1 / 7 2020, Korea Genome Organization This is an open-access article distributed under the terms of the Creative Commons Attribution license (http://creativecommons. org/licenses/by/4.0/), which permits unre- stricted use, distribution, and reproduction in any medium, provided the original work is properly cited. Introduction Coronaviruses (CoVs) usually influence the respiratory tract of mammals that lead to mild to severe respiratory tract infections [1]. In the past two decades, two highly patho- genic human CoVs including severe acute respiratory syndrome coronavirus (SARS- CoV) and Middle East respiratory syndrome coronavirus (MERS-CoV), emerging from animal reservoirs, have led to global epidemics with high morbidity and mortality [2]. According to the World Health Organization (WHO), as of April 2020 CoV has had a to- tal of 2,269,630 diagnosed cases causing 155,205 deaths, throughout the world [3]. SARS-CoV-2 has a similar incubation phase and a relatively lower fatality rate than SARS- CoV or MERS-CoV, but it is estimated that the reproductive number of SARS-CoV-2 is higher than that of SARS-CoV [4]. Whole-genome analysis revealed that SARS-CoV-2 used mutations and recombination as crucial strategies in different genomic regions to become a novel infectious agent [5]. Generally, the rates of nucleotide substitution of RNA viruses are faster and are this rapid evolution is mainly shaped by natural selection [6]. Numerous substitution models Computational analysis of SARS- CoV-2, SARS-CoV, and MERS-CoV genome using MEGA Vipan Kumar Sohpal* Department of Chemical & Bio Engineering, Beant College of Engineering & Technology, Gurdaspur 143521, India Received: July 20, 2020 Revised: September 5, 2020 Accepted: September 22, 2020 *Corresponding author: E-mail: [email protected] eISSN 2234-0742 Genomics Inform 2020;18(3):e30 https://doi.org/10.5808/GI.2020.18.3.e30 Original article The novel coronavirus pandemic that has originated from China and spread throughout the world in three months. Genome of severe acute respiratory syndrome coronavirus 2 (SARS- CoV-2) predecessor, severe acute respiratory syndrome coronavirus (SARS-CoV) and Middle East respiratory syndrome coronavirus (MERS-CoV) play an important role in understand- ing the concept of genetic variation. In this paper, the genomic data accessed from Nation- al Center for Biotechnology Information (NCBI) through Molecular Evolutionary Genetic Analysis (MEGA) for statistical analysis. Firstly, the Bayesian information criterion (BIC) and Akaike information criterion (AICc) are used to evaluate the best substitution pattern. Sec- ondly, the maximum likelihood method used to estimate of transition/transversions (R) through Kimura-2, Tamura-3, Hasegawa-Kishino-Yano, and Tamura-Nei nucleotide substi- tutions model. Thirdly and finally nucleotide frequencies computed based on genomic data of NCBI. The results indicate that general times reversible model has the lowest BIC and AICc score 347,394 and 347,287, respectively. The transition/transversions bias for nucleo- tide substitutions models varies from 0.56 to 0.59 in MEGA output. The average nitroge- nous bases frequency of U, C, A, and G are 31.74, 19.48, 28.04, and 20.74, respectively in percentages. Overall the genomic data analysis of SARS-CoV-2, SARS-CoV, and MERS-CoV highlights the close genetic relationship. Keywords: Middle East respiratory syndrome, Molecular Evolutionary Genetic Analysis, Na- tional Center for Biotechnology Information, SARS-CoV, SARS-CoV-2

Welcome message from author
This document is posted to help you gain knowledge. Please leave a comment to let me know what you think about it! Share it to your friends and learn new things together.
Transcript
1 / 7
2020, Korea Genome OrganizationThis is an open-access article distributed under the terms of the Creative Commons Attribution license (http://creativecommons.org/licenses/by/4.0/), which permits unre-stricted use, distribution, and reproduction in any medium, provided the original work is properly cited.
Introduction
Coronaviruses (CoVs) usually influence the respiratory tract of mammals that lead to mild to severe respiratory tract infections [1]. In the past two decades, two highly patho-genic human CoVs including severe acute respiratory syndrome coronavirus (SARS-CoV) and Middle East respiratory syndrome coronavirus (MERS-CoV), emerging from animal reservoirs, have led to global epidemics with high morbidity and mortality [2]. According to the World Health Organization (WHO), as of April 2020 CoV has had a to-tal of 2,269,630 diagnosed cases causing 155,205 deaths, throughout the world [3]. SARS-CoV-2 has a similar incubation phase and a relatively lower fatality rate than SARS-CoV or MERS-CoV, but it is estimated that the reproductive number of SARS-CoV-2 is higher than that of SARS-CoV [4]. Whole-genome analysis revealed that SARS-CoV-2 used mutations and recombination as crucial strategies in different genomic regions to become a novel infectious agent [5].
Generally, the rates of nucleotide substitution of RNA viruses are faster and are this rapid evolution is mainly shaped by natural selection [6]. Numerous substitution models
Computational analysis of SARS-CoV-2, SARS-CoV, and MERS-CoV genome using MEGA Vipan Kumar Sohpal*
Department of Chemical & Bio Engineering, Beant College of Engineering & Technology, Gurdaspur 143521, India
Received: July 20, 2020Revised: September 5, 2020 Accepted: September 22, 2020
*Corresponding author: E-mail: [email protected]
eISSN 2234-0742Genomics Inform 2020;18(3):e30https://doi.org/10.5808/GI.2020.18.3.e30
Original article
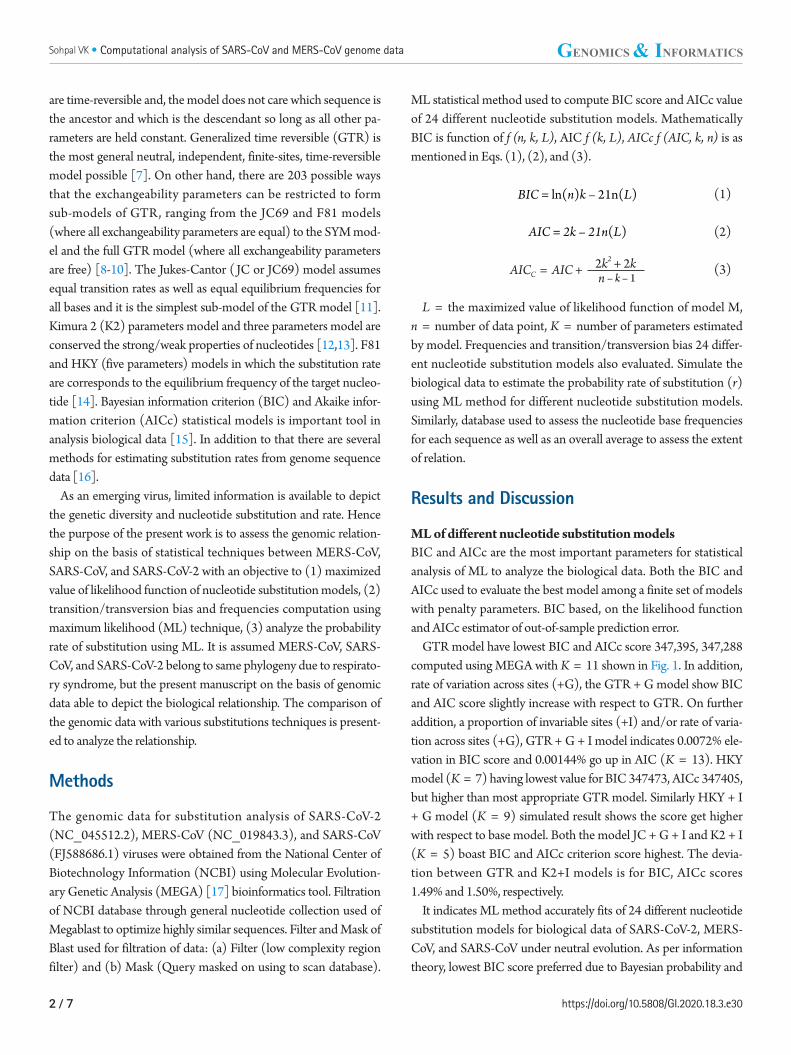
The novel coronavirus pandemic that has originated from China and spread throughout the world in three months. Genome of severe acute respiratory syndrome coronavirus 2 (SARS-CoV-2) predecessor, severe acute respiratory syndrome coronavirus (SARS-CoV) and Middle East respiratory syndrome coronavirus (MERS-CoV) play an important role in understand-ing the concept of genetic variation. In this paper, the genomic data accessed from Nation-al Center for Biotechnology Information (NCBI) through Molecular Evolutionary Genetic Analysis (MEGA) for statistical analysis. Firstly, the Bayesian information criterion (BIC) and Akaike information criterion (AICc) are used to evaluate the best substitution pattern. Sec-ondly, the maximum likelihood method used to estimate of transition/transversions (R) through Kimura-2, Tamura-3, Hasegawa-Kishino-Yano, and Tamura-Nei nucleotide substi-tutions model. Thirdly and finally nucleotide frequencies computed based on genomic data of NCBI. The results indicate that general times reversible model has the lowest BIC and AICc score 347,394 and 347,287, respectively. The transition/transversions bias for nucleo-tide substitutions models varies from 0.56 to 0.59 in MEGA output. The average nitroge-nous bases frequency of U, C, A, and G are 31.74, 19.48, 28.04, and 20.74, respectively in percentages. Overall the genomic data analysis of SARS-CoV-2, SARS-CoV, and MERS-CoV highlights the close genetic relationship.
Keywords: Middle East respiratory syndrome, Molecular Evolutionary Genetic Analysis, Na-tional Center for Biotechnology Information, SARS-CoV, SARS-CoV-2
are time-reversible and, the model does not care which sequence is the ancestor and which is the descendant so long as all other pa-rameters are held constant. Generalized time reversible (GTR) is the most general neutral, independent, finite-sites, time-reversible model possible [7]. On other hand, there are 203 possible ways that the exchangeability parameters can be restricted to form sub-models of GTR, ranging from the JC69 and F81 models (where all exchangeability parameters are equal) to the SYM mod-el and the full GTR model (where all exchangeability parameters are free) [8-10]. The Jukes-Cantor ( JC or JC69) model assumes equal transition rates as well as equal equilibrium frequencies for all bases and it is the simplest sub-model of the GTR model [11]. Kimura 2 (K2) parameters model and three parameters model are conserved the strong/weak properties of nucleotides [12,13]. F81 and HKY (five parameters) models in which the substitution rate are corresponds to the equilibrium frequency of the target nucleo-tide [14]. Bayesian information criterion (BIC) and Akaike infor-mation criterion (AICc) statistical models is important tool in analysis biological data [15]. In addition to that there are several methods for estimating substitution rates from genome sequence data [16].
As an emerging virus, limited information is available to depict the genetic diversity and nucleotide substitution and rate. Hence the purpose of the present work is to assess the genomic relation-ship on the basis of statistical techniques between MERS-CoV, SARS-CoV, and SARS-CoV-2 with an objective to (1) maximized value of likelihood function of nucleotide substitution models, (2) transition/transversion bias and frequencies computation using maximum likelihood (ML) technique, (3) analyze the probability rate of substitution using ML. It is assumed MERS-CoV, SARS-CoV, and SARS-CoV-2 belong to same phylogeny due to respirato-ry syndrome, but the present manuscript on the basis of genomic data able to depict the biological relationship. The comparison of the genomic data with various substitutions techniques is present-ed to analyze the relationship.
Methods
The genomic data for substitution analysis of SARS-CoV-2 (NC_045512.2), MERS-CoV (NC_019843.3), and SARS-CoV (FJ588686.1) viruses were obtained from the National Center of Biotechnology Information (NCBI) using Molecular Evolution-ary Genetic Analysis (MEGA) [17] bioinformatics tool. Filtration of NCBI database through general nucleotide collection used of Megablast to optimize highly similar sequences. Filter and Mask of Blast used for filtration of data: (a) Filter (low complexity region filter) and (b) Mask (Query masked on using to scan database).
ML statistical method used to compute BIC score and AICc value of 24 different nucleotide substitution models. Mathematically BIC is function of f (n, k, L), AIC f (k, L), AICc f (AIC, k, n) is as mentioned in Eqs. (1), (2), and (3).
(1)
(2)
(3)
L = the maximized value of likelihood function of model M, n = number of data point, K = number of parameters estimated by model. Frequencies and transition/transversion bias 24 differ-ent nucleotide substitution models also evaluated. Simulate the biological data to estimate the probability rate of substitution (r) using ML method for different nucleotide substitution models. Similarly, database used to assess the nucleotide base frequencies for each sequence as well as an overall average to assess the extent of relation.
Results and Discussion
ML of different nucleotide substitution models BIC and AICc are the most important parameters for statistical analysis of ML to analyze the biological data. Both the BIC and AICc used to evaluate the best model among a finite set of models with penalty parameters. BIC based, on the likelihood function and AICc estimator of out-of-sample prediction error.
GTR model have lowest BIC and AICc score 347,395, 347,288 computed using MEGA with K = 11 shown in Fig. 1. In addition, rate of variation across sites (+G), the GTR + G model show BIC and AIC score slightly increase with respect to GTR. On further addition, a proportion of invariable sites (+I) and/or rate of varia-tion across sites (+G), GTR + G + I model indicates 0.0072% ele-vation in BIC score and 0.00144% go up in AIC (K = 13). HKY model (K = 7) having lowest value for BIC 347473, AICc 347405, but higher than most appropriate GTR model. Similarly HKY + I + G model (K = 9) simulated result shows the score get higher with respect to base model. Both the model JC + G + I and K2 + I (K = 5) boast BIC and AICc criterion score highest. The devia-tion between GTR and K2+I models is for BIC, AICc scores 1.49% and 1.50%, respectively.
It indicates ML method accurately fits of 24 different nucleotide substitution models for biological data of SARS-CoV-2, MERS-CoV, and SARS-CoV under neutral evolution. As per information theory, lowest BIC score preferred due to Bayesian probability and
https://doi.org/10.5808/GI.2020.18.3.e302 / 7
Sohpal VK • Computational analysis of SARS-CoV and MERS-CoV genome data
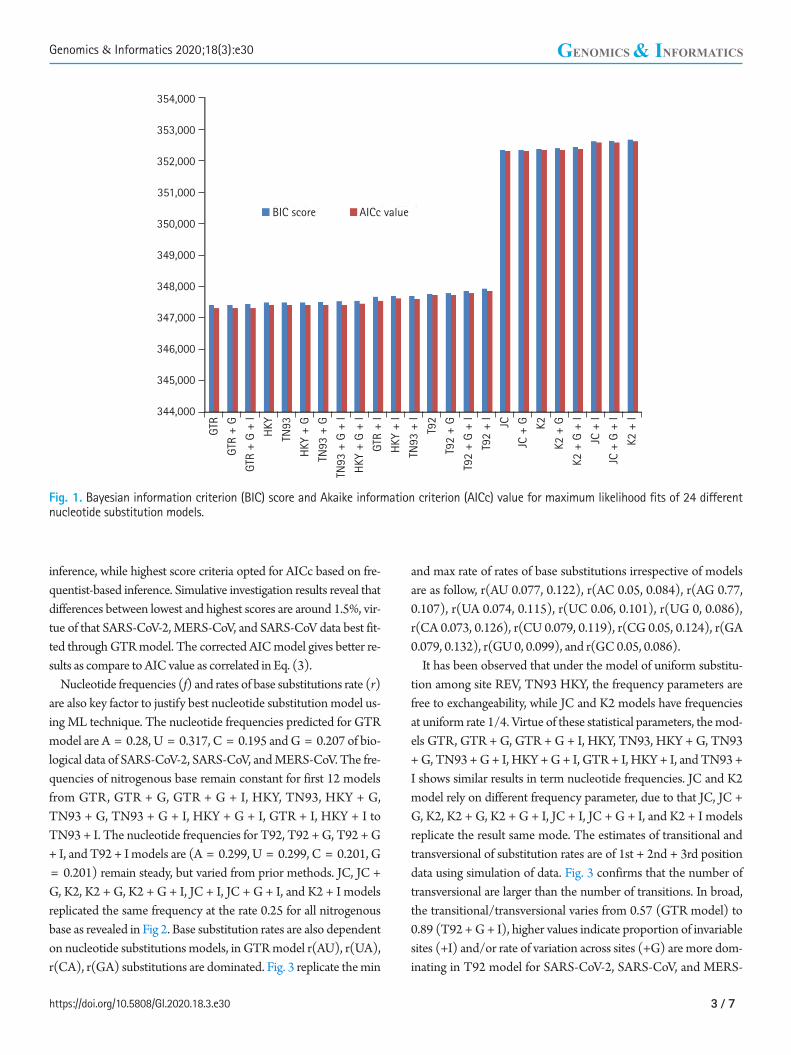
inference, while highest score criteria opted for AICc based on fre-quentist-based inference. Simulative investigation results reveal that differences between lowest and highest scores are around 1.5%, vir-tue of that SARS-CoV-2, MERS-CoV, and SARS-CoV data best fit-ted through GTR model. The corrected AIC model gives better re-sults as compare to AIC value as correlated in Eq. (3).
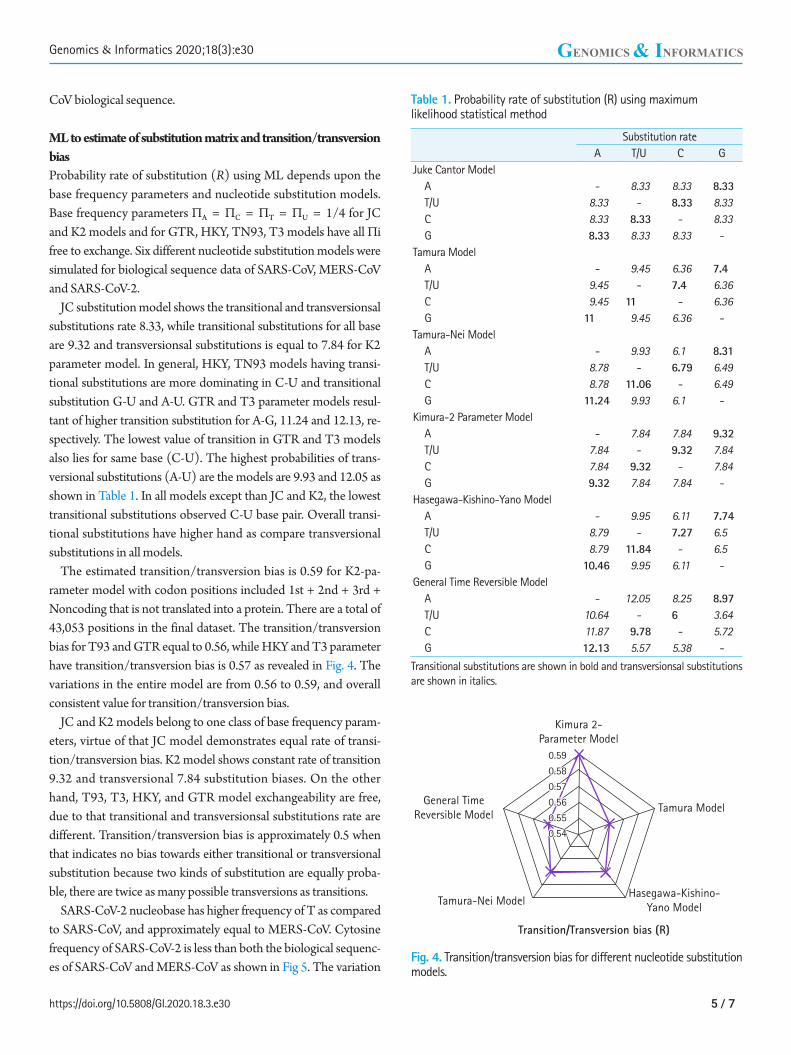
Nucleotide frequencies (f) and rates of base substitutions rate (r) are also key factor to justify best nucleotide substitution model us-ing ML technique. The nucleotide frequencies predicted for GTR model are A = 0.28, U = 0.317, C = 0.195 and G = 0.207 of bio-logical data of SARS-CoV-2, SARS-CoV, and MERS-CoV. The fre-quencies of nitrogenous base remain constant for first 12 models from GTR, GTR + G, GTR + G + I, HKY, TN93, HKY + G, TN93 + G, TN93 + G + I, HKY + G + I, GTR + I, HKY + I to TN93 + I. The nucleotide frequencies for T92, T92 + G, T92 + G + I, and T92 + I models are (A = 0.299, U = 0.299, C = 0.201, G = 0.201) remain steady, but varied from prior methods. JC, JC + G, K2, K2 + G, K2 + G + I, JC + I, JC + G + I, and K2 + I models replicated the same frequency at the rate 0.25 for all nitrogenous base as revealed in Fig 2. Base substitution rates are also dependent on nucleotide substitutions models, in GTR model r(AU), r(UA), r(CA), r(GA) substitutions are dominated. Fig. 3 replicate the min
and max rate of rates of base substitutions irrespective of models are as follow, r(AU 0.077, 0.122), r(AC 0.05, 0.084), r(AG 0.77, 0.107), r(UA 0.074, 0.115), r(UC 0.06, 0.101), r(UG 0, 0.086), r(CA 0.073, 0.126), r(CU 0.079, 0.119), r(CG 0.05, 0.124), r(GA 0.079, 0.132), r(GU 0, 0.099), and r(GC 0.05, 0.086).
It has been observed that under the model of uniform substitu-tion among site REV, TN93 HKY, the frequency parameters are free to exchangeability, while JC and K2 models have frequencies at uniform rate 1/4. Virtue of these statistical parameters, the mod-els GTR, GTR + G, GTR + G + I, HKY, TN93, HKY + G, TN93 + G, TN93 + G + I, HKY + G + I, GTR + I, HKY + I, and TN93 + I shows similar results in term nucleotide frequencies. JC and K2 model rely on different frequency parameter, due to that JC, JC + G, K2, K2 + G, K2 + G + I, JC + I, JC + G + I, and K2 + I models replicate the result same mode. The estimates of transitional and transversional of substitution rates are of 1st + 2nd + 3rd position data using simulation of data. Fig. 3 confirms that the number of transversional are larger than the number of transitions. In broad, the transitional/transversional varies from 0.57 (GTR model) to 0.89 (T92 + G + I), higher values indicate proportion of invariable sites (+I) and/or rate of variation across sites (+G) are more dom-inating in T92 model for SARS-CoV-2, SARS-CoV, and MERS-
354,000
353,000
352,000
351,000
350,000
349,000
348,000
347,000
346,000
345,000
344,000
BIC score AICc valueG
TR
GTR
+ G
GTR
+ G
+ I
HKY
TN93
HKY
+ G
HKY
+ G
+ I
GTR
+ I
HKY
+ I
TN93
+ I
T92
T92
+ G
T92
+ G
+ I
T92
+ I
JC
JC +
G K2
K2 +
G
K2 +
G +
I
JC +
I
JC +
G +
I
K2 +
I
TN93
+ G
TN93
+ G
+ I
Fig. 1. Bayesian information criterion (BIC) score and Akaike information criterion (AICc) value for maximum likelihood fits of 24 different nucleotide substitution models.
3 / 7https://doi.org/10.5808/GI.2020.18.3.e30
Genomics & Informatics 2020;18(3):e30
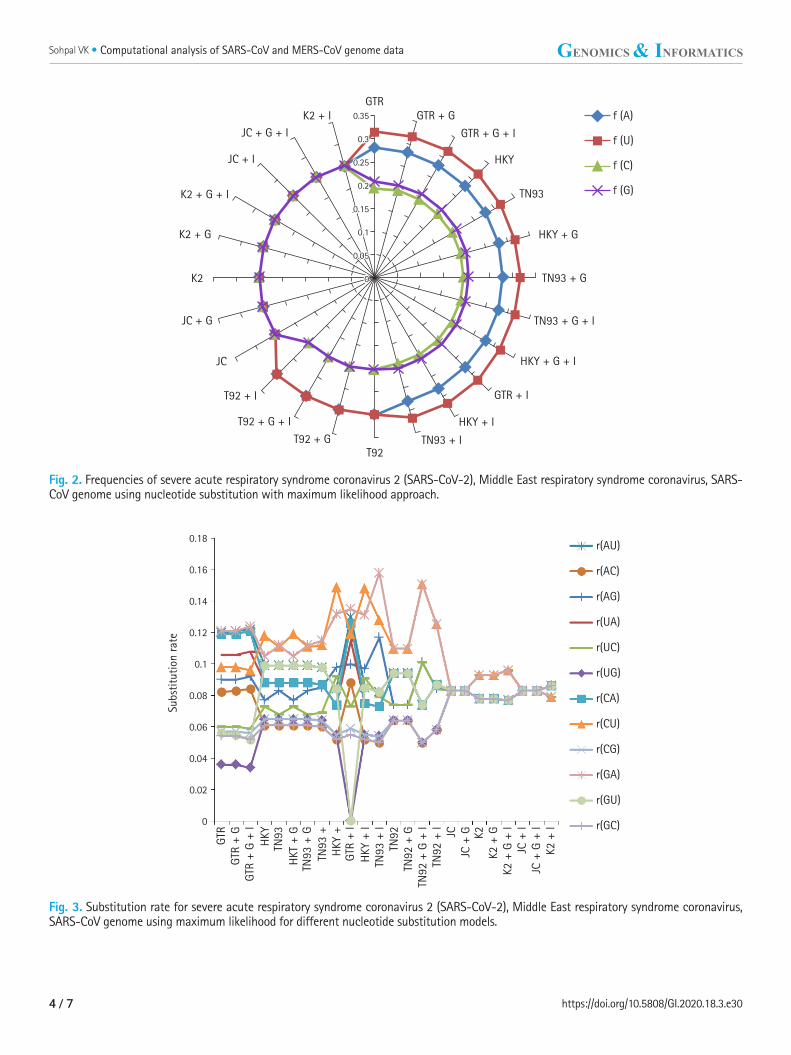
Fig. 2. Frequencies of severe acute respiratory syndrome coronavirus 2 (SARS-CoV-2), Middle East respiratory syndrome coronavirus, SARS-CoV genome using nucleotide substitution with maximum likelihood approach.
Fig. 3. Substitution rate for severe acute respiratory syndrome coronavirus 2 (SARS-CoV-2), Middle East respiratory syndrome coronavirus, SARS-CoV genome using maximum likelihood for different nucleotide substitution models.
GTRf (A)
f (U)
f (C)
f (G)
GTR + G
GTR + G + I
HKY
TN93
HKY + G
TN93 + G
TN93 + G + I
HKY + G + I
GTR + I
HKY + I
TN93 + IT92
T92 + G
T92 + G + I
T92 + I
JC
JC + G
K2
K2 + G
K2 + G + I
JC + I
JC + G + IK2 + I 0.35
0.3
0.25
0.2
0.15
0.1
0.05
0
0.18
0.16
0.14
0.12
0.1
0.08
0.06
0.04
0.02
0
Subs
titut
ion
rate
GTR
GTR
+ G
GTR
+ G
+ I
HKY
TN93
HKT
+ G
TN93
+ G
TN93
+H
KY +
GTR
+ I
HKY
+ I
TN93
+ I
TN92
TN92
+ G
TN92
+ G
+ I
TN92
+ I JC
JC +
G K2K2
+ G
K2 +
G +
IJC
+ I
JC +
G +
IK2
+ I
r(AU)
r(AC)
r(AG)
r(UA)
r(UC)
r(UG)
r(CA)
r(CU)
r(CG)
r(GA)
r(GU)
r(GC)
https://doi.org/10.5808/GI.2020.18.3.e304 / 7
Sohpal VK • Computational analysis of SARS-CoV and MERS-CoV genome data
CoV biological sequence.
ML to estimate of substitution matrix and transition/transversion bias Probability rate of substitution (R) using ML depends upon the base frequency parameters and nucleotide substitution models. Base frequency parameters ΠA = ΠC = ΠT = ΠU = 1/4 for JC and K2 models and for GTR, HKY, TN93, T3 models have all Πi free to exchange. Six different nucleotide substitution models were simulated for biological sequence data of SARS-CoV, MERS-CoV and SARS-CoV-2.
JC substitution model shows the transitional and transversionsal substitutions rate 8.33, while transitional substitutions for all base are 9.32 and transversionsal substitutions is equal to 7.84 for K2 parameter model. In general, HKY, TN93 models having transi-tional substitutions are more dominating in C-U and transitional substitution G-U and A-U. GTR and T3 parameter models resul-tant of higher transition substitution for A-G, 11.24 and 12.13, re-spectively. The lowest value of transition in GTR and T3 models also lies for same base (C-U). The highest probabilities of trans-versional substitutions (A-U) are the models are 9.93 and 12.05 as shown in Table 1. In all models except than JC and K2, the lowest transitional substitutions observed C-U base pair. Overall transi-tional substitutions have higher hand as compare transversional substitutions in all models.
The estimated transition/transversion bias is 0.59 for K2-pa-rameter model with codon positions included 1st + 2nd + 3rd + Noncoding that is not translated into a protein. There are a total of 43,053 positions in the final dataset. The transition/transversion bias for T93 and GTR equal to 0.56, while HKY and T3 parameter have transition/transversion bias is 0.57 as revealed in Fig. 4. The variations in the entire model are from 0.56 to 0.59, and overall consistent value for transition/transversion bias.
JC and K2 models belong to one class of base frequency param-eters, virtue of that JC model demonstrates equal rate of transi-tion/transversion bias. K2 model shows constant rate of transition 9.32 and transversional 7.84 substitution biases. On the other hand, T93, T3, HKY, and GTR model exchangeability are free, due to that transitional and transversionsal substitutions rate are different. Transition/transversion bias is approximately 0.5 when that indicates no bias towards either transitional or transversional substitution because two kinds of substitution are equally proba-ble, there are twice as many possible transversions as transitions.
SARS-CoV-2 nucleobase has higher frequency of T as compared to SARS-CoV, and approximately equal to MERS-CoV. Cytosine frequency of SARS-CoV-2 is less than both the biological sequenc-es of SARS-CoV and MERS-CoV as shown in Fig 5. The variation
Table 1. Probability rate of substitution (R) using maximum likelihood statistical method
Substitution rateA T/U C G
Juke Cantor Model A - 8.33 8.33 8.33 T/U 8.33 - 8.33 8.33 C 8.33 8.33 - 8.33 G 8.33 8.33 8.33 -Tamura Model A - 9.45 6.36 7.4 T/U 9.45 - 7.4 6.36 C 9.45 11 - 6.36 G 11 9.45 6.36 -Tamura-Nei Model A - 9.93 6.1 8.31 T/U 8.78 - 6.79 6.49 C 8.78 11.06 - 6.49 G 11.24 9.93 6.1 -Kimura-2 Parameter Model A - 7.84 7.84 9.32 T/U 7.84 - 9.32 7.84 C 7.84 9.32 - 7.84 G 9.32 7.84 7.84 -Hasegawa-Kishino-Yano Model A - 9.95 6.11 7.74 T/U 8.79 - 7.27 6.5 C 8.79 11.84 - 6.5 G 10.46 9.95 6.11 -General Time Reversible Model A - 12.05 8.25 8.97 T/U 10.64 - 6 3.64 C 11.87 9.78 - 5.72 G 12.13 5.57 5.38 -
Transitional substitutions are shown in bold and transversionsal substitutions are shown in italics.
Fig. 4. Transition/transversion bias for different nucleotide substitution models.
Kimura 2- Parameter Model
General Time Reversible Model
Tamura-Nei Model
Tamura Model
Hasegawa-Kishino- Yano Model
Transition/Transversion bias (R)
0.59
0.58
0.57
0.56
0.55
0.54
5 / 7https://doi.org/10.5808/GI.2020.18.3.e30
Genomics & Informatics 2020;18(3):e30
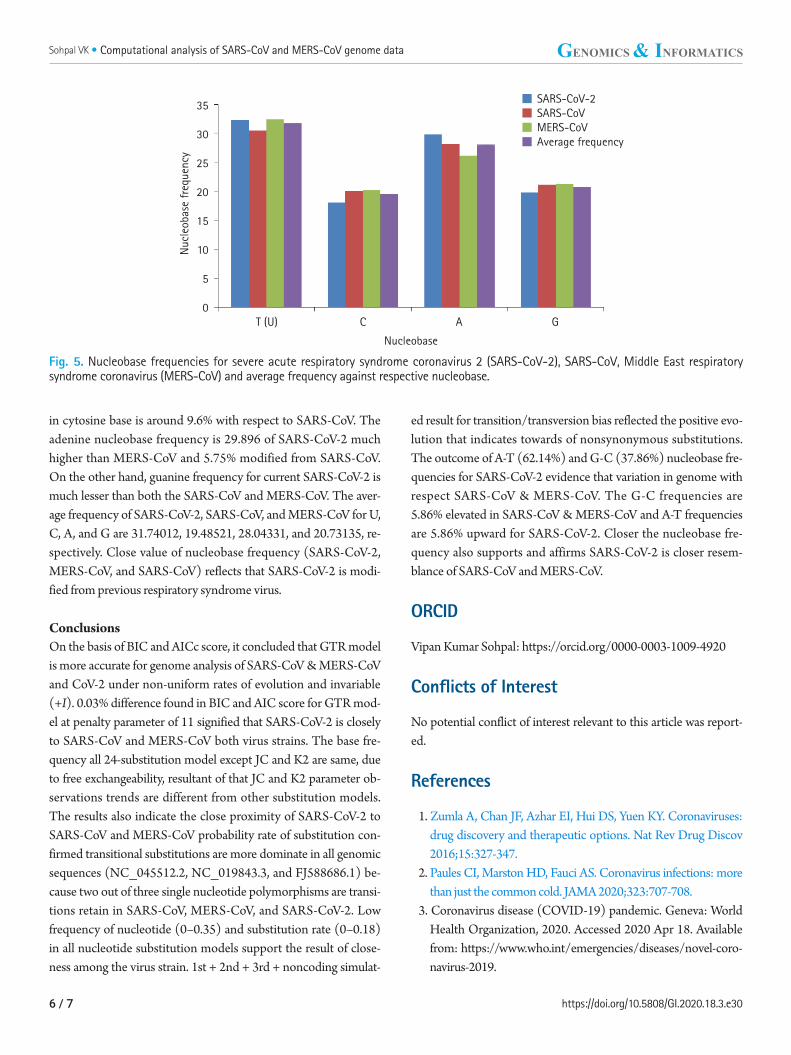
in cytosine base is around 9.6% with respect to SARS-CoV. The adenine nucleobase frequency is 29.896 of SARS-CoV-2 much higher than MERS-CoV and 5.75% modified from SARS-CoV. On the other hand, guanine frequency for current SARS-CoV-2 is much lesser than both the SARS-CoV and MERS-CoV. The aver-age frequency of SARS-CoV-2, SARS-CoV, and MERS-CoV for U, C, A, and G are 31.74012, 19.48521, 28.04331, and 20.73135, re-spectively. Close value of nucleobase frequency (SARS-CoV-2, MERS-CoV, and SARS-CoV) reflects that SARS-CoV-2 is modi-fied from previous respiratory syndrome virus.
Conclusions On the basis of BIC and AICc score, it concluded that GTR model is more accurate for genome analysis of SARS-CoV & MERS-CoV and CoV-2 under non-uniform rates of evolution and invariable (+I). 0.03% difference found in BIC and AIC score for GTR mod-el at penalty parameter of 11 signified that SARS-CoV-2 is closely to SARS-CoV and MERS-CoV both virus strains. The base fre-quency all 24-substitution model except JC and K2 are same, due to free exchangeability, resultant of that JC and K2 parameter ob-servations trends are different from other substitution models. The results also indicate the close proximity of SARS-CoV-2 to SARS-CoV and MERS-CoV probability rate of substitution con-firmed transitional substitutions are more dominate in all genomic sequences (NC_045512.2, NC_019843.3, and FJ588686.1) be-cause two out of three single nucleotide polymorphisms are transi-tions retain in SARS-CoV, MERS-CoV, and SARS-CoV-2. Low frequency of nucleotide (0–0.35) and substitution rate (0–0.18) in all nucleotide substitution models support the result of close-ness among the virus strain. 1st + 2nd + 3rd + noncoding simulat-
ed result for transition/transversion bias reflected the positive evo-lution that indicates towards of nonsynonymous substitutions. The outcome of A-T (62.14%) and G-C (37.86%) nucleobase fre-quencies for SARS-CoV-2 evidence that variation in genome with respect SARS-CoV & MERS-CoV. The G-C frequencies are 5.86% elevated in SARS-CoV & MERS-CoV and A-T frequencies are 5.86% upward for SARS-CoV-2. Closer the nucleobase fre-quency also supports and affirms SARS-CoV-2 is closer resem-blance of SARS-CoV and MERS-CoV.
ORCID
Vipan Kumar Sohpal: https://orcid.org/0000-0003-1009-4920
Conflicts of Interest
No potential conflict of interest relevant to this article was report-ed.
References
1. Zumla A, Chan JF, Azhar EI, Hui DS, Yuen KY. Coronaviruses: drug discovery and therapeutic options. Nat Rev Drug Discov 2016;15:327-347.
2. Paules CI, Marston HD, Fauci AS. Coronavirus infections: more than just the common cold. JAMA 2020;323:707-708.
3. Coronavirus disease (COVID-19) pandemic. Geneva: World Health Organization, 2020. Accessed 2020 Apr 18. Available from: https://www.who.int/emergencies/diseases/novel-coro-navirus-2019.
Fig. 5. Nucleobase frequencies for severe acute respiratory syndrome coronavirus 2 (SARS-CoV-2), SARS-CoV, Middle East respiratory syndrome coronavirus (MERS-CoV) and average frequency against respective nucleobase.
35
30
25
20
15
10
5
0
Nuc
leob
ase
freq
uenc
y
Nucleobase
■ SARS-CoV-2■ SARS-CoV■ MERS-CoV■ Average frequency
T (U) C A G
https://doi.org/10.5808/GI.2020.18.3.e306 / 7
Sohpal VK • Computational analysis of SARS-CoV and MERS-CoV genome data
4. Lv L, Li G, Chen J, Liang X, Li Y. Comparative genomic analysis revealed specific mutation pattern between human coronavirus SARS-CoV-2 and Bat-SARSr-CoV RaTG13. Preprint BioRxiv https://doi.org/10.1101/2020.02.27.969006 (2020).
5. Rehman SU, Shafique L, Ihsan A, Liu Q. Evolutionary trajectory for the emergence of novel coronavirus SARS-CoV-2. Pathogens 2020;9:240.
6. Lau SK, Woo PC, Li KS, Huang Y, Tsoi HW, Wong BH, et al. Se-vere acute respiratory syndrome coronavirus-like virus in Chi-nese horseshoe bats. Proc Natl Acad Sci U S A 2005;102:14040-14045.
7. Yang Z. Estimating the pattern of nucleotide substitution. J Mol Evol 1994;39:105-111.
8. Hillis DM, Moritz C, Mable BK. Molecular Systematics. 2nd ed. Sunderland: Sinauer Associates, 1996.
9. Jukes TH, Cantor CR. Evolution of protein molecules. In: Mam-malian Protein Metabolism, Vol. 3 (Munro HN, ed.). New York: Academic Press, 1969. pp. 21-132.
10. Felsenstein J. Evolutionary trees from DNA sequences: a maxi-mum likelihood approach. J Mol Evol 1981;17:368-376.
11. Zharkikh A. Estimation of evolutionary distances between nucle-otide sequences. J Mol Evol 1994;39:315-329.
12. Kimura M. A simple method for estimating evolutionary rates of base substitutions through comparative studies of nucleotide se-quences. J Mol Evol 1980;16:111-120.
13. Kimura M. Estimation of evolutionary distances between homol-ogous nucleotide sequences. Proc Natl Acad Sci U S A 1981; 78:454-458.
14. Hasegawa M, Kishino H, Yano T. Dating of the human-ape split-ting by a molecular clock of mitochondrial DNA. J Mol Evol 1985;22:160-174.
15. Aho K, Derryberry D, Peterson T. Model selection for ecologists: the worldviews of AIC and BIC. Ecology 2014;95:631-636.
16. Bromham L. Substitution rate analysis and molecular evolution. In: Phylogenetics in the Genomic Era (Scornavacca C, Delsuc F, Galtier N, eds.). The Authors, 2020. pp. 4.4:1-5.5:21.
17. Kumar S, Stecher G, Li M, Knyaz C, Tamura K. MEGA X: molec-ular evolutionary genetics analysis across computing platforms. Mol Biol Evol 2018;35:1547-1549.
7 / 7https://doi.org/10.5808/GI.2020.18.3.e30
Genomics & Informatics 2020;18(3):e30
Related Documents