Hydrol. Earth Syst. Sci., 13, 2055–2068, 2009 www.hydrol-earth-syst-sci.net/13/2055/2009/ © Author(s) 2009. This work is distributed under the Creative Commons Attribution 3.0 License. Hydrology and Earth System Sciences Comparison of different base flow separation methods in a lowland catchment A. L. Gonzales 1 , J. Nonner 1 , J. Heijkers 2 , and S. Uhlenbrook 1,3 1 UNESCO-IHE, Department of water engineering, P.O. Box 3015, 2601 DA Delft, The Netherlands 2 Hoogheemraadschap de Stichtse Rijnlanden – HDSR, P.O. Box 550, 3990 GJ Houten, The Netherlands 3 Delft University of Technology, Water Resources Section, P.O. Box 5048, 2600 GA Delft, The Netherlands Received: 11 March 2009 – Published in Hydrol. Earth Syst. Sci. Discuss.: 27 April 2009 Revised: 18 September 2009 – Accepted: 14 October 2009 – Published: 4 November 2009 Abstract. Assessment of water resources available in differ- ent storages and moving along different pathways in a catch- ment is important for its optimal use and protection, and also for the prediction of floods and low flows. Moreover, un- derstanding of the runoff generation processes is essential for assessing the impacts of climate and land use changes on the hydrological response of a catchment. Many methods for base flow separation exist, but hardly one focuses on the specific behaviour of temperate lowland areas. This paper presents the results of a base flow separation study carried out in a lowland area in the Netherlands. In this study, field observations of precipitation, groundwater and surface water levels and discharges, together with tracer analysis are used to understand the runoff generation processes in the catch- ment. Several tracer and non-tracer based base flow separa- tion methods were applied to the discharge time series, and their results are compared. The results show that groundwater levels react fast to pre- cipitation events in this lowland area with shallow ground- water tables. Moreover, a good correlation was found be- tween groundwater levels and discharges suggesting that most of the measured discharge also during floods comes from groundwater storage. It was estimated using tracer hy- drological approaches that approximately 90% of the total discharge is groundwater displaced by event water mainly infiltrating in the northern part of the catchment, and only the remaining 10% is surface runoff. The impact of remote recharge causing displacement of near channel groundwa- ter during floods could also be motivated with hydraulic ap- proximations. The results show further that when base flow separation is meant to identify groundwater contributions to Correspondence to: A. L. Gonzales ([email protected]) stream flow, process based methods (e.g. the rating curve method; Kliner and Knezek, 1974) are more reliable than other simple non-tracer based methods. Also, the recursive filtering method (proposed by Eckhardt, 2005) can be cal- ibrated well using the results of tracer investigation giving good results. Consequently, non-tracer based base flow sep- aration methods that can be validated for some events may provide a powerful tool for groundwater assessment or model calibration/validation in lowland areas. 1 Introduction Understanding runoff generation processes, i.e. source areas, pathways and retention times, is important for the predic- tion of water quantities, including floods and low flows (base flows), and water quality in a catchment (e.g. Bonell, 1998; Uhlenbrook, 2006; Eckhardt, 2008). However, these pro- cesses continue to be difficult to quantify and conceptualize (McDonnell and Tanaka, 2001; Uhlenbrook and Hoeg, 2003) and the direct measurement of each discharge component, in a continuous way and at a sufficient number of locations is practically impossible (e.g. Tardy et al., 2004). The accurate analysis of water flow pathways from rainfall to streams is also needed for the optimal protection of surface and ground- water resources (e.g. Wenninger et al., 2004). Understanding of the runoff generation processes is also essential for assess- ing the impacts of changes (e.g. land use changes, climate change) on the hydrological response of a catchment (e.g. Uhlenbrook et al., 2008). In many catchments, base flow is an important compo- nent of stream flow and, therefore, base flow separations have been widely studied and have a long history in the sci- ence of hydrology (Hall, 1968; Tallaksen, 1995). Base flow Published by Copernicus Publications on behalf of the European Geosciences Union.

Welcome message from author
This document is posted to help you gain knowledge. Please leave a comment to let me know what you think about it! Share it to your friends and learn new things together.
Transcript
Hydrol. Earth Syst. Sci., 13, 2055–2068, 2009www.hydrol-earth-syst-sci.net/13/2055/2009/© Author(s) 2009. This work is distributed underthe Creative Commons Attribution 3.0 License.
Hydrology andEarth System
Sciences
Comparison of different base flow separation methods in a lowlandcatchment
A. L. Gonzales1, J. Nonner1, J. Heijkers2, and S. Uhlenbrook1,3
1UNESCO-IHE, Department of water engineering, P.O. Box 3015, 2601 DA Delft, The Netherlands2Hoogheemraadschap de Stichtse Rijnlanden – HDSR, P.O. Box 550, 3990 GJ Houten, The Netherlands3Delft University of Technology, Water Resources Section, P.O. Box 5048, 2600 GA Delft, The Netherlands
Received: 11 March 2009 – Published in Hydrol. Earth Syst. Sci. Discuss.: 27 April 2009Revised: 18 September 2009 – Accepted: 14 October 2009 – Published: 4 November 2009
Abstract. Assessment of water resources available in differ-ent storages and moving along different pathways in a catch-ment is important for its optimal use and protection, and alsofor the prediction of floods and low flows. Moreover, un-derstanding of the runoff generation processes is essentialfor assessing the impacts of climate and land use changeson the hydrological response of a catchment. Many methodsfor base flow separation exist, but hardly one focuses on thespecific behaviour of temperate lowland areas. This paperpresents the results of a base flow separation study carriedout in a lowland area in the Netherlands. In this study, fieldobservations of precipitation, groundwater and surface waterlevels and discharges, together with tracer analysis are usedto understand the runoff generation processes in the catch-ment. Several tracer and non-tracer based base flow separa-tion methods were applied to the discharge time series, andtheir results are compared.
The results show that groundwater levels react fast to pre-cipitation events in this lowland area with shallow ground-water tables. Moreover, a good correlation was found be-tween groundwater levels and discharges suggesting thatmost of the measured discharge also during floods comesfrom groundwater storage. It was estimated using tracer hy-drological approaches that approximately 90% of the totaldischarge is groundwater displaced by event water mainlyinfiltrating in the northern part of the catchment, and onlythe remaining 10% is surface runoff. The impact of remoterecharge causing displacement of near channel groundwa-ter during floods could also be motivated with hydraulic ap-proximations. The results show further that when base flowseparation is meant to identify groundwater contributions to
Correspondence to:A. L. Gonzales([email protected])
stream flow, process based methods (e.g. the rating curvemethod; Kliner and Knezek, 1974) are more reliable thanother simple non-tracer based methods. Also, the recursivefiltering method (proposed by Eckhardt, 2005) can be cal-ibrated well using the results of tracer investigation givinggood results. Consequently, non-tracer based base flow sep-aration methods that can be validated for some events mayprovide a powerful tool for groundwater assessment or modelcalibration/validation in lowland areas.
1 Introduction
Understanding runoff generation processes, i.e. source areas,pathways and retention times, is important for the predic-tion of water quantities, including floods and low flows (baseflows), and water quality in a catchment (e.g. Bonell, 1998;Uhlenbrook, 2006; Eckhardt, 2008). However, these pro-cesses continue to be difficult to quantify and conceptualize(McDonnell and Tanaka, 2001; Uhlenbrook and Hoeg, 2003)and the direct measurement of each discharge component, ina continuous way and at a sufficient number of locations ispractically impossible (e.g. Tardy et al., 2004). The accurateanalysis of water flow pathways from rainfall to streams isalso needed for the optimal protection of surface and ground-water resources (e.g. Wenninger et al., 2004). Understandingof the runoff generation processes is also essential for assess-ing the impacts of changes (e.g. land use changes, climatechange) on the hydrological response of a catchment (e.g.Uhlenbrook et al., 2008).
In many catchments, base flow is an important compo-nent of stream flow and, therefore, base flow separationshave been widely studied and have a long history in the sci-ence of hydrology (Hall, 1968; Tallaksen, 1995). Base flow
Published by Copernicus Publications on behalf of the European Geosciences Union.
2056 A. L. Gonzales et al.: Comparison of different base flow separation methods in a lowland catchment
separation methods can be divided in two main groups: non-tracer-based and tracer-based separation methods. However,most of the studies focused on mountainous catchments, andlittle attention has been given to lowland areas and areas thathave been strongly modified by man. Thus, in this study wewill focus on such a lowland study area.
1.1 Non tracer based base flow separation
The first base flow separation methods focused on the anal-ysis of the recession or depletion curves (e.g. Linsley et al.,1975; Szilagyi and Parlange, 1998) and they are capable ofidentifying the point where direct runoff (presumably surfacerunoff) finishes but they do not try to reconstruct the tempo-ral variable base flow hydrograph during floods (Dingman,2002). Later, the first filtering base flow separation meth-ods were developed to standardize the graphical base flowseparation methods (see also methodological section below):fixed interval, sliding interval and local minimum methods(Pettyjhon and Henning, 1979; Sloto and Crouse, 1996). Ba-sically, these methods take the minimum values of the hy-drograph within a pre-defined interval by following differ-ent criteria and connect them. The discharge under the con-structed line is defined as base flow accordingly. More re-cent filtering methods assume that base flow, associated asit is with discharge from groundwater storage, produces thelong wave responses of the hydrograph. Hence, low pass fil-tering of the hydrograph can be used to separate base flow(Eckhardt, 2005, 2008). Other base flow separation methodsuse the unit hydrograph method (e.g. Su, 1995). Here, thebase flow is determined by fitting a unit hydrograph modelwith information from the recession limbs of the hydrographand extrapolating it backwards. Another group of methodsfor base flow separation are the envelope and rating curvemethods (Kliner and Knezek, 1974; Sellinger, 1996; Holkoet al., 2002), which assume that a close relation exists be-tween groundwater levels and stream flows during recessionperiods due to the hydraulic connection between the streamand aquifer. Therefore, observed groundwater levels are usedto calculate base flow contributions based on previously de-fined relationships between groundwater levels and streamflows.
1.2 Tracer-based base flow separation
Hydrograph separations using hydrochemical tracers and en-vironmental isotopes offer the possibility to gain a better un-derstanding of the runoff generation processes (e.g. Bonell,1998). For example, the use of natural tracers demonstratedthat the retention of water in small catchments can be verylong (e.g. Kirchner et al., 2000; McGuire and McDonnell,2006). However, how and where the water is stored for solong in these catchments, while the hydrodynamic reactionduring rain events can be very quick (cf. “hydrological para-dox”: Kirchner, 2003) is not completely understood.
This type of hydrograph separation is based on a mass bal-ance approach, which assumes that the composition or chem-ical signature of water coming from various sources is con-stant and unique (different from each other) and that conser-vation of mass applies to the water quantities and water qual-ity including conservative mixing of different water compo-nents (e.g. Weiler et al., 1999; Uhlenbrook and Hoeg, 2003).However, relatively large uncertainties may be present in thequantification of the runoff components due to a number offactors (e.g. Joerin et al., 2002). Some of these uncertain-ties are the product of tracer analyses and discharge mea-surements, intra-storm variability of isotopic concentration,elevation effect on the isotopic composition of rain, chemicalreactions during runoff formation and the mixing of compo-nents, and spatial heterogeneity of tracer concentrations (seeUhlenbrook and Hoeg, 2003, for further discussion). Eventhough some of these uncertainties can be reduced by theuse of transfer function methods (e.g. Weiler et al., 2003),the assumption of a constant and uniform signature for ev-ery component is often fulfilled within short intervals (e.g.within an event). Then, tracer based hydrograph separationscan provide valuable information about the groundwater con-tributions to stream flow. However, little experience with thistechnique exists for low land areas.
1.3 Objectives
The objectives of this paper are (i) to compare different ap-proaches for base flow separation in a lowland area, (ii) todemonstrate how the application of different methods in con-junction with additional experimental investigation can leadto a better understanding of the runoff generation processes,and (iii) to discuss the applicability of different base flowseparation methods in lowland areas. The study was carriedout in a typical lowland area at Langbroekerwetering in theNetherlands.
2 Material and methods
2.1 Study area
The study area is located in the central part of The Nether-lands, in the province of Utrecht (Fig. 1). The Langbroek-erwetering area is limited by the rivers Neder Rijn in thesoutheast and the Kromme Rijn towards the southwest. Inthe North, the area is bounded by an ice pushed ridge calledthe Utrechtse Heuvelrug (topographic divide). The surfaceof the study area is 51.7 km2.
The climate in the Langbroekerwetering area is humidtemperate, with mild winters because of the strong influenceof the Gulf Stream. The monthly average temperature variesbetween 2.6◦C in January and 17.2◦C in July. The mean an-nual rainfall in the study area amounts to 800 mm, with a rel-atively high inter-annual variation and a moderate variationof the monthly rainfall within a year. The average rainfall
Hydrol. Earth Syst. Sci., 13, 2055–2068, 2009 www.hydrol-earth-syst-sci.net/13/2055/2009/
A. L. Gonzales et al.: Comparison of different base flow separation methods in a lowland catchment 2057
23
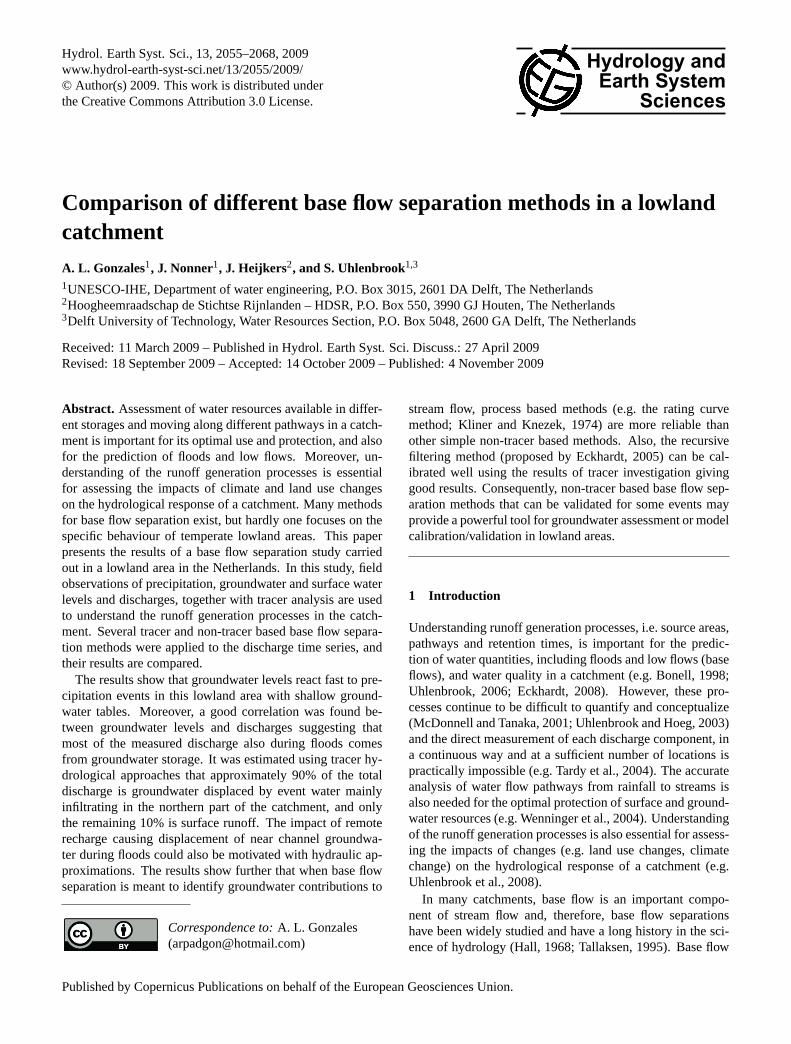
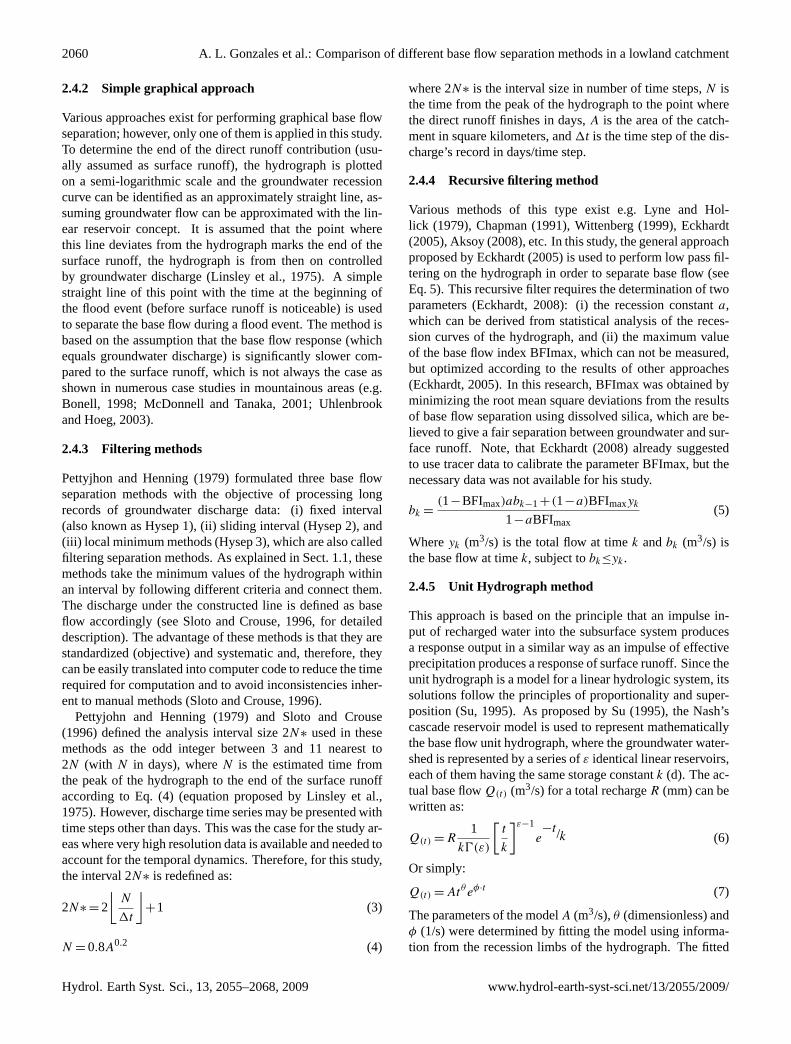
Figure 1. The research area Langbroekerwetering, located in the center of The Netherlands. Fig. 1. The research area Langbroekerwetering, located in the center of The Netherlands.
amount in April is 46.5 mm (the driest month) and 80 mmin December (the wettest month). The mean annual poten-tial evapotranspiration has been estimated at about 500 mmbased on daily potential evapotranspiration data using thePenman-Monteith approach (Huang, 2007).
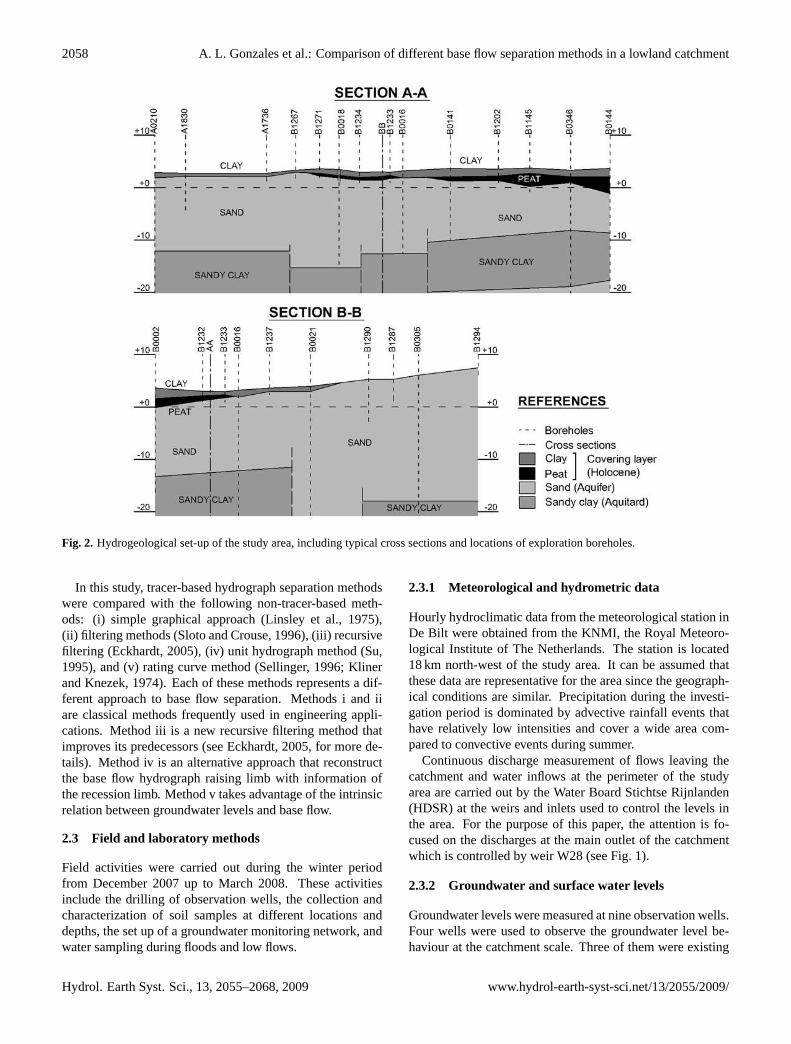
The highest area of the catchment is located at theUtrechtse Heuvelrug, an ice pushed ridge of about 60 m. Theridge is characterized by sandy permeable soils. In this areainfiltration and recharge of groundwater takes place. At thebottom of the ridge, the catchment becomes very flat, with analtitude between 3 and 5 m a.s.l. Here, the lithology consistsof series of alternating marine sediments (clays, sandy clays)and fluvial deposits (coarse sands) overlain in the lowest ar-eas by peat and clay deposits, also known as the coveringlayer (Huang, 2007) (Fig. 2). The low lying area constitutesa groundwater discharge area with seepage rates that havebeen estimated by Veldhuizen et al. (2009) at 1 to 2 mm/d(annual average).
The surface drainage system of the study area is very denseas is typical in Dutch lowland areas. It consists of a set ofcanals and ditches that were designed to maintain appropriategroundwater levels according to the land use requirements.The water levels are kept as constant as possible, but they arekept slightly lower during winter times (about 0.1–0.3 m), inorder to create storage capacity in the channel network forpotential winter floods caused by excessive rainfall. Controlis achieved by the use of weirs and inlets. Weirs are controldevices placed at different locations along the canals. Inletsare gate devices that let water flow into the study area. Astypical in low lands, when floods take place water may leave
the area at various points due to the flat topography (includ-ing change of flow directions).
2.2 General methodological approach
Understanding of the runoff generation process involvesmany aspects that can be summarized in three main steps:(i) familiarization with the physical environment where theprocesses take place e.g. hydrogeology, topography and sur-face drainage system, (ii) observation of different state vari-ables at different locations e.g. groundwater levels, soil mois-ture, surface water levels and chemical/isotopic compositionsetc., and (iii) formulation of a conceptual model of the waterflow through the catchment and identification of the domi-nating runoff generation processes. Each of these steps maycomprise activities at the catchment scale and at the localfield scale. The activities at the catchment scale are neces-sary to gain insights on the hydrological heterogeneity of thearea and its influence on the catchment scale responses. Thework at the field scale contributes to the identification of thedominating runoff generation processes.
Base flow separation methods using various non-tracer-based methods and tracer-based methods applying differenttracers should be carried out. The results of the non-tracer-based methods can be compared with the hydraulic and hy-drological concept of the catchment and with the results ofthe tracer-based separations. The agreement or disagreementbetween the results of different methods provides further in-sights into their applicability to lowland areas and into therunoff generation processes at play.
www.hydrol-earth-syst-sci.net/13/2055/2009/ Hydrol. Earth Syst. Sci., 13, 2055–2068, 2009
2058 A. L. Gonzales et al.: Comparison of different base flow separation methods in a lowland catchment
24
Figure 2. Hydrogeological set-up of the study area, including typical cross sections and
locations of exploration boreholes
Fig. 2. Hydrogeological set-up of the study area, including typical cross sections and locations of exploration boreholes.
In this study, tracer-based hydrograph separation methodswere compared with the following non-tracer-based meth-ods: (i) simple graphical approach (Linsley et al., 1975),(ii) filtering methods (Sloto and Crouse, 1996), (iii) recursivefiltering (Eckhardt, 2005), (iv) unit hydrograph method (Su,1995), and (v) rating curve method (Sellinger, 1996; Klinerand Knezek, 1974). Each of these methods represents a dif-ferent approach to base flow separation. Methods i and iiare classical methods frequently used in engineering appli-cations. Method iii is a new recursive filtering method thatimproves its predecessors (see Eckhardt, 2005, for more de-tails). Method iv is an alternative approach that reconstructthe base flow hydrograph raising limb with information ofthe recession limb. Method v takes advantage of the intrinsicrelation between groundwater levels and base flow.
2.3 Field and laboratory methods
Field activities were carried out during the winter periodfrom December 2007 up to March 2008. These activitiesinclude the drilling of observation wells, the collection andcharacterization of soil samples at different locations anddepths, the set up of a groundwater monitoring network, andwater sampling during floods and low flows.
2.3.1 Meteorological and hydrometric data
Hourly hydroclimatic data from the meteorological station inDe Bilt were obtained from the KNMI, the Royal Meteoro-logical Institute of The Netherlands. The station is located18 km north-west of the study area. It can be assumed thatthese data are representative for the area since the geograph-ical conditions are similar. Precipitation during the investi-gation period is dominated by advective rainfall events thathave relatively low intensities and cover a wide area com-pared to convective events during summer.
Continuous discharge measurement of flows leaving thecatchment and water inflows at the perimeter of the studyarea are carried out by the Water Board Stichtse Rijnlanden(HDSR) at the weirs and inlets used to control the levels inthe area. For the purpose of this paper, the attention is fo-cused on the discharges at the main outlet of the catchmentwhich is controlled by weir W28 (see Fig. 1).
2.3.2 Groundwater and surface water levels
Groundwater levels were measured at nine observation wells.Four wells were used to observe the groundwater level be-haviour at the catchment scale. Three of them were existing
Hydrol. Earth Syst. Sci., 13, 2055–2068, 2009 www.hydrol-earth-syst-sci.net/13/2055/2009/
A. L. Gonzales et al.: Comparison of different base flow separation methods in a lowland catchment 2059
25
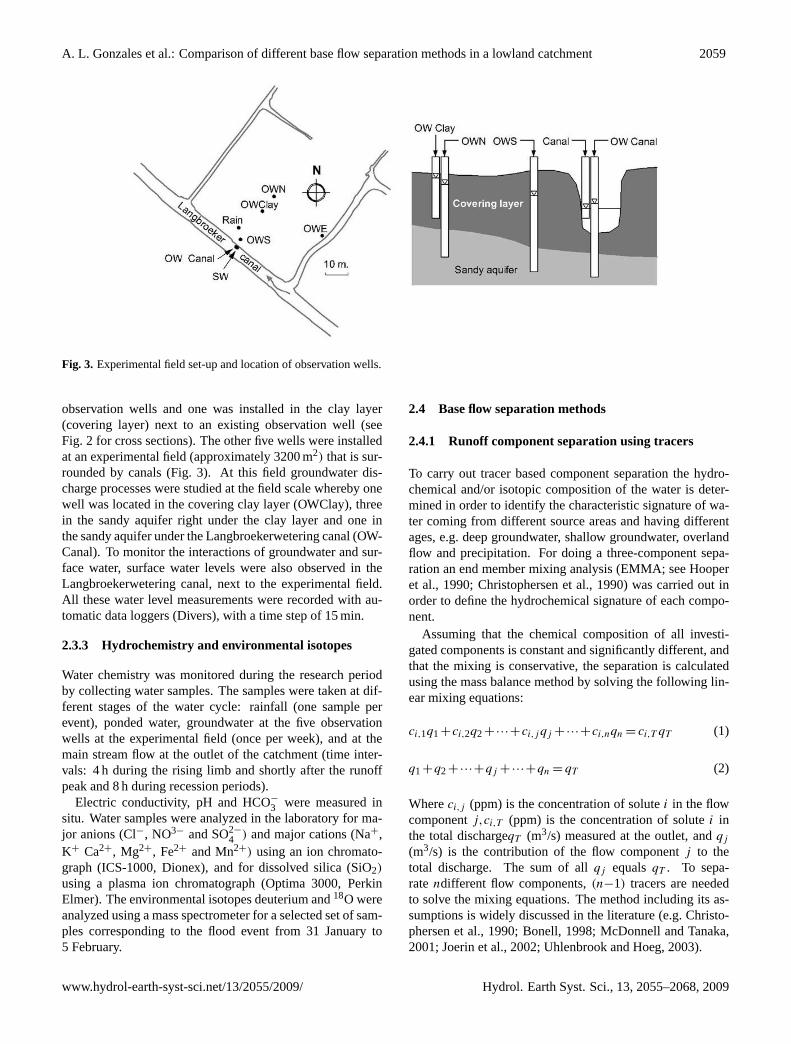
Figure 3. Experimental field set-up and location of observation wells Fig. 3. Experimental field set-up and location of observation wells.
observation wells and one was installed in the clay layer(covering layer) next to an existing observation well (seeFig. 2 for cross sections). The other five wells were installedat an experimental field (approximately 3200 m2) that is sur-rounded by canals (Fig. 3). At this field groundwater dis-charge processes were studied at the field scale whereby onewell was located in the covering clay layer (OWClay), threein the sandy aquifer right under the clay layer and one inthe sandy aquifer under the Langbroekerwetering canal (OW-Canal). To monitor the interactions of groundwater and sur-face water, surface water levels were also observed in theLangbroekerwetering canal, next to the experimental field.All these water level measurements were recorded with au-tomatic data loggers (Divers), with a time step of 15 min.
2.3.3 Hydrochemistry and environmental isotopes
Water chemistry was monitored during the research periodby collecting water samples. The samples were taken at dif-ferent stages of the water cycle: rainfall (one sample perevent), ponded water, groundwater at the five observationwells at the experimental field (once per week), and at themain stream flow at the outlet of the catchment (time inter-vals: 4 h during the rising limb and shortly after the runoffpeak and 8 h during recession periods).
Electric conductivity, pH and HCO−3 were measured insitu. Water samples were analyzed in the laboratory for ma-jor anions (Cl−, NO3− and SO2−
4 ) and major cations (Na+,K+ Ca2+, Mg2+, Fe2+ and Mn2+) using an ion chromato-graph (ICS-1000, Dionex), and for dissolved silica (SiO2)
using a plasma ion chromatograph (Optima 3000, PerkinElmer). The environmental isotopes deuterium and18O wereanalyzed using a mass spectrometer for a selected set of sam-ples corresponding to the flood event from 31 January to5 February.
2.4 Base flow separation methods
2.4.1 Runoff component separation using tracers
To carry out tracer based component separation the hydro-chemical and/or isotopic composition of the water is deter-mined in order to identify the characteristic signature of wa-ter coming from different source areas and having differentages, e.g. deep groundwater, shallow groundwater, overlandflow and precipitation. For doing a three-component sepa-ration an end member mixing analysis (EMMA; see Hooperet al., 1990; Christophersen et al., 1990) was carried out inorder to define the hydrochemical signature of each compo-nent.
Assuming that the chemical composition of all investi-gated components is constant and significantly different, andthat the mixing is conservative, the separation is calculatedusing the mass balance method by solving the following lin-ear mixing equations:
ci,1q1+ci,2q2+···+ci,jqj +···+ci,nqn = ci,T qT (1)
q1+q2+···+qj +···+qn = qT (2)
Whereci,j (ppm) is the concentration of solutei in the flowcomponentj,ci,T (ppm) is the concentration of solutei inthe total dischargeqT (m3/s) measured at the outlet, andqj
(m3/s) is the contribution of the flow componentj to thetotal discharge. The sum of allqj equalsqT . To sepa-ratendifferent flow components,(n−1) tracers are neededto solve the mixing equations. The method including its as-sumptions is widely discussed in the literature (e.g. Christo-phersen et al., 1990; Bonell, 1998; McDonnell and Tanaka,2001; Joerin et al., 2002; Uhlenbrook and Hoeg, 2003).
www.hydrol-earth-syst-sci.net/13/2055/2009/ Hydrol. Earth Syst. Sci., 13, 2055–2068, 2009
2060 A. L. Gonzales et al.: Comparison of different base flow separation methods in a lowland catchment
2.4.2 Simple graphical approach
Various approaches exist for performing graphical base flowseparation; however, only one of them is applied in this study.To determine the end of the direct runoff contribution (usu-ally assumed as surface runoff), the hydrograph is plottedon a semi-logarithmic scale and the groundwater recessioncurve can be identified as an approximately straight line, as-suming groundwater flow can be approximated with the lin-ear reservoir concept. It is assumed that the point wherethis line deviates from the hydrograph marks the end of thesurface runoff, the hydrograph is from then on controlledby groundwater discharge (Linsley et al., 1975). A simplestraight line of this point with the time at the beginning ofthe flood event (before surface runoff is noticeable) is usedto separate the base flow during a flood event. The method isbased on the assumption that the base flow response (whichequals groundwater discharge) is significantly slower com-pared to the surface runoff, which is not always the case asshown in numerous case studies in mountainous areas (e.g.Bonell, 1998; McDonnell and Tanaka, 2001; Uhlenbrookand Hoeg, 2003).
2.4.3 Filtering methods
Pettyjhon and Henning (1979) formulated three base flowseparation methods with the objective of processing longrecords of groundwater discharge data: (i) fixed interval(also known as Hysep 1), (ii) sliding interval (Hysep 2), and(iii) local minimum methods (Hysep 3), which are also calledfiltering separation methods. As explained in Sect. 1.1, thesemethods take the minimum values of the hydrograph withinan interval by following different criteria and connect them.The discharge under the constructed line is defined as baseflow accordingly (see Sloto and Crouse, 1996, for detaileddescription). The advantage of these methods is that they arestandardized (objective) and systematic and, therefore, theycan be easily translated into computer code to reduce the timerequired for computation and to avoid inconsistencies inher-ent to manual methods (Sloto and Crouse, 1996).
Pettyjohn and Henning (1979) and Sloto and Crouse(1996) defined the analysis interval size 2N∗ used in thesemethods as the odd integer between 3 and 11 nearest to2N (with N in days), whereN is the estimated time fromthe peak of the hydrograph to the end of the surface runoffaccording to Eq. (4) (equation proposed by Linsley et al.,1975). However, discharge time series may be presented withtime steps other than days. This was the case for the study ar-eas where very high resolution data is available and needed toaccount for the temporal dynamics. Therefore, for this study,the interval 2N∗ is redefined as:
2N∗ = 2
⌊N
1t
⌋+1 (3)
N = 0.8A0.2 (4)
where 2N∗ is the interval size in number of time steps,N isthe time from the peak of the hydrograph to the point wherethe direct runoff finishes in days,A is the area of the catch-ment in square kilometers, and1t is the time step of the dis-charge’s record in days/time step.
2.4.4 Recursive filtering method
Various methods of this type exist e.g. Lyne and Hol-lick (1979), Chapman (1991), Wittenberg (1999), Eckhardt(2005), Aksoy (2008), etc. In this study, the general approachproposed by Eckhardt (2005) is used to perform low pass fil-tering on the hydrograph in order to separate base flow (seeEq. 5). This recursive filter requires the determination of twoparameters (Eckhardt, 2008): (i) the recession constanta,which can be derived from statistical analysis of the reces-sion curves of the hydrograph, and (ii) the maximum valueof the base flow index BFImax, which can not be measured,but optimized according to the results of other approaches(Eckhardt, 2005). In this research, BFImax was obtained byminimizing the root mean square deviations from the resultsof base flow separation using dissolved silica, which are be-lieved to give a fair separation between groundwater and sur-face runoff. Note, that Eckhardt (2008) already suggestedto use tracer data to calibrate the parameter BFImax, but thenecessary data was not available for his study.
bk =(1−BFImax)abk−1+(1−a)BFImaxyk
1−aBFImax(5)
Whereyk (m3/s) is the total flow at timek andbk (m3/s) isthe base flow at timek, subject tobk≤yk.
2.4.5 Unit Hydrograph method
This approach is based on the principle that an impulse in-put of recharged water into the subsurface system producesa response output in a similar way as an impulse of effectiveprecipitation produces a response of surface runoff. Since theunit hydrograph is a model for a linear hydrologic system, itssolutions follow the principles of proportionality and super-position (Su, 1995). As proposed by Su (1995), the Nash’scascade reservoir model is used to represent mathematicallythe base flow unit hydrograph, where the groundwater water-shed is represented by a series ofε identical linear reservoirs,each of them having the same storage constantk (d). The ac-tual base flowQ(t) (m3/s) for a total rechargeR (mm) can bewritten as:
Q(t) = R1
k0(ε)
[t
k
]ε−1
e−t/k (6)
Or simply:
Q(t) = Atθeφ·t (7)
The parameters of the modelA (m3/s),θ (dimensionless) andφ (1/s) were determined by fitting the model using informa-tion from the recession limbs of the hydrograph. The fitted
Hydrol. Earth Syst. Sci., 13, 2055–2068, 2009 www.hydrol-earth-syst-sci.net/13/2055/2009/
A. L. Gonzales et al.: Comparison of different base flow separation methods in a lowland catchment 2061
model was then used to construct the total base flow hydro-graph, including the rising limbs.
2.4.6 Rating curve method
This method assumes that there is a relationship betweengroundwater levels and discharge in the stream during reces-sion periods. Kliner and Knezek (1974) propose to determinethis relation by fitting an envelope to all the available datafrom groundwater levels versus discharge measurements. In-stead, Sellinger (1996) proposes to fit a curve only to the datacorresponding to the recession limbs. Theoretically, both ap-proaches should give similar results and for ease of calcula-tion, the second approach was followed in this work. Thepotential relation that Sellinger (1996) proposes was not suc-cessful in this research. Therefore, the exponential functionshown by Eq. (8) was applied with good results. The termQ0 (m3/s) was introduced to account for a constant dischargecoming from the deeper aquifer.
Q = AeBh+Q0 (8)
WhereQ (m3/s) is the discharge at the outlet of the catch-ment,h (m) is the groundwater level in an observation well,or an average groundwater level over the catchment, andA
(m3/s),B (1/m) andQ0 (m3/s) are fitting parameters, whichcan be determined e.g. with the least squares method usingobserved discharge (Q) and water level data (h) correspond-ing to the recession limb of the hydrograph after the sur-face runoff is over. The starting point of pure groundwaterdischarge may be determined approximately using Linsley’sformula (see Eq. 4). The analysis has to be applied separatelyfor each event.
2.5 Response time of the aquifer system
In order to fully analyse the runoff generation for the studyarea, it is also necessary to become familiar with the conceptof the response time of an aquifer system. Assuming thatin the study area the first aquifer under the covering layeris a confined aquifer, it is possible to calculate the time thatan impulse, i.e. a recharge event at the upper boundary ofthe covering layer, takes to produce a maximum level riseat an observation well within the covering layer area. Thefollowing equations hold (they are also known as impulse-response function) (Venetis, 1970; Olsthoorn, 2007):
1h(x,t) = 1h(x=0,t=0)
u
t√
πe−u2
(9)
u =
√x2S
4kDt(10)
Where1h(x,t) (m) is the increase in water level at a distancex (m) from the recharge area to an observation well in thearea within the covering layer and at a timet (d) since theoccurrence of the impulse1h(x=0,t=0) (m).
3 Results
3.1 Rainfall runoff observations
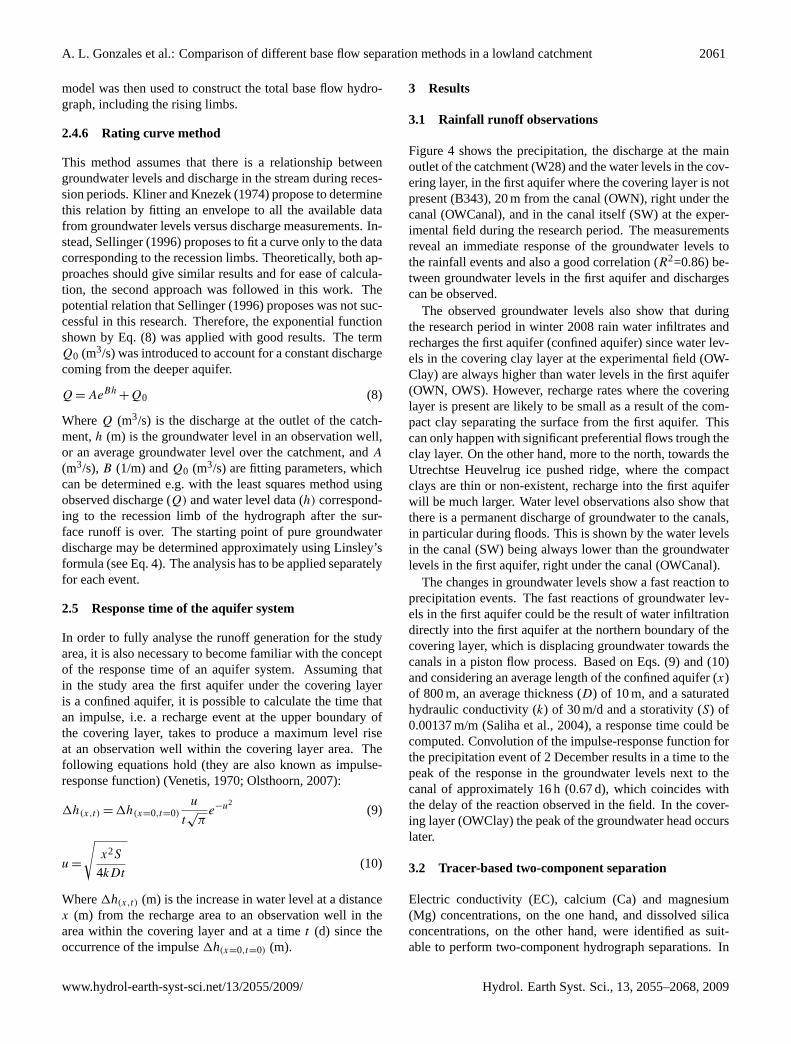
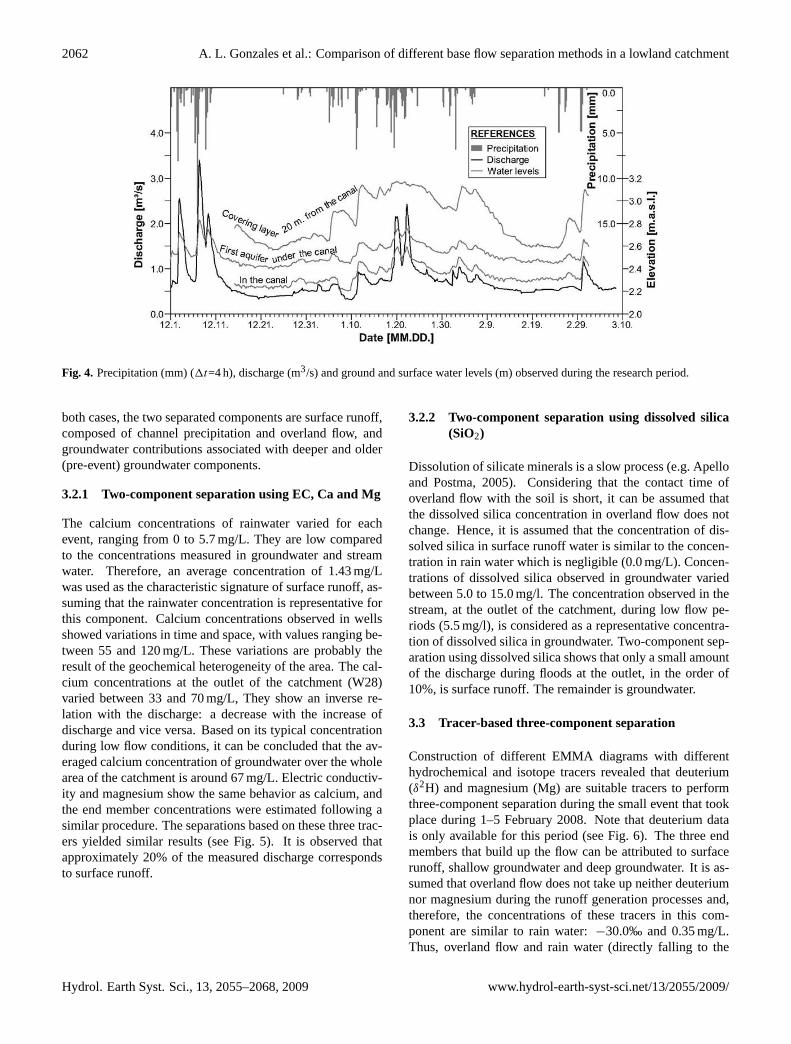
Figure 4 shows the precipitation, the discharge at the mainoutlet of the catchment (W28) and the water levels in the cov-ering layer, in the first aquifer where the covering layer is notpresent (B343), 20 m from the canal (OWN), right under thecanal (OWCanal), and in the canal itself (SW) at the exper-imental field during the research period. The measurementsreveal an immediate response of the groundwater levels tothe rainfall events and also a good correlation (R2=0.86) be-tween groundwater levels in the first aquifer and dischargescan be observed.
The observed groundwater levels also show that duringthe research period in winter 2008 rain water infiltrates andrecharges the first aquifer (confined aquifer) since water lev-els in the covering clay layer at the experimental field (OW-Clay) are always higher than water levels in the first aquifer(OWN, OWS). However, recharge rates where the coveringlayer is present are likely to be small as a result of the com-pact clay separating the surface from the first aquifer. Thiscan only happen with significant preferential flows trough theclay layer. On the other hand, more to the north, towards theUtrechtse Heuvelrug ice pushed ridge, where the compactclays are thin or non-existent, recharge into the first aquiferwill be much larger. Water level observations also show thatthere is a permanent discharge of groundwater to the canals,in particular during floods. This is shown by the water levelsin the canal (SW) being always lower than the groundwaterlevels in the first aquifer, right under the canal (OWCanal).
The changes in groundwater levels show a fast reaction toprecipitation events. The fast reactions of groundwater lev-els in the first aquifer could be the result of water infiltrationdirectly into the first aquifer at the northern boundary of thecovering layer, which is displacing groundwater towards thecanals in a piston flow process. Based on Eqs. (9) and (10)and considering an average length of the confined aquifer (x)of 800 m, an average thickness (D) of 10 m, and a saturatedhydraulic conductivity (k) of 30 m/d and a storativity (S) of0.00137 m/m (Saliha et al., 2004), a response time could becomputed. Convolution of the impulse-response function forthe precipitation event of 2 December results in a time to thepeak of the response in the groundwater levels next to thecanal of approximately 16 h (0.67 d), which coincides withthe delay of the reaction observed in the field. In the cover-ing layer (OWClay) the peak of the groundwater head occurslater.
3.2 Tracer-based two-component separation
Electric conductivity (EC), calcium (Ca) and magnesium(Mg) concentrations, on the one hand, and dissolved silicaconcentrations, on the other hand, were identified as suit-able to perform two-component hydrograph separations. In
www.hydrol-earth-syst-sci.net/13/2055/2009/ Hydrol. Earth Syst. Sci., 13, 2055–2068, 2009
2062 A. L. Gonzales et al.: Comparison of different base flow separation methods in a lowland catchment
26
Figure 4. Precipitation (mm) (∆t=4 hours), discharge (m3/s) and ground and surface water
levels (m) observed during the research period.
Fig. 4. Precipitation (mm) (1t=4 h), discharge (m3/s) and ground and surface water levels (m) observed during the research period.
both cases, the two separated components are surface runoff,composed of channel precipitation and overland flow, andgroundwater contributions associated with deeper and older(pre-event) groundwater components.
3.2.1 Two-component separation using EC, Ca and Mg
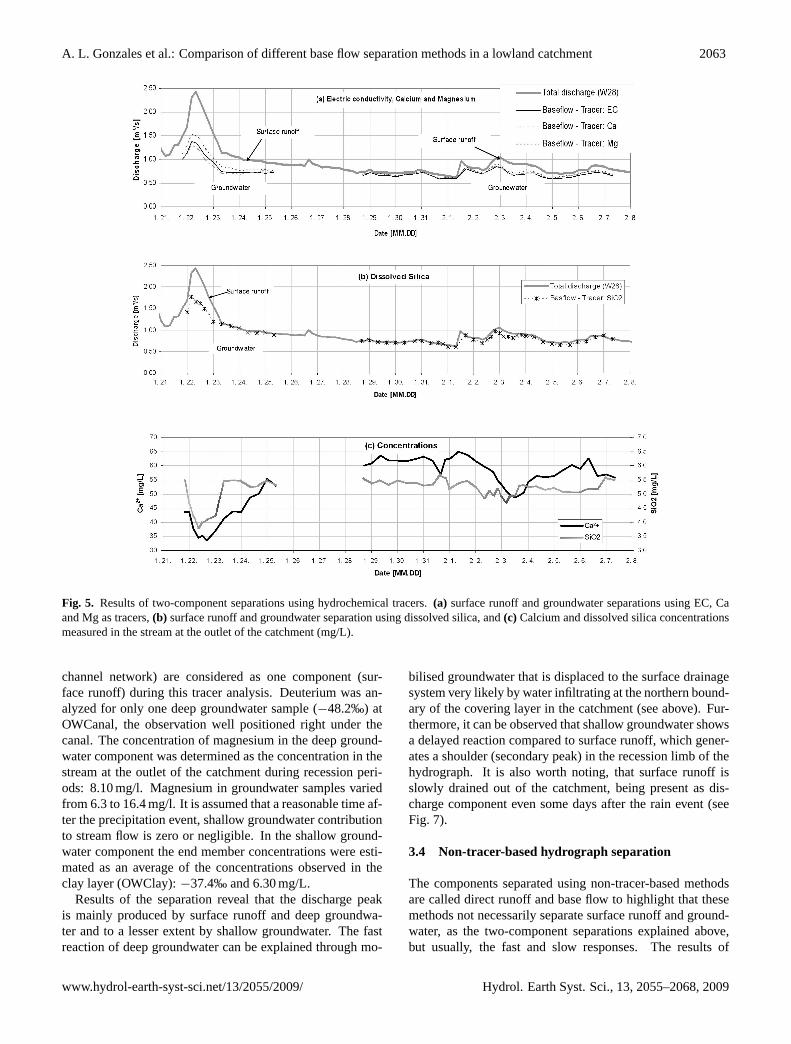
The calcium concentrations of rainwater varied for eachevent, ranging from 0 to 5.7 mg/L. They are low comparedto the concentrations measured in groundwater and streamwater. Therefore, an average concentration of 1.43 mg/Lwas used as the characteristic signature of surface runoff, as-suming that the rainwater concentration is representative forthis component. Calcium concentrations observed in wellsshowed variations in time and space, with values ranging be-tween 55 and 120 mg/L. These variations are probably theresult of the geochemical heterogeneity of the area. The cal-cium concentrations at the outlet of the catchment (W28)varied between 33 and 70 mg/L, They show an inverse re-lation with the discharge: a decrease with the increase ofdischarge and vice versa. Based on its typical concentrationduring low flow conditions, it can be concluded that the av-eraged calcium concentration of groundwater over the wholearea of the catchment is around 67 mg/L. Electric conductiv-ity and magnesium show the same behavior as calcium, andthe end member concentrations were estimated following asimilar procedure. The separations based on these three trac-ers yielded similar results (see Fig. 5). It is observed thatapproximately 20% of the measured discharge correspondsto surface runoff.
3.2.2 Two-component separation using dissolved silica(SiO2)
Dissolution of silicate minerals is a slow process (e.g. Apelloand Postma, 2005). Considering that the contact time ofoverland flow with the soil is short, it can be assumed thatthe dissolved silica concentration in overland flow does notchange. Hence, it is assumed that the concentration of dis-solved silica in surface runoff water is similar to the concen-tration in rain water which is negligible (0.0 mg/L). Concen-trations of dissolved silica observed in groundwater variedbetween 5.0 to 15.0 mg/l. The concentration observed in thestream, at the outlet of the catchment, during low flow pe-riods (5.5 mg/l), is considered as a representative concentra-tion of dissolved silica in groundwater. Two-component sep-aration using dissolved silica shows that only a small amountof the discharge during floods at the outlet, in the order of10%, is surface runoff. The remainder is groundwater.
3.3 Tracer-based three-component separation
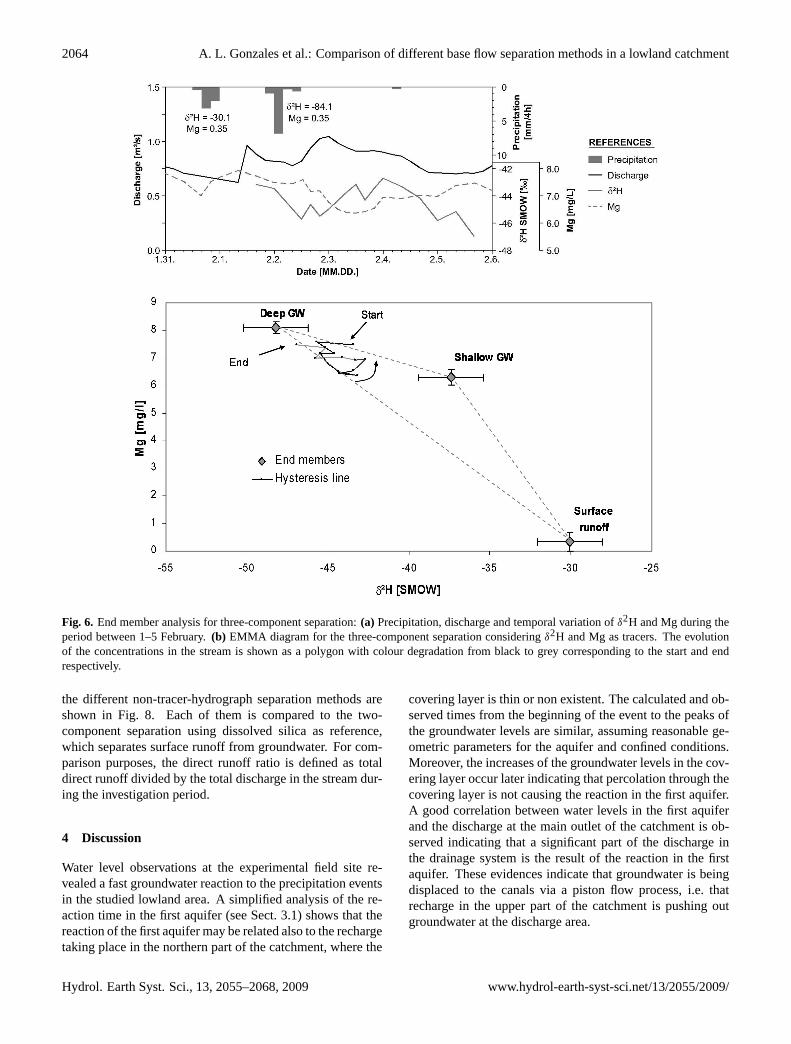
Construction of different EMMA diagrams with differenthydrochemical and isotope tracers revealed that deuterium(δ2H) and magnesium (Mg) are suitable tracers to performthree-component separation during the small event that tookplace during 1–5 February 2008. Note that deuterium datais only available for this period (see Fig. 6). The three endmembers that build up the flow can be attributed to surfacerunoff, shallow groundwater and deep groundwater. It is as-sumed that overland flow does not take up neither deuteriumnor magnesium during the runoff generation processes and,therefore, the concentrations of these tracers in this com-ponent are similar to rain water:−30.0‰ and 0.35 mg/L.Thus, overland flow and rain water (directly falling to the
Hydrol. Earth Syst. Sci., 13, 2055–2068, 2009 www.hydrol-earth-syst-sci.net/13/2055/2009/
A. L. Gonzales et al.: Comparison of different base flow separation methods in a lowland catchment 2063
Fig. 5. Results of two-component separations using hydrochemical tracers.(a) surface runoff and groundwater separations using EC, Caand Mg as tracers,(b) surface runoff and groundwater separation using dissolved silica, and(c) Calcium and dissolved silica concentrationsmeasured in the stream at the outlet of the catchment (mg/L).
channel network) are considered as one component (sur-face runoff) during this tracer analysis. Deuterium was an-alyzed for only one deep groundwater sample (−48.2‰) atOWCanal, the observation well positioned right under thecanal. The concentration of magnesium in the deep ground-water component was determined as the concentration in thestream at the outlet of the catchment during recession peri-ods: 8.10 mg/l. Magnesium in groundwater samples variedfrom 6.3 to 16.4 mg/l. It is assumed that a reasonable time af-ter the precipitation event, shallow groundwater contributionto stream flow is zero or negligible. In the shallow ground-water component the end member concentrations were esti-mated as an average of the concentrations observed in theclay layer (OWClay):−37.4‰ and 6.30 mg/L.
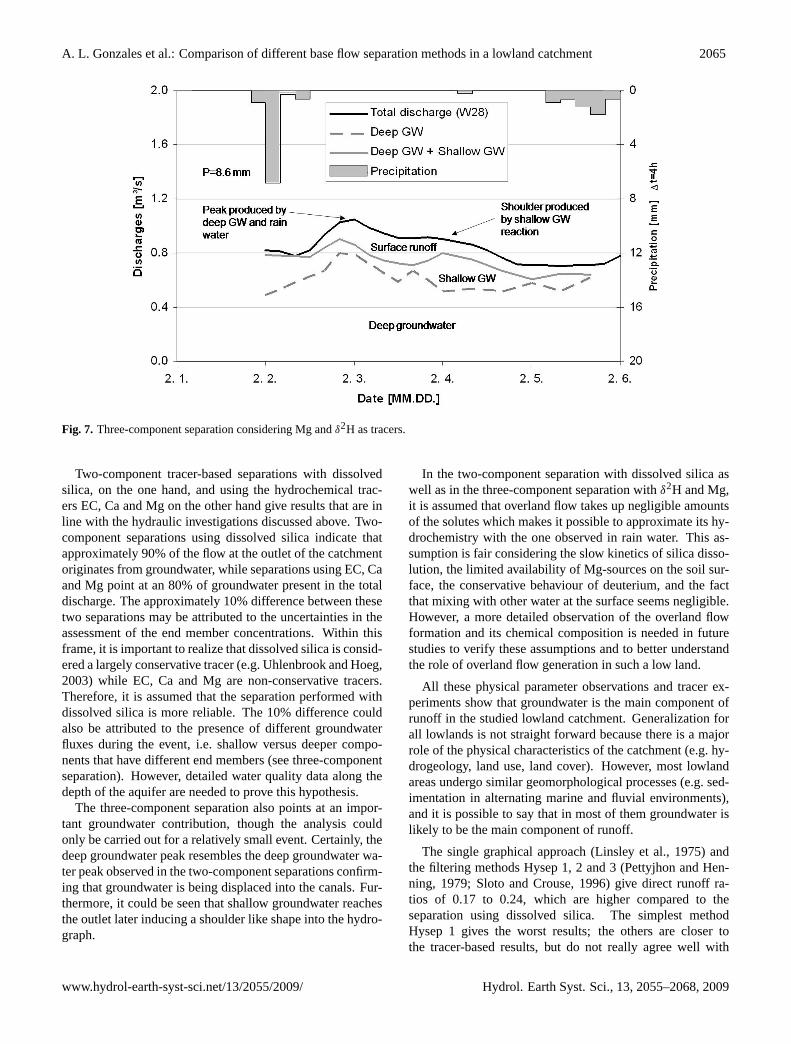
Results of the separation reveal that the discharge peakis mainly produced by surface runoff and deep groundwa-ter and to a lesser extent by shallow groundwater. The fastreaction of deep groundwater can be explained through mo-
bilised groundwater that is displaced to the surface drainagesystem very likely by water infiltrating at the northern bound-ary of the covering layer in the catchment (see above). Fur-thermore, it can be observed that shallow groundwater showsa delayed reaction compared to surface runoff, which gener-ates a shoulder (secondary peak) in the recession limb of thehydrograph. It is also worth noting, that surface runoff isslowly drained out of the catchment, being present as dis-charge component even some days after the rain event (seeFig. 7).
3.4 Non-tracer-based hydrograph separation
The components separated using non-tracer-based methodsare called direct runoff and base flow to highlight that thesemethods not necessarily separate surface runoff and ground-water, as the two-component separations explained above,but usually, the fast and slow responses. The results of
www.hydrol-earth-syst-sci.net/13/2055/2009/ Hydrol. Earth Syst. Sci., 13, 2055–2068, 2009
2064 A. L. Gonzales et al.: Comparison of different base flow separation methods in a lowland catchment
Fig. 6. End member analysis for three-component separation:(a) Precipitation, discharge and temporal variation ofδ2H and Mg during theperiod between 1–5 February.(b) EMMA diagram for the three-component separation consideringδ2H and Mg as tracers. The evolutionof the concentrations in the stream is shown as a polygon with colour degradation from black to grey corresponding to the start and endrespectively.
the different non-tracer-hydrograph separation methods areshown in Fig. 8. Each of them is compared to the two-component separation using dissolved silica as reference,which separates surface runoff from groundwater. For com-parison purposes, the direct runoff ratio is defined as totaldirect runoff divided by the total discharge in the stream dur-ing the investigation period.
4 Discussion
Water level observations at the experimental field site re-vealed a fast groundwater reaction to the precipitation eventsin the studied lowland area. A simplified analysis of the re-action time in the first aquifer (see Sect. 3.1) shows that thereaction of the first aquifer may be related also to the rechargetaking place in the northern part of the catchment, where the
covering layer is thin or non existent. The calculated and ob-served times from the beginning of the event to the peaks ofthe groundwater levels are similar, assuming reasonable ge-ometric parameters for the aquifer and confined conditions.Moreover, the increases of the groundwater levels in the cov-ering layer occur later indicating that percolation through thecovering layer is not causing the reaction in the first aquifer.A good correlation between water levels in the first aquiferand the discharge at the main outlet of the catchment is ob-served indicating that a significant part of the discharge inthe drainage system is the result of the reaction in the firstaquifer. These evidences indicate that groundwater is beingdisplaced to the canals via a piston flow process, i.e. thatrecharge in the upper part of the catchment is pushing outgroundwater at the discharge area.
Hydrol. Earth Syst. Sci., 13, 2055–2068, 2009 www.hydrol-earth-syst-sci.net/13/2055/2009/
A. L. Gonzales et al.: Comparison of different base flow separation methods in a lowland catchment 2065
Fig. 7. Three-component separation considering Mg andδ2H as tracers.
Two-component tracer-based separations with dissolvedsilica, on the one hand, and using the hydrochemical trac-ers EC, Ca and Mg on the other hand give results that are inline with the hydraulic investigations discussed above. Two-component separations using dissolved silica indicate thatapproximately 90% of the flow at the outlet of the catchmentoriginates from groundwater, while separations using EC, Caand Mg point at an 80% of groundwater present in the totaldischarge. The approximately 10% difference between thesetwo separations may be attributed to the uncertainties in theassessment of the end member concentrations. Within thisframe, it is important to realize that dissolved silica is consid-ered a largely conservative tracer (e.g. Uhlenbrook and Hoeg,2003) while EC, Ca and Mg are non-conservative tracers.Therefore, it is assumed that the separation performed withdissolved silica is more reliable. The 10% difference couldalso be attributed to the presence of different groundwaterfluxes during the event, i.e. shallow versus deeper compo-nents that have different end members (see three-componentseparation). However, detailed water quality data along thedepth of the aquifer are needed to prove this hypothesis.
The three-component separation also points at an impor-tant groundwater contribution, though the analysis couldonly be carried out for a relatively small event. Certainly, thedeep groundwater peak resembles the deep groundwater wa-ter peak observed in the two-component separations confirm-ing that groundwater is being displaced into the canals. Fur-thermore, it could be seen that shallow groundwater reachesthe outlet later inducing a shoulder like shape into the hydro-graph.
In the two-component separation with dissolved silica aswell as in the three-component separation withδ2H and Mg,it is assumed that overland flow takes up negligible amountsof the solutes which makes it possible to approximate its hy-drochemistry with the one observed in rain water. This as-sumption is fair considering the slow kinetics of silica disso-lution, the limited availability of Mg-sources on the soil sur-face, the conservative behaviour of deuterium, and the factthat mixing with other water at the surface seems negligible.However, a more detailed observation of the overland flowformation and its chemical composition is needed in futurestudies to verify these assumptions and to better understandthe role of overland flow generation in such a low land.
All these physical parameter observations and tracer ex-periments show that groundwater is the main component ofrunoff in the studied lowland catchment. Generalization forall lowlands is not straight forward because there is a majorrole of the physical characteristics of the catchment (e.g. hy-drogeology, land use, land cover). However, most lowlandareas undergo similar geomorphological processes (e.g. sed-imentation in alternating marine and fluvial environments),and it is possible to say that in most of them groundwater islikely to be the main component of runoff.
The single graphical approach (Linsley et al., 1975) andthe filtering methods Hysep 1, 2 and 3 (Pettyjhon and Hen-ning, 1979; Sloto and Crouse, 1996) give direct runoff ra-tios of 0.17 to 0.24, which are higher compared to theseparation using dissolved silica. The simplest methodHysep 1 gives the worst results; the others are closer tothe tracer-based results, but do not really agree well with
www.hydrol-earth-syst-sci.net/13/2055/2009/ Hydrol. Earth Syst. Sci., 13, 2055–2068, 2009
2066 A. L. Gonzales et al.: Comparison of different base flow separation methods in a lowland catchment
30
Figure 8. Results obtained with different non-tracer based base flow separation methods and
comparison with the surface runoff/groundwater separation using dissolved silica as tracer
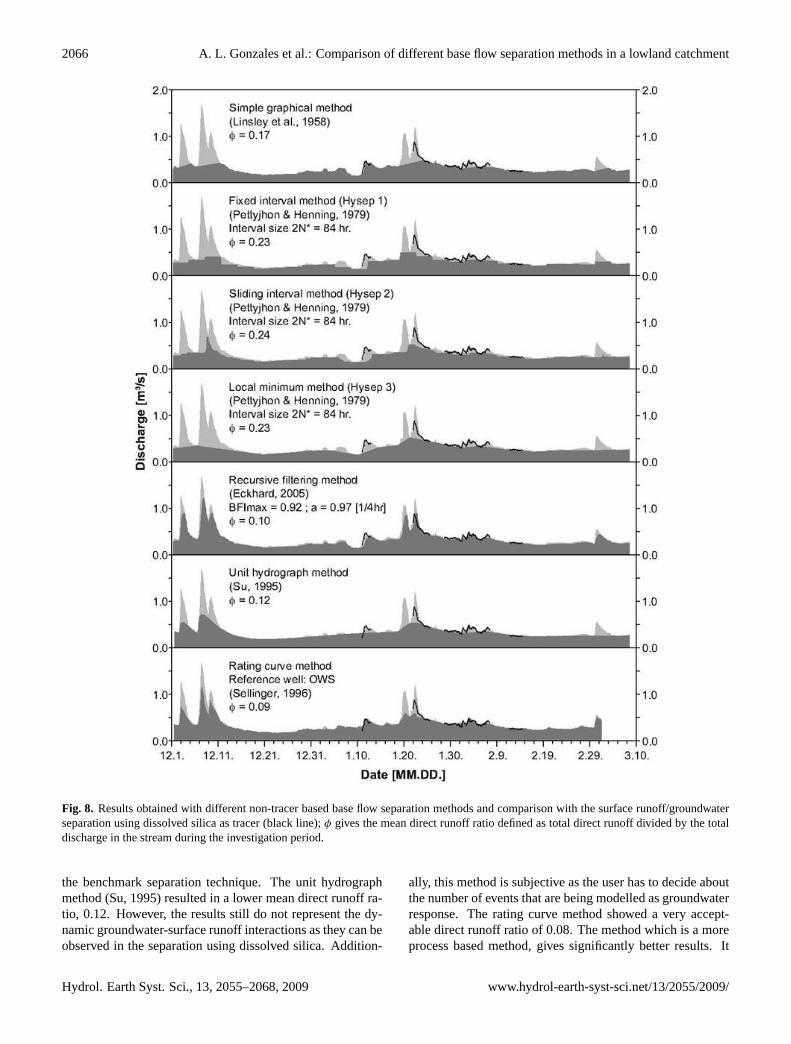
Fig. 8. Results obtained with different non-tracer based base flow separation methods and comparison with the surface runoff/groundwaterseparation using dissolved silica as tracer (black line);φ gives the mean direct runoff ratio defined as total direct runoff divided by the totaldischarge in the stream during the investigation period.
the benchmark separation technique. The unit hydrographmethod (Su, 1995) resulted in a lower mean direct runoff ra-tio, 0.12. However, the results still do not represent the dy-namic groundwater-surface runoff interactions as they can beobserved in the separation using dissolved silica. Addition-
ally, this method is subjective as the user has to decide aboutthe number of events that are being modelled as groundwaterresponse. The rating curve method showed a very accept-able direct runoff ratio of 0.08. The method which is a moreprocess based method, gives significantly better results. It
Hydrol. Earth Syst. Sci., 13, 2055–2068, 2009 www.hydrol-earth-syst-sci.net/13/2055/2009/
A. L. Gonzales et al.: Comparison of different base flow separation methods in a lowland catchment 2067
does not only show that there is an important groundwatercontribution during the flood events, but the separated baseflow also follows the temporal course of the groundwaterdischarge obtained in the separation using dissolved silica.Finally, it can be observed that recursive filtering method(Eckhardt, 2005) gives the best results, if compared to theseparation using dissolved silica, with a direct runoff rationof 0.10. This is not a surprise since the BFImax parameterof this method was calibrated with the results of the separa-tion with dissolved silica, thus a good agreement of the twomethods was expected.
5 Conclusions
The simplified analysis of the reaction time in the firstaquifer, the good correlation observed between groundwaterlevels and discharges at the outlet of the catchment, and thetracer analyses (two and three component tracer-based sepa-rations), all of them indicate that groundwater displacementin a piston flow is the main process in runoff generation inthe studied lowland. The importance of groundwater flowin runoff generation may be generalized to most flat lowlandareas where topography and land use/cover do not favour sur-face runoff generation.
In general, tracer-based hydrograph separation methodsagreed well with other field observations and proved to beuseful to gain further insight in to the runoff generation pro-cesses in the studied lowland catchment. However, they maynot be practical and economic in the long run and it is notpossible to apply them to past discharge time series if nochemical/isotopic data of stream water and main source ar-eas are available, which is usually the case. Therefore, it isnecessary to use non-tracer-based base flow separation meth-ods that still give meaningful insights in to the groundwaterdischarge of a catchment.
It was demonstrated that in the investigated lowland area,different non-tracer-based methods yield different separationresults, which may be the case in most lowland areas. Conse-quently, the selection of an appropriate method is an impor-tant issue. Furthermore, the results show how tracer-basedseparations can be used to validate the results of the selectedmethod. For the study area, the base flow separation methodwhich identified the groundwater component of stream flowthe best were the rating curve/envelope method (Sellinger,1996; Kliner and Knezek, 1974) and the recursive filter-ing methods from Eckhardt (2005). The first method alsogave good results in different mountainous areas (Kliner andKnezek, 1974; Holko et al., 2002). However, groundwaterlevel measurements are needed for this method. The recur-sive filtering method provided in particular very satisfactoryresults when it was calibrated with the results of tracer inves-tigations as suggested by Eckhardt (2005).
It is concluded that Eckhardt’s recursive filtering methodis suitable base flow separation in lowland areas when cali-
bration of the BFImax parameter is performed with the useof tracer experiments. When groundwater level observationsare available, the rating curve/envelope method is straightforward.
Finally, it was demonstrated that the results of verifiednon-tracer based methods can be used for estimating ground-water discharge in a low land catchment. This is essential,for instance, for groundwater or surface water model calibra-tion/validation, water resources assessment etc. Future re-search will concentrate on these aspects with respect to theapplicability to the hydrological conditions in low lands.
Acknowledgements.This study was supported by the WatermillProject of UNESCO-IHE and the Hoogheemraadschap de StichtseRijnlanden (HDSR), the Netherlands. Data for this research waskindly provided by the following institutions: HDSR (informationon the study area and discharge time series), KNMI (hydroclimatictime series) and Vrije University of Amsterdam (analysis of watersamples for the environmental isotopes deuterium and18O).
Edited by: E. Zehe
References
Appelo, C. A. J. and Postma, D.: Geochemistry, groundwater andpollution, A.A. Balkema, 2005.
Aksoy, H., Unal, N. E., and Pektas, A. O.: Smoothed minimabase?ow separation tool for perennial and intermittent streams,Hydrol. Processes, 22, 4467–4476, 2008.
Chapman, T. G.: Comment on “Evaluation of automated techniquesfor base ?ow and recession analyses” by R. J. Nathan and T. A.McMahon, Water Resour. Res., 27, 1783–1784, 1991.
Christophersen, N., Neal, C., and Hooper, R. P.: Modelingstreamwater chemistry as a mixture of soil water endmembers, astep towards second generation acidification models, J. Hydrol.,116, 307–320, 1990.
Dingman, S. L.: Physical hydrology, Prentice Hall, 2002.Eckhardt, K.: How to construct recursive digital filters for base flow
separation, Hydrol. Processes, 19, 507–515, 2005.Eckhardt, K.: A comparison of base flow indices, which were cal-
culated with seven different base flow separation methods, J. Hy-drol., 352, 168–173, 2008.
Hall, F. R.: Base-flow recessions – A review, Water Resour. Res.,4(5), 973–983, 1968.
Holko, L., Herrmann, A., Uhlenbrook, S., Pfister, L., and Querner,E.: Ground water runoff separation – test of applicability ofa simple separation method under varying natural conditions.Friend 2002 – Regional hydrology: Bridging the gap between re-search and practice (IAHS Publication no. 274), 265–272, 2002.
Hooper, R. P., Christophersen, N., and Peters, J.: End member mix-ing analysis (EMMA): an analytical framework for the interpre-tation of streamwater chemistry, J. Hydrol., 116, 321–345, 1990.
Huang, C.: A conceptual validation framework for groundwatermodeling. Case study Langbroekerwetering area. Water Scienceand Engineering – Hydrology and Water Resources, Delft, Inter-national Institute for Infrastructural, hydraulic and environmentalengineering – Unesco-IHE, Master of Science: 130, 2007.
www.hydrol-earth-syst-sci.net/13/2055/2009/ Hydrol. Earth Syst. Sci., 13, 2055–2068, 2009
2068 A. L. Gonzales et al.: Comparison of different base flow separation methods in a lowland catchment
Joerin, C., Beven, K. J., Iorgulescu, I., and Musy, A.: Uncertaintyin hydrograph separations based on geochemical mixing models,J. Hydrol., 255(1–4), 90–106, 2002.
Kirchner, J. W., Feng, X., and Neal, C.: Fractal stream chemistryand its implications for contaminant transport in catchments, Na-ture, 403, 524–527, 2000.
Kirchner, J. W.: A double paradox in catchment hydrology and geo-chemistry, Hydrol. Processes, 17, 871–874, 2003.
Kliner, K. and Knezek, M.: The underground runoff separationmethod making use of the observation of ground water table, Hy-drology and hydromechanics, XXII(5), 457–466, 1974.
Linsley, R. K., Kohler, M. A., and Paulhus, J. L. H.: Hydrology forengineers, McGraw-Hill, 1975.
Lyne, V. D. and Hollick, M.: Stochastic time-variable rainfall runoffmodelling. Hydrology and Water Resources Symposium, Institu-tion of Engineers Australia, Perth, 89–92, 1979.
McDonnell, J. J. and Tanaka, T. (Eds.): Hydrology and biogeo-chemistry of forested catchments, Special issue of HydrologicalProcesses, 15(9), 2001.
McGuire, K. J. and McDonnell, J. J.: A review and evaluation ofcatchment transit time modeling, J. Hydrol., 330, 543–563, 2006.
Olsthoorn, T. N.: Do a bit more with convolution, Groundwater,46(1), 13–22, 2007.
Pettyjohn, W. A. and Henning, R.: Preliminary estimate of ground-water recharge rates, related streamflow and water quality inOhio: Ohio State. University Water Resources Center, ProjectCompletion Report Number 552, 323, 1979.
Saliha, A. H., Zhengyue, J., De Laat, P., and Nonner, J.: Mod-elling the Western Betuwe Area. Water Science and Engineering– Hydrology and Water Resources, Delft, International Institutefor Infrastructural, Hydraulic and Environmental Engineering –IHE. Master of Science: 155, 2004.
Sellinger, C. E.: Computer program for performing hydrograph sep-aration using the rating curve method, US Department of Com-merce, National Oceanic and Atmospheric Administration, Tech-nical Memorandum ERL GLERL-100, 1996.
Sloto, R. A. and Crouse, M. Y.: HYSEP: A computer program forstreamflow hydrograph separation and analysis, US GeologicalSurvey, Water Resources Investigation Report, 96-4040, 1996.
Su, N.: The unit hydrograph model for hydrograph separation, En-vironment International, 21(5), 509–515, 1995.
Szilagyi, J. and Parlange, M. B.: Base flow separation based on an-alytical solutions of the Boussinesq equation, J. Hydrol., 204(1–4), 251–260, 1998.
Tallaksen, L. M.: A review of base flow recession analysis, J. Hy-drol., 165, 149–370, 1995.
Tardy, Y., Bustillo, V., and Boeglin, J. L.: Geochemistry appliedto the watershed survey: hydrograph separation, erosion and soildynamics. A case study: the basin of the Niger River, Africa,Appl. Geochemistry, 4, 469–518, 2004.
Uhlenbrook, S., Frey, M., Leibundgut, C., and Maloszewski, P.: Hy-drograph separations in a mesoscale mountainous basin at eventand seasonal timescales, Water Resour. Res., 38(6), 31-1/31-14,2002.
Uhlenbrook, S. and Hoeg, S.: Quantifying uncertainties in tracer-based hydrograph separations: a case study for two three andfive-component hydrograph separations in a mountainous catch-ment, Hydrol. Processes, 17, 431–453, 2003.
Uhlenbrook, S.: Catchment hydrology – a science in which allprocesses are preferential, Hydrol. Processes, HPToday, 20(16),3581–3585, doi:10.1002/hyp.6564, 2006.
Uhlenbrook, S., Didszun, J., and Wenninger, J.: Source areas andmixing of runoff components at the hillslope scale – A multi-technical approach, Hydrol. Sci. J., 53(4), 741–753, 2008.
Veldhuizen, A. A., Heijkers, J., Borren, W., Nijsten, G. J., and La-gendijk, V.: HYDROMEDAH: Development of an integrated hy-drological modelling toolkit & database for HoogheemraadschapDe Stichtse Rijnlanden, in preperation, 2009 (in Dutch).
Venetis, C.: Finite aquifers: Characteristic responses and applica-tions, J. Hydrol., 12(1–2), 53–62, 1970.
Weiler, M., Scherrer, S., Naef, F., and Burlando, P.: Hydro-graph separation of runoff components based on measuring hy-draulic state variables, tracer experiments, and weighting meth-ods, IAHS Publications, 258, 249–255, 1999.
Weiler, M., McGlynn, B. L., McGuire, K. J., and McDonnell, J. J.:How does rainfall become runoff? A combined tracer and runofftransfer function approach, Water Resour. Res., 39(11), 4-1/4-13,2003.
Wenninger, J., Uhlenbrook, S., Tilch, N., and Leibundgut, C.: Ex-perimental evidence of fast groundwater responses in a hills-lope/floodplain area in the Black Forest Mountains, Germany,Hydrol. Processes, 18(17), 3305–3322, 2004.
Wittenberg, H.: Baseflow recession and recharge as nonlinear stor-age processes, Hydrol. Processes, 13, 715–726, 1999.
Hydrol. Earth Syst. Sci., 13, 2055–2068, 2009 www.hydrol-earth-syst-sci.net/13/2055/2009/
Related Documents