1 Comparative Analysis of Unsupervised and Supervised Image Classification Techniques Sunayana G. Domadia Dr.Tanish Zaveri Assistant Professor Professor EC Department EC Department Ins. of Comp. & Comm. Tech. for Women Nirma University New V.V. Nagar Ahmedabad Abstract-- Image classification techniques are used to classify different features available in the image. The objective of image classification is to identify the features occurring in an image in terms of the object. Image classification are applied in many areas such as medical imaging, object identification in satellite images, traffic control systems, brake light detection, machine vision, etc. Image classification techniques are mainly divided in two categories: supervised image classification techniques and unsupervised image classification techniques. In this paper different supervised and unsupervised image classification techniques are implemented, analyzed and comparison in terms of accuracy & time to classify for each algorithm are also given. Keywords-- k-means algorithm, EM algorithm, ANN, Maximum likelihood, Confusion matrix. I. INTRODUCTION broad group of digital image processing techniques is directed towards image classification which is done by the automated grouping of pixels into specified categories [2]. Image classification is mainly divided into two categories (1) supervised image classification and (2) unsupervised image classification. In supervised image classification training stage is required, which means first we need to select some pixels form each class called training pixels. Find the characteristics of training pixels and also find other pixels which have same characteristics, this way image classification can be done. In unsupervised image classification, no training stage is required, but different algorithms are used for clustering. In real world, sometimes image does not have much information about data. So, in this case we can use unsupervised image classification as here information is not required before classification, unlike supervised classification. Numerous factors affect the classification results, among which important ones being the objective of classification, the spectral and spatial characteristics of the data, the natural variability of terrain conditions in geographic region, and the digital classification technique employed [3]. The success of an image classification depends on many factors likes availability of high-quality remotely sensed imagery and ancillary data, the design of a proper classification procedure, and the analysts skills and experiences are the most important ones. II. UNSUPERVISED IMAGE CLASSIFICATION TECHNIQUES A. K-means Clustering The basic step of K-means clustering is given in figure 1[1]. To initialize we determine number of cluster k and we assume center of this cluster. We can take any random object as initial centroid. This algorithm will do three steps given below until convergence which is shown in Figure 1. Iterate until stable Determine the centroids coordinate Determine the distance of each object to the centroids Group the object based on minimum distance Fig. 1 K means algorithm The criterion for ending the iterative process can be defined in terms of one iteration to the next. Specifically, this is the magnitude change of the mean from iteration i-1 to iteration i summed over all K clusters. 1 1 () K i i k k k i (1) B. Expectation-Maximization (EM) Algorithm It is standard method to fit finite mixture models in to observed data. EM is an iterative procedure which converges to a (local) maximum of the marginal a posteriori probability function [4]. ( / ) ( / ) () P x Px P (2) A National Conference on Recent Trends in Engineering & Technology 13-14 May 2011 B.V.M. Engineering College, V.V.Nagar,Gujarat,India

Welcome message from author
This document is posted to help you gain knowledge. Please leave a comment to let me know what you think about it! Share it to your friends and learn new things together.
Transcript
1
Comparative Analysis of Unsupervised andSupervised Image Classification Techniques
Sunayana G. Domadia Dr.Tanish ZaveriAssistant Professor Professor EC Department EC Department
Ins. of Comp. & Comm. Tech. for Women Nirma University New V.V. Nagar Ahmedabad
Abstract-- Image classification techniques are used to classify different features available in the image. The objective of image classification is to identify the features occurring in an image in terms of the object. Image classification are applied in many areas such as medical imaging, object identification in satellite images, traffic control systems, brake light detection, machine vision, etc. Image classification techniques are mainly divided in two categories: supervised image classification techniques and unsupervised image classification techniques. In this paper different supervised and unsupervised image classificationtechniques are implemented, analyzed and comparison in terms of accuracy & time to classify for each algorithm are also given. Keywords-- k-means algorithm, EM algorithm, ANN, Maximum likelihood, Confusion matrix.
I. INTRODUCTION
broad group of digital image processing techniques is directed towards image classification which is done by
the automated grouping of pixels into specified categories [2].Image classification is mainly divided into two categories (1) supervised image classification and (2) unsupervised image classification. In supervised image classification training stageis required, which means first we need to select some pixels form each class called training pixels. Find the characteristics of training pixels and also find other pixels which have same characteristics, this way image classification can be done. In unsupervised image classification, no training stage is required, but different algorithms are used for clustering. In real world, sometimes image does not have much information about data. So, in this case we can use unsupervised image classification as here information is not required before classification, unlike supervised classification.
Numerous factors affect the classification results, among which important ones being the objective of classification, the spectral and spatial characteristics of the data, the natural variability of terrain conditions in geographic region, and the digital classification technique employed [3]. The success of an image classification depends on many factors likes availability of high-quality remotely sensed imagery and ancillary data, the design of a proper classification procedure,and the analysts skills and experiences are the most importantones.
II. UNSUPERVISED IMAGE CLASSIFICATION TECHNIQUES
A. K-means Clustering
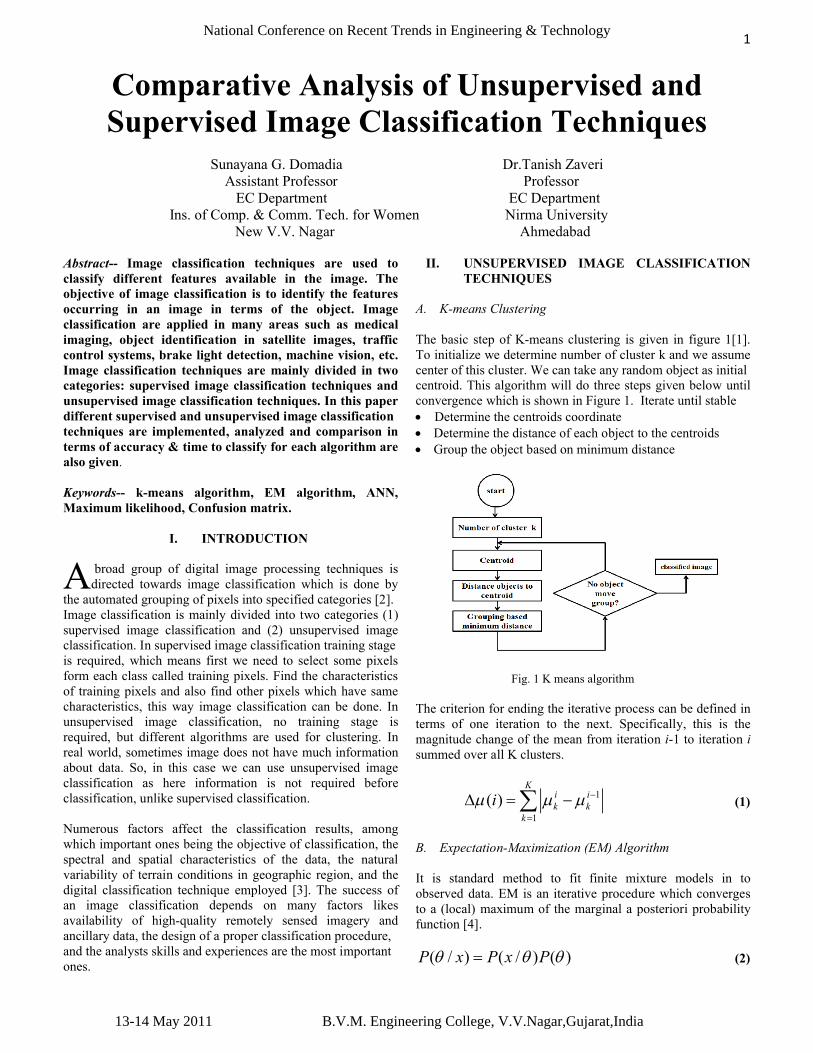
The basic step of K-means clustering is given in figure 1[1]. To initialize we determine number of cluster k and we assume center of this cluster. We can take any random object as initialcentroid. This algorithm will do three steps given below until convergence which is shown in Figure 1. Iterate until stable Determine the centroids coordinate Determine the distance of each object to the centroids Group the object based on minimum distance
Fig. 1 K means algorithm
The criterion for ending the iterative process can be defined in terms of one iteration to the next. Specifically, this is the magnitude change of the mean from iteration i-1 to iteration isummed over all K clusters.
1
1
( )K
i ik k
k
i
(1)
B. Expectation-Maximization (EM) Algorithm
It is standard method to fit finite mixture models in to observed data. EM is an iterative procedure which converges to a (local) maximum of the marginal a posteriori probability function [4].
( / ) ( / ) ( )P x P x P (2)
A
National Conference on Recent Trends in Engineering & Technology
13-14 May 2011 B.V.M. Engineering College, V.V.Nagar,Gujarat,India
2
Where θ is a set of unknown parameters from x.[5] EM is a general method of estimating the features of a given data set, when the data are incomplete or have missing values. Being an iterative procedure, the EM method can present high computational cost. EM algorithm implement by two types ofdistribution:
Univariate normal distribution Multivariate normal distribution
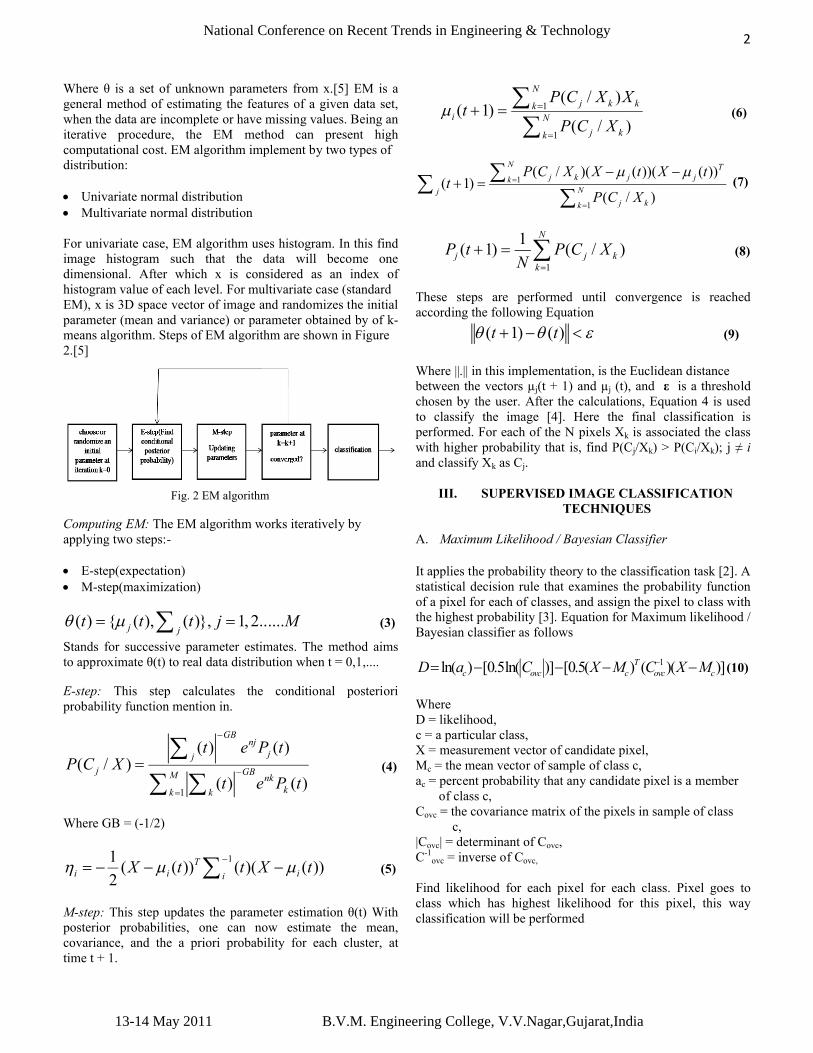
For univariate case, EM algorithm uses histogram. In this find image histogram such that the data will become one dimensional. After which x is considered as an index of histogram value of each level. For multivariate case (standardEM), x is 3D space vector of image and randomizes the initial parameter (mean and variance) or parameter obtained by of k-means algorithm. Steps of EM algorithm are shown in Figure2.[5]
Fig. 2 EM algorithm
Computing EM: The EM algorithm works iteratively byapplying two steps:-
E-step(expectation) M-step(maximization)
( ) { ( ), ( )}, 1, 2......j jt t t j M (3)
Stands for successive parameter estimates. The method aims to approximate θ(t) to real data distribution when t = 0,1,....
E-step: This step calculates the conditional posteriori probability function mention in.
1
( ) ( )( / )
( ) ( )
GBnj
jj
j GBM nkkk k
t e P tP C X
t e P t
(4)
Where GB = (-1/2)
11( ( )) ( )( ( ))
2T
i i iiX t t X t
(5)
M-step: This step updates the parameter estimation θ(t) With posterior probabilities, one can now estimate the mean, covariance, and the a priori probability for each cluster, at time t + 1.
1
1
( / )( 1)
( / )
N
j k kki N
j kk
P C X Xt
P C X
(6)
1
1
( / )( ( ))( ( ))( 1)
( / )
N Tj k j jk
Njj kk
P C X X t X tt
P C X
(7)
1
1( 1) ( / )
N
j j kk
P t P C XN
(8)
These steps are performed until convergence is reached according the following Equation
( 1) ( )t t (9)
Where ||.|| in this implementation, is the Euclidean distancebetween the vectors µj(t + 1) and µj (t), and ε is a thresholdchosen by the user. After the calculations, Equation 4 is used to classify the image [4]. Here the final classification isperformed. For each of the N pixels Xk is associated the classwith higher probability that is, find P(Cj/Xk) > P(Ci/Xk); j ≠ iand classify Xk as Cj.
III. SUPERVISED IMAGE CLASSIFICATION TECHNIQUES
A. Maximum Likelihood / Bayesian Classifier
It applies the probability theory to the classification task [2]. A statistical decision rule that examines the probability function of a pixel for each of classes, and assign the pixel to class with the highest probability [3]. Equation for Maximum likelihood / Bayesian classifier as follows
1ln( ) [0.5ln( )] [0.5( ) ( )( )]Tc ovc c ovc cD a C X M C X M (10)
WhereD = likelihood,c = a particular class,X = measurement vector of candidate pixel,Mc = the mean vector of sample of class c,ac = percent probability that any candidate pixel is a member of class c,Covc = the covariance matrix of the pixels in sample of class c,|Covc| = determinant of Covc,C-1
ovc = inverse of Covc,
Find likelihood for each pixel for each class. Pixel goes to class which has highest likelihood for this pixel, this way classification will be performed
National Conference on Recent Trends in Engineering & Technology
13-14 May 2011 B.V.M. Engineering College, V.V.Nagar,Gujarat,India
3
B. Artificial Neural Network
Artificial Neural Network (ANN) is a parallel distributed processor that has a natural tendency for storing experiential knowledge [6].
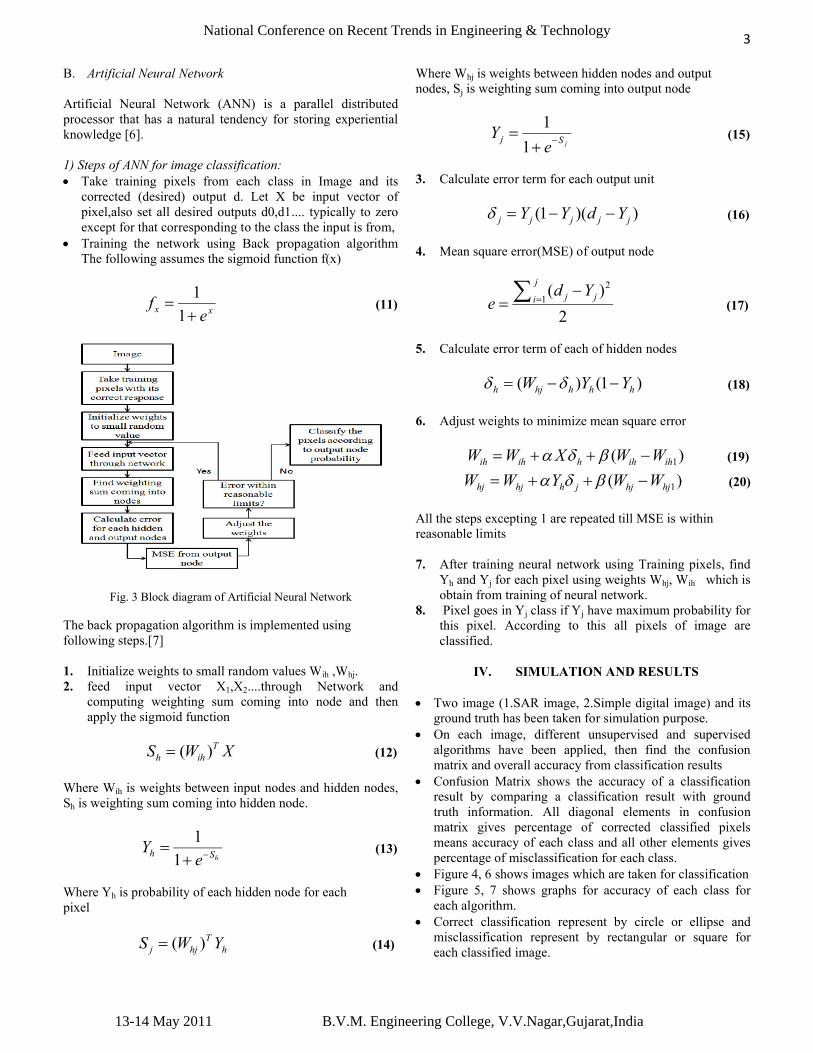
1) Steps of ANN for image classification: Take training pixels from each class in Image and its
corrected (desired) output d. Let X be input vector of pixel,also set all desired outputs d0,d1.... typically to zero except for that corresponding to the class the input is from,
Training the network using Back propagation algorithm The following assumes the sigmoid function f(x)
1
1x xf
e
(11)
Fig. 3 Block diagram of Artificial Neural Network
The back propagation algorithm is implemented usingfollowing steps.[7]
1. Initialize weights to small random values Wih ,Whj.2. feed input vector X1,X2....through Network and
computing weighting sum coming into node and then apply the sigmoid function
( )Th ihS W X (12)
Where Wih is weights between input nodes and hidden nodes, Sh is weighting sum coming into hidden node.
1
1 hh SYe
(13)
Where Yh is probability of each hidden node for eachpixel
( )Tj hj hS W Y (14)
Where Whj is weights between hidden nodes and outputnodes, Sj is weighting sum coming into output node
1
1 jj SYe
(15)
3. Calculate error term for each output unit
(1 )( )j j j j jY Y d Y (16)
4. Mean square error(MSE) of output node
2
1( )
2
j
j jid Y
e
(17)
5. Calculate error term of each of hidden nodes
( ) (1 )h hj h h hW Y Y (18)
6. Adjust weights to minimize mean square error
1( )ih ih h ih ihW W X W W (19)
1( )hj hj h j hj hjW W Y W W (20)
All the steps excepting 1 are repeated till MSE is withinreasonable limits
7. After training neural network using Training pixels, find Yh and Yj for each pixel using weights Whj, Wih which is obtain from training of neural network.
8. Pixel goes in Yj class if Yj have maximum probability for this pixel. According to this all pixels of image are classified.
IV. SIMULATION AND RESULTS
Two image (1.SAR image, 2.Simple digital image) and its ground truth has been taken for simulation purpose.
On each image, different unsupervised and supervised algorithms have been applied, then find the confusion matrix and overall accuracy from classification results
Confusion Matrix shows the accuracy of a classificationresult by comparing a classification result with groundtruth information. All diagonal elements in confusionmatrix gives percentage of corrected classified pixelsmeans accuracy of each class and all other elements givespercentage of misclassification for each class.
Figure 4, 6 shows images which are taken for classification Figure 5, 7 shows graphs for accuracy of each class for
each algorithm. Correct classification represent by circle or ellipse and
misclassification represent by rectangular or square foreach classified image.
National Conference on Recent Trends in Engineering & Technology
13-14 May 2011 B.V.M. Engineering College, V.V.Nagar,Gujarat,India
4
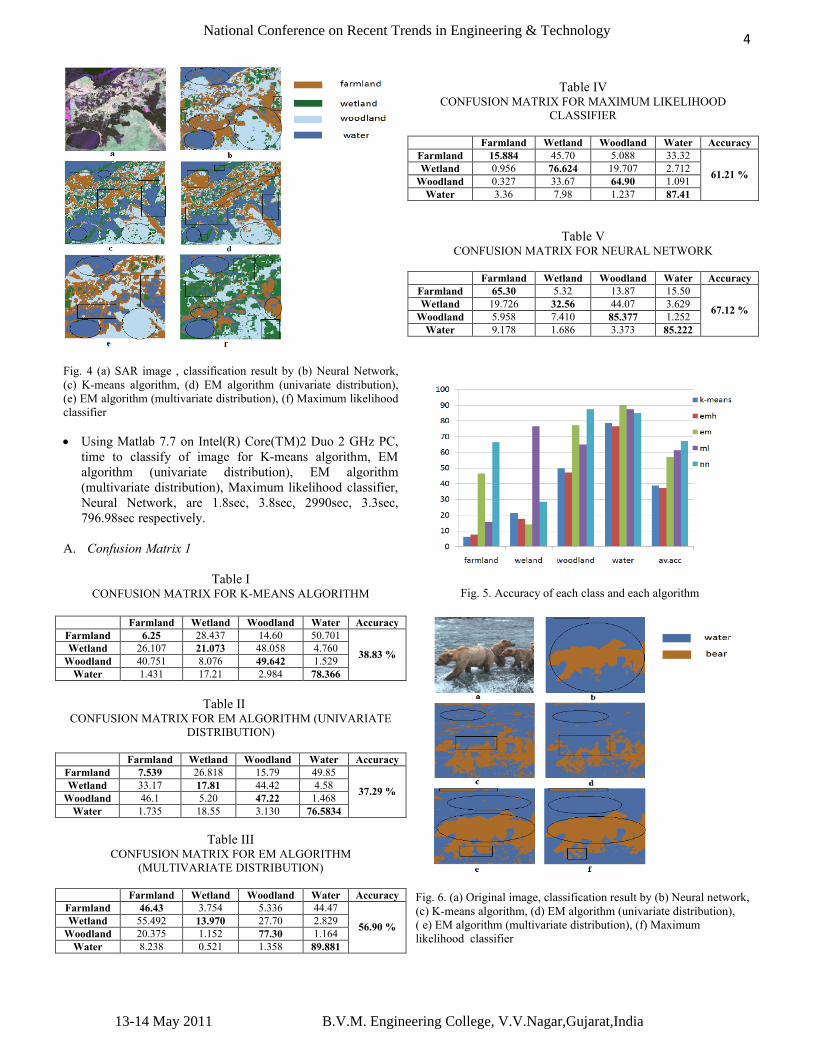
Fig. 4 (a) SAR image , classification result by (b) Neural Network, (c) K-means algorithm, (d) EM algorithm (univariate distribution), (e) EM algorithm (multivariate distribution), (f) Maximum likelihood classifier
Using Matlab 7.7 on Intel(R) Core(TM)2 Duo 2 GHz PC, time to classify of image for K-means algorithm, EM algorithm (univariate distribution), EM algorithm (multivariate distribution), Maximum likelihood classifier, Neural Network, are 1.8sec, 3.8sec, 2990sec, 3.3sec, 796.98sec respectively.
A. Confusion Matrix 1
Table ICONFUSION MATRIX FOR K-MEANS ALGORITHM
Farmland Wetland Woodland Water AccuracyFarmland 6.25 28.437 14.60 50.701Wetland 26.107 21.073 48.058 4.760
Woodland 40.751 8.076 49.642 1.529Water 1.431 17.21 2.984 78.366
38.83 %
Table IICONFUSION MATRIX FOR EM ALGORITHM (UNIVARIATE
DISTRIBUTION)
Farmland Wetland Woodland Water AccuracyFarmland 7.539 26.818 15.79 49.85Wetland 33.17 17.81 44.42 4.58
Woodland 46.1 5.20 47.22 1.468Water 1.735 18.55 3.130 76.5834
37.29 %
Table IIICONFUSION MATRIX FOR EM ALGORITHM
(MULTIVARIATE DISTRIBUTION)
Farmland Wetland Woodland Water AccuracyFarmland 46.43 3.754 5.336 44.47Wetland 55.492 13.970 27.70 2.829
Woodland 20.375 1.152 77.30 1.164Water 8.238 0.521 1.358 89.881
56.90 %
Table IVCONFUSION MATRIX FOR MAXIMUM LIKELIHOOD
CLASSIFIER
Farmland Wetland Woodland Water AccuracyFarmland 15.884 45.70 5.088 33.32Wetland 0.956 76.624 19.707 2.712
Woodland 0.327 33.67 64.90 1.091Water 3.36 7.98 1.237 87.41
61.21 %
Table VCONFUSION MATRIX FOR NEURAL NETWORK
Farmland Wetland Woodland Water AccuracyFarmland 65.30 5.32 13.87 15.50Wetland 19.726 32.56 44.07 3.629
Woodland 5.958 7.410 85.377 1.252Water 9.178 1.686 3.373 85.222
67.12 %
Fig. 5. Accuracy of each class and each algorithm
Fig. 6. (a) Original image, classification result by (b) Neural network, (c) K-means algorithm, (d) EM algorithm (univariate distribution),( e) EM algorithm (multivariate distribution), (f) Maximum likelihood classifier
National Conference on Recent Trends in Engineering & Technology
13-14 May 2011 B.V.M. Engineering College, V.V.Nagar,Gujarat,India
5
Time to classify of image for K-means algorithm, EM algorithm (univariate distribution), EM algorithm (multivariate distribution), Maximum likelihood classifier, Neural Network are 1.82sec, 3.82sec, 3100sec, 3.4sec, 801.57sec respectively.
B. Confusion Matrix 2
Table VICONFUSION MATRIX FOR K-MEANS ALGORITHM
Water Bear AccuracyWater 72.46 27.53Bear 43.40 56.59
64.53 %
Table VIICONFUSION MATRIX FOR EM ALGORITHM (UNIVARIATE
DISTRIBUTION)
Water Bear AccuracyWater 85.094 14.905Bear 60.76 39.23
62.16 %
Table VIIICONFUSION MATRIX FOR EM ALGORITHM
(MULTIVARIATE DISTRIBUTION)
Water Bear AccuracyWater 78.591 21.40Bear 0.061 99.93
89.26 %
Table XICONFUSION MATRIX FOR MAXIMUM LIKELIHOOD
CLASSIFIER
Water Bear AccuracyWater 86.83 13.168Bear 0.072 99.92
93.38 %
Table XCONFUSION MATRIX FOR NEURAL NETWORK
Water Bear AccuracyWater 97.26 2.737Bear 2.589 97.41
97.34 %
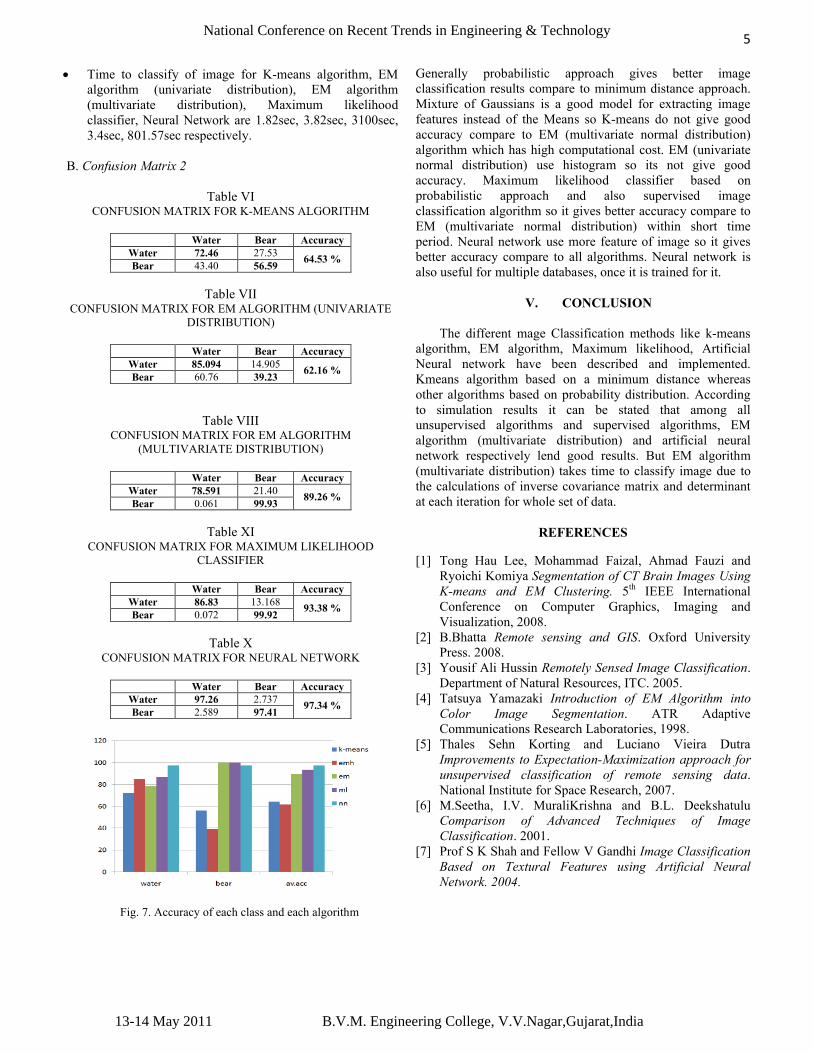
Fig. 7. Accuracy of each class and each algorithm
Generally probabilistic approach gives better image classification results compare to minimum distance approach. Mixture of Gaussians is a good model for extracting image features instead of the Means so K-means do not give good accuracy compare to EM (multivariate normal distribution) algorithm which has high computational cost. EM (univariate normal distribution) use histogram so its not give good accuracy. Maximum likelihood classifier based on probabilistic approach and also supervised image classification algorithm so it gives better accuracy compare to EM (multivariate normal distribution) within short time period. Neural network use more feature of image so it gives better accuracy compare to all algorithms. Neural network is also useful for multiple databases, once it is trained for it.
V. CONCLUSION
The different mage Classification methods like k-means algorithm, EM algorithm, Maximum likelihood, Artificial Neural network have been described and implemented. Kmeans algorithm based on a minimum distance whereas other algorithms based on probability distribution. According to simulation results it can be stated that among all unsupervised algorithms and supervised algorithms, EM algorithm (multivariate distribution) and artificial neural network respectively lend good results. But EM algorithm (multivariate distribution) takes time to classify image due to the calculations of inverse covariance matrix and determinant at each iteration for whole set of data.
REFERENCES
[1] Tong Hau Lee, Mohammad Faizal, Ahmad Fauzi and Ryoichi Komiya Segmentation of CT Brain Images Using K-means and EM Clustering. 5th IEEE International Conference on Computer Graphics, Imaging and Visualization, 2008.
[2] B.Bhatta Remote sensing and GIS. Oxford University Press. 2008.
[3] Yousif Ali Hussin Remotely Sensed Image Classification. Department of Natural Resources, ITC. 2005.
[4] Tatsuya Yamazaki Introduction of EM Algorithm into Color Image Segmentation. ATR Adaptive Communications Research Laboratories, 1998.
[5] Thales Sehn Korting and Luciano Vieira Dutra Improvements to Expectation-Maximization approach for unsupervised classification of remote sensing data. National Institute for Space Research, 2007.
[6] M.Seetha, I.V. MuraliKrishna and B.L. Deekshatulu Comparison of Advanced Techniques of Image Classification. 2001.
[7] Prof S K Shah and Fellow V Gandhi Image Classification Based on Textural Features using Artificial Neural Network. 2004.
National Conference on Recent Trends in Engineering & Technology
13-14 May 2011 B.V.M. Engineering College, V.V.Nagar,Gujarat,India
Related Documents