Company Presentation September 2017

Welcome message from author
This document is posted to help you gain knowledge. Please leave a comment to let me know what you think about it! Share it to your friends and learn new things together.
Transcript
Company Presentation
September 2017
Legal Disclaimer
This presentation has been prepared by TPI Composites, Inc. (the “Company”) and is solely for informational purposes and is strictly confidential. Disclosure of this presentation,
its contents, extracts or other abstracts to third parties is not authorized without the express written permission of the Company. Neither this presentation nor the accompanying
oral presentation constitutes an offer to purchase or sell, or a solicitation of an offer to purchase or buy, any securities of the Company by any person in any jurisdiction, including
the United States, in which it is unlawful for such person to make an offer or solicitation.
This presentation and the accompanying oral statements contain forward-looking statements within the meaning of the federal securities laws. All statements other than
statements of historical facts contained in this presentation, including statements regarding our future results of operations and financial position, business strategy and plans and
objectives of management for future operations, are forward-looking statements. In many cases, you can identify forward-looking statements by terms such as “may,” “should,”
“expects,” “plans,” “anticipates,” “could,” “intends,” “target,” “projects,” “contemplates,” “believes,” “estimates,” “predicts,” “potential” or “continue” or the negative of these terms or
other similar words. Forward-looking statements contained in this presentation include, but are not limited to, statements about (i) growth of the wind energy market and our
addressable market; (ii) the potential impact of GE’s acquisition of LM Wind Power upon our business; (iii) our future financial and operating performance, including our net sales,
total billings, cost of goods sold, gross profit or gross margin, operating expenses, sets, estimated megawatts, dedicated manufacturing lines, lines installed, lines in startup, lines
in transition, ability to generate positive cash flow, and ability to achieve or maintain profitability; (iv) the sufficiency of our cash and cash equivalents to meet our liquidity needs;
(v) our ability to attract and retain customers for our products, and to optimize product pricing; (vi) competition from other wind blade manufacturers; (vii) the discovery of defects
in our products; (viii) our ability to successfully expand in our existing markets and into new international markets; (ix) worldwide economic conditions and their impact on
customer demand; (x) our ability to effectively manage our growth strategy and future expenses; (xi) our ability to maintain, protect and enhance our intellectual property; (xii) our
ability to comply with existing, modified or new laws and regulations applying to our business; and (xiii) the attraction and retention of qualified employees and key personnel.
These forward-looking statements are only predictions. These statements relate to future events or our future financial performance and involve known and unknown risks,
uncertainties and other important factors that may cause our actual results, levels of activity, performance or achievements to materially differ from any future results, levels of
activity, performance or achievements expressed or implied by these forward-looking statements. Because forward-looking statements are inherently subject to risks and
uncertainties, some of which cannot be predicted or quantified, you should not rely on these forward-looking statements as guarantees of future events. Further information on
the factors, risks and uncertainties that could affect our financial results and the forward-looking statements in this presentation are included in the Company’s registration
statement on Form S-1 filed with the U.S. Securities and Exchange Commission, including those described under the heading “Risk Factors” and “Special Note Regarding
Forward-Looking Statements” and in our other filings with the Securities and Exchange Commission and will be included in subsequent periodic and current reports we make with
the Securities and Exchange Commission from time to time.
The forward-looking statements in this presentation and accompanying oral statements represent our views as of the date of this presentation. We anticipate that subsequent
events and developments will cause our views to change. However, while we may elect to update these forward-looking statements at some point in the future, we undertake no
obligation to update any forward-looking statement to reflect events or developments after the date on which the statement is made or to reflect the occurrence of unanticipated
events except to the extent required by applicable law. You should, therefore, not rely on these forward-looking statements as representing our views as of any date after the date
of this presentation. Our forward-looking statements do not reflect the potential impact of any future acquisitions, mergers, dispositions, joint ventures, or investments we may
make.
2September 2017
Legal Disclaimer (continued)
This presentation includes unaudited non-GAAP financial measures including total billings, EBITDA, adjusted EBITDA, net debt and free cash flow. We define total billings as the
total amounts we have invoiced our customers for products and services for which we are entitled to payment under the terms of our long term supply agreements or other
contractual agreements. We define EBITDA as net income (loss) attributable to the Company plus interest expense (including losses on extinguishment of debt and net of interest
income), income taxes, and depreciation and amortization. We define adjusted EBITDA as EBITDA plus any share-based compensation expense plus or minus any gains or
losses from foreign currency remeasurement. We define net debt as the total principal amount of debt outstanding less unrestricted cash and equivalents. We define free cash
flow as net cash flow generated from operating activities less capital expenditures. We present non-GAAP measures when we believe that the additional information is useful and
meaningful to investors. Non-GAAP financial measures do not have any standardized meaning and are therefore unlikely to be comparable to similar measures presented by
other companies. The presentation of non-GAAP financial measures is not intended to be a substitute for, and should not be considered in isolation from, the financial measures
reported in accordance with GAAP. See the appendix for the reconciliations of certain non-GAAP financial measures to the comparable GAAP measures.
This presentation also contains estimates and other information concerning our industry that are based on industry publications, surveys and forecasts. This information involves
a number of assumptions and limitations, and we have not independently verified the accuracy or completeness of the information. While we are not aware of any misstatements
regarding any third-party information presented in this presentation, their estimates, in particular as they relate to projections, involve numerous assumptions, are subject to risks
and uncertainties, and are subject to change based on various factors, including those discussed under the section titled “Risk Factors” and elsewhere in our Registration
Statement on Form S-1.
3September 2017
Key Investment Highlights
4
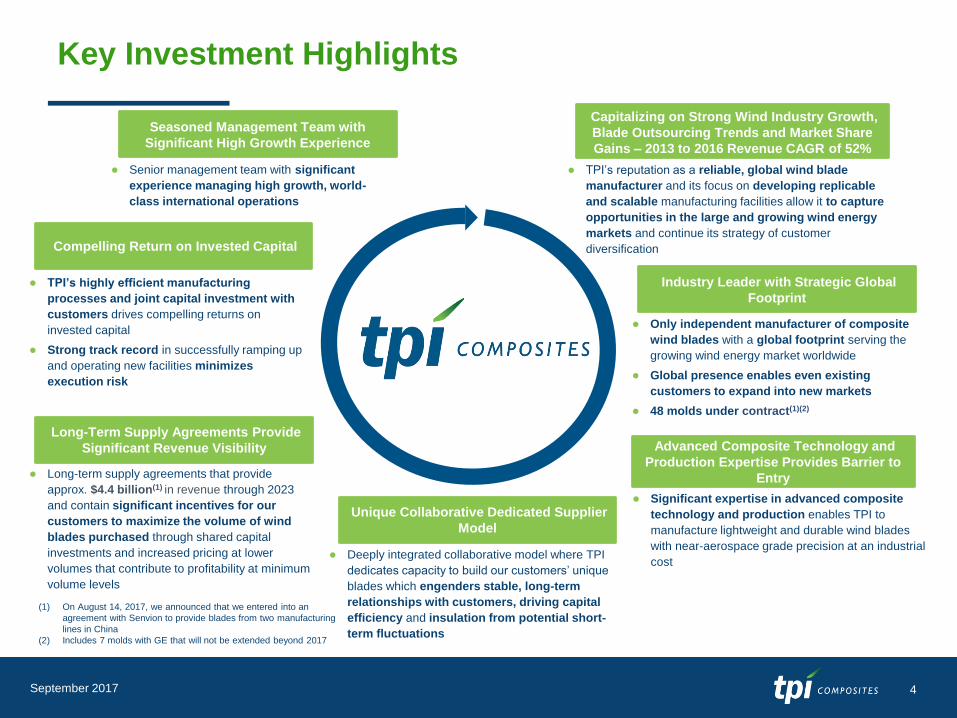
Capitalizing on Strong Wind Industry Growth,
Blade Outsourcing Trends and Market Share
Gains – 2013 to 2016 Revenue CAGR of 52%
● TPI’s reputation as a reliable, global wind blade
manufacturer and its focus on developing replicable
and scalable manufacturing facilities allow it to capture
opportunities in the large and growing wind energy
markets and continue its strategy of customer
diversification
Adoption of new mobile
technologies
Government and regulatory support
Industry Leader with Strategic Global
Footprint
Advanced Composite Technology and
Production Expertise Provides Barrier to
Entry
● Only independent manufacturer of composite
wind blades with a global footprint serving the
growing wind energy market worldwide
● Global presence enables even existing
customers to expand into new markets
● 48 molds under contract(1)(2)
● Significant expertise in advanced composite
technology and production enables TPI to
manufacture lightweight and durable wind blades
with near-aerospace grade precision at an industrial
cost
Unique Collaborative Dedicated Supplier
Model
Long-Term Supply Agreements Provide
Significant Revenue Visibility
Compelling Return on Invested Capital
Seasoned Management Team with
Significant High Growth Experience
● Senior management team with significant
experience managing high growth, world-
class international operations
● TPI’s highly efficient manufacturing
processes and joint capital investment with
customers drives compelling returns on
invested capital
● Strong track record in successfully ramping up
and operating new facilities minimizes
execution risk
● Deeply integrated collaborative model where TPI
dedicates capacity to build our customers’ unique
blades which engenders stable, long-term
relationships with customers, driving capital
efficiency and insulation from potential short-
term fluctuations
● Long-term supply agreements that provide
approx. $4.4 billion(1) in revenue through 2023
and contain significant incentives for our
customers to maximize the volume of wind
blades purchased through shared capital
investments and increased pricing at lower
volumes that contribute to profitability at minimum
volume levels
(1) On August 14, 2017, we announced that we entered into an
agreement with Senvion to provide blades from two manufacturing
lines in China
(2) Includes 7 molds with GE that will not be extended beyond 2017
September 2017
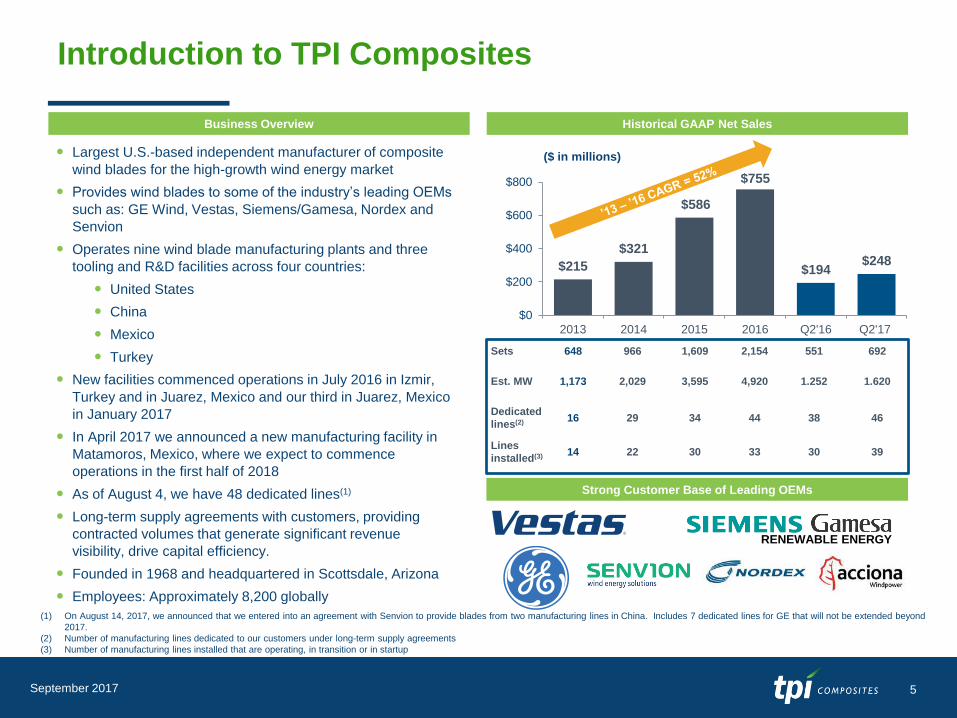
$215
$321
$586
$194$248
$0
$200
$400
$600
$800
2013 2014 2015 2016 Q2'16 Q2'17
$755
Introduction to TPI Composites
5
Strong Customer Base of Leading OEMs
Business Overview Historical GAAP Net Sales
($ in millions) Largest U.S.-based independent manufacturer of composite
wind blades for the high-growth wind energy market
Provides wind blades to some of the industry’s leading OEMs
such as: GE Wind, Vestas, Siemens/Gamesa, Nordex and
Senvion
Operates nine wind blade manufacturing plants and three
tooling and R&D facilities across four countries:
United States
China
Mexico
Turkey
New facilities commenced operations in July 2016 in Izmir,
Turkey and in Juarez, Mexico and our third in Juarez, Mexico
in January 2017
In April 2017 we announced a new manufacturing facility in
Matamoros, Mexico, where we expect to commence
operations in the first half of 2018
As of August 4, we have 48 dedicated lines(1)
Long-term supply agreements with customers, providing
contracted volumes that generate significant revenue
visibility, drive capital efficiency.
Founded in 1968 and headquartered in Scottsdale, Arizona
Employees: Approximately 8,200 globally
Sets 648 966 1,609 2,154 551 692
Est. MW 1,173 2,029 3,595 4,920 1.252 1.620
Dedicated
lines(2) 16 29 34 44 38 46
Lines
installed(3) 14 22 30 33 30 39
(1) On August 14, 2017, we announced that we entered into an agreement with Senvion to provide blades from two manufacturing lines in China. Includes 7 dedicated lines for GE that will not be extended beyond
2017.
(2) Number of manufacturing lines dedicated to our customers under long-term supply agreements
(3) Number of manufacturing lines installed that are operating, in transition or in startup
RENEWABLE ENERGY
September 2017
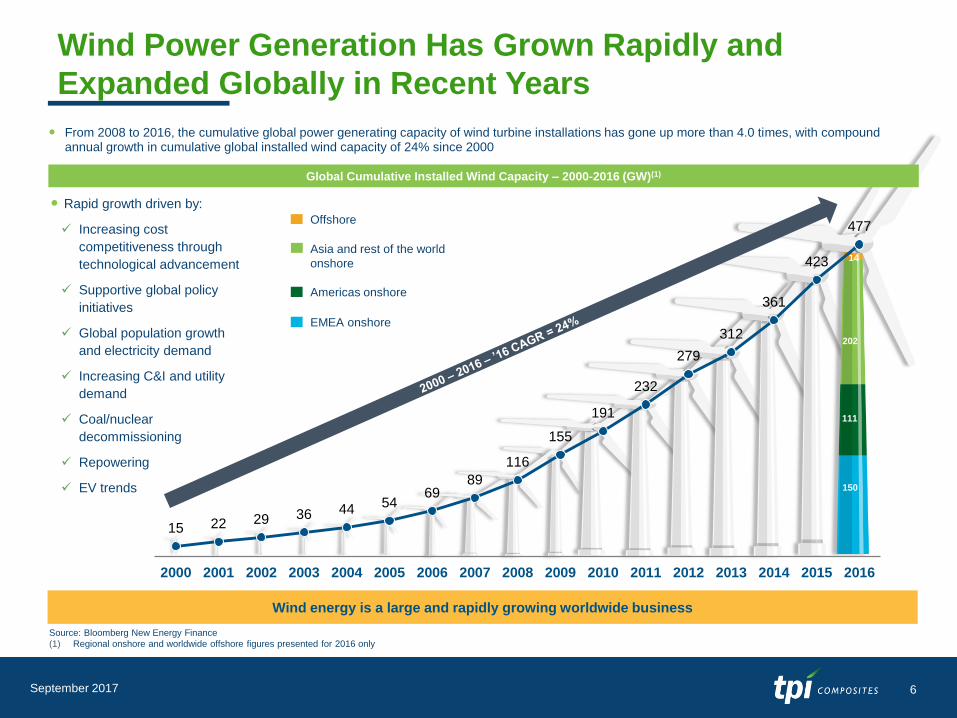
Global Cumulative Installed Wind Capacity – 2000-2016 (GW)(1)
Rapid growth driven by:
Increasing cost
competitiveness through
technological advancement
Supportive global policy
initiatives
Global population growth
and electricity demand
Increasing C&I and utility
demand
Coal/nuclear
decommissioning
Repowering
EV trends
From 2008 to 2016, the cumulative global power generating capacity of wind turbine installations has gone up more than 4.0 times, with compound annual growth in cumulative global installed wind capacity of 24% since 2000
Wind Power Generation Has Grown Rapidly and
Expanded Globally in Recent Years
6
Wind energy is a large and rapidly growing worldwide business
Source: Bloomberg New Energy Finance
(1) Regional onshore and worldwide offshore figures presented for 2016 only
EMEA onshore
Americas onshore
Asia and rest of the world
onshore
Offshore
150
111
202
14
15 22 29 36 44 5469
89
116
155
191
232
279
312
361
423
477
2000 2001 2002 2003 2004 2005 2006 2007 2008 2009 2010 2011 2012 2013 2014 2015 2016
September 2017
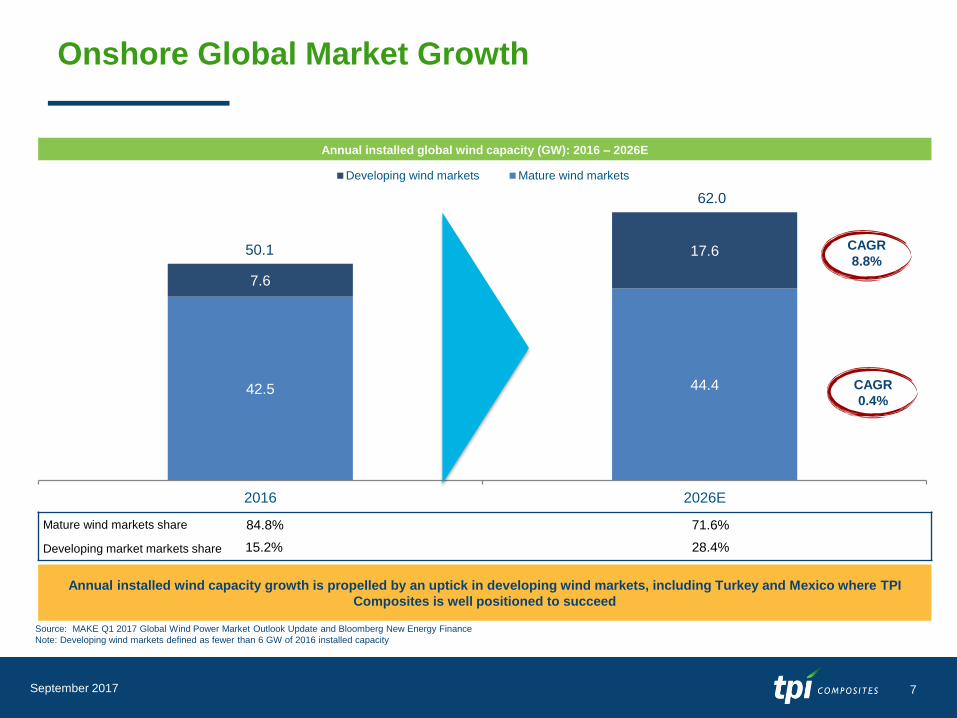
Onshore Global Market Growth
7
42.5 44.4
7.6
17.6
2016 2026E
Developing wind markets Mature wind markets
Source: MAKE Q1 2017 Global Wind Power Market Outlook Update and Bloomberg New Energy Finance
Note: Developing wind markets defined as fewer than 6 GW of 2016 installed capacity
Annual installed global wind capacity (GW): 2016 – 2026E
Annual installed wind capacity growth is propelled by an uptick in developing wind markets, including Turkey and Mexico where TPI
Composites is well positioned to succeed
50.1
CAGR
0.4%
CAGR
8.8%
Mature wind markets share
Developing market markets share 15.2%
84.8%
28.4%
71.6%
62.0
September 2017
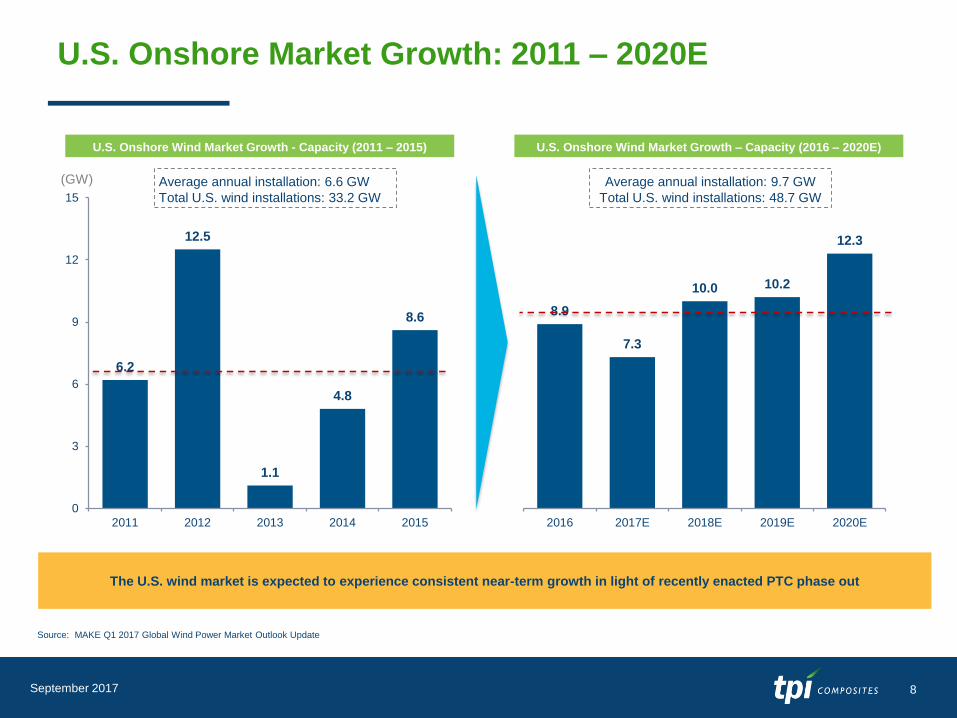
U.S. Onshore Market Growth: 2011 – 2020E
8
The U.S. wind market is expected to experience consistent near-term growth in light of recently enacted PTC phase out
Source: MAKE Q1 2017 Global Wind Power Market Outlook Update
(GW)
U.S. Onshore Wind Market Growth - Capacity (2011 – 2015)
6.2
12.5
1.1
4.8
8.6
0
3
6
9
12
15
2011 2012 2013 2014 2015
Series 1
8.9
7.3
10.0 10.2
12.3
2016 2017E 2018E 2019E 2020E
Series 1
U.S. Onshore Wind Market Growth – Capacity (2016 – 2020E)
Average annual installation: 9.7 GW
Total U.S. wind installations: 48.7 GW
Average annual installation: 6.6 GW
Total U.S. wind installations: 33.2 GW
September 2017
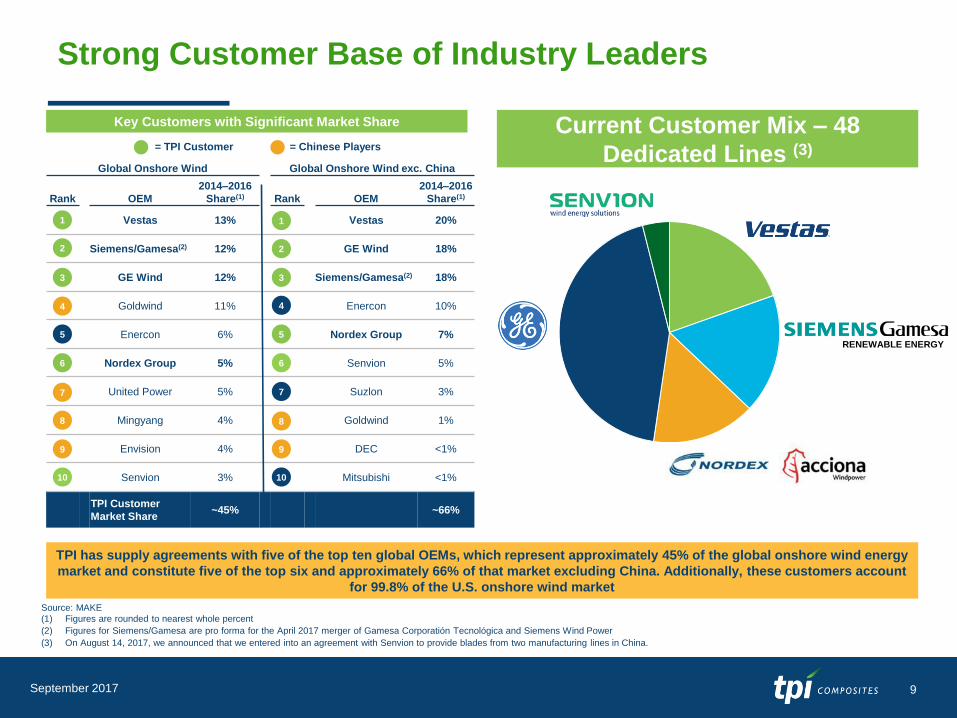
Strong Customer Base of Industry Leaders
9
Current Customer Mix – 48
Dedicated Lines (3)
Key Customers with Significant Market Share
= TPI Customer
Global Onshore Wind Global Onshore Wind exc. China
Rank OEM
2014–2016
Share(1) Rank OEM
2014–2016
Share(1)
1 Vestas 13% Vestas 20%
2 Siemens/Gamesa(2) 12% GE Wind 18%
3 GE Wind 12% Siemens/Gamesa(2) 18%
4 Goldwind 11% Enercon 10%
5 Enercon 6% Nordex Group 7%
6 Nordex Group 5% Senvion 5%
7 United Power 5% Suzlon 3%
8 Mingyang 4% Goldwind 1%
9 Envision 4% DEC <1%
10 Senvion 3% Mitsubishi <1%
TPI Customer
Market Share ~45% ~66%
Source: MAKE
(1) Figures are rounded to nearest whole percent
(2) Figures for Siemens/Gamesa are pro forma for the April 2017 merger of Gamesa Corporatión Tecnológica and Siemens Wind Power
(3) On August 14, 2017, we announced that we entered into an agreement with Senvion to provide blades from two manufacturing lines in China.
TPI has supply agreements with five of the top ten global OEMs, which represent approximately 45% of the global onshore wind energy
market and constitute five of the top six and approximately 66% of that market excluding China. Additionally, these customers account
for 99.8% of the U.S. onshore wind market
1
2
4
5
7
3
6
8
9
10
= Chinese Players
1
2
5
6
3
4
9
7
8
10
RENEWABLE ENERGY
September 2017
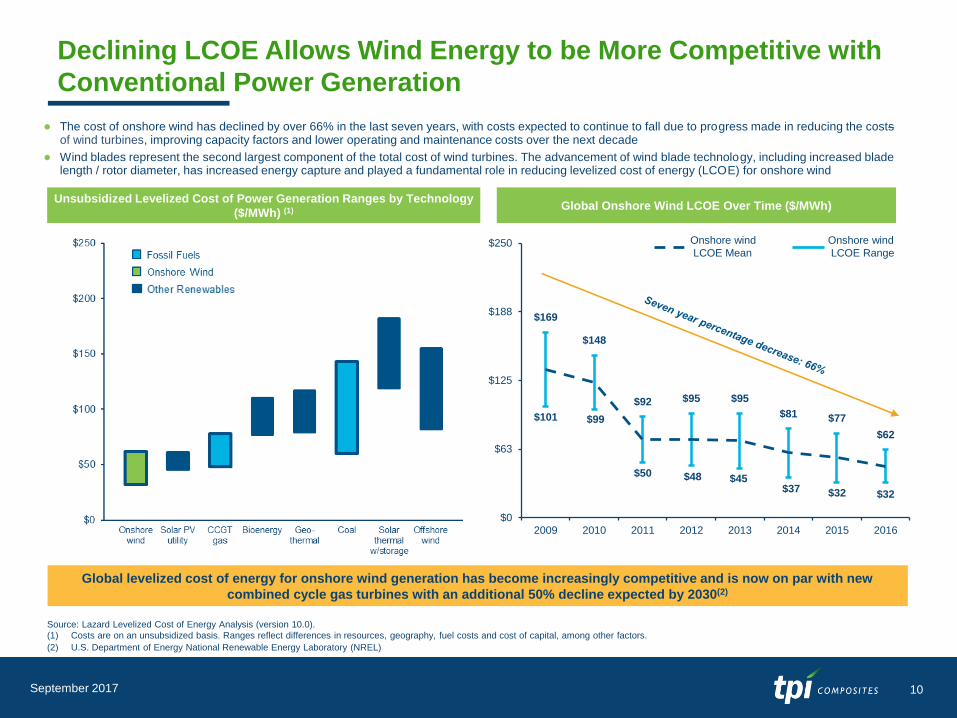
Declining LCOE Allows Wind Energy to be More Competitive with
Conventional Power Generation
10
Global Onshore Wind LCOE Over Time ($/MWh)
$169
$148
$92 $95 $95
$81 $77
$62
$101 $99
$50 $48 $45$37 $32 $32
$0
$63
$125
$188
$250
2009 2010 2011 2012 2013 2014 2015 2016
Onshore wind
LCOE Mean
Onshore wind
LCOE Range
Unsubsidized Levelized Cost of Power Generation Ranges by Technology
($/MWh) (1)
● The cost of onshore wind has declined by over 66% in the last seven years, with costs expected to continue to fall due to progress made in reducing the costsof wind turbines, improving capacity factors and lower operating and maintenance costs over the next decade
● Wind blades represent the second largest component of the total cost of wind turbines. The advancement of wind blade technology, including increased blade length / rotor diameter, has increased energy capture and played a fundamental role in reducing levelized cost of energy (LCOE) for onshore wind
Global levelized cost of energy for onshore wind generation has become increasingly competitive and is now on par with new
combined cycle gas turbines with an additional 50% decline expected by 2030(2)
Source: Lazard Levelized Cost of Energy Analysis (version 10.0).
(1) Costs are on an unsubsidized basis. Ranges reflect differences in resources, geography, fuel costs and cost of capital, among other factors.
(2) U.S. Department of Energy National Renewable Energy Laboratory (NREL)
September 2017
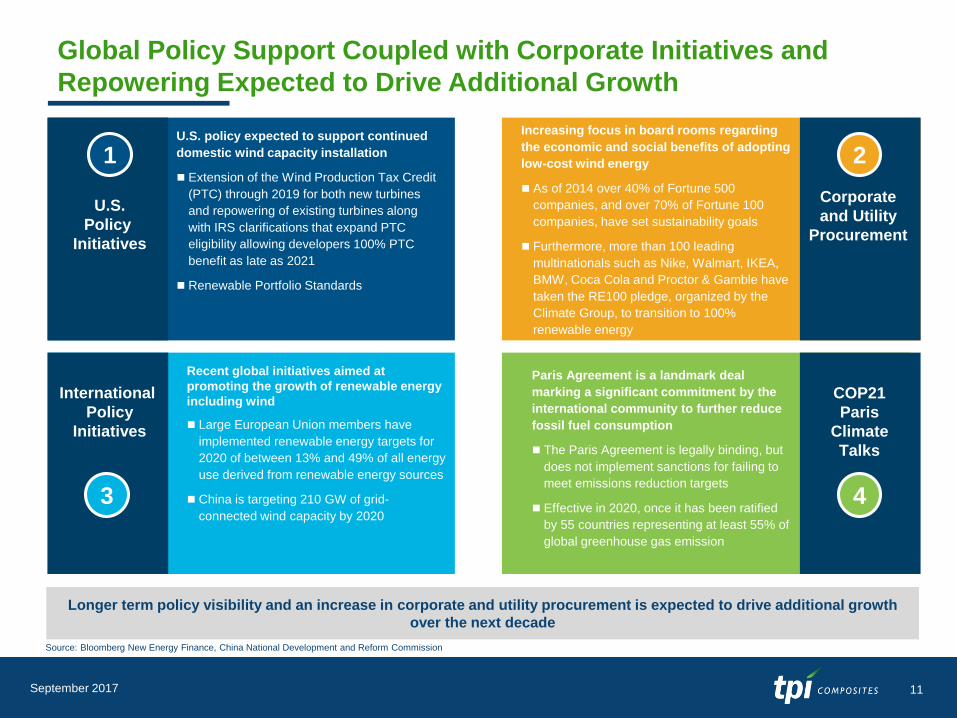
U.S.
Policy
Initiatives
Global Policy Support Coupled with Corporate Initiatives and
Repowering Expected to Drive Additional Growth
11
U.S. policy expected to support continued
domestic wind capacity installation
Extension of the Wind Production Tax Credit
(PTC) through 2019 for both new turbines
and repowering of existing turbines along
with IRS clarifications that expand PTC
eligibility allowing developers 100% PTC
benefit as late as 2021
Renewable Portfolio Standards
1
Increasing focus in board rooms regarding
the economic and social benefits of adopting
low-cost wind energy
As of 2014 over 40% of Fortune 500
companies, and over 70% of Fortune 100
companies, have set sustainability goals
Furthermore, more than 100 leading
multinationals such as Nike, Walmart, IKEA,
BMW, Coca Cola and Proctor & Gamble have
taken the RE100 pledge, organized by the
Climate Group, to transition to 100%
renewable energy
Corporate
and Utility
Procurement
2
International
Policy
Initiatives
Recent global initiatives aimed at
promoting the growth of renewable energy
including wind
Large European Union members have
implemented renewable energy targets for
2020 of between 13% and 49% of all energy
use derived from renewable energy sources
China is targeting 210 GW of grid-
connected wind capacity by 2020
3
COP21
Paris
Climate
Talks
Paris Agreement is a landmark deal
marking a significant commitment by the
international community to further reduce
fossil fuel consumption
The Paris Agreement is legally binding, but
does not implement sanctions for failing to
meet emissions reduction targets
Effective in 2020, once it has been ratified
by 55 countries representing at least 55% of
global greenhouse gas emission
4
Source: Bloomberg New Energy Finance, China National Development and Reform Commission
Longer term policy visibility and an increase in corporate and utility procurement is expected to drive additional growth
over the next decade
September 2017
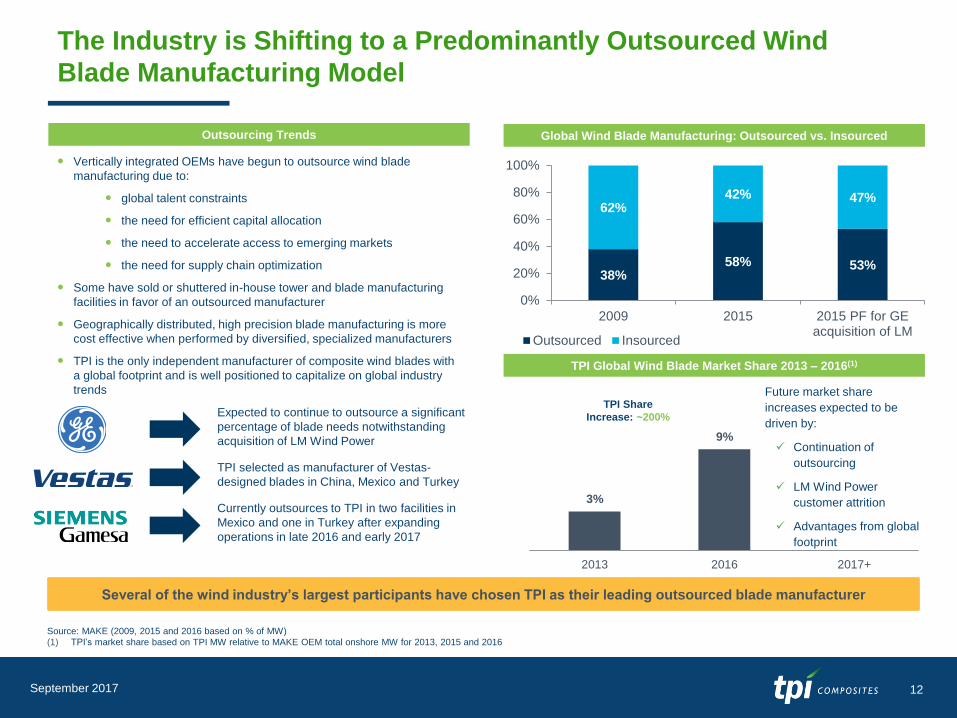
The Industry is Shifting to a Predominantly Outsourced Wind
Blade Manufacturing Model
12
Source: MAKE (2009, 2015 and 2016 based on % of MW)
(1) TPI’s market share based on TPI MW relative to MAKE OEM total onshore MW for 2013, 2015 and 2016
Global Wind Blade Manufacturing: Outsourced vs. Insourced
38%58% 53%
62%42% 47%
0%
20%
40%
60%
80%
100%
2009 2015 2015 PF for GEacquisition of LM
Outsourced Insourced
Vertically integrated OEMs have begun to outsource wind blade
manufacturing due to:
global talent constraints
the need for efficient capital allocation
the need to accelerate access to emerging markets
the need for supply chain optimization
Some have sold or shuttered in-house tower and blade manufacturing
facilities in favor of an outsourced manufacturer
Geographically distributed, high precision blade manufacturing is more
cost effective when performed by diversified, specialized manufacturers
TPI is the only independent manufacturer of composite wind blades with
a global footprint and is well positioned to capitalize on global industry
trends
Several of the wind industry’s largest participants have chosen TPI as their leading outsourced blade manufacturer
Expected to continue to outsource a significant
percentage of blade needs notwithstanding
acquisition of LM Wind Power
TPI selected as manufacturer of Vestas-
designed blades in China, Mexico and Turkey
Currently outsources to TPI in two facilities in
Mexico and one in Turkey after expanding
operations in late 2016 and early 2017
Outsourcing Trends
TPI Global Wind Blade Market Share 2013 – 2016(1)
3%
9%
2013 2016 2017+
TPI Share
Increase: ~200%
Future market share
increases expected to be
driven by:
Continuation of
outsourcing
LM Wind Power
customer attrition
Advantages from global
footprint
September 2017
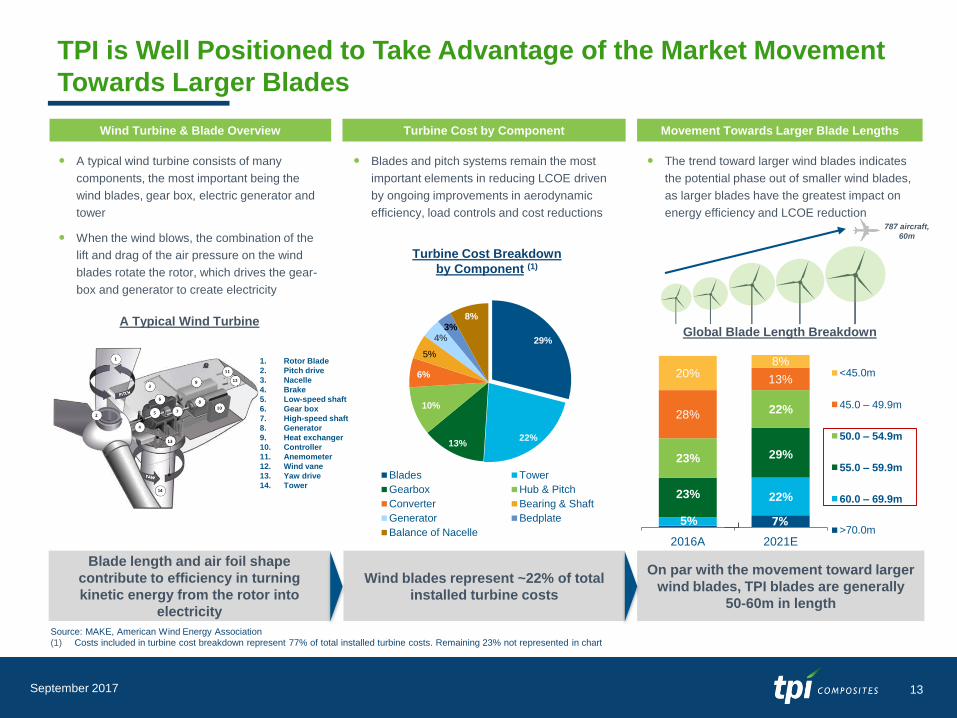
A typical wind turbine consists of many
components, the most important being the
wind blades, gear box, electric generator and
tower
When the wind blows, the combination of the
lift and drag of the air pressure on the wind
blades rotate the rotor, which drives the gear-
box and generator to create electricity
A Typical Wind Turbine
Blades and pitch systems remain the most
important elements in reducing LCOE driven
by ongoing improvements in aerodynamic
efficiency, load controls and cost reductions
29%
22%13%
10%
6%
4%3%
8%
Blades Tower
Gearbox Hub & Pitch
Converter Bearing & Shaft
Generator Bedplate
Balance of Nacelle
TPI is Well Positioned to Take Advantage of the Market Movement
Towards Larger Blades
13
The trend toward larger wind blades indicates
the potential phase out of smaller wind blades,
as larger blades have the greatest impact on
energy efficiency and LCOE reduction
Global Blade Length Breakdown
22%23%
29%23%
22%28%
13%20%
8%
2016A 2021E
<45.0m
45.0 – 49.9m
50.0 – 54.9m
55.0 – 59.9m
60.0 – 69.9m
>70.0m7%
Wind Turbine & Blade Overview Turbine Cost by Component Movement Towards Larger Blade Lengths
Turbine Cost Breakdown
by Component (1)
Source: MAKE, American Wind Energy Association
(1) Costs included in turbine cost breakdown represent 77% of total installed turbine costs. Remaining 23% not represented in chart
Wind blades represent ~22% of total
installed turbine costs
787 aircraft,
60m
On par with the movement toward larger
wind blades, TPI blades are generally
50-60m in length
Blade length and air foil shape
contribute to efficiency in turning
kinetic energy from the rotor into
electricity
1. Rotor Blade
2. Pitch drive
3. Nacelle
4. Brake
5. Low-speed shaft
6. Gear box
7. High-speed shaft
8. Generator
9. Heat exchanger
10. Controller
11. Anemometer
12. Wind vane
13. Yaw drive
14. Tower
5%
5%
September 2017
Strong Barriers to Entry Will Allow TPI to Capture Additional
Market Share
14
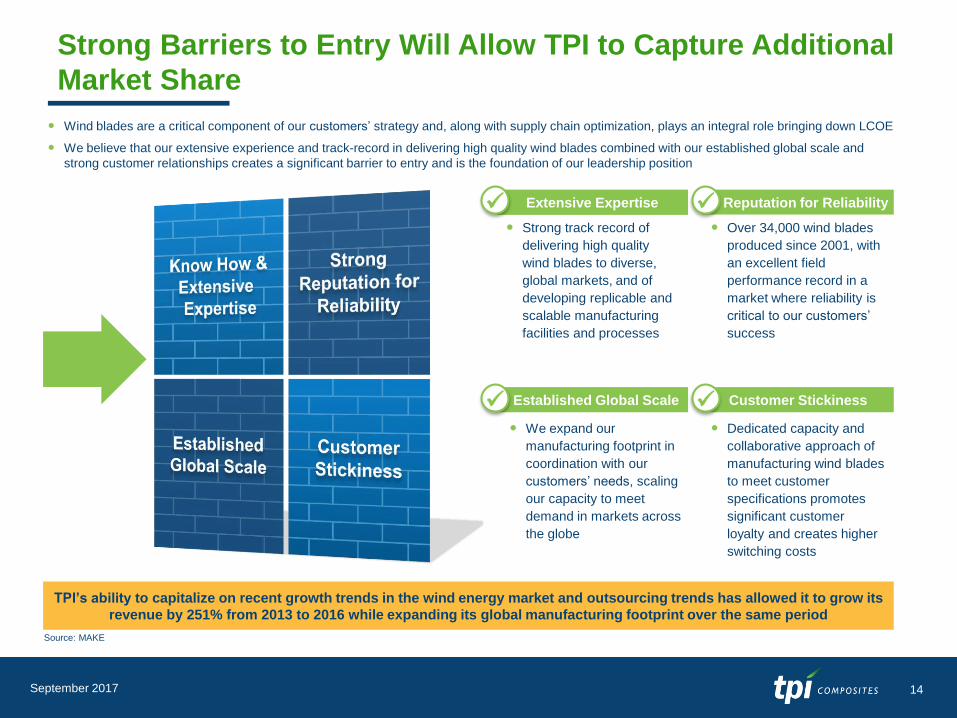
Wind blades are a critical component of our customers’ strategy and, along with supply chain optimization, plays an integral role bringing down LCOE
We believe that our extensive experience and track-record in delivering high quality wind blades combined with our established global scale and
strong customer relationships creates a significant barrier to entry and is the foundation of our leadership position
Strong track record of
delivering high quality
wind blades to diverse,
global markets, and of
developing replicable and
scalable manufacturing
facilities and processes
Extensive Expertise Reputation for Reliability
Established Global Scale Customer Stickiness
Over 34,000 wind blades
produced since 2001, with
an excellent field
performance record in a
market where reliability is
critical to our customers’
success
We expand our
manufacturing footprint in
coordination with our
customers’ needs, scaling
our capacity to meet
demand in markets across
the globe
Dedicated capacity and
collaborative approach of
manufacturing wind blades
to meet customer
specifications promotes
significant customer
loyalty and creates higher
switching costs
Source: MAKE
TPI’s ability to capitalize on recent growth trends in the wind energy market and outsourcing trends has allowed it to grow its
revenue by 251% from 2013 to 2016 while expanding its global manufacturing footprint over the same period
September 2017
Global Footprint Strategically Optimized for Regional Industry
Demand
15
Source: Bloomberg New Energy Finance
Note: Onshore wind capacity and installation statistics shown. Bubble sizes represent projected onshore wind generation capacity installations from 2017 to 2020 in GW
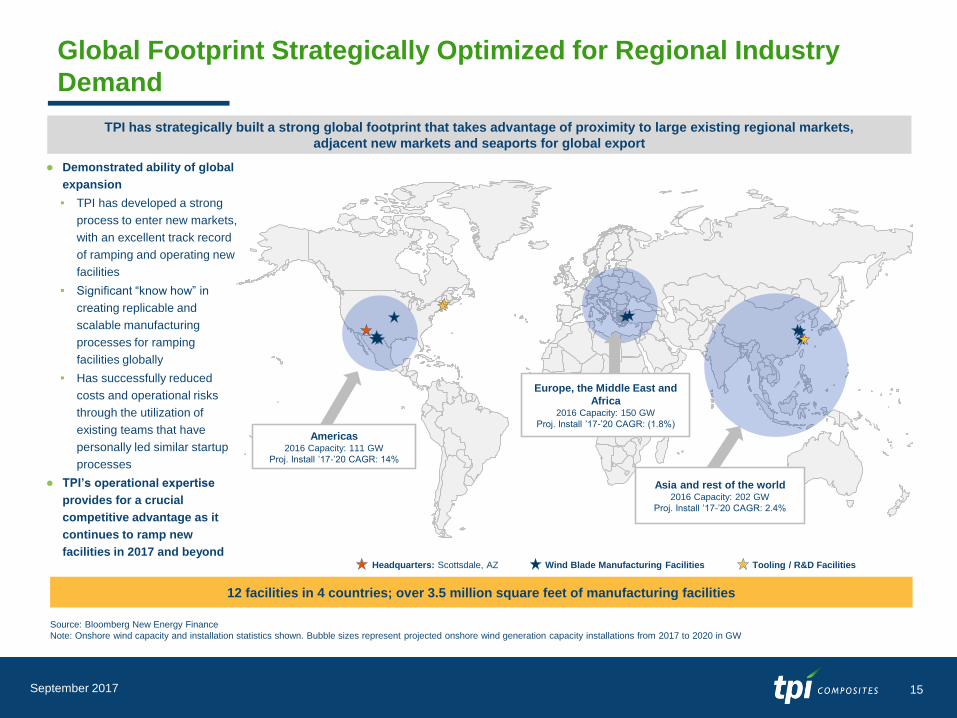
TPI has strategically built a strong global footprint that takes advantage of proximity to large existing regional markets,
adjacent new markets and seaports for global export
12 facilities in 4 countries; over 3.5 million square feet of manufacturing facilities
Headquarters: Scottsdale, AZ Wind Blade Manufacturing Facilities Tooling / R&D Facilities
Europe, the Middle East and
Africa 2016 Capacity: 150 GW
Proj. Install ’17-’20 CAGR: (1.8%)
Americas2016 Capacity: 111 GW
Proj. Install ’17-’20 CAGR: 14%
Asia and rest of the world2016 Capacity: 202 GW
Proj. Install ’17-’20 CAGR: 2.4%
● Demonstrated ability of global
expansion
▪ TPI has developed a strong
process to enter new markets,
with an excellent track record
of ramping and operating new
facilities
▪ Significant “know how” in
creating replicable and
scalable manufacturing
processes for ramping
facilities globally
▪ Has successfully reduced
costs and operational risks
through the utilization of
existing teams that have
personally led similar startup
processes
● TPI’s operational expertise
provides for a crucial
competitive advantage as it
continues to ramp new
facilities in 2017 and beyond
September 2017
Advanced Composite Technology and Production Expertise
Provides Barrier to Entry
16
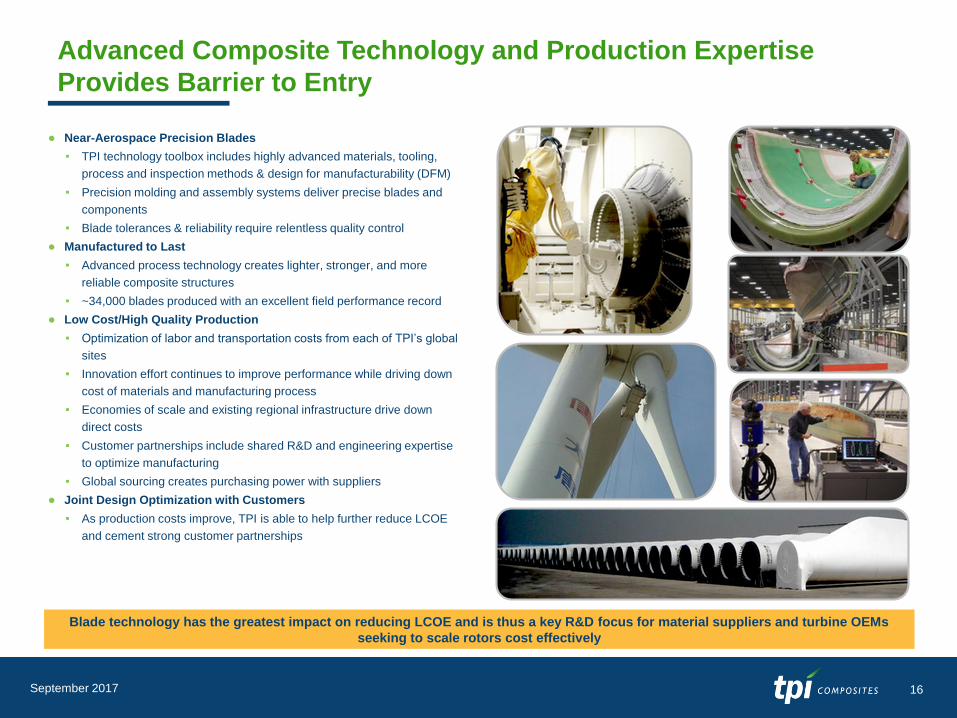
Blade technology has the greatest impact on reducing LCOE and is thus a key R&D focus for material suppliers and turbine OEMs
seeking to scale rotors cost effectively
● Near-Aerospace Precision Blades
▪ TPI technology toolbox includes highly advanced materials, tooling,
process and inspection methods & design for manufacturability (DFM)
▪ Precision molding and assembly systems deliver precise blades and
components
▪ Blade tolerances & reliability require relentless quality control
● Manufactured to Last
▪ Advanced process technology creates lighter, stronger, and more
reliable composite structures
▪ ~34,000 blades produced with an excellent field performance record
● Low Cost/High Quality Production
▪ Optimization of labor and transportation costs from each of TPI’s global
sites
▪ Innovation effort continues to improve performance while driving down
cost of materials and manufacturing process
▪ Economies of scale and existing regional infrastructure drive down
direct costs
▪ Customer partnerships include shared R&D and engineering expertise
to optimize manufacturing
▪ Global sourcing creates purchasing power with suppliers
● Joint Design Optimization with Customers
▪ As production costs improve, TPI is able to help further reduce LCOE
and cement strong customer partnerships
September 2017
Dedicated Supplier Model Encourages Stable Long-Term
Customers
17September 2017
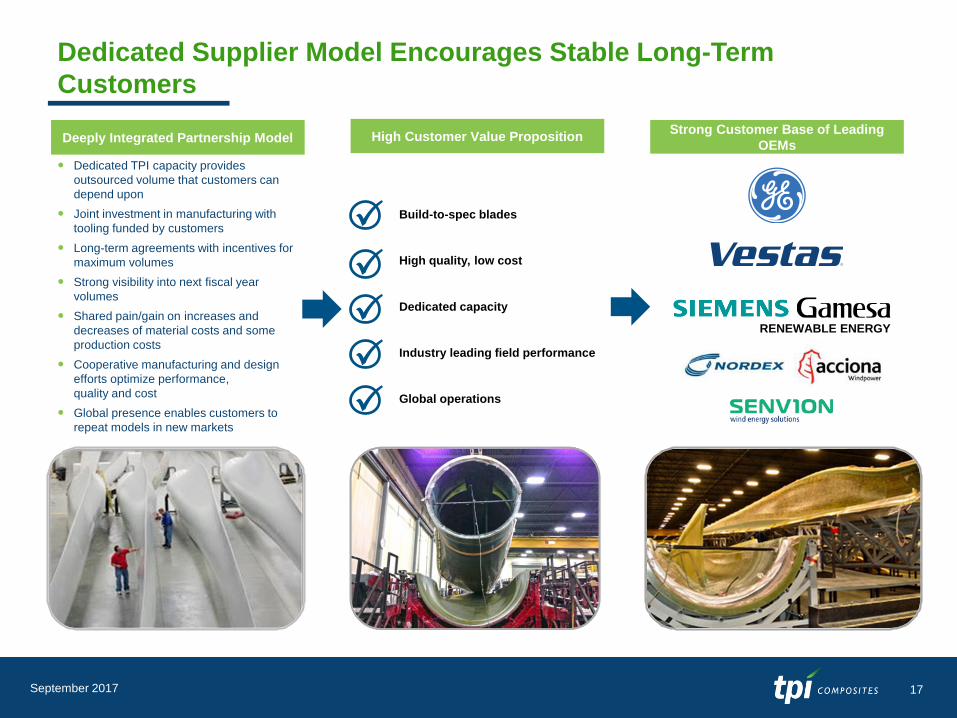
Build-to-spec blades
Dedicated TPI capacity provides
outsourced volume that customers can
depend upon
Joint investment in manufacturing with
tooling funded by customers
Long-term agreements with incentives for
maximum volumes
Strong visibility into next fiscal year
volumes
Shared pain/gain on increases and
decreases of material costs and some
production costs
Cooperative manufacturing and design
efforts optimize performance,
quality and cost
Global presence enables customers to
repeat models in new markets
Dedicated capacity
Industry leading field performance
High quality, low cost
Global operations
High Customer Value PropositionStrong Customer Base of Leading
OEMs
RENEWABLE ENERGY
Deeply Integrated Partnership Model
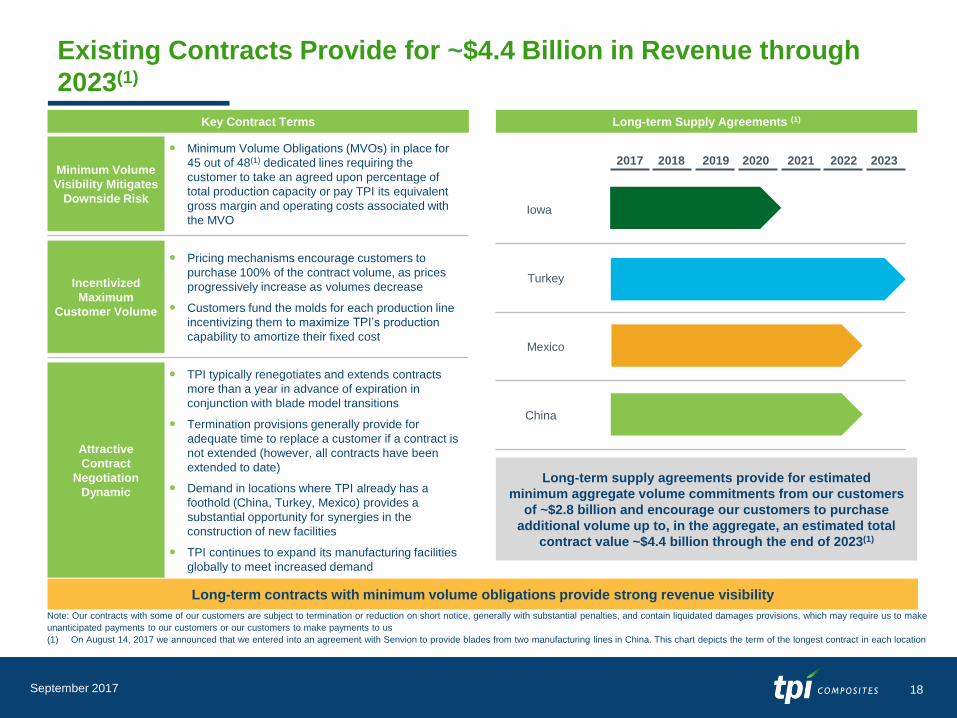
Existing Contracts Provide for ~$4.4 Billion in Revenue through
2023(1)
18
Long-term contracts with minimum volume obligations provide strong revenue visibility
Key Contract Terms
Minimum Volume
Visibility Mitigates
Downside Risk
Minimum Volume Obligations (MVOs) in place for
45 out of 48(1) dedicated lines requiring the
customer to take an agreed upon percentage of
total production capacity or pay TPI its equivalent
gross margin and operating costs associated with
the MVO
Incentivized
Maximum
Customer Volume
Pricing mechanisms encourage customers to
purchase 100% of the contract volume, as prices
progressively increase as volumes decrease
Customers fund the molds for each production line
incentivizing them to maximize TPI’s production
capability to amortize their fixed cost
Attractive
Contract
Negotiation
Dynamic
TPI typically renegotiates and extends contracts
more than a year in advance of expiration in
conjunction with blade model transitions
Termination provisions generally provide for
adequate time to replace a customer if a contract is
not extended (however, all contracts have been
extended to date)
Demand in locations where TPI already has a
foothold (China, Turkey, Mexico) provides a
substantial opportunity for synergies in the
construction of new facilities
TPI continues to expand its manufacturing facilities
globally to meet increased demand
2017 2018 2019 2020 2021 2022 2023
Iowa
Turkey
Mexico
China
Note: Our contracts with some of our customers are subject to termination or reduction on short notice, generally with substantial penalties, and contain liquidated damages provisions, which may require us to make
unanticipated payments to our customers or our customers to make payments to us
(1) On August 14, 2017 we announced that we entered into an agreement with Senvion to provide blades from two manufacturing lines in China. This chart depicts the term of the longest contract in each location
Long-term supply agreements provide for estimated
minimum aggregate volume commitments from our customers
of ~$2.8 billion and encourage our customers to purchase
additional volume up to, in the aggregate, an estimated total
contract value ~$4.4 billion through the end of 2023(1)
Long-term Supply Agreements (1)
September 2017
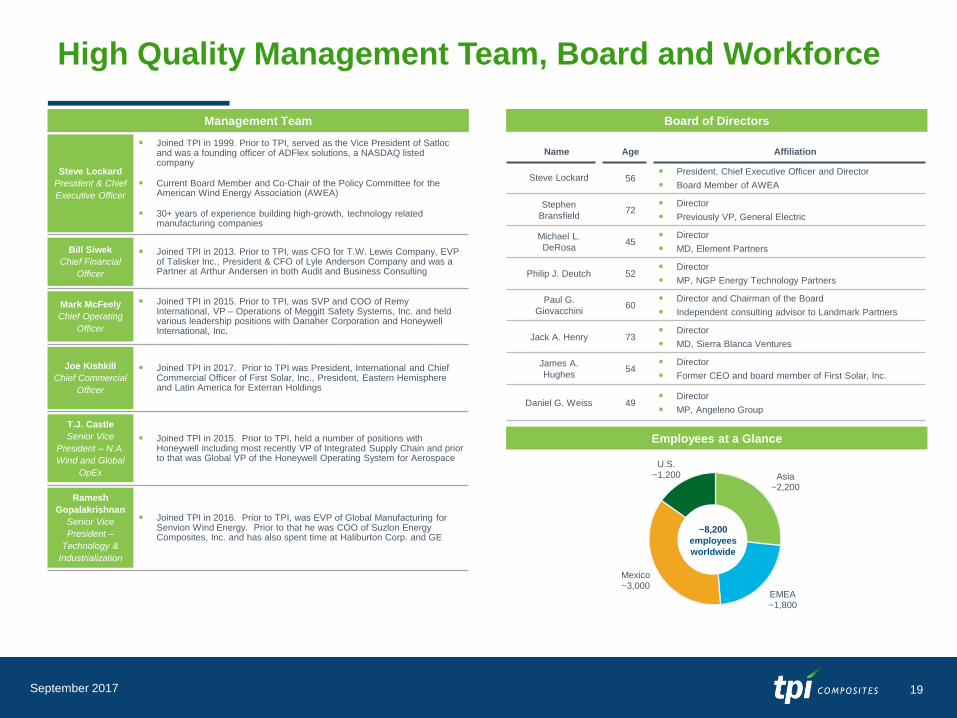
High Quality Management Team, Board and Workforce
19
Asia~2,200
EMEA~1,800
Mexico~3,000
U.S.~1,200
Management Team Board of Directors
Steve Lockard
President & Chief
Executive Officer
Joined TPI in 1999. Prior to TPI, served as the Vice President of Satloc and was a founding officer of ADFlex solutions, a NASDAQ listed company
Current Board Member and Co-Chair of the Policy Committee for the American Wind Energy Association (AWEA)
30+ years of experience building high-growth, technology related manufacturing companies
Bill Siwek
Chief Financial
Officer
Joined TPI in 2013. Prior to TPI, was CFO for T.W. Lewis Company, EVP of Talisker Inc., President & CFO of Lyle Anderson Company and was a Partner at Arthur Andersen in both Audit and Business Consulting
Mark McFeely
Chief Operating
Officer
Joined TPI in 2015. Prior to TPI, was SVP and COO of Remy International, VP – Operations of Meggitt Safety Systems, Inc. and held various leadership positions with Danaher Corporation and Honeywell International, Inc.
Joe Kishkill
Chief Commercial
Officer
Joined TPI in 2017. Prior to TPI was President, International and Chief Commercial Officer of First Solar, Inc., President, Eastern Hemisphere and Latin America for Exterran Holdings
T.J. Castle
Senior Vice
President – N.A.
Wind and Global
OpEx
Joined TPI in 2015. Prior to TPI, held a number of positions with Honeywell including most recently VP of Integrated Supply Chain and prior to that was Global VP of the Honeywell Operating System for Aerospace
Ramesh
Gopalakrishnan
Senior Vice
President –
Technology &
Industrialization
Joined TPI in 2016. Prior to TPI, was EVP of Global Manufacturing for Senvion Wind Energy. Prior to that he was COO of Suzlon Energy Composites, Inc. and has also spent time at Haliburton Corp. and GE
Employees at a Glance
Name Age Affiliation
Steve Lockard 56 President, Chief Executive Officer and Director
Board Member of AWEA
Stephen
Bransfield72
Director
Previously VP, General Electric
Michael L.
DeRosa45
Director
MD, Element Partners
Philip J. Deutch 52 Director
MP, NGP Energy Technology Partners
Paul G.
Giovacchini60
Director and Chairman of the Board
Independent consulting advisor to Landmark Partners
Jack A. Henry 73 Director
MD, Sierra Blanca Ventures
James A.
Hughes54
Director
Former CEO and board member of First Solar, Inc.
Daniel G. Weiss 49 Director
MP, Angeleno Group
~8,200
employees
worldwide
September 2017
Key Company Highlights
20
Capitalizing on Strong Wind Industry Growth, Blade Outsourcing Trends and Market
Share Gains
Long-Term Supply Agreements Provide Significant Revenue Visibility
Industry Leader with Strategic Global Footprint
Advanced Composite Technology and Production Expertise Provides Barrier to Entry
Unique Collaborative Dedicated Supplier Model
Compelling Return on Invested Capital
Seasoned Management Team with Significant High Growth Experience
September 2017
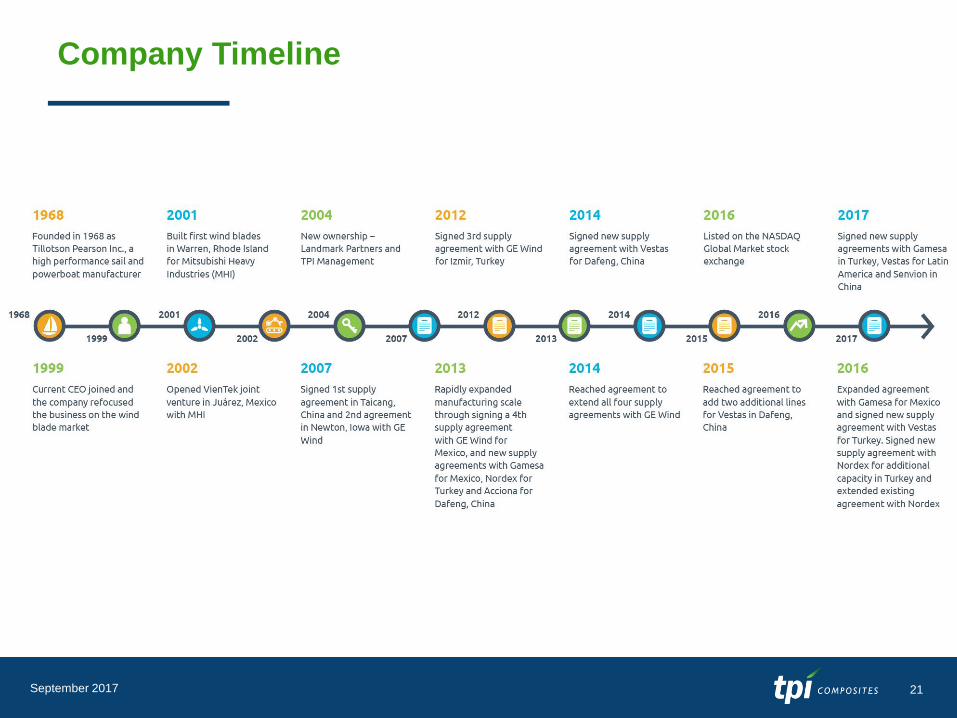
Company Timeline
21
1968 1999 20082001 2004 2007 2012 2013 2014 20162015 2017
September 2017
Financial Summary
22September 2017
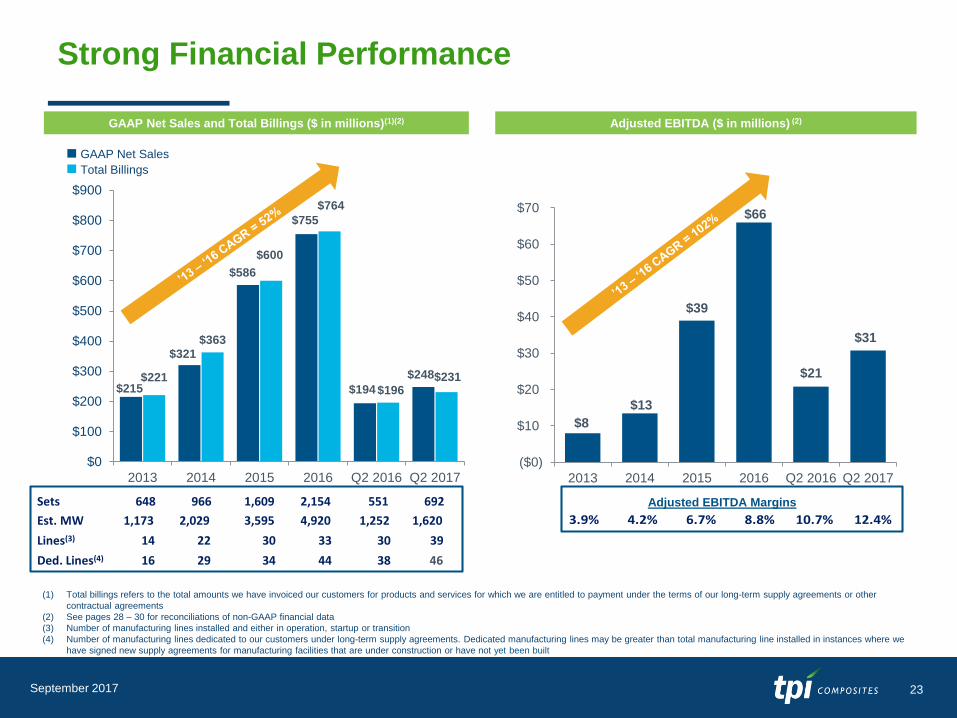
Strong Financial Performance
23September 2017
$8
$13
$39
$66
$21
$31
($0)
$10
$20
$30
$40
$50
$60
$70
2013 2014 2015 2016 Q2 2016 Q2 2017
GAAP Net Sales and Total Billings ($ in millions)(1)(2) Adjusted EBITDA ($ in millions) (2)
$215
$321
$586
$755
$194
$248$221
$363
$600
$764
$196$231
$0
$100
$200
$300
$400
$500
$600
$700
$800
$900
2013 2014 2015 2016 Q2 2016 Q2 2017
(1) Total billings refers to the total amounts we have invoiced our customers for products and services for which we are entitled to payment under the terms of our long-term supply agreements or other
contractual agreements
(2) See pages 28 – 30 for reconciliations of non-GAAP financial data
(3) Number of manufacturing lines installed and either in operation, startup or transition
(4) Number of manufacturing lines dedicated to our customers under long-term supply agreements. Dedicated manufacturing lines may be greater than total manufacturing line installed in instances where we
have signed new supply agreements for manufacturing facilities that are under construction or have not yet been built
Total Billings
GAAP Net Sales
Sets 648 966 1,609 2,154 551 692
Est. MW 1,173 2,029 3,595 4,920 1,252 1,620
Lines(3) 14 22 30 33 30 39
Ded. Lines(4) 16 29 34 44 38 46
Adjusted EBITDA Margins
3.9% 4.2% 6.7% 8.8% 10.7% 12.4%
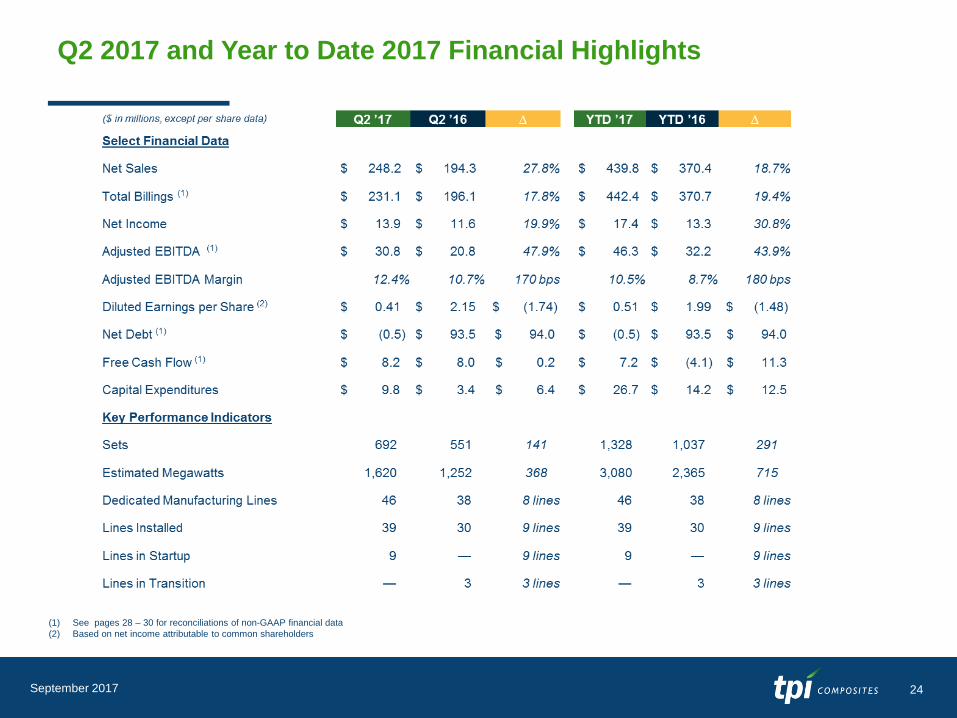
Q2 2017 and Year to Date 2017 Financial Highlights
24
(1) See pages 28 – 30 for reconciliations of non-GAAP financial data
(2) Based on net income attributable to common shareholders
September 2017
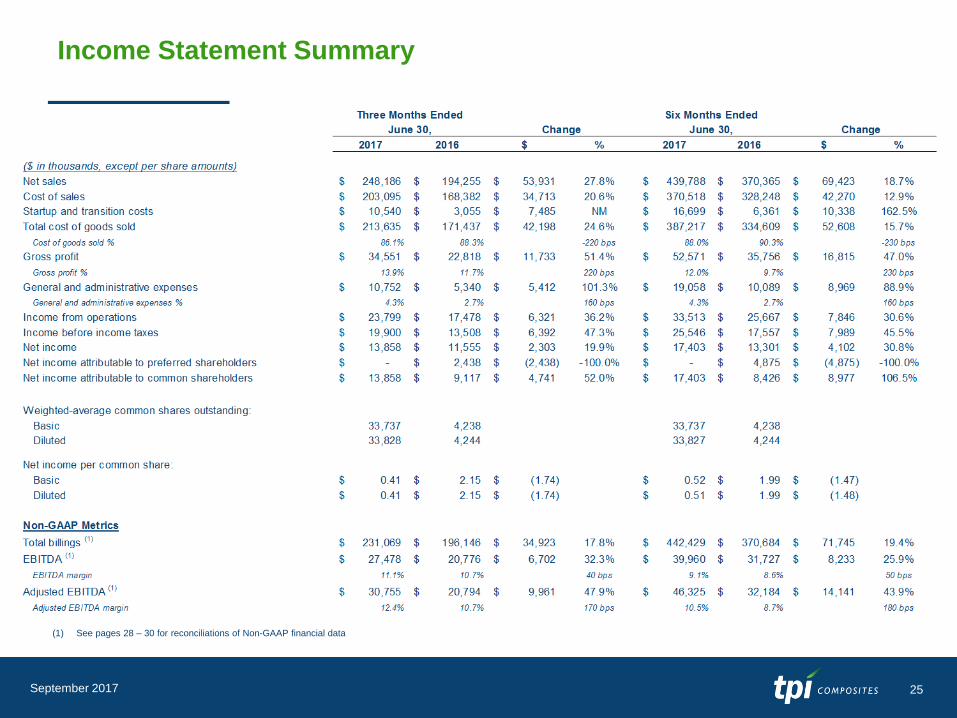
Income Statement Summary
25
(1) See pages 28 – 30 for reconciliations of Non-GAAP financial data
September 2017
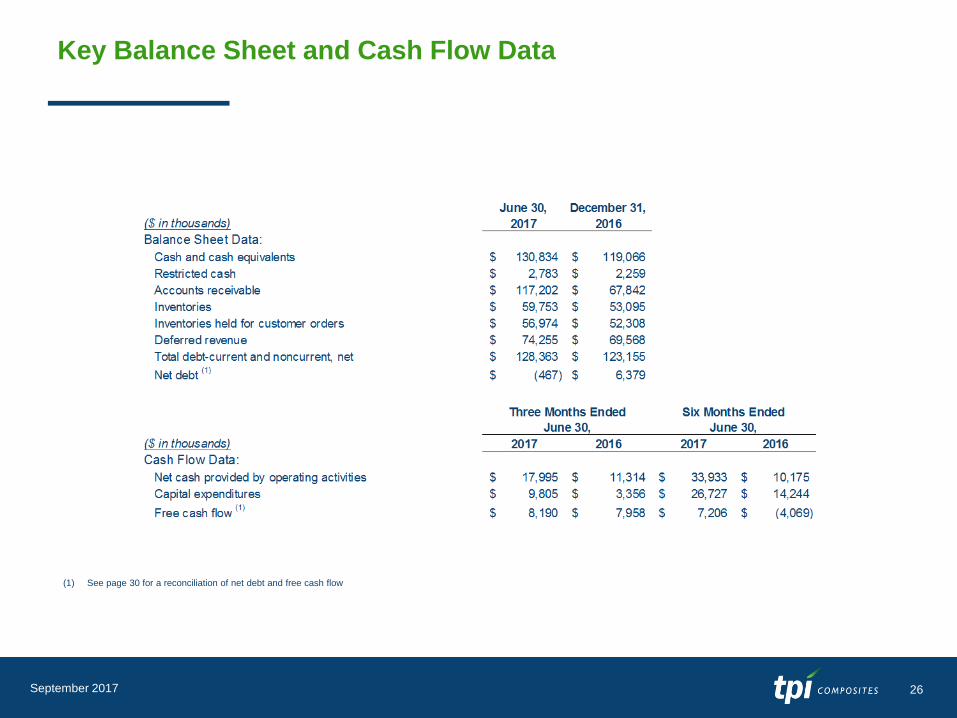
Key Balance Sheet and Cash Flow Data
26
(1) See page 30 for a reconciliation of net debt and free cash flow
September 2017
Appendix - Non-GAAP Information
27
This presentation includes unaudited non-GAAP financial measures including total billings, EBITDA, adjusted EBITDA, net debt and free
cash flow. We define total billings as the total amounts we have invoiced our customers for products and services for which we are entitled
to payment under the terms of our long-term supply agreements or other contractual agreements. We define EBITDA as net income (loss)
attributable to the Company plus interest expense (including losses on the extinguishment of debt and net of interest income), income taxes,
and depreciation and amortization. We define adjusted EBITDA as EBITDA plus any share-based compensation expense, plus or minus any
gains or losses from foreign currency remeasurement. We define net debt as the total principal amount of debt outstanding less unrestricted
cash and equivalents. We define free cash flow as net cash flow generated from operating activities less capital expenditures. We present
non-GAAP measures when we believe that the additional information is useful and meaningful to investors. Non-GAAP financial measures
do not have any standardized meaning and are therefore unlikely to be comparable to similar measures presented by other companies. The
presentation of non-GAAP financial measures is not intended to be a substitute for, and should not be considered in isolation from, the
financial measures reported in accordance with GAAP. See below for a reconciliation of certain non-GAAP financial measures to the
comparable GAAP measures.
September 2017
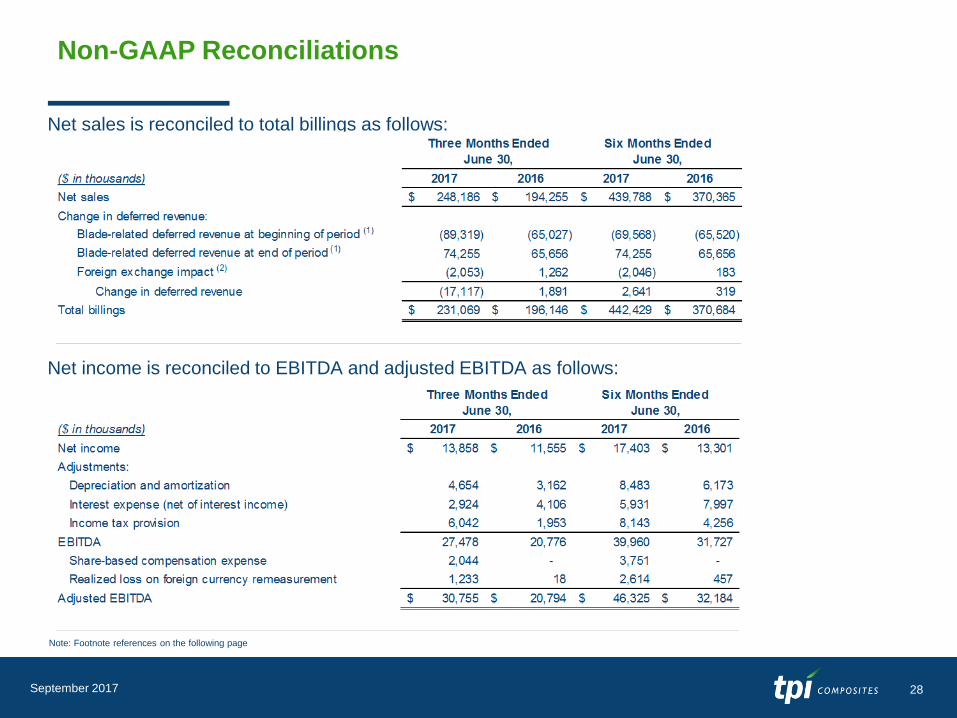
Non-GAAP Reconciliations
28
Note: Footnote references on the following page
Net sales is reconciled to total billings as follows:
Net income is reconciled to EBITDA and adjusted EBITDA as follows:
September 2017
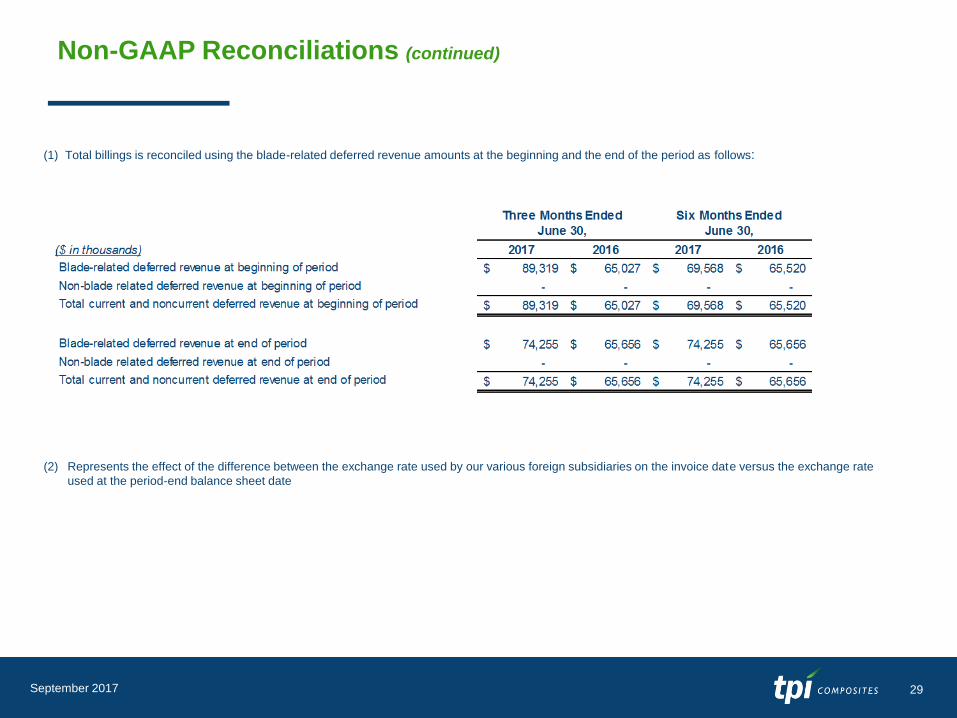
Non-GAAP Reconciliations (continued)
29
(1) Total billings is reconciled using the blade-related deferred revenue amounts at the beginning and the end of the period as follows:
(2) Represents the effect of the difference between the exchange rate used by our various foreign subsidiaries on the invoice date versus the exchange rate
used at the period-end balance sheet date
September 2017
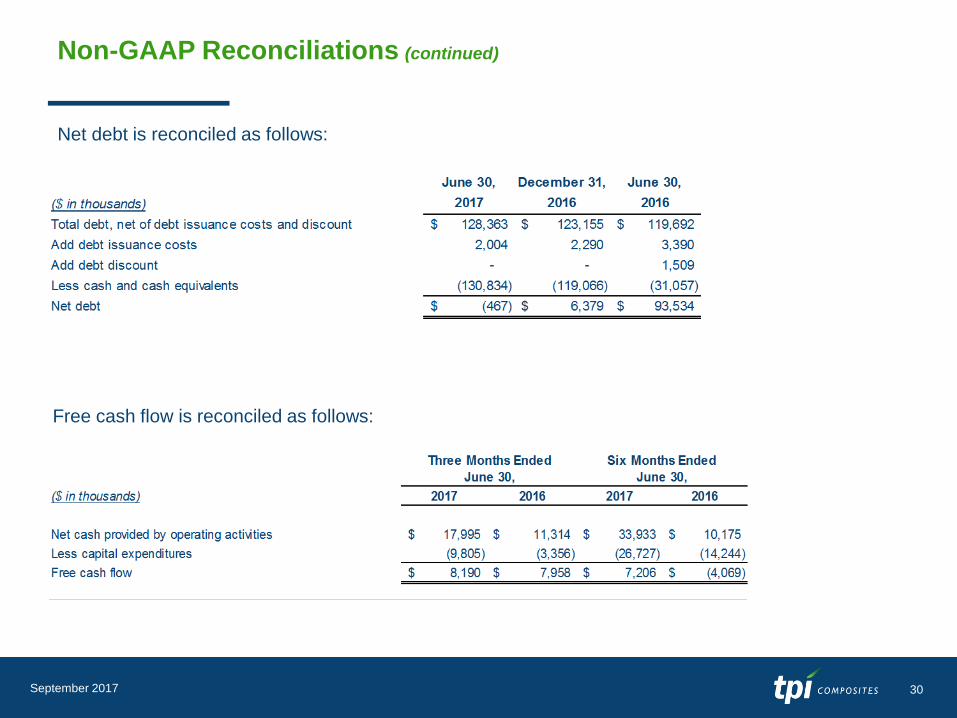
Non-GAAP Reconciliations (continued)
Net debt is reconciled as follows:
30
Free cash flow is reconciled as follows:
September 2017

Related Documents