Marine Structures 15 (2002) 335–364 Collision scenarios and probabilistic collision damage A.J. Brown* Department of Aerospace and Ocean Engineering, Virginia Polytechnic Institute and State University, Blacksburg, VA 24061, USA Received 15 April 2001; accepted 15 December 2001 Abstract This paper examines the influence of collision scenario random variables on the extent of predicted damage in ship collisions. Struck and striking ship speed, collision angle, striking ship type and striking ship displacement are treated as independent random variables. Other striking ship characteristics are treated as dependent variables derived from the independent variables based on relationships developed from worldwide ship data. A Simplified Collision Model (SIMCOL) is used to assess the sensitivity of probabilistic damage extent to these variables. SIMCOL applies the scenario variables directly in a time-stepping simultaneous solution of internal (structural) and external (ship) problems. During the simultaneous solution SIMCOL also calculates struck ship absorbed energy in the longitudinal and transverse directions. These results are compared to absorbed energy estimates based on uncoupled external dynamics only. The necessity and effectiveness of this approach is examined. r 2002 Published by Elsevier Science Ltd. Keywords: Ship collision; Ship damage; Probabilistic; Collision scenario; Collision model 1. Introduction The serious consequences of ship collisions necessitate the development of regulations and requirements for the sub-division and structural design of ships to minimize damage, reduce environmental pollution, and improve safety. The Society of Naval Architects and Marine Engineers (SNAME) Ad Hoc Panel #6 was established to study the effect of structural design on the extent of damage in ship *Tel.: +1-540-231-4950; fax: +1-540-231-9632. E-mail address: [email protected] (A.J. Brown). 0951-8339/02/$ - see front matter r 2002 Published by Elsevier Science Ltd. PII:S0951-8339(02)00007-2

Welcome message from author
This document is posted to help you gain knowledge. Please leave a comment to let me know what you think about it! Share it to your friends and learn new things together.
Transcript

Marine Structures 15 (2002) 335–364
Collision scenarios and probabilisticcollision damage
A.J. Brown*
Department of Aerospace and Ocean Engineering, Virginia Polytechnic Institute and State University,
Blacksburg, VA 24061, USA
Received 15 April 2001; accepted 15 December 2001
Abstract
This paper examines the influence of collision scenario random variables on the extent of
predicted damage in ship collisions. Struck and striking ship speed, collision angle, striking
ship type and striking ship displacement are treated as independent random variables. Other
striking ship characteristics are treated as dependent variables derived from the independent
variables based on relationships developed from worldwide ship data. A Simplified Collision
Model (SIMCOL) is used to assess the sensitivity of probabilistic damage extent to these
variables. SIMCOL applies the scenario variables directly in a time-stepping simultaneous
solution of internal (structural) and external (ship) problems. During the simultaneous
solution SIMCOL also calculates struck ship absorbed energy in the longitudinal and
transverse directions. These results are compared to absorbed energy estimates based on
uncoupled external dynamics only. The necessity and effectiveness of this approach is
examined. r 2002 Published by Elsevier Science Ltd.
Keywords: Ship collision; Ship damage; Probabilistic; Collision scenario; Collision model
1. Introduction
The serious consequences of ship collisions necessitate the development ofregulations and requirements for the sub-division and structural design of ships tominimize damage, reduce environmental pollution, and improve safety. The Societyof Naval Architects and Marine Engineers (SNAME) Ad Hoc Panel #6 wasestablished to study the effect of structural design on the extent of damage in ship
*Tel.: +1-540-231-4950; fax: +1-540-231-9632.
E-mail address: [email protected] (A.J. Brown).
0951-8339/02/$ - see front matter r 2002 Published by Elsevier Science Ltd.
PII: S 0 9 5 1 - 8 3 3 9 ( 0 2 ) 0 0 0 0 7 - 2

collision and grounding. SNAME and the Ship Structure Committee (SSC) sponsorresearch under this panel as reported by Sirkar et al. [1], Crake [2], Rawson et al. [3],Chen [4], and Brown et al. [5]. A Simplified Collision Model (SIMCOL) wasdeveloped as part of this research. It is used in a Monte Carlo simulation asdescribed by Brown and Amrozowicz [6] to predict probabilistic damage.Preliminary results from this research are presented in this paper.
The collection of collision and collision scenario data is an essential element in thisdevelopment. Collision data are required for two purposes:
* collision model validation; and* definition of probabilistic collision scenarios.
These two data requirements are very different. This paper considers only theanalysis of data to define probabilistic collision scenarios.
Thousands of cases are required to develop probabilistic descriptions of possiblecollision scenarios. For a given struck ship design, the collision scenario is definedprobabilistically using random variables. Collision angle, strike location, and shipspeed data must be collected from actual collision events or developed using a shipencounter model. Striking ship data may come from actual collision events, local orregional models or worldwide ship characteristics.
This paper provides a preliminary set of probabilities, probability densityfunctions and equations required to generate specific collision scenarios in a MonteCarlo simulation using SIMCOL. It assesses the sensitivity of structural damage(penetration and length) to each of these independent variables applied in 10,000collision scenarios with each of four different struck ships, and it assesses thenecessity of solving the internal damage problem simultaneously with the externalship dynamics.
2. SIMCOL
SIMCOL uses a time-domain simultaneous solution of external ship dynamics andinternal deformation mechanics similar to that originally proposed by Hutchison [7].
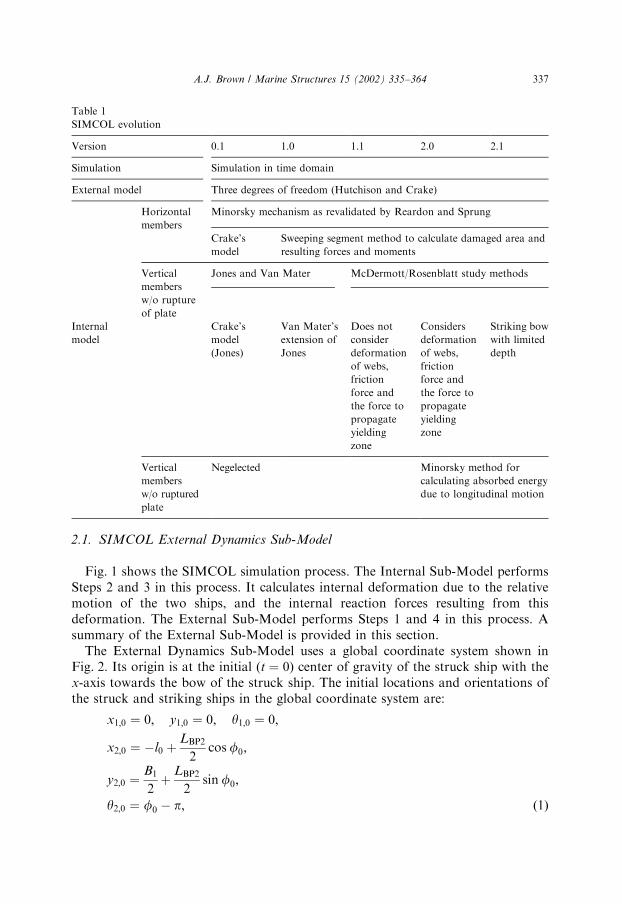
SIMCOL Version 0.0 was developed as part of the work of SNAME Ad HocPanel #3 [1]. Based on further research, test runs and the need to make the modelsensitive to a broader range of design and scenario variables, improvements weremade progressively by SNAME Ad Hoc Panel #6. A sweeping segment method wasadded to the model in SIMCOL Version 1.0 to improve the calculation of damagevolume and the direction of damage forces. Models from Rosenblatt [8] andMcDermott [9] were applied in Version 1.1 assuming rigid web frames. In Version2.0, the lateral deformation of web frames was included. In Version 2.1, the verticalextent of the striking ship bow is considered. Table 1 summarizes the evolution ofSIMCOL over the last five years. Version 2.1 is used for the research presented inthis paper and is described in the following sections.
A.J. Brown / Marine Structures 15 (2002) 335–364336
2.1. SIMCOL External Dynamics Sub-Model
Fig. 1 shows the SIMCOL simulation process. The Internal Sub-Model performsSteps 2 and 3 in this process. It calculates internal deformation due to the relativemotion of the two ships, and the internal reaction forces resulting from thisdeformation. The External Sub-Model performs Steps 1 and 4 in this process. Asummary of the External Sub-Model is provided in this section.
The External Dynamics Sub-Model uses a global coordinate system shown inFig. 2. Its origin is at the initial (t ¼ 0) center of gravity of the struck ship with thex-axis towards the bow of the struck ship. The initial locations and orientations ofthe struck and striking ships in the global coordinate system are:
x1;0 ¼ 0; y1;0 ¼ 0; y1;0 ¼ 0;
x2;0 ¼ �l0 þLBP2
2cos f0;
y2;0 ¼B1
2þ
LBP2
2sin f0;
y2;0 ¼ f0 � p; ð1Þ
Table 1
SIMCOL evolution
Version 0.1 1.0 1.1 2.0 2.1
Simulation Simulation in time domain
External model Three degrees of freedom (Hutchison and Crake)
Horizontal
members
Minorsky mechanism as revalidated by Reardon and Sprung
Crake’s
model
Sweeping segment method to calculate damaged area and
resulting forces and moments
Vertical
members
w/o rupture
of plate
Jones and Van Mater McDermott/Rosenblatt study methods
Internal
model
Crake’s
model
(Jones)
Van Mater’s
extension of
Jones
Does not
consider
deformation
of webs,
friction
force and
the force to
propagate
yielding
zone
Considers
deformation
of webs,
friction
force and
the force to
propagate
yielding
zone
Striking bow
with limited
depth
Vertical
members
w/o ruptured
plate
Negelected Minorsky method for
calculating absorbed energy
due to longitudinal motion
A.J. Brown / Marine Structures 15 (2002) 335–364 337

where x1; y1 are the center of gravity of the struck ship (m), y1 the heading of thestruck ship (1), x2; y2 the center of gravity of the striking ship (m), y2 the heading ofthe striking ship (1), LBP2 the LBP of the striking ship (m), B1 the breadth of thestruck ship (m), and f the collision angle (1).
A local damage coordinate system, x2Z; is established on the struck ship tocalculate relative movement and collision forces. The origin of this system is set atmidship on the shell plate of the damaged side of the struck ship. Axes x and Z pointaft and inboard relative to the struck ship. Local coordinate systems are alsoestablished at the centers of gravity of both struck and striking ships. Forces andmoments in the local systems are transformed to the global x2y system for solutionof the ship dynamics.
Considering the symmetry of the ships, and with the center of gravity of the shipsassumed at midship, the local system added mass tensor for each ship is
As ¼
a11 0 0
0 a22 0
0 0 a33
264
375; ð2Þ
At time step i
Using current velocities, calculate nextpositions and orientation angles of ships
and the relative motion at impact point
Calculate the change of impact locationalong the struck ship and the increment of
penetration during the time step
Calculate the average reaction forces duringthe time step by internal mechanisms
Calculate the average accelerations of bothships, the velocities for the next time step,
and the lost kinetic energy based on externalship dynamics
Go to the next time step:i = i+1
Meet stoppingcriteria ?
Calculate maximumpenetration and damage
length
YesNo
1.
2.
3.
4.
Fig. 1. SIMCOL simulation process.
A.J. Brown / Marine Structures 15 (2002) 335–364338

where a11 is the added mass in the surge direction (kg), a22 the added mass in thesway direction (kg), and a33 the yaw added mass moment of inertia (kgm2).
Average added mass values vary with the duration of the collision impact. Mid-range values are typically used. The added mass tensor is transformed in accordancewith the orientation of each ship to the global coordinate system. The transformedtensor, Ay; for each ship is:
Ay ¼
a11 cos2 yþ a22 sin
2 y ða11 � a22Þ cos y sin y 0
ða11 � a22Þ cos y sin y a11 sin2 yþ a22 cos
2 y 0
0 0 a33
264
375: ð3Þ
The mass for each ship is represented by a tensor:
Mship ¼
ms 0 0
0 ms 0
0 0 Is33
264
375; ð4Þ
where ms is the mass of each ship (kg), and Is33 the yaw mass moment of inertia(kgm2).
Fig. 2. SIMCOL global coordinate system.
A.J. Brown / Marine Structures 15 (2002) 335–364 339

The virtual mass, MV ; for each ship is then
MVy ¼ Mship þ Ay ¼
mV11 mV12 0
mV21 mV22 0
0 0 IV33
264
375
¼
ms þ a11 cos2 yþ a22 sin
2 y ða11 � a22Þ cos y sin y 0
ða11 � a22Þ cos y sin y ms þ a11 sin2 yþ a22 cos
2 y 0
0 0 Is33 þ a33
264
375:ð5Þ
Referring to Fig. 1, Step 1, the velocities from the previous time step are applied tothe ships to calculate their positions at the end of the current time step:
Xnþ1 ¼ Xn þ Vsnt; ð6Þ
where X is the location and orientation of ships in the global system, X ¼ fx; y; ygT;Vsn the ship velocity, Vs ¼ fu; v;ogoT; and t the time step (s).
In Steps 2 and 3, the Internal Model calculates the compatible deformation, andthe average forces and moments generated by this deformation over the time step. InStep 4, these forces and moments are applied to each ship. The new acceleration foreach ship is
V0s ¼
F
MVW; ð7Þ
where F is the forces exerted on the ships in the global system, F ¼ fFx;Fy;MgT; andV0
s the ship acceleration, Vs0¼ fu0; v0;o0gT and
u0 ¼FxmV22 � FymV12
mV11mV22 � m2V12
;
v0 ¼FymV11 � FxmV12
mV11mV22 � m2V12
;
o0 ¼M
IV33: ð8Þ
The new velocity for each ship at the end of the time step is then
Vs;nþ1 ¼ Vs;n þ V’st: ð9Þ
2.2. SIMCOL Internal Sub-Model
The Internal Sub-Model calculates the struck ship deformation resulting from theships’ relative motion, and calculates the average internal forces and momentsgenerated by this deformation over the time step. Refer to Fig. 1, Steps 2 and 3. TheInternal Sub-Model determines reacting forces from side and bulkhead (vertical)structures using specific component deformation mechanisms including: membranetension; shell rupture; web frame bending; shear and compression; force required topropagate the yielded zone; and friction. It determines absorbed energy and forces
A.J. Brown / Marine Structures 15 (2002) 335–364340

from the crushing and tearing of decks, bottoms and stringers (horizontal structures)using the Minorsky [10] correlation as modified by Reardon and Sprung [11]. Totalforces are the sum of these two components. In SIMCOL Version 2.1, the strikingship bow is assumed to be rigid and wedge-shaped with upper and lower extentsdetermined by the bow height of the striking ship and the relative drafts of the twoships. Deformation is only considered in the struck ship. The striking ship bow isassumed to be rigid.
Penetration of the struck ship begins with the side shell plating and webs (verticalstructures). Fig. 3 illustrates the two basic types of strike determined by the strikelocation relative to the webs.
In this analysis:
* Plastic bending of shell plating is not considered. The contribution of plasticbending in the transverse deformation of longitudinally stiffened hull platesis negligible. The sample calculation sheets in Rosenblatt [8] support thisargument. In six test cases, the energy absorbed in plastic bending never exceeds0.55% of the total absorbed energy when the cargo boundary is ruptured. It is agood assumption that the plastic membrane tension phase starts from thebeginning of collision penetration and is the primary shell energy-absorptionmechanism.
* Rupture of stiffened hull plates starting in the stiffeners is not considered. Thismechanism is unlikely for most structures except for flat-bar stiffened plates. It isa standard practice to use angles or bulbs instead of flat bar for longitudinalstiffeners of side shell and longitudinal bulkheads, therefore, this option is notconsidered in SIMCOL.
Web frames acting as a vertical beamdistort in bending, shear or compression
Strike at webframe
Strike betweenweb frame
Analyze each shellseparately
consistent withweb deformation.
Analyze each shellseparately with
nodes consistentwith web
deformation.
Fig. 3. Web deformation in SIMCOL 2.0 [8].
A.J. Brown / Marine Structures 15 (2002) 335–364 341

* Web frames do not yield or buckle before plates load in membrane tension.McDermott [9] demonstrates that this mechanism is unlikely and does notcontribute significantly to absorbed energy in any case. This mechanism requiresvery weak web frames that would not be sufficient to satisfy normal sea andoperational loads.
SIMCOL Version 1.1 assumes that flanking web frames are rigid. Version 2.0and subsequent versions used for this paper consider the transverse deformationof webs. In a right-angle collision case, Eq. (10) gives the total plastic energyabsorbed in membrane tension in time step n: This assumes that the plate is notruptured, that flanking webs do not deflect in the longitudinal direction, and thatcompression in the side shell caused by longitudinal bending of the ship hull girder issmall:
En ¼ Tmetn;
Tm ¼ smtBe;ð10Þ
where En is the plastic energy absorbed by side shell or longitudinal bulkhead (J), Tm
the membrane tension (N), sm the yield stress of side shell or bulkhead adjusted forstrain rate (Pa), etn the total elongation of shell or bulkhead structure betweendamaged webs, t the smeared thickness of side shell or bulkhead plating andstiffeners (m), and Be the effective breadth (height) of side shell or bulkhead (m).
Fig. 4 illustrates the membrane geometry for calculation of elongation. e1 and e2are the elongation of legs L1 and L2; respectively:
ei ¼ffiffiffiffiffiffiffiffiffiffiffiffiffiffiffiffiffiL2
i þ w2
q� LiD
w2
2Li
;
et ¼ e1 þ e2 ¼Ld
2L1L2w2 ð11Þ
and Ld is the distance between adjacent webs (m), and wn the transverse deflection attime step n (m).
Fig. 4. Membrane geometry [8].
A.J. Brown / Marine Structures 15 (2002) 335–364342

Side shell rupture due to membrane tension is predicted using the followingcriteria:
* the strain in the side shell reaches the rupture strain, er; taken as 10% in ABS steel;or
* the bending angle at a support reaches the critical value as defined in the followingequation [8]:
em ¼4
3
sm
su � sm cos yc
sin yc tan yc ¼ 1:5D; ð12Þ
where, em is the maximum bending and membrane-tension strain to rupture, sm
the membrane-tension in-plate stress (MPa), su the ultimate stress of the plate(MPa), yc the critical bending angle, and D the tension test ductility.
The resistance of the membrane is only considered up to the point of rupture:
ei ¼ei
Li
per;
ybi ¼1
2arctan
w
Li
Dw
2Li
pyc; ð13Þ
where ei is the strain in leg i; and ybi the bending angle of flanking web frames.Since the striking bow normally has a generous radius, the bending angle at the
impact location is not considered in the rupture criteria. From these equations, it isseen that only the strain and bending angle in the shorter leg need to be consideredfor right angle collisions. Based on material properties of ABS steel, the criticalbending angles yc from Eq. (12) are 19.8961, 17.3181 or 16.8121 for MS, H32 or H36grades, respectively. Once either of the rupture criteria is reached, the side shell orlongitudinal bulkhead is considered ruptured and does not continue to contribute tothe reacting force.
N - reacting forcecomponent normal tostruck ship
Theoretical resultantneglecting propagation ofyielded zone
Theoretical resultantconsidering propagationof yielded zone
Ff - nominal frictionFR - force required topropagate yielded zone
T1 – tension in leg L1
T2 – tension in leg L2
Fig. 5. Oblique collision force diagram [9].
A.J. Brown / Marine Structures 15 (2002) 335–364 343

For collisions at an oblique angle, the membrane tension is only fully developed inthe leg behind the strike, L2 in Fig. 4. This is demonstrated in the force diagramshown in Fig. 5, where T1 is much smaller than T2: It is also assumed that all thestrain developed from membrane tension is behind the striking point. Therefore, thefirst rupture criterion in Eq. (13) becomes
eb ¼et
Lb
per; ð14Þ
where eb and Lb represent the strain and length of the leg behind the striking. InFig. 4, they are e2 and L2; respectively.
In SIMCOL Version 2.0 and later, transverse deformation of web frames is alsoconsidered. Web failure modes include bending, shear, and compression. Webframes allow transverse deformation while keeping their longitudinal locations. Theresisting force is assumed constant at a distorted flanking web frame, and thetransverse deformation of the web frame is assumed uniform from top to bottom.The magnitude of this force is its maximum elastic capacity. From Fig. 5, the appliedforce on a rigid flanking web frame is
Pi ¼ Ti
w
Li
; ð15Þ
where Pi and Ti are referred to the particular leg Li: If the applied force, Pi; is greaterthan the maximum elastic capacity of the flanking web, Pwf ; the particular web frameis deformed as shown in Fig. 6.
The change of angle, gc; at the distorted web is then
gciDPwf
Ti
: ð16Þ
Rosenblatt [8] proposed an approach to determine whether Pi exceeds the capacityPwf ; and to estimate the value of Pwf : First, the allowable bending moment and shearforce of the web frame at each support, the crushing load of the web, and thebuckling force of supporting struts are calculated. Then, the load Pi is applied to theweb frame, and the induced moments, shear forces and compression of the webframe and struts are calculated, considering the web frame as a beam with clampedends. The ratios of the induced loads to the allowable loads are determined using
Pwf
w1
w
L1 L2 Ls
γc
Fig. 6. Deflection and forces in web frames [8].
A.J. Brown / Marine Structures 15 (2002) 335–364344

Eq. (17). If the maximum ratio, Rm; is greater than unity, the load, P; exceeds thecapacity, and the web frame deforms. Rm is also used to estimate the number ofdistorted web frames:
Rm ¼P
Pwf: ð17Þ
The deflection at the outermost distorted web is
wn ¼Ls
Li þ nLs
w � gc2 nLi þ1
2ðn � 1ÞnLs
� �; ð18Þ
where n is the number of deformed web frames on Li side and Ls the web framespacing (m).
The deflection at other deformed web frames is
wj ¼ ðn � j þ 1Þwn þ1
2ðn � jÞðn � j þ 1Þgc2Ls; ð19Þ
where j is the number of webs counted from the striking point. The elongation inadjacent webs is
ej ¼ffiffiffiffiffiffiffiffiffiffiffiffiffiffiffiffiffiffiffiffiffiffiffiffiffiffiffiffiffiffiffiffiffiffiffiffiðwj � wjþ1Þ
2 þ L2s
q� Ls ð20Þ
and the elongation in the struck web is
e0i ¼ffiffiffiffiffiffiffiffiffiffiffiffiffiffiffiffiffiffiffiffiffiffiffiffiffiffiffiffiffiffiffiðw � w1Þ
2 þ L2i
q� Li: ð21Þ
With these elongation and deformation results, the rupture criteria given in Eqs. (13)and (14) are applied to all deformed webs. The total elongation on the Li side is
eti ¼ e0i þXn
j¼1
eji ð22Þ
and the energy absorbed in membrane tension and web deformation is
Ei ¼ Tieti þ Pwf
Xn
j¼1
wji: ð23Þ
For right angle collisions, Ti always equals Tm as calculated in Eq. (10). In obliqueangle collisions, Ti equals Tm if Li is on the side behind the strike. Based onexperimental data, Rosenblatt [8] suggests using 1=2Tm ahead of the strike and this isused in SIMCOL 2.1.
For double hull ships, if the web frames are distorted because of bending, shearingand buckling of supporting struts, the deformed web frames push the inner skin intomembrane tension as shown in Fig. 3, and the right angle collision mechanism isapplied to the inner hull. Inner skin integrity is checked using Eqs. (13) and (14), andthe energy absorbed in inner skin membrane tension is calculated using Eq. (10).
In the simulation, the energy absorbed in membrane tension and web deformationduring the time step is
DKEn ¼ ðE1;nþ1 þ E2;nþ1Þ � ðE1n þ E2;nÞ: ð24Þ
A.J. Brown / Marine Structures 15 (2002) 335–364 345

Considering the friction force, Ff ; shown in Fig. 5, and assuming the dynamiccoefficient of friction is a constant value of 0.15, the reacting forces and momentsare:
DKEn ¼ Nnðwnþ1 � wnÞ þ Ffnjlnþ1 � lnj ¼ N½ðwnþ1 � wnÞ þ 0:15jlnþ1 � lnj�;
FZn ¼ Nn ¼ðE1;nþ1 þ E2;nþ1Þ � ðE1n þ E2;nÞðwnþ1 � wnÞ þ 0:15jlnþ1 � lnj
;
Fxn ¼ Ff
ðlnþ1 � lnÞjlnþ1 � lnj
¼ 0:15FZn
ðlnþ1 � lnÞjlnþ1 � lnj
;
Mn ¼ �Fxndn þ FZnln: ð25Þ
In addition to the friction force, another longitudinal force, FR; the force topropagate the yielding zone, is considered, as shown in Fig. 5. McDermott [9]provides an expression for this force:
FR ¼syd 0
Rd 0tw 1�
syR
d 0E
� �2
þtf ðb � twÞd 0 � 0:5tf
d 0 �syR
d 0E
� �" #; ð26Þ
where d 0 is the depth of side shell longitudinal stiffeners, R the radius of the strikingbow, tw the thickness of side shell stiffener webs, tf the thickness of side shell stiffenerflanges, b the width of side shell stiffener flanges, and E the modulus of elasticity, or
cF ¼FR
syAstiff;
cA ¼Astiff
Atotal;
FR ¼ cF cAsytB; ð27Þ
where cF is the force coefficient, cA the ratio of sectional areas, Astiff the sectionalarea of stiffeners, and Atotal the total sectional area of stiffeners and their attachedplate.
The full implementation of Eq. (26) requires structural details that are not appropriatefor a simplified analysis so Eq. (27) is used in this study. Based on a sampling of typicalside shell scantlings, cF cA is assumed to have a constant value of 0.025.
Since FR also effects membrane tension energy, Eq. (25) becomes
DKEn ¼ FZn½ðwnþ1 � wnÞ þ 0:15jlnþ1 � lnj þ FRðlnþ1 � lnÞ;
FZn ¼ðE1;nþ1 þ E2;nþ1Þ � ðE1n þ E2;nÞ � FRðlnþ1 � lnÞ
ðwnþ1 � wnÞ þ 0:15jlnþ1 � lnj;
Fxn ¼ ðFR þ 0:15FZnÞðlnþ1 � lnÞjlnþ1 � lnj
;
Mn ¼ �Fxndn þ FZnln: ð28Þ
The Internal Sub-Model determines absorbed energy and forces from the crushingand tearing of decks, bottoms and stringers (horizontal structures) in a simplifiedmanner using the Minorsky [10] correlation as modified by Reardon and Sprung[11].
A.J. Brown / Marine Structures 15 (2002) 335–364346

V.U. Minorsky conducted the first and best known of the empirical collisionstudies based on actual data. His method relates the energy dissipated in a collisionevent to the volume of damaged structure. Actual collisions in which ship speeds,collision angle, and extents of damage are known were used to empirically determinea linear constant. This constant relates damage volume to energy dissipation. In theoriginal analysis the collision is assumed to be totally inelastic, and motion is limitedto a single degree of freedom. Under these assumptions, a closed form solution fordamaged volume can be obtained. With additional degrees of freedom, a time-stepped solution must be used.
Step 2 in the collision simulation process calculates damaged area and volume inthe struck ship given the relative motion of the two ships in a time step calculated inStep 1 by the External Sub-Model. Fig. 7 illustrates the geometry of the sweepingsegment method used for this calculation in SIMCOL Version 2.1.
The intrusion portion of the bow is described with five nodes, as shown in Fig. 7.The shaded area in Fig. 7 shows the damaged area of decks and/or bottoms duringthe time step. Coordinates of the five nodes in the x2Z system at each time step arederived from the penetration and location of the impact, the collision angle, f; andthe half entrance angle, a; of the striking bow.
The damaged plating thickness t is the sum thickness of deck and/or bottomstructures that are within the upper and lower extents of the striking bow. Given thedamaged material volume, the Minorsky force is calculated based on the followingassumptions:
* The resistant force acting on each out-sweeping segment is in the oppositedirection of the average movement of the segment.
* The force exerted on the struck ship is in the direction of this average movement.
Fig. 7. Sweeping segment method.
A.J. Brown / Marine Structures 15 (2002) 335–364 347
* The work of the resistant force is done over the distance of this averagemovement.
* The total force on each segment acts through the geometric center of the sweepingarea.
The energy absorbed is then
DKE1;n ¼ 47:1� 106RT1;n ¼ 47:1� 106A1;nt; ð29Þ
where DKE is the kinetic energy absorbed by decks, bottoms and stringers (J), RT thedamaged volume of structural members (m3), A the damaged area of the decks orbottoms swept by each bow segment (m2), and t the total thickness of impacteddecks or bottoms (m).
Forces and moments acting on other segments are calculated similarly. The totalexerted force, Fn; is the sum of the forces and moments on each segment:
Fn ¼X4
i¼1
fFxi;n;FZi;n;Mi;ng: ð30Þ
These forces are added to the side shell, bulkhead and web forces. Internal forcesand moments are calculated for the struck ship in the local coordinate system, i.e. thex2Z system, and converted to the global system. The forces and moments on thestriking ship have the same magnitude and the opposite direction of those acting onthe struck ship.
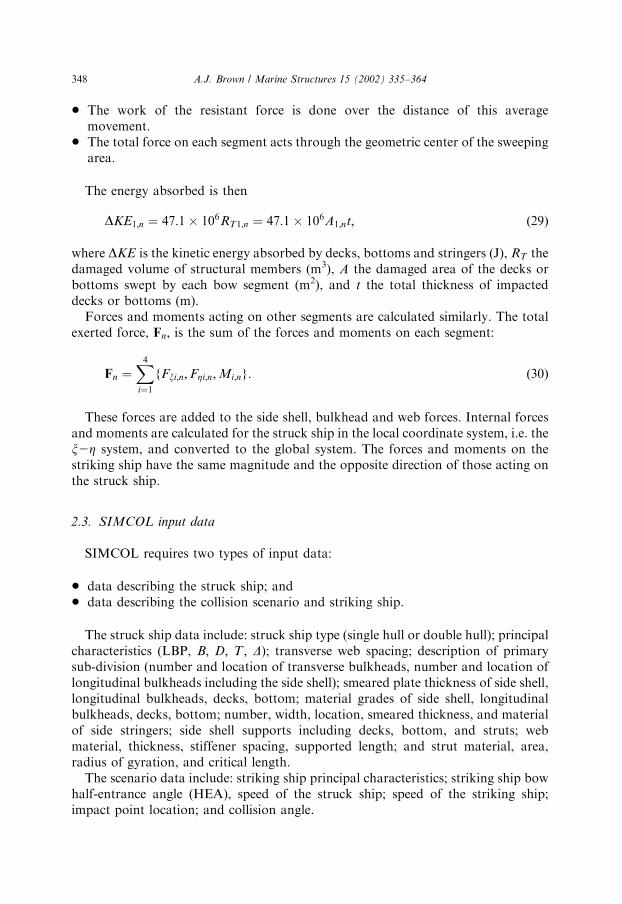
2.3. SIMCOL input data
SIMCOL requires two types of input data:
* data describing the struck ship; and* data describing the collision scenario and striking ship.
The struck ship data include: struck ship type (single hull or double hull); principalcharacteristics (LBP, B; D; T ; D); transverse web spacing; description of primarysub-division (number and location of transverse bulkheads, number and location oflongitudinal bulkheads including the side shell); smeared plate thickness of side shell,longitudinal bulkheads, decks, bottom; material grades of side shell, longitudinalbulkheads, decks, bottom; number, width, location, smeared thickness, and materialof side stringers; side shell supports including decks, bottom, and struts; webmaterial, thickness, stiffener spacing, supported length; and strut material, area,radius of gyration, and critical length.
The scenario data include: striking ship principal characteristics; striking ship bowhalf-entrance angle (HEA), speed of the struck ship; speed of the striking ship;impact point location; and collision angle.
A.J. Brown / Marine Structures 15 (2002) 335–364348

3. Collision scenarios
The collision scenario is described using random variables. Two primary datasources are used to determine the probabilities and probability density functionsnecessary to define these random variables:
* Sandia Report [12]; and* Lloyd’s Worldwide Ship data [13].
The Sandia Report considers collision data from four sources:
* Lloyd’s Casualty Data for 1973–1993—contains 30,000 incident reports of which1947 were ship-to-ship collision events, 702 of which occurred in ports. These datawere used primarily to estimate the probability and geographical location ofcollisions and fires that could harm nuclear flasks. It did not include specificscenario and technical data. It is not directly applicable to collision scenarios.
* ORI Analysis [14]—includes a summary of data from cargo vessel accidents in1974 and 1975 for 78,000 transits of ships over 5000 gross tons. Most of this datais from the USCG Commercial Vessel Casualty File. It includes 216 collisions forships in US waters or US ships in international waters. Eight collisions of tankersand cargo ships and other tanker accidents from the ECO World Tanker Accidentfile are also included. This totals 1122 cargo ship accidents. One hundred andfifteen are struck cargo ship collisions with more than 90% of these in inland andcoastal waters. The study addresses the probability of various accident types.
* ORI Analysis [15]—this study uses the same data as the ORI (1980) Study. Itincludes the probability of striking ship displacement, speed, collision angle andcollision location for struck cargo ship collisions.
* Engineering Computer Optecnomics, Inc. World Fleet Data [14].
Applicable subsets of this data are described here. In this paper, pdfs generatedfrom this data are used to develop 10,000 collision cases that are applied to fourstruck tanker designs, for a total of 40,000 SIMCOL runs. SIMCOL calculatesdamage penetration, damage length, oil outflow and absorbed energy for each ofthese runs.
3.1. Collision event variables
Collision event variables are not expected to be fully independent, but theirinterdependence is difficult to quantify because of limited collision data. Fig. 8provides a framework for defining the relationship of scenario variables. Availabledata are incomplete to fully quantify this relationship. Strike location must often beinferred from the damage description because reliable records of the precise locationare not available. Ship headings and speeds prior to the collision are often includedin accident reports, but collision angle and ship speed at the moment of collision arefrequently not included or only estimated and described imprecisely.
A.J. Brown / Marine Structures 15 (2002) 335–364 349
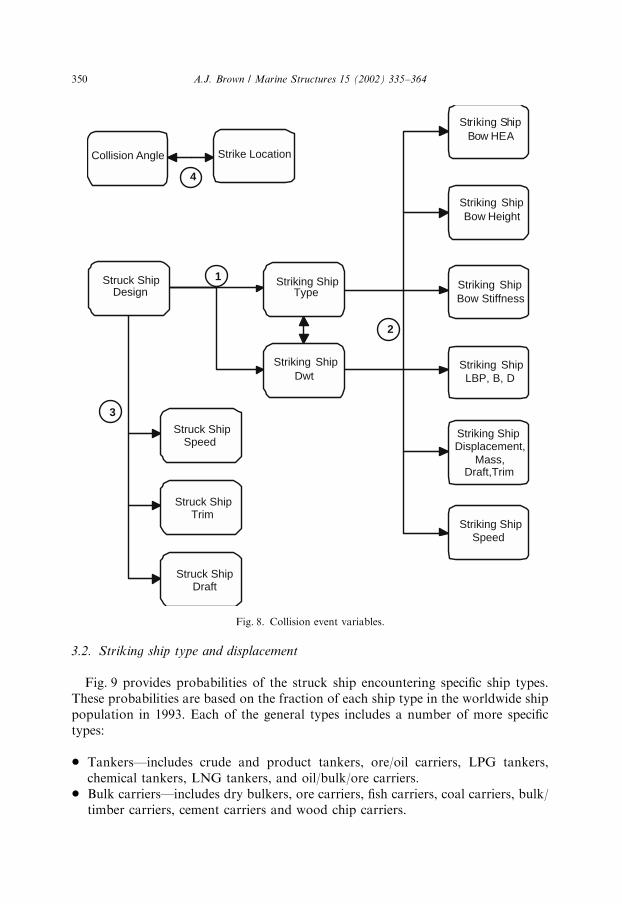
3.2. Striking ship type and displacement
Fig. 9 provides probabilities of the struck ship encountering specific ship types.These probabilities are based on the fraction of each ship type in the worldwide shippopulation in 1993. Each of the general types includes a number of more specifictypes:
* Tankers—includes crude and product tankers, ore/oil carriers, LPG tankers,chemical tankers, LNG tankers, and oil/bulk/ore carriers.
* Bulk carriers—includes dry bulkers, ore carriers, fish carriers, coal carriers, bulk/timber carriers, cement carriers and wood chip carriers.
Striking Ship
Striking Ship
Striking Ship Bow HEA
Striking Ship
Striking Ship
Striking Ship
Striking Ship
Striking Ship
Collision Angle Strike Location
Struck Ship
Struck Ship
1
3
2
4
Design Type
Dwt
Bow Height
Bow Stiffness
LBP, B, D
Displacement,Mass,
Draft,Trim
Speed
Speed
Struck Ship Trim
Struck Ship Draft
Fig. 8. Collision event variables.
A.J. Brown / Marine Structures 15 (2002) 335–364350

* Cargo vessels (break bulk/freighters)—includes general freighters and refrigeratedfreighters.
* Passenger—includes passenger and combo passenger/cargo ships.* Containerships—includes containerships, car carriers, container/RO-ROs,
ROROs, bulk/car carriers, and bulk/containerships.
It is likely that particular ships are more likely to meet ships of the same type sincethey travel the same routes, but this relationship could not be established withavailable data. Additional collision data must be obtained to establish thisrelationship.
Fig. 10 shows the worldwide distributions of displacement for these shiptypes. The distributions are significantly different and must be applied individually
0.252
0.176
0.424
0.014
0.135
0.500
0.450
0.400
0.350
0.300
0.250
0.200
0.150
0.100
0.050
0.000
all tankers bulk cargo freighters passenger ships
container ships
Pro
bab
ility
Fig. 9. Striking ship type probability.
0.08
0.07
0.06
0.05
0.04
0.03
0.02
0.01
0.000 20 40 60 80 100
kDWT (MT)
pd
f
All Tankers
Bulk Cargo
Freighters
Passenger
Container
Fig. 10. Striking ship displacement, worldwide.
A.J. Brown / Marine Structures 15 (2002) 335–364 351

to each ship type. Weibull density function a and b values for each distribution areprovided in Table 2.
Collision speed is the striking ship speed at the moment of collision. It is notnecessarily related to service speed. It depends primarily on actions taken just priorto collision. Collision speed data are collected from actual collision events. Fig. 11 isa plot of data derived from the Sandia Report [12] and limited USCG tanker-collision data [16]. An approximate Weibull distribution (a ¼ 2:2; b ¼ 6:5) is fit tothis data. The mean of this distribution is substantially less than service speed (s),and indicates significant adjustment in speed prior to the actual collision event.
3.3. Striking ship principal characteristics
In this section, data and regression curves are presented for deriving strikingship HEA, length, beam, draft, and bow height from striking ship type anddisplacement.
Bow HEA is not a standard ship principal characteristic. A limited number of bowdrawings were reviewed in the Sandia Study. Table 3 provides single values derivedfrom this study for each type of ship. These values are used in this study.
Table 2
Striking ship type and displacement
Ship type Probability of encounter Weibull a Weibull b Mean (kMT) s (kMT)
Tanker 0.252 0.84 11.2 12.277 14.688
Bulk carrier 0.176 1.20 21.0 19.754 16.532
Cargo 0.424 2.00 11.0 9.748 5.096
Passenger 0.014 0.92 12.0 12.479 13.579
Container 0.135 0.67 15.0 19.836 30.52
0
0.05
0.1
0.15
0.2
0.25
0 5 10 15 20
Striking ship speed (knts)
pd
f
Sandia Cargo Ships
Weibull(2.5,4.7)
USCG Tankers, 1992-pres
Fig. 11. Striking ship speed.
A.J. Brown / Marine Structures 15 (2002) 335–364352

Lloyd’s worldwide data [13] are used to specify the remaining principalcharacteristics as a function of ship type and displacement. Typical principalcharacteristic data are plotted in Fig. 12. These data are fit to a power function of theform: y ¼ Cxa; where x is displacement in ton. Table 3 provides values forcoefficients and powers used in these equations.
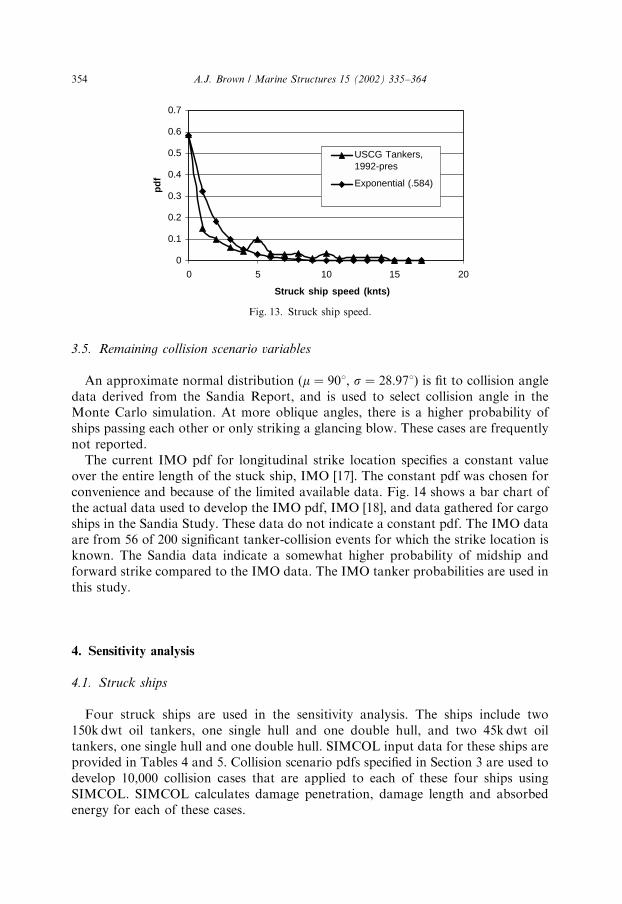
3.4. Struck ship variables
Fig. 13 is a plot of struck ship speed derived from the USCG tanker collision data.The struck ship collision speed distribution is also very different from service speed.Struck ships are frequently moored or at anchor as is indicated by the significant pdfvalue at zero speed. An exponential distribution (a ¼ 0:584) is fit to this data. Fullload displacement and draft with zero trim are assumed for the struck ship in thispaper.
y = 7.473x0.3184
R2 = 0.9837
0
50
100
150
200
250
300
350
400
450
500
0 50000 100000 150000 200000 250000 300000
Displacement (tonne)
LB
P (
m)
Fig. 12. Tankers length versus displacement.
Table 3
Striking ship characteristics (y ¼ Cxa where x is displacement in ton)
Ship type LBP (m) Beam (m) Draft (m) Bow height (m) HEA
C a C a C a C A
Tanker 7.47 0.318 1.15 0.321 0.574 0.297 0.671 0.320 38
Bulk carrier 6.6 0.332 0.96 0.336 0.547 0.303 1.31 0.261 20
Freighter 6.93 0.325 1.72 0.273 0.474 0.320 0.741 0.321 20
Passenger ship 8.22 0.299 1.97 0.256 0.889 0.210 1.13 0.258 17
Container ship 5.49 0.353 1.96 0.265 0.596 0.284 0.746 0.317 17
A.J. Brown / Marine Structures 15 (2002) 335–364 353
3.5. Remaining collision scenario variables
An approximate normal distribution (m ¼ 901, s ¼ 28:971) is fit to collision angledata derived from the Sandia Report, and is used to select collision angle in theMonte Carlo simulation. At more oblique angles, there is a higher probability ofships passing each other or only striking a glancing blow. These cases are frequentlynot reported.
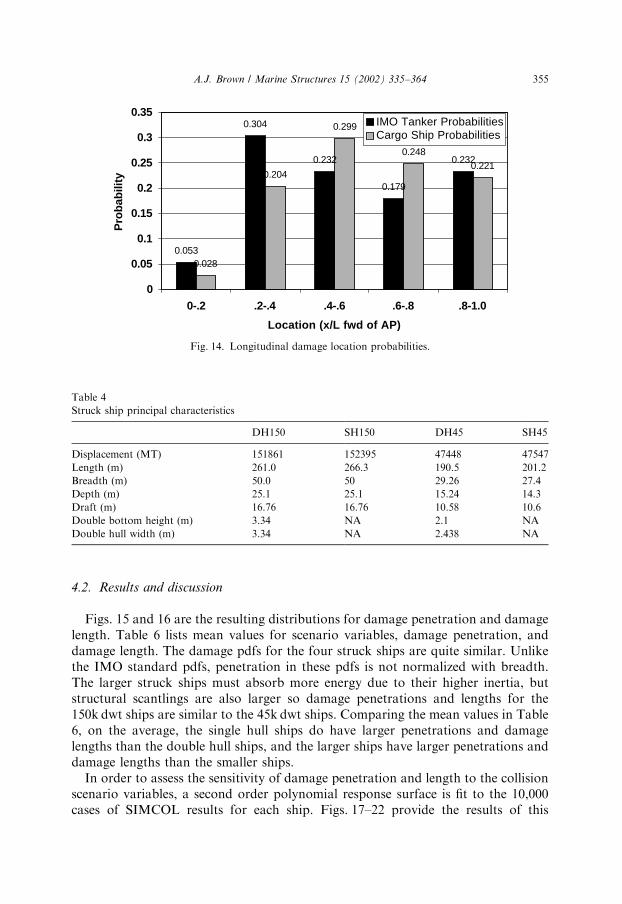
The current IMO pdf for longitudinal strike location specifies a constant valueover the entire length of the stuck ship, IMO [17]. The constant pdf was chosen forconvenience and because of the limited available data. Fig. 14 shows a bar chart ofthe actual data used to develop the IMO pdf, IMO [18], and data gathered for cargoships in the Sandia Study. These data do not indicate a constant pdf. The IMO dataare from 56 of 200 significant tanker-collision events for which the strike location isknown. The Sandia data indicate a somewhat higher probability of midship andforward strike compared to the IMO data. The IMO tanker probabilities are used inthis study.
4. Sensitivity analysis
4.1. Struck ships
Four struck ships are used in the sensitivity analysis. The ships include two150k dwt oil tankers, one single hull and one double hull, and two 45k dwt oiltankers, one single hull and one double hull. SIMCOL input data for these ships areprovided in Tables 4 and 5. Collision scenario pdfs specified in Section 3 are used todevelop 10,000 collision cases that are applied to each of these four ships usingSIMCOL. SIMCOL calculates damage penetration, damage length and absorbedenergy for each of these cases.
0
0.1
0.2
0.3
0.4
0.5
0.6
0.7
0 5 10 15 20
Struck ship speed (knts)
pd
fUSCG Tankers,1992-pres
Exponential (.584)
Fig. 13. Struck ship speed.
A.J. Brown / Marine Structures 15 (2002) 335–364354
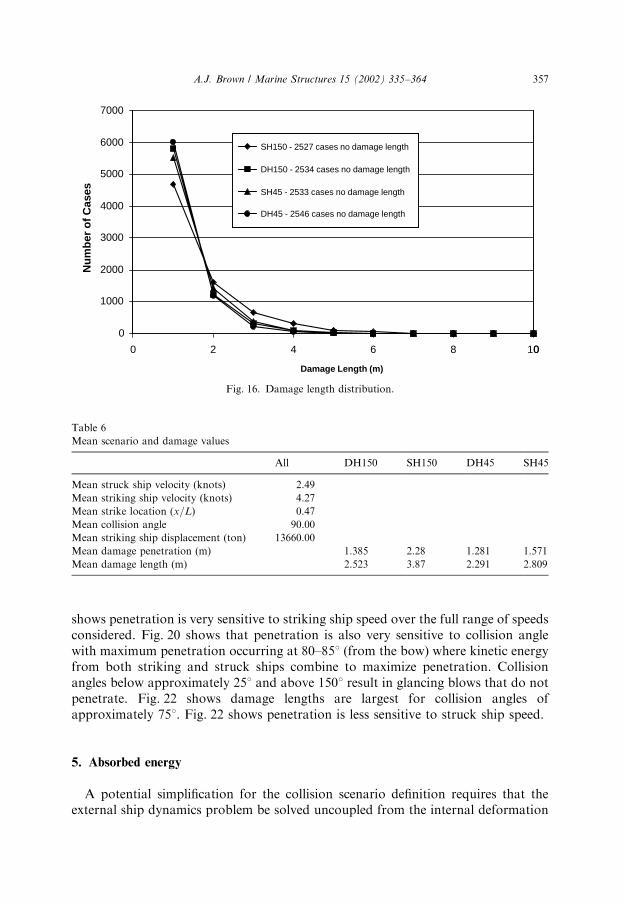
4.2. Results and discussion
Figs. 15 and 16 are the resulting distributions for damage penetration and damagelength. Table 6 lists mean values for scenario variables, damage penetration, anddamage length. The damage pdfs for the four struck ships are quite similar. Unlikethe IMO standard pdfs, penetration in these pdfs is not normalized with breadth.The larger struck ships must absorb more energy due to their higher inertia, butstructural scantlings are also larger so damage penetrations and lengths for the150k dwt ships are similar to the 45k dwt ships. Comparing the mean values in Table6, on the average, the single hull ships do have larger penetrations and damagelengths than the double hull ships, and the larger ships have larger penetrations anddamage lengths than the smaller ships.
In order to assess the sensitivity of damage penetration and length to the collisionscenario variables, a second order polynomial response surface is fit to the 10,000cases of SIMCOL results for each ship. Figs. 17–22 provide the results of this
0.053
0.304
0.232
0.179
0.232
0.028
0.204
0.299
0.2480.221
0
0.05
0.1
0.15
0.2
0.25
0.3
0.35
0-.2 .2-.4 .4-.6 .6-.8 .8-1.0
Location (x/L fwd of AP)
Pro
bab
ility
IMO Tanker ProbabilitiesCargo Ship Probabilities
Fig. 14. Longitudinal damage location probabilities.
Table 4
Struck ship principal characteristics
DH150 SH150 DH45 SH45
Displacement (MT) 151861 152395 47448 47547
Length (m) 261.0 266.3 190.5 201.2
Breadth (m) 50.0 50 29.26 27.4
Depth (m) 25.1 25.1 15.24 14.3
Draft (m) 16.76 16.76 10.58 10.6
Double bottom height (m) 3.34 NA 2.1 NA
Double hull width (m) 3.34 NA 2.438 NA
A.J. Brown / Marine Structures 15 (2002) 335–364 355

analysis. In each of the figures, the other collision scenario variables are assigned themean values listed in Table 6.
Fig. 17 shows a very significant increase in damage penetration as a function ofstriking ship displacement with diminishing increases above 40k ton. The variationwith strike location (Fig. 18) is much less with smaller penetrations for strikes awayfrom midships where more striking energy is converted to struck ship yaw. Fig. 19
Table 5
Stuck ship structural characteristics
DH150 SH150 DH45 SH45
Web frame spacing (mm) 5.2 5.2 3.505 3.89
Smeared deck thickness (mm) 29.4 28.2 27.6 30.5
Smeared inner bottom thickness (mm) 37.1 NA 27.8 NA
Smeared bottom thickness (mm) 36.6 44.2 34 38.5
Smeared stringer thickness (mm) 14.9 NA NA NA
Smeared side shell thickness (mm) 26.7 27.8 24.5 23.6
Smeared inner side thickness (mm) 28.1 NA 20.1 NA
Smeared long bhd thickness (mm) 25.1 24.5 20 33.4
Smeared upper web thickness 12.5 12.5 12.7 19
Smeared lower web thickness 14.5 16 12.7 19
0
500
1000
1500
2000
2500
3000
0 5 10 15 20 25
Maximum Penetration (m)
Nu
mb
er o
f Cas
es
SH150 - 2522 cases no penetration
DH150 - 2533 cases no penetration
SH45 - 2530 cases no penetration
DH45 - 2545 cases no penetration
Fig. 15. Damage penetration distribution given penetration.
A.J. Brown / Marine Structures 15 (2002) 335–364356
shows penetration is very sensitive to striking ship speed over the full range of speedsconsidered. Fig. 20 shows that penetration is also very sensitive to collision anglewith maximum penetration occurring at 80–851 (from the bow) where kinetic energyfrom both striking and struck ships combine to maximize penetration. Collisionangles below approximately 251 and above 1501 result in glancing blows that do notpenetrate. Fig. 22 shows damage lengths are largest for collision angles ofapproximately 751. Fig. 22 shows penetration is less sensitive to struck ship speed.
5. Absorbed energy
A potential simplification for the collision scenario definition requires that theexternal ship dynamics problem be solved uncoupled from the internal deformation
0
1000
2000
3000
4000
5000
6000
7000
0 2 4 6 8 100
Damage Length (m)
Nu
mb
er o
f Cas
es
SH150 - 2527 cases no damage length
DH150 - 2534 cases no damage length
SH45 - 2533 cases no damage length
DH45 - 2546 cases no damage length
Fig. 16. Damage length distribution.
Table 6
Mean scenario and damage values
All DH150 SH150 DH45 SH45
Mean struck ship velocity (knots) 2.49
Mean striking ship velocity (knots) 4.27
Mean strike location (x=L) 0.47
Mean collision angle 90.00
Mean striking ship displacement (ton) 13660.00
Mean damage penetration (m) 1.385 2.28 1.281 1.571
Mean damage length (m) 2.523 3.87 2.291 2.809
A.J. Brown / Marine Structures 15 (2002) 335–364 357

problem. This allows multiple collision scenario random variable definitions to bereplaced by pdfs for transverse and longitudinal absorbed energy only. This sectionexamines the validity of this simplification.
5.1. Absorbed energy calculation
Pedersen and Zhang [19] derive expressions for absorbed energy uncoupled frominternal mechanics. Collision absorbed energies in the x (transverse) direction and Z
0
0.5
1
1.5
2
2.5
3
0 0.2 0.4 0.6 0.8 1
Strike Location (x/L)
Pen
etra
tio
n (
met
ers)
DH45
SH45
SH150
DH150
Fig. 18. Penetration versus strike location.
0
1
2
3
4
5
6
7
0 20 400 60 80 100 120
Striking Ship Displacement (tonne)
Pen
etra
tio
n (
met
ers)
DH45
SH45
DH150
SH150
Fig. 17. Penetration versus striking ship displacement.
A.J. Brown / Marine Structures 15 (2002) 335–364358
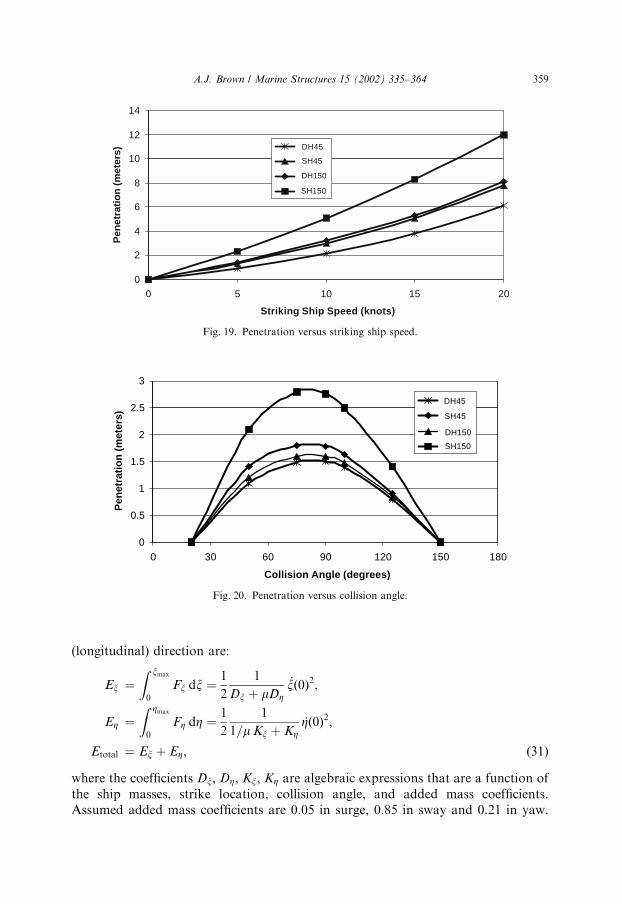
(longitudinal) direction are:
Ex ¼Z xmax
0
Fx dx ¼1
2
1
Dx þ mDZ
’xð0Þ2;
EZ ¼Z Zmax
0
FZ dZ ¼1
2
1
1=m Kx þ KZ’Zð0Þ2;
Etotal ¼ Ex þ EZ; ð31Þ
where the coefficients Dx; DZ; Kx; KZ are algebraic expressions that are a function ofthe ship masses, strike location, collision angle, and added mass coefficients.Assumed added mass coefficients are 0.05 in surge, 0.85 in sway and 0.21 in yaw.
0
2
4
6
8
10
12
14
0 5 10 15 20
Striking Ship Speed (knots)
Pen
etra
tio
n (
met
ers) DH45
SH45
DH150
SH150
Fig. 19. Penetration versus striking ship speed.
0
0.5
1
1.5
2
2.5
3
0 30 60 90 120 150 180
Collision Angle (degrees)
Pen
etra
tio
n (
met
ers)
DH45
SH45
DH150
SH150
Fig. 20. Penetration versus collision angle.
A.J. Brown / Marine Structures 15 (2002) 335–364 359

These values correspond with an intermediate collision-impact duration. Z dotð0Þand x dotð0Þ are the relative longitudinal and transverse velocities between the twoships just prior to impact. Eq. (30) assumes that the two ships stick together onimpact. Whether the two ships slide or stick is determined by the ratio of transverseto longitudinal force impulses at impact. If this ratio exceeds the coefficient of staticfriction, it is assumed that the two ships slide. The impulse ratio at impact is assumedto be constant for the entire process.
Absorbed energy in SIMCOL is calculated by multiplying transverse force bytransverse displacement and longitudinal force by longitudinal displacement for eachtime step, and then summing for all time steps until the end of the collision event.The relationship between longitudinal and transverse forces is very dependent on theinternal deformation of the structure and their relationship varies from time step totime step as the struck ship is penetrated.
0
0.5
1
1.5
2
2.5
3
3.5
4
4.5
5
0 30 60 90 120 150 180
Collision Angle (degrees)
Dam
ag
e L
en
gth
(m
ete
rs) DH45
SH45
DH150
SH150
Fig. 21. Damage length versus collision angle.
0
0.5
1
1.5
2
2.5
3
3.5
0 5 10 15 20
Struck Ship Speed (knots)
Pen
etra
tio
n (
met
ers)
DH45
SH45
DH150
SH150
Fig. 22. Penetration versus struck ship speed.
A.J. Brown / Marine Structures 15 (2002) 335–364360
y = 0.9737x - 49163
R2 = 0.9949
4.E+08
3.E+08
2.E+08
1.E+08
0.E+00
0.E+00 5.E+07 1.E+08 2.E+08 2.E+08 3.E+08 3.E+08 4.E+08 4.E+08
Coupled Solution Total Absorbed Energy (Joules)
Ped
erse
n &
Zh
ang
To
tal E
ner
gy
(Jo
ule
s)
Fig. 23. Total absorbed energy.
0.E+00
1.E+08
2.E+08
3.E+08
4.E+08
0.E+00 1.E+08 2.E+08 3.E+08 4.E+08
Coupled Solution Transverse Absorbed Energy (Joules)
Ped
erse
n &
Zh
ang
Tra
nsv
erse
Ab
sorb
ed E
ner
gy
(Jo
ule
s)
y = 0.8747x + 10453 R2 = 0.981
Fig. 24. Transverse absorbed energy.
A.J. Brown / Marine Structures 15 (2002) 335–364 361

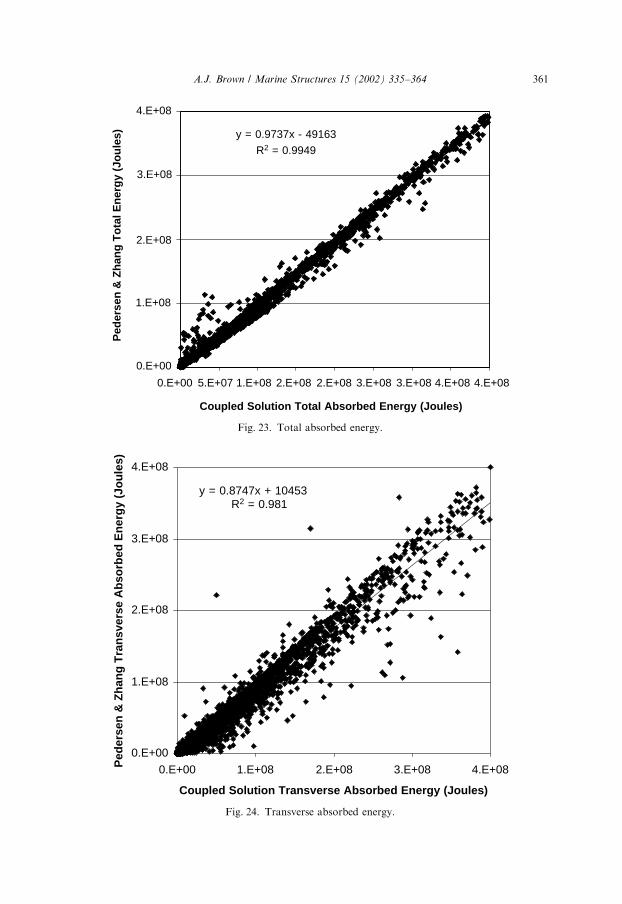
5.2. Absorbed energy results and discussion
Figs. 23–25 compare absorbed energy calculated using the Pedersen andZhang method to energy calculated using SIMCOL. Total absorbed energy shownin Fig. 23 is very similar in the two cases, particularly considering the significantdifference in the two methods. The longitudinal and transverse components showa larger difference, particularly in the longitudinal direction. This may resultfrom differences in structural resistance in the transverse and longitudinaldirections, which in SIMCOL varies during the collision process. The difference inlongitudinal absorbed energy is potentially significant because once the structure ispenetrated, longitudinal damage extent determines the number of compartments thatare opened to the sea. This has a significant effect on damage stability and oiloutflow.
6. Conclusions and recommendations
An accurate definition of collision scenario random variables is essential forpredicting collision damage penetration and length. Probabilistic damage extents are
0.0E+00
2.0E+07
4.0E+07
6.0E+07
8.0E+07
1.0E+08
1.2E+08
1.4E+08
0.0E+00 2.0E+07 4.0E+07 6.0E+07 8.0E+07 1.0E+08 1.2E+08 1.4E+08
Coupled Solution Longitudinal Absorbed Energy (Joules)
Ped
erse
n &
Zh
ang
Lo
ng
itu
din
al A
bso
rbed
En
erg
y (J
ou
les)
Fig. 25. Longitudinal absorbed energy.
A.J. Brown / Marine Structures 15 (2002) 335–364362

very sensitive to striking ship displacement, striking ship speed and collision angle. Asignificant effort is warranted to insure that pdfs for these random variables arecorrect. Damage extents are less sensitive to struck ship speed and strike location.
When estimating damage stability and oil outflow, damage length is a veryimportant factor. Using uncoupled methods to predict absorbed longitudinal energymay not provide sufficient accuracy for this calculation.
Normalization of damage extents using struck ship principal characteristics (L; B;D) as in the standard IMO pdfs may not be a reasonable approach over the fullrange of collision scenarios. This requires further investigation.
Future work will investigate the sensitivity of probabilistic damage extents tostruck ship structural scantlings and will consider striking ship bow deformation.
References
[1] Sirkar J, et al. A framework for assessing the environmental performance of tankers in accidental
groundings and collisions. SNAME Trans 1997;105:253–95.
[2] Crake K. Probabilistic evaluations of tanker ship damage in grounding events. Naval Engineer
Thesis, Department of Ocean Engineering, MIT, 1995.
[3] Rawson C, Crake K, Brown AJ. Assessing the environmental performance of tankers in accidental
grounding and collision. SNAME Trans 1998;106:41–58.
[4] Chen D. Simplified Collision Model (SIMCOL). Master of Science Thesis, Department of Ocean
Engineering, Virginia Tech, 2000.
[5] Brown AJ, et al. Structural design and response in collision and grounding. SNAME Trans
2000;108:447–73.
[6] Brown AJ, Amrozowicz M. Tanker environmental risk—putting the pieces together. SNAME/SNAJ
International Conference on Designs and Methodologies for Collision and Grounding Protection of
Ships, 1996.
[7] Hutchison BL. Barge collisions, rammings and groundings—an engineering assessment of the
potential for damage to radioactive material transport casks. Report No. SAND85-7165 TTC-05212,
1986.
[8] Rosenblatt & Son, Inc. Tanker structural analysis for minor collision. USCG Report, CG-D-72-76,
1975.
[9] McDermott JF, et al. Tanker structural analysis for minor collisions. SNAME Trans 1974;82:
382–414.
[10] Minorsky VV. An analysis of ship collisions with reference to protection of nuclear power plants.
J Ship Res, 1959.
[11] Reardon P, Sprung JL. Validation of Minorsky’s ship collision model and use of the model to
estimate the probability of damaging a radioactive material transportation cask during a ship
collision. Proceedings of the International Conference on Design and Methodologies for Collision
and Grounding Protection of Ships, San Francisco, 1996.
[12] Sandia National Laboratories. Data and methods for the assessment of the risks associated with the
maritime transport of radioactive materials results of the Searam program studies. Report SAND98-
1171/2, Albuquerque, NM, 1998.
[13] Lloyds. Lloyds Worldwide Ship data. Provided by MARAD, 1993.
[14] ORI. Hazardous environment experienced by radioactive material packages transported by water.
Silver Spring, MD, 1980.
[15] ORI. Accident severities experienced by radioactive material packages transported by water. Silver
Spring, MD, 1981.
[16] USCG Ship Casualty Data, 1982–1990.
A.J. Brown / Marine Structures 15 (2002) 335–364 363

[17] IMO. Interim guidelines for approval of alternative methods of design, construction of oil tankers.
Under Regulation 13F(5) of Annex I of MARPOL 73/78, Resolution MEPC 66 (37), 1995.
[18] IMO. Comparative study on oil tanker design. Distribution of actual penetrations and damage
locations along ship’s length for collisions and groundings. IMO paper, MEPC 32/7/15, Annex 5,
1989.
[19] Pedersen PT, Zhang S. On impact mechanics in ship collisions. Marine Struct 1998;11:429–49.
A.J. Brown / Marine Structures 15 (2002) 335–364364
Related Documents


![SocioSense: Robot Navigation Amongst Pedestrians with ...gamma.cs.unc.edu/SocioSense/iros.pdf · a probabilistic model of robot-human cooperative collision avoidance [37]. Other methods](https://static.cupdf.com/doc/110x72/5fd4da407b69274cfa314ecf/sociosense-robot-navigation-amongst-pedestrians-with-gammacsuncedusociosenseirospdf.jpg)