13 May 2016 Update | Sector: Utilities Coal India BSE SENSEX S&P CNX CMP: INR282 TP: INR371 (+32%) Buy 25,490 7,815 Stock Info Bloomberg COAL IN Equity Shares (m) 6,316.4 52-Week Range (INR) 447/272 1, 6, 12 Rel. Per (%) 1/-16/-17 M.Cap. (INR b)/(USD b) 1,778.1/26.7 Avg Val ( INR m) 1,583 Free float (%) 20.4 Financials Snapshot (INR b) Y/E Mar 2016E 2017E 2018E Net Sales 761.7 762.1 853.5 EBITDA 162.6 117.1 168.6 PAT 145.5 110.3 146.1 EPS (INR) 23.0 17.5 23.1 Gr. (%) 5.9 -24.2 32.5 BV/Sh (INR) 54.0 55.8 58.1 RoE (%) 42.6 31.3 39.8 RoCE (%) 61.7 49.6 62.3 P/E (x) 12.2 16.1 12.2 P/BV (x) 5.2 5.0 4.8 Shareholding pattern (%) As On Mar-16 Dec-15 Mar-15 Promoter 79.7 79.7 79.7 DII 8.6 8.6 8.8 FII 8.5 8.8 9.0 Others 3.2 2.9 2.5 FII Includes depository receipts Stock Performance (1-year) Efficiencies eroding demand; cutting estimates Downside to coal prices limited, however; valuations attractive – Buy Efficiencies eroded 4% demand: All India coal consumption grew just 1.4% in FY16, the slowest in five years due to low demand from the Power sector and decline in non-Power sector demand. Efficiency gains crowded out 4% demand growth from Power. Non-Power sector demand was impacted because metal and sponge iron production suffered from volatility in metal prices. Cutting FY20E volumes by 50m tons: We remain bullish on non-Power sector demand because improved availability is triggering restart of aluminum smelters. We have reworked our demand and supply model and reduced Coal India’s FY20E volumes by 50m tons. Aggressive production target creating oversupply: Oversupply is putting pressure on prices of coal in E-auction, which is evident from declining ratio of allocated to offered quantities. We are cutting average E-auction realization by INR561 to INR1,445/ton for FY17 and by INR400 to INR1,450/ton for FY18-20. We now assume delayed price hike; cut quantum of hike from 8-10% to 4%: We had factored 8-10% price hike on ACQ (annual contracted quantity) coal in FY17, which now appears to be postponed. We are pushing back ACQ price hike to FY18 and also reducing the quantum of hike to ~4%. Cutting FY17E EBITDA by 27% to INR182b: Reduction in volumes and prices is resulting in a cut of INR117b in revenue estimate for FY17 to INR762b. Some cost pressures would be lower than our estimates, cushioning the impact on margins. Overall, we are reducing cost of mining (ex-OBR) by INR51b on factoring lower wage hike of 5% (v/s 20%). But that will not be enough to offset the impact on revenue. We are cutting adjusted EBITDA by 27% to INR182b for FY17 and by 23% to INR238b for FY18. Consolidated EPS is revised down by 29% to INR17.5 for FY17 and by 24% to INR23.1 for FY18. Land acquisition and evacuation issues addressed: Coal India has demonstrated that it is able to achieve strong volume growth and has addressed issues related to land acquisition and evacuation bottlenecks. Downside to coal prices limited: Though Power sector is the largest consumer, the value of stock has very high leverage to market prices of coal. We believe that downside to international coal prices is limited because current market prices are hurting production in major exporting countries. Valuations attractive for a growing mining company: The stock is trading at an EV of 7.6x FY17E EBITDA and 5.8x FY18E EBITDA. Valuations are attractive for a growing mining company, despite challenging market conditions. We value Coal India at INR371/share based on EV/EBITDA of 7.5x FY18E. This is very close to our revised DCF value of INR375/share. Maintain Buy. 260 310 360 410 460 May-15 Aug-15 Nov-15 Feb-16 May-16 Coal India Sensex - Rebased Sanjay Jain ([email protected]); +91 22 3982 5412 Dhruv Muchhal ([email protected]); +9122 3027 8033 Investors are advised to refer through important disclosures made at the last page of the Research Report. Motilal Oswal research is available on www.motilaloswal.com/Institutional-Equities, Bloomberg, Thomson Reuters, Factset and S&P Capital.

Welcome message from author
This document is posted to help you gain knowledge. Please leave a comment to let me know what you think about it! Share it to your friends and learn new things together.
Transcript
13 May 2016Update | Sector: Utilities
Coal India
BSE SENSEX S&P CNX CMP: INR282 TP: INR371 (+32%) Buy25,490 7,815
Stock Info Bloomberg COAL IN Equity Shares (m) 6,316.4 52-Week Range (INR) 447/272 1, 6, 12 Rel. Per (%) 1/-16/-17 M.Cap. (INR b)/(USD b) 1,778.1/26.7Avg Val ( INR m) 1,583 Free float (%) 20.4
Financials Snapshot (INR b) Y/E Mar 2016E 2017E 2018E Net Sales 761.7 762.1 853.5 EBITDA 162.6 117.1 168.6 PAT 145.5 110.3 146.1 EPS (INR) 23.0 17.5 23.1 Gr. (%) 5.9 -24.2 32.5BV/Sh (INR) 54.0 55.8 58.1 RoE (%) 42.6 31.3 39.8 RoCE (%) 61.7 49.6 62.3 P/E (x) 12.2 16.1 12.2 P/BV (x) 5.2 5.0 4.8
Shareholding pattern (%)
As On Mar-16 Dec-15 Mar-15
Promoter 79.7 79.7 79.7
DII 8.6 8.6 8.8
FII 8.5 8.8 9.0
Others 3.2 2.9 2.5
FII Includes depository receipts
Stock Performance (1-year)
Efficiencies eroding demand; cutting estimates Downside to coal prices limited, however; valuations attractive – Buy
Efficiencies eroded 4% demand: All India coal consumption grew just 1.4% in FY16, the slowest in five years due to low demand from the Power sector and decline in non-Power sector demand. Efficiency gains crowded out 4% demand growth from Power. Non-Power sector demand was impacted because metal and sponge iron production suffered from volatility in metal prices.
Cutting FY20E volumes by 50m tons: We remain bullish on non-Power sector demand because improved availability is triggering restart of aluminum smelters. We have reworked our demand and supply model and reduced Coal India’s FY20E volumes by 50m tons.
Aggressive production target creating oversupply: Oversupply is putting pressure on prices of coal in E-auction, which is evident from declining ratio of allocated to offered quantities. We are cutting average E-auction realization by INR561 to INR1,445/ton for FY17 and by INR400 to INR1,450/ton for FY18-20.
We now assume delayed price hike; cut quantum of hike from 8-10% to 4%: We had factored 8-10% price hike on ACQ (annual contracted quantity) coal in FY17, which now appears to be postponed. We are pushing back ACQ price hike to FY18 and also reducing the quantum of hike to ~4%.
Cutting FY17E EBITDA by 27% to INR182b: Reduction in volumes and prices is resulting in a cut of INR117b in revenue estimate for FY17 to INR762b. Some cost pressures would be lower than our estimates, cushioning the impact on margins. Overall, we are reducing cost of mining (ex-OBR) by INR51b on factoring lower wage hike of 5% (v/s 20%). But that will not be enough to offset the impact on revenue. We are cutting adjusted EBITDA by 27% to INR182b for FY17 and by 23% to INR238b for FY18. Consolidated EPS is revised down by 29% to INR17.5 for FY17 and by 24% to INR23.1 for FY18.
Land acquisition and evacuation issues addressed: Coal India hasdemonstrated that it is able to achieve strong volume growth and has addressed issues related to land acquisition and evacuation bottlenecks.
Downside to coal prices limited: Though Power sector is the largest consumer, the value of stock has very high leverage to market prices of coal. We believe that downside to international coal prices is limited because current market prices are hurting production in major exporting countries.
Valuations attractive for a growing mining company: The stock is trading at an EV of 7.6x FY17E EBITDA and 5.8x FY18E EBITDA. Valuations are attractive for a growing mining company, despite challenging market conditions. We value Coal India at INR371/share based on EV/EBITDA of 7.5x FY18E. This is very close to our revised DCF value of INR375/share. Maintain Buy.
260
310
360
410
460
May
-15
Aug-
15
Nov
-15
Feb-
16
May
-16
Coal IndiaSensex - Rebased
Sanjay Jain ([email protected]); +91 22 3982 5412 Dhruv Muchhal ([email protected]); +9122 3027 8033
Investors are advised to refer through important disclosures made at the last page of the Research Report. Motilal Oswal research is available on www.motilaloswal.com/Institutional-Equities, Bloomberg, Thomson Reuters, Factset and S&P Capital.
Coal India
13 May 2016 2
Coal demand growth disappointing Reworking D-S model; lowering Coal India’s FY20E volumes by 50m tons
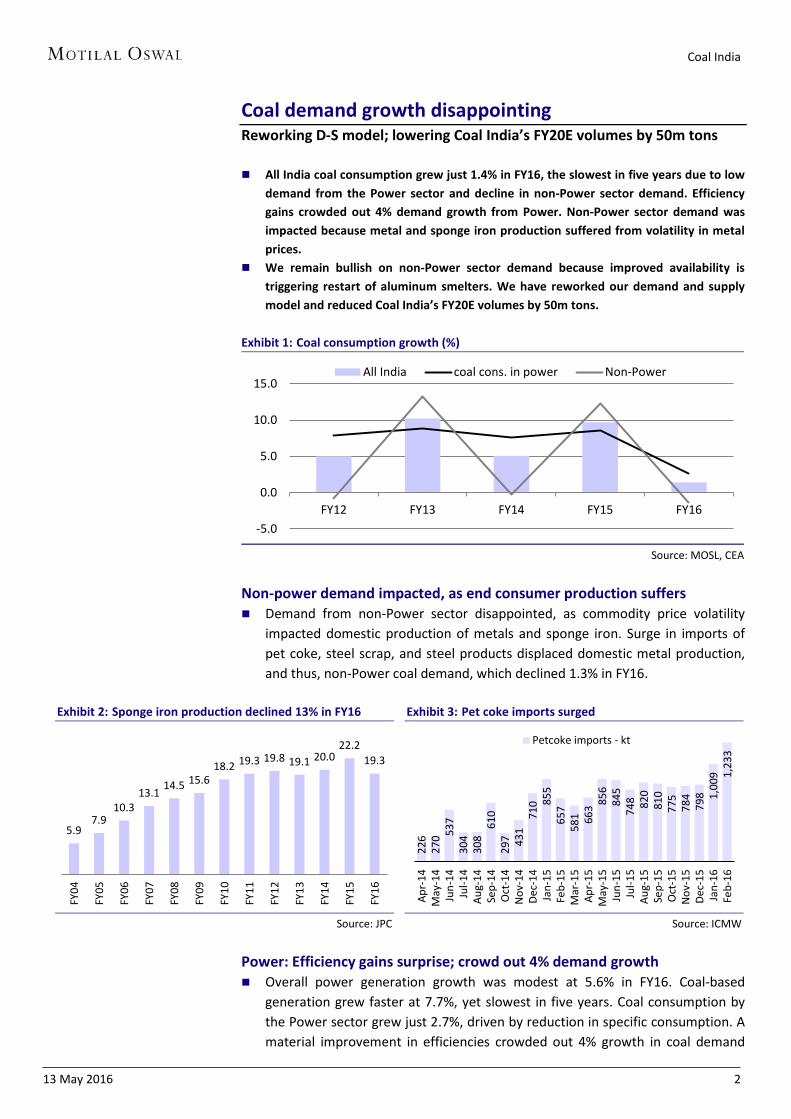
All India coal consumption grew just 1.4% in FY16, the slowest in five years due to lowdemand from the Power sector and decline in non-Power sector demand. Efficiencygains crowded out 4% demand growth from Power. Non-Power sector demand wasimpacted because metal and sponge iron production suffered from volatility in metalprices.
We remain bullish on non-Power sector demand because improved availability istriggering restart of aluminum smelters. We have reworked our demand and supplymodel and reduced Coal India’s FY20E volumes by 50m tons.
Exhibit 1: Coal consumption growth (%)
Source: MOSL, CEA
Non-power demand impacted, as end consumer production suffers Demand from non-Power sector disappointed, as commodity price volatility
impacted domestic production of metals and sponge iron. Surge in imports ofpet coke, steel scrap, and steel products displaced domestic metal production,and thus, non-Power coal demand, which declined 1.3% in FY16.
Exhibit 2: Sponge iron production declined 13% in FY16
Source: JPC
Exhibit 3: Pet coke imports surged
Source: ICMW
Power: Efficiency gains surprise; crowd out 4% demand growth Overall power generation growth was modest at 5.6% in FY16. Coal-based
generation grew faster at 7.7%, yet slowest in five years. Coal consumption bythe Power sector grew just 2.7%, driven by reduction in specific consumption. Amaterial improvement in efficiencies crowded out 4% growth in coal demand
-5.0
0.0
5.0
10.0
15.0
FY12 FY13 FY14 FY15 FY16
All India coal cons. in power Non-Power
5.9 7.9
10.3 13.1 14.5 15.6
18.2 19.3 19.8 19.1 20.022.2
19.3
FY04
FY05
FY06
FY07
FY08
FY09
FY10
FY11
FY12
FY13
FY14
FY15
FY16
226
270 53
7 30
4 30
8 61
0 29
7 431
710 85
5 65
7 58
1 663 85
6 84
5 74
8 820
810
775
784
798 1,
009 1,
233
Apr-
14M
ay-1
4Ju
n-14
Jul-1
4Au
g-14
Sep-
14O
ct-1
4N
ov-1
4De
c-14
Jan-
15Fe
b-15
Mar
-15
Apr-
15M
ay-1
5Ju
n-15
Jul-1
5Au
g-15
Sep-
15O
ct-1
5N
ov-1
5De
c-15
Jan-
16Fe
b-16
Petcoke imports - kt
Coal India
13 May 2016 3
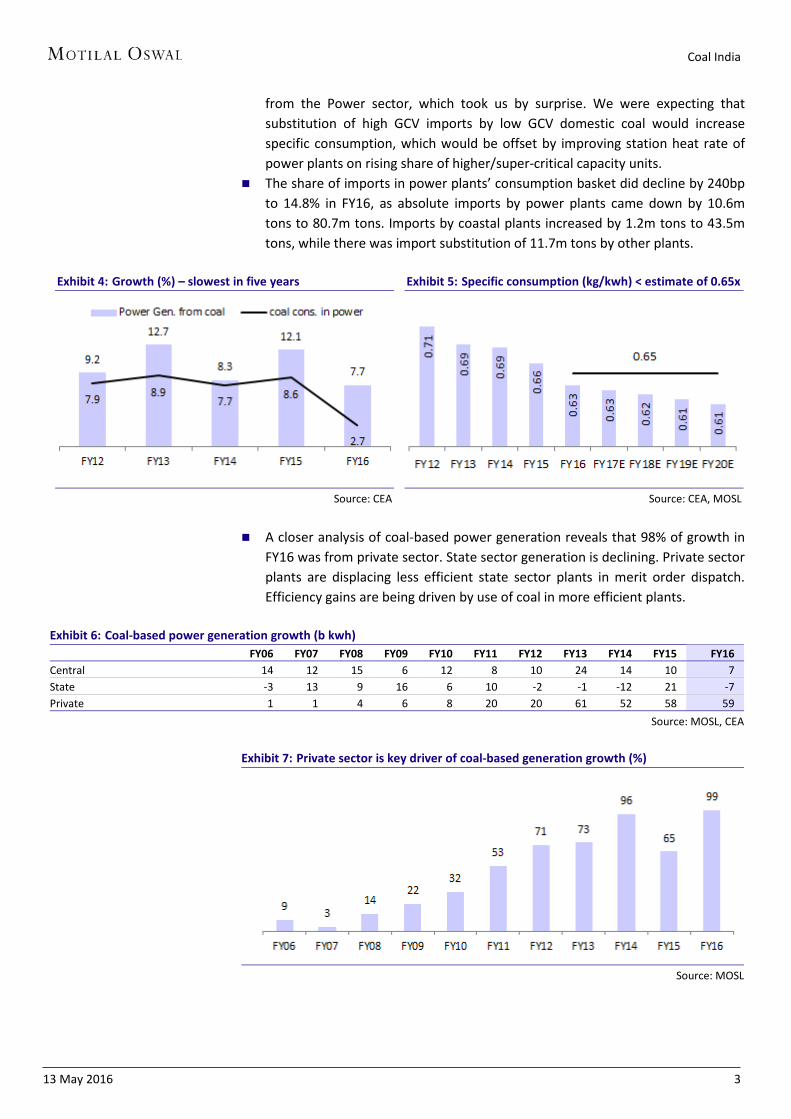
from the Power sector, which took us by surprise. We were expecting that substitution of high GCV imports by low GCV domestic coal would increase specific consumption, which would be offset by improving station heat rate of power plants on rising share of higher/super-critical capacity units.
The share of imports in power plants’ consumption basket did decline by 240bpto 14.8% in FY16, as absolute imports by power plants came down by 10.6mtons to 80.7m tons. Imports by coastal plants increased by 1.2m tons to 43.5mtons, while there was import substitution of 11.7m tons by other plants.
Exhibit 4: Growth (%) – slowest in five years
Source: CEA
Exhibit 5: Specific consumption (kg/kwh) < estimate of 0.65x
Source: CEA, MOSL
A closer analysis of coal-based power generation reveals that 98% of growth inFY16 was from private sector. State sector generation is declining. Private sectorplants are displacing less efficient state sector plants in merit order dispatch.Efficiency gains are being driven by use of coal in more efficient plants.
Exhibit 6: Coal-based power generation growth (b kwh) FY06 FY07 FY08 FY09 FY10 FY11 FY12 FY13 FY14 FY15 FY16
Central 14 12 15 6 12 8 10 24 14 10 7 State -3 13 9 16 6 10 -2 -1 -12 21 -7Private 1 1 4 6 8 20 20 61 52 58 59
Source: MOSL, CEA
Exhibit 7: Private sector is key driver of coal-based generation growth (%)
Source: MOSL
Coal India
13 May 2016 4
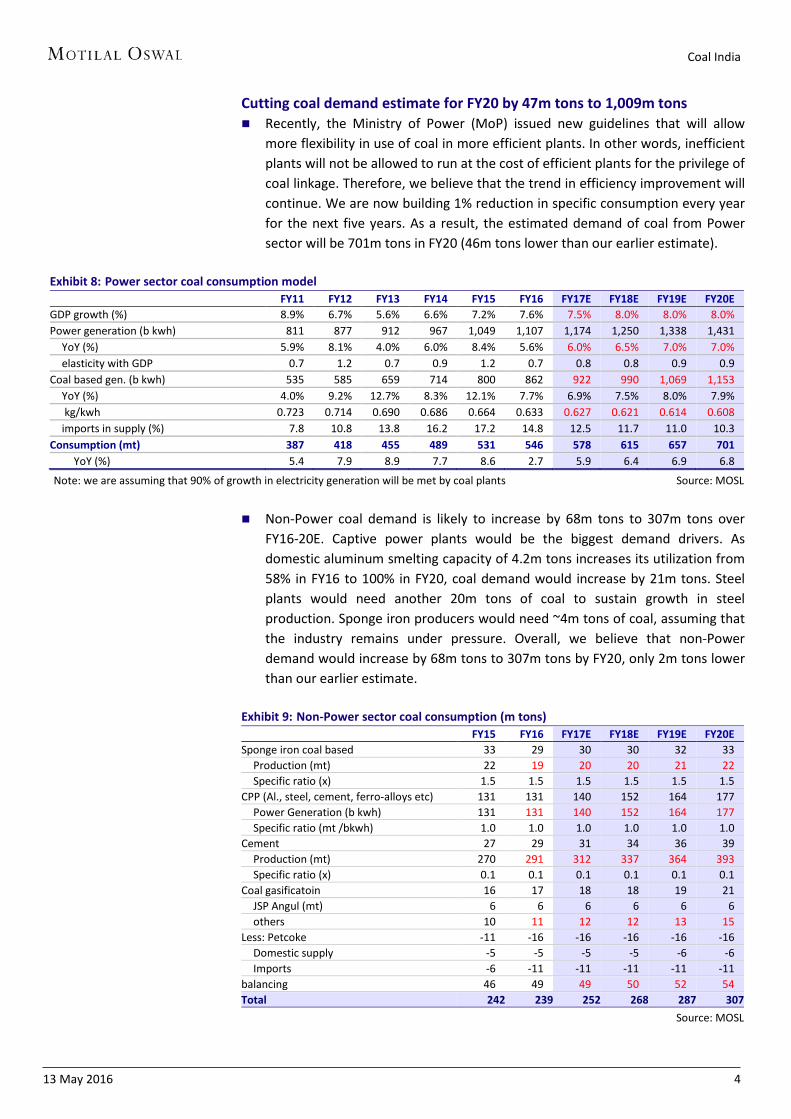
Cutting coal demand estimate for FY20 by 47m tons to 1,009m tons Recently, the Ministry of Power (MoP) issued new guidelines that will allow
more flexibility in use of coal in more efficient plants. In other words, inefficientplants will not be allowed to run at the cost of efficient plants for the privilege ofcoal linkage. Therefore, we believe that the trend in efficiency improvement willcontinue. We are now building 1% reduction in specific consumption every yearfor the next five years. As a result, the estimated demand of coal from Powersector will be 701m tons in FY20 (46m tons lower than our earlier estimate).
Exhibit 8: Power sector coal consumption model FY11 FY12 FY13 FY14 FY15 FY16 FY17E FY18E FY19E FY20E
GDP growth (%) 8.9% 6.7% 5.6% 6.6% 7.2% 7.6% 7.5% 8.0% 8.0% 8.0% Power generation (b kwh) 811 877 912 967 1,049 1,107 1,174 1,250 1,338 1,431
YoY (%) 5.9% 8.1% 4.0% 6.0% 8.4% 5.6% 6.0% 6.5% 7.0% 7.0% elasticity with GDP 0.7 1.2 0.7 0.9 1.2 0.7 0.8 0.8 0.9 0.9
Coal based gen. (b kwh) 535 585 659 714 800 862 922 990 1,069 1,153 YoY (%) 4.0% 9.2% 12.7% 8.3% 12.1% 7.7% 6.9% 7.5% 8.0% 7.9% kg/kwh 0.723 0.714 0.690 0.686 0.664 0.633 0.627 0.621 0.614 0.608 imports in supply (%) 7.8 10.8 13.8 16.2 17.2 14.8 12.5 11.7 11.0 10.3
Consumption (mt) 387 418 455 489 531 546 578 615 657 701 YoY (%) 5.4 7.9 8.9 7.7 8.6 2.7 5.9 6.4 6.9 6.8
Note: we are assuming that 90% of growth in electricity generation will be met by coal plants Source: MOSL
Non-Power coal demand is likely to increase by 68m tons to 307m tons overFY16-20E. Captive power plants would be the biggest demand drivers. Asdomestic aluminum smelting capacity of 4.2m tons increases its utilization from58% in FY16 to 100% in FY20, coal demand would increase by 21m tons. Steelplants would need another 20m tons of coal to sustain growth in steelproduction. Sponge iron producers would need ~4m tons of coal, assuming thatthe industry remains under pressure. Overall, we believe that non-Powerdemand would increase by 68m tons to 307m tons by FY20, only 2m tons lowerthan our earlier estimate.
Exhibit 9: Non-Power sector coal consumption (m tons) FY15 FY16 FY17E FY18E FY19E FY20E
Sponge iron coal based 33 29 30 30 32 33 Production (mt) 22 19 20 20 21 22 Specific ratio (x) 1.5 1.5 1.5 1.5 1.5 1.5
CPP (Al., steel, cement, ferro-alloys etc) 131 131 140 152 164 177 Power Generation (b kwh) 131 131 140 152 164 177 Specific ratio (mt /bkwh) 1.0 1.0 1.0 1.0 1.0 1.0
Cement 27 29 31 34 36 39 Production (mt) 270 291 312 337 364 393 Specific ratio (x) 0.1 0.1 0.1 0.1 0.1 0.1
Coal gasificatoin 16 17 18 18 19 21 JSP Angul (mt) 6 6 6 6 6 6 others 10 11 12 12 13 15
Less: Petcoke -11 -16 -16 -16 -16 -16Domestic supply -5 -5 -5 -5 -6 -6Imports -6 -11 -11 -11 -11 -11
balancing 46 49 49 50 52 54 Total 242 239 252 268 287 307
Source: MOSL
Coal India
13 May 2016 5
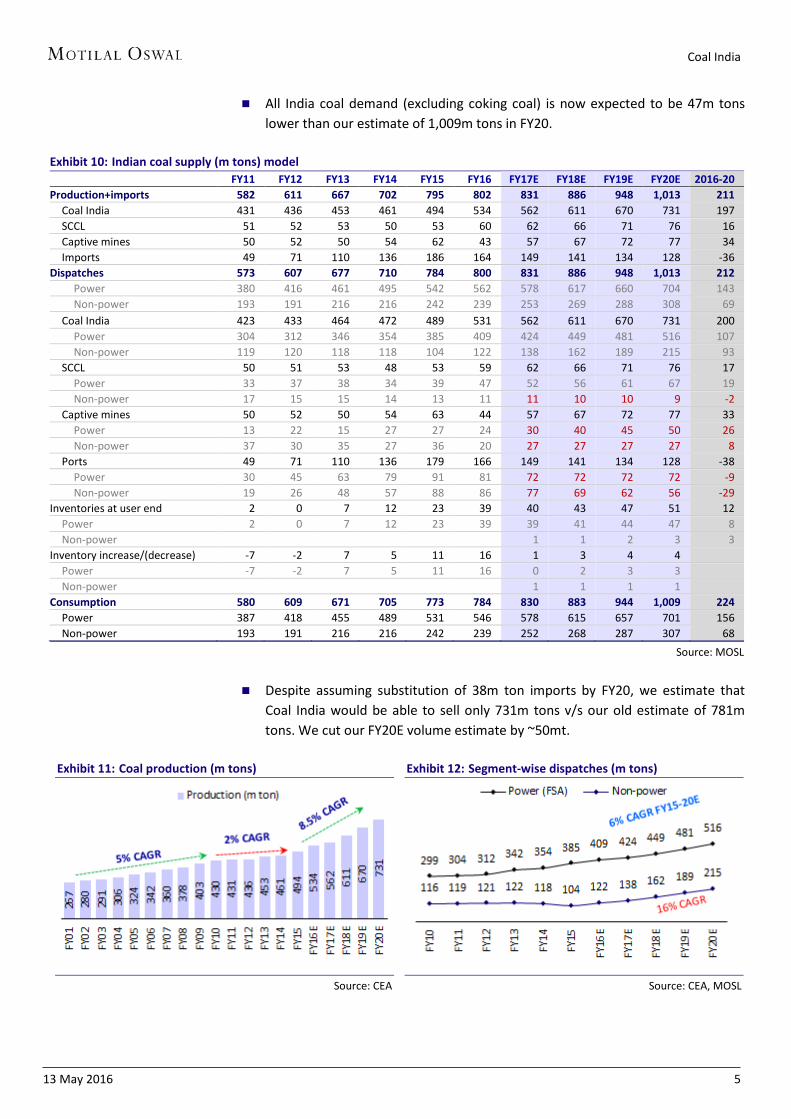
All India coal demand (excluding coking coal) is now expected to be 47m tonslower than our estimate of 1,009m tons in FY20.
Exhibit 10: Indian coal supply (m tons) model FY11 FY12 FY13 FY14 FY15 FY16 FY17E FY18E FY19E FY20E 2016-20
Production+imports 582 611 667 702 795 802 831 886 948 1,013 211 Coal India 431 436 453 461 494 534 562 611 670 731 197 SCCL 51 52 53 50 53 60 62 66 71 76 16 Captive mines 50 52 50 54 62 43 57 67 72 77 34 Imports 49 71 110 136 186 164 149 141 134 128 -36
Dispatches 573 607 677 710 784 800 831 886 948 1,013 212 Power 380 416 461 495 542 562 578 617 660 704 143 Non-power 193 191 216 216 242 239 253 269 288 308 69
Coal India 423 433 464 472 489 531 562 611 670 731 200 Power 304 312 346 354 385 409 424 449 481 516 107 Non-power 119 120 118 118 104 122 138 162 189 215 93
SCCL 50 51 53 48 53 59 62 66 71 76 17 Power 33 37 38 34 39 47 52 56 61 67 19 Non-power 17 15 15 14 13 11 11 10 10 9 -2
Captive mines 50 52 50 54 63 44 57 67 72 77 33 Power 13 22 15 27 27 24 30 40 45 50 26 Non-power 37 30 35 27 36 20 27 27 27 27 8
Ports 49 71 110 136 179 166 149 141 134 128 -38Power 30 45 63 79 91 81 72 72 72 72 -9Non-power 19 26 48 57 88 86 77 69 62 56 -29
Inventories at user end 2 0 7 12 23 39 40 43 47 51 12 Power 2 0 7 12 23 39 39 41 44 47 8 Non-power 1 1 2 3 3
Inventory increase/(decrease) -7 -2 7 5 11 16 1 3 4 4 Power -7 -2 7 5 11 16 0 2 3 3 Non-power 1 1 1 1
Consumption 580 609 671 705 773 784 830 883 944 1,009 224 Power 387 418 455 489 531 546 578 615 657 701 156 Non-power 193 191 216 216 242 239 252 268 287 307 68
Source: MOSL
Despite assuming substitution of 38m ton imports by FY20, we estimate thatCoal India would be able to sell only 731m tons v/s our old estimate of 781mtons. We cut our FY20E volume estimate by ~50mt.
Exhibit 11: Coal production (m tons)
Source: CEA
Exhibit 12: Segment-wise dispatches (m tons)
Source: CEA, MOSL

Coal India
13 May 2016 6
Oversupply putting pressure on pricing Cutting E-auction prices; pushing back price hike
Coal India is trying to push more volumes into the market than actual demand growth.Import substitution is slower due to subdued prices in international coal market andhigh cost of transport within India. Oversupply is putting pressure on prices of coal inE-auction, which is evident from declining ratio of allocated to offered quantities. Weare cutting average E-auction realization by INR561 to INR1,445/ton for FY17 and byINR400 to INR1,450/ton for FY18-20.
Ministry of Coal (MoC) is soon likely to announce auctioning of non-Power linkage, asit will no longer be renewing old linkages.
MoC has committed to re-grading of coal mines and rationalization of pricing based onGCV. However, the actual progress on these issues is slow. We had factored a pricehike of 8-10% on ACQ (annual contracted quantity) coal during FY17, which nowappears to be postponed. We are pushing back ACQ price hike to FY18 and alsoreducing the quantum of hike to ~4%.
E-auction pricing under pressure; cutting FY17 estimate by INR561/ton
Exhibit 13: Coal supply by Coal India (m tons)
Source: MOSL, Company
Exhibit 14: E-auction supply is increasing rapidly
Source: MOSL, ICMW
Exhibit 15: Demand is not keeping pace
Source: MOSL, ICMW
Coal India’s aggressive production targets are
creating huge oversupply…gap will
continue to widen if targets are not rationalized
Coal India
13 May 2016 7
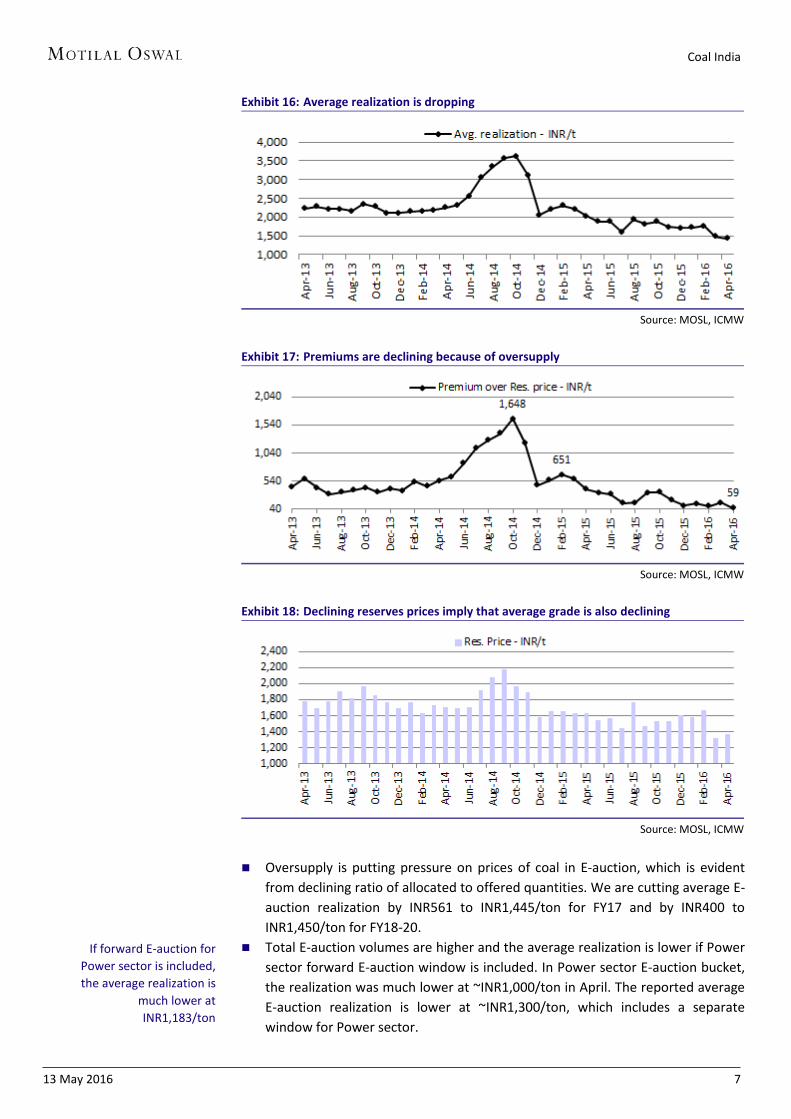
Exhibit 16: Average realization is dropping
Source: MOSL, ICMW
Exhibit 17: Premiums are declining because of oversupply
Source: MOSL, ICMW
Exhibit 18: Declining reserves prices imply that average grade is also declining
Source: MOSL, ICMW
Oversupply is putting pressure on prices of coal in E-auction, which is evidentfrom declining ratio of allocated to offered quantities. We are cutting average E-auction realization by INR561 to INR1,445/ton for FY17 and by INR400 toINR1,450/ton for FY18-20.
Total E-auction volumes are higher and the average realization is lower if Powersector forward E-auction window is included. In Power sector E-auction bucket,the realization was much lower at ~INR1,000/ton in April. The reported averageE-auction realization is lower at ~INR1,300/ton, which includes a separatewindow for Power sector.
If forward E-auction for Power sector is included, the average realization is
much lower at INR1,183/ton
Coal India
13 May 2016 8
We need to treat Power sector volumes separately, because they are crowdingout Power sector ACQ volumes and fetching 10% premium at notified prices.Therefore, we are focusing on only regular E-auction for the purpose of analysis.
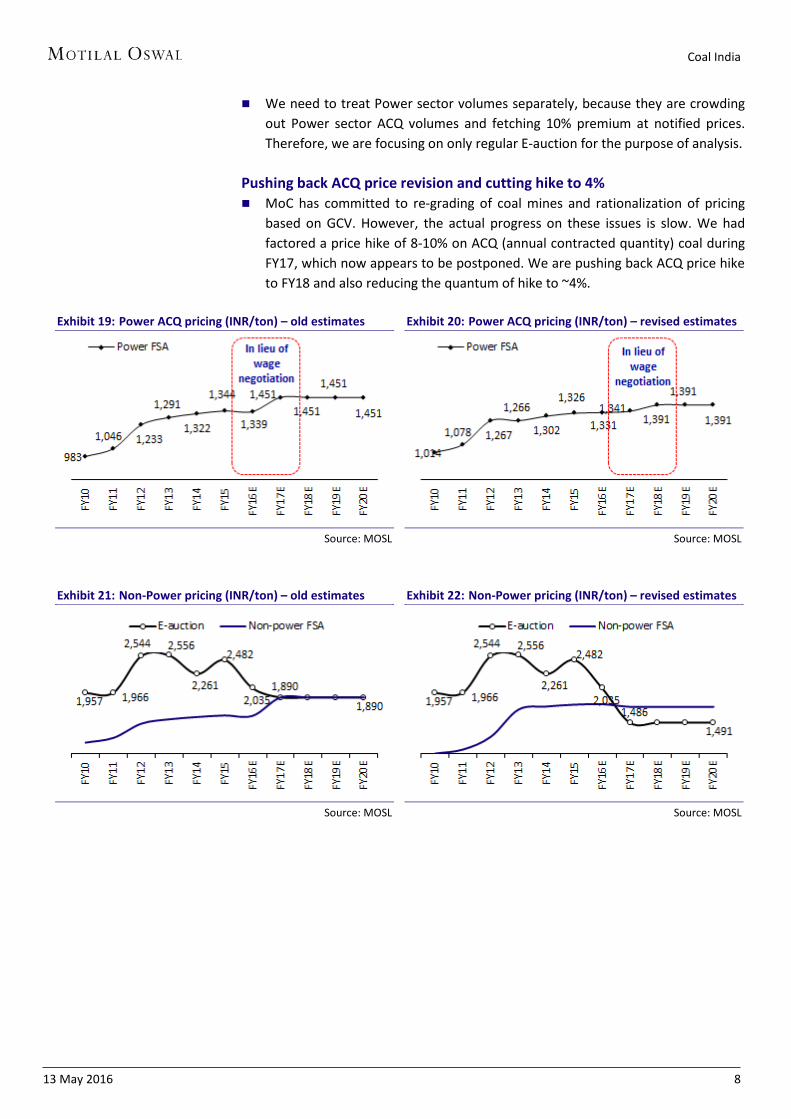
Pushing back ACQ price revision and cutting hike to 4% MoC has committed to re-grading of coal mines and rationalization of pricing
based on GCV. However, the actual progress on these issues is slow. We hadfactored a price hike of 8-10% on ACQ (annual contracted quantity) coal duringFY17, which now appears to be postponed. We are pushing back ACQ price hiketo FY18 and also reducing the quantum of hike to ~4%.
Exhibit 19: Power ACQ pricing (INR/ton) – old estimates
Source: MOSL
Exhibit 20: Power ACQ pricing (INR/ton) – revised estimates
Source: MOSL
Exhibit 21: Non-Power pricing (INR/ton) – old estimates
Source: MOSL
Exhibit 22: Non-Power pricing (INR/ton) – revised estimates
Source: MOSL
Coal India
13 May 2016 9
Cutting FY17E adjusted EBITDA by 27% Valuations attractive for a growing mining company; maintain Buy
Reducing certain cost estimates; yet FY17E adjusted EBITDA cut 27% Reduction in volumes and prices is resulting in a cut of INR117b to our revenue estimate for FY17 to INR762b. Revenue would be flat in FY17, despite 5.7% volume increase. Some cost pressures would be lower than our estimates, cushioning the impact on margins.
We had factored wage hike of 20% in FY17. As inflationary pressures have easedand many PSUs are under severe margin pressure, we understand that theprovisions for wage hike will be much lower. We are cutting our wage hikeestimate to 5%, which would save INR44b in cost increase during FY17.
Contracting expenses are likely to witness lower inflation. We are increasing social expenses from INR3b to INR9.4b due to continued
focus on various CSR initiatives. Under Ind-AS, some of the mining expenses will get capitalized.
It is yet not clear how Coal India will treat OBR provisioning under Ind-AS. Itshould not be provided for to align with practices followed by mining companiesglobally, in our view. We are already excluding OBR provisions from expenses incalculating adjusted EBITDA to make its financials comparable to other miningcompanies.
Overall, we are reducing cost of mining (ex-OBR) by INR51b on factoring lowerwage hike of 5% (v/s 20%). But that will not be enough to offset the impact onrevenue. We are cutting adjusted EBITDA by 27% to INR182b for FY17 and by23% to INR238b for FY18.
EBITDA per ton will decline by 19% to INR323/ton in FY17, which will befollowed by increase of 21% in FY18.
Consolidated EPS is revised down by 29% to INR17.5 for FY17 and by 24% toINR23.1 for FY18.
Valuations attractive for growing mining company; maintain Buy Coal India has demonstrated that it is able to achieve strong volume growth and
has addressed issues related to land acquisition and evacuation bottlenecks. The stock (adjusted for dividend) has got de-rated and corrected by 30% from its
peak of ~INR445 on concerns that it will be difficult to achieve price hike in viewof (a) falling global coal prices, (b) E-auction prices, and (c) slower than expectedpickup in domestic demand.
Though Power sector is the largest consumer, the value of stock has very highleverage to market prices of coal. When prices are high, Coal India is able to (a)substitute imports at a faster rate, (b) push more volumes into domestic market,and (c) benefit from operating leverage and higher prices in E-auction. Thisworks otherwise when the prices are weak, as is the present situation.
We believe that international coal prices have limited downside because currentmarket prices are hurting production in both Indonesia and USA, which areamong the key coal exporters in the world.
Reducing wage hike estimates to 5%
No clarity on OBR accounting, but it won’t affect adjusted EBITDA
Adjusted EBITDA is cut 27%
Volume growth concerns allayed
Leverage to prices has increased
Coal prices have limited downside
Coal India
13 May 2016 10
The stock is trading at an EV of 7.6x FY17E EBITDA and 5.8x FY18E EBITDA.Valuations are attractive for a growing mining company, despite challengingmarket conditions.
We value Coal India at INR371/share based on EV/EBITDA of 7.5x FY18E. This isvery close to our revised DCF value of INR375/share. Maintain Buy.
Valuations are attractive
Coal India
13 May 2016 11
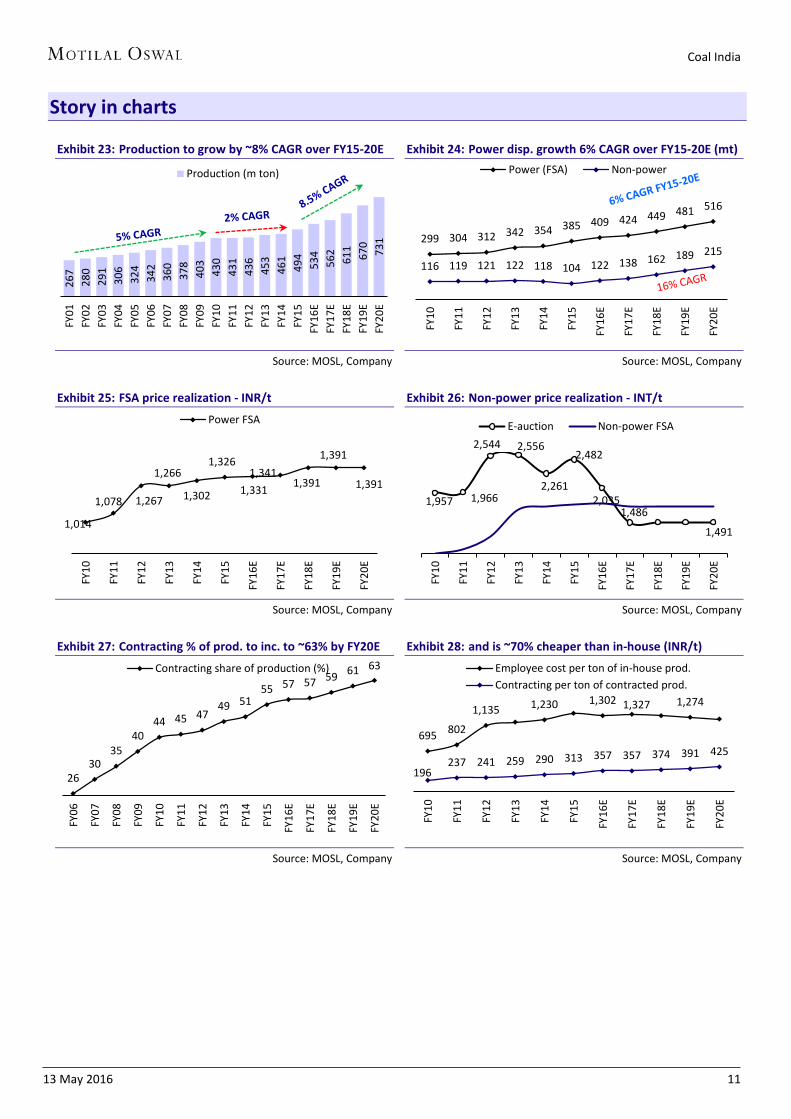
Story in charts
Exhibit 23: Production to grow by ~8% CAGR over FY15-20E
Source: MOSL, Company
Exhibit 24: Power disp. growth 6% CAGR over FY15-20E (mt)
Source: MOSL, Company
Exhibit 25: FSA price realization - INR/t
Source: MOSL, Company
Exhibit 26: Non-power price realization - INT/t
Source: MOSL, Company
Exhibit 27: Contracting % of prod. to inc. to ~63% by FY20E
Source: MOSL, Company
Exhibit 28: and is ~70% cheaper than in-house (INR/t)
Source: MOSL, Company
267
280
291
306
324
342
360
378
403
430
431
436
453
461
494
534
562
611
670
731
FY01
FY02
FY03
FY04
FY05
FY06
FY07
FY08
FY09
FY10
FY11
FY12
FY13
FY14
FY15
FY16
EFY
17E
FY18
EFY
19E
FY20
E
Production (m ton)
299 304 312 342 354 385 409 424 449 481 516
116 119 121 122 118 104 122 138 162 189 215
FY10
FY11
FY12
FY13
FY14
FY15
FY16
E
FY17
E
FY18
E
FY19
E
FY20
E
Power (FSA) Non-power
1,014
1,078 1,267
1,266
1,302
1,326
1,331 1,341
1,391
1,391
1,391
FY10
FY11
FY12
FY13
FY14
FY15
FY16
E
FY17
E
FY18
E
FY19
E
FY20
E
Power FSA
1,957 1,966
2,544 2,556
2,261
2,482
2,035 1,486
1,491
FY10
FY11
FY12
FY13
FY14
FY15
FY16
E
FY17
E
FY18
E
FY19
E
FY20
E
E-auction Non-power FSA
26 30
35 40
44 45 47 49 51
55 57 57 59 61 63
FY06
FY07
FY08
FY09
FY10
FY11
FY12
FY13
FY14
FY15
FY16
E
FY17
E
FY18
E
FY19
E
FY20
E
Contracting share of production (%)
695 802
1,135 1,230 1,302 1,327 1,274
196 237 241 259 290 313 357 357 374 391 425
FY10
FY11
FY12
FY13
FY14
FY15
FY16
E
FY17
E
FY18
E
FY19
E
FY20
E
Employee cost per ton of in-house prod.Contracting per ton of contracted prod.
Coal India
13 May 2016 12
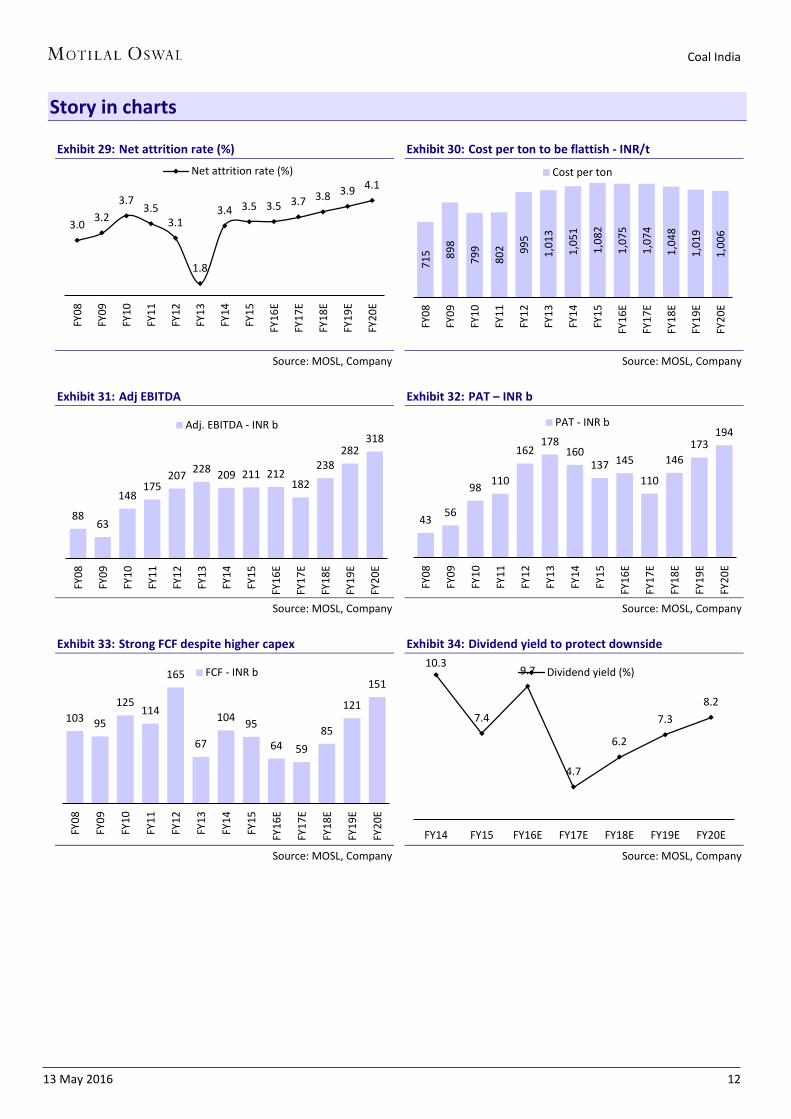
Story in charts
Exhibit 29: Net attrition rate (%)
Source: MOSL, Company
Exhibit 30: Cost per ton to be flattish - INR/t
Source: MOSL, Company
Exhibit 31: Adj EBITDA
Source: MOSL, Company
Exhibit 32: PAT – INR b
Source: MOSL, Company
Exhibit 33: Strong FCF despite higher capex
Source: MOSL, Company
Exhibit 34: Dividend yield to protect downside
Source: MOSL, Company
3.0 3.2 3.7
3.5 3.1
1.8
3.4 3.5 3.5 3.7 3.8 3.9 4.1
FY08
FY09
FY10
FY11
FY12
FY13
FY14
FY15
FY16
E
FY17
E
FY18
E
FY19
E
FY20
E
Net attrition rate (%)
715 89
8
799
802 99
5
1,01
3
1,05
1
1,08
2
1,07
5
1,07
4
1,04
8
1,01
9
1,00
6
FY08
FY09
FY10
FY11
FY12
FY13
FY14
FY15
FY16
E
FY17
E
FY18
E
FY19
E
FY20
E
Cost per ton
88 63
148 175
207 228 209 211 212182
238 282
318
FY08
FY09
FY10
FY11
FY12
FY13
FY14
FY15
FY16
E
FY17
E
FY18
E
FY19
E
FY20
E
Adj. EBITDA - INR b
43 56
98 110
162 178
160 137 145
110
146 173
194 FY
08
FY09
FY10
FY11
FY12
FY13
FY14
FY15
FY16
E
FY17
E
FY18
E
FY19
E
FY20
E
PAT - INR b
103 95
125 114
165
67
104 95
64 59 85
121
151
FY08
FY09
FY10
FY11
FY12
FY13
FY14
FY15
FY16
E
FY17
E
FY18
E
FY19
E
FY20
E
FCF - INR b10.3
7.4
9.7
4.7
6.2
7.3 8.2
FY14 FY15 FY16E FY17E FY18E FY19E FY20E
Dividend yield (%)
Coal India
13 May 2016 13
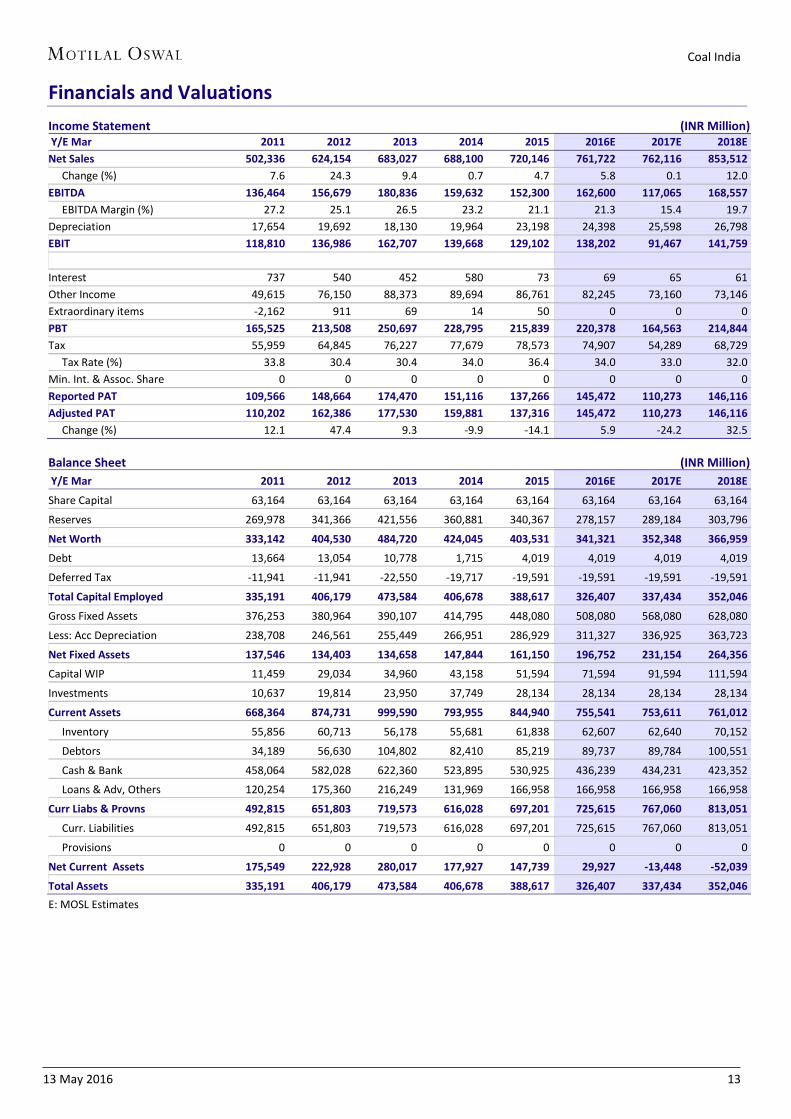
Financials and Valuations Income Statement (INR Million) Y/E Mar 2011 2012 2013 2014 2015 2016E 2017E 2018E Net Sales 502,336 624,154 683,027 688,100 720,146 761,722 762,116 853,512 Change (%) 7.6 24.3 9.4 0.7 4.7 5.8 0.1 12.0 EBITDA 136,464 156,679 180,836 159,632 152,300 162,600 117,065 168,557 EBITDA Margin (%) 27.2 25.1 26.5 23.2 21.1 21.3 15.4 19.7 Depreciation 17,654 19,692 18,130 19,964 23,198 24,398 25,598 26,798 EBIT 118,810 136,986 162,707 139,668 129,102 138,202 91,467 141,759 Interest 737 540 452 580 73 69 65 61 Other Income 49,615 76,150 88,373 89,694 86,761 82,245 73,160 73,146 Extraordinary items -2,162 911 69 14 50 0 0 0 PBT 165,525 213,508 250,697 228,795 215,839 220,378 164,563 214,844 Tax 55,959 64,845 76,227 77,679 78,573 74,907 54,289 68,729 Tax Rate (%) 33.8 30.4 30.4 34.0 36.4 34.0 33.0 32.0 Min. Int. & Assoc. Share 0 0 0 0 0 0 0 0 Reported PAT 109,566 148,664 174,470 151,116 137,266 145,472 110,273 146,116 Adjusted PAT 110,202 162,386 177,530 159,881 137,316 145,472 110,273 146,116 Change (%) 12.1 47.4 9.3 -9.9 -14.1 5.9 -24.2 32.5
Balance Sheet (INR Million) Y/E Mar 2011 2012 2013 2014 2015 2016E 2017E 2018E
Share Capital 63,164 63,164 63,164 63,164 63,164 63,164 63,164 63,164
Reserves 269,978 341,366 421,556 360,881 340,367 278,157 289,184 303,796
Net Worth 333,142 404,530 484,720 424,045 403,531 341,321 352,348 366,959
Debt 13,664 13,054 10,778 1,715 4,019 4,019 4,019 4,019
Deferred Tax -11,941 -11,941 -22,550 -19,717 -19,591 -19,591 -19,591 -19,591
Total Capital Employed 335,191 406,179 473,584 406,678 388,617 326,407 337,434 352,046
Gross Fixed Assets 376,253 380,964 390,107 414,795 448,080 508,080 568,080 628,080
Less: Acc Depreciation 238,708 246,561 255,449 266,951 286,929 311,327 336,925 363,723
Net Fixed Assets 137,546 134,403 134,658 147,844 161,150 196,752 231,154 264,356
Capital WIP 11,459 29,034 34,960 43,158 51,594 71,594 91,594 111,594
Investments 10,637 19,814 23,950 37,749 28,134 28,134 28,134 28,134
Current Assets 668,364 874,731 999,590 793,955 844,940 755,541 753,611 761,012
Inventory 55,856 60,713 56,178 55,681 61,838 62,607 62,640 70,152
Debtors 34,189 56,630 104,802 82,410 85,219 89,737 89,784 100,551
Cash & Bank 458,064 582,028 622,360 523,895 530,925 436,239 434,231 423,352
Loans & Adv, Others 120,254 175,360 216,249 131,969 166,958 166,958 166,958 166,958
Curr Liabs & Provns 492,815 651,803 719,573 616,028 697,201 725,615 767,060 813,051
Curr. Liabilities 492,815 651,803 719,573 616,028 697,201 725,615 767,060 813,051
Provisions 0 0 0 0 0 0 0 0
Net Current Assets 175,549 222,928 280,017 177,927 147,739 29,927 -13,448 -52,039
Total Assets 335,191 406,179 473,584 406,678 388,617 326,407 337,434 352,046 E: MOSL Estimates
Coal India
13 May 2016 14
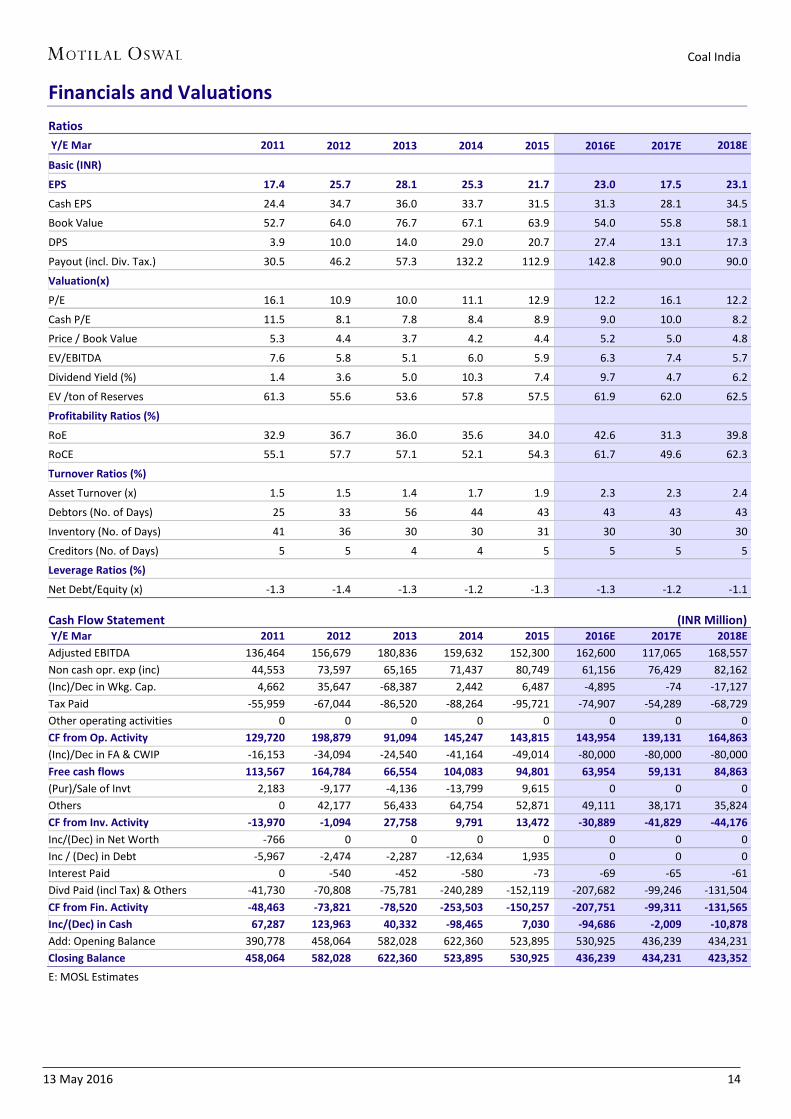
Financials and Valuations Ratios Y/E Mar 2011 2012 2013 2014 2015 2016E 2017E 2018E
Basic (INR)
EPS 17.4 25.7 28.1 25.3 21.7 23.0 17.5 23.1
Cash EPS 24.4 34.7 36.0 33.7 31.5 31.3 28.1 34.5
Book Value 52.7 64.0 76.7 67.1 63.9 54.0 55.8 58.1
DPS 3.9 10.0 14.0 29.0 20.7 27.4 13.1 17.3
Payout (incl. Div. Tax.) 30.5 46.2 57.3 132.2 112.9 142.8 90.0 90.0
Valuation(x)
P/E 16.1 10.9 10.0 11.1 12.9 12.2 16.1 12.2
Cash P/E 11.5 8.1 7.8 8.4 8.9 9.0 10.0 8.2
Price / Book Value 5.3 4.4 3.7 4.2 4.4 5.2 5.0 4.8
EV/EBITDA 7.6 5.8 5.1 6.0 5.9 6.3 7.4 5.7
Dividend Yield (%) 1.4 3.6 5.0 10.3 7.4 9.7 4.7 6.2
EV /ton of Reserves 61.3 55.6 53.6 57.8 57.5 61.9 62.0 62.5
Profitability Ratios (%)
RoE 32.9 36.7 36.0 35.6 34.0 42.6 31.3 39.8
RoCE 55.1 57.7 57.1 52.1 54.3 61.7 49.6 62.3
Turnover Ratios (%)
Asset Turnover (x) 1.5 1.5 1.4 1.7 1.9 2.3 2.3 2.4
Debtors (No. of Days) 25 33 56 44 43 43 43 43
Inventory (No. of Days) 41 36 30 30 31 30 30 30
Creditors (No. of Days) 5 5 4 4 5 5 5 5
Leverage Ratios (%)
Net Debt/Equity (x) -1.3 -1.4 -1.3 -1.2 -1.3 -1.3 -1.2 -1.1
Cash Flow Statement (INR Million) Y/E Mar 2011 2012 2013 2014 2015 2016E 2017E 2018E Adjusted EBITDA 136,464 156,679 180,836 159,632 152,300 162,600 117,065 168,557 Non cash opr. exp (inc) 44,553 73,597 65,165 71,437 80,749 61,156 76,429 82,162 (Inc)/Dec in Wkg. Cap. 4,662 35,647 -68,387 2,442 6,487 -4,895 -74 -17,127 Tax Paid -55,959 -67,044 -86,520 -88,264 -95,721 -74,907 -54,289 -68,729 Other operating activities 0 0 0 0 0 0 0 0 CF from Op. Activity 129,720 198,879 91,094 145,247 143,815 143,954 139,131 164,863 (Inc)/Dec in FA & CWIP -16,153 -34,094 -24,540 -41,164 -49,014 -80,000 -80,000 -80,000 Free cash flows 113,567 164,784 66,554 104,083 94,801 63,954 59,131 84,863 (Pur)/Sale of Invt 2,183 -9,177 -4,136 -13,799 9,615 0 0 0 Others 0 42,177 56,433 64,754 52,871 49,111 38,171 35,824 CF from Inv. Activity -13,970 -1,094 27,758 9,791 13,472 -30,889 -41,829 -44,176 Inc/(Dec) in Net Worth -766 0 0 0 0 0 0 0 Inc / (Dec) in Debt -5,967 -2,474 -2,287 -12,634 1,935 0 0 0 Interest Paid 0 -540 -452 -580 -73 -69 -65 -61 Divd Paid (incl Tax) & Others -41,730 -70,808 -75,781 -240,289 -152,119 -207,682 -99,246 -131,504 CF from Fin. Activity -48,463 -73,821 -78,520 -253,503 -150,257 -207,751 -99,311 -131,565 Inc/(Dec) in Cash 67,287 123,963 40,332 -98,465 7,030 -94,686 -2,009 -10,878 Add: Opening Balance 390,778 458,064 582,028 622,360 523,895 530,925 436,239 434,231 Closing Balance 458,064 582,028 622,360 523,895 530,925 436,239 434,231 423,352 E: MOSL Estimates
Coal India
Powergrid TATA Hindalco
Sector Updates
METALS GALLERY
Coal India
13 May 2016 16
Disclosures This document has been prepared by Motilal Oswal Securities Limited (hereinafter referred to as Most) to provide information about the company (ies) and/sector(s), if any, covered in the report and may be distributed by it and/or its affiliated company(ies). This report is for personal information of the selected recipient/s and does not construe to be any investment, legal or taxation advice to you. This research report does not constitute an offer, invitation or inducement to invest in securities or other investments and Motilal Oswal Securities Limited (hereinafter referred as MOSt) is not soliciting any action based upon it. This report is not for public distribution and has been furnished to you solely for your general information and should not be reproduced or redistributed to any other person in any form. This report does not constitute a personal recommendation or take into account the particular investment objectives, financial situations, or needs of individual clients. Before acting on any advice or recommendation in this material, investors should consider whether it is suitable for their particular circumstances and, if necessary, seek professional advice. The price and value of the investments referred to in this material and the income from them may go down as well as up, and investors may realize losses on any investments. Past performance is not a guide for future performance, future returns are not guaranteed and a loss of original capital may occur.
MOSt and its affiliates are a full-service, integrated investment banking, investment management, brokerage and financing group. We and our affiliates have investment banking and other business relationships with a some companies covered by our Research Department. Our research professionals may provide input into our investment banking and other business selection processes. Investors should assume that MOSt and/or its affiliates are seeking or will seek investment banking or other business from the company or companies that are the subject of this material and that the research professionals who were involved in preparing this material may educate investors on investments in such business . The research professionals responsible for the preparation of this document may interact with trading desk personnel, sales personnel and other parties for the purpose of gathering, applying and interpreting information. Our research professionals are paid on twin parameters of performance & profitability of MOSt. MOSt generally prohibits its analysts, persons reporting to analysts, and members of their households from maintaining a financial interest in the securities or derivatives of any companies that the analysts cover. Additionally, MOSt generally prohibits its analysts and persons reporting to analysts from serving as an officer, director, or advisory board member of any companies that the analysts cover. Our salespeople, traders, and other professionals or affiliates may provide oral or written market commentary or trading strategies to our clients that reflect opinions that are contrary to the opinions expressed herein, and our proprietary trading and investing businesses may make investment decisions that are inconsistent with the recommendations expressed herein. In reviewing these materials, you should be aware that any or all of the foregoing among other things, may give rise to real or potential conflicts of interest. MOSt and its affiliated company(ies), their directors and employees and their relatives may; (a) from time to time, have a long or short position in, act as principal in, and buy or sell the securities or derivatives thereof of companies mentioned herein. (b) be engaged in any other transaction involving such securities and earn brokerage or other compensation or act as a market maker in the financial instruments of the company(ies) discussed herein or act as an advisor or lender/borrower to such company(ies) or may have any other potential conflict of interests with respect to any recommendation and other related information and opinions.; however the same shall have no bearing whatsoever on the specific recommendations made by the analyst(s), as the recommendations made by the analyst(s) are completely independent of the views of the affiliates of MOSt even though there might exist an inherent conflict of interest in some of the stocks mentioned in the research report Reports based on technical and derivative analysis center on studying charts company's price movement, outstanding positions and trading volume, as opposed to focusing on a company's fundamentals and, as such, may not match with a report on a company's fundamental analysis. In addition MOST has different business segments / Divisions with independent research separated by Chinese walls catering to different set of customers having various objectives, risk profiles, investment horizon, etc, and therefore may at times have different contrary views on stocks sectors and markets.
Unauthorized disclosure, use, dissemination or copying (either whole or partial) of this information, is prohibited. The person accessing this information specifically agrees to exempt MOSt or any of its affiliates or employees from, any and all responsibility/liability arising from such misuse and agrees not to hold MOSt or any of its affiliates or employees responsible for any such misuse and further agrees to hold MOSt or any of its affiliates or employees free and harmless from all losses, costs, damages, expenses that may be suffered by the person accessing this information due to any errors and delays. The information contained herein is based on publicly available data or other sources believed to be reliable. Any statements contained in this report attributed to a third party represent MOSt’s interpretation of the data, information and/or opinions provided by that third party either publicly or through a subscription service, and such use and interpretation have not been reviewed by the third party. This Report is not intended to be a complete statement or summary of the securities, markets or developments referred to in the document. While we would endeavor to update the information herein on reasonable basis, MOSt and/or its affiliates are under no obligation to update the information. Also there may be regulatory, compliance, or other reasons that may prevent MOSt and/or its affiliates from doing so. MOSt or any of its affiliates or employees shall not be in any way responsible and liable for any loss or damage that may arise to any person from any inadvertent error in the information contained in this report. MOSt or any of its affiliates or employees do not provide, at any time, any express or implied warranty of any kind, regarding any matter pertaining to this report, including without limitation the implied warranties of merchantability, fitness for a particular purpose, and non-infringement. The recipients of this report should rely on their own investigations.
This report is intended for distribution to institutional investors. Recipients who are not institutional investors should seek advice of their independent financial advisor prior to taking any investment decision based on this report or for any necessary explanation of its contents.
Most and it’s associates may have managed or co-managed public offering of securities, may have received compensation for investment banking or merchant banking or brokerage services, may have received any compensation for products or services other than investment banking or merchant banking or brokerage services from the subject company in the past 12 months. Most and it’s associates have not received any compensation or other benefits from the subject company or third party in connection with the research report. Subject Company may have been a client of Most or its associates during twelve months preceding the date of distribution of the research report
MOSt and/or its affiliates and/or employees may have interests/positions, financial or otherwise of over 1 % at the end of the month immediately preceding the date of publication of the research in the securities mentioned in this report. To enhance transparency, MOSt has incorporated a Disclosure of Interest Statement in this document. This should, however, not be treated as endorsement of the views expressed in the report.
Motilal Oswal Securities Limited is registered as a Research Analyst under SEBI (Research Analyst) Regulations, 2014. SEBI Reg. No. INH000000412
Pending Regulatory inspections against Motilal Oswal Securities Limited: SEBI pursuant to a complaint from client Shri C.R. Mohanraj alleging unauthorized trading, issued a letter dated 29th April 2014 to MOSL notifying appointment of an Adjudicating Officer as per SEBI regulations to hold inquiry and adjudge violation of SEBI Regulations; MOSL replied to the Show Cause Notice whereby SEBI granted us an opportunity of Inspection of Documents. Since all the documents requested by us were not covered we have requested to SEBI vide our letter dated June 23, 2015 to provide pending list of documents for inspection.
List of associate companies of Motilal Oswal Securities Limited -Click here to access detailed report Analyst Certification The views expressed in this research report accurately reflect the personal views of the analyst(s) about the subject securities or issues, and no part of the compensation of the research analyst(s) was, is, or will be directly or indirectly related to the specific recommendations and views expressed by research analyst(s) in this report. The research analysts, strategists, or research associates principally responsible for preparation of MOSt research receive compensation based upon various factors, including quality of research, investor client feedback, stock picking, competitive factors and firm revenues Disclosure of Interest Statement COAL INDIA Analyst ownership of the stock No Served as an officer, director or employee No A graph of daily closing prices of securities is available at www.nseindia.com and http://economictimes.indiatimes.com/markets/stocks/stock-quotes
Regional Disclosures (outside India) This report is not directed or intended for distribution to or use by any person or entity resident in a state, country or any jurisdiction, where such distribution, publication, availability or use would be contrary to law, regulation or which would subject MOSt & its group companies to registration or licensing requirements within such jurisdictions.
For Hong Kong: This report is distributed in Hong Kong by Motilal Oswal capital Markets (Hong Kong) Private Limited, a licensed corporation (CE AYY-301) licensed and regulated by the Hong Kong Securities and Futures Commission (SFC) pursuant to the Securities and Futures Ordinance (Chapter 571 of the Laws of Hong Kong) “SFO”. As per SEBI (Research Analyst Regulations) 2014 Motilal Oswal Securities (SEBI Reg No. INH000000412) has an agreement with Motilal Oswal capital Markets (Hong Kong) Private Limited for distribution of research report in Kong Kong. This report is intended for distribution only to “Professional Investors” as defined in Part I of Schedule 1 to SFO. Any investment or investment activity to which this document relates is only available to professional investor and will be engaged only with professional investors.” Nothing here is an offer or solicitation of these securities, products and services in any jurisdiction where their offer or sale is not qualified or exempt from registration. The Indian Analyst(s) who compile this report is/are not located in Hong Kong & are not conducting Research Analysis in Hong Kong.
For U.S Motilal Oswal Securities Limited (MOSL) is not a registered broker - dealer under the U.S. Securities Exchange Act of 1934, as amended (the"1934 act") and under applicable state laws in the United States. In addition MOSL is not a registered investment adviser under the U.S. Investment Advisers Act of 1940, as amended (the "Advisers Act" and together with the 1934 Act, the "Acts), and under applicable state laws in the United States. Accordingly, in the absence of specific exemption under the Acts, any brokerage and investment services provided by MOSL, including the products and services described herein are not available to or intended for U.S. persons.
This report is intended for distribution only to "Major Institutional Investors" as defined by Rule 15a-6(b)(4) of the Exchange Act and interpretations thereof by SEC (henceforth referred to as "major institutional investors"). This document must not be acted on or relied on by persons who are not major institutional investors. Any investment or investment activity to which this document relates is only available to major institutional investors and will be engaged in only with major institutional investors. In reliance on the exemption from registration provided by Rule 15a-6 of the U.S. Securities Exchange Act of 1934, as amended (the "Exchange Act") and interpretations thereof by the U.S. Securities and Exchange Commission ("SEC") in order to conduct business with Institutional Investors based in the U.S., MOSL has entered into a chaperoning agreement with a U.S. registered broker-dealer, Motilal Oswal Securities International Private Limited. ("MOSIPL"). Any business interaction pursuant to this report will have to be executed within the provisions of this chaperoning agreement.
The Research Analysts contributing to the report may not be registered /qualified as research analyst with FINRA. Such research analyst may not be associated persons of the U.S. registered broker-dealer, MOSIPL, and therefore, may not be subject to NASD rule 2711 and NYSE Rule 472 restrictions on communication with a subject company, public appearances and trading securities held by a research analyst account.
For Singapore Motilal Oswal Capital Markets Singapore Pte Limited is acting as an exempt financial advisor under section 23(1)(f) of the Financial Advisers Act(FAA) read with regulation 17(1)(d) of the Financial Advisors Regulations and is a subsidiary of Motilal Oswal Securities Limited in India. This research is distributed in Singapore by Motilal Oswal Capital Markets Singapore Pte Limited and it is only directed in Singapore to accredited investors, as defined in the Financial Advisers Regulations and the Securities and Futures Act (Chapter 289), as amended from time to time.
In respect of any matter arising from or in connection with the research you could contact the following representatives of Motilal Oswal Capital Markets Singapore Pte Limited: Varun Kumar Kadambari Balachandran [email protected] [email protected] Contact : (+65) 68189232 (+65) 68189233 / 65249115 Office Address:21 (Suite 31),16 Collyer Quay,Singapore 04931
Motilal Oswal Securities Ltd
Motilal Oswal Tower, Level 9, Sayani Road, Prabhadevi, Mumbai 400 025 Phone: +91 22 3982 5500 E-mail: [email protected]
Related Documents