Classification and Prediction: Basic Concepts Bamshad Mobasher DePaul University

Classification and Prediction: Basic Concepts Bamshad Mobasher DePaul University Bamshad Mobasher DePaul University.
Dec 22, 2015
Welcome message from author
This document is posted to help you gain knowledge. Please leave a comment to let me know what you think about it! Share it to your friends and learn new things together.
Transcript
Classification and Prediction:Basic Concepts
Bamshad MobasherDePaul University
Bamshad MobasherDePaul University

2
What Is Classification?i The goal of data classification is to organize and
categorize data in distinct classes4 A model is first created based on the data distribution4 The model is then used to classify new data4 Given the model, a class can be predicted for new data
i Classification = prediction for discrete and nominal values (e.g., class/category labels)4 Also called “Categorization”

3
Prediction, Clustering, Classificationi What is Prediction/Estimation?
4 The goal of prediction is to forecast or deduce the value of an attribute based on values of other attributes
4 A model is first created based on the data distribution4 The model is then used to predict future or unknown values4 Most common approach: regression analysis
i Supervised vs. Unsupervised Classification4 Supervised Classification = Classification
h We know the class labels and the number of classes
4 Unsupervised Classification = Clusteringh We do not know the class labels and may not know the
number of classes

4
Classification Taski Given:
4 A description of an instance, x X, where X is the instance language or instance or feature space.
h Typically, x is a row in a table with the instance/feature space described in terms of features or attributes.
4 A fixed set of class or category labels: C={c1, c2,…cn}
i Classification task is to determine:4 The class/category of x: c(x) C, where c(x) is a function whose
domain is X and whose range is C.

5
Learning for Classification
i A training example is an instance xX, paired with its correct class label c(x): <x, c(x)> for an unknown classification function, c.
i Given a set of training examples, D4 Find a hypothesized classification function, h(x), such that: h(x) =
c(x), for all training instances (i.e., for all <x, c(x)> in D). This is called consistency.
6
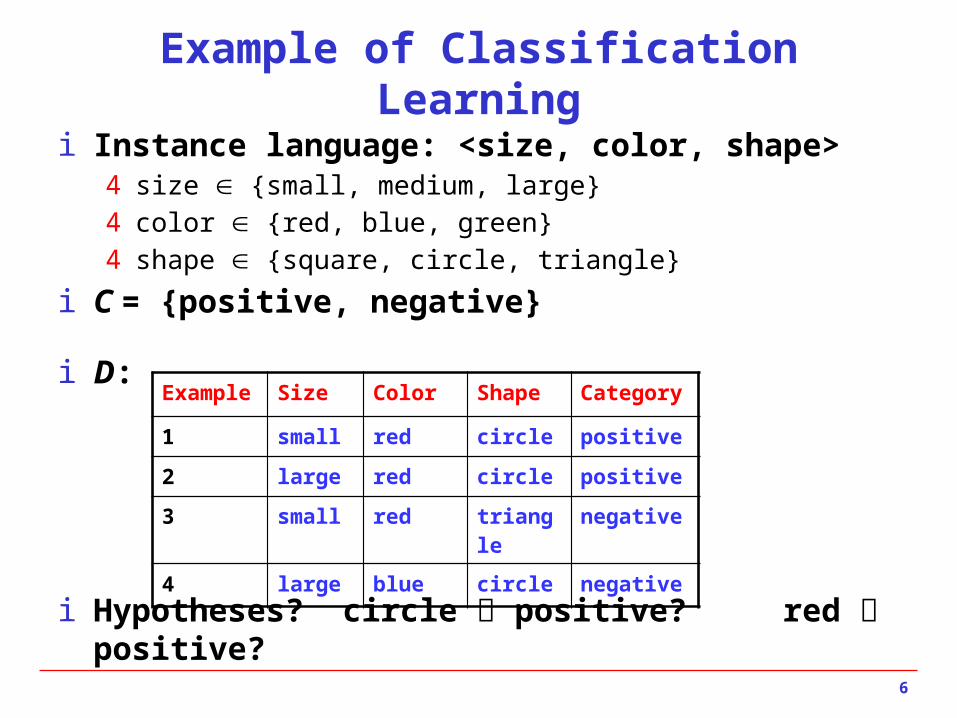
Example of Classification Learning
i Instance language: <size, color, shape>4 size {small, medium, large}4 color {red, blue, green}4 shape {square, circle, triangle}
i C = {positive, negative}
i D:
i Hypotheses? circle positive? red positive?
Example Size Color Shape Category
1 small red circle positive
2 large red circle positive
3 small red triangle negative
4 large blue circle negative
7
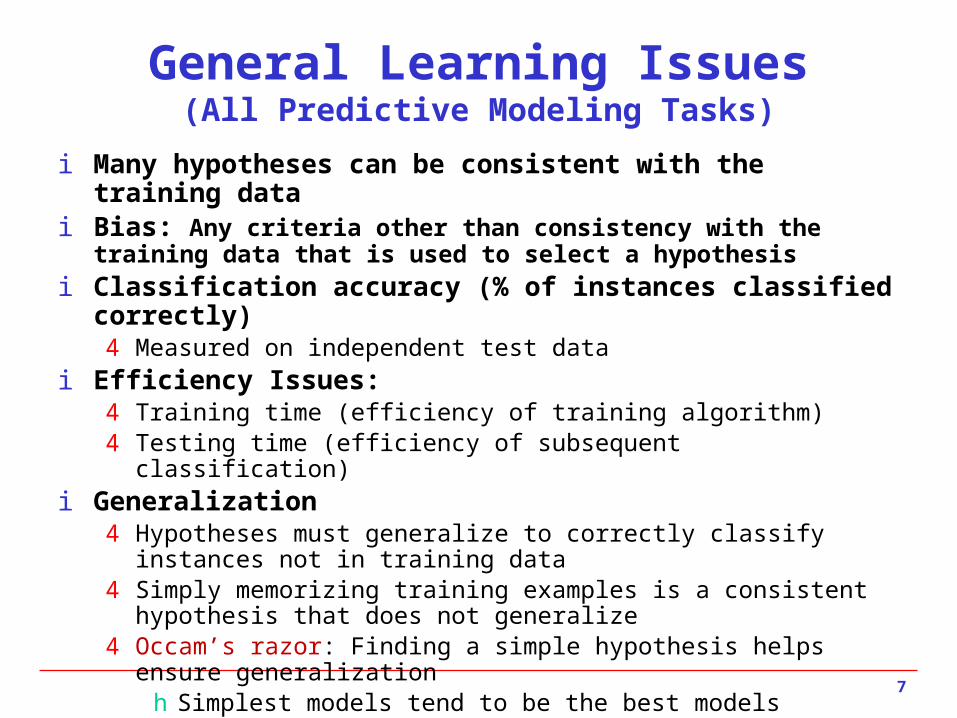
General Learning Issues(All Predictive Modeling Tasks)
i Many hypotheses can be consistent with the training datai Bias: Any criteria other than consistency with the training data that is used to
select a hypothesisi Classification accuracy (% of instances classified correctly)
4 Measured on independent test datai Efficiency Issues:
4 Training time (efficiency of training algorithm)4 Testing time (efficiency of subsequent classification)
i Generalization4 Hypotheses must generalize to correctly classify instances not in training data4 Simply memorizing training examples is a consistent hypothesis that does not
generalize4 Occam’s razor: Finding a simple hypothesis helps ensure generalization
h Simplest models tend to be the best modelsh The KISS principle

8
Classification: 3 Step Processi 1. Model construction (Learning):
4 Each record (instance, example) is assumed to belong to a predefined class, as determined by one of the attributes
h This attribute is call the target attributeh The values of the target attribute are the class labels
4 The set of all instances used for learning the model is called training set
4 The model may be represented in many forms: decision trees, probabilities, neural networks, ….
i 2. Model Evaluation (Accuracy):4 Estimate accuracy rate of the model based on a test set4 The known labels of test instances are compared with the predicts class
from model4 Test set is independent of training set otherwise over-fitting will occur
i 3. Model Use (Classification):4 The model is used to classify unseen instances (i.e., to predict the class
labels for new unclassified instances)4 Predict the value of an actual attribute

9
Model Construction

10
Model Evaluation

11
Model Use: Classification
12
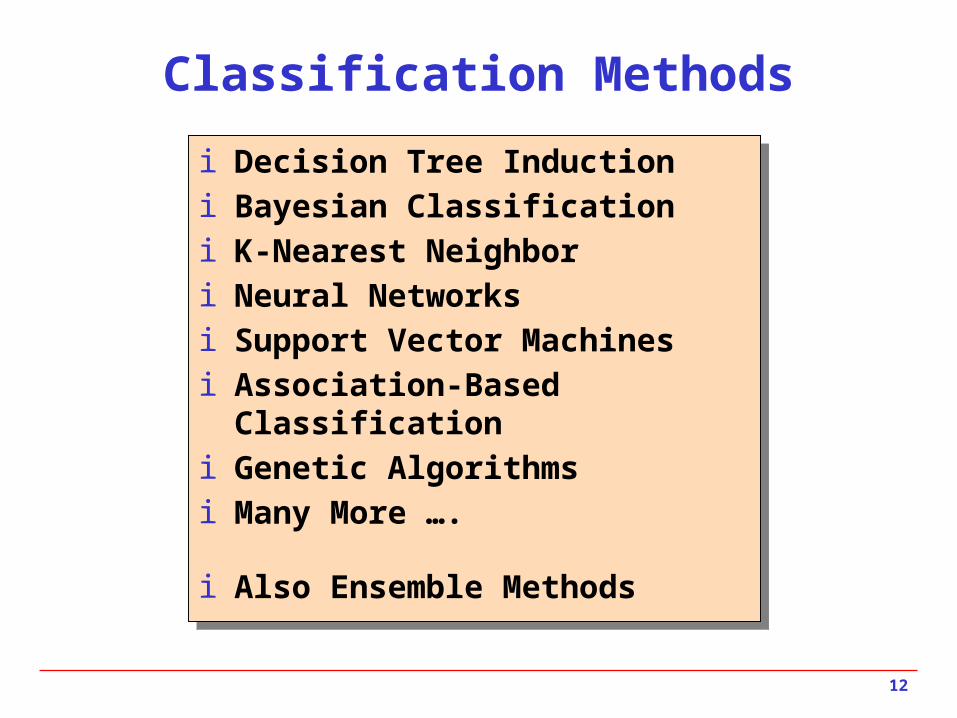
Classification Methods
i Decision Tree Inductioni Bayesian Classificationi K-Nearest Neighbori Neural Networksi Support Vector Machinesi Association-Based
Classificationi Genetic Algorithmsi Many More ….
i Also Ensemble Methods
i Decision Tree Inductioni Bayesian Classificationi K-Nearest Neighbori Neural Networksi Support Vector Machinesi Association-Based
Classificationi Genetic Algorithmsi Many More ….
i Also Ensemble Methods
13
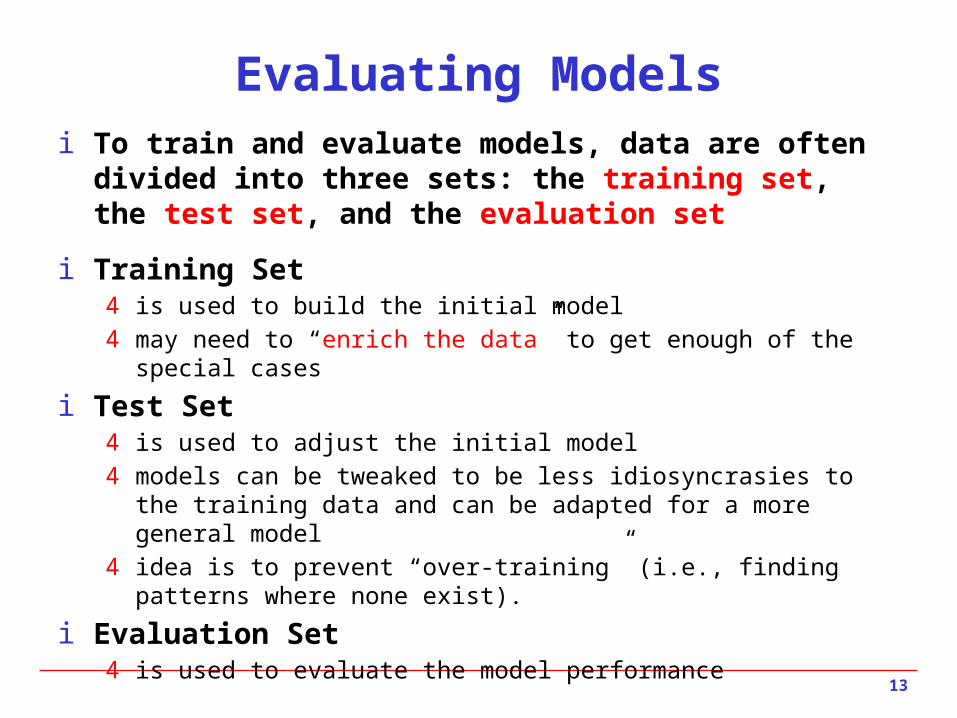
Evaluating Modelsi To train and evaluate models, data are often divided into three
sets: the training set, the test set, and the evaluation set
i Training Set4 is used to build the initial model4 may need to “enrich the data” to get enough of the special cases
i Test Set4 is used to adjust the initial model4 models can be tweaked to be less idiosyncrasies to the training data and can be
adapted for a more general model4 idea is to prevent “over-training” (i.e., finding patterns where none exist).
i Evaluation Set4 is used to evaluate the model performance
14
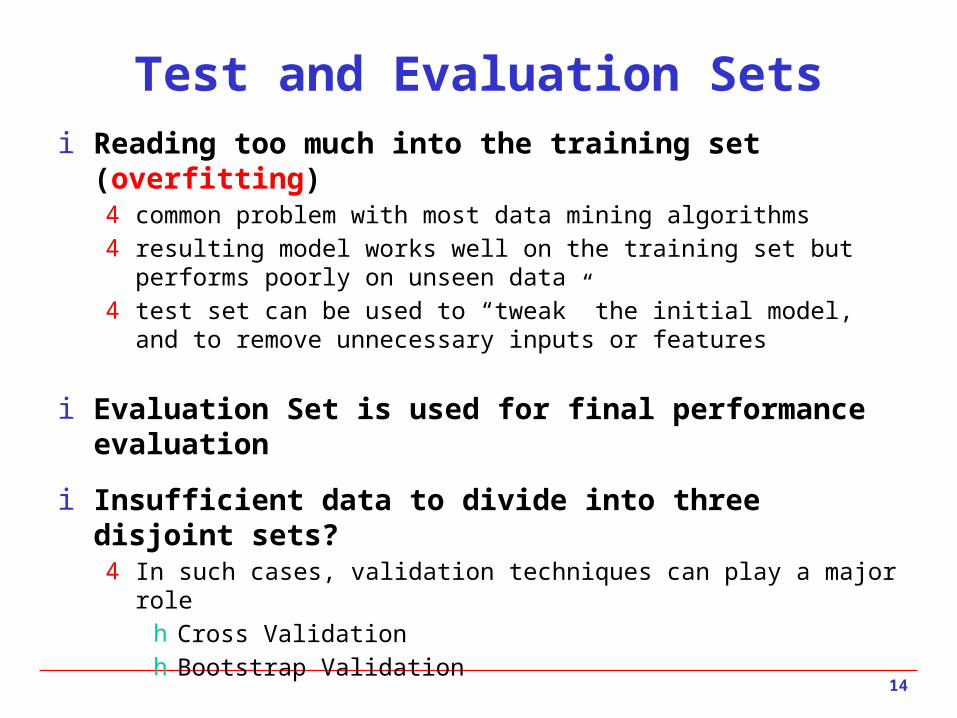
Test and Evaluation Setsi Reading too much into the training set (overfitting)
4 common problem with most data mining algorithms 4 resulting model works well on the training set but performs poorly on unseen
data4 test set can be used to “tweak” the initial model, and to remove unnecessary
inputs or features
i Evaluation Set is used for final performance evaluation
i Insufficient data to divide into three disjoint sets?4 In such cases, validation techniques can play a major role
h Cross Validationh Bootstrap Validation

15
Cross Validationi Cross validation is a heuristic that works as follows
4 randomly divide the data into n folds, each with approximately the same number of records
4 create n models using the same algorithms and training parameters; each model is trained with n-1 folds of the data and tested on the remaining fold
4 can be used to find the best algorithm and its optimal training parameter
i Steps in Cross Validation4 1. Divide the available data into a training set and an evaluation set4 2. Split the training data into n folds4 3. Select an algorithm and training parameters4 4. Train and test n models using the n train-test splits4 5. Repeat step 2 to 4 using different algorithms / parameters and compare
model accuracies4 6. Select the best model4 7. Use all the training data to train the model4 8. Assess the final model using the evaluation set
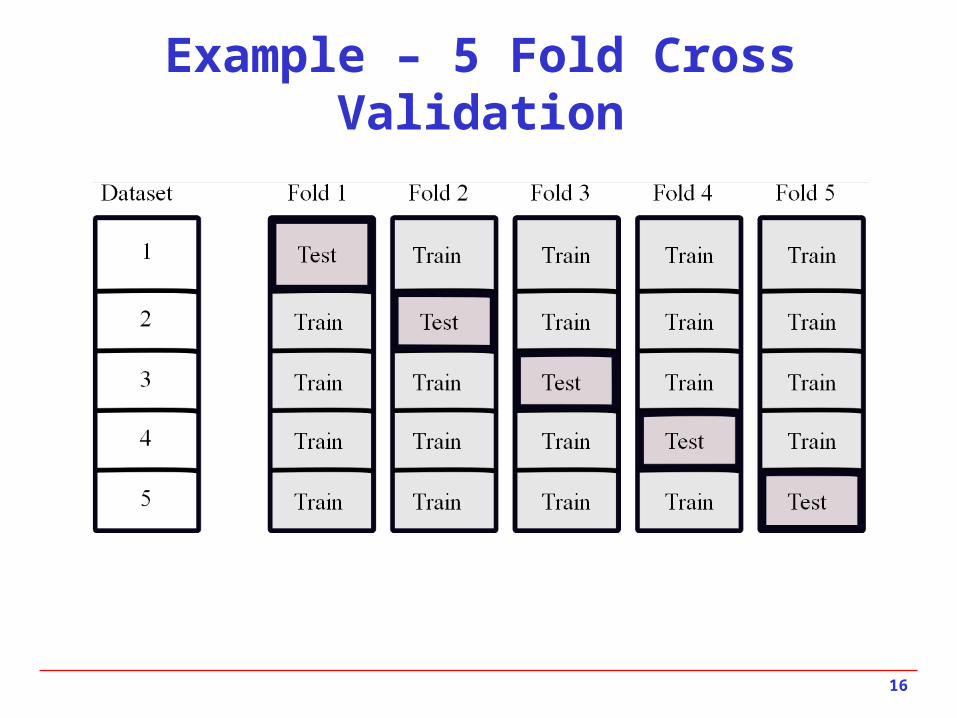
Example – 5 Fold Cross Validation
16

17
Bootstrap Validationi Based on the statistical procedure of sampling with replacement
4 data set of n instances is sampled n times (with replacement) to give another data set of n instances
4 since some elements will be repeated, there will be elements in the original data set that are not picked
4 these remaining instances are used as the test set
i How many instances in the test set?4 Probability of not getting picked in one sampling = 1 - 1/n4 Pr(not getting picked in n samples) = (1 -1/n)n = e-1 = 0.3684 so, for large data set, test set will contain about 36.8% of instances4 to compensate for smaller training sample (63.2%), test set error rate is combined
with the re-substitution error in training set:
e = (0.632 * e test instance) + (0.368 * e training instance)
i Bootstrap validation increases variance that can occur in each fold
18
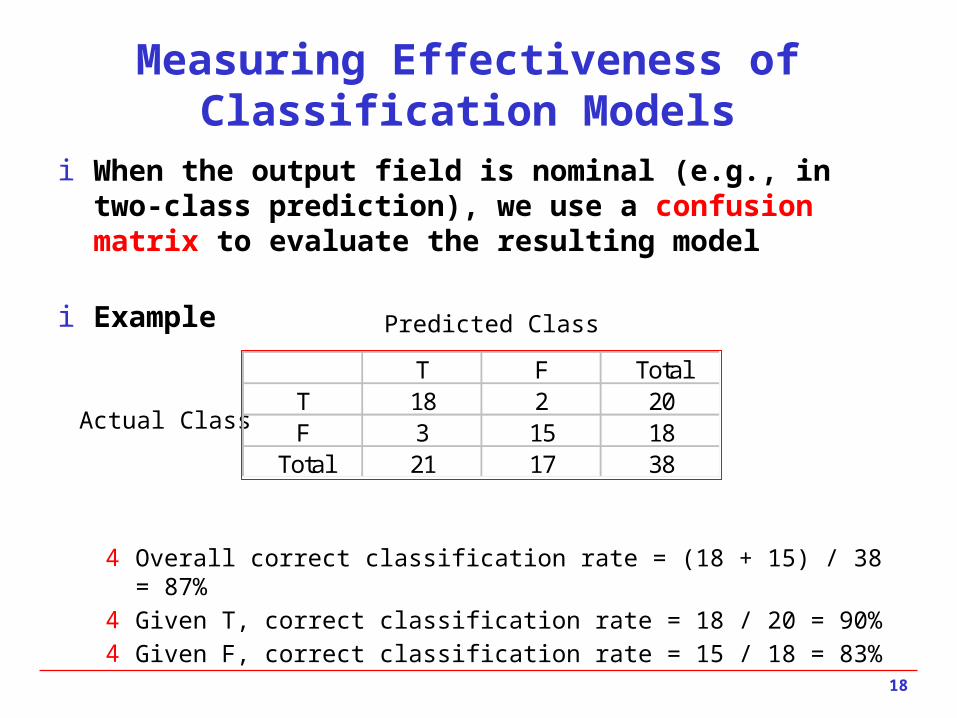
Measuring Effectiveness of Classification Models
i When the output field is nominal (e.g., in two-class prediction), we use a confusion matrix to evaluate the resulting model
i Example
4 Overall correct classification rate = (18 + 15) / 38 = 87%4 Given T, correct classification rate = 18 / 20 = 90%4 Given F, correct classification rate = 15 / 18 = 83%
T F TotalT 18 2 20F 3 15 18
Total 21 17 38
Predicted Class
Actual Class
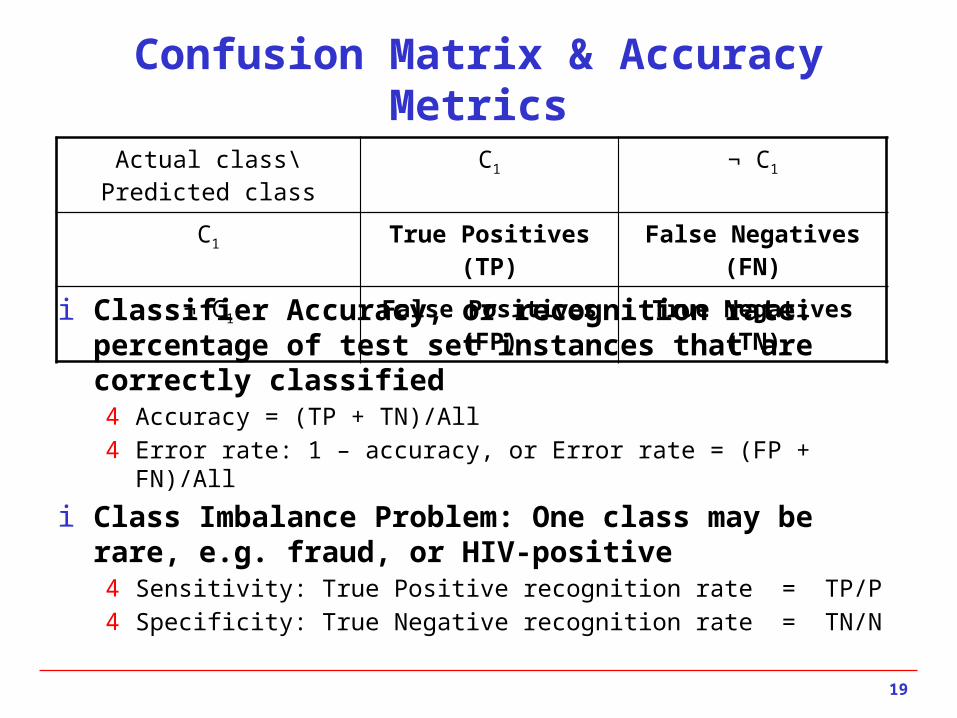
Confusion Matrix & Accuracy Metrics
i Classifier Accuracy, or recognition rate: percentage of test set instances that are correctly classified4 Accuracy = (TP + TN)/All4 Error rate: 1 – accuracy, or Error rate = (FP + FN)/All
i Class Imbalance Problem: One class may be rare, e.g. fraud, or HIV-positive4 Sensitivity: True Positive recognition rate = TP/P4 Specificity: True Negative recognition rate = TN/N
19
Actual class\Predicted class C1 ¬ C1
C1 True Positives (TP) False Negatives (FN)
¬ C1 False Positives (FP) True Negatives (TN)
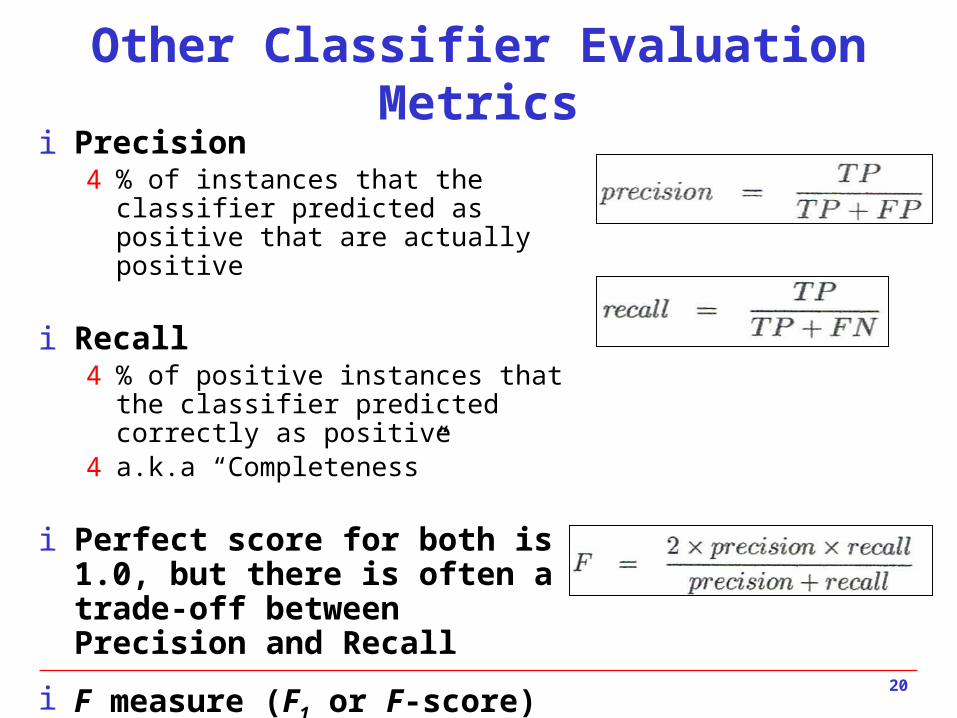
Other Classifier Evaluation Metricsi Precision
4 % of instances that the classifier predicted as positive that are actually positive
i Recall4 % of positive instances that the classifier
predicted correctly as positive4 a.k.a “Completeness”
i Perfect score for both is 1.0, but there is often a trade-off between Precision and Recall
i F measure (F1 or F-score)4 harmonic mean of precision and recall
20
21
What Is Prediction/Estimation?i (Numerical) prediction is similar to classification
4 construct a model4 use model to predict continuous or ordered value for a given input
i Prediction is different from classification4 Classification refers to predict categorical class label4 Prediction models continuous-valued functions
i Major method for prediction: regression4 model the relationship between one or more independent or predictor
variables and a dependent or response variablei Regression analysis
4 Linear and multiple regression4 Non-linear regression4 Other regression methods: generalized linear model, Poisson regression,
log-linear models, regression trees

22
Linear Regression
i Linear regression: involves a response variable y and a single predictor variable x y = w0 + w1 x
4 w0 (y-intercept) and w1 (slope) are regression coefficients
i Method of least squares: estimates the best-fitting straight line
i Multiple linear regression: involves more than one predictor variable
4 Training data is of the form (X1, y1), (X2, y2),…, (X|D|, y|D|)
4 Ex. For 2-D data, we may have: y = w0 + w1 x1+ w2 x2
4 Solvable by extension of least square method
4 Many nonlinear functions can be transformed into the above
||
1
2
||
11
)(
))((
D
ii
D
iii
xx
yyxxw xwyw 10

23
i Some nonlinear models can be modeled by a polynomial function
i A polynomial regression model can be transformed into linear regression model. For example,
y = w0 + w1 x + w2 x2 + w3 x3
is convertible to linear with new variables: x2 = x2, x3= x3
y = w0 + w1 x + w2 x2 + w3 x3
i Other functions, such as power function, can also be transformed to linear model
i Some models are intractable nonlinear (e.g., sum of exponential terms)4 possible to obtain least squares estimates through extensive
computation on more complex functions
Nonlinear Regression

24
i Generalized linear models
4 Foundation on which linear regression can be applied to modeling categorical response variables
4 Variance of y is a function of the mean value of y, not a constant
4 Logistic regression: models the probability of some event occurring as a linear function of a set of predictor variables
4 Poisson regression: models the data that exhibit a Poisson distribution
i Log-linear models (for categorical data)
4 Approximate discrete multidimensional prob. distributions
4 Also useful for data compression and smoothing
i Regression trees and model trees
4 Trees to predict continuous values rather than class labels
Other Regression-Based Models

25
Regression Trees and Model Treesi Regression tree: proposed in CART system (Breiman et al. 1984)
4 CART: Classification And Regression Trees
4 Each leaf stores a continuous-valued prediction
4 It is the average value of the predicted attribute for the training instances
that reach the leaf
i Model tree: proposed by Quinlan (1992)
4 Each leaf holds a regression model—a multivariate linear equation for
the predicted attribute
4 A more general case than regression tree
i Regression and model trees tend to be more accurate than linear
regression when instances are not represented well by simple linear
models

26
Evaluating Numeric Predictioni Prediction Accuracy
4 Difference between predicted scores and the actual results (from evaluation set)4 Typically the accuracy of the model is measured in terms of variance (i.e., average
of the squared differences)
i Common Metrics (pi = predicted target value for test instance i, ai = actual target value for instance i)
4 Mean Absolute Error: Average loss over the test set
4 Root Mean Squared Error: compute the standard deviation (i.e., square root of the co-variance between predicted and actual ratings)
n
apapRMSE nn
2211 )(...)(
n
apapMAE nn )(...)( 11

Classification and Prediction:Basic Concepts
Bamshad MobasherDePaul University
Bamshad MobasherDePaul University
Related Documents