This journal is c the Owner Societies 2011 Phys. Chem. Chem. Phys., 2011, 13, 8549–8559 8549 Cite this: Phys. Chem. Chem. Phys., 2011, 13, 8549–8559 Towards the complete experiment: measurement of S( 1 D 2 ) polarization in correlation with single rotational states of CO(J) from the photodissociation of oriented OCS(v 2 = 1|JlM = 111) M. Laura Lipciuc, a T. Peter Rakitzis, b W. Leo Meerts, ac Gerrit C. Groenenboom c and Maurice H. M. Janssen* a Received 26th November 2010, Accepted 8th March 2011 DOI: 10.1039/c0cp02671a In this paper we report slice imaging polarization experiments on the state-to-state photodissociation at 42 594 cm 1 of spatially oriented OCS(v 2 = 1|JlM = 111) - CO(J) + S( 1 D 2 ). Slice images were measured of the three-dimensional recoil distribution of the S( 1 D 2 ) photofragment for different polarization geometries of the photolysis and probe laser. The high resolution slice images show well separated velocity rings in the S( 1 D 2 ) velocity distribution. The velocity rings of the S( 1 D 2 ) photofragment correlate with individual rotational states of the CO(J) cofragment in the J CO = 57–65 region. The angular distribution of the S( 1 D 2 ) velocity rings are extracted and analyzed using two different polarization models. The first model assumes the nonaxial dynamics evolves after excitation to a single potential energy surface of an oriented OCS(v 2 = 1|JlM = 111) molecule. The second model assumes the excitation is to two potential energy surfaces, and the OCS molecule is randomly oriented. In the high J region (J CO = 62–65) it appears that both models fit the polarization very well, in the region J CO = 57–61 both models seem to fit the data less well. From the molecular frame alignment moments the m-state distribution of S( 1 D 2 ) is calculated as a function of the CO(J) channel. A comparison is made with the theoretical m-state distribution calculated from the long-range electrostatic dipole–dipole plus quadrupole interaction model. The S( 1 D 2 ) photofragment velocity distribution shows a very pronounced strong peak for S( 1 D 2 ) fragments born in coincidence with CO(J = 61). I. Introduction Polarization of the electronic angular momentum of atomic photofragments can be induced by photodissociation of molecules with polarized light. 1 Measurement of the photo- fragment angular momentum polarization and v–J correlation, where v is the laboratory velocity of the fragment, can provide detailed insight into the dynamics of the photodissociation process. 2–4 The v–J correlation, together with the measurement of the recoil anisotropy parameter, 5 can be used to determine the symmetry of excited states, the (anisotropic) shape of dissociative surfaces, the nature of avoided crossings, and the influence of the long-range interaction forces. 3,4,6–8 Photo- fragment imaging methods 9–17 are powerful techniques for the study of photodissociation processes. The directly measured or inverted three-dimensional (3D) recoil distribution of photofragments provides the angular and velocity distribution of the fragments. Detection of the fragment with varying polarization of the probe light can reveal the (potentially induced) electronic or rotational anisotropy of the fragment. The application of imaging to measure anisotropy of angular momentum was demonstrated shortly after the invention of ion imaging 9 in a study of the alignment of the rotational angular momentum of the methyl fragment from the photo- dissociation of methyl iodide. 18 The photodissociation of carbonyl sulfide (OCS) has been extensively investigated in the wavelength region of 222–248 nm, 14,19–35 which is near the maximum and on the red side of the absorption band. 36,37 During the last five years there have been many new studies published on the photo- dissociation of OCS and these high quality experimental data have turned the OCS molecule into a benchmark system for photodissociation studies of triatomic molecules. Following absorption of a UV photon around 230 nm OCS(X 1 S + ) dissociates into S(95% 1 D 2 , 5% 3 P 2 ) and CO(X 1 S + ) photo- fragments. 20 The CO fragments are released in the vibrational ground state but are rotationally highly excited. In the X 1 S + ground electronic state the OCS molecule is linear. As reported a LaserLaB Amsterdam and Department of Chemistry, Vrije Universiteit, de Boelelaan 1083, 1081 HV Amsterdam, The Netherlands. E-mail: [email protected] b Department of Physics, University of Crete, and IESL-FORTH, P.O. 1527, 71110, Heraklion, Greece c Institute for Molecules and Materials, Radboud University Nijmegen, Heyendaalseweg 135, 6525 AJ Nijmegen, The Netherlands PCCP Dynamic Article Links www.rsc.org/pccp PAPER Downloaded by Radboud Universiteit Nijmegen on 21 April 2011 Published on 22 March 2011 on http://pubs.rsc.org | doi:10.1039/C0CP02671A View Online

Welcome message from author
This document is posted to help you gain knowledge. Please leave a comment to let me know what you think about it! Share it to your friends and learn new things together.
Transcript
This journal is c the Owner Societies 2011 Phys. Chem. Chem. Phys., 2011, 13, 8549–8559 8549
Cite this: Phys. Chem. Chem. Phys., 2011, 13, 8549–8559
Towards the complete experiment: measurement of S(1D2) polarization
in correlation with single rotational states of CO(J) from the
photodissociation of oriented OCS(v2 = 1|JlM = 111)
M. Laura Lipciuc,a T. Peter Rakitzis,b W. Leo Meerts,ac Gerrit C. Groenenboomc
and Maurice H. M. Janssen*a
Received 26th November 2010, Accepted 8th March 2011
DOI: 10.1039/c0cp02671a
In this paper we report slice imaging polarization experiments on the state-to-state
photodissociation at 42 594 cm�1 of spatially oriented OCS(v2 = 1|JlM = 111) -
CO(J) + S(1D2). Slice images were measured of the three-dimensional recoil distribution of the
S(1D2) photofragment for different polarization geometries of the photolysis and probe laser. The
high resolution slice images show well separated velocity rings in the S(1D2) velocity distribution.
The velocity rings of the S(1D2) photofragment correlate with individual rotational states of the
CO(J) cofragment in the JCO = 57–65 region. The angular distribution of the S(1D2) velocity
rings are extracted and analyzed using two different polarization models. The first model assumes
the nonaxial dynamics evolves after excitation to a single potential energy surface of an oriented
OCS(v2 = 1|JlM = 111) molecule. The second model assumes the excitation is to two potential
energy surfaces, and the OCS molecule is randomly oriented. In the high J region (JCO = 62–65)
it appears that both models fit the polarization very well, in the region JCO = 57–61 both models
seem to fit the data less well. From the molecular frame alignment moments the m-state
distribution of S(1D2) is calculated as a function of the CO(J) channel. A comparison is made
with the theoretical m-state distribution calculated from the long-range electrostatic dipole–dipole
plus quadrupole interaction model. The S(1D2) photofragment velocity distribution shows a very
pronounced strong peak for S(1D2) fragments born in coincidence with CO(J = 61).
I. Introduction
Polarization of the electronic angular momentum of atomic
photofragments can be induced by photodissociation of
molecules with polarized light.1 Measurement of the photo-
fragment angular momentum polarization and v–J correlation,
where v is the laboratory velocity of the fragment, can provide
detailed insight into the dynamics of the photodissociation
process.2–4 The v–J correlation, together with the measurement
of the recoil anisotropy parameter,5 can be used to determine
the symmetry of excited states, the (anisotropic) shape of
dissociative surfaces, the nature of avoided crossings, and
the influence of the long-range interaction forces.3,4,6–8 Photo-
fragment imaging methods9–17 are powerful techniques for the
study of photodissociation processes. The directly measured
or inverted three-dimensional (3D) recoil distribution of
photofragments provides the angular and velocity distribution
of the fragments. Detection of the fragment with varying
polarization of the probe light can reveal the (potentially
induced) electronic or rotational anisotropy of the fragment.
The application of imaging to measure anisotropy of angular
momentum was demonstrated shortly after the invention of
ion imaging9 in a study of the alignment of the rotational
angular momentum of the methyl fragment from the photo-
dissociation of methyl iodide.18
The photodissociation of carbonyl sulfide (OCS) has
been extensively investigated in the wavelength region of
222–248 nm,14,19–35 which is near the maximum and on the
red side of the absorption band.36,37 During the last five years
there have been many new studies published on the photo-
dissociation of OCS and these high quality experimental data
have turned the OCS molecule into a benchmark system for
photodissociation studies of triatomic molecules. Following
absorption of a UV photon around 230 nm OCS(X1S+)
dissociates into S(95% 1D2, 5%3P2) and CO(X1S+) photo-
fragments.20 The CO fragments are released in the vibrational
ground state but are rotationally highly excited. In the X1S+
ground electronic state the OCS molecule is linear. As reported
a LaserLaB Amsterdam and Department of Chemistry,Vrije Universiteit, de Boelelaan 1083, 1081 HV Amsterdam,The Netherlands. E-mail: [email protected]
bDepartment of Physics, University of Crete, and IESL-FORTH,P.O. 1527, 71110, Heraklion, Greece
c Institute for Molecules and Materials, Radboud University Nijmegen,Heyendaalseweg 135, 6525 AJ Nijmegen, The Netherlands
PCCP Dynamic Article Links
www.rsc.org/pccp PAPER
Dow
nloa
ded
by R
adbo
ud U
nive
rsite
it N
ijmeg
en o
n 21
Apr
il 20
11Pu
blis
hed
on 2
2 M
arch
201
1 on
http
://pu
bs.r
sc.o
rg |
doi:1
0.10
39/C
0CP0
2671
AView Online
8550 Phys. Chem. Chem. Phys., 2011, 13, 8549–8559 This journal is c the Owner Societies 2011
by Suzuki et al.22 there are three electronic states correlating
with the S(1D) + CO(X1S+) dissociation channel, the 11S+,
11P and 11D states, and one electronic state, the 11S� state,
correlating with the S(3P) + CO(3P+) dissociation channel.
Transitions from the ground electronic state to these electro-
nically excited states are forbidden when the molecule is linear
but become allowed in the bent geometry (Cs). Away from
linearity the 11D electronic state splits into the 21A0 and 21A0 0
Renner–Teller pairs, the 11P splits into 31A0 and 31A0 0 states,
the 11S+ becomes 11A0 and 11S� becomes the 11A0 0 state. At
230 nm only the 21A0(11D) and 11A0 0(11S�) surfaces are
energetically accessible through parallel (21A0) and perpendicular
(11A0 0) transitions. It was reported in the study by Suzuki
et al.22 that nonadiabatic transitions from the 21A0 electro-
nically excited state to the 11A0 electronic ground state take
place during dissociation of OCS and this mechanism is
believed to cause a bimodal rotational distribution of the
CO(J) fragments. Recently,33 state-to-state cross section data
were published for photodissociation of ground state and
vibrationally excited OCS(n2 = 0,1,2), reporting the strong
enhancement of the absorption cross section with increasing
excitation of the bending mode of OCS. This effect was
interpreted as reflecting the strong increase of the transition
dipole moment with increasing OCS bending angle. Furthermore,
calculations of the transition dipole moment22 showed that the
parallel (in plane) component is increasing much faster than
the perpendicular component when the OCS bending angle
increases from 0 to 301. This different change of the strength of
the parallel and perpendicular dipole moment with OCS
bending angle was attributed to cause the different b-parameters
for ground state versus vibrationally excited OCS(n2 = 1).26
Recently, Brouard et al.34 proposed the transition dipole
moment to make an angle of 651–801 to the linear OCS axis.
However, this very large angle seems to be at odds with the ab
initio calculations by Suzuki et al.22 The experiments by
Brouard and coworkers were performed at a photolysis
wavelength of 248 nm which is far out in the red wing of the
absorption spectrum, and perhaps they were more sensitive to
photolysis from higher vibrationally excited states of OCS like
n2 = 1,2. Furthermore, the state-to-state experiments using
spatially oriented OCS(v2 = 1|JlM = 111) concluded that the
angle between the direction of the transition dipole moment
and the direction of the permanent dipole moment, which is
along the linear OCS axis, is about 301.14,28 Very recently,
Danielache et al.38 reported new ab initio calculations on the
potential energy surfaces and the transition dipole moment
function of OCS and the various isotopologues.
It has been reported before23,25,30,34,39,40 that the S(1D2)
photofragment electronic angular momentum is anisotropic.
Siebbeles et al.41 developed a full quantum treatment of the
photodissociation of diatomic molecules in the axial recoil
limit, and Vasyutinskii and coworkers42–44 further developed
this treatment and recently extended the formalism to
predissociating and bending triatomic systems.45–47 Rakitzis
and Zare48 introduced a similar description of photofragment
polarization from diatomic photodissociation in terms of the
molecular-frame polarization parameters a(k)q (p). More recently,
Rakitzis and coworkers have extended this formalism to describe
photofragment polarization from the photodissociation of
polyatomic molecules,49,50 oriented molecules,51 and rotating
parent molecules.52 It was also shown that both formalisms
are fully equivalent and the various alignment parameters can
be related by simple expressions, see e.g. ref. 4 and 50 for a
thorough recent review of this equivalence.
Rakitzis et al.25 interpreted their results for the S(1D2)
alignment after photolysis of OCS at 223 nm in terms of
incoherent (a(k)0 (J) and a(k)q (>)) and coherent (a(k)1 (J,>))
molecular frame anisotropy moments for the fast and slow
S(1D2) + CO(X1S+) channels. These values are in good
agreement with the values reported by Kim et al.23 and
Brouard et al.34
Using a quantum state-selected molecular beam and
velocity map imaging van den Brom et al.30 reported values
of the alignment moments for photolysis of quantum state-
selected OCS at 223 nm and 230 nm. The m-state distribution
can be calculated directly from the a(k)q (p) alignment
moments.48 For the OCS photolysis the m = �1 state seems
to carry most of the population for both fast and slow
channel.25,30,34 However, the interpretation of these a(k)q (p)
parameters (which describe axial-recoil diatomic photo-
dissociation dynamics) is not straightforward for the nonaxial
recoil photodissociation of OCS; therefore, in this paper,
we use the more recently developed a(k)q (s) formalism for
polyatomic nonaxial-recoil photodissociation.49
The long-range dipole–dipole and dipole–quadrupole inter-
action model was introduced by Teule et al.7 to explain the
changing m-state population of O(1D2) with correlated N2(J)
from the photolysis of the isoelectronic molecule N2O around
205 nm. They suggested that the N2O dissociation takes place
adiabatically on the 2A0 and 1A0 0 surfaces until, at large
separation between the fragments, the m-state population
derives from the long-range dipole–quadrupole and quadrupole–
quadrupole interaction. This long-range model was subsequently
used to interpret polarization studies in various other triatomic
systems.53–56 Very recently, a new full theoretical study on
the validity of the long-range model was performed by
Groenenboom and coworkers.57 Preliminary conclusions from
this full theoretical study are that the experimental trend7 that
for O(1D2) born in coincidence with low N2 rotational levels
the population of |M| = 1 sub-levels is preferred, while for the
highest rotational levels of N2, the O(1D2) products are
preferentially formed with M = 0, can be qualitatively
accounted for by the long-range electrostatic model. However,
it seems that the location at which the populations are formed
is at a somewhat closer distance and the approximation of the
real potentials by the long-range dipole–dipole plus dipole–
quadrupole interaction is not sufficient. Therefore, more
theoretical work is needed to account properly for the relative
contributions of the parallel and perpendicular components of
the transition strength to the absorption.57
In this paper we report new experimental data on the
polarization of the S(1D2) photofragment following the photo-
dissociation of state-selected OCS(v2 = 1|JlM = 111) at
42 594 cm�1. Recent technological developments using
high-resolution slice imaging16 make it possible to measure
well-separated rings in the slice images of the S(1D2) fragment
correlating with individual rotational states of the CO(J)
cofragment.32 In section II we first discuss the relevant
Dow
nloa
ded
by R
adbo
ud U
nive
rsite
it N
ijmeg
en o
n 21
Apr
il 20
11Pu
blis
hed
on 2
2 M
arch
201
1 on
http
://pu
bs.r
sc.o
rg |
doi:1
0.10
39/C
0CP0
2671
AView Online
This journal is c the Owner Societies 2011 Phys. Chem. Chem. Phys., 2011, 13, 8549–8559 8551
theoretical framework to analyze and interpret our data. In
Section III we give a brief description of the experimental
set-up and in section IV we present our experimental results.
In section V we discuss our results and summarize our main
conclusions.
II. Theory
The S(1D2) photofragments resulting from the photolysis of
OCS have an anisotropic angular momentum distribution,
which is sensitive to the polarization directions of the photo-
lysis and probe lasers, but also, to some extent, to the direction
of the ion extraction field that is used to image the photo-
fragments. This ion extraction field will also orient and align
the OCS(v2 = 1|JlM = 111) quantum state that is selected by
the hexapole.
Recently, Rakitzis and Janssen presented the molecular-
frame and laboratory-frame ionization probability of photo-
fragments from the photodissociation of oriented parent
molecules via a single dissociative state, in terms of the
molecular-frame a(k)q polarization parameters.51 They showed
that, for experimental geometries where the orientation field is
perpendicular to the imaging plane of the detector, as is the
case in our experiment, the effect of the orientation field on the
photofragment angular distributions is small.
We analyze the experimental signals using two different
models. The first is the single-surface model51 for oriented or
aligned parent molecules, the second is a two-surface model
for isotropic parent molecules, described by Rakitzis and
Alexander,49 for which the molecular-frame photofragment
ionization probability is expressed in terms of the more general
a(k)q parameters49,58
I p 1 + cbC20(y) + s2{A
20(iso)C
20(Y) +
cA20(aniso)[C
20(Y)C2
0(y)] + cA21[C
21(Y)C2
1(y)]cos F +
cA22[C
22(Y)C2
2(y)]cos 2F} + s4{A40(iso)C0
4(Y) +
cA40(aniso)[C
40(Y)C2
0(y)] + cA41[C
41(Y)C2
1(y)]cos F +
cA42[C
42(Y)C2
2(y)]cos 2F}, (1)
where A(k)q are the molecular frame polarization parameters
(k = 2 and 4), C(k)q (y) are the modified spherical harmonics, Y
is the polar angle between the recoil direction of the photo-
fragments and the probe laser polarization, F is the azimuthal
angle of the pump and probe polarization with the recoil
velocity of the photofragments and y is the angle between
the photolysis laser polarization and the recoil direction of the
S(1D2) fragments. The constant c = 1 when the photolysis
laser is linearly polarized. We will only present results here for
linearly polarized photolysis light. The s2 and s4 are the line
strength detection factors for (2+1) REMPI of the S(1D2)
state and take on values s2 = �5/7 and s4 = �48/7 when the
S(1D2) is detected via the 1P1 resonant intermediate, and values
s2 = 40/49 and s4 = �36/49 when the 1F3 state is the resonant
intermediate.49 We assume here that the one photon ionization
step from the intermediate state is not sensitive to the
polarization of the probe laser.59 All the above values for
the sk (k = 2 and 4) parameters are for a linearly polarized
probe laser.
We note that eqn (1) forms a complete basis for the
description of experimental signals from photofragment
angular momentum polarization (up to k = 4, using linearly
polarized photolysis and probe light), as does the bipolar
moment formalism.60 Recently, Vasyutinskii and coworkers46,47
have shown how the parameters of such a general expansion
can be calculated, for a general range of photodissociation
mechanisms, thus opening the direction of the quantitative
description of angular momentum polarization from poly-
atomic photodissociation.
We use the velocity map slice imaging technique to measure
directly a cut through the three-dimensional angular distribution
of the photofragment. The molecular frame angles can be
expressed in terms of laboratory frame angles.61 For our slice
imaging geometry with a probe laser polarization either parallel
to the polarization of the photolysis or perpendicular to the plane
of the 3D-slice we can express the molecular frame ionization
probability in terms of a single laboratory frame angular
coordinate, y, the angle between the photolysis laser polarization
and the recoil direction of the S(1D2) fragment. For each
pump–probe laser geometry eqn (1) becomes an expansion of
second, fourth or sixth order Legendre polynomials Pl(cos y)
I(y) p 1 + b2P2(cos y) + b4P4(cos y) + b6P6(cos y) (2)
where b2, b4 and b6 are the expansion coefficients.
Using the molecular-frame to laboratory-frame trans-
formation (eqn (17) and (18) in ref. 49), eqn (1) can be
expressed in the form of eqn (2), in terms of the single
coordinate y, and bl in terms of A(k)q parameters. Explicit
expressions for the bl are given for the experimental geometry
where the probe and photolysis polarization directions are
parallel to each other and the imaging plane of the detector.58
The maximum order of Legendre polynomials that will appear
in the expansion in eqn (2) is given by the value 2(m + n), where
m is the number of photolysis photons (in this experimentm=1)
and n is the number of probe photons to the intermediate
resonant state (in this experiment n = 2). The expansion is
terminated at the sixth order if both laser polarizations are
parallel to each other and parallel to the detector slice plane. If
the polarization of the photolysis laser is parallel to the detector
slice plane and the polarization of the probe laser is perpendicular
to the detector slice plane direction the expansion will terminate at
the second order. If the polarization of the photolysis laser is
perpendicular to the detector slice plane and the polarization of
the probe laser is parallel to the detector slice plane the expansion
will terminate at the fourth order. The experimentally determined
bl (l = 2,4,6) parameters contain information about the
anisotropy parameter b and the photofragment alignment
moments A(k)q . As demonstrated by Rakitzis58 several pump–
probe laser polarization geometries can be used in order to
measure completely the photofragment alignment.
III. Experimental
The experimental setup has been described in great detail
before.16,26,62,63 Here we give only a brief description of the
experimental conditions. A mixture of 20% OCS seeded in Ar
is supersonically expanded through a pulsed nozzle (General
Valve solenoid pulsed valve) and skimmed before it enters a
Dow
nloa
ded
by R
adbo
ud U
nive
rsite
it N
ijmeg
en o
n 21
Apr
il 20
11Pu
blis
hed
on 2
2 M
arch
201
1 on
http
://pu
bs.r
sc.o
rg |
doi:1
0.10
39/C
0CP0
2671
AView Online
8552 Phys. Chem. Chem. Phys., 2011, 13, 8549–8559 This journal is c the Owner Societies 2011
second buffer chamber containing a removable beam stop. The
beam stop is used to enhance the selectivity of the hexapole in
the third chamber. The hexapole focuses OCS(v2 = 1|JlM= 111)
molecules onto a 1 mm in diameter conically shaped hole in
the repeller plate of the ion optics. The rotationally state-
selected OCS(v2 = 1|JlM = 111) molecules are intersected by
two counter propagating UV laser beams. The OCS molecules
are photolyzed by a 42594 cm�1 photon. The S(1D2) fragments
are detected by (2+1) REMPI ionization via the 1P1 and1F3
resonant intermediate states. The probe laser was set at
291.476 nm (vacuum wavelength) for the detection of S(1D2)
via the 1P1 intermediate state and at 288.179 nm (vacuum
wavelength) for the detection of S(1D2) via the 1F3 intermediate
state. The S ions are velocity mapped on a position sensitive
detector (MCP/Phosphor/CCD camera) after passing a time-
of-flight tube. The MCP detector is gated with a homebuilt
fast HV pulser with an effective gain width of the slice of about
12 ns in order to detect only the central part of the sulfur ion
cloud. The light from the phosphor screen is imaged by a 2048
by 2048 pixels large frame CCD camera. To obtain the
position of the individual ion events on the phosphor screen
we used centroiding techniques to read out the CCD
camera.32,64
IV. Results
Data was measured at several pump–probe laser geometries
through both the 1P1 and the 1F3 two photon resonant
intermediate states. These geometries are VV, VH, HV and
HH where the first letter indicates the polarization of the
pump laser and the second letter indicates the polarization of
the probe laser. The label V is for the geometry with the
polarization of the laser vertical and in the plane of the slice
image, the label H is for the geometry with the polarization of
the laser horizontal and perpendicular to the slice imaging
plane. From the data taken with these laser geometries the
alignment moments of the S(1D2) can be obtained. Other data
was taken for a geometry with the polarization of the photo-
lysis laser at an angle of 451 with respect to the molecular beam
axis and the polarization of the probe laser either linear (V and H)
or circular polarized (C). These experiments were performed
to probe the orientation of the angular momentum of the S
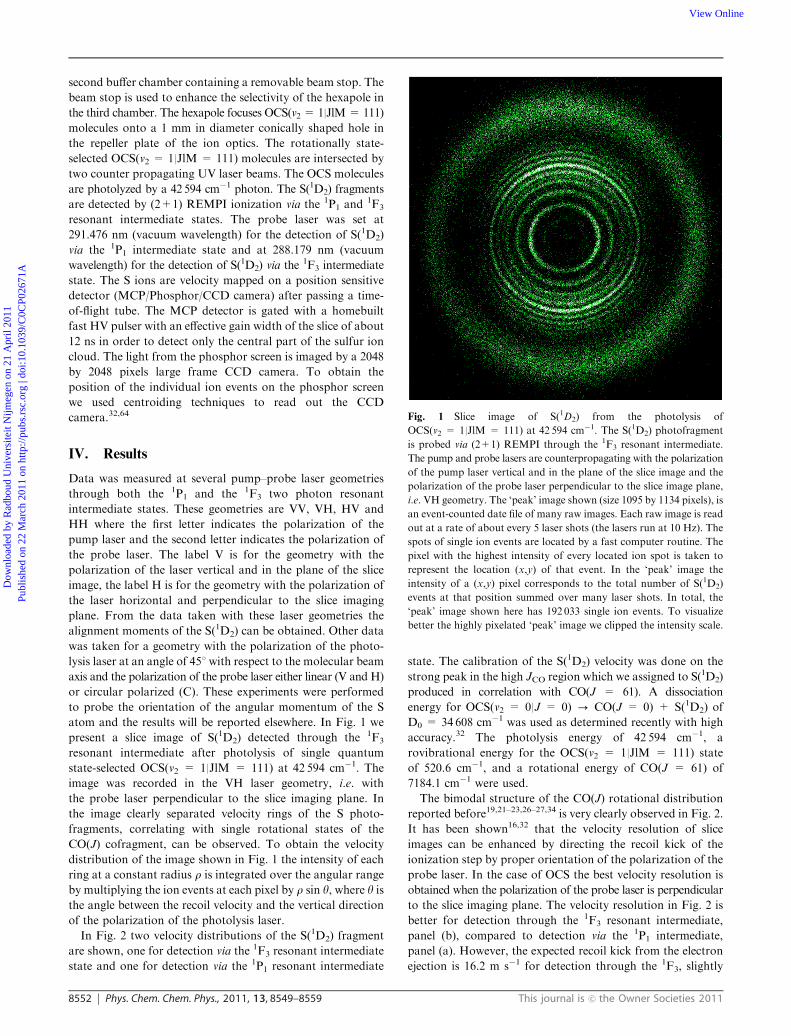
atom and the results will be reported elsewhere. In Fig. 1 we
present a slice image of S(1D2) detected through the 1F3
resonant intermediate after photolysis of single quantum
state-selected OCS(v2 = 1|JlM = 111) at 42 594 cm�1. The
image was recorded in the VH laser geometry, i.e. with
the probe laser perpendicular to the slice imaging plane. In
the image clearly separated velocity rings of the S photo-
fragments, correlating with single rotational states of the
CO(J) cofragment, can be observed. To obtain the velocity
distribution of the image shown in Fig. 1 the intensity of each
ring at a constant radius r is integrated over the angular range
by multiplying the ion events at each pixel by r sin y, where y isthe angle between the recoil velocity and the vertical direction
of the polarization of the photolysis laser.
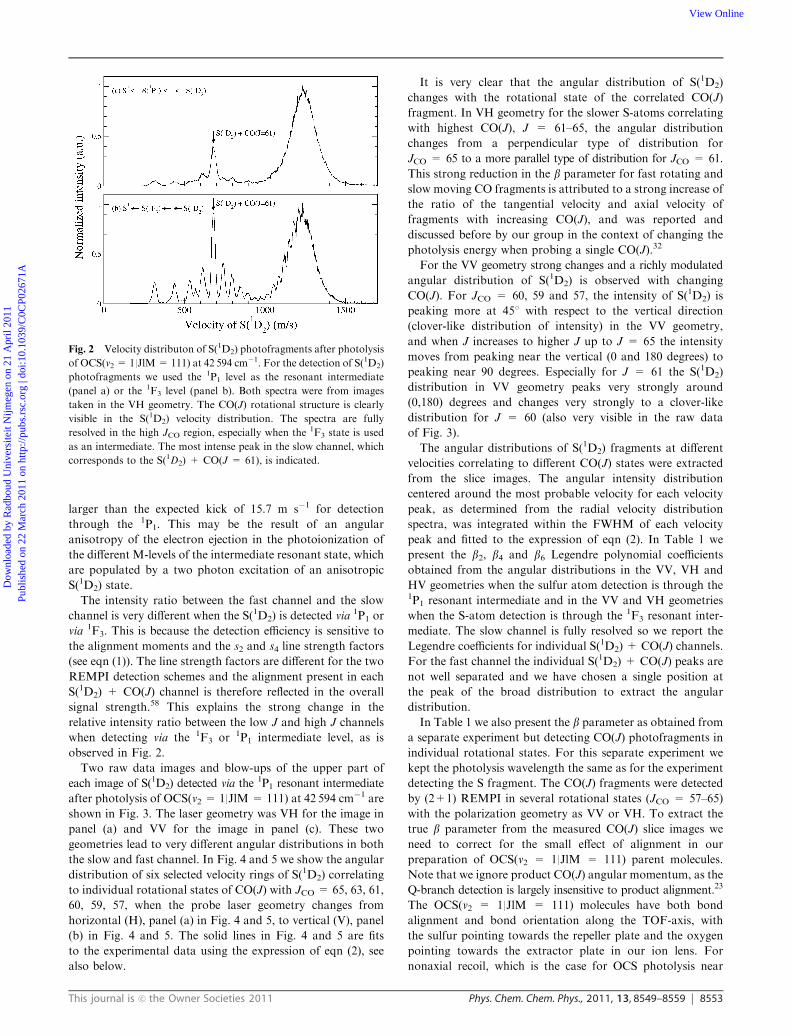
In Fig. 2 two velocity distributions of the S(1D2) fragment
are shown, one for detection via the 1F3 resonant intermediate
state and one for detection via the 1P1 resonant intermediate
state. The calibration of the S(1D2) velocity was done on the
strong peak in the high JCO region which we assigned to S(1D2)
produced in correlation with CO(J = 61). A dissociation
energy for OCS(v2 = 0|J = 0) - CO(J = 0) + S(1D2) of
D0 = 34 608 cm�1 was used as determined recently with high
accuracy.32 The photolysis energy of 42 594 cm�1, a
rovibrational energy for the OCS(v2 = 1|JlM = 111) state
of 520.6 cm�1, and a rotational energy of CO(J = 61) of
7184.1 cm�1 were used.
The bimodal structure of the CO(J) rotational distribution
reported before19,21–23,26–27,34 is very clearly observed in Fig. 2.
It has been shown16,32 that the velocity resolution of slice
images can be enhanced by directing the recoil kick of the
ionization step by proper orientation of the polarization of the
probe laser. In the case of OCS the best velocity resolution is
obtained when the polarization of the probe laser is perpendicular
to the slice imaging plane. The velocity resolution in Fig. 2 is
better for detection through the 1F3 resonant intermediate,
panel (b), compared to detection via the 1P1 intermediate,
panel (a). However, the expected recoil kick from the electron
ejection is 16.2 m s�1 for detection through the 1F3, slightly
Fig. 1 Slice image of S(1D2) from the photolysis of
OCS(v2 = 1|JlM = 111) at 42 594 cm�1. The S(1D2) photofragment
is probed via (2+1) REMPI through the 1F3 resonant intermediate.
The pump and probe lasers are counterpropagating with the polarization
of the pump laser vertical and in the plane of the slice image and the
polarization of the probe laser perpendicular to the slice image plane,
i.e. VH geometry. The ‘peak’ image shown (size 1095 by 1134 pixels), is
an event-counted date file of many raw images. Each raw image is read
out at a rate of about every 5 laser shots (the lasers run at 10 Hz). The
spots of single ion events are located by a fast computer routine. The
pixel with the highest intensity of every located ion spot is taken to
represent the location (x,y) of that event. In the ‘peak’ image the
intensity of a (x,y) pixel corresponds to the total number of S(1D2)
events at that position summed over many laser shots. In total, the
‘peak’ image shown here has 192 033 single ion events. To visualize
better the highly pixelated ‘peak’ image we clipped the intensity scale.
Dow
nloa
ded
by R
adbo
ud U
nive
rsite
it N
ijmeg
en o
n 21
Apr
il 20
11Pu
blis
hed
on 2
2 M
arch
201
1 on
http
://pu
bs.r
sc.o
rg |
doi:1
0.10
39/C
0CP0
2671
AView Online
This journal is c the Owner Societies 2011 Phys. Chem. Chem. Phys., 2011, 13, 8549–8559 8553
larger than the expected kick of 15.7 m s�1 for detection
through the 1P1. This may be the result of an angular
anisotropy of the electron ejection in the photoionization of
the different M-levels of the intermediate resonant state, which
are populated by a two photon excitation of an anisotropic
S(1D2) state.
The intensity ratio between the fast channel and the slow
channel is very different when the S(1D2) is detected via 1P1 or
via 1F3. This is because the detection efficiency is sensitive to
the alignment moments and the s2 and s4 line strength factors
(see eqn (1)). The line strength factors are different for the two
REMPI detection schemes and the alignment present in each
S(1D2) + CO(J) channel is therefore reflected in the overall
signal strength.58 This explains the strong change in the
relative intensity ratio between the low J and high J channels
when detecting via the 1F3 or 1P1 intermediate level, as is
observed in Fig. 2.
Two raw data images and blow-ups of the upper part of
each image of S(1D2) detected via the 1P1 resonant intermediate
after photolysis of OCS(v2 = 1|JlM= 111) at 42 594 cm�1 are
shown in Fig. 3. The laser geometry was VH for the image in
panel (a) and VV for the image in panel (c). These two
geometries lead to very different angular distributions in both
the slow and fast channel. In Fig. 4 and 5 we show the angular
distribution of six selected velocity rings of S(1D2) correlating
to individual rotational states of CO(J) with JCO = 65, 63, 61,
60, 59, 57, when the probe laser geometry changes from
horizontal (H), panel (a) in Fig. 4 and 5, to vertical (V), panel
(b) in Fig. 4 and 5. The solid lines in Fig. 4 and 5 are fits
to the experimental data using the expression of eqn (2), see
also below.
It is very clear that the angular distribution of S(1D2)
changes with the rotational state of the correlated CO(J)
fragment. In VH geometry for the slower S-atoms correlating
with highest CO(J), J = 61–65, the angular distribution
changes from a perpendicular type of distribution for
JCO = 65 to a more parallel type of distribution for JCO = 61.
This strong reduction in the b parameter for fast rotating and
slow moving CO fragments is attributed to a strong increase of
the ratio of the tangential velocity and axial velocity of
fragments with increasing CO(J), and was reported and
discussed before by our group in the context of changing the
photolysis energy when probing a single CO(J).32
For the VV geometry strong changes and a richly modulated
angular distribution of S(1D2) is observed with changing
CO(J). For JCO = 60, 59 and 57, the intensity of S(1D2) is
peaking more at 451 with respect to the vertical direction
(clover-like distribution of intensity) in the VV geometry,
and when J increases to higher J up to J = 65 the intensity
moves from peaking near the vertical (0 and 180 degrees) to
peaking near 90 degrees. Especially for J = 61 the S(1D2)
distribution in VV geometry peaks very strongly around
(0,180) degrees and changes very strongly to a clover-like
distribution for J = 60 (also very visible in the raw data
of Fig. 3).
The angular distributions of S(1D2) fragments at different
velocities correlating to different CO(J) states were extracted
from the slice images. The angular intensity distribution
centered around the most probable velocity for each velocity
peak, as determined from the radial velocity distribution
spectra, was integrated within the FWHM of each velocity
peak and fitted to the expression of eqn (2). In Table 1 we
present the b2, b4 and b6 Legendre polynomial coefficients
obtained from the angular distributions in the VV, VH and
HV geometries when the sulfur atom detection is through the1P1 resonant intermediate and in the VV and VH geometries
when the S-atom detection is through the 1F3 resonant inter-
mediate. The slow channel is fully resolved so we report the
Legendre coefficients for individual S(1D2) + CO(J) channels.
For the fast channel the individual S(1D2) + CO(J) peaks are
not well separated and we have chosen a single position at
the peak of the broad distribution to extract the angular
distribution.
In Table 1 we also present the b parameter as obtained from
a separate experiment but detecting CO(J) photofragments in
individual rotational states. For this separate experiment we
kept the photolysis wavelength the same as for the experiment
detecting the S fragment. The CO(J) fragments were detected
by (2+1) REMPI in several rotational states (JCO = 57–65)
with the polarization geometry as VV or VH. To extract the
true b parameter from the measured CO(J) slice images we
need to correct for the small effect of alignment in our
preparation of OCS(v2 = 1|JlM = 111) parent molecules.
Note that we ignore product CO(J) angular momentum, as the
Q-branch detection is largely insensitive to product alignment.23
The OCS(v2 = 1|JlM = 111) molecules have both bond
alignment and bond orientation along the TOF-axis, with
the sulfur pointing towards the repeller plate and the oxygen
pointing towards the extractor plate in our ion lens. For
nonaxial recoil, which is the case for OCS photolysis near
Fig. 2 Velocity distributon of S(1D2) photofragments after photolysis
of OCS(v2 = 1|JlM= 111) at 42 594 cm�1. For the detection of S(1D2)
photofragments we used the 1P1 level as the resonant intermediate
(panel a) or the 1F3 level (panel b). Both spectra were from images
taken in the VH geometry. The CO(J) rotational structure is clearly
visible in the S(1D2) velocity distribution. The spectra are fully
resolved in the high JCO region, especially when the 1F3 state is used
as an intermediate. The most intense peak in the slow channel, which
corresponds to the S(1D2) + CO(J = 61), is indicated.
Dow
nloa
ded
by R
adbo
ud U
nive
rsite
it N
ijmeg
en o
n 21
Apr
il 20
11Pu
blis
hed
on 2
2 M
arch
201
1 on
http
://pu
bs.r
sc.o
rg |
doi:1
0.10
39/C
0CP0
2671
AView Online

8554 Phys. Chem. Chem. Phys., 2011, 13, 8549–8559 This journal is c the Owner Societies 2011
230 nm, the angular distribution will depend on the degree of
alignment of the parent molecule61,65
IðyÞ ¼ 1þ2P2ðcos wÞ þ 3
4c2 sin
2 w sin2 ad1þ2c2P2ðcos ad Þ
1� 34
c2 sin2 w sin2 ad
1þ2c2P2ðcos ad Þ
24
35P2ðcos yÞ: ð3Þ
where w is the angle between the transition dipole moment ~mand the recoil direction~v, y is the angle between the photolysis
laser polarization and the recoil direction, ad is the angle
between the permanent dipole moment ~v and the recoil
direction. For the (v2 = 1|JlM = 111) state the coefficient
which describes the alignment of the permanent dipole
moment, c2 = 1/4 and the angle ad = w + 301. We use our
previous measurement of the angle between the transition
dipole moment and the permanent dipole moment of about
301.14 Note that in the recent paper of Brouard et al.34 the
authors proposed the transition dipole moment made an angle
of 651–801 to the linear OCS axis. For the analysis reported
here we assume that our measurement with oriented molecules
is interpreted correctly14 and we extract from the observed
angular distribution of the CO(J) fragment the ‘‘true’’
b parameter, btrue, using ad = w + 301. In Table 1 we show
the values for the ‘‘experimental’’ b parameter, bexp, withoutthe correction of the influence from the parent alignment
for several rotational states of the CO photofragment. The
experimentally measured laboratory frame anisotropy parameters,
b2, b4 and b6 presented in Table 1, were fit using a nonlinear
fitting algorithm66 to expressions resulting from the coordinate
frame transformation of eqn (1) to determine the molecular
frame polarization parameters a(k)q . The 5 different laser
geometries used for both 1P1 and 1F3 resonant intermediates
provide us with a system of 10 equations and we have
6 unknown a(k)q moments. To improve the quality of the fitting
we also let the b parameter vary from the value btrue measured
on single CO(J) states after correction for the small alignment
of the parent state using eqn (3). The algorithm fitted the best
a(k)q values for a particular S-speed (correlating to a single JCO
cofragment) by minimizing w2 ¼P
g
Pl
ðbl;observed�bl;calculatedÞ2
d2l;observed;
l = 2,4 and 6; g labels the different polarization geometries;
dl,observed is the estimated error in the measured parameters
bl,observed, which was taken to be 0.1 for all data. Note that we
are only interested in relative changes of w2 as the absolute
Fig. 3 Raw data images of S(1D2) photofragments after photolysis of OCS(v2 = 1|JlM = 111) at 42 594 cm�1. The S(1D2) photofragment is
probed via (2+1) REMPI with the 1P1 level as resonant intermediate. The image in panel (b) is a cut of (630 by 280) pixels of the (1200 by 1200)
pixels image in panel (a). The image in panel (d) is a cut of (630 by 280) pixels of the (1200 by 1200) pixels image in panel (c). In panels (a–b) the
polarization of the pump laser was vertical and in the plane of the image and the polarization of the probe laser was horizontal (VH geometry) and
perpendicular (normal) to the plane of the image. In panels (c–d) the polarizations of both pump and probe laser were vertical (VV geometry).
Note how the angular distribution of individual rings in the high JCO region and of the slow JCO channel changes when the polarization of the
probe laser is changed from horizontal to vertical.
Dow
nloa
ded
by R
adbo
ud U
nive
rsite
it N
ijmeg
en o
n 21
Apr
il 20
11Pu
blis
hed
on 2
2 M
arch
201
1 on
http
://pu
bs.r
sc.o
rg |
doi:1
0.10
39/C
0CP0
2671
AView Online

This journal is c the Owner Societies 2011 Phys. Chem. Chem. Phys., 2011, 13, 8549–8559 8555
value of w2 is determined by the estimated error in the
experimental data. In a few cases it was observed that the fit
algorithm was producing a(k)q parameters beyond a physical
maximum and in those cases we constrained such an
a(k)q parameter to the maximum physical value.
V. Discussion and conclusions
A One-surface versus two-surface dynamics
Theoretical calculations by Suzuki et al.22 indicate that in the
high J-region of the bimodal distribution the fragments are
produced from parent molecules excited to a single parallel
surface, 21A0(11D). Very recently, Brouard and coworkers34
concluded after studying the OCS photolysis at 248 nm that
the excitation to the 21A0(11D) electronic state is predominant
and the excitation to the 11A0 0(11S�) state is minor. However,
the most recent ab initio theoretical study on OCS by
Danielache et al.38 report that near the peak of the absorption
band at 223 nm the 21A0 and the 11A0 0 surface have an equal
absorption strength for OCS at room temperature. For
excitation wavelengths more towards the red the contribution
of the 21A0 surface is larger than the 11A0 0 surface. Still, at an
excitation of 42 594 cm�1 (234 nm) the recent theoretical work
suggests that the relative contribution of 21A0 versus 11A0 0 is
about 1 : 0.7, so a very large contribution of the perpendicular
excitation to the 11A0 0 surface.38 Therefore, one of our goals is
to determine whether our data can be explained with a
one-surface dissociation model, at least for certain values of J,
or whether a two-surface model is necessary.
We fit the angular distributions of the S(1D2) photo-
fragments with a single-surface model, described in ref. 51.
The results of the fitting, the a(k)q polarization parameters and
the b parameter, are given in Table 2. We note that this model
includes the effects of alignment of the OCS(v2 = 1|JlM = 111)
parent molecules, which, however, were predicted to be
small for our experimental geometry with the orientation
field perpendicular to the detector plane. We checked this
prediction, by fitting the data with the one-surface model
without parent-molecule orientation (by setting the orientation
and alignment parameters c1 = 0 and c2 = 0) and verified that
the results were very similar to the fitting that included parent-
molecule orientation. Observing the fit parameters in Table 2,
we notice that the results fit into two categories. In the first
category, for J = 62–65 the quality of the fits is excellent and
the value of w2 is very low. Note that when w2 = 10
all calculated b parameters differ (on average) from the
experimental b values by an estimated error of 0.1. All the
fit parameters (the a(k)q and b parameters) yield values within
the physical ranges.4 In the second category, for J = 57–61
(except J = 59) the quality of the fit appears to be worse (the
value of w2 is about ten times larger) and some of the fit
parameters (in particular the a(2)1 and a(2)2 parameters) yield
values that are beyond the physical ranges. In the fit they were
constrained to remain within the physical ranges (values
shown in bottom row of Table 2). We interpret this behavior
to mean that the dissociation dynamics, for J = 62–65, can be
qualitatively described by singe-surface dissociation, whereas
for J = 57–61 dynamics on more than one surface may
become more important.
To test the need to include more than one surface in the
dynamics, we fitted our data also to a two-surface model,
Fig. 4 The angular intensity distribution of S(1D2) fragments as
extracted from individual rings which are assigned to correlated single
rotational states of the CO(J) cofragment: open squares CO(J = 61),
solid squares CO(J = 63), and solid circles CO(J = 65), from
photolysis of OCS(v2 = 1|JlM = 111) at 42 594 cm�1 and detection
of S(1D2) via the 1P1 intermediate state with either VH (panel a) or VV
(panel b) polarization geometry. The individual angular distributions
were fitted to a function I(y) p (1 + b2P2y) for the VH laser
polarization geometry and to a function I(y) p (1 + b2P2y +
b4P4y + b6P6y) function for the VV laser polarization geometry.
The fits are shown as solid lines and the best fit coefficients bn are givenin Table 1. The angular distribution is extracted over a velocity band
centered at the specific velocity peak of the radial velocity distribution
as determined from images similar to the ones shown in Fig. 3 with a
width of 10–16 pixels.
Fig. 5 Similar to Fig. 4 but different S(1D2) fragments were selected
in individual rings assigned to CO(J) cofragment: open squares
CO(J = 57), solid squares CO(J = 59), and solid circles
CO(J = 60). Otherwise as in Fig. 4.
Dow
nloa
ded
by R
adbo
ud U
nive
rsite
it N
ijmeg
en o
n 21
Apr
il 20
11Pu
blis
hed
on 2
2 M
arch
201
1 on
http
://pu
bs.r
sc.o
rg |
doi:1
0.10
39/C
0CP0
2671
AView Online

8556 Phys. Chem. Chem. Phys., 2011, 13, 8549–8559 This journal is c the Owner Societies 2011
Table 1 Experimentally observed b2, b4 and b6 Legendre polynomial coefficients of the angular distribution of S(1D2) photofragments correlatingwith single rotational states, JCO, of the CO cofragment (first column) after photolysis of OCS(v2 = 1|JlM = 111) at 42 594 cm�1. The secondcolumn contains the calculated speed of S(1D2) using the dissociation energy D0 = 34 608 cm�1 determined before32 and using conservation oflinear momentum and energy in the two-body breakup of a single OCS(v2 = 1|JlM = 111) state with a spectroscopically accurate internal energyof 520.603 cm�1. The rotational energy of CO(J) was calculated using the rotational constants reported before.27 The third collumn contains thevalue of the anisotropy parameter bexp(JCO) as measured in a separate two-laser experiment with photolysis at 42 594 cm�1 and a probe laseraround 230 nm detecting a single rotationally quantum state-selected CO(J) cofragment. The bexp(JCO) reported is the value directly obtained fromthe angular distribution of the slice image of CO(J), without the small correction for the alignment of the parent OCS(v2 = 1|JlM= 111) state, seeeqn (3). The laser polarization geometry of photolysis and probe laser (V= vertical = in the slice imaging plane, H= horizontal = perpendicularto the slice imaging plane) and the resonant intermediate state used for detecting the S(1D2) fragment are given in the first row.
JCO v(S1D2)/m s�1 bexp(JCO)
VV (1P1) VH (1P1) HV (1P1) VV (1F3) VH (1F3)
b2 b4 b6 b2 b2 b4 b2 b4 b6 b2
65 359 �0.66 �0.47 0.09 �0.12 �0.41 0.18 �0.02 �0.49 �0.05 �0.06 �0.6564 462 0.31 0.09 0.33 0.38 0.72 0.68 0.03 0.24 �0.01 0.07 0.3763 545 0.79 0.94 �0.38 0.24 1.28 0.67 �0.45 0.80 �0.14 0.00 1.0262 616 1.20 1.62 0.31 0.01 1.58 0.59 �0.08 1.29 0.01 0.00 1.5161 678 1.44 1.58 1.05 0.44 1.88 0.85 0.46 1.38 0.14 0.08 1.4660 734 1.31 1.39 �0.90 �0.53 1.64 0.65 �0.50 1.30 �0.37 �0.14 1.7059 786 1.37 1.51 �0.31 0.17 1.77 0.60 �0.21 1.32 �0.32 �0.06 1.7458 834 — 1.50 �0.94 �0.68 1.46 0.55 �0.32 1.26 �0.55 �0.01 1.6657 878 — 1.45 �0.76 �0.47 1.93 0.49 �0.02 1.57 �0.16 0.00 1.82Peak low J E 47 — 0.53 0.76 �0.31 0.50 0.83 0.61 0.27 0.14 �0.04 0.72
Table 2 Best fit alignment parameters for photolysis at 42 594 cm�1 of an orientated OCS(v2 = 1|JlM= 111) parent molecule, assuming that thedynamics evolves on a single potential energy surface and including the effect of nonaxial recoil. The single rotational state, JCO, of the COcofragment, born in coincidence with the measured S(1D2) photofragment at that velocity, is indicated in the first column. The experimental valueof btrue(JCO) using the experimental value bexp(JCO) (see Table 1) and applying eqn (3) (see also text), is given for comparison in the second column.The best fit bfit(JCO) and a(k)q alignment moments are given in columns 3–9. The physical ranges of the parameters are given in the bottom row.
JCO btrue(JCO) bfit(JCO) a20 a21 a22 a40 a41 a42 w2 � errorb
65 �0.74 �0.58 �0.073 0.004 �0.37 0.0 �0.031 0.003 0.864 0.14 0.34 �0.28 �0.078 �0.42 �0.044 0.077 0.064 1.463 0.66 1.06 �0.46 �0.29 �0.46 0.046 0.076 0.014 1.562 1.06 1.42 �0.34 �0.33 �0.17 �0.033 �0.006 0.069 161 1.38 1.42 �0.28 �0.32 �0.59 �0.13 0.032 0.10 860 1.25 1.63 �0.57 �0.612a �0.612a 0.12 0.00 �0.066 1259 1.30 1.71 �0.57 �0.612a �0.49 0.044 0.12 �0.023 1.558 1.65 1.62 �0.65 �0.612a �0.612a 0.12 �0.036 �0.10 1957 1.80 1.77 �0.40 �0.612a �0.612a 0.082 0.012 �0.077 23Physical range �1 to +2 �1 to +2 �1 to +1 �1 to +1 �0.612 to +0.612 �0.167 to +0.25 �0.15 to +0.15 �0.1 to 0.127
a Constrained in fit to the minimum physical value. b The w2 � error in the fit was calculated assuming an error in the experimental bn coefficients
of 0.1.
Table 3 Resulting best fit parameters for photolysis of OCS(v2 = 1|JlM = 111) at 42 594 cm�1 assuming that the dynamics evolves on twosurfaces. The single rotational state, JCO, of the CO(J) cofragment, born in coincidence with the measured S(1D2) photofragment, is indicated inthe first column. The corrected experimental value of btrue(JCO), as extracted from the experimental bexp(JCO) (see eqn (3)), is given in the secondcolumn. The best fit bfit(JCO) and A(k)
q alignment moments are given in columns 3–11. The physical ranges of the A(k)q parameters were calculated
using eqn (16) in ref. 50 are given in the bottom row. Note that the maximum values of A(k)q are given assuming the a(k)q of both contributing
surfaces are equal and maximum
JCO btrue(JCO) bfit(JCO) A20iso A2
0aniso A40iso A4
0aniso A21 A2
2 A41 A4
2 w2 � error
65 �0.74 �0.56 �0.13 �0.006 0.25 �0.063 �0.073 0.003 0.262 �0.018 1.964 0.14 0.50 �0.28 �0.033 0.11 �0.043 0.23 0.11 �0.019 0.025 0.563 0.66 1.05 �0.14 0.37 0.25 0.17 0.138 0.026 0.10 0.032 2.562 1.06 1.47 �0.11 �0.018 0.074 0.12 �0.009 0.032 �0.20 �0.019 1.861 1.38 1.57 �0.16 �0.088 0.093 0.012 0.091 0.44 �0.44 �0.11 3660 1.25 1.48 �0.10 0.088 0.12 0.28 0.003 0.032 �0.087 0.16 1359 1.30 1.68 �0.23 0.037 0.16 0.27 0.17 0.015 �0.35 0.074 2.658 1.65 1.47 �0.36 0.12 �0.046 0.38 �0.044 0.038 �0.63 0.24 2457 1.80 1.68 0.087 0.061 0.20 0.14 0.026 0.032 0.10 0.14 6Range �1 to +2 �1 to
+2�1 to+1
�2 to+2
�3.0 to+3.0
�3 to+3
�0.167 to+0.25
�0.334 to+0.5
�0.723 to+0.723
�0.484 to+0.622
a The w2 � error in the fit was calculated assuming an error in the experimental bn coefficients of 0.1.
Dow
nloa
ded
by R
adbo
ud U
nive
rsite
it N
ijmeg
en o
n 21
Apr
il 20
11Pu
blis
hed
on 2
2 M
arch
201
1 on
http
://pu
bs.r
sc.o
rg |
doi:1
0.10
39/C
0CP0
2671
AView Online
This journal is c the Owner Societies 2011 Phys. Chem. Chem. Phys., 2011, 13, 8549–8559 8557
described by eqn (1) in ref. 51. The results of the two-surface
model fitting (the A(k)q and b parameters) are given in Table 3.
We note that the difference between this two-surface model
and the one-surface model used before is the addition of two
q = 0 parameters for a total of four, the A(k)0 (iso) and the
A(k)0 (aniso) for k= 2 and 4, instead of just two parameters, the
a(k)0 for k = 2 and 4 in the one-surface model; these four
q = 0 parameters allow the determination of two distinct
m-state distributions of the S(1D2) photofragments, which are
associated with dissociation via each of two distinct dissociative
states. However, we note that this two-state model does not
take into account the OCS(v2 = 1|JlM = 111) parent-
molecule orientation. Observing the fit parameters in
Table 3, we notice that the two-state model does not fit the
data significantly better than the one-state model (i.e. the w2
values of the fits are not significantly better, on average).
The two-surface fit follows the similar trend of fitting the
distributions well in the range J = 62–65, and less well for the
range J = 57–61. The form of eqn (1) should fit any photo-
fragment polarization angular distribution formed from the
photodissociation of molecules via the coherent excitation of
multiple dissociative states (i.e. including interference effect),
provided that the parent molecules are not oriented or aligned.
In addition, in ref. 51 it was shown that eqn (1) fits well the
photofragment angular distribution from the photodissociation
of oriented and aligned parent molecules, provided only
single-surface (incoherent) terms are present. Perhaps, a
possible reason for the failure of the single-surface model to
fit the distributions in the range J = 57–61, and the failure of
the two-surface model from eqn (1) to improve the fits is due
to the presence of interference terms in the polarization of the
S(1D2) photofragments from the coherent excitation of at
least two dissociative states. These interference terms are not
properly modeled by eqn (1), because the parent-molecule
alignment has not been taken into account. However, because
the degree of alignment of the OCS(v2 = 1|JlM= 111) state is
rather small in our experimental geometry, we wonder if such
interference terms will be significant enough to influence the
angular dependence in a more extended theoretical modeling
of the angular dependence of the S(1D2) photofragment
distribution. We note that our treatment of the OCS parent-
molecule polarization deals only with the semiclassical
alignment of the OCS dipole moment, and does not treat
any effects of parent molecule angular momentum polarization
on the photofragment polarization. Therefore, a full treatment,
including the parent-molecule alignment for coherent excitation
of multiple dissociative states and the correlation of parent
and photofragment angular momentum, may allow the
analysis of our results to yield further insight, especially for
the product distributions with J = 57–61. Furthermore,
perhaps there is also a connection with the strong changes in
intensity of the CO(J = 61) + S(1D2) channel and the
modeling of the angular distribution.
B m-State distribution and long-range potential
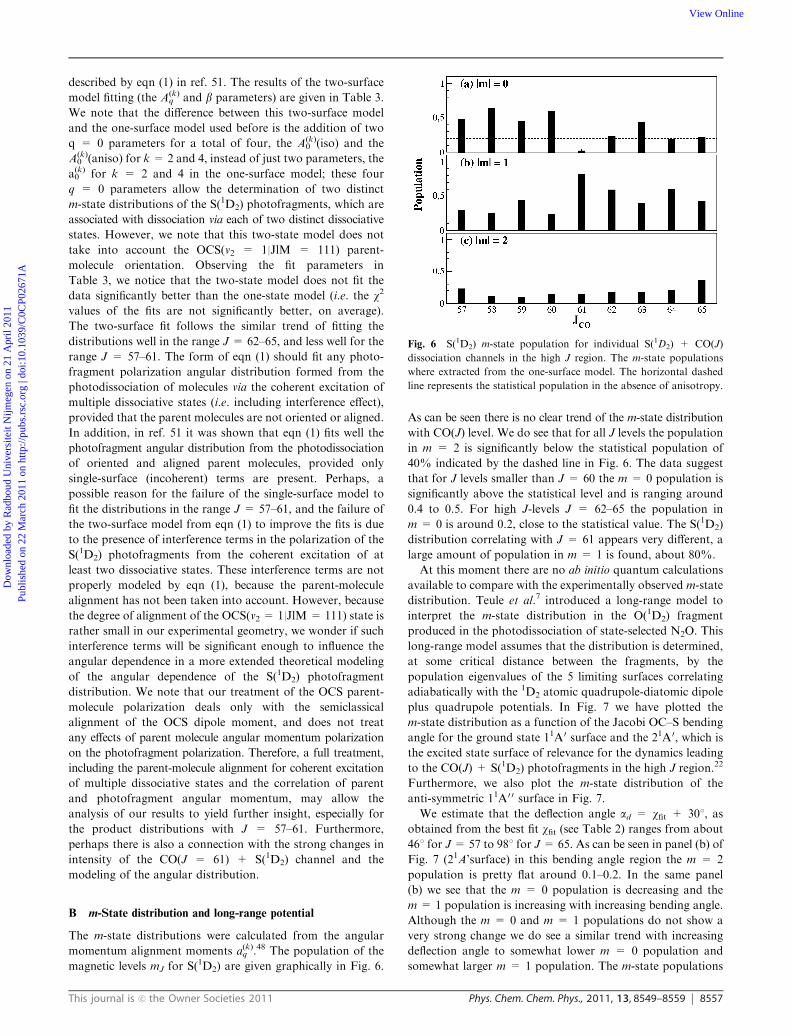
The m-state distributions were calculated from the angular
momentum alignment moments a(k)q .48 The population of the
magnetic levels mJ for S(1D2) are given graphically in Fig. 6.
As can be seen there is no clear trend of the m-state distribution
with CO(J) level. We do see that for all J levels the population
in m = 2 is significantly below the statistical population of
40% indicated by the dashed line in Fig. 6. The data suggest
that for J levels smaller than J = 60 the m = 0 population is
significantly above the statistical level and is ranging around
0.4 to 0.5. For high J-levels J = 62–65 the population in
m = 0 is around 0.2, close to the statistical value. The S(1D2)
distribution correlating with J = 61 appears very different, a
large amount of population in m = 1 is found, about 80%.
At this moment there are no ab initio quantum calculations
available to compare with the experimentally observed m-state
distribution. Teule et al.7 introduced a long-range model to
interpret the m-state distribution in the O(1D2) fragment
produced in the photodissociation of state-selected N2O. This
long-range model assumes that the distribution is determined,
at some critical distance between the fragments, by the
population eigenvalues of the 5 limiting surfaces correlating
adiabatically with the 1D2 atomic quadrupole-diatomic dipole
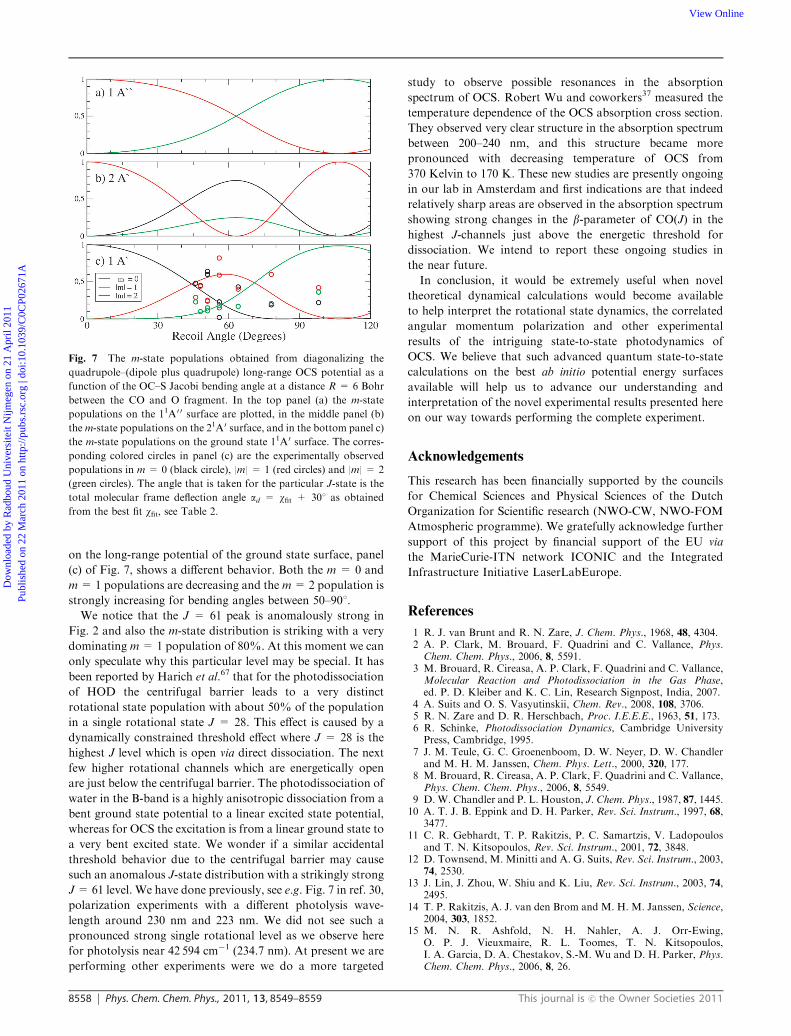
plus quadrupole potentials. In Fig. 7 we have plotted the
m-state distribution as a function of the Jacobi OC–S bending
angle for the ground state 11A0 surface and the 21A0, which is
the excited state surface of relevance for the dynamics leading
to the CO(J) + S(1D2) photofragments in the high J region.22
Furthermore, we also plot the m-state distribution of the
anti-symmetric 11A0 0 surface in Fig. 7.
We estimate that the deflection angle ad = wfit + 301, as
obtained from the best fit wfit (see Table 2) ranges from about
461 for J= 57 to 981 for J= 65. As can be seen in panel (b) of
Fig. 7 (21A’surface) in this bending angle region the m = 2
population is pretty flat around 0.1–0.2. In the same panel
(b) we see that the m = 0 population is decreasing and the
m = 1 population is increasing with increasing bending angle.
Although the m = 0 and m = 1 populations do not show a
very strong change we do see a similar trend with increasing
deflection angle to somewhat lower m = 0 population and
somewhat larger m = 1 population. The m-state populations
Fig. 6 S(1D2) m-state population for individual S(1D2) + CO(J)
dissociation channels in the high J region. The m-state populations
where extracted from the one-surface model. The horizontal dashed
line represents the statistical population in the absence of anisotropy.
Dow
nloa
ded
by R
adbo
ud U
nive
rsite
it N
ijmeg
en o
n 21
Apr
il 20
11Pu
blis
hed
on 2
2 M
arch
201
1 on
http
://pu
bs.r
sc.o
rg |
doi:1
0.10
39/C
0CP0
2671
AView Online
8558 Phys. Chem. Chem. Phys., 2011, 13, 8549–8559 This journal is c the Owner Societies 2011
on the long-range potential of the ground state surface, panel
(c) of Fig. 7, shows a different behavior. Both the m = 0 and
m= 1 populations are decreasing and the m= 2 population is
strongly increasing for bending angles between 50–901.
We notice that the J = 61 peak is anomalously strong in
Fig. 2 and also the m-state distribution is striking with a very
dominating m= 1 population of 80%. At this moment we can
only speculate why this particular level may be special. It has
been reported by Harich et al.67 that for the photodissociation
of HOD the centrifugal barrier leads to a very distinct
rotational state population with about 50% of the population
in a single rotational state J = 28. This effect is caused by a
dynamically constrained threshold effect where J = 28 is the
highest J level which is open via direct dissociation. The next
few higher rotational channels which are energetically open
are just below the centrifugal barrier. The photodissociation of
water in the B-band is a highly anisotropic dissociation from a
bent ground state potential to a linear excited state potential,
whereas for OCS the excitation is from a linear ground state to
a very bent excited state. We wonder if a similar accidental
threshold behavior due to the centrifugal barrier may cause
such an anomalous J-state distribution with a strikingly strong
J=61 level. We have done previously, see e.g. Fig. 7 in ref. 30,
polarization experiments with a different photolysis wave-
length around 230 nm and 223 nm. We did not see such a
pronounced strong single rotational level as we observe here
for photolysis near 42 594 cm�1 (234.7 nm). At present we are
performing other experiments were we do a more targeted
study to observe possible resonances in the absorption
spectrum of OCS. Robert Wu and coworkers37 measured the
temperature dependence of the OCS absorption cross section.
They observed very clear structure in the absorption spectrum
between 200–240 nm, and this structure became more
pronounced with decreasing temperature of OCS from
370 Kelvin to 170 K. These new studies are presently ongoing
in our lab in Amsterdam and first indications are that indeed
relatively sharp areas are observed in the absorption spectrum
showing strong changes in the b-parameter of CO(J) in the
highest J-channels just above the energetic threshold for
dissociation. We intend to report these ongoing studies in
the near future.
In conclusion, it would be extremely useful when novel
theoretical dynamical calculations would become available
to help interpret the rotational state dynamics, the correlated
angular momentum polarization and other experimental
results of the intriguing state-to-state photodynamics of
OCS. We believe that such advanced quantum state-to-state
calculations on the best ab initio potential energy surfaces
available will help us to advance our understanding and
interpretation of the novel experimental results presented here
on our way towards performing the complete experiment.
Acknowledgements
This research has been financially supported by the councils
for Chemical Sciences and Physical Sciences of the Dutch
Organization for Scientific research (NWO-CW, NWO-FOM
Atmospheric programme). We gratefully acknowledge further
support of this project by financial support of the EU via
the MarieCurie-ITN network ICONIC and the Integrated
Infrastructure Initiative LaserLabEurope.
References
1 R. J. van Brunt and R. N. Zare, J. Chem. Phys., 1968, 48, 4304.2 A. P. Clark, M. Brouard, F. Quadrini and C. Vallance, Phys.Chem. Chem. Phys., 2006, 8, 5591.
3 M. Brouard, R. Cireasa, A. P. Clark, F. Quadrini and C. Vallance,Molecular Reaction and Photodissociation in the Gas Phase,ed. P. D. Kleiber and K. C. Lin, Research Signpost, India, 2007.
4 A. Suits and O. S. Vasyutinskii, Chem. Rev., 2008, 108, 3706.5 R. N. Zare and D. R. Herschbach, Proc. I.E.E.E., 1963, 51, 173.6 R. Schinke, Photodissociation Dynamics, Cambridge UniversityPress, Cambridge, 1995.
7 J. M. Teule, G. C. Groenenboom, D. W. Neyer, D. W. Chandlerand M. H. M. Janssen, Chem. Phys. Lett., 2000, 320, 177.
8 M. Brouard, R. Cireasa, A. P. Clark, F. Quadrini and C. Vallance,Phys. Chem. Chem. Phys., 2006, 8, 5549.
9 D. W. Chandler and P. L. Houston, J. Chem. Phys., 1987, 87, 1445.10 A. T. J. B. Eppink and D. H. Parker, Rev. Sci. Instrum., 1997, 68,
3477.11 C. R. Gebhardt, T. P. Rakitzis, P. C. Samartzis, V. Ladopoulos
and T. N. Kitsopoulos, Rev. Sci. Instrum., 2001, 72, 3848.12 D. Townsend, M. Minitti and A. G. Suits, Rev. Sci. Instrum., 2003,
74, 2530.13 J. Lin, J. Zhou, W. Shiu and K. Liu, Rev. Sci. Instrum., 2003, 74,
2495.14 T. P. Rakitzis, A. J. van den Brom and M. H. M. Janssen, Science,
2004, 303, 1852.15 M. N. R. Ashfold, N. H. Nahler, A. J. Orr-Ewing,
O. P. J. Vieuxmaire, R. L. Toomes, T. N. Kitsopoulos,I. A. Garcia, D. A. Chestakov, S.-M. Wu and D. H. Parker, Phys.Chem. Chem. Phys., 2006, 8, 26.
Fig. 7 The m-state populations obtained from diagonalizing the
quadrupole–(dipole plus quadrupole) long-range OCS potential as a
function of the OC–S Jacobi bending angle at a distance R = 6 Bohr
between the CO and O fragment. In the top panel (a) the m-state
populations on the 11A0 0 surface are plotted, in the middle panel (b)
them-state populations on the 21A0 surface, and in the bottom panel c)
the m-state populations on the ground state 11A0 surface. The corres-
ponding colored circles in panel (c) are the experimentally observed
populations in m = 0 (black circle), |m| = 1 (red circles) and |m| = 2
(green circles). The angle that is taken for the particular J-state is the
total molecular frame deflection angle ad = wfit + 301 as obtained
from the best fit wfit, see Table 2.
Dow
nloa
ded
by R
adbo
ud U
nive
rsite
it N
ijmeg
en o
n 21
Apr
il 20
11Pu
blis
hed
on 2
2 M
arch
201
1 on
http
://pu
bs.r
sc.o
rg |
doi:1
0.10
39/C
0CP0
2671
AView Online
This journal is c the Owner Societies 2011 Phys. Chem. Chem. Phys., 2011, 13, 8549–8559 8559
16 M. L. Lipciuc, J. B. Buijs and M. H. M. Janssen, Phys. Chem.Chem. Phys., 2006, 8, 219.
17 A. I. Chichinin, K.-H. Gericke, S. Kauczok and C. Maul, Int. Rev.Phys. Chem., 2009, 28, 607.
18 M. H. M. Janssen, D. H. Parker, G. O. Sitz, S. Stolte andD. W. Chandler, J. Phys. Chem., 1991, 95, 8007.
19 N. Sivakumar, G. E. Hall, P. L. Houston, J. W. Hepburn andI. Burak, J. Chem. Phys., 1988, 88, 3692.
20 G. Nan, I. Burak and P. L. Houston, Chem. Phys. Lett., 1993, 209,383.
21 Y. Sato, Y. Matsumi, M. Kawasaki, K. Tsukiyama andR. Bersohn, J. Phys. Chem., 1995, 99, 16307.
22 T. Suzuki, H. Katayanagi, S. Nanbu and M. Aoyagi, J. Chem.Phys., 1998, 109, 5778.
23 Z. H. Kim, A. J. Alexander and R. N. Zare, J. Phys. Chem. A,1999, 103, 10144.
24 A. Sugita, M. Mashino, M. Kawasaki, Y. Matsumi, R. Bersohn,G. Trott-Kriegeskorte and K.-H. Gericke, J. Chem. Phys., 2000,112, 7095.
25 T. P. Rakitzis, P. C. Samartzis and T. N. Kitsopoulos, Phys. Rev.Lett., 2001, 87, 123001.
26 A. J. van den Brom, T. P. Rakitzis, J. van Heyst,T. N. Kitsopoulos, S. R. Jezowski and M. H. M. Janssen,J. Chem. Phys., 2002, 117, 4255.
27 A. M. Rijs, E. H. G. Backus, C. A. de Lange, M. H. M. Janssen,N. P. C. Westwood, K. Wang and V. McKoy, J. Chem. Phys.,2002, 116, 2776.
28 A. J. van den Brom, T. P. Rakitzis and M. H. M. Janssen, J. Chem.Phys., 2004, 121, 11645.
29 M. Kim, W. Li, S. K. Lee and A. G. Suits, Can. J. Chem., 2004, 82,880.
30 A. J. van den Brom, T. P. Rakitzis and M. H. M. Janssen, J. Chem.Phys., 2005, 123, 164313.
31 A. J. van den Brom, T. P. Rakitzis and M. H. M. Janssen,Phys. Scr., 2006, 73, C83.
32 M. L. Lipciuc and M. H. M. Janssen, Phys. Chem. Chem. Phys.,2006, 8, 3007.
33 M. L. Lipciuc and M. H. M. Janssen, J. Chem. Phys., 2007, 126,194318.
34 M. Brouard, A. V. Green, F. Quadrini and C. Vallance, J. Chem.Phys., 2007, 127, 084304.
35 M. Brouard, F. Quadrini and C. Vallance, J. Chem. Phys., 2007,127, 084305.
36 J. W. Rabalais, J. M. McDonald, V. Scherr and S. P. McGlynn,Chem. Rev., 1971, 71, 73.
37 C. Y. Robert Wu, F. Z. Chen and D. L. Judge, J. Quant. Spectrosc.Radiat. Transfer, 1999, 61, 265.
38 S. O. Danielache, S. Nanbu, C. Eskebjerg, M. S. Johnson andN. Yoshida, J. Chem. Phys., 2009, 131, 024307.
39 T. P. Rakitzis, P. C. Samartzis and T. N. Kitsopoulos, J. Chem.Phys., 1999, 111, 10415.
40 S. K. Lee, R. Silva, S. Thamanna, O. S. Vasyutinskii andA. G. Suits, J. Chem. Phys., 2006, 125, 144318.
41 L. D. A. Siebbeles, M. Glass-Maujean, O. S. Vasyutinskii,J. A. Beswick and R. Octavio, J. Chem. Phys., 1994, 100, 3610.
42 M. Ahmed, E. R. Wouters, D. S. Peterka, O. S. Vasyutinskii andA. G. Suits, Faraday Discuss., 1999, 113, 425.
43 G. G. Balint-Kurti, A. J. Orr-Ewing, J. A. Beswick, A. Brown andO. S. Vasyutinskii, J. Chem. Phys., 2002, 116, 10760.
44 A. Smolin, O. S. Vasyutinskii, E. Wouters and A. Suits, J. Chem.Phys., 2004, 121, 6759.
45 V. V. Kuznetsov and O. S. Vasyutinskii, J. Chem. Phys., 2007, 127,044308.
46 P. S. Shternin and O. S. Vasyutinskii, J. Chem. Phys., 2008, 128,194314.
47 V. V. Krasilnikov, M. B. Kuznetsov, A. G. Suits andO. S. Vasyutinskii, Phys. Chem. Chem. Phys., 2011, DOI:10.1039/c0cp01375g.
48 T. P. Rakitzis and R. N. Zare, J. Chem. Phys., 1999, 110, 3341.49 T. P. Rakitzis and A. J. Alexander, J. Chem. Phys., 2010, 132,
224310.50 T. P. Rakitzis, J. Chem. Phys., 2010, 133, 204301.51 T. P. Rakitzis and M. H. M. Janssen, Mol. Phys., 2010, 108, 937.52 L. Bougas and T. P. Rakitzis, Phys. Chem. Chem. Phys., 2010,
DOI: 10.1039/c0cp02451a.53 M. Brouard, A. P. Clark, C. Vallance and O. S. Vasyutinskii,
J. Chem. Phys., 2003, 119, 771.54 M. Brouard, R. Cireasa, A. P. Clark, T. J. Preston, C. Vallance,
G. C. Groenenboom and O. S. Vasyutinskii, J. Phys. Chem. A,2004, 108, 7965.
55 M. Brouard, R. Cireasa, A. P. Clark, T. J. Preston andC. Vallance, J. Chem. Phys., 2006, 124, 64309.
56 A. M. Coroiu, D. H. Parker, G. C. Groenenboom, J. Barr,I. T. Novalbos and B. J. Whitaker, Eur. Phys. J. D, 2006, 38, 151.
57 M. P. J. van der Loo, PhD Thesis, Radboud University, Nijmegen,2008.
58 T. P. Rakitzis, Chem. Phys. Lett., 2001, 342, 121.59 P. S. Shternin, V. K. Ivanov, A. Suits and O. S. Vasyutinskii, Phys.
Chem. Chem. Phys., 2006, 8, 2972.60 R. N. Dixon, J. Chem. Phys., 1986, 85, 1866.61 T. P. Rakitzis, A. J. van den Brom and M. H. M. Janssen, Chem.
Phys. Lett., 2003, 372, 187.62 M. H. M. Janssen, J. W. G. Mastenbroek and S. Stolte, J. Phys.
Chem. A, 1997, 101, 7605.63 M. L. Lipciuc, A. J. van den Brom, L. Dinu andM. H. M. Janssen,
Rev. Sci. Instrum., 2005, 76, 123103.64 M. L. Lipciuc, PhD Thesis, Vrije Universiteit, Amsterdam, 2008.65 C. A. Taatjes, M. H. M. Janssen and S. Stolte, Chem. Phys. Lett.,
1993, 203, 363.66 W. Meerts and M. Schmitt, Int. Rev. Phys. Chem., 2006, 25, 353.67 S. A. Harich, X. F. Yang, X. Yang, R. van Harreveldt and M.
van Hemert, Phys. Rev. Lett., 2001, 87, 263001.
Dow
nloa
ded
by R
adbo
ud U
nive
rsite
it N
ijmeg
en o
n 21
Apr
il 20
11Pu
blis
hed
on 2
2 M
arch
201
1 on
http
://pu
bs.r
sc.o
rg |
doi:1
0.10
39/C
0CP0
2671
AView Online
Related Documents