WEALTH MANAGEMENT Eyes Wide Open CIO Office Investment Outlook 2018

Welcome message from author
This document is posted to help you gain knowledge. Please leave a comment to let me know what you think about it! Share it to your friends and learn new things together.
Transcript

WEALTH MANAGEMENT
Eyes Wide Open
CIO OfficeInvestment Outlook 2018
OPPORTUNITIES TO INSPIRE 1
EMIRATES NBD WEALTH MANAGEMENT INVESTMENT OUTLOOK 2018
2017 Disruption and Rally
We began 2017 with a thematicfocus on disruption: an insightfulplay but wholly underestimatedacross the board.
It is now clear that 2017 markedsome of the most significant, tangibleand transformational disruptions wehave seen in over fifty years. Frompolitics to economics, nothing wasexempt.
While the past decade heralded theTech Age, 2017 was truly thebreakout year for disruptivetechnology. Traditional industrieswere put in defence mode. Financefor example, a sector previouslycoddled as untouchable, had tocompete with the onslaught ofinnovative technology: fromblockchain to digital asset managers,finance as we once knew it hasforever changed.
At the forefront of this disruption isthe human experience: frombanking to shopping, politics topersonal, Amazon to AI; TechnologyLiving is now the new normal.
With such momentous changecomes empowerment; the previouslyunheard voices arise, and the powershifts. The rise of nationalism inEurope and the surge of populism inthe US saw the greatest disruptionto the status quo in decades.
Nowhere was this change morepalpable in the GCC than in SaudiArabia, where historic social changeis afoot, and political power isevolving in line with an increasinglydiversifying economy and theconcentration of the youthdemographic. Critically, it was thisyouth demographic - the millennials
globally - which drove overwhelmingchange in 2017.
From Austria to Australia, SaudiArabia to South Africa, millennialsare now having their say inGovernment and making theirinfluence known.
2017 witnessed the EmergingMarkets (EM), particularly India, risefrom the shadows of the traditionallyfavoured Developed Markets (DM).EM economies held their own in2017, with most outperforming theirDM counterparts on multiple fronts.
The widely anticipated negativeeffect of a Trump presidency did notin fact materialize and marketsglobally reacted positively to aRepublican reformist taking office.
Global debt, however, continues torise and is now at record levels –more than 325% of global GDP.This is in part due to central bankpolicies after the 2008 recession,but at these levels, central banksare likely to start reining in thisliquidity with the inevitable resultingtension in global markets.
2018 Conviction and Persistence
We start 2018 with a healthy dose ofoptimism: cautious optimism. The2018 investor must be discerning,focused, agile and adaptable. Theyear of rallying returns off the back ofcomplacent investing is behind us.
That said, provided the rightconditions are met, we do expectcertain markets to have robust yearsahead. India and Saudi Arabiaremain our favourite markets from amulti-asset-rally perspective. Bothcountries are driving changes thatwill have significant global impact.
If Modi can wrestle command of theIndian Government in the upcomingelections, and oil remains below USD65/b, this should allow him tocontinue to reform and boost theIndian economy further.
For Saudi Arabia, we would expectpositive performance in both bondsand equities alongside theanticipated MSCI upgrade andcontinued focus on social andeconomic reform. A rally in theKingdom would also enhanceperformance in the UAE andBahrain.
We intend to remain overweightequities for the first half of 2018 andwill continue to focus on thetechnology sector, which presentssubstantial upside opportunity. USand Indian equities continue to haveour particular attention.
US equities have experiencedremarkable returns over the pastdecade and are now on course forthe longest positive streak everrecorded. We do, however, expectan increase in volatility as theimpact of multiple fed rate increases(albeit from historically record lows)take hold, and the inevitable “soul-searching” in the latter half of theyear hits as the benefits of taxreform and healthy economic databegin to wane.
Indian equities should continue tooutperform DM and EM, even withthe substantial rally in corporatevaluations over the past twelvemonths.
For the bond market, it is a tale oftwo halves: we expect DM bonds tocontinue to deliver negative to flatreturns and for EM bonds tocontinue to deliver alpha.
CIO Statement
Emirates NBD CIO-Office Year Ahead 2018

EMIRATES NBD WEALTH MANAGEMENT INVESTMENT OUTLOOK 2018
GCC bonds present opportunities asthe benefits of recent reforms andthe relatively neutral performanceover the past 12 months signal anupward trend. US Governmentbonds remain appealing and webelieve that they may sustain arange of 2.5% to 2.75%.
EM debt is appealing and our focusis on the UAE, India, China,Indonesia, Russia, Mexico, Turkeyand the KSA.
Blockchain technology andcryptocurrencies have theinvestment community divided.Blockchain encompasses the veryessence of disruptive technology;while it has certainly changed theway that certain industries dobusiness, as it relates tocryptocurrencies, its potential todisplace fiat currencies remains thecreed of the crypto believers. Thelack of regulation and resultantinability to “cash-out” on anymeaningful scale into fiat currencylimits cryptocurrency utilisation tothe “pump-and-dump” price arbitragingjaunts in a virtual world. For now.
It remains to be seen whethercryptocurrencies can in factpenetrate real economies and indoing so, compel governments andregulators to adapt.
With US corporates expected to seesignificant surpluses in light of taxreform, the US dollar is expected to
continue its slide against the euroand GBP. GBP, albeit still exposed tothe uncertainty of the Brexit outcome,may etch close to USD 1.42.
With widespread uncertainty onthe strength and stability ofmarkets throughout 2018, holdinga position in gold is likely topreserve overall portfolio returnsand help mitigate against volatilityand potential shocks.
In the US, as fervor builds aroundSenate and Congressional electionsin Q4 2018, the US President willface a real challenge in securingRepublican command of bothHouses, and as a result, risksweakening his legislative agenda.
In Europe, Italians go to the polls inwhat could become a barometer forthe nationalist movement sweepingEurope. In Germany, Angela Merkelis expected to struggle to keep thecoalition together (at least in thebackground) which may spell anothergeneral election and a resultingtremble in the EU administration.
In the GCC, markets will look tosignals around continued reformand the Saudi Arabian MSCIupgrade, both of which shouldboost markets.
2018 will be an interesting year forinvestors; a year for steadfast focus,diversification and continuousconsidered scrutiny.
Tariq Bin Hendi, PhDActing Chief Investment Officer
OPPORTUNITIES TO INSPIRE 2Emirates NBD CIO-Office Year Ahead 2018
CIO Statement

OPPORTUNITIES TO INSPIRE
A Look Back on Our 2017 StrategiesTechnology was the winner in equity markets. EM assets performedacross all asset classes.
5GCC Macro Economic OutlookThe outlook for the GCC economies at the start of 2018 is constructive. 7Oil OutlookWe forecast Brent Oil Futures at an average of USD 56/b in 2018.8Equity Strategy Expect high single digit returns in the US and low teen returns in EMs.Synchronised global growth and upwards earning revisions aresupportive of equity performance. In the GCC, high yielding stocksremain in favour.
10
Equity Strategy – Emerging MarketsThe bulging young demographic is supportive of consumption. Asiahas the highest corporate profitability and economic growth globally.India and China remain the dominant economies.
17
3
Contents
Emirates NBD CIO-Office Year Ahead 2018
EMIRATES NBD WEALTH MANAGEMENT INVESTMENT OUTLOOK 2018

BlockchainThe decentralisation of transaction-linked information is the underpinning ofblockchain technology. It may prove to be the catalyst for change across globalindustries, from accounting to manufacturing.
23Fixed Income Strategy Finding value in a risk environment: despite tighter valuations across the fixedincome asset class, stretched valuations have become the norm with theabundance of liquidity.
25Portfolio Strategy Diversification benefits of traditional asset classes are limited. Alternativestrategies enhance a portfolios risk/return trade-off.
29UK Real Estate StrategyThe search for yield and excess liquidity is driving UK commercial propertyinvestment.
33Global Risks to Our 2018 OutlookWe outline the risks that may come to pass in 2018.35
Contents
OPPORTUNITIES TO INSPIRE 4Emirates NBD CIO-Office Year Ahead 2018
EMIRATES NBD WEALTH MANAGEMENT INVESTMENT OUTLOOK 2018

OPPORTUNITIES TO INSPIRE 5
A Look Back on Our 2017 Strategies
Emirates NBD CIO-Office Year Ahead 2018
EMIRATES NBD WEALTH MANAGEMENT INVESTMENT OUTLOOK 2018
We successfully executedour “sustainable business”investment strategy:“Only those companies that arecontinually evolving and recreatingtheir businesses will survive. Whatleads to a sustainable business?Companies need to invest andinnovate, to be environmentallyconscious and ethical, expand intonew markets and adopt disruptivetechnology.” (Source: Emirates NBDWealth Management InvestmentOutlook 2017)
Our Long Term DM SustainablePortfolio ended 2017 up 24.7% andto complement the 2017 strategywe will be launching a SustainableEquity Portfolio for EM in 2018.
Our 2017 Equity strategy was to:
Overweight the US, and thetechnology, industrials andfinance sectors: The S&P 500ended 2017 with total returns of21%, driven by the technologysector, with the semiconductorsector a stand out. 7 out of 12sectors in the Index returned over20%. The rally was paired withhistorically low volatility. Ouroverweight calls on US technology,finance, industrials and healthcarepaid off as did our underweight onconsumer staples and telecom. Thetechnology sector has not only beenthe highest gainer, but contributedto more than 40% of the gains in theS&P 500 Index.
Overweight EM:The MSCI EM Indexended 2017 up 34%. Our overweighton India has been unchanged for 3years, riding both the waves andfallouts from the demonetisation andGST implementation. The IndianSensex Index ended 2017 up 28%.
Overweight Europe exporters;underweight the UK:Though the strong euro was a drag,the Stoxx Eurozone Exporters Indexended 2017 up 9.8%, outperformingthe broader benchmark.
Neutral the GCC:Though oil prices rallied, the GCCmarkets did not keep pace with eitheroil or EM, ending 2017 flat (incl.dividends). Geopolitical concernsweighed on sentiment.
Underweight certain sectors: Brick and mortar retail, non–onlinepay TV, telecom and the traditionalauto (internal combustion engine)industries: as expected, these werethe laggards in 2017.
Sector Sustainability Driver
0% 10% 20% 30% 40% 50% 60%
GCC
Eurostoxx
Japan Nikkei
Healthcare
S&P 500
MSCI World
India Sensex
MSCI EM
Technology
Semiconductors
Robotics
Genomics
AI
Lithium
Exhibit 2: Our 2017 technology strategy yielded highest returns
Exhibit 1: Focused sectors and their key drivers
Source: Bloomberg. Dec 2017
Source: Emirates NBD CIO Office. Dec 2017
Innovative Healthcare R&D
Social media User base
Internet search Mobile ads
Robotics/ AI Industrial use
Ecommerce AI
Digital banking Big data
Global payments EM
Health “Wellness"
Lifestyle Millennials
Renewables Consumer preference

A Look Back on Our 2017 Strategies
OPPORTUNITIES TO INSPIRE 6Emirates NBD CIO-Office Year Ahead 2018
EMIRATES NBD WEALTH MANAGEMENT INVESTMENT OUTLOOK 2018
Our 2017 Fixed Income strategywas to:
The search for yield remained thekey driver for our overall strategy oflong-only and excessive duration bets.
Our 2017 outlook on globalsustainability and structuralconcerns, subdued inflation, and
geopolitics supported our play onglobal high yield paper, investmentgrade bonds, EM debt, and selectpositioning on GCC credits.
In summary, the strategy was a purebeta play, taking directional bets insearch of yield and focusing onsectors which were aligned withcommodities and energy.
To some extent, technical factorsoutpaced fundamentals on thisquest for return. The second lowestdefault rates in the bond markets,coupled with robust demand forprimary bond issuances, whet theappetite for high yield bonds in thefixed income asset class.
US Government
Global DM Sovereign Bonds
Corporate Investment Grade
GCC Debt
Global High yield
USD Emerging Market
Local EM Sovereign
0% 2% 4% 6% 8% 10% 12% 14% 16% 18%
2.0%
2.1%
5.9%
7.5%
7.8%
8.0%
15.5%
Exhibit 4: Benchmark performance on the fixed income assetclass for 2017
Source: Bloomberg. Dec 2017
Exhibit 3: Estimates on bond yields and spreads (as per 2017 strategy)
Option-Adjusted spread using Treasuries for risk free rate. 5-Year US Treasuries being used for the above table limiting duration to 4 to 5 years.* Germany 5-year Bunds referenced for yield/spread calculationsSource: ENBD CIO Office. Dec 2017
Short term Sustainable medium2017/F term valuations (3yr-5yr)
Bonds Yield Spread Yield Spread Yield / Spread
10 - Year US Government Bond 2.50% 0 2.50% to 2.75% 0 2.25% to 2.50%Developed MarketsGlobal Developed Sovereign Bonds 0.92% 19 1.10% - 1.35% 40 25 bps to 50 bpsGlobal Investment Grade 2.58% 121 2.75% - 3.00% 125 100 bps to 150bpsHigh YieldUS High Yield 6.30% 434 6% - 6.50% 450 450 bps to 550 bpsEuropean HY Bond* 3.33% 353 3.50% - 4.00% 350 300 bps to 350 bpsGlobal High Yield 5.85% 423 6.25% - 6.50% 475 400 bps to 500 bpsEmerging MarketsSovereign Bonds 5.03% 282 4.75% - 5.25% 300 250bps to 300 bpsCorporate Bonds 5.24% 333 5.25% - 5.75% 350 350 bps to 400 bpsGCC Bonds 4.24% 210 4.40% - 4.70% 250 225 bps to 275 bps
Current

OPPORTUNITIES TO INSPIRE 7
GCC Macro Economic Outlook
Emirates NBD CIO-Office Year Ahead 2018
EMIRATES NBD WEALTH MANAGEMENT INVESTMENT OUTLOOK 2018
Following an eventful 2017, we seethe outlook for the GCC economies atthe start of this year as constructive.
Following two years of relativeausterity in regional budgets, whichsaw the introduction of new taxes aswell as cuts to energy and othersubsidies, governments havesignalled a more expansionaryfiscal stance in their 2018 budgets.While Saudi Arabia has recentlyannounced public sector wageincreases and bonuses tocompensate for further fuel andelectricity price hikes and theintroduction of Value Added Tax(VAT) this year, most GCC budgetshave increased their allocations forinfrastructure spending, despiteusing relatively conservative oilprice assumptions for 2018. Thisshould underpin non-oil sectorgrowth this year, even ashouseholds’ spending is likely toremain somewhat constrained.
Oil prices have also started this yearhigher, which has helped to boostsentiment, although we are cautiousabout whether these prices will besustained for the full year. Ouraverage forecast for Brent oil is USD56 in 2018, not much higher than theaverage for 2017. However, even atthis seemingly conservative oil priceassumption, there is room for GCCgovernments to increase spendingwhile continuing to narrow theirbudget deficits.
After contracting in 2017 on OPECagreed production cuts, we alsoexpect the oil sector in most GCCeconomies to contribute positivelyto GDP growth this year, to varyingdegrees. Saudi Arabia had cutproduction by more than agreedwith OPEC last year, allowing theKingdom room to boost crudeoutput in 2018 while still remaining
compliant with OPEC limits. As aresult of both stronger oil and non-oil sector growth, we expect(weighted) average real GDPgrowth in the GCC to accelerate to2.8% in 2018 from an estimated0.6% in 2017.
Within the GCC, the UAE is likely toremain the outperformer in terms ofgrowth, with real GDP expanding3.4% this year, up from an estimated2.0% in 2017. The public sector isexpected to be the main engine ofgrowth this year however, withinfrastructure spending set to pickup as the country prepares to hostExpo 2020, and some public sectorwage growth likely as well.However, household consumption islikely be constrained by higher costsof living (petrol prices will rise with oilprices and VAT has been applied tofood and utilities as well as morediscretionary items) while there islittle indication yet that wages in theprivate sector will rise this year. TheEmirates NBD PMI survey datashowed that firms in the UAE did notincrease hiring much last year evenon the back of record growth inoutput and new work, and that staffcosts have also seen little growth.
Consumers in Saudi Arabia shouldfare slightly better, as the
Government has already put inplace a cash grant to help mitigatethe impact of fuel and energysubsidy cuts on lower incomehouseholds, and also announcedpublic sector wage increases andbonuses at the start of this year. Weexpect Saudi GDP growth toaccelerate to 2.5% this year from-0.5% in 2017.
2014 2015 2016 2017e 2018f0.0
0.5
1.0
1.5
2.0
2.5
3.0
3.5
4.0
3.23.6
2.5
0.6
2.8
Source: Bloomberg. Dec 2017
Exhibit 1: GCC weighted average real GDP growth, % YoY
Oil prices havealso started this
year higher, whichhas helped to
boost sentiment
Oil Outlook
OPPORTUNITIES TO INSPIRE 8Emirates NBD CIO-Office Year Ahead 2018
EMIRATES NBD WEALTH MANAGEMENT INVESTMENT OUTLOOK 2018
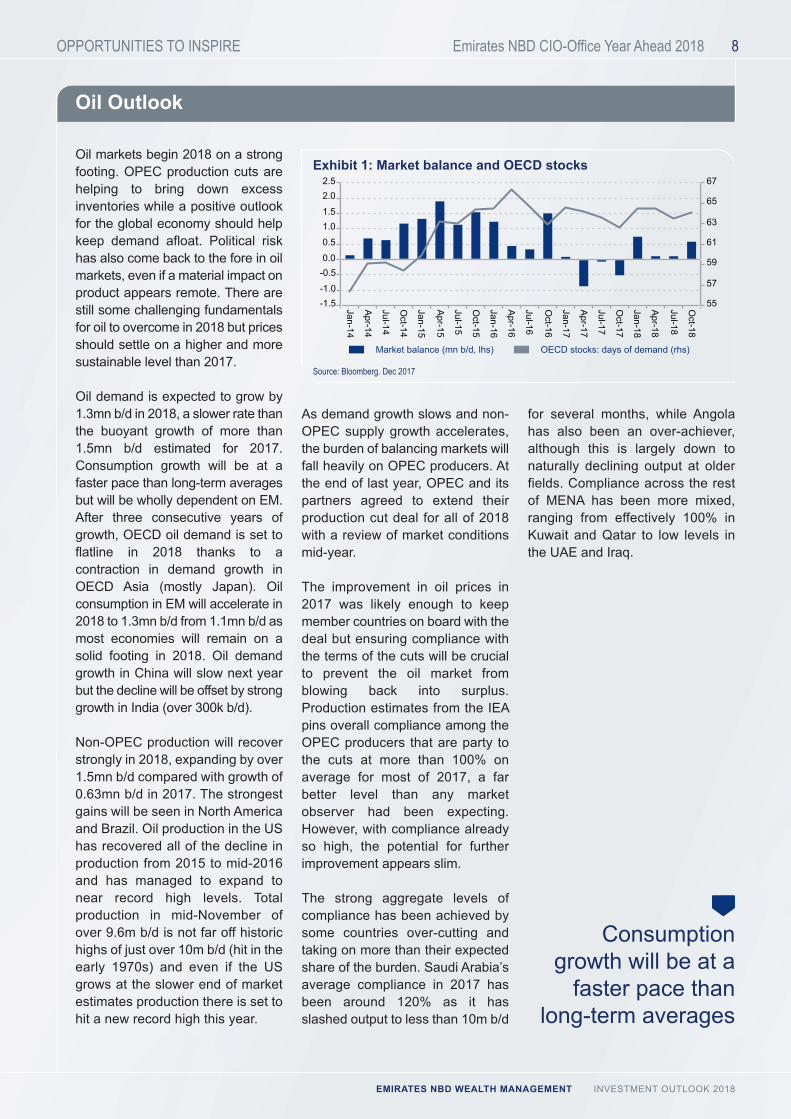
Oil markets begin 2018 on a strongfooting. OPEC production cuts arehelping to bring down excessinventories while a positive outlookfor the global economy should helpkeep demand afloat. Political riskhas also come back to the fore in oilmarkets, even if a material impact onproduct appears remote. There arestill some challenging fundamentalsfor oil to overcome in 2018 but pricesshould settle on a higher and moresustainable level than 2017.
Oil demand is expected to grow by1.3mn b/d in 2018, a slower rate thanthe buoyant growth of more than1.5mn b/d estimated for 2017.Consumption growth will be at afaster pace than long-term averagesbut will be wholly dependent on EM.After three consecutive years ofgrowth, OECD oil demand is set toflatline in 2018 thanks to acontraction in demand growth inOECD Asia (mostly Japan). Oilconsumption in EM will accelerate in2018 to 1.3mn b/d from 1.1mn b/d asmost economies will remain on asolid footing in 2018. Oil demandgrowth in China will slow next yearbut the decline will be offset by stronggrowth in India (over 300k b/d).
Non-OPEC production will recoverstrongly in 2018, expanding by over1.5mn b/d compared with growth of0.63mn b/d in 2017. The strongestgains will be seen in North Americaand Brazil. Oil production in the UShas recovered all of the decline inproduction from 2015 to mid-2016and has managed to expand tonear record high levels. Totalproduction in mid-November ofover 9.6m b/d is not far off historichighs of just over 10m b/d (hit in theearly 1970s) and even if the USgrows at the slower end of marketestimates production there is set tohit a new record high this year.
As demand growth slows and non-OPEC supply growth accelerates,the burden of balancing markets willfall heavily on OPEC producers. Atthe end of last year, OPEC and itspartners agreed to extend theirproduction cut deal for all of 2018with a review of market conditionsmid-year.
The improvement in oil prices in2017 was likely enough to keepmember countries on board with thedeal but ensuring compliance withthe terms of the cuts will be crucialto prevent the oil market fromblowing back into surplus.Production estimates from the IEApins overall compliance among theOPEC producers that are party tothe cuts at more than 100% onaverage for most of 2017, a farbetter level than any marketobserver had been expecting.However, with compliance alreadyso high, the potential for furtherimprovement appears slim.
The strong aggregate levels ofcompliance has been achieved bysome countries over-cutting andtaking on more than their expectedshare of the burden. Saudi Arabia’saverage compliance in 2017 hasbeen around 120% as it hasslashed output to less than 10m b/d
for several months, while Angolahas also been an over-achiever,although this is largely down tonaturally declining output at olderfields. Compliance across the restof MENA has been more mixed,ranging from effectively 100% inKuwait and Qatar to low levels inthe UAE and Iraq.
Market balance (mn b/d, lhs) OECD stocks: days of demand (rhs)
Jan-14
Apr-14
Jul-14
Oct-14
Jan-15
Apr-15
Jul-15
Oct-15
Jan-16
Apr-16
Jul-16
Oct-16
Jan-17
Apr-17
Jul-17
Oct-17
Jan-18
Apr-18
Jul-18
Oct-18
-1.5-1.0
-0.50.0
0.5
1.01.5
2.02.5
55
57
59
61
63
65
67
Source: Bloomberg. Dec 2017
Exhibit 1: Market balance and OECD stocks
Consumptiongrowth will be at afaster pace than
long-term averages
OPPORTUNITIES TO INSPIRE 9
Oil Outlook
Emirates NBD CIO-Office Year Ahead 2018
EMIRATES NBD WEALTH MANAGEMENT INVESTMENT OUTLOOK 2018
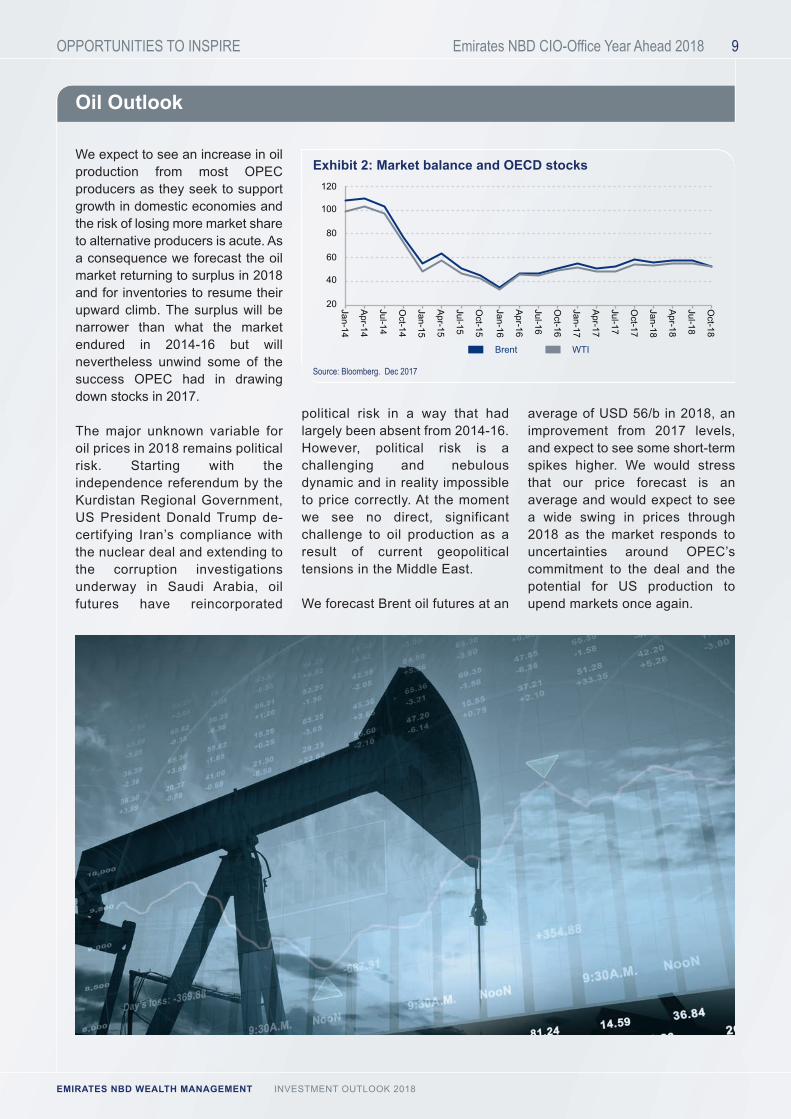
We expect to see an increase in oilproduction from most OPECproducers as they seek to supportgrowth in domestic economies andthe risk of losing more market shareto alternative producers is acute. Asa consequence we forecast the oilmarket returning to surplus in 2018and for inventories to resume theirupward climb. The surplus will benarrower than what the marketendured in 2014-16 but willnevertheless unwind some of thesuccess OPEC had in drawingdown stocks in 2017.
The major unknown variable foroil prices in 2018 remains politicalrisk. Starting with theindependence referendum by theKurdistan Regional Government,US President Donald Trump de-certifying Iran’s compliance withthe nuclear deal and extending tothe corruption investigationsunderway in Saudi Arabia, oilfutures have reincorporated
political risk in a way that hadlargely been absent from 2014-16.However, political risk is achallenging and nebulousdynamic and in reality impossibleto price correctly. At the momentwe see no direct, significantchallenge to oil production as aresult of current geopoliticaltensions in the Middle East.
We forecast Brent oil futures at an
average of USD 56/b in 2018, animprovement from 2017 levels,and expect to see some short-termspikes higher. We would stressthat our price forecast is anaverage and would expect to seea wide swing in prices through2018 as the market responds touncertainties around OPEC’scommitment to the deal and thepotential for US production toupend markets once again.
Brent WTI
20
40
60
80
100
120
Jan-14
Apr-14
Jul-14
Oct-14
Jan-15
Apr-15
Jul-15
Oct-15
Jan-16
Apr-16
Jul-16
Oct-16
Jan-17
Apr-17
Jul-17
Oct-17
Jan-18
Apr-18
Jul-18
Oct-18
Source: Bloomberg. Dec 2017
Exhibit 2: Market balance and OECD stocks

Equity Strategy
OPPORTUNITIES TO INSPIRE 10Emirates NBD CIO-Office Year Ahead 2018
EMIRATES NBD WEALTH MANAGEMENT INVESTMENT OUTLOOK 2018
> Expect high single digit returns in DMs, low teen returns in EMs, complementing a great 2017
> Valuations of most markets at the higher end: endorse caution
> Volatility should revert to normal levels
> Global growth remains synchronous, with upwards earnings revisions supporting equity performance
Post a stellar performance of globalequity markets in 2017, backed bysynchronous economic growth, lowinterest rates and easy liquidityconditions, the total world marketcap is c. USD 100tn – tripling fromthe 2009 lows. Globally, equity ETFssaw a record USD 448bn of inflowsin 2017 (though, active managerssaw outflows of USD 153bn).
To a large extent, current valuationsreflect that equity markets havediscounted much of the expectedfuture profit growth. That limits theupside and is in line with the maturephase of the bull market. The MSCIWorld Index had positive absolutereturns in every month of 2017.
Volatility picks up a while before apeak is reached, so a big downturnis not imminent. Serious marketdownturns are usually preceded byrecessions, which still seem sometime away with 2018 looking likeanother year of strong economicgrowth. However, the liquidity boostfrom Central Banks is on its wayout, removing the strongest pillar ofequity performance in 2017.
MSCI World Growth Index
+56.5
+13.0
MSCI World Value Index
40
60
80
100
120
140
160
Jan-08
Jan-09
Jan-10
Jan-11
Jan-12
Jan-13
Jan-14
Jan-15
Jan-16
Jan-17
Jan-18
Exhibit 1: Growth outperformed value since the 2008 Financial Crisis
Source: Bloomberg. Rebased to 100. Jan 2008
MSCI World 5Yr Zscore P/E 5Yr Zscore
-3
-2
-1
0
1
2
3
Jan-08
Jan-09
Jan-10
Jan-11
Jan-12
Jan-13
Jan-14
Jan-15
Jan-16
Jan-17
Jan-18
Exhibit 2: Global markets are overvalued but not in bubble territory
Source: Bloomberg. Jan 2018
Growth has outperformed value since the 2008 Financial Crisis. We think that the majorcontinuing factor that will drive equity market performance is earnings growth. We areoperating in markets that are trading at valuations well above their 10 year average andinvestors need conviction on earnings visibility to remain invested.
OPPORTUNITIES TO INSPIRE 11
Equity Strategy
Emirates NBD CIO-Office Year Ahead 2018
EMIRATES NBD WEALTH MANAGEMENT INVESTMENT OUTLOOK 2018
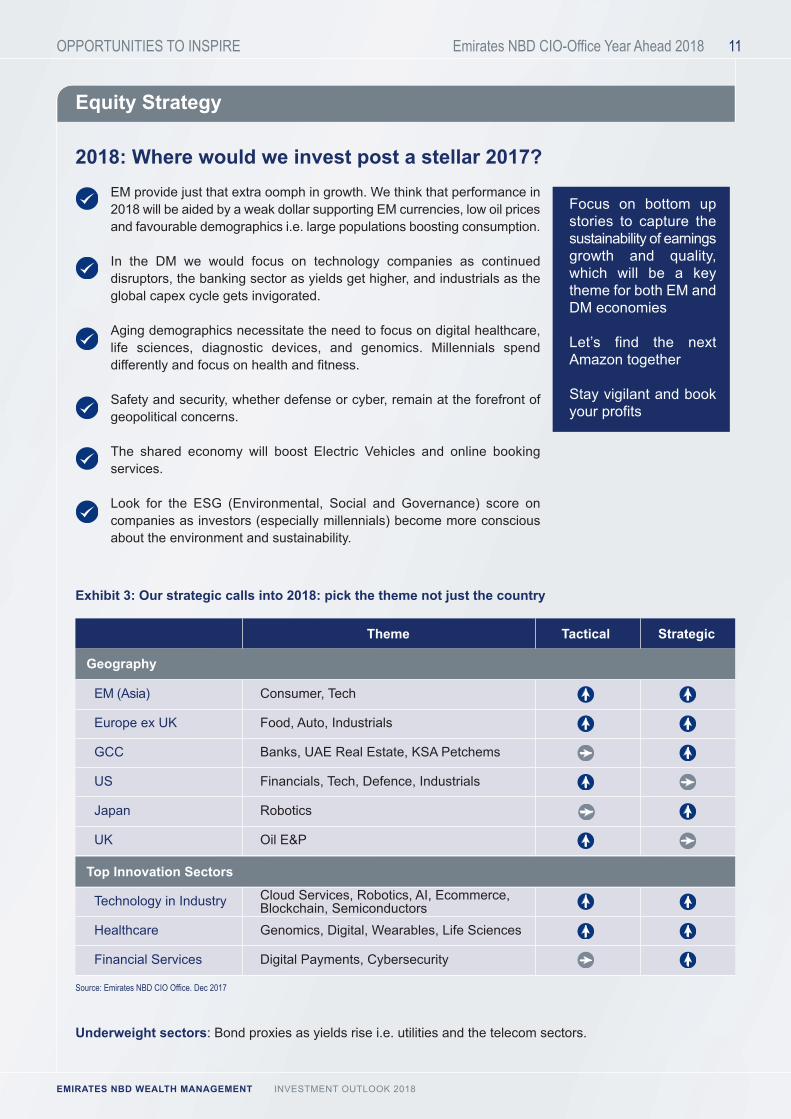
2018: Where would we invest post a stellar 2017? EM provide just that extra oomph in growth. We think that performance in2018 will be aided by a weak dollar supporting EM currencies, low oil pricesand favourable demographics i.e. large populations boosting consumption.
In the DM we would focus on technology companies as continueddisruptors, the banking sector as yields get higher, and industrials as theglobal capex cycle gets invigorated.
Aging demographics necessitate the need to focus on digital healthcare,life sciences, diagnostic devices, and genomics. Millennials spenddifferently and focus on health and fitness.
Safety and security, whether defense or cyber, remain at the forefront ofgeopolitical concerns.
The shared economy will boost Electric Vehicles and online bookingservices.
Look for the ESG (Environmental, Social and Governance) score oncompanies as investors (especially millennials) become more consciousabout the environment and sustainability.
Underweight sectors: Bond proxies as yields rise i.e. utilities and the telecom sectors.
Exhibit 3: Our strategic calls into 2018: pick the theme not just the country
Theme Tactical Strategic
Cloud Services, Robotics, AI, Ecommerce,Blockchain, Semiconductors
Focus on bottom upstories to capture thesustainability of earningsgrowth and quality,which will be a keytheme for both EM andDM economies
Let’s find the nextAmazon together
Stay vigilant and bookyour profits
Source: Emirates NBD CIO Office. Dec 2017
Geography
Top Innovation Sectors
EM (Asia) Consumer, Tech
Europe ex UK Food, Auto, Industrials
GCC Banks, UAE Real Estate, KSA Petchems
US Financials, Tech, Defence, Industrials
Japan Robotics
UK Oil E&P
Technology in Industry
Healthcare Genomics, Digital, Wearables, Life Sciences
Financial Services Digital Payments, Cybersecurity

OPPORTUNITIES TO INSPIRE 12Emirates NBD CIO-Office Year Ahead 2018
EMIRATES NBD WEALTH MANAGEMENT INVESTMENT OUTLOOK 2018
Equity Strategy – US Equity Markets
Exceptional returns in 2017 (a broad-based rally) are not expected tocontinue into 2018 and neither is thelow volatility. The largest drawdownwas 3%, whilst the median over thelast 40 years was 10%. Continueinvesting in sustainable businessesto generate mid to high single digitreturns in 2018. It is the 9th year ofeconomic expansion in the US.Economic growth leads to corporateprofit growth and though late cycle,the economy is still in anexpansionary mode.
Positive catalysts> Earnings growth of c.10% for US
large caps in 2018 is achievablethrough tax cuts = 5% + Organicgrowth = 5%. The statutory taxrate has been reduced to 21%from 35%. The median tax ratepaid by S&P companies iscurrently 28%. Buybacks on thetax amnesty on repatriationwould further boost earningsgrowth. There is c. USD 900bn incash overseas with technologyand healthcare companies
> Higher capex spend
> Upwards earnings revisions andpositive forward guidance
> A slow tightening cycle
Risks: Valuations are lofty comparedto historical norms. The median stocktrades in the 98th Percentile (40years). As full employment isreached, higher labour costs coulddent profits. Confidence is near arecord high.
˃ Expect mid to high single digit returns in 2018, with H1 getting the lions share
˃ Overweight finance, technology and industrials (cyclical sectors)
˃ The S&P 500 has had positive total returns for 14 months, a first for the Index
Dec-17
Nov-17
Oct-17
Sep-17
Aug-17
Jul-17
Jun-17
May-17
Apr-17
Mar-17
Feb-17
Jan-17
Dec-16
0.0
0.5
1.0
1.5
2.0
2.5
3.0
3.5
4.0
4.5
1.1
3.1
2.32.1
0.3
2.1
0.6
1.41.0
0.1
4.0
1.92.0
Exhibit 5: The S&P 500, % change each month
Exhibit 4: US indices valuations and growth
Source: Bloomberg. Dec 2017
TelecomEnergy
Real estateUtilities
Cons. StplIndustrials
S&P500HealthcareFinancials
Cons. DiscMaterials
Tech
-5% 0% 5% 10% 15% 20% 25% 30% 35% 40%
Exhibit 6: Technology the best performer
Source: Bloomberg. Dec 2017
2017 Forward LT EPSTotal Return P/E Growth
S&P 500 2,674 21.8% 20.0 12.9
RUSSELL 2000 1,536 14.6% 34.7 9.0
NASDAQ 6,903 29.7% 24.3 11.2
DOW JONES 24,719 28.1% 19.7 8.7
Source: Bloomberg. Dec 2017
Index Level
OPPORTUNITIES TO INSPIRE 13Emirates NBD CIO-Office Year Ahead 2018
EMIRATES NBD WEALTH MANAGEMENT INVESTMENT OUTLOOK 2018
Equity Strategy – US Equity Markets
Sectors with the highest potentialgrowth:
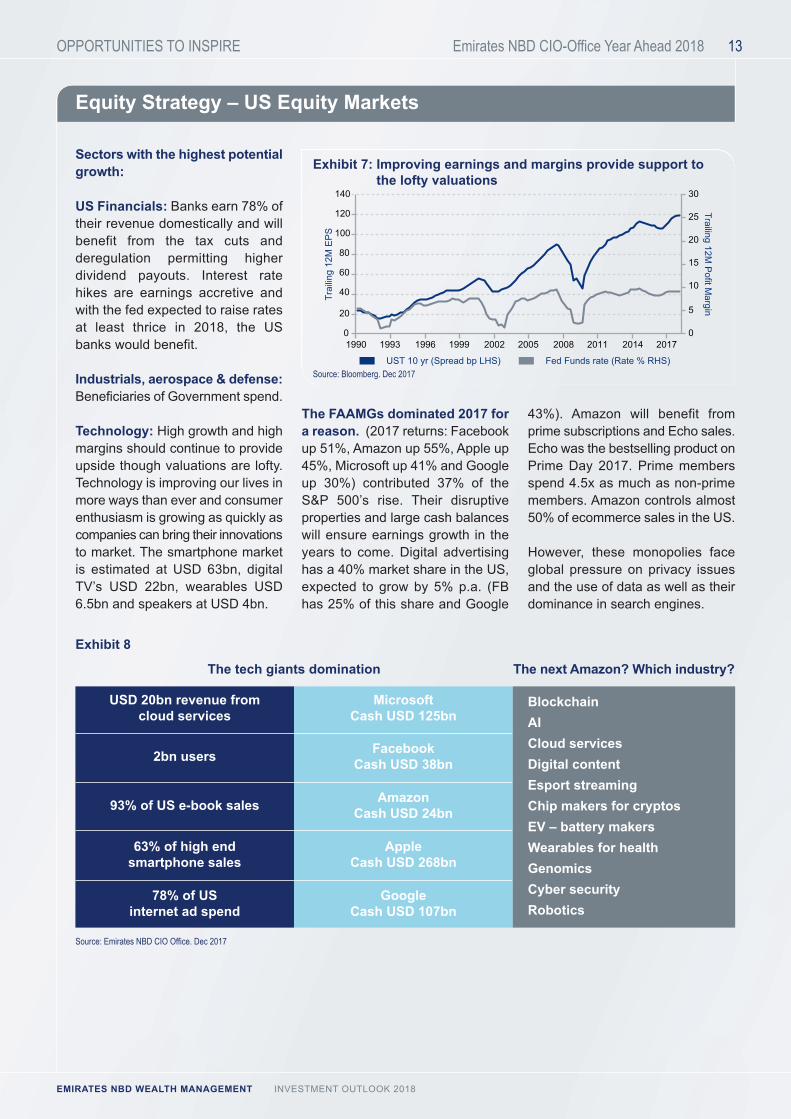
US Financials: Banks earn 78% oftheir revenue domestically and willbenefit from the tax cuts andderegulation permitting higherdividend payouts. Interest ratehikes are earnings accretive andwith the fed expected to raise ratesat least thrice in 2018, the USbanks would benefit.
Industrials, aerospace & defense:Beneficiaries of Government spend.
Technology: High growth and highmargins should continue to provideupside though valuations are lofty.Technology is improving our lives inmore ways than ever and consumerenthusiasm is growing as quickly ascompanies can bring their innovationsto market. The smartphone marketis estimated at USD 63bn, digitalTV’s USD 22bn, wearables USD6.5bn and speakers at USD 4bn.
The FAAMGs dominated 2017 fora reason. (2017 returns: Facebookup 51%, Amazon up 55%, Apple up45%, Microsoft up 41% and Googleup 30%) contributed 37% of theS&P 500’s rise. Their disruptiveproperties and large cash balanceswill ensure earnings growth in theyears to come. Digital advertisinghas a 40% market share in the US,expected to grow by 5% p.a. (FBhas 25% of this share and Google
43%). Amazon will benefit fromprime subscriptions and Echo sales.Echo was the bestselling product onPrime Day 2017. Prime membersspend 4.5x as much as non-primemembers. Amazon controls almost50% of ecommerce sales in the US.
However, these monopolies faceglobal pressure on privacy issuesand the use of data as well as theirdominance in search engines.
Fed Funds rate (Rate % RHS)UST 10 yr (Spread bp LHS)
Trai
ling
12M
EP
S
Trailing 12M P
ofit Margin
1990 1993 1996 1999 2002 2005 2008 2011 2014 20170
20
40
60
80
100
120
140
0
5
10
15
20
25
30
Exhibit 7: Improving earnings and margins provide support tothe lofty valuations
Source: Bloomberg. Dec 2017
The tech giants domination The next Amazon? Which industry?
FacebookCash USD 38bn
AmazonCash USD 24bn
AppleCash USD 268bn
GoogleCash USD 107bn
Exhibit 8
Source: Emirates NBD CIO Office. Dec 2017
Microsoft Cash USD 125bn
2bn users
93% of US e-book sales
63% of high endsmartphone sales
78% of US internet ad spend
USD 20bn revenue from cloud services
BlockchainAICloud services Digital content Esport streamingChip makers for cryptosEV – battery makers Wearables for health GenomicsCyber securityRobotics

OPPORTUNITIES TO INSPIRE 14Emirates NBD CIO-Office Year Ahead 2018
EMIRATES NBD WEALTH MANAGEMENT INVESTMENT OUTLOOK 2018
Equity Strategy – GCC Markets
> High yielding companies offer sustainable returns
˃ Regular free cash flows are translating to sustainable dividend pay outs
> The petrochemical companies have high margins on account of lower feedstock prices
> The real estate sector is generating sustainable income from malls and hotels
> The banking and telecom sectors have maintained their high dividend payout
MXGCC Index MXEF Index CO1 Comdty
20
40
60
80
100
120
140
160
Jan-13 Jan-14 Jan-15 Jan-16 Jan-17 Jan-18
Exhibit 9: On a 5 year basis the GCC markets match EM returns
Source: Bloomberg. Jan 2018
Real estateIndustrialMaterialsFinancials
MSCI GCCHealthcare
EnergyDisc.
StaplesTelecomUtilities
-10% -5% 0% 5% 10% 15% 20%
16.4%15.9%
11.8%10.5%
4.6%4.2%
2.9%2.1%
-0.9%-3.7%
-7.3%
Exhibit 10: MSCI GCC sector total returns 2017
Source: Bloomberg. Dec 2017
The GCC markets offer reasonablevaluations as they were theexception to the global rally of 2017.The UAE and KSA indices ended2017 flat, hence provide a bettercanvas than the global equitymarket. On a five year basis GCCmarkets performance has matchedthat of EM, but regional events keptinvestors sidelined in 2017. GCCmarkets are attractively valued– theUAE is trading at 10x 2018E Price toEarnings with a 4.9% yield, the SaudiIndex at 13.2x with a 3.7% yield vs13x for MSCI EM and a 2.8% yield,.However, geopolitical concerns needto be addressed to provide increasedliquidity and investor confidence inthe UAE and GCC markets.
In the GCC in 2017, real estate gainsin the Index were driven largely byone stock in the KSA i.e. Dar AlArkan (up 133%). Industrial gainswere driven by DP World (up 45%)and finance sector gains were led bybanks in the KSA. The materialssector had petrochemical companiesrally on higher petrochemical productprices. Financials and logisticcompanies were the best performerson the Dubai bourse. On the AbuDhabi bourse insurance and energycompanies were the outperformers. On a five year
basis GCC marketsperformance has
matched that of EM
OPPORTUNITIES TO INSPIRE 15Emirates NBD CIO-Office Year Ahead 2018
EMIRATES NBD WEALTH MANAGEMENT INVESTMENT OUTLOOK 2018
Equity Strategy – GCC Markets
Banking: We remain positive banksin the GCC as higher interest rateswill translate to higher net interestmargins and higher earnings. NetInterest Margin expansion hascontinued for GCC banks in Q4.The Islamic banks in the GCCremain the best positioned tobenefit from higher global rates asthey have large proportions of non-interest bearing deposits.
2017 began with GCC banks facingtightening liquidity and deterioratingcredit quality issues in the SMEsector. 2018 looks better asimproved business and consumergrowth, supported by higher oilprices should accelerate economicgrowth. In the UAE the key catalystis expected to be the Expo 2020with the construction sector drivinggrowth. Also, banking consolidationwithin the UAE such as the FirstGulf Bank and the National Bank ofAbu Dhabi merger, are consideredto be at the forefront of a strategictransformation in the bankingsector, as this may compel smallerbanks to merge and remaincompetitive.
Real estate: Here the Dubai realestate sector would be our focus.The upcoming Expo 2020 isexpected to drive up demand andprices in 2018. Increasingly,individual investors and real estatefunds are investing in Dubai as themajor developers i.e. EmaarProperties, Dubai Properties andNakheel provide differentiatedproducts in the market. In the realestate sector developers remaincheaply valued and as off plandeliveries translate into revenue thesector should see a boost.
The sector remains well supportedby recurring revenue from malls and
hotels. Over the next three years,around 886,000 sq. meters (+22.0%)of new retail space is expected toenter the Dubai market, reaching4.1mn sq. meters of retail GLA.Dubai is targeting 20mn touristarrivals by 2020. Dubai has beenranked amongst the top three citiesin the world that are visited bytourists relative to its population size.
Logistics: Our focus is on the UAEhere. The UAE’s logistics sector isexpected to grow in 2018 fueled bynew investments and strong growthin the UAE’s air and sea freightmarkets. According to BMIResearch, UAE’s air freight marketis expected to expand by a CAGRof +4.8% over the 2017-2021period. The UAE’s two leadingairports have continued to invest inexpanding and enhancing facilitiesin recent years. Air freight volumesin the UAE are expected to increasewith the expansion of cold-chainlogistics services at both airports.Jebel Ali Port, managed by DPWorld, is investing USD 1.6bnwhich will further expand the portsin the UAE and develop its facilities.Abu Dhabi Ports Company plans toexpand Khalifa Port in terms ofcapacity in mid-2018 to keep pacewith rapid growth within the sectorand accommodate more industries.
These expansions will have ameaningful positive outcome formajor logistics-focused companiesin the UAE such as Air Arabia andAramex. The logistics industry willbenefit from the increased tourismand a pick-up in the economy.Synergies amongst the players andadoption of technology are leadingto efficiencies of scale.
Petrochemicals in the KSA: The rally could continue. As oil
hovers close to USD 70,petrochemical product prices willmove in line. We expect a continuedfocus on operational excellence toboost margins and FCF generation.Globally recognised players such asSABIC have clear strategies withthree major greenfield expansionsin upstream chemicals, to enhanceits geographical exposure andfeedstock diversity. Acquisitionswould strengthen its position in keyend markets and provide access tonew product technologies.
Capital markets: 2017 saw somesignificant IPO’s with Emaar listing20% of its development businessand raising AED 4.8bn in theprocess. ADNOC listed itsdistribution subsidiary, raising AED3.1bn off a 10% spinoff. The SaudiAramco IPO is expected to be thebiggest globally and in the region in2018. Tadawul is easing regulationson foreign investors to trade on thebourse in order to facilitate the IPOof Saudi Aramco. Tadawul’sindependent custody model (ICM)will be updated to enhanceQualified Foreign Investor (QFI)access to the market by providingfurther flexibility in trading limits.
The changes depict a positivetransformation as viewed byinternational institutions toenhance the growth of themarket. To facilitate inclusion inthe MSCI EM Index, Saudiregulators announced reformsincluding easing rules for foreigninstitutions to invest. Thisremains the biggest catalyst forthe KSA market as it would get2.5 to 3% share of the MSCI EMIndex with the correspondingpassive inflows boosting itsequity market.
GCC: High yielding sectors to invest in and capital market reform
OPPORTUNITIES TO INSPIRE 16Emirates NBD CIO-Office Year Ahead 2018
EMIRATES NBD WEALTH MANAGEMENT INVESTMENT OUTLOOK 2018
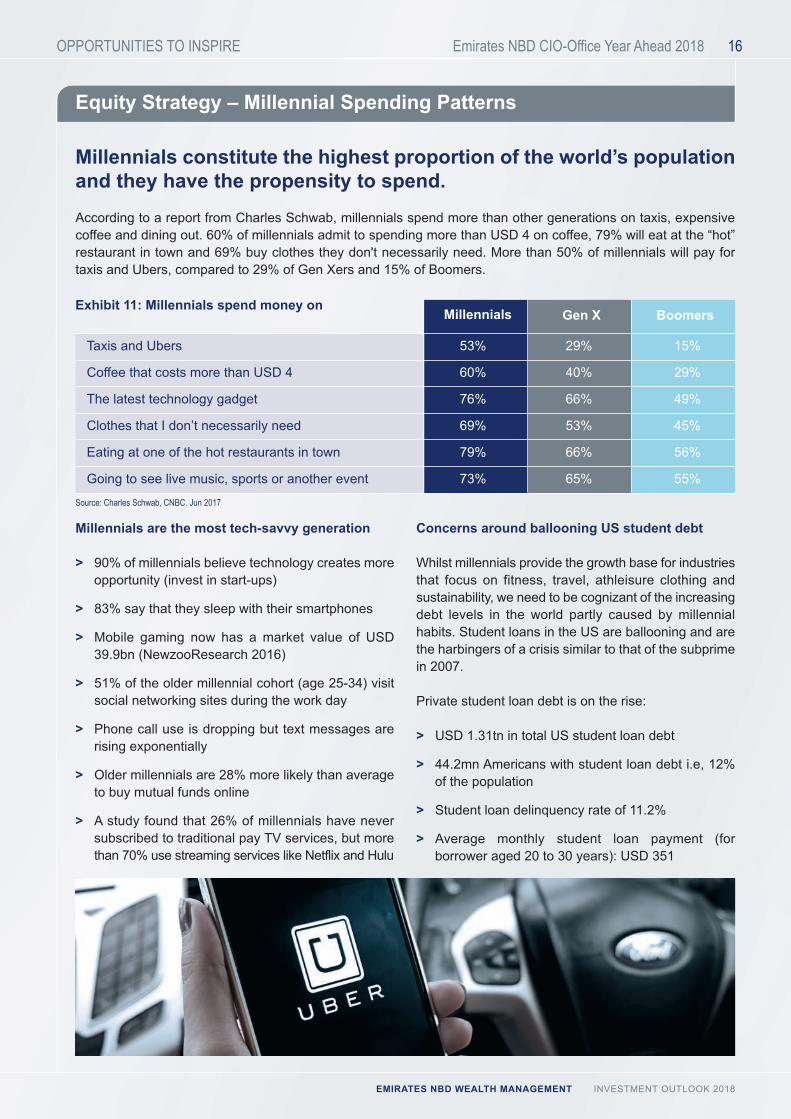
Equity Strategy – Millennial Spending Patterns
Millennials constitute the highest proportion of the world’s populationand they have the propensity to spend. According to a report from Charles Schwab, millennials spend more than other generations on taxis, expensivecoffee and dining out. 60% of millennials admit to spending more than USD 4 on coffee, 79% will eat at the “hot”restaurant in town and 69% buy clothes they don't necessarily need. More than 50% of millennials will pay fortaxis and Ubers, compared to 29% of Gen Xers and 15% of Boomers.
Millennials are the most tech-savvy generation
> 90% of millennials believe technology creates moreopportunity (invest in start-ups)
> 83% say that they sleep with their smartphones
> Mobile gaming now has a market value of USD39.9bn (NewzooResearch 2016)
> 51% of the older millennial cohort (age 25-34) visitsocial networking sites during the work day
> Phone call use is dropping but text messages arerising exponentially
> Older millennials are 28% more likely than averageto buy mutual funds online
> A study found that 26% of millennials have neversubscribed to traditional pay TV services, but morethan 70% use streaming services like Netflix and Hulu
Concerns around ballooning US student debt
Whilst millennials provide the growth base for industriesthat focus on fitness, travel, athleisure clothing andsustainability, we need to be cognizant of the increasingdebt levels in the world partly caused by millennialhabits. Student loans in the US are ballooning and arethe harbingers of a crisis similar to that of the subprimein 2007.
Private student loan debt is on the rise:
> USD 1.31tn in total US student loan debt
> 44.2mn Americans with student loan debt i.e, 12%of the population
> Student loan delinquency rate of 11.2%
> Average monthly student loan payment (forborrower aged 20 to 30 years): USD 351
Exhibit 11: Millennials spend money onMillennials Gen X Boomers
Taxis and Ubers 53% 29% 15%
Coffee that costs more than USD 4 60% 40% 29%
The latest technology gadget 76% 66% 49%
Clothes that I don’t necessarily need 69% 53% 45%
Eating at one of the hot restaurants in town 79% 66% 56%
Going to see live music, sports or another event 73% 65% 55%
Source: Charles Schwab, CNBC. Jun 2017

OPPORTUNITIES TO INSPIRE 17Emirates NBD CIO-Office Year Ahead 2018
EMIRATES NBD WEALTH MANAGEMENT INVESTMENT OUTLOOK 2018
Equity Strategy – Emerging Markets
China OtherEM Asia Ex China
1.2%
0.9%
1.5%
Exhibit 12: Breakdown of 2017 global GDP growth between EMAsia and other countries
Source: IMF WEO. Oct 2017
Global economic trends have beennegatively affected by an agingworld population and, since the2008 Financial Crisis, by lowerproductivity, which have bothstarved the world for structuralgrowth and investors for returns andyield. Both factors have beennegative contributors to globalpotential growth and recentlytriggered speculation about apossible period of economicstagnation ahead.
According to the October 2017 IMFWorld Economic Outlook, globalGDP is forecast to rise onlymodestly to 3.8% by 2021 from3.7% in 2018, as output gaps in theadvanced economies are closedand their growth rates are expectedto decline. The IMF includesdeveloping economies anddescribes how the slack in globalGDP growth will be picked up bythese economies which areprojected to grow at 5% by the endof the forecast period.
What is even more relevant is thecontribution to incremental growthprovided by the region. In particular,within the emerging and developingeconomies, we think investorsshould focus their attention on thegeographical area accounting forthe bulk of global growth, which isEM Asia. EM Asia accounted for60% of world growth in 2017, hence58% of the 3.6% world expansionrate, with China making up 34% andother EM Asia 24% of it (Exhibit 12).
The structural drivers of suchdiverging performance between EMand DM economies are to be found indemographic and productivity trends,with both factors most supportivespecifically in EM Asia. Cyclically,increased stability in China, upsidein EM currencies, hence apotentially weaker dollar, play a rolein the favourable outlook as well.
Overall we hold the view that in EMAsia investors should focus theirattention on countries with dynamicdomestic economies, keeping inmind that exposure to global traderepresents a growing risk in thedays of ‘Trumpnomics’. A case inpoint is provided by India, where weretain a constructive view due to itsuntapped potential stemming fromthe huge consumer base.
EM Asia demographicsSupportive demographics in Asiaaccount for exceptional growth rates
of the labour force and of the middleclass, the latter being the populationcohort which has a relevant amountof discretionary income available,hence important for the sustainabledevelopment of a country.
According to the BrookingsInstitution, Asia will account for 90%of the next billion entrants in themiddle class globally, of which380mn are Indians and 350mnChinese. In Asia the middle class isforecast to grow at an impressiverate in the 2020-2030 decade, 72%,unrivalled for the same period inother regions of the world.
The above patterns are importantfor consumption expenditure, sincethe middle class represents themost important market segment forconsumer goods. Consumption isexpected for this cohort to grow by101% in the 2020-2030 decade inAsia, double the world rate.
> EM Asia offers an appealing growth profile
˃ Demographics and productivity above global average
˃ Consumption patterns boosted by growing middle class
˃ Stable China key to EM Asia outlook
˃ Growing US debt points to dollar peak
OPPORTUNITIES TO INSPIRE 18Emirates NBD CIO-Office Year Ahead 2018
EMIRATES NBD WEALTH MANAGEMENT INVESTMENT OUTLOOK 2018
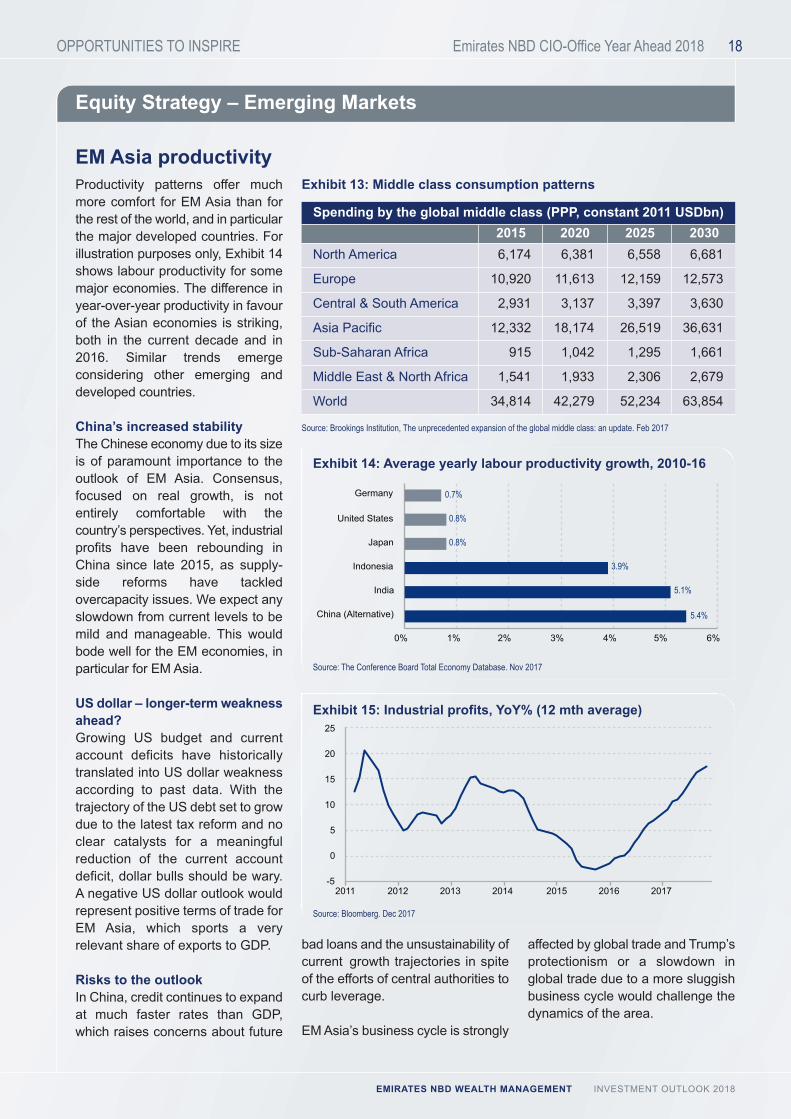
2015 2020 2025 2030Spending by the global middle class (PPP, constant 2011 USDbn)
North America 6,174 6,381 6,558 6,681
Europe 10,920 11,613 12,159 12,573
Central & South America 2,931 3,137 3,397 3,630
Asia Pacific 12,332 18,174 26,519 36,631
Sub-Saharan Africa 915 1,042 1,295 1,661
Middle East & North Africa 1,541 1,933 2,306 2,679
World 34,814 42,279 52,234 63,854
Equity Strategy – Emerging Markets
Productivity patterns offer muchmore comfort for EM Asia than forthe rest of the world, and in particularthe major developed countries. Forillustration purposes only, Exhibit 14shows labour productivity for somemajor economies. The difference inyear-over-year productivity in favourof the Asian economies is striking,both in the current decade and in2016. Similar trends emergeconsidering other emerging anddeveloped countries.
China’s increased stabilityThe Chinese economy due to its sizeis of paramount importance to theoutlook of EM Asia. Consensus,focused on real growth, is notentirely comfortable with thecountry’s perspectives. Yet, industrialprofits have been rebounding inChina since late 2015, as supply-side reforms have tackledovercapacity issues. We expect anyslowdown from current levels to bemild and manageable. This wouldbode well for the EM economies, inparticular for EM Asia.
US dollar – longer-term weaknessahead?Growing US budget and currentaccount deficits have historicallytranslated into US dollar weaknessaccording to past data. With thetrajectory of the US debt set to growdue to the latest tax reform and noclear catalysts for a meaningfulreduction of the current accountdeficit, dollar bulls should be wary.A negative US dollar outlook wouldrepresent positive terms of trade forEM Asia, which sports a veryrelevant share of exports to GDP.
Risks to the outlookIn China, credit continues to expandat much faster rates than GDP,which raises concerns about future
China (Alternative)
India
Indonesia
Japan
United States
Germany
0% 1% 2% 3% 4% 5% 6%
5.4%
5.1%
3.9%
0.8%
0.8%
0.7%
Source: The Conference Board Total Economy Database. Nov 2017
Exhibit 14: Average yearly labour productivity growth, 2010-16
Source: Brookings Institution, The unprecedented expansion of the global middle class: an update. Feb 2017
Exhibit 13: Middle class consumption patterns
-5
0
5
10
15
20
25
2011 2012 2013 2014 2015 2016 2017
Source: Bloomberg. Dec 2017
Exhibit 15: Industrial profits, YoY% (12 mth average)
bad loans and the unsustainability ofcurrent growth trajectories in spiteof the efforts of central authorities tocurb leverage.
EM Asia’s business cycle is strongly
affected by global trade and Trump’sprotectionism or a slowdown inglobal trade due to a more sluggishbusiness cycle would challenge thedynamics of the area.
EM Asia productivity

OPPORTUNITIES TO INSPIRE 19Emirates NBD CIO-Office Year Ahead 2018
EMIRATES NBD WEALTH MANAGEMENT INVESTMENT OUTLOOK 2018
Equity Strategy – Emerging Markets
The EMs remain an area ofappealing valuations vs DMs. Notonly do they offer the highesteconomic growth, corporate earningsgrowth is in the mid-teens, which ismuch higher than that of the DMs.
Domestic demand drives consumptionin these denser economies whichalso boast a young populationwhich will enter the workforce andboost productivity further.
EMs are not a homogeneous groupand besides covering severalgeographies i.e. Asia, SouthAmerica and Central Europe, theyalso can be classified into oilimporters and exporters.
India is the world’s largestdemocracy, seen to be politicallystable and China is now becominga hub of technological innovation.
China dominates the world with730mn internet users, andTencent’s WeChat has exceeded700mn users. China also leads theworld in adoption of electric vehiclesin a move to reduce pollution.
> Driven by the youth and the growing middle class
> A widening EM – DM growth differential will support EM assets
> Stable macro conditions should reinforce recovering earning trends
> Increasing spending power as the working population increases
> Low penetration of consumer goods offers a blank canvas
2017 2030 2050
4.11
0.82
4.74
0.79
5.39
0.75
0
2
4
6
1
3
5
Less Developed Region Developed Region
Exhibit 16: EMs are witnessing growth in the work force vs. adecline in the DMs
Source: United Nations Population Division, 15-64 age group ( in mn). Dec 2017Developed regions comprise Europe, Northern America, Australia/New Zealand and JapanLess Developed Regions comprise all regions of Africa, Asia (ex. Japan), Latin America and the Caribbean plusMelanesia, Micronesia and Polynesia
We focus here on just two themes that we like in the EM space,in the economies which offer the highest growth globally:
> China which is transitioning into an innovative, digitally ledeconomy
> India where under penetration of digital services and arising middle class provide ample scope for growth ofconsumer good companies

OPPORTUNITIES TO INSPIRE 20Emirates NBD CIO-Office Year Ahead 2018
EMIRATES NBD WEALTH MANAGEMENT INVESTMENT OUTLOOK 2018
Equity Strategy – China Technology
Achieving dominance in emergingtechnologies is the world’s mostimportant battle for economicpower. China and the US are theleaders on investment in technologyand AI. In the US, the private sectorleads, and in China it is theGovernment, which aligns with thecountry’s tech monoliths to ensurethe people and the state remain insync. The pace of technologicalbreakthroughs is quickening and willplay an important role for globalmarkets in 2018. The convergenceof AI, big data, and ultra-fastnetworks is the game changer.Connectivity through the internetand smartphones is the key toeconomic potential.
The rise of the BATs (Baidu +39%,Alibaba +95% and Tencent +114%in 2017)is due to the accessibility of thesecompanies to the data of a largeconsumer base. Today AIpermeates all their applicationsallowing them to personaliseofferings and provide the cuttingcompetitive edge to ensure theyretain a monopoly. On Singles Day,Alibaba used AI to generate 400mnpersonalised ads; Chatbots answered
Exhibit 17: US vs China
3.5mn customer queries. TheChinese social media andecommerce companies’ advantageover the US is the 1bn plus Chinapopulation. Chinese consumershave embraced facial recognitionand mobile payments much fasterthan their Western counterparts.
The cashless society has arrived– but it’s in Asia.Internet titans Alibaba and Tencenthave sidelined the banks to take agrowing role in daily commerce.Their success offers a glimpse of afuture where technology firms driveinnovations in finance just as theyhave in retailing, auto and the media
sectors. WeChat and rival Alipayhave about 90% of the mobile-payment market in China.
For Alibaba and Tencent, thetransaction fees come second to theconsumer data collected, which cantransform their apps into marketingplatforms for a wide variety ofservices. While using the customerdata within their ecosystems, bothinternet giants say they don’t sell it toothers. The problem for banks isthat the payment processors oftenknow more about their customersthan they do.
Started more than a decade ago asa copy of PayPal, Alibaba’s Alipaypassed PayPal in 2013 as thelargest mobile-payment platform.That same year, Tencent linked amobile-payment system to itspopular WeChat instant-messagingapp. Tencent and AntFinancialservices are forming partnershipswith payment processing companiesacross Europe and investing inmobile-payment firms in India,Thailand and other countries.
Internet Users 246mn 773mn
Supercomputers (500 most powerful) 2017 143 202
Operational Robots 2017 250,000 340,000
Top AI start ups 75 8
Mobile payments volume 2016 USD 112bn USD 5.5tn
Source: Eurasia Group “Top Risks 2018”
Dec-2011 Dec-2012 Dec-2013
CAGR (2011-2016): 72.7%
Dec-2014 Dec-2015 Dec-20160
100
200
300
400
500
3155
125
217
358
469
Exhibit 18: Number of mobile payment users in China (mn)
Source: China Internet Network Information Centre. Dec 2017
US China

OPPORTUNITIES TO INSPIRE 21Emirates NBD CIO-Office Year Ahead 2018
EMIRATES NBD WEALTH MANAGEMENT INVESTMENT OUTLOOK 2018
Equity Strategy – India
Indian equities are expected todeliver some of the highestearnings growth across majormarkets in 2018. Corporate earningswill be supported by the USD 32bnbank recapitalisation which will boostcredit and consumer spending. Weexpect more fiscal stimulus ahead ofthe 8 State elections in 2018.
Domestic stock market liquiditycontinues to be a strong support forIndian equities along with FIIinflows. Near-term growth recovery,positive domestic sentiment, arating upgrade by Moody’s, andlong-term demographic supportmake staying invested in India anattractive proposition.
Domestic Institutional Investors(DIIs) were net investors to the tuneof USD 14bn in 2017. ForeignInstitutional Investors (FIIs) alsosupported the markets with netinvestments of USD 7.5bn into theIndian equity markets.
Domestic mutual-fund inflows are atrecord levels. Low inflation and lowreturns on property and gold boostedequity inflows. Financial savingsincreased to 54% of annual savingsin 2017 versus 40% in 2012. In 2017,equity participation was 10-12% offinancial savings, mostly via mutualfunds. Risks are a potential high-end-property-market revival andchanges in taxation on capital gains.
The disruption from 2017’s “bigbang” reforms should wane andfocus a return to pushing growth.One of the key concerns in 2017 was
that the Indian market was notsupported by strong earnings growth.Corporate earnings look set for arecovery, which would support thecurrent lofty valuations. The NiftyIndex is trading 10% below 2007’speak valuation and is 1.5sd above its10-year average. High valuationsclearly factor in easy liquidity in globalmarkets. Current market consensusis for 20%+ earnings growth for 2018.
This earnings recovery is aconfluence of the macro polices and
reforms agenda, the boost toinfrastructure spending, the exportgrowth supported by strong globalgrowth, and robust consumerdemand (including improvement inrural demand). A nascent recoveryin private capex would boostearnings over the longer period.
Cash in the hand of the middle andlower income population will lead tohigher consumption as will India’sstrong economic growth and thepower of the Government to spend.
Smartphone Connection (mn) Smartphone Penetration
2014 2015 2016 2017 2018 2019 20200
100
200
300
400
500
600
700
800
0%
10%
20%
30%
40%
50%
60%
157239
340451
544629 702
17%
24%
32%
40%46%
51%55%
Exhibit 19: Smartphone penetration in India
Source: COAI Annual Report. Dec 2017
Jun-16 Sep-16 Dec-16 Mar-17 Jun-170
100
200
300
400
500
330
21
346
21
370
22
401
22
410
22
Wireless Internet Subscribers Wired Internet Subscribers
Exhibit 20: Total internet subscribers (mn)
Source: TRAI. Dec 2017
> India is young and growing – the cycle is at its beginning
> Indian corporate earnings growth is in the high teens
> The Indian middle class is set to become globally significant
> Capital markets’ expansion will add to breadth
> Domestic flows providing sustainable liquidity
OPPORTUNITIES TO INSPIRE 22Emirates NBD CIO-Office Year Ahead 2018
EMIRATES NBD WEALTH MANAGEMENT INVESTMENT OUTLOOK 2018
Equity Strategy – India
India provides the demographicsfor increasing ecommerce anddigitisation
India is currently the 2nd largesttelecommunication market globallyand has the 3rd highest number ofinternet users in the world.
> Data usage on Indian telecomoperators' networks (excludingReliance Jio), doubled in sixmonths to 359 petabytes or3.7mn gigabytes per month as4G data usage share increasedto 34% by the end of June 2017
> The Government of India plansto provide wifi to 550,000 villagesby March 2019
The Indian market continues to bedriven by the affordable (<USD 100)and value for money (USD 100-400)smart phone segments.
Supported by rising smartphonepenetration, the launch of 4Gnetworks and increasing consumerwealth, the Indian e-commercemarket is expected to grow to USD200bn by 2026. E-commerce isincreasingly attracting customersfrom Tier 2 and 3 cities, wherepeople have limited access tobrands but have high aspirations.
Two-wheeler sales, tractor sales,diesel demand, rural wage growth,and demand for consumer non-durables – point towards morehouseholds entering the middleclass segment and an improvingrural economy. However, themonsoons in 2018 will remain keyfor a sustained improvement in ruraldemand.
Sectors that will benefit fromincreasing consumption and arecovery of the rural economy:
Autos: Strong demand exists tosustain a 10% sales growth over thenext three years in private andcommercial vehicles. Two-wheelersshould see a 7% CAGR over thesame period.
Consumer goods: Expect demandto pick up on improved consumersentiment, a low base and moreaffordable product prices after theGST “Goods & Services Tax”implementation led to lower taxrates. The rural consumption storyhalted in 2017 owing to severaldisruptive changes in the economy– demonetisation and GST – andpost consecutive droughts in 2014and 2015. The drivers for a ruralconsumption pick-up are now inplace.
Capital goods/infrastructure: TheGovernment is focusing on urbandevelopment and roads;engineering and construction is key.Urban infrastructure and roads isone of the Modi Government’s top-three capex themes.
Property: Demonetisation hasbrought prices to more reasonablelevels. Increased affordability shoulddrive volume recovery.
Private sector banks: Strongdemographics are supportive ofretail / consumer banking growth.With some signs of resolution oflarge ticket corporate NPLs, thecorporate private sector lenderswould likely benefit as credit costsmoderate and growth in corporatelending resumes.
Life insurance companies:A structural shift towards financialsavings which started as aconsequence of the demonetisationdrive should continue. Lifeinsurance companies which havebetter distribution franchises andstrong banc-assurance tie upswould benefit. With structuralimprovements in persistencytogether with higher growth, NewBusiness Premium (NBP) marginsare also likely to improve resultingin better profitability.
Key risks
> A sharp and sustained rise in oilprices
> A sustained spike in bond yieldscould impact the cost of capital
> Any political instability as a resultof the heavy election calendar of2018
OPPORTUNITIES TO INSPIRE 23Emirates NBD CIO-Office Year Ahead 2018
EMIRATES NBD WEALTH MANAGEMENT INVESTMENT OUTLOOK 2018
Blockchain
So what is blockchain? At its core, itis a decentralised – yet incorruptible –digital ledger used to record atransaction. Any transaction. Itsbest-known application was increating cryptocurrency, but thetechnology has the capability todisrupt every industry across theboard: from banking to baking!Blockchain technology eliminatesreliance on single-location storageof information, permits public recordkeeping that is easily verifiedacross potentially millions ofsources, all the while preservingprivacy and anonymity. Think of itas sharing a single document withmillions of users, but where allusers can simultaneously accessand use the document, with no riskto data reliability.
Most importantly – and by design –the blockchain ecosystem preventsany single entity from controllinginformation; it has no single point offailure because information is storedin blocks with an interlinked chain(hence the name blockchain). Justlike the internet, the technology isbuilt to be robust. This technologyaddresses major global regulatoryissues because all information onthe blockchain is widely accessible.
A blockchain continues to grow asmore users (known as nodes oradministrators) voluntarily join itand verify information on theblockchain. So why volunteer?Depending on which underlyingblockchain is used, these nodes oradministrators are rewardedthrough gathering or “mining”tokens, known as cryptocurrencies.
Cryptocurrencies (cryptos) areeffectively digital tokens that areexchangeable for goods or services(i.e. a utility token) or tradeableagainst other cryptos (i.e. acurrency token or coin). Cryptos,just like blockchain technology,were designed to operate in adecentralised digital paymentsystem. The first of these wasBitcoin, which has now becomesynonymous with the cryptomovement. The staunch supportersof cryptos argue that they are nodifferent to your traditional (fiat)currencies sitting in a bank account;that effectively, both crypto and fiatcurrencies are limited entries in adatabase that cannot be changedwithout fulfilling specific conditions.
The consensus on blockchaintechnology is that it is a matter ofwhen - and not if - it is adopteduniversally. The only consensus oncryptos today, however, is that thereis no consensus; you either support
the underlying technology andperceived value or you don’t. Notunlike when the internet was firstintroduced, there will be those whoshun the technology and others whoembrace it. Only time will tell if theearly movers will have the edge, orif the crypto skeptics were right allalong. As with all technology, it isonly as good as it is useful: only atthat point in time when it becomespart of Technology Living will thedissenters be forced to adapt.
In keeping with our view that we are indeed living in Tech Age 2.0,blockchain technology presents boundless opportunity to continue todisrupt as it grows in its application across several sectors.
Just like theinternet, thetechnology is
built to be robust

Blockchain
OPPORTUNITIES TO INSPIRE 24Emirates NBD CIO-Office Year Ahead 2018
EMIRATES NBD WEALTH MANAGEMENT INVESTMENT OUTLOOK 2018
Industries potentially disruptedby blockchain:
Financial Services & Payments:Complex, cross-border paymentsmay be more secure withblockchain. International paymentsystems such as SWIFT need safercross-border payments solutions: afully decentralised blockchain couldbe that solution. That said, spin-offtechnologies from blockchains alsopose a threat to the long-term viabilityof SWIFT. In fact, the US FederalReserve, which is the supervisor ofUS dollar payment, settlement andclearing systems, highlighted cross-border payments as a possible casefor blockchain use.
Leading global banks, alongsideMasterCard, Visa and IBM, aretenaciously exploring the ledgertechnology behind blockchain toimprove post-trade processing, to
make secure payments and tomaintain immutable records.
Online Retail: Sellers and buyerscan connect directly on blockchain,circumventing the middleman.Smart contracts embedded in theblockchain could establish scoresfor buyers and sellers to determinetheir reliability and quality.
The Internet of Things: Samsungand IBM are creating a decentralisednetwork of IoT devices.
Online Media and Music: Listenersand musicians can connect directly.
Online Marketing: Start-ups appearto support the decentralised systemof record keeping, and are alreadylooking to build platforms whichavoid the reliance on intermediaries:this could possibly mitigate againstclick-fraud.
Video Games: The virtual currenciesused in digital games could be"tokenised" and transferable,allowing people to make moneytrading them like "real" assets.Start-up houses, Gameflip andDMarket, are looking to developthis further.
eSports: Multiplayer video gamecompetitions are getting morepopular, and blockchain technologywill allow virtual asset purchases,among other benefits.
Cloud Storage: File storage couldbecome more secure and possiblycheaper.
Digital Wallets: E-Wallets couldmake it easier to pay for tolls,parking and other consumables.
(Source: Barron’s, Bloomberg, Morningstar)
Exhibit 1: Major technology transforming financial services
Technology Financial Services
Foundations Innovations
Machine Learning
PredictiveAnalytics
Distributed Ledger
(Blockchain)
SmartContractsBiometrics
APIsDigital Wallets
AIBig Data
DistributedComputing
Cryptography
Mobile AccessInternet
Pay
Investment Advice (Robots)Credit Decisions
Regtech, Fraud DetectionAsset Trading
Settle PaymentsB2B
Back-office and RecordingDigital Currencies
Automatic TransactionsSecurity
Identity ProtectionEasy to use Digital Wallets; Finance Dashboards; P2P
Crowd-fundingInter-operability and Expandability
Save Borrow Manage risks Get advice
Source: Morningstar. Dec 2017

OPPORTUNITIES TO INSPIRE 25
Fixed Income Strategy
Emirates NBD CIO-Office Year Ahead 2018
EMIRATES NBD WEALTH MANAGEMENT INVESTMENT OUTLOOK 2018
Each year we examine thepotential catalysts which mayimpact returns on fixed income.2015 brought the “great rotation”;2017 followed with PresidentTrump’s “reflationary trade”; and2018 presents a dilemma. At theend of a decade long bull run,global central banks are graduallypulling the plug on stimulus – theso-called “easy money”.
It has become all too prevalenttoday that bond market sentiment isdriven by a series of glossy chartsand theories; but the fact remains:long term global growth has beenstagnant and inflation has beenstubbornly low.
Are we just complacent or beingnaïve trying to understand the realmof financial markets?
> On policy rates – Is this the“new normal” on rates?
> On Inflation – How muchmoney needs to be thrown in to
stimulate spending to igniteinflation?
> On global debt levels – Is thissustainable? Can we affordhigher rates and still servicesuch massive debt levels?Currently global debt is at arecord high of close to USD220tn or circa 325% of globalGDP output
> On expected returns – Are wecomplacent with the returns andrisks attached?
> On monetary and fiscalreforms – Were policy makerscredible? Did this create assetbubbles that led to the birth ofcryptocurrencies?
The most topical - The US yieldcurve being flat has raised manyconcerns as we move to perhaps alate extended economic cycle. Webelieve economic fundamentalsand the growth trajectory couldfurther support and maintain the
shape of the yield curve of furtherflattening to some inversion. Thesteady increase in shorter-termrates has been a major driver of theflattening of the yield curve.
With broad-based expectations forthree rate hikes by the FederalReserve in 2018, the spreaddifferential between the shorter-termtreasuries and their long-termmaturities could converge further.During the last four decades, theyield curve has flattened six times ofwhich 5 led to a recessionary periodfor the US with an average lag effectof about 1 to 2 years.
As far as tighter monetary policiesare concerned, higher rates do notalways translate nor stipulate theunderperformance on the fixedincome asset class directly. Today,the bond markets have evolved,and offer well diversifiedopportunities for investors. Thereare many ways to steer away fromthe most sensitive bonds from risingrates and position into the less
Fixed Income is core for every portfolio: finding value in a rich environment (perhaps the “New Normal”)
> DM Sovereign bonds portend negative to flat returns
> US Government bonds are appealing
> Remain overweight EM bonds – sovereigns, financials, consumer staples attractive
> GCC bond markets offer select opportunites across sovereigns and corporates
Fixed Income Positioning Current Expected Returns Risks toSub-Asset Class Tactical Strategic Yield for 2018 our Strategy
DM Sovereign Debt ▼ ■ 1.15% Flat
Corporate Investment Grade ▲ ■ 2.48% 2.5% to 3.5%
Corporate High Yield (Global) ■ ■ 5.23% 4.0% to 6.0%
EM Debt ▲ ▲ 4.52% 4.0% to 5.0%
GCC Bond/Sukuk ▲ ▲ 4.25% 3.5% to 4.5%
Overweight ▲ Neutral ■ Underweight ▼
Geo-politicalconcerns, inflationarypressures, fasterthan expectedmonetary policyactions, highersupply of bondissuance to fundfederal deficit, higherglobal growth thanexpected
Exhibit 1: Our preference and strategy across the fixed income sub asset class
Source: Fixed Income desk (CIO Office) projections. Dec 2017

Fixed Income Strategy
OPPORTUNITIES TO INSPIRE 26Emirates NBD CIO-Office Year Ahead 2018
EMIRATES NBD WEALTH MANAGEMENT INVESTMENT OUTLOOK 2018
sensitive, and still be investedprudently without compromising onquality of bond portfolios.
We believe bond markets areseasoned and ready for a gradualpace of policy rate hikes with the“well-telegraphed” unwinding ofcentral bank’s balance sheets. Afaster pace of US rate hikes areprobably the biggest risk to ourassessment, along with inflationovershooting. However, wesubscribe to the fact that policyrates are unrealistically low,especially as we move towards theend of an extended late-economic
cycle. In most of the past USeconomic cycles, the FederalReserve has had enough buffer ontheir monetary policy to drop rates.Failing to hike rates sufficientlyduring this cycle could posesignificant risks to the economyleaving the FED with limited tools tomaneuver monetary policies.
US-Government bonds areappealing given the macro-economic landscapeOur findings and thoughts on longterm valuations, give us comfort andconviction that yields on the US 10-year benchmark should be well
anchored between the 2.50% to2.75% range throughout 2018.While the current shape of the yieldcurve does depict some inversion,we see a low likelihood that long-term inflation expectations mayovershoot and pressure bond yieldsto rise.
Exhibit 2: Yield curve vs fed funds rate Exhibit 3: Economics vs reality: US benchmarkyields seem to be well anchored
Source: Bloomberg. Dec 2017
1997 2002 2007 2012 20170
1
2
3
4
5
6
7
-100
-50
0
50
100
150
200
250
300
Fed Funds TR - upper bound (%)5Y-30Y (Spread bp LHS) Fed Funds Rate (%)UST 10Y (Spread bp LHS)
2013 2014 2015 2016 20171.0
1.5
2.0
2.5
3.0
3.5First 25bp hike in Dec 2015; Start of the tightening cycle
Three 25bp hikesduring 2017
0.0
0.2
0.4
0.6
0.8
1.0
1.2
1.4
1.6
Exhibit 4: University of Michigan expected changein prices over the next 5-10 years(median)
Exhibit 5: Negative or zero yields lure globalinvestors to US Government bonds
Source: Bloomberg. Dec 2017
Source: Bloomberg. Dec 2017
Source: Bloomberg. Dec 2017
2.0
2.5
3.0
3.5
4.0
4.5
5.0
1990 1993 1996 1999 2002 2005 2008 2011 2014 2017 2014 2015 2016 20170
2000
4000
6000
8000
10000
12000
14000
Bill
ions
(US
D)
OPPORTUNITIES TO INSPIRE 27Emirates NBD CIO-Office Year Ahead 2018
EMIRATES NBD WEALTH MANAGEMENT INVESTMENT OUTLOOK 2018
Fixed Income Strategy
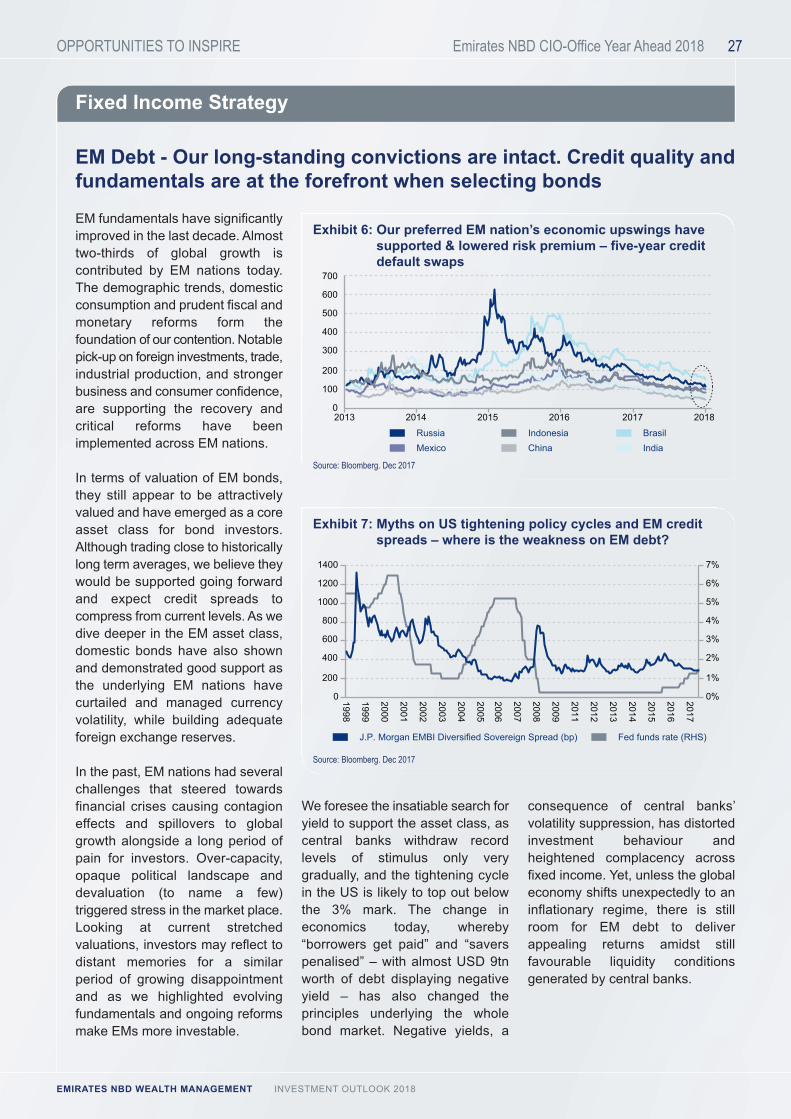
EM fundamentals have significantlyimproved in the last decade. Almosttwo-thirds of global growth iscontributed by EM nations today.The demographic trends, domesticconsumption and prudent fiscal andmonetary reforms form thefoundation of our contention. Notablepick-up on foreign investments, trade,industrial production, and strongerbusiness and consumer confidence,are supporting the recovery andcritical reforms have beenimplemented across EM nations.
In terms of valuation of EM bonds,they still appear to be attractivelyvalued and have emerged as a coreasset class for bond investors.Although trading close to historicallylong term averages, we believe theywould be supported going forwardand expect credit spreads tocompress from current levels. As wedive deeper in the EM asset class,domestic bonds have also shownand demonstrated good support asthe underlying EM nations havecurtailed and managed currencyvolatility, while building adequateforeign exchange reserves.
In the past, EM nations had severalchallenges that steered towardsfinancial crises causing contagioneffects and spillovers to globalgrowth alongside a long period ofpain for investors. Over-capacity,opaque political landscape anddevaluation (to name a few)triggered stress in the market place.Looking at current stretchedvaluations, investors may reflect todistant memories for a similarperiod of growing disappointmentand as we highlighted evolvingfundamentals and ongoing reformsmake EMs more investable.
We foresee the insatiable search foryield to support the asset class, ascentral banks withdraw recordlevels of stimulus only verygradually, and the tightening cyclein the US is likely to top out belowthe 3% mark. The change ineconomics today, whereby“borrowers get paid” and “saverspenalised” – with almost USD 9tnworth of debt displaying negativeyield – has also changed theprinciples underlying the wholebond market. Negative yields, a
consequence of central banks’volatility suppression, has distortedinvestment behaviour andheightened complacency acrossfixed income. Yet, unless the globaleconomy shifts unexpectedly to aninflationary regime, there is stillroom for EM debt to deliverappealing returns amidst stillfavourable liquidity conditionsgenerated by central banks.
EM Debt - Our long-standing convictions are intact. Credit quality andfundamentals are at the forefront when selecting bonds
IndonesiaRussia BrasilChinaMexico India
0
100
200
300
400
500
600
700
2013 2014 2015 2016 2017 2018
Exhibit 6: Our preferred EM nation’s economic upswings havesupported & lowered risk premium – five-year creditdefault swaps
Source: Bloomberg. Dec 2017
Fed funds rate (RHS)J.P. Morgan EMBI Diversified Sovereign Spread (bp)
1998
1999
2000
2001
2002
2003
2004
2005
2006
2007
2008
2009
2011
2012
2013
2014
2015
2016
2017
0
200
400
600
800
1000
1200
1400
0%
1%
2%
3%
4%
5%
6%
7%
Exhibit 7: Myths on US tightening policy cycles and EM creditspreads – where is the weakness on EM debt?
Source: Bloomberg. Dec 2017

OPPORTUNITIES TO INSPIRE 28Emirates NBD CIO-Office Year Ahead 2018
EMIRATES NBD WEALTH MANAGEMENT INVESTMENT OUTLOOK 2018
Fixed Income Strategy
50,000
100,000
150,000
200,000
250,000
300,000
2012 2013 2014 2015 2016 2017
Corporate
Record borrowing from EM debt issuers (USD mn) Record borrowing from Global debt issuers (USD mn)
Financial DM EMSovereign
0
1,000,000
2,000,000
3,000,000
4,000,000
5,000,000
2012 2013 2014 2015 2016 2017 2018
Exhibit 8: Borrowings through bond markets have surged over the years to record levels
Source: Bond Radar and Emirates NBD CIO Office. Dec 2017 Source: Bond Radar and Emirates NBD CIO Office. Dec 2017
Emerging market vulnerabilities have structurally declined and are nowmore diverse. Primary Eurobond sales were well received andsurpassed USD 675bn for 2017

OPPORTUNITIES TO INSPIRE 29Emirates NBD CIO-Office Year Ahead 2018
EMIRATES NBD WEALTH MANAGEMENT INVESTMENT OUTLOOK 2018
Portfolio Strategy
˃ Diversification benefits of traditional asset classes are limited
˃ New reflation regime implies shift towards riskier assets
˃ Benefits from active management to increase amidst lower correlations
˃ Selective themes preferred in overvalued markets
˃ Alternative strategies enhance portfolios’ risk-return trade-off
Portfolio construction plays aprimary role in the investmentprocess as it is the key driver of afavourable risk-return trade-off. Inlayman’s terms, an investor mustcombine different financial assetsproperly into a well-constructedportfolio in order to achieve thehighest returns possible for the riskshe or she is willing to undertake.The proper asset mix guaranteessome diversification benefits, withportfolio returns smoothed out bythe tendency of asset classes tobehave differently in a given phaseof any business cycle (Exhibit 1).
For instance, during recessionaryperiods, stocks exhibit the largestdrops while government bondshave the largest returns. Thisensures that a balanced stock-bondportfolio suffers less severe lossesthan a pure equity portfolio.
Over the past 30 years the so called60/40 portfolio, with a 60%allocation to equities and 40% togovernment bonds, has beenconsidered the cornerstone of assetallocation according to modernportfolio theory. This methodologyhas served US investors well,delivering 9.6% annualised returnswhen invested in the S&P500 and10-year Treasuries, since December1990 through December 2017.Considering the overvaluation ofcore equities and core bonds in theDM, one can hardly expect similarreturns in the future.
The proper asset mix in a portfolio isdependent on the macroeconomic
scenario as defined by differentpermutations of growth andinflation. In late 2016, the globaleconomy exited a post-crisisregime marked by below-averageeconomic growth and inflation,which had persisted since the endof the late 2000s’ Great Recession.Asset markets were in a risk-on andrisk-off regime where investors,concerned about the outlook forgrowth, exhibited a herding
behaviour and kept changingallocations between risky and saferassets depending on the ebb andflow of their risk appetite.
The post-crisis risk-on and risk-offregime was marked by a negativecorrelation between equities andbonds, which is now evolving into amore normal relationship where thecorrelation level is closer to zero(Exhibit 2).
Global Industrial Production (YoY%)Global Equities to Bonds (YoY%, LHS)
2001 2002 2004 2006 2008 2010 2012 2013 2015 2017-60%
-40%
-20%
0%
20%
40%
60%
-20%
-10%
0%
10%
20%
Exhibit 1: World equities to bonds & global industrial production
Source: Bloomberg, PB-CIO Office. Dec 2017
-0.6
-0.4
-0.2
0.0
0.2
0.4
0.6
0.8
1991 1994 1997 2000 2003 2006 2009 2012 2015 2018
Exhibit 2: Correlation between equities and bonds
Source: Bloomberg. Dec 2017

OPPORTUNITIES TO INSPIRE 30Emirates NBD CIO-Office Year Ahead 2018
EMIRATES NBD WEALTH MANAGEMENT INVESTMENT OUTLOOK 2018
We are currently in a moderateinflation and above-trend growthenvironment, with below-averagereal rates worldwide. Investors whoskewed portfolios towards saferassets, will have to adapt to the newone; a reflationary backdrop whereportfolios see an increasedallocation to riskier assets.
Exhibit 3 gives a brief overview ofhow portfolio allocation shouldchange depending onmacroeconomic regimes. Althoughthe study is skewed towards USassets, extrapolating to globalassets is fairly straightforward,considering the leading role of USfinancial markets on globalsentiment and volatility. Investorsunder the current prevailingreflationary conditions should preferequities to corporate credit and thelatter to government bonds. Mildlyhigher inflation, a reflection of higherexpected growth, will not derail theequity market rally, which we expectto be more subdued in 2018, aslong as monetary policy rates rise ata moderate pace without puttingupward pressure on real rates.Corporate credit, on the other hand,presents limited opportunities forcapital appreciation due to highcorporate leverage levels achievedin the major developed economies.Proper security selection will be of
paramount importance, especially inthe high-yielding sub-asset classeswhere the credit premium is lowest.
As economic agents gain confidencein the outlook, drop their post-crisiscaution, stop deleveraging, andconsume and invest more, investorsdrop their flight-to-quality behaviourand start investing with morediscernment. This is all dependenton the specific opportunities offeredby markets. As a consequence,correlations amongst securitieswithin asset classes tend todecrease as well, with each securitybeing increasingly driven byidiosyncratic factors rather than byherding tendencies reflectingcollective concerns.
For instance, pairwise securitycorrelations within equities tend tochange with the business cycle,rising during economic contractionsand dropping as the economyexpands.
In general, lower correlationsamongst asset classes and sub-asset classes and betweensecurities allow for greater returnsvia active management. Thissuggests we should see acomeback of actively managedstrategies, and in particular activeequity strategies, contrasting the
recent shift towards passiveinvesting through ETFs.
Active management carried out bythe most talented professionals,expected to add value to theportfolio construction process by theaddition of mutual funds and hedgefunds, should be most welcomeconsidering that benefits fromallocating to risky and safer assetswill be fading. The gradual removalof accommodation implemented bycentral banks alongside theabsolute level of bond yieldsreduces the allure of fixed income,and at the same time the equity-bond correlation headed towardszero lowers the diversificationbenefits of the equity-governmentbond allocation.
Exhibit 3: Asset class performance under different macroeconomic regimes in the US
Moderate Strong Recovery with Recovery Recovery Inflation
Best Performer Treasuries Treasuries US Equities US Equities Commodities
Above Median US Dollar Credit Credit Commodities US Dollar
Median Credit US Dollar Treasuries Credit Treasuries
Below Median US Equities US Equities Commodities Treasuries US Equities
Worst Performer Commodities Commodities US Dollar US Dollar Credit
Corporate credit,on the other hand,presents limitedopportunities for
capital appreciation
Source: Adapted from JPMorgan Asset Management. Dec 2017
Portfolio Strategy
Recession Stagnation

OPPORTUNITIES TO INSPIRE 31Emirates NBD CIO-Office Year Ahead 2018
EMIRATES NBD WEALTH MANAGEMENT INVESTMENT OUTLOOK 2018
Portfolio Strategy
Also, the not inexpensive valuationsof core bonds and equities (Exhibit4) call for diversification via sub-asset classes, via themes andhedge funds, in an environmentwhere pure beta exposure is lesslikely to boost portfolio returns.
Diversification via sub-assetclassesExposure to EM assets, both equitiesand bonds, and to non-US smallcaps has historically been rewardingin a reflationary environment. In theEM countries, existing economicslack translates into lower multiplesfor financial assets, fully valued in theDM economies where output gapsare almost close to zero.
Small caps, sensitive to the economiccycle, will continue to outperform asgrowth accelerates in the currentsynchronised recovery. Valuationsof non-US small caps make thesub-asset class still palatable.
The prospect of rising bond yieldscalls for lower duration andstrategies linked to variable rates.Senior bank loans offer this kind ofexposure, combining a more seniorbond structure, lower duration, andsensitivity to variable rates whencompared to high-yielding bonds.
If we are proven right in ourassessment that central banks inthe current year will still tighten at amoderate pace without exertingupward pressure on real rates,basically lagging inflation, theninflation-protected securities shouldhave room to offer positive returns.Diversification via inflation linked-bonds should help mitigate thenegative effects of the low-volatilitybear market in government bonds.
Diversification via themesSome longer-term socioeconomictrends can be translated into
For equities: Outperformance ofHFRI Fund of Hedge Funds Index(HFRIFOF) against MSCI WorldIndex, since HFRIFOF inception,01/01/90, through December 2017.
For bonds:Outperformance of HFRIFund of Hedge Funds Index(HFRIFOF) against Barclays GlobalAggregate, since HFRIFOF inception,01/01/90, through December 2017.
actionable investment ideas whichidentify a specific theme.
A case in point is technologicalprogress made in the fields of artificialintelligence and robotics, wheremachines are increasingly able toreplace humans physically and areincreasingly capable of more cognitivebehaviour. In business digitisation,a company's business model isenhanced by means of digitaltechnologies, potentially displacingunnecessary human labour.
Stocks related to this theme, suchas internet platform providers,
semiconductor manufacturers, andvendors of robots, to name just afew, outperformed the broadermarket last year and are expected tocontinue to do so in the longer term.
Diversification via alternativestrategiesHedge funds offer access toalternative investment strategies andto different sources of returns vstraditional equities and bonds. Theiroutperformance versus traditionalasset classes tends to stand out duringperiods of adverse market conditions,in particular in equity bear markets andduring rising rate regimes (Exhibit 5).
Bond YieldEarnings Yield (LHS)
1996 1999 2002 2005 2008 2011 2014 20170%
1%
2%
3%
4%
5%
6%
3%
4%5%
6%7%
8%9%
10%
11%12%
Exhibit 4: Global stocks and global government bonds expensiveon historical basis
Exhibit 5: Outperformance of hedge funds during challenging marketregimes
Source: Bloomberg, PB-CIO Office. Dec 2017
Average alternative outperformance
Equity bear markets Rising rate regimes
24.0% 15.0%
Source: Bloomberg, PB-CIO Office. Dec 2017

OPPORTUNITIES TO INSPIRE 32Emirates NBD CIO-Office Year Ahead 2018
EMIRATES NBD WEALTH MANAGEMENT INVESTMENT OUTLOOK 2018
Portfolio Strategy
Hedge funds are expected toenhance portfolio returns as equityvolatility is set to increase fromtoday's exceptionally low levels andthe removal of policy accommodationis exerting upward pressure ongovernment bond yields.
Hedge funds, by mitigating equityrisk drawdowns, and helpinginvestors to stay invested in periodsof uncertainty, allow investors toparticipate in subsequent marketrecoveries (Exhibit 6).
After disappointing in the challengingpost crisis regime, we expect theasset class to stage a comeback asfalling market correlations allowinvestors to reap active managementreturns. Investors are advised toafford capital to multi-strategy hedgefunds, without focusing on narrowinvestment themes in this diverseand difficult-to-navigate landscape.
In summary, as investors shift theirallocation towards riskier assetsunder the new macroeconomicregime, they should keep in mindthe constraints posed by currentvaluations and build portfoliosaround non-overvalued sub-assetclasses, secular themes andalternative investment strategies.
MSCI World Index Fund of Hedge Funds Index-60%
-50%
-40%
-30%
-20%
-10%
0%1989 1993 1997 2001 2005 2009 2013 2017
Exhibit 6: Hedge funds versus MSCI World - historical drawdownby year
Source: Bloomberg, PB-CIO Office. Dec 2017

OPPORTUNITIES TO INSPIRE 33Emirates NBD CIO-Office Year Ahead 2018
EMIRATES NBD WEALTH MANAGEMENT INVESTMENT OUTLOOK 2018
UK Real Estate Strategy
˃ Search for yield and excess liquidity is driving UK commercial property investment
˃ Weak GBP is making UK real estate attractive to overseas investors
˃ Market cycle peaking and consensus forecasts are for a correction
˃ Favour student accommodation, warehouse/logistics, long income, healthcare, CRE debt and selectUK housing sectors to mitigate downside risks
˃ Favour REITs over direct investment - select value opportunities available
Despite the ongoing uncertainty andpolitical turmoil, UK commercialproperty made good progress in2017 with an annual total return of11.2%. The key driver of real estatemarkets since the global financialcrisis has been the huge weight ofdomestic and international capitalsearching for yield in a low rateenvironment. High quality (or‘prime’) real estate has been asignificant beneficiary of thisexcessive liquidity and many‘gateway’ markets around the worldhave experienced consistentlystrong price growth for a number ofyears. The UK is one of thosemarkets and pricing pressures werefurther exacerbated by GBP’s sharpcorrection following the ‘Brexit’ votein June last year.
As a result, UK commercial propertyhas become even more desirable toforeign investors, particularly thosefrom North America, the Far Eastand Europe. They have been thedominant buyers in the UK over thelast few years, especially for largescale transactions and in CentralLondon (the first ‘port of call’ for anyoverseas investor). Prices for primeproperties are now, in many cases,in excess of their pre-GFC levels.
Despite the resultant peak pricingconcerns and ongoing uncertainty,the UK’s stable legal system, robustproperty rights, landlord-friendlylease structures, high degree oftransparency and superior marketliquidity are all overriding factors forthese investors.
However, we are now in a risingrate environment and Brexituncertainty is starting to impactproperty fundamentals withweakening occupier demand andrents in a number of key sectors.There is little sign of a shift inpricing momentum at the allproperty level at present but thereare tentative signs of weakness incertain sectors of the transactionalmarket. Poor sentiment is already
prevalent in listed propertysecurities (Exhibit 3) and manyleading institutional investors andproperty advisors are alsoforecasting a correction in 2018through 2019. Certainly the currentconsensus, shared by us, is that thenext leg of the market will be down.
Jan-16
Feb-16
Mar-16
Apr-16
May-16
Jun-16
Jul-16
Aug-16
Sep-16
Oct-16
Nov-16
Dec-16
Jan-17
Feb-17
Mar-17
Apr-17
May-17
Jun-17
Jul-17
Aug-17
Sep-17
1.10
1.15
1.201.25
1.30
1.351.40
1.45
1.501.55
Exhibit 1: GBP against USD
Source: Bloomberg. Dec 2017
Overseas Investors Domestic Investors
47%
53%
Exhibit 2: UK commercial property transactions by investortype 2017
Source: Bloomberg, Propertydata. Dec 2017

OPPORTUNITIES TO INSPIRE 34Emirates NBD CIO-Office Year Ahead 2018
EMIRATES NBD WEALTH MANAGEMENT INVESTMENT OUTLOOK 2018
UK Real Estate Strategy
In light of the current outlook, wefavour property sectors which offera potential hedge against a marketcorrection through investment inproperty sectors with counter-cyclical valuations and/or stablerental income (in either nominal orreal terms). Maintaining rents anddividend cover through a marketdown-cycle are key factors. Thesesectors are:
> Student Accommodation
> Long Income
> Warehouse / Logistics
> Healthcare
> Commercial Property Debt
> UK Residential Housing
> Opportunistic Value
> REITs
2009 2010 2011 2012 2013 2014 2015 2016 2017 2018F 2019F0
5
10
15
20
25
1.89
14.71
8.11
2.31
11.02
19.46
13.89
2.63
11.23
4.00 4.20
Source: MSCI, IPF, Dec 2017
2009 2010 2011 2012 2013 2014 2015 2016 2017 2018F 2019F-10
-5
0
5
10
15
-5.86
7.07
1.18
-4.26
3.88
12.41
7.81
-2.79
5.45
-0.70 -0.60
Exhibit 5: Annual all property capital growth forecasts Q4 2017
Source: MSCI, IPF, Dec 2017
Exhibit 4: Annual all property total return forecasts Q4 2017
GFC RangeCurrent Yield
10
PrimeCentralLondon
PrimeRetail
Centres
Shops Shopping Centres Offices Industrial
SmallMarketTownsRetail
SecondaryRetail
RegionalDominant
MajorUrban
Centres
SmallUrban
Centres
LondonWestEnd
LondonCity
CBDMajorCities
CBDSecondary
Cities
RegionalOut ofTown
SouthEast
Industrial
RegionalIndustrial
Prim
e Y
ield
%
98
7654
3210
Exhibit 3: Current prime CRE yields vs GFC cycle Q4 2017
Source: C&W, Savills, 2017, ENBD estimates, Jan 2018

OPPORTUNITIES TO INSPIRE 35Emirates NBD CIO-Office Year Ahead 2018
EMIRATES NBD WEALTH MANAGEMENT INVESTMENT OUTLOOK 2018
Global Risks to Our 2018 Outlook
Elevated valuations, volatility and low bond yields are considerable issues as we enter 2018. Thisunderscores the need for investors to remain disciplined and globally diversified to help mitigate anypotential isolated shocks. We have identified key potential risks that we actively monitor:
Cyber-attacks causing loss of data for individuals, loss of profits forbusinesses and increasing cross border tension between governments.
An unexpected decline in global growth. China remains the biggest worry.
A slow-down in corporate earnings. If the double digit EPS growthexpectations fall short, markets could pull back suddenly and sharply.
Reduced liquidity if accommodative DM Central Bank policy reversalsoccur. Inflation pressures would then affect oil, food and wages.
Increasing levels of global debt leading to higher default rates and poorerquality of issuances.
Geopolitical Risks from North Korea - US relations.
Individuals’ privacy concerns leading to government interjection in freemarkets. Impact could be severe to various tech-titans which own substantialdata on billions of individuals.

OPPORTUNITIES TO INSPIRE 36Emirates NBD CIO-Office Year Ahead 2018
EMIRATES NBD WEALTH MANAGEMENT INVESTMENT OUTLOOK 2018
Contributors
Tariq Bin Hendi, PhD – Acting Chief Investment Officer
Tel: +971 (0)4 609 3555 Email: [email protected]
Anita Gupta – Head of Equity Strategy
Tel: +971 (0)4 609 3564 Email: [email protected]
Syed Yahya Sultan – Head of Fixed Income Strategy
Tel: +971 (0)4 609 3724 Email: [email protected]
Giorgio Borelli – Head of Asset Allocation and Quantitative Strategies
Tel: +971 (0)4 609 3573 Email: [email protected]
Sunny Naqi, CPA – Fixed Income Analyst, CIO Office
Tel: +914 (0)4 609 3513 Email: [email protected]
Muna Alawadhi – Analyst
Tel: +971 (0)4 609 3511 Email: [email protected]
Nawaf Fahad Ali Mousa AlNaqbi – Equity Analyst
Tel: +971 (0)4 609 3838 Email: [email protected]
Khatija Haque – Head of MENA Research
Tel: +971 (0)4 230 7803 Email: [email protected]
Daniel Richards – MENA Economist
Tel: +971 (0)4 609 3032 Email: [email protected]
Edward Bell – Director Commodity Research
Tel: +971 (0)4 230 7701 Email: [email protected]
Nigel Burton – Director Real Estate Investments
Tel: +44 (0)20 7838 2248 Email: [email protected]
Debra Tran – Head of Private Banking Singapore
Tel: +65 (0)6 594 8757 Email: [email protected]

OPPORTUNITIES TO INSPIRE 37Emirates NBD CIO-Office Year Ahead 2018
EMIRATES NBD WEALTH MANAGEMENT INVESTMENT OUTLOOK 2018
Disclaimer
While ENBD uses reasonable efforts to obtain information from sources which itbelieves to be reliable to the best of its knowledge, ENBD makes no representationthat the information or opinions contained in this publication is accurate, reliable orcomplete and Emirates NBD accepts no responsibility whatsoever for any loss ordamage caused by and act or omission taken as a result of the information containedin this publication.
This publication is provided on a confidential basis and is for informational uses onlyand is not intended for trading purposes. Data/information provided herein areintended to serve for illustrative purposes. The data/information contained in thispublication is not designed to initiate or conclude any transaction. In addition, thedata/information contained in this publication is prepared as of a particular date andtime and will not reflect subsequent changes in the market or changes in any otherfactors relevant to the determination of whether a particular investment activity isadvisable. This publication may include data/information taken from stock exchangesand other sources from around the world and ENBD does not guarantee thesequence, accuracy, completeness, or timeliness of information contained in thispublication provided thereto by unaffiliated third parties. Moreover, the provision ofcertain data/information in this publication is subject to the terms and conditions ofother agreements to which ENBD is a party.
This publication is not intended for use by, or distribution to, any person or entity inany jurisdiction or country where such use or distribution would be contrary to law orregulation. Accordingly, anything to the contrary herein set forth notwithstanding,ENBD, its suppliers, agents, directors, officers, employees, representatives,successors, assigns, affiliates or subsidiaries shall not, directly or indirectly, be liable,in any way, to you or any other person for any: (a) inaccuracies or errors in oromissions from the this publication including, but not limited to, quotes and financialdata; (b) loss or damage arising from the use of this publication, including, but notlimited to any investment decision occasioned thereby. (c) UNDER NOCIRCUMSTANCES, INCLUDING BUT NOT LIMITED TO NEGLIGENCE, SHALLENBD, ITS SUPPLIERS, agents, directors, officers, employees, representatives,successors, assigns, affiliates or subsidiaries BE LIABLE TO YOU FOR DIRECT,INDIRECT, INCIDENTAL, CONSEQUENTIAL, SPECIAL, PUNITIVE, OREXEMPLARY DAMAGES EVEN IF ENBD HAS BEEN ADVISED SPECIFICALLY OFTHE POSSIBILITY OF SUCH DAMAGES, ARISING FROM THE USE OF THISPUBLICATION, INCLUDING BUT NOT LIMITED TO, LOSS OF REVENUE,OPPORTUNITY, OR ANTICIPATED PROFITS OR LOST BUSINESS.
The information contained in this publication does not purport to contain all mattersrelevant to any particular investment or financial instrument and all statements asto future matters are not guaranteed to be accurate. Anyone proposing to rely onor use the information contained in this publication should independently verifyand check the accuracy, completeness, reliability and suitability of the informationand should obtain independent and specific advice from appropriate professionalsor experts. Further, references to any financial instrument or investment productare not intended to imply that an actual trading market exists for such instrumentor product.
This Portfolio has been prepared based on parameters that reflect good faithdeterminations based on the information provided in the Customer Investment Profile(“CIP”) or as per the agreed investment agreement in place with you (“Mandate”).Unless otherwise specifically agreed by the Bank, in preparing this Portfolio the Bankhas only taken into account the information provided in the CIP or Mandate andcannot be held liable for information not disclosed to the Bank in the CIP or Mandate.This Portfolio is based on the Bank’s understanding of the information disclosed inthe CIP or Mandate which may change should your risk profile or other relevantfactors change.
In addition, before entering into any transaction, the risks should be fully understoodand a determination made as to whether a transaction is appropriate given theperson’s investment objectives, financial and operational resources, experiences andother relevant circumstances. The obligations relating to a particular transaction (andcontractual relationship) including, without limitation, the nature and extent of theirexposure to risk should be known as well as any regulatory requirements andrestrictions applicable thereto.
In publishing this document ENBD is not acting in the capacity of a fiduciary orfinancial advisor. Data included in this publication may rely on models that do notreflect or take into account all potentially significant factors such as market risk,liquidity risk, and credit risk. ENBD may use different models, make valuationadjustments, or use different methodologies when determining prices at which ENBDis willing to trade financial instruments and/or when valuing its own inventory positionsfor its books and records.
Investment in financial instruments involves risks and returns may vary. The value ofand income from your investments may vary because of changes in interest rates,foreign exchange rates, prices and other factors and there is the possibility that youmay lose the principle amount invested.. Past performance is not necessarily a guideto future performance. Estimates of future performance are based on assumptionsthat may not be realized. Before making an investment, investors should consult theiradvisers on the legal, regulatory, tax, business, investment, financial and accountingimplications of the investment. This portfolio review report does not includeDerivatives Trading system activities.
Recipient AcknowledgementsIn receiving this publication, you acknowledge, understand and agree that there are
risks associated with investment activities. Moreover, you acknowledge in receivingthis publication that the responsibility to obtain and carefully read and understand thecontent of documents relating to any investment activity described in this publicationand to seek separate, independent financial advice if required to assess whether aparticular investment activity described herein is suitable, lies exclusively with you.
You acknowledge, understand and agree that past investment performance is notindicative of the future performance results of any investment and that theinformation contained herein is not to be used as an indication of the futureperformance of any investment activity. You acknowledge, understand that thispublication has been developed, compiled, prepared, revised, selected, andarranged by ENBD and others (including certain other information sources) throughthe application of methods and standards of judgment developed and appliedthrough the expenditure of substantial time, effort, and money and constitutesvaluable intellectual property of ENBD and such others.
All present and future rights in and to trade secrets, patents, copyrights, trademarks,service marks, know-how, and other proprietary rights of any type under the laws ofany governmental authority, domestic or foreign, shall, as between you and ENBD, atall times be and remain the sole and exclusive property of ENBD and/or other lawfulparties. Except as specifically permitted in writing, you acknowledge and agree thatyou may not copy or make any use of the content of this publication or any portionthereof. Except as specifically permitted in writing, you shall not use the intellectualproperty rights connected with this publication, or the names of any individualparticipant in, or contributor to, the content of this publication, or any variations orderivatives thereof, for any purpose.
YOU AGREE TO USE THIS PUBLICATION SOLELY FOR YOUR OWNNONCOMMERCIAL USE AND BENEFIT, AND NOT FOR RESALE OR OTHERTRANSFER OR DISPOSITION TO, OR USE BY OR FOR THE BENEFIT OF, ANYOTHER PERSON OR ENTITY. YOU AGREE NOT TO USE, TRANSFER,DISTRIBUTE, OR DISPOSE OF ANY INFORMATION CONTAINED IN THISPUBLICATION IN ANY MANNER THAT COULD COMPETE WITH THE BUSINESSINTERESTS OF ENBD. YOU MAY NOT COPY, REPRODUCE, PUBLISH,DISPLAY, MODIFY, OR CREATE DERIVATIVE WORKS FROM ANY DATACONTAINED IN THIS PUBLICATION. YOU MAY NOT OFFER ANY PART OF THISPUBLICATION FOR SALE OR DISTRIBUTE IT OVER ANY MEDIUM INCLUDINGBUT NOT LIMITED TO OVER-THE-AIR TELEVISION OR RADIO BROADCAST, ACOMPUTER NETWORK OR HYPERLINK FRAMING ON THE INTERNETWITHOUT THE PRIOR WRITTEN CONSENT OF ENBD. THE INFORMATIONCONTAINED IN THIS PUBLICATION MAY NOT BE USED TO CONSTRUCT ADATABASE OF ANY KIND. YOU MAY NOT USE THE DATA IN THIS PUBLICATIONIN ANY WAY TO IMPROVE THE QUALITY OF ANY DATA SOLD ORCONTRIBUTED TO BY YOU TO ANY THIRD PARTY. FURTHERMORE, YOU MAYNOT USE ANY OF THE TRADEMARKS, TRADE NAMES, SERVICE MARKS,COPYRIGHTS, OR LOGOS OF ENBD OR ITS SUBSIDIARIES IN ANY MANNERWHICH CREATES THE IMPRESSION THAT SUCH ITEMS BELONG TO OR AREASSOCIATED WITH YOU OR, EXCEPT AS OTHERWISE PROVIDED WITHENBD’S PRIOR WRITTEN CONSENT, AND YOU ACKNOWLEDGE THAT YOUHAVE NO OWNERSHIP RIGHTS IN AND TO ANY OF SUCH ITEMS. MOREOVERYOU AGREE THAT YOUR USE OF THIS PUBLICATION IS AT YOUR SOLE RISKAND ACKNOWLEDGE THAT THIS PUBLICATION AND ANYTHING CONTAINEDHEREIN, IS PROVIDED "AS IS" AND "AS AVAILABLE," AND THAT ENBD MAKESNO WARRANTY OF ANY KIND, EXPRESS OR IMPLIED, AS TO THISPUBLICATION, INCLUDING, BUT NOT LIMITED TO, MERCHANTABILITY, NON-INFRINGEMENT, TITLE, OR FITNESS FOR A PARTICULAR PURPOSE OR USE.
ENBD is licensed and regulated by the UAE Central Bank.
Additional Information for the United KingdomThis publication was prepared by Emirates NBD Bank PJSC in United Arab Emirates.It has been issued and approved for distribution to clients by the London branch ofEmirates NBD Bank PJSC which is authorised by the Prudential Regulation Authorityand regulated by the Financial Conduct Authority and Prudential Authority in the UK.Any services provided by Emirates NBD Bank PJSC outside the UK will not beregulated by the Financial Conduct Authority and Prudential Authority and you will notreceive all the protections afforded to retail customers under this regime. Changes inforeign exchange rates may affect any of the returns or income set out within thispublication. Please contact your UK Relationship Manager for further details or todiscuss the contents of the publication.
Additional Information for SingaporeThis publication was prepared by Emirates NBD Bank PJSC in the United ArabEmirates. It has been issued and approved for distribution to clients of Singaporebranch. Emirates NBD PJSC Singapore Branch holds a wholesale banking licenseissued by The Monetary Authority of Singapore and regulated under the FinancialAdvisers Act ‘FAA’ Chapter 110 and The Securities and Futures Act ‘SFA’ Chapter 289.Any services provided by Emirates NBD Bank PJSC outside Singapore will not beregulated by the FAA and SFA and you will not receive all the protections afforded toretail customers under the SFA & FAA regime (where appropriate). Please contactyour Relationship Manager for further details or for clarification of the contents, whereappropriate.
To find out more on ENBD, please visit www.emiratesnbd.com


WEALTH MANAGEMENT
EMIRATES NBD WEALTH MANAGEMENT
ABU DHABI – DUBAI – LONDON – MUMBAI – RIYADH – SINGAPORE
www.emiratesnbd.com
Related Documents