Chuuk State Census Report 2000 FSM Census of Population and Housing December 2002 Chuuk Branch Statistics Office Division of Statistics Department of Economic Affairs National Government Weno, Chuuk 96942 Federated States Of Micronesia

Welcome message from author
This document is posted to help you gain knowledge. Please leave a comment to let me know what you think about it! Share it to your friends and learn new things together.
Transcript
Chuuk State Census Report
2000 FSM Census of Population and Housing
December 2002
Chuuk Branch Statistics Office Division of Statistics
Department of Economic Affairs National Government Weno, Chuuk 96942
Federated States Of Micronesia

i
2000 FSM Census of Population
and Housing
Chuuk State Census Report
December 2002
Chuuk Branch Statistcs Office Division of Statistics
Department of Economic Affairs National Government Weno, Chuuk 96942
Federated States of Micronesia

iii

v

vii

ix
Preface 2000 FSM Census of Chuuk
x
Chuuk Branch Statistics Office, Division of Statistics, FSM Department of Economic Affairs xi
TABLE OF CONTENTS CONTENTS Page PRESIDENT’S MESSAGE .........................................................................................................................................iii GOVERNOR’S MESSAGE..........................................................................................................................................v ACKNOWLEDGEMENT...........................................................................................................................................vii PREFACE .................................................................................................................................................................... ix TABLE OF CONTENTS .............................................................................................................................................xi LIST OF TEXT TABLES ..........................................................................................................................................xiv LIST OF FIGURES..................................................................................................................................................xviii LIST OF BASIC TABLES.........................................................................................................................................xix SYMBOLS .................................................................................................................................................................xxi MAPS........................................................................................................................................................................xxii EXECUTIVE SUMMARY ......................................................................................................................................xxiv CHAPTER 1. INTRODUCTION.................................................................................................................................1 Geographical characteristics ...........................................................................................................................1
Climate ............................................................................................................................................1 Regional Sub-Division......................................................................................................................2
A Brief History of Census Taking...................................................................................................................2 Spanish Administration.....................................................................................................................2 German Administration ....................................................................................................................4 Japanese Administration ...................................................................................................................5 American Administration................................................................................................................11
The 2000 FSM Census of Chuuk ..................................................................................................................14 Analysis of Data on Geographical Distribution ............................................................................................15
Geographic Distribution Over Time ...............................................................................................15 Population Distribution...................................................................................................................15 Population Density..........................................................................................................................17
Conclusion ....................................................................................................................................................17 CHAPTER 2. AGE AND SEX STRUCTURE ..........................................................................................................19 Introduction...................................................................................................................................................19 Data Description............................................................................................................................................19 Analysis of Age and Sex Data.......................................................................................................................19
Population Change and Intercensal Growth....................................................................................19 Age and Sex Distribution................................................................................................................20 Median Age.....................................................................................................................................22 Sex Ratio.........................................................................................................................................22 Dependency Ratio...........................................................................................................................23 Accuracy of Age and Sex Data .......................................................................................................24
Conclusion ....................................................................................................................................................25 CHAPTER 3. HOUSEHOLDS, FAMILIES, AND MARITAL STATUS ................................................................27 Introduction...................................................................................................................................................27 Definitions.....................................................................................................................................................27 Analysis of Data on Households and Marital Status .....................................................................................29
Households and Families ................................................................................................................29 Marital Status..................................................................................................................................31
Conclusion ....................................................................................................................................................33 CHAPTER 4. FERTILITY.........................................................................................................................................35 Introduction...................................................................................................................................................35 Data Description............................................................................................................................................35 Analysis of Fertility Data ..............................................................................................................................35
Crude Birth Rate .............................................................................................................................35 Age-Specific Fertility......................................................................................................................37
Table of contents 2000 FSM Census of Chuuk State
xii Chuuk Branch Statistics Office, Division of Statistics, FSM Department of Economic Affairs
Fertility of Population Subgroups ...................................................................................................39 Conclusions ...................................................................................................................................................41 CHAPTER 5. MORTALITY......................................................................................................................................43 Introduction ...................................................................................................................................................43 Data Description............................................................................................................................................43 Analysis of Mortality Data ............................................................................................................................43
Crude Death Rate ............................................................................................................................43 Infant and Child Mortality Rates, and Life Expectancy at Birth .....................................................44
Conclusions ...................................................................................................................................................47 CHAPTER 6. MIGRATION ......................................................................................................................................49 Introduction ...................................................................................................................................................49 Data Description............................................................................................................................................49 Analysis of Migration Data ...........................................................................................................................50
Birthplace ........................................................................................................................................50 Citizenship and Legal Residence ....................................................................................................52 Continuous Residence.....................................................................................................................53 Place of Residence Five Years Prior to the Census.........................................................................54
Conclusions ...................................................................................................................................................56 CHAPTER 7. RELIGION, ETHNICITY AND LANGUAGE...................................................................................57 Introduction ...................................................................................................................................................57 Definitions .....................................................................................................................................................57 Analysis of Data on Religion, Ethnicity and Language.................................................................................58
Religion ..........................................................................................................................................58 Ethnicity ..........................................................................................................................................60 Language.........................................................................................................................................60
Conclusions ...................................................................................................................................................62 CHAPTER 8. EDUCATION AND LITERACY........................................................................................................63 Introduction ...................................................................................................................................................63 Data Description............................................................................................................................................63 Analysis of Education Data ...........................................................................................................................64
School Enrollment...........................................................................................................................64 Educational Attainment...................................................................................................................68 Literacy Status.................................................................................................................................71 Vocational Training ........................................................................................................................72
Conclusions ...................................................................................................................................................72 CHAPTER 9. ECONOMIC ACTIVITY ....................................................................................................................75 Introduction ...................................................................................................................................................75 Definitions .....................................................................................................................................................75 Analysis of Economic Activity Data .............................................................................................................76
Labor Force Participation................................................................................................................76 Unemployment................................................................................................................................80 Underemployment...........................................................................................................................81 Labor Force Status by Citizenship ..................................................................................................81 Labor Force Status by English Language Ability ...........................................................................82 Labor Force Status by Educational Attainment...............................................................................83 Work Experience.............................................................................................................................83 Subsistence Activity........................................................................................................................84 Market-Oriented Activities .............................................................................................................87 Other Labor Force Characteristics ..................................................................................................88
Conclusion.....................................................................................................................................................88
2000 FSM Census of Chuuk State Table of contents
Chuuk Branch Statistics Office, Division of Statistics, FSM Department of Economic Affairs xiii
CHAPTER 10. INDUSTRY AND OCCUPATION...................................................................................................89 Introduction...................................................................................................................................................89 Data Description............................................................................................................................................89 Analysis of Industry and Occupation Data....................................................................................................92
Industry ..........................................................................................................................................92 Occupation......................................................................................................................................94 Class of Worker ..............................................................................................................................98
Conclusion .................................................................................................................................................. 100 CHAPTER 11. INCOME ......................................................................................................................................... 101 Introduction................................................................................................................................................. 101 Definitions................................................................................................................................................... 101 Analysis of Income Data ............................................................................................................................. 102 Conclusions................................................................................................................................................. 109 CHAPTER 12. HOUSING CHARACTERISTICS.................................................................................................. 111 Introduction................................................................................................................................................. 111 Data Description.......................................................................................................................................... 111 Analysis of Housing Data ........................................................................................................................... 115
General Housing Characteristics................................................................................................... 115 Structural Characteristics .............................................................................................................. 116 Utilities ........................................................................................................................................ 119 Equipment..................................................................................................................................... 122
Conclusions................................................................................................................................................. 128 BIBLIOGRAPHY ..................................................................................................................................................... 129 APPENDIX A. BASIC TABLES.............................................................................................................................. 133 APPENDIX B. 2000 FSM CENSUS QUESTIONNAIRE........................................................................................ 263
Chuuk Branch Statistics Office, Division of Statistics, FSM Department of Economic Affairs xiv
LIST OF TEXT TABLES TABLE Page Chapter 1. Population Table 1.1. Early Population Estimates for Major Island Units in Chuuk State: Selected Years ....................................4 Table 1.2. Population of Japanese and Chuukese in Chuuk: 1920 to 1946 ...................................................................7 Table 1.3 Population of Chuuk: 1920 to 2000 ...............................................................................................................7 Table 1.4. Population of Chuuk by Region: 1930 to 2000.............................................................................................8 Table 1.5. Proportional Distribution by Municipality, Chuuk State: Selected Census Years ........................................8 Table 1.6. Population of Chuuk by Age and Region: 1930. ..........................................................................................9 Table 1.7. Population of Chuuk by Region of Registration and Region of Residence (horizontal): 1930 ..................10 Table 1.8. Population of Chuuk by Region of Registration and Region of Residence (vertical): 1930.......................10 Table 1.9. Population of Chuuk by Age Group and Region: 1935 ..............................................................................10 Table 1.10. Age by Region, Chuuk: 1967 ...................................................................................................................12 Table 1.11. Population of Chuuk by Age and Region: 1973 .......................................................................................12 Table 1.12. TTPI-born by Home Area and Region of Residence: 1973 ......................................................................13 Table 1.13. Population of Chuuk by Age and Region: 1980 .......................................................................................13 Table 1.14. Residence in 1975 by Current Region of Residence, Chuuk: 1980 ..........................................................13 Table 1.15. Population Distribution by Municipality, Chuuk State: 1994 and 2000 ..................................................16 Table 1.16. Population Density, Chuuk State: 2000 ....................................................................................................17 Chapter 2. Age Sex Structure Table 2.1: Population Change and Annual Growth Rate by Age Group, Chuuk State: 1973 to 2000........................20 Table 2.2: Percent Distribution of Population by Five-Year Age Group and Sex, Chuuk State: 1973 to 2000..........20 Table 2.3: Population by Age Group and Sex, Chuuk State: 1994 and 2000 .............................................................22 Table 2.4: Median Age by Municipality and Sex, Chuuk State: 1973 to 2000...........................................................22 Table 2.5: Males per Females by Municipality, Chuuk State: 1973 to 2000 ..............................................................23 Table 2.6: Males per Females by Age Group and Municipality, Chuuk State: 1994 and 2000..................................23 Table 2.7. Dependency Ratio by Municipality, Chuuk State: 1973 to 2000...............................................................24 Table 2.8: Selected Demographic Indicators from FSM and Neighboring Pacific Countries: 2000 ..........................24 Table 2.9: Myers and Bachi Method of Measuring Digit Preference, Chuuk State: 1973 to 2000.............................24 Chapter 3 Households, Families, and Marital Status Table 3.1: Type of Living Quarters in Chuuk State: 1973 to 2000.............................................................................29 Table 3.2: Household Composition, Chuuk State: 1973 to 2000................................................................................29 Table 3.3: Household Composition by Municipality of Usual Residence, Chuuk State: 1994 & 2000 .....................30 Table 3.4: Person per Household by Municipality of Usual Residence, Chuuk State: 1994 and 2000.......................30 Table 3.5: Household Size for Chuuk Lagoon and Outer Islands, Chuuk State: 1989,1994 and 2000.......................31 Table 3.6: Marital Status for Aged 15 Years and Over by Sex, Chuuk State: 1973 to 2000 .......................................31 Table 3.7: Marital Status for Age 15 Years and Over by Municipality, Chuuk State: 1994 and 2000........................32 Table 3.8: Singulate Mean Age at Marriage for Aged 15 Years and Over by Municipality and Sex, Chuuk State:
1989 to 2000..............................................................................................................................................................32 Chapter 4. Fertility Table 4.1: Crude Birth Rate, Chuuk State: 1994 and 2000.........................................................................................36 Table 4.2: Estimation of Crude Birth Rate, Chuuk State: 1985 to 2000.....................................................................36 Table 4.3: Registered Births by Calendar Year and Implied Crude Birth Rate, Chuuk State: 1992 to 1999..............37 Table 4.4: Adjustment of Births in Year Prior to the Census, Chuuk State: 1994 and 2000 ......................................37 Table 4.5: Calculation of Total Fertility Rate with P/F Ratio, Chuuk State: 1994 & 2000 ........................................38 Table 4.6: Age-specific Fertility Rate, Chuuk State: 1973 to 2000 ............................................................................39 Table 4.7: Children Ever Born per Woman and TFR by Mother's Educational Attainment, Chuuk State: 1994 and
2000...........................................................................................................................................................................40 Table 4.8: Children Ever Born per Woman and TFR by Labor Force Participation, Chuuk State: 1994 and 2000 ...40 Table 4.9: Age-specific Fertility Rates by Region, Chuuk State: 1994 and 2000.......................................................40 Table 4.10: Children Ever Born per Woman by Region, Chuuk State: 1994 and 2000..............................................41
2000 FSM Census of Chuuk State List of Text-tables
Chuuk Branch Statistics Office, Division of Statistics, FSM Department of Economic Affairs xv
Chapter 5. Mortality Table 5.1: Average Age-specific Mortality Rates, Chuuk State: 1992 to 1995 and 1996 to 1999 .............................44 Table 5.2: Number of Children Ever Born (CEB) and Children Surviving (CS) and Proportion Surviving (PS) by
Age Group of Mother, Chuuk State: 1973 to 2000 ...................................................................................................44 Table 5.3: Indirect Estimates of Early Age Mortality CEB/CS, Chuuk State: 1973 to 2000 .....................................45 Table 5.4: Summary Indicators from Indirect Estimation of Early Age Mortality, Chuuk State: 1969 to 1996 ........45 Table 5.5: Estimated Mortality Data from Other Neighboring Pacific Island Nations: Various Years......................46 Table 5.6: Life Table as Implied by Coale and Demeny Life Table for the West Pattern of Females and Males,
Chuuk: 1997-1998.....................................................................................................................................................47 Chapter 6. Migration Table 6.1: Birthplace of Chuuk Residents by Sex: 1989 to 2000...............................................................................50 Table 6.2: Birthplace of Chuuk Residents: 1994 and 2000 ........................................................................................51 Table 6.3: State of Birth of Chuuk and other FSM States: 1994 and 2000................................................................51 Table 6.4. Internal Lifetime Migration, Chuuk State: 1994 and 2000........................................................................52 Table 6.5: Usual Residence by Citizenship, Chuuk State: 1994 and 2000.................................................................52 Table 6.6: Municipality and State of Legal Residence by Municipality of Usual Residence, Chuuk State: 1994 and
2000 ..........................................................................................................................................................................53 Table 6.7: Distribution of Non-movers and Previous Residence, Chuuk State: 1994 and 2000 ................................53 Table 6.8: Movers by Place of Previous Residence, Chuuk State: 1994 and 2000 ....................................................54 Table 6.9: Residence 5 Years Ago by Usual Residence for Persons Aged 5 Years and Over, Chuuk State: 1994 and
2000 ..........................................................................................................................................................................54 Table 6.10. Annual Internal Migration Rate by Region, Chuuk State: 1994 and 2000 ..............................................54 Table 6.11: Residence Five Years Ago by Usual Residence for Persons 5 Years and Over, Chuuk State: 1994 and
2000 ..........................................................................................................................................................................55 Table 6.12: Educational Attainment of Interstate Migrants by Sex, Chuuk State 1994 and 2000..............................55 Table 6.13: Labor Force Participation of Interstate Migrants by Sex, Chuuk State 1994 and 2000...........................55 Chapter 7. Religion, Ethnicity, and Language Table 7.1: Religion by Sex, Chuuk State: 1973 to 2000.............................................................................................58 Table 7.2: Religion by Municipality, Chuuk State: 1994 and 2000 ...........................................................................59 Table 7.3: Religion by Age Group, Chuuk State: 1994 and 2000 ..............................................................................59 Table 7.4: Ethnic Origin of Chuuk Residents by Region: 1994 and 2000...................................................................60 Table 7.5: Ethnicity by Place of Birth, Chuuk State: 1994 and 2000 .........................................................................60 Table 7.6: Languages Spoken at Home by Ethnicity, Chuuk State: 1994 and 2000 ................................................. 61 Table 7.7: Languages Spoken at Home by Place of Birth, Chuuk State: 1994 and 2000...........................................61 Table 7.8: Frequency of English Use by Municipality, Chuuk State: 1994 and 2000................................................61 Table 7.9: English Speakers at Home by Age Group, Chuuk State: 1994 and 2000.................................................. 62 Chapter 8. Education Table 8.1: School Attendance for Age 3 Years and Over by Level and Type, Chuuk State: 1973 to 2000 ................64 Table 8.2: School Attendance for Age 3 Years and Over by Level and Type, Chuuk State: 1994 and 2000..............65 Table 8.3: Age-specific Enrollment Ratio per 100 by Age and Sex, Chuuk State: 1994 and 2000............................65 Table 8.4: Age-specific Enrollment Ratio by Age, Chuuk State: 1994 and 2000 ......................................................67 Table 8.5: Gross Enrollment Ratio by Sex, Chuuk State: 1994 and 2000..................................................................68 Table 8.6: Educational Attainment for Age 25 Years and Over by Sex, Chuuk State: 1980, 1994 and 2000.............68 Table 8.7: Educational Attainment for Age 25 Years and Over by Sex, Chuuk State: 1994 and 2000.......................69 Table 8.8: Educational Attainment for Aged 25 Years and Over by Region, Chuuk State: 1994 and 2000 ...............69 Table 8.9: Educational Attainment for Age 25 Years and Over by Age Group and Sex, Chuuk State: 1994 and 200070 Table 8.10: Educational Attainment for Age 25 Years and Over by Place of Birth, Chuuk State: 1994 and 2000....71 Table 8.11: Literate Population for Aged 10 Years and Over by Age Group and Sex, Chuuk State: 1980, 1994 and
2000 ..........................................................................................................................................................................71 Table 8.12: Literate Population for Aged 10 Years and Over by Age Group and Region: Chuuk State: 1994 and
2000 ..........................................................................................................................................................................72 Table 8.13: Vocational Training by Age Group, Chuuk State: 1980, 1994 and 2000................................................72
List of Text Table 2000 FSM Census of Chuuk State
xvi Chuuk Branch Statistics Office, Division of Statistics, FSM Department of Economic Affairs
Chapter 9. Economic Activity Table 9.1: Distribution of Working-Age Population for Aged 15 Years and Over by Region, Chuuk State: 1994 and
2000...........................................................................................................................................................................77 Table 9.2: Distribution of Working Age Population for Aged 15 Years and Over by Sex, Chuuk State: 1994 and
2000...........................................................................................................................................................................77 Table 9.3: Labor Force Distribution by Sex and Region, Chuuk State: 1994 and 2000 .............................................78 Table 9.4: Labor Force Participation Rates by Age Group and Sex, Chuuk State: 1994 and 2000............................78 Table 9.5: Labor Force Participation Rates by Age Group and Region, Chuuk State: 1994 and 2000 ......................79 Table 9.6: Unemployment Rates (Percent of Labor Force Unemployed) by Age Groug and Sex, Chuuk State: 1994
and 2000 ....................................................................................................................................................................80 Table 9.7: Unemployment Rates (Percent of Labor Force Unemployed) by Age Group and Region, Chuuk State:
1994 and 2000 ............................................................................................................................................................... Table 9.8: Unemployed Persons by Age Group and Previous Work Experience, Chuuk State: 1994 and 2000........81 Table 9.9. Underemployment by Region, Chuuk: 1994 and 2000...............................................................................81 Table 9.10: Labor Force Status for Age 15 Years and Over by Citizenship, Chuuk State: 1994 and 2000................82 Table 9.11: Labor Force Status for Age 15 Years & Over by Language Ability, Chuuk State: 1994 and 2000 .........83 Table 9.12: Educational Attainment Labor Force Status, Chuuk State: 1994 & 2000 ................................................83 Table 9.13: Year of Last Work for Aged 15 Years and Over Not in the Formal Labor Force, Chuuk State: 2000....84 Table 9.14: Percent of Population in Subsistence Work by Region, Chuuk State: 1994 and 2000 ............................84 Table 9.15: Percent of Population in Subsistence Work by Age Group, Sex & Region, Chuuk State: 1994 & 2000 .85 Table 9.16: Subsistence Activities for Aged 15 Years and Over by Educational Attainment, Chuuk State: 1994 and
2000...........................................................................................................................................................................87 Table 9.17: Subsistence Activities by Search for Cash Employment, Chuuk State: 1994 and 2000..........................87 Table 9.18: Percent of Population in Market-Oriented Activity by Region, Chuuk State: 1994 and 2000 ................87 Table 9.19: Location of Work Last Week by Region, Chuuk State: 1994 and 2000..................................................88 Chapter 10. Industry and Occupation Table 10.1: Industry of Employment for Aged 15 Years and Over, Chuuk State: 1994 and 2000.............................92 Table 10.2: Detailed Breakdown of Industry by Sex, Chuuk State: 1994 and 2000...................................................93 Table 10.3: Industry by Percent of Persons with High School Diploma and Vocational Training, Chuuk State: 1994
and 2000 ....................................................................................................................................................................94 Table 10.4: Industry by Occupation, Chuuk State: 1994 and 2000 .............................................................................94 Table 10.5: Occupations of Current formal Work Force, Chuuk State: , 1994 and 2000...........................................95 Table 10.6: Occupations of Current Work Force for Aged 15 Years and Over Who Worked in 5 Years Previous to
Census by Sex, Chuuk State: 1994 and 2000 ............................................................................................................95 Table 10.7: Occupation by Age Groups for Aged 15 years and Over, Chuuk State: 1994 and 2000 .........................96 Table 10.8: Occupation for Aged 15 Years and Over by Age Group, Chuuk State: 1994 and 2000..........................96 Table 10.9: Occupation for Aged 15 Years and Over by Place of Birth, Chuuk State: 1994 and 2000 .....................97 Table 10.10: Occupation for Aged 15 Years and Over by Region, Chuuk State: 1994 and 2000 ..............................97 Table 10.11: Educational Attainment of the Current Formal Work Force for Aged 25 Years and Over by
Occupation, Chuuk State: 1994 and 2000 .................................................................................................................98 Table 10.12: Type of Work for Aged 15 Years and Over by Region and Sex, Chuuk State: 1994 and 2000 ............99 Table 10.13: Type of Work for Aged 15 Years and Over by Age Group, Chuuk State: 1994 and 2000....................99 Table 10.14: Educational Attainment by Class of Worker, Chuuk State: 1994 and 2000 ........................................100 Chapter 11. Income Table 11.1: Household, Family and Individual Income in U.S. Dollars ($) in 1993 and 1999 by Region, Chuuk
State: 1994 and 2000 ...............................................................................................................................................102 Table 11.2: Median Household Income Change for Chuuk and Other FSM States: 1994 and 2000........................103 Table 11.3: Percent Distribution of Individual Income in 1994 and 2000 by Region, Chuuk State: 1994 and 2000103 Table 11.4: Individual Income in 1993 and 1999 by Age Group and Sex, Chuuk State: 1994 and 2000.................104 Table 11.5: Individual Income by Sex, Chuuk State: 1994 and 2000.......................................................................104 Table 11.6: Median Income in U.S. Dollars ($) by Type of Family and Region, Chuuk State: 1994 and 2000.......105 Table 11.7: Individual Income in 1993 and 1999 by Educational Attainment, Chuuk State: 1994 and 2000 ..........106 Table 11.8: Individual Median Income in 1993 and 1999 by Economic Status the Week Before the Census, Chuuk
State: 1994 and 2000 ...............................................................................................................................................106
2000 FSM Census of Chuuk State List of Text-tables
Chuuk Branch Statistics Office, Division of Statistics, FSM Department of Economic Affairs xvii
Table 11.9: Median Individual Income in U.S. Dollars ($) in 1993 and 1999 by Occupation, Chuuk State: 1994 and 2000 ........................................................................................................................................................................ 107
Table 11.10: Individual Income in 1993 and 1999 by Class of Work, Chuuk State: 1994 and 2000....................... 107 Table 11.11: Median Income in U.S. Dollars ($) by Source and Region, Chuuk State: 1994 and 2000 .................. 108 Table 11.12: Proportion of Persons Earning Income in each Region, by Source, Chuuk State: 1994 and 2000...... 109 Table 11.13: Income Source in 1993 and 1999 by Sex, Chuuk State: 1994 and 2000 ............................................. 109 Chapter 12. Housing Table 12.1: Total Housing Units, Occupied Housing Units, and Others, Chuuk State: 1980, 1994 and 2000.......... 115 Table 12.2: Total Housing Units by Region, Chuuk State: 1994 and 2000............................................................... 115 Table 12.3. Year House Built by Region, Chuuk State: 2000 ................................................................................... 116 Table 12.4: Occupied Housing Units by Number of Units per Structure, Chuuk State: 1994 and 2000................... 116 Table 12.5: Occupied Housing Units by Number of Units per Structure and Region, Chuuk State: 1994 and 2000116 Table 12.6. Rooms per Occupied Housing Units, Chuuk State: 1980, 1994 and 2000 ............................................ 117 Table 12.7. Number of Rooms per Occupied Housing Unit by Region, Chuuk State: 1994 and 2000.................... 117 Table 12.8. Number of Bedrooms per Housing Unit of All Units, Chuuk State: 1980, 1994 and 2000................... 117 Table 12.9. Number of Bedrooms of All Housing Units by Region, Chuuk State: 1994 and 2000 ......................... 118 Table 12.10. Material Used for Roof of All Housing Units, Chuuk State: 1980, 1994 and 2000 ............................ 118 Table 12.11. Materials Used for Roof of All Housing Units by Region, Chuuk State: 1994 and 2000 ................... 118 Table 12.12. Materials Used for Walls, Chuuk State: 1980, 1994 and 2000............................................................ 119 Table 12.13. Materials Used for Outside Walls by Region, Chuuk State: 1994 and 2000....................................... 119 Table 12.14. Materials Used for Foundation of All Housing Units by Region, Chuuk State: 1994 and 2000 ......... 119 Table 12.15. Electricity Source of All Housing Units, Chuuk State: 1980, 1994 and 2000..................................... 120 Table 12.16. Electricity and Air Condition of All Housing Units by Region, Chuuk State: 1994 and 2000 ........... 120 Table 12.17. Piped Water of All Housing Units, Chuuk State: 1980, 1994 and 2000.............................................. 120 Table 12.18. Water Supply of All Housing Units by Region, Chuuk State: 1994 and 2000.................................... 121 Table 12.19. Source of Drinking Water of All Housing Units, Chuuk State: 1980, 1994 and 2000 ........................ 121 Table 12.20. Source of Drinking Water of All Housing Units by Region, Chuuk State: 1994 and 2000................. 121 Table 12.21. Sewage disposal of All Housing Units, Chuuk State: 1980, 1994 and 2000 ....................................... 122 Table 12.22. Sewage Disposal of All Housing Units by Region, Chuuk State: 1994 and 2000............................... 122 Table 12.23. Plumbing Facilities of All Housing Units, Chuuk State: 1980, 1994 and 2000 .................................. 122 Table 12.24. Plumbing Facilities of Occupied Housing Units by Region, Chuuk State: 1994 and 2000................. 123 Table 12.25. Toilet Facilities of All Housing Units, Chuuk State: 1980, 1994 and 2000 ........................................ 123 Table 12.26. Toilet Facilities of All Housing Units by Region, Chuuk State: 1994 and 2000................................. 123 Table 12.27. Bathtub or Shower Facilities of All Housing Units, Chuuk State: 1980, 1994 and 2000.................... 124 Table 12.28. Bathtub or Shower Facilities of All Housing Units by Region, Chuuk State: 1994 and 2000 ............ 124 Table 12.29. Cooking Facilities Inside of Occupied Housing Units by Region, Chuuk State: 1994 and 2000........ 124 Table 12.30. Cooking Facilities Outside of Occupied Housing Units by Region, Chuuk State: 1994 and 2000 ..... 125 Table 12.31. Vehicles and Boats Owned by Region, Chuuk State: 1994 and 2000 ................................................. 125 Table 12.32. Monthly Cost of Electricity by Region, Chuuk State: 1994 and 2000 ................................................ 126 Table 12.33. Monthly Cost of Kerosene by Region, Chuuk State: 1994 and 2000 .................................................. 126 Table 12.34. Monthly Cost of Water by Region, Chuuk State: 1994 and 2000 ....................................................... 127 Table 12.35. Monthly Cost of Other Fuel by Region, Chuuk State: 1994 and 2000................................................ 127 Table 12.36. Value of House by Region, Chuuk State: 1994 and 2000 ................................................................... 128
xviii Chuuk Branch Statistics Office, Division of Statistics, FSM Department of Economic Affairs
LIST OF FIGURES
FIGURE Page
Figure 1.1. Population Distribution by Region, Chuuk: 1930 to 2000 ..............................................................15 Figure 1.2. Population Distribution by Region, Chuuk: 2000 ...........................................................................17 Figure 2.1. Population Structure of Chuuk, Chuuk: 1973 to 2000 ....................................................................21 Figure 4.1. Age-Specific Fertility Rates, Chuuk: 1973 to 2000 ........................................................................39 Figure 6.1. Interstate Lifetime Net-migration Flows of Chuuk and other FSM States, Chuuk: 2000 ...............51 Figure 8.1. Age-Specific Enrollment Rates by Age, Chuuk: 1994 & 2000.......................................................66 Figure 8.2. Age-Specific Enrollment Rates by Age and Sex, Chuuk: 2000 ......................................................66 Figure 8.3. Age-Specific Enrollment Rates by Region, Chuuk: 2000...............................................................67 Figure 8.4 Literate Population by Age and Sex, Chuuk: 2000 .........................................................................71 Figure 9.1. Labor Force Participation Rates, Chuuk: 1994 and 2000................................................................78 Figure 9.2. Labor Force Participation Rate by Age and Sex, Chuuk: 2000.......................................................79 Figure 9.3 Labor Force Participation Rate by Age and Region, Chuuk: 2000 .................................................79 Figure 9.4 Subsistence Activities by Sex, Chuuk: 2000...................................................................................86 Figure 11.1. Individual Income by Region, Chuuk: 2000 .................................................................................103
Chuuk Branch Statistics Office, Division of Statistics, FSM Department of Economic Affairs xix
LIST OF BASIC TABLES TABLE Page Table B01a. Age by Municipality of Usual Residence, Chuuk: 2000....................................................................... 133 Table B01b. Age by Municipality of Usual Residence, Chuuk: 2000 - continued.................................................. 134 Table B01a. Age by Municipality of Usual Residence, Chuuk: 2000....................................................................... 135 Table B01b. Age by Municipality of Usual Residence, Chuuk: 2000 - continued.................................................. 136 Table B01c. Age by Municipality of Usual Residence, Chuuk: 2000 - continued................................................... 137 Table B01d. Age by Municipality of Usual Residence, Chuuk: 2000 - continued................................................... 138 Table B02a. Household and Family Characteristics by Municipality of Usual Residence, Chuuk: 2000................. 139 Table B02b. Household and Family Characteristics by Usual Residence, Chuuk: 2000 - cont'd.............................. 140 Table B02c. Household and Family Characteristics by Municipality of Usual Residence, Chuuk: 2000 - cont'd .... 141 Table B02d. Household and Family Characteristics by Municipality of Usual Residence, Chuuk: 2000 - cont'd.... 142 Table B03a. Household Size and Fertility by Municipality of Usual Residence, Chuuk: 2000 ................................ 143 Table B03b. Household Size and Fertility by Municipality of Usual Residence, Chuuk: 2000-cont'd ..................... 144 Table B03a. Fertility by Age of Mother & Sex of Child by Municipality of Usual Residence, Chuuk: 2000 .......... 145 Table B03b. Fertility by Age of Mother and Sex of Child by Usual Residence, Chuuk: 2000................................. 146 Table B03c. Household Size and Fertility by Municipality of Usual Residence, Chuuk: 2000 - cont'd ................... 147 Table B03d. Household Size and Fertility by Municipality of Usual Residence, Chuuk: 2000 - cont'd ................... 148 Table B03c1. Fertility by Age of Mother & Sex of Child by Municipality of Usual Residence, Chuuk: 2000 ........ 149 Table B03d1. Fertility by Age of Mother and Sex of Child by Municipality Usual Residence, Chuuk: 2000 ......... 150 Table B04A. Single Years of Age by Municipality of Usual Residence, Chuuk: 2000 ............................................ 151 Table B04b. Single Years of Age by Municipality of Usual Residence, Chuuk: 2000 - continued .......................... 152 Table P04a.1. Single Years of Age by Municipality of Usual Residence, Chuuk: 2000........................................... 153 Table B04b.1. Single Years of Age by Municipality of Usual Residence, Chuuk: 2000 - continued ....................... 154 Table B04c. Single Years of Age by Municipality of Usual Residence, Chuuk: 2000 - continued .......................... 155 Table B04d. Single Years of Age by Municipality of Usual Residence, Chuuk: 2000 - continued .......................... 156 Table B04b.1. Single Years of Age by Municipality of Usual Residence, Chuuk: 2000 - continued ....................... 157 Table B04d.1. Single Years of Age by Municipality of Usual Residence, Chuuk: 2000 - continued ....................... 158 Table B05a. Place of Birth by Municipality of Usual Residence, Chuuk: 2000 ....................................................... 159 Table B05b. Place of Birth by Municipality of Usual Residence, Chuuk: 2000 - continued .................................... 160 Table B05a. Place of Birth by Municipality of Usual Residence, Chuuk: 2000 ....................................................... 161 Table B05b. Place of Birth by Municipality of Usual Residence, Chuuk: 2000 - continued .................................... 162 Table B05c. Place of Birth by Municipality of Usual Residence, Chuuk: 2000 - continued..................................... 163 Table B05d. Place of Birth by Municipality of Usual Residence, Chuuk: 2000 - continued .................................... 164 Table B05c. Place of Birth by Municipality of Usual Residence, Chuuk: 2000 - continued..................................... 165 Table B05d. Place of Birth by Municipality of Usual Residence, Chuuk: 2000 - continued .................................... 166 Table B06a. Legal Residence by Municipality of Usual Residence, Chuuk: 2000 ................................................... 167 Table B06b. Legal Residence by Municipality of Usual Residence, Chuuk: 2000-cont'd ........................................ 168 Table B06a. Legal Residence by Municipality of Usual Residence, Chuuk: 2000 ................................................... 169 Table B06b. Legal Residence by Municipality of Usual Residence, Chuuk: 2000-cont'd ........................................ 170 Table B06c. Legal Residence by Municipality of Usual Residence, Chuuk: 2000 - cont'd ...................................... 171 Table B06d. Legal Residence by Municipality of Usual Residence, Chuuk: 2000 - continued ................................ 172 Table B06c. Legal Residence by Municipality of Usual Residence, Chuuk: 2000 - cont'd ...................................... 173 Table B06d. Legal Residence by Municipality of Usual Residence, Chuuk: 2000 - continued ................................ 174 Table B07a. Length of Continuous Residence and Place of Previous Residence by Municipality of Usual Residence, Chuuk: 2000.......................................................................................................................................... 175 Table B07b. Length of Continuous Residence and Place of Previous Residence by Municipality........................... 176 Table B07a. Length of Continuous Residence and Place of Previous Residence by Municipality ........................... 177 Table B07b. Length of Continuous Residence and Place of Previous Residence by Municipality........................... 178 Table B07c. Length of Continuous Residence and Place of Previous Residence by Municipality ........................... 179 Table B07d. Length of Continuous Residence and Place of Previous Residence by Municipality........................... 180 Table B07c. Length of Continuous Residence and Place of Previous Residence by Municipality ........................... 181 Table B07d. Length of Continuous Residence and Place of Previous Residence by Municipality........................... 182 Table B08a. Residence 5 Years Ago by Municipality of Usual Residence, Chuuk: 2000 ........................................ 183
List of Basic-Tables 2000 FSM Census of Chuuk State
xx Chuuk Branch Statistics Office, Division of Statistics, FSM Department of Economic Affairs
Table B08b. Residence 5 Years Ago by Municipality of Usual Residence, Chuuk: 2000 - continued .....................184 Table B08a. Residence 5 Years Ago by Municipality of Usual Residence, Chuuk: 2000 ........................................185 Table B08b. Residence 5 Years Ago by Municipality of Usual Residence, Chuuk: 2000 - continued .....................186 Table B08c. Residence 5 Years Ago by Municipality of Usual Residence, Chuuk: 2000 - continued......................187 Table B08d. Residence 5 Years Ago by Municipality of Usual Residence, Chuuk: 2000 - continued .....................188 Table B08c. Residence 5 Years Ago by Municipality of Usual Residence, Chuuk: 2000 - continued......................189 Table B08d. Residence 5 Years Ago by Municipality of Usual Residence, Chuuk: 2000 - continued .....................190 Table B09a. Ethnicity by Municipality of Usual Residence, Chuuk: 2000 ...............................................................191 Table B09b. Ethnicity by Municipality of Usual Residence, Chuuk: 2000 - continued ...........................................192 Table B09c. Ethnicity by Municipality of Usual Residence, Chuuk: 2000 - continued ............................................193 Table B09d. Ethnicity by Municipality of Usual Residence, Chuuk: 2000 - continued ............................................194 Table B10a. Marital Status and Religion by Municipality of Usual Residence, Chuuk: 2000 ..................................195 Table B10b. Marital Status and Religion by Municipalit of Usual Residence, Chuuk: 2000 - cont'd .......................196 Table B10c. Marital Status and Religion by Municipality of Usual Residence, Chuuk: 2000 - continued ...............197 Table B10d. Marital Status and Religion by Municipalit of Usual Residence, Chuuk: 2000 - continued................198 Table B11a. Languages and Dialects Spoken at Home by Municipality of Usual Residence, Chuuk: 2000 ............199 Table B11b. Languages and Dialects Spoken at Home by Municipality of Usual Residence, Chuuk: 2000 - cont'd200 Table B11c. Languages and Dialects Spoken at Home by Municipality of Usual Residence, Chuuk: 2000 - cont'd201 B11d. Languages and Dialects Spoken at Home by Municipality of Usual Residence, Chuuk: 2000 - continued ...202 Table B12a. School Enrollment and Educational Attainment by Municipality of Usual Residence, Chuuk: 2000 ..203 Table B12b. School Enrollment & Educational Attainment by Usual Residence, Chuuk: 2000...............................204 Table B12c. School Enrollment & Educational Attainment by Municipality of Usual Residence, Chuuk: 2000 .....205 Table B12d. School Enrollment and Educational Attainment by Municipality of Usual Residence, Chuuk: 2000 ..206 Table B13a. Literacy, Vocational Training, and Veteran Status by Usual Residence, Chuuk: 2000 ........................207 Table B13b. Literacy, Vocational Training, and Veteran Status by Usual Residence, Chuuk: 2000 ........................208 Table B13c. Literacy, Vocational Training, and Veteran Status by Muni. of Usual Residence, Chuuk: 2000..........209 Table B13d. Literacy, Vocational Training, and Veteran Status by Muni. of Usual Residence, Chuuk: 2000 .........210 Table B14a: Labor Force Characteristics by Municipality of Usual Residence, Chuuk: 2000..................................211 Table B14b. Labor Force Characteristics by Municipality of Usual Residence, Chuuk: 2000 - cont'd.....................212 Table B14c: Labor Force Characteristics by Municipality of Usual Residence, Chuuk: 2000 - continued...............213 Table B14d. Labor Force Characteristics by Municipality of Usual Residence, Chuuk: 2000 - continued...............214 Table B15a. Labor Force Characteristics from U.S. Definition and Duration of Work in 1999 by Municipality of Usual Residence, Chuuk: 2000................................................................................................................................215 Table B15a. Labor Force Activity Charact. from U.S. Definition and Duration of Work in 1999............................216 Table B15c. Labor Force Characteristics from U.S. Definition and Duration of Work in 1999 ...............................217 Table B15d. Labor Force Characteristics from U.S. Definition and Duration of Work in 1999 ...............................218 Table B15AA. Activity and Place of Work in Week Before Census and Workers in Families in 1999 ...................219 Table B15AB. Activity and Place of Work in Week Before Census and Workers in Families in 1999....................220 Table B15Bc. Activity and Place of Work in Week Before Census and Workers in Families in 1999.....................221 Table B15BD. Activity and Place of Work in Week Before Census and Workers in Families in 1999....................222 Table B16a. Occupation by Municipality of Usual Residence, Chuuk: 2000 ...........................................................223 Table B16b. Occupation by Usual Residence, Chuuk: 2000 - continued ..................................................................224 Table B16c. Occupation by Municipality of Usual Residence, Chuuk: 2000 - continued........................................225 Table B16d. Occupation by Usual Residence, Chuuk: 2000 - continued ..................................................................226 Table B17a. Industry by Municipality of Usual Residence, Chuuk: 2000.................................................................227 Table B17b. Industry by Municipality of Usual Residence, Chuuk: 2000 - continued .............................................228 Table B17c. Industry by Municipality Usual Residence, Chuuk: 2000 - continued..................................................229 Table B17d. Industry by Municipality of Usual Residence, Chuuk: 2000 - continued .............................................230 Table B18a. Class of Worker and Commuting Charact. by Municipality of Usual Residence, Chuuk: 2000...........231 Table B18b. Class of Worker and Commuting Charact. by Municipality of Usual Residence, Chuuk: 2000...........232 Table B18c. Class of Worker and Commuting Charact. by Municipality of Usual Residence, Chuuk: 2000 - cont'd233 Table B18d. Class of Worker and Commuting Charact. by Municipality of Usual Residence, Chuuk: 2000 - cont'd234 Table B19a. Income in 1999 by Municipality of Usual Residence, Chuuk: 2000.....................................................235 Table B19b. Income in 1999 by Municipality of Usual Residence, Chuuk: 2000 - continued..................................236 Table B19c. Income in 1999 by Municipality of Usual Residence, Chuuk: 2000 - continued..................................237 Table B19d. Income in 1999 by Municipality of Usual Residence, Chuuk: 2000 - continued..................................238
2000 FSM Census of Chuuk State List of Basic-Tables
Chuuk Branch Statistics Office, Division of Statistics, FSM Department of Economic Affairs xxi
Table H01. Structural Characteristics, Chuuk State: 2000 ........................................................................................ 239 Table H01. Structural Characteristics, Chuuk State: 2000 - continued .................................................................... 240 Table H01. Structural Characteristics, Chuuk State: 2000 - continued ................................................................... 241 Table H01. Structural Characteristics, Chuuk State: 2000 - continued .................................................................... 242 Table H02. Utilitzation Characteristics, Chuuk State: 2000...................................................................................... 243 Table H02. Utilitzation Characterisitcs, Chuuk State: 2000 - continued.................................................................. 244 Table H02. Utilitzation Characteristics, Chuuk State: 2000 - continued................................................................... 245 Table H02. Utilitzation Characterisitcs, Chuuk State: 2000 - continued.................................................................. 246 Table H03. Plumbing and Water Source Characteristics, Chuuk State: 2000 ........................................................... 247 Table H03. Plumbing and Water Source Characteristics, Chuuk State: 2000 - continued ....................................... 248 Table H03. Plumbing and Water Source Characteristics, Chuuk State: 2000 - continued ........................................ 249 Table H03. Plumbing and Water Source Characteristics, Chuuk State: 2000 - continued ....................................... 250 Table H04. Cooking Facilities and Appliances, Chuuk State: 2000.......................................................................... 251 Table H04. Cooking Facilities and Appliances, Chuuk State: 2000 - continued...................................................... 252 Table H04. Cooking Facilities and Appliances, Chuuk State: 2000 - continued...................................................... 253 Table H04. Cooking Facilities and Appliances, Chuuk State: 2000 - continued...................................................... 254 Table H05. Vehicles and Monthly Costs, Chuuk State: 2000 ................................................................................... 255 Table H05. Vehicles and Monthly Costs, Chuuk State: 2000 - continued ............................................................... 256 Table H05. Vehicles and Monthly Costs, Chuuk State: 2000 - continued ............................................................... 257 Table H05. Vehicles and Monthly Costs, Chuuk State: 2000 - continued ............................................................... 258 Table H06. Tenure and Financial Characteristics, Chuuk State: 2000 ...................................................................... 259 Table H06. Tenure and Financial Characteristics, Chuuk State: 2000 - continued .................................................. 260 Table H06. Tenure and Financial Characteristics, Chuuk State: 2000 ...................................................................... 261 Table H06. Tenure and Financial Characteristics, Chuuk State: 2000 - continued .................................................. 262
SYMBOLS • A dash "–" represents zero or a percent which rounds to less than 0.1 • Three dots "..." means not applicable, or information suppressed for reasons of confidentiality • "NA" means not available
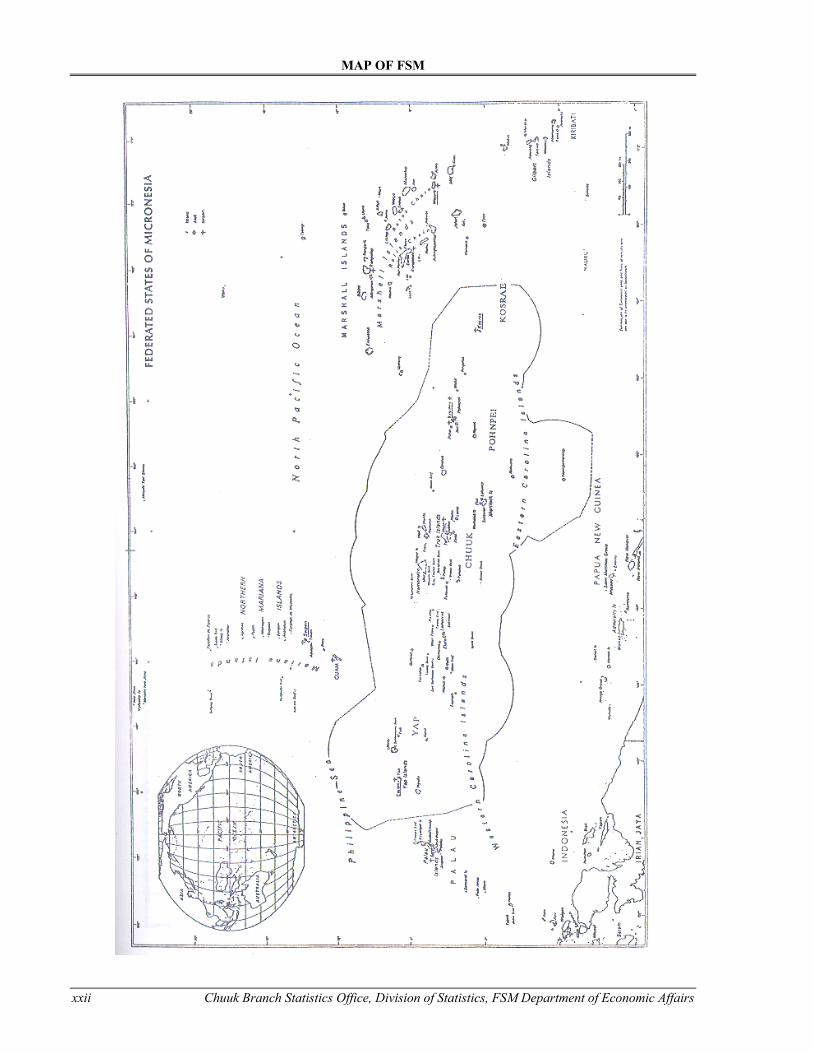
MAP OF FSM
xxii Chuuk Branch Statistics Office, Division of Statistics, FSM Department of Economic Affairs
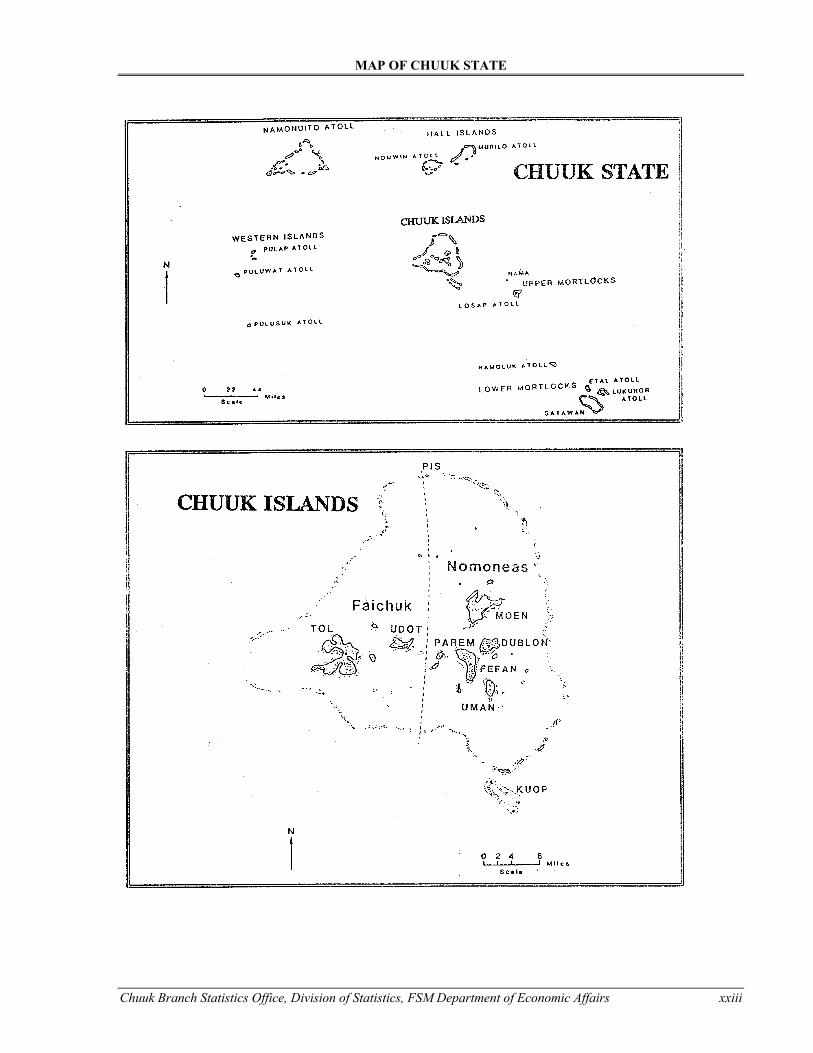
MAP OF CHUUK STATE
Chuuk Branch Statistics Office, Division of Statistics, FSM Department of Economic Affairs xxiii
xxiv Chuuk Branch Statistics Office, Division of Statistics, FSM Department of Economic Affairs
EXECUTIVE SUMMARY This report presents the 2000 FSM Census of Population and Housing data for Chuuk, along with historical data from recent censuses. This report is organized into 12 chapters, which briefly summarize information on the population's demographic, social, economic and housing conditions. Apart from the obvious use of the report in planning, policy formulation, and in administration processes, the data presented in the report can also serve as a benchmark information in monitoring and evaluation activities. The following paragraphs present a few of the major facts about the resident population of Chuuk State. These are only a few of the main outcomes and should not be viewed as the only information available. Demographic Characteristics Population size and projections. The population of Chuuk State increased from 31,596 in 1973 to 53,319 in 1994 and to 53,595 persons in the year 2000. The population by region in 2000 was 14,722 in Northern Namoneas, 11,694 in Southern Namoneas, 14,049 in Faichuk, 6,911 in the Mortlocks and 6,219 in Oksoritod. Between 1994 and 2000, the population grew by about .1 percent per year, which is much lower than the 2.2 percent per year for the period 1989 to 1994 and the 2.0 percent per year for the period 1973 to 2000. Population density. Population density describes the number of people living in a specific geographic area (i.e., country, state, island, etc.) divided by the landmass of the geographic area. The population density in the State of Chuuk in 2000 was about 1,094 persons per square mile. Regional differences existed in 2000, with the highest density in the Northern Namoneas region (1,900 persons per square mile) and the lowest in Oksoritod region (590 persons per square mile). The high density in the Northern Namoneas region was expected as Weno is Chuuk’s major urban and administrative center. Median Age. The median age - the age at which half of the population is younger and half older - in the State of Chuuk in 2000 was 18.5 years, an increase of 2 years from the 16.5 years in 1973. The present median age suggests that Chuuk had one of the youngest populations in the FSM. Sex Ratio. Most populations have slightly more male than female births. As the population ages, the difference decreases because of higher male mortality. The sex ratio (number of males per 100 females) for Chuuk State in 2000 was about 103 (about 101 in Northern Namoneas, 106 in Southern Namoneas, 104 in Faichuk, 102 in Mortlocks, and 100 in Oksoritod. The sex ratio in the State of Chuuk decreased by about 2 percentage points between 1994 and 2000. Households. The total number of households declined from 7,043 in 1994 to 6,976 in 2000. However, the average number of persons per household increased slightly between the two census years, from 7.5 persons to 7.7 persons. Moreover, there was a marked regional difference in the average family size in the household. In 2000, the Mortlocks recorded a low of 7.19 persons per household, and the Halls in Oksoritod reached 9.1 persons per household. Marital status. Adults in Chuuk State increasingly delay marriage. The average age at first marriage in Chuuk increased from about 25 years in 1989 to about 27 years in 2000. The proportion of married population decreased from about 60.2 percent in 1973 to about 49.7 percent in 2000. In 2000, proportions married by region were 48.8 percent in Northern Namoneas, 49.6 in Southern Namomeas, 50.2 in Faichuk, 51.1 in Mortlocks, and 50.1 Oksoritod. Fertility. Almost all fertility indicators revealed a decline in fertility levels in Chuuk. For one thing, the crude birth rate (CBR) dropped from 32 in 1994 births per 1,000 persons to 27.5 births per 1,000 persons in 2000. The total fertility rate (TFR) declined from 5.6 children per woman to 4.5 over the same period. Mortality. Mortality rates have generally declined in the past three decades; however, accurate mortality records are not always available. For instance, mortality records would indicate that the crude death rate in Chuuk has generally been about 4 deaths per 1,000 persons. However, it is more likely to be 7 deaths per 1,000 persons. Infant mortality rates have declined in the past 30 years. In the early 1970s, infant mortality rates ranged between 71 and 75 infant deaths per 1,000 births. In 2000, the infant mortality rate was just about 43 infant deaths per 1,000 births. Also, from the early 1970s to the year 2000, life expectancy rose from 59 to 66.
2000 FSM Census of Chuuk State Executive Summary
Chuuk Branch Statistics Office, Division of Statistics, FSM Department of Economic Affairs xxv
Birthplace. Over 98 percent of the Chuuk residents in 1994 and 2000 were born in Chuuk. The proportion of Chuuk residents born outside of Chuuk decreased between 1994 and 2000, especially among the Asian-born persons. The proportion of Asian-born persons declined by 50 percent (from about 489 persons in1994 to about 51 in 2000). This decline was largely due to the dissolution of the foreign fishing venture (which mostly employed these persons) in the intercensal period. Residence 5 years before the census. Cross-classification of data on residence 5 years before the census with current residence showed the level and pattern of short-term migration. This kind of analysis further provided an estimation of inter-state migration per year. Among the 2000 Chuuk residents aged 5 years and over, about 1 percent lived outside of Chuuk Stated during 1995 (about 1.4 percent for the Lagoon and less than .5 percent for the Outer Islands). The result provided an estimated net interstate out-migration of 1.3 per 1,000 per year for the period 1994 and 2000, Additionally, it provided estimations of internal net migration rate the Lagoon (1.2 per 1,000) and the Outer Islands (-3.6 per 1,000) for the same period. Social Characteristics Religion. The Catholic and Protestant were the major religions in the State of Chuuk. The 1994 and 2000 censuses indicated that 53 percent of the residents of Chuuk were Catholics, 43 percent were Protestants and 4 percent were of other religion. Majority of the municipalities on both the Lagoon and Outer Islands were Catholics. Ethnicity and Language Spoken at Home. About 94 percent of Chuuk residents were of Chuukese ethnicity. Language corresponds to ethnicity. Over 99 percent reported Chuukese as their commonly used language at home. About 91 percent of Chuuk residents reported English as their second most commonly used language. School Enrollment. In 2000, about 56 percent of persons age 3 to 24 were enrolled in school. Among these enrolled persons, about 5 percent were attending pre-school, 64 percent were in elementary school, 27 percent in high school, and 4 percent in college. Educational Attainment. In 2000 about 17.8 percent of among all persons 25 years old and over did not complete any level of schooling, compared to 34.6 percent in 1980. Also, the proportion attaining high school increased from 16.4 to 34.1, and the proportion attained college increased from 5.8 percent to 13.7 percent. Economic Characteristics Labor Force Participation. Labor force participation was compiled based on the current economic activity (that is, economic activities during a seven day reference period). The overall labor force participation rate of persons 15 years and over during the week before the 2000 Census in Chuuk was about 58 percent, compared with 38 percent in 1994. The male participation rate was (67 percent) while the female was (48 percent). The unemployment rate in 2000, based on UN classification, was over 34 percent. By region, unemployment was highest in Faichuk at about 40 percent, followed by Oksoritod with 38 percent and Northern Namoneas with 37 percent. Southern Namoneas and Mortlocks had slightly lower unemployment rates of 23 percent and 33 percent, respectively. Subsistence. Out of about 11,979 employed persons in 2000, about 7,433 persons were engaged in agricultural, fishery or related activities. About 2,299 persons were engaged in market oriented agricultural, fishery, or related activities while the remaining 5,134 persons were in pure subsistence (did subsistence for household consumption only and did not sell). Industry and Occupation. The formal work force in Chuuk in 2000 was about 4,546 (a 15 percent decrease since 1994). The number of workers in most of the industries decline, except for four industries: Gas, electricity & water supply, Transportation & communication, Wholesale & retail trade, and Public Administration. About 36 percent of the formal work force were manages and professional workers. Technicians and associate professionals (about 13 percent) and service workers (about 17 percent) were also reported as major occupations. Administrative support also had a high percentage (12 percent). Skilled agricultural and fishery workers constituted about 1 percent of all formal workers.
Executive Summary 2000 FSM Census of Chuuk State
xxvi Chuuk Branch Statistics Office, Division of Statistics, FSM Department of Economic Affairs
Class of Worker. The percentage share of private and public workers in Chuuk changed between 1994 and 2000. The private sector’s share of the work force increased from 37.6 in 1994 to 43.4 in 2000. Public sector’s share on the other hand decreased from 62.4 in 1994 to56.9 in 2000. Income. Out of the 6,976 households in Chuuk in 2000, about 6,385 households reported income for 1999. Their median income for these households was about $2,800. The mean household income was higher at about $9,600. The median household income by region was about $4,700 for Northern Namoneas, $2,900 for southern Namoneas, $1,800 for Faichuk, and $2,000 for Mortlocks and Oksoritod. The overall median individual income was about $800. Housing. The total number of housing units increased from about 5,400 in 1980 to over 7,500 in 1994 then decline slightly to 7,400 in 2000. In all census years observed, about 92 to 94 percent of the households were occupied. The number of housing units with 8 or more rooms increased from about 0.4 percent in 1980 to about 0.9 percent 1994 and 2000. Housing conditions in Chuuk improved over the years. About 30 percent of all housing units were built between 1993 and 2000. In 2000, about one-third (27 percent) of the housing units had electricity or solar power compared to 22 percent in 1980. About 25 percent of all the housing units had piped water in 2000 compared to 3 percent in 1980. Similarly, of all housing units in 2000, over 34 percent had flush toilet and about 36 percent had bathtubs or shower. Lastly, a set of basic tables is presented at the end of the report. A set of detail tables is also available in a separate publication. The detailed tables set provides a breakdown of data by municipality. These serve as a basic source of data on Chuuk's population and housing characteristics.
Chuuk Branch Statistics Office, Division of Statistics, FSM Department of Economic Affairs 1
CHAPTER 1 INTRODUCTION
The creation of the independent and sovereign nation of the Federated States of Micronesia (FSM) under the Compact of Free Association with the United States caused a growing need for social and economic development planning. Consequently both the government and private sectors needed social, economic, and demographic data. Furthermore, as in many developing countries, administrators and planners in Chuuk State, in their quest for social and economic development often contended with incomplete or unavailable information. The 2000 FSM Census of Chuuk State was thus conducted as part of the overall effort to provide current and updated information required for planning and administrative purposes. This report presents basic analysis of the 2000 FSM Census results of Chuuk, which also covers the 1994 Census results for comparison purposes. This chapter locates Chuuk geographically and presents a brief history and population distribution of Chuuk State in selected census years, along with some background on the methodology of the 2000 FSM Census. Chapter 2 presents population change and structure. Chapter 3 presents households and marital status. Chapters 4 to 6 discuss population dynamics (fertility, mortality, and migration). Chapters 7 to 11 provide the basic analysis for social and economic characteristics. Chapter 12 presents housing characteristics. A separate publication presenting detailed tabulations for Chuuk from the 2000 FSM Census has also been compiled and disseminated by the Division of Statistics, of the FSM Department of Economic Affairs. Supplemental information and data from previous selected censuses (1973, 1980, 1989 and 1994) are used to present change over time. Geographical characteristics Chuuk, situated at 151022' to 150004' east longitude, 707' to 7041' north latitude, is approximately 650 miles east of Guam, 1,200 miles west of the Marshall Islands and 380 miles west of Pohnpei. The main atoll, at the center of the State, is surrounded by a quarter mile long, triangular reef varying from 30 to 49 miles in diameter, which protrudes above the water in about 50 places to form low islets. The lagoon, having a circumference of 140 miles and an area of 823 square miles, contains six fairly large, high, habitable volcanic islands and many lesser ones, of which about one hundred have names (Goodenough 1951:19). The high islands and many low coral sand islets in the lagoon have a total land area of 38.6 square miles. Chuuk consists of approximately 100 islands, 43 of which are inhabited with a total land area of 49.2 square miles scattered over an ocean area 300 miles wide and 600 miles long. Climate Chuuk State is characterized by a wet, warm and humid climate, which is similar to most Pacific Islands in the North Pacific. Weather variations are most evident in wind and rainfall characteristics. Temperature and relative humidity levels remain consistent throughout the year. Tropical disturbances, even though highly unpredictable, are generally quite seasonal in nature. Prevailing northeasterly and southerly winds are moderate (7 to 11 miles per hour) throughout the year. Northeasterly trade winds occur during the months of November through April with higher wind speed being prevalent from January through March. Lower velocity winds from the south, southeast and southwest are predominant during the months of June through October. The average rainfall in Chuuk is approximately 150 inches per year. Monthly rainfall ranges from 6 to almost 16 inches. The least amount of monthly rainfall (6 to 9 inches) occurs during the months of January to March as stronger northeasterly trade winds approach Chuuk. Ambient air temperatures typically range from a daily low of 750 Fahrenheit (240 Centigrade) to an average high of 870 Fahrenheit (310 Centigrade). Daily levels of relative humidity range from 78 percent, during daylight hours, to approximately 85 to 87 percent during the night and early morning hours. Tropical storms generally occur between the months of July and November; many are associated with the influence of the inter-tropical convergence zone which typically moves northward through Chuuk during this time of the year. The occurrence of typhoons in immediate vicinity of Chuuk is uncommon. However, in 1987,Typhoon Nina passed close to Chuuk Lagoon causing heavy damage to homes, and buildings and agricultural crops. Again in November of 1990,
Chapter 1. Introduction 2000 FSM Census of Chuuk State
2 Chuuk Branch Statistics Office, Division of Statistics, FSM Department of Economic Affairs
Typhoon Owen passed through the Northern Outer Islands (The Halls and Nomunuito) devastating many of the small atoll islands. Regional Sub-Division Chuuk State is divided into five (5) political regions. Chuuk Lagoon has 3 of the regions: (1) Northern Namoneas (7.75 square miles), consisting of Weno (formerly known as Moen), Piis-Paneu (formerly Piis-Moen), and Fono;(2) Southern Namoneas (11.72 square miles), consisting of Tonoas (formerly Dublon), Fefen ,Etten, Siis, Uman, Parem and Totiw; and (3) Faichuk (19.25 square miles), consisting of Eot, Udot, Romonum, Fanapanges, Wonei, Paata, Tol and Polle. Chuuk Outer islands makes up the two remaining regions:(4) The Mortlocks (4.91 square miles) consisting of Nama, Losap, Piis-Emwar, Namoluk, Ettal, Lekinioch, Oneop, Kuttu, Moch, Satowan and Ta; and (5) Oksoritod (10.6 square miles) is formally divided into three areas which are: (1) The Halls (Nomwin, Fananu, Ruo, and Murilo), (2) Namonuito (Makur, Onou, Unanu, Onoun and Piherarh), and (3) Pattiw (Houk, Polowat, Pollap, and Tamatam). Just outside Chuuk Lagoon is small Kuop Atoll, belonging to the people of Uman. The island area of these lagoon islands is 38.6 square miles and makes up almost 80 percent of the state's land area. All of Chuuk's Outer Islands are composed of coral and most are atolls. The Outer Islands have a total land area of just 10.6 square miles with approximately 1,200 square miles of lagoon area. A Brief History of Census Taking Before the coming of the Europeans, Chuuk and the islands around Chuuk were much more heavily populated1. The population of Chuuk was estimated at 35,000 in 1827 (Lutke, 1835). In 1874, a Rev. E.T. Doane traveled on the 'Star' from Pohnpei to the Mortlocks, and wrote back to the Geographical Magazine, published in London. The ship went first to Satowan, where Doane counted "about 1500" people, with about 600 on one islet. He recorded "some 600 or more" on Ettal. The population on Namoluk was "from 300 to 500". When the ship went on to Losap, Doane found: All the surroundings of the people, their language, dress, proas, ornaments, tattooing, dwellings, the children in
undress, and the women with the native tapa, showed they were in kith and kin with the islanders already visited. The population may reach 500. The island seemed fertile, and capable of furnishing plenty of food (Doane 1874:204-5).
Doane found no more than 150 to 200 persons on Nama, from reports of Natives on the ship. About 1,500 were on Lekinioch. The ship went on to Nukuoro after this. Spanish Administration The early Spanish voyages into Micronesia served to introduce islanders to the marvels of Western technology -- ships as large as meetinghouses and strange-looking men with impermeable skin (armor). Of all these wonders the most precious was iron, the durable material that could be worked into tools and weapons. Islanders were quick to appreciate the advantages of iron as a replacement for their fragile implements of bone, shell, and stone. When the Spanish colonized the Mariana’s at the end of the 17th century, the Chuukese, employing the outer island navigators as their middlemen, carried on trade with Guam for iron. If Europeans would not come to Chuuk, the islanders would sail hundreds of miles to search them out and barter for the metal that was more precious in their eyes than gold (Gorenflo & Levin, 1992). By the end of the 18th century, Europeans were again plying the Pacific, this time to reap a share of the profits in the lucrative China trade. As they did, they rediscovered the Pacific -- sighting and visiting islands that had never before been seen by white men, correcting erroneous positions recorded 200 years earlier and redrawing the maps of the region. In 1795, James Mortlock, captain of the British trading vessel Young William, gave his name -- and for a time that of his ship -- to the group of atolls southeast of Chuuk. Nearly 30 years later, John Hall, while in command of another British vessel, sighted the islands that still bear his name. There were dozens of other sightings and brief visits: Monteverde at Nama in 1806; Lutrell at Namoluk, Nama, and Losap in 1808. In the wake of the early pioneers of the China trade came the naval explorers from France and Russia. When Freycinet, the commander of the earliest of them, stood off Houk for a few hours in 1819, he was greeted by a throng of islanders who chanted "loulou" (the Chamorro loanword for iron). The next of the French naval commanders, Louis Duperrey, 1Part of this section from Hall and Pelzer, 1946.
2000 FSM Census of Chuuk State Chapter 1. Introduction
Chuuk Branch Statistics Office, Division of Statistics, FSM Department of Economic Affairs 3
who visited the area in 1824 and mapped half of the Chuuk lagoon, reported the same experience at Pollap. "The word loulou is always on their lips," he wrote. "Axes, knives, nails and large fishhooks are all objects of great value for them." When the Russian naval party under Feodor Lutke spent a week in the Mortlocks in 1828, he found the people to be surprisingly demanding traders. They scoffed at the iron bars and hoop they were offered and insisted on tinderboxes and knives instead. The iron based traffic with Guam and the passing contact with European and American ships had given the outer islanders cosmopolitanism that sometimes astonished ship captains. Tobacco had already made its way into many of these islands and cock fighting was a popular pastime on Murilo by the early 1920s. One old man from the Namonuitos astonished a captain by carrying on a conversation in Spanish while devouring pate-de-foie-gras with unfeigned relish. Throughout this period of contact, the high islands of Chuuk remained something of a backwater. Like the inhabitants of other volcanic islands in Micronesia, the people there had lost their navigational skills through disuse over the years. They were also less visited than the atolls and were less accustomed to dealing with foreign merchants and seamen. Moreover, the high islands were plagued by the incessant war between districts that was carried on amid ever shifting alliances. Dumont d'Urville, the last of the great French naval commanders to visit Micronesia, brought his two ships into the Chuuk lagoon in 1839 and anchored off Fefen. The Frenchmen found the islanders thoroughly unfamiliar with muskets, European food (cheese and wine and biscuits), and even clothes. The French visit ended tragically when a dozen Chuukese were killed in a battle that broke out between the visitors and the people of a nearby island. The next visitor to Chuuk, Andrew Cheyne in 1844, was also attacked. As Cheyne's schooner lay at anchor off Siis, several hundred men rushed the European seamen and killed several before they were routed. Cheyne publicized the attack in a maritime journal and issued a warning that "no vessel should visit the island group unless well-manned and armed, as the natives will be certain to attack any vessel that they may find in a defenseless state" (Gorenflo & Levin, 1992). Ship captains seemed to have heeded Cheyne's warning and given Chuuk a wide berth for the next 30 years. One who didn't -- Captain Alfred Tetens of the Vesta -- almost lost his ship in a surprise raid in 1868. For years, Chuuk -- or "dreaded Hogoleu", as it was sometimes called -- bore a notorious reputation among Western mariners. Islanders initiated not all the violence, however. The infamous Carl and two or three other blackbirding vessels visited the Mortlocks in the early 1870s and shanghaied dozens of men for work in the plantations of the South Pacific. Years later a handful of these recruits returned, decked out in Western clothing and eager to tell of their adventures -- but within four months all were dead, possibly victims of diseases they had contracted during their long stay abroad. When three Pohnpeian missionary couples were taken to the Mortlocks in 1874 to introduce Christianity to the islands for the first time, they were greeted with a sullen silence. Memories of the black birding visits were still painfully fresh in the minds of the Mortlockese. Yet, the missionary couples were reluctantly allowed to remain, and within three years had won over 800 converts to Protestantism. The Mortlocks, which had long been the gateway to Chuuk, sent one of the Pohnpeian teachers to Uman in 1879. The spread of Christianity throughout the lagoon islands followed quickly, aided by the work of Robert Logan and other American missionaries. Under the impact of these missionaries, the warfare that was always breaking out between different sections of Chuuk slowly began to subside, although it was another 20 years before it ended altogether. Merchants soon followed the missionaries into Chuuk, as they did in so many other parts of the Pacific. August Hartman opened a trading station on Fefen, Charles Irons went to Polowat, and Frederick Narruhn established a business on Weno, with Pierre Nedelic and Jack Ehlers coming after them. These pioneer traders found a market for Western goods, including calico and serge, but their work was not without its risks. Hartmann and two of the early traders in the Western islands were killed, and a couple of others were forced to flee for their lives. Even so, commerce and Christianity were by this time firmly rooted in Chuuk. Spanish annexation of the Carolines in 1885, which ushered in the era of colonial rule, passed virtually unnoticed in Chuuk. The Spanish government, which had its capital on Pohnpei, was kept so occupied by the uprisings and intrigues on that island that it had neither the time nor the inclination to extend effective rule to any of the other islands in the eastern Caroline. A Spanish warship stopped off at Chuuk in July 1886 to raise the flag over the island group. The next visit was nine years later when the gunboat Quiros came to put an end to the hostilities between Uman and part of Fefen. The chiefs were assembled on board the ship, a peace treaty was signed, and the Spanish steamed off, confident that they had accomplished their purpose. They were badly mistaken. Within a year fighting between Uman and Fefen resumed, Romanum slaughtered a deputation of chiefs from Udot, and a Japanese trader was strangled to
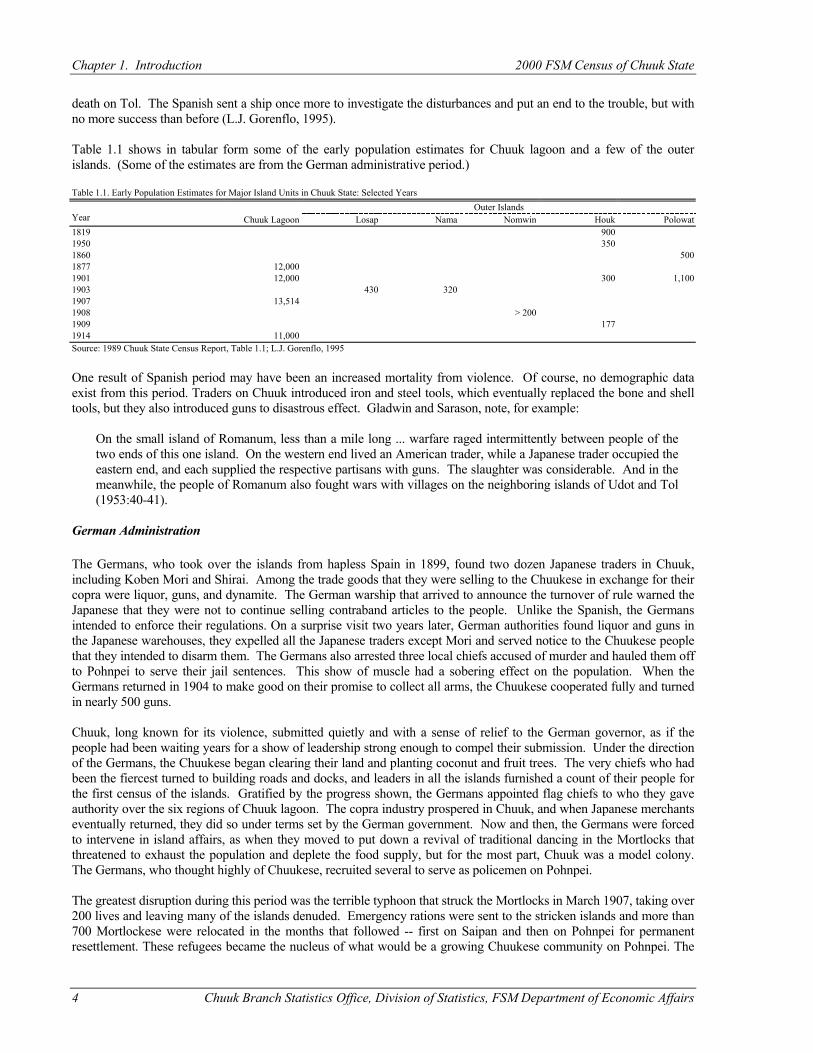
Chapter 1. Introduction 2000 FSM Census of Chuuk State
4 Chuuk Branch Statistics Office, Division of Statistics, FSM Department of Economic Affairs
death on Tol. The Spanish sent a ship once more to investigate the disturbances and put an end to the trouble, but with no more success than before (L.J. Gorenflo, 1995). Table 1.1 shows in tabular form some of the early population estimates for Chuuk lagoon and a few of the outer islands. (Some of the estimates are from the German administrative period.) Table 1.1. Early Population Estimates for Major Island Units in Chuuk State: Selected Years
Outer Islands Year Chuuk Lagoon Losap Nama Nomwin Houk Polowat 1819 900 1950 350 1860 500 1877 12,000 1901 12,000 300 1,100 1903 430 320 1907 13,514 1908 > 200 1909 177 1914 11,000 Source: 1989 Chuuk State Census Report, Table 1.1; L.J. Gorenflo, 1995 One result of Spanish period may have been an increased mortality from violence. Of course, no demographic data exist from this period. Traders on Chuuk introduced iron and steel tools, which eventually replaced the bone and shell tools, but they also introduced guns to disastrous effect. Gladwin and Sarason, note, for example: On the small island of Romanum, less than a mile long ... warfare raged intermittently between people of the
two ends of this one island. On the western end lived an American trader, while a Japanese trader occupied the eastern end, and each supplied the respective partisans with guns. The slaughter was considerable. And in the meanwhile, the people of Romanum also fought wars with villages on the neighboring islands of Udot and Tol (1953:40-41).
German Administration The Germans, who took over the islands from hapless Spain in 1899, found two dozen Japanese traders in Chuuk, including Koben Mori and Shirai. Among the trade goods that they were selling to the Chuukese in exchange for their copra were liquor, guns, and dynamite. The German warship that arrived to announce the turnover of rule warned the Japanese that they were not to continue selling contraband articles to the people. Unlike the Spanish, the Germans intended to enforce their regulations. On a surprise visit two years later, German authorities found liquor and guns in the Japanese warehouses, they expelled all the Japanese traders except Mori and served notice to the Chuukese people that they intended to disarm them. The Germans also arrested three local chiefs accused of murder and hauled them off to Pohnpei to serve their jail sentences. This show of muscle had a sobering effect on the population. When the Germans returned in 1904 to make good on their promise to collect all arms, the Chuukese cooperated fully and turned in nearly 500 guns. Chuuk, long known for its violence, submitted quietly and with a sense of relief to the German governor, as if the people had been waiting years for a show of leadership strong enough to compel their submission. Under the direction of the Germans, the Chuukese began clearing their land and planting coconut and fruit trees. The very chiefs who had been the fiercest turned to building roads and docks, and leaders in all the islands furnished a count of their people for the first census of the islands. Gratified by the progress shown, the Germans appointed flag chiefs to who they gave authority over the six regions of Chuuk lagoon. The copra industry prospered in Chuuk, and when Japanese merchants eventually returned, they did so under terms set by the German government. Now and then, the Germans were forced to intervene in island affairs, as when they moved to put down a revival of traditional dancing in the Mortlocks that threatened to exhaust the population and deplete the food supply, but for the most part, Chuuk was a model colony. The Germans, who thought highly of Chuukese, recruited several to serve as policemen on Pohnpei. The greatest disruption during this period was the terrible typhoon that struck the Mortlocks in March 1907, taking over 200 lives and leaving many of the islands denuded. Emergency rations were sent to the stricken islands and more than 700 Mortlockese were relocated in the months that followed -- first on Saipan and then on Pohnpei for permanent resettlement. These refugees became the nucleus of what would be a growing Chuukese community on Pohnpei. The
2000 FSM Census of Chuuk State Chapter 1. Introduction
Chuuk Branch Statistics Office, Division of Statistics, FSM Department of Economic Affairs 5
extensive typhoon damage was a major setback for the expanding copra industry and it was years before production reached its pre-typhoon level. Yet, new employment opportunities were opening for Chuukese during these same years. Phosphate mining began on Nauru in 1902 and on Angaur, Palau, a few years later. By 1908 over half of the 500 islanders working on Nauru were Chuukese, and 200 more were employed in the mine on Angaur on contracts that lasted between six months and a year. These years saw the arrival of German missionaries representing other religious denominations. Lienbenzell missionaries took over the work of the American Congregationalists in 1907, and Catholic priests and brothers of the Capuchin Order launched their work in Lukunoch (today’s spelling is Lekinioch) in 1911, moving on to Chuuk lagoon a year later. The Germans acquired these islands in 1899 when Spain sold the northern Mariana’s and the Caroline Islands to the German government following Spain's defeat in the Spanish-American war. When, in 1909, the German government finally appointed a resident administrator for Chuuk and set up a branch office on Tonoas, the people provided free labor for the construction of the new facilities. They had only a few people on the administrative staff, and their main aim was economic exploitation. They encouraged the Chuukese to produce copra, fish, and lumber for sale. They also ordered each family to plant at least 100 coconut palms. Coconut trees became the dominant species for approximately two thirds of the slope of the mountains. It became expensive to sacrifice a coconut for drinking when it could be used for making copra (Coulter 1957:297). Even the head tax that the Germans inaugurated in 1910 caused no ill feeling among the Chuukese, who continued to look to the government to do what they could not easily do for themselves: arbitrate local disputes and keep the peace. In its final years, German administration offered some additional benefits to the population. A government physician, assigned to Chuuk, made the rounds of the islands to offer medical services while he studied health problems in the area. The government also made plans to build a 40-bed hospital and a vocational training school in Chuuk, but before these could be implemented Germany was stripped of its possessions. The Germans also effectively stopped Chuukese "warfare" and set a standard for relationships for future administrations:
On arrival the Germans ordered the Chuukese to forfeit their guns and stop making war. In response, the Chuukese, at that time numbering about 10,000, listened to the Germans, turned in their 436 guns and stopped making war. This response might have been a result of the Chuukese realization that their traditional system could no longer handle this situation of warfare with German weapons...From this incident the Chuukese attained the attitude that the foreign administration holds the ultimate authority for law and order. (Mirrer 1971:18-19).
The Germans took no systematic censuses in Chuuk (or any other area of Micronesia) during their comparatively short reign. However, during the various South Seas Expeditions in the early 1900s, censuses of individual islands were collected, with the results compiled and displayed in the various volumes of their reports. Japanese Administration Japan seized Germany's possessions in Micronesia in 1914 at the outbreak of World War I and established its military headquarters on Tonoas. From there the Japanese Navy ruled Chuuk and the rest of Micronesia for the next seven years. The new ruling power quickly made its impact felt in Chuuk. With characteristic energy, Japanese began work on a public works program that included the installation of harbor facilities, the construction of docks and the laying of roads on the islands. They also built the first hospital in Chuuk, staffed by naval doctors and Japanese health aides. Perhaps their most significant early achievement, however, was the establishment of a public school system that came to include six elementary schools throughout Chuuk. Japan's administrative policy was, from the very start, far more aggressively assimilationist than its predecessors. Japan never concealed the fact that it intended to "place a permanent Japanese imprint" on Chuuk. Japanese, like the Germans before them, appointed flag chiefs over the islands. Japanese administrators presided over meetings of the flag chiefs, removing those who were regarded as unsuitable in their eyes and replacing them with others who were more receptive to Japanese policies. Prominent leaders were offered cultural tours of Japan to introduce them to
Chapter 1. Introduction 2000 FSM Census of Chuuk State
6 Chuuk Branch Statistics Office, Division of Statistics, FSM Department of Economic Affairs
Japanese values. This policy continued even after naval rule was replaced by civilian administration in July 1921 and the headquarters transferred from Chuuk to Palau. Through the 1920s the administration continued its emphasis on education, particularly on the study of the Japanese language. Better students who completed the first three years of school were sent to a higher school on Tonoas for an additional two years. A few of the Chuukese graduates were employed as policemen or teachers' aides; others went to work for the government as errand boys or clerks. A number of others found employment with Nambo, the great Japanese trading company of the day that had stores on several islands and ran coconut plantations in various sites. Still others signed on to work in the phosphate mines on Angaur. Youth organizations, or Seinandan, flourished on nearly all the islands. The 1930s saw the first large-scale immigration of Japanese colonists into Chuuk. Okinawan settlers came in ever-greater numbers and, aided by government subsidies, bought fishing vessels and produced Katsuobushi for local use and export. Later immigrants obtained land grants from the government to set up vegetable and sweet potato gardens, and some expanded into the production of starch. Much of the land that had originally been claimed by the government was made available to Japanese businesses for development purposes. By 1937 nearly 4000 Japanese and Okinawans lived in Chuuk out of a total population numbering 18,000. In these golden years of development, subsidies were ended. The Japanese government had turned Micronesia into a colony that paid its own way. Chuukese participation in this prosperity was real but marginal. The fishing industry, like most of the major industries, was run entirely by Japanese nationals, but hundreds of Chuukese men went to Pohnpei to do plantation labor on a contract basis. Local people bought steamship tickets to other parts of Micronesia and bicycles for their children. Never before had there been so much money in circulation among the Chuukese. The war brought a reversal of fortune to Japanese and Chuukese alike. For two years before Pearl Harbor the Japanese were busy constructing airfields and port facilities, but it was only in January 1944, on the eve of the threatened Allied invasion, that the Japanese Army defense forces arrived and serious work began on the caves and tunnels and gun emplacements that are still tourist attractions today. The invasion never came, but enemy bombers following the United States carrier raid on the island group in February 1944 regularly pounded Chuuk. For the last year and a half of the war, some 35,000 Japanese fighting men and laborers shared the islands' scant food resources with the local population. Every available foot of land was planted in sweet potatoes, and Chuukese often had to sneak food out of their own gardens to feed themselves and their families. All this ended on August 15, 1945, when the Japanese Emperor announced his country's unconditional surrender to the Allies. Table 1.2 shows the population of Chuukese and Japanese during the Japanese period. At the beginning of the period, of course, few Japanese were in the Islands. As the Japanese Administration increased its influence in the islands, the number and percentage of Japanese increased considerably until the end of World War II (when the Japanese were repatriated.) Japan intended to annex the islands. Many Okinawans and Koreans left Japan for the larger Pacific Islands, and many brought their families. Although the total effect on Japan's population was minor, the intent was to use the islands to relieve population pressure in Japan itself. By December, 1941, when Japan bombed Pearl Harbor, immigrants in Micronesia outnumbered locals on some islands from 3 or 4 to 1 and other islands by as much as 10 or more to 1 (Bowden et al., 1966:27). Also, they began to "Japanize the islanders through education, propaganda, intermarriage, and in general the promotion of cultural changes" (Mirrer 1971:23). As a subsequent change, intermarriage and affairs brought increased numbers of inter-racial babies. Japanese constituted less than 6 percent of the population in 1920, and only 3 percent in 1925. Japanese continued to be a fairly small percentage of the population in the 1930 and 1935 censuses, although they were 16 percent of the population by 1935 -- about 1 in every 6 persons. Unfortunately we do not have information from the 1940 census, because it is obvious that an enormous build up occurred in the pre-war period. By 1911, the native population of what was to become Chuuk state had decreased to 11,000 and by 1920 to 9,822. The establishment of a health service stopped the downward trend, and the population increased very slightly from 9,822 in 1920 to 10,344 in 1935 (See Table 1.2). Table 1.2 also shows the number of Japanese in Chuuk during the Japanese period. The Japanese took censuses in 1920, 1925, 1930, 1935, and 1940. Complete, lengthy reports were prepared for
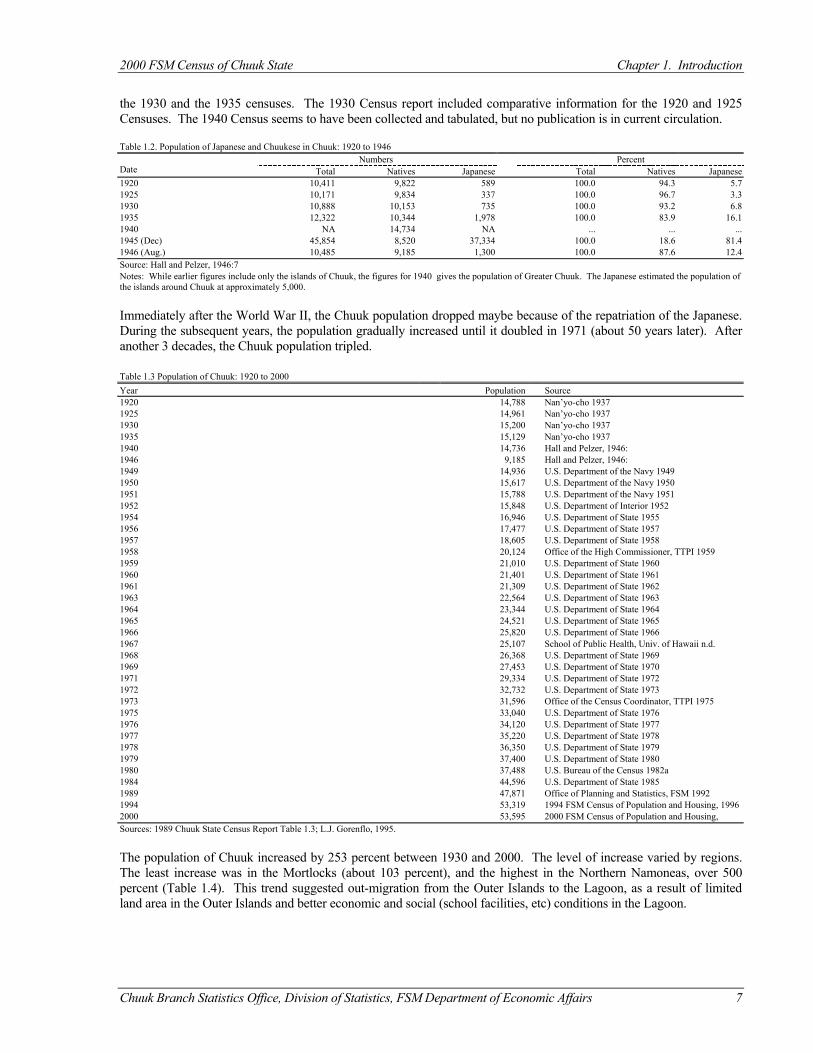
2000 FSM Census of Chuuk State Chapter 1. Introduction
Chuuk Branch Statistics Office, Division of Statistics, FSM Department of Economic Affairs 7
the 1930 and the 1935 censuses. The 1930 Census report included comparative information for the 1920 and 1925 Censuses. The 1940 Census seems to have been collected and tabulated, but no publication is in current circulation. Table 1.2. Population of Japanese and Chuukese in Chuuk: 1920 to 1946
Numbers Percent Date Total Natives Japanese Total Natives Japanese 1920 10,411 9,822 589 100.0 94.3 5.7 1925 10,171 9,834 337 100.0 96.7 3.3 1930 10,888 10,153 735 100.0 93.2 6.8 1935 12,322 10,344 1,978 100.0 83.9 16.1 1940 NA 14,734 NA ... ... ... 1945 (Dec) 45,854 8,520 37,334 100.0 18.6 81.4 1946 (Aug.) 10,485 9,185 1,300 100.0 87.6 12.4 Source: Hall and Pelzer, 1946:7 Notes: While earlier figures include only the islands of Chuuk, the figures for 1940 gives the population of Greater Chuuk. The Japanese estimated the population of the islands around Chuuk at approximately 5,000. Immediately after the World War II, the Chuuk population dropped maybe because of the repatriation of the Japanese. During the subsequent years, the population gradually increased until it doubled in 1971 (about 50 years later). After another 3 decades, the Chuuk population tripled. Table 1.3 Population of Chuuk: 1920 to 2000 Year Population Source 1920 14,788 Nan’yo-cho 1937 1925 14,961 Nan’yo-cho 1937 1930 15,200 Nan’yo-cho 1937 1935 15,129 Nan’yo-cho 1937 1940 14,736 Hall and Pelzer, 1946: 1946 9,185 Hall and Pelzer, 1946: 1949 14,936 U.S. Department of the Navy 1949 1950 15,617 U.S. Department of the Navy 1950 1951 15,788 U.S. Department of the Navy 1951 1952 15,848 U.S. Department of Interior 1952 1954 16,946 U.S. Department of State 1955 1956 17,477 U.S. Department of State 1957 1957 18,605 U.S. Department of State 1958 1958 20,124 Office of the High Commissioner, TTPI 1959 1959 21,010 U.S. Department of State 1960 1960 21,401 U.S. Department of State 1961 1961 21,309 U.S. Department of State 1962 1963 22,564 U.S. Department of State 1963 1964 23,344 U.S. Department of State 1964 1965 24,521 U.S. Department of State 1965 1966 25,820 U.S. Department of State 1966 1967 25,107 School of Public Health, Univ. of Hawaii n.d. 1968 26,368 U.S. Department of State 1969 1969 27,453 U.S. Department of State 1970 1971 29,334 U.S. Department of State 1972 1972 32,732 U.S. Department of State 1973 1973 31,596 Office of the Census Coordinator, TTPI 1975 1975 33,040 U.S. Department of State 1976 1976 34,120 U.S. Department of State 1977 1977 35,220 U.S. Department of State 1978 1978 36,350 U.S. Department of State 1979 1979 37,400 U.S. Department of State 1980 1980 37,488 U.S. Bureau of the Census 1982a 1984 44,596 U.S. Department of State 1985 1989 47,871 Office of Planning and Statistics, FSM 1992 1994 53,319 1994 FSM Census of Population and Housing, 1996 2000 53,595 2000 FSM Census of Population and Housing, Sources: 1989 Chuuk State Census Report Table 1.3; L.J. Gorenflo, 1995. The population of Chuuk increased by 253 percent between 1930 and 2000. The level of increase varied by regions. The least increase was in the Mortlocks (about 103 percent), and the highest in the Northern Namoneas, over 500 percent (Table 1.4). This trend suggested out-migration from the Outer Islands to the Lagoon, as a result of limited land area in the Outer Islands and better economic and social (school facilities, etc) conditions in the Lagoon.
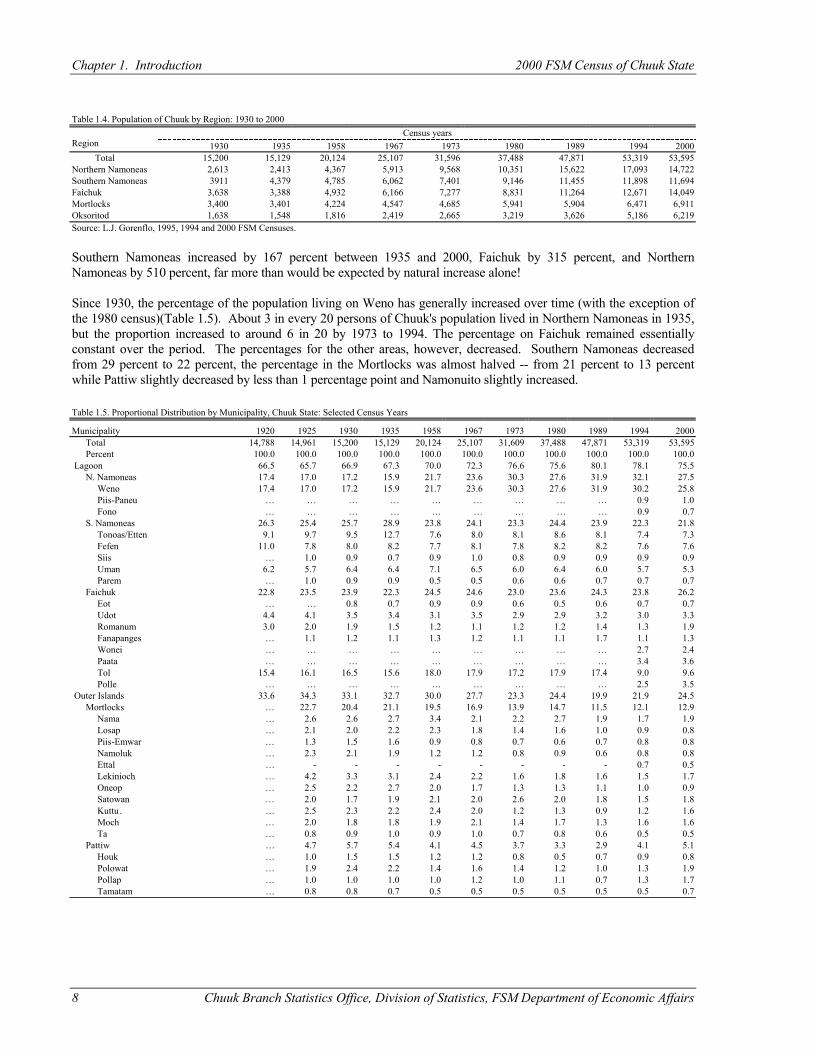
Chapter 1. Introduction 2000 FSM Census of Chuuk State
8 Chuuk Branch Statistics Office, Division of Statistics, FSM Department of Economic Affairs
Table 1.4. Population of Chuuk by Region: 1930 to 2000
Census years Region 1930 1935 1958 1967 1973 1980 1989 1994 2000 Total 15,200 15,129 20,124 25,107 31,596 37,488 47,871 53,319 53,595 Northern Namoneas 2,613 2,413 4,367 5,913 9,568 10,351 15,622 17,093 14,722 Southern Namoneas 3911 4,379 4,785 6,062 7,401 9,146 11,455 11,898 11,694 Faichuk 3,638 3,388 4,932 6,166 7,277 8,831 11,264 12,671 14,049 Mortlocks 3,400 3,401 4,224 4,547 4,685 5,941 5,904 6,471 6,911 Oksoritod 1,638 1,548 1,816 2,419 2,665 3,219 3,626 5,186 6,219 Source: L.J. Gorenflo, 1995, 1994 and 2000 FSM Censuses. Southern Namoneas increased by 167 percent between 1935 and 2000, Faichuk by 315 percent, and Northern Namoneas by 510 percent, far more than would be expected by natural increase alone! Since 1930, the percentage of the population living on Weno has generally increased over time (with the exception of the 1980 census)(Table 1.5). About 3 in every 20 persons of Chuuk's population lived in Northern Namoneas in 1935, but the proportion increased to around 6 in 20 by 1973 to 1994. The percentage on Faichuk remained essentially constant over the period. The percentages for the other areas, however, decreased. Southern Namoneas decreased from 29 percent to 22 percent, the percentage in the Mortlocks was almost halved -- from 21 percent to 13 percent while Pattiw slightly decreased by less than 1 percentage point and Namonuito slightly increased. Table 1.5. Proportional Distribution by Municipality, Chuuk State: Selected Census Years
Municipality 1920 1925 1930 1935 1958 1967 1973 1980 1989 1994 2000 Total 14,788 14,961 15,200 15,129 20,124 25,107 31,609 37,488 47,871 53,319 53,595 Percent 100.0 100.0 100.0 100.0 100.0 100.0 100.0 100.0 100.0 100.0 100.0 Lagoon 66.5 65.7 66.9 67.3 70.0 72.3 76.6 75.6 80.1 78.1 75.5 N. Namoneas 17.4 17.0 17.2 15.9 21.7 23.6 30.3 27.6 31.9 32.1 27.5 Weno 17.4 17.0 17.2 15.9 21.7 23.6 30.3 27.6 31.9 30.2 25.8 Piis-Paneu … … … … … … … … … 0.9 1.0 Fono … … … … … … … … … 0.9 0.7 S. Namoneas 26.3 25.4 25.7 28.9 23.8 24.1 23.3 24.4 23.9 22.3 21.8 Tonoas/Etten 9.1 9.7 9.5 12.7 7.6 8.0 8.1 8.6 8.1 7.4 7.3 Fefen 11.0 7.8 8.0 8.2 7.7 8.1 7.8 8.2 8.2 7.6 7.6 Siis … 1.0 0.9 0.7 0.9 1.0 0.8 0.9 0.9 0.9 0.9 Uman 6.2 5.7 6.4 6.4 7.1 6.5 6.0 6.4 6.0 5.7 5.3 Parem … 1.0 0.9 0.9 0.5 0.5 0.6 0.6 0.7 0.7 0.7 Faichuk 22.8 23.5 23.9 22.3 24.5 24.6 23.0 23.6 24.3 23.8 26.2 Eot … … 0.8 0.7 0.9 0.9 0.6 0.5 0.6 0.7 0.7 Udot 4.4 4.1 3.5 3.4 3.1 3.5 2.9 2.9 3.2 3.0 3.3 Romanum 3.0 2.0 1.9 1.5 1.2 1.1 1.2 1.2 1.4 1.3 1.9 Fanapanges … 1.1 1.2 1.1 1.3 1.2 1.1 1.1 1.7 1.1 1.3 Wonei … … … … … … … … … 2.7 2.4 Paata … … … … … … … … … 3.4 3.6 Tol 15.4 16.1 16.5 15.6 18.0 17.9 17.2 17.9 17.4 9.0 9.6 Polle … … … … … … … … … 2.5 3.5 Outer Islands 33.6 34.3 33.1 32.7 30.0 27.7 23.3 24.4 19.9 21.9 24.5 Mortlocks … 22.7 20.4 21.1 19.5 16.9 13.9 14.7 11.5 12.1 12.9 Nama … 2.6 2.6 2.7 3.4 2.1 2.2 2.7 1.9 1.7 1.9 Losap … 2.1 2.0 2.2 2.3 1.8 1.4 1.6 1.0 0.9 0.8 Piis-Emwar … 1.3 1.5 1.6 0.9 0.8 0.7 0.6 0.7 0.8 0.8 Namoluk … 2.3 2.1 1.9 1.2 1.2 0.8 0.9 0.6 0.8 0.8 Ettal … - - - - - - - - 0.7 0.5 Lekinioch … 4.2 3.3 3.1 2.4 2.2 1.6 1.8 1.6 1.5 1.7 Oneop … 2.5 2.2 2.7 2.0 1.7 1.3 1.3 1.1 1.0 0.9 Satowan … 2.0 1.7 1.9 2.1 2.0 2.6 2.0 1.8 1.5 1.8 Kuttu . … 2.5 2.3 2.2 2.4 2.0 1.2 1.3 0.9 1.2 1.6 Moch … 2.0 1.8 1.8 1.9 2.1 1.4 1.7 1.3 1.6 1.6 Ta … 0.8 0.9 1.0 0.9 1.0 0.7 0.8 0.6 0.5 0.5 Pattiw … 4.7 5.7 5.4 4.1 4.5 3.7 3.3 2.9 4.1 5.1 Houk … 1.0 1.5 1.5 1.2 1.2 0.8 0.5 0.7 0.9 0.8 Polowat … 1.9 2.4 2.2 1.4 1.6 1.4 1.2 1.0 1.3 1.9 Pollap … 1.0 1.0 1.0 1.0 1.2 1.0 1.1 0.7 1.3 1.7 Tamatam … 0.8 0.8 0.7 0.5 0.5 0.5 0.5 0.5 0.5 0.7
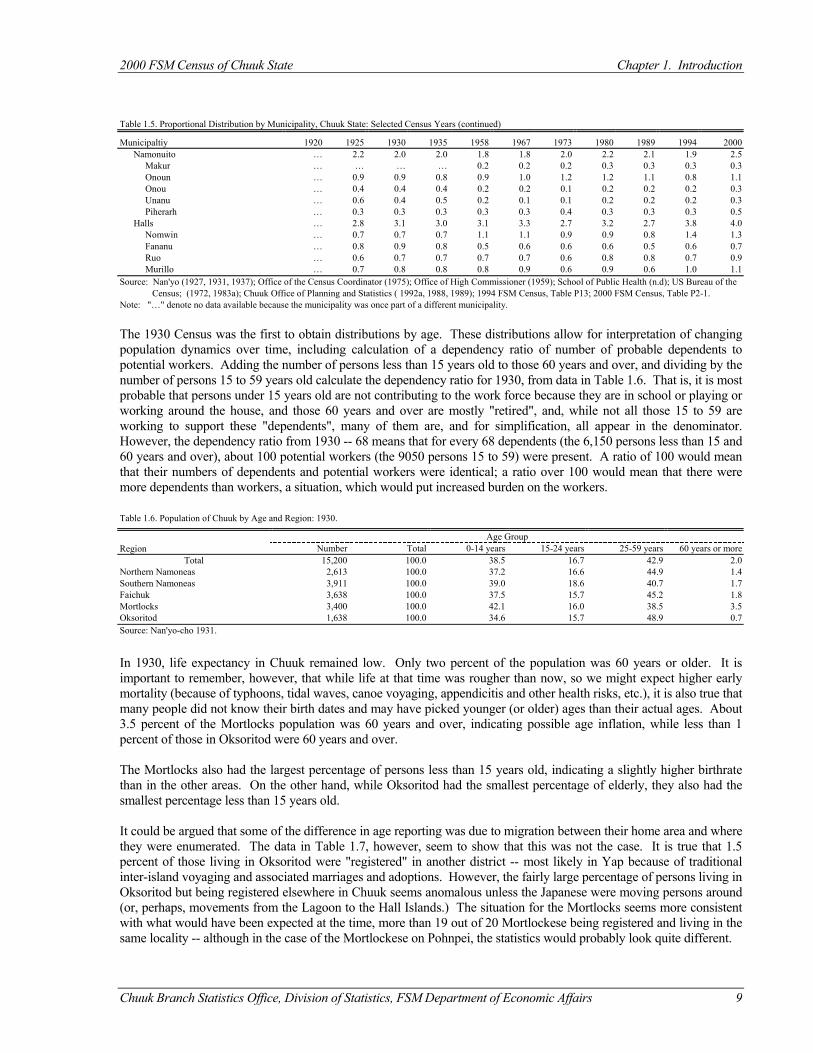
2000 FSM Census of Chuuk State Chapter 1. Introduction
Chuuk Branch Statistics Office, Division of Statistics, FSM Department of Economic Affairs 9
Table 1.5. Proportional Distribution by Municipality, Chuuk State: Selected Census Years (continued)
Municipaltiy 1920 1925 1930 1935 1958 1967 1973 1980 1989 1994 2000 Namonuito … 2.2 2.0 2.0 1.8 1.8 2.0 2.2 2.1 1.9 2.5 Makur … … … … 0.2 0.2 0.2 0.3 0.3 0.3 0.3 Onoun … 0.9 0.9 0.8 0.9 1.0 1.2 1.2 1.1 0.8 1.1 Onou … 0.4 0.4 0.4 0.2 0.2 0.1 0.2 0.2 0.2 0.3 Unanu … 0.6 0.4 0.5 0.2 0.1 0.1 0.2 0.2 0.2 0.3 Piherarh … 0.3 0.3 0.3 0.3 0.3 0.4 0.3 0.3 0.3 0.5 Halls … 2.8 3.1 3.0 3.1 3.3 2.7 3.2 2.7 3.8 4.0 Nomwin … 0.7 0.7 0.7 1.1 1.1 0.9 0.9 0.8 1.4 1.3 Fananu … 0.8 0.9 0.8 0.5 0.6 0.6 0.6 0.5 0.6 0.7 Ruo … 0.6 0.7 0.7 0.7 0.7 0.6 0.8 0.8 0.7 0.9 Murillo … 0.7 0.8 0.8 0.8 0.9 0.6 0.9 0.6 1.0 1.1 Source: Nan'yo (1927, 1931, 1937); Office of the Census Coordinator (1975); Office of High Commissioner (1959); School of Public Health (n.d); US Bureau of the Census; (1972, 1983a); Chuuk Office of Planning and Statistics ( 1992a, 1988, 1989); 1994 FSM Census, Table P13; 2000 FSM Census, Table P2-1. Note: "…" denote no data available because the municipality was once part of a different municipality. The 1930 Census was the first to obtain distributions by age. These distributions allow for interpretation of changing population dynamics over time, including calculation of a dependency ratio of number of probable dependents to potential workers. Adding the number of persons less than 15 years old to those 60 years and over, and dividing by the number of persons 15 to 59 years old calculate the dependency ratio for 1930, from data in Table 1.6. That is, it is most probable that persons under 15 years old are not contributing to the work force because they are in school or playing or working around the house, and those 60 years and over are mostly "retired", and, while not all those 15 to 59 are working to support these "dependents", many of them are, and for simplification, all appear in the denominator. However, the dependency ratio from 1930 -- 68 means that for every 68 dependents (the 6,150 persons less than 15 and 60 years and over), about 100 potential workers (the 9050 persons 15 to 59) were present. A ratio of 100 would mean that their numbers of dependents and potential workers were identical; a ratio over 100 would mean that there were more dependents than workers, a situation, which would put increased burden on the workers. Table 1.6. Population of Chuuk by Age and Region: 1930.
Age Group Region Number Total 0-14 years 15-24 years 25-59 years 60 years or more
Total 15,200 100.0 38.5 16.7 42.9 2.0 Northern Namoneas 2,613 100.0 37.2 16.6 44.9 1.4 Southern Namoneas 3,911 100.0 39.0 18.6 40.7 1.7 Faichuk 3,638 100.0 37.5 15.7 45.2 1.8 Mortlocks 3,400 100.0 42.1 16.0 38.5 3.5 Oksoritod 1,638 100.0 34.6 15.7 48.9 0.7 Source: Nan'yo-cho 1931.
In 1930, life expectancy in Chuuk remained low. Only two percent of the population was 60 years or older. It is important to remember, however, that while life at that time was rougher than now, so we might expect higher early mortality (because of typhoons, tidal waves, canoe voyaging, appendicitis and other health risks, etc.), it is also true that many people did not know their birth dates and may have picked younger (or older) ages than their actual ages. About 3.5 percent of the Mortlocks population was 60 years and over, indicating possible age inflation, while less than 1 percent of those in Oksoritod were 60 years and over. The Mortlocks also had the largest percentage of persons less than 15 years old, indicating a slightly higher birthrate than in the other areas. On the other hand, while Oksoritod had the smallest percentage of elderly, they also had the smallest percentage less than 15 years old. It could be argued that some of the difference in age reporting was due to migration between their home area and where they were enumerated. The data in Table 1.7, however, seem to show that this was not the case. It is true that 1.5 percent of those living in Oksoritod were "registered" in another district -- most likely in Yap because of traditional inter-island voyaging and associated marriages and adoptions. However, the fairly large percentage of persons living in Oksoritod but being registered elsewhere in Chuuk seems anomalous unless the Japanese were moving persons around (or, perhaps, movements from the Lagoon to the Hall Islands.) The situation for the Mortlocks seems more consistent with what would have been expected at the time, more than 19 out of 20 Mortlockese being registered and living in the same locality -- although in the case of the Mortlockese on Pohnpei, the statistics would probably look quite different.
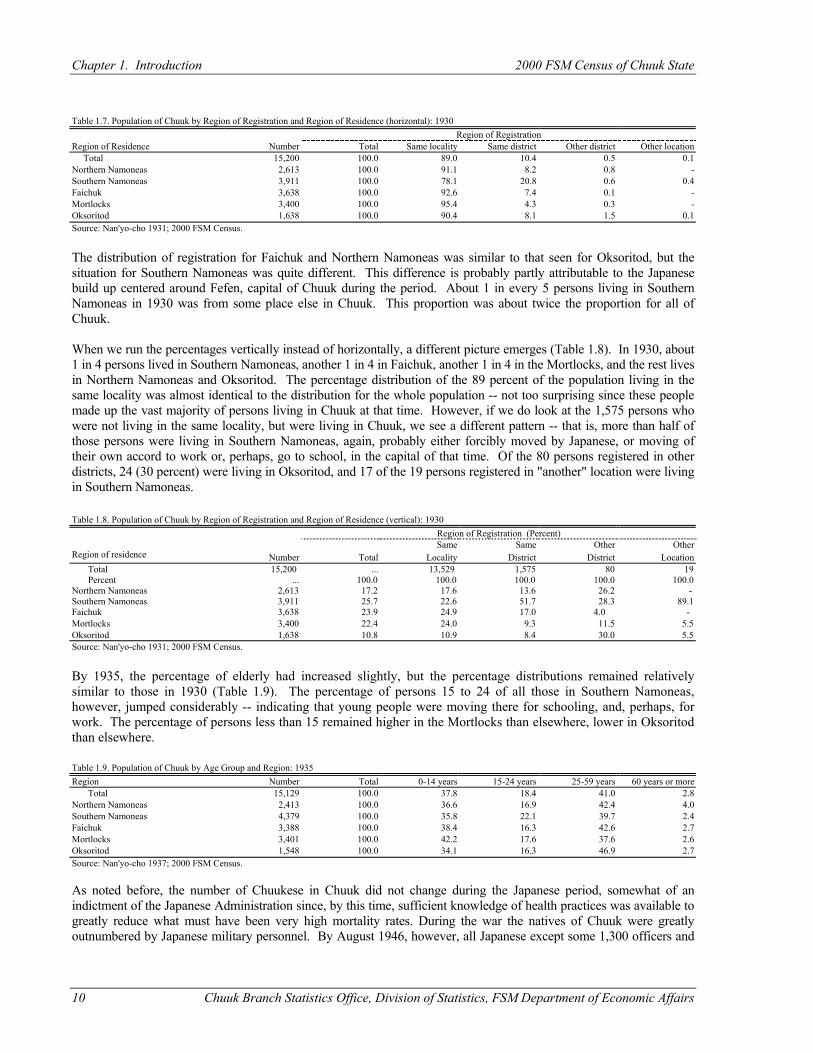
Chapter 1. Introduction 2000 FSM Census of Chuuk State
10 Chuuk Branch Statistics Office, Division of Statistics, FSM Department of Economic Affairs
Table 1.7. Population of Chuuk by Region of Registration and Region of Residence (horizontal): 1930 Region of Registration Region of Residence Number Total Same locality Same district Other district Other location Total 15,200 100.0 89.0 10.4 0.5 0.1 Northern Namoneas 2,613 100.0 91.1 8.2 0.8 - Southern Namoneas 3,911 100.0 78.1 20.8 0.6 0.4 Faichuk 3,638 100.0 92.6 7.4 0.1 - Mortlocks 3,400 100.0 95.4 4.3 0.3 - Oksoritod 1,638 100.0 90.4 8.1 1.5 0.1 Source: Nan'yo-cho 1931; 2000 FSM Census. The distribution of registration for Faichuk and Northern Namoneas was similar to that seen for Oksoritod, but the situation for Southern Namoneas was quite different. This difference is probably partly attributable to the Japanese build up centered around Fefen, capital of Chuuk during the period. About 1 in every 5 persons living in Southern Namoneas in 1930 was from some place else in Chuuk. This proportion was about twice the proportion for all of Chuuk. When we run the percentages vertically instead of horizontally, a different picture emerges (Table 1.8). In 1930, about 1 in 4 persons lived in Southern Namoneas, another 1 in 4 in Faichuk, another 1 in 4 in the Mortlocks, and the rest lives in Northern Namoneas and Oksoritod. The percentage distribution of the 89 percent of the population living in the same locality was almost identical to the distribution for the whole population -- not too surprising since these people made up the vast majority of persons living in Chuuk at that time. However, if we do look at the 1,575 persons who were not living in the same locality, but were living in Chuuk, we see a different pattern -- that is, more than half of those persons were living in Southern Namoneas, again, probably either forcibly moved by Japanese, or moving of their own accord to work or, perhaps, go to school, in the capital of that time. Of the 80 persons registered in other districts, 24 (30 percent) were living in Oksoritod, and 17 of the 19 persons registered in "another" location were living in Southern Namoneas. Table 1.8. Population of Chuuk by Region of Registration and Region of Residence (vertical): 1930
Region of Registration (Percent) Same Same Other Other
Region of residence Number Total Locality District District Location Total 15,200 ... 13,529 1,575 80 19 Percent ... 100.0 100.0 100.0 100.0 100.0 Northern Namoneas 2,613 17.2 17.6 13.6 26.2 - Southern Namoneas 3,911 25.7 22.6 51.7 28.3 89.1 Faichuk 3,638 23.9 24.9 17.0 4.0 - Mortlocks 3,400 22.4 24.0 9.3 11.5 5.5 Oksoritod 1,638 10.8 10.9 8.4 30.0 5.5 Source: Nan'yo-cho 1931; 2000 FSM Census. By 1935, the percentage of elderly had increased slightly, but the percentage distributions remained relatively similar to those in 1930 (Table 1.9). The percentage of persons 15 to 24 of all those in Southern Namoneas, however, jumped considerably -- indicating that young people were moving there for schooling, and, perhaps, for work. The percentage of persons less than 15 remained higher in the Mortlocks than elsewhere, lower in Oksoritod than elsewhere. Table 1.9. Population of Chuuk by Age Group and Region: 1935 Region Number Total 0-14 years 15-24 years 25-59 years 60 years or more Total 15,129 100.0 37.8 18.4 41.0 2.8 Northern Namoneas 2,413 100.0 36.6 16.9 42.4 4.0 Southern Namoneas 4,379 100.0 35.8 22.1 39.7 2.4 Faichuk 3,388 100.0 38.4 16.3 42.6 2.7 Mortlocks 3,401 100.0 42.2 17.6 37.6 2.6 Oksoritod 1,548 100.0 34.1 16.3 46.9 2.7 Source: Nan'yo-cho 1937; 2000 FSM Census. As noted before, the number of Chuukese in Chuuk did not change during the Japanese period, somewhat of an indictment of the Japanese Administration since, by this time, sufficient knowledge of health practices was available to greatly reduce what must have been very high mortality rates. During the war the natives of Chuuk were greatly outnumbered by Japanese military personnel. By August 1946, however, all Japanese except some 1,300 officers and
2000 FSM Census of Chuuk State Chapter 1. Introduction
Chuuk Branch Statistics Office, Division of Statistics, FSM Department of Economic Affairs 11
men had been repatriated to Japan. The only other foreigners in Chuuk were 7 Germans and 7 Spaniards, the Germans being Protestant and the Spaniards being Catholic missionaries. At the end of the war there were some 1,500 Japanese and Okinawans civilians in Chuuk, all of whom were shipped back to their home countries. American Administration Once again the spoils of war, Micronesia passed into the hands of the United States. Early American development policy for the islands was defined more in reaction to earlier Japanese policy than in any more positive way. All Japanese nationals, including those who had been married to Chuukese women, were repatriated as soon as possible. Hence, the pool of skilled labor that created the economic miracle in the 1930s was lost forever. The United States Navy, which was then administering the islands, further pledged to avoid all "indiscriminate exploitation" of island resources. There would be economic development projects funded by outside capital. Any economic development that occurred was to benefit the local people and be subject to their control. This was to set the pattern for the islands during their first two decades under American rule. United Nations trusteeship in 1947 and civilian administration under the Department of the Interior in 1951 had virtually no impact on the United States' "go slow" development policy. The Island Trading Company replaced the United States Commercial Company, which had been introduced by the Navy in 1946 to supervise economic development, a year later. This, in turn, spawned local import-export businesses such as the Truk Trading Company. Retail stores multiplied and the production of copra and handicraft was encouraged. Experimental projects in such things as cacao, ramie, choir fiber, and poultry were begun, but nearly all proved failures. Although unwilling to impose development programs on the people, the United States showed no such hesitation in promoting democratic political practices. From the very start the United States attempted to set up democratic forms of government on every level of island society. In 1948 municipalities were established and elections were held for magistrates. At first the people of most places chose the head of the highest ranking clan on the island; but in time, as it became clear that the magistrates would be expected to deal with American government officials, some of the chiefs picked surrogates whom they supported in the elections. Later the magistrates of some islands would carve out a leadership role for themselves that was more independent of the chiefs. Meanwhile, training programs were established for teachers and nurses, with the Pacific Islands Teacher Training School (PITTS) moving from Guam to Chuuk in 1952. Later the institution evolved into the first full high school (PICS) in the Trust Territory. During the 1950s this school graduated 10 or 15 Chuukese a year, a mere five percent of the output of high school graduates during the 1970s. Only a few hundred people had any salary employment during these years, most of them in lower level positions in the government. Then, in the early 1960s, during the Kennedy Administration, United States policy was suddenly reversed. A massive buildup of education and health services was undertaken as the Trust Territory budget doubled in 1964 and escalated each year to the end of the decade. New classroom buildings were put up everywhere and American teachers were recruited to upgrade educational standards. Chuuk acquired its own high school, and several years later five junior high schools. Education enrollments, particularly on the secondary level, increased many times over, and in the early 1970s, with the help of United States Federal assistance, unprecedented numbers of Chuukese began going abroad for college. All the while, new government jobs were created as employment in Chuuk doubled and then doubled once again. The government was now more than ever the engine that drove the economy. Exports remained at the level of the 1950s, bringing in a few hundred thousand dollars a year while imports skyrocketed throughout the following years. Belatedly during the 1970s the United States administration made attempts to halt the galloping wage-and-consumption direction of the economy. A ceiling was put on the annual budget, but supplementary funds in the form of United States Federal Program grants and Capital Improvement Project funds fostered the same cycle until 1979. The year before, Chuuk elected its first governor and the state became self-governing after nearly a century of colonial rule. Its political status was formalized in 1986 when the Federated States of Micronesia's Compact of Free Association with the United States was implemented. With Chuuk’s political status finally settled -- at least for the next 15 years -- the state was free to devote full attention to its main problem: developing a viable economy.
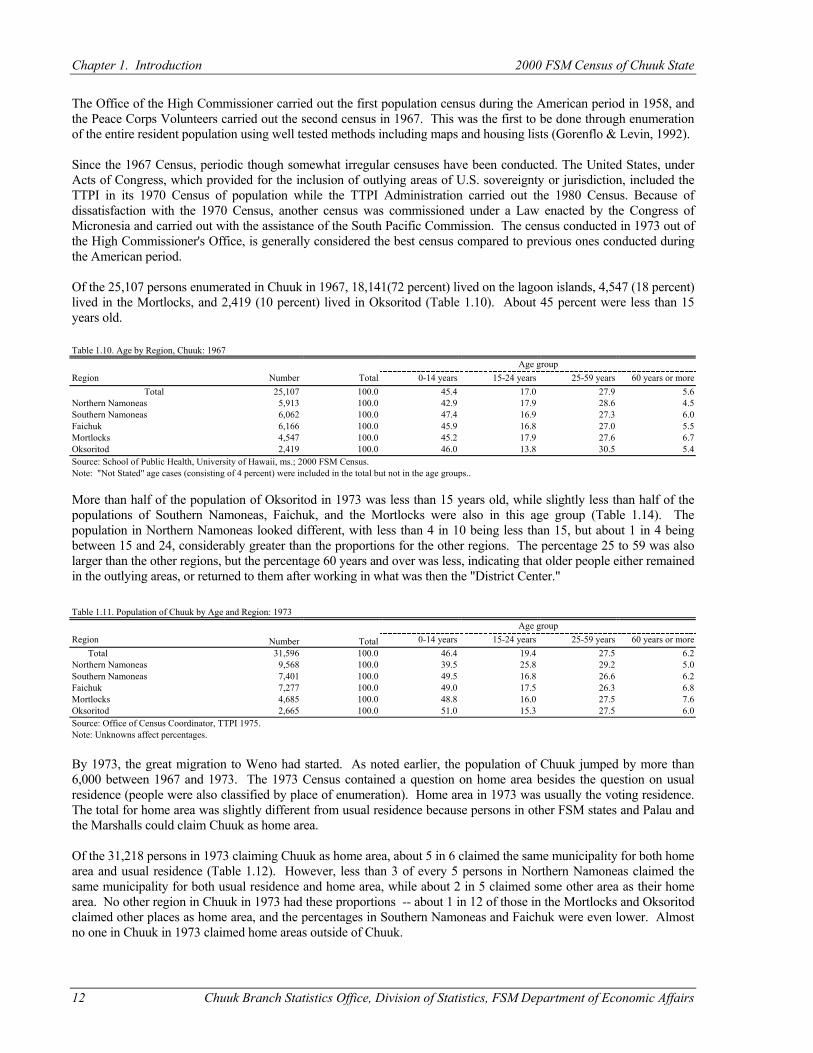
Chapter 1. Introduction 2000 FSM Census of Chuuk State
12 Chuuk Branch Statistics Office, Division of Statistics, FSM Department of Economic Affairs
The Office of the High Commissioner carried out the first population census during the American period in 1958, and the Peace Corps Volunteers carried out the second census in 1967. This was the first to be done through enumeration of the entire resident population using well tested methods including maps and housing lists (Gorenflo & Levin, 1992). Since the 1967 Census, periodic though somewhat irregular censuses have been conducted. The United States, under Acts of Congress, which provided for the inclusion of outlying areas of U.S. sovereignty or jurisdiction, included the TTPI in its 1970 Census of population while the TTPI Administration carried out the 1980 Census. Because of dissatisfaction with the 1970 Census, another census was commissioned under a Law enacted by the Congress of Micronesia and carried out with the assistance of the South Pacific Commission. The census conducted in 1973 out of the High Commissioner's Office, is generally considered the best census compared to previous ones conducted during the American period. Of the 25,107 persons enumerated in Chuuk in 1967, 18,141(72 percent) lived on the lagoon islands, 4,547 (18 percent) lived in the Mortlocks, and 2,419 (10 percent) lived in Oksoritod (Table 1.10). About 45 percent were less than 15 years old. Table 1.10. Age by Region, Chuuk: 1967
Age group Region Number Total 0-14 years 15-24 years 25-59 years 60 years or more
Total 25,107 100.0 45.4 17.0 27.9 5.6 Northern Namoneas 5,913 100.0 42.9 17.9 28.6 4.5 Southern Namoneas 6,062 100.0 47.4 16.9 27.3 6.0 Faichuk 6,166 100.0 45.9 16.8 27.0 5.5 Mortlocks 4,547 100.0 45.2 17.9 27.6 6.7 Oksoritod 2,419 100.0 46.0 13.8 30.5 5.4 Source: School of Public Health, University of Hawaii, ms.; 2000 FSM Census. Note: "Not Stated" age cases (consisting of 4 percent) were included in the total but not in the age groups..
More than half of the population of Oksoritod in 1973 was less than 15 years old, while slightly less than half of the populations of Southern Namoneas, Faichuk, and the Mortlocks were also in this age group (Table 1.14). The population in Northern Namoneas looked different, with less than 4 in 10 being less than 15, but about 1 in 4 being between 15 and 24, considerably greater than the proportions for the other regions. The percentage 25 to 59 was also larger than the other regions, but the percentage 60 years and over was less, indicating that older people either remained in the outlying areas, or returned to them after working in what was then the "District Center." Table 1.11. Population of Chuuk by Age and Region: 1973
Age group Region Number Total 0-14 years 15-24 years 25-59 years 60 years or more Total 31,596 100.0 46.4 19.4 27.5 6.2 Northern Namoneas 9,568 100.0 39.5 25.8 29.2 5.0 Southern Namoneas 7,401 100.0 49.5 16.8 26.6 6.2 Faichuk 7,277 100.0 49.0 17.5 26.3 6.8 Mortlocks 4,685 100.0 48.8 16.0 27.5 7.6 Oksoritod 2,665 100.0 51.0 15.3 27.5 6.0 Source: Office of Census Coordinator, TTPI 1975. Note: Unknowns affect percentages. By 1973, the great migration to Weno had started. As noted earlier, the population of Chuuk jumped by more than 6,000 between 1967 and 1973. The 1973 Census contained a question on home area besides the question on usual residence (people were also classified by place of enumeration). Home area in 1973 was usually the voting residence. The total for home area was slightly different from usual residence because persons in other FSM states and Palau and the Marshalls could claim Chuuk as home area. Of the 31,218 persons in 1973 claiming Chuuk as home area, about 5 in 6 claimed the same municipality for both home area and usual residence (Table 1.12). However, less than 3 of every 5 persons in Northern Namoneas claimed the same municipality for both usual residence and home area, while about 2 in 5 claimed some other area as their home area. No other region in Chuuk in 1973 had these proportions -- about 1 in 12 of those in the Mortlocks and Oksoritod claimed other places as home area, and the percentages in Southern Namoneas and Faichuk were even lower. Almost no one in Chuuk in 1973 claimed home areas outside of Chuuk.
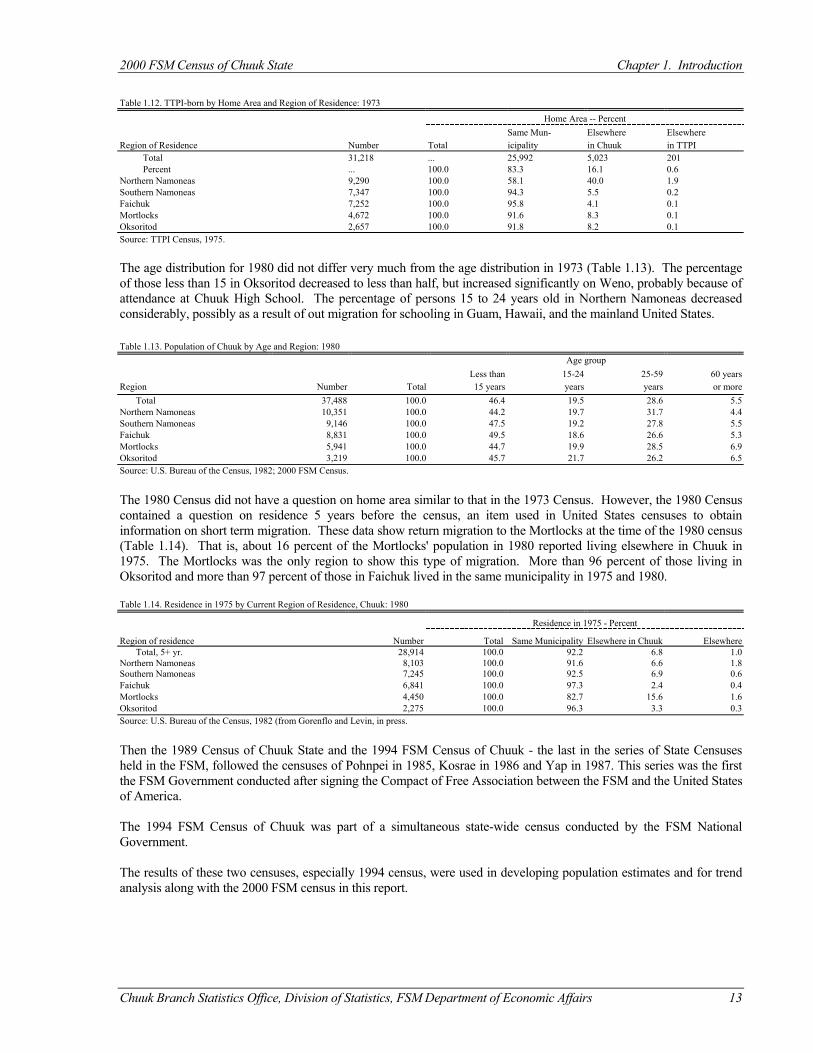
2000 FSM Census of Chuuk State Chapter 1. Introduction
Chuuk Branch Statistics Office, Division of Statistics, FSM Department of Economic Affairs 13
Table 1.12. TTPI-born by Home Area and Region of Residence: 1973
Home Area -- Percent Same Mun- Elsewhere Elsewhere Region of Residence Number Total icipality in Chuuk in TTPI Total 31,218 ... 25,992 5,023 201 Percent ... 100.0 83.3 16.1 0.6 Northern Namoneas 9,290 100.0 58.1 40.0 1.9 Southern Namoneas 7,347 100.0 94.3 5.5 0.2 Faichuk 7,252 100.0 95.8 4.1 0.1 Mortlocks 4,672 100.0 91.6 8.3 0.1 Oksoritod 2,657 100.0 91.8 8.2 0.1 Source: TTPI Census, 1975. The age distribution for 1980 did not differ very much from the age distribution in 1973 (Table 1.13). The percentage of those less than 15 in Oksoritod decreased to less than half, but increased significantly on Weno, probably because of attendance at Chuuk High School. The percentage of persons 15 to 24 years old in Northern Namoneas decreased considerably, possibly as a result of out migration for schooling in Guam, Hawaii, and the mainland United States. Table 1.13. Population of Chuuk by Age and Region: 1980
Age group Less than 15-24 25-59 60 years
Region Number Total 15 years years years or more Total 37,488 100.0 46.4 19.5 28.6 5.5 Northern Namoneas 10,351 100.0 44.2 19.7 31.7 4.4 Southern Namoneas 9,146 100.0 47.5 19.2 27.8 5.5 Faichuk 8,831 100.0 49.5 18.6 26.6 5.3 Mortlocks 5,941 100.0 44.7 19.9 28.5 6.9 Oksoritod 3,219 100.0 45.7 21.7 26.2 6.5 Source: U.S. Bureau of the Census, 1982; 2000 FSM Census. The 1980 Census did not have a question on home area similar to that in the 1973 Census. However, the 1980 Census contained a question on residence 5 years before the census, an item used in United States censuses to obtain information on short term migration. These data show return migration to the Mortlocks at the time of the 1980 census (Table 1.14). That is, about 16 percent of the Mortlocks' population in 1980 reported living elsewhere in Chuuk in 1975. The Mortlocks was the only region to show this type of migration. More than 96 percent of those living in Oksoritod and more than 97 percent of those in Faichuk lived in the same municipality in 1975 and 1980. Table 1.14. Residence in 1975 by Current Region of Residence, Chuuk: 1980
Residence in 1975 - Percent
Region of residence Number Total Same Municipality Elsewhere in Chuuk Elsewhere Total, 5+ yr. 28,914 100.0 92.2 6.8 1.0 Northern Namoneas 8,103 100.0 91.6 6.6 1.8 Southern Namoneas 7,245 100.0 92.5 6.9 0.6 Faichuk 6,841 100.0 97.3 2.4 0.4 Mortlocks 4,450 100.0 82.7 15.6 1.6 Oksoritod 2,275 100.0 96.3 3.3 0.3 Source: U.S. Bureau of the Census, 1982 (from Gorenflo and Levin, in press. Then the 1989 Census of Chuuk State and the 1994 FSM Census of Chuuk - the last in the series of State Censuses held in the FSM, followed the censuses of Pohnpei in 1985, Kosrae in 1986 and Yap in 1987. This series was the first the FSM Government conducted after signing the Compact of Free Association between the FSM and the United States of America. The 1994 FSM Census of Chuuk was part of a simultaneous state-wide census conducted by the FSM National Government. The results of these two censuses, especially 1994 census, were used in developing population estimates and for trend analysis along with the 2000 FSM census in this report.
Chapter 1. Introduction 2000 FSM Census of Chuuk State
14 Chuuk Branch Statistics Office, Division of Statistics, FSM Department of Economic Affairs
The 2000 FSM Census of Chuuk The 2000 Census covered all persons usually residing in the FSM as of April 1, 2000. A census of the usual residents is a de-jure count of the population. Only people who had resided or intended to reside in the FSM for six months or more prior to the census were counted. Thus short-term visitors, staying for less than six months, were excluded. Usual residents who were overseas at the time of the Census were included if they intended to return to the FSM within six months. FSM citizens who were away for more than six months were not considered to be usual residents of FSM, and were excluded from the Census. The census also covered housing units (living quarters), both occupied and intended for occupancy (vacant) at the time of the census. Excluded were buildings for businesses, offices, institutions, and other structures not used as living quarters. The objectives of the 2000 FSM Census were to provide the following: i. Information on the change in the size and composition of Chuuk population. ii. Current population figures for making very realistic estimates of Chuuk and FSM population for the
allocation of funds to the states and municipalities, and for the revision of municipal and electoral boundaries. iii. The information required for development planning and policymaking. iv. A framework for sampling for post census surveys. Time Schedule and Key Events The preparation for the 2000 FSM Census started in October 1999. The following provides the list of major events for the 2000 FSM Census project. 1999 Oct. Planning and Preparation of Census Workshops Develop Census Organization Chart Prepare Calendar of Activities Prepare census operational budget Prepare enumeration plan Nov Decide timing and scope of enumeration Design control forms Select and purchase office equipment and supplies Dec Develop Quality control and Operational control Prepare training materials 2000 Jan Train personnel for map update Update map information Feb Review map update Print and prepare training materials Finalize questionnaire content Decide processing procedures Mar Generate Enumerators and Crew Leaders maps Revise procedure and program Review field materials Print training materials for the actual enumeration Prepare Enumerators and Supervisors kit for the actual enumeration Finalize recruitment of Enumerators and Supervisors Conduct training for Enumerators and Supervisors Distribute field materials Make field assignment for Enumerators and Supervisors Census publicity with radio and church Apr Conduct Enumeration Conduct field editing
Conduct preliminary count May Editors and Coders recruited Jun Recruit and Train keyers Prepare Control counts Manual edits Coding verification operation Verify questionnaire keying Conduct computer editing Jul Generate tabulation Review tabulation Nov Attend training in D.C. on tabulation and analysis 2001 Mar Workshop on table development and analysis Final table production Preparation of the Census Analytical report Aug First draft of the census and detail report were develop Review on the first draft took place Draft copy to be extended to the users for further comments
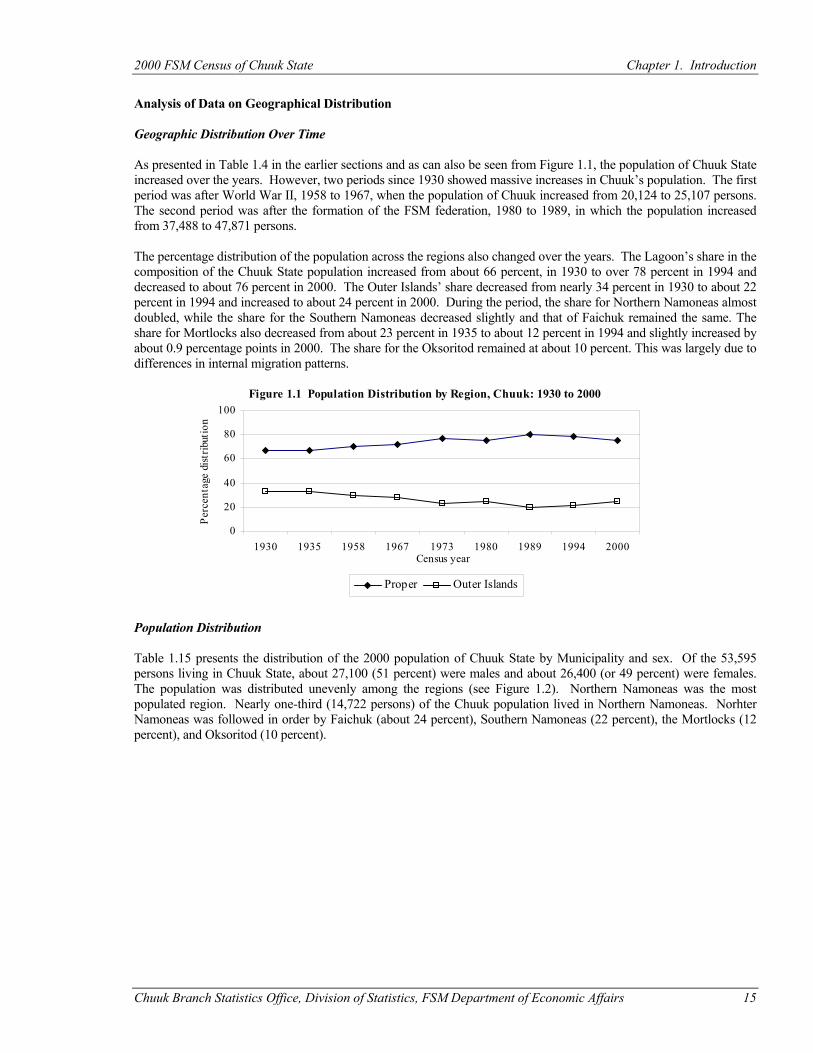
2000 FSM Census of Chuuk State Chapter 1. Introduction
Chuuk Branch Statistics Office, Division of Statistics, FSM Department of Economic Affairs 15
Analysis of Data on Geographical Distribution Geographic Distribution Over Time As presented in Table 1.4 in the earlier sections and as can also be seen from Figure 1.1, the population of Chuuk State increased over the years. However, two periods since 1930 showed massive increases in Chuuk’s population. The first period was after World War II, 1958 to 1967, when the population of Chuuk increased from 20,124 to 25,107 persons. The second period was after the formation of the FSM federation, 1980 to 1989, in which the population increased from 37,488 to 47,871 persons. The percentage distribution of the population across the regions also changed over the years. The Lagoon’s share in the composition of the Chuuk State population increased from about 66 percent, in 1930 to over 78 percent in 1994 and decreased to about 76 percent in 2000. The Outer Islands’ share decreased from nearly 34 percent in 1930 to about 22 percent in 1994 and increased to about 24 percent in 2000. During the period, the share for Northern Namoneas almost doubled, while the share for the Southern Namoneas decreased slightly and that of Faichuk remained the same. The share for Mortlocks also decreased from about 23 percent in 1935 to about 12 percent in 1994 and slightly increased by about 0.9 percentage points in 2000. The share for the Oksoritod remained at about 10 percent. This was largely due to differences in internal migration patterns.
Population Distribution Table 1.15 presents the distribution of the 2000 population of Chuuk State by Municipality and sex. Of the 53,595 persons living in Chuuk State, about 27,100 (51 percent) were males and about 26,400 (or 49 percent) were females. The population was distributed unevenly among the regions (see Figure 1.2). Northern Namoneas was the most populated region. Nearly one-third (14,722 persons) of the Chuuk population lived in Northern Namoneas. Norhter Namoneas was followed in order by Faichuk (about 24 percent), Southern Namoneas (22 percent), the Mortlocks (12 percent), and Oksoritod (10 percent).
Figure 1.1 Population Distribution by Region, Chuuk: 1930 to 2000
0
20
40
60
80
100
1930 1935 1958 1967 1973 1980 1989 1994 2000Census year
Perc
enta
ge d
istrib
utio
n
Proper Outer Islands
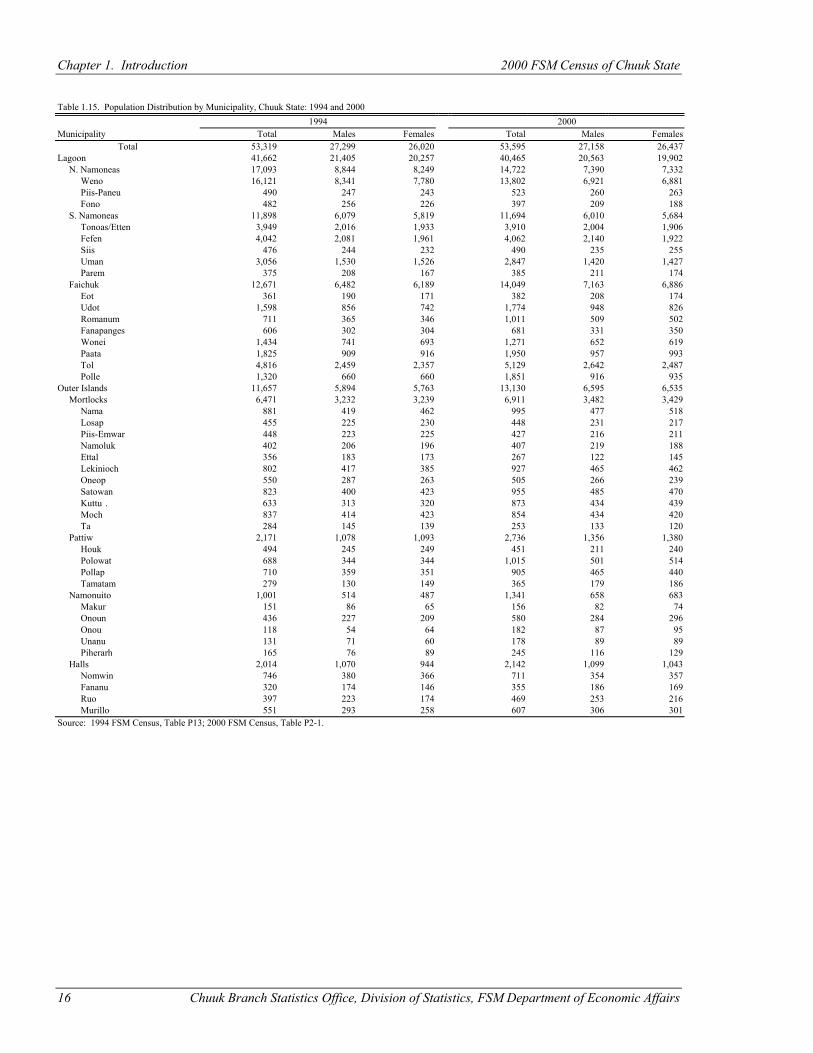
Chapter 1. Introduction 2000 FSM Census of Chuuk State
16 Chuuk Branch Statistics Office, Division of Statistics, FSM Department of Economic Affairs
Table 1.15. Population Distribution by Municipality, Chuuk State: 1994 and 2000 1994 2000
Municipality Total Males Females Total Males Females Total 53,319 27,299 26,020 53,595 27,158 26,437
Lagoon 41,662 21,405 20,257 40,465 20,563 19,902 N. Namoneas 17,093 8,844 8,249 14,722 7,390 7,332 Weno 16,121 8,341 7,780 13,802 6,921 6,881 Piis-Paneu 490 247 243 523 260 263 Fono 482 256 226 397 209 188 S. Namoneas 11,898 6,079 5,819 11,694 6,010 5,684 Tonoas/Etten 3,949 2,016 1,933 3,910 2,004 1,906 Fefen 4,042 2,081 1,961 4,062 2,140 1,922 Siis 476 244 232 490 235 255 Uman 3,056 1,530 1,526 2,847 1,420 1,427 Parem 375 208 167 385 211 174 Faichuk 12,671 6,482 6,189 14,049 7,163 6,886 Eot 361 190 171 382 208 174 Udot 1,598 856 742 1,774 948 826 Romanum 711 365 346 1,011 509 502 Fanapanges 606 302 304 681 331 350 Wonei 1,434 741 693 1,271 652 619 Paata 1,825 909 916 1,950 957 993 Tol 4,816 2,459 2,357 5,129 2,642 2,487 Polle 1,320 660 660 1,851 916 935 Outer Islands 11,657 5,894 5,763 13,130 6,595 6,535 Mortlocks 6,471 3,232 3,239 6,911 3,482 3,429 Nama 881 419 462 995 477 518 Losap 455 225 230 448 231 217 Piis-Emwar 448 223 225 427 216 211 Namoluk 402 206 196 407 219 188 Ettal 356 183 173 267 122 145 Lekinioch 802 417 385 927 465 462 Oneop 550 287 263 505 266 239 Satowan 823 400 423 955 485 470 Kuttu . 633 313 320 873 434 439 Moch 837 414 423 854 434 420 Ta 284 145 139 253 133 120 Pattiw 2,171 1,078 1,093 2,736 1,356 1,380 Houk 494 245 249 451 211 240 Polowat 688 344 344 1,015 501 514 Pollap 710 359 351 905 465 440 Tamatam 279 130 149 365 179 186 Namonuito 1,001 514 487 1,341 658 683 Makur 151 86 65 156 82 74 Onoun 436 227 209 580 284 296 Onou 118 54 64 182 87 95 Unanu 131 71 60 178 89 89 Piherarh 165 76 89 245 116 129 Halls 2,014 1,070 944 2,142 1,099 1,043 Nomwin 746 380 366 711 354 357 Fananu 320 174 146 355 186 169 Ruo 397 223 174 469 253 216 Murillo 551 293 258 607 306 301 Source: 1994 FSM Census, Table P13; 2000 FSM Census, Table P2-1.
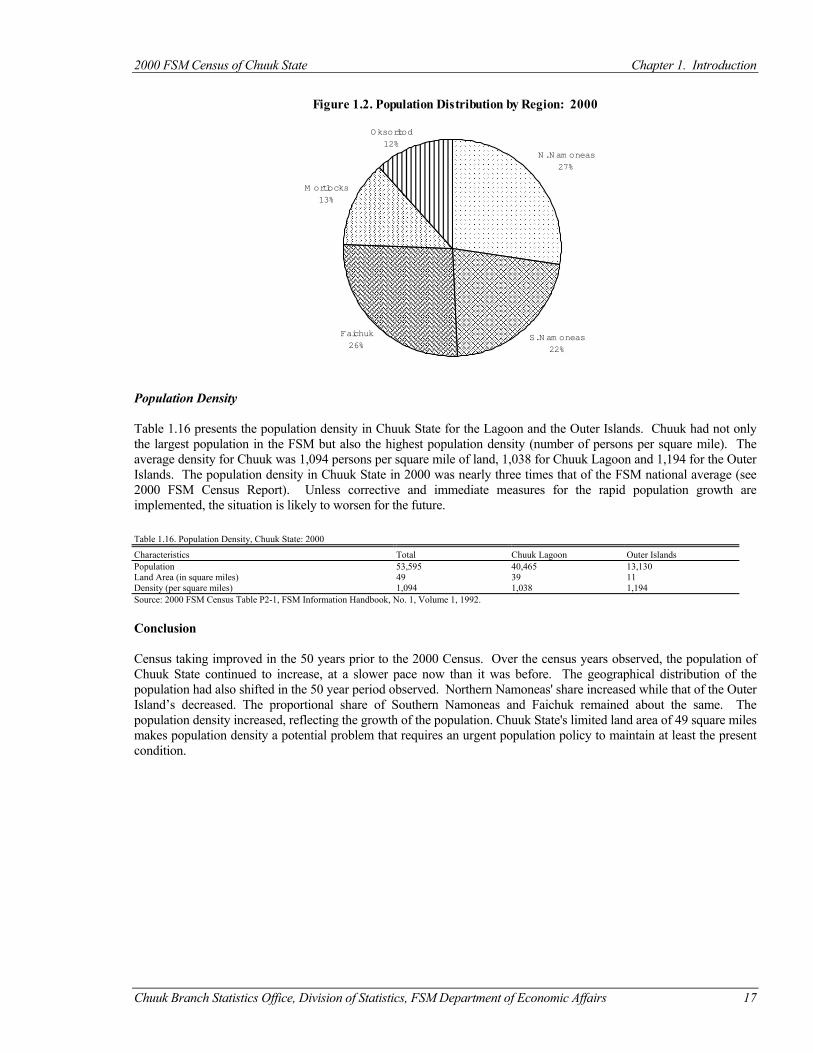
2000 FSM Census of Chuuk State Chapter 1. Introduction
Chuuk Branch Statistics Office, Division of Statistics, FSM Department of Economic Affairs 17
Population Density Table 1.16 presents the population density in Chuuk State for the Lagoon and the Outer Islands. Chuuk had not only the largest population in the FSM but also the highest population density (number of persons per square mile). The average density for Chuuk was 1,094 persons per square mile of land, 1,038 for Chuuk Lagoon and 1,194 for the Outer Islands. The population density in Chuuk State in 2000 was nearly three times that of the FSM national average (see 2000 FSM Census Report). Unless corrective and immediate measures for the rapid population growth are implemented, the situation is likely to worsen for the future. Table 1.16. Population Density, Chuuk State: 2000
Characteristics Total Chuuk Lagoon Outer Islands Population 53,595 40,465 13,130 Land Area (in square miles) 49 39 11 Density (per square miles) 1,094 1,038 1,194 Source: 2000 FSM Census Table P2-1, FSM Information Handbook, No. 1, Volume 1, 1992. Conclusion Census taking improved in the 50 years prior to the 2000 Census. Over the census years observed, the population of Chuuk State continued to increase, at a slower pace now than it was before. The geographical distribution of the population had also shifted in the 50 year period observed. Northern Namoneas' share increased while that of the Outer Island’s decreased. The proportional share of Southern Namoneas and Faichuk remained about the same. The population density increased, reflecting the growth of the population. Chuuk State's limited land area of 49 square miles makes population density a potential problem that requires an urgent population policy to maintain at least the present condition.
���������������������������������������������������������������������������������������������������������������������������������������������������������������������������������������������������������������������������������������������������������������������������������������������������������������������������������������������������������������������������������������������������������������������������������������������������������������������������������������������������������������������������������������������������������������������������������������������������������������������������������������������������������������������������������������������������������������������������������������������������
��������������������������������������������������������������������������������������������������������������������������������������������������������������������������������������������������������������������������������������������������������������������������������������������������������������������������������������������������������������������������������
������������������������������������������������������������������������������������������������������������������������������������������������������������������������������������������������������������������������������������������������������������������������
������������������������������������������������������������������������������������������������������������������������������������������������������������������������������������������������������������������������������������������������
Figure 1.2. Population Distribution by Region: 2000
S. Nam oneas
22%
Faichuk
26%
M ortlocks
13%
N. Nam oneas
27%
Oksoritod
12%

Chuuk Branch Statistics Office, Division of Statistics, FSM Department of Economic Affairs 19
CHAPTER 2 AGE AND SEX STRUCTURE
Introduction The age and sex structure of a population provides basic information necessary for planning and for providing key insights on social and economic characteristics. Age composition helps identify populations for schooling, employment, voting, and retirement. Sex distribution is important for identifying social characteristics, trends in community structure, and the population's economic potential. Data Description Age The 2000 Census obtained information on age from the response to the date of birth question and the age reported in questionnaire items 4a and 4b. Age was in completed years as of April 1, 2000. In cases where age was not reported or clearly appeared to be incorrect, the age was imputed according to relationship, marital status and other related characteristics of other individuals. Sex Information on sex was asked of all persons in the census. In cases where sex was not reported, census personnel tried to determine it from the person’s name. Otherwise, sex was imputed according to relationship, fertility characteristics and other related variables. Limitations and Comparability. There is no limitation to the 2000 age and sex data. Every census conducted in Chuuk collected age and sex data. Analysis of Age and Sex Data Some important measures derived from the age and sex data will be analyzed in this chapter, namely the sex ratio, dependency ratio, intercensal growth rate, and median age. Also, we will look at the changes in the population distribution and age-sex structure and some probable causes for these changes. Population Change and Intercensal Growth One of the most important uses of any census is to throw light on the rate at which the population is growing annually (the annual intercensal growth). The annual intercensal growth rate ranged from 2.7, for period 1973-1989, to 0.1 percent, for period 1994-2000, annually (Table 2.1). The low growth rate between 1994 and 2000 was largely due to the increased emigration in recent years. The annual growth rate from 1973 to 1994 was 2.5 percent. Between 1973 and 2000, the annual growth rate was 2.0, and because of the long period covered, is most certainly a good reflection on average growth over the years. It should be noted that the intercensal growth rate would have been much higher had it not been for the effect of increasing emigration. The annual growth rate varied significantly by age group. Over the three decades before the census, the growth rate for the very young (0 to 4 age groups) declined from 2.0 percent for the period 1973-1980 to -2.5 percent for the 1994-2000 periods. In contrast, the annual growth rate of the very old (75+) age groups increased from 0.6 percent in the first period to 5.1percent in third period, respectively. The difference in growth may be due to the combined effect of a decline in fertility rates (lowering the growth rate of the young) and declining rates in mortality (increasing the proportion of the old age population).
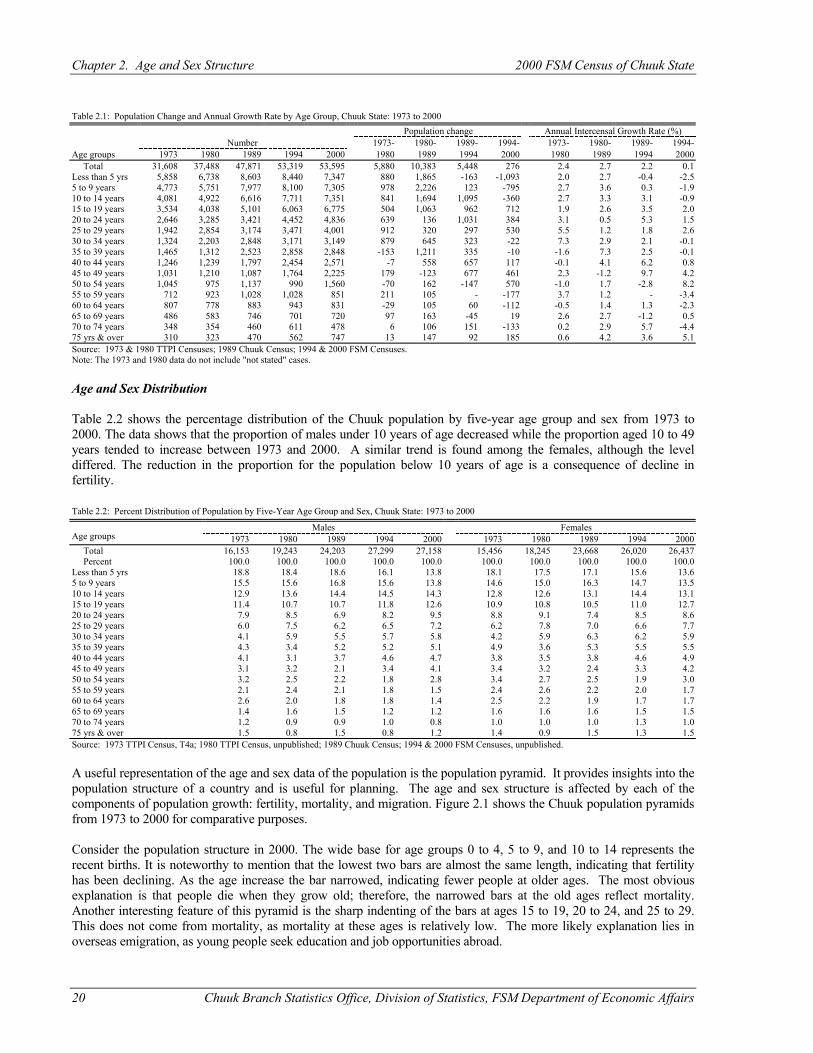
Chapter 2. Age and Sex Structure 2000 FSM Census of Chuuk State
20 Chuuk Branch Statistics Office, Division of Statistics, FSM Department of Economic Affairs
Table 2.1: Population Change and Annual Growth Rate by Age Group, Chuuk State: 1973 to 2000
Population change Annual Intercensal Growth Rate (%) Number 1973- 1980- 1989- 1994- 1973- 1980- 1989- 1994-
Age groups 1973 1980 1989 1994 2000 1980 1989 1994 2000 1980 1989 1994 2000 Total 31,608 37,488 47,871 53,319 53,595 5,880 10,383 5,448 276 2.4 2.7 2.2 0.1 Less than 5 yrs 5,858 6,738 8,603 8,440 7,347 880 1,865 -163 -1,093 2.0 2.7 -0.4 -2.5 5 to 9 years 4,773 5,751 7,977 8,100 7,305 978 2,226 123 -795 2.7 3.6 0.3 -1.9 10 to 14 years 4,081 4,922 6,616 7,711 7,351 841 1,694 1,095 -360 2.7 3.3 3.1 -0.9 15 to 19 years 3,534 4,038 5,101 6,063 6,775 504 1,063 962 712 1.9 2.6 3.5 2.0 20 to 24 years 2,646 3,285 3,421 4,452 4,836 639 136 1,031 384 3.1 0.5 5.3 1.5 25 to 29 years 1,942 2,854 3,174 3,471 4,001 912 320 297 530 5.5 1.2 1.8 2.6 30 to 34 years 1,324 2,203 2,848 3,171 3,149 879 645 323 -22 7.3 2.9 2.1 -0.1 35 to 39 years 1,465 1,312 2,523 2,858 2,848 -153 1,211 335 -10 -1.6 7.3 2.5 -0.1 40 to 44 years 1,246 1,239 1,797 2,454 2,571 -7 558 657 117 -0.1 4.1 6.2 0.8 45 to 49 years 1,031 1,210 1,087 1,764 2,225 179 -123 677 461 2.3 -1.2 9.7 4.2 50 to 54 years 1,045 975 1,137 990 1,560 -70 162 -147 570 -1.0 1.7 -2.8 8.2 55 to 59 years 712 923 1,028 1,028 851 211 105 - -177 3.7 1.2 - -3.4 60 to 64 years 807 778 883 943 831 -29 105 60 -112 -0.5 1.4 1.3 -2.3 65 to 69 years 486 583 746 701 720 97 163 -45 19 2.6 2.7 -1.2 0.5 70 to 74 years 348 354 460 611 478 6 106 151 -133 0.2 2.9 5.7 -4.4 75 yrs & over 310 323 470 562 747 13 147 92 185 0.6 4.2 3.6 5.1 Source: 1973 & 1980 TTPI Censuses; 1989 Chuuk Census; 1994 & 2000 FSM Censuses. Note: The 1973 and 1980 data do not include "not stated" cases. Age and Sex Distribution Table 2.2 shows the percentage distribution of the Chuuk population by five-year age group and sex from 1973 to 2000. The data shows that the proportion of males under 10 years of age decreased while the proportion aged 10 to 49 years tended to increase between 1973 and 2000. A similar trend is found among the females, although the level differed. The reduction in the proportion for the population below 10 years of age is a consequence of decline in fertility. Table 2.2: Percent Distribution of Population by Five-Year Age Group and Sex, Chuuk State: 1973 to 2000
Males Females Age groups 1973 1980 1989 1994 2000 1973 1980 1989 1994 2000 Total 16,153 19,243 24,203 27,299 27,158 15,456 18,245 23,668 26,020 26,437 Percent 100.0 100.0 100.0 100.0 100.0 100.0 100.0 100.0 100.0 100.0 Less than 5 yrs 18.8 18.4 18.6 16.1 13.8 18.1 17.5 17.1 15.6 13.6 5 to 9 years 15.5 15.6 16.8 15.6 13.8 14.6 15.0 16.3 14.7 13.5 10 to 14 years 12.9 13.6 14.4 14.5 14.3 12.8 12.6 13.1 14.4 13.1 15 to 19 years 11.4 10.7 10.7 11.8 12.6 10.9 10.8 10.5 11.0 12.7 20 to 24 years 7.9 8.5 6.9 8.2 9.5 8.8 9.1 7.4 8.5 8.6 25 to 29 years 6.0 7.5 6.2 6.5 7.2 6.2 7.8 7.0 6.6 7.7 30 to 34 years 4.1 5.9 5.5 5.7 5.8 4.2 5.9 6.3 6.2 5.9 35 to 39 years 4.3 3.4 5.2 5.2 5.1 4.9 3.6 5.3 5.5 5.5 40 to 44 years 4.1 3.1 3.7 4.6 4.7 3.8 3.5 3.8 4.6 4.9 45 to 49 years 3.1 3.2 2.1 3.4 4.1 3.4 3.2 2.4 3.3 4.2 50 to 54 years 3.2 2.5 2.2 1.8 2.8 3.4 2.7 2.5 1.9 3.0 55 to 59 years 2.1 2.4 2.1 1.8 1.5 2.4 2.6 2.2 2.0 1.7 60 to 64 years 2.6 2.0 1.8 1.8 1.4 2.5 2.2 1.9 1.7 1.7 65 to 69 years 1.4 1.6 1.5 1.2 1.2 1.6 1.6 1.6 1.5 1.5 70 to 74 years 1.2 0.9 0.9 1.0 0.8 1.0 1.0 1.0 1.3 1.0 75 yrs & over 1.5 0.8 1.5 0.8 1.2 1.4 0.9 1.5 1.3 1.5 Source: 1973 TTPI Census, T4a; 1980 TTPI Census, unpublished; 1989 Chuuk Census; 1994 & 2000 FSM Censuses, unpublished. A useful representation of the age and sex data of the population is the population pyramid. It provides insights into the population structure of a country and is useful for planning. The age and sex structure is affected by each of the components of population growth: fertility, mortality, and migration. Figure 2.1 shows the Chuuk population pyramids from 1973 to 2000 for comparative purposes. Consider the population structure in 2000. The wide base for age groups 0 to 4, 5 to 9, and 10 to 14 represents the recent births. It is noteworthy to mention that the lowest two bars are almost the same length, indicating that fertility has been declining. As the age increase the bar narrowed, indicating fewer people at older ages. The most obvious explanation is that people die when they grow old; therefore, the narrowed bars at the old ages reflect mortality. Another interesting feature of this pyramid is the sharp indenting of the bars at ages 15 to 19, 20 to 24, and 25 to 29. This does not come from mortality, as mortality at these ages is relatively low. The more likely explanation lies in overseas emigration, as young people seek education and job opportunities abroad.
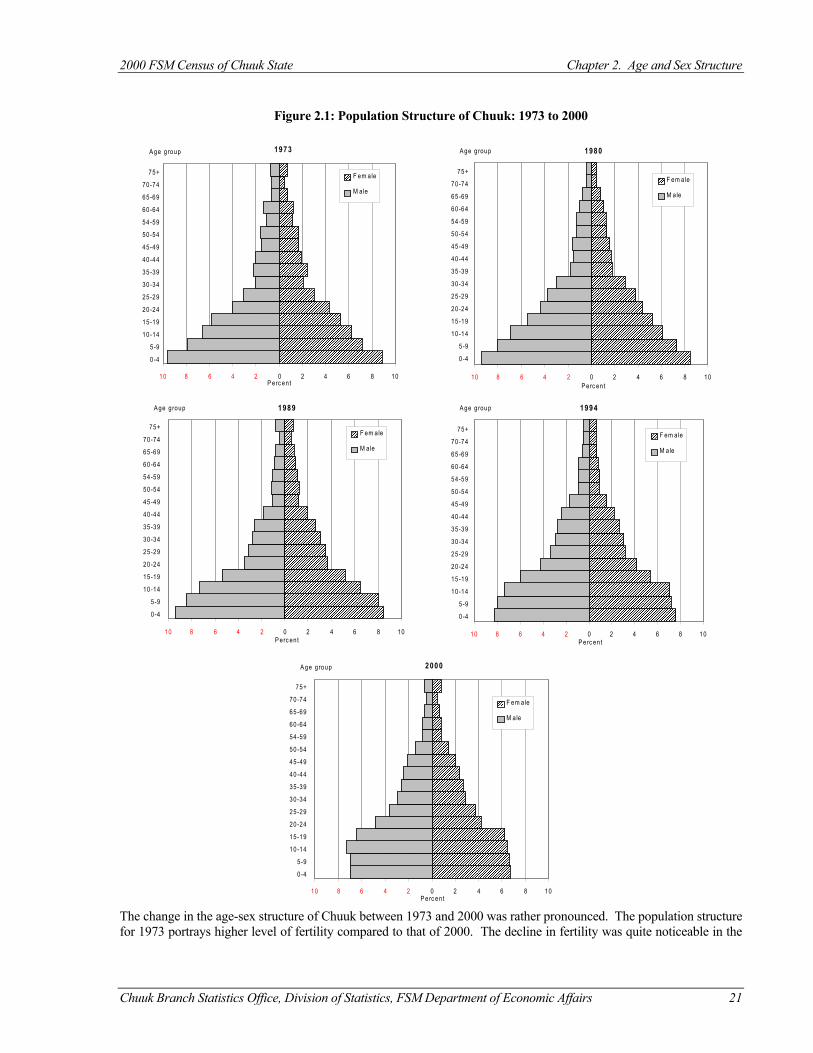
2000 FSM Census of Chuuk State Chapter 2. Age and Sex Structure
Chuuk Branch Statistics Office, Division of Statistics, FSM Department of Economic Affairs 21
Figure 2.1: Population Structure of Chuuk: 1973 to 2000
The change in the age-sex structure of Chuuk between 1973 and 2000 was rather pronounced. The population structure for 1973 portrays higher level of fertility compared to that of 2000. The decline in fertility was quite noticeable in the
�����������������������������������������������������������������������������������������������������������
����������������������������������������������������������
��������������������������������������������������
��������������������������������������������������������������������������
������������������������
������������������
������������������������������������
������������
��������
������
��������
1973
10 8 6 4 2 0 2 4 6 8 10
A ge group
P erc ent
������F em ale
M ale
��������������������������������������������������������������������������������
��������������������������������������������������������������������
����������������������������������������������������������
��������������������������������������������������
�����������������������������������������������������������������������������������������
������������������
������������������
����������������
���������������������������������
����������
������
������
1980
10 8 6 4 2 0 2 4 6 8 10
A ge group
P erc ent
������ F em ale
M ale
����������������������������������������������������������������������������������������������������������������������������������������������������������������������������������
��������������������������������������������������
������������������������������������
����������������������������������
���������������������������������������������������������������
������������
��������������
���������������������������
������
��������
1989
10 8 6 4 2 0 2 4 6 8 10
A ge group
P erc ent
���F em ale
M ale
��������������������������������������������������������������������������������������������������������������������������������������
��������������������������������������������������
����������������������������������������
�����������������������������������������������������������������������
����������������������
����������������
����������
�����������������������
��������
��������
1994
10 8 6 4 2 0 2 4 6 8 10
A ge group
P erc ent
���F em ale
M ale
��������������������������������������������������������������
������������������������������������������������������������������������������������������������������������������������������������������������������
����������������������������������������
������������������������������������
���������������������������������������������������������������
��������������������
��������������
��������������������
������
��������
2000
10 8 6 4 2 0 2 4 6 8 10
A ge group
P erc ent
���F em ale
M ale
75+
70-74
65-69
60-64
54-59
50-54
45-49
40-44
35-39
30-34
25-29
20-24
15-19
10-14
5-9
0-4
75+
70-74
65-69
60-64
54-59
50-54
45-49
40-44
35-39
30-34
25-29
20-24
15-19
10-14
5-9
0-4
75+
70-74
65-69
60-64
54-59
50-54
45-49
40-44
35-39
30-34
25-29
20-24
15-19
10-14
5-9
0-4
75+
70-74
65-69
60-64
54-59
50-54
45-49
40-44
35-39
30-34
25-29
20-24
15-19
10-14
5-9
0-4
75+
70-74
65-69
60-64
54-59
50-54
45-49
40-44
35-39
30-34
25-29
20-24
15-19
10-14
5-9
0-4
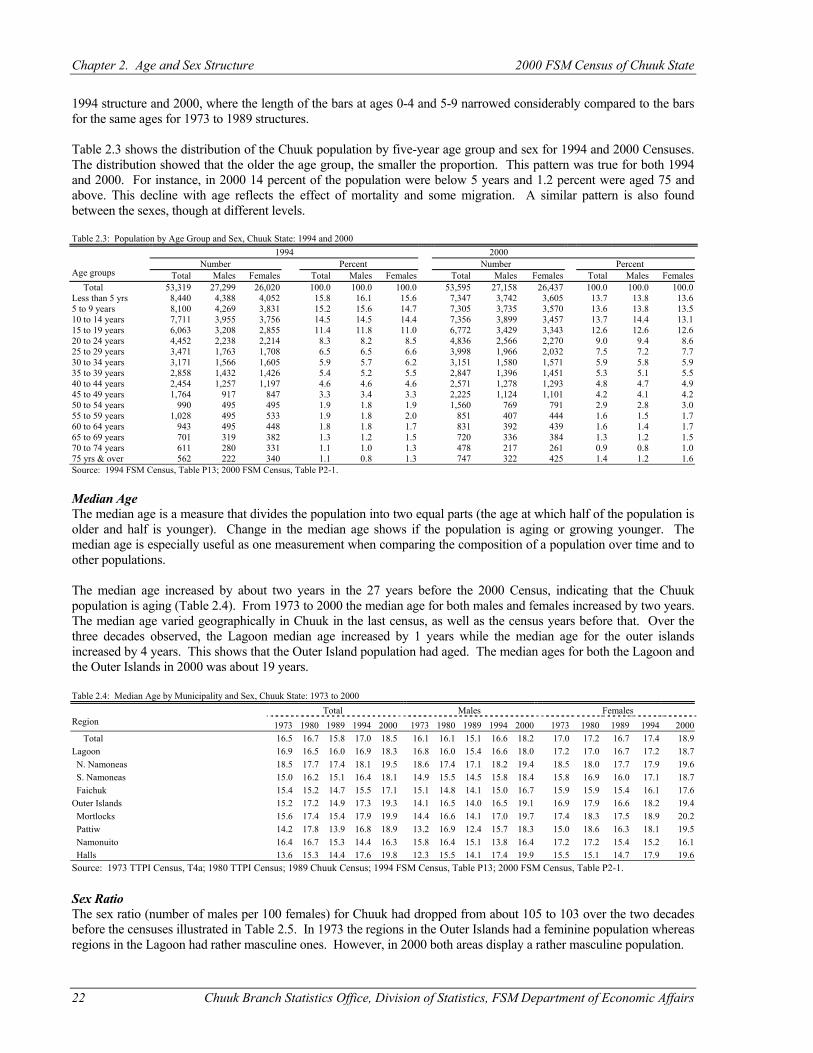
Chapter 2. Age and Sex Structure 2000 FSM Census of Chuuk State
22 Chuuk Branch Statistics Office, Division of Statistics, FSM Department of Economic Affairs
1994 structure and 2000, where the length of the bars at ages 0-4 and 5-9 narrowed considerably compared to the bars for the same ages for 1973 to 1989 structures. Table 2.3 shows the distribution of the Chuuk population by five-year age group and sex for 1994 and 2000 Censuses. The distribution showed that the older the age group, the smaller the proportion. This pattern was true for both 1994 and 2000. For instance, in 2000 14 percent of the population were below 5 years and 1.2 percent were aged 75 and above. This decline with age reflects the effect of mortality and some migration. A similar pattern is also found between the sexes, though at different levels. Table 2.3: Population by Age Group and Sex, Chuuk State: 1994 and 2000
1994 2000 Number Percent Number Percent
Age groups Total Males Females Total Males Females Total Males Females Total Males Females Total 53,319 27,299 26,020 100.0 100.0 100.0 53,595 27,158 26,437 100.0 100.0 100.0 Less than 5 yrs 8,440 4,388 4,052 15.8 16.1 15.6 7,347 3,742 3,605 13.7 13.8 13.6 5 to 9 years 8,100 4,269 3,831 15.2 15.6 14.7 7,305 3,735 3,570 13.6 13.8 13.5 10 to 14 years 7,711 3,955 3,756 14.5 14.5 14.4 7,356 3,899 3,457 13.7 14.4 13.1 15 to 19 years 6,063 3,208 2,855 11.4 11.8 11.0 6,772 3,429 3,343 12.6 12.6 12.6 20 to 24 years 4,452 2,238 2,214 8.3 8.2 8.5 4,836 2,566 2,270 9.0 9.4 8.6 25 to 29 years 3,471 1,763 1,708 6.5 6.5 6.6 3,998 1,966 2,032 7.5 7.2 7.7 30 to 34 years 3,171 1,566 1,605 5.9 5.7 6.2 3,151 1,580 1,571 5.9 5.8 5.9 35 to 39 years 2,858 1,432 1,426 5.4 5.2 5.5 2,847 1,396 1,451 5.3 5.1 5.5 40 to 44 years 2,454 1,257 1,197 4.6 4.6 4.6 2,571 1,278 1,293 4.8 4.7 4.9 45 to 49 years 1,764 917 847 3.3 3.4 3.3 2,225 1,124 1,101 4.2 4.1 4.2 50 to 54 years 990 495 495 1.9 1.8 1.9 1,560 769 791 2.9 2.8 3.0 55 to 59 years 1,028 495 533 1.9 1.8 2.0 851 407 444 1.6 1.5 1.7 60 to 64 years 943 495 448 1.8 1.8 1.7 831 392 439 1.6 1.4 1.7 65 to 69 years 701 319 382 1.3 1.2 1.5 720 336 384 1.3 1.2 1.5 70 to 74 years 611 280 331 1.1 1.0 1.3 478 217 261 0.9 0.8 1.0 75 yrs & over 562 222 340 1.1 0.8 1.3 747 322 425 1.4 1.2 1.6 Source: 1994 FSM Census, Table P13; 2000 FSM Census, Table P2-1. Median Age The median age is a measure that divides the population into two equal parts (the age at which half of the population is older and half is younger). Change in the median age shows if the population is aging or growing younger. The median age is especially useful as one measurement when comparing the composition of a population over time and to other populations. The median age increased by about two years in the 27 years before the 2000 Census, indicating that the Chuuk population is aging (Table 2.4). From 1973 to 2000 the median age for both males and females increased by two years. The median age varied geographically in Chuuk in the last census, as well as the census years before that. Over the three decades observed, the Lagoon median age increased by 1 years while the median age for the outer islands increased by 4 years. This shows that the Outer Island population had aged. The median ages for both the Lagoon and the Outer Islands in 2000 was about 19 years. Table 2.4: Median Age by Municipality and Sex, Chuuk State: 1973 to 2000
Total Males Females Region 1973 1980 1989 1994 2000 1973 1980 1989 1994 2000 1973 1980 1989 1994 2000 Total 16.5 16.7 15.8 17.0 18.5 16.1 16.1 15.1 16.6 18.2 17.0 17.2 16.7 17.4 18.9 Lagoon 16.9 16.5 16.0 16.9 18.3 16.8 16.0 15.4 16.6 18.0 17.2 17.0 16.7 17.2 18.7 N. Namoneas 18.5 17.7 17.4 18.1 19.5 18.6 17.4 17.1 18.2 19.4 18.5 18.0 17.7 17.9 19.6 S. Namoneas 15.0 16.2 15.1 16.4 18.1 14.9 15.5 14.5 15.8 18.4 15.8 16.9 16.0 17.1 18.7 Faichuk 15.4 15.2 14.7 15.5 17.1 15.1 14.8 14.1 15.0 16.7 15.9 15.9 15.4 16.1 17.6 Outer Islands 15.2 17.2 14.9 17.3 19.3 14.1 16.5 14.0 16.5 19.1 16.9 17.9 16.6 18.2 19.4 Mortlocks 15.6 17.4 15.4 17.9 19.9 14.4 16.6 14.1 17.0 19.7 17.4 18.3 17.5 18.9 20.2 Pattiw 14.2 17.8 13.9 16.8 18.9 13.2 16.9 12.4 15.7 18.3 15.0 18.6 16.3 18.1 19.5 Namonuito 16.4 16.7 15.3 14.4 16.3 15.8 16.4 15.1 13.8 16.4 17.2 17.2 15.4 15.2 16.1 Halls 13.6 15.3 14.4 17.6 19.8 12.3 15.5 14.1 17.4 19.9 15.5 15.1 14.7 17.9 19.6 Source: 1973 TTPI Census, T4a; 1980 TTPI Census; 1989 Chuuk Census; 1994 FSM Census, Table P13; 2000 FSM Census, Table P2-1.
Sex Ratio The sex ratio (number of males per 100 females) for Chuuk had dropped from about 105 to 103 over the two decades before the censuses illustrated in Table 2.5. In 1973 the regions in the Outer Islands had a feminine population whereas regions in the Lagoon had rather masculine ones. However, in 2000 both areas display a rather masculine population.
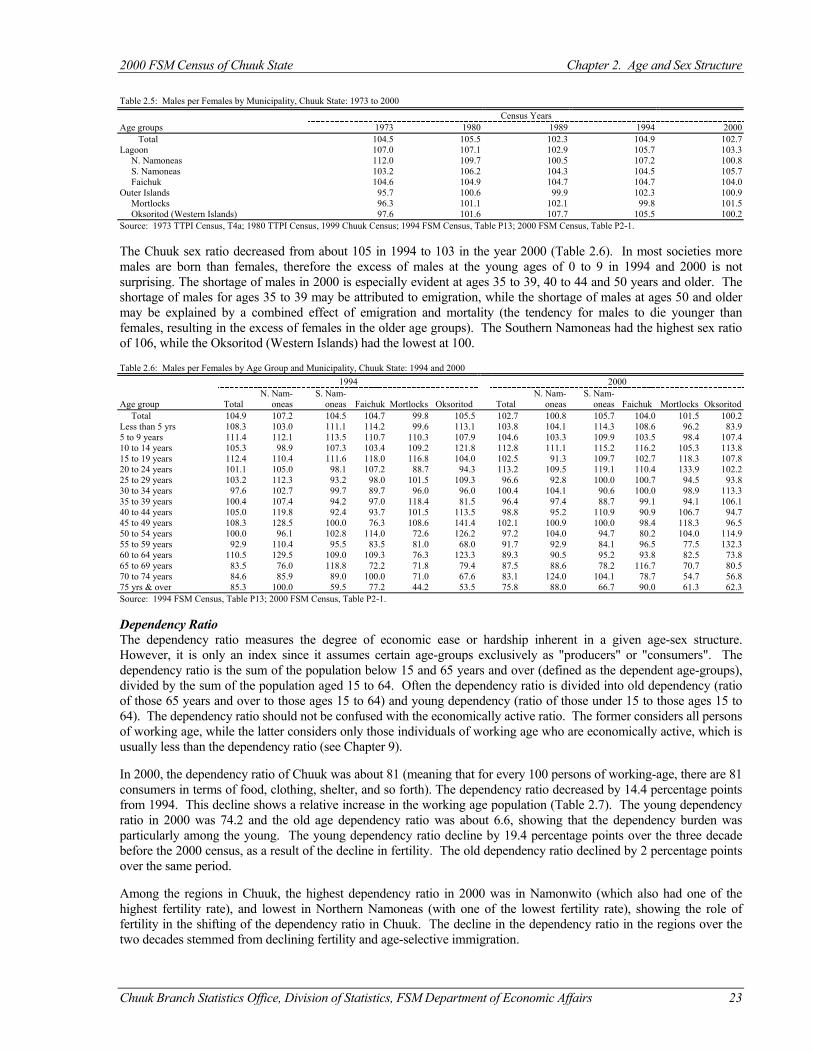
2000 FSM Census of Chuuk State Chapter 2. Age and Sex Structure
Chuuk Branch Statistics Office, Division of Statistics, FSM Department of Economic Affairs 23
Table 2.5: Males per Females by Municipality, Chuuk State: 1973 to 2000 Census Years
Age groups 1973 1980 1989 1994 2000 Total 104.5 105.5 102.3 104.9 102.7 Lagoon 107.0 107.1 102.9 105.7 103.3 N. Namoneas 112.0 109.7 100.5 107.2 100.8 S. Namoneas 103.2 106.2 104.3 104.5 105.7 Faichuk 104.6 104.9 104.7 104.7 104.0 Outer Islands 95.7 100.6 99.9 102.3 100.9 Mortlocks 96.3 101.1 102.1 99.8 101.5 Oksoritod (Western Islands) 97.6 101.6 107.7 105.5 100.2 Source: 1973 TTPI Census, T4a; 1980 TTPI Census, 1999 Chuuk Census; 1994 FSM Census, Table P13; 2000 FSM Census, Table P2-1. The Chuuk sex ratio decreased from about 105 in 1994 to 103 in the year 2000 (Table 2.6). In most societies more males are born than females, therefore the excess of males at the young ages of 0 to 9 in 1994 and 2000 is not surprising. The shortage of males in 2000 is especially evident at ages 35 to 39, 40 to 44 and 50 years and older. The shortage of males for ages 35 to 39 may be attributed to emigration, while the shortage of males at ages 50 and older may be explained by a combined effect of emigration and mortality (the tendency for males to die younger than females, resulting in the excess of females in the older age groups). The Southern Namoneas had the highest sex ratio of 106, while the Oksoritod (Western Islands) had the lowest at 100. Table 2.6: Males per Females by Age Group and Municipality, Chuuk State: 1994 and 2000 1994 2000
Age group Total N. Nam-
oneas S. Nam-
oneas Faichuk Mortlocks Oksoritod Total N. Nam-
oneas S. Nam-
oneas Faichuk Mortlocks Oksoritod Total 104.9 107.2 104.5 104.7 99.8 105.5 102.7 100.8 105.7 104.0 101.5 100.2 Less than 5 yrs 108.3 103.0 111.1 114.2 99.6 113.1 103.8 104.1 114.3 108.6 96.2 83.9 5 to 9 years 111.4 112.1 113.5 110.7 110.3 107.9 104.6 103.3 109.9 103.5 98.4 107.4 10 to 14 years 105.3 98.9 107.3 103.4 109.2 121.8 112.8 111.1 115.2 116.2 105.3 113.8 15 to 19 years 112.4 110.4 111.6 118.0 116.8 104.0 102.5 91.3 109.7 102.7 118.3 107.8 20 to 24 years 101.1 105.0 98.1 107.2 88.7 94.3 113.2 109.5 119.1 110.4 133.9 102.2 25 to 29 years 103.2 112.3 93.2 98.0 101.5 109.3 96.6 92.8 100.0 100.7 94.5 93.8 30 to 34 years 97.6 102.7 99.7 89.7 96.0 96.0 100.4 104.1 90.6 100.0 98.9 113.3 35 to 39 years 100.4 107.4 94.2 97.0 118.4 81.5 96.4 97.4 88.7 99.1 94.1 106.1 40 to 44 years 105.0 119.8 92.4 93.7 101.5 113.5 98.8 95.2 110.9 90.9 106.7 94.7 45 to 49 years 108.3 128.5 100.0 76.3 108.6 141.4 102.1 100.9 100.0 98.4 118.3 96.5 50 to 54 years 100.0 96.1 102.8 114.0 72.6 126.2 97.2 104.0 94.7 80.2 104.0 114.9 55 to 59 years 92.9 110.4 95.5 83.5 81.0 68.0 91.7 92.9 84.1 96.5 77.5 132.3 60 to 64 years 110.5 129.5 109.0 109.3 76.3 123.3 89.3 90.5 95.2 93.8 82.5 73.8 65 to 69 years 83.5 76.0 118.8 72.2 71.8 79.4 87.5 88.6 78.2 116.7 70.7 80.5 70 to 74 years 84.6 85.9 89.0 100.0 71.0 67.6 83.1 124.0 104.1 78.7 54.7 56.8 75 yrs & over 85.3 100.0 59.5 77.2 44.2 53.5 75.8 88.0 66.7 90.0 61.3 62.3 Source: 1994 FSM Census, Table P13; 2000 FSM Census, Table P2-1. Dependency Ratio The dependency ratio measures the degree of economic ease or hardship inherent in a given age-sex structure. However, it is only an index since it assumes certain age-groups exclusively as "producers" or "consumers". The dependency ratio is the sum of the population below 15 and 65 years and over (defined as the dependent age-groups), divided by the sum of the population aged 15 to 64. Often the dependency ratio is divided into old dependency (ratio of those 65 years and over to those ages 15 to 64) and young dependency (ratio of those under 15 to those ages 15 to 64). The dependency ratio should not be confused with the economically active ratio. The former considers all persons of working age, while the latter considers only those individuals of working age who are economically active, which is usually less than the dependency ratio (see Chapter 9). In 2000, the dependency ratio of Chuuk was about 81 (meaning that for every 100 persons of working-age, there are 81 consumers in terms of food, clothing, shelter, and so forth). The dependency ratio decreased by 14.4 percentage points from 1994. This decline shows a relative increase in the working age population (Table 2.7). The young dependency ratio in 2000 was 74.2 and the old age dependency ratio was about 6.6, showing that the dependency burden was particularly among the young. The young dependency ratio decline by 19.4 percentage points over the three decade before the 2000 census, as a result of the decline in fertility. The old dependency ratio declined by 2 percentage points over the same period. Among the regions in Chuuk, the highest dependency ratio in 2000 was in Namonwito (which also had one of the highest fertility rate), and lowest in Northern Namoneas (with one of the lowest fertility rate), showing the role of fertility in the shifting of the dependency ratio in Chuuk. The decline in the dependency ratio in the regions over the two decades stemmed from declining fertility and age-selective immigration.
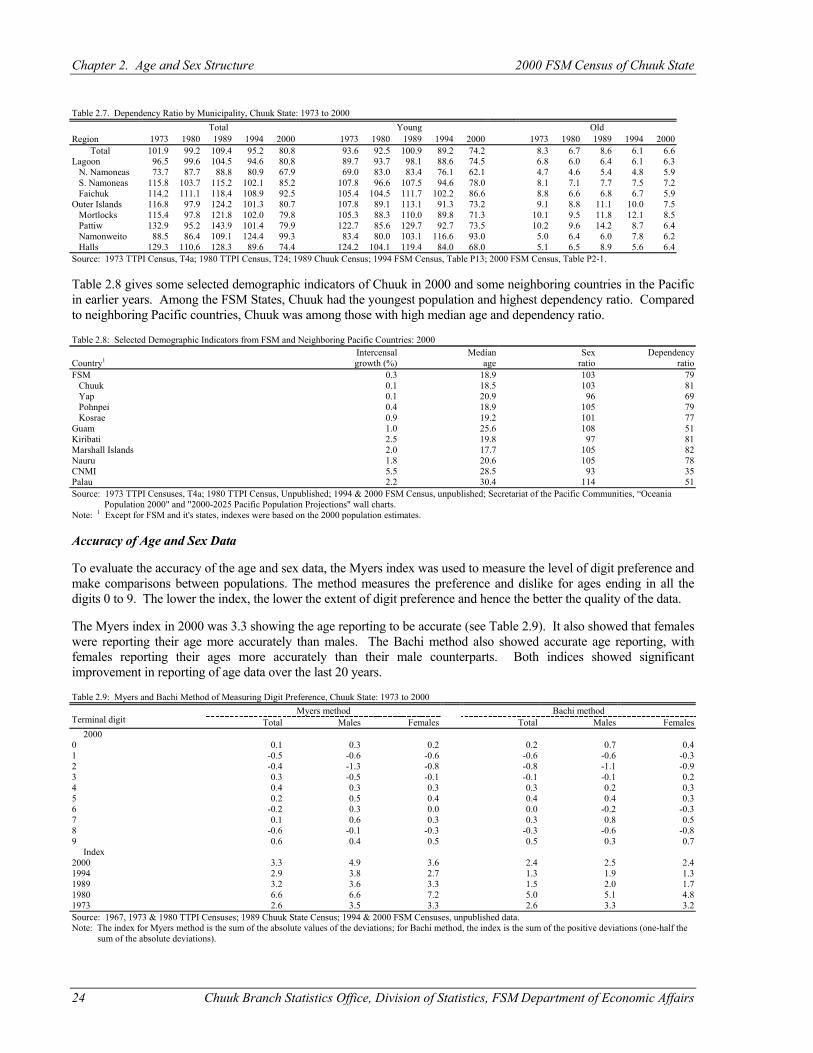
Chapter 2. Age and Sex Structure 2000 FSM Census of Chuuk State
24 Chuuk Branch Statistics Office, Division of Statistics, FSM Department of Economic Affairs
Table 2.7. Dependency Ratio by Municipality, Chuuk State: 1973 to 2000 Total Young Old Region 1973 1980 1989 1994 2000 1973 1980 1989 1994 2000 1973 1980 1989 1994 2000 Total 101.9 99.2 109.4 95.2 80.8 93.6 92.5 100.9 89.2 74.2 8.3 6.7 8.6 6.1 6.6 Lagoon 96.5 99.6 104.5 94.6 80.8 89.7 93.7 98.1 88.6 74.5 6.8 6.0 6.4 6.1 6.3 N. Namoneas 73.7 87.7 88.8 80.9 67.9 69.0 83.0 83.4 76.1 62.1 4.7 4.6 5.4 4.8 5.9 S. Namoneas 115.8 103.7 115.2 102.1 85.2 107.8 96.6 107.5 94.6 78.0 8.1 7.1 7.7 7.5 7.2 Faichuk 114.2 111.1 118.4 108.9 92.5 105.4 104.5 111.7 102.2 86.6 8.8 6.6 6.8 6.7 5.9 Outer Islands 116.8 97.9 124.2 101.3 80.7 107.8 89.1 113.1 91.3 73.2 9.1 8.8 11.1 10.0 7.5 Mortlocks 115.4 97.8 121.8 102.0 79.8 105.3 88.3 110.0 89.8 71.3 10.1 9.5 11.8 12.1 8.5 Pattiw 132.9 95.2 143.9 101.4 79.9 122.7 85.6 129.7 92.7 73.5 10.2 9.6 14.2 8.7 6.4 Namonweito 88.5 86.4 109.1 124.4 99.3 83.4 80.0 103.1 116.6 93.0 5.0 6.4 6.0 7.8 6.2 Halls 129.3 110.6 128.3 89.6 74.4 124.2 104.1 119.4 84.0 68.0 5.1 6.5 8.9 5.6 6.4 Source: 1973 TTPI Census, T4a; 1980 TTPI Census, T24; 1989 Chuuk Census; 1994 FSM Census, Table P13; 2000 FSM Census, Table P2-1. Table 2.8 gives some selected demographic indicators of Chuuk in 2000 and some neighboring countries in the Pacific in earlier years. Among the FSM States, Chuuk had the youngest population and highest dependency ratio. Compared to neighboring Pacific countries, Chuuk was among those with high median age and dependency ratio. Table 2.8: Selected Demographic Indicators from FSM and Neighboring Pacific Countries: 2000
Intercensal Median Sex Dependency Country1 growth (%) age ratio ratio FSM 0.3 18.9 103 79 Chuuk 0.1 18.5 103 81 Yap 0.1 20.9 96 69 Pohnpei 0.4 18.9 105 79 Kosrae 0.9 19.2 101 77 Guam 1.0 25.6 108 51 Kiribati 2.5 19.8 97 81 Marshall Islands 2.0 17.7 105 82 Nauru 1.8 20.6 105 78 CNMI 5.5 28.5 93 35 Palau 2.2 30.4 114 51 Source: 1973 TTPI Censuses, T4a; 1980 TTPI Census, Unpublished; 1994 & 2000 FSM Census, unpublished; Secretariat of the Pacific Communities, “Oceania Population 2000" and "2000-2025 Pacific Population Projections" wall charts. Note: 1 Except for FSM and it's states, indexes were based on the 2000 population estimates. Accuracy of Age and Sex Data To evaluate the accuracy of the age and sex data, the Myers index was used to measure the level of digit preference and make comparisons between populations. The method measures the preference and dislike for ages ending in all the digits 0 to 9. The lower the index, the lower the extent of digit preference and hence the better the quality of the data. The Myers index in 2000 was 3.3 showing the age reporting to be accurate (see Table 2.9). It also showed that females were reporting their age more accurately than males. The Bachi method also showed accurate age reporting, with females reporting their ages more accurately than their male counterparts. Both indices showed significant improvement in reporting of age data over the last 20 years. Table 2.9: Myers and Bachi Method of Measuring Digit Preference, Chuuk State: 1973 to 2000
Myers method Bachi method Terminal digit Total Males Females Total Males Females 2000 0 0.1 0.3 0.2 0.2 0.7 0.4 1 -0.5 -0.6 -0.6 -0.6 -0.6 -0.3 2 -0.4 -1.3 -0.8 -0.8 -1.1 -0.9 3 0.3 -0.5 -0.1 -0.1 -0.1 0.2 4 0.4 0.3 0.3 0.3 0.2 0.3 5 0.2 0.5 0.4 0.4 0.4 0.3 6 -0.2 0.3 0.0 0.0 -0.2 -0.3 7 0.1 0.6 0.3 0.3 0.8 0.5 8 -0.6 -0.1 -0.3 -0.3 -0.6 -0.8 9 0.6 0.4 0.5 0.5 0.3 0.7 Index 2000 3.3 4.9 3.6 2.4 2.5 2.4 1994 2.9 3.8 2.7 1.3 1.9 1.3 1989 3.2 3.6 3.3 1.5 2.0 1.7 1980 6.6 6.6 7.2 5.0 5.1 4.8 1973 2.6 3.5 3.3 2.6 3.3 3.2 Source: 1967, 1973 & 1980 TTPI Censuses; 1989 Chuuk State Census; 1994 & 2000 FSM Censuses, unpublished data. Note: The index for Myers method is the sum of the absolute values of the deviations; for Bachi method, the index is the sum of the positive deviations (one-half the sum of the absolute deviations).
2000 FSM Census of Chuuk State Chapter 2. Age and Sex Structure
Chuuk Branch Statistics Office, Division of Statistics, FSM Department of Economic Affairs 25
Conclusion The age and sex composition of Chuuk changed over the three decades before the census. These shifts in the age-sex structure have important implications for future planning. The annual growth rate of Chuuk for the period 1994 to 2000 was 0.1 percent, declining from 2.2 percent for the previous period, 1989 to 1994. This decline is attributed mostly to a decline in fertility and increasing emigration. The sex ratio declined to about 103 in 2000, a reflection of the tendency for males to migrate and die younger than females. The trend of the sex ratio varied among the regions mainly because of different migration patterns. The Chuuk population slowly aged over the three decades. The Chuuk’s median age in 2000 was at about 19 years, two years older than the 1994 Census and about four years older than the 1973 Census. This increase in the median age certainly came from the combination of declining fertility (females having fewer children), low mortality (people dying at an older age than before), and selective migration (immigration of working age persons). The median age also increased in the regions (Table 2.5). The dependency ratio decreased from about 101 in 1973 to about 81 in 2000. This decrease stemmed from declining fertility and age-selective immigration.

Chuuk Branch Statistics Office, Division of Statistics, FSM Department of Economic Affairs 27
CHAPTER 3 HOUSEHOLDS, FAMILIES, AND MARITAL STATUS
Introduction This chapter presents a summary of analysis on size and composition of households and families in the State of Chuuk. The household and family structures in Chuuk, in most cases, are similar. The determination factor for household is sharing meals by a group of people living together. However, for family, the determining factor is the relationship by blood, marriage, or adoption. In Chuuk, most people live together because they are related. Households with unrelated members are usually found in the town centers where unrelated people may share housing for financial or other reasons. The data from the 1973, 1989, 1994 and the 2000 Censuses are used in this chapter to examine the changes in household and family structure in Chuuk after nearly three decades. Since marital status affects the household and family structure, it is included in this chapter. As married couples tend to have their own family, more marriages are likely to increase the number of households and families in the nation. The data on marital status provided in this chapter examine the change in the marital status and the effects on the demographic and other socio-cultural patterns. Definitions Household Type and Relationship Question 2 on the 2000 Census questionnaire asked for relationship of every household member to the householder. The major relationships were: householder, husband/wife, natural son/daughter, adopted son/daughter, brother/sister, father/mother, other relative, and non-relative. The “other relative” category was later re-coded to include son/daughter in-law, father/mother in-law, brother/sister in-law, niece/nephew, grandparent, uncle/aunt, and cousin. Household was defined during the census as a person or a group of people living together in a housing unit and sharing meals together. These people did not need to be related but as long as they shared their meals, they were considered a household for census purposes. A housing unit was a house, apartment, mobile home, group of rooms, or single room occupied as a separate living quarter. A unit may have had more than one household if the occupants did not share their meals together. There were two types of living quarters used in the census; regular households and group quarters. Regular households were those where the occupants may have been a single family (one person living alone) two or more families living together, or any other group of related or unrelated persons who shared living arrangements. Group quarters were those places where people either lived or stayed (during the time of the census) other than their usual house or apartment such as schools, hotels or motels, hospitals, prisons, etc. Persons per household was obtained by dividing the number of persons in households by the number of households (or householders). Persons per family was obtained by dividing the number of persons in family households (households where two or more members were related to the householder) by the number of family households. Householder and relationship to householder were defined as follows: Householder -- the person (or one of the persons) in whose name the home was owned, bought, or rented and who was listed as person number 1 of the household. If there was no such person in the household, any adult household member 15 years old and over could be designated as the householder. Husband/wife -- a person married to and living with a householder. This category included persons in formal marriages, as well as custom marriages. Natural-born son/daughter -- Son or daughter of the householder by birth, regardless of his or her age or marital status. Adopted son/daughter -- sons or daughters of the householder by legal adoption, regardless of the age of the child.
Chapter 3. Households, Families, and Marital Status 2000 FSM Census of Chuuk State
28 Chuuk Branch Statistics Office, Division of Statistics, FSM Department of Economic Affairs
Brother/sister -- the brother or sister of the householder, including stepbrothers and stepsisters as well as adopted brothers and sisters. Father/mother -- parents of the householder by birth, stepparents, and parents of adoption excluding parents-in-law. Other relative -- a person who was related to the householder by blood, marriage, or adoption. ( In-laws, nephews, aunts, cousins, grand parents and so forth ). Non-relative -- a person who was not related by blood, marriage, or adoption to the householder or who could not be described by the categories given. Marital Status Question 5 asked for marital status of all residents. However, data were tabulated for persons aged 15 years and older. Marital status referred to the status at the time of enumeration. Traditional marriages were classified under now married. The five marital categories were: never married: now married, widowed, divorced, and separated. They are defined below: Never married -- persons who never had been married, including persons whose only marriages were annulled. Now married -- all persons whose current marriage had not ended by widowhood or divorce. Widowed -- person whose spouse had died. Divorced -- person who had legally divorced his or her spouse. Separated --persons legally separated or otherwise absent from their spouse because of marital discord. Included were persons who had been deserted or who had parted because they no longer wanted to live together but who had not obtained a divorce. When a person did not report his or her marital status, the Division of Statistics imputed the information according to the relationship to the householder and sex and age of the person. Limitations and comparability. The results from the 1973, 1989, 1994 Censuses were used in the 2000 FSM Census of Chuuk State analysis because the data are comparable. For the 2000 FSM Census, the definition used for Group Quarters was the same as that in the 1994 Census. The 2000 Census of Chuuk State classified the following types of other group quarters as institutional rather than non-institutional group quarters: wards in general hospitals for patients who had no usual home elsewhere. These changes should not significantly affect the comparability of data with earlier censuses because of the relatively small number of persons involved, except for that of 1973 or earlier censuses. As in 1980, 10 or more unrelated persons living together were classified as living in non-institutional group quarters. In 1973 or earlier census, the criterion was six or more unrelated persons. Therefore, the 1973 Census result on number of household per housing unit was not directly comparable to the recent census. Several changes also occurred in the identification of specific types of group quarters. The 1994 and 2000 FSM Censuses of Chuuk State identified separately the following types of correctional institutions: jails and police lockups. The 1994 and 2000 FSM Censuses of Chuuk classified workers' dormitories as group quarters regardless of the number of persons sharing the dorm. In 1980, 10 or more unrelated persons had to share the dorm for it to be classified as group quarters. In 1960, data on persons in military barracks were shown only for men; in subsequent censuses, they included both men and women. In the 1994 and 2000 FSM Censuses of Chuuk data products, the phrase "inmates of institutions" was changed to "institutionalized persons." Also, persons living in non-institutional group quarters were referred to as "other persons in-group quarters," and the phrase "staff residents" was used for staff living in institutions.
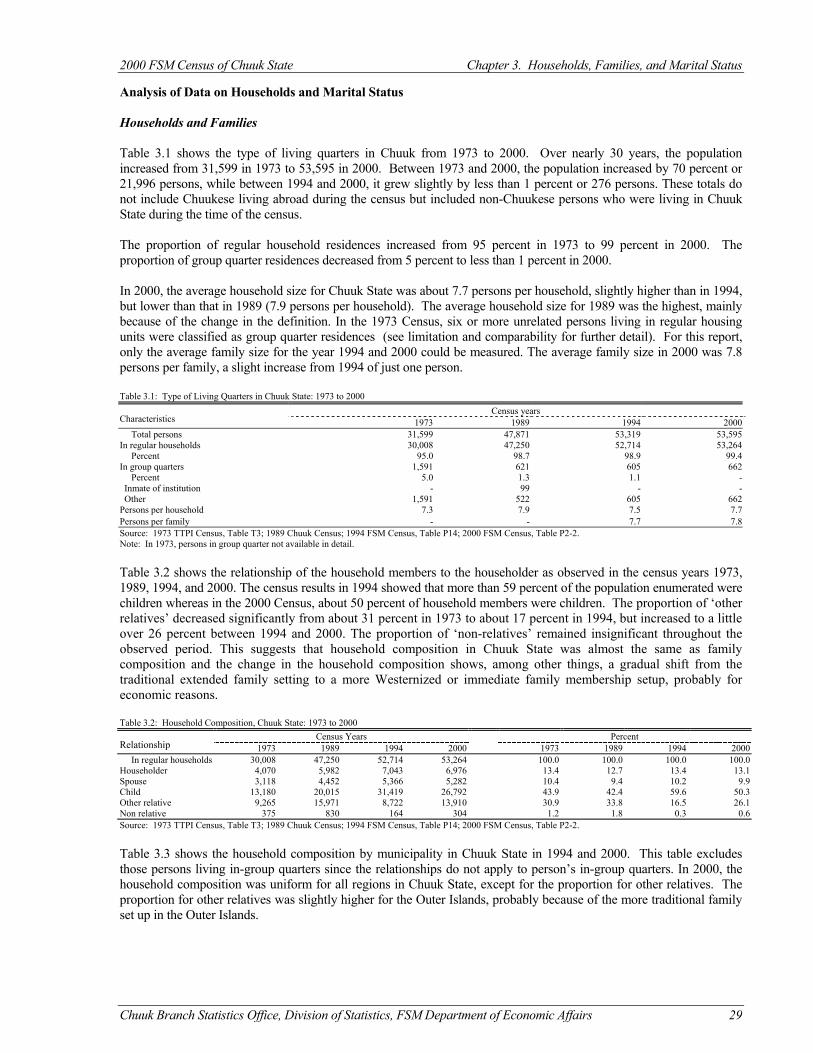
2000 FSM Census of Chuuk State Chapter 3. Households, Families, and Marital Status
Chuuk Branch Statistics Office, Division of Statistics, FSM Department of Economic Affairs 29
Analysis of Data on Households and Marital Status Households and Families Table 3.1 shows the type of living quarters in Chuuk from 1973 to 2000. Over nearly 30 years, the population increased from 31,599 in 1973 to 53,595 in 2000. Between 1973 and 2000, the population increased by 70 percent or 21,996 persons, while between 1994 and 2000, it grew slightly by less than 1 percent or 276 persons. These totals do not include Chuukese living abroad during the census but included non-Chuukese persons who were living in Chuuk State during the time of the census. The proportion of regular household residences increased from 95 percent in 1973 to 99 percent in 2000. The proportion of group quarter residences decreased from 5 percent to less than 1 percent in 2000. In 2000, the average household size for Chuuk State was about 7.7 persons per household, slightly higher than in 1994, but lower than that in 1989 (7.9 persons per household). The average household size for 1989 was the highest, mainly because of the change in the definition. In the 1973 Census, six or more unrelated persons living in regular housing units were classified as group quarter residences (see limitation and comparability for further detail). For this report, only the average family size for the year 1994 and 2000 could be measured. The average family size in 2000 was 7.8 persons per family, a slight increase from 1994 of just one person. Table 3.1: Type of Living Quarters in Chuuk State: 1973 to 2000
Census years Characteristics 1973 1989 1994 2000 Total persons 31,599 47,871 53,319 53,595 In regular households 30,008 47,250 52,714 53,264 Percent 95.0 98.7 98.9 99.4 In group quarters 1,591 621 605 662 Percent 5.0 1.3 1.1 - Inmate of institution - 99 - - Other 1,591 522 605 662 Persons per household 7.3 7.9 7.5 7.7 Persons per family - - 7.7 7.8 Source: 1973 TTPI Census, Table T3; 1989 Chuuk Census; 1994 FSM Census, Table P14; 2000 FSM Census, Table P2-2. Note: In 1973, persons in group quarter not available in detail. Table 3.2 shows the relationship of the household members to the householder as observed in the census years 1973, 1989, 1994, and 2000. The census results in 1994 showed that more than 59 percent of the population enumerated were children whereas in the 2000 Census, about 50 percent of household members were children. The proportion of ‘other relatives’ decreased significantly from about 31 percent in 1973 to about 17 percent in 1994, but increased to a little over 26 percent between 1994 and 2000. The proportion of ‘non-relatives’ remained insignificant throughout the observed period. This suggests that household composition in Chuuk State was almost the same as family composition and the change in the household composition shows, among other things, a gradual shift from the traditional extended family setting to a more Westernized or immediate family membership setup, probably for economic reasons. Table 3.2: Household Composition, Chuuk State: 1973 to 2000
Census Years Percent Relationship 1973 1989 1994 2000 1973 1989 1994 2000 In regular households 30,008 47,250 52,714 53,264 100.0 100.0 100.0 100.0 Householder 4,070 5,982 7,043 6,976 13.4 12.7 13.4 13.1 Spouse 3,118 4,452 5,366 5,282 10.4 9.4 10.2 9.9 Child 13,180 20,015 31,419 26,792 43.9 42.4 59.6 50.3 Other relative 9,265 15,971 8,722 13,910 30.9 33.8 16.5 26.1 Non relative 375 830 164 304 1.2 1.8 0.3 0.6 Source: 1973 TTPI Census, Table T3; 1989 Chuuk Census; 1994 FSM Census, Table P14; 2000 FSM Census, Table P2-2. Table 3.3 shows the household composition by municipality in Chuuk State in 1994 and 2000. This table excludes those persons living in-group quarters since the relationships do not apply to person’s in-group quarters. In 2000, the household composition was uniform for all regions in Chuuk State, except for the proportion for other relatives. The proportion for other relatives was slightly higher for the Outer Islands, probably because of the more traditional family set up in the Outer Islands.
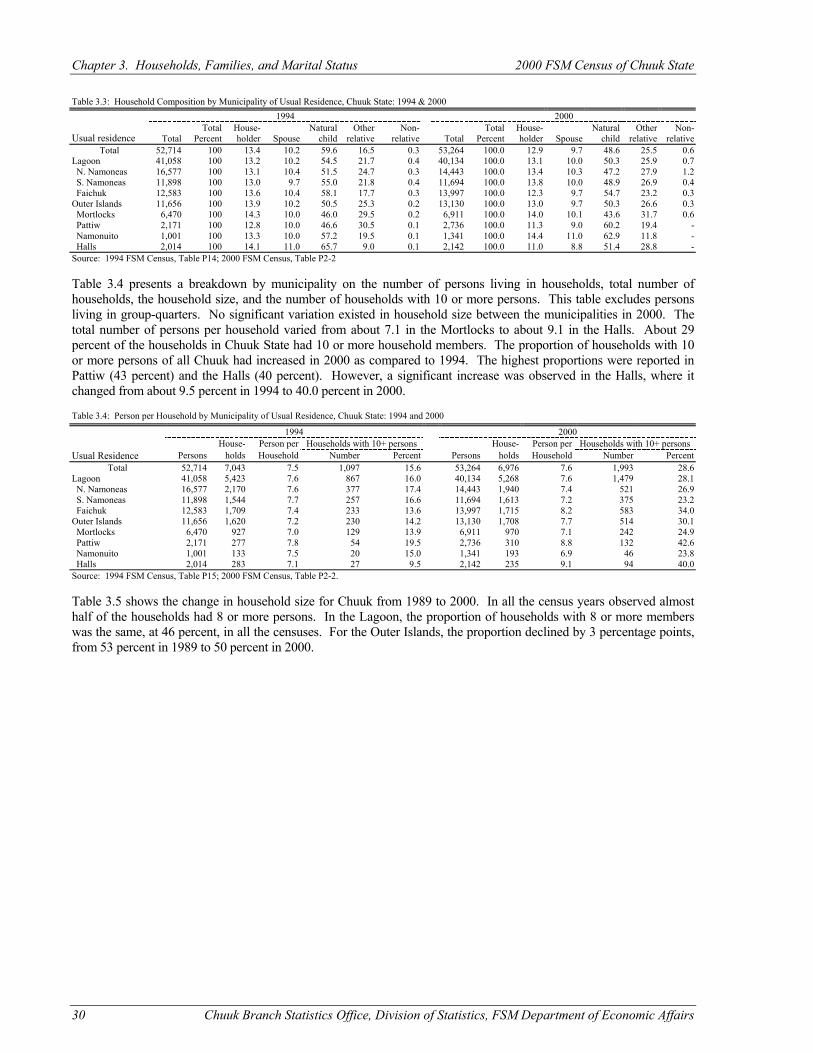
Chapter 3. Households, Families, and Marital Status 2000 FSM Census of Chuuk State
30 Chuuk Branch Statistics Office, Division of Statistics, FSM Department of Economic Affairs
Table 3.3: Household Composition by Municipality of Usual Residence, Chuuk State: 1994 & 2000 1994 2000
Usual residence
Total Total
Percent House-holder
Spouse
Natural child
Other relative
Non-relative
Total
Total Percent
House-holder
Spouse
Natural child
Other relative
Non-relative
Total 52,714 100 13.4 10.2 59.6 16.5 0.3 53,264 100.0 12.9 9.7 48.6 25.5 0.6 Lagoon 41,058 100 13.2 10.2 54.5 21.7 0.4 40,134 100.0 13.1 10.0 50.3 25.9 0.7 N. Namoneas 16,577 100 13.1 10.4 51.5 24.7 0.3 14,443 100.0 13.4 10.3 47.2 27.9 1.2 S. Namoneas 11,898 100 13.0 9.7 55.0 21.8 0.4 11,694 100.0 13.8 10.0 48.9 26.9 0.4 Faichuk 12,583 100 13.6 10.4 58.1 17.7 0.3 13,997 100.0 12.3 9.7 54.7 23.2 0.3 Outer Islands 11,656 100 13.9 10.2 50.5 25.3 0.2 13,130 100.0 13.0 9.7 50.3 26.6 0.3 Mortlocks 6,470 100 14.3 10.0 46.0 29.5 0.2 6,911 100.0 14.0 10.1 43.6 31.7 0.6 Pattiw 2,171 100 12.8 10.0 46.6 30.5 0.1 2,736 100.0 11.3 9.0 60.2 19.4 - Namonuito 1,001 100 13.3 10.0 57.2 19.5 0.1 1,341 100.0 14.4 11.0 62.9 11.8 - Halls 2,014 100 14.1 11.0 65.7 9.0 0.1 2,142 100.0 11.0 8.8 51.4 28.8 - Source: 1994 FSM Census, Table P14; 2000 FSM Census, Table P2-2 Table 3.4 presents a breakdown by municipality on the number of persons living in households, total number of households, the household size, and the number of households with 10 or more persons. This table excludes persons living in group-quarters. No significant variation existed in household size between the municipalities in 2000. The total number of persons per household varied from about 7.1 in the Mortlocks to about 9.1 in the Halls. About 29 percent of the households in Chuuk State had 10 or more household members. The proportion of households with 10 or more persons of all Chuuk had increased in 2000 as compared to 1994. The highest proportions were reported in Pattiw (43 percent) and the Halls (40 percent). However, a significant increase was observed in the Halls, where it changed from about 9.5 percent in 1994 to 40.0 percent in 2000. Table 3.4: Person per Household by Municipality of Usual Residence, Chuuk State: 1994 and 2000
1994 2000 House- Person per Households with 10+ persons House- Person per Households with 10+ persons
Usual Residence Persons holds Household Number Percent Persons holds Household Number Percent Total 52,714 7,043 7.5 1,097 15.6 53,264 6,976 7.6 1,993 28.6
Lagoon 41,058 5,423 7.6 867 16.0 40,134 5,268 7.6 1,479 28.1 N. Namoneas 16,577 2,170 7.6 377 17.4 14,443 1,940 7.4 521 26.9 S. Namoneas 11,898 1,544 7.7 257 16.6 11,694 1,613 7.2 375 23.2 Faichuk 12,583 1,709 7.4 233 13.6 13,997 1,715 8.2 583 34.0 Outer Islands 11,656 1,620 7.2 230 14.2 13,130 1,708 7.7 514 30.1 Mortlocks 6,470 927 7.0 129 13.9 6,911 970 7.1 242 24.9 Pattiw 2,171 277 7.8 54 19.5 2,736 310 8.8 132 42.6 Namonuito 1,001 133 7.5 20 15.0 1,341 193 6.9 46 23.8 Halls 2,014 283 7.1 27 9.5 2,142 235 9.1 94 40.0 Source: 1994 FSM Census, Table P15; 2000 FSM Census, Table P2-2. Table 3.5 shows the change in household size for Chuuk from 1989 to 2000. In all the census years observed almost half of the households had 8 or more persons. In the Lagoon, the proportion of households with 8 or more members was the same, at 46 percent, in all the censuses. For the Outer Islands, the proportion declined by 3 percentage points, from 53 percent in 1989 to 50 percent in 2000.
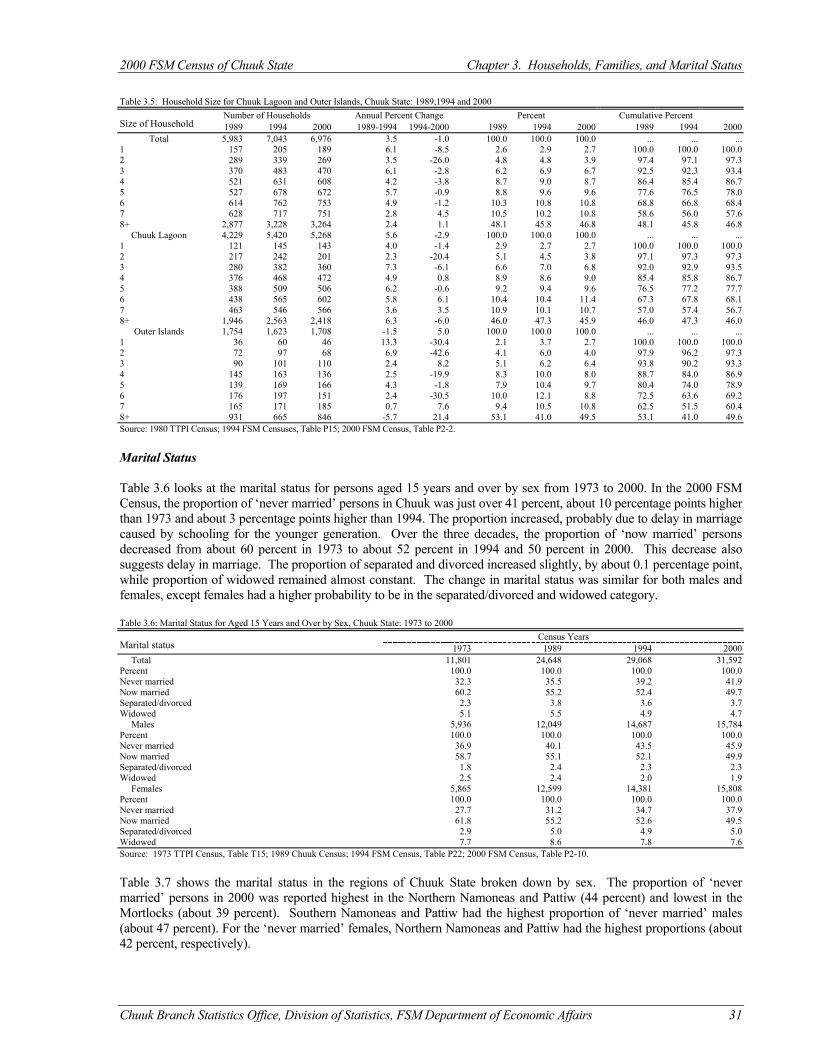
2000 FSM Census of Chuuk State Chapter 3. Households, Families, and Marital Status
Chuuk Branch Statistics Office, Division of Statistics, FSM Department of Economic Affairs 31
Table 3.5: Household Size for Chuuk Lagoon and Outer Islands, Chuuk State: 1989,1994 and 2000
Number of Households Annual Percent Change Percent Cumulative Percent Size of Household 1989 1994 2000 1989-1994 1994-2000 1989 1994 2000 1989 1994 2000
Total 5,983 7,043 6,976 3.5 -1.0 100.0 100.0 100.0 ... ... ... 1 157 205 189 6.1 -8.5 2.6 2.9 2.7 100.0 100.0 100.0 2 289 339 269 3.5 -26.0 4.8 4.8 3.9 97.4 97.1 97.3 3 370 483 470 6.1 -2.8 6.2 6.9 6.7 92.5 92.3 93.4 4 521 631 608 4.2 -3.8 8.7 9.0 8.7 86.4 85.4 86.7 5 527 678 672 5.7 -0.9 8.8 9.6 9.6 77.6 76.5 78.0 6 614 762 753 4.9 -1.2 10.3 10.8 10.8 68.8 66.8 68.4 7 628 717 751 2.8 4.5 10.5 10.2 10.8 58.6 56.0 57.6 8+ 2,877 3,228 3,264 2.4 1.1 48.1 45.8 46.8 48.1 45.8 46.8
Chuuk Lagoon 4,229 5,420 5,268 5.6 -2.9 100.0 100.0 100.0 ... ... ... 1 121 145 143 4.0 -1.4 2.9 2.7 2.7 100.0 100.0 100.0 2 217 242 201 2.3 -20.4 5.1 4.5 3.8 97.1 97.3 97.3 3 280 382 360 7.3 -6.1 6.6 7.0 6.8 92.0 92.9 93.5 4 376 468 472 4.9 0.8 8.9 8.6 9.0 85.4 85.8 86.7 5 388 509 506 6.2 -0.6 9.2 9.4 9.6 76.5 77.2 77.7 6 438 565 602 5.8 6.1 10.4 10.4 11.4 67.3 67.8 68.1 7 463 546 566 3.6 3.5 10.9 10.1 10.7 57.0 57.4 56.7 8+ 1,946 2,563 2,418 6.3 -6.0 46.0 47.3 45.9 46.0 47.3 46.0
Outer Islands 1,754 1,623 1,708 -1.5 5.0 100.0 100.0 100.0 ... ... ... 1 36 60 46 13.3 -30.4 2.1 3.7 2.7 100.0 100.0 100.0 2 72 97 68 6.9 -42.6 4.1 6.0 4.0 97.9 96.2 97.3 3 90 101 110 2.4 8.2 5.1 6.2 6.4 93.8 90.2 93.3 4 145 163 136 2.5 -19.9 8.3 10.0 8.0 88.7 84.0 86.9 5 139 169 166 4.3 -1.8 7.9 10.4 9.7 80.4 74.0 78.9 6 176 197 151 2.4 -30.5 10.0 12.1 8.8 72.5 63.6 69.2 7 165 171 185 0.7 7.6 9.4 10.5 10.8 62.5 51.5 60.4 8+ 931 665 846 -5.7 21.4 53.1 41.0 49.5 53.1 41.0 49.6 Source: 1980 TTPI Census; 1994 FSM Censuses, Table P15; 2000 FSM Census, Table P2-2. Marital Status Table 3.6 looks at the marital status for persons aged 15 years and over by sex from 1973 to 2000. In the 2000 FSM Census, the proportion of ‘never married’ persons in Chuuk was just over 41 percent, about 10 percentage points higher than 1973 and about 3 percentage points higher than 1994. The proportion increased, probably due to delay in marriage caused by schooling for the younger generation. Over the three decades, the proportion of ‘now married’ persons decreased from about 60 percent in 1973 to about 52 percent in 1994 and 50 percent in 2000. This decrease also suggests delay in marriage. The proportion of separated and divorced increased slightly, by about 0.1 percentage point, while proportion of widowed remained almost constant. The change in marital status was similar for both males and females, except females had a higher probability to be in the separated/divorced and widowed category. Table 3.6: Marital Status for Aged 15 Years and Over by Sex, Chuuk State: 1973 to 2000
Census Years Marital status 1973 1989 1994 2000 Total 11,801 24,648 29,068 31,592 Percent 100.0 100.0 100.0 100.0 Never married 32.3 35.5 39.2 41.9 Now married 60.2 55.2 52.4 49.7 Separated/divorced 2.3 3.8 3.6 3.7 Widowed 5.1 5.5 4.9 4.7 Males 5,936 12,049 14,687 15,784 Percent 100.0 100.0 100.0 100.0 Never married 36.9 40.1 43.5 45.9 Now married 58.7 55.1 52.1 49.9 Separated/divorced 1.8 2.4 2.3 2.3 Widowed 2.5 2.4 2.0 1.9 Females 5,865 12,599 14,381 15,808 Percent 100.0 100.0 100.0 100.0 Never married 27.7 31.2 34.7 37.9 Now married 61.8 55.2 52.6 49.5 Separated/divorced 2.9 5.0 4.9 5.0 Widowed 7.7 8.6 7.8 7.6 Source: 1973 TTPI Census, Table T15; 1989 Chuuk Census; 1994 FSM Census, Table P22; 2000 FSM Census, Table P2-10. Table 3.7 shows the marital status in the regions of Chuuk State broken down by sex. The proportion of ‘never married’ persons in 2000 was reported highest in the Northern Namoneas and Pattiw (44 percent) and lowest in the Mortlocks (about 39 percent). Southern Namoneas and Pattiw had the highest proportion of ‘never married’ males (about 47 percent). For the ‘never married’ females, Northern Namoneas and Pattiw had the highest proportions (about 42 percent, respectively).
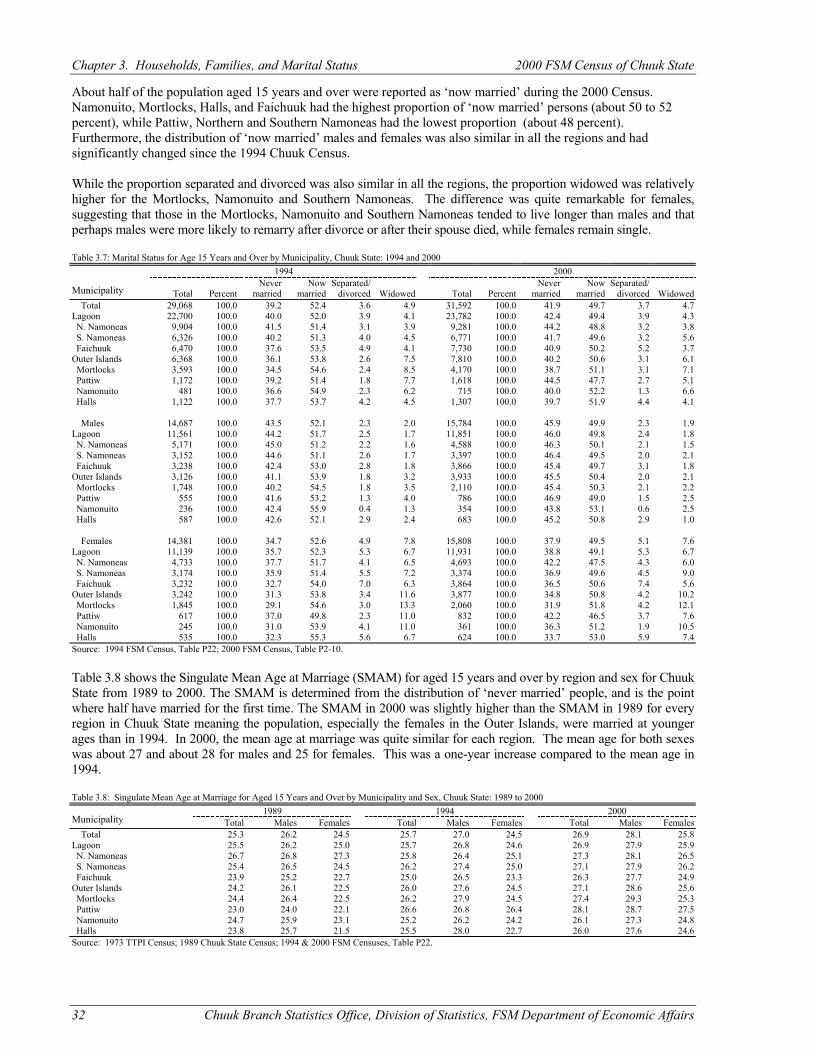
Chapter 3. Households, Families, and Marital Status 2000 FSM Census of Chuuk State
32 Chuuk Branch Statistics Office, Division of Statistics, FSM Department of Economic Affairs
About half of the population aged 15 years and over were reported as ‘now married’ during the 2000 Census. Namonuito, Mortlocks, Halls, and Faichuuk had the highest proportion of ‘now married’ persons (about 50 to 52 percent), while Pattiw, Northern and Southern Namoneas had the lowest proportion (about 48 percent). Furthermore, the distribution of ‘now married’ males and females was also similar in all the regions and had significantly changed since the 1994 Chuuk Census. While the proportion separated and divorced was also similar in all the regions, the proportion widowed was relatively higher for the Mortlocks, Namonuito and Southern Namoneas. The difference was quite remarkable for females, suggesting that those in the Mortlocks, Namonuito and Southern Namoneas tended to live longer than males and that perhaps males were more likely to remarry after divorce or after their spouse died, while females remain single. Table 3.7: Marital Status for Age 15 Years and Over by Municipality, Chuuk State: 1994 and 2000
1994 2000 Never Now Separated/ Never Now Separated/
Municipality Total Percent married married divorced Widowed Total Percent married married divorced Widowed Total 29,068 100.0 39.2 52.4 3.6 4.9 31,592 100.0 41.9 49.7 3.7 4.7 Lagoon 22,700 100.0 40.0 52.0 3.9 4.1 23,782 100.0 42.4 49.4 3.9 4.3 N. Namoneas 9,904 100.0 41.5 51.4 3.1 3.9 9,281 100.0 44.2 48.8 3.2 3.8 S. Namoneas 6,326 100.0 40.2 51.3 4.0 4.5 6,771 100.0 41.7 49.6 3.2 5.6 Faichuuk 6,470 100.0 37.6 53.5 4.9 4.1 7,730 100.0 40.9 50.2 5.2 3.7 Outer Islands 6,368 100.0 36.1 53.8 2.6 7.5 7,810 100.0 40.2 50.6 3.1 6.1 Mortlocks 3,593 100.0 34.5 54.6 2.4 8.5 4,170 100.0 38.7 51.1 3.1 7.1 Pattiw 1,172 100.0 39.2 51.4 1.8 7.7 1,618 100.0 44.5 47.7 2.7 5.1 Namonuito 481 100.0 36.6 54.9 2.3 6.2 715 100.0 40.0 52.2 1.3 6.6 Halls 1,122 100.0 37.7 53.7 4.2 4.5 1,307 100.0 39.7 51.9 4.4 4.1
Males 14,687 100.0 43.5 52.1 2.3 2.0 15,784 100.0 45.9 49.9 2.3 1.9 Lagoon 11,561 100.0 44.2 51.7 2.5 1.7 11,851 100.0 46.0 49.8 2.4 1.8 N. Namoneas 5,171 100.0 45.0 51.2 2.2 1.6 4,588 100.0 46.3 50.1 2.1 1.5 S. Namoneas 3,152 100.0 44.6 51.1 2.6 1.7 3,397 100.0 46.4 49.5 2.0 2.1 Faichuuk 3,238 100.0 42.4 53.0 2.8 1.8 3,866 100.0 45.4 49.7 3.1 1.8 Outer Islands 3,126 100.0 41.1 53.9 1.8 3.2 3,933 100.0 45.5 50.4 2.0 2.1 Mortlocks 1,748 100.0 40.2 54.5 1.8 3.5 2,110 100.0 45.4 50.3 2.1 2.2 Pattiw 555 100.0 41.6 53.2 1.3 4.0 786 100.0 46.9 49.0 1.5 2.5 Namonuito 236 100.0 42.4 55.9 0.4 1.3 354 100.0 43.8 53.1 0.6 2.5 Halls 587 100.0 42.6 52.1 2.9 2.4 683 100.0 45.2 50.8 2.9 1.0
Females 14,381 100.0 34.7 52.6 4.9 7.8 15,808 100.0 37.9 49.5 5.1 7.6 Lagoon 11,139 100.0 35.7 52.3 5.3 6.7 11,931 100.0 38.8 49.1 5.3 6.7 N. Namoneas 4,733 100.0 37.7 51.7 4.1 6.5 4,693 100.0 42.2 47.5 4.3 6.0 S. Namoneas 3,174 100.0 35.9 51.4 5.5 7.2 3,374 100.0 36.9 49.6 4.5 9.0 Faichuuk 3,232 100.0 32.7 54.0 7.0 6.3 3,864 100.0 36.5 50.6 7.4 5.6 Outer Islands 3,242 100.0 31.3 53.8 3.4 11.6 3,877 100.0 34.8 50.8 4.2 10.2 Mortlocks 1,845 100.0 29.1 54.6 3.0 13.3 2,060 100.0 31.9 51.8 4.2 12.1 Pattiw 617 100.0 37.0 49.8 2.3 11.0 832 100.0 42.2 46.5 3.7 7.6 Namonuito 245 100.0 31.0 53.9 4.1 11.0 361 100.0 36.3 51.2 1.9 10.5 Halls 535 100.0 32.3 55.3 5.6 6.7 624 100.0 33.7 53.0 5.9 7.4 Source: 1994 FSM Census, Table P22; 2000 FSM Census, Table P2-10. Table 3.8 shows the Singulate Mean Age at Marriage (SMAM) for aged 15 years and over by region and sex for Chuuk State from 1989 to 2000. The SMAM is determined from the distribution of ‘never married’ people, and is the point where half have married for the first time. The SMAM in 2000 was slightly higher than the SMAM in 1989 for every region in Chuuk State meaning the population, especially the females in the Outer Islands, were married at younger ages than in 1994. In 2000, the mean age at marriage was quite similar for each region. The mean age for both sexes was about 27 and about 28 for males and 25 for females. This was a one-year increase compared to the mean age in 1994. Table 3.8: Singulate Mean Age at Marriage for Aged 15 Years and Over by Municipality and Sex, Chuuk State: 1989 to 2000
1989 1994 2000 Municipality Total Males Females Total Males Females Total Males Females Total 25.3 26.2 24.5 25.7 27.0 24.5 26.9 28.1 25.8 Lagoon 25.5 26.2 25.0 25.7 26.8 24.6 26.9 27.9 25.9 N. Namoneas 26.7 26.8 27.3 25.8 26.4 25.1 27.3 28.1 26.5 S. Namoneas 25.4 26.5 24.5 26.2 27.4 25.0 27.1 27.9 26.2 Faichuuk 23.9 25.2 22.7 25.0 26.5 23.3 26.3 27.7 24.9 Outer Islands 24.2 26.1 22.5 26.0 27.6 24.5 27.1 28.6 25.6 Mortlocks 24.4 26.4 22.5 26.2 27.9 24.5 27.4 29.3 25.3 Pattiw 23.0 24.0 22.1 26.6 26.8 26.4 28.1 28.7 27.5 Namonuito 24.7 25.9 23.1 25.2 26.2 24.2 26.1 27.3 24.8 Halls 23.8 25.7 21.5 25.5 28.0 22.7 26.0 27.6 24.6 Source: 1973 TTPI Census; 1989 Chuuk State Census; 1994 & 2000 FSM Censuses, Table P22.
2000 FSM Census of Chuuk State Chapter 3. Households, Families, and Marital Status
Chuuk Branch Statistics Office, Division of Statistics, FSM Department of Economic Affairs 33
Conclusion The average household size in Chuuk State remained at about seven persons per household over the three decades. However, the household composition changed. The proportions of ‘natural children’ increased while the proportions of ‘other relatives’ and ‘non-relatives’ decreased. This suggests that the household composition in Chuuk State shifted from the traditional extended families to a more Westernized or nuclear family setup. Like other population characteristics, marriage patterns also changed. Younger generations of both men and women tended to delay marriage, probably to pursue their education or participate in the labor force. Additionally, in a market-oriented economy, getting married and running a family is expensive. More women were in the labor force in 2000 than before, and contributed to the financial well being of the family. The proportion of separated or divorced couples was maintained for males but increased for females. In other words, the proportion of single female parents due to separation and divorce in 2000 has slightly increased by about 0.1 percent since 1994. The number of widowed women in 2000 decreased slightly since 1973, which supported the fact that men tend to die earlier or remarry while women live longer or remain widowed.

Chuuk Branch Statistics Office, Division of Statistics, FSM Department of Economic Affairs 35
CHAPTER 4 FERTILITY
Introduction Before large-scale international migration became common, population growth was determined mostly by the difference between the number of people being born and the number of people dying. At present, births are not the only contributing factor to population growth, but they make up a significant portion, especially in the Pacific region where most families are characterized by a high level of fertility. Birth or fertility rates measure the impact that births have on population structure and growth. As a rule, censuses do quite well in estimating fertility as questions and techniques have been refined over the years. There are two approaches for measuring fertility, direct measures and indirect measures, both of which can be applied to the 1994 and of 2000 FSM Censuses of Chuuk. Since either method can be used, a useful starting point is to compare the results obtained from each. If the results differ widely, it suggests that the data used in one or both methods are incorrect, or one method does not apply. Changes in fertility patterns and levels are often due to family planning. Census data on fertility provide benchmark information on fertility to look for changes in patterns and levels. In many countries, the introduction of family planning methods, such as contraceptives, usually lowers fertility levels of older women first. In a nation where family planning is prevalent, we expect to see lower fertility levels for the older women. Data Description Vital registration in Chuuk is not complete, so estimates must be derived from a census or survey. The 2000 FSM Census of Chuuk asked four questions on fertility in order to get information on recent births, previous births, and child mortality. Fertility questions were asked to all females born before April 1, 1987 (all women aged 13 and over) but were tabulated for women aged 15 and over. Question 17a asked how many children born to each woman and were living at home, living elsewhere, or dead and categorized by sex. Questions 17b to 17d asked the date and sex of the last child born alive and whether that child was still alive. Limitations and comparability. Accurate fertility data are often difficult to capture because of poor recollection by mothers on number of births or dates of births of their children. Indirect methods of measuring fertility help to compensate for these weaknesses in the data. The 1973 TTPI Census asked questions on children ever born, children still alive and date of the last child born, by sex, to women aged 14 years and over. The 1980 Census asked women 15 and over for number of children ever born and surviving and babies born in the 12 months before the census. The 1980 collection technique would have caught women who had multiple births in the year, while the 1973, 1994 and 2000 only considered most recent births, missing those women who had multiple births in the year before the census. The editing techniques on fertility data for the earlier censuses were slightly different from the 1994 and 2000 FSM Censuses of Chuuk. Analysis of Fertility Data Crude Birth Rate A crude birth rate (CBR) is the number of births in a year divided by the mid-period population. Note that the mid-period population is not the census population, that is, the reported births refer to the last 12 months, while the population refers to the date of enumeration. The CBR is a crude rate because the base of the calculation is the whole population, resulting in the rate being affected by the age and sex structure. Two measures of how many births occurred in the 12 months prior to the census can be derived from census data. The first is the number of births reported by women in the census; the second is the population under 1 year plus the estimated number of infant deaths (deaths during the year to persons under 1 year). These two figures were not equal for the period April 2, 1999 through April 1, 2000.
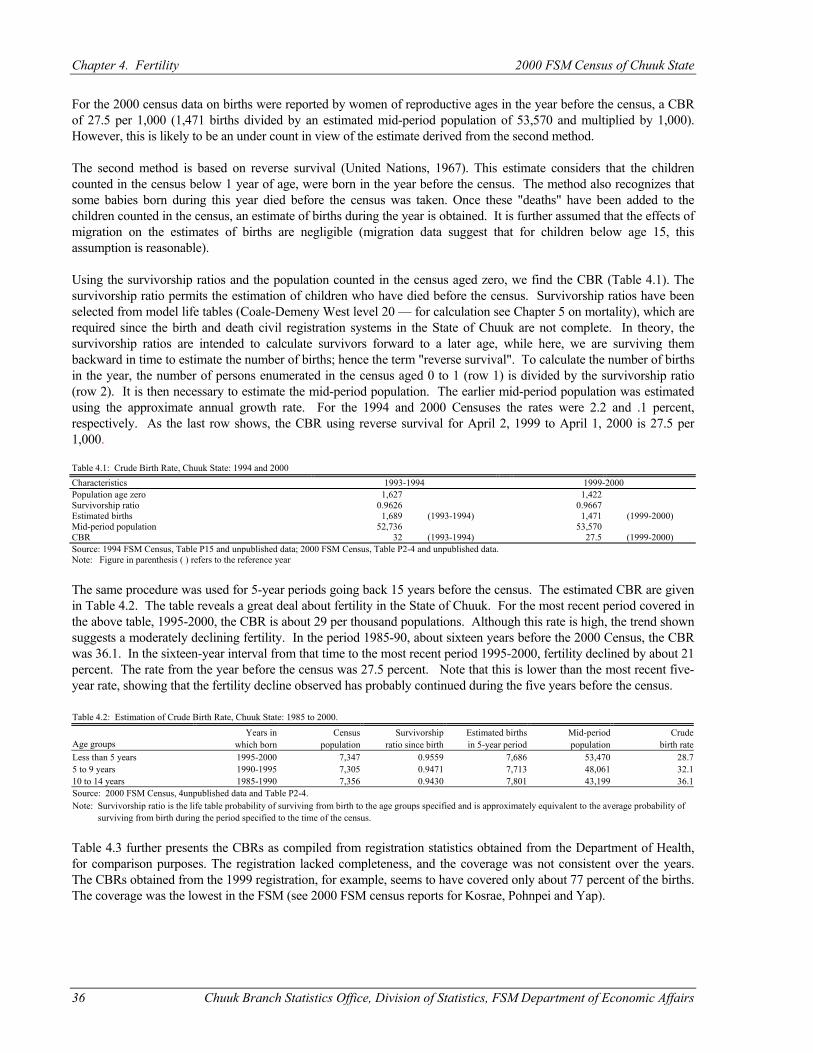
Chapter 4. Fertility 2000 FSM Census of Chuuk State
36 Chuuk Branch Statistics Office, Division of Statistics, FSM Department of Economic Affairs
For the 2000 census data on births were reported by women of reproductive ages in the year before the census, a CBR of 27.5 per 1,000 (1,471 births divided by an estimated mid-period population of 53,570 and multiplied by 1,000). However, this is likely to be an under count in view of the estimate derived from the second method. The second method is based on reverse survival (United Nations, 1967). This estimate considers that the children counted in the census below 1 year of age, were born in the year before the census. The method also recognizes that some babies born during this year died before the census was taken. Once these "deaths" have been added to the children counted in the census, an estimate of births during the year is obtained. It is further assumed that the effects of migration on the estimates of births are negligible (migration data suggest that for children below age 15, this assumption is reasonable). Using the survivorship ratios and the population counted in the census aged zero, we find the CBR (Table 4.1). The survivorship ratio permits the estimation of children who have died before the census. Survivorship ratios have been selected from model life tables (Coale-Demeny West level 20 — for calculation see Chapter 5 on mortality), which are required since the birth and death civil registration systems in the State of Chuuk are not complete. In theory, the survivorship ratios are intended to calculate survivors forward to a later age, while here, we are surviving them backward in time to estimate the number of births; hence the term "reverse survival". To calculate the number of births in the year, the number of persons enumerated in the census aged 0 to 1 (row 1) is divided by the survivorship ratio (row 2). It is then necessary to estimate the mid-period population. The earlier mid-period population was estimated using the approximate annual growth rate. For the 1994 and 2000 Censuses the rates were 2.2 and .1 percent, respectively. As the last row shows, the CBR using reverse survival for April 2, 1999 to April 1, 2000 is 27.5 per 1,000. Table 4.1: Crude Birth Rate, Chuuk State: 1994 and 2000 Characteristics 1993-1994 1999-2000 Population age zero 1,627 1,422 Survivorship ratio 0.9626 0.9667 Estimated births 1,689 (1993-1994) 1,471 (1999-2000) Mid-period population 52,736 53,570 CBR 32 (1993-1994) 27.5 (1999-2000) Source: 1994 FSM Census, Table P15 and unpublished data; 2000 FSM Census, Table P2-4 and unpublished data. Note: Figure in parenthesis ( ) refers to the reference year
The same procedure was used for 5-year periods going back 15 years before the census. The estimated CBR are given in Table 4.2. The table reveals a great deal about fertility in the State of Chuuk. For the most recent period covered in the above table, 1995-2000, the CBR is about 29 per thousand populations. Although this rate is high, the trend shown suggests a moderately declining fertility. In the period 1985-90, about sixteen years before the 2000 Census, the CBR was 36.1. In the sixteen-year interval from that time to the most recent period 1995-2000, fertility declined by about 21 percent. The rate from the year before the census was 27.5 percent. Note that this is lower than the most recent five-year rate, showing that the fertility decline observed has probably continued during the five years before the census. Table 4.2: Estimation of Crude Birth Rate, Chuuk State: 1985 to 2000. Years in Census Survivorship Estimated births Mid-period Crude Age groups which born population ratio since birth in 5-year period population birth rate Less than 5 years 1995-2000 7,347 0.9559 7,686 53,470 28.7 5 to 9 years 1990-1995 7,305 0.9471 7,713 48,061 32.1 10 to 14 years 1985-1990 7,356 0.9430 7,801 43,199 36.1 Source: 2000 FSM Census, 4unpublished data and Table P2-4. Note: Survivorship ratio is the life table probability of surviving from birth to the age groups specified and is approximately equivalent to the average probability of surviving from birth during the period specified to the time of the census.
Table 4.3 further presents the CBRs as compiled from registration statistics obtained from the Department of Health, for comparison purposes. The registration lacked completeness, and the coverage was not consistent over the years. The CBRs obtained from the 1999 registration, for example, seems to have covered only about 77 percent of the births. The coverage was the lowest in the FSM (see 2000 FSM census reports for Kosrae, Pohnpei and Yap).
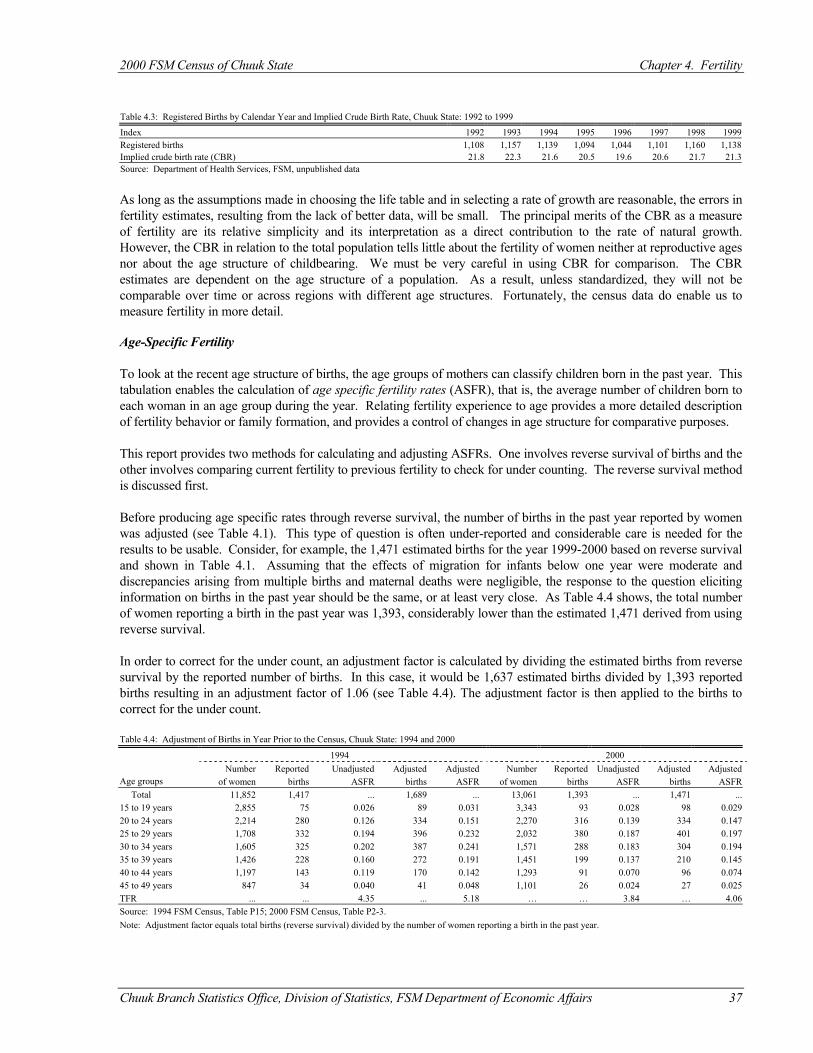
2000 FSM Census of Chuuk State Chapter 4. Fertility
Chuuk Branch Statistics Office, Division of Statistics, FSM Department of Economic Affairs 37
Table 4.3: Registered Births by Calendar Year and Implied Crude Birth Rate, Chuuk State: 1992 to 1999
Index 1992 1993 1994 1995 1996 1997 1998 1999 Registered births 1,108 1,157 1,139 1,094 1,044 1,101 1,160 1,138 Implied crude birth rate (CBR) 21.8 22.3 21.6 20.5 19.6 20.6 21.7 21.3 Source: Department of Health Services, FSM, unpublished data
As long as the assumptions made in choosing the life table and in selecting a rate of growth are reasonable, the errors in fertility estimates, resulting from the lack of better data, will be small. The principal merits of the CBR as a measure of fertility are its relative simplicity and its interpretation as a direct contribution to the rate of natural growth. However, the CBR in relation to the total population tells little about the fertility of women neither at reproductive ages nor about the age structure of childbearing. We must be very careful in using CBR for comparison. The CBR estimates are dependent on the age structure of a population. As a result, unless standardized, they will not be comparable over time or across regions with different age structures. Fortunately, the census data do enable us to measure fertility in more detail. Age-Specific Fertility To look at the recent age structure of births, the age groups of mothers can classify children born in the past year. This tabulation enables the calculation of age specific fertility rates (ASFR), that is, the average number of children born to each woman in an age group during the year. Relating fertility experience to age provides a more detailed description of fertility behavior or family formation, and provides a control of changes in age structure for comparative purposes. This report provides two methods for calculating and adjusting ASFRs. One involves reverse survival of births and the other involves comparing current fertility to previous fertility to check for under counting. The reverse survival method is discussed first. Before producing age specific rates through reverse survival, the number of births in the past year reported by women was adjusted (see Table 4.1). This type of question is often under-reported and considerable care is needed for the results to be usable. Consider, for example, the 1,471 estimated births for the year 1999-2000 based on reverse survival and shown in Table 4.1. Assuming that the effects of migration for infants below one year were moderate and discrepancies arising from multiple births and maternal deaths were negligible, the response to the question eliciting information on births in the past year should be the same, or at least very close. As Table 4.4 shows, the total number of women reporting a birth in the past year was 1,393, considerably lower than the estimated 1,471 derived from using reverse survival. In order to correct for the under count, an adjustment factor is calculated by dividing the estimated births from reverse survival by the reported number of births. In this case, it would be 1,637 estimated births divided by 1,393 reported births resulting in an adjustment factor of 1.06 (see Table 4.4). The adjustment factor is then applied to the births to correct for the under count. Table 4.4: Adjustment of Births in Year Prior to the Census, Chuuk State: 1994 and 2000
1994 2000 Number Reported Unadjusted Adjusted Adjusted Number Reported Unadjusted Adjusted Adjusted Age groups of women births ASFR births ASFR of women births ASFR births ASFR Total 11,852 1,417 ... 1,689 ... 13,061 1,393 ... 1,471 ... 15 to 19 years 2,855 75 0.026 89 0.031 3,343 93 0.028 98 0.029 20 to 24 years 2,214 280 0.126 334 0.151 2,270 316 0.139 334 0.147 25 to 29 years 1,708 332 0.194 396 0.232 2,032 380 0.187 401 0.197 30 to 34 years 1,605 325 0.202 387 0.241 1,571 288 0.183 304 0.194 35 to 39 years 1,426 228 0.160 272 0.191 1,451 199 0.137 210 0.145 40 to 44 years 1,197 143 0.119 170 0.142 1,293 91 0.070 96 0.074 45 to 49 years 847 34 0.040 41 0.048 1,101 26 0.024 27 0.025 TFR ... ... 4.35 ... 5.18 … … 3.84 … 4.06 Source: 1994 FSM Census, Table P15; 2000 FSM Census, Table P2-3. Note: Adjustment factor equals total births (reverse survival) divided by the number of women reporting a birth in the past year.
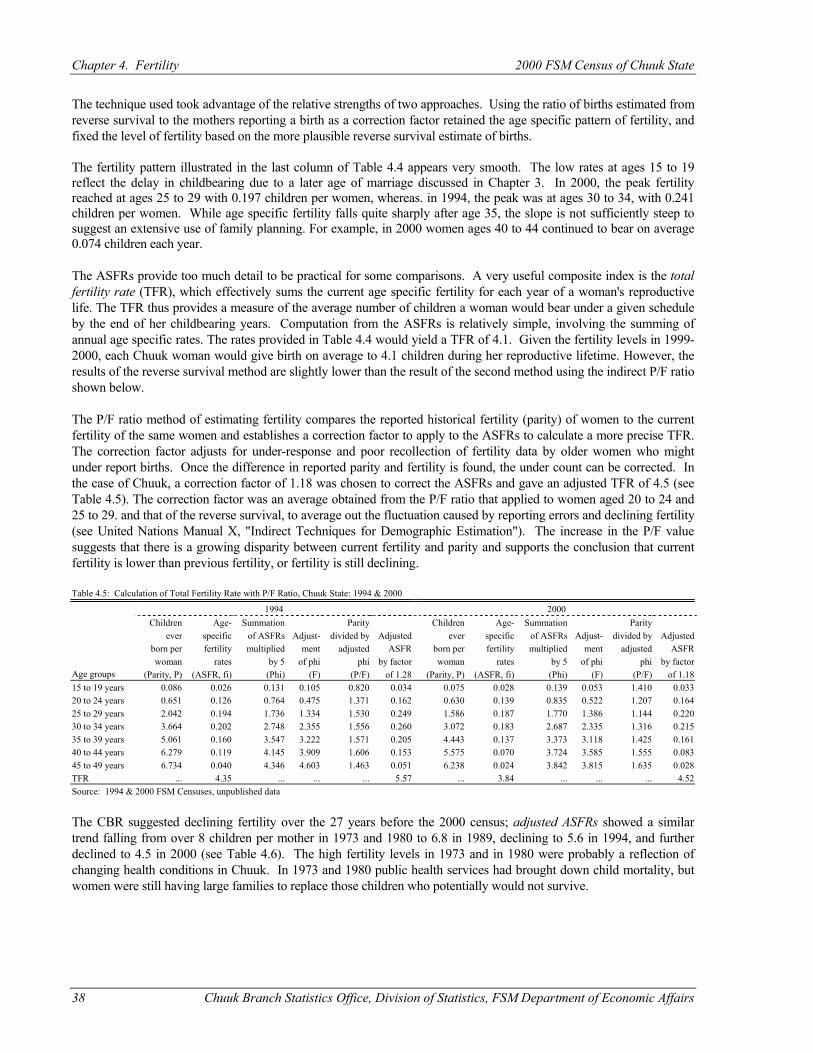
Chapter 4. Fertility 2000 FSM Census of Chuuk State
38 Chuuk Branch Statistics Office, Division of Statistics, FSM Department of Economic Affairs
The technique used took advantage of the relative strengths of two approaches. Using the ratio of births estimated from reverse survival to the mothers reporting a birth as a correction factor retained the age specific pattern of fertility, and fixed the level of fertility based on the more plausible reverse survival estimate of births. The fertility pattern illustrated in the last column of Table 4.4 appears very smooth. The low rates at ages 15 to 19 reflect the delay in childbearing due to a later age of marriage discussed in Chapter 3. In 2000, the peak fertility reached at ages 25 to 29 with 0.197 children per women, whereas. in 1994, the peak was at ages 30 to 34, with 0.241 children per women. While age specific fertility falls quite sharply after age 35, the slope is not sufficiently steep to suggest an extensive use of family planning. For example, in 2000 women ages 40 to 44 continued to bear on average 0.074 children each year. The ASFRs provide too much detail to be practical for some comparisons. A very useful composite index is the total fertility rate (TFR), which effectively sums the current age specific fertility for each year of a woman's reproductive life. The TFR thus provides a measure of the average number of children a woman would bear under a given schedule by the end of her childbearing years. Computation from the ASFRs is relatively simple, involving the summing of annual age specific rates. The rates provided in Table 4.4 would yield a TFR of 4.1. Given the fertility levels in 1999-2000, each Chuuk woman would give birth on average to 4.1 children during her reproductive lifetime. However, the results of the reverse survival method are slightly lower than the result of the second method using the indirect P/F ratio shown below. The P/F ratio method of estimating fertility compares the reported historical fertility (parity) of women to the current fertility of the same women and establishes a correction factor to apply to the ASFRs to calculate a more precise TFR. The correction factor adjusts for under-response and poor recollection of fertility data by older women who might under report births. Once the difference in reported parity and fertility is found, the under count can be corrected. In the case of Chuuk, a correction factor of 1.18 was chosen to correct the ASFRs and gave an adjusted TFR of 4.5 (see Table 4.5). The correction factor was an average obtained from the P/F ratio that applied to women aged 20 to 24 and 25 to 29. and that of the reverse survival, to average out the fluctuation caused by reporting errors and declining fertility (see United Nations Manual X, "Indirect Techniques for Demographic Estimation"). The increase in the P/F value suggests that there is a growing disparity between current fertility and parity and supports the conclusion that current fertility is lower than previous fertility, or fertility is still declining. Table 4.5: Calculation of Total Fertility Rate with P/F Ratio, Chuuk State: 1994 & 2000
1994 2000 Children Age- Summation Parity Children Age- Summation Parity ever specific of ASFRs Adjust- divided by Adjusted ever specific of ASFRs Adjust- divided by Adjusted born per fertility multiplied ment adjusted ASFR born per fertility multiplied ment adjusted ASFR woman rates by 5 of phi phi by factor woman rates by 5 of phi phi by factor Age groups (Parity, P) (ASFR, fi) (Phi) (F) (P/F) of 1.28 (Parity, P) (ASFR, fi) (Phi) (F) (P/F) of 1.18 15 to 19 years 0.086 0.026 0.131 0.105 0.820 0.034 0.075 0.028 0.139 0.053 1.410 0.033 20 to 24 years 0.651 0.126 0.764 0.475 1.371 0.162 0.630 0.139 0.835 0.522 1.207 0.164 25 to 29 years 2.042 0.194 1.736 1.334 1.530 0.249 1.586 0.187 1.770 1.386 1.144 0.220 30 to 34 years 3.664 0.202 2.748 2.355 1.556 0.260 3.072 0.183 2.687 2.335 1.316 0.215 35 to 39 years 5.061 0.160 3.547 3.222 1.571 0.205 4.443 0.137 3.373 3.118 1.425 0.161 40 to 44 years 6.279 0.119 4.145 3.909 1.606 0.153 5.575 0.070 3.724 3.585 1.555 0.083 45 to 49 years 6.734 0.040 4.346 4.603 1.463 0.051 6.238 0.024 3.842 3.815 1.635 0.028 TFR ... 4.35 ... ... ... 5.57 ... 3.84 ... ... ... 4.52 Source: 1994 & 2000 FSM Censuses, unpublished data
The CBR suggested declining fertility over the 27 years before the 2000 census; adjusted ASFRs showed a similar trend falling from over 8 children per mother in 1973 and 1980 to 6.8 in 1989, declining to 5.6 in 1994, and further declined to 4.5 in 2000 (see Table 4.6). The high fertility levels in 1973 and in 1980 were probably a reflection of changing health conditions in Chuuk. In 1973 and 1980 public health services had brought down child mortality, but women were still having large families to replace those children who potentially would not survive.
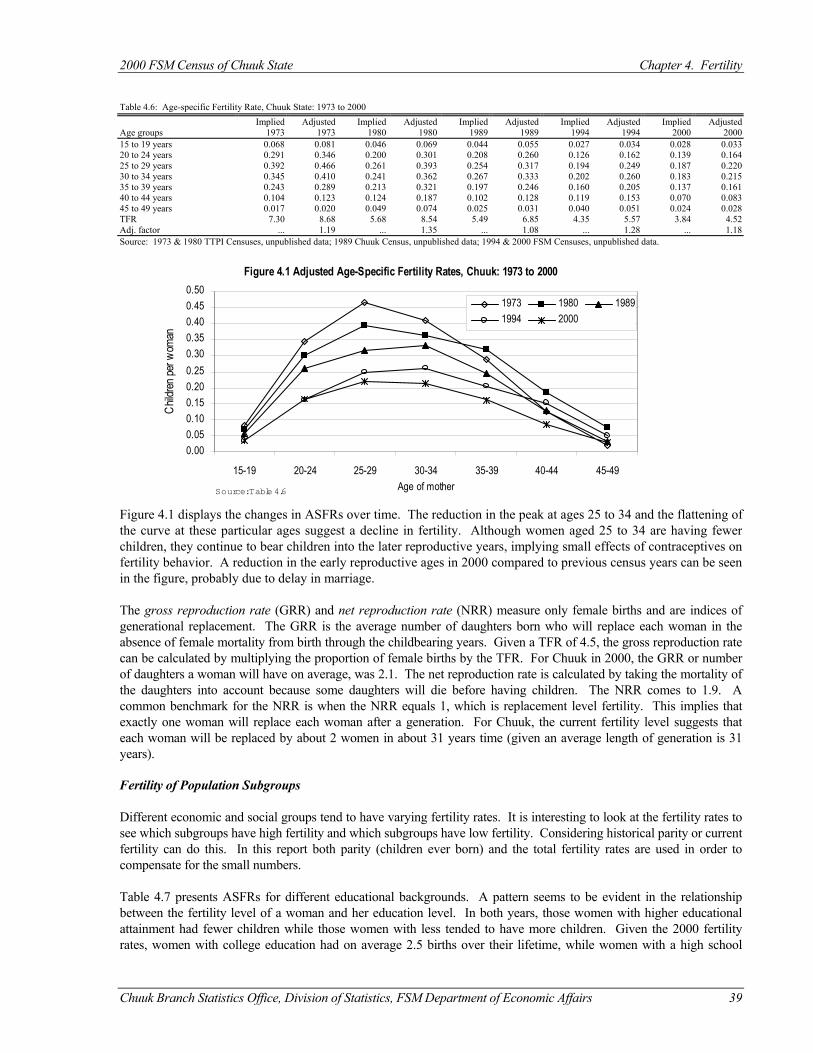
2000 FSM Census of Chuuk State Chapter 4. Fertility
Chuuk Branch Statistics Office, Division of Statistics, FSM Department of Economic Affairs 39
Table 4.6: Age-specific Fertility Rate, Chuuk State: 1973 to 2000
Implied Adjusted Implied Adjusted Implied Adjusted Implied Adjusted Implied Adjusted Age groups 1973 1973 1980 1980 1989 1989 1994 1994 2000 2000 15 to 19 years 0.068 0.081 0.046 0.069 0.044 0.055 0.027 0.034 0.028 0.033 20 to 24 years 0.291 0.346 0.200 0.301 0.208 0.260 0.126 0.162 0.139 0.164 25 to 29 years 0.392 0.466 0.261 0.393 0.254 0.317 0.194 0.249 0.187 0.220 30 to 34 years 0.345 0.410 0.241 0.362 0.267 0.333 0.202 0.260 0.183 0.215 35 to 39 years 0.243 0.289 0.213 0.321 0.197 0.246 0.160 0.205 0.137 0.161 40 to 44 years 0.104 0.123 0.124 0.187 0.102 0.128 0.119 0.153 0.070 0.083 45 to 49 years 0.017 0.020 0.049 0.074 0.025 0.031 0.040 0.051 0.024 0.028 TFR 7.30 8.68 5.68 8.54 5.49 6.85 4.35 5.57 3.84 4.52 Adj. factor ... 1.19 ... 1.35 ... 1.08 ... 1.28 ... 1.18 Source: 1973 & 1980 TTPI Censuses, unpublished data; 1989 Chuuk Census, unpublished data; 1994 & 2000 FSM Censuses, unpublished data.
Figure 4.1 displays the changes in ASFRs over time. The reduction in the peak at ages 25 to 34 and the flattening of the curve at these particular ages suggest a decline in fertility. Although women aged 25 to 34 are having fewer children, they continue to bear children into the later reproductive years, implying small effects of contraceptives on fertility behavior. A reduction in the early reproductive ages in 2000 compared to previous census years can be seen in the figure, probably due to delay in marriage. The gross reproduction rate (GRR) and net reproduction rate (NRR) measure only female births and are indices of generational replacement. The GRR is the average number of daughters born who will replace each woman in the absence of female mortality from birth through the childbearing years. Given a TFR of 4.5, the gross reproduction rate can be calculated by multiplying the proportion of female births by the TFR. For Chuuk in 2000, the GRR or number of daughters a woman will have on average, was 2.1. The net reproduction rate is calculated by taking the mortality of the daughters into account because some daughters will die before having children. The NRR comes to 1.9. A common benchmark for the NRR is when the NRR equals 1, which is replacement level fertility. This implies that exactly one woman will replace each woman after a generation. For Chuuk, the current fertility level suggests that each woman will be replaced by about 2 women in about 31 years time (given an average length of generation is 31 years). Fertility of Population Subgroups Different economic and social groups tend to have varying fertility rates. It is interesting to look at the fertility rates to see which subgroups have high fertility and which subgroups have low fertility. Considering historical parity or current fertility can do this. In this report both parity (children ever born) and the total fertility rates are used in order to compensate for the small numbers. Table 4.7 presents ASFRs for different educational backgrounds. A pattern seems to be evident in the relationship between the fertility level of a woman and her education level. In both years, those women with higher educational attainment had fewer children while those women with less tended to have more children. Given the 2000 fertility rates, women with college education had on average 2.5 births over their lifetime, while women with a high school
Figure 4.1 Adjusted Age-Specific Fertility Rates, Chuuk: 1973 to 2000
0.000.050.100.150.200.250.300.350.400.450.50
15-19 20-24 25-29 30-34 35-39 40-44 45-49Age of mother
Child
ren pe
r wom
an
1973 1980 19891994 2000
Source: Table 4.6
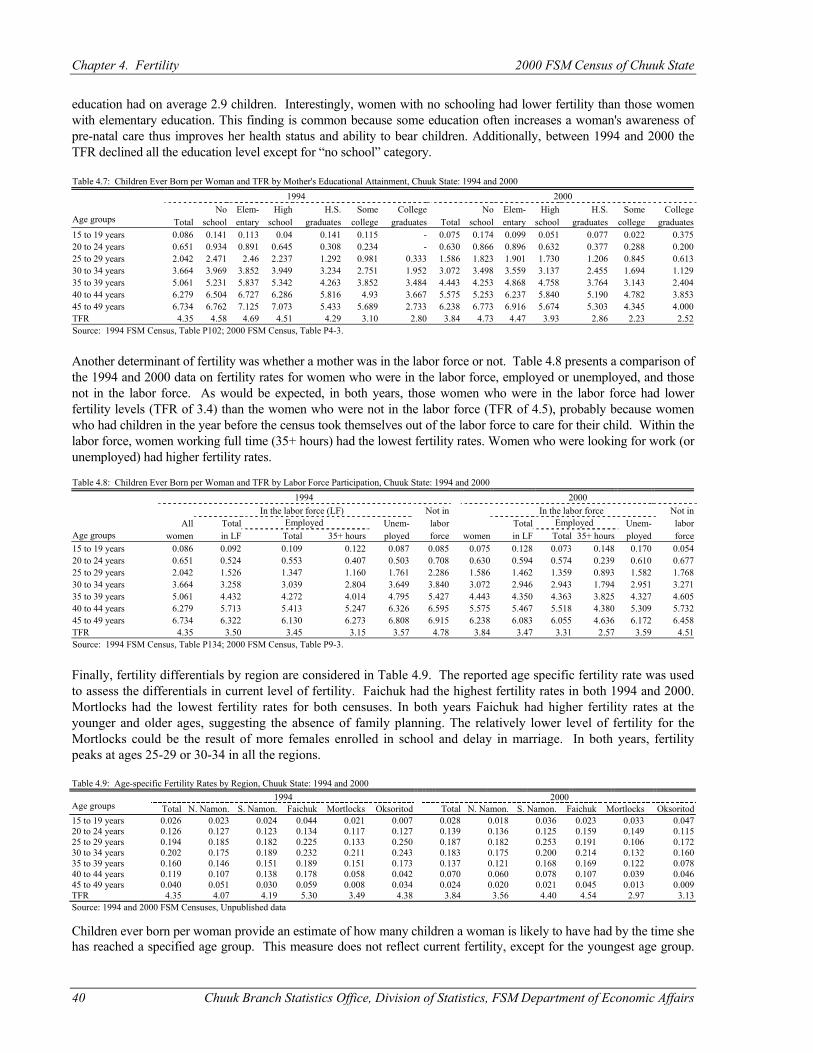
Chapter 4. Fertility 2000 FSM Census of Chuuk State
40 Chuuk Branch Statistics Office, Division of Statistics, FSM Department of Economic Affairs
education had on average 2.9 children. Interestingly, women with no schooling had lower fertility than those women with elementary education. This finding is common because some education often increases a woman's awareness of pre-natal care thus improves her health status and ability to bear children. Additionally, between 1994 and 2000 the TFR declined all the education level except for “no school” category. Table 4.7: Children Ever Born per Woman and TFR by Mother's Educational Attainment, Chuuk State: 1994 and 2000
1994 2000 No Elem- High H.S. Some College No Elem- High H.S. Some College
Age groups Total school entary school graduates college graduates Total school entary school graduates college graduates 15 to 19 years 0.086 0.141 0.113 0.04 0.141 0.115 - 0.075 0.174 0.099 0.051 0.077 0.022 0.375 20 to 24 years 0.651 0.934 0.891 0.645 0.308 0.234 - 0.630 0.866 0.896 0.632 0.377 0.288 0.200 25 to 29 years 2.042 2.471 2.46 2.237 1.292 0.981 0.333 1.586 1.823 1.901 1.730 1.206 0.845 0.613 30 to 34 years 3.664 3.969 3.852 3.949 3.234 2.751 1.952 3.072 3.498 3.559 3.137 2.455 1.694 1.129 35 to 39 years 5.061 5.231 5.837 5.342 4.263 3.852 3.484 4.443 4.253 4.868 4.758 3.764 3.143 2.404 40 to 44 years 6.279 6.504 6.727 6.286 5.816 4.93 3.667 5.575 5.253 6.237 5.840 5.190 4.782 3.853 45 to 49 years 6.734 6.762 7.125 7.073 5.433 5.689 2.733 6.238 6.773 6.916 5.674 5.303 4.345 4.000 TFR 4.35 4.58 4.69 4.51 4.29 3.10 2.80 3.84 4.73 4.47 3.93 2.86 2.23 2.52 Source: 1994 FSM Census, Table P102; 2000 FSM Census, Table P4-3.
Another determinant of fertility was whether a mother was in the labor force or not. Table 4.8 presents a comparison of the 1994 and 2000 data on fertility rates for women who were in the labor force, employed or unemployed, and those not in the labor force. As would be expected, in both years, those women who were in the labor force had lower fertility levels (TFR of 3.4) than the women who were not in the labor force (TFR of 4.5), probably because women who had children in the year before the census took themselves out of the labor force to care for their child. Within the labor force, women working full time (35+ hours) had the lowest fertility rates. Women who were looking for work (or unemployed) had higher fertility rates. Table 4.8: Children Ever Born per Woman and TFR by Labor Force Participation, Chuuk State: 1994 and 2000 1994 2000 In the labor force (LF) Not in In the labor force Not in All Total Employed Unem- labor Total Employed Unem- labor Age groups women in LF Total 35+ hours ployed force women in LF Total 35+ hours ployed force 15 to 19 years 0.086 0.092 0.109 0.122 0.087 0.085 0.075 0.128 0.073 0.148 0.170 0.054 20 to 24 years 0.651 0.524 0.553 0.407 0.503 0.708 0.630 0.594 0.574 0.239 0.610 0.677 25 to 29 years 2.042 1.526 1.347 1.160 1.761 2.286 1.586 1.462 1.359 0.893 1.582 1.768 30 to 34 years 3.664 3.258 3.039 2.804 3.649 3.840 3.072 2.946 2.943 1.794 2.951 3.271 35 to 39 years 5.061 4.432 4.272 4.014 4.795 5.427 4.443 4.350 4.363 3.825 4.327 4.605 40 to 44 years 6.279 5.713 5.413 5.247 6.326 6.595 5.575 5.467 5.518 4.380 5.309 5.732 45 to 49 years 6.734 6.322 6.130 6.273 6.808 6.915 6.238 6.083 6.055 4.636 6.172 6.458 TFR 4.35 3.50 3.45 3.15 3.57 4.78 3.84 3.47 3.31 2.57 3.59 4.51 Source: 1994 FSM Census, Table P134; 2000 FSM Census, Table P9-3.
Finally, fertility differentials by region are considered in Table 4.9. The reported age specific fertility rate was used to assess the differentials in current level of fertility. Faichuk had the highest fertility rates in both 1994 and 2000. Mortlocks had the lowest fertility rates for both censuses. In both years Faichuk had higher fertility rates at the younger and older ages, suggesting the absence of family planning. The relatively lower level of fertility for the Mortlocks could be the result of more females enrolled in school and delay in marriage. In both years, fertility peaks at ages 25-29 or 30-34 in all the regions. Table 4.9: Age-specific Fertility Rates by Region, Chuuk State: 1994 and 2000
1994 2000 Age groups Total N. Namon. S. Namon. Faichuk Mortlocks Oksoritod Total N. Namon. S. Namon. Faichuk Mortlocks Oksoritod 15 to 19 years 0.026 0.023 0.024 0.044 0.021 0.007 0.028 0.018 0.036 0.023 0.033 0.047 20 to 24 years 0.126 0.127 0.123 0.134 0.117 0.127 0.139 0.136 0.125 0.159 0.149 0.115 25 to 29 years 0.194 0.185 0.182 0.225 0.133 0.250 0.187 0.182 0.253 0.191 0.106 0.172 30 to 34 years 0.202 0.175 0.189 0.232 0.211 0.243 0.183 0.175 0.200 0.214 0.132 0.160 35 to 39 years 0.160 0.146 0.151 0.189 0.151 0.173 0.137 0.121 0.168 0.169 0.122 0.078 40 to 44 years 0.119 0.107 0.138 0.178 0.058 0.042 0.070 0.060 0.078 0.107 0.039 0.046 45 to 49 years 0.040 0.051 0.030 0.059 0.008 0.034 0.024 0.020 0.021 0.045 0.013 0.009 TFR 4.35 4.07 4.19 5.30 3.49 4.38 3.84 3.56 4.40 4.54 2.97 3.13 Source: 1994 and 2000 FSM Censuses, Unpublished data Children ever born per woman provide an estimate of how many children a woman is likely to have had by the time she has reached a specified age group. This measure does not reflect current fertility, except for the youngest age group.
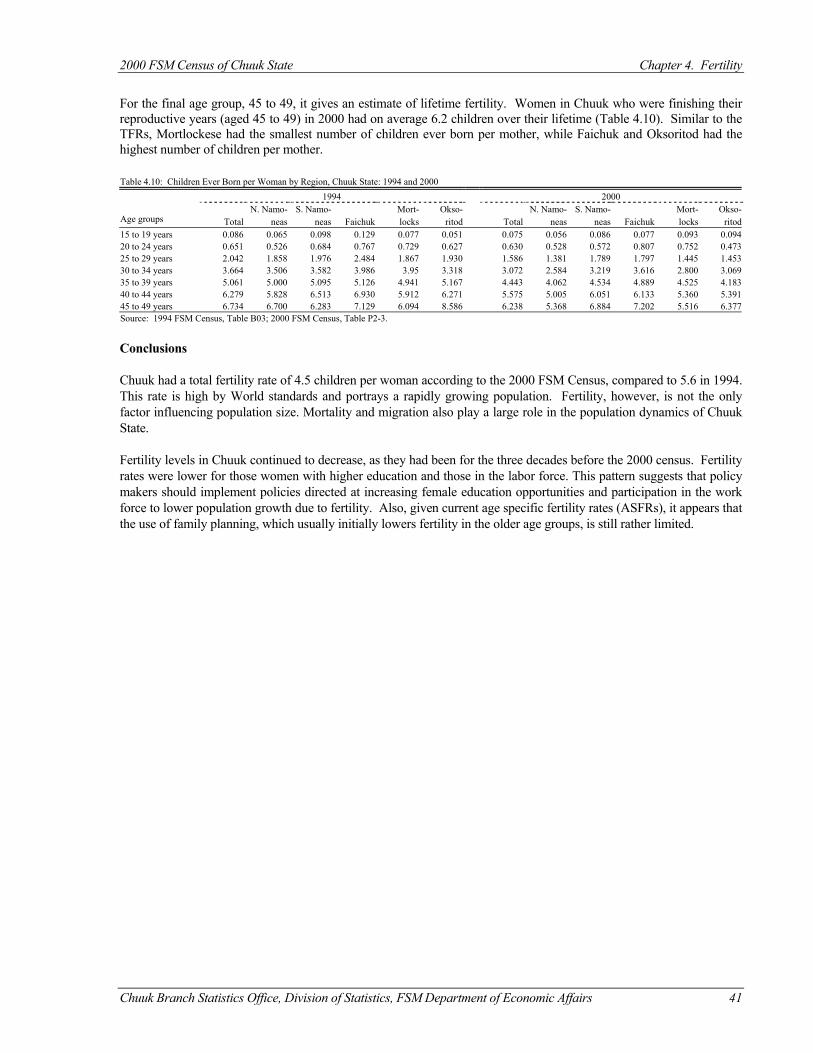
2000 FSM Census of Chuuk State Chapter 4. Fertility
Chuuk Branch Statistics Office, Division of Statistics, FSM Department of Economic Affairs 41
For the final age group, 45 to 49, it gives an estimate of lifetime fertility. Women in Chuuk who were finishing their reproductive years (aged 45 to 49) in 2000 had on average 6.2 children over their lifetime (Table 4.10). Similar to the TFRs, Mortlockese had the smallest number of children ever born per mother, while Faichuk and Oksoritod had the highest number of children per mother. Table 4.10: Children Ever Born per Woman by Region, Chuuk State: 1994 and 2000
1994 2000 N. Namo- S. Namo- Mort- Okso- N. Namo- S. Namo- Mort- Okso-
Age groups Total neas neas Faichuk locks ritod Total neas neas Faichuk locks ritod 15 to 19 years 0.086 0.065 0.098 0.129 0.077 0.051 0.075 0.056 0.086 0.077 0.093 0.094 20 to 24 years 0.651 0.526 0.684 0.767 0.729 0.627 0.630 0.528 0.572 0.807 0.752 0.473 25 to 29 years 2.042 1.858 1.976 2.484 1.867 1.930 1.586 1.381 1.789 1.797 1.445 1.453 30 to 34 years 3.664 3.506 3.582 3.986 3.95 3.318 3.072 2.584 3.219 3.616 2.800 3.069 35 to 39 years 5.061 5.000 5.095 5.126 4.941 5.167 4.443 4.062 4.534 4.889 4.525 4.183 40 to 44 years 6.279 5.828 6.513 6.930 5.912 6.271 5.575 5.005 6.051 6.133 5.360 5.391 45 to 49 years 6.734 6.700 6.283 7.129 6.094 8.586 6.238 5.368 6.884 7.202 5.516 6.377 Source: 1994 FSM Census, Table B03; 2000 FSM Census, Table P2-3.
Conclusions Chuuk had a total fertility rate of 4.5 children per woman according to the 2000 FSM Census, compared to 5.6 in 1994. This rate is high by World standards and portrays a rapidly growing population. Fertility, however, is not the only factor influencing population size. Mortality and migration also play a large role in the population dynamics of Chuuk State. Fertility levels in Chuuk continued to decrease, as they had been for the three decades before the 2000 census. Fertility rates were lower for those women with higher education and those in the labor force. This pattern suggests that policy makers should implement policies directed at increasing female education opportunities and participation in the work force to lower population growth due to fertility. Also, given current age specific fertility rates (ASFRs), it appears that the use of family planning, which usually initially lowers fertility in the older age groups, is still rather limited.

Chuuk Branch Statistics Office, Division of Statistics, FSM Department of Economic Affairs 43
CHAPTER 5 MORTALITY
Introduction As reported in Chapter 4, fertility rates in the State of Chuuk declined over nearly three decades before the 2000 Census. However, mortality rates of Chuuk had already been brought to a moderately low level and thus little decline occurred in between 1994 and 2000. In this chapter mortality is estimated directly from available registration data, and indirectly from recent censuses in the FSM to find the level and trend of mortality over time in the FSM. Data Description Mortality cannot be estimated through direct methods from the census data because no direct questions were asked regarding deaths. Indirect estimates of early age mortality can be derived from the questions concerning children ever born and children still alive (questionnaire item 17a). The proportion of children surviving can be applied to model life tables to produce basic mortality rates. Children ever born and surviving were asked to women in the 1973, 1980, 1989 and 1994 Censuses as well and data are provided for comparison. Mortality indices of interest are crude death rate, infant mortality rate, child mortality rate, and life expectancy at birth. The crude death rate (CDR) is the most common direct measure of mortality and is defined as the number of deaths per 1,000 persons. Similar to the crude birth rate, the crude death rate is dependent on the age-sex structure, thus it is a crude measure. An adjustment on the CDR must be made before any attempt to compare mortality over time or for different regions or countries can be made. The infant mortality rate (IMR) is defined as the number of infant deaths per 1,000 live births during the year. The IMR is a good indicator of the quality of health care in a nation because mortality is high during the first months of life and small improvements can be measured. It is also an adjusted measure that is not dependent on the age-sex structure of a region. The child mortality rate is defined as the probability of dying between ages 1 and 5. Life expectancy at birth is the average number of years a newborn baby can expect to live, given the current level and pattern of mortality. Unlike the crude birth rate this measure is independent of the age structure of a nation and is thus a good measure for comparison between countries or regions. Life expectancy is obtained from a life table constructed based on a set of age specific death rates, from which probability of surviving to a specific age is determined. These survival probabilities are applied to an assumed cohort of births that occurred in the same year, following the survivors as they reach successive ages until all have eventually died. From the total number of all years lived, probability of survival between the ages and life expectancies at the various ages is estimated (see Arriaga, E.E. et al., 1994 pp 74-83 for details on the derivation). In Chuuk, however, deaths are under-registered, making it difficult to obtain the life table from age specific death rates calculated from registration data. As an alternative, a life table implied by childhood survivorship ratios has been presented in this chapter. Analysis of Mortality Data Direct measures of mortality could be calculated using deaths registered with the Department of Health. Unfortunately these events are under-registered and inconsistently covered, providing only a guide to the patterns of mortality but not to the level. To compensate for the different levels of coverage and to smooth some erratic patterns, Table 5.1 presents two four-year averages of mortality rates. In both cases the CDR was approximately four per thousand which is an under count. The CDR is calculated using the total number of deaths in a year divided by the estimated mid-period population. Age-specific mortality rates in the case of the Chuuk were erratic and inaccurate because of the small number of persons and deaths and because of inaccuracies in reporting. Crude Death Rate The crude death rate, based on the registration system, is likely to be an underestimate due to under-registration of deaths. In order to get better estimates of mortality, an indirect method was used to calculate child and infant mortality and find a model life table applicable to the State of Chuuk. The life table is basically a statistical model of mortality experience based on given mortality rates. Model life tables allow us to project mortality rates (and other demographic
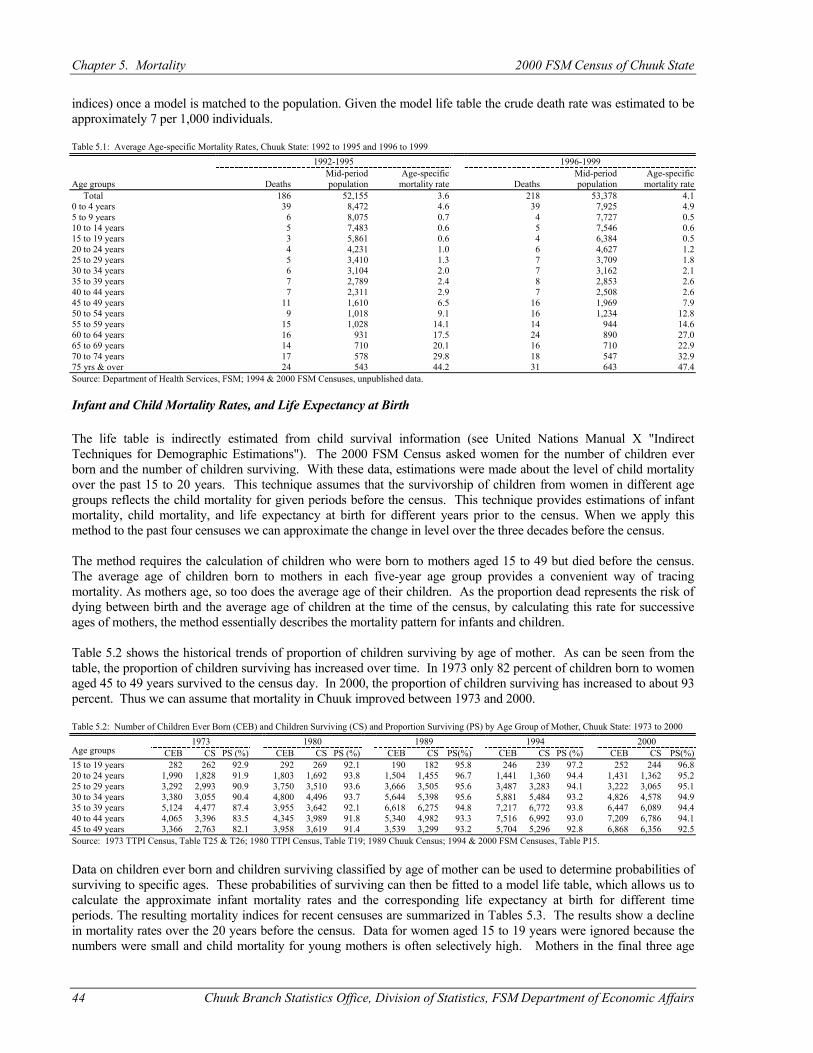
Chapter 5. Mortality 2000 FSM Census of Chuuk State
44 Chuuk Branch Statistics Office, Division of Statistics, FSM Department of Economic Affairs
indices) once a model is matched to the population. Given the model life table the crude death rate was estimated to be approximately 7 per 1,000 individuals. Table 5.1: Average Age-specific Mortality Rates, Chuuk State: 1992 to 1995 and 1996 to 1999
1992-1995 1996-1999 Mid-period Age-specific Mid-period Age-specific
Age groups Deaths population mortality rate Deaths population mortality rate Total 186 52,155 3.6 218 53,378 4.1 0 to 4 years 39 8,472 4.6 39 7,925 4.9 5 to 9 years 6 8,075 0.7 4 7,727 0.5 10 to 14 years 5 7,483 0.6 5 7,546 0.6 15 to 19 years 3 5,861 0.6 4 6,384 0.5 20 to 24 years 4 4,231 1.0 6 4,627 1.2 25 to 29 years 5 3,410 1.3 7 3,709 1.8 30 to 34 years 6 3,104 2.0 7 3,162 2.1 35 to 39 years 7 2,789 2.4 8 2,853 2.6 40 to 44 years 7 2,311 2.9 7 2,508 2.6 45 to 49 years 11 1,610 6.5 16 1,969 7.9 50 to 54 years 9 1,018 9.1 16 1,234 12.8 55 to 59 years 15 1,028 14.1 14 944 14.6 60 to 64 years 16 931 17.5 24 890 27.0 65 to 69 years 14 710 20.1 16 710 22.9 70 to 74 years 17 578 29.8 18 547 32.9 75 yrs & over 24 543 44.2 31 643 47.4 Source: Department of Health Services, FSM; 1994 & 2000 FSM Censuses, unpublished data. Infant and Child Mortality Rates, and Life Expectancy at Birth The life table is indirectly estimated from child survival information (see United Nations Manual X "Indirect Techniques for Demographic Estimations"). The 2000 FSM Census asked women for the number of children ever born and the number of children surviving. With these data, estimations were made about the level of child mortality over the past 15 to 20 years. This technique assumes that the survivorship of children from women in different age groups reflects the child mortality for given periods before the census. This technique provides estimations of infant mortality, child mortality, and life expectancy at birth for different years prior to the census. When we apply this method to the past four censuses we can approximate the change in level over the three decades before the census. The method requires the calculation of children who were born to mothers aged 15 to 49 but died before the census. The average age of children born to mothers in each five-year age group provides a convenient way of tracing mortality. As mothers age, so too does the average age of their children. As the proportion dead represents the risk of dying between birth and the average age of children at the time of the census, by calculating this rate for successive ages of mothers, the method essentially describes the mortality pattern for infants and children. Table 5.2 shows the historical trends of proportion of children surviving by age of mother. As can be seen from the table, the proportion of children surviving has increased over time. In 1973 only 82 percent of children born to women aged 45 to 49 years survived to the census day. In 2000, the proportion of children surviving has increased to about 93 percent. Thus we can assume that mortality in Chuuk improved between 1973 and 2000. Table 5.2: Number of Children Ever Born (CEB) and Children Surviving (CS) and Proportion Surviving (PS) by Age Group of Mother, Chuuk State: 1973 to 2000
1973 1980 1989 1994 2000 Age groups CEB CS PS (%) CEB CS PS (%) CEB CS PS(%) CEB CS PS (%) CEB CS PS(%) 15 to 19 years 282 262 92.9 292 269 92.1 190 182 95.8 246 239 97.2 252 244 96.8 20 to 24 years 1,990 1,828 91.9 1,803 1,692 93.8 1,504 1,455 96.7 1,441 1,360 94.4 1,431 1,362 95.2 25 to 29 years 3,292 2,993 90.9 3,750 3,510 93.6 3,666 3,505 95.6 3,487 3,283 94.1 3,222 3,065 95.1 30 to 34 years 3,380 3,055 90.4 4,800 4,496 93.7 5,644 5,398 95.6 5,881 5,484 93.2 4,826 4,578 94.9 35 to 39 years 5,124 4,477 87.4 3,955 3,642 92.1 6,618 6,275 94.8 7,217 6,772 93.8 6,447 6,089 94.4 40 to 44 years 4,065 3,396 83.5 4,345 3,989 91.8 5,340 4,982 93.3 7,516 6,992 93.0 7,209 6,786 94.1 45 to 49 years 3,366 2,763 82.1 3,958 3,619 91.4 3,539 3,299 93.2 5,704 5,296 92.8 6,868 6,356 92.5 Source: 1973 TTPI Census, Table T25 & T26; 1980 TTPI Census, Table T19; 1989 Chuuk Census; 1994 & 2000 FSM Censuses, Table P15. Data on children ever born and children surviving classified by age of mother can be used to determine probabilities of surviving to specific ages. These probabilities of surviving can then be fitted to a model life table, which allows us to calculate the approximate infant mortality rates and the corresponding life expectancy at birth for different time periods. The resulting mortality indices for recent censuses are summarized in Tables 5.3. The results show a decline in mortality rates over the 20 years before the census. Data for women aged 15 to 19 years were ignored because the numbers were small and child mortality for young mothers is often selectively high. Mothers in the final three age
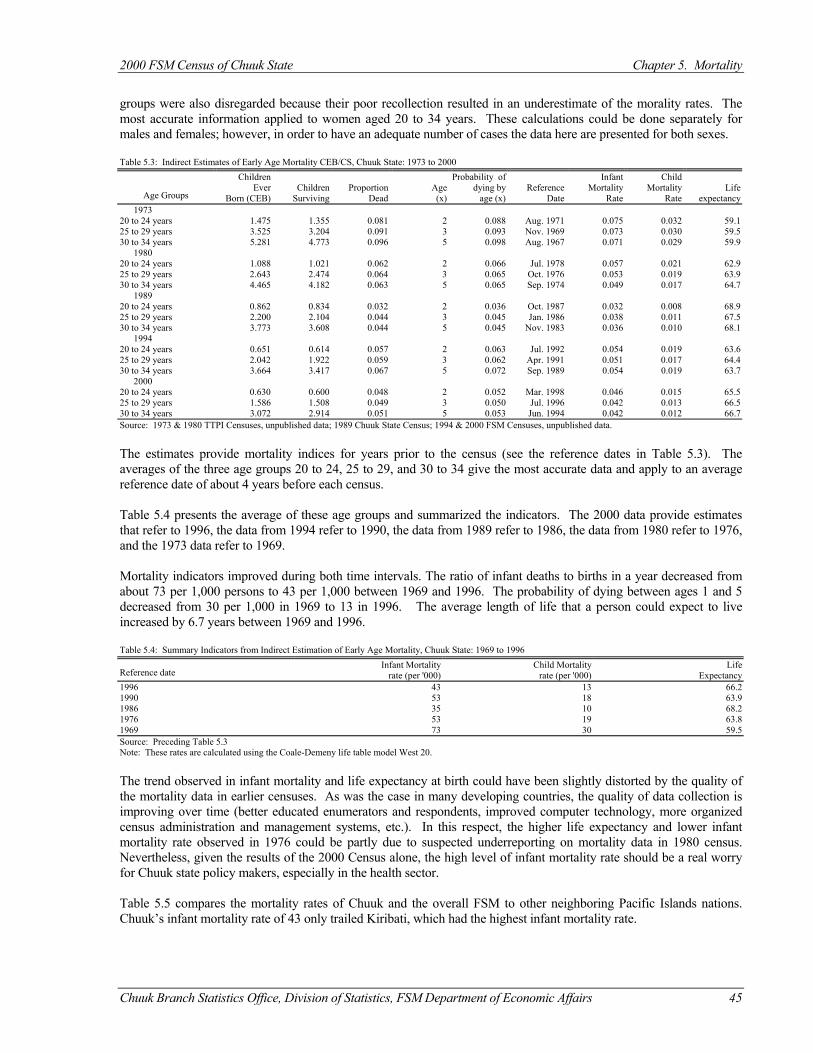
2000 FSM Census of Chuuk State Chapter 5. Mortality
Chuuk Branch Statistics Office, Division of Statistics, FSM Department of Economic Affairs 45
groups were also disregarded because their poor recollection resulted in an underestimate of the morality rates. The most accurate information applied to women aged 20 to 34 years. These calculations could be done separately for males and females; however, in order to have an adequate number of cases the data here are presented for both sexes. Table 5.3: Indirect Estimates of Early Age Mortality CEB/CS, Chuuk State: 1973 to 2000
Children Probability of Infant Child Ever Children Proportion Age dying by Reference Mortality Mortality Life
Age Groups Born (CEB) Surviving Dead (x) age (x) Date Rate Rate expectancy 1973 20 to 24 years 1.475 1.355 0.081 2 0.088 Aug. 1971 0.075 0.032 59.1 25 to 29 years 3.525 3.204 0.091 3 0.093 Nov. 1969 0.073 0.030 59.5 30 to 34 years 5.281 4.773 0.096 5 0.098 Aug. 1967 0.071 0.029 59.9 1980 20 to 24 years 1.088 1.021 0.062 2 0.066 Jul. 1978 0.057 0.021 62.9 25 to 29 years 2.643 2.474 0.064 3 0.065 Oct. 1976 0.053 0.019 63.9 30 to 34 years 4.465 4.182 0.063 5 0.065 Sep. 1974 0.049 0.017 64.7 1989 20 to 24 years 0.862 0.834 0.032 2 0.036 Oct. 1987 0.032 0.008 68.9 25 to 29 years 2.200 2.104 0.044 3 0.045 Jan. 1986 0.038 0.011 67.5 30 to 34 years 3.773 3.608 0.044 5 0.045 Nov. 1983 0.036 0.010 68.1 1994 20 to 24 years 0.651 0.614 0.057 2 0.063 Jul. 1992 0.054 0.019 63.6 25 to 29 years 2.042 1.922 0.059 3 0.062 Apr. 1991 0.051 0.017 64.4 30 to 34 years 3.664 3.417 0.067 5 0.072 Sep. 1989 0.054 0.019 63.7 2000 20 to 24 years 0.630 0.600 0.048 2 0.052 Mar. 1998 0.046 0.015 65.5 25 to 29 years 1.586 1.508 0.049 3 0.050 Jul. 1996 0.042 0.013 66.5 30 to 34 years 3.072 2.914 0.051 5 0.053 Jun. 1994 0.042 0.012 66.7 Source: 1973 & 1980 TTPI Censuses, unpublished data; 1989 Chuuk State Census; 1994 & 2000 FSM Censuses, unpublished data. The estimates provide mortality indices for years prior to the census (see the reference dates in Table 5.3). The averages of the three age groups 20 to 24, 25 to 29, and 30 to 34 give the most accurate data and apply to an average reference date of about 4 years before each census. Table 5.4 presents the average of these age groups and summarized the indicators. The 2000 data provide estimates that refer to 1996, the data from 1994 refer to 1990, the data from 1989 refer to 1986, the data from 1980 refer to 1976, and the 1973 data refer to 1969. Mortality indicators improved during both time intervals. The ratio of infant deaths to births in a year decreased from about 73 per 1,000 persons to 43 per 1,000 between 1969 and 1996. The probability of dying between ages 1 and 5 decreased from 30 per 1,000 in 1969 to 13 in 1996. The average length of life that a person could expect to live increased by 6.7 years between 1969 and 1996. Table 5.4: Summary Indicators from Indirect Estimation of Early Age Mortality, Chuuk State: 1969 to 1996
Infant Mortality Child Mortality Life Reference date rate (per '000) rate (per '000) Expectancy 1996 43 13 66.2 1990 53 18 63.9 1986 35 10 68.2 1976 53 19 63.8 1969 73 30 59.5 Source: Preceding Table 5.3 Note: These rates are calculated using the Coale-Demeny life table model West 20. The trend observed in infant mortality and life expectancy at birth could have been slightly distorted by the quality of the mortality data in earlier censuses. As was the case in many developing countries, the quality of data collection is improving over time (better educated enumerators and respondents, improved computer technology, more organized census administration and management systems, etc.). In this respect, the higher life expectancy and lower infant mortality rate observed in 1976 could be partly due to suspected underreporting on mortality data in 1980 census. Nevertheless, given the results of the 2000 Census alone, the high level of infant mortality rate should be a real worry for Chuuk state policy makers, especially in the health sector. Table 5.5 compares the mortality rates of Chuuk and the overall FSM to other neighboring Pacific Islands nations. Chuuk’s infant mortality rate of 43 only trailed Kiribati, which had the highest infant mortality rate.
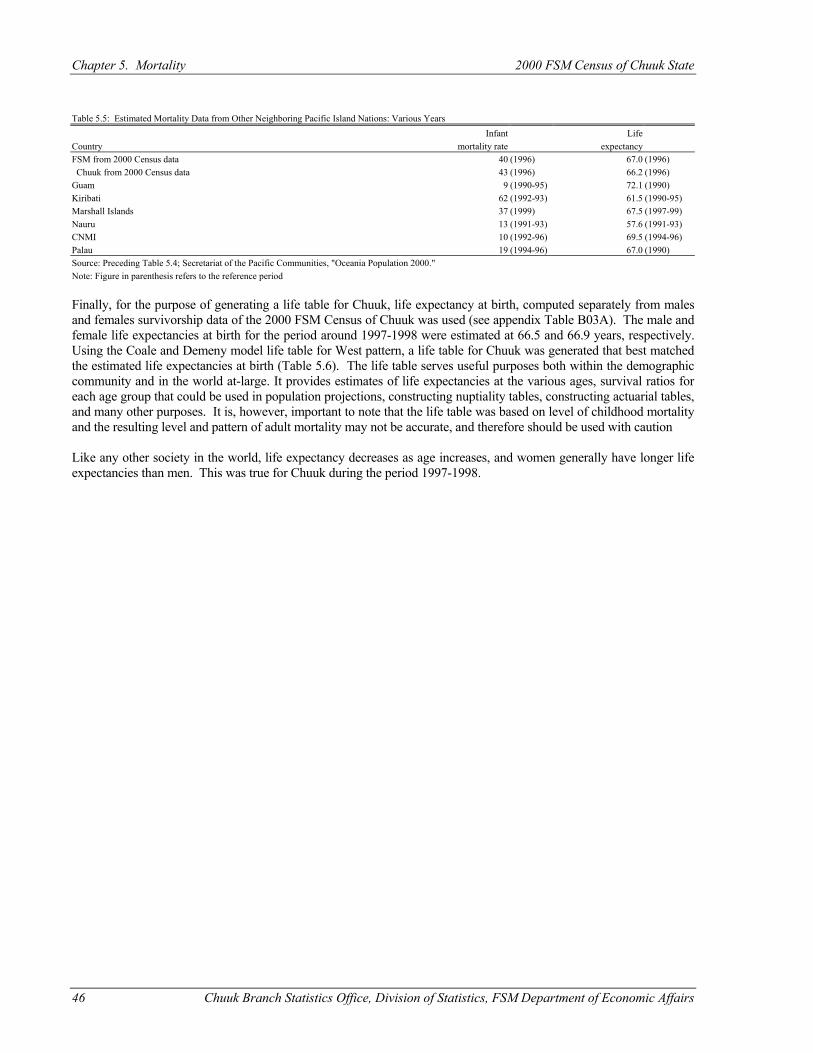
Chapter 5. Mortality 2000 FSM Census of Chuuk State
46 Chuuk Branch Statistics Office, Division of Statistics, FSM Department of Economic Affairs
Table 5.5: Estimated Mortality Data from Other Neighboring Pacific Island Nations: Various Years Infant Life Country mortality rate expectancy FSM from 2000 Census data 40 (1996) 67.0 (1996) Chuuk from 2000 Census data 43 (1996) 66.2 (1996) Guam 9 (1990-95) 72.1 (1990) Kiribati 62 (1992-93) 61.5 (1990-95) Marshall Islands 37 (1999) 67.5 (1997-99) Nauru 13 (1991-93) 57.6 (1991-93) CNMI 10 (1992-96) 69.5 (1994-96) Palau 19 (1994-96) 67.0 (1990) Source: Preceding Table 5.4; Secretariat of the Pacific Communities, "Oceania Population 2000." Note: Figure in parenthesis refers to the reference period Finally, for the purpose of generating a life table for Chuuk, life expectancy at birth, computed separately from males and females survivorship data of the 2000 FSM Census of Chuuk was used (see appendix Table B03A). The male and female life expectancies at birth for the period around 1997-1998 were estimated at 66.5 and 66.9 years, respectively. Using the Coale and Demeny model life table for West pattern, a life table for Chuuk was generated that best matched the estimated life expectancies at birth (Table 5.6). The life table serves useful purposes both within the demographic community and in the world at-large. It provides estimates of life expectancies at the various ages, survival ratios for each age group that could be used in population projections, constructing nuptiality tables, constructing actuarial tables, and many other purposes. It is, however, important to note that the life table was based on level of childhood mortality and the resulting level and pattern of adult mortality may not be accurate, and therefore should be used with caution Like any other society in the world, life expectancy decreases as age increases, and women generally have longer life expectancies than men. This was true for Chuuk during the period 1997-1998.
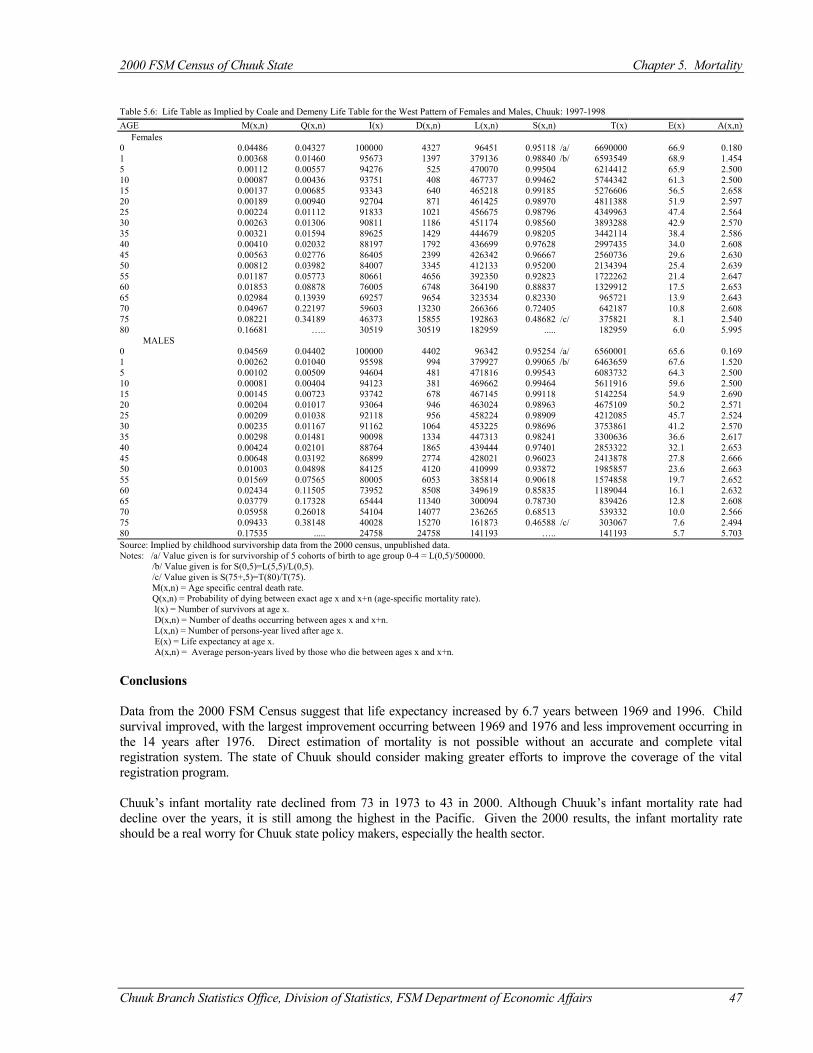
2000 FSM Census of Chuuk State Chapter 5. Mortality
Chuuk Branch Statistics Office, Division of Statistics, FSM Department of Economic Affairs 47
Table 5.6: Life Table as Implied by Coale and Demeny Life Table for the West Pattern of Females and Males, Chuuk: 1997-1998 AGE M(x,n) Q(x,n) I(x) D(x,n) L(x,n) S(x,n) T(x) E(x) A(x,n) Females 0 0.04486 0.04327 100000 4327 96451 0.95118 /a/ 6690000 66.9 0.180 1 0.00368 0.01460 95673 1397 379136 0.98840 /b/ 6593549 68.9 1.454 5 0.00112 0.00557 94276 525 470070 0.99504 6214412 65.9 2.500 10 0.00087 0.00436 93751 408 467737 0.99462 5744342 61.3 2.500 15 0.00137 0.00685 93343 640 465218 0.99185 5276606 56.5 2.658 20 0.00189 0.00940 92704 871 461425 0.98970 4811388 51.9 2.597 25 0.00224 0.01112 91833 1021 456675 0.98796 4349963 47.4 2.564 30 0.00263 0.01306 90811 1186 451174 0.98560 3893288 42.9 2.570 35 0.00321 0.01594 89625 1429 444679 0.98205 3442114 38.4 2.586 40 0.00410 0.02032 88197 1792 436699 0.97628 2997435 34.0 2.608 45 0.00563 0.02776 86405 2399 426342 0.96667 2560736 29.6 2.630 50 0.00812 0.03982 84007 3345 412133 0.95200 2134394 25.4 2.639 55 0.01187 0.05773 80661 4656 392350 0.92823 1722262 21.4 2.647 60 0.01853 0.08878 76005 6748 364190 0.88837 1329912 17.5 2.653 65 0.02984 0.13939 69257 9654 323534 0.82330 965721 13.9 2.643 70 0.04967 0.22197 59603 13230 266366 0.72405 642187 10.8 2.608 75 0.08221 0.34189 46373 15855 192863 0.48682 /c/ 375821 8.1 2.540 80 0.16681 ….. 30519 30519 182959 ..... 182959 6.0 5.995 MALES 0 0.04569 0.04402 100000 4402 96342 0.95254 /a/ 6560001 65.6 0.169 1 0.00262 0.01040 95598 994 379927 0.99065 /b/ 6463659 67.6 1.520 5 0.00102 0.00509 94604 481 471816 0.99543 6083732 64.3 2.500 10 0.00081 0.00404 94123 381 469662 0.99464 5611916 59.6 2.500 15 0.00145 0.00723 93742 678 467145 0.99118 5142254 54.9 2.690 20 0.00204 0.01017 93064 946 463024 0.98963 4675109 50.2 2.571 25 0.00209 0.01038 92118 956 458224 0.98909 4212085 45.7 2.524 30 0.00235 0.01167 91162 1064 453225 0.98696 3753861 41.2 2.570 35 0.00298 0.01481 90098 1334 447313 0.98241 3300636 36.6 2.617 40 0.00424 0.02101 88764 1865 439444 0.97401 2853322 32.1 2.653 45 0.00648 0.03192 86899 2774 428021 0.96023 2413878 27.8 2.666 50 0.01003 0.04898 84125 4120 410999 0.93872 1985857 23.6 2.663 55 0.01569 0.07565 80005 6053 385814 0.90618 1574858 19.7 2.652 60 0.02434 0.11505 73952 8508 349619 0.85835 1189044 16.1 2.632 65 0.03779 0.17328 65444 11340 300094 0.78730 839426 12.8 2.608 70 0.05958 0.26018 54104 14077 236265 0.68513 539332 10.0 2.566 75 0.09433 0.38148 40028 15270 161873 0.46588 /c/ 303067 7.6 2.494 80 0.17535 ..... 24758 24758 141193 ….. 141193 5.7 5.703 Source: Implied by childhood survivorship data from the 2000 census, unpublished data. Notes: /a/ Value given is for survivorship of 5 cohorts of birth to age group 0-4 = L(0,5)/500000. /b/ Value given is for S(0,5)=L(5,5)/L(0,5). /c/ Value given is S(75+,5)=T(80)/T(75). M(x,n) = Age specific central death rate. Q(x,n) = Probability of dying between exact age x and x+n (age-specific mortality rate). l(x) = Number of survivors at age x. D(x,n) = Number of deaths occurring between ages x and x+n. L(x,n) = Number of persons-year lived after age x. E(x) = Life expectancy at age x. A(x,n) = Average person-years lived by those who die between ages x and x+n. Conclusions Data from the 2000 FSM Census suggest that life expectancy increased by 6.7 years between 1969 and 1996. Child survival improved, with the largest improvement occurring between 1969 and 1976 and less improvement occurring in the 14 years after 1976. Direct estimation of mortality is not possible without an accurate and complete vital registration system. The state of Chuuk should consider making greater efforts to improve the coverage of the vital registration program. Chuuk’s infant mortality rate declined from 73 in 1973 to 43 in 2000. Although Chuuk’s infant mortality rate had decline over the years, it is still among the highest in the Pacific. Given the 2000 results, the infant mortality rate should be a real worry for Chuuk state policy makers, especially the health sector.

Chuuk Branch Statistics Office, Division of Statistics, FSM Department of Economic Affairs 49
CHAPTER 6 MIGRATION
Introduction In previous chapters, we discussed a number of demographic topics including population structure, fertility, and mortality. From these discussions, it is very clear that migration plays an important role in the population dynamics of Chuuk. Migration is one of the main determinants of population size and growth (the others are fertility and mortality). The measurement of migration, however, is more complex. Unlike fertility and mortality (which predictably happen once in each person's lifetime) people may not ever migrate and those that do may do so more than once and for different reasons. Some people migrate for employment, others for education, visiting, and so forth. Migration involves movement from one place to another. In the case of Chuuk, three main types of migration are present: 1) migration between Chuuk and other FSM States (referred to here as interstate); 2) migration between the Lagoon and Outer Islands (referred to here as internal); and 3) migration between Chuuk and outside of Chuuk, including other non-FSM states (referred to here as international migration). There is also migration between the regions and municipalities but because of the small numbers concerned, it is not desirable to make detailed analysis of them. A person who migrates is referred to as an immigrant or in-migrant with respect to the area of destination, and an emigrant or out-migrant with respect to the place of origin (in each case the former term is used for international migration and the latter for internal and interstate migration). Censuses are not the most reliable sources for measuring international migration. Data from other sources will be used in this report to provide at least some insight into emigration from Chuuk. On the other hand, the census is a reliable source for measuring internal and inter-state migration. Migration has emerged as an extremely important factor shaping the demography of the Pacific (Connell, 1990). This is true for Chuuk although the levels and patterns of migration differ in many respects from other parts of the Pacific. Because the Census asks different questions about migration, it actually defines migration in different ways for different purposes. This is an important point for census data users to understand because it means that different migration figures presented in the different tables may not be strictly comparable with each other. For example, even though data on birthplace and residence 5 years ago provide a basis for measuring migration, the measures obtained are defined differently, serve different purposes, and are not comparable. For the same reason, unlike with fertility or mortality, it is not easy to make comparisons of levels of internal migration between different countries. Data Description Birthplace The 2000 Census asked for details of everyone's place of birth and recorded island/village, municipality, and FSM states if a person was born in the FSM. When a person's birthplace was outside FSM, the name of the foreign country was recorded. Citizenship and Legal Residence Details of citizenship were obtained for all persons in the FSM. The question requested the municipality and state of legal residence (place where a person is a registered voter) for FSM citizens. For non-FSM citizens, the country of citizenship was recorded. Continuous Residence Continuous residence was obtained from questionnaire items P11a and P11b, asked of all persons residing in the FSM. The question requested respondents to provide the month and year they started living continuously at the present place of residence. If respondents had not been living continuously in the present residence since birth, they were requested to provide the name of the municipality, FSM State, or foreign country in which they previously resided. Residence in 1995 All individuals who responded that they lived in a different municipality or overseas on April 1, 1995 (five years prior to the census) were requested to give the name of the municipality and FSM state, or foreign country of residence.
Chapter 6. Migration 2000 FSM Census of Chuuk State
50 Chuuk Branch Statistics Office, Division of Statistics, FSM Department of Economic Affairs
Limitations and Comparability. Due to changes in the boundaries of foreign countries over the past decades, some persons may have reported their place of birth in terms of boundaries that existed at the time of their birth but have since changed. Not all migratory moves in the five years before the census were covered. For example, some persons may have resided in the same place in 1994 and 2000 but moved in the interim. This migration was not taken into account. Where persons moved more than once in the five years before the census, only the place of residence five years before and the current place of residence were recorded. Analysis of Migration Data The data from the 2000 Census was used to determine the migration patterns in Chuuk, including place of birth, citizenship, continuous residence, and residence in 1995. These are compared with the 1989 and 1994 Censuses (if available) and are also used to analyze the changes that took place over time. Birthplace Birthplace provides useful data on lifetime migration and mobility patterns, covering an indefinite time interval, determined by people's ages and the timing and direction of movement. Table 6.1 compares the birthplace of Chuuk residents in 1989, 1994 and 2000. With few exceptions, the data shows that the overseas-born immigrant population to Chuuk was primarily male, especially from other FSM States in 2000 and Asia in 1994 and again in 1989. These differences in sexes could have important implications for future composition of the Chuuk population, particularly if the international migration were to increase. The figures suggest that immigration, particularly from Asia, increased rapidly between 1989 and 1994, but fell in 2000. While the Chuuk-born population grew by more than 1 percent (746persons) between census years 1994 and 2000, the Asian-born population decreased by more about 90 percent (438 persons) during the same period. Table 6.1: Birthplace of Chuuk Residents by Sex: 1989 to 2000 1989 Males per 1994 Males per 2000 Males per Birthplace Total Males Females 100 females Total Males Females 100 females Total Males Females 100 females Total 47,871 24,203 23,668 102.3 53,319 27,299 26,020 104.9 53,595 27,158 26,437 102.7 Chuuk 46,829 23,605 23,224 101.6 52,347 26,562 25,785 103.0 53,093 26,846 26,247 102.3 Outside Chuuk 1,042 598 444 134.7 972 737 235 313.6 502 312 190 164.2 Other FSM States 406 221 185 119.5 224 134 90 148.9 192 128 64 200.0 USA 232 131 101 129.7 212 118 94 125.5 80 49 31 158.1 Asia 69 47 22 213.6 489 454 35 1,297.1 51 38 13 292.3 Elsewhere 335 199 136 146.3 47 31 16 193.8 179 97 82 118.3 Source: 1989 Chuuk Censuses; 1994 FSM Census, Table P17; 2000 FSM Census, Table P2-5..
Table 6.2 shows place of usual residence by country of birth for 1994 and 2000 to reveal some details about international migration. In census year 2000, 99 percent of Chuuk residents were born in Chuuk. The immigrant population accounted for about 1 percent of the total population (a 1 percent drop from 1994). The immigrant population comprised of foreigners (including other FSM State persons) and Chuukese born overseas who had returned to Chuuk. Between 1994 and 2000, the number of foreign-born individuals in Chuuk was reduced: Asians by 438, Americans by 132 and other Micronesians States by 32 persons. The only increase was for individuals born ‘elsewhere’ by 132 persons. The largest proportion among all the foreign-born people in Chuuk at the time of 2000 Census was from the other FSM states, while during the 1994 Census was from Asia, comprised mostly of Chinese-born fishermen. Almost all of the Chuuk residents were born in their place of residence. The highest percentage of foreign-born in Chuuk Lagoon were those born in other FSM states, accounting for almost half (46 percent) of the foreign-born population. Similarly, the majority (78 percent) of foreigners in the Outer Islands were born in other FSM States.
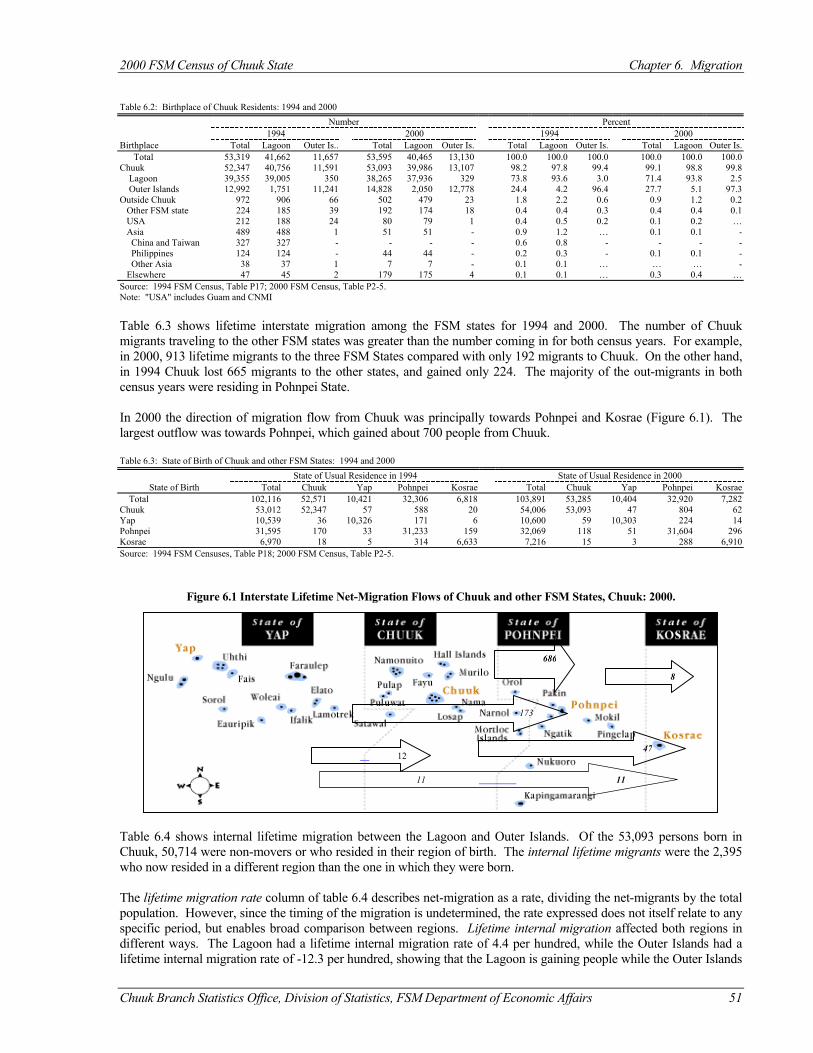
2000 FSM Census of Chuuk State Chapter 6. Migration
Chuuk Branch Statistics Office, Division of Statistics, FSM Department of Economic Affairs 51
Table 6.2: Birthplace of Chuuk Residents: 1994 and 2000 Number Percent 1994 2000 1994 2000 Birthplace Total Lagoon Outer Is.. Total Lagoon Outer Is. Total Lagoon Outer Is. Total Lagoon Outer Is. Total 53,319 41,662 11,657 53,595 40,465 13,130 100.0 100.0 100.0 100.0 100.0 100.0 Chuuk 52,347 40,756 11,591 53,093 39,986 13,107 98.2 97.8 99.4 99.1 98.8 99.8 Lagoon 39,355 39,005 350 38,265 37,936 329 73.8 93.6 3.0 71.4 93.8 2.5 Outer Islands 12,992 1,751 11,241 14,828 2,050 12,778 24.4 4.2 96.4 27.7 5.1 97.3 Outside Chuuk 972 906 66 502 479 23 1.8 2.2 0.6 0.9 1.2 0.2 Other FSM state 224 185 39 192 174 18 0.4 0.4 0.3 0.4 0.4 0.1 USA 212 188 24 80 79 1 0.4 0.5 0.2 0.1 0.2 … Asia 489 488 1 51 51 - 0.9 1.2 … 0.1 0.1 - China and Taiwan 327 327 - - - - 0.6 0.8 - - - - Philippines 124 124 - 44 44 - 0.2 0.3 - 0.1 0.1 - Other Asia 38 37 1 7 7 - 0.1 0.1 … … … - Elsewhere 47 45 2 179 175 4 0.1 0.1 … 0.3 0.4 … Source: 1994 FSM Census, Table P17; 2000 FSM Census, Table P2-5. Note: "USA" includes Guam and CNMI Table 6.3 shows lifetime interstate migration among the FSM states for 1994 and 2000. The number of Chuuk migrants traveling to the other FSM states was greater than the number coming in for both census years. For example, in 2000, 913 lifetime migrants to the three FSM States compared with only 192 migrants to Chuuk. On the other hand, in 1994 Chuuk lost 665 migrants to the other states, and gained only 224. The majority of the out-migrants in both census years were residing in Pohnpei State. In 2000 the direction of migration flow from Chuuk was principally towards Pohnpei and Kosrae (Figure 6.1). The largest outflow was towards Pohnpei, which gained about 700 people from Chuuk. Table 6.3: State of Birth of Chuuk and other FSM States: 1994 and 2000 State of Usual Residence in 1994 State of Usual Residence in 2000
State of Birth Total Chuuk Yap Pohnpei Kosrae Total Chuuk Yap Pohnpei Kosrae Total 102,116 52,571 10,421 32,306 6,818 103,891 53,285 10,404 32,920 7,282 Chuuk 53,012 52,347 57 588 20 54,006 53,093 47 804 62 Yap 10,539 36 10,326 171 6 10,600 59 10,303 224 14 Pohnpei 31,595 170 33 31,233 159 32,069 118 51 31,604 296 Kosrae 6,970 18 5 314 6,633 7,216 15 3 288 6,910 Source: 1994 FSM Censuses, Table P18; 2000 FSM Census, Table P2-5.
Figure 6.1 Interstate Lifetime Net-Migration Flows of Chuuk and other FSM States, Chuuk: 2000.
Table 6.4 shows internal lifetime migration between the Lagoon and Outer Islands. Of the 53,093 persons born in Chuuk, 50,714 were non-movers or who resided in their region of birth. The internal lifetime migrants were the 2,395 who now resided in a different region than the one in which they were born. The lifetime migration rate column of table 6.4 describes net-migration as a rate, dividing the net-migrants by the total population. However, since the timing of the migration is undetermined, the rate expressed does not itself relate to any specific period, but enables broad comparison between regions. Lifetime internal migration affected both regions in different ways. The Lagoon had a lifetime internal migration rate of 4.4 per hundred, while the Outer Islands had a lifetime internal migration rate of -12.3 per hundred, showing that the Lagoon is gaining people while the Outer Islands
173
47
11 11
686
12
8
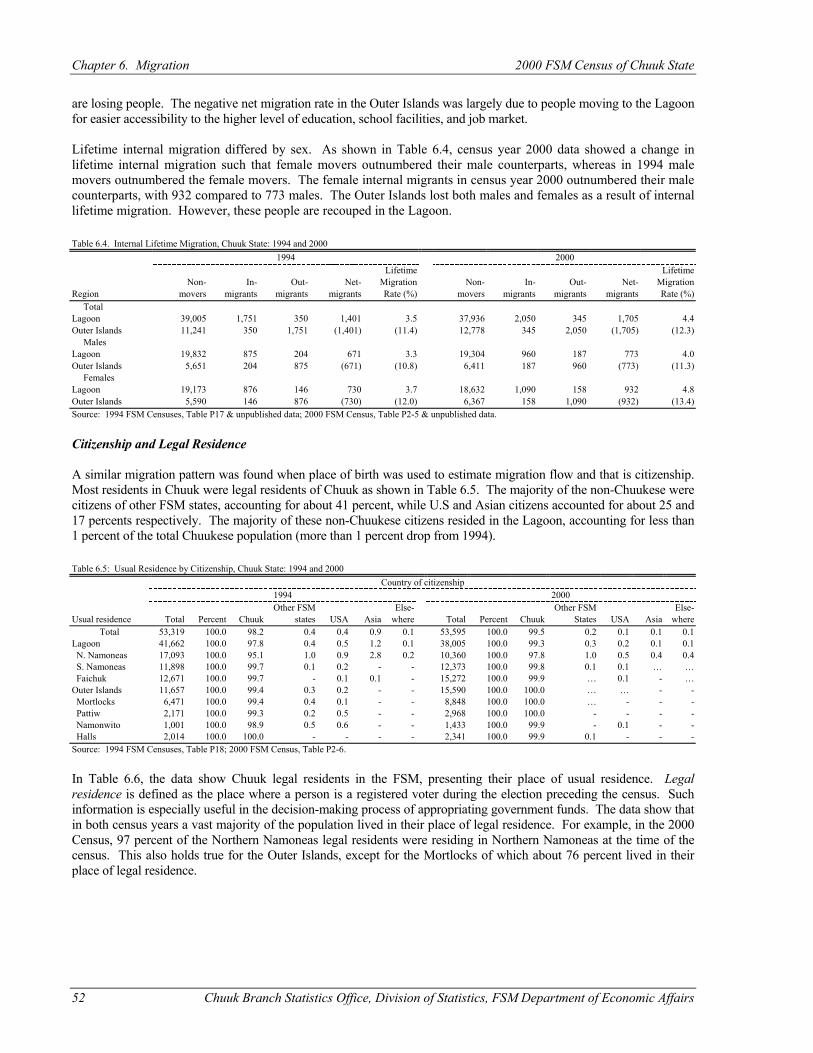
Chapter 6. Migration 2000 FSM Census of Chuuk State
52 Chuuk Branch Statistics Office, Division of Statistics, FSM Department of Economic Affairs
are losing people. The negative net migration rate in the Outer Islands was largely due to people moving to the Lagoon for easier accessibility to the higher level of education, school facilities, and job market. Lifetime internal migration differed by sex. As shown in Table 6.4, census year 2000 data showed a change in lifetime internal migration such that female movers outnumbered their male counterparts, whereas in 1994 male movers outnumbered the female movers. The female internal migrants in census year 2000 outnumbered their male counterparts, with 932 compared to 773 males. The Outer Islands lost both males and females as a result of internal lifetime migration. However, these people are recouped in the Lagoon. Table 6.4. Internal Lifetime Migration, Chuuk State: 1994 and 2000
1994 2000 Lifetime Lifetime Non- In- Out- Net- Migration Non- In- Out- Net- Migration
Region movers migrants migrants migrants Rate (%) movers migrants migrants migrants Rate (%) Total Lagoon 39,005 1,751 350 1,401 3.5 37,936 2,050 345 1,705 4.4 Outer Islands 11,241 350 1,751 (1,401) (11.4) 12,778 345 2,050 (1,705) (12.3) Males Lagoon 19,832 875 204 671 3.3 19,304 960 187 773 4.0 Outer Islands 5,651 204 875 (671) (10.8) 6,411 187 960 (773) (11.3) Females Lagoon 19,173 876 146 730 3.7 18,632 1,090 158 932 4.8 Outer Islands 5,590 146 876 (730) (12.0) 6,367 158 1,090 (932) (13.4) Source: 1994 FSM Censuses, Table P17 & unpublished data; 2000 FSM Census, Table P2-5 & unpublished data.
Citizenship and Legal Residence A similar migration pattern was found when place of birth was used to estimate migration flow and that is citizenship. Most residents in Chuuk were legal residents of Chuuk as shown in Table 6.5. The majority of the non-Chuukese were citizens of other FSM states, accounting for about 41 percent, while U.S and Asian citizens accounted for about 25 and 17 percents respectively. The majority of these non-Chuukese citizens resided in the Lagoon, accounting for less than 1 percent of the total Chuukese population (more than 1 percent drop from 1994). Table 6.5: Usual Residence by Citizenship, Chuuk State: 1994 and 2000
Country of citizenship 1994 2000 Other FSM Else- Other FSM Else-
Usual residence Total Percent Chuuk states USA Asia where Total Percent Chuuk States USA Asia where Total 53,319 100.0 98.2 0.4 0.4 0.9 0.1 53,595 100.0 99.5 0.2 0.1 0.1 0.1
Lagoon 41,662 100.0 97.8 0.4 0.5 1.2 0.1 38,005 100.0 99.3 0.3 0.2 0.1 0.1 N. Namoneas 17,093 100.0 95.1 1.0 0.9 2.8 0.2 10,360 100.0 97.8 1.0 0.5 0.4 0.4 S. Namoneas 11,898 100.0 99.7 0.1 0.2 - - 12,373 100.0 99.8 0.1 0.1 … … Faichuk 12,671 100.0 99.7 - 0.1 0.1 - 15,272 100.0 99.9 … 0.1 - … Outer Islands 11,657 100.0 99.4 0.3 0.2 - - 15,590 100.0 100.0 … … - - Mortlocks 6,471 100.0 99.4 0.4 0.1 - - 8,848 100.0 100.0 … - - - Pattiw 2,171 100.0 99.3 0.2 0.5 - - 2,968 100.0 100.0 - - - - Namonwito 1,001 100.0 98.9 0.5 0.6 - - 1,433 100.0 99.9 - 0.1 - - Halls 2,014 100.0 100.0 - - - - 2,341 100.0 99.9 0.1 - - - Source: 1994 FSM Censuses, Table P18; 2000 FSM Census, Table P2-6.
In Table 6.6, the data show Chuuk legal residents in the FSM, presenting their place of usual residence. Legal residence is defined as the place where a person is a registered voter during the election preceding the census. Such information is especially useful in the decision-making process of appropriating government funds. The data show that in both census years a vast majority of the population lived in their place of legal residence. For example, in the 2000 Census, 97 percent of the Northern Namoneas legal residents were residing in Northern Namoneas at the time of the census. This also holds true for the Outer Islands, except for the Mortlocks of which about 76 percent lived in their place of legal residence.
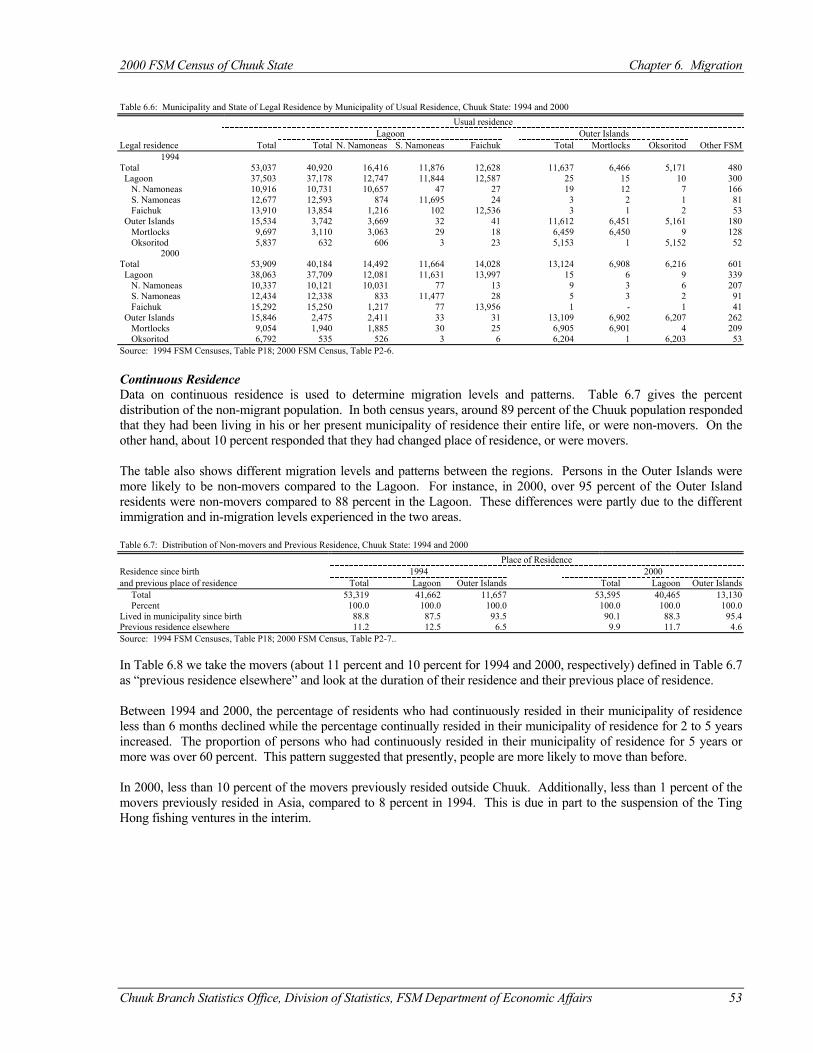
2000 FSM Census of Chuuk State Chapter 6. Migration
Chuuk Branch Statistics Office, Division of Statistics, FSM Department of Economic Affairs 53
Table 6.6: Municipality and State of Legal Residence by Municipality of Usual Residence, Chuuk State: 1994 and 2000 Usual residence
Lagoon Outer Islands Legal residence Total Total N. Namoneas S. Namoneas Faichuk Total Mortlocks Oksoritod Other FSM
1994 Total 53,037 40,920 16,416 11,876 12,628 11,637 6,466 5,171 480 Lagoon 37,503 37,178 12,747 11,844 12,587 25 15 10 300 N. Namoneas 10,916 10,731 10,657 47 27 19 12 7 166 S. Namoneas 12,677 12,593 874 11,695 24 3 2 1 81 Faichuk 13,910 13,854 1,216 102 12,536 3 1 2 53 Outer Islands 15,534 3,742 3,669 32 41 11,612 6,451 5,161 180 Mortlocks 9,697 3,110 3,063 29 18 6,459 6,450 9 128 Oksoritod 5,837 632 606 3 23 5,153 1 5,152 52
2000 Total 53,909 40,184 14,492 11,664 14,028 13,124 6,908 6,216 601 Lagoon 38,063 37,709 12,081 11,631 13,997 15 6 9 339 N. Namoneas 10,337 10,121 10,031 77 13 9 3 6 207 S. Namoneas 12,434 12,338 833 11,477 28 5 3 2 91 Faichuk 15,292 15,250 1,217 77 13,956 1 - 1 41 Outer Islands 15,846 2,475 2,411 33 31 13,109 6,902 6,207 262 Mortlocks 9,054 1,940 1,885 30 25 6,905 6,901 4 209 Oksoritod 6,792 535 526 3 6 6,204 1 6,203 53 Source: 1994 FSM Censuses, Table P18; 2000 FSM Census, Table P2-6. Continuous Residence Data on continuous residence is used to determine migration levels and patterns. Table 6.7 gives the percent distribution of the non-migrant population. In both census years, around 89 percent of the Chuuk population responded that they had been living in his or her present municipality of residence their entire life, or were non-movers. On the other hand, about 10 percent responded that they had changed place of residence, or were movers. The table also shows different migration levels and patterns between the regions. Persons in the Outer Islands were more likely to be non-movers compared to the Lagoon. For instance, in 2000, over 95 percent of the Outer Island residents were non-movers compared to 88 percent in the Lagoon. These differences were partly due to the different immigration and in-migration levels experienced in the two areas. Table 6.7: Distribution of Non-movers and Previous Residence, Chuuk State: 1994 and 2000
Place of Residence Residence since birth 1994 2000 and previous place of residence Total Lagoon Outer Islands Total Lagoon Outer Islands Total 53,319 41,662 11,657 53,595 40,465 13,130 Percent 100.0 100.0 100.0 100.0 100.0 100.0 Lived in municipality since birth 88.8 87.5 93.5 90.1 88.3 95.4 Previous residence elsewhere 11.2 12.5 6.5 9.9 11.7 4.6 Source: 1994 FSM Censuses, Table P18; 2000 FSM Census, Table P2-7.. In Table 6.8 we take the movers (about 11 percent and 10 percent for 1994 and 2000, respectively) defined in Table 6.7 as “previous residence elsewhere” and look at the duration of their residence and their previous place of residence. Between 1994 and 2000, the percentage of residents who had continuously resided in their municipality of residence less than 6 months declined while the percentage continually resided in their municipality of residence for 2 to 5 years increased. The proportion of persons who had continuously resided in their municipality of residence for 5 years or more was over 60 percent. This pattern suggested that presently, people are more likely to move than before. In 2000, less than 10 percent of the movers previously resided outside Chuuk. Additionally, less than 1 percent of the movers previously resided in Asia, compared to 8 percent in 1994. This is due in part to the suspension of the Ting Hong fishing ventures in the interim.
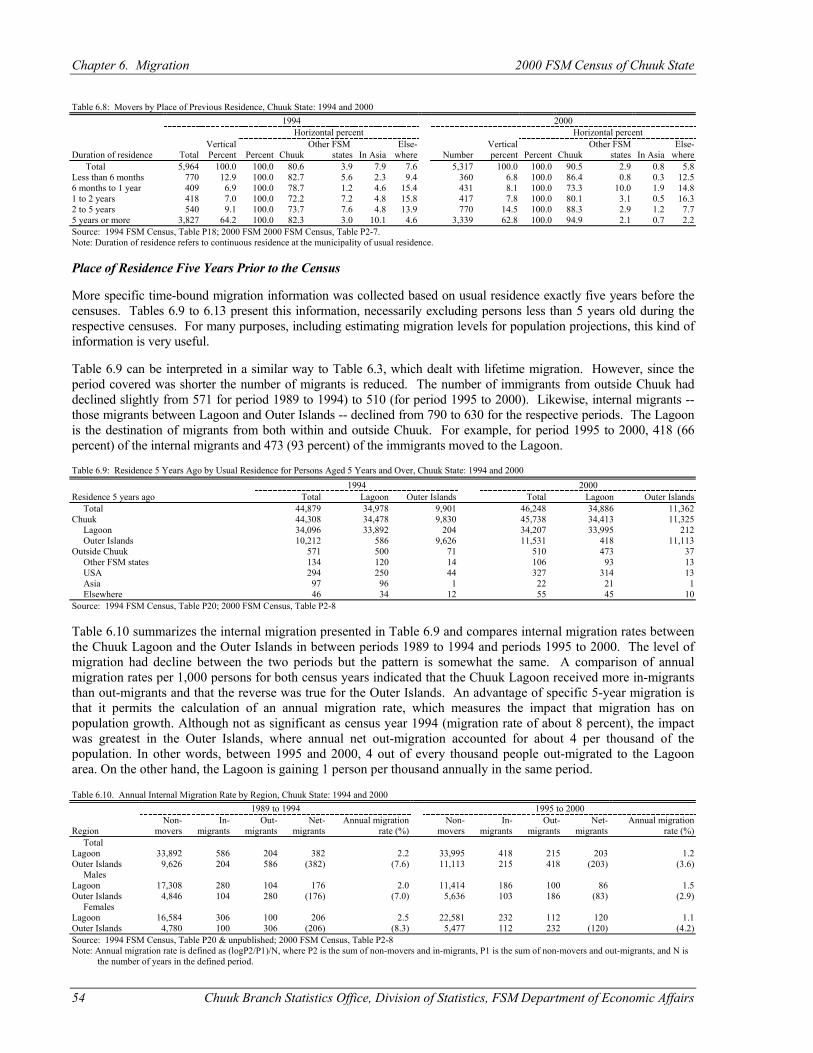
Chapter 6. Migration 2000 FSM Census of Chuuk State
54 Chuuk Branch Statistics Office, Division of Statistics, FSM Department of Economic Affairs
Table 6.8: Movers by Place of Previous Residence, Chuuk State: 1994 and 2000
1994 2000 Horizontal percent Horizontal percent Vertical Other FSM Else- Vertical Other FSM Else-
Duration of residence Total Percent Percent Chuuk states In Asia where Number percent Percent Chuuk states In Asia where Total 5,964 100.0 100.0 80.6 3.9 7.9 7.6 5,317 100.0 100.0 90.5 2.9 0.8 5.8 Less than 6 months 770 12.9 100.0 82.7 5.6 2.3 9.4 360 6.8 100.0 86.4 0.8 0.3 12.5 6 months to 1 year 409 6.9 100.0 78.7 1.2 4.6 15.4 431 8.1 100.0 73.3 10.0 1.9 14.8 1 to 2 years 418 7.0 100.0 72.2 7.2 4.8 15.8 417 7.8 100.0 80.1 3.1 0.5 16.3 2 to 5 years 540 9.1 100.0 73.7 7.6 4.8 13.9 770 14.5 100.0 88.3 2.9 1.2 7.7 5 years or more 3,827 64.2 100.0 82.3 3.0 10.1 4.6 3,339 62.8 100.0 94.9 2.1 0.7 2.2 Source: 1994 FSM Census, Table P18; 2000 FSM 2000 FSM Census, Table P2-7. Note: Duration of residence refers to continuous residence at the municipality of usual residence. Place of Residence Five Years Prior to the Census More specific time-bound migration information was collected based on usual residence exactly five years before the censuses. Tables 6.9 to 6.13 present this information, necessarily excluding persons less than 5 years old during the respective censuses. For many purposes, including estimating migration levels for population projections, this kind of information is very useful. Table 6.9 can be interpreted in a similar way to Table 6.3, which dealt with lifetime migration. However, since the period covered was shorter the number of migrants is reduced. The number of immigrants from outside Chuuk had declined slightly from 571 for period 1989 to 1994) to 510 (for period 1995 to 2000). Likewise, internal migrants --those migrants between Lagoon and Outer Islands -- declined from 790 to 630 for the respective periods. The Lagoon is the destination of migrants from both within and outside Chuuk. For example, for period 1995 to 2000, 418 (66 percent) of the internal migrants and 473 (93 percent) of the immigrants moved to the Lagoon. Table 6.9: Residence 5 Years Ago by Usual Residence for Persons Aged 5 Years and Over, Chuuk State: 1994 and 2000 1994 2000 Residence 5 years ago Total Lagoon Outer Islands Total Lagoon Outer Islands Total 44,879 34,978 9,901 46,248 34,886 11,362 Chuuk 44,308 34,478 9,830 45,738 34,413 11,325 Lagoon 34,096 33,892 204 34,207 33,995 212 Outer Islands 10,212 586 9,626 11,531 418 11,113 Outside Chuuk 571 500 71 510 473 37 Other FSM states 134 120 14 106 93 13 USA 294 250 44 327 314 13 Asia 97 96 1 22 21 1 Elsewhere 46 34 12 55 45 10 Source: 1994 FSM Census, Table P20; 2000 FSM Census, Table P2-8 Table 6.10 summarizes the internal migration presented in Table 6.9 and compares internal migration rates between the Chuuk Lagoon and the Outer Islands in between periods 1989 to 1994 and periods 1995 to 2000. The level of migration had decline between the two periods but the pattern is somewhat the same. A comparison of annual migration rates per 1,000 persons for both census years indicated that the Chuuk Lagoon received more in-migrants than out-migrants and that the reverse was true for the Outer Islands. An advantage of specific 5-year migration is that it permits the calculation of an annual migration rate, which measures the impact that migration has on population growth. Although not as significant as census year 1994 (migration rate of about 8 percent), the impact was greatest in the Outer Islands, where annual net out-migration accounted for about 4 per thousand of the population. In other words, between 1995 and 2000, 4 out of every thousand people out-migrated to the Lagoon area. On the other hand, the Lagoon is gaining 1 person per thousand annually in the same period. Table 6.10. Annual Internal Migration Rate by Region, Chuuk State: 1994 and 2000
1989 to 1994 1995 to 2000 Non- In- Out- Net- Annual migration Non- In- Out- Net- Annual migration
Region movers migrants migrants migrants rate (%) movers migrants migrants migrants rate (%) Total Lagoon 33,892 586 204 382 2.2 33,995 418 215 203 1.2 Outer Islands 9,626 204 586 (382) (7.6) 11,113 215 418 (203) (3.6) Males Lagoon 17,308 280 104 176 2.0 11,414 186 100 86 1.5 Outer Islands 4,846 104 280 (176) (7.0) 5,636 103 186 (83) (2.9) Females Lagoon 16,584 306 100 206 2.5 22,581 232 112 120 1.1 Outer Islands 4,780 100 306 (206) (8.3) 5,477 112 232 (120) (4.2) Source: 1994 FSM Census, Table P20 & unpublished; 2000 FSM Census, Table P2-8 Note: Annual migration rate is defined as (logP2/P1)/N, where P2 is the sum of non-movers and in-migrants, P1 is the sum of non-movers and out-migrants, and N is the number of years in the defined period.
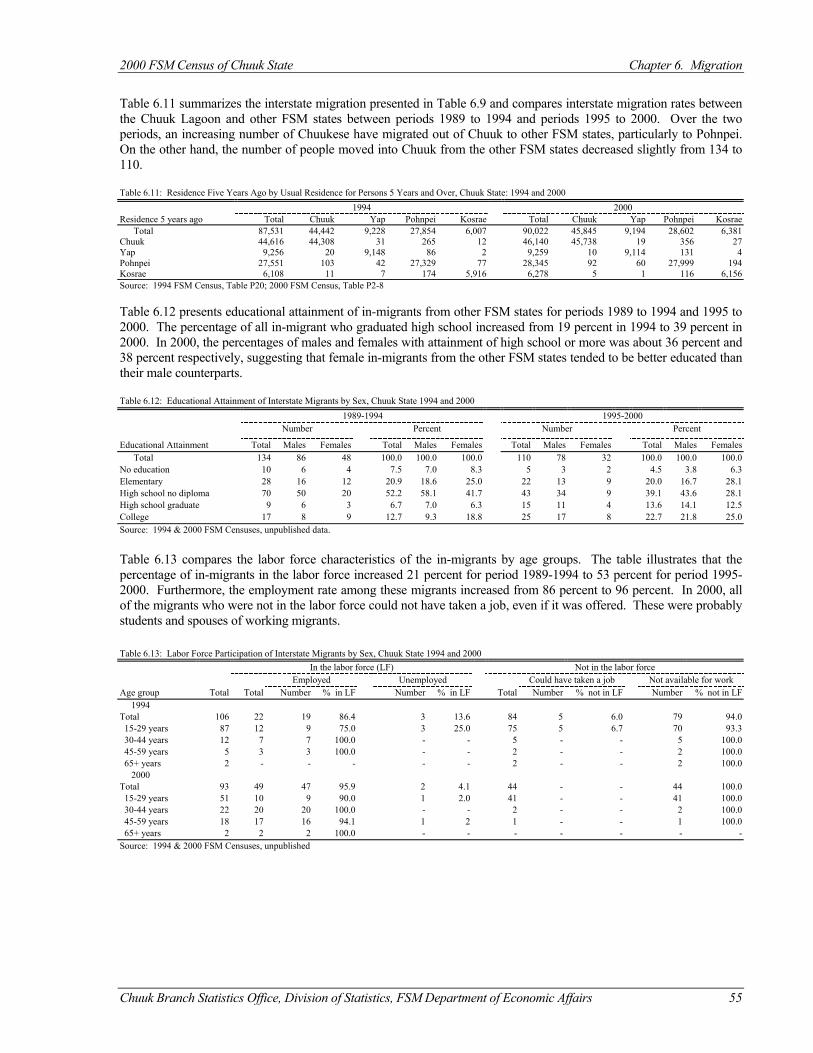
2000 FSM Census of Chuuk State Chapter 6. Migration
Chuuk Branch Statistics Office, Division of Statistics, FSM Department of Economic Affairs 55
Table 6.11 summarizes the interstate migration presented in Table 6.9 and compares interstate migration rates between the Chuuk Lagoon and other FSM states between periods 1989 to 1994 and periods 1995 to 2000. Over the two periods, an increasing number of Chuukese have migrated out of Chuuk to other FSM states, particularly to Pohnpei. On the other hand, the number of people moved into Chuuk from the other FSM states decreased slightly from 134 to 110. Table 6.11: Residence Five Years Ago by Usual Residence for Persons 5 Years and Over, Chuuk State: 1994 and 2000 1994 2000 Residence 5 years ago Total Chuuk Yap Pohnpei Kosrae Total Chuuk Yap Pohnpei Kosrae Total 87,531 44,442 9,228 27,854 6,007 90,022 45,845 9,194 28,602 6,381 Chuuk 44,616 44,308 31 265 12 46,140 45,738 19 356 27 Yap 9,256 20 9,148 86 2 9,259 10 9,114 131 4 Pohnpei 27,551 103 42 27,329 77 28,345 92 60 27,999 194 Kosrae 6,108 11 7 174 5,916 6,278 5 1 116 6,156 Source: 1994 FSM Census, Table P20; 2000 FSM Census, Table P2-8 Table 6.12 presents educational attainment of in-migrants from other FSM states for periods 1989 to 1994 and 1995 to 2000. The percentage of all in-migrant who graduated high school increased from 19 percent in 1994 to 39 percent in 2000. In 2000, the percentages of males and females with attainment of high school or more was about 36 percent and 38 percent respectively, suggesting that female in-migrants from the other FSM states tended to be better educated than their male counterparts. Table 6.12: Educational Attainment of Interstate Migrants by Sex, Chuuk State 1994 and 2000 1989-1994 1995-2000
Number Percent Number Percent
Educational Attainment Total Males Females Total Males Females Total Males Females Total Males Females Total 134 86 48 100.0 100.0 100.0 110 78 32 100.0 100.0 100.0 No education 10 6 4 7.5 7.0 8.3 5 3 2 4.5 3.8 6.3 Elementary 28 16 12 20.9 18.6 25.0 22 13 9 20.0 16.7 28.1 High school no diploma 70 50 20 52.2 58.1 41.7 43 34 9 39.1 43.6 28.1 High school graduate 9 6 3 6.7 7.0 6.3 15 11 4 13.6 14.1 12.5 College 17 8 9 12.7 9.3 18.8 25 17 8 22.7 21.8 25.0 Source: 1994 & 2000 FSM Censuses, unpublished data.
Table 6.13 compares the labor force characteristics of the in-migrants by age groups. The table illustrates that the percentage of in-migrants in the labor force increased 21 percent for period 1989-1994 to 53 percent for period 1995-2000. Furthermore, the employment rate among these migrants increased from 86 percent to 96 percent. In 2000, all of the migrants who were not in the labor force could not have taken a job, even if it was offered. These were probably students and spouses of working migrants. Table 6.13: Labor Force Participation of Interstate Migrants by Sex, Chuuk State 1994 and 2000
In the labor force (LF) Not in the labor force Employed Unemployed Could have taken a job Not available for work
Age group Total Total Number % in LF Number % in LF Total Number % not in LF Number % not in LF 1994 Total 106 22 19 86.4 3 13.6 84 5 6.0 79 94.0 15-29 years 87 12 9 75.0 3 25.0 75 5 6.7 70 93.3 30-44 years 12 7 7 100.0 - - 5 - - 5 100.0 45-59 years 5 3 3 100.0 - - 2 - - 2 100.0 65+ years 2 - - - - - 2 - - 2 100.0 2000 Total 93 49 47 95.9 2 4.1 44 - - 44 100.0 15-29 years 51 10 9 90.0 1 2.0 41 - - 41 100.0 30-44 years 22 20 20 100.0 - - 2 - - 2 100.0 45-59 years 18 17 16 94.1 1 2 1 - - 1 100.0 65+ years 2 2 2 100.0 - - - - - - - Source: 1994 & 2000 FSM Censuses, unpublished
Chapter 6. Migration 2000 FSM Census of Chuuk State
56 Chuuk Branch Statistics Office, Division of Statistics, FSM Department of Economic Affairs
Conclusions The data in the 2000 Census show that internal and international migrations affect the population dynamics of Chuuk. The census covered internal and interstate migration reasonably well. International migration was only covered to some extend. For internal migration, the 2000 Census data showed the direction of migration flows was principally toward the Lagoon. The Lagoon was the only net receiving region, gaining migrants from the Outer Islands. In turn, the outer islands lost people. The annual internal migration rate for the Lagoon decreased from 2.2 per thousand to 1.2 per thousand between period 1989 to 1994 and 1995 to 2000. The annual internal migration rate for the Outer Islands also decreased from –7.6 per thousand in 1994 to –3.6 per thousand in the year 2000. For interstate migration, Pohnpei is the main destination of Chuukese who were migrating to other FSM states in both periods. Also, more than half of the in-migrants to Chuuk from the other FSM states hailed from Pohnpei. The annual interstate net migration rate for Chuuk was about –13 per thousand for period 1995 to 2000, increasing from –8 per thousand for period 1989 to 1994. For international migration, the number of non-FSM persons in Chuuk declined over the 10 years before the current census. Pacific Islanders was the largest group of non-FSM migrants to Chuuk in 2000, whereas in the 1994 the largest group was Asian. This shift was due largely to the dissolution of the foreign fishing venture in the intercensal period. In effect, generalizations about international migration are difficult to find. All the same, it may be well conclusive to recognize that shifts in international migration may be affected significantly by economic and political changes not only in Chuuk but also elsewhere in Micronesia.
Chuuk Branch Statistics Office, Division of Statistics, FSM Department of Economic Affairs 57
CHAPTER 7 RELIGION, ETHNICITY AND LANGUAGE
Introduction The questionnaire used in the 2000 Census contained several questions on social characteristics of the population such as religion, ethnic origin and language. In Chuuk, religion-related organizations, like youth programs, play an important role in the community, making data on religion necessary for planning purposes. The data provided in this chapter show two major religious affiliations: Catholic and Protestant. Under Protestant there are several sects with Congregational being the largest group. The Protestant religion first came to Micronesia in 1852, beginning work on Pohnpei and Kosrae, and soon afterwards expanding to Chuuk. Although the mission sending organization was interdenominational, most of the missionaries represented the Congregational Church (Hezel, 1983). The data on religion tell us about people’s religious affiliation. Data on ethnicity is useful in planning processes and social research. Ethnic origin tells about where a person's ancestors came from. The 2000 Census data showed majority of the Chuuk residents were of Chuuk origin. The largest foreign (non-local) ethnic group in Chuuk in 1994 was the Asians, which included mostly Filipinos and Chinese. The Chinese population has decreased in 2000 from 1994 due to the expiration of the fishing company contract to Chuuk State in the intercensal period. The second largest non-local ethnic group was the Whites. This group included persons from Europe, U.S., Australia, and New Zealand. The data on language use provide information for bilingual programs in school, and at the work place. In the history of Chuuk, different second languages were taught in schools depending on the administering country. During the Japanese Administration (from 1914 to 1945), Japanese was used as the common language in schools, offices, and other places. When the U.S took over at the end of the World War II, English became the main language for communication. At present, English is the medium of official communication at the government offices and even in the private sector. Definitions Religion The 2000 Census obtained data on Religion from responses to questionnaire item 7, asked of all persons regardless of age and sex. For census purposes, religion was defined as a religious or spiritual belief or preference, regardless of whether or not this belief was represented by an organized group. Ethnicity Item 6 on the 2000 Census questionnaire concerned ethnicity or race. The question relied on self-identification and was open-ended. Ethnic origin or race refers to a person's origin or descent, including an individual's heritage or the place of birth of an individual's ancestors. Persons reported their ethnic group regardless of the number of generations removed from their place of ancestral origin. Responses to the ethnic origin question reflected the ethnic group with which persons identified and not necessarily the degree of attachment or association the persons have with a particular group. Most respondents reported their ethnic origin or race by specifying a single ethnic group, but some reported two or three groups. Census staff identified and coded the first two responses reported. In published tabulations, the 2000 Census designed multiple groups as general open-ended categories and such as "Chuukese and other group(s) "rather than specific multiple ethnic groups such as Chuukese-Japanese." Thus, the census would include a person who reported "Chuukese” and “Filipino" ethnicities he will be tabulated in the "Chuukese and other group(s)" category under "Multiple ethnic group". The 1994 and 2000 Censuses accepted "American" as a unique ethnicity if given alone or with the state names. Language The language questions (15a and 15b) were asked only of persons 5 years old and over and obtained two items: what language(s) does one speak and what language does one speak at home. For persons who spoke more than 3 languages, only the three most common were listed. For language spoken at home, only the one mostly used is recorded.
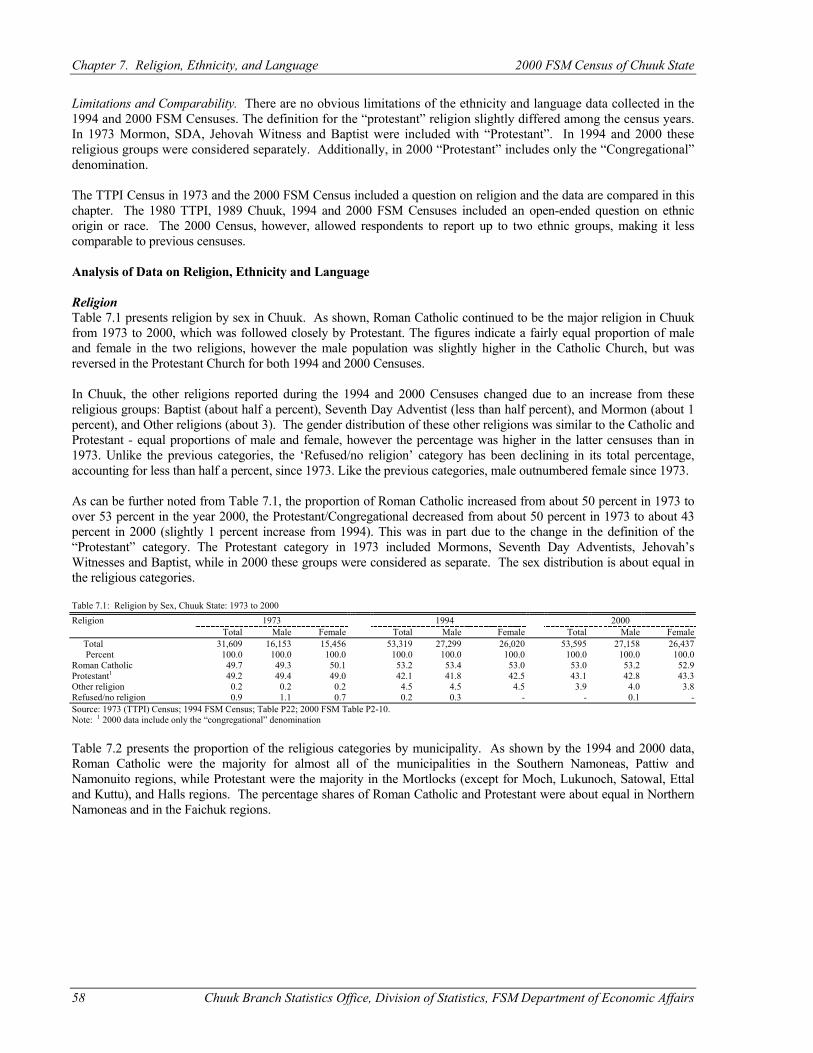
Chapter 7. Religion, Ethnicity, and Language 2000 FSM Census of Chuuk State
58 Chuuk Branch Statistics Office, Division of Statistics, FSM Department of Economic Affairs
Limitations and Comparability. There are no obvious limitations of the ethnicity and language data collected in the 1994 and 2000 FSM Censuses. The definition for the “protestant” religion slightly differed among the census years. In 1973 Mormon, SDA, Jehovah Witness and Baptist were included with “Protestant”. In 1994 and 2000 these religious groups were considered separately. Additionally, in 2000 “Protestant” includes only the “Congregational” denomination. The TTPI Census in 1973 and the 2000 FSM Census included a question on religion and the data are compared in this chapter. The 1980 TTPI, 1989 Chuuk, 1994 and 2000 FSM Censuses included an open-ended question on ethnic origin or race. The 2000 Census, however, allowed respondents to report up to two ethnic groups, making it less comparable to previous censuses. Analysis of Data on Religion, Ethnicity and Language Religion Table 7.1 presents religion by sex in Chuuk. As shown, Roman Catholic continued to be the major religion in Chuuk from 1973 to 2000, which was followed closely by Protestant. The figures indicate a fairly equal proportion of male and female in the two religions, however the male population was slightly higher in the Catholic Church, but was reversed in the Protestant Church for both 1994 and 2000 Censuses. In Chuuk, the other religions reported during the 1994 and 2000 Censuses changed due to an increase from these religious groups: Baptist (about half a percent), Seventh Day Adventist (less than half percent), and Mormon (about 1 percent), and Other religions (about 3). The gender distribution of these other religions was similar to the Catholic and Protestant - equal proportions of male and female, however the percentage was higher in the latter censuses than in 1973. Unlike the previous categories, the ‘Refused/no religion’ category has been declining in its total percentage, accounting for less than half a percent, since 1973. Like the previous categories, male outnumbered female since 1973. As can be further noted from Table 7.1, the proportion of Roman Catholic increased from about 50 percent in 1973 to over 53 percent in the year 2000, the Protestant/Congregational decreased from about 50 percent in 1973 to about 43 percent in 2000 (slightly 1 percent increase from 1994). This was in part due to the change in the definition of the “Protestant” category. The Protestant category in 1973 included Mormons, Seventh Day Adventists, Jehovah’s Witnesses and Baptist, while in 2000 these groups were considered as separate. The sex distribution is about equal in the religious categories. Table 7.1: Religion by Sex, Chuuk State: 1973 to 2000 Religion 1973 1994 2000
Total Male Female Total Male Female Total Male Female Total 31,609 16,153 53,319 27,299 26,020 53,595 27,158 26,437 Percent 100.0 100.0 100.0 100.0 100.0 100.0 100.0 Roman Catholic 49.7 49.3 53.2 53.4 53.0 53.2 52.9 Protestant1 49.2 49.4 42.1 41.8 43.1 42.8 43.3 Other religion 0.2 0.2 4.5 4.5 3.9 4.0 3.8 Refused/no religion 0.9 1.1
15,456 100.0 50.1 49.0 0.2 0.7 0.2 0.3
100.0 53.0 42.5 4.5
- - 0.1 - Source: 1973 (TTPI) Census; 1994 FSM Census; Table P22; 2000 FSM Table P2-10. Note: 1 2000 data include only the “congregational” denomination
Table 7.2 presents the proportion of the religious categories by municipality. As shown by the 1994 and 2000 data, Roman Catholic were the majority for almost all of the municipalities in the Southern Namoneas, Pattiw and Namonuito regions, while Protestant were the majority in the Mortlocks (except for Moch, Lukunoch, Satowal, Ettal and Kuttu), and Halls regions. The percentage shares of Roman Catholic and Protestant were about equal in Northern Namoneas and in the Faichuk regions.
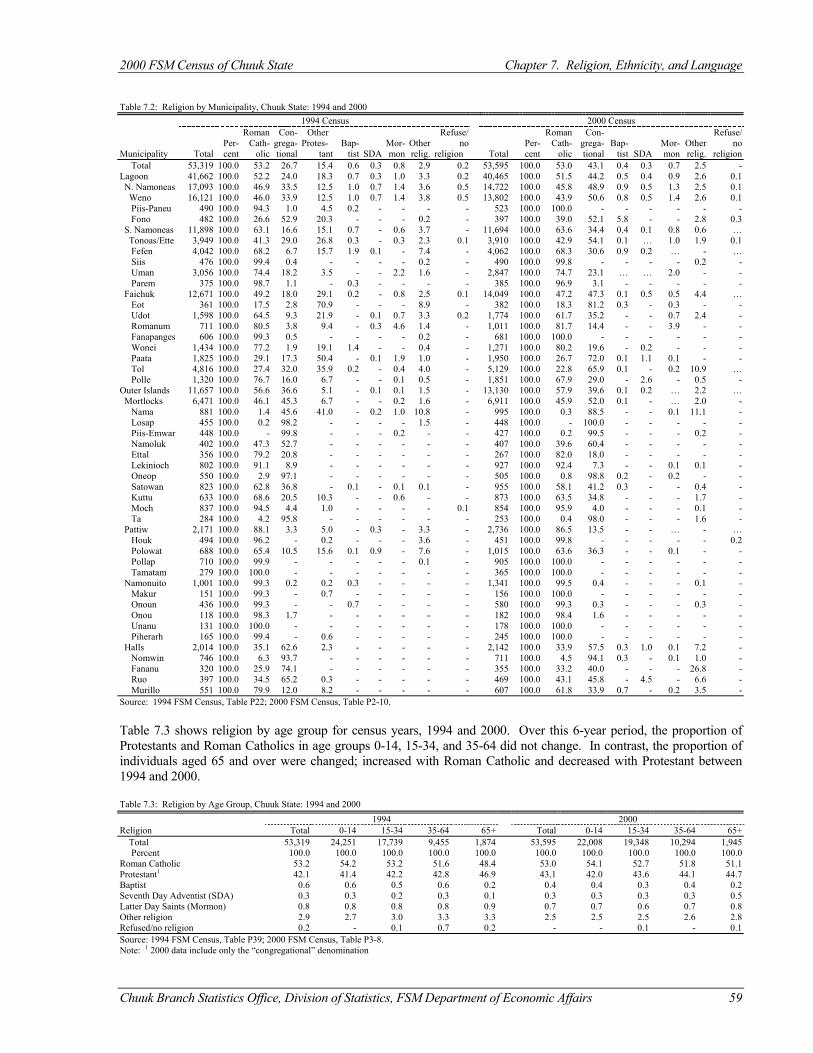
2000 FSM Census of Chuuk State Chapter 7. Religion, Ethnicity, and Language
Chuuk Branch Statistics Office, Division of Statistics, FSM Department of Economic Affairs 59
Table 7.2: Religion by Municipality, Chuuk State: 1994 and 2000 1994 Census 2000 Census Roman Con- Other Refuse/ Roman Con- Refuse/ Per- Cath- grega- Protes- Bap- Mor- Other no Per- Cath- grega- Bap- Mor- Other no
Municipality Total cent olic tional tant tist SDA mon relig. religion Total cent olic tional tist SDA mon relig. religion Total 53,319 100.0 53.2 26.7 15.4 0.6 0.3 0.8 2.9 0.2 53,595 100.0 53.0 43.1 0.4 0.3 0.7 2.5 - Lagoon 41,662 100.0 52.2 24.0 18.3 0.7 0.3 1.0 3.3 0.2 40,465 100.0 51.5 44.2 0.5 0.4 0.9 2.6 0.1 N. Namoneas 17,093 100.0 46.9 33.5 12.5 1.0 0.7 1.4 3.6 0.5 14,722 100.0 45.8 48.9 0.9 0.5 1.3 2.5 0.1 Weno 16,121 100.0 46.0 33.9 12.5 1.0 0.7 1.4 3.8 0.5 13,802 100.0 43.9 50.6 0.8 0.5 1.4 2.6 0.1 Piis-Paneu 490 100.0 94.3 1.0 4.5 0.2 - - - - 523 100.0 100.0 - - - - - - Fono 482 100.0 26.6 52.9 20.3 - - - 0.2 - 397 100.0 39.0 52.1 5.8 - - 2.8 0.3 S. Namoneas 11,898 100.0 63.1 16.6 15.1 0.7 - 0.6 3.7 - 11,694 100.0 63.6 34.4 0.4 0.1 0.8 0.6 … Tonoas/Ette 3,949 100.0 41.3 29.0 26.8 0.3 - 0.3 2.3 0.1 3,910 100.0 42.9 54.1 0.1 … 1.0 1.9 0.1 Fefen 4,042 100.0 68.2 6.7 15.7 1.9 0.1 - 7.4 - 4,062 100.0 68.3 30.6 0.9 0.2 … - … Siis 476 100.0 99.4 0.4 - - - - 0.2 - 490 100.0 99.8 - - - - 0.2 - Uman 3,056 100.0 74.4 18.2 3.5 - - 2.2 1.6 - 2,847 100.0 74.7 23.1 … … 2.0 - - Parem 375 100.0 98.7 1.1 - 0.3 - - - - 385 100.0 96.9 3.1 - - - - - Faichuk 12,671 100.0 49.2 18.0 29.1 0.2 - 0.8 2.5 0.1 14,049 100.0 47.2 47.3 0.1 0.5 0.5 4.4 … Eot 361 100.0 17.5 2.8 70.9 - - - 8.9 - 382 100.0 18.3 81.2 0.3 - 0.3 - - Udot 1,598 100.0 64.5 9.3 21.9 - 0.1 0.7 3.3 0.2 1,774 100.0 61.7 35.2 - - 0.7 2.4 - Romanum 711 100.0 80.5 3.8 9.4 - 0.3 4.6 1.4 - 1,011 100.0 81.7 14.4 - - 3.9 - - Fanapanges 606 100.0 99.3 0.5 - - - - 0.2 - 681 100.0 100.0 - - - - - - Wonei 1,434 100.0 77.2 1.9 19.1 1.4 - - 0.4 - 1,271 100.0 80.2 19.6 - 0.2 - - - Paata 1,825 100.0 29.1 17.3 50.4 - 0.1 1.9 1.0 - 1,950 100.0 26.7 72.0 0.1 1.1 0.1 - - Tol 4,816 100.0 27.4 32.0 35.9 0.2 - 0.4 4.0 - 5,129 100.0 22.8 65.9 0.1 - 0.2 10.9 … Polle 1,320 100.0 76.7 16.0 6.7 - - 0.1 0.5 - 1,851 100.0 67.9 29.0 - 2.6 - 0.5 - Outer Islands 11,657 100.0 56.6 36.6 5.1 - 0.1 0.1 1.5 - 13,130 100.0 57.9 39.6 0.1 0.2 … 2.2 … Mortlocks 6,471 100.0 46.1 45.3 6.7 - - 0.2 1.6 - 6,911 100.0 45.9 52.0 0.1 - … 2.0 - Nama 881 100.0 1.4 45.6 41.0 - 0.2 1.0 10.8 - 995 100.0 0.3 88.5 - - 0.1 11.1 - Losap 455 100.0 0.2 98.2 - - - - 1.5 - 448 100.0 - 100.0 - - - - - Piis-Emwar 448 100.0 - 99.8 - - - 0.2 - - 427 100.0 0.2 99.5 - - - 0.2 - Namoluk 402 100.0 47.3 52.7 - - - - - - 407 100.0 39.6 60.4 - - - - - Ettal 356 100.0 79.2 20.8 - - - - - - 267 100.0 82.0 18.0 - - - - - Lekinioch 802 100.0 91.1 8.9 - - - - - - 927 100.0 92.4 7.3 - - 0.1 0.1 - Oneop 550 100.0 2.9 97.1 - - - - - - 505 100.0 0.8 98.8 0.2 - 0.2 - - Satowan 823 100.0 62.8 36.8 - 0.1 - 0.1 0.1 - 955 100.0 58.1 41.2 0.3 - - 0.4 - Kuttu 633 100.0 68.6 20.5 10.3 - - 0.6 - - 873 100.0 63.5 34.8 - - - 1.7 - Moch 837 100.0 94.5 4.4 1.0 - - - - 0.1 854 100.0 95.9 4.0 - - - 0.1 - Ta 284 100.0 4.2 95.8 - - - - - - 253 100.0 0.4 98.0 - - - 1.6 - Pattiw 2,171 100.0 88.1 3.3 5.0 - 0.3 - 3.3 - 2,736 100.0 86.5 13.5 - - … - … Houk 494 100.0 96.2 - 0.2 - - - 3.6 - 451 100.0 99.8 - - - - - 0.2 Polowat 688 100.0 65.4 10.5 15.6 0.1 0.9 - 7.6 - 1,015 100.0 63.6 36.3 - - 0.1 - - Pollap 710 100.0 99.9 - - - - - 0.1 - 905 100.0 100.0 - - - - - - Tamatam 279 100.0 100.0 - - - - - - - 365 100.0 100.0 - - - - - - Namonuito 1,001 100.0 99.3 0.2 0.2 0.3 - - - - 1,341 100.0 99.5 0.4 - - - 0.1 - Makur 151 100.0 99.3 - 0.7 - - - - - 156 100.0 100.0 - - - - - - Onoun 436 100.0 99.3 - - 0.7 - - - - 580 100.0 99.3 0.3 - - - 0.3 - Onou 118 100.0 98.3 1.7 - - - - - - 182 100.0 98.4 1.6 - - - - - Unanu 131 100.0 100.0 - - - - - - - 178 100.0 100.0 - - - - - - Piherarh 165 100.0 99.4 - 0.6 - - - - - 245 100.0 100.0 - - - - - - Halls 2,014 100.0 35.1 62.6 2.3 - - - - - 2,142 100.0 33.9 57.5 0.3 1.0 0.1 7.2 - Nomwin 746 100.0 6.3 93.7 - - - - - - 711 100.0 4.5 94.1 0.3 - 0.1 1.0 - Fananu 320 100.0 25.9 74.1 - - - - - - 355 100.0 33.2 40.0 - - - 26.8 - Ruo 397 100.0 34.5 65.2 0.3 - - - - - 469 100.0 43.1 45.8 - 4.5 - 6.6 - Murillo 551 100.0 79.9 12.0 8.2 - - - - - 607 100.0 61.8 33.9 0.7 - 0.2 3.5 - Source: 1994 FSM Census, Table P22; 2000 FSM Census, Table P2-10. Table 7.3 shows religion by age group for census years, 1994 and 2000. Over this 6-year period, the proportion of Protestants and Roman Catholics in age groups 0-14, 15-34, and 35-64 did not change. In contrast, the proportion of individuals aged 65 and over were changed; increased with Roman Catholic and decreased with Protestant between 1994 and 2000. Table 7.3: Religion by Age Group, Chuuk State: 1994 and 2000 1994 2000 Religion Total 0-14 15-34 35-64 65+ Total 0-14 15-34 35-64 65+ Total 53,319 24,251 17,739 9,455 1,874 53,595 22,008 19,348 10,294 1,945 Percent 100.0 100.0 100.0 100.0 100.0 100.0 100.0 100.0 100.0 100.0 Roman Catholic 53.2 54.2 53.2 51.6 48.4 53.0 54.1 52.7 51.8 51.1 Protestant1 42.1 41.4 42.2 42.8 46.9 43.1 42.0 43.6 44.1 44.7 Baptist 0.6 0.6 0.5 0.6 0.2 0.4 0.4 0.3 0.4 0.2 Seventh Day Adventist (SDA) 0.3 0.3 0.2 0.3 0.1 0.3 0.3 0.3 0.3 0.5 Latter Day Saints (Mormon) 0.8 0.8 0.8 0.8 0.9 0.7 0.7 0.6 0.7 0.8 Other religion 2.9 2.7 3.0 3.3 3.3 2.5 2.5 2.5 2.6 2.8 Refused/no religion 0.2 - 0.1 0.7 0.2 - - 0.1 - 0.1 Source: 1994 FSM Census, Table P39; 2000 FSM Census, Table P3-8. Note: 1 2000 data include only the “congregational” denomination
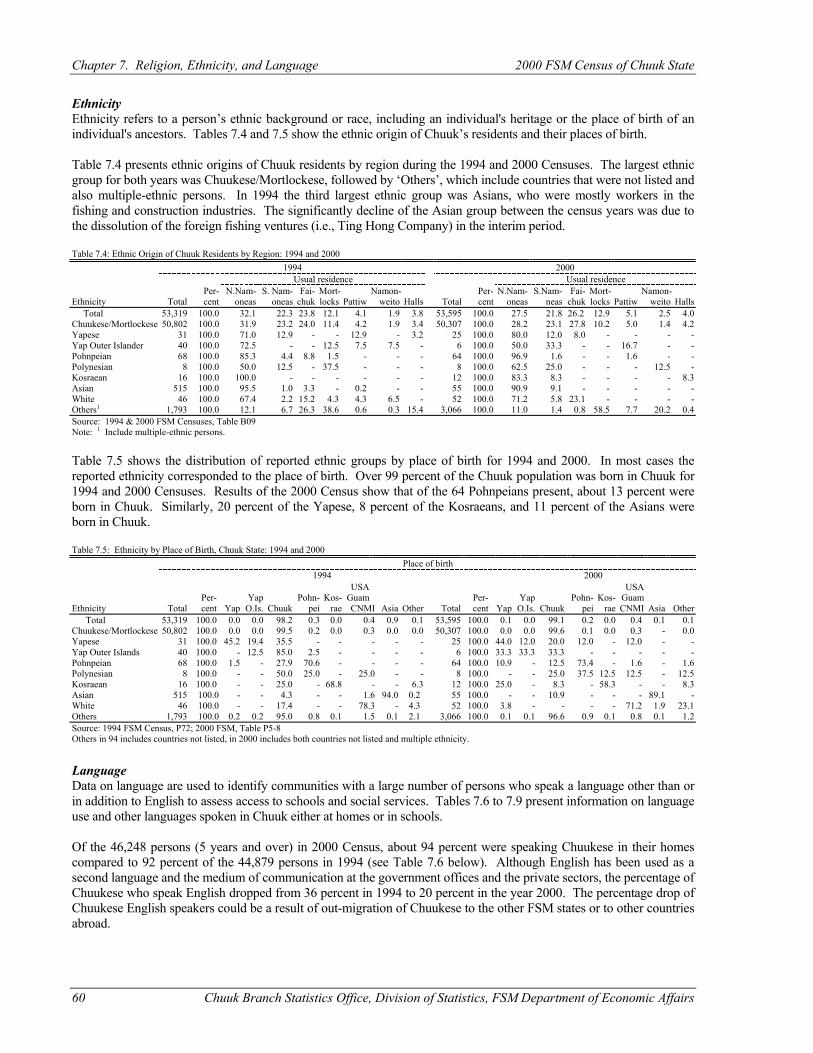
Chapter 7. Religion, Ethnicity, and Language 2000 FSM Census of Chuuk State
60 Chuuk Branch Statistics Office, Division of Statistics, FSM Department of Economic Affairs
Ethnicity Ethnicity refers to a person’s ethnic background or race, including an individual's heritage or the place of birth of an individual's ancestors. Tables 7.4 and 7.5 show the ethnic origin of Chuuk’s residents and their places of birth. Table 7.4 presents ethnic origins of Chuuk residents by region during the 1994 and 2000 Censuses. The largest ethnic group for both years was Chuukese/Mortlockese, followed by ‘Others’, which include countries that were not listed and also multiple-ethnic persons. In 1994 the third largest ethnic group was Asians, who were mostly workers in the fishing and construction industries. The significantly decline of the Asian group between the census years was due to the dissolution of the foreign fishing ventures (i.e., Ting Hong Company) in the interim period. Table 7.4: Ethnic Origin of Chuuk Residents by Region: 1994 and 2000 1994 2000
Usual residence Usual residence Per- N.Nam- S. Nam- Fai- Mort- Namon- Per- N.Nam- S.Nam- Fai- Mort- Namon-
Ethnicity Total cent oneas oneas chuk locks Pattiw weito Halls Total cent oneas neas chuk locks Pattiw weito Halls Total 53,319 100.0 32.1 22.3 23.8 12.1 4.1 1.9 3.8 53,595 100.0 27.5 21.8 26.2 12.9 5.1 2.5 4.0 Chuukese/Mortlockese 50,802 100.0 31.9 23.2 24.0 11.4 4.2 1.9 3.4 50,307 100.0 28.2 23.1 27.8 10.2 5.0 1.4 4.2 Yapese 31 100.0 71.0 12.9 - - 12.9 - 3.2 25 100.0 80.0 12.0 8.0 - - - - Yap Outer Islander 40 100.0 72.5 - - 12.5 7.5 7.5 - 6 100.0 50.0 33.3 - - 16.7 - - Pohnpeian 68 100.0 85.3 4.4 8.8 1.5 - - - 64 100.0 96.9 1.6 - - 1.6 - - Polynesian 8 100.0 50.0 12.5 - 37.5 - - - 8 100.0 62.5 25.0 - - - 12.5 - Kosraean 16 100.0 100.0 - - - - - - 12 100.0 83.3 8.3 - - - - 8.3 Asian 515 100.0 95.5 1.0 3.3 - 0.2 - - 55 100.0 90.9 9.1 - - - - - White 46 100.0 67.4 2.2 15.2 4.3 4.3 6.5 - 52 100.0 71.2 5.8 23.1 - - - - Others1 1,793 100.0 12.1 6.7 26.3 38.6 0.6 0.3 15.4 3,066 100.0 11.0 1.4 0.8 58.5 7.7 20.2 0.4 Source: 1994 & 2000 FSM Censuses, Table B09 Note: 1 Include multiple-ethnic persons. Table 7.5 shows the distribution of reported ethnic groups by place of birth for 1994 and 2000. In most cases the reported ethnicity corresponded to the place of birth. Over 99 percent of the Chuuk population was born in Chuuk for 1994 and 2000 Censuses. Results of the 2000 Census show that of the 64 Pohnpeians present, about 13 percent were born in Chuuk. Similarly, 20 percent of the Yapese, 8 percent of the Kosraeans, and 11 percent of the Asians were born in Chuuk. Table 7.5: Ethnicity by Place of Birth, Chuuk State: 1994 and 2000 Place of birth
1994 2000 USA USA
Per- Yap Pohn- Kos- Guam Per- Yap Pohn- Kos- Guam Ethnicity Total cent Yap O.Is. Chuuk pei rae CNMI Asia Other Total cent Yap O.Is. Chuuk pei rae CNMI Asia Other Total 53,319 100.0 0.0 0.0 98.2 0.3 0.0 0.4 0.9 0.1 53,595 100.0 0.1 0.0 99.1 0.2 0.0 0.4 0.1 0.1 Chuukese/Mortlockese 50,802 100.0 0.0 0.0 99.5 0.2 0.0 0.3 0.0 0.0 50,307 100.0 0.0 0.0 99.6 0.1 0.0 0.3 - 0.0 Yapese 31 100.0 45.2 19.4 35.5 - - - - - 25 100.0 44.0 12.0 20.0 12.0 - 12.0 - - Yap Outer Islands 40 100.0 - 12.5 85.0 2.5 - - - - 6 100.0 33.3 33.3 33.3 - - - - - Pohnpeian 68 100.0 1.5 - 27.9 70.6 - - - - 64 100.0 10.9 - 12.5 73.4 - 1.6 - 1.6 Polynesian 8 100.0 - - 50.0 25.0 - 25.0 - - 8 100.0 - - 25.0 37.5 12.5 12.5 - 12.5 Kosraean 16 100.0 - - 25.0 - 68.8 - - 6.3 12 100.0 25.0 - 8.3 - 58.3 - - 8.3 Asian 515 100.0 - - 4.3 - - 1.6 94.0 0.2 55 100.0 - - 10.9 - - - 89.1 - White 46 100.0 - - 17.4 - - 78.3 - 4.3 52 100.0 3.8 - - - - 71.2 1.9 23.1 Others 1,793 100.0 0.2 0.2 95.0 0.8 0.1 1.5 0.1 2.1 3,066 100.0 0.1 0.1 96.6 0.9 0.1 0.8 0.1 1.2 Source: 1994 FSM Census, P72; 2000 FSM, Table P5-8 Others in 94 includes countries not listed, in 2000 includes both countries not listed and multiple ethnicity.
Language Data on language are used to identify communities with a large number of persons who speak a language other than or in addition to English to assess access to schools and social services. Tables 7.6 to 7.9 present information on language use and other languages spoken in Chuuk either at homes or in schools. Of the 46,248 persons (5 years and over) in 2000 Census, about 94 percent were speaking Chuukese in their homes compared to 92 percent of the 44,879 persons in 1994 (see Table 7.6 below). Although English has been used as a second language and the medium of communication at the government offices and the private sectors, the percentage of Chuukese who speak English dropped from 36 percent in 1994 to 20 percent in the year 2000. The percentage drop of Chuukese English speakers could be a result of out-migration of Chuukese to the other FSM states or to other countries abroad.
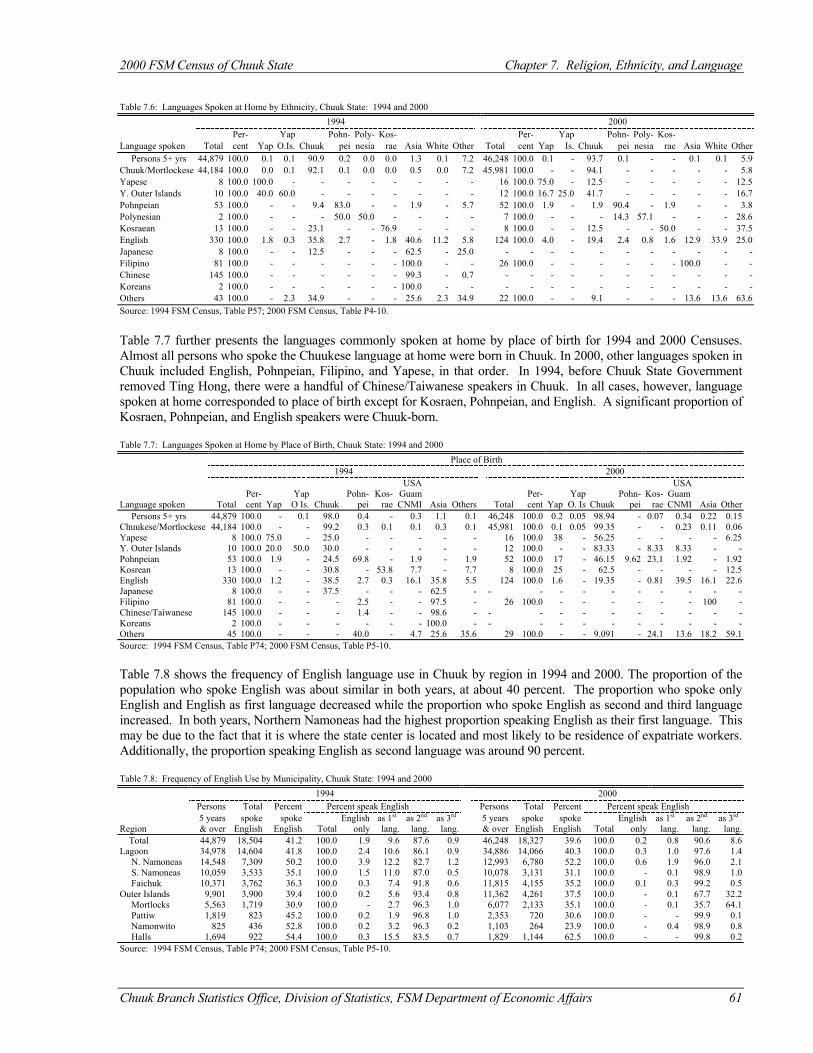
2000 FSM Census of Chuuk State Chapter 7. Religion, Ethnicity, and Language
Chuuk Branch Statistics Office, Division of Statistics, FSM Department of Economic Affairs 61
Table 7.6: Languages Spoken at Home by Ethnicity, Chuuk State: 1994 and 2000 1994 2000 Per- Yap Pohn- Poly- Kos- Per- Yap Pohn- Poly- Kos-
Language spoken Total cent Yap O.Is. Chuuk pei nesia rae Asia White Other Total cent Yap Is. Chuuk pei nesia rae Asia White Other Persons 5+ yrs 44,879 100.0 0.1 0.1 90.9 0.2 0.0 0.0 1.3 0.1 7.2 46,248 100.0 0.1 - 93.7 0.1 - - 0.1 0.1 5.9 Chuuk/Mortlockese 44,184 100.0 0.0 0.1 92.1 0.1 0.0 0.0 0.5 0.0 7.2 45,981 100.0 - - 94.1 - - - - - 5.8 Yapese 8 100.0 100.0 - - - - - - - - 16 100.0 75.0 - 12.5 - - - - - 12.5 Y. Outer Islands 10 100.0 40.0 60.0 - - - - - - - 12 100.0 16.7 25.0 41.7 - - - - - 16.7 Pohnpeian 53 100.0 - - 9.4 83.0 - - 1.9 - 5.7 52 100.0 1.9 - 1.9 90.4 - 1.9 - - 3.8 Polynesian 2 100.0 - - - 50.0 50.0 - - - - 7 100.0 - - - 14.3 57.1 - - - 28.6 Kosraean 13 100.0 - - 23.1 - - 76.9 - - - 8 100.0 - - 12.5 - - 50.0 - - 37.5 English 330 100.0 1.8 0.3 35.8 2.7 - 1.8 40.6 11.2 5.8 124 100.0 4.0 - 19.4 2.4 0.8 1.6 12.9 33.9 25.0 Japanese 8 100.0 - - 12.5 - - - 62.5 - 25.0 - - - - - - - - - - - Filipino 81 100.0 - - - - - - 100.0 - - 26 100.0 - - - - - - 100.0 - - Chinese 145 100.0 - - - - - - 99.3 - 0.7 - - - - - - - - - - - Koreans 2 100.0 - - - - - - 100.0 - - - - - - - - - - - - - Others 43 100.0 - 2.3 34.9 - - - 25.6 2.3 34.9 22 100.0 - - 9.1 - - - 13.6 13.6 63.6 Source: 1994 FSM Census, Table P57; 2000 FSM Census, Table P4-10.
Table 7.7 further presents the languages commonly spoken at home by place of birth for 1994 and 2000 Censuses. Almost all persons who spoke the Chuukese language at home were born in Chuuk. In 2000, other languages spoken in Chuuk included English, Pohnpeian, Filipino, and Yapese, in that order. In 1994, before Chuuk State Government removed Ting Hong, there were a handful of Chinese/Taiwanese speakers in Chuuk. In all cases, however, language spoken at home corresponded to place of birth except for Kosraen, Pohnpeian, and English. A significant proportion of Kosraen, Pohnpeian, and English speakers were Chuuk-born. Table 7.7: Languages Spoken at Home by Place of Birth, Chuuk State: 1994 and 2000
Place of Birth 1994 2000 USA USA Per- Yap Pohn- Kos- Guam Per- Yap Pohn- Kos- Guam
Language spoken Total cent Yap O Is. Chuuk pei rae CNMI Asia Others Total cent Yap O. Is Chuuk pei rae CNMI Asia Other Persons 5+ yrs 44,879 100.0 - 0.1 98.0 0.4 - 0.3 1.1 0.1 46,248 100.0 0.2 0.05 98.94 - 0.07 0.34 0.22 0.15 Chuukese/Mortlockese 44,184 100.0 - - 99.2 0.3 0.1 0.1 0.3 0.1 45,981 100.0 0.1 0.05 99.35 - - 0.23 0.11 0.06 Yapese 8 100.0 75.0 - 25.0 - - - - - 16 100.0 38 - 56.25 - - - - 6.25 Y. Outer Islands 10 100.0 20.0 50.0 30.0 - - - - - 12 100.0 - - 83.33 - 8.33 8.33 - - Pohnpeian 53 100.0 1.9 - 24.5 69.8 - 1.9 - 1.9 52 100.0 17 - 46.15 9.62 23.1 1.92 - 1.92 Kosrean 13 100.0 - - 30.8 - 53.8 7.7 - 7.7 8 100.0 25 - 62.5 - - - - 12.5 English 330 100.0 1.2 - 38.5 2.7 0.3 16.1 35.8 5.5 124 100.0 1.6 - 19.35 - 0.81 39.5 16.1 22.6 Japanese 8 100.0 - - 37.5 - - - 62.5 - - - - - - - - - - - Filipino 81 100.0 - - - 2.5 - - 97.5 - 26 100.0 - - - - - - 100 - Chinese/Taiwanese 145 100.0 - - - 1.4 - - 98.6 - - - - - - - - - - - Koreans 2 100.0 - - - - - - 100.0 - - - - - - - - - - - Others 45 100.0 - - - 40.0 - 4.7 25.6 35.6 29 100.0 - - 9.091 - 24.1 13.6 18.2 59.1 Source: 1994 FSM Census, Table P74; 2000 FSM Census, Table P5-10. Table 7.8 shows the frequency of English language use in Chuuk by region in 1994 and 2000. The proportion of the population who spoke English was about similar in both years, at about 40 percent. The proportion who spoke only English and English as first language decreased while the proportion who spoke English as second and third language increased. In both years, Northern Namoneas had the highest proportion speaking English as their first language. This may be due to the fact that it is where the state center is located and most likely to be residence of expatriate workers. Additionally, the proportion speaking English as second language was around 90 percent. Table 7.8: Frequency of English Use by Municipality, Chuuk State: 1994 and 2000
1994 2000 Persons Total Percent Percent speak English Persons Total Percent Percent speak English 5 years spoke spoke English as 1st as 2nd as 3rd 5 years spoke spoke English as 1st as 2nd as 3rd
Region & over English English Total only lang. lang. lang. & over English English Total only lang. lang. lang. Total 44,879 18,504 41.2 100.0 1.9 9.6 87.6 0.9 46,248 18,327 39.6 100.0 0.2 0.8 90.6 8.6 Lagoon 34,978 14,604 41.8 100.0 2.4 10.6 86.1 0.9 34,886 14,066 40.3 100.0 0.3 1.0 97.6 1.4 N. Namoneas 14,548 7,309 50.2 100.0 3.9 12.2 82.7 1.2 12,993 6,780 52.2 100.0 0.6 1.9 96.0 2.1 S. Namoneas 10,059 3,533 35.1 100.0 1.5 11.0 87.0 0.5 10,078 3,131 31.1 100.0 - 0.1 98.9 1.0 Faichuk 10,371 3,762 36.3 100.0 0.3 7.4 91.8 0.6 11,815 4,155 35.2 100.0 0.1 0.3 99.2 0.5 Outer Islands 9,901 3,900 39.4 100.0 0.2 5.6 93.4 0.8 11,362 4,261 37.5 100.0 - 0.1 67.7 32.2 Mortlocks 5,563 1,719 30.9 100.0 - 2.7 96.3 1.0 6,077 2,133 35.1 100.0 - 0.1 35.7 64.1 Pattiw 1,819 823 45.2 100.0 0.2 1.9 96.8 1.0 2,353 720 30.6 100.0 - - 99.9 0.1 Namonwito 825 436 52.8 100.0 0.2 3.2 96.3 0.2 1,103 264 23.9 100.0 - 0.4 98.9 0.8 Halls 1,694 922 54.4 100.0 0.3 15.5 83.5 0.7 1,829 1,144 62.5 100.0 - - 99.8 0.2 Source: 1994 FSM Census, Table P74; 2000 FSM Census, Table P5-10.
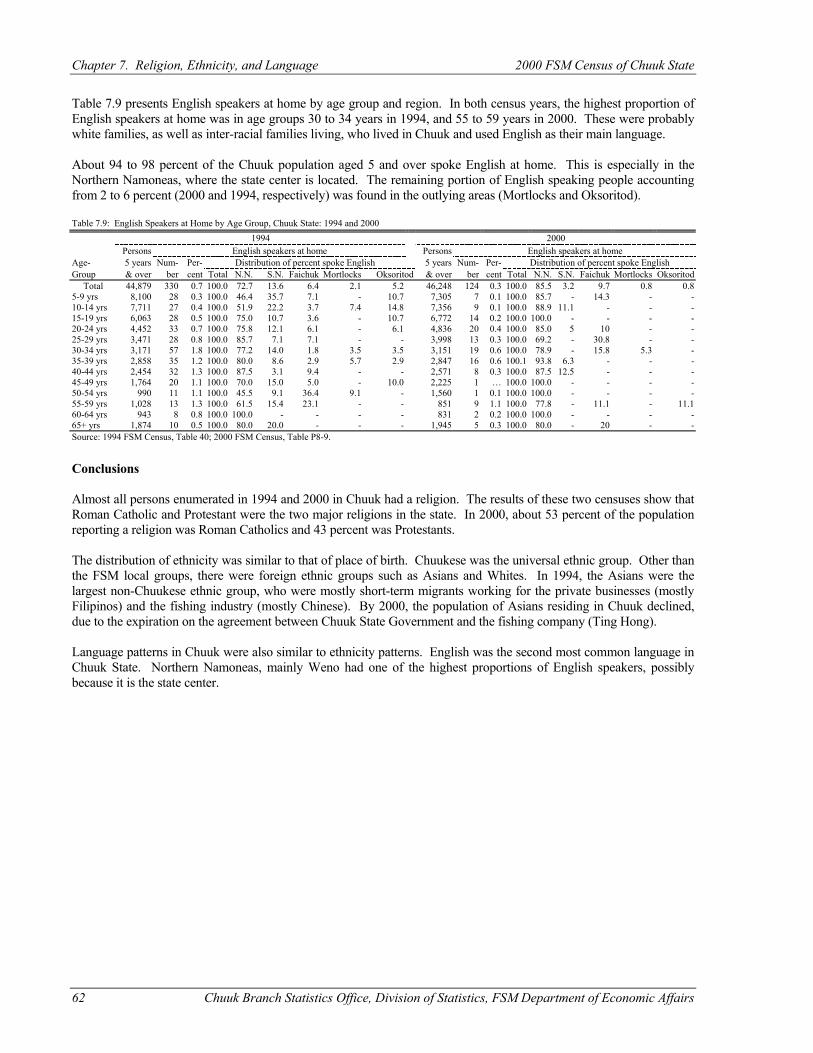
Chapter 7. Religion, Ethnicity, and Language 2000 FSM Census of Chuuk State
62 Chuuk Branch Statistics Office, Division of Statistics, FSM Department of Economic Affairs
Table 7.9 presents English speakers at home by age group and region. In both census years, the highest proportion of English speakers at home was in age groups 30 to 34 years in 1994, and 55 to 59 years in 2000. These were probably white families, as well as inter-racial families living, who lived in Chuuk and used English as their main language. About 94 to 98 percent of the Chuuk population aged 5 and over spoke English at home. This is especially in the Northern Namoneas, where the state center is located. The remaining portion of English speaking people accounting from 2 to 6 percent (2000 and 1994, respectively) was found in the outlying areas (Mortlocks and Oksoritod). Table 7.9: English Speakers at Home by Age Group, Chuuk State: 1994 and 2000 1994 2000
Persons English speakers at home Persons English speakers at home Age- 5 years Num- Per- Distribution of percent spoke English 5 years Num- Per- Distribution of percent spoke English Group & over ber cent Total N.N. S.N. Faichuk Mortlocks Oksoritod & over ber cent Total N.N. S.N. Faichuk Mortlocks Oksoritod Total 44,879 330 0.7 100.0 72.7 13.6 6.4 2.1 5.2 46,248 124 0.3 100.0 85.5 3.2 9.7 0.8 0.8 5-9 yrs 8,100 28 0.3 100.0 46.4 35.7 7.1 - 10.7 7,305 7 0.1 100.0 85.7 - 14.3 - - 10-14 yrs 7,711 27 0.4 100.0 51.9 22.2 3.7 7.4 14.8 7,356 9 0.1 100.0 88.9 11.1 - - - 15-19 yrs 6,063 28 0.5 100.0 75.0 10.7 3.6 - 10.7 6,772 14 0.2 100.0 100.0 - - - - 20-24 yrs 4,452 33 0.7 100.0 75.8 12.1 6.1 - 6.1 4,836 20 0.4 100.0 85.0 5 10 - - 25-29 yrs 3,471 28 0.8 100.0 85.7 7.1 7.1 - - 3,998 13 0.3 100.0 69.2 - 30.8 - - 30-34 yrs 3,171 57 1.8 100.0 77.2 14.0 1.8 3.5 3.5 3,151 19 0.6 100.0 78.9 - 15.8 5.3 - 35-39 yrs 2,858 35 1.2 100.0 80.0 8.6 2.9 5.7 2.9 2,847 16 0.6 100.1 93.8 6.3 - - - 40-44 yrs 2,454 32 1.3 100.0 87.5 3.1 9.4 - - 2,571 8 0.3 100.0 87.5 12.5 - - - 45-49 yrs 1,764 20 1.1 100.0 70.0 15.0 5.0 - 10.0 2,225 1 … 100.0 100.0 - - - - 50-54 yrs 990 11 1.1 100.0 45.5 9.1 36.4 9.1 - 1,560 1 0.1 100.0 100.0 - - - - 55-59 yrs 1,028 13 1.3 100.0 61.5 15.4 23.1 - - 851 9 1.1 100.0 77.8 - 11.1 - 11.1 60-64 yrs 943 8 0.8 100.0 100.0 - - - - 831 2 0.2 100.0 100.0 - - - - 65+ yrs 1,874 10 0.5 100.0 80.0 20.0 - - - 1,945 5 0.3 100.0 80.0 - 20 - - Source: 1994 FSM Census, Table 40; 2000 FSM Census, Table P8-9.
Conclusions Almost all persons enumerated in 1994 and 2000 in Chuuk had a religion. The results of these two censuses show that Roman Catholic and Protestant were the two major religions in the state. In 2000, about 53 percent of the population reporting a religion was Roman Catholics and 43 percent was Protestants. The distribution of ethnicity was similar to that of place of birth. Chuukese was the universal ethnic group. Other than the FSM local groups, there were foreign ethnic groups such as Asians and Whites. In 1994, the Asians were the largest non-Chuukese ethnic group, who were mostly short-term migrants working for the private businesses (mostly Filipinos) and the fishing industry (mostly Chinese). By 2000, the population of Asians residing in Chuuk declined, due to the expiration on the agreement between Chuuk State Government and the fishing company (Ting Hong). Language patterns in Chuuk were also similar to ethnicity patterns. English was the second most common language in Chuuk State. Northern Namoneas, mainly Weno had one of the highest proportions of English speakers, possibly because it is the state center.
Chuuk Branch Statistics Office, Division of Statistics, FSM Department of Economic Affairs 63
CHAPTER 8 EDUCATION AND LITERACY
Introduction A population's level of formal schooling is considered a good indicator of both social conditions and potential for economic success. For Chuuk State, which is moving from a more traditional economic system to a more Westernized system, data on education serve to provide a means to evaluate cultural change. Moreover, given the important role that education has come to play in various sectors of Chuuk's economy, results on this subject should provide insights on the direction of development and on the changing economic potential of the state. The 2000 FSM census had two items for education: school enrollment and level of educational attainment. The Chuuk State Department of Education collects statistical data annually to obtain information about school enrollment and to assess needs for special programs in bilingual education and special education. The census allows more in-depth analysis of schooling as well as educational attainment of the entire population to compare with the socio-economic characteristics of the population. Data Description School Enrollment and Type of School The 2000 census obtained data on school enrollment from answers to questionnaire item 12. Persons were classified as enrolled in school if they reported attending a "regular" public or private school or college at any time between April 1, 2000 and the date of enumeration. The question included instructions to "include only pre-kindergarten, kindergarten, elementary school, and schooling which would lead to a high school diploma or a college degree" as regular school. A public school was defined as any school or college controlled and supported by the state or national government. Private schools were supported and controlled primarily by religious organizations or other private groups. Level of School Enrolled The 2000 census classified persons enrolled in school at the time of the census as enrolled in pre-primary school, elementary school, high school, or college according to their response to question 13 (years of school completed or highest degree received) in combination with the response to status of school attendance. Persons who were enrolled and reported completing pre-kindergarten school or less were classified as enrolled in pre-primary school, which included kindergarten. Similarly, enrolled persons who had completed at least kindergarten, but not eighth grade, were classified as enrolled in elementary school. Enrolled persons who completed at least the eighth grade, but who were not high school graduates, were classified as enrolled in high school. Enrolled persons who reported completing high school or some college or having received a post-secondary degree were classified as enrolled in college. Enrolled persons who reported completing the twelfth grade but receiving no diploma were classified as enrolled in high school. Educational Attainment The 2000 census obtained data on educational attainment from answers to questionnaire item 13. Persons were classified according to the highest grade of school completed or the highest degree received. For persons currently enrolled in school, the question included instructions to report the level of the previous grade attended or the highest degree received. Enumerators were instructed that schooling completed in foreign or upgraded school systems should be reported by an estimated equivalent level of schooling in the regular American system; that vocational certificates or diplomas from vocational, trade, or business schools or colleges were not to be reported unless they were college-level degrees; and that honorary degrees were not to be reported. The instructions excluded "barber school, cosmetology, or other training for a specific trade" from the professional school degree category. Literacy The 2000 census obtained data on literacy - ability to read and write in any language - from responses to questionnaire item 14, asked of persons 3 years old and over. In published reports based on the 2000 data, results generally are shown only for persons 10 years old and over. Respondents were asked if they could read and write a paragraph, in any language. A person was not literate if he or she could read but not write, or if the writing ability was limited to writing the person's own name.

Chapter 8. Education 2000 FSM Census of Chuuk State
64 Chuuk Branch Statistics Office, Division of Statistics, FSM Department of Economic Affairs
Vocational Training The 2000 census obtained data on vocational training for all persons aged 15 years and over from responses to questionnaire item 18. "Vocational training" denotes a school program designed to prepare a person for work in a specific occupational field. Persons were counted as having completed vocational training if they completed the requirements for a vocational training program at a trade school, business school, hospital, some other kind of school for occupational training, or place of work. Vocational training included training in vocational fields such as carpentry, electronics, nursing, or accounting if a bachelor's degree would not be granted for the training. Training at place of work includes programs designed to teach new skills. Individual courses for personal enrichment, such as a single typing course, were not considered vocational training. Job Corps training and correspondence courses were included. The types of training not included were college courses applicable towards a bachelor's degree, single courses not part of an organized program, on-the-job training, and Armed Forces basic training. Limitations and Comparability. School enrollment and educational attainment questions have been included in all censuses conducted in Chuuk State since 1973. The pertinent question in each census referred to the status of school attendance during a specific reference period and to the highest grade completed. All reference periods coincided to schooling seasons, but not to the same months. The age range for which enrollment data were obtained and published also varied between censuses. For 1973, census information on enrollment was recorded for persons aged 4 years and over while the 2000, 1994 and 1980 Censuses recorded information on enrollment for persons aged 3 years and over. Because of this and differences in reference period, comparison of school enrollment has to be considered cautiously. There are no obvious limitations of the school enrollment and educational attainment data collected in the 2000 census of Chuuk. Information on type of school was collected in Chuuk only during the 1973, 1980, 1994 and 2000 Censuses. Also, vocational training questions were asked only in the 1980, 1994 and 2000 Censuses. The 1980 Census had one additional question on specific type of school while the 1994 and 2000 census provided additional information on whether the training was inside or outside Chuuk State. Analysis of Education Data School Enrollment School Attendance by Level of Enrollment The number of persons attending school in the state of Chuuk decreased between 1994 and 2000 although it had been continuously increasing since 1973 (Table 8.1). This decrease was evident only for elementary and pre-school/kindergarten school enrollment. High school and college enrollment increased, and the number of students enrolled in public high schools increased while that of private high schools decreased. Table 8.1: School Attendance for Age 3 Years and Over by Level and Type, Chuuk State: 1973 to 2000 Number Percent change Level and Type 19731 1980 1994 2000 '73*-'80 '80-'94 94-'00 Total enrollment 10,175 11,138 17,601 17,082 1.2 2.6 (0.5) Pre-school/kindergarten ... 322 960 823 --- 4.7 (2.8) Public ... 239 831 722 --- 5.1 (2.5) Private ... 83 129 101 --- 2.5 (4.6) Elementary 8,346 8,481 11,645 10,992 0.2 1.9 (1.0) Public ... 7,956 10,650 10,245 --- 1.8 (0.7) Private ... 525 995 747 --- 3.4 (5.5) High school 1,819 1,985 4,380 4,573 1.2 3.9 0.7 Public ... 1,902 3,741 4,091 --- 3.5 1.4 Private ... 83 639 482 --- 6.2 (5.4) College 10 350 616 694 13.9 3.1 1.9 Source: 1973 TTPI Census, Table T12A; 1980 TTPI Census, Table T34; 1994 FSM Census, Table P24; 2000 FSM Census, Table P2-12. Note: 1. No breakdown by type and covered ages 4 to 30 years. Table 8.2 presents data on school attendance by sex for census years 1994 and 2000. In both census years, the sex ratio of total males per 100 females shows more males in school than females. There were more males than females enrolled at the pre-school and elementary levels. While there were more females than males enrolled at the private pre-school and private elementary school levels, males were more likely to be enrolled in the public pre-school and public elementary school levels. Females’ enrollment at high school level significantly outnumbered males’ enrollment during both years, and in 2000 females enrolled in college outnumbered males though it was the opposite in 1994. The
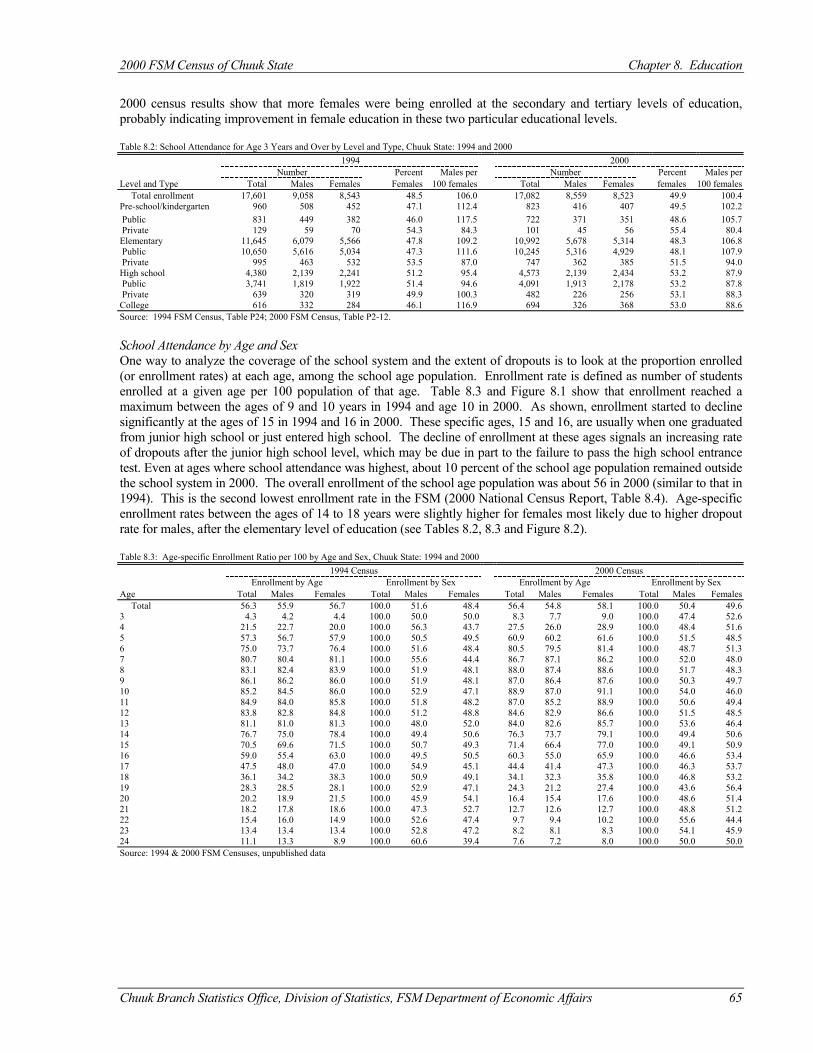
2000 FSM Census of Chuuk State Chapter 8. Education
Chuuk Branch Statistics Office, Division of Statistics, FSM Department of Economic Affairs 65
2000 census results show that more females were being enrolled at the secondary and tertiary levels of education, probably indicating improvement in female education in these two particular educational levels. Table 8.2: School Attendance for Age 3 Years and Over by Level and Type, Chuuk State: 1994 and 2000 1994 2000
Number Percent Males per Number Percent Males per Level and Type Total Males Females Females 100 females Total Males Females females 100 females Total enrollment 17,601 9,058 8,543 48.5 106.0 17,082 8,559 8,523 49.9 100.4 Pre-school/kindergarten 960 508 452 47.1 112.4 823 416 407 49.5 102.2 Public 831 449 382 46.0 117.5 722 371 351 48.6 105.7 Private 129 59 70 54.3 84.3 101 45 56 55.4 80.4 Elementary 11,645 6,079 5,566 47.8 109.2 10,992 5,678 5,314 48.3 106.8 Public 10,650 5,616 5,034 47.3 111.6 10,245 5,316 4,929 48.1 107.9 Private 995 463 532 53.5 87.0 747 362 385 51.5 94.0 High school 4,380 2,139 2,241 51.2 95.4 4,573 2,139 2,434 53.2 87.9 Public 3,741 1,819 1,922 51.4 94.6 4,091 1,913 2,178 53.2 87.8 Private 639 320 319 49.9 100.3 482 226 256 53.1 88.3 College 616 332 284 46.1 116.9 694 326 368 53.0 88.6 Source: 1994 FSM Census, Table P24; 2000 FSM Census, Table P2-12. School Attendance by Age and Sex One way to analyze the coverage of the school system and the extent of dropouts is to look at the proportion enrolled (or enrollment rates) at each age, among the school age population. Enrollment rate is defined as number of students enrolled at a given age per 100 population of that age. Table 8.3 and Figure 8.1 show that enrollment reached a maximum between the ages of 9 and 10 years in 1994 and age 10 in 2000. As shown, enrollment started to decline significantly at the ages of 15 in 1994 and 16 in 2000. These specific ages, 15 and 16, are usually when one graduated from junior high school or just entered high school. The decline of enrollment at these ages signals an increasing rate of dropouts after the junior high school level, which may be due in part to the failure to pass the high school entrance test. Even at ages where school attendance was highest, about 10 percent of the school age population remained outside the school system in 2000. The overall enrollment of the school age population was about 56 in 2000 (similar to that in 1994). This is the second lowest enrollment rate in the FSM (2000 National Census Report, Table 8.4). Age-specific enrollment rates between the ages of 14 to 18 years were slightly higher for females most likely due to higher dropout rate for males, after the elementary level of education (see Tables 8.2, 8.3 and Figure 8.2). Table 8.3: Age-specific Enrollment Ratio per 100 by Age and Sex, Chuuk State: 1994 and 2000 1994 Census 2000 Census
Enrollment by Age Enrollment by Sex Enrollment by Age Enrollment by Sex Age Total Males Females Total Males Females Total Males Females Total Males Females Total 56.3 55.9 56.7 100.0 51.6 48.4 56.4 54.8 58.1 100.0 50.4 49.6 3 4.3 4.2 4.4 100.0 50.0 50.0 8.3 7.7 9.0 100.0 47.4 52.6 4 21.5 22.7 20.0 100.0 56.3 43.7 27.5 26.0 28.9 100.0 48.4 51.6 5 57.3 56.7 57.9 100.0 50.5 49.5 60.9 60.2 61.6 100.0 51.5 48.5 6 75.0 73.7 76.4 100.0 51.6 48.4 80.5 79.5 81.4 100.0 48.7 51.3 7 80.7 80.4 81.1 100.0 55.6 44.4 86.7 87.1 86.2 100.0 52.0 48.0 8 83.1 82.4 83.9 100.0 51.9 48.1 88.0 87.4 88.6 100.0 51.7 48.3 9 86.1 86.2 86.0 100.0 51.9 48.1 87.0 86.4 87.6 100.0 50.3 49.7 10 85.2 84.5 86.0 100.0 52.9 47.1 88.9 87.0 91.1 100.0 54.0 46.0 11 84.9 84.0 85.8 100.0 51.8 48.2 87.0 85.2 88.9 100.0 50.6 49.4 12 83.8 82.8 84.8 100.0 51.2 48.8 84.6 82.9 86.6 100.0 51.5 48.5 13 81.1 81.0 81.3 100.0 48.0 52.0 84.0 82.6 85.7 100.0 53.6 46.4 14 76.7 75.0 78.4 100.0 49.4 50.6 76.3 73.7 79.1 100.0 49.4 50.6 15 70.5 69.6 71.5 100.0 50.7 49.3 71.4 66.4 77.0 100.0 49.1 50.9 16 59.0 55.4 63.0 100.0 49.5 50.5 60.3 55.0 65.9 100.0 46.6 53.4 17 47.5 48.0 47.0 100.0 54.9 45.1 44.4 41.4 47.3 100.0 46.3 53.7 18 36.1 34.2 38.3 100.0 50.9 49.1 34.1 32.3 35.8 100.0 46.8 53.2 19 28.3 28.5 28.1 100.0 52.9 47.1 24.3 21.2 27.4 100.0 43.6 56.4 20 20.2 18.9 21.5 100.0 45.9 54.1 16.4 15.4 17.6 100.0 48.6 51.4 21 18.2 17.8 18.6 100.0 47.3 52.7 12.7 12.6 12.7 100.0 48.8 51.2 22 15.4 16.0 14.9 100.0 52.6 47.4 9.7 9.4 10.2 100.0 55.6 44.4 23 13.4 13.4 13.4 100.0 52.8 47.2 8.2 8.1 8.3 100.0 54.1 45.9 24 11.1 13.3 8.9 100.0 60.6 39.4 7.6 7.2 8.0 100.0 50.0 50.0 Source: 1994 & 2000 FSM Censuses, unpublished data
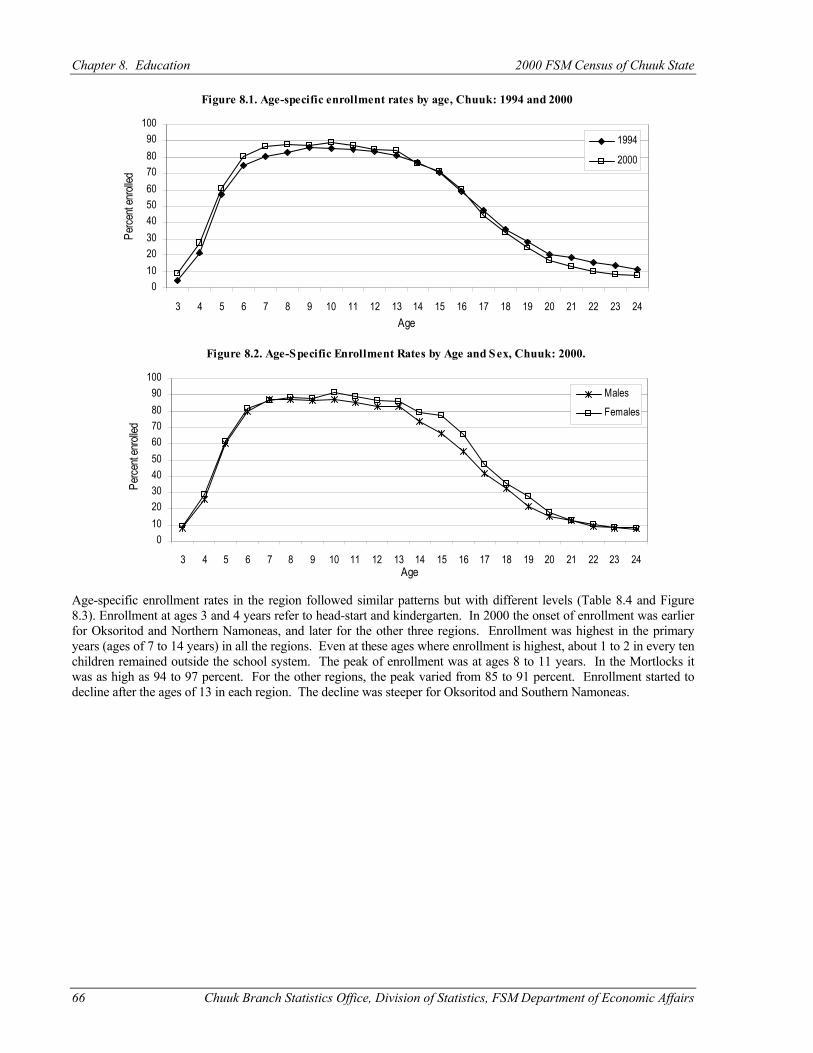
Chapter 8. Education 2000 FSM Census of Chuuk State
66 Chuuk Branch Statistics Office, Division of Statistics, FSM Department of Economic Affairs
Age-specific enrollment rates in the region followed similar patterns but with different levels (Table 8.4 and Figure 8.3). Enrollment at ages 3 and 4 years refer to head-start and kindergarten. In 2000 the onset of enrollment was earlier for Oksoritod and Northern Namoneas, and later for the other three regions. Enrollment was highest in the primary years (ages of 7 to 14 years) in all the regions. Even at these ages where enrollment is highest, about 1 to 2 in every ten children remained outside the school system. The peak of enrollment was at ages 8 to 11 years. In the Mortlocks it was as high as 94 to 97 percent. For the other regions, the peak varied from 85 to 91 percent. Enrollment started to decline after the ages of 13 in each region. The decline was steeper for Oksoritod and Southern Namoneas.
Figure 8.1. Age-specific enrollment rates by age, Chuuk: 1994 and 2000
0102030405060708090
100
3 4 5 6 7 8 9 10 11 12 13 14 15 16 17 18 19 20 21 22 23 24Age
Perce
nt en
rolled
1994
2000
Figure 8.2. Age-Specific Enrollment Rates by Age and Sex, Chuuk: 2000.
0102030405060708090
100
3 4 5 6 7 8 9 10 11 12 13 14 15 16 17 18 19 20 21 22 23 24Age
Perce
nt en
rolled
MalesFemales
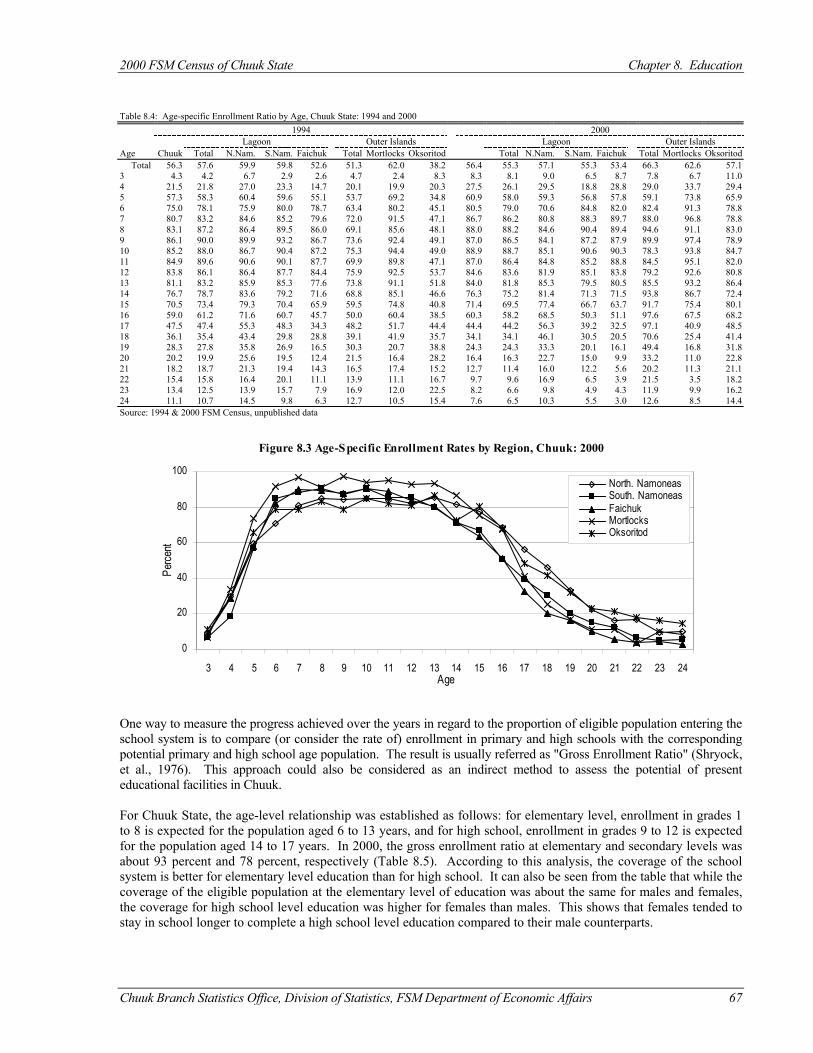
2000 FSM Census of Chuuk State Chapter 8. Education
Chuuk Branch Statistics Office, Division of Statistics, FSM Department of Economic Affairs 67
Table 8.4: Age-specific Enrollment Ratio by Age, Chuuk State: 1994 and 2000 1994 2000
Lagoon Outer Islands Lagoon Outer Islands Age Chuuk Total N.Nam. S.Nam. Faichuk Total Mortlocks Oksoritod Total N.Nam. S.Nam. Faichuk Total Mortlocks Oksoritod Total 56.3 57.6 59.9 59.8 52.6 51.3 62.0 38.2 56.4 55.3 57.1 55.3 53.4 66.3 62.6 57.1 3 4.3 4.2 6.7 2.9 2.6 4.7 2.4 8.3 8.3 8.1 9.0 6.5 8.7 7.8 6.7 11.0 4 21.5 21.8 27.0 23.3 14.7 20.1 19.9 20.3 27.5 26.1 29.5 18.8 28.8 29.0 33.7 29.4 5 57.3 58.3 60.4 59.6 55.1 53.7 69.2 34.8 60.9 58.0 59.3 56.8 57.8 59.1 73.8 65.9 6 75.0 78.1 75.9 80.0 78.7 63.4 80.2 45.1 80.5 79.0 70.6 84.8 82.0 82.4 91.3 78.8 7 80.7 83.2 84.6 85.2 79.6 72.0 91.5 47.1 86.7 86.2 80.8 88.3 89.7 88.0 96.8 78.8 8 83.1 87.2 86.4 89.5 86.0 69.1 85.6 48.1 88.0 88.2 84.6 90.4 89.4 94.6 91.1 83.0 9 86.1 90.0 89.9 93.2 86.7 73.6 92.4 49.1 87.0 86.5 84.1 87.2 87.9 89.9 97.4 78.9 10 85.2 88.0 86.7 90.4 87.2 75.3 94.4 49.0 88.9 88.7 85.1 90.6 90.3 78.3 93.8 84.7 11 84.9 89.6 90.6 90.1 87.7 69.9 89.8 47.1 87.0 86.4 84.8 85.2 88.8 84.5 95.1 82.0 12 83.8 86.1 86.4 87.7 84.4 75.9 92.5 53.7 84.6 83.6 81.9 85.1 83.8 79.2 92.6 80.8 13 81.1 83.2 85.9 85.3 77.6 73.8 91.1 51.8 84.0 81.8 85.3 79.5 80.5 85.5 93.2 86.4 14 76.7 78.7 83.6 79.2 71.6 68.8 85.1 46.6 76.3 75.2 81.4 71.3 71.5 93.8 86.7 72.4 15 70.5 73.4 79.3 70.4 65.9 59.5 74.8 40.8 71.4 69.5 77.4 66.7 63.7 91.7 75.4 80.1 16 59.0 61.2 71.6 60.7 45.7 50.0 60.4 38.5 60.3 58.2 68.5 50.3 51.1 97.6 67.5 68.2 17 47.5 47.4 55.3 48.3 34.3 48.2 51.7 44.4 44.4 44.2 56.3 39.2 32.5 97.1 40.9 48.5 18 36.1 35.4 43.4 29.8 28.8 39.1 41.9 35.7 34.1 34.1 46.1 30.5 20.5 70.6 25.4 41.4 19 28.3 27.8 35.8 26.9 16.5 30.3 20.7 38.8 24.3 24.3 33.3 20.1 16.1 49.4 16.8 31.8 20 20.2 19.9 25.6 19.5 12.4 21.5 16.4 28.2 16.4 16.3 22.7 15.0 9.9 33.2 11.0 22.8 21 18.2 18.7 21.3 19.4 14.3 16.5 17.4 15.2 12.7 11.4 16.0 12.2 5.6 20.2 11.3 21.1 22 15.4 15.8 16.4 20.1 11.1 13.9 11.1 16.7 9.7 9.6 16.9 6.5 3.9 21.5 3.5 18.2 23 13.4 12.5 13.9 15.7 7.9 16.9 12.0 22.5 8.2 6.6 9.8 4.9 4.3 11.9 9.9 16.2 24 11.1 10.7 14.5 9.8 6.3 12.7 10.5 15.4 7.6 6.5 10.3 5.5 3.0 12.6 8.5 14.4 Source: 1994 & 2000 FSM Census, unpublished data
One way to measure the progress achieved over the years in regard to the proportion of eligible population entering the school system is to compare (or consider the rate of) enrollment in primary and high schools with the corresponding potential primary and high school age population. The result is usually referred as "Gross Enrollment Ratio" (Shryock, et al., 1976). This approach could also be considered as an indirect method to assess the potential of present educational facilities in Chuuk. For Chuuk State, the age-level relationship was established as follows: for elementary level, enrollment in grades 1 to 8 is expected for the population aged 6 to 13 years, and for high school, enrollment in grades 9 to 12 is expected for the population aged 14 to 17 years. In 2000, the gross enrollment ratio at elementary and secondary levels was about 93 percent and 78 percent, respectively (Table 8.5). According to this analysis, the coverage of the school system is better for elementary level education than for high school. It can also be seen from the table that while the coverage of the eligible population at the elementary level of education was about the same for males and females, the coverage for high school level education was higher for females than males. This shows that females tended to stay in school longer to complete a high school level education compared to their male counterparts.
Figure 8.3 Age-Specific Enrollment Rates by Region, Chuuk: 2000
0
20
40
60
80
100
3 4 5 6 7 8 9 10 11 12 13 14 15 16 17 18 19 20 21 22 23 24Age
Perce
nt
North. NamoneasSouth. NamoneasFaichukMortlocksOksoritod
Chapter 8. Education 2000 FSM Census of Chuuk State
68 Chuuk Branch Statistics Office, Division of Statistics, FSM Department of Economic Affairs
Table 8.5: Gross Enrollment Ratio by Sex, Chuuk State: 1994 and 2000 1994 2000 Level Total Males Females Total Males Females Elementary 92.0 91.8 92.2 93.0 92.1 94.0 High School 81.0 75.9 86.6 77.6 77.6 84.5 Source: 1994 & 2000 FSM Census, unpublished data Educational Attainment Educational Attainment by Age and Sex Table 8.6 summarizes data on educational attainment for the population aged 25 years and over. The absolute numbers of the population completing some level of education increased between 1980 and 2000. The proportion for persons with no schooling decreased from about 35 percent in 1980 to about 19 percent in 1994 and 18 percent in 2000. That is, in 1980 one in every three persons had no schooling, compared to one in five in 1994 and 2000. Also, the proportion of the population completing at least high school levels of education (high school and higher) increased from around 22 percent in 1980 to about 46 percent in 1994 and 49 percent in 2000. In general, educational attainment for males also increased consistently between 1980, 1994 and 2000. The proportion of males with no schooling in 2000 was 15 percent, a decrease from over 29 percent in 1980 and about 16 percent in 1994. The proportion with only elementary level attainment declined in 1994 and rose significantly in 2000. The proportion with high school attainment increased significantly while that of college decreased. The decline in the proportion of males with only elementary level education between 1980 and 1994 could have possibly resulted from, among other things, the heavy out migration of working age males during the second half of the 1980s, many of whom emigrated to take jobs as laborers and may not have had higher level of education. Table 8.6: Educational Attainment for Age 25 Years and Over by Sex, Chuuk State: 1980, 1994 and 2000 Number Percent Educational attainment 1980 1994 2000 1980 1994 2000 Total 12,754 18,553 19,980 100.0 100.0 100.0 No school 4,415 3,553 3,561 34.6 19.2 17.8 Pre-school/kindergarten -... 1,177 121 .-.. 6.3 0.6 Elementary 5,508 5,328 6,743 43.2 28.7 33.7 High school 2,094 5,570 6,821 16.4 30.0 34.1 College 737 2,925 2,734 5.8 15.8 13.7 Males 6,381 9,241 9,788 100.0 100.0 100.0 No school 1,868 1,438 1472 29.3 15.6 15.0 Pre-school/kindergarten -... 508 57 .-.. 5.5 0.6 Elementary 2,530 2,191 2904 39.6 23.7 29.7 High school 1,416 3,075 3613 22.2 33.3 36.9 College 567 2,029 1742 8.9 22.0 17.8 Females 6,373 9,312 10,192 100.0 100.0 100.0 No School 2,547 2,115 2089 40.0 22.7 20.5 Pre-School/Kindergarten -... 669 64 .-.. 7.2 0.6 Elementary 2,978 3,137 3839 46.7 33.7 37.7 High School 678 2,495 3208 10.6 26.8 31.5 College 170 896 992 2.7 9.6 9.7 Source: 1980 TTPI Census, Table T35; 1994 FSM Census, Table P24; 2000 FSM Census, Table P2-12. The improvement in educational attainment for females in Chuuk State was more pronounced. The proportion of females with no schooling was 21 percent in 2000, a drop from 40 percent in 1980 and about 23 percent in 1994. In other words, in 1980 two women in every five had no grade completed compared to about one in five, in 1994 and 2000. This improvement held true for higher education levels, as well. The proportion of females with at least a high school education increased from about 13 percent in 1980 to over 36 percent in 1994 to 41 percent in 2000. The proportion of females with some college education also increased by about seven percentage points (from about 3 to about 10 percent) over the period of a decade and a half. Table 8.7 further presents the cumulative percentage distribution of the population aged 25 years and over by the highest grade completed. Cumulative percentage provides the proportion of the population with at least a given level of educational attainment. In 2000 about 82 percent of the population aged 25 years and over had some level of education as opposed to 75 percent in 1994. The population with at least elementary level education constituted about 58 percent in 1994 and 63 percent in 2000. Likewise, the proportion of the population with high school or higher-level education was about 16 percent in 1994 and 14 percent in 2000. While the attainment at lower levels of education could be considered somewhat satisfactory, higher-level educational attainment in Chuuk State could be improved.
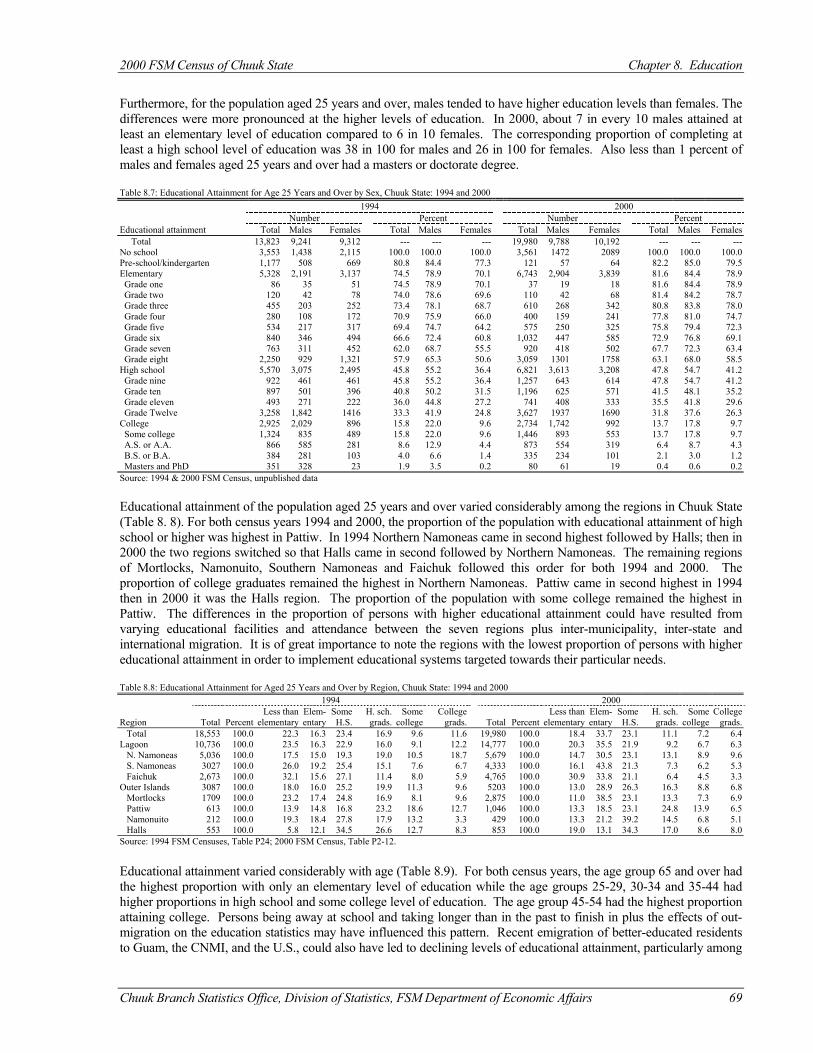
2000 FSM Census of Chuuk State Chapter 8. Education
Chuuk Branch Statistics Office, Division of Statistics, FSM Department of Economic Affairs 69
Furthermore, for the population aged 25 years and over, males tended to have higher education levels than females. The differences were more pronounced at the higher levels of education. In 2000, about 7 in every 10 males attained at least an elementary level of education compared to 6 in 10 females. The corresponding proportion of completing at least a high school level of education was 38 in 100 for males and 26 in 100 for females. Also less than 1 percent of males and females aged 25 years and over had a masters or doctorate degree. Table 8.7: Educational Attainment for Age 25 Years and Over by Sex, Chuuk State: 1994 and 2000 1994 2000
Number Percent Number Percent Educational attainment Total Males Females Total Males Females Total Males Females Total Males Females Total 13,823 9,241 9,312 --- --- --- 19,980 9,788 10,192 --- --- --- No school 3,553 1,438 2,115 100.0 100.0 100.0 3,561 1472 2089 100.0 100.0 100.0 Pre-school/kindergarten 1,177 508 669 80.8 84.4 77.3 121 57 64 82.2 85.0 79.5 Elementary 5,328 2,191 3,137 74.5 78.9 70.1 6,743 2,904 3,839 81.6 84.4 78.9 Grade one 86 35 51 74.5 78.9 70.1 37 19 18 81.6 84.4 78.9 Grade two 120 42 78 74.0 78.6 69.6 110 42 68 81.4 84.2 78.7 Grade three 455 203 252 73.4 78.1 68.7 610 268 342 80.8 83.8 78.0 Grade four 280 108 172 70.9 75.9 66.0 400 159 241 77.8 81.0 74.7 Grade five 534 217 317 69.4 74.7 64.2 575 250 325 75.8 79.4 72.3 Grade six 840 346 494 66.6 72.4 60.8 1,032 447 585 72.9 76.8 69.1 Grade seven 763 311 452 62.0 68.7 55.5 920 418 502 67.7 72.3 63.4 Grade eight 2,250 929 1,321 57.9 65.3 50.6 3,059 1301 1758 63.1 68.0 58.5 High school 5,570 3,075 2,495 45.8 55.2 36.4 6,821 3,613 3,208 47.8 54.7 41.2 Grade nine 922 461 461 45.8 55.2 36.4 1,257 643 614 47.8 54.7 41.2 Grade ten 897 501 396 40.8 50.2 31.5 1,196 625 571 41.5 48.1 35.2 Grade eleven 493 271 222 36.0 44.8 27.2 741 408 333 35.5 41.8 29.6 Grade Twelve 3,258 1,842 1416 33.3 41.9 24.8 3,627 1937 1690 31.8 37.6 26.3 College 2,925 2,029 896 15.8 22.0 9.6 2,734 1,742 992 13.7 17.8 9.7 Some college 1,324 835 489 15.8 22.0 9.6 1,446 893 553 13.7 17.8 9.7 A.S. or A.A. 866 585 281 8.6 12.9 4.4 873 554 319 6.4 8.7 4.3 B.S. or B.A. 384 281 103 4.0 6.6 1.4 335 234 101 2.1 3.0 1.2 Masters and PhD 351 328 23 1.9 3.5 0.2 80 61 19 0.4 0.6 0.2 Source: 1994 & 2000 FSM Census, unpublished data Educational attainment of the population aged 25 years and over varied considerably among the regions in Chuuk State (Table 8. 8). For both census years 1994 and 2000, the proportion of the population with educational attainment of high school or higher was highest in Pattiw. In 1994 Northern Namoneas came in second highest followed by Halls; then in 2000 the two regions switched so that Halls came in second followed by Northern Namoneas. The remaining regions of Mortlocks, Namonuito, Southern Namoneas and Faichuk followed this order for both 1994 and 2000. The proportion of college graduates remained the highest in Northern Namoneas. Pattiw came in second highest in 1994 then in 2000 it was the Halls region. The proportion of the population with some college remained the highest in Pattiw. The differences in the proportion of persons with higher educational attainment could have resulted from varying educational facilities and attendance between the seven regions plus inter-municipality, inter-state and international migration. It is of great importance to note the regions with the lowest proportion of persons with higher educational attainment in order to implement educational systems targeted towards their particular needs. Table 8.8: Educational Attainment for Aged 25 Years and Over by Region, Chuuk State: 1994 and 2000 1994 2000
Less than Elem- Some H. sch. Some College Less than Elem- Some H. sch. Some College Region Total Percent elementary entary H.S. grads. college grads. Total Percent elementary entary H.S. grads. college grads. Total 18,553 100.0 22.3 16.3 23.4 16.9 9.6 11.6 19,980 100.0 18.4 33.7 23.1 11.1 7.2 6.4 Lagoon 10,736 100.0 23.5 16.3 22.9 16.0 9.1 12.2 14,777 100.0 20.3 35.5 21.9 9.2 6.7 6.3 N. Namoneas 5,036 100.0 17.5 15.0 19.3 19.0 10.5 18.7 5,679 100.0 14.7 30.5 23.1 13.1 8.9 9.6 S. Namoneas 3027 100.0 26.0 19.2 25.4 15.1 7.6 6.7 4,333 100.0 16.1 43.8 21.3 7.3 6.2 5.3 Faichuk 2,673 100.0 32.1 15.6 27.1 11.4 8.0 5.9 4,765 100.0 30.9 33.8 21.1 6.4 4.5 3.3 Outer Islands 3087 100.0 18.0 16.0 25.2 19.9 11.3 9.6 5203 100.0 13.0 28.9 26.3 16.3 8.8 6.8 Mortlocks 1709 100.0 23.2 17.4 24.8 16.9 8.1 9.6 2,875 100.0 11.0 38.5 23.1 13.3 7.3 6.9 Pattiw 613 100.0 13.9 14.8 16.8 23.2 18.6 12.7 1,046 100.0 13.3 18.5 23.1 24.8 13.9 6.5 Namonuito 212 100.0 19.3 18.4 27.8 17.9 13.2 3.3 429 100.0 13.3 21.2 39.2 14.5 6.8 5.1 Halls 553 100.0 5.8 12.1 34.5 26.6 12.7 8.3 853 100.0 19.0 13.1 34.3 17.0 8.6 8.0 Source: 1994 FSM Censuses, Table P24; 2000 FSM Census, Table P2-12.
Educational attainment varied considerably with age (Table 8.9). For both census years, the age group 65 and over had the highest proportion with only an elementary level of education while the age groups 25-29, 30-34 and 35-44 had higher proportions in high school and some college level of education. The age group 45-54 had the highest proportion attaining college. Persons being away at school and taking longer than in the past to finish in plus the effects of out-migration on the education statistics may have influenced this pattern. Recent emigration of better-educated residents to Guam, the CNMI, and the U.S., could also have led to declining levels of educational attainment, particularly among
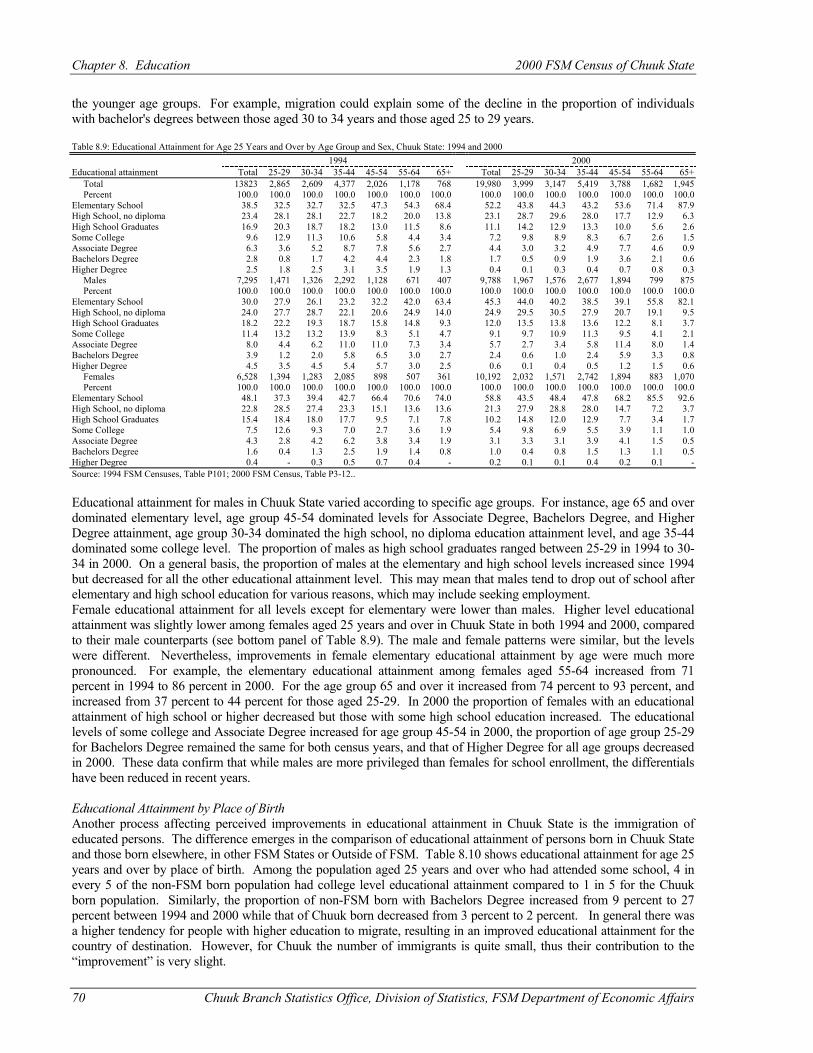
Chapter 8. Education 2000 FSM Census of Chuuk State
70 Chuuk Branch Statistics Office, Division of Statistics, FSM Department of Economic Affairs
the younger age groups. For example, migration could explain some of the decline in the proportion of individuals with bachelor's degrees between those aged 30 to 34 years and those aged 25 to 29 years. Table 8.9: Educational Attainment for Age 25 Years and Over by Age Group and Sex, Chuuk State: 1994 and 2000 1994 2000 Educational attainment Total 25-29 30-34 35-44 45-54 55-64 65+ Total 25-29 30-34 35-44 45-54 55-64 65+ Total 13823 2,865 2,609 4,377 2,026 1,178 768 19,980 3,999 3,147 5,419 3,788 1,682 1,945 Percent 100.0 100.0 100.0 100.0 100.0 100.0 100.0 100.0 100.0 100.0 100.0 100.0 100.0 100.0 Elementary School 38.5 32.5 32.7 32.5 47.3 54.3 68.4 52.2 43.8 44.3 43.2 53.6 71.4 87.9 High School, no diploma 23.4 28.1 28.1 22.7 18.2 20.0 13.8 23.1 28.7 29.6 28.0 17.7 12.9 6.3 High School Graduates 16.9 20.3 18.7 18.2 13.0 11.5 8.6 11.1 14.2 12.9 13.3 10.0 5.6 2.6 Some College 9.6 12.9 11.3 10.6 5.8 4.4 3.4 7.2 9.8 8.9 8.3 6.7 2.6 1.5 Associate Degree 6.3 3.6 5.2 8.7 7.8 5.6 2.7 4.4 3.0 3.2 4.9 7.7 4.6 0.9 Bachelors Degree 2.8 0.8 1.7 4.2 4.4 2.3 1.8 1.7 0.5 0.9 1.9 3.6 2.1 0.6 Higher Degree 2.5 1.8 2.5 3.1 3.5 1.9 1.3 0.4 0.1 0.3 0.4 0.7 0.8 0.3 Males 7,295 1,471 1,326 2,292 1,128 671 407 9,788 1,967 1,576 2,677 1,894 799 875 Percent 100.0 100.0 100.0 100.0 100.0 100.0 100.0 100.0 100.0 100.0 100.0 100.0 100.0 100.0 Elementary School 30.0 27.9 26.1 23.2 32.2 42.0 63.4 45.3 44.0 40.2 38.5 39.1 55.8 82.1 High School, no diploma 24.0 27.7 28.7 22.1 20.6 24.9 14.0 24.9 29.5 30.5 27.9 20.7 19.1 9.5 High School Graduates 18.2 22.2 19.3 18.7 15.8 14.8 9.3 12.0 13.5 13.8 13.6 12.2 8.1 3.7 Some College 11.4 13.2 13.2 13.9 8.3 5.1 4.7 9.1 9.7 10.9 11.3 9.5 4.1 2.1 Associate Degree 8.0 4.4 6.2 11.0 11.0 7.3 3.4 5.7 2.7 3.4 5.8 11.4 8.0 1.4 Bachelors Degree 3.9 1.2 2.0 5.8 6.5 3.0 2.7 2.4 0.6 1.0 2.4 5.9 3.3 0.8 Higher Degree 4.5 3.5 4.5 5.4 5.7 3.0 2.5 0.6 0.1 0.4 0.5 1.2 1.5 0.6 Females 6,528 1,394 1,283 2,085 898 507 361 10,192 2,032 1,571 2,742 1,894 883 1,070 Percent 100.0 100.0 100.0 100.0 100.0 100.0 100.0 100.0 100.0 100.0 100.0 100.0 100.0 100.0 Elementary School 48.1 37.3 39.4 42.7 66.4 70.6 74.0 58.8 43.5 48.4 47.8 68.2 85.5 92.6 High School, no diploma 22.8 28.5 27.4 23.3 15.1 13.6 13.6 21.3 27.9 28.8 28.0 14.7 7.2 3.7 High School Graduates 15.4 18.4 18.0 17.7 9.5 7.1 7.8 10.2 14.8 12.0 12.9 7.7 3.4 1.7 Some College 7.5 12.6 9.3 7.0 2.7 3.6 1.9 5.4 9.8 6.9 5.5 3.9 1.1 1.0 Associate Degree 4.3 2.8 4.2 6.2 3.8 3.4 1.9 3.1 3.3 3.1 3.9 4.1 1.5 0.5 Bachelors Degree 1.6 0.4 1.3 2.5 1.9 1.4 0.8 1.0 0.4 0.8 1.5 1.3 1.1 0.5 Higher Degree 0.4 - 0.3 0.5 0.7 0.4 - 0.2 0.1 0.1 0.4 0.2 0.1 - Source: 1994 FSM Censuses, Table P101; 2000 FSM Census, Table P3-12.. Educational attainment for males in Chuuk State varied according to specific age groups. For instance, age 65 and over dominated elementary level, age group 45-54 dominated levels for Associate Degree, Bachelors Degree, and Higher Degree attainment, age group 30-34 dominated the high school, no diploma education attainment level, and age 35-44 dominated some college level. The proportion of males as high school graduates ranged between 25-29 in 1994 to 30-34 in 2000. On a general basis, the proportion of males at the elementary and high school levels increased since 1994 but decreased for all the other educational attainment level. This may mean that males tend to drop out of school after elementary and high school education for various reasons, which may include seeking employment. Female educational attainment for all levels except for elementary were lower than males. Higher level educational attainment was slightly lower among females aged 25 years and over in Chuuk State in both 1994 and 2000, compared to their male counterparts (see bottom panel of Table 8.9). The male and female patterns were similar, but the levels were different. Nevertheless, improvements in female elementary educational attainment by age were much more pronounced. For example, the elementary educational attainment among females aged 55-64 increased from 71 percent in 1994 to 86 percent in 2000. For the age group 65 and over it increased from 74 percent to 93 percent, and increased from 37 percent to 44 percent for those aged 25-29. In 2000 the proportion of females with an educational attainment of high school or higher decreased but those with some high school education increased. The educational levels of some college and Associate Degree increased for age group 45-54 in 2000, the proportion of age group 25-29 for Bachelors Degree remained the same for both census years, and that of Higher Degree for all age groups decreased in 2000. These data confirm that while males are more privileged than females for school enrollment, the differentials have been reduced in recent years. Educational Attainment by Place of Birth Another process affecting perceived improvements in educational attainment in Chuuk State is the immigration of educated persons. The difference emerges in the comparison of educational attainment of persons born in Chuuk State and those born elsewhere, in other FSM States or Outside of FSM. Table 8.10 shows educational attainment for age 25 years and over by place of birth. Among the population aged 25 years and over who had attended some school, 4 in every 5 of the non-FSM born population had college level educational attainment compared to 1 in 5 for the Chuuk born population. Similarly, the proportion of non-FSM born with Bachelors Degree increased from 9 percent to 27 percent between 1994 and 2000 while that of Chuuk born decreased from 3 percent to 2 percent. In general there was a higher tendency for people with higher education to migrate, resulting in an improved educational attainment for the country of destination. However, for Chuuk the number of immigrants is quite small, thus their contribution to the “improvement” is very slight.
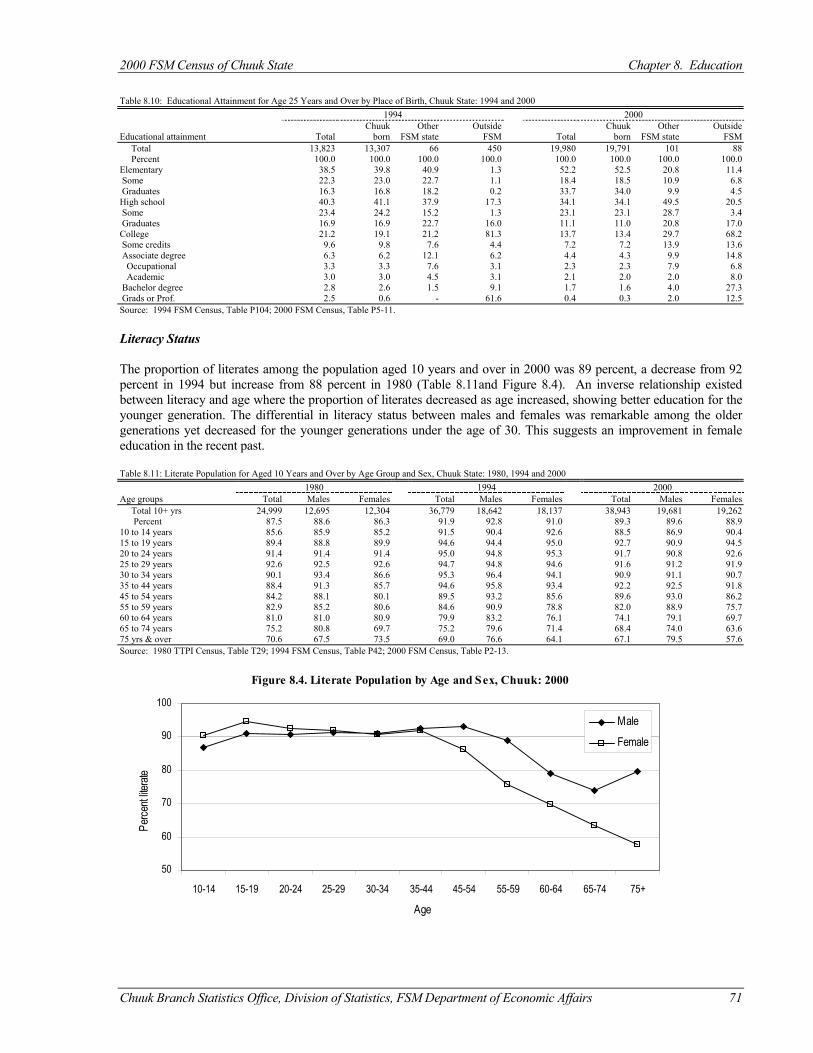
2000 FSM Census of Chuuk State Chapter 8. Education
Chuuk Branch Statistics Office, Division of Statistics, FSM Department of Economic Affairs 71
Table 8.10: Educational Attainment for Age 25 Years and Over by Place of Birth, Chuuk State: 1994 and 2000 1994 2000
Chuuk Other Outside Chuuk Other Outside Educational attainment Total born FSM state FSM Total born FSM state FSM Total 13,823 13,307 66 450 19,980 19,791 101 88 Percent 100.0 100.0 100.0 100.0 100.0 100.0 100.0 100.0 Elementary 38.5 39.8 40.9 1.3 52.2 52.5 20.8 11.4 Some 22.3 23.0 22.7 1.1 18.4 18.5 10.9 6.8 Graduates 16.3 16.8 18.2 0.2 33.7 34.0 9.9 4.5 High school 40.3 41.1 37.9 17.3 34.1 34.1 49.5 20.5 Some 23.4 24.2 15.2 1.3 23.1 23.1 28.7 3.4 Graduates 16.9 16.9 22.7 16.0 11.1 11.0 20.8 17.0 College 21.2 19.1 21.2 81.3 13.7 13.4 29.7 68.2 Some credits 9.6 9.8 7.6 4.4 7.2 7.2 13.9 13.6 Associate degree 6.3 6.2 12.1 6.2 4.4 4.3 9.9 14.8 Occupational 3.3 3.3 7.6 3.1 2.3 2.3 7.9 6.8 Academic 3.0 3.0 4.5 3.1 2.1 2.0 2.0 8.0 Bachelor degree 2.8 2.6 1.5 9.1 1.7 1.6 4.0 27.3 Grads or Prof. 2.5 0.6 - 61.6 0.4 0.3 2.0 12.5 Source: 1994 FSM Census, Table P104; 2000 FSM Census, Table P5-11. Literacy Status The proportion of literates among the population aged 10 years and over in 2000 was 89 percent, a decrease from 92 percent in 1994 but increase from 88 percent in 1980 (Table 8.11and Figure 8.4). An inverse relationship existed between literacy and age where the proportion of literates decreased as age increased, showing better education for the younger generation. The differential in literacy status between males and females was remarkable among the older generations yet decreased for the younger generations under the age of 30. This suggests an improvement in female education in the recent past. Table 8.11: Literate Population for Aged 10 Years and Over by Age Group and Sex, Chuuk State: 1980, 1994 and 2000 1980 1994 2000 Age groups Total Males Females Total Males Females Total Males Females Total 10+ yrs 24,999 12,695 12,304 36,779 18,642 18,137 38,943 19,681 19,262 Percent 87.5 88.6 86.3 91.9 92.8 91.0 89.3 89.6 88.9 10 to 14 years 85.6 85.9 85.2 91.5 90.4 92.6 88.5 86.9 90.4 15 to 19 years 89.4 88.8 89.9 94.6 94.4 95.0 92.7 90.9 94.5 20 to 24 years 91.4 91.4 91.4 95.0 94.8 95.3 91.7 90.8 92.6 25 to 29 years 92.6 92.5 92.6 94.7 94.8 94.6 91.6 91.2 91.9 30 to 34 years 90.1 93.4 86.6 95.3 96.4 94.1 90.9 91.1 90.7 35 to 44 years 88.4 91.3 85.7 94.6 95.8 93.4 92.2 92.5 91.8 45 to 54 years 84.2 88.1 80.1 89.5 93.2 85.6 89.6 93.0 86.2 55 to 59 years 82.9 85.2 80.6 84.6 90.9 78.8 82.0 88.9 75.7 60 to 64 years 81.0 81.0 80.9 79.9 83.2 76.1 74.1 79.1 69.7 65 to 74 years 75.2 80.8 69.7 75.2 79.6 71.4 68.4 74.0 63.6 75 yrs & over 70.6 67.5 73.5 69.0 76.6 64.1 67.1 79.5 57.6 Source: 1980 TTPI Census, Table T29; 1994 FSM Census, Table P42; 2000 FSM Census, Table P2-13.
Figure 8.4. Literate Population by Age and Sex, Chuuk: 2000
50
60
70
80
90
100
10-14 15-19 20-24 25-29 30-34 35-44 45-54 55-59 60-64 65-74 75+
Age
Perce
nt lite
rate
Male
Female
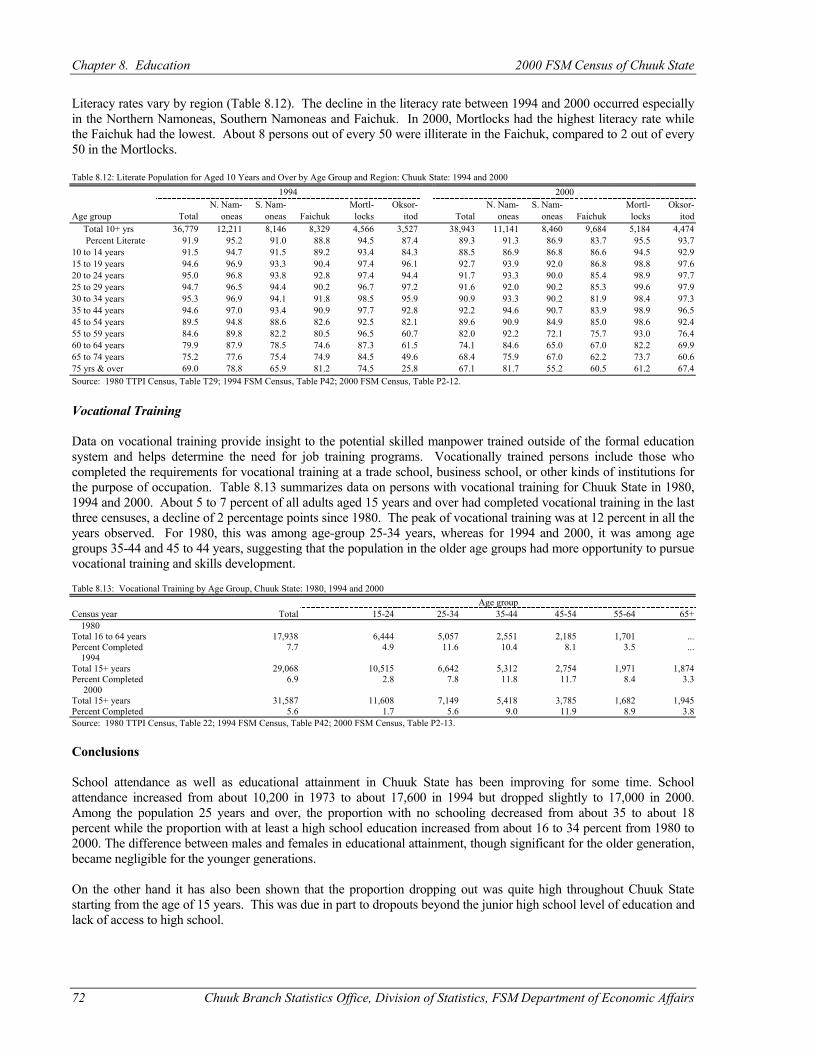
Chapter 8. Education 2000 FSM Census of Chuuk State
72 Chuuk Branch Statistics Office, Division of Statistics, FSM Department of Economic Affairs
Literacy rates vary by region (Table 8.12). The decline in the literacy rate between 1994 and 2000 occurred especially in the Northern Namoneas, Southern Namoneas and Faichuk. In 2000, Mortlocks had the highest literacy rate while the Faichuk had the lowest. About 8 persons out of every 50 were illiterate in the Faichuk, compared to 2 out of every 50 in the Mortlocks. Table 8.12: Literate Population for Aged 10 Years and Over by Age Group and Region: Chuuk State: 1994 and 2000 1994 2000
N. Nam- S. Nam- Mortl- Oksor- N. Nam- S. Nam- Mortl- Oksor- Age group Total oneas oneas Faichuk locks itod Total oneas oneas Faichuk locks itod Total 10+ yrs 36,779 12,211 8,146 8,329 4,566 3,527 38,943 11,141 8,460 9,684 5,184 4,474 Percent Literate 91.9 95.2 91.0 88.8 94.5 87.4 89.3 91.3 86.9 83.7 95.5 93.7 10 to 14 years 91.5 94.7 91.5 89.2 93.4 84.3 88.5 86.9 86.8 86.6 94.5 92.9 15 to 19 years 94.6 96.9 93.3 90.4 97.4 96.1 92.7 93.9 92.0 86.8 98.8 97.6 20 to 24 years 95.0 96.8 93.8 92.8 97.4 94.4 91.7 93.3 90.0 85.4 98.9 97.7 25 to 29 years 94.7 96.5 94.4 90.2 96.7 97.2 91.6 92.0 90.2 85.3 99.6 97.9 30 to 34 years 95.3 96.9 94.1 91.8 98.5 95.9 90.9 93.3 90.2 81.9 98.4 97.3 35 to 44 years 94.6 97.0 93.4 90.9 97.7 92.8 92.2 94.6 90.7 83.9 98.9 96.5 45 to 54 years 89.5 94.8 88.6 82.6 92.5 82.1 89.6 90.9 84.9 85.0 98.6 92.4 55 to 59 years 84.6 89.8 82.2 80.5 96.5 60.7 82.0 92.2 72.1 75.7 93.0 76.4 60 to 64 years 79.9 87.9 78.5 74.6 87.3 61.5 74.1 84.6 65.0 67.0 82.2 69.9 65 to 74 years 75.2 77.6 75.4 74.9 84.5 49.6 68.4 75.9 67.0 62.2 73.7 60.6 75 yrs & over 69.0 78.8 65.9 81.2 74.5 25.8 67.1 81.7 55.2 60.5 61.2 67.4 Source: 1980 TTPI Census, Table T29; 1994 FSM Census, Table P42; 2000 FSM Census, Table P2-12.
Vocational Training Data on vocational training provide insight to the potential skilled manpower trained outside of the formal education system and helps determine the need for job training programs. Vocationally trained persons include those who completed the requirements for vocational training at a trade school, business school, or other kinds of institutions for the purpose of occupation. Table 8.13 summarizes data on persons with vocational training for Chuuk State in 1980, 1994 and 2000. About 5 to 7 percent of all adults aged 15 years and over had completed vocational training in the last three censuses, a decline of 2 percentage points since 1980. The peak of vocational training was at 12 percent in all the years observed. For 1980, this was among age-group 25-34 years, whereas for 1994 and 2000, it was among age groups 35-44 and 45 to 44 years, suggesting that the population in the older age groups had more opportunity to pursue vocational training and skills development. Table 8.13: Vocational Training by Age Group, Chuuk State: 1980, 1994 and 2000 Age group Census year Total 15-24 25-34 35-44 45-54 55-64 65+ 1980 Total 16 to 64 years 17,938 6,444 5,057 2,551 2,185 1,701 ... Percent Completed 7.7 4.9 11.6 10.4 8.1 3.5 ... 1994 Total 15+ years 29,068 10,515 6,642 5,312 2,754 1,971 1,874 Percent Completed 6.9 2.8 7.8 11.8 11.7 8.4 3.3 2000 Total 15+ years 31,587 11,608 7,149 5,418 3,785 1,682 1,945 Percent Completed 5.6 1.7 5.6 9.0 11.9 8.9 3.8 Source: 1980 TTPI Census, Table 22; 1994 FSM Census, Table P42; 2000 FSM Census, Table P2-13. Conclusions School attendance as well as educational attainment in Chuuk State has been improving for some time. School attendance increased from about 10,200 in 1973 to about 17,600 in 1994 but dropped slightly to 17,000 in 2000. Among the population 25 years and over, the proportion with no schooling decreased from about 35 to about 18 percent while the proportion with at least a high school education increased from about 16 to 34 percent from 1980 to 2000. The difference between males and females in educational attainment, though significant for the older generation, became negligible for the younger generations. On the other hand it has also been shown that the proportion dropping out was quite high throughout Chuuk State starting from the age of 15 years. This was due in part to dropouts beyond the junior high school level of education and lack of access to high school.
2000 FSM Census of Chuuk State Chapter 8. Education
Chuuk Branch Statistics Office, Division of Statistics, FSM Department of Economic Affairs 73
The overall enrollment rate in Chuuk was the second lowest in the FSM. By region, the overall enrollment rate is highest in the Mortlocks at 63 percent, and lowest in Faichuk at 53 percent. In all the regions, about 1 to 2 children in every five children remained outside the school system, even at ages where enrollment was highest. The proportion of literate persons increased from 86 percent in 1980 to about 89 percent in 2000. The proportion of persons with vocational training was higher among the ages of 35-54 years in the current censuses.

Chuuk Branch Statistics Office, Division of Statistics, FSM Department of Economic Affairs 75
CHAPTER 9 ECONOMIC ACTIVITY
Introduction The changing economy of Chuuk State creates a demand for data on labor force characteristics and job activities. The following chapters provide insight into the adjustments Chuuk State is making as it moves from subsistence to a cash-oriented economy. Information on economic activity, industries and occupations, and income is presented in the next three chapters. In Chuuk State the potential labor force, defined as the population of working age (15 years and above), accounted for 29,068 persons (55 percent) of the population during the 1994 Census, and 31,587 persons (44 percent) during the 2000 Census. Many potential contributors to Chuuk State production were not in the labor force because they were students, house workers looking after children, or retired. Two in every five of the working age population was currently working, or seeking work in the government, the private sector, or the subsistence or traditional sectors (involving mainly agriculture and fishing). Definitions In order to determine the current labor force status, all respondents aged 15 years and over were asked whether they did any 'work' in the week before the census, including full-time or part-time work. Work also included full-time and part-time work in a family farm or business, with or without pay. Work did not include unpaid volunteer work. The series of questions on employment status was designed to identify several types of individuals in Chuuk State: persons who worked at a job or business or farm at any time during the reference week; persons who did not do such work during the reference week, but who had jobs or businesses from which they were temporarily absent; and persons who did not work during the reference week, but who were looking for work during the reference week. The labor force included the employed work force as well as the unemployed. The total employed labor force was made up of a number of constituent groups, including persons who worked full- or part-time at a job or business, and persons who worked mainly in farming or fishing during the reference week regardless of whether any of their produce was sold or not. The latter group has been classified in agriculture and fishing and further sub-classified as market-oriented and subsistence. A person was described as a subsistence worker if he/she mainly farmed or fished in the week before the census without selling, or intending to sell, any produce. Persons who did only some subsistence, but mainly worked at another job in the week before the census were not included in this group. Persons who farmed or fished and sold their produce were also in the agricultural/fishing group but were categorized as market oriented. Unemployed persons were those persons who were looking and available for work in the four weeks preceding the census. The economically inactive working age population, those not in the labor force, were working age persons not classified as being employed or unemployed. A special group of inactive persons were those who were not employed nor looking for work but who said they could have taken a job if one had been offered to them. These persons were categorized as "could have taken a job". Labor force participation rates (LFPR) were calculated by dividing the number of persons in the labor force by the potential labor force of the group. For example a LFPR for women aged 15 to 19 would be calculated by dividing the number of women both employed and unemployed by the total number of women aged 15 to 19 and multiplied by 100 to make it a percentage. Unemployment rates, on the other hand, were calculated by dividing the number of persons unemployed by the number of persons in the labor force, and again multiplied by 100 to make it a percentage.
Chapter 9. Economic Activity 2000 FSM Census of Chuuk State
76 Chuuk Branch Statistics Office, Division of Statistics, FSM Department of Economic Affairs
The current work force included both formal workers and agricultural and fishing workers, and all persons at a paid job. Current workers were only those persons who responded about their jobs in the week before the census. Persons sick or temporarily absent from a job were not included in the current work force. Limitations and comparability. The above definitions follow the recommendations of the Conference of Labor Statisticians and the global and regional recommendations of the United Nations International Labor Organization (ILO). The definitions differ from the U.S. Bureau of Census labor force definitions in two ways. First, the U.S. definition of labor force does not include subsistence, while the ILO definition does; the second difference is that the age limit in the U.S. is usually for persons aged 16 and over, while ILO uses aged 15 and over. The two methods result in different labor force participation rates and unemployment rates. Although the ILO method is presented in this chapter, a table based on the U.S. definitions is presented in the basic tables section of this report (Table B15). The question for classifying persons in subsistence agriculture and fishing activities into the ‘subsistence’ and ‘market-oriented’ subgroups differed slightly between 1994 and 2000. The 1994 Census classified persons according to the primary purpose (pure subsistence or market oriented) of the main type of subsistence activity (fishing, gardening, etc.), allowing for only the main activity to be captured. In 2000, the question allowed for multiple answers, but did not distinguish between main and secondary activities and classified persons who ‘sold any’ as market orientated. Thus, a subsistence worker mainly engaged in gardening for home consumption who sometimes fished to sell would be classified as pure-subsistence worker according to 1994 definitions. In 2000, he/she would be classified as a market-oriented worker. Analysis of Economic Activity Data Labor Force Participation Table 9.1 reports the total population of working age in Chuuk State for 1994 and 2000. For census year 2000, the working age population was 31,586, of whom 18,192 persons, or 58 percent, were in the labor force and 13,395, or 42 percent, were not in the labor force. This proportion of not in the labor force was the highest among the FSM states in 1994. Of 8,922 in the employed labor force, three-fifths were engaged in a job or business outside of the agricultural sector. The remaining two-fifths of the employed labor force were engaged in farming and fishing, the great majority of whom (88 percent) were involved in 'subsistence' activities only, not selling or intending to sell any of their produce. This result illustrates the importance of the subsistence sector in Chuuk State and the need to include such workers in the definition of the labor force to fully reflect their contribution to the domestic production of the state. On the other hand, 'market-oriented' farmers and fishermen constituted about 12 out of every 100 persons aged 15 and over of the agricultural and fishing sector. By 2000, the total population of working age in Chuuk State was 31,587, of whom 18,192, or 58 percent, were in the labor force and 13,395, or 42 percent, were not in the labor force. Of the 31,587 potential working-age persons, almost 20 percent (6,213 persons) were unemployed or were looking and available for work and about 38 percent (11,979 persons) were employed in the formal, agriculture and fishing sectors. A comparison of work status by region shows significant variations among regions. In 1994, Northern Namoneas, Mortlocks and Oksoritod had the largest proportions of the working age population in the labor force while Faichuk and Southern Namoneas had the smallest portion. Northern Namoneas had a larger proportion of employed persons in formal work while the Mortlocks and the Oksoritod had a larger proportion of subsistence in agriculture/fishing. In 2000, Southern Namoneas, Faichuk and Mortlocks had the largest proportions of the working age population in the labor force. Interestingly, Northern Namoneas and Oksoritod had the smaller proportion of employed persons in the labor force whereas four earlier in 1994, they were the highest. In 1994, nearly 62 percent of the total working age population in Chuuk was not in the labor force. In other words, more than three-fifth of the working age population in Chuuk did not have a job and was not looking for work. The proportions were higher in the Lagoon Area than in the Outer Islands. Six years later in 2000 the total percentage of working age population not in the labor force a week before the census declined to about 42 percent. This suggested an improvement due to a decrease in the proportion of people not in the labor force.
2000 FSM Census of Chuuk State Chapter 9. Economic Activity
Chuuk Branch Statistics Office, Division of Statistics, FSM Department of Economic Affairs 77
Unemployment rates, labor force participation rates and subsistence are compared among the regions later in this chapter. Table 9.1: Distribution of Working-Age Population for Aged 15 Years and Over by Region, Chuuk State: 1994 and 2000
1994 2000 Labor Force Status Total N. Namon. S. Namon. Faichuk Mortlocks Oksoritod Total N. Namon. S. Namon. Faichuk Mortlocks Oksoritod
Persons 15+ years 29,068 9,904 6,326 6,470 3,593 2,775 31,587 9,276 6,771 7,730 4,170 3,640 In labor force 11,140 4,031 2,165 2,034 1,574 1,336 18,192 5,016 4,182 4,725 2,540 1,729 Employed 8,922 3,483 1,684 1,291 1,325 1,139 11,979 3,145 3,215 2,846 1,693 1,080 Formal work 5,373 3,067 860 613 576 257 4,546 2,204 739 607 681 315 Agriculture/Fishing 3,549 416 824 678 749 882 7,433 941 2,476 2,239 1,012 765 Subsistence 3,119 297 707 540 737 838 5,134 654 1,465 1,452 938 625 Market Oriented 430 119 117 138 12 44 2,299 287 1,011 787 74 140 Unemployed 2,218 548 481 743 249 197 6,213 1,871 967 1,879 847 649 Not in labor force 17,928 5,873 4,161 4,436 2,019 1,439 13,395 4,260 2,589 3,005 1,630 1,911 Could have taken job 3,335 545 851 1,184 231 524 795 244 180 219 118 34 Not available for work 14,593 5,328 3,310 3,252 1,788 915 12,600 4,016 2,409 2,786 1,512 1,877
Percent 100.0 100.0 100.0 100.0 100.0 100.0 100.0 100.0 100.0 100.0 100.0 100.0 In labor force 38.3 40.7 34.2 31.4 43.8 48.1 57.6 54.1 61.8 61.1 60.9 47.5 Employed 30.7 35.2 26.6 20.0 36.9 41.0 37.9 33.9 47.5 36.8 40.6 29.7 Formal work 18.5 31.0 13.6 9.5 16.0 9.3 14.4 23.8 10.9 7.9 16.3 8.7 Agriculture/Fishing 12.2 4.2 13.0 10.5 20.8 31.8 23.5 10.1 36.6 29.0 24.3 21.0 Subsistence 10.7 3.0 11.2 8.3 20.5 30.2 16.3 7.1 21.6 18.8 22.5 17.2 Market Oriented 1.5 1.2 1.8 2.1 0.3 1.6 7.3 3.1 14.9 10.2 1.8 3.8 Unemployed 7.6 5.5 7.6 11.5 6.9 7.1 19.7 20.2 14.3 24.3 20.3 17.8 Not in labor force 61.7 59.3 65.8 68.6 56.2 51.9 42.4 45.9 38.2 38.9 39.1 52.5 Could have taken job 11.5 5.5 13.5 18.3 6.4 18.9 2.5 2.6 2.7 2.8 2.8 0.9 Not available for work 50.2 53.8 52.3 50.3 49.8 33.0 39.9 43.3 35.6 36.0 36.3 51.6 Source: 1994 FSM Census, Table P26; 2000 FSM Census, Table P2-14. Table 9.2 illustrates the distribution of working age population by gender in the labor force. In 1994, although almost half (49.5 percent) of the working-age population were females, they accounted for only about a third (32.2 percent) of the labor force and slightly over a quarter (26.4 percent) in the employed population but more than half (55.4 percent) in the unemployed population. The preceding information showed how underrepresented the female working-age population was in the State of Chuuk during the 1994 Census. By the year 2000, the female representation in the work force had substantially improved, showing a participation rate of about 41.9 percent or two-fifths in the labor force, 39.1 percent in the employed population, and slightly less than half (47.4 percent) in the unemployed population. This suggested that representation of female to male in the work force is gradually becoming more equal. The proportion of females ‘not in the labor force’ is still higher than the proportion of males. Table 9.2: Distribution of Working Age Population for Aged 15 Years and Over by Sex, Chuuk State: 1994 and 2000 1994 2000
Number Percent Proportion Number Percent Proportion Labor force Total Males Females Males Females females Total Males Females Males Females females Total 29,068 14,687 14,381 14,687 14,381 49.5 31,587 15,782 15,805 15,782 15,805 50.0
… … … 100.0 100.0 … … … … 100.0 100.0 … Labor force 11,140 7,557 3,583 51.5 24.9 32.2 18,192 10,568 7,624 67.0 48.2 41.9 Employed 8,922 6,568 2,354 44.7 16.4 26.4 11,979 7,300 4,679 46.3 29.6 39.1 Formal work 5,373 3,828 1,545 26.1 10.7 28.8 4,546 3,261 1,285 20.7 8.1 28.3 Agriculture/fishing 3,549 2,740 809 18.7 5.6 22.8 7,433 4,039 3,394 25.6 21.5 45.7 Subsistence 3,119 2,375 744 16.2 5.2 23.9 5,134 2,710 2,424 17.2 15.3 47.2 Market oriented 430 365 65 2.5 0.5 15.1 2,299 1,329 970 8.4 6.1 42.2 Unemployed 2,218 989 1,229 6.7 8.5 55.4 6,213 3,268 2,945 20.7 18.6 47.4 Not in labor force 17,928 7,130 10,798 48.5 75.1 60.2 13,395 5,214 8,181 33.0 51.8 61.1 Could have taken a job 3,335 1,156 2,179 7.9 15.2 65.3 795 317 478 2.0 3.0 60.1 Not available for work 14,593 5,974 8,619 40.7 59.9 59.1 12,600 4,897 7,703 31.0 48.7 61.1 Source: 1994 FSM Census, Table P26; 2000 FSM Census, Table P2-14. Table 9.3 portrays the distribution of the labor force by sex across the regions in 1994 and 2000. In 1994 the Lagoon region made up over 73 percent of Chuuk State's total labor force, and the Outer Islands made up 26 percent. In 2000, the Lagoon region increased to about 78 percent of Chuuk State’s total labor force, while the Outer Islands decreased to less than a quarter (22 percent). In 1994, 68 percent of the total labor forces were males and 32 percent were females while in 2000, 58 percent of the labor force were males and 42 percent were females. This showed a decreasing proportion of males and an increasing proportion of females in the labor force between 1994 and 2000. Interestingly, women's largest and smallest contributions to Chuuk’s labor force occurred in the Outer Islands particularly, in the Oksoritod area. In 1994 women’s largest contribution to state labor force was in Pattiw (43 percent), and in 2000, was in Namonuito (48 percent). Women's smallest contribution for both censuses occurred in Halls, at 26 and 40 percent of
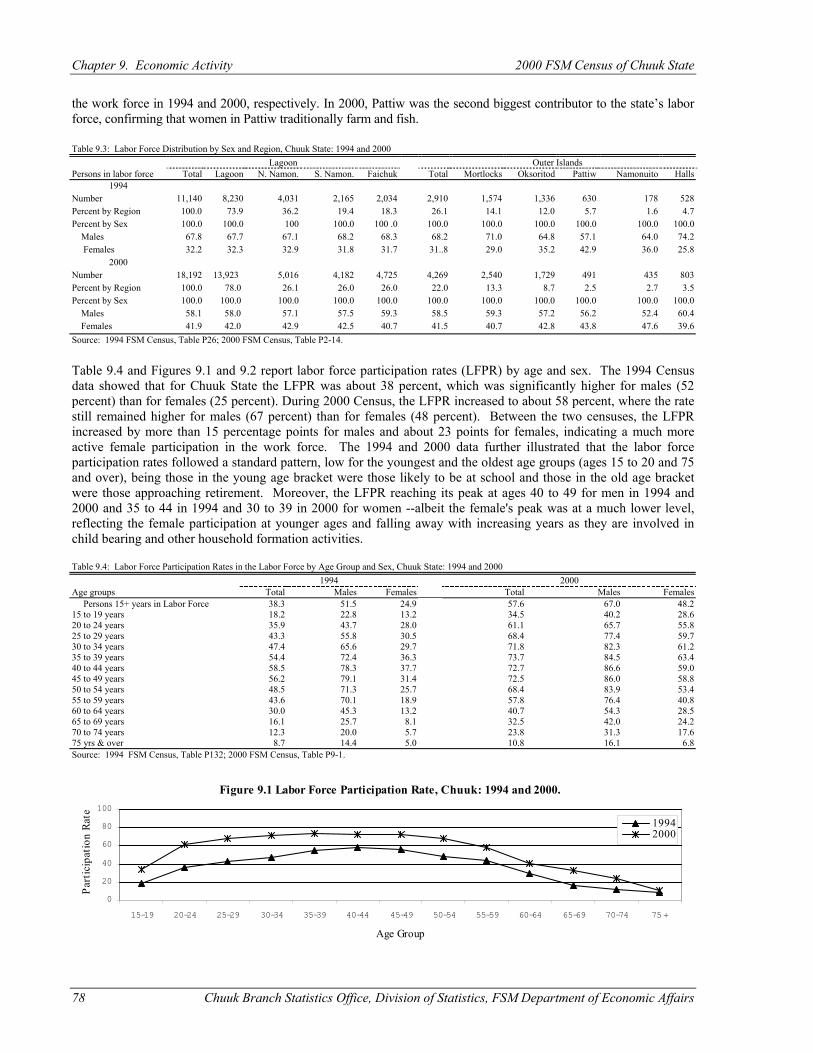
Chapter 9. Economic Activity 2000 FSM Census of Chuuk State
78 Chuuk Branch Statistics Office, Division of Statistics, FSM Department of Economic Affairs
the work force in 1994 and 2000, respectively. In 2000, Pattiw was the second biggest contributor to the state’s labor force, confirming that women in Pattiw traditionally farm and fish. Table 9.3: Labor Force Distribution by Sex and Region, Chuuk State: 1994 and 2000 Lagoon Outer Islands Persons in labor force Total Lagoon N. Namon. S. Namon. Faichuk Total Mortlocks Oksoritod Pattiw Namonuito Halls
1994 Number 11,140 8,230 4,031 2,165 2,034 2,910 1,574 1,336 630 178 528 Percent by Region 100.0 73.9 36.2 19.4 18.3 26.1 14.1 12.0 5.7 1.6 4.7 Percent by Sex 100.0 100.0 100 100.0 100 .0 100.0 100.0 100.0 100.0 100.0 100.0 Males 67.8 67.7 67.1 68.2 68.3 68.2 71.0 64.8 57.1 64.0 74.2 Females 32.2 32.3 32.9 31.8 31.7 31..8 29.0 35.2 42.9 36.0 25.8
2000 Number 18,192 13,923 5,016 4,182 4,725 4,269 2,540 1,729 491 435 803 Percent by Region 100.0 78.0 26.1 26.0 26.0 22.0 13.3 8.7 2.5 2.7 3.5 Percent by Sex 100.0 100.0 100.0 100.0 100.0 100.0 100.0 100.0 100.0 100.0 100.0 Males 58.1 58.0 57.1 57.5 59.3 58.5 59.3 57.2 56.2 52.4 60.4 Females 41.9 42.0 42.9 42.5 40.7 41.5 40.7 42.8 43.8 47.6 39.6 Source: 1994 FSM Census, Table P26; 2000 FSM Census, Table P2-14.
Table 9.4 and Figures 9.1 and 9.2 report labor force participation rates (LFPR) by age and sex. The 1994 Census data showed that for Chuuk State the LFPR was about 38 percent, which was significantly higher for males (52 percent) than for females (25 percent). During 2000 Census, the LFPR increased to about 58 percent, where the rate still remained higher for males (67 percent) than for females (48 percent). Between the two censuses, the LFPR increased by more than 15 percentage points for males and about 23 points for females, indicating a much more active female participation in the work force. The 1994 and 2000 data further illustrated that the labor force participation rates followed a standard pattern, low for the youngest and the oldest age groups (ages 15 to 20 and 75 and over), being those in the young age bracket were those likely to be at school and those in the old age bracket were those approaching retirement. Moreover, the LFPR reaching its peak at ages 40 to 49 for men in 1994 and 2000 and 35 to 44 in 1994 and 30 to 39 in 2000 for women --albeit the female's peak was at a much lower level, reflecting the female participation at younger ages and falling away with increasing years as they are involved in child bearing and other household formation activities. Table 9.4: Labor Force Participation Rates in the Labor Force by Age Group and Sex, Chuuk State: 1994 and 2000 1994 2000 Age groups Total Males Females Total Males Females Persons 15+ years in Labor Force 38.3 51.5 24.9 57.6 67.0 48.2 15 to 19 years 18.2 22.8 13.2 34.5 40.2 28.6 20 to 24 years 35.9 43.7 28.0 61.1 65.7 55.8 25 to 29 years 43.3 55.8 30.5 68.4 77.4 59.7 30 to 34 years 47.4 65.6 29.7 71.8 82.3 61.2 35 to 39 years 54.4 72.4 36.3 73.7 84.5 63.4 40 to 44 years 58.5 78.3 37.7 72.7 86.6 59.0 45 to 49 years 56.2 79.1 31.4 72.5 86.0 58.8 50 to 54 years 48.5 71.3 25.7 68.4 83.9 53.4 55 to 59 years 43.6 70.1 18.9 57.8 76.4 40.8 60 to 64 years 30.0 45.3 13.2 40.7 54.3 28.5 65 to 69 years 16.1 25.7 8.1 32.5 42.0 24.2 70 to 74 years 12.3 20.0 5.7 23.8 31.3 17.6 75 yrs & over 8.7 14.4 5.0 10.8 16.1 6.8 Source: 1994 FSM Census, Table P132; 2000 FSM Census, Table P9-1.
Figure 9.1 Labor Force Participation Rate, Chuuk: 1994 and 2000.
0
20
40
60
80
100
15-19 20-24 25-29 30-34 35-39 40-44 45-49 50-54 55-59 60-64 65-69 70-74 75 +
Age Group
Part
icip
atio
n Ra
te
19942000
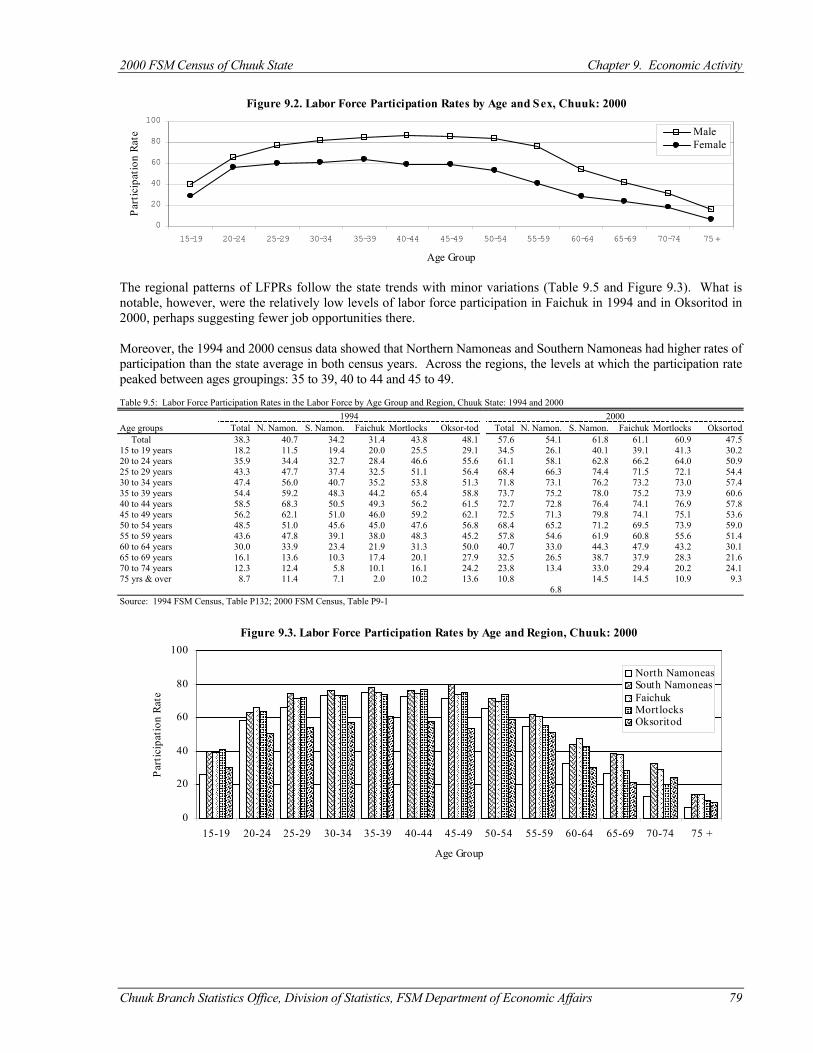
2000 FSM Census of Chuuk State Chapter 9. Economic Activity
Chuuk Branch Statistics Office, Division of Statistics, FSM Department of Economic Affairs 79
The regional patterns of LFPRs follow the state trends with minor variations (Table 9.5 and Figure 9.3). What is notable, however, were the relatively low levels of labor force participation in Faichuk in 1994 and in Oksoritod in 2000, perhaps suggesting fewer job opportunities there. Moreover, the 1994 and 2000 census data showed that Northern Namoneas and Southern Namoneas had higher rates of participation than the state average in both census years. Across the regions, the levels at which the participation rate peaked between ages groupings: 35 to 39, 40 to 44 and 45 to 49. Table 9.5: Labor Force Participation Rates in the Labor Force by Age Group and Region, Chuuk State: 1994 and 2000 1994 2000 Age groups Total N. Namon. S. Namon. Faichuk Mortlocks Oksor-tod Total N. Namon. S. Namon. Faichuk Mortlocks Oksortod Total 38.3 40.7 34.2 31.4 43.8 48.1 57.6 54.1 61.8 61.1 60.9 47.5 15 to 19 years 18.2 11.5 19.4 20.0 25.5 29.1 34.5 26.1 40.1 39.1 41.3 30.2 20 to 24 years 35.9 34.4 32.7 28.4 46.6 55.6 61.1 58.1 62.8 66.2 64.0 50.9 25 to 29 years 43.3 47.7 37.4 32.5 51.1 56.4 68.4 66.3 74.4 71.5 72.1 54.4 30 to 34 years 47.4 56.0 40.7 35.2 53.8 51.3 71.8 73.1 76.2 73.2 73.0 57.4 35 to 39 years 54.4 59.2 48.3 44.2 65.4 58.8 73.7 75.2 78.0 75.2 73.9 60.6 40 to 44 years 58.5 68.3 50.5 49.3 56.2 61.5 72.7 72.8 76.4 74.1 76.9 57.8 45 to 49 years 56.2 62.1 51.0 46.0 59.2 62.1 72.5 71.3 79.8 74.1 75.1 53.6 50 to 54 years 48.5 51.0 45.6 45.0 47.6 56.8 68.4 65.2 71.2 69.5 73.9 59.0 55 to 59 years 43.6 47.8 39.1 38.0 48.3 45.2 57.8 54.6 61.9 60.8 55.6 51.4 60 to 64 years 30.0 33.9 23.4 21.9 31.3 50.0 40.7 33.0 44.3 47.9 43.2 30.1 65 to 69 years 16.1 13.6 10.3 17.4 20.1 27.9 32.5 26.5 38.7 37.9 28.3 21.6 70 to 74 years 12.3 12.4 5.8 10.1 16.1 24.2 23.8 13.4 33.0 29.4 20.2 24.1 75 yrs & over 8.7 11.4 7.1 2.0 10.2 13.6 10.8
6.8 14.5 14.5 10.9 9.3
Source: 1994 FSM Census, Table P132; 2000 FSM Census, Table P9-1
��������������������
��������������������������������
���������������������������
���������������������������
���������������������������
������������������������������������
����������������������������������������
������������������������������������
������������������������
������������������
���������������
����������������
��������
���������������
������������������������
������������������������������������
������������������������������������
������������������������������������
���������������������������
���������������������������
������������������������
����������������������������
������������������������
��������������������
������������
������
��������������������
��������������������������������
���������������������������
���������������������������
���������������������������
������������������������������������
������������������������������������
������������������������������������
���������������������
������������������
������������
������������
��������
������������
������������������������
����������������������������
����������������������������
����������������������������
����������������������������
���������������������
���������������������
������������������������
����������������
������������
������������
������
Figure 9.3. Labor Force Participation Rates by Age and Region, Chuuk: 2000
0
20
40
60
80
100
15-19 20-24 25-29 30-34 35-39 40-44 45-49 50-54 55-59 60-64 65-69 70-74 75 +
Age Group
Part
icip
atio
n Ra
te
North Namoneas�������� South Namoneas�������� Faichuk����
Mortlocks����Oksoritod
Figure 9.2. Labor Force Participation Rates by Age and Sex, Chuuk: 2000
0
20
40
60
80
100
15-19 20-24 25-29 30-34 35-39 40-44 45-49 50-54 55-59 60-64 65-69 70-74 75 +
Age Group
Part
icip
atio
n Ra
te MaleFemale
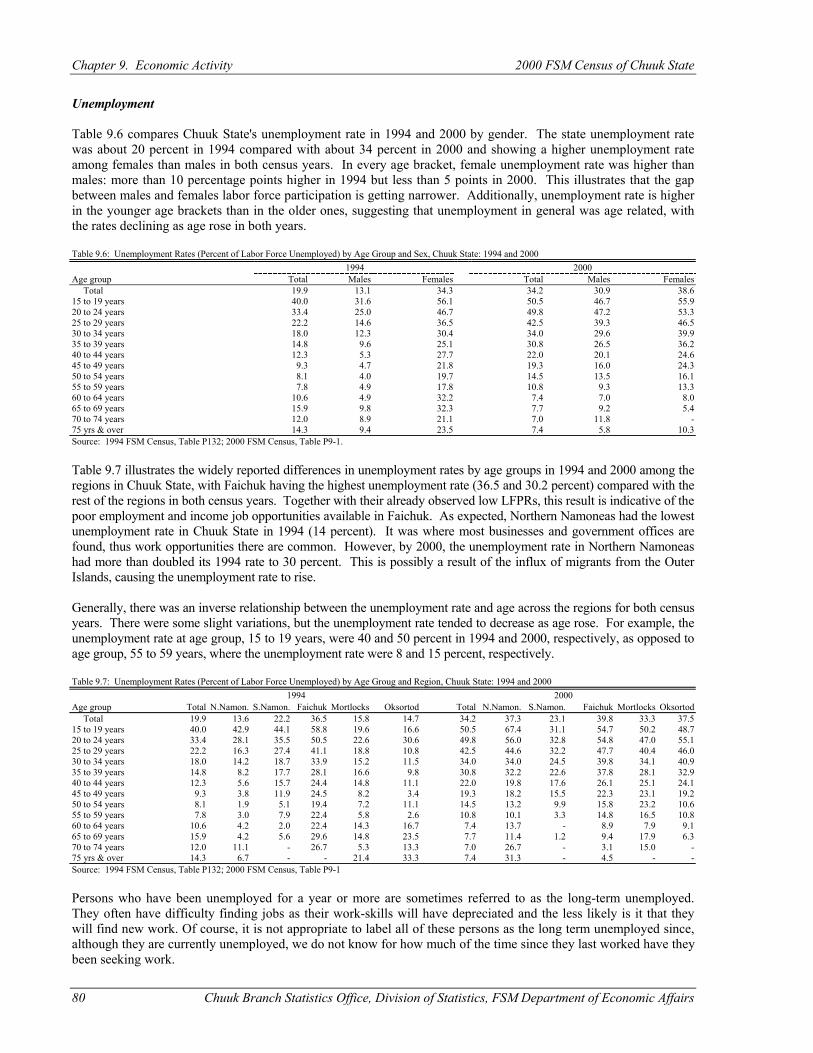
Chapter 9. Economic Activity 2000 FSM Census of Chuuk State
80 Chuuk Branch Statistics Office, Division of Statistics, FSM Department of Economic Affairs
Unemployment Table 9.6 compares Chuuk State's unemployment rate in 1994 and 2000 by gender. The state unemployment rate was about 20 percent in 1994 compared with about 34 percent in 2000 and showing a higher unemployment rate among females than males in both census years. In every age bracket, female unemployment rate was higher than males: more than 10 percentage points higher in 1994 but less than 5 points in 2000. This illustrates that the gap between males and females labor force participation is getting narrower. Additionally, unemployment rate is higher in the younger age brackets than in the older ones, suggesting that unemployment in general was age related, with the rates declining as age rose in both years. Table 9.6: Unemployment Rates (Percent of Labor Force Unemployed) by Age Group and Sex, Chuuk State: 1994 and 2000 1994 2000 Age group Total Males Females Total Males Females Total 19.9 13.1 34.3 34.2 30.9 38.6 15 to 19 years 40.0 31.6 56.1 50.5 46.7 55.9 20 to 24 years 33.4 25.0 46.7 49.8 47.2 53.3 25 to 29 years 22.2 14.6 36.5 42.5 39.3 46.5 30 to 34 years 18.0 12.3 30.4 34.0 29.6 39.9 35 to 39 years 14.8 9.6 25.1 30.8 26.5 36.2 40 to 44 years 12.3 5.3 27.7 22.0 20.1 24.6 45 to 49 years 9.3 4.7 21.8 19.3 16.0 24.3 50 to 54 years 8.1 4.0 19.7 14.5 13.5 16.1 55 to 59 years 7.8 4.9 17.8 10.8 9.3 13.3 60 to 64 years 10.6 4.9 32.2 7.4 7.0 8.0 65 to 69 years 15.9 9.8 32.3 7.7 9.2 5.4 70 to 74 years 12.0 8.9 21.1 7.0 11.8 - 75 yrs & over 14.3 9.4 23.5 7.4 5.8 10.3 Source: 1994 FSM Census, Table P132; 2000 FSM Census, Table P9-1. Table 9.7 illustrates the widely reported differences in unemployment rates by age groups in 1994 and 2000 among the regions in Chuuk State, with Faichuk having the highest unemployment rate (36.5 and 30.2 percent) compared with the rest of the regions in both census years. Together with their already observed low LFPRs, this result is indicative of the poor employment and income job opportunities available in Faichuk. As expected, Northern Namoneas had the lowest unemployment rate in Chuuk State in 1994 (14 percent). It was where most businesses and government offices are found, thus work opportunities there are common. However, by 2000, the unemployment rate in Northern Namoneas had more than doubled its 1994 rate to 30 percent. This is possibly a result of the influx of migrants from the Outer Islands, causing the unemployment rate to rise. Generally, there was an inverse relationship between the unemployment rate and age across the regions for both census years. There were some slight variations, but the unemployment rate tended to decrease as age rose. For example, the unemployment rate at age group, 15 to 19 years, were 40 and 50 percent in 1994 and 2000, respectively, as opposed to age group, 55 to 59 years, where the unemployment rate were 8 and 15 percent, respectively. Table 9.7: Unemployment Rates (Percent of Labor Force Unemployed) by Age Groug and Region, Chuuk State: 1994 and 2000 1994 2000 Age group Total N.Namon. S.Namon. Faichuk Mortlocks Oksortod Total N.Namon. S.Namon. Faichuk Mortlocks Oksortod Total 19.9 13.6 22.2 36.5 15.8 14.7 34.2 37.3 23.1 39.8 33.3 37.5 15 to 19 years 40.0 42.9 44.1 58.8 19.6 16.6 50.5 67.4 31.1 54.7 50.2 48.7 20 to 24 years 33.4 28.1 35.5 50.5 22.6 30.6 49.8 56.0 32.8 54.8 47.0 55.1 25 to 29 years 22.2 16.3 27.4 41.1 18.8 10.8 42.5 44.6 32.2 47.7 40.4 46.0 30 to 34 years 18.0 14.2 18.7 33.9 15.2 11.5 34.0 34.0 24.5 39.8 34.1 40.9 35 to 39 years 14.8 8.2 17.7 28.1 16.6 9.8 30.8 32.2 22.6 37.8 28.1 32.9 40 to 44 years 12.3 5.6 15.7 24.4 14.8 11.1 22.0 19.8 17.6 26.1 25.1 24.1 45 to 49 years 9.3 3.8 11.9 24.5 8.2 3.4 19.3 18.2 15.5 22.3 23.1 19.2 50 to 54 years 8.1 1.9 5.1 19.4 7.2 11.1 14.5 13.2 9.9 15.8 23.2 10.6 55 to 59 years 7.8 3.0 7.9 22.4 5.8 2.6 10.8 10.1 3.3 14.8 16.5 10.8 60 to 64 years 10.6 4.2 2.0 22.4 14.3 16.7 7.4 13.7 - 8.9 7.9 9.1 65 to 69 years 15.9 4.2 5.6 29.6 14.8 23.5 7.7 11.4 1.2 9.4 17.9 6.3 70 to 74 years 12.0 11.1 - 26.7 5.3 13.3 7.0 26.7 - 3.1 15.0 - 75 yrs & over 14.3 6.7 - - 21.4 33.3 7.4 31.3 - 4.5 - - Source: 1994 FSM Census, Table P132; 2000 FSM Census, Table P9-1 Persons who have been unemployed for a year or more are sometimes referred to as the long-term unemployed. They often have difficulty finding jobs as their work-skills will have depreciated and the less likely is it that they will find new work. Of course, it is not appropriate to label all of these persons as the long term unemployed since, although they are currently unemployed, we do not know for how much of the time since they last worked have they been seeking work.
2000 FSM Census of Chuuk State Chapter 9. Economic Activity
Chuuk Branch Statistics Office, Division of Statistics, FSM Department of Economic Affairs 81
Table 9.8 reports on the last work experience of the 2,218 unemployed persons in 1994 and the 6,213 unemployed in 2000 in Chuuk State according to their age and sex. These respondents were asked for the year in which they last worked at a job, business or farm, even if for only a few days. In 1994, nearly 90 percent of the unemployed had not previously worked while the 2000 data showed that more than 95 percent of the unemployed had not previously worked. No pattern was noticeable by age; however, in general, the female unemployed were more likely to have had no previous work. Table 9.8: Unemployed Persons by Age Group and Previous Work Experience, Chuuk State: 1994 and 2000
1994 2000 Proportion worked in
1994 or earlier Proportion never
worked Proportion worked in
2000 or earlier Proportion never
worked Age group Total Males Females Total Males Females Total Males Females Total Males Females Total Males Females Total Males Females Total 2,218 989 1,229 10.8 13.3 8.7 89.2 86.7 91.3 6213 3268 2945 4.1 4.7 3.4 95.9 95.3 96.6 15 to 19 years 442 231 211 5.9 6.1 5.7 94.1 93.9 94.3 1177 643 534 0.3 0.5 0.2 99.7 99.5 99.8 20 to 24 years 534 244 290 9.7 11.5 8.3 90.3 88.5 91.7 1472 797 675 2.0 2.1 1.8 98.0 97.9 98.2 25 to 29 years 334 144 190 12.3 17.4 8.4 87.7 82.6 91.6 1161 597 564 3.7 4.2 3.2 96.3 95.8 96.8 30 to 34 years 271 126 145 14.4 15.1 13.8 85.6 84.9 86.2 769 385 384 5.3 6.8 3.9 94.7 93.2 96.1 35 to 39 years 230 100 130 10.4 15.0 6.9 89.6 85.0 93.1 646 313 333 6.0 7.7 4.5 94.0 92.3 95.5 40 to 44 years 177 52 125 10.7 17.3 8.0 89.3 82.7 92.0 411 223 188 9.0 8.5 9.6 91.0 91.5 90.4 45 to 49 years 92 34 58 17.4 23.5 13.8 82.6 76.5 86.2 312 155 157 6.7 7.7 5.7 93.3 92.3 94.3 50 to 54 years 39 14 25 15.4 14.3 16.0 84.6 85.7 84.0 155 87 68 20.0 24.1 14.7 80.0 75.9 85.3 55 to 59 years 35 17 18 14.3 23.5 5.6 85.7 76.5 94.4 53 29 24 9.4 10.3 8.3 90.6 89.7 91.7 60 to 64 years 30 11 19 20.0 36.4 10.5 80.0 63.6 89.5 25 15 10 8.0 13.3 - 92.0 86.7 100.0 65 to 69 years 18 8 10 22.2 37.5 10.0 77.8 62.5 90.0 18 13 5 - - - 100.0 100.0 100.0 70 to 74 years 9 5 4 11.1 20.0 - 88.9 80.0 100.0 8 8 - 25.0 25.0 - 75.0 75.0 - 75 yrs & over 7 3 4 - - - 100.0 100.0 100.0 6 3 3 - - - 100.0 100.0 100.0 Source: 1994 & 2000 FSM Censuses, unpublished data Underemployment Table 9.9 gives a more comprehensive indication of the extent of underemployment in the FSM beyond the ILO definitions. The percent distribution of persons looking for work remained about the same between 1994 and 2000. For example, of the 8,768 persons looking for work in 2000, over 70 percent (6,213 persons) were unemployed, about 30 percent (2,471 persons) were in subsistence agriculture and fishing and 1 percent (84 persons) were in market-oriented agriculture and fishing. In 1994, of the 3,153 persons looking for work, 2,218 persons were unemployed, 847 were in subsistence agriculture and fishing and 88 persons in market-oriented activities. The 1994 and 2000 data show that there is a substantial number of people of working-age population who are underemployed suggesting these people were working at lower capacity than they could prefer. Table 9.9. Underemployment by Region, Chuuk: 1994 and 2000
1994 2000 Underemployment Total N.Namon. S.Namon. Faichuk Mortlocks Oksoritod Total N.Namon. S.Namon. Faichuk Mortlocks Oksoritod Persons 15+ years 29,068 9,904 6,326 6,470 3,593 2,775 31,587 9,276 6,771 7,730 4,170 3,640 In formal work 5,373 3,067 860 613 576 257 4,546 2,204 739 607 681 315 Looking for work 3,153 627 778 868 485 395 8,768 2,197 1,674 2,480 1,409 1,008 Unemployed 2,218 548 481 743 249 197 6,213 1,871 967 1,879 847 649 Subsistence agriculture and fishing 847 63 271 103 234 176 2,471 308 688 596 561 318 Market-oriented agric. and fishing 88 16 26 22 2 22 84 18 19 5 1 41 Could have taken a job 4,227 594 969 1,402 364 898 1,555 245 588 439 236 47 Subsistence agriculture and fishing 791 31 92 171 128 369 311 -15 109 98 110 9 Market Oriented agric. and fishing 101 18 26 47 5 5 449 16 299 122 8 4 Not in the labor force 3,335 545 851 1,184 231 524 795 244 180 219 118 34 Total available for work 12,753 4,288 2,607 2,883 1,425 1,550 14,869 4,646 3,001 3,526 2,326 1,370 Not available .for work 16,315 5,616 3,719 3,587 2,168 1,225 16,718 4,630 3,770 4,204 1,844 2,270 Source: 1994 and 2000 FSM census, Unpublished data
Labor Force Status by Citizenship Table 9.10 examines the distribution of the working age population by labor force status and citizenship. About 98 percent of the working age population was citizens of Chuuk compared to more than 99 percent in 2000. In 1994, a little over 2 percent of the working age population and 4 percent of the labor force were non-Chuukese while in 2000 they were less than 1 percent of the working age population and the labor force. The 1994 and 2000 data further indicated that Non-Chuukese numbered 658 and 236 persons, respectively, in the state labor force, making up about 4 percent of the male labor force and less than 1 percent of the female labor force in 1994 but less than 1 percent for both male and female labor force in 2000.The largest group of foreign workers hailed from Asia,
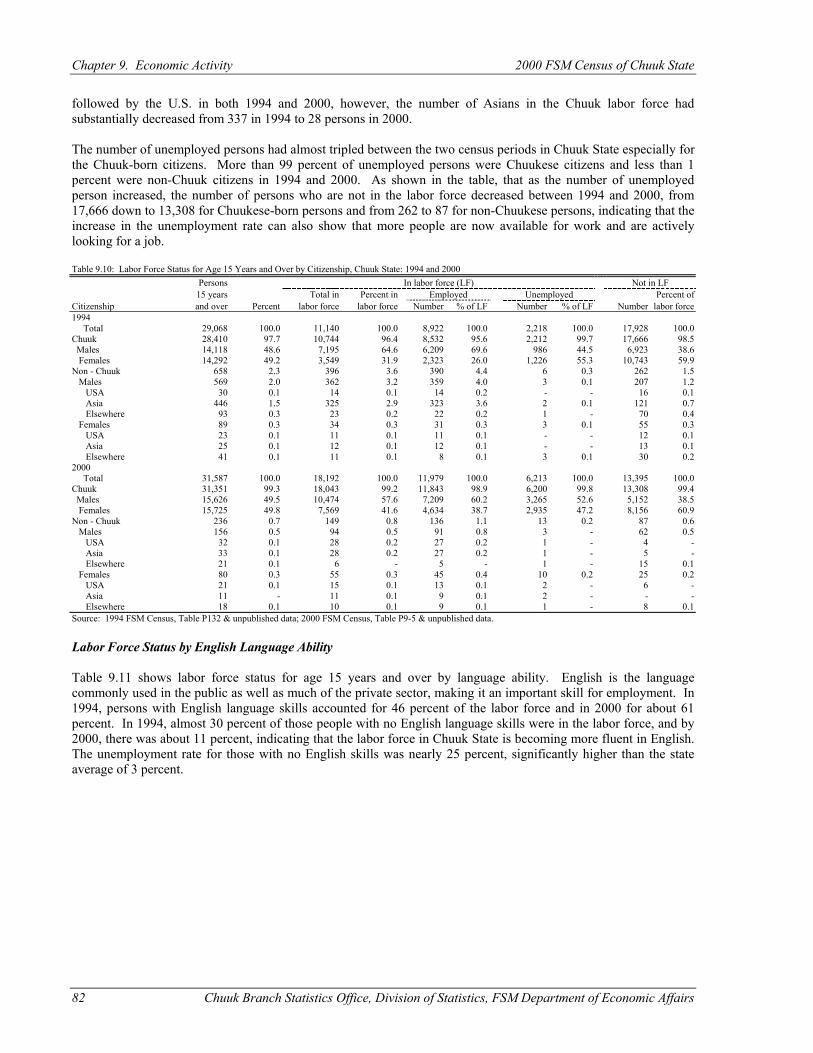
Chapter 9. Economic Activity 2000 FSM Census of Chuuk State
82 Chuuk Branch Statistics Office, Division of Statistics, FSM Department of Economic Affairs
followed by the U.S. in both 1994 and 2000, however, the number of Asians in the Chuuk labor force had substantially decreased from 337 in 1994 to 28 persons in 2000. The number of unemployed persons had almost tripled between the two census periods in Chuuk State especially for the Chuuk-born citizens. More than 99 percent of unemployed persons were Chuukese citizens and less than 1 percent were non-Chuuk citizens in 1994 and 2000. As shown in the table, that as the number of unemployed person increased, the number of persons who are not in the labor force decreased between 1994 and 2000, from 17,666 down to 13,308 for Chuukese-born persons and from 262 to 87 for non-Chuukese persons, indicating that the increase in the unemployment rate can also show that more people are now available for work and are actively looking for a job. Table 9.10: Labor Force Status for Age 15 Years and Over by Citizenship, Chuuk State: 1994 and 2000 Persons In labor force (LF) Not in LF
15 years Total in Percent in Employed Unemployed Percent of Citizenship and over Percent labor force labor force Number % of LF Number % of LF Number labor force 1994 Total 29,068 100.0 11,140 100.0 8,922 100.0 2,218 100.0 17,928 100.0 Chuuk 28,410 97.7 10,744 96.4 8,532 95.6 2,212 99.7 17,666 98.5 Males 14,118 48.6 7,195 64.6 6,209 69.6 986 44.5 6,923 38.6 Females 14,292 49.2 3,549 31.9 2,323 26.0 1,226 55.3 10,743 59.9 Non - Chuuk 658 2.3 396 3.6 390 4.4 6 0.3 262 1.5 Males 569 2.0 362 3.2 359 4.0 3 0.1 207 1.2 USA 30 0.1 14 0.1 14 0.2 - - 16 0.1 Asia 446 1.5 325 2.9 323 3.6 2 0.1 121 0.7 Elsewhere 93 0.3 23 0.2 22 0.2 1 - 70 0.4 Females 89 0.3 34 0.3 31 0.3 3 0.1 55 0.3 USA 23 0.1 11 0.1 11 0.1 - - 12 0.1 Asia 25 0.1 12 0.1 12 0.1 - - 13 0.1 Elsewhere 41 0.1 11 0.1 8 0.1 3 0.1 30 0.2 2000 Total 31,587 100.0 18,192 100.0 11,979 100.0 6,213 100.0 13,395 100.0 Chuuk 31,351 99.3 18,043 99.2 11,843 98.9 6,200 99.8 13,308 99.4 Males 15,626 49.5 10,474 57.6 7,209 60.2 3,265 52.6 5,152 38.5 Females 15,725 49.8 7,569 41.6 4,634 38.7 2,935 47.2 8,156 60.9 Non - Chuuk 236 0.7 149 0.8 136 1.1 13 0.2 87 0.6 Males 156 0.5 94 0.5 91 0.8 3 - 62 0.5 USA 32 0.1 28 0.2 27 0.2 1 - 4 - Asia 33 0.1 28 0.2 27 0.2 1 - 5 - Elsewhere 21 0.1 6 - 5 - 1 - 15 0.1 Females 80 0.3 55 0.3 45 0.4 10 0.2 25 0.2 USA 21 0.1 15 0.1 13 0.1 2 - 6 - Asia 11 - 11 0.1 9 0.1 2 - - - Elsewhere 18 0.1 10 0.1 9 0.1 1 - 8 0.1 Source: 1994 FSM Census, Table P132 & unpublished data; 2000 FSM Census, Table P9-5 & unpublished data. Labor Force Status by English Language Ability Table 9.11 shows labor force status for age 15 years and over by language ability. English is the language commonly used in the public as well as much of the private sector, making it an important skill for employment. In 1994, persons with English language skills accounted for 46 percent of the labor force and in 2000 for about 61 percent. In 1994, almost 30 percent of those people with no English language skills were in the labor force, and by 2000, there was about 11 percent, indicating that the labor force in Chuuk State is becoming more fluent in English. The unemployment rate for those with no English skills was nearly 25 percent, significantly higher than the state average of 3 percent.
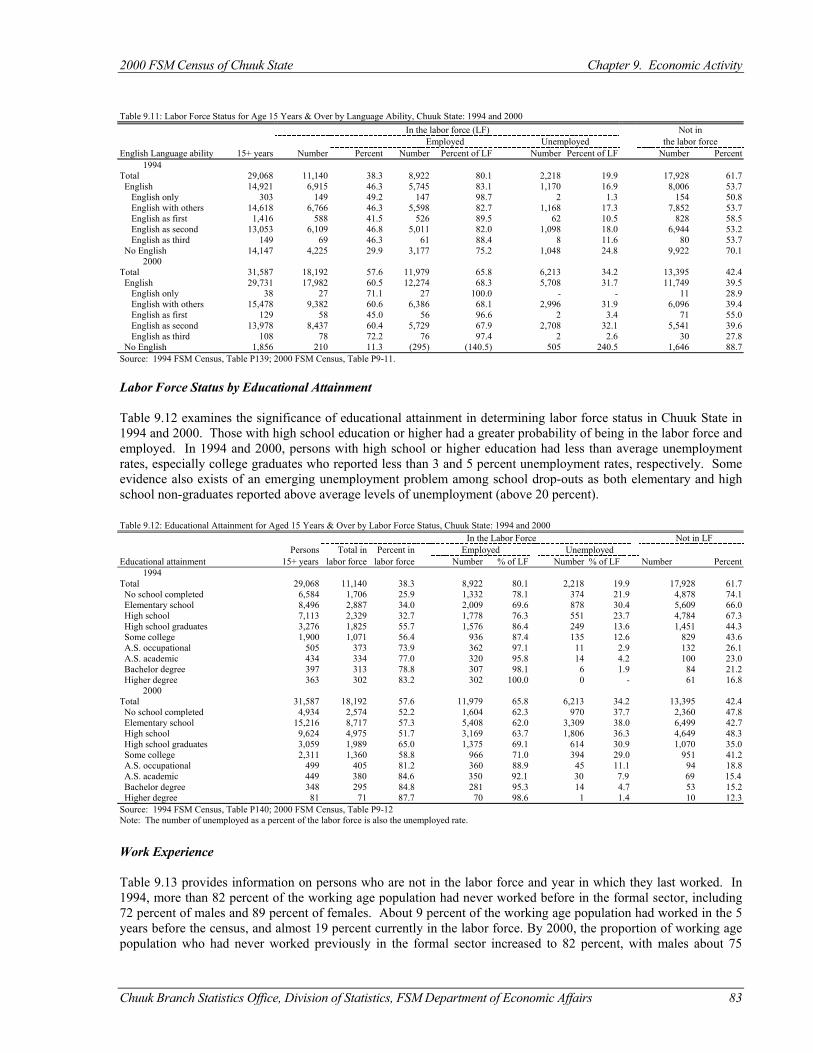
2000 FSM Census of Chuuk State Chapter 9. Economic Activity
Chuuk Branch Statistics Office, Division of Statistics, FSM Department of Economic Affairs 83
Table 9.11: Labor Force Status for Age 15 Years & Over by Language Ability, Chuuk State: 1994 and 2000 In the labor force (LF) Not in
Employed Unemployed the labor force English Language ability 15+ years Number Percent Number Percent of LF Number Percent of LF Number Percent 1994 Total 29,068 11,140 38.3 8,922 80.1 2,218 19.9 17,928 61.7 English 14,921 6,915 46.3 5,745 83.1 1,170 16.9 8,006 53.7 English only 303 149 49.2 147 98.7 2 1.3 154 50.8 English with others 14,618 6,766 46.3 5,598 82.7 1,168 17.3 7,852 53.7 English as first 1,416 588 41.5 526 89.5 62 10.5 828 58.5 English as second 13,053 6,109 46.8 5,011 82.0 1,098 18.0 6,944 53.2 English as third 149 69 46.3 61 88.4 8 11.6 80 53.7 No English 14,147 4,225 29.9 3,177 75.2 1,048 24.8 9,922 70.1 2000 Total 31,587 18,192 57.6 11,979 65.8 6,213 34.2 13,395 42.4 English 29,731 17,982 60.5 12,274 68.3 5,708 31.7 11,749 39.5 English only 38 27 71.1 27 100.0 - - 11 28.9 English with others 15,478 9,382 60.6 6,386 68.1 2,996 31.9 6,096 39.4 English as first 129 58 45.0 56 96.6 2 3.4 71 55.0 English as second 13,978 8,437 60.4 5,729 67.9 2,708 32.1 5,541 39.6 English as third 108 78 72.2 76 97.4 2 2.6 30 27.8 No English 1,856 210 11.3 (295) (140.5) 505 240.5 1,646 88.7 Source: 1994 FSM Census, Table P139; 2000 FSM Census, Table P9-11. Labor Force Status by Educational Attainment Table 9.12 examines the significance of educational attainment in determining labor force status in Chuuk State in 1994 and 2000. Those with high school education or higher had a greater probability of being in the labor force and employed. In 1994 and 2000, persons with high school or higher education had less than average unemployment rates, especially college graduates who reported less than 3 and 5 percent unemployment rates, respectively. Some evidence also exists of an emerging unemployment problem among school drop-outs as both elementary and high school non-graduates reported above average levels of unemployment (above 20 percent). Table 9.12: Educational Attainment for Aged 15 Years & Over by Labor Force Status, Chuuk State: 1994 and 2000 In the Labor Force Not in LF
Persons Total in Percent in Employed Unemployed Educational attainment 15+ years labor force labor force Number % of LF Number % of LF Number Percent 1994 Total 29,068 11,140 38.3 8,922 80.1 2,218 19.9 17,928 61.7 No school completed 6,584 1,706 25.9 1,332 78.1 374 21.9 4,878 74.1 Elementary school 8,496 2,887 34.0 2,009 69.6 878 30.4 5,609 66.0 High school 7,113 2,329 32.7 1,778 76.3 551 23.7 4,784 67.3 High school graduates 3,276 1,825 55.7 1,576 86.4 249 13.6 1,451 44.3 Some college 1,900 1,071 56.4 936 87.4 135 12.6 829 43.6 A.S. occupational 505 373 73.9 362 97.1 11 2.9 132 26.1 A.S. academic 434 334 77.0 320 95.8 14 4.2 100 23.0 Bachelor degree 397 313 78.8 307 98.1 6 1.9 84 21.2 Higher degree 363 302 83.2 302 100.0 0 - 61 16.8 2000 Total 31,587 18,192 57.6 11,979 65.8 6,213 34.2 13,395 42.4 No school completed 4,934 2,574 52.2 1,604 62.3 970 37.7 2,360 47.8 Elementary school 15,216 8,717 57.3 5,408 62.0 3,309 38.0 6,499 42.7 High school 9,624 4,975 51.7 3,169 63.7 1,806 36.3 4,649 48.3 High school graduates 3,059 1,989 65.0 1,375 69.1 614 30.9 1,070 35.0 Some college 2,311 1,360 58.8 966 71.0 394 29.0 951 41.2 A.S. occupational 499 405 81.2 360 88.9 45 11.1 94 18.8 A.S. academic 449 380 84.6 350 92.1 30 7.9 69 15.4 Bachelor degree 348 295 84.8 281 95.3 14 4.7 53 15.2 Higher degree 81 71 87.7 70 98.6 1 1.4 10 12.3 Source: 1994 FSM Census, Table P140; 2000 FSM Census, Table P9-12 Note: The number of unemployed as a percent of the labor force is also the unemployed rate.
Work Experience Table 9.13 provides information on persons who are not in the labor force and year in which they last worked. In 1994, more than 82 percent of the working age population had never worked before in the formal sector, including 72 percent of males and 89 percent of females. About 9 percent of the working age population had worked in the 5 years before the census, and almost 19 percent currently in the labor force. By 2000, the proportion of working age population who had never worked previously in the formal sector increased to 82 percent, with males about 75
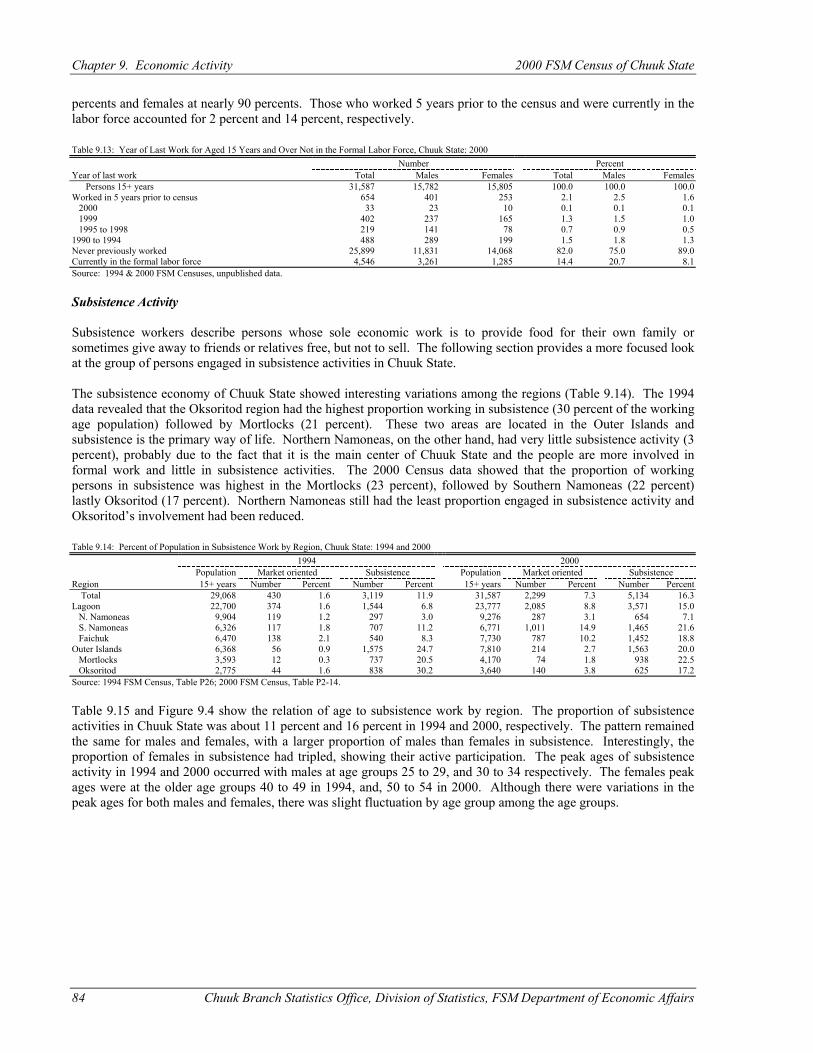
Chapter 9. Economic Activity 2000 FSM Census of Chuuk State
84 Chuuk Branch Statistics Office, Division of Statistics, FSM Department of Economic Affairs
percents and females at nearly 90 percents. Those who worked 5 years prior to the census and were currently in the labor force accounted for 2 percent and 14 percent, respectively. Table 9.13: Year of Last Work for Aged 15 Years and Over Not in the Formal Labor Force, Chuuk State: 2000 Number Percent Year of last work Total Males Females Total Males Females Persons 15+ years 31,587 15,782 15,805 100.0 100.0 100.0 Worked in 5 years prior to census 654 401 253 2.1 2.5 1.6 2000 33 23 10 0.1 0.1 0.1 1999 402 237 165 1.3 1.5 1.0 1995 to 1998 219 141 78 0.7 0.9 0.5 1990 to 1994 488 289 199 1.5 1.8 1.3 Never previously worked 25,899 11,831 14,068 82.0 75.0 89.0 Currently in the formal labor force 4,546 3,261 1,285 14.4 20.7 8.1 Source: 1994 & 2000 FSM Censuses, unpublished data. Subsistence Activity Subsistence workers describe persons whose sole economic work is to provide food for their own family or sometimes give away to friends or relatives free, but not to sell. The following section provides a more focused look at the group of persons engaged in subsistence activities in Chuuk State. The subsistence economy of Chuuk State showed interesting variations among the regions (Table 9.14). The 1994 data revealed that the Oksoritod region had the highest proportion working in subsistence (30 percent of the working age population) followed by Mortlocks (21 percent). These two areas are located in the Outer Islands and subsistence is the primary way of life. Northern Namoneas, on the other hand, had very little subsistence activity (3 percent), probably due to the fact that it is the main center of Chuuk State and the people are more involved in formal work and little in subsistence activities. The 2000 Census data showed that the proportion of working persons in subsistence was highest in the Mortlocks (23 percent), followed by Southern Namoneas (22 percent) lastly Oksoritod (17 percent). Northern Namoneas still had the least proportion engaged in subsistence activity and Oksoritod’s involvement had been reduced. Table 9.14: Percent of Population in Subsistence Work by Region, Chuuk State: 1994 and 2000 1994 2000
Population Market oriented Subsistence Population Market oriented Subsistence Region 15+ years Number Percent Number Percent 15+ years Number Percent Number Percent Total 29,068 430 1.6 3,119 11.9 31,587 2,299 7.3 5,134 16.3 Lagoon 22,700 374 1.6 1,544 6.8 23,777 2,085 8.8 3,571 15.0 N. Namoneas 9,904 119 1.2 297 3.0 9,276 287 3.1 654 7.1 S. Namoneas 6,326 117 1.8 707 11.2 6,771 1,011 14.9 1,465 21.6 Faichuk 6,470 138 2.1 540 8.3 7,730 787 10.2 1,452 18.8 Outer Islands 6,368 56 0.9 1,575 24.7 7,810 214 2.7 1,563 20.0 Mortlocks 3,593 12 0.3 737 20.5 4,170 74 1.8 938 22.5 Oksoritod 2,775 44 1.6 838 30.2 3,640 140 3.8 625 17.2 Source: 1994 FSM Census, Table P26; 2000 FSM Census, Table P2-14. Table 9.15 and Figure 9.4 show the relation of age to subsistence work by region. The proportion of subsistence activities in Chuuk State was about 11 percent and 16 percent in 1994 and 2000, respectively. The pattern remained the same for males and females, with a larger proportion of males than females in subsistence. Interestingly, the proportion of females in subsistence had tripled, showing their active participation. The peak ages of subsistence activity in 1994 and 2000 occurred with males at age groups 25 to 29, and 30 to 34 respectively. The females peak ages were at the older age groups 40 to 49 in 1994, and, 50 to 54 in 2000. Although there were variations in the peak ages for both males and females, there was slight fluctuation by age group among the age groups.
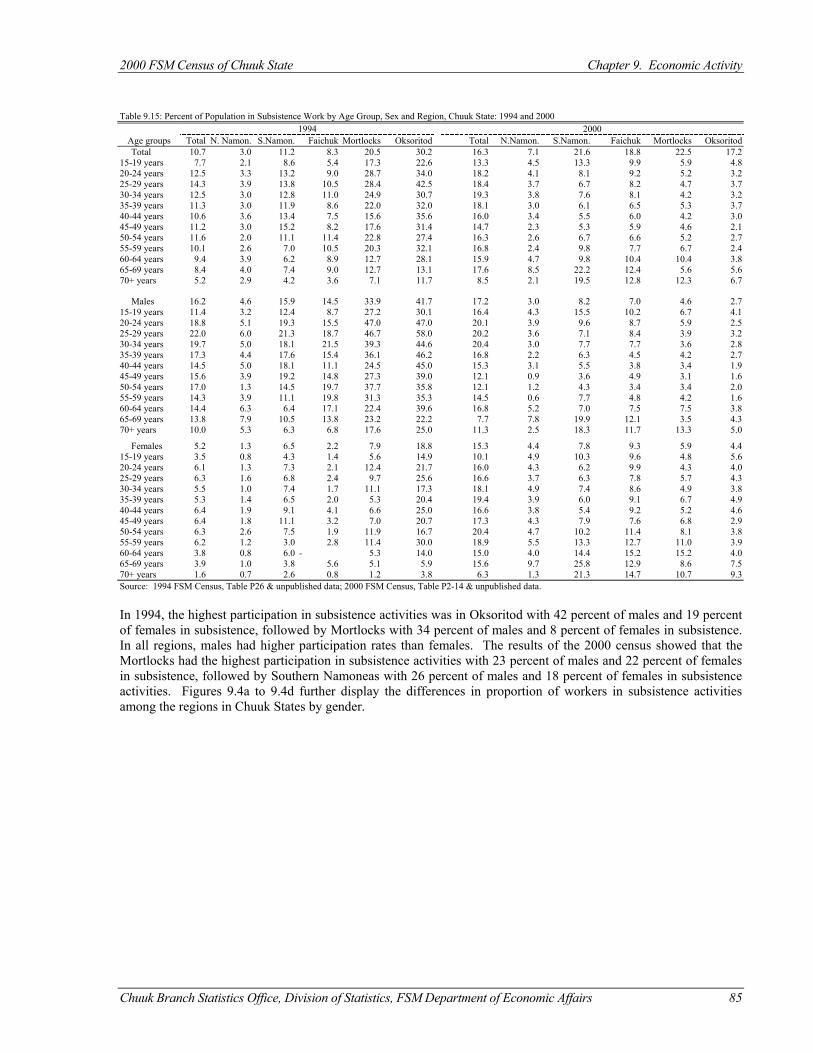
2000 FSM Census of Chuuk State Chapter 9. Economic Activity
Chuuk Branch Statistics Office, Division of Statistics, FSM Department of Economic Affairs 85
Table 9.15: Percent of Population in Subsistence Work by Age Group, Sex and Region, Chuuk State: 1994 and 2000 1994 2000
Age groups Total N. Namon. S.Namon. Faichuk Mortlocks Oksoritod Total N.Namon. S.Namon. Faichuk Mortlocks Oksoritod Total 10.7 3.0 11.2 8.3 20.5 30.2 16.3 7.1 21.6 18.8 22.5 17.2 15-19 years 7.7 2.1 8.6 5.4 17.3 22.6 13.3 4.5 13.3 9.9 5.9 4.8 20-24 years 12.5 3.3 13.2 9.0 28.7 34.0 18.2 4.1 8.1 9.2 5.2 3.2 25-29 years 14.3 3.9 13.8 10.5 28.4 42.5 18.4 3.7 6.7 8.2 4.7 3.7 30-34 years 12.5 3.0 12.8 11.0 24.9 30.7 19.3 3.8 7.6 8.1 4.2 3.2 35-39 years 11.3 3.0 11.9 8.6 22.0 32.0 18.1 3.0 6.1 6.5 5.3 3.7 40-44 years 10.6 3.6 13.4 7.5 15.6 35.6 16.0 3.4 5.5 6.0 4.2 3.0 45-49 years 11.2 3.0 15.2 8.2 17.6 31.4 14.7 2.3 5.3 5.9 4.6 2.1 50-54 years 11.6 2.0 11.1 11.4 22.8 27.4 16.3 2.6 6.7 6.6 5.2 2.7 55-59 years 10.1 2.6 7.0 10.5 20.3 32.1 16.8 2.4 9.8 7.7 6.7 2.4 60-64 years 9.4 3.9 6.2 8.9 12.7 28.1 15.9 4.7 9.8 10.4 10.4 3.8 65-69 years 8.4 4.0 7.4 9.0 12.7 13.1 17.6 8.5 22.2 12.4 5.6 5.6 70+ years 5.2 2.9 4.2 3.6 7.1 11.7 8.5 2.1 19.5 12.8 12.3 6.7
Males 16.2 4.6 15.9 14.5 33.9 41.7 17.2 3.0 8.2 7.0 4.6 2.7 15-19 years 11.4 3.2 12.4 8.7 27.2 30.1 16.4 4.3 15.5 10.2 6.7 4.1 20-24 years 18.8 5.1 19.3 15.5 47.0 47.0 20.1 3.9 9.6 8.7 5.9 2.5 25-29 years 22.0 6.0 21.3 18.7 46.7 58.0 20.2 3.6 7.1 8.4 3.9 3.2 30-34 years 19.7 5.0 18.1 21.5 39.3 44.6 20.4 3.0 7.7 7.7 3.6 2.8 35-39 years 17.3 4.4 17.6 15.4 36.1 46.2 16.8 2.2 6.3 4.5 4.2 2.7 40-44 years 14.5 5.0 18.1 11.1 24.5 45.0 15.3 3.1 5.5 3.8 3.4 1.9 45-49 years 15.6 3.9 19.2 14.8 27.3 39.0 12.1 0.9 3.6 4.9 3.1 1.6 50-54 years 17.0 1.3 14.5 19.7 37.7 35.8 12.1 1.2 4.3 3.4 3.4 2.0 55-59 years 14.3 3.9 11.1 19.8 31.3 35.3 14.5 0.6 7.7 4.8 4.2 1.6 60-64 years 14.4 6.3 6.4 17.1 22.4 39.6 16.8 5.2 7.0 7.5 7.5 3.8 65-69 years 13.8 7.9 10.5 13.8 23.2 22.2 7.7 7.8 19.9 12.1 3.5 4.3 70+ years 10.0 5.3 6.3 6.8 17.6 25.0 11.3 2.5 18.3 11.7 13.3 5.0
Females 5.2 1.3 6.5 2.2 7.9 18.8 15.3 4.4 7.8 9.3 5.9 4.4 15-19 years 3.5 0.8 4.3 1.4 5.6 14.9 10.1 4.9 10.3 9.6 4.8 5.6 20-24 years 6.1 1.3 7.3 2.1 12.4 21.7 16.0 4.3 6.2 9.9 4.3 4.0 25-29 years 6.3 1.6 6.8 2.4 9.7 25.6 16.6 3.7 6.3 7.8 5.7 4.3 30-34 years 5.5 1.0 7.4 1.7 11.1 17.3 18.1 4.9 7.4 8.6 4.9 3.8 35-39 years 5.3 1.4 6.5 2.0 5.3 20.4 19.4 3.9 6.0 9.1 6.7 4.9 40-44 years 6.4 1.9 9.1 4.1 6.6 25.0 16.6 3.8 5.4 9.2 5.2 4.6 45-49 years 6.4 1.8 11.1 3.2 7.0 20.7 17.3 4.3 7.9 7.6 6.8 2.9 50-54 years 6.3 2.6 7.5 1.9 11.9 16.7 20.4 4.7 10.2 11.4 8.1 3.8 55-59 years 6.2 1.2 3.0 2.8 11.4 30.0 18.9 5.5 13.3 12.7 11.0 3.9 60-64 years 3.8 0.8 6.0 - 5.3 14.0 15.0 4.0 14.4 15.2 15.2 4.0 65-69 years 3.9 1.0 3.8 5.6 5.1 5.9 15.6 9.7 25.8 12.9 8.6 7.5 70+ years 1.6 0.7 2.6 0.8 1.2 3.8 6.3 1.3 21.3 14.7 10.7 9.3 Source: 1994 FSM Census, Table P26 & unpublished data; 2000 FSM Census, Table P2-14 & unpublished data. In 1994, the highest participation in subsistence activities was in Oksoritod with 42 percent of males and 19 percent of females in subsistence, followed by Mortlocks with 34 percent of males and 8 percent of females in subsistence. In all regions, males had higher participation rates than females. The results of the 2000 census showed that the Mortlocks had the highest participation in subsistence activities with 23 percent of males and 22 percent of females in subsistence, followed by Southern Namoneas with 26 percent of males and 18 percent of females in subsistence activities. Figures 9.4a to 9.4d further display the differences in proportion of workers in subsistence activities among the regions in Chuuk States by gender.
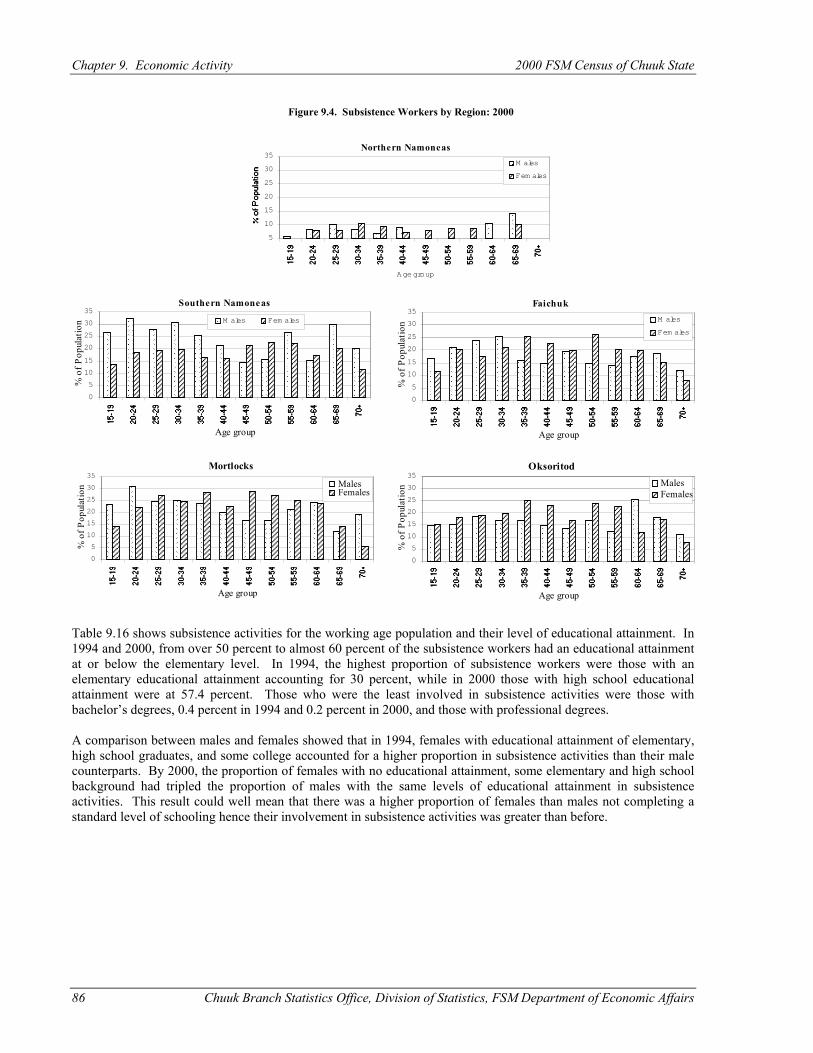
Chapter 9. Economic Activity 2000 FSM Census of Chuuk State
86 Chuuk Branch Statistics Office, Division of Statistics, FSM Department of Economic Affairs
Table 9.16 shows subsistence activities for the working age population and their level of educational attainment. In 1994 and 2000, from over 50 percent to almost 60 percent of the subsistence workers had an educational attainment at or below the elementary level. In 1994, the highest proportion of subsistence workers were those with an elementary educational attainment accounting for 30 percent, while in 2000 those with high school educational attainment were at 57.4 percent. Those who were the least involved in subsistence activities were those with bachelor’s degrees, 0.4 percent in 1994 and 0.2 percent in 2000, and those with professional degrees. A comparison between males and females showed that in 1994, females with educational attainment of elementary, high school graduates, and some college accounted for a higher proportion in subsistence activities than their male counterparts. By 2000, the proportion of females with no educational attainment, some elementary and high school background had tripled the proportion of males with the same levels of educational attainment in subsistence activities. This result could well mean that there was a higher proportion of females than males not completing a standard level of schooling hence their involvement in subsistence activities was greater than before.
��� ������������ ���� ���� ���
������
���������� ���
������ ��� ���� ���� ��� ���
������
Northern Namoneas
5
10
15
20
25
30
35
Age group
���� M ales��Fem ales
������������������������
������������������������
������������������������
������������������
���������������
��������������������
����������������
����������������
������������������������
������������
������������������
����������������
���������
������������
������������
����������������
����������������
������������
���������������
���������������
���������������
����������������
����������������
���������
Southern Namoneas
0
5
10
15
20
25
30
35
Age group
% o
f Pop
ulat
ion
���M ales
��Fem ales
����������������
���������������
���������������
��������������������
����������������
����������������
����������������
����������������
���������
������������
����������������
������������
���������
����������������
����������������
���������������
���������������
���������������
������������
���������������
����������������
����������������
������������
������
Faichuk
0
5
10
15
20
25
30
35
Age group
% o
f Pop
ulat
ion
��� M ales������ Fem ales
����������������
��������������������
����������������
���������������
������������
������������
������������
������������
����������������
����������������
������������
������������
���������
������������
���������������
����������������
��������������������
����������������
���������������
���������������
���������������
������������
���������
��������
Mortlocks
0
5
10
15
20
25
30
35
Age group
% o
f Pop
ulat
ion
������Males���
Females
���������
���������
����������������
���������
������������
������������
������������
���������
���������
���������������
���������
��������
������������
������������
����������������
����������������
���������������
������������
���������
����������������
����������������
��������
������������
������
Oksoritod
0
5
10
15
20
25
30
35
Age group
% o
f Pop
ulat
ion
���Males���Females
Figure 9.4. Subsistence Workers by Region: 2000
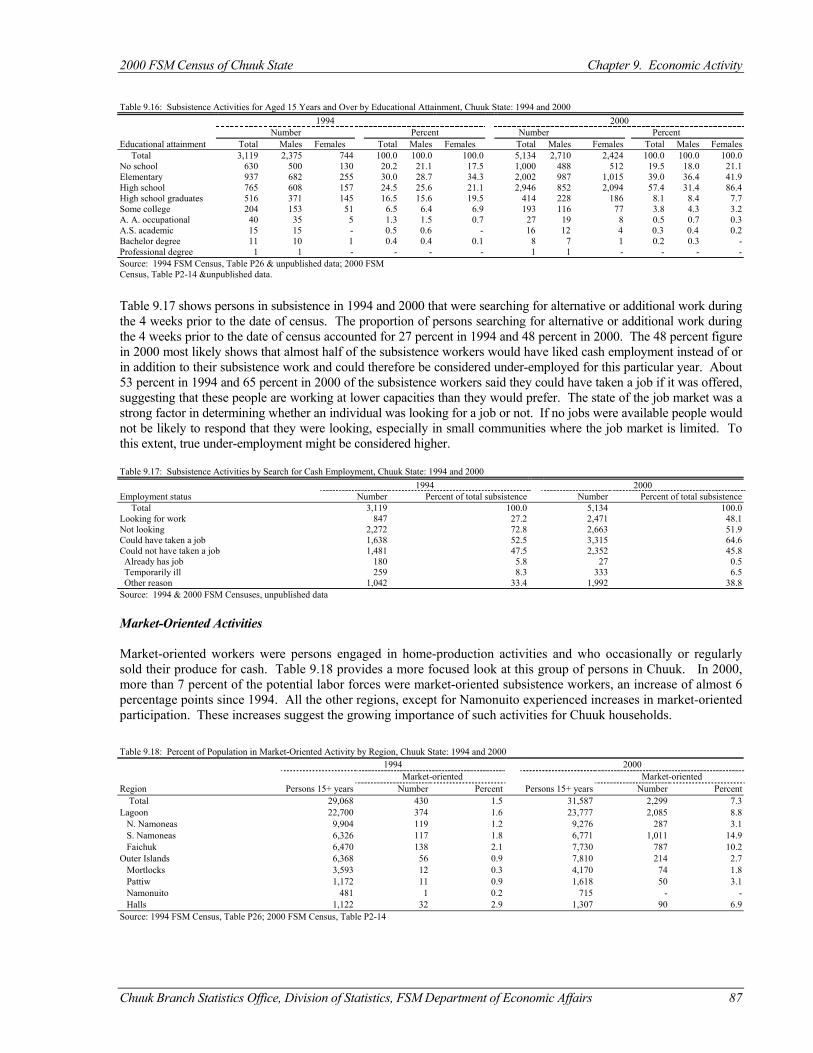
2000 FSM Census of Chuuk State Chapter 9. Economic Activity
Chuuk Branch Statistics Office, Division of Statistics, FSM Department of Economic Affairs 87
Table 9.16: Subsistence Activities for Aged 15 Years and Over by Educational Attainment, Chuuk State: 1994 and 2000 1994 2000
Number Percent Number Percent Educational attainment Total Males Females Total Males Females Total Males Females Total Males Females Total 3,119 2,375 744 100.0 100.0 100.0 5,134 2,710 2,424 100.0 100.0 100.0 No school 630 500 130 20.2 21.1 17.5 1,000 488 512 19.5 18.0 21.1 Elementary 937 682 255 30.0 28.7 34.3 2,002 987 1,015 39.0 36.4 41.9 High school 765 608 157 24.5 25.6 21.1 2,946 852 2,094 57.4 31.4 86.4 High school graduates 516 371 145 16.5 15.6 19.5 414 228 186 8.1 8.4 7.7 Some college 204 153 51 6.5 6.4 6.9 193 116 77 3.8 4.3 3.2 A. A. occupational 40 35 5 1.3 1.5 0.7 27 19 8 0.5 0.7 0.3 A.S. academic 15 15 - 0.5 0.6 - 16 12 4 0.3 0.4 0.2 Bachelor degree 11 10 1 0.4 0.4 0.1 8 7 1 0.2 0.3 - Professional degree 1 1 - - - - 1 1 - - - - Source: 1994 FSM Census, Table P26 & unpublished data; 2000 FSM Census, Table P2-14 &unpublished data.
Table 9.17 shows persons in subsistence in 1994 and 2000 that were searching for alternative or additional work during the 4 weeks prior to the date of census. The proportion of persons searching for alternative or additional work during the 4 weeks prior to the date of census accounted for 27 percent in 1994 and 48 percent in 2000. The 48 percent figure in 2000 most likely shows that almost half of the subsistence workers would have liked cash employment instead of or in addition to their subsistence work and could therefore be considered under-employed for this particular year. About 53 percent in 1994 and 65 percent in 2000 of the subsistence workers said they could have taken a job if it was offered, suggesting that these people are working at lower capacities than they would prefer. The state of the job market was a strong factor in determining whether an individual was looking for a job or not. If no jobs were available people would not be likely to respond that they were looking, especially in small communities where the job market is limited. To this extent, true under-employment might be considered higher. Table 9.17: Subsistence Activities by Search for Cash Employment, Chuuk State: 1994 and 2000 1994 2000 Employment status Number Percent of total subsistence Number Percent of total subsistence Total 3,119 100.0 5,134 100.0 Looking for work 847 27.2 2,471 48.1 Not looking 2,272 72.8 2,663 51.9 Could have taken a job 1,638 52.5 3,315 64.6 Could not have taken a job 1,481 47.5 2,352 45.8 Already has job 180 5.8 27 0.5 Temporarily ill 259 8.3 333 6.5 Other reason 1,042 33.4 1,992 38.8 Source: 1994 & 2000 FSM Censuses, unpublished data Market-Oriented Activities Market-oriented workers were persons engaged in home-production activities and who occasionally or regularly sold their produce for cash. Table 9.18 provides a more focused look at this group of persons in Chuuk. In 2000, more than 7 percent of the potential labor forces were market-oriented subsistence workers, an increase of almost 6 percentage points since 1994. All the other regions, except for Namonuito experienced increases in market-oriented participation. These increases suggest the growing importance of such activities for Chuuk households. Table 9.18: Percent of Population in Market-Oriented Activity by Region, Chuuk State: 1994 and 2000
1994 2000 Market-oriented Market-oriented
Region Persons 15+ years Number Percent Persons 15+ years Number Percent Total 29,068 430 1.5 31,587 2,299 7.3 Lagoon 22,700 374 1.6 23,777 2,085 8.8 N. Namoneas 9,904 119 1.2 9,276 287 3.1 S. Namoneas 6,326 117 1.8 6,771 1,011 14.9 Faichuk 6,470 138 2.1 7,730 787 10.2 Outer Islands 6,368 56 0.9 7,810 214 2.7 Mortlocks 3,593 12 0.3 4,170 74 1.8 Pattiw 1,172 11 0.9 1,618 50 3.1 Namonuito 481 1 0.2 715 - - Halls 1,122 32 2.9 1,307 90 6.9 Source: 1994 FSM Census, Table P26; 2000 FSM Census, Table P2-14
Chapter 9. Economic Activity 2000 FSM Census of Chuuk State
88 Chuuk Branch Statistics Office, Division of Statistics, FSM Department of Economic Affairs
Other Labor Force Characteristics Commuting Most people in Chuuk State worked in the same municipality as where they lived; however the majority did not work in the same village. Table 9.19 presents location of work for the regions in the Lagoon only because in the Outer Islands, the islands are too small and there is a limited means of transportation other than walking. In 1994 and 2000, the Southern Namoneas region had the fewest persons working in the same municipality and the fewest people working in the same village, while Northern Namoneas had the largest portion of persons working in the same village and municipality. Table 9.19: Location of Work Last Week by Region, Chuuk State: 1994 and 2000 1994 2000
Total in formal Percent work in Percent work in Percent work in Total in formal Percent work in Percent work in Percent work in Region work force same municipality same village different village work force same municipality same village different village Total 4,540 85.9 47.8 14.1 4546 82.8 37.6 45.1 N. Namoneas 3,067 94.2 48.7 5.8 2204 96.6 38.3 58.3 S. Namoneas 860 60.8 29.1 39.2 739 41.7 19.2 22.5 Faichuk 613 79.6 62.7 20.4 607 71.7 49.9 21.7 Source: 1994 FSM Census, Table B15; 2000 FSM Census, Table B15A. Armed Forces Only 72 persons claimed to be on active duty during the 2000 Census and 37 persons were previously on duty in the U.S. Armed Forces. Many of those persons on active duty were U.S. citizens from the Civil Actions Teams assigned in the FSM. The number of armed forces dependents was 67. Conclusion For both census years, Chuuk State had the highest unemployment rate in the FSM, ranging from about 20 percent in 1994 to 34 percent in 2000. Unemployment rate increased as more people were actively looking for and available to take a job, plus those who were not actively seeking a job the week before the census but were now available to take a job. Moreover, the labor force participation rate increased from about 38 percent to almost 58 percent between 1994 and 2000. The proportion of unemployed persons with no previous work experience was very high, more than 89 percent in 1994 and almost 96 percent in 2000. The high proportion for both years suggests that unemployment is a long-term difficulty for many persons in the state of Chuuk. As evident within FSM and elsewhere, persons with higher education are more likely to be employed and in the labor force than those with little or no schooling, and the female unemployment rates are usually more than twice those of males. Subsistence activities were common in Chuuk State to a certain extent. About 11 percent in 1994 and 16 percent in 2000 of the working age population were engaged mostly in farming and fishing for their own use. The Lagoon area had fewer persons in subsistence activities as compared to the Outer Islands, where subsistence activities are the primary way of life. The substantial differences among the regions suggest the need for independent planning for the Lagoon and the Outer Island regions. About 53 percent in 1994 and almost 65 percent in 2000 of the subsistence workers said they could have taken a formal job if it was offered, suggesting that these people were working at lower capacities than they would prefer.
Chuuk Branch Statistics Office, Division of Statistics, FSM Department of Economic Affairs 89
CHAPTER 10 INDUSTRY AND OCCUPATION
Introduction Industry and occupation data provide information on the changes occurring in the economy and how industries change employment patterns over the years. Different occupational groups classified against other characteristics show what persons held which occupations in which Chuuk State. This chapter presents information collected from persons in the formal work force (excluding subsistence agriculture or fishing) who were currently working plus persons who were currently not employed. Also reviewed in this chapter is the difference in the employment between the private and public sectors. In the 2000 FSM Census question 28 was for industry and question 29 for occupation for all individuals aged 15 years and over. The type of business or industry was asked along with the name of the employer in order to check the information. Industry refers to the activity of the establishment in which an economically active person worked during the reference period established for data on economic characteristics (or last worked, if unemployed). The activity of the establishment refers to the kinds of goods or services produced. Occupation refers to the kind of work done during the reference period irrespective of the industry or the status (employer/employee). The occupation groups were derived from the level of skill and experience needed for the position. Examples include manager, sales person, typist, or factory worker. The data collected from previous censuses are not directly comparable for these classifications because of changes in definitions. The 1980 Census used definitions of industries and occupations from the U.S. standard industry and occupation classifications. The 1994 and 2000 Census used classifications defined by the International Labor Organization (ILO). Although the differences are minor, ILO classifications are used by a majority of Pacific Island nations and are international standard. The 1980 census tabulated information for individuals ages 16 and over which makes a difference when comparing to the 1994 and 2000 data which are tabulated for individuals aged 15 and over. Data Description Industry Industries within Chuuk State have been broken down into 14 categories by the state census office and are based on the ILO's International Standard Industrial Classification (ISIC). Some of the categories have been grouped together in order to accommodate the different economic activities of Chuuk State.
1. The first group contains agriculture, forestry, fishing, and mining (quarrying) enterprises. This group includes all agricultural production, subsistence activities, commercial fishing, mining, and quarrying.
2. Construction enterprises contain all enterprises relating to heavy construction and special building trade
contractors. Construction includes additions, alterations, reconstruction, installations, and repairs.
3. Transportation, communication, electric, gas, and sanitation services all fall in one category in the ILO breakdown; however, for Chuuk State this group has been broken into two groups, one group for transportation and communication and one group for electricity, gas, and sanitation services. The transportation and communication group includes all establishments, which provide the general public with passenger or freight transportation services and post and telecommunication services. The other group contains the major utilities of electricity, gas, and water supply.
4. Manufacturing of durable and non-durable goods is the fourth category. Manufacturing is the mechanical or
chemical transformation of materials or substances into new products. The category ranges in industries from fish packaging to publishing.
5. Wholesale and retail trade is combined in one group. Both groups encompass establishments involved with
selling of merchandise; wholesale implies trade to other businesses, while retail implies merchandise for personal or household consumption.
Chapter 10. Industry and Occupation 2000 FSM Census of Chuuk State
90 Chuuk Branch Statistics Office, Division of Statistics, FSM Department of Economic Affairs
6. Financial intermediation and real estate include establishments such as depository institutions, credit
institutions, investment companies, commodity brokers, and insurance agents and brokers. Real estate includes owners, lessors, lessees, buyers, sellers, agents, and developers.
7. Hotels, restaurants and bars include enterprises that provide lodging, food, and beverages. This group
contains establishments that provide short-term accommodations as well as bars, canteens, and restaurants.
8. Business and computer activities include the renting of machinery and equipment, research and development, legal activities, architect and engineering services, computer activities, and other business related activities.
9. Health and social work industries include hospitals, medical and dental facilities, veterinary activities and
social work facilities.
10. Education contains all establishments, which provide educational opportunities for the population.
11. Public administration consists of all government agencies and organizations, local, national, state, and international. It also includes defense establishments and compulsory social security.
12 Other community and social services includes sewage and refuse disposal, membership organizations,
recreational activities, libraries, and other service activities. Private household services are also included in this final category.
Occupation The International Standard Classification of Occupations (ISCO) classifies occupations into 10 basic categories. ISCO further aggregates occupations into 3 additional levels of detail. Responses on occupation in the 2000 FSM Census were classified down to three digits in the ISCO categories. The major groups are organized by the degree of skill and experience necessary for the occupation. The ten major groups are broken down as follows:
1. Executives and managers: this group contains occupations whose main tasks include formulating government policy, laws, and regulations, planning, directing and coordinating policies and activities of enterprises or organizations. Examples are judges, government department chiefs, traditional chiefs, legislators, and senior management of organizations.
2. Professionals: this group includes occupations whose tasks require a high level of professional knowledge and
experience. Tasks include increasing knowledge, applying scientific and artistic concepts and theories to the solution of problems, and teaching about the foregoing in a systematic manner. Examples include mathematicians, statisticians, geologists, computer programmers, architects, engineers, nurses, doctors, teachers for secondary level and above, accountants, lawyers, judges, and economists.
3. Technicians and associate professionals: this group requires technical knowledge and experience and
conducts tasks carrying out technical work connected with the application of concepts and operational methods. This group includes teachers at primary level, computer troubleshooters, ships’ engineer, air traffic controller, building inspectors, medical health assistants, nutritionists, and business service agents.
4. Administrative support: also called clerks, this group includes occupations whose main tasks are to organize,
store, compute, and retrieve information. This group includes office clerks (such as secretaries and word processors, transport clerks, filing clerks) and customer service clerks (such as tellers, cashiers, client information, travel agents).
5. Service workers: This group includes occupations with tasks of provide services related to travel,
housekeeping, catering, personal care, protection, maintaining law and order, selling goods at shops or
2000 FSM Census of Chuuk State Chapter 10. Industry and Occupation
Chuuk Branch Statistics Office, Division of Statistics, FSM Department of Economic Affairs 91
markets. This group includes travel stewards, waiters, cooks, child-care workers, barbers, police officers, fire fighters and stall or market sales persons.
6. Agriculture and fishing workers: these occupations include skilled workers who grow crops, breed or hunt
animals, catch or cultivate fish and conserve or exploit forests.
7. Craft and related trades: tasks include extracting raw materials, constructing buildings, and other structures and making various products and handicraft goods.
8. Machine operators: includes tasks, which require the knowledge and experience necessary to operate and
monitor large-scale industrial machinery and equipment.
9. Elementary occupations and laborers: includes persons doing simple and routine tasks involving the use of hand-held tools and physical effort. Examples are selling goods in the street, door-keeping, cleaning, working as laborers.
10. The final group is armed forces: 26 persons were recorded with this occupation because of what they were
doing for the armed forces. Class of Worker Question 30 of the 1994 and 2000 FSM Censuses asked for information on class of worker for every individual over 15 who had worked in the 5 years prior to the census. Class of worker refers to the type of ownership of the employing organization and is based on the U.S. Bureau of Census definitions. The private sector was classified into private for-profit employer, non-profit employer, self-employed, and working without pay for a family business or farm. Likewise, the public sector was classified into municipal government, national government, state government, and foreign or federal government (federal government refers to the U.S. federal government). Limitation and Comparability. The 1980 Census used definitions of industries and occupations from the U.S. standard industry and occupation classifications. The 1994 and 2000 Census used classifications defined by the International Labor Organization (ILO). Furthermore, the 1980 census tabulated information for individuals aged 16 and over while the 1994 and 2000 data was tabulated for individual aged 15 and over. Comparison of aggregate data on Industry and Occupation should be made with caution.
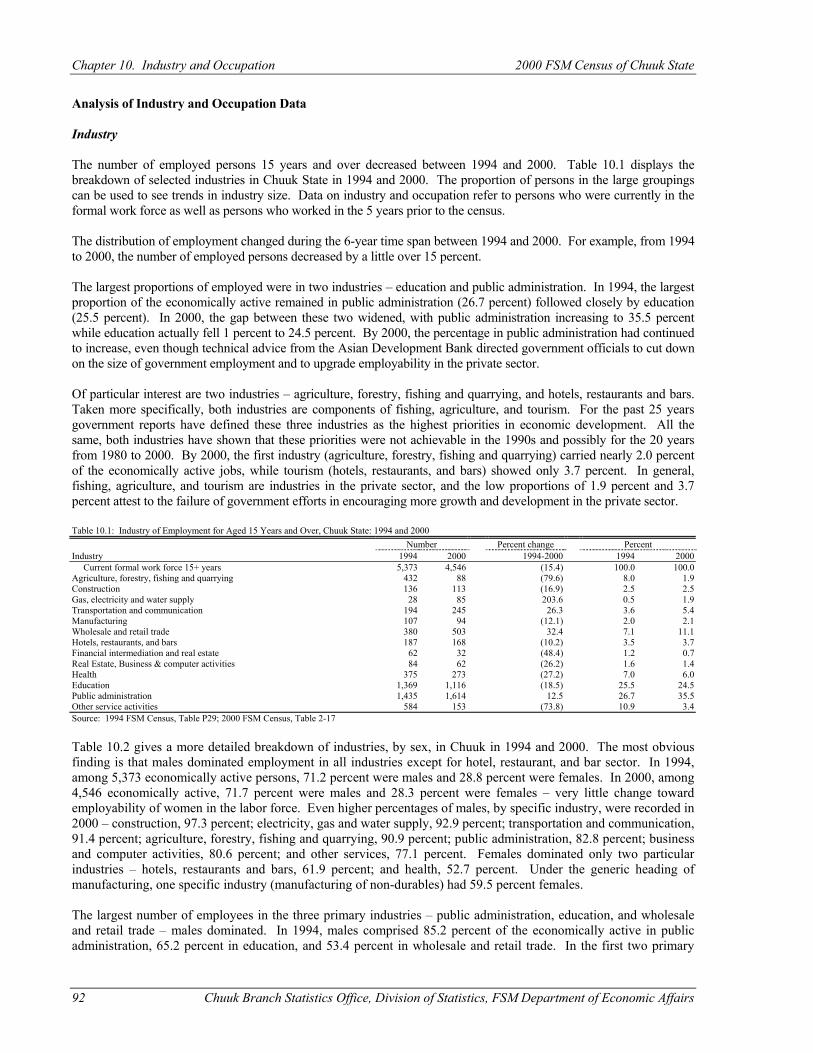
Chapter 10. Industry and Occupation 2000 FSM Census of Chuuk State
92 Chuuk Branch Statistics Office, Division of Statistics, FSM Department of Economic Affairs
Analysis of Industry and Occupation Data Industry The number of employed persons 15 years and over decreased between 1994 and 2000. Table 10.1 displays the breakdown of selected industries in Chuuk State in 1994 and 2000. The proportion of persons in the large groupings can be used to see trends in industry size. Data on industry and occupation refer to persons who were currently in the formal work force as well as persons who worked in the 5 years prior to the census. The distribution of employment changed during the 6-year time span between 1994 and 2000. For example, from 1994 to 2000, the number of employed persons decreased by a little over 15 percent. The largest proportions of employed were in two industries – education and public administration. In 1994, the largest proportion of the economically active remained in public administration (26.7 percent) followed closely by education (25.5 percent). In 2000, the gap between these two widened, with public administration increasing to 35.5 percent while education actually fell 1 percent to 24.5 percent. By 2000, the percentage in public administration had continued to increase, even though technical advice from the Asian Development Bank directed government officials to cut down on the size of government employment and to upgrade employability in the private sector. Of particular interest are two industries – agriculture, forestry, fishing and quarrying, and hotels, restaurants and bars. Taken more specifically, both industries are components of fishing, agriculture, and tourism. For the past 25 years government reports have defined these three industries as the highest priorities in economic development. All the same, both industries have shown that these priorities were not achievable in the 1990s and possibly for the 20 years from 1980 to 2000. By 2000, the first industry (agriculture, forestry, fishing and quarrying) carried nearly 2.0 percent of the economically active jobs, while tourism (hotels, restaurants, and bars) showed only 3.7 percent. In general, fishing, agriculture, and tourism are industries in the private sector, and the low proportions of 1.9 percent and 3.7 percent attest to the failure of government efforts in encouraging more growth and development in the private sector. Table 10.1: Industry of Employment for Aged 15 Years and Over, Chuuk State: 1994 and 2000 Number Percent change Percent Industry 1994 2000 1994-2000 1994 2000 Current formal work force 15+ years 5,373 4,546 (15.4) 100.0 100.0 Agriculture, forestry, fishing and quarrying 432 88 (79.6) 8.0 1.9 Construction 136 113 (16.9) 2.5 2.5 Gas, electricity and water supply 28 85 203.6 0.5 1.9 Transportation and communication 194 245 26.3 3.6 5.4 Manufacturing 107 94 (12.1) 2.0 2.1 Wholesale and retail trade 380 503 32.4 7.1 11.1 Hotels, restaurants, and bars 187 168 (10.2) 3.5 3.7 Financial intermediation and real estate 62 32 (48.4) 1.2 0.7 Real Estate, Business & computer activities 84 62 (26.2) 1.6 1.4 Health 375 273 (27.2) 7.0 6.0 Education 1,369 1,116 (18.5) 25.5 24.5 Public administration 1,435 1,614 12.5 26.7 35.5 Other service activities 584 153 (73.8) 10.9 3.4 Source: 1994 FSM Census, Table P29; 2000 FSM Census, Table 2-17 Table 10.2 gives a more detailed breakdown of industries, by sex, in Chuuk in 1994 and 2000. The most obvious finding is that males dominated employment in all industries except for hotel, restaurant, and bar sector. In 1994, among 5,373 economically active persons, 71.2 percent were males and 28.8 percent were females. In 2000, among 4,546 economically active, 71.7 percent were males and 28.3 percent were females – very little change toward employability of women in the labor force. Even higher percentages of males, by specific industry, were recorded in 2000 – construction, 97.3 percent; electricity, gas and water supply, 92.9 percent; transportation and communication, 91.4 percent; agriculture, forestry, fishing and quarrying, 90.9 percent; public administration, 82.8 percent; business and computer activities, 80.6 percent; and other services, 77.1 percent. Females dominated only two particular industries – hotels, restaurants and bars, 61.9 percent; and health, 52.7 percent. Under the generic heading of manufacturing, one specific industry (manufacturing of non-durables) had 59.5 percent females. The largest number of employees in the three primary industries – public administration, education, and wholesale and retail trade – males dominated. In 1994, males comprised 85.2 percent of the economically active in public administration, 65.2 percent in education, and 53.4 percent in wholesale and retail trade. In the first two primary
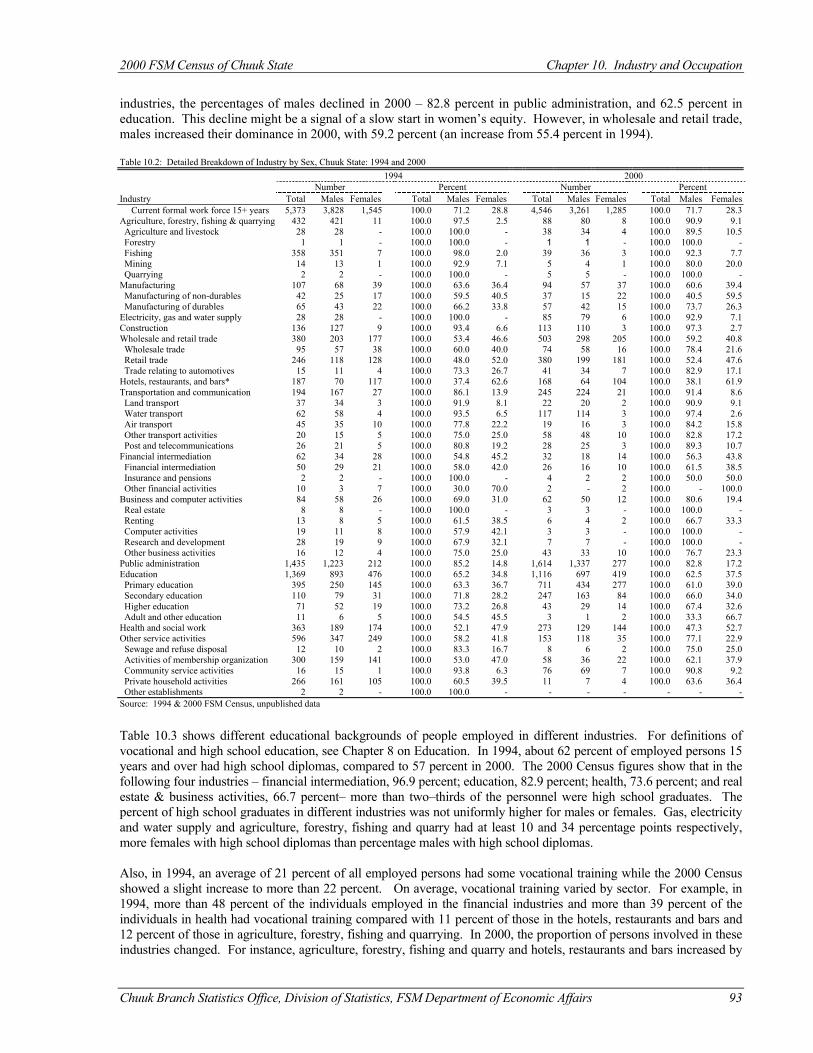
2000 FSM Census of Chuuk State Chapter 10. Industry and Occupation
Chuuk Branch Statistics Office, Division of Statistics, FSM Department of Economic Affairs 93
industries, the percentages of males declined in 2000 – 82.8 percent in public administration, and 62.5 percent in education. This decline might be a signal of a slow start in women’s equity. However, in wholesale and retail trade, males increased their dominance in 2000, with 59.2 percent (an increase from 55.4 percent in 1994). Table 10.2: Detailed Breakdown of Industry by Sex, Chuuk State: 1994 and 2000
1994 2000 Number Percent Number Percent Industry Total Males Females Total Males Females Total Males Females Total Males Females Current formal work force 15+ years 5,373 3,828 1,545 100.0 71.2 28.8 4,546 3,261 1,285 100.0 71.7 28.3 Agriculture, forestry, fishing & quarrying 432 421 11 100.0 97.5 2.5 88 80 8 100.0 90.9 9.1 Agriculture and livestock 28 28 - 100.0 100.0 - 38 34 4 100.0 89.5 10.5 Forestry 1 1 - 100.0 100.0 - 1 1 - 100.0 100.0 - Fishing 358 351 7 100.0 98.0 2.0 39 36 3 100.0 92.3 7.7 Mining 14 13 1 100.0 92.9 7.1 5 4 1 100.0 80.0 20.0 Quarrying 2 2 - 100.0 100.0 - 5 5 - 100.0 100.0 - Manufacturing 107 68 39 100.0 63.6 36.4 94 57 37 100.0 60.6 39.4 Manufacturing of non-durables 42 25 17 100.0 59.5 40.5 37 15 22 100.0 40.5 59.5 Manufacturing of durables 65 43 22 100.0 66.2 33.8 57 42 15 100.0 73.7 26.3 Electricity, gas and water supply 28 28 - 100.0 100.0 - 85 79 6 100.0 92.9 7.1 Construction 136 127 9 100.0 93.4 6.6 113 110 3 100.0 97.3 2.7 Wholesale and retail trade 380 203 177 100.0 53.4 46.6 503 298 205 100.0 59.2 40.8 Wholesale trade 95 57 38 100.0 60.0 40.0 74 58 16 100.0 78.4 21.6 Retail trade 246 118 128 100.0 48.0 52.0 380 199 181 100.0 52.4 47.6 Trade relating to automotives 15 11 4 100.0 73.3 26.7 41 34 7 100.0 82.9 17.1 Hotels, restaurants, and bars* 187 70 117 100.0 37.4 62.6 168 64 104 100.0 38.1 61.9 Transportation and communication 194 167 27 100.0 86.1 13.9 245 224 21 100.0 91.4 8.6 Land transport 37 34 3 100.0 91.9 8.1 22 20 2 100.0 90.9 9.1 Water transport 62 58 4 100.0 93.5 6.5 117 114 3 100.0 97.4 2.6 Air transport 45 35 10 100.0 77.8 22.2 19 16 3 100.0 84.2 15.8 Other transport activities 20 15 5 100.0 75.0 25.0 58 48 10 100.0 82.8 17.2 Post and telecommunications 26 21 5 100.0 80.8 19.2 28 25 3 100.0 89.3 10.7 Financial intermediation 62 34 28 100.0 54.8 45.2 32 18 14 100.0 56.3 43.8 Financial intermediation 50 29 21 100.0 58.0 42.0 26 16 10 100.0 61.5 38.5 Insurance and pensions 2 2 - 100.0 100.0 - 4 2 2 100.0 50.0 50.0 Other financial activities 10 3 7 100.0 30.0 70.0 2 - 2 100.0 - 100.0 Business and computer activities 84 58 26 100.0 69.0 31.0 62 50 12 100.0 80.6 19.4 Real estate 8 8 - 100.0 100.0 - 3 3 - 100.0 100.0 - Renting 13 8 5 100.0 61.5 38.5 6 4 2 100.0 66.7 33.3 Computer activities 19 11 8 100.0 57.9 42.1 3 3 - 100.0 100.0 - Research and development 28 19 9 100.0 67.9 32.1 7 7 - 100.0 100.0 - Other business activities 16 12 4 100.0 75.0 25.0 43 33 10 100.0 76.7 23.3 Public administration 1,435 1,223 212 100.0 85.2 14.8 1,614 1,337 277 100.0 82.8 17.2 Education 1,369 893 476 100.0 65.2 34.8 1,116 697 419 100.0 62.5 37.5 Primary education 395 250 145 100.0 63.3 36.7 711 434 277 100.0 61.0 39.0 Secondary education 110 79 31 100.0 71.8 28.2 247 163 84 100.0 66.0 34.0 Higher education 71 52 19 100.0 73.2 26.8 43 29 14 100.0 67.4 32.6 Adult and other education 11 6 5 100.0 54.5 45.5 3 1 2 100.0 33.3 66.7 Health and social work 363 189 174 100.0 52.1 47.9 273 129 144 100.0 47.3 52.7 Other service activities 596 347 249 100.0 58.2 41.8 153 118 35 100.0 77.1 22.9 Sewage and refuse disposal 12 10 2 100.0 83.3 16.7 8 6 2 100.0 75.0 25.0 Activities of membership organization 300 159 141 100.0 53.0 47.0 58 36 22 100.0 62.1 37.9 Community service activities 16 15 1 100.0 93.8 6.3 76 69 7 100.0 90.8 9.2 Private household activities 266 161 105 100.0 60.5 39.5 11 7 4 100.0 63.6 36.4 Other establishments 2 2 - 100.0 100.0 - - - - - - - Source: 1994 & 2000 FSM Census, unpublished data
Table 10.3 shows different educational backgrounds of people employed in different industries. For definitions of vocational and high school education, see Chapter 8 on Education. In 1994, about 62 percent of employed persons 15 years and over had high school diplomas, compared to 57 percent in 2000. The 2000 Census figures show that in the following four industries – financial intermediation, 96.9 percent; education, 82.9 percent; health, 73.6 percent; and real estate & business activities, 66.7 percent– more than two–thirds of the personnel were high school graduates. The percent of high school graduates in different industries was not uniformly higher for males or females. Gas, electricity and water supply and agriculture, forestry, fishing and quarry had at least 10 and 34 percentage points respectively, more females with high school diplomas than percentage males with high school diplomas. Also, in 1994, an average of 21 percent of all employed persons had some vocational training while the 2000 Census showed a slight increase to more than 22 percent. On average, vocational training varied by sector. For example, in 1994, more than 48 percent of the individuals employed in the financial industries and more than 39 percent of the individuals in health had vocational training compared with 11 percent of those in the hotels, restaurants and bars and 12 percent of those in agriculture, forestry, fishing and quarrying. In 2000, the proportion of persons involved in these industries changed. For instance, agriculture, forestry, fishing and quarry and hotels, restaurants and bars increased by
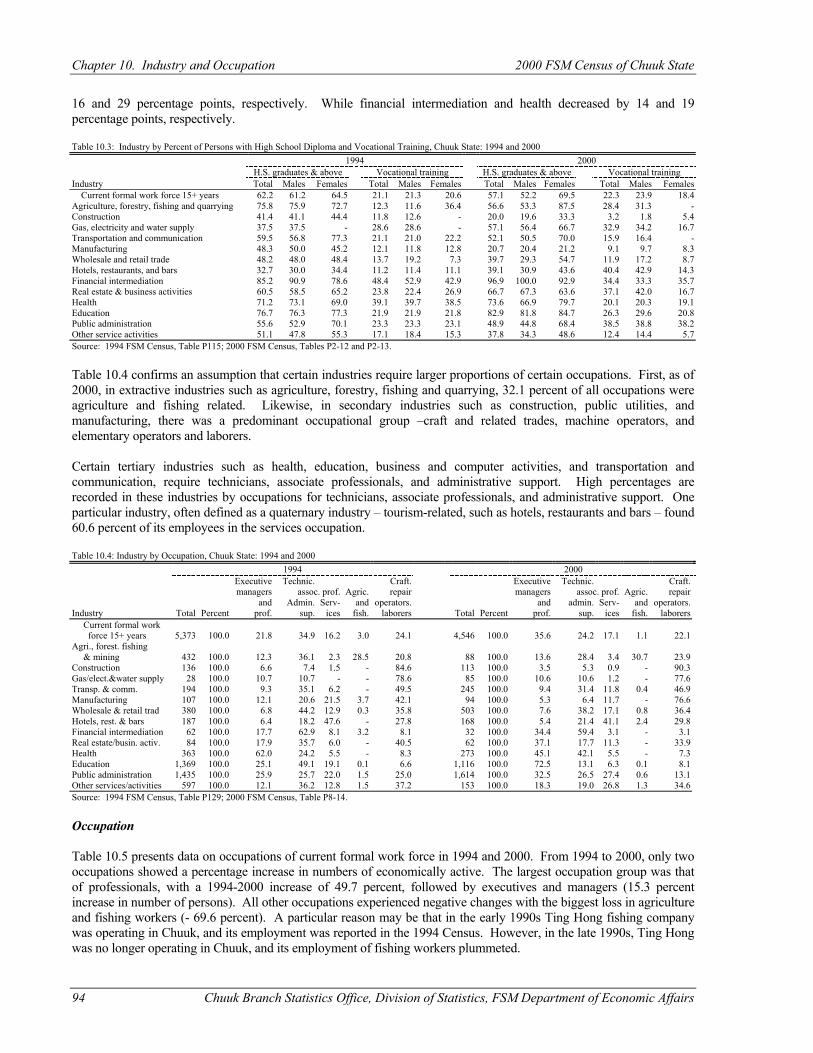
Chapter 10. Industry and Occupation 2000 FSM Census of Chuuk State
94 Chuuk Branch Statistics Office, Division of Statistics, FSM Department of Economic Affairs
16 and 29 percentage points, respectively. While financial intermediation and health decreased by 14 and 19 percentage points, respectively. Table 10.3: Industry by Percent of Persons with High School Diploma and Vocational Training, Chuuk State: 1994 and 2000 1994 2000
H.S. graduates & above Vocational training H.S. graduates & above Vocational training Industry Total Males Females Total Males Females Total Males Females Total Males Females Current formal work force 15+ years 62.2 61.2 64.5 21.1 21.3 20.6 57.1 52.2 69.5 22.3 23.9 18.4 Agriculture, forestry, fishing and quarrying 75.8 75.9 72.7 12.3 11.6 36.4 56.6 53.3 87.5 28.4 31.3 - Construction 41.4 41.1 44.4 11.8 12.6 - 20.0 19.6 33.3 3.2 1.8 5.4 Gas, electricity and water supply 37.5 37.5 - 28.6 28.6 - 57.1 56.4 66.7 32.9 34.2 16.7 Transportation and communication 59.5 56.8 77.3 21.1 21.0 22.2 52.1 50.5 70.0 15.9 16.4 - Manufacturing 48.3 50.0 45.2 12.1 11.8 12.8 20.7 20.4 21.2 9.1 9.7 8.3 Wholesale and retail trade 48.2 48.0 48.4 13.7 19.2 7.3 39.7 29.3 54.7 11.9 17.2 8.7 Hotels, restaurants, and bars 32.7 30.0 34.4 11.2 11.4 11.1 39.1 30.9 43.6 40.4 42.9 14.3 Financial intermediation 85.2 90.9 78.6 48.4 52.9 42.9 96.9 100.0 92.9 34.4 33.3 35.7 Real estate & business activities 60.5 58.5 65.2 23.8 22.4 26.9 66.7 67.3 63.6 37.1 42.0 16.7 Health 71.2 73.1 69.0 39.1 39.7 38.5 73.6 66.9 79.7 20.1 20.3 19.1 Education 76.7 76.3 77.3 21.9 21.9 21.8 82.9 81.8 84.7 26.3 29.6 20.8 Public administration 55.6 52.9 70.1 23.3 23.3 23.1 48.9 44.8 68.4 38.5 38.8 38.2 Other service activities 51.1 47.8 55.3 17.1 18.4 15.3 37.8 34.3 48.6 12.4 14.4 5.7 Source: 1994 FSM Census, Table P115; 2000 FSM Census, Tables P2-12 and P2-13. Table 10.4 confirms an assumption that certain industries require larger proportions of certain occupations. First, as of 2000, in extractive industries such as agriculture, forestry, fishing and quarrying, 32.1 percent of all occupations were agriculture and fishing related. Likewise, in secondary industries such as construction, public utilities, and manufacturing, there was a predominant occupational group –craft and related trades, machine operators, and elementary operators and laborers. Certain tertiary industries such as health, education, business and computer activities, and transportation and communication, require technicians, associate professionals, and administrative support. High percentages are recorded in these industries by occupations for technicians, associate professionals, and administrative support. One particular industry, often defined as a quaternary industry – tourism-related, such as hotels, restaurants and bars – found 60.6 percent of its employees in the services occupation. Table 10.4: Industry by Occupation, Chuuk State: 1994 and 2000 1994 2000
Executive Technic. Craft. Executive Technic. Craft. managers assoc. prof. Agric. repair managers assoc. prof. Agric. repair and Admin. Serv- and operators. and admin. Serv- and operators.
Industry Total Percent prof. sup. ices fish. laborers Total Percent prof. sup. ices fish. laborers Current formal work force 15+ years 5,373 100.0 21.8 34.9 16.2 3.0 24.1 4,546 100.0 35.6 24.2 17.1 1.1 22.1 Agri., forest. fishing & mining 432 100.0 12.3 36.1 2.3 28.5 20.8 88 100.0 13.6 28.4 3.4 30.7 23.9 Construction 136 100.0 6.6 7.4 1.5 - 84.6 113 100.0 3.5 5.3 0.9 - 90.3 Gas/elect.&water supply 28 100.0 10.7 10.7 - - 78.6 85 100.0 10.6 10.6 1.2 - 77.6 Transp. & comm. 194 100.0 9.3 35.1 6.2 - 49.5 245 100.0 9.4 31.4 11.8 0.4 46.9 Manufacturing 107 100.0 12.1 20.6 21.5 3.7 42.1 94 100.0 5.3 6.4 11.7 - 76.6 Wholesale & retail trad 380 100.0 6.8 44.2 12.9 0.3 35.8 503 100.0 7.6 38.2 17.1 0.8 36.4 Hotels, rest. & bars 187 100.0 6.4 18.2 47.6 - 27.8 168 100.0 5.4 21.4 41.1 2.4 29.8 Financial intermediation 62 100.0 17.7 62.9 8.1 3.2 8.1 32 100.0 34.4 59.4 3.1 - 3.1 Real estate/busin. activ. 84 100.0 17.9 35.7 6.0 - 40.5 62 100.0 37.1 17.7 11.3 - 33.9 Health 363 100.0 62.0 24.2 5.5 - 8.3 273 100.0 45.1 42.1 5.5 - 7.3 Education 1,369 100.0 25.1 49.1 19.1 0.1 6.6 1,116 100.0 72.5 13.1 6.3 0.1 8.1 Public administration 1,435 100.0 25.9 25.7 22.0 1.5 25.0 1,614 100.0 32.5 26.5 27.4 0.6 13.1 Other services/activities 597 100.0 12.1 36.2 12.8 1.5 37.2 153 100.0 18.3 19.0 26.8 1.3 34.6 Source: 1994 FSM Census, Table P129; 2000 FSM Census, Table P8-14. Occupation Table 10.5 presents data on occupations of current formal work force in 1994 and 2000. From 1994 to 2000, only two occupations showed a percentage increase in numbers of economically active. The largest occupation group was that of professionals, with a 1994-2000 increase of 49.7 percent, followed by executives and managers (15.3 percent increase in number of persons). All other occupations experienced negative changes with the biggest loss in agriculture and fishing workers (- 69.6 percent). A particular reason may be that in the early 1990s Ting Hong fishing company was operating in Chuuk, and its employment was reported in the 1994 Census. However, in the late 1990s, Ting Hong was no longer operating in Chuuk, and its employment of fishing workers plummeted.
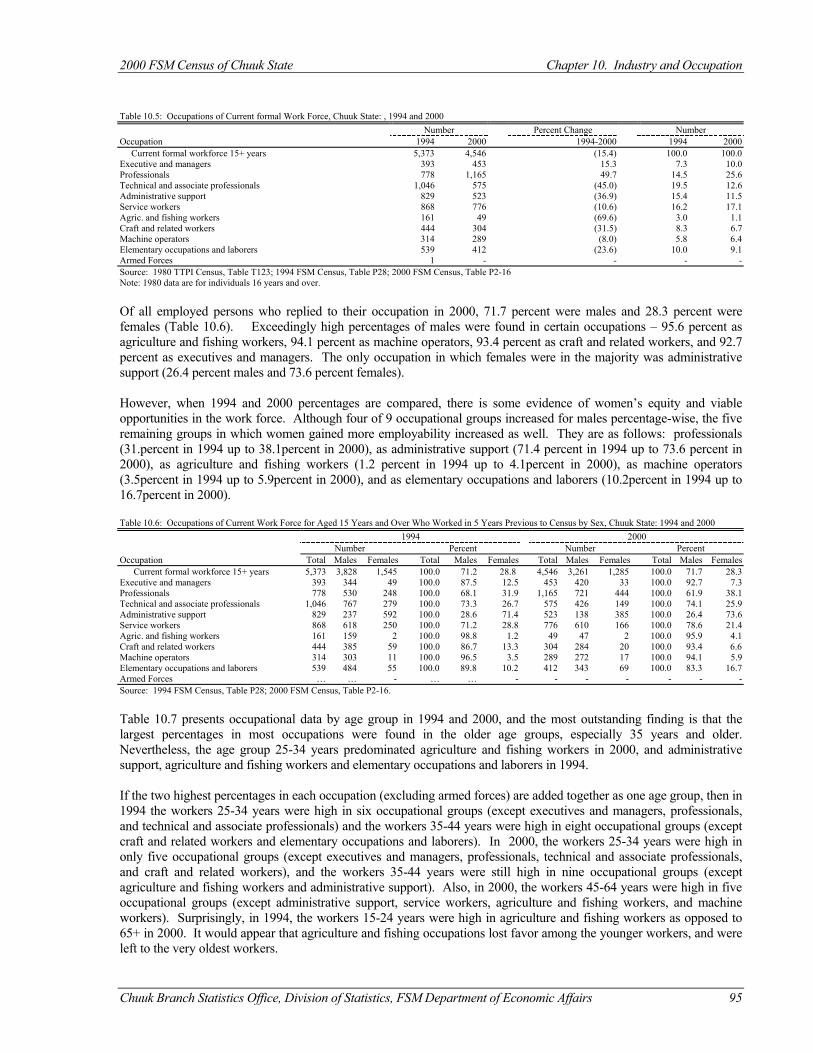
2000 FSM Census of Chuuk State Chapter 10. Industry and Occupation
Chuuk Branch Statistics Office, Division of Statistics, FSM Department of Economic Affairs 95
Table 10.5: Occupations of Current formal Work Force, Chuuk State: , 1994 and 2000 Number Percent Change Number Occupation 1994 2000 1994-2000 1994 2000 Current formal workforce 15+ years 5,373 4,546 (15.4) 100.0 100.0 Executive and managers 393 453 15.3 7.3 10.0 Professionals 778 1,165 49.7 14.5 25.6 Technical and associate professionals 1,046 575 (45.0) 19.5 12.6 Administrative support 829 523 (36.9) 15.4 11.5 Service workers 868 776 (10.6) 16.2 17.1 Agric. and fishing workers 161 49 (69.6) 3.0 1.1 Craft and related workers 444 304 (31.5) 8.3 6.7 Machine operators 314 289 (8.0) 5.8 6.4 Elementary occupations and laborers 539 412 (23.6) 10.0 9.1 Armed Forces 1 - - - - Source: 1980 TTPI Census, Table T123; 1994 FSM Census, Table P28; 2000 FSM Census, Table P2-16 Note: 1980 data are for individuals 16 years and over. Of all employed persons who replied to their occupation in 2000, 71.7 percent were males and 28.3 percent were females (Table 10.6). Exceedingly high percentages of males were found in certain occupations – 95.6 percent as agriculture and fishing workers, 94.1 percent as machine operators, 93.4 percent as craft and related workers, and 92.7 percent as executives and managers. The only occupation in which females were in the majority was administrative support (26.4 percent males and 73.6 percent females). However, when 1994 and 2000 percentages are compared, there is some evidence of women’s equity and viable opportunities in the work force. Although four of 9 occupational groups increased for males percentage-wise, the five remaining groups in which women gained more employability increased as well. They are as follows: professionals (31.percent in 1994 up to 38.1percent in 2000), as administrative support (71.4 percent in 1994 up to 73.6 percent in 2000), as agriculture and fishing workers (1.2 percent in 1994 up to 4.1percent in 2000), as machine operators (3.5percent in 1994 up to 5.9percent in 2000), and as elementary occupations and laborers (10.2percent in 1994 up to 16.7percent in 2000). Table 10.6: Occupations of Current Work Force for Aged 15 Years and Over Who Worked in 5 Years Previous to Census by Sex, Chuuk State: 1994 and 2000
1994 2000 Number Percent Number Percent
Occupation Total Males Females Total Males Females Total Males Females Total Males Females Current formal workforce 15+ years 5,373 3,828 1,545 100.0 71.2 28.8 4,546 3,261 1,285 100.0 71.7 28.3 Executive and managers 393 344 49 100.0 87.5 12.5 453 420 33 100.0 92.7 7.3 Professionals 778 530 248 100.0 68.1 31.9 1,165 721 444 100.0 61.9 38.1 Technical and associate professionals 1,046 767 279 100.0 73.3 26.7 575 426 149 100.0 74.1 25.9 Administrative support 829 237 592 100.0 28.6 71.4 523 138 385 100.0 26.4 73.6 Service workers 868 618 250 100.0 71.2 28.8 776 610 166 100.0 78.6 21.4 Agric. and fishing workers 161 159 2 100.0 98.8 1.2 49 47 2 100.0 95.9 4.1 Craft and related workers 444 385 59 100.0 86.7 13.3 304 284 20 100.0 93.4 6.6 Machine operators 314 303 11 100.0 96.5 3.5 289 272 17 100.0 94.1 5.9 Elementary occupations and laborers 539 484 55 100.0 89.8 10.2 412 343 69 100.0 83.3 16.7 Armed Forces … … - … … - - - - - - - Source: 1994 FSM Census, Table P28; 2000 FSM Census, Table P2-16. Table 10.7 presents occupational data by age group in 1994 and 2000, and the most outstanding finding is that the largest percentages in most occupations were found in the older age groups, especially 35 years and older. Nevertheless, the age group 25-34 years predominated agriculture and fishing workers in 2000, and administrative support, agriculture and fishing workers and elementary occupations and laborers in 1994. If the two highest percentages in each occupation (excluding armed forces) are added together as one age group, then in 1994 the workers 25-34 years were high in six occupational groups (except executives and managers, professionals, and technical and associate professionals) and the workers 35-44 years were high in eight occupational groups (except craft and related workers and elementary occupations and laborers). In 2000, the workers 25-34 years were high in only five occupational groups (except executives and managers, professionals, technical and associate professionals, and craft and related workers), and the workers 35-44 years were still high in nine occupational groups (except agriculture and fishing workers and administrative support). Also, in 2000, the workers 45-64 years were high in five occupational groups (except administrative support, service workers, agriculture and fishing workers, and machine workers). Surprisingly, in 1994, the workers 15-24 years were high in agriculture and fishing workers as opposed to 65+ in 2000. It would appear that agriculture and fishing occupations lost favor among the younger workers, and were left to the very oldest workers.
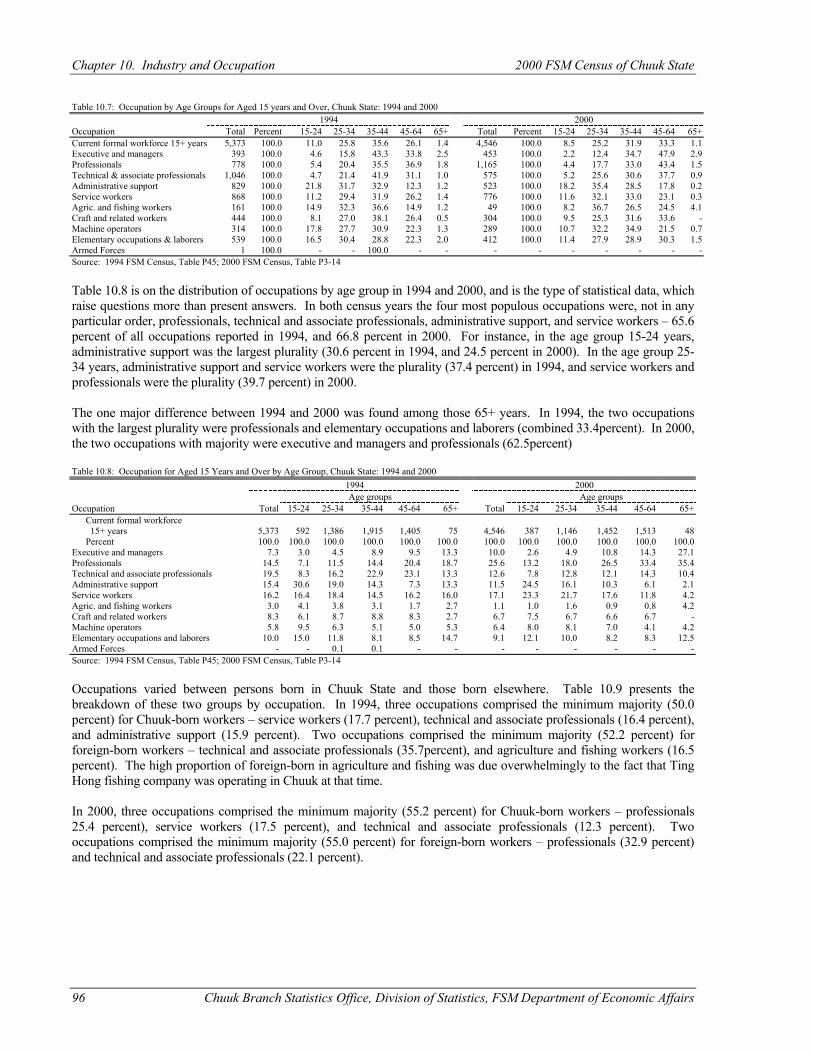
Chapter 10. Industry and Occupation 2000 FSM Census of Chuuk State
96 Chuuk Branch Statistics Office, Division of Statistics, FSM Department of Economic Affairs
Table 10.7: Occupation by Age Groups for Aged 15 years and Over, Chuuk State: 1994 and 2000 1994 2000 Occupation Total Percent 15-24 25-34 35-44 45-64 65+ Total Percent 15-24 25-34 35-44 45-64 65+ Current formal workforce 15+ years 5,373 100.0 11.0 25.8 35.6 26.1 1.4 4,546 100.0 8.5 25.2 31.9 33.3 1.1 Executive and managers 393 100.0 4.6 15.8 43.3 33.8 2.5 453 100.0 2.2 12.4 34.7 47.9 2.9 Professionals 778 100.0 5.4 20.4 35.5 36.9 1.8 1,165 100.0 4.4 17.7 33.0 43.4 1.5 Technical & associate professionals 1,046 100.0 4.7 21.4 41.9 31.1 1.0 575 100.0 5.2 25.6 30.6 37.7 0.9 Administrative support 829 100.0 21.8 31.7 32.9 12.3 1.2 523 100.0 18.2 35.4 28.5 17.8 0.2 Service workers 868 100.0 11.2 29.4 31.9 26.2 1.4 776 100.0 11.6 32.1 33.0 23.1 0.3 Agric. and fishing workers 161 100.0 14.9 32.3 36.6 14.9 1.2 49 100.0 8.2 36.7 26.5 24.5 4.1 Craft and related workers 444 100.0 8.1 27.0 38.1 26.4 0.5 304 100.0 9.5 25.3 31.6 33.6 - Machine operators 314 100.0 17.8 27.7 30.9 22.3 1.3 289 100.0 10.7 32.2 34.9 21.5 0.7 Elementary occupations & laborers 539 100.0 16.5 30.4 28.8 22.3 2.0 412 100.0 11.4 27.9 28.9 30.3 1.5 Armed Forces 1 100.0 - - 100.0 - - - - - - - - - Source: 1994 FSM Census, Table P45; 2000 FSM Census, Table P3-14 Table 10.8 is on the distribution of occupations by age group in 1994 and 2000, and is the type of statistical data, which raise questions more than present answers. In both census years the four most populous occupations were, not in any particular order, professionals, technical and associate professionals, administrative support, and service workers – 65.6 percent of all occupations reported in 1994, and 66.8 percent in 2000. For instance, in the age group 15-24 years, administrative support was the largest plurality (30.6 percent in 1994, and 24.5 percent in 2000). In the age group 25-34 years, administrative support and service workers were the plurality (37.4 percent) in 1994, and service workers and professionals were the plurality (39.7 percent) in 2000. The one major difference between 1994 and 2000 was found among those 65+ years. In 1994, the two occupations with the largest plurality were professionals and elementary occupations and laborers (combined 33.4percent). In 2000, the two occupations with majority were executive and managers and professionals (62.5percent) Table 10.8: Occupation for Aged 15 Years and Over by Age Group, Chuuk State: 1994 and 2000 1994 2000
Age groups Age groups Occupation Total 15-24 25-34 35-44 45-64 65+ Total 15-24 25-34 35-44 45-64 65+ Current formal workforce 15+ years 5,373 592 1,386 1,915 1,405 75 4,546 387 1,146 1,452 1,513 48 Percent 100.0 100.0 100.0 100.0 100.0 100.0 100.0 100.0 100.0 100.0 100.0 100.0 Executive and managers 7.3 3.0 4.5 8.9 9.5 13.3 10.0 2.6 4.9 10.8 14.3 27.1 Professionals 14.5 7.1 11.5 14.4 20.4 18.7 25.6 13.2 18.0 26.5 33.4 35.4 Technical and associate professionals 19.5 8.3 16.2 22.9 23.1 13.3 12.6 7.8 12.8 12.1 14.3 10.4 Administrative support 15.4 30.6 19.0 14.3 7.3 13.3 11.5 24.5 16.1 10.3 6.1 2.1 Service workers 16.2 16.4 18.4 14.5 16.2 16.0 17.1 23.3 21.7 17.6 11.8 4.2 Agric. and fishing workers 3.0 4.1 3.8 3.1 1.7 2.7 1.1 1.0 1.6 0.9 0.8 4.2 Craft and related workers 8.3 6.1 8.7 8.8 8.3 2.7 6.7 7.5 6.7 6.6 6.7 - Machine operators 5.8 9.5 6.3 5.1 5.0 5.3 6.4 8.0 8.1 7.0 4.1 4.2 Elementary occupations and laborers 10.0 15.0 11.8 8.1 8.5 14.7 9.1 12.1 10.0 8.2 8.3 12.5 Armed Forces - - 0.1 0.1 - - - - - - - - Source: 1994 FSM Census, Table P45; 2000 FSM Census, Table P3-14 Occupations varied between persons born in Chuuk State and those born elsewhere. Table 10.9 presents the breakdown of these two groups by occupation. In 1994, three occupations comprised the minimum majority (50.0 percent) for Chuuk-born workers – service workers (17.7 percent), technical and associate professionals (16.4 percent), and administrative support (15.9 percent). Two occupations comprised the minimum majority (52.2 percent) for foreign-born workers – technical and associate professionals (35.7percent), and agriculture and fishing workers (16.5 percent). The high proportion of foreign-born in agriculture and fishing was due overwhelmingly to the fact that Ting Hong fishing company was operating in Chuuk at that time. In 2000, three occupations comprised the minimum majority (55.2 percent) for Chuuk-born workers – professionals 25.4 percent), service workers (17.5 percent), and technical and associate professionals (12.3 percent). Two occupations comprised the minimum majority (55.0 percent) for foreign-born workers – professionals (32.9 percent) and technical and associate professionals (22.1 percent).
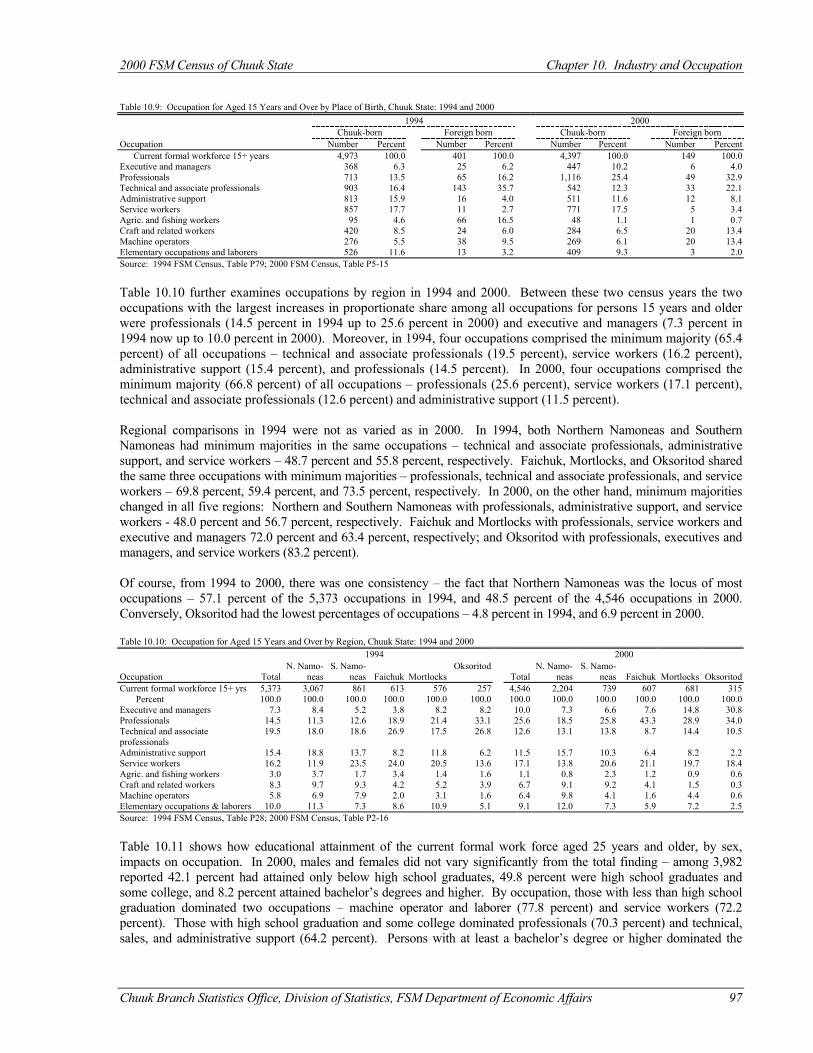
2000 FSM Census of Chuuk State Chapter 10. Industry and Occupation
Chuuk Branch Statistics Office, Division of Statistics, FSM Department of Economic Affairs 97
Table 10.9: Occupation for Aged 15 Years and Over by Place of Birth, Chuuk State: 1994 and 2000 1994 2000
Chuuk-born Foreign born Chuuk-born Foreign born Occupation Number Percent Number Percent Number Percent Number Percent Current formal workforce 15+ years 4,973 100.0 401 100.0 4,397 100.0 149 100.0 Executive and managers 368 6.3 25 6.2 447 10.2 6 4.0 Professionals 713 13.5 65 16.2 1,116 25.4 49 32.9 Technical and associate professionals 903 16.4 143 35.7 542 12.3 33 22.1 Administrative support 813 15.9 16 4.0 511 11.6 12 8.1 Service workers 857 17.7 11 2.7 771 17.5 5 3.4 Agric. and fishing workers 95 4.6 66 16.5 48 1.1 1 0.7 Craft and related workers 420 8.5 24 6.0 284 6.5 20 13.4 Machine operators 276 5.5 38 9.5 269 6.1 20 13.4 Elementary occupations and laborers 526 11.6 13 3.2 409 9.3 3 2.0 Source: 1994 FSM Census, Table P79; 2000 FSM Census, Table P5-15 Table 10.10 further examines occupations by region in 1994 and 2000. Between these two census years the two occupations with the largest increases in proportionate share among all occupations for persons 15 years and older were professionals (14.5 percent in 1994 up to 25.6 percent in 2000) and executive and managers (7.3 percent in 1994 now up to 10.0 percent in 2000). Moreover, in 1994, four occupations comprised the minimum majority (65.4 percent) of all occupations – technical and associate professionals (19.5 percent), service workers (16.2 percent), administrative support (15.4 percent), and professionals (14.5 percent). In 2000, four occupations comprised the minimum majority (66.8 percent) of all occupations – professionals (25.6 percent), service workers (17.1 percent), technical and associate professionals (12.6 percent) and administrative support (11.5 percent). Regional comparisons in 1994 were not as varied as in 2000. In 1994, both Northern Namoneas and Southern Namoneas had minimum majorities in the same occupations – technical and associate professionals, administrative support, and service workers – 48.7 percent and 55.8 percent, respectively. Faichuk, Mortlocks, and Oksoritod shared the same three occupations with minimum majorities – professionals, technical and associate professionals, and service workers – 69.8 percent, 59.4 percent, and 73.5 percent, respectively. In 2000, on the other hand, minimum majorities changed in all five regions: Northern and Southern Namoneas with professionals, administrative support, and service workers - 48.0 percent and 56.7 percent, respectively. Faichuk and Mortlocks with professionals, service workers and executive and managers 72.0 percent and 63.4 percent, respectively; and Oksoritod with professionals, executives and managers, and service workers (83.2 percent). Of course, from 1994 to 2000, there was one consistency – the fact that Northern Namoneas was the locus of most occupations – 57.1 percent of the 5,373 occupations in 1994, and 48.5 percent of the 4,546 occupations in 2000. Conversely, Oksoritod had the lowest percentages of occupations – 4.8 percent in 1994, and 6.9 percent in 2000. Table 10.10: Occupation for Aged 15 Years and Over by Region, Chuuk State: 1994 and 2000 1994 2000
Occupation
Total
N. Namo-neas
S. Namo-neas
Faichuk
Mortlocks
Oksoritod Total
N. Namo-neas
S. Namo-neas
Faichuk
Mortlocks
Oksoritod
Current formal workforce 15+ yrs 5,373 3,067 861 613 576 257 4,546 2,204 739 607 681 315 Percent 100.0 100.0 100.0 100.0 100.0 100.0 100.0 100.0 100.0 100.0 100.0 100.0 Executive and managers 7.3 8.4 5.2 3.8 8.2 8.2 10.0 7.3 6.6 7.6 14.8 30.8 Professionals 14.5 11.3 12.6 18.9 21.4 33.1 25.6 18.5 25.8 43.3 28.9 34.0 Technical and associate professionals
19.5 18.0 18.6 26.9 17.5 26.8 12.6 13.1 13.8 8.7 14.4 10.5
Administrative support 15.4 18.8 13.7 8.2 11.8 6.2 11.5 15.7 10.3 6.4 8.2 2.2 Service workers 16.2 11.9 23.5 24.0 20.5 13.6 17.1 13.8 20.6 21.1 19.7 18.4 Agric. and fishing workers 3.0 3.7 1.7 3.4 1.4 1.6 1.1 0.8 2.3 1.2 0.9 0.6 Craft and related workers 8.3 9.7 9.3 4.2 5.2 3.9 6.7 9.1 9.2 4.1 1.5 0.3 Machine operators 5.8 6.9 7.9 2.0 3.1 1.6 6.4 9.8 4.1 1.6 4.4 0.6 Elementary occupations & laborers 10.0 11.3 7.3 8.6 10.9 5.1 9.1 12.0 7.3 5.9 7.2 2.5 Source: 1994 FSM Census, Table P28; 2000 FSM Census, Table P2-16 Table 10.11 shows how educational attainment of the current formal work force aged 25 years and older, by sex, impacts on occupation. In 2000, males and females did not vary significantly from the total finding – among 3,982 reported 42.1 percent had attained only below high school graduates, 49.8 percent were high school graduates and some college, and 8.2 percent attained bachelor’s degrees and higher. By occupation, those with less than high school graduation dominated two occupations – machine operator and laborer (77.8 percent) and service workers (72.2 percent). Those with high school graduation and some college dominated professionals (70.3 percent) and technical, sales, and administrative support (64.2 percent). Persons with at least a bachelor’s degree or higher dominated the
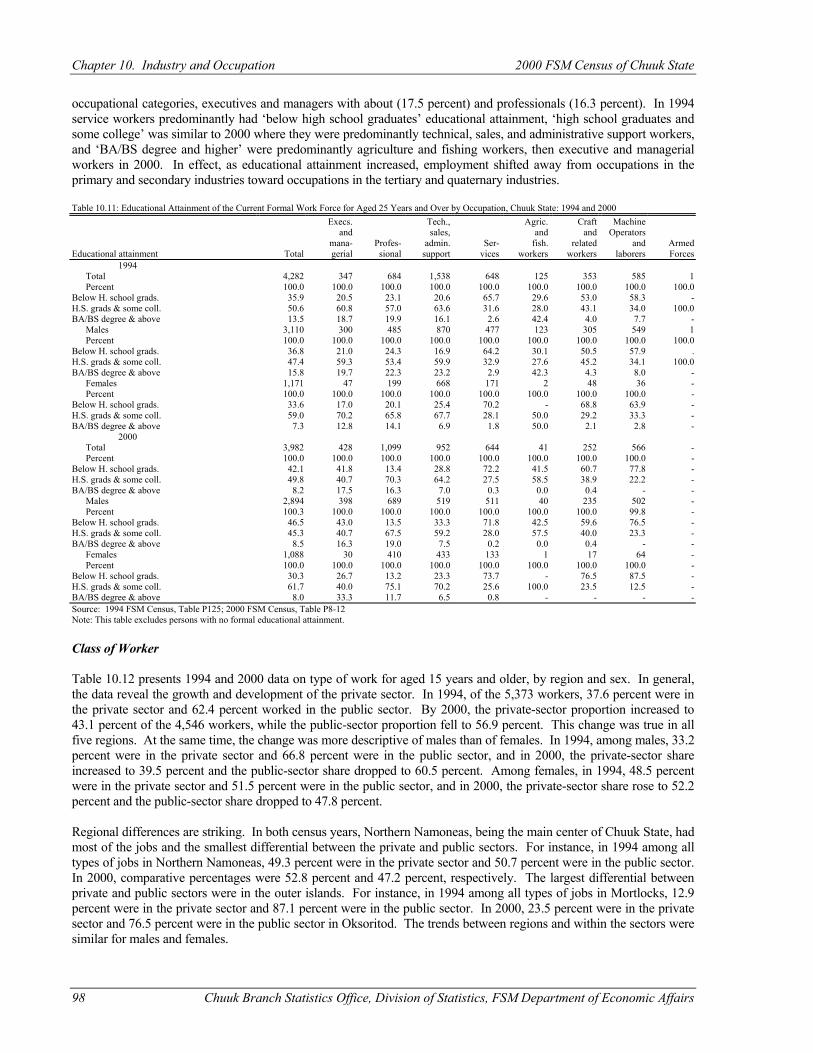
Chapter 10. Industry and Occupation 2000 FSM Census of Chuuk State
98 Chuuk Branch Statistics Office, Division of Statistics, FSM Department of Economic Affairs
occupational categories, executives and managers with about (17.5 percent) and professionals (16.3 percent). In 1994 service workers predominantly had ‘below high school graduates’ educational attainment, ‘high school graduates and some college’ was similar to 2000 where they were predominantly technical, sales, and administrative support workers, and ‘BA/BS degree and higher’ were predominantly agriculture and fishing workers, then executive and managerial workers in 2000. In effect, as educational attainment increased, employment shifted away from occupations in the primary and secondary industries toward occupations in the tertiary and quaternary industries. Table 10.11: Educational Attainment of the Current Formal Work Force for Aged 25 Years and Over by Occupation, Chuuk State: 1994 and 2000 Execs. Tech., Agric. Craft Machine
and sales, and and Operators mana- Profes- admin. Ser- fish. related and Armed
Educational attainment Total gerial sional support vices workers workers laborers Forces 1994 Total 4,282 347 684 1,538 648 125 353 585 1 Percent 100.0 100.0 100.0 100.0 100.0 100.0 100.0 100.0 100.0 Below H. school grads. 35.9 20.5 23.1 20.6 65.7 29.6 53.0 58.3 - H.S. grads & some coll. 50.6 60.8 57.0 63.6 31.6 28.0 43.1 34.0 100.0 BA/BS degree & above 13.5 18.7 19.9 16.1 2.6 42.4 4.0 7.7 - Males 3,110 300 485 870 477 123 305 549 1 Percent 100.0 100.0 100.0 100.0 100.0 100.0 100.0 100.0 100.0 Below H. school grads. 36.8 21.0 24.3 16.9 64.2 30.1 50.5 57.9 . H.S. grads & some coll. 47.4 59.3 53.4 59.9 32.9 27.6 45.2 34.1 100.0 BA/BS degree & above 15.8 19.7 22.3 23.2 2.9 42.3 4.3 8.0 - Females 1,171 47 199 668 171 2 48 36 - Percent 100.0 100.0 100.0 100.0 100.0 100.0 100.0 100.0 - Below H. school grads. 33.6 17.0 20.1 25.4 70.2 - 68.8 63.9 - H.S. grads & some coll. 59.0 70.2 65.8 67.7 28.1 50.0 29.2 33.3 - BA/BS degree & above 7.3 12.8 14.1 6.9 1.8 50.0 2.1 2.8 - 2000 Total 3,982 428 1,099 952 644 41 252 566 - Percent 100.0 100.0 100.0 100.0 100.0 100.0 100.0 100.0 - Below H. school grads. 42.1 41.8 13.4 28.8 72.2 41.5 60.7 77.8 - H.S. grads & some coll. 49.8 40.7 70.3 64.2 27.5 58.5 38.9 22.2 - BA/BS degree & above 8.2 17.5 16.3 7.0 0.3 0.0 0.4 - - Males 2,894 398 689 519 511 40 235 502 - Percent 100.3 100.0 100.0 100.0 100.0 100.0 100.0 99.8 - Below H. school grads. 46.5 43.0 13.5 33.3 71.8 42.5 59.6 76.5 - H.S. grads & some coll. 45.3 40.7 67.5 59.2 28.0 57.5 40.0 23.3 - BA/BS degree & above 8.5 16.3 19.0 7.5 0.2 0.0 0.4 - - Females 1,088 30 410 433 133 1 17 64 - Percent 100.0 100.0 100.0 100.0 100.0 100.0 100.0 100.0 - Below H. school grads. 30.3 26.7 13.2 23.3 73.7 - 76.5 87.5 - H.S. grads & some coll. 61.7 40.0 75.1 70.2 25.6 100.0 23.5 12.5 - BA/BS degree & above 8.0 33.3 11.7 6.5 0.8 - - - - Source: 1994 FSM Census, Table P125; 2000 FSM Census, Table P8-12 Note: This table excludes persons with no formal educational attainment. Class of Worker Table 10.12 presents 1994 and 2000 data on type of work for aged 15 years and older, by region and sex. In general, the data reveal the growth and development of the private sector. In 1994, of the 5,373 workers, 37.6 percent were in the private sector and 62.4 percent worked in the public sector. By 2000, the private-sector proportion increased to 43.1 percent of the 4,546 workers, while the public-sector proportion fell to 56.9 percent. This change was true in all five regions. At the same time, the change was more descriptive of males than of females. In 1994, among males, 33.2 percent were in the private sector and 66.8 percent were in the public sector, and in 2000, the private-sector share increased to 39.5 percent and the public-sector share dropped to 60.5 percent. Among females, in 1994, 48.5 percent were in the private sector and 51.5 percent were in the public sector, and in 2000, the private-sector share rose to 52.2 percent and the public-sector share dropped to 47.8 percent. Regional differences are striking. In both census years, Northern Namoneas, being the main center of Chuuk State, had most of the jobs and the smallest differential between the private and public sectors. For instance, in 1994 among all types of jobs in Northern Namoneas, 49.3 percent were in the private sector and 50.7 percent were in the public sector. In 2000, comparative percentages were 52.8 percent and 47.2 percent, respectively. The largest differential between private and public sectors were in the outer islands. For instance, in 1994 among all types of jobs in Mortlocks, 12.9 percent were in the private sector and 87.1 percent were in the public sector. In 2000, 23.5 percent were in the private sector and 76.5 percent were in the public sector in Oksoritod. The trends between regions and within the sectors were similar for males and females.
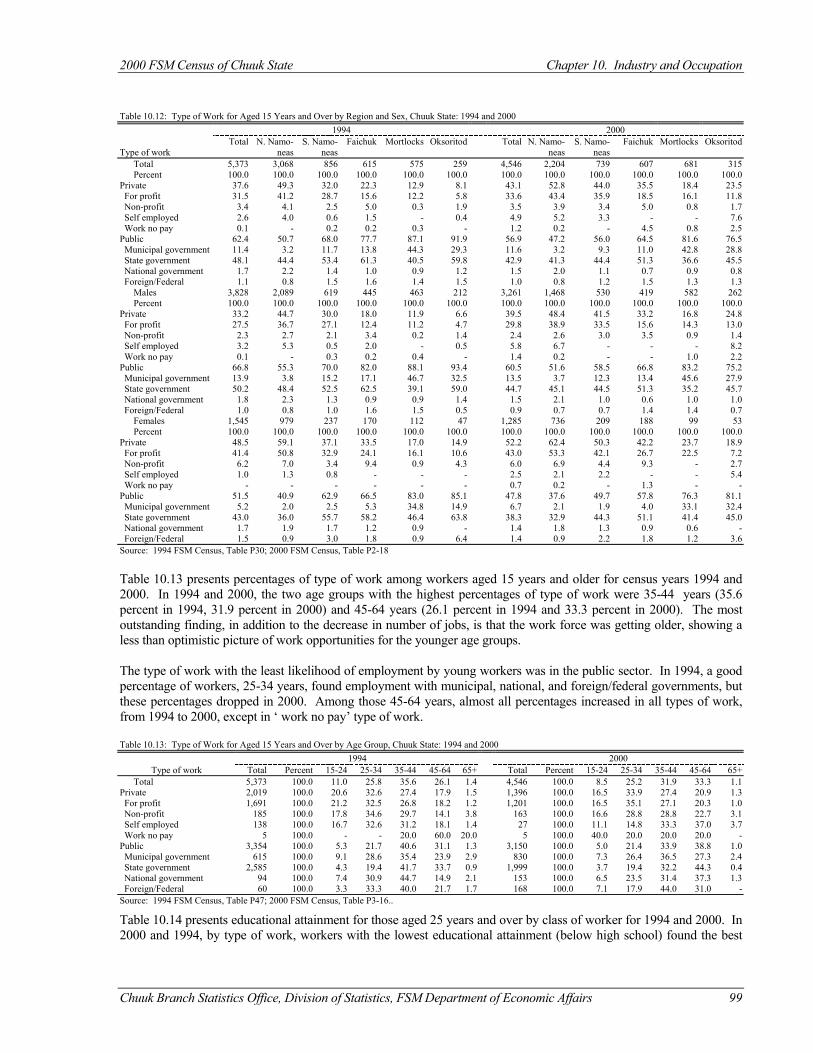
2000 FSM Census of Chuuk State Chapter 10. Industry and Occupation
Chuuk Branch Statistics Office, Division of Statistics, FSM Department of Economic Affairs 99
Table 10.12: Type of Work for Aged 15 Years and Over by Region and Sex, Chuuk State: 1994 and 2000 1994 2000
Type of work
Total N. Namo-neas
S. Namo-neas
Faichuk Mortlocks Oksoritod Total N. Namo-neas
S. Namo-neas
Faichuk Mortlocks Oksoritod
Total 5,373 3,068 856 615 575 259 4,546 2,204 739 607 681 315 Percent 100.0 100.0 100.0 100.0 100.0 100.0 100.0 100.0 100.0 100.0 100.0 100.0 Private 37.6 49.3 32.0 22.3 12.9 8.1 43.1 52.8 44.0 35.5 18.4 23.5 For profit 31.5 41.2 28.7 15.6 12.2 5.8 33.6 43.4 35.9 18.5 16.1 11.8 Non-profit 3.4 4.1 2.5 5.0 0.3 1.9 3.5 3.9 3.4 5.0 0.8 1.7 Self employed 2.6 4.0 0.6 1.5 - 0.4 4.9 5.2 3.3 - - 7.6 Work no pay 0.1 - 0.2 0.2 0.3 - 1.2 0.2 - 4.5 0.8 2.5 Public 62.4 50.7 68.0 77.7 87.1 91.9 56.9 47.2 56.0 64.5 81.6 76.5 Municipal government 11.4 3.2 11.7 13.8 44.3 29.3 11.6 3.2 9.3 11.0 42.8 28.8 State government 48.1 44.4 53.4 61.3 40.5 59.8 42.9 41.3 44.4 51.3 36.6 45.5 National government 1.7 2.2 1.4 1.0 0.9 1.2 1.5 2.0 1.1 0.7 0.9 0.8 Foreign/Federal 1.1 0.8 1.5 1.6 1.4 1.5 1.0 0.8 1.2 1.5 1.3 1.3 Males 3,828 2,089 619 445 463 212 3,261 1,468 530 419 582 262 Percent 100.0 100.0 100.0 100.0 100.0 100.0 100.0 100.0 100.0 100.0 100.0 100.0 Private 33.2 44.7 30.0 18.0 11.9 6.6 39.5 48.4 41.5 33.2 16.8 24.8 For profit 27.5 36.7 27.1 12.4 11.2 4.7 29.8 38.9 33.5 15.6 14.3 13.0 Non-profit 2.3 2.7 2.1 3.4 0.2 1.4 2.4 2.6 3.0 3.5 0.9 1.4 Self employed 3.2 5.3 0.5 2.0 - 0.5 5.8 6.7 - - - 8.2 Work no pay 0.1 - 0.3 0.2 0.4 - 1.4 0.2 - - 1.0 2.2 Public 66.8 55.3 70.0 82.0 88.1 93.4 60.5 51.6 58.5 66.8 83.2 75.2 Municipal government 13.9 3.8 15.2 17.1 46.7 32.5 13.5 3.7 12.3 13.4 45.6 27.9 State government 50.2 48.4 52.5 62.5 39.1 59.0 44.7 45.1 44.5 51.3 35.2 45.7 National government 1.8 2.3 1.3 0.9 0.9 1.4 1.5 2.1 1.0 0.6 1.0 1.0 Foreign/Federal 1.0 0.8 1.0 1.6 1.5 0.5 0.9 0.7 0.7 1.4 1.4 0.7 Females 1,545 979 237 170 112 47 1,285 736 209 188 99 53 Percent 100.0 100.0 100.0 100.0 100.0 100.0 100.0 100.0 100.0 100.0 100.0 100.0 Private 48.5 59.1 37.1 33.5 17.0 14.9 52.2 62.4 50.3 42.2 23.7 18.9 For profit 41.4 50.8 32.9 24.1 16.1 10.6 43.0 53.3 42.1 26.7 22.5 7.2 Non-profit 6.2 7.0 3.4 9.4 0.9 4.3 6.0 6.9 4.4 9.3 - 2.7 Self employed 1.0 1.3 0.8 - - - 2.5 2.1 2.2 - - 5.4 Work no pay - - - - - - 0.7 0.2 - 1.3 - - Public 51.5 40.9 62.9 66.5 83.0 85.1 47.8 37.6 49.7 57.8 76.3 81.1 Municipal government 5.2 2.0 2.5 5.3 34.8 14.9 6.7 2.1 1.9 4.0 33.1 32.4 State government 43.0 36.0 55.7 58.2 46.4 63.8 38.3 32.9 44.3 51.1 41.4 45.0 National government 1.7 1.9 1.7 1.2 0.9 - 1.4 1.8 1.3 0.9 0.6 - Foreign/Federal 1.5 0.9 3.0 1.8 0.9 6.4 1.4 0.9 2.2 1.8 1.2 3.6 Source: 1994 FSM Census, Table P30; 2000 FSM Census, Table P2-18 Table 10.13 presents percentages of type of work among workers aged 15 years and older for census years 1994 and 2000. In 1994 and 2000, the two age groups with the highest percentages of type of work were 35-44 years (35.6 percent in 1994, 31.9 percent in 2000) and 45-64 years (26.1 percent in 1994 and 33.3 percent in 2000). The most outstanding finding, in addition to the decrease in number of jobs, is that the work force was getting older, showing a less than optimistic picture of work opportunities for the younger age groups. The type of work with the least likelihood of employment by young workers was in the public sector. In 1994, a good percentage of workers, 25-34 years, found employment with municipal, national, and foreign/federal governments, but these percentages dropped in 2000. Among those 45-64 years, almost all percentages increased in all types of work, from 1994 to 2000, except in ‘ work no pay’ type of work. Table 10.13: Type of Work for Aged 15 Years and Over by Age Group, Chuuk State: 1994 and 2000 1994 2000
Type of work Total Percent 15-24 25-34 35-44 45-64 65+ Total Percent 15-24 25-34 35-44 45-64 65+ Total 5,373 100.0 11.0 25.8 35.6 26.1 1.4 4,546 100.0 8.5 25.2 31.9 33.3 1.1 Private 2,019 100.0 20.6 32.6 27.4 17.9 1.5 1,396 100.0 16.5 33.9 27.4 20.9 1.3 For profit 1,691 100.0 21.2 32.5 26.8 18.2 1.2 1,201 100.0 16.5 35.1 27.1 20.3 1.0 Non-profit 185 100.0 17.8 34.6 29.7 14.1 3.8 163 100.0 16.6 28.8 28.8 22.7 3.1 Self employed 138 100.0 16.7 32.6 31.2 18.1 1.4 27 100.0 11.1 14.8 33.3 37.0 3.7 Work no pay 5 100.0 - - 20.0 60.0 20.0 5 100.0 40.0 20.0 20.0 20.0 - Public 3,354 100.0 5.3 21.7 40.6 31.1 1.3 3,150 100.0 5.0 21.4 33.9 38.8 1.0 Municipal government 615 100.0 9.1 28.6 35.4 23.9 2.9 830 100.0 7.3 26.4 36.5 27.3 2.4 State government 2,585 100.0 4.3 19.4 41.7 33.7 0.9 1,999 100.0 3.7 19.4 32.2 44.3 0.4 National government 94 100.0 7.4 30.9 44.7 14.9 2.1 153 100.0 6.5 23.5 31.4 37.3 1.3 Foreign/Federal 60 100.0 3.3 33.3 40.0 21.7 1.7 168 100.0 7.1 17.9 44.0 31.0 - Source: 1994 FSM Census, Table P47; 2000 FSM Census, Table P3-16..
Table 10.14 presents educational attainment for those aged 25 years and over by class of worker for 1994 and 2000. In 2000 and 1994, by type of work, workers with the lowest educational attainment (below high school) found the best
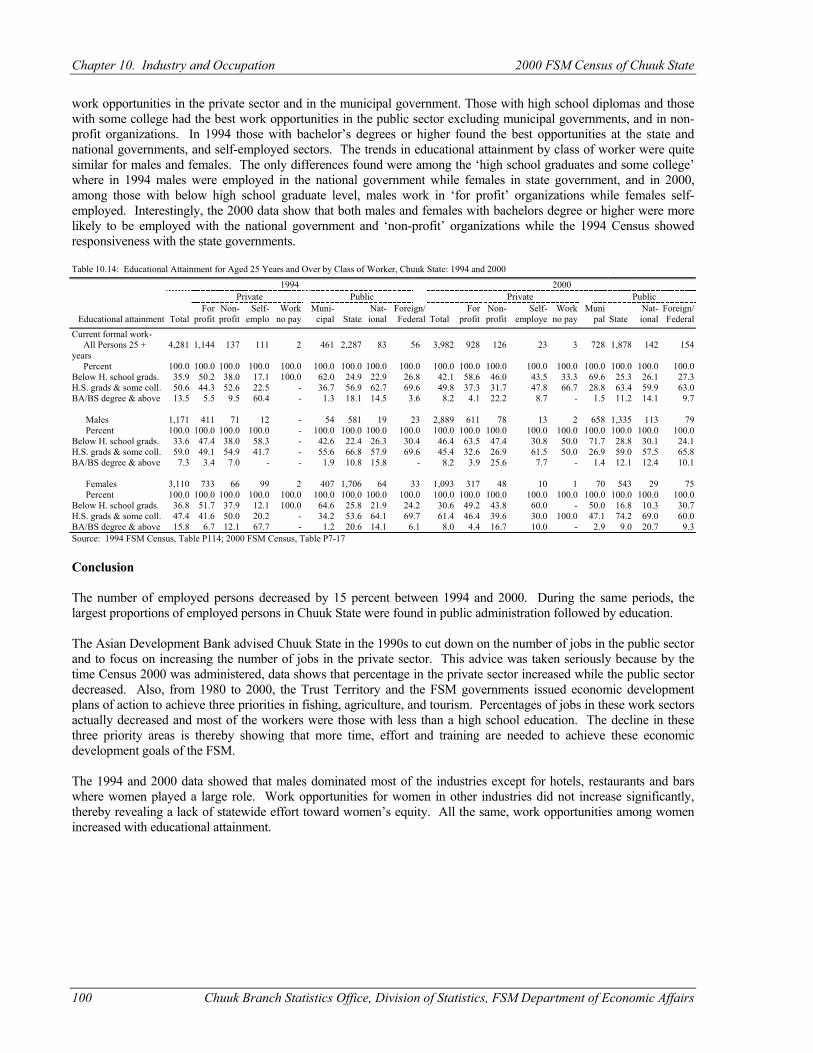
Chapter 10. Industry and Occupation 2000 FSM Census of Chuuk State
100 Chuuk Branch Statistics Office, Division of Statistics, FSM Department of Economic Affairs
work opportunities in the private sector and in the municipal government. Those with high school diplomas and those with some college had the best work opportunities in the public sector excluding municipal governments, and in non-profit organizations. In 1994 those with bachelor’s degrees or higher found the best opportunities at the state and national governments, and self-employed sectors. The trends in educational attainment by class of worker were quite similar for males and females. The only differences found were among the ‘high school graduates and some college’ where in 1994 males were employed in the national government while females in state government, and in 2000, among those with below high school graduate level, males work in ‘for profit’ organizations while females self-employed. Interestingly, the 2000 data show that both males and females with bachelors degree or higher were more likely to be employed with the national government and ‘non-profit’ organizations while the 1994 Census showed responsiveness with the state governments. Table 10.14: Educational Attainment for Aged 25 Years and Over by Class of Worker, Chuuk State: 1994 and 2000
1994 2000 Private Public Private Public
Educational attainment
Total
For profit
Non- profit
Self- emplo
Work no pay
Muni- cipal
State
Nat- ional
Foreign/ Federal
Total
For profit
Non- profit
Self- employe
Work no pay
Muni pal
State
Nat- ional
Foreign/ Federal
Current formal work- All Persons 25 + years
4,281 1,144 137 111 2 461 2,287 83 56 3,982 928 126 23 3 728 1,878 142 154
Percent 100.0 100.0 100.0 100.0 100.0 100.0 100.0 100.0 100.0 100.0 100.0 100.0 100.0 100.0 100.0 100.0 100.0 100.0 Below H. school grads. 35.9 50.2 38.0 17.1 100.0 62.0 24.9 22.9 26.8 42.1 58.6 46.0 43.5 33.3 69.6 25.3 26.1 27.3 H.S. grads & some coll. 50.6 44.3 52.6 22.5 - 36.7 56.9 62.7 69.6 49.8 37.3 31.7 47.8 66.7 28.8 63.4 59.9 63.0 BA/BS degree & above 13.5 5.5 9.5 60.4 - 1.3 18.1 14.5 3.6 8.2 4.1 22.2 8.7 - 1.5 11.2 14.1 9.7 Males 1,171 411 71 12 - 54 581 19 23 2,889 611 78 13 2 658 1,335 113 79 Percent 100.0 100.0 100.0 100.0 - 100.0 100.0 100.0 100.0 100.0 100.0 100.0 100.0 100.0 100.0 100.0 100.0 100.0 Below H. school grads. 33.6 47.4 38.0 58.3 - 42.6 22.4 26.3 30.4 46.4 63.5 47.4 30.8 50.0 71.7 28.8 30.1 24.1 H.S. grads & some coll. 59.0 49.1 54.9 41.7 - 55.6 66.8 57.9 69.6 45.4 32.6 26.9 61.5 50.0 26.9 59.0 57.5 65.8 BA/BS degree & above 7.3 3.4 7.0 - - 1.9 10.8 15.8 - 8.2 3.9 25.6 7.7 - 1.4 12.1 12.4 10.1 Females 3,110 733 66 99 2 407 1,706 64 33 1,093 317 48 10 1 70 543 29 75 Percent 100.0 100.0 100.0 100.0 100.0 100.0 100.0 100.0 100.0 100.0 100.0 100.0 100.0 100.0 100.0 100.0 100.0 100.0 Below H. school grads. 36.8 51.7 37.9 12.1 100.0 64.6 25.8 21.9 24.2 30.6 49.2 43.8 60.0 - 50.0 16.8 10.3 30.7 H.S. grads & some coll. 47.4 41.6 50.0 20.2 - 34.2 53.6 64.1 69.7 61.4 46.4 39.6 30.0 100.0 47.1 74.2 69.0 60.0 BA/BS degree & above 15.8 6.7 12.1 67.7 - 1.2 20.6 14.1 6.1 8.0 4.4 16.7 10.0 - 2.9 9.0 20.7 9.3 Source: 1994 FSM Census, Table P114; 2000 FSM Census, Table P7-17 Conclusion The number of employed persons decreased by 15 percent between 1994 and 2000. During the same periods, the largest proportions of employed persons in Chuuk State were found in public administration followed by education. The Asian Development Bank advised Chuuk State in the 1990s to cut down on the number of jobs in the public sector and to focus on increasing the number of jobs in the private sector. This advice was taken seriously because by the time Census 2000 was administered, data shows that percentage in the private sector increased while the public sector decreased. Also, from 1980 to 2000, the Trust Territory and the FSM governments issued economic development plans of action to achieve three priorities in fishing, agriculture, and tourism. Percentages of jobs in these work sectors actually decreased and most of the workers were those with less than a high school education. The decline in these three priority areas is thereby showing that more time, effort and training are needed to achieve these economic development goals of the FSM. The 1994 and 2000 data showed that males dominated most of the industries except for hotels, restaurants and bars where women played a large role. Work opportunities for women in other industries did not increase significantly, thereby revealing a lack of statewide effort toward women’s equity. All the same, work opportunities among women increased with educational attainment.
Chuuk Branch Statistics Office, Division of Statistics, FSM Department of Economic Affairs 101
CHAPTER 11 INCOME
Introduction The 2000 FSM Census asked for cash income earned in 1999 from all persons 15 years and older. Income provides a measure of how well cash resources are distributed within the country as well as an insight into the sources of cash in Chuuk. Cash income is the amount of money received during a fixed period of time. For the 2000 FSM Census, the time period referred to be calendar year 1999. Income includes wages or salaries, cash income from farm or non-farm businesses, interest and dividends or net rentals, estates or trusts, social security or retirement, and remittances. The census collected income for households, families and by individual. Household income included all cash income earned by each member living in a housing unit who was aged 15 years and over. Family income included the cash income from those members of a household with two or more related members. Individual income is based on what an individual earned during 1999. Household and family income did not include those people enumerated in group quarters on census day. However, individual income did include those people in group quarters. About 60 percent of the population aged 15 years and over reported receiving cash income in 1999. The person with a 19,090 income was a small portion of the 31,587 persons in the working age population. The only persons used in the measures of income were those who reported an income for 1999. Thus measures of income were considered only for those persons who received money through salaries, wages, social security or other sources. Fully 68 percent of the population 15 years and over reported no income. Definitions Wage or salary income is the total amount of money earned by a person working as an employee for a private enterprise (business or farm) or a branch of government. Wage or salary income includes take-home pay plus all deductions for withholding tax, social security, union dues, bonds, uniforms, and others. Also included are piece-rate payments, commissions, tips, bonuses, and sick leave pay. Own business income includes money receipts as well as business expenses. Interests and dividends are money earned from savings or shares. Social security and government benefits include payments from retirement, or disability payments. Remittances include money received from relatives within and outside of the FSM who are not living with the individual. Two statistics were used to analyze income: median and mean. The median income is that income value that divides income recipients into two equal halves. The mean income is the sum of all income in a region or characteristic divided by the number of income recipients. (Similarly, the aggregate of all incomes in a region can be found by multiplying the mean by the number of persons earning income.) The median is a better estimate of average income because it places less emphasis on extreme values and is less susceptible to the effects of misreporting and processing errors. In this chapter both median and mean are used in most tables. Limitations and Comparability. Income is a self-reported number and is easily misreported due to income inflation or deflation or to poor recollection. In the case of the FSM 1994 Census, the income was received at least 9 months prior to the time of reporting, making it easier to forget small or irregular income. Other errors occurred because of misunderstandings such as reporting net rather than gross earnings. The 1980 TTPI census collected similar information on income and these data are used here with an inflation factor to compare against the 2000 Census data. Furthermore, the data collected during 1980, 1994 and 2000 Censuses refer to cash income only. Income data may not fully explain the economy in Chuuk because of the significant share of subsistence activities in the economy. It does, however, give an indication of Chuuk population’s access to material possessions and changes in the cash economy.
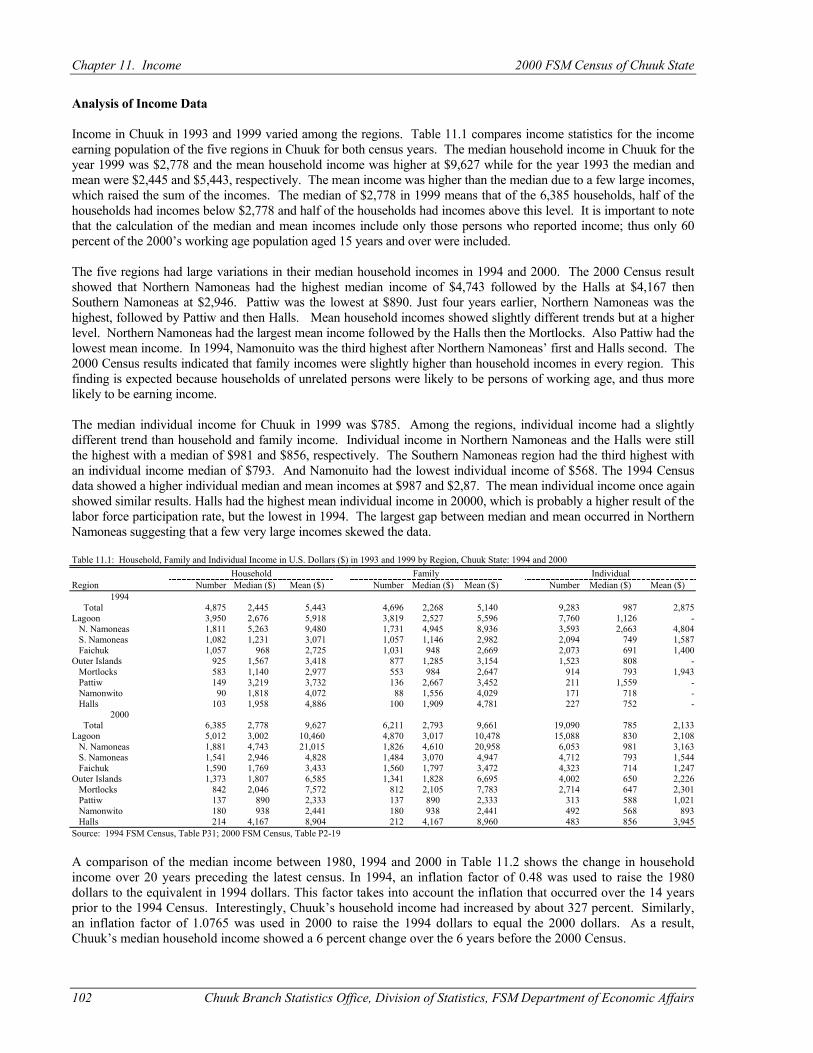
Chapter 11. Income 2000 FSM Census of Chuuk State
102 Chuuk Branch Statistics Office, Division of Statistics, FSM Department of Economic Affairs
Analysis of Income Data Income in Chuuk in 1993 and 1999 varied among the regions. Table 11.1 compares income statistics for the income earning population of the five regions in Chuuk for both census years. The median household income in Chuuk for the year 1999 was $2,778 and the mean household income was higher at $9,627 while for the year 1993 the median and mean were $2,445 and $5,443, respectively. The mean income was higher than the median due to a few large incomes, which raised the sum of the incomes. The median of $2,778 in 1999 means that of the 6,385 households, half of the households had incomes below $2,778 and half of the households had incomes above this level. It is important to note that the calculation of the median and mean incomes include only those persons who reported income; thus only 60 percent of the 2000’s working age population aged 15 years and over were included. The five regions had large variations in their median household incomes in 1994 and 2000. The 2000 Census result showed that Northern Namoneas had the highest median income of $4,743 followed by the Halls at $4,167 then Southern Namoneas at $2,946. Pattiw was the lowest at $890. Just four years earlier, Northern Namoneas was the highest, followed by Pattiw and then Halls. Mean household incomes showed slightly different trends but at a higher level. Northern Namoneas had the largest mean income followed by the Halls then the Mortlocks. Also Pattiw had the lowest mean income. In 1994, Namonuito was the third highest after Northern Namoneas’ first and Halls second. The 2000 Census results indicated that family incomes were slightly higher than household incomes in every region. This finding is expected because households of unrelated persons were likely to be persons of working age, and thus more likely to be earning income. The median individual income for Chuuk in 1999 was $785. Among the regions, individual income had a slightly different trend than household and family income. Individual income in Northern Namoneas and the Halls were still the highest with a median of $981 and $856, respectively. The Southern Namoneas region had the third highest with an individual income median of $793. And Namonuito had the lowest individual income of $568. The 1994 Census data showed a higher individual median and mean incomes at $987 and $2,87. The mean individual income once again showed similar results. Halls had the highest mean individual income in 20000, which is probably a higher result of the labor force participation rate, but the lowest in 1994. The largest gap between median and mean occurred in Northern Namoneas suggesting that a few very large incomes skewed the data. Table 11.1: Household, Family and Individual Income in U.S. Dollars ($) in 1993 and 1999 by Region, Chuuk State: 1994 and 2000
Household Family Individual Region Number Median ($) Mean ($) Number Median ($) Mean ($) Number Median ($) Mean ($)
1994 Total 4,875 2,445 5,443 4,696 2,268 5,140 9,283 987 2,875 Lagoon 3,950 2,676 5,918 3,819 2,527 5,596 7,760 1,126 - N. Namoneas 1,811 5,263 9,480 1,731 4,945 8,936 3,593 2,663 4,804 S. Namoneas 1,082 1,231 3,071 1,057 1,146 2,982 2,094 749 1,587 Faichuk 1,057 968 2,725 1,031 948 2,669 2,073 691 1,400 Outer Islands 925 1,567 3,418 877 1,285 3,154 1,523 808 - Mortlocks 583 1,140 2,977 553 984 2,647 914 793 1,943 Pattiw 149 3,219 3,732 136 2,667 3,452 211 1,559 - Namonwito 90 1,818 4,072 88 1,556 4,029 171 718 - Halls 103 1,958 4,886 100 1,909 4,781 227 752 -
2000 Total 6,385 2,778 9,627 6,211 2,793 9,661 19,090 785 2,133 Lagoon 5,012 3,002 10,460 4,870 3,017 10,478 15,088 830 2,108 N. Namoneas 1,881 4,743 21,015 1,826 4,610 20,958 6,053 981 3,163 S. Namoneas 1,541 2,946 4,828 1,484 3,070 4,947 4,712 793 1,544 Faichuk 1,590 1,769 3,433 1,560 1,797 3,472 4,323 714 1,247 Outer Islands 1,373 1,807 6,585 1,341 1,828 6,695 4,002 650 2,226 Mortlocks 842 2,046 7,572 812 2,105 7,783 2,714 647 2,301 Pattiw 137 890 2,333 137 890 2,333 313 588 1,021 Namonwito 180 938 2,441 180 938 2,441 492 568 893 Halls 214 4,167 8,904 212 4,167 8,960 483 856 3,945 Source: 1994 FSM Census, Table P31; 2000 FSM Census, Table P2-19 A comparison of the median income between 1980, 1994 and 2000 in Table 11.2 shows the change in household income over 20 years preceding the latest census. In 1994, an inflation factor of 0.48 was used to raise the 1980 dollars to the equivalent in 1994 dollars. This factor takes into account the inflation that occurred over the 14 years prior to the 1994 Census. Interestingly, Chuuk’s household income had increased by about 327 percent. Similarly, an inflation factor of 1.0765 was used in 2000 to raise the 1994 dollars to equal the 2000 dollars. As a result, Chuuk’s median household income showed a 6 percent change over the 6 years before the 2000 Census.
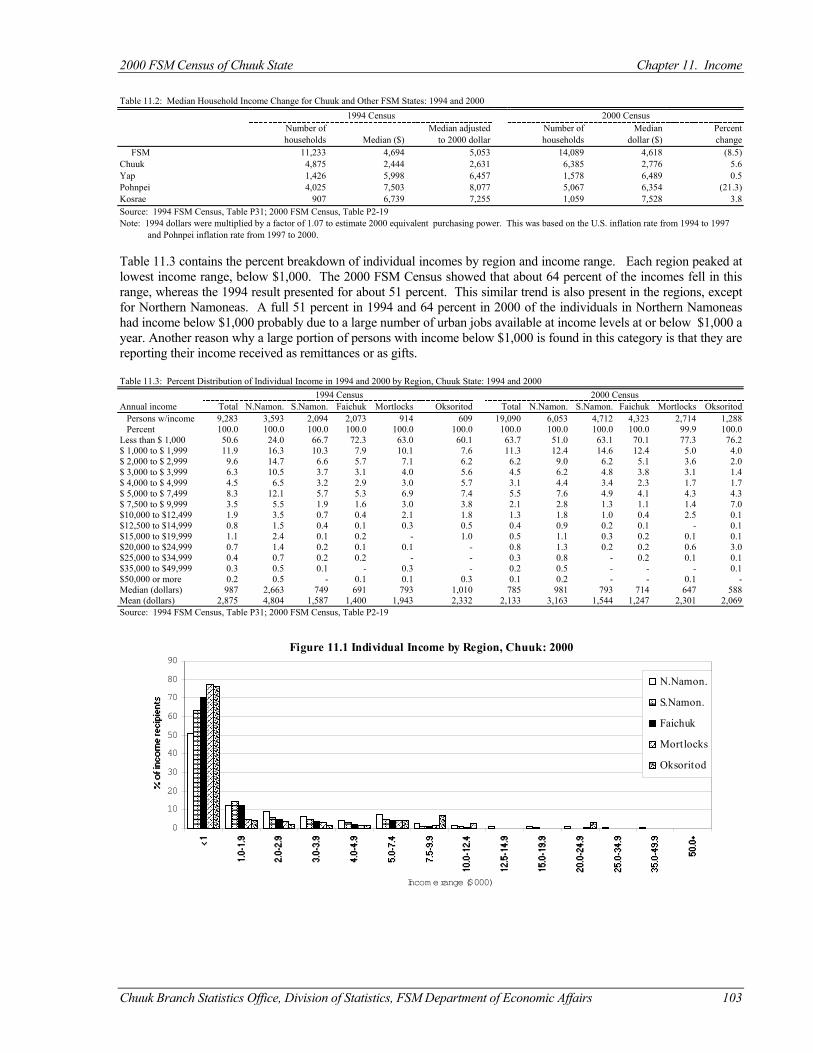
2000 FSM Census of Chuuk State Chapter 11. Income
Chuuk Branch Statistics Office, Division of Statistics, FSM Department of Economic Affairs 103
Table 11.2: Median Household Income Change for Chuuk and Other FSM States: 1994 and 2000
1994 Census 2000 Census Number of Median adjusted Number of Median Percent households Median ($) to 2000 dollar households dollar ($) change
FSM 11,233 4,694 5,053 14,089 4,618 (8.5) Chuuk 4,875 2,444 2,631 6,385 2,776 5.6 Yap 1,426 5,998 6,457 1,578 6,489 0.5 Pohnpei 4,025 7,503 8,077 5,067 6,354 (21.3) Kosrae 907 6,739 7,255 1,059 7,528 3.8 Source: 1994 FSM Census, Table P31; 2000 FSM Census, Table P2-19 Note: 1994 dollars were multiplied by a factor of 1.07 to estimate 2000 equivalent purchasing power. This was based on the U.S. inflation rate from 1994 to 1997 and Pohnpei inflation rate from 1997 to 2000. Table 11.3 contains the percent breakdown of individual incomes by region and income range. Each region peaked at lowest income range, below $1,000. The 2000 FSM Census showed that about 64 percent of the incomes fell in this range, whereas the 1994 result presented for about 51 percent. This similar trend is also present in the regions, except for Northern Namoneas. A full 51 percent in 1994 and 64 percent in 2000 of the individuals in Northern Namoneas had income below $1,000 probably due to a large number of urban jobs available at income levels at or below $1,000 a year. Another reason why a large portion of persons with income below $1,000 is found in this category is that they are reporting their income received as remittances or as gifts. Table 11.3: Percent Distribution of Individual Income in 1994 and 2000 by Region, Chuuk State: 1994 and 2000
1994 Census 2000 Census Annual income Total N.Namon. S.Namon. Faichuk Mortlocks Oksoritod Total N.Namon. S.Namon. Faichuk Mortlocks Oksoritod Persons w/income 9,283 3,593 2,094 2,073 914 609 19,090 6,053 4,712 4,323 2,714 1,288 Percent 100.0 100.0 100.0 100.0 100.0 100.0 100.0 100.0 100.0 100.0 99.9 100.0 Less than $ 1,000 50.6 24.0 66.7 72.3 63.0 60.1 63.7 51.0 63.1 70.1 77.3 76.2 $ 1,000 to $ 1,999 11.9 16.3 10.3 7.9 10.1 7.6 11.3 12.4 14.6 12.4 5.0 4.0 $ 2,000 to $ 2,999 9.6 14.7 6.6 5.7 7.1 6.2 6.2 9.0 6.2 5.1 3.6 2.0 $ 3,000 to $ 3,999 6.3 10.5 3.7 3.1 4.0 5.6 4.5 6.2 4.8 3.8 3.1 1.4 $ 4,000 to $ 4,999 4.5 6.5 3.2 2.9 3.0 5.7 3.1 4.4 3.4 2.3 1.7 1.7 $ 5,000 to $ 7,499 8.3 12.1 5.7 5.3 6.9 7.4 5.5 7.6 4.9 4.1 4.3 4.3 $ 7,500 to $ 9,999 3.5 5.5 1.9 1.6 3.0 3.8 2.1 2.8 1.3 1.1 1.4 7.0 $10,000 to $12,499 1.9 3.5 0.7 0.4 2.1 1.8 1.3 1.8 1.0 0.4 2.5 0.1 $12,500 to $14,999 0.8 1.5 0.4 0.1 0.3 0.5 0.4 0.9 0.2 0.1 - 0.1 $15,000 to $19,999 1.1 2.4 0.1 0.2 - 1.0 0.5 1.1 0.3 0.2 0.1 0.1 $20,000 to $24,999 0.7 1.4 0.2 0.1 0.1 - 0.8 1.3 0.2 0.2 0.6 3.0 $25,000 to $34,999 0.4 0.7 0.2 0.2 - - 0.3 0.8 - 0.2 0.1 0.1 $35,000 to $49,999 0.3 0.5 0.1 - 0.3 - 0.2 0.5 - - - 0.1 $50,000 or more 0.2 0.5 - 0.1 0.1 0.3 0.1 0.2 - - 0.1 - Median (dollars) 987 2,663 749 691 793 1,010 785 981 793 714 647 588 Mean (dollars) 2,875 4,804 1,587 1,400 1,943 2,332 2,133 3,163 1,544 1,247 2,301 2,069 Source: 1994 FSM Census, Table P31; 2000 FSM Census, Table P2-19
������������������������������������
������������
������
������
��������
�������� ���� ��� ����
���������������������������������
��������
������
������ ����
�������� ���� ��� ����
����������������������������������������
������ ���� ���� ���
������
������
������
Figure 11.1 Individual Income by Region, Chuuk: 2000
0
10
20
30
40
50
60
70
80
90
Incom e range ($000)
N.Namon.������ S.Namon.
Faichuk������ Mortlocks��� Oksoritod
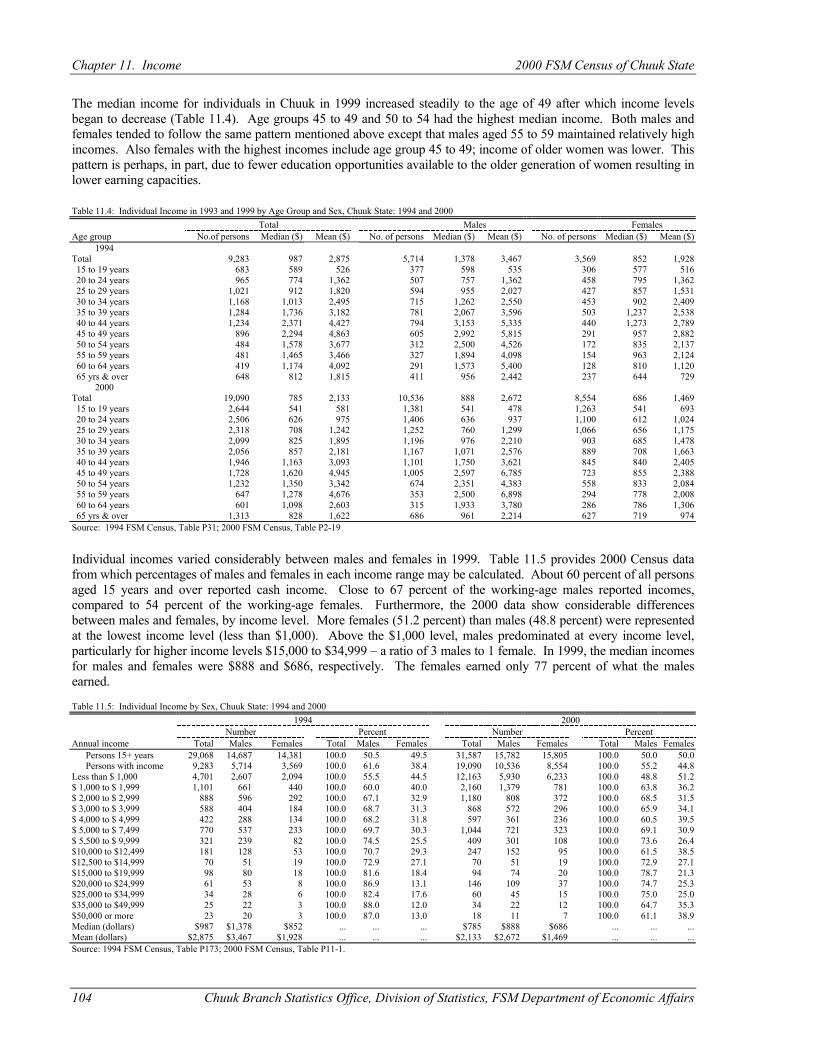
Chapter 11. Income 2000 FSM Census of Chuuk State
104 Chuuk Branch Statistics Office, Division of Statistics, FSM Department of Economic Affairs
The median income for individuals in Chuuk in 1999 increased steadily to the age of 49 after which income levels began to decrease (Table 11.4). Age groups 45 to 49 and 50 to 54 had the highest median income. Both males and females tended to follow the same pattern mentioned above except that males aged 55 to 59 maintained relatively high incomes. Also females with the highest incomes include age group 45 to 49; income of older women was lower. This pattern is perhaps, in part, due to fewer education opportunities available to the older generation of women resulting in lower earning capacities. Table 11.4: Individual Income in 1993 and 1999 by Age Group and Sex, Chuuk State: 1994 and 2000 Total Males Females Age group No.of persons Median ($) Mean ($) No. of persons Median ($) Mean ($) No. of persons Median ($) Mean ($) 1994 Total 9,283 987 2,875 5,714 1,378 3,467 3,569 852 1,928 15 to 19 years 683 589 526 377 598 535 306 577 516 20 to 24 years 965 774 1,362 507 757 1,362 458 795 1,362 25 to 29 years 1,021 912 1,820 594 955 2,027 427 857 1,531 30 to 34 years 1,168 1,013 2,495 715 1,262 2,550 453 902 2,409 35 to 39 years 1,284 1,736 3,182 781 2,067 3,596 503 1,237 2,538 40 to 44 years 1,234 2,371 4,427 794 3,153 5,335 440 1,273 2,789 45 to 49 years 896 2,294 4,863 605 2,992 5,815 291 957 2,882 50 to 54 years 484 1,578 3,677 312 2,500 4,526 172 835 2,137 55 to 59 years 481 1,465 3,466 327 1,894 4,098 154 963 2,124 60 to 64 years 419 1,174 4,092 291 1,573 5,400 128 810 1,120 65 yrs & over 648 812 1,815 411 956 2,442 237 644 729 2000 Total 19,090 785 2,133 10,536 888 2,672 8,554 686 1,469 15 to 19 years 2,644 541 581 1,381 541 478 1,263 541 693 20 to 24 years 2,506 626 975 1,406 636 937 1,100 612 1,024 25 to 29 years 2,318 708 1,242 1,252 760 1,299 1,066 656 1,175 30 to 34 years 2,099 825 1,895 1,196 976 2,210 903 685 1,478 35 to 39 years 2,056 857 2,181 1,167 1,071 2,576 889 708 1,663 40 to 44 years 1,946 1,163 3,093 1,101 1,750 3,621 845 840 2,405 45 to 49 years 1,728 1,620 4,945 1,005 2,597 6,785 723 855 2,388 50 to 54 years 1,232 1,350 3,342 674 2,351 4,383 558 833 2,084 55 to 59 years 647 1,278 4,676 353 2,500 6,898 294 778 2,008 60 to 64 years 601 1,098 2,603 315 1,933 3,780 286 786 1,306 65 yrs & over 1,313 828 1,622 686 961 2,214 627 719 974 Source: 1994 FSM Census, Table P31; 2000 FSM Census, Table P2-19
Individual incomes varied considerably between males and females in 1999. Table 11.5 provides 2000 Census data from which percentages of males and females in each income range may be calculated. About 60 percent of all persons aged 15 years and over reported cash income. Close to 67 percent of the working-age males reported incomes, compared to 54 percent of the working-age females. Furthermore, the 2000 data show considerable differences between males and females, by income level. More females (51.2 percent) than males (48.8 percent) were represented at the lowest income level (less than $1,000). Above the $1,000 level, males predominated at every income level, particularly for higher income levels $15,000 to $34,999 – a ratio of 3 males to 1 female. In 1999, the median incomes for males and females were $888 and $686, respectively. The females earned only 77 percent of what the males earned. Table 11.5: Individual Income by Sex, Chuuk State: 1994 and 2000
1994 2000 Number Percent Number Percent
Annual income Total Males Females Total Males Females Total Males Females Total Males Females Persons 15+ years 29,068 14,687 14,381 100.0 50.5 49.5 31,587 15,782 15,805 100.0 50.0 50.0 Persons with income 9,283 5,714 3,569 100.0 61.6 38.4 19,090 10,536 8,554 100.0 55.2 44.8 Less than $ 1,000 4,701 2,607 2,094 100.0 55.5 44.5 12,163 5,930 6,233 100.0 48.8 51.2 $ 1,000 to $ 1,999 1,101 661 440 100.0 60.0 40.0 2,160 1,379 781 100.0 63.8 36.2 $ 2,000 to $ 2,999 888 596 292 100.0 67.1 32.9 1,180 808 372 100.0 68.5 31.5 $ 3,000 to $ 3,999 588 404 184 100.0 68.7 31.3 868 572 296 100.0 65.9 34.1 $ 4,000 to $ 4,999 422 288 134 100.0 68.2 31.8 597 361 236 100.0 60.5 39.5 $ 5,000 to $ 7,499 770 537 233 100.0 69.7 30.3 1,044 721 323 100.0 69.1 30.9 $ 5,500 to $ 9,999 321 239 82 100.0 74.5 25.5 409 301 108 100.0 73.6 26.4 $10,000 to $12,499 181 128 53 100.0 70.7 29.3 247 152 95 100.0 61.5 38.5 $12,500 to $14,999 70 51 19 100.0 72.9 27.1 70 51 19 100.0 72.9 27.1 $15,000 to $19,999 98 80 18 100.0 81.6 18.4 94 74 20 100.0 78.7 21.3 $20,000 to $24,999 61 53 8 100.0 86.9 13.1 146 109 37 100.0 74.7 25.3 $25,000 to $34,999 34 28 6 100.0 82.4 17.6 60 45 15 100.0 75.0 25.0 $35,000 to $49,999 25 22 3 100.0 88.0 12.0 34 22 12 100.0 64.7 35.3 $50,000 or more 23 20 3 100.0 87.0 13.0 18 11 7 100.0 61.1 38.9 Median (dollars) $987 $1,378 $852 ... ... ... $785 $888 $686 ... ... ... Mean (dollars) $2,875 $3,467 $1,928 ... ... ... $2,133 $2,672 $1,469 ... ... ... Source: 1994 FSM Census, Table P173; 2000 FSM Census, Table P11-1.
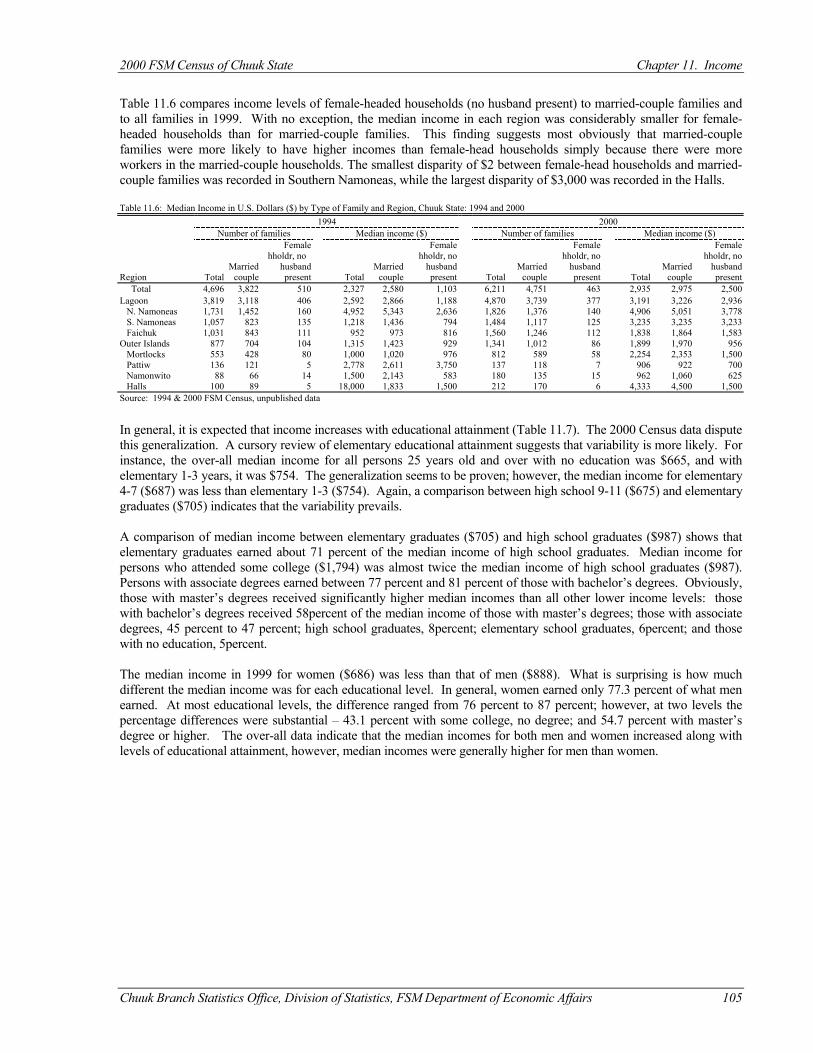
2000 FSM Census of Chuuk State Chapter 11. Income
Chuuk Branch Statistics Office, Division of Statistics, FSM Department of Economic Affairs 105
Table 11.6 compares income levels of female-headed households (no husband present) to married-couple families and to all families in 1999. With no exception, the median income in each region was considerably smaller for female-headed households than for married-couple families. This finding suggests most obviously that married-couple families were more likely to have higher incomes than female-head households simply because there were more workers in the married-couple households. The smallest disparity of $2 between female-head households and married-couple families was recorded in Southern Namoneas, while the largest disparity of $3,000 was recorded in the Halls. Table 11.6: Median Income in U.S. Dollars ($) by Type of Family and Region, Chuuk State: 1994 and 2000
1994 2000 Number of families Median income ($) Number of families Median income ($) Female Female Female Female hholdr, no hholdr, no hholdr, no hholdr, no Married husband Married husband Married husband Married husband
Region Total couple present Total couple present Total couple present Total couple present Total 4,696 3,822 510 2,327 2,580 1,103 6,211 4,751 463 2,935 2,975 2,500 Lagoon 3,819 3,118 406 2,592 2,866 1,188 4,870 3,739 377 3,191 3,226 2,936 N. Namoneas 1,731 1,452 160 4,952 5,343 2,636 1,826 1,376 140 4,906 5,051 3,778 S. Namoneas 1,057 823 135 1,218 1,436 794 1,484 1,117 125 3,235 3,235 3,233 Faichuk 1,031 843 111 952 973 816 1,560 1,246 112 1,838 1,864 1,583 Outer Islands 877 704 104 1,315 1,423 929 1,341 1,012 86 1,899 1,970 956 Mortlocks 553 428 80 1,000 1,020 976 812 589 58 2,254 2,353 1,500 Pattiw 136 121 5 2,778 2,611 3,750 137 118 7 906 922 700 Namonwito 88 66 14 1,500 2,143 583 180 135 15 962 1,060 625 Halls 100 89 5 18,000 1,833 1,500 212 170 6 4,333 4,500 1,500 Source: 1994 & 2000 FSM Census, unpublished data
In general, it is expected that income increases with educational attainment (Table 11.7). The 2000 Census data dispute this generalization. A cursory review of elementary educational attainment suggests that variability is more likely. For instance, the over-all median income for all persons 25 years old and over with no education was $665, and with elementary 1-3 years, it was $754. The generalization seems to be proven; however, the median income for elementary 4-7 ($687) was less than elementary 1-3 ($754). Again, a comparison between high school 9-11 ($675) and elementary graduates ($705) indicates that the variability prevails. A comparison of median income between elementary graduates ($705) and high school graduates ($987) shows that elementary graduates earned about 71 percent of the median income of high school graduates. Median income for persons who attended some college ($1,794) was almost twice the median income of high school graduates ($987). Persons with associate degrees earned between 77 percent and 81 percent of those with bachelor’s degrees. Obviously, those with master’s degrees received significantly higher median incomes than all other lower income levels: those with bachelor’s degrees received 58percent of the median income of those with master’s degrees; those with associate degrees, 45 percent to 47 percent; high school graduates, 8percent; elementary school graduates, 6percent; and those with no education, 5percent. The median income in 1999 for women ($686) was less than that of men ($888). What is surprising is how much different the median income was for each educational level. In general, women earned only 77.3 percent of what men earned. At most educational levels, the difference ranged from 76 percent to 87 percent; however, at two levels the percentage differences were substantial – 43.1 percent with some college, no degree; and 54.7 percent with master’s degree or higher. The over-all data indicate that the median incomes for both men and women increased along with levels of educational attainment, however, median incomes were generally higher for men than women.
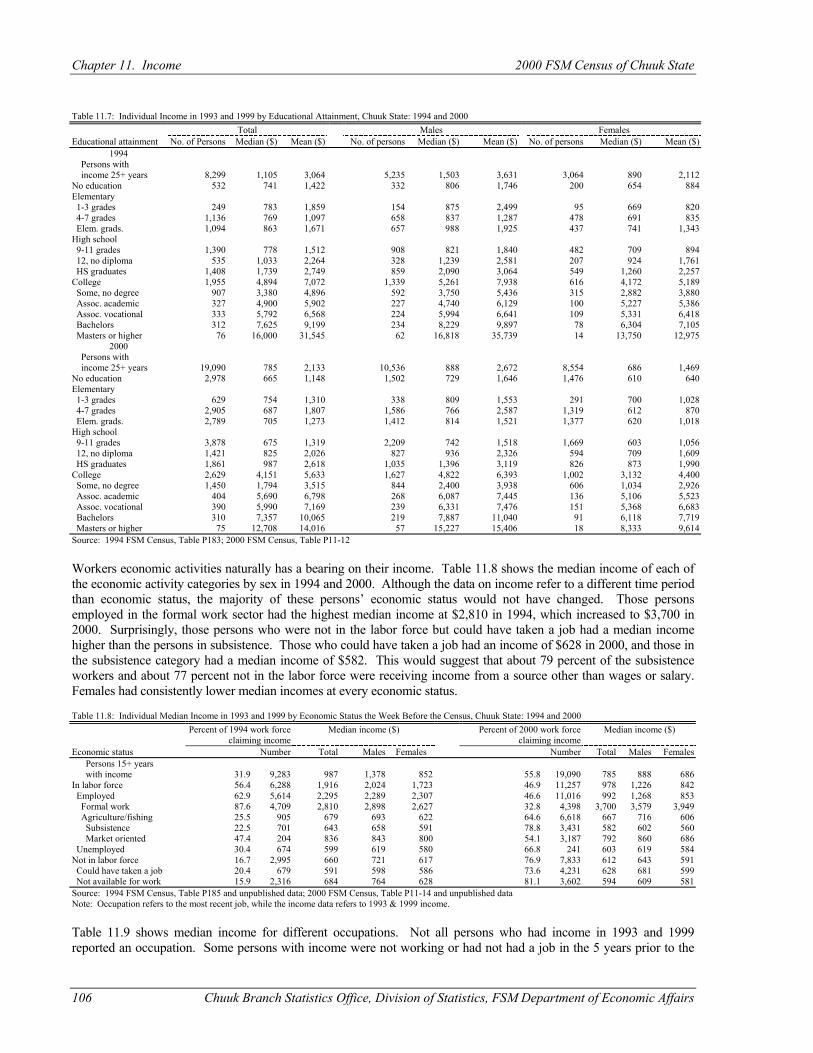
Chapter 11. Income 2000 FSM Census of Chuuk State
106 Chuuk Branch Statistics Office, Division of Statistics, FSM Department of Economic Affairs
Table 11.7: Individual Income in 1993 and 1999 by Educational Attainment, Chuuk State: 1994 and 2000 Total Males Females Educational attainment No. of Persons Median ($) Mean ($) No. of persons Median ($) Mean ($) No. of persons Median ($) Mean ($)
1994 Persons with income 25+ years 8,299 1,105 3,064 5,235 1,503 3,631 3,064 890 2,112 No education 532 741 1,422 332 806 1,746 200 654 884 Elementary 1-3 grades 249 783 1,859 154 875 2,499 95 669 820 4-7 grades 1,136 769 1,097 658 837 1,287 478 691 835 Elem. grads. 1,094 863 1,671 657 988 1,925 437 741 1,343 High school 9-11 grades 1,390 778 1,512 908 821 1,840 482 709 894 12, no diploma 535 1,033 2,264 328 1,239 2,581 207 924 1,761 HS graduates 1,408 1,739 2,749 859 2,090 3,064 549 1,260 2,257 College 1,955 4,894 7,072 1,339 5,261 7,938 616 4,172 5,189 Some, no degree 907 3,380 4,896 592 3,750 5,436 315 2,882 3,880 Assoc. academic 327 4,900 5,902 227 4,740 6,129 100 5,227 5,386 Assoc. vocational 333 5,792 6,568 224 5,994 6,641 109 5,331 6,418 Bachelors 312 7,625 9,199 234 8,229 9,897 78 6,304 7,105 Masters or higher 76 16,000 31,545 62 16,818 35,739 14 13,750 12,975
2000 Persons with income 25+ years 19,090 785 2,133 10,536 888 2,672 8,554 686 1,469 No education 2,978 665 1,148 1,502 729 1,646 1,476 610 640 Elementary 1-3 grades 629 754 1,310 338 809 1,553 291 700 1,028 4-7 grades 2,905 687 1,807 1,586 766 2,587 1,319 612 870 Elem. grads. 2,789 705 1,273 1,412 814 1,521 1,377 620 1,018 High school 9-11 grades 3,878 675 1,319 2,209 742 1,518 1,669 603 1,056 12, no diploma 1,421 825 2,026 827 936 2,326 594 709 1,609 HS graduates 1,861 987 2,618 1,035 1,396 3,119 826 873 1,990 College 2,629 4,151 5,633 1,627 4,822 6,393 1,002 3,132 4,400 Some, no degree 1,450 1,794 3,515 844 2,400 3,938 606 1,034 2,926 Assoc. academic 404 5,690 6,798 268 6,087 7,445 136 5,106 5,523 Assoc. vocational 390 5,990 7,169 239 6,331 7,476 151 5,368 6,683 Bachelors 310 7,357 10,065 219 7,887 11,040 91 6,118 7,719 Masters or higher 75 12,708 14,016 57 15,227 15,406 18 8,333 9,614 Source: 1994 FSM Census, Table P183; 2000 FSM Census, Table P11-12 Workers economic activities naturally has a bearing on their income. Table 11.8 shows the median income of each of the economic activity categories by sex in 1994 and 2000. Although the data on income refer to a different time period than economic status, the majority of these persons’ economic status would not have changed. Those persons employed in the formal work sector had the highest median income at $2,810 in 1994, which increased to $3,700 in 2000. Surprisingly, those persons who were not in the labor force but could have taken a job had a median income higher than the persons in subsistence. Those who could have taken a job had an income of $628 in 2000, and those in the subsistence category had a median income of $582. This would suggest that about 79 percent of the subsistence workers and about 77 percent not in the labor force were receiving income from a source other than wages or salary. Females had consistently lower median incomes at every economic status. Table 11.8: Individual Median Income in 1993 and 1999 by Economic Status the Week Before the Census, Chuuk State: 1994 and 2000 Percent of 1994 work force
claiming income Median income ($) Percent of 2000 work force
claiming income Median income ($)
Economic status Number Total Males Females Number Total Males Females Persons 15+ years with income 31.9 9,283 987 1,378 852 55.8 19,090 785 888 686 In labor force 56.4 6,288 1,916 2,024 1,723 46.9 11,257 978 1,226 842 Employed 62.9 5,614 2,295 2,289 2,307 46.6 11,016 992 1,268 853 Formal work 87.6 4,709 2,810 2,898 2,627 32.8 4,398 3,700 3,579 3,949 Agriculture/fishing 25.5 905 679 693 622 64.6 6,618 667 716 606 Subsistence 22.5 701 643 658 591 78.8 3,431 582 602 560 Market oriented 47.4 204 836 843 800 54.1 3,187 792 860 686 Unemployed 30.4 674 599 619 580 66.8 241 603 619 584 Not in labor force 16.7 2,995 660 721 617 76.9 7,833 612 643 591 Could have taken a job 20.4 679 591 598 586 73.6 4,231 628 681 599 Not available for work 15.9 2,316 684 764 628 81.1 3,602 594 609 581 Source: 1994 FSM Census, Table P185 and unpublished data; 2000 FSM Census, Table P11-14 and unpublished data Note: Occupation refers to the most recent job, while the income data refers to 1993 & 1999 income. Table 11.9 shows median income for different occupations. Not all persons who had income in 1993 and 1999 reported an occupation. Some persons with income were not working or had not had a job in the 5 years prior to the
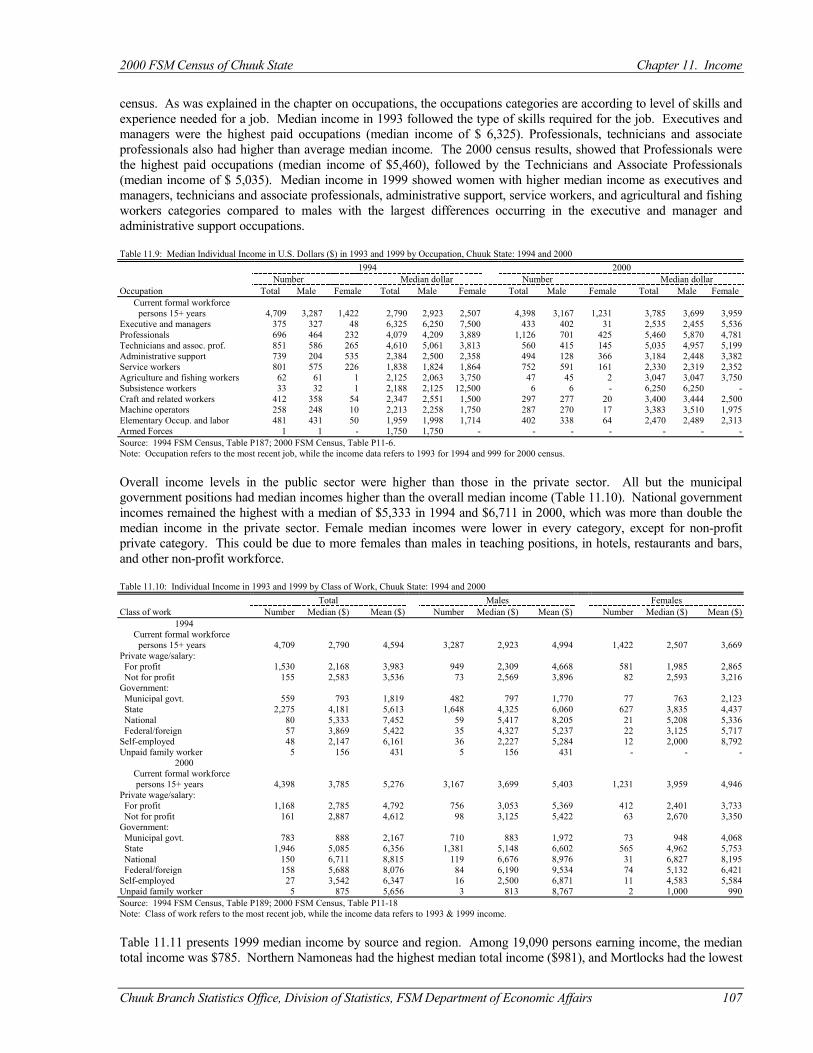
2000 FSM Census of Chuuk State Chapter 11. Income
Chuuk Branch Statistics Office, Division of Statistics, FSM Department of Economic Affairs 107
census. As was explained in the chapter on occupations, the occupations categories are according to level of skills and experience needed for a job. Median income in 1993 followed the type of skills required for the job. Executives and managers were the highest paid occupations (median income of $ 6,325). Professionals, technicians and associate professionals also had higher than average median income. The 2000 census results, showed that Professionals were the highest paid occupations (median income of $5,460), followed by the Technicians and Associate Professionals (median income of $ 5,035). Median income in 1999 showed women with higher median income as executives and managers, technicians and associate professionals, administrative support, service workers, and agricultural and fishing workers categories compared to males with the largest differences occurring in the executive and manager and administrative support occupations. Table 11.9: Median Individual Income in U.S. Dollars ($) in 1993 and 1999 by Occupation, Chuuk State: 1994 and 2000
1994 2000 Number Median dollar Number Median dollar
Occupation Total Male Female Total Male Female Total Male Female Total Male Female Current formal workforce persons 15+ years 4,709 3,287 1,422 2,790 2,923 2,507 4,398 3,167 1,231 3,785 3,699 3,959 Executive and managers 375 327 48 6,325 6,250 7,500 433 402 31 2,535 2,455 5,536 Professionals 696 464 232 4,079 4,209 3,889 1,126 701 425 5,460 5,870 4,781 Technicians and assoc. prof. 851 586 265 4,610 5,061 3,813 560 415 145 5,035 4,957 5,199 Administrative support 739 204 535 2,384 2,500 2,358 494 128 366 3,184 2,448 3,382 Service workers 801 575 226 1,838 1,824 1,864 752 591 161 2,330 2,319 2,352 Agriculture and fishing workers 62 61 1 2,125 2,063 3,750 47 45 2 3,047 3,047 3,750 Subsistence workers 33 32 1 2,188 2,125 12,500 6 6 - 6,250 6,250 - Craft and related workers 412 358 54 2,347 2,551 1,500 297 277 20 3,400 3,444 2,500 Machine operators 258 248 10 2,213 2,258 1,750 287 270 17 3,383 3,510 1,975 Elementary Occup. and labor 481 431 50 1,959 1,998 1,714 402 338 64 2,470 2,489 2,313 Armed Forces 1 1 - 1,750 1,750 - - - - - - - Source: 1994 FSM Census, Table P187; 2000 FSM Census, Table P11-6. Note: Occupation refers to the most recent job, while the income data refers to 1993 for 1994 and 999 for 2000 census. Overall income levels in the public sector were higher than those in the private sector. All but the municipal government positions had median incomes higher than the overall median income (Table 11.10). National government incomes remained the highest with a median of $5,333 in 1994 and $6,711 in 2000, which was more than double the median income in the private sector. Female median incomes were lower in every category, except for non-profit private category. This could be due to more females than males in teaching positions, in hotels, restaurants and bars, and other non-profit workforce. Table 11.10: Individual Income in 1993 and 1999 by Class of Work, Chuuk State: 1994 and 2000 Total Males Females Class of work Number Median ($) Mean ($) Number Median ($) Mean ($) Number Median ($) Mean ($)
1994 Current formal workforce persons 15+ years 4,709 2,790 4,594 3,287 2,923 4,994 1,422 2,507 3,669 Private wage/salary: For profit 1,530 2,168 3,983 949 2,309 4,668 581 1,985 2,865 Not for profit 155 2,583 3,536 73 2,569 3,896 82 2,593 3,216 Government: Municipal govt. 559 793 1,819 482 797 1,770 77 763 2,123 State 2,275 4,181 5,613 1,648 4,325 6,060 627 3,835 4,437 National 80 5,333 7,452 59 5,417 8,205 21 5,208 5,336 Federal/foreign 57 3,869 5,422 35 4,327 5,237 22 3,125 5,717 Self-employed 48 2,147 6,161 36 2,227 5,284 12 2,000 8,792 Unpaid family worker 5 156 431 5 156 431 - - -
2000 Current formal workforce persons 15+ years 4,398 3,785 5,276 3,167 3,699 5,403 1,231 3,959 4,946 Private wage/salary: For profit 1,168 2,785 4,792 756 3,053 5,369 412 2,401 3,733 Not for profit 161 2,887 4,612 98 3,125 5,422 63 2,670 3,350 Government: Municipal govt. 783 888 2,167 710 883 1,972 73 948 4,068 State 1,946 5,085 6,356 1,381 5,148 6,602 565 4,962 5,753 National 150 6,711 8,815 119 6,676 8,976 31 6,827 8,195 Federal/foreign 158 5,688 8,076 84 6,190 9,534 74 5,132 6,421 Self-employed 27 3,542 6,347 16 2,500 6,871 11 4,583 5,584 Unpaid family worker 5 875 5,656 3 813 8,767 2 1,000 990 Source: 1994 FSM Census, Table P189; 2000 FSM Census, Table P11-18 Note: Class of work refers to the most recent job, while the income data refers to 1993 & 1999 income. Table 11.11 presents 1999 median income by source and region. Among 19,090 persons earning income, the median total income was $785. Northern Namoneas had the highest median total income ($981), and Mortlocks had the lowest
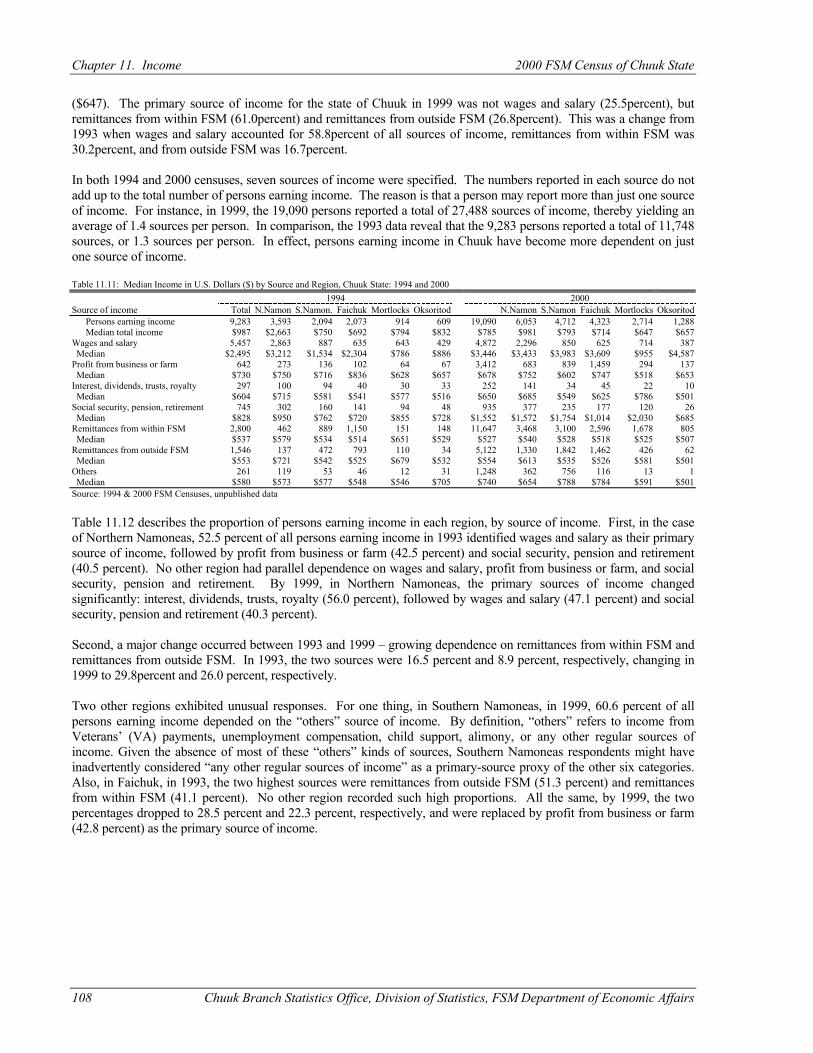
Chapter 11. Income 2000 FSM Census of Chuuk State
108 Chuuk Branch Statistics Office, Division of Statistics, FSM Department of Economic Affairs
($647). The primary source of income for the state of Chuuk in 1999 was not wages and salary (25.5percent), but remittances from within FSM (61.0percent) and remittances from outside FSM (26.8percent). This was a change from 1993 when wages and salary accounted for 58.8percent of all sources of income, remittances from within FSM was 30.2percent, and from outside FSM was 16.7percent. In both 1994 and 2000 censuses, seven sources of income were specified. The numbers reported in each source do not add up to the total number of persons earning income. The reason is that a person may report more than just one source of income. For instance, in 1999, the 19,090 persons reported a total of 27,488 sources of income, thereby yielding an average of 1.4 sources per person. In comparison, the 1993 data reveal that the 9,283 persons reported a total of 11,748 sources, or 1.3 sources per person. In effect, persons earning income in Chuuk have become more dependent on just one source of income. Table 11.11: Median Income in U.S. Dollars ($) by Source and Region, Chuuk State: 1994 and 2000
1994 2000 Source of income Total N.Namon S.Namon. Faichuk Mortlocks Oksoritod N.Namon S.Namon Faichuk Mortlocks Oksoritod Persons earning income 9,283 3,593 2,094 2,073 914 609 19,090 6,053 4,712 4,323 2,714 1,288 Median total income $987 $2,663 $750 $692 $794 $832 $785 $981 $793 $714 $647 $657 Wages and salary 5,457 2,863 887 635 643 429 4,872 2,296 850 625 714 387 Median $2,495 $3,212 $1,534 $2,304 $786 $886 $3,446 $3,433 $3,983 $3,609 $955 $4,587 Profit from business or farm 642 273 136 102 64 67 3,412 683 839 1,459 294 137 Median $730 $750 $716 $836 $628 $657 $678 $752 $602 $747 $518 $653 Interest, dividends, trusts, royalty 297 100 94 40 30 33 252 141 34 45 22 10 Median $604 $715 $581 $541 $577 $516 $650 $685 $549 $625 $786 $501 Social security, pension, retirement 745 302 160 141 94 48 935 377 235 177 120 26 Median $828 $950 $762 $720 $855 $728 $1,552 $1,572 $1,754 $1,014 $2,030 $685 Remittances from within FSM 2,800 462 889 1,150 151 148 11,647 3,468 3,100 2,596 1,678 805 Median $537 $579 $534 $514 $651 $529 $527 $540 $528 $518 $525 $507 Remittances from outside FSM 1,546 137 472 793 110 34 5,122 1,330 1,842 1,462 426 62 Median $553 $721 $542 $525 $679 $532 $554 $613 $535 $526 $581 $501 Others 261 119 53 46 12 31 1,248 362 756 116 13 1 Median $580 $573 $577 $548 $546 $705 $740 $654 $788 $784 $591 $501 Source: 1994 & 2000 FSM Censuses, unpublished data Table 11.12 describes the proportion of persons earning income in each region, by source of income. First, in the case of Northern Namoneas, 52.5 percent of all persons earning income in 1993 identified wages and salary as their primary source of income, followed by profit from business or farm (42.5 percent) and social security, pension and retirement (40.5 percent). No other region had parallel dependence on wages and salary, profit from business or farm, and social security, pension and retirement. By 1999, in Northern Namoneas, the primary sources of income changed significantly: interest, dividends, trusts, royalty (56.0 percent), followed by wages and salary (47.1 percent) and social security, pension and retirement (40.3 percent). Second, a major change occurred between 1993 and 1999 – growing dependence on remittances from within FSM and remittances from outside FSM. In 1993, the two sources were 16.5 percent and 8.9 percent, respectively, changing in 1999 to 29.8percent and 26.0 percent, respectively. Two other regions exhibited unusual responses. For one thing, in Southern Namoneas, in 1999, 60.6 percent of all persons earning income depended on the “others” source of income. By definition, “others” refers to income from Veterans’ (VA) payments, unemployment compensation, child support, alimony, or any other regular sources of income. Given the absence of most of these “others” kinds of sources, Southern Namoneas respondents might have inadvertently considered “any other regular sources of income” as a primary-source proxy of the other six categories. Also, in Faichuk, in 1993, the two highest sources were remittances from outside FSM (51.3 percent) and remittances from within FSM (41.1 percent). No other region recorded such high proportions. All the same, by 1999, the two percentages dropped to 28.5 percent and 22.3 percent, respectively, and were replaced by profit from business or farm (42.8 percent) as the primary source of income.
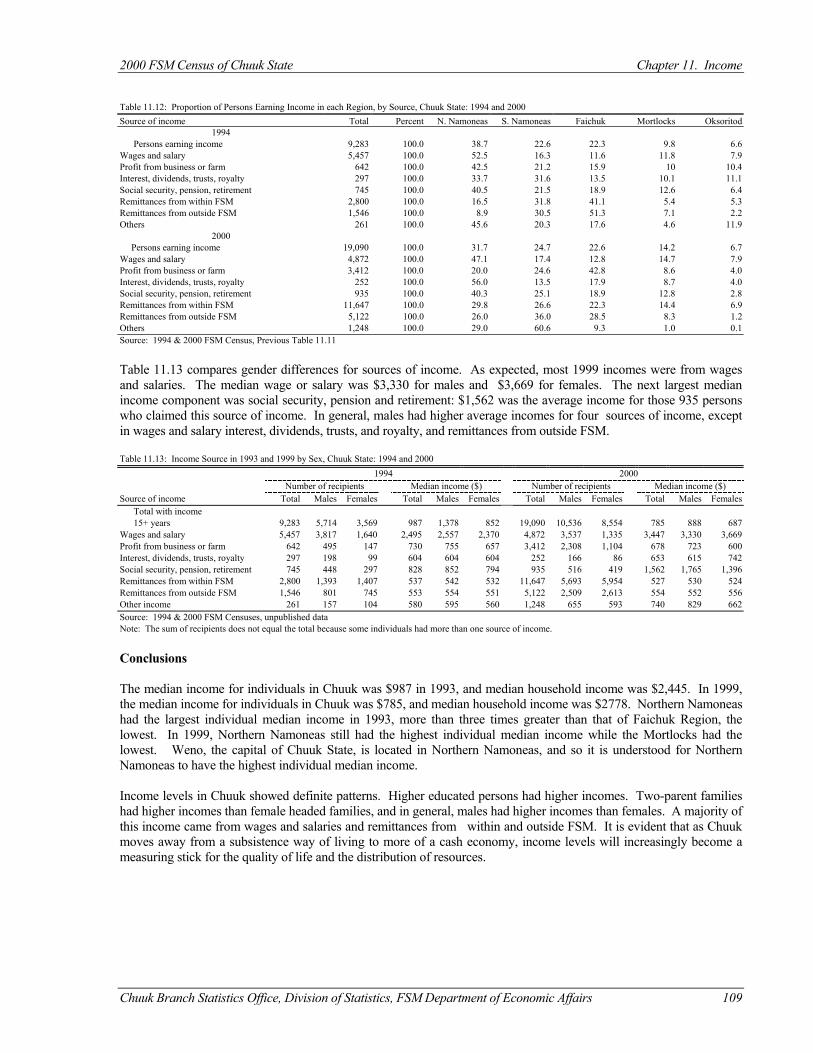
2000 FSM Census of Chuuk State Chapter 11. Income
Chuuk Branch Statistics Office, Division of Statistics, FSM Department of Economic Affairs 109
Table 11.12: Proportion of Persons Earning Income in each Region, by Source, Chuuk State: 1994 and 2000 Source of income Total Percent N. Namoneas S. Namoneas Faichuk Mortlocks Oksoritod
1994 Persons earning income 9,283 100.0 38.7 22.6 22.3 9.8 6.6 Wages and salary 5,457 100.0 52.5 16.3 11.6 11.8 7.9 Profit from business or farm 642 100.0 42.5 21.2 15.9 10 10.4 Interest, dividends, trusts, royalty 297 100.0 33.7 31.6 13.5 10.1 11.1 Social security, pension, retirement 745 100.0 40.5 21.5 18.9 12.6 6.4 Remittances from within FSM 2,800 100.0 16.5 31.8 41.1 5.4 5.3 Remittances from outside FSM 1,546 100.0 8.9 30.5 51.3 7.1 2.2 Others 261 100.0 45.6 20.3 17.6 4.6 11.9
2000 Persons earning income 19,090 100.0 31.7 24.7 22.6 14.2 6.7 Wages and salary 4,872 100.0 47.1 17.4 12.8 14.7 7.9 Profit from business or farm 3,412 100.0 20.0 24.6 42.8 8.6 4.0 Interest, dividends, trusts, royalty 252 100.0 56.0 13.5 17.9 8.7 4.0 Social security, pension, retirement 935 100.0 40.3 25.1 18.9 12.8 2.8 Remittances from within FSM 11,647 100.0 29.8 26.6 22.3 14.4 6.9 Remittances from outside FSM 5,122 100.0 26.0 36.0 28.5 8.3 1.2 Others 1,248 100.0 29.0 60.6 9.3 1.0 0.1 Source: 1994 & 2000 FSM Census, Previous Table 11.11 Table 11.13 compares gender differences for sources of income. As expected, most 1999 incomes were from wages and salaries. The median wage or salary was $3,330 for males and $3,669 for females. The next largest median income component was social security, pension and retirement: $1,562 was the average income for those 935 persons who claimed this source of income. In general, males had higher average incomes for four sources of income, except in wages and salary interest, dividends, trusts, and royalty, and remittances from outside FSM. Table 11.13: Income Source in 1993 and 1999 by Sex, Chuuk State: 1994 and 2000
1994 2000 Number of recipients Median income ($) Number of recipients Median income ($)
Source of income Total Males Females Total Males Females Total Males Females Total Males Females Total with income 15+ years 9,283 5,714 3,569 987 1,378 852 19,090 10,536 8,554 785 888 687 Wages and salary 5,457 3,817 1,640 2,495 2,557 2,370 4,872 3,537 1,335 3,447 3,330 3,669 Profit from business or farm 642 495 147 730 755 657 3,412 2,308 1,104 678 723 600 Interest, dividends, trusts, royalty 297 198 99 604 604 604 252 166 86 653 615 742 Social security, pension, retirement 745 448 297 828 852 794 935 516 419 1,562 1,765 1,396 Remittances from within FSM 2,800 1,393 1,407 537 542 532 11,647 5,693 5,954 527 530 524 Remittances from outside FSM 1,546 801 745 553 554 551 5,122 2,509 2,613 554 552 556 Other income 261 157 104 580 595 560 1,248 655 593 740 829 662 Source: 1994 & 2000 FSM Censuses, unpublished data Note: The sum of recipients does not equal the total because some individuals had more than one source of income.
Conclusions The median income for individuals in Chuuk was $987 in 1993, and median household income was $2,445. In 1999, the median income for individuals in Chuuk was $785, and median household income was $2778. Northern Namoneas had the largest individual median income in 1993, more than three times greater than that of Faichuk Region, the lowest. In 1999, Northern Namoneas still had the highest individual median income while the Mortlocks had the lowest. Weno, the capital of Chuuk State, is located in Northern Namoneas, and so it is understood for Northern Namoneas to have the highest individual median income. Income levels in Chuuk showed definite patterns. Higher educated persons had higher incomes. Two-parent families had higher incomes than female headed families, and in general, males had higher incomes than females. A majority of this income came from wages and salaries and remittances from within and outside FSM. It is evident that as Chuuk moves away from a subsistence way of living to more of a cash economy, income levels will increasingly become a measuring stick for the quality of life and the distribution of resources.

Chuuk Branch Statistics Office, Division of Statistics, FSM Department of Economic Affairs 111
CHAPTER 12 HOUSING CHARACTERISTICS
Introduction Information on housing provides important insights to the level of development and often illuminating the interface between a traditional cultural system and the modernization that has affected most of the Pacific during the late twentieth century. The housing characteristics in Chuuk have been organized in this chapter into four major sections; (1) general housing characteristics; (2) structural characteristics, (3) utilities, and (4) equipment. The 1980 census result was used to examine the change in housing in Chuuk State over time. The data presented in this chapter include the total and different types of housing units found in the 2000 Census. The 2000 Census questionnaire contain a similar set of questions used in the 1994 Census, so the comparison of housing data for these two years were consistent. Data Description General Housing Characteristics A housing unit is a house, apartment, group of rooms, or single room occupied as separate living quarters or, if vacant, intended for occupancy as separate living quarters. Separate living quarters are those in which the occupants live and eat apart from other persons in the building and which have direct access from outside the building or through a common hall. Housing units built not for household occupancy but for groups of unrelated persons was defined as group quarter. Group quarters include institutionalized and non-institutionalized quarters such as prisons/local jails, hospitals, school/college dormitories, etc. The 2000 Chuuk State Census included both occupied and vacant housing units as part of the housing inventory. Recreational boats, tents, and others were also included in the questionnaire to enumerate people using them as their usual residence. The census classified a housing unit as occupied if it was the usual residence of the person or group of persons inhabiting it at the time of enumeration or if the occupants were only temporarily absent. A vacant housing unit was a unit with no residents at the time of enumeration, unless its occupants were only temporarily absent. The census also considered vacant units that were temporarily occupied at the time of enumeration by persons who usually resided elsewhere. A new unit not yet occupied was classified as vacant if construction had reached the point where all exterior windows and doors, and final usable floors, were in place. The census did not consider unoccupied units open to the elements as vacant. Also excluded from vacant units were quarters used entirely for non-residential purposes, such as store, office, or storage facility. The 2000 Chuuk Census distinguished between owner-occupied and renter-occupied housing units, a characteristic referred to as tenure. Questionnaire item H22, asked of all occupied housing units, dealt with tenure. The census classified a housing unit as owner-occupied if the owner or co-owner resided in the unit on the census day, even if the unit was mortgaged or not fully paid for. The remaining occupied housing units were classified as renter-occupied, regardless if cash or some other means of remittance was used. The census recorded a housing unit as "rented for cash" if any money rent was paid or contracted for; this rent could come from individuals either living in the unit or elsewhere, or from an organization. Rental units classified under "occupied without payment of cash rent" generally were those provided free by friends or relatives, or in exchange for services such as those provided by a resident manager or tenant worker. Questionnaire item H6 concerned the year a structure was built. Data on year of construction was collected for both occupied and vacant housing units. Data on the year in which a structure was built referred to when the building was first constructed, not when it was remodeled, added to, or converted. Recently built structures that met the housing unit definition requirements (all exterior windows, doors, and final usable floors installed) were assigned to the "1999-2000" category.
Chapter 12. Housing 2000 FSM Census of Chuuk State
112 Chuuk Branch Statistics Office, Division of Statistics, FSM Department of Economic Affairs
Structural Characteristics The 2000 census obtained information on the number of housing units in a structure from questionnaire item H1, which was asked of all housing units. A structure comprised a separate building that either had open space on all four sides or was separated from other structures by dividing walls that extended from ground to roof. The statistics presented in this report refer to the number of housing units in separate structures of specified type and size. The following categories applied: . One-unit, detached -- a single-unit structure detached from any other structure (except a shed or garage). A
one-family house, which contained a business, was considered detached as long as the building had open space on all four sides.
. One-unit, attached -- a one-unit structure, which had one or more walls extending from ground to roof
separating it from adjoining structures. In double houses and houses attached to non-residential structures, each housing unit was an individual attached structure if the dividing or common wall extended from ground or roof.
. Two or more units -- housing units in structures containing two or more housing units, further categorized as
units in structures with 2, 3 or 4, 5 to 9, 10 to 19, 20 or more units. . Other -- any housing unit that did not fit the previous categories, such as abandoned cars, campers, vans, and
shacks. The 2000 census obtained information on the number of rooms per housing unit from questionnaire item H7, with resulting information recorded both for occupied and vacant housing units. The intent of this question was to count the number of whole rooms used for living purposes. For each unit, whole rooms included living rooms, dining rooms, kitchens, bedrooms, finished recreation rooms, enclosed porches suitable for year-round use, and lodger's rooms. Excluded were kitchenettes, bathrooms, open porches, balconies, halls for foyers, utility rooms, and other unfinished space used for storage. Data on bedrooms were obtained from questionnaire item H8, with resulting information recorded for both occupied and vacant housing units. The number of bedrooms refers to the count of rooms designed as bedrooms and the number of rooms that one would count as bedrooms when listing a housing unit for sale or for rent. The 2000 census included as bedrooms all rooms intended for use as bedrooms even if residents were using them for some other purpose on Census Day. Housing units comprising a single room, such as an efficiency apartment, by definition were classified as having no bedroom. Data on material used for the outside walls of housing units were obtained from questionnaire item H3, for both occupied and vacant housing units. The census classified each unit according to the type of material used most in the construction of its outside walls and included as separate categories "Poured concrete", "Concrete blocks", "Metal/Tin", "Plywood", "Thatch", "Local wood or bamboo", "Other", and "No walls". The census collected data on the material used for the roofs of housing units with questionnaire item H4, the results recorded both for occupied and vacant housing units. The census classified each housing unit according to the type of material used most in the construction of its roof. The material categories used were "Poured concrete", "Metal/Tin", "Wood", "Thatch", "Bamboo", and "Other". The 2000 census collected data on type of material used for the foundation of housing units with questionnaire item H5, both for occupied and vacant housing units. Census personnel classified each housing unit according to the type of material used most in its foundation. The categories employed were "Concrete", "Wood pier or piling", "Coral", "Stone", and "Other". Utilities The 2000 census collected data on electric power with questionnaire items H10, recorded for both occupied and vacant housing units. Even if the power had been shut off for some reasons, the census considered the unit to have electric power.
2000 FSM Census of Chuuk State Chapter 12. Housing
Chuuk Branch Statistics Office, Division of Statistics, FSM Department of Economic Affairs 113
The census data on source of water were obtained from questionnaire item H15, also recorded for occupied and vacant housing units. Categories 1 to 9 on question H15 dealt with the sources of drinking water to the household. "A public (government) system only" refers to when there was running water comes through water pipes from any common source supplying 5 or more houses or apartments and it was the only source of water for the entire household or apartment. "A community water system only" refers to when there was running water coming through water pipes supplied by a village or community water system or obtained from a well that was maintained by the community. "A public and catchments" refers to when there was running water from a public system and there was also catchment in which rainwater was collected. "An individual well" refers to when the water came from a well on the property or on neighboring property serving fewer than 5 houses or apartments. Well water hand drawn, wind drawn, or engine drawn whether piped or not piped and stored in tanks or used directly from the well were included. "A catchments, tanks, or drums only" refers to when the source of water was a catchments, tanks, or drums in which rainwater was collected. Such sources usually serve only one structure. "A public standpipe or street hydrant" refers to when there was an elevated tank or vertical storage cylinder connected to a public system from which nearby residents draw water. "Purchased bottled water" refers to when the household depended only on water purchased from businesses. "Some other sources such as a spring, river, creek, etc." were being used as the main source of drinking water. Data on water supply, also referred to as "Piped water" related to the source of water, were obtained from questionnaire items H9a and H9b, recorded for both occupied and vacant housing units. Piped water signified a housing unit where water was available at a sink, washbasin, bathtub, or shower. The piped water may have been located within a housing unit, in a hallway associated with the unit, or in a room used by several other households in the building containing the unit (even if occupants had to go outdoors to reach that part of the building). If both hot and cold water were available, the census recorded the type of energy used by the water heater; "electricity", "gas”,” solar power", or "other fuels". Equipment The 2000 census obtained information on plumbing facilities from questionnaire items H9a, H9c, and H9d for occupied and vacant housing units. A unit was considered to have complete plumbing facilities when it had piped water, a flush toilet, and a bathtub or shower, regardless of whether these facilities were located in the unit being enumerated or inside the building in which the unit was. Data on sinks with piped water were obtained from questionnaire item H17e, recorded for both occupied and vacant housing units. For classification as a housing unit possessing a sink with piped water, such a sink had to be in the unit itself or inside the building containing the housing unit enumerated. Questionnaire items H9d and H16 addressed the type of toilet facilities both in occupied and vacant housing units. A flush toilet consisted of any toilet connected to piped water and emptying into a public sewer, septic tank or cesspool. If the unit did not have a flush toilet, the toilet could be an outhouse, privy, or benjo; otherwise, the last category, "Other", was used. The 2000 census collected data on bathtub and shower with questionnaire item H9c both for occupied and vacant housing units. A bathtub or shower was counted only if connected permanently to piped running water, thus excluding equipment such as portable bathtubs. Questionnaire items H17a and H17b concerned cooking facilities and were asked at both occupied and vacant housing units. Main cooking facilities were those used most often for the preparation of meals, located either outside or inside the housing unit. A housing unit with "No cooking facilities" comprised a unit with no cooking facilities available inside or outside the building.
Chapter 12. Housing 2000 FSM Census of Chuuk State
114 Chuuk Branch Statistics Office, Division of Statistics, FSM Department of Economic Affairs
Questionnaire items H18 and H19 asked for the number of vehicles used for land transportation as well as boats used by the household for water transportation. Finally, the census collected data on household appliances such as refrigerator, deep freezer, air-conditioning, television and VCR, telephone or CB radio, and battery operated radio. Limitation and Comparability. Data from the 1980 and 1994 censuses were provided for comparative purposes. As concepts and definitions in 1980 may differ slightly from the 1994 and 2000 census, comparison may be limited only to aggregate statistics. There was no obvious limitation between the 1994 and 2000 data.
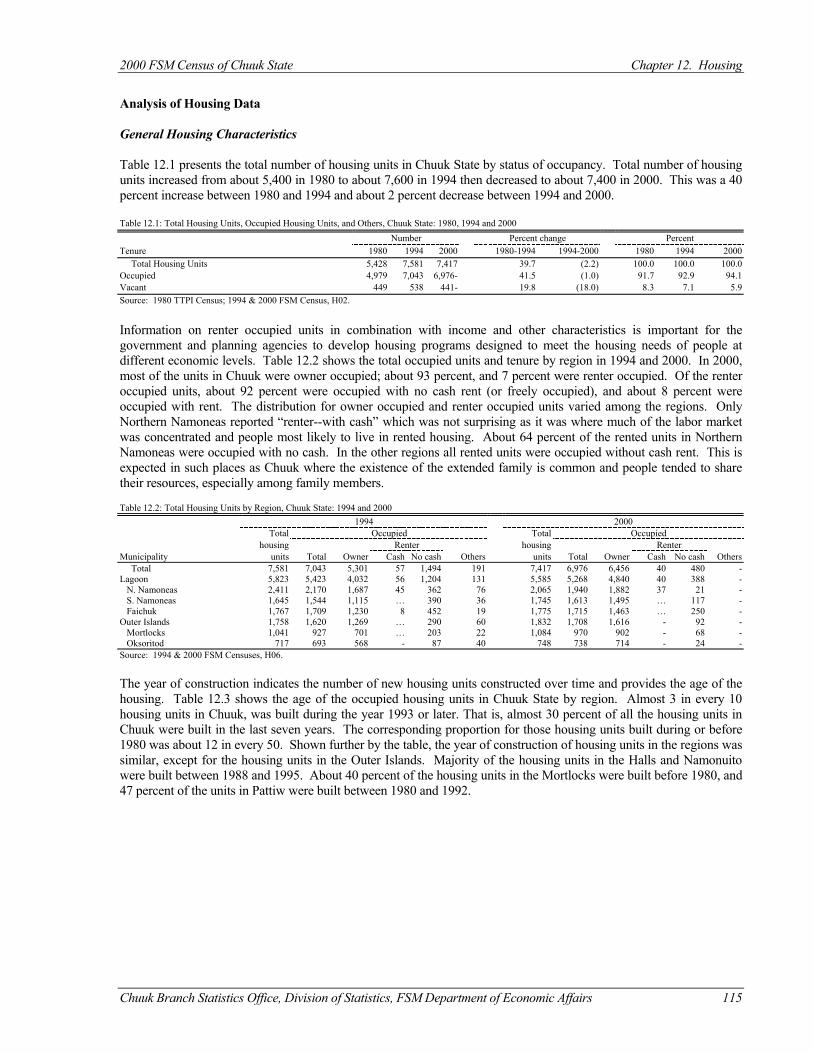
2000 FSM Census of Chuuk State Chapter 12. Housing
Chuuk Branch Statistics Office, Division of Statistics, FSM Department of Economic Affairs 115
Analysis of Housing Data General Housing Characteristics Table 12.1 presents the total number of housing units in Chuuk State by status of occupancy. Total number of housing units increased from about 5,400 in 1980 to about 7,600 in 1994 then decreased to about 7,400 in 2000. This was a 40 percent increase between 1980 and 1994 and about 2 percent decrease between 1994 and 2000. Table 12.1: Total Housing Units, Occupied Housing Units, and Others, Chuuk State: 1980, 1994 and 2000
Number Percent change Percent Tenure 1980 1994 2000 1980-1994 1994-2000 1980 1994 2000 Total Housing Units 5,428 7,581 7,417 39.7 (2.2) 100.0 100.0 100.0 Occupied 4,979 7,043 6,976- 41.5 (1.0) 91.7 92.9 94.1 Vacant 449 538 441- 19.8 (18.0) 8.3 7.1 5.9 Source: 1980 TTPI Census; 1994 & 2000 FSM Census, H02.
Information on renter occupied units in combination with income and other characteristics is important for the government and planning agencies to develop housing programs designed to meet the housing needs of people at different economic levels. Table 12.2 shows the total occupied units and tenure by region in 1994 and 2000. In 2000, most of the units in Chuuk were owner occupied; about 93 percent, and 7 percent were renter occupied. Of the renter occupied units, about 92 percent were occupied with no cash rent (or freely occupied), and about 8 percent were occupied with rent. The distribution for owner occupied and renter occupied units varied among the regions. Only Northern Namoneas reported “renter--with cash” which was not surprising as it was where much of the labor market was concentrated and people most likely to live in rented housing. About 64 percent of the rented units in Northern Namoneas were occupied with no cash. In the other regions all rented units were occupied without cash rent. This is expected in such places as Chuuk where the existence of the extended family is common and people tended to share their resources, especially among family members. Table 12.2: Total Housing Units by Region, Chuuk State: 1994 and 2000 1994 2000
Total Occupied Total Occupied housing Renter housing Renter
Municipality units Total Owner Cash No cash Others units Total Owner Cash No cash Others Total 7,581 7,043 5,301 57 1,494 191 7,417 6,976 6,456 40 480 - Lagoon 5,823 5,423 4,032 56 1,204 131 5,585 5,268 4,840 40 388 - N. Namoneas 2,411 2,170 1,687 45 362 76 2,065 1,940 1,882 37 21 - S. Namoneas 1,645 1,544 1,115 … 390 36 1,745 1,613 1,495 … 117 - Faichuk 1,767 1,709 1,230 8 452 19 1,775 1,715 1,463 … 250 - Outer Islands 1,758 1,620 1,269 … 290 60 1,832 1,708 1,616 - 92 - Mortlocks 1,041 927 701 … 203 22 1,084 970 902 - 68 - Oksoritod 717 693 568 - 87 40 748 738 714 - 24 - Source: 1994 & 2000 FSM Censuses, H06. The year of construction indicates the number of new housing units constructed over time and provides the age of the housing. Table 12.3 shows the age of the occupied housing units in Chuuk State by region. Almost 3 in every 10 housing units in Chuuk, was built during the year 1993 or later. That is, almost 30 percent of all the housing units in Chuuk were built in the last seven years. The corresponding proportion for those housing units built during or before 1980 was about 12 in every 50. Shown further by the table, the year of construction of housing units in the regions was similar, except for the housing units in the Outer Islands. Majority of the housing units in the Halls and Namonuito were built between 1988 and 1995. About 40 percent of the housing units in the Mortlocks were built before 1980, and 47 percent of the units in Pattiw were built between 1980 and 1992.
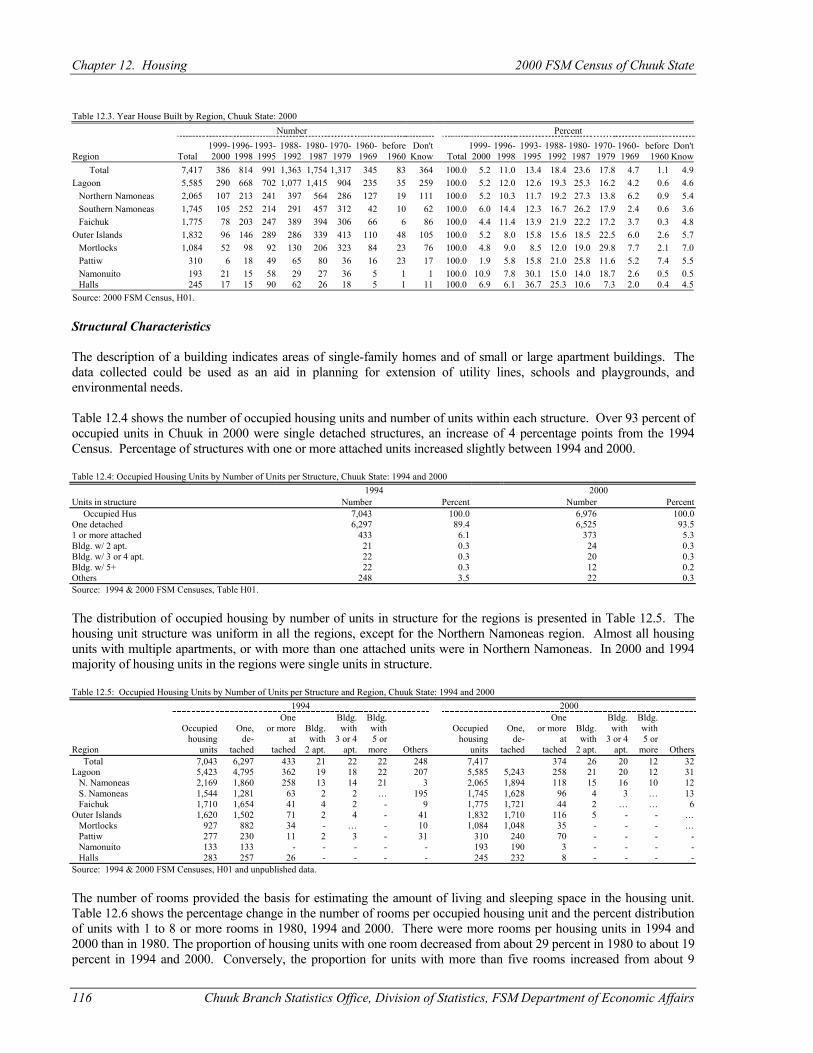
Chapter 12. Housing 2000 FSM Census of Chuuk State
116 Chuuk Branch Statistics Office, Division of Statistics, FSM Department of Economic Affairs
Table 12.3. Year House Built by Region, Chuuk State: 2000 Number Percent
Region Total 1999- 2000
1996- 1998
1993- 1995
1988-1992
1980- 1987
1970- 1979
1960- 1969
before 1960
Don't Know Total
1999- 2000
1996- 1998
1993-1995
1988-1992
1980- 1987
1970-1979
1960- 1969
before 1960
Don't Know
Total 7,417 386 814 991 1,363 1,754 1,317 345 83 364 100.0 5.2 11.0 13.4 18.4 23.6 17.8 4.7 1.1 4.9 Lagoon 5,585 290 668 702 1,077 1,415 904 235 35 259 100.0 5.2 12.0 12.6 19.3 25.3 16.2 4.2 0.6 4.6 Northern Namoneas 2,065 107 213 241 397 564 286 127 19 111 100.0 5.2 10.3 11.7 19.2 27.3 13.8 6.2 0.9 5.4 Southern Namoneas 1,745 105 252 214 291 457 312 42 10 62 100.0 6.0 14.4 12.3 16.7 26.2 17.9 2.4 0.6 3.6 Faichuk 1,775 78 203 247 389 394 306 66 6 86 100.0 4.4 11.4 13.9 21.9 22.2 17.2 3.7 0.3 4.8 Outer Islands 1,832 96 146 289 286 339 413 110 48 105 100.0 5.2 8.0 15.8 15.6 18.5 22.5 6.0 2.6 5.7 Mortlocks 1,084 52 98 92 130 206 323 84 23 76 100.0 4.8 9.0 8.5 12.0 19.0 29.8 7.7 2.1 7.0 Pattiw 310 6 18 49 65 80 36 16 23 17 100.0 1.9 5.8 15.8 21.0 25.8 11.6 5.2 7.4 5.5 Namonuito 193 21 15 58 29 27 36 5 1 1 100.0 10.9 7.8 30.1 15.0 14.0 18.7 2.6 0.5 0.5 Halls 245 17 15 90 62 26 18 5 1 11 100.0 6.9 6.1 36.7 25.3 10.6 7.3 2.0 0.4 4.5 Source: 2000 FSM Census, H01. Structural Characteristics The description of a building indicates areas of single-family homes and of small or large apartment buildings. The data collected could be used as an aid in planning for extension of utility lines, schools and playgrounds, and environmental needs. Table 12.4 shows the number of occupied housing units and number of units within each structure. Over 93 percent of occupied units in Chuuk in 2000 were single detached structures, an increase of 4 percentage points from the 1994 Census. Percentage of structures with one or more attached units increased slightly between 1994 and 2000. Table 12.4: Occupied Housing Units by Number of Units per Structure, Chuuk State: 1994 and 2000 1994 2000 Units in structure Number Percent Number Percent Occupied Hus 7,043 100.0 6,976 100.0 One detached 6,297 89.4 6,525 93.5 1 or more attached 433 6.1 373 5.3 Bldg. w/ 2 apt. 21 0.3 24 0.3 Bldg. w/ 3 or 4 apt. 22 0.3 20 0.3 Bldg. w/ 5+ 22 0.3 12 0.2 Others 248 3.5 22 0.3 Source: 1994 & 2000 FSM Censuses, Table H01. The distribution of occupied housing by number of units in structure for the regions is presented in Table 12.5. The housing unit structure was uniform in all the regions, except for the Northern Namoneas region. Almost all housing units with multiple apartments, or with more than one attached units were in Northern Namoneas. In 2000 and 1994 majority of housing units in the regions were single units in structure. Table 12.5: Occupied Housing Units by Number of Units per Structure and Region, Chuuk State: 1994 and 2000 1994 2000
One Bldg. Bldg. One Bldg. Bldg. Occupied One, or more Bldg. with with Occupied One, or more Bldg. with with housing de- at with 3 or 4 5 or housing de- at with 3 or 4 5 or
Region units tached tached 2 apt. apt. more Others units tached tached 2 apt. apt. more Others Total 7,043 6,297 433 21 22 22 248 7,417 374 26 20 12 32 Lagoon 5,423 4,795 362 19 18 22 207 5,585 5,243 258 21 20 12 31 N. Namoneas 2,169 1,860 258 13 14 21 3 2,065 1,894 118 15 16 10 12 S. Namoneas 1,544 1,281 63 2 2 … 195 1,745 1,628 96 4 3 … 13 Faichuk 1,710 1,654 41 4 2 - 9 1,775 1,721 44 2 … … 6 Outer Islands 1,620 1,502 71 2 4 - 41 1,832 1,710 116 5 - - … Mortlocks 927 882 34 - … - 10 1,084 1,048 35 - - - … Pattiw 277 230 11 2 3 - 31 310 240 70 - - - - Namonuito 133 133 - - - - - 193 190 3 - - - - Halls 283 257 26 - - - - 245 232 8 - - - - Source: 1994 & 2000 FSM Censuses, H01 and unpublished data. The number of rooms provided the basis for estimating the amount of living and sleeping space in the housing unit. Table 12.6 shows the percentage change in the number of rooms per occupied housing unit and the percent distribution of units with 1 to 8 or more rooms in 1980, 1994 and 2000. There were more rooms per housing units in 1994 and 2000 than in 1980. The proportion of housing units with one room decreased from about 29 percent in 1980 to about 19 percent in 1994 and 2000. Conversely, the proportion for units with more than five rooms increased from about 9
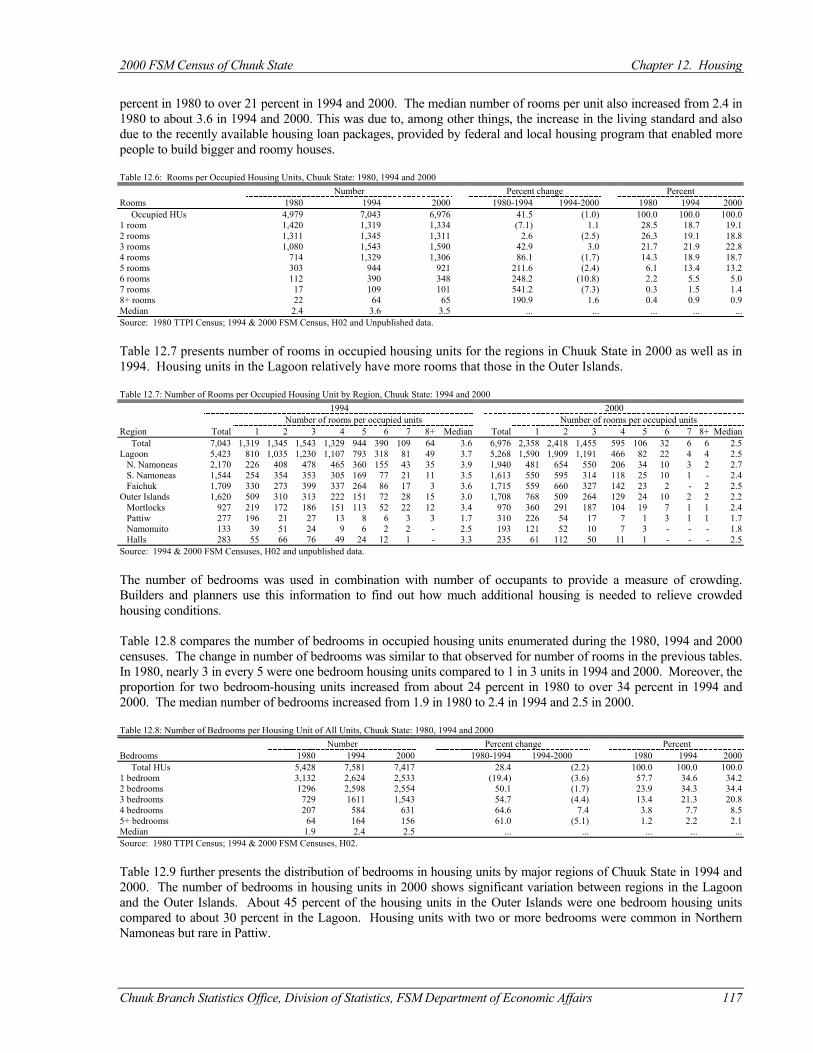
2000 FSM Census of Chuuk State Chapter 12. Housing
Chuuk Branch Statistics Office, Division of Statistics, FSM Department of Economic Affairs 117
percent in 1980 to over 21 percent in 1994 and 2000. The median number of rooms per unit also increased from 2.4 in 1980 to about 3.6 in 1994 and 2000. This was due to, among other things, the increase in the living standard and also due to the recently available housing loan packages, provided by federal and local housing program that enabled more people to build bigger and roomy houses. Table 12.6: Rooms per Occupied Housing Units, Chuuk State: 1980, 1994 and 2000 Number Percent change Percent Rooms 1980 1994 2000 1980-1994 1994-2000 1980 1994 2000 Occupied HUs 4,979 7,043 6,976 41.5 (1.0) 100.0 100.0 100.0 1 room 1,420 1,319 1,334 (7.1) 1.1 28.5 18.7 19.1 2 rooms 1,311 1,345 1,311 2.6 (2.5) 26.3 19.1 18.8 3 rooms 1,080 1,543 1,590 42.9 3.0 21.7 21.9 22.8 4 rooms 714 1,329 1,306 86.1 (1.7) 14.3 18.9 18.7 5 rooms 303 944 921 211.6 (2.4) 6.1 13.4 13.2 6 rooms 112 390 348 248.2 (10.8) 2.2 5.5 5.0 7 rooms 17 109 101 541.2 (7.3) 0.3 1.5 1.4 8+ rooms 22 64 65 190.9 1.6 0.4 0.9 0.9 Median 2.4 3.6 3.5 ... ... ... ... ... Source: 1980 TTPI Census; 1994 & 2000 FSM Census, H02 and Unpublished data. Table 12.7 presents number of rooms in occupied housing units for the regions in Chuuk State in 2000 as well as in 1994. Housing units in the Lagoon relatively have more rooms that those in the Outer Islands. Table 12.7: Number of Rooms per Occupied Housing Unit by Region, Chuuk State: 1994 and 2000 1994 2000
Number of rooms per occupied units Number of rooms per occupied units Region Total 1 2 3 4 5 6 7 8+ Median Total 1 2 3 4 5 6 7 8+ Median Total 7,043 1,319 1,345 1,543 1,329 944 390 109 64 3.6 6,976 2,358 2,418 1,455 595 106 32 6 6 2.5 Lagoon 5,423 810 1,035 1,230 1,107 793 318 81 49 3.7 5,268 1,590 1,909 1,191 466 82 22 4 4 2.5 N. Namoneas 2,170 226 408 478 465 360 155 43 35 3.9 1,940 481 654 550 206 34 10 3 2 2.7 S. Namoneas 1,544 254 354 353 305 169 77 21 11 3.5 1,613 550 595 314 118 25 10 1 - 2.4 Faichuk 1,709 330 273 399 337 264 86 17 3 3.6 1,715 559 660 327 142 23 2 - 2 2.5 Outer Islands 1,620 509 310 313 222 151 72 28 15 3.0 1,708 768 509 264 129 24 10 2 2 2.2 Mortlocks 927 219 172 186 151 113 52 22 12 3.4 970 360 291 187 104 19 7 1 1 2.4 Pattiw 277 196 21 27 13 8 6 3 3 1.7 310 226 54 17 7 1 3 1 1 1.7 Namonuito 133 39 51 24 9 6 2 2 - 2.5 193 121 52 10 7 3 - - - 1.8 Halls 283 55 66 76 49 24 12 1 - 3.3 235 61 112 50 11 1 - - - 2.5 Source: 1994 & 2000 FSM Censuses, H02 and unpublished data. The number of bedrooms was used in combination with number of occupants to provide a measure of crowding. Builders and planners use this information to find out how much additional housing is needed to relieve crowded housing conditions. Table 12.8 compares the number of bedrooms in occupied housing units enumerated during the 1980, 1994 and 2000 censuses. The change in number of bedrooms was similar to that observed for number of rooms in the previous tables. In 1980, nearly 3 in every 5 were one bedroom housing units compared to 1 in 3 units in 1994 and 2000. Moreover, the proportion for two bedroom-housing units increased from about 24 percent in 1980 to over 34 percent in 1994 and 2000. The median number of bedrooms increased from 1.9 in 1980 to 2.4 in 1994 and 2.5 in 2000. Table 12.8: Number of Bedrooms per Housing Unit of All Units, Chuuk State: 1980, 1994 and 2000 Number Percent change Percent Bedrooms 1980 1994 2000 1980-1994 1994-2000 1980 1994 2000 Total HUs 5,428 7,581 7,417 28.4 (2.2) 100.0 100.0 100.0 1 bedroom 3,132 2,624 2,533 (19.4) (3.6) 57.7 34.6 34.2 2 bedrooms 1296 2,598 2,554 50.1 (1.7) 23.9 34.3 34.4 3 bedrooms 729 1611 1,543 54.7 (4.4) 13.4 21.3 20.8 4 bedrooms 207 584 631 64.6 7.4 3.8 7.7 8.5 5+ bedrooms 64 164 156 61.0 (5.1) 1.2 2.2 2.1 Median 1.9 2.4 2.5 ... ... ... ... ... Source: 1980 TTPI Census; 1994 & 2000 FSM Censuses, H02. Table 12.9 further presents the distribution of bedrooms in housing units by major regions of Chuuk State in 1994 and 2000. The number of bedrooms in housing units in 2000 shows significant variation between regions in the Lagoon and the Outer Islands. About 45 percent of the housing units in the Outer Islands were one bedroom housing units compared to about 30 percent in the Lagoon. Housing units with two or more bedrooms were common in Northern Namoneas but rare in Pattiw.
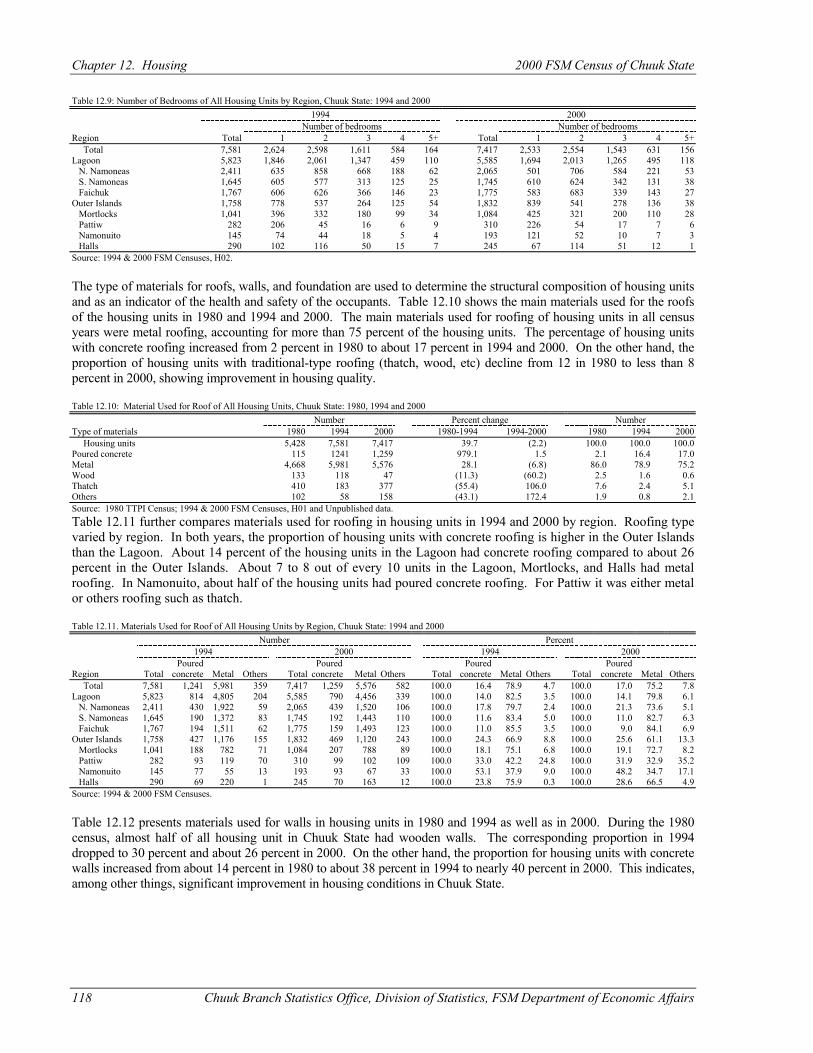
Chapter 12. Housing 2000 FSM Census of Chuuk State
118 Chuuk Branch Statistics Office, Division of Statistics, FSM Department of Economic Affairs
Table 12.9: Number of Bedrooms of All Housing Units by Region, Chuuk State: 1994 and 2000 1994 2000
Number of bedrooms Number of bedrooms Region Total 1 2 3 4 5+ Total 1 2 3 4 5+ Total 7,581 2,624 2,598 1,611 584 164 7,417 2,533 2,554 1,543 631 156 Lagoon 5,823 1,846 2,061 1,347 459 110 5,585 1,694 2,013 1,265 495 118 N. Namoneas 2,411 635 858 668 188 62 2,065 501 706 584 221 53 S. Namoneas 1,645 605 577 313 125 25 1,745 610 624 342 131 38 Faichuk 1,767 606 626 366 146 23 1,775 583 683 339 143 27 Outer Islands 1,758 778 537 264 125 54 1,832 839 541 278 136 38 Mortlocks 1,041 396 332 180 99 34 1,084 425 321 200 110 28 Pattiw 282 206 45 16 6 9 310 226 54 17 7 6 Namonuito 145 74 44 18 5 4 193 121 52 10 7 3 Halls 290 102 116 50 15 7 245 67 114 51 12 1 Source: 1994 & 2000 FSM Censuses, H02. The type of materials for roofs, walls, and foundation are used to determine the structural composition of housing units and as an indicator of the health and safety of the occupants. Table 12.10 shows the main materials used for the roofs of the housing units in 1980 and 1994 and 2000. The main materials used for roofing of housing units in all census years were metal roofing, accounting for more than 75 percent of the housing units. The percentage of housing units with concrete roofing increased from 2 percent in 1980 to about 17 percent in 1994 and 2000. On the other hand, the proportion of housing units with traditional-type roofing (thatch, wood, etc) decline from 12 in 1980 to less than 8 percent in 2000, showing improvement in housing quality. Table 12.10: Material Used for Roof of All Housing Units, Chuuk State: 1980, 1994 and 2000 Number Percent change Number Type of materials 1980 1994 2000 1980-1994 1994-2000 1980 1994 2000 Housing units 5,428 7,581 7,417 39.7 (2.2) 100.0 100.0 100.0 Poured concrete 115 1241 1,259 979.1 1.5 2.1 16.4 17.0 Metal 4,668 5,981 5,576 28.1 (6.8) 86.0 78.9 75.2 Wood 133 118 47 (11.3) (60.2) 2.5 1.6 0.6 Thatch 410 183 377 (55.4) 106.0 7.6 2.4 5.1 Others 102 58 158 (43.1) 172.4 1.9 0.8 2.1 Source: 1980 TTPI Census; 1994 & 2000 FSM Censuses, H01 and Unpublished data. Table 12.11 further compares materials used for roofing in housing units in 1994 and 2000 by region. Roofing type varied by region. In both years, the proportion of housing units with concrete roofing is higher in the Outer Islands than the Lagoon. About 14 percent of the housing units in the Lagoon had concrete roofing compared to about 26 percent in the Outer Islands. About 7 to 8 out of every 10 units in the Lagoon, Mortlocks, and Halls had metal roofing. In Namonuito, about half of the housing units had poured concrete roofing. For Pattiw it was either metal or others roofing such as thatch. Table 12.11. Materials Used for Roof of All Housing Units by Region, Chuuk State: 1994 and 2000
Number Percent 1994 2000 1994 2000 Poured Poured Poured Poured
Region Total concrete Metal Others Total concrete Metal Others Total concrete Metal Others Total concrete Metal Others Total 7,581 1,241 5,981 359 7,417 1,259 5,576 582 100.0 16.4 78.9 4.7 100.0 17.0 75.2 7.8 Lagoon 5,823 814 4,805 204 5,585 790 4,456 339 100.0 14.0 82.5 3.5 100.0 14.1 79.8 6.1 N. Namoneas 2,411 430 1,922 59 2,065 439 1,520 106 100.0 17.8 79.7 2.4 100.0 21.3 73.6 5.1 S. Namoneas 1,645 190 1,372 83 1,745 192 1,443 110 100.0 11.6 83.4 5.0 100.0 11.0 82.7 6.3 Faichuk 1,767 194 1,511 62 1,775 159 1,493 123 100.0 11.0 85.5 3.5 100.0 9.0 84.1 6.9 Outer Islands 1,758 427 1,176 155 1,832 469 1,120 243 100.0 24.3 66.9 8.8 100.0 25.6 61.1 13.3 Mortlocks 1,041 188 782 71 1,084 207 788 89 100.0 18.1 75.1 6.8 100.0 19.1 72.7 8.2 Pattiw 282 93 119 70 310 99 102 109 100.0 33.0 42.2 24.8 100.0 31.9 32.9 35.2 Namonuito 145 77 55 13 193 93 67 33 100.0 53.1 37.9 9.0 100.0 48.2 34.7 17.1 Halls 290 69 220 1 245 70 163 12 100.0 23.8 75.9 0.3 100.0 28.6 66.5 4.9 Source: 1994 & 2000 FSM Censuses. Table 12.12 presents materials used for walls in housing units in 1980 and 1994 as well as in 2000. During the 1980 census, almost half of all housing unit in Chuuk State had wooden walls. The corresponding proportion in 1994 dropped to 30 percent and about 26 percent in 2000. On the other hand, the proportion for housing units with concrete walls increased from about 14 percent in 1980 to about 38 percent in 1994 to nearly 40 percent in 2000. This indicates, among other things, significant improvement in housing conditions in Chuuk State.
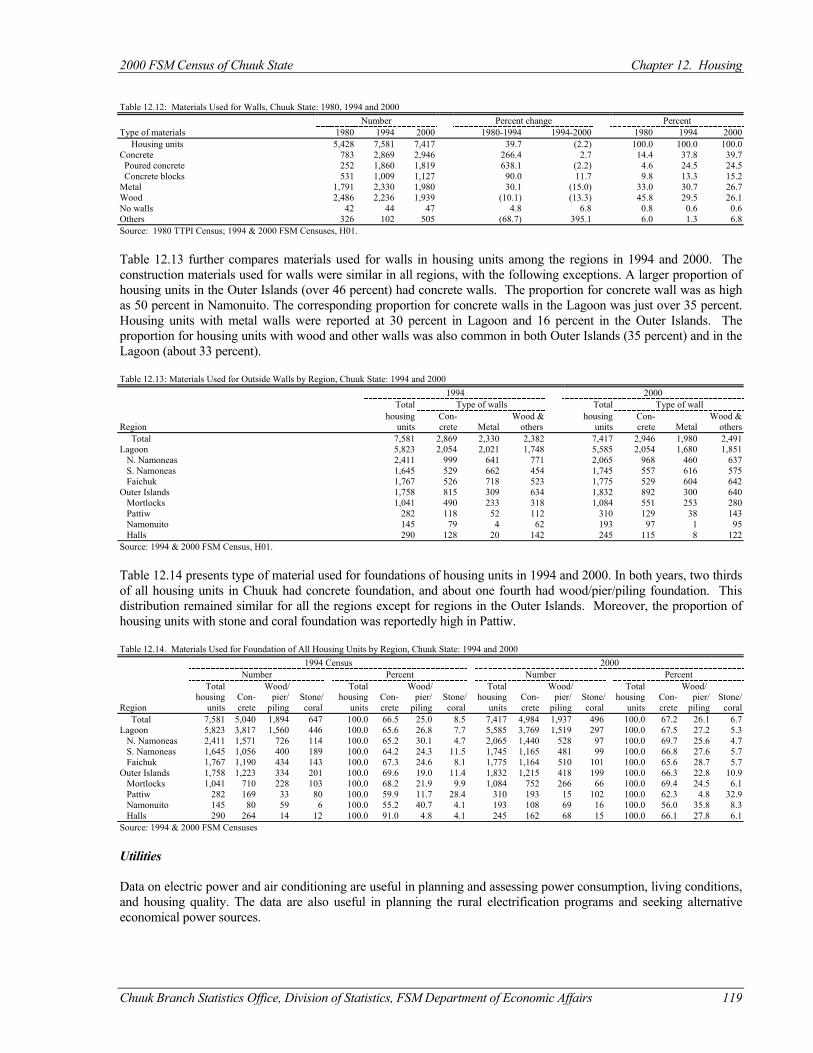
2000 FSM Census of Chuuk State Chapter 12. Housing
Chuuk Branch Statistics Office, Division of Statistics, FSM Department of Economic Affairs 119
Table 12.12: Materials Used for Walls, Chuuk State: 1980, 1994 and 2000 Number Percent change Percent Type of materials 1980 1994 2000 1980-1994 1994-2000 1980 1994 2000 Housing units 5,428 7,581 7,417 39.7 (2.2) 100.0 100.0 100.0 Concrete 783 2,869 2,946 266.4 2.7 14.4 37.8 39.7 Poured concrete 252 1,860 1,819 638.1 (2.2) 4.6 24.5 24.5 Concrete blocks 531 1,009 1,127 90.0 11.7 9.8 13.3 15.2 Metal 1,791 2,330 1,980 30.1 (15.0) 33.0 30.7 26.7 Wood 2,486 2,236 1,939 (10.1) (13.3) 45.8 29.5 26.1 No walls 42 44 47 4.8 6.8 0.8 0.6 0.6 Others 326 102 505 (68.7) 395.1 6.0 1.3 6.8 Source: 1980 TTPI Census; 1994 & 2000 FSM Censuses, H01. Table 12.13 further compares materials used for walls in housing units among the regions in 1994 and 2000. The construction materials used for walls were similar in all regions, with the following exceptions. A larger proportion of housing units in the Outer Islands (over 46 percent) had concrete walls. The proportion for concrete wall was as high as 50 percent in Namonuito. The corresponding proportion for concrete walls in the Lagoon was just over 35 percent. Housing units with metal walls were reported at 30 percent in Lagoon and 16 percent in the Outer Islands. The proportion for housing units with wood and other walls was also common in both Outer Islands (35 percent) and in the Lagoon (about 33 percent). Table 12.13: Materials Used for Outside Walls by Region, Chuuk State: 1994 and 2000 1994 2000
Total Type of walls Total Type of wall housing Con- Wood & housing Con- Wood &
Region units crete Metal others units crete Metal others Total 7,581 2,869 2,330 2,382 7,417 2,946 1,980 2,491 Lagoon 5,823 2,054 2,021 1,748 5,585 2,054 1,680 1,851 N. Namoneas 2,411 999 641 771 2,065 968 460 637 S. Namoneas 1,645 529 662 454 1,745 557 616 575 Faichuk 1,767 526 718 523 1,775 529 604 642 Outer Islands 1,758 815 309 634 1,832 892 300 640 Mortlocks 1,041 490 233 318 1,084 551 253 280 Pattiw 282 118 52 112 310 129 38 143 Namonuito 145 79 4 62 193 97 1 95 Halls 290 128 20 142 245 115 8 122 Source: 1994 & 2000 FSM Census, H01. Table 12.14 presents type of material used for foundations of housing units in 1994 and 2000. In both years, two thirds of all housing units in Chuuk had concrete foundation, and about one fourth had wood/pier/piling foundation. This distribution remained similar for all the regions except for regions in the Outer Islands. Moreover, the proportion of housing units with stone and coral foundation was reportedly high in Pattiw. Table 12.14. Materials Used for Foundation of All Housing Units by Region, Chuuk State: 1994 and 2000
1994 Census 2000 Number Percent Number Percent Total Wood/ Total Wood/ Total Wood/ Total Wood/ housing Con- pier/ Stone/ housing Con- pier/ Stone/ housing Con- pier/ Stone/ housing Con- pier/ Stone/
Region units crete piling coral units crete piling coral units crete piling coral units crete piling coral Total 7,581 5,040 1,894 647 100.0 66.5 25.0 8.5 7,417 4,984 1,937 496 100.0 67.2 26.1 6.7 Lagoon 5,823 3,817 1,560 446 100.0 65.6 26.8 7.7 5,585 3,769 1,519 297 100.0 67.5 27.2 5.3 N. Namoneas 2,411 1,571 726 114 100.0 65.2 30.1 4.7 2,065 1,440 528 97 100.0 69.7 25.6 4.7 S. Namoneas 1,645 1,056 400 189 100.0 64.2 24.3 11.5 1,745 1,165 481 99 100.0 66.8 27.6 5.7 Faichuk 1,767 1,190 434 143 100.0 67.3 24.6 8.1 1,775 1,164 510 101 100.0 65.6 28.7 5.7 Outer Islands 1,758 1,223 334 201 100.0 69.6 19.0 11.4 1,832 1,215 418 199 100.0 66.3 22.8 10.9 Mortlocks 1,041 710 228 103 100.0 68.2 21.9 9.9 1,084 752 266 66 100.0 69.4 24.5 6.1 Pattiw 282 169 33 80 100.0 59.9 11.7 28.4 310 193 15 102 100.0 62.3 4.8 32.9 Namonuito 145 80 59 6 100.0 55.2 40.7 4.1 193 108 69 16 100.0 56.0 35.8 8.3 Halls 290 264 14 12 100.0 91.0 4.8 4.1 245 162 68 15 100.0 66.1 27.8 6.1 Source: 1994 & 2000 FSM Censuses Utilities Data on electric power and air conditioning are useful in planning and assessing power consumption, living conditions, and housing quality. The data are also useful in planning the rural electrification programs and seeking alternative economical power sources.
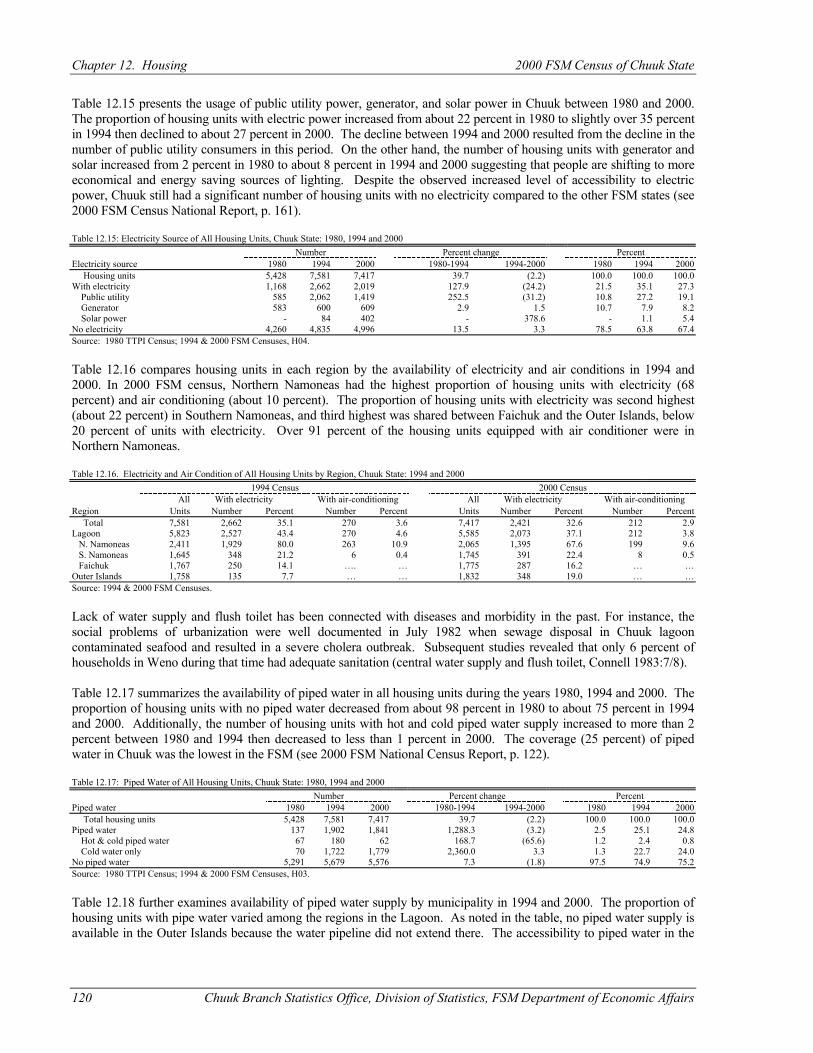
Chapter 12. Housing 2000 FSM Census of Chuuk State
120 Chuuk Branch Statistics Office, Division of Statistics, FSM Department of Economic Affairs
Table 12.15 presents the usage of public utility power, generator, and solar power in Chuuk between 1980 and 2000. The proportion of housing units with electric power increased from about 22 percent in 1980 to slightly over 35 percent in 1994 then declined to about 27 percent in 2000. The decline between 1994 and 2000 resulted from the decline in the number of public utility consumers in this period. On the other hand, the number of housing units with generator and solar increased from 2 percent in 1980 to about 8 percent in 1994 and 2000 suggesting that people are shifting to more economical and energy saving sources of lighting. Despite the observed increased level of accessibility to electric power, Chuuk still had a significant number of housing units with no electricity compared to the other FSM states (see 2000 FSM Census National Report, p. 161). Table 12.15: Electricity Source of All Housing Units, Chuuk State: 1980, 1994 and 2000 Number Percent change Percent Electricity source 1980 1994 2000 1980-1994 1994-2000 1980 1994 2000 Housing units 5,428 7,581 7,417 39.7 (2.2) 100.0 100.0 100.0 With electricity 1,168 2,662 2,019 127.9 (24.2) 21.5 35.1 27.3 Public utility 585 2,062 1,419 252.5 (31.2) 10.8 27.2 19.1 Generator 583 600 609 2.9 1.5 10.7 7.9 8.2 Solar power - 84 402 - 378.6 - 1.1 5.4 No electricity 4,260 4,835 4,996 13.5 3.3 78.5 63.8 67.4 Source: 1980 TTPI Census; 1994 & 2000 FSM Censuses, H04. Table 12.16 compares housing units in each region by the availability of electricity and air conditions in 1994 and 2000. In 2000 FSM census, Northern Namoneas had the highest proportion of housing units with electricity (68 percent) and air conditioning (about 10 percent). The proportion of housing units with electricity was second highest (about 22 percent) in Southern Namoneas, and third highest was shared between Faichuk and the Outer Islands, below 20 percent of units with electricity. Over 91 percent of the housing units equipped with air conditioner were in Northern Namoneas. Table 12.16. Electricity and Air Condition of All Housing Units by Region, Chuuk State: 1994 and 2000
1994 Census 2000 Census All With electricity With air-conditioning All With electricity With air-conditioning
Region Units Number Percent Number Percent Units Number Percent Number Percent Total 7,581 2,662 35.1 270 3.6 7,417 2,421 32.6 212 2.9 Lagoon 5,823 2,527 43.4 270 4.6 5,585 2,073 37.1 212 3.8 N. Namoneas 2,411 1,929 80.0 263 10.9 2,065 1,395 67.6 199 9.6 S. Namoneas 1,645 348 21.2 6 0.4 1,745 391 22.4 8 0.5 Faichuk 1,767 250 14.1 …. … 1,775 287 16.2 … … Outer Islands 1,758 135 7.7 … … 1,832 348 19.0 … … Source: 1994 & 2000 FSM Censuses. Lack of water supply and flush toilet has been connected with diseases and morbidity in the past. For instance, the social problems of urbanization were well documented in July 1982 when sewage disposal in Chuuk lagoon contaminated seafood and resulted in a severe cholera outbreak. Subsequent studies revealed that only 6 percent of households in Weno during that time had adequate sanitation (central water supply and flush toilet, Connell 1983:7/8). Table 12.17 summarizes the availability of piped water in all housing units during the years 1980, 1994 and 2000. The proportion of housing units with no piped water decreased from about 98 percent in 1980 to about 75 percent in 1994 and 2000. Additionally, the number of housing units with hot and cold piped water supply increased to more than 2 percent between 1980 and 1994 then decreased to less than 1 percent in 2000. The coverage (25 percent) of piped water in Chuuk was the lowest in the FSM (see 2000 FSM National Census Report, p. 122). Table 12.17: Piped Water of All Housing Units, Chuuk State: 1980, 1994 and 2000 Number Percent change Percent Piped water 1980 1994 2000 1980-1994 1994-2000 1980 1994 2000 Total housing units 5,428 7,581 7,417 39.7 (2.2) 100.0 100.0 100.0 Piped water 137 1,902 1,841 1,288.3 (3.2) 2.5 25.1 24.8 Hot & cold piped water 67 180 62 168.7 (65.6) 1.2 2.4 0.8 Cold water only 70 1,722 1,779 2,360.0 3.3 1.3 22.7 24.0 No piped water 5,291 5,679 5,576 7.3 (1.8) 97.5 74.9 75.2 Source: 1980 TTPI Census; 1994 & 2000 FSM Censuses, H03. Table 12.18 further examines availability of piped water supply by municipality in 1994 and 2000. The proportion of housing units with pipe water varied among the regions in the Lagoon. As noted in the table, no piped water supply is available in the Outer Islands because the water pipeline did not extend there. The accessibility to piped water in the
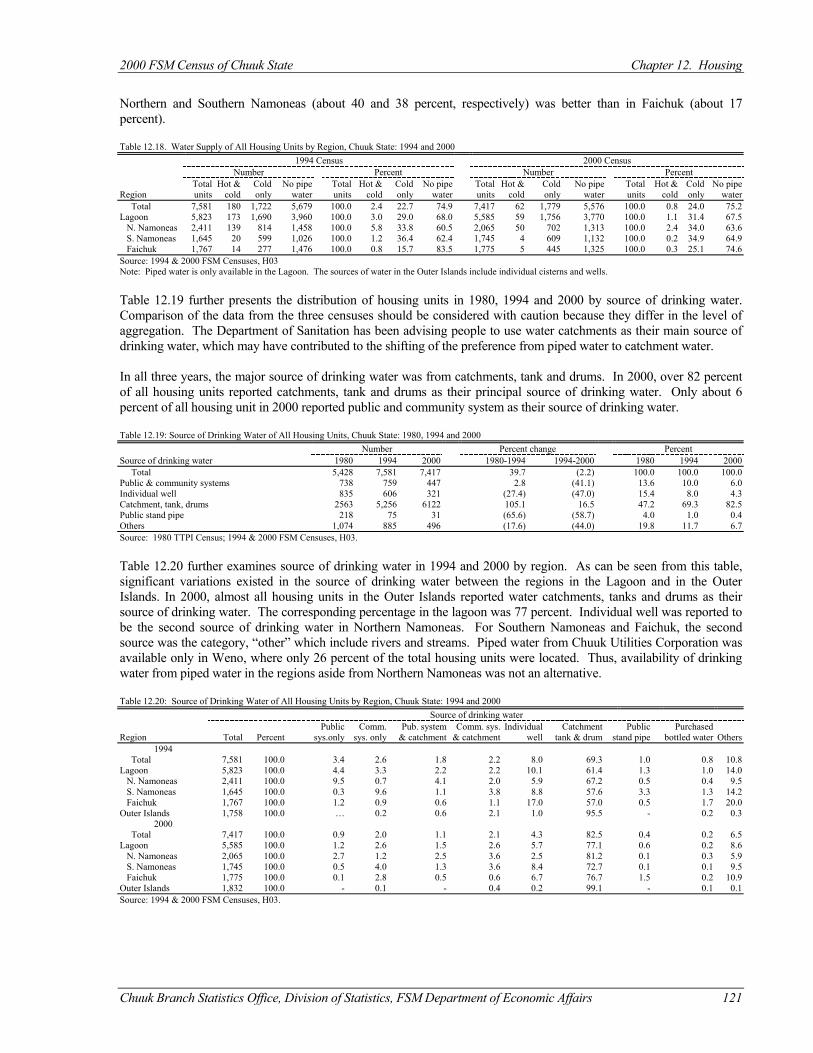
2000 FSM Census of Chuuk State Chapter 12. Housing
Chuuk Branch Statistics Office, Division of Statistics, FSM Department of Economic Affairs 121
Northern and Southern Namoneas (about 40 and 38 percent, respectively) was better than in Faichuk (about 17 percent). Table 12.18. Water Supply of All Housing Units by Region, Chuuk State: 1994 and 2000
1994 Census 2000 Census Number Percent Number Percent Total Hot & Cold No pipe Total Hot & Cold No pipe Total Hot & Cold No pipe Total Hot & Cold No pipe
Region units cold only water units cold only water units cold only water units cold only water Total 7,581 180 1,722 5,679 100.0 2.4 22.7 74.9 7,417 62 1,779 5,576 100.0 0.8 24.0 75.2 Lagoon 5,823 173 1,690 3,960 100.0 3.0 29.0 68.0 5,585 59 1,756 3,770 100.0 1.1 31.4 67.5 N. Namoneas 2,411 139 814 1,458 100.0 5.8 33.8 60.5 2,065 50 702 1,313 100.0 2.4 34.0 63.6 S. Namoneas 1,645 20 599 1,026 100.0 1.2 36.4 62.4 1,745 4 609 1,132 100.0 0.2 34.9 64.9 Faichuk 1,767 14 277 1,476 100.0 0.8 15.7 83.5 1,775 5 445 1,325 100.0 0.3 25.1 74.6 Source: 1994 & 2000 FSM Censuses, H03 Note: Piped water is only available in the Lagoon. The sources of water in the Outer Islands include individual cisterns and wells. Table 12.19 further presents the distribution of housing units in 1980, 1994 and 2000 by source of drinking water. Comparison of the data from the three censuses should be considered with caution because they differ in the level of aggregation. The Department of Sanitation has been advising people to use water catchments as their main source of drinking water, which may have contributed to the shifting of the preference from piped water to catchment water. In all three years, the major source of drinking water was from catchments, tank and drums. In 2000, over 82 percent of all housing units reported catchments, tank and drums as their principal source of drinking water. Only about 6 percent of all housing unit in 2000 reported public and community system as their source of drinking water. Table 12.19: Source of Drinking Water of All Housing Units, Chuuk State: 1980, 1994 and 2000 Number Percent change Percent Source of drinking water 1980 1994 2000 1980-1994 1994-2000 1980 1994 2000 Total 5,428 7,581 7,417 39.7 (2.2) 100.0 100.0 100.0 Public & community systems 738 759 447 2.8 (41.1) 13.6 10.0 6.0 Individual well 835 606 321 (27.4) (47.0) 15.4 8.0 4.3 Catchment, tank, drums 2563 5,256 6122 105.1 16.5 47.2 69.3 82.5 Public stand pipe 218 75 31 (65.6) (58.7) 4.0 1.0 0.4 Others 1,074 885 496 (17.6) (44.0) 19.8 11.7 6.7 Source: 1980 TTPI Census; 1994 & 2000 FSM Censuses, H03. Table 12.20 further examines source of drinking water in 1994 and 2000 by region. As can be seen from this table, significant variations existed in the source of drinking water between the regions in the Lagoon and in the Outer Islands. In 2000, almost all housing units in the Outer Islands reported water catchments, tanks and drums as their source of drinking water. The corresponding percentage in the lagoon was 77 percent. Individual well was reported to be the second source of drinking water in Northern Namoneas. For Southern Namoneas and Faichuk, the second source was the category, “other” which include rivers and streams. Piped water from Chuuk Utilities Corporation was available only in Weno, where only 26 percent of the total housing units were located. Thus, availability of drinking water from piped water in the regions aside from Northern Namoneas was not an alternative. Table 12.20: Source of Drinking Water of All Housing Units by Region, Chuuk State: 1994 and 2000 Source of drinking water Region
Total
Percent
Public sys.only
Comm. sys. only
Pub. system & catchment
Comm. sys. & catchment
Individual well
Catchment tank & drum
Public stand pipe
Purchased bottled water
Others
1994 Total 7,581 100.0 3.4 2.6 1.8 2.2 8.0 69.3 1.0 0.8 10.8 Lagoon 5,823 100.0 4.4 3.3 2.2 2.2 10.1 61.4 1.3 1.0 14.0 N. Namoneas 2,411 100.0 9.5 0.7 4.1 2.0 5.9 67.2 0.5 0.4 9.5 S. Namoneas 1,645 100.0 0.3 9.6 1.1 3.8 8.8 57.6 3.3 1.3 14.2 Faichuk 1,767 100.0 1.2 0.9 0.6 1.1 17.0 57.0 0.5 1.7 20.0 Outer Islands 1,758 100.0 … 0.2 0.6 2.1 1.0 95.5 - 0.2 0.3
2000 Total 7,417 100.0 0.9 2.0 1.1 2.1 4.3 82.5 0.4 0.2 6.5 Lagoon 5,585 100.0 1.2 2.6 1.5 2.6 5.7 77.1 0.6 0.2 8.6 N. Namoneas 2,065 100.0 2.7 1.2 2.5 3.6 2.5 81.2 0.1 0.3 5.9 S. Namoneas 1,745 100.0 0.5 4.0 1.3 3.6 8.4 72.7 0.1 0.1 9.5 Faichuk 1,775 100.0 0.1 2.8 0.5 0.6 6.7 76.7 1.5 0.2 10.9 Outer Islands 1,832 100.0 - 0.1 - 0.4 0.2 99.1 - 0.1 0.1 Source: 1994 & 2000 FSM Censuses, H03.
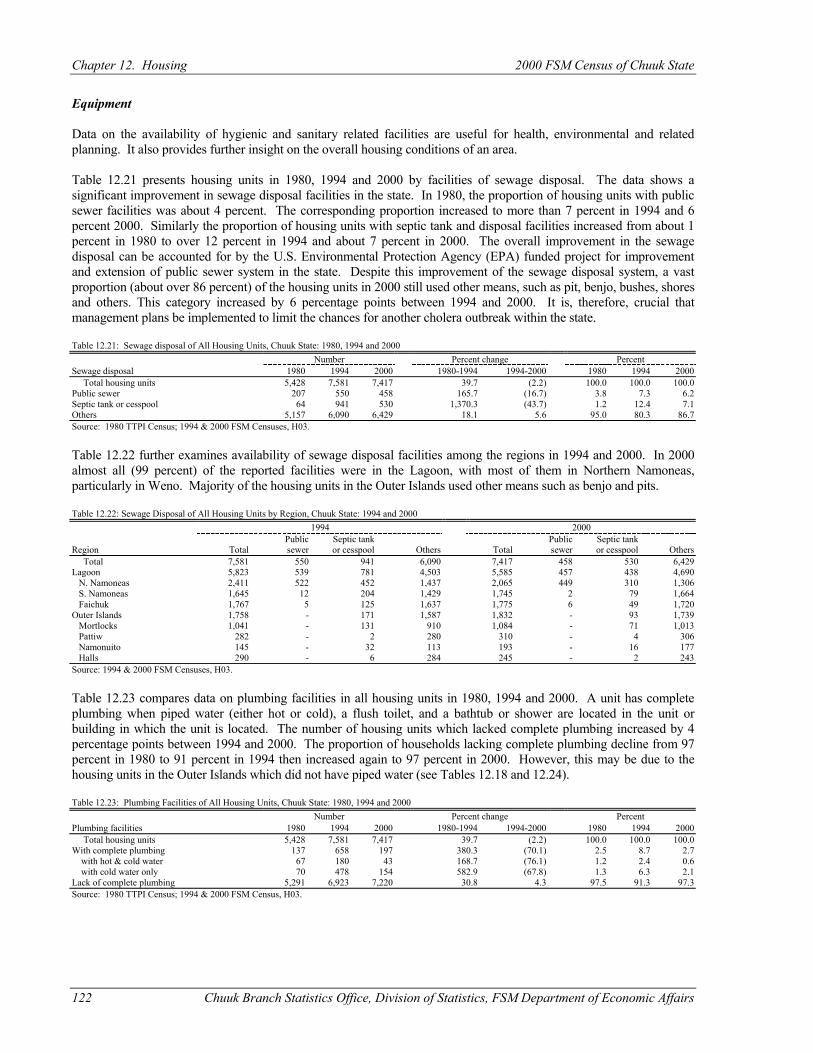
Chapter 12. Housing 2000 FSM Census of Chuuk State
122 Chuuk Branch Statistics Office, Division of Statistics, FSM Department of Economic Affairs
Equipment Data on the availability of hygienic and sanitary related facilities are useful for health, environmental and related planning. It also provides further insight on the overall housing conditions of an area. Table 12.21 presents housing units in 1980, 1994 and 2000 by facilities of sewage disposal. The data shows a significant improvement in sewage disposal facilities in the state. In 1980, the proportion of housing units with public sewer facilities was about 4 percent. The corresponding proportion increased to more than 7 percent in 1994 and 6 percent 2000. Similarly the proportion of housing units with septic tank and disposal facilities increased from about 1 percent in 1980 to over 12 percent in 1994 and about 7 percent in 2000. The overall improvement in the sewage disposal can be accounted for by the U.S. Environmental Protection Agency (EPA) funded project for improvement and extension of public sewer system in the state. Despite this improvement of the sewage disposal system, a vast proportion (about over 86 percent) of the housing units in 2000 still used other means, such as pit, benjo, bushes, shores and others. This category increased by 6 percentage points between 1994 and 2000. It is, therefore, crucial that management plans be implemented to limit the chances for another cholera outbreak within the state. Table 12.21: Sewage disposal of All Housing Units, Chuuk State: 1980, 1994 and 2000 Number Percent change Percent Sewage disposal 1980 1994 2000 1980-1994 1994-2000 1980 1994 2000 Total housing units 5,428 7,581 7,417 39.7 (2.2) 100.0 100.0 100.0 Public sewer 207 550 458 165.7 (16.7) 3.8 7.3 6.2 Septic tank or cesspool 64 941 530 1,370.3 (43.7) 1.2 12.4 7.1 Others 5,157 6,090 6,429 18.1 5.6 95.0 80.3 86.7 Source: 1980 TTPI Census; 1994 & 2000 FSM Censuses, H03. Table 12.22 further examines availability of sewage disposal facilities among the regions in 1994 and 2000. In 2000 almost all (99 percent) of the reported facilities were in the Lagoon, with most of them in Northern Namoneas, particularly in Weno. Majority of the housing units in the Outer Islands used other means such as benjo and pits. Table 12.22: Sewage Disposal of All Housing Units by Region, Chuuk State: 1994 and 2000 1994 2000 Public Septic tank Public Septic tank Region Total sewer or cesspool Others Total sewer or cesspool Others Total 7,581 550 941 6,090 7,417 458 530 6,429 Lagoon 5,823 539 781 4,503 5,585 457 438 4,690 N. Namoneas 2,411 522 452 1,437 2,065 449 310 1,306 S. Namoneas 1,645 12 204 1,429 1,745 2 79 1,664 Faichuk 1,767 5 125 1,637 1,775 6 49 1,720 Outer Islands 1,758 - 171 1,587 1,832 - 93 1,739 Mortlocks 1,041 - 131 910 1,084 - 71 1,013 Pattiw 282 - 2 280 310 - 4 306 Namonuito 145 - 32 113 193 - 16 177 Halls 290 - 6 284 245 - 2 243 Source: 1994 & 2000 FSM Censuses, H03. Table 12.23 compares data on plumbing facilities in all housing units in 1980, 1994 and 2000. A unit has complete plumbing when piped water (either hot or cold), a flush toilet, and a bathtub or shower are located in the unit or building in which the unit is located. The number of housing units which lacked complete plumbing increased by 4 percentage points between 1994 and 2000. The proportion of households lacking complete plumbing decline from 97 percent in 1980 to 91 percent in 1994 then increased again to 97 percent in 2000. However, this may be due to the housing units in the Outer Islands which did not have piped water (see Tables 12.18 and 12.24). Table 12.23: Plumbing Facilities of All Housing Units, Chuuk State: 1980, 1994 and 2000 Number Percent change Percent Plumbing facilities 1980 1994 2000 1980-1994 1994-2000 1980 1994 2000 Total housing units 5,428 7,581 7,417 39.7 (2.2) 100.0 100.0 100.0 With complete plumbing 137 658 197 380.3 (70.1) 2.5 8.7 2.7 with hot & cold water 67 180 43 168.7 (76.1) 1.2 2.4 0.6 with cold water only 70 478 154 582.9 (67.8) 1.3 6.3 2.1 Lack of complete plumbing 5,291 6,923 7,220 30.8 4.3 97.5 91.3 97.3 Source: 1980 TTPI Census; 1994 & 2000 FSM Census, H03.
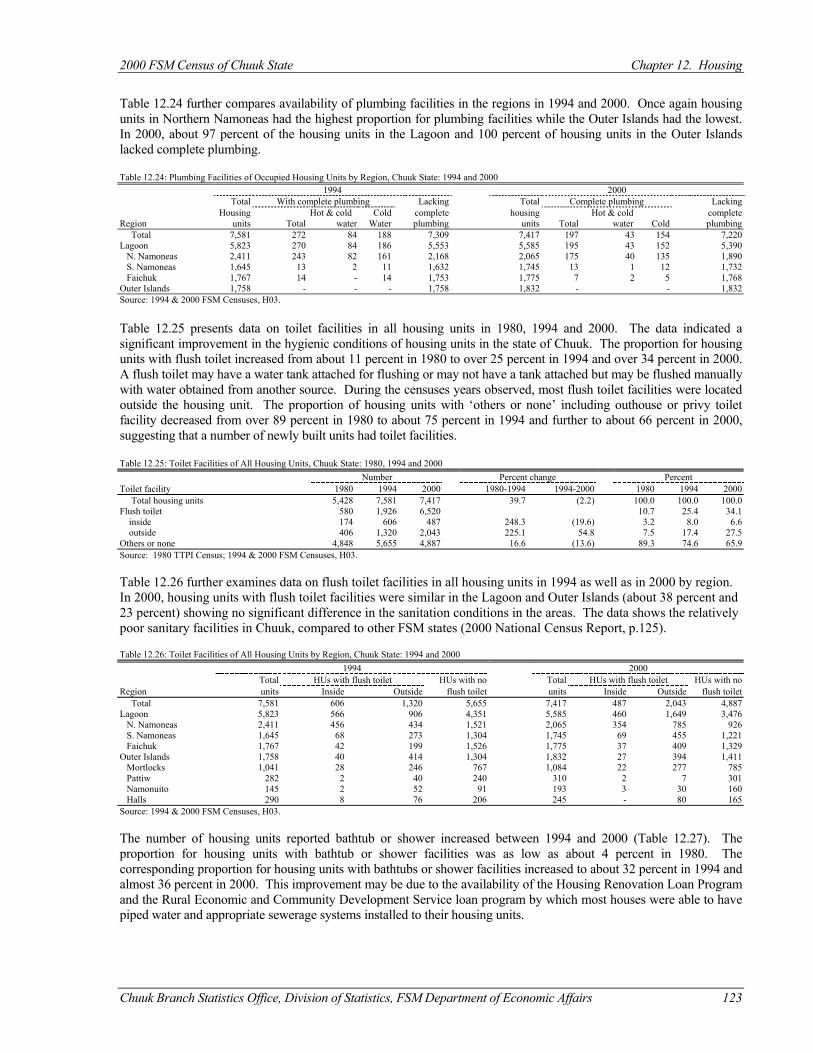
2000 FSM Census of Chuuk State Chapter 12. Housing
Chuuk Branch Statistics Office, Division of Statistics, FSM Department of Economic Affairs 123
Table 12.24 further compares availability of plumbing facilities in the regions in 1994 and 2000. Once again housing units in Northern Namoneas had the highest proportion for plumbing facilities while the Outer Islands had the lowest. In 2000, about 97 percent of the housing units in the Lagoon and 100 percent of housing units in the Outer Islands lacked complete plumbing. Table 12.24: Plumbing Facilities of Occupied Housing Units by Region, Chuuk State: 1994 and 2000 1994 2000
Total With complete plumbing Lacking Total Complete plumbing Lacking Housing Hot & cold Cold complete housing Hot & cold complete
Region units Total water Water plumbing units Total water Cold plumbing Total 7,581 272 84 188 7,309 7,417 197 43 154 7,220 Lagoon 5,823 270 84 186 5,553 5,585 195 43 152 5,390 N. Namoneas 2,411 243 82 161 2,168 2,065 175 40 135 1,890 S. Namoneas 1,645 13 2 11 1,632 1,745 13 1 12 1,732 Faichuk 1,767 14 - 14 1,753 1,775 7 2 5 1,768 Outer Islands 1,758 - - - 1,758 1,832 - - 1,832 Source: 1994 & 2000 FSM Censuses, H03. Table 12.25 presents data on toilet facilities in all housing units in 1980, 1994 and 2000. The data indicated a significant improvement in the hygienic conditions of housing units in the state of Chuuk. The proportion for housing units with flush toilet increased from about 11 percent in 1980 to over 25 percent in 1994 and over 34 percent in 2000. A flush toilet may have a water tank attached for flushing or may not have a tank attached but may be flushed manually with water obtained from another source. During the censuses years observed, most flush toilet facilities were located outside the housing unit. The proportion of housing units with ‘others or none’ including outhouse or privy toilet facility decreased from over 89 percent in 1980 to about 75 percent in 1994 and further to about 66 percent in 2000, suggesting that a number of newly built units had toilet facilities. Table 12.25: Toilet Facilities of All Housing Units, Chuuk State: 1980, 1994 and 2000 Number Percent change Percent Toilet facility 1980 1994 2000 1980-1994 1994-2000 1980 1994 2000 Total housing units 5,428 7,581 7,417 39.7 (2.2) 100.0 100.0 100.0 Flush toilet 580 1,926 6,520 10.7 25.4 34.1 inside 174 606 487 248.3 (19.6) 3.2 8.0 6.6 outside 406 1,320 2,043 225.1 54.8 7.5 17.4 27.5 Others or none 4,848 5,655 4,887 16.6 (13.6) 89.3 74.6 65.9 Source: 1980 TTPI Census; 1994 & 2000 FSM Censuses, H03. Table 12.26 further examines data on flush toilet facilities in all housing units in 1994 as well as in 2000 by region. In 2000, housing units with flush toilet facilities were similar in the Lagoon and Outer Islands (about 38 percent and 23 percent) showing no significant difference in the sanitation conditions in the areas. The data shows the relatively poor sanitary facilities in Chuuk, compared to other FSM states (2000 National Census Report, p.125). Table 12.26: Toilet Facilities of All Housing Units by Region, Chuuk State: 1994 and 2000 1994 2000 Total HUs with flush toilet HUs with no Total HUs with flush toilet HUs with no Region units Inside Outside flush toilet units Inside Outside flush toilet Total 7,581 606 1,320 5,655 7,417 487 2,043 4,887 Lagoon 5,823 566 906 4,351 5,585 460 1,649 3,476 N. Namoneas 2,411 456 434 1,521 2,065 354 785 926 S. Namoneas 1,645 68 273 1,304 1,745 69 455 1,221 Faichuk 1,767 42 199 1,526 1,775 37 409 1,329 Outer Islands 1,758 40 414 1,304 1,832 27 394 1,411 Mortlocks 1,041 28 246 767 1,084 22 277 785 Pattiw 282 2 40 240 310 2 7 301 Namonuito 145 2 52 91 193 3 30 160 Halls 290 8 76 206 245 - 80 165 Source: 1994 & 2000 FSM Censuses, H03. The number of housing units reported bathtub or shower increased between 1994 and 2000 (Table 12.27). The proportion for housing units with bathtub or shower facilities was as low as about 4 percent in 1980. The corresponding proportion for housing units with bathtubs or shower facilities increased to about 32 percent in 1994 and almost 36 percent in 2000. This improvement may be due to the availability of the Housing Renovation Loan Program and the Rural Economic and Community Development Service loan program by which most houses were able to have piped water and appropriate sewerage systems installed to their housing units.
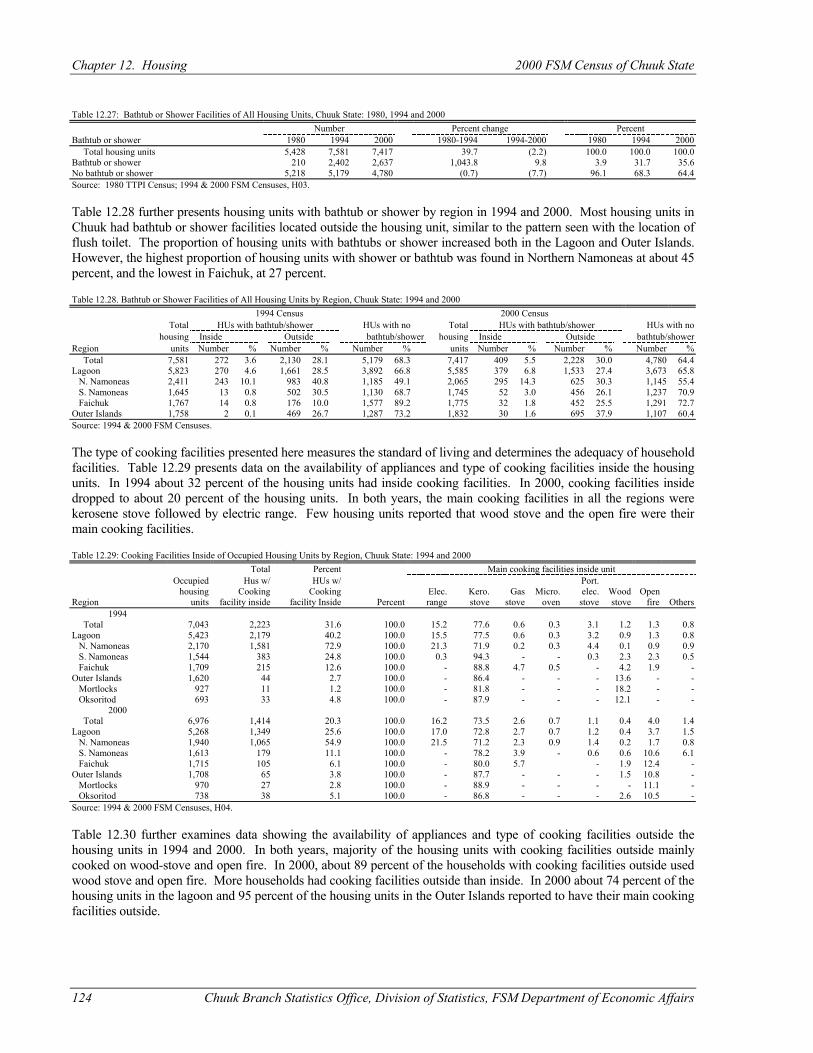
Chapter 12. Housing 2000 FSM Census of Chuuk State
124 Chuuk Branch Statistics Office, Division of Statistics, FSM Department of Economic Affairs
Table 12.27: Bathtub or Shower Facilities of All Housing Units, Chuuk State: 1980, 1994 and 2000 Number Percent change Percent Bathtub or shower 1980 1994 2000 1980-1994 1994-2000 1980 1994 2000 Total housing units 5,428 7,581 7,417 39.7 (2.2) 100.0 100.0 100.0 Bathtub or shower 210 2,402 2,637 1,043.8 9.8 3.9 31.7 35.6 No bathtub or shower 5,218 5,179 4,780 (0.7) (7.7) 96.1 68.3 64.4 Source: 1980 TTPI Census; 1994 & 2000 FSM Censuses, H03. Table 12.28 further presents housing units with bathtub or shower by region in 1994 and 2000. Most housing units in Chuuk had bathtub or shower facilities located outside the housing unit, similar to the pattern seen with the location of flush toilet. The proportion of housing units with bathtubs or shower increased both in the Lagoon and Outer Islands. However, the highest proportion of housing units with shower or bathtub was found in Northern Namoneas at about 45 percent, and the lowest in Faichuk, at 27 percent. Table 12.28. Bathtub or Shower Facilities of All Housing Units by Region, Chuuk State: 1994 and 2000
1994 Census 2000 Census Total HUs with bathtub/shower HUs with no Total HUs with bathtub/shower HUs with no housing Inside Outside bathtub/shower housing Inside Outside bathtub/shower
Region units Number % Number % Number % units Number % Number % Number % Total 7,581 272 3.6 2,130 28.1 5,179 68.3 7,417 409 5.5 2,228 30.0 4,780 64.4 Lagoon 5,823 270 4.6 1,661 28.5 3,892 66.8 5,585 379 6.8 1,533 27.4 3,673 65.8 N. Namoneas 2,411 243 10.1 983 40.8 1,185 49.1 2,065 295 14.3 625 30.3 1,145 55.4 S. Namoneas 1,645 13 0.8 502 30.5 1,130 68.7 1,745 52 3.0 456 26.1 1,237 70.9 Faichuk 1,767 14 0.8 176 10.0 1,577 89.2 1,775 32 1.8 452 25.5 1,291 72.7 Outer Islands 1,758 2 0.1 469 26.7 1,287 73.2 1,832 30 1.6 695 37.9 1,107 60.4 Source: 1994 & 2000 FSM Censuses. The type of cooking facilities presented here measures the standard of living and determines the adequacy of household facilities. Table 12.29 presents data on the availability of appliances and type of cooking facilities inside the housing units. In 1994 about 32 percent of the housing units had inside cooking facilities. In 2000, cooking facilities inside dropped to about 20 percent of the housing units. In both years, the main cooking facilities in all the regions were kerosene stove followed by electric range. Few housing units reported that wood stove and the open fire were their main cooking facilities. Table 12.29: Cooking Facilities Inside of Occupied Housing Units by Region, Chuuk State: 1994 and 2000
Total Percent Main cooking facilities inside unit Occupied Hus w/ HUs w/ Port.
housing Cooking Cooking Elec. Kero. Gas Micro. elec. Wood Open Region units facility inside facility Inside Percent range stove stove oven stove stove fire Others
1994 Total 7,043 2,223 31.6 100.0 15.2 77.6 0.6 0.3 3.1 1.2 1.3 0.8 Lagoon 5,423 2,179 40.2 100.0 15.5 77.5 0.6 0.3 3.2 0.9 1.3 0.8 N. Namoneas 2,170 1,581 72.9 100.0 21.3 71.9 0.2 0.3 4.4 0.1 0.9 0.9 S. Namoneas 1,544 383 24.8 100.0 0.3 94.3 - - 0.3 2.3 2.3 0.5 Faichuk 1,709 215 12.6 100.0 - 88.8 4.7 0.5 - 4.2 1.9 - Outer Islands 1,620 44 2.7 100.0 - 86.4 - - - 13.6 - - Mortlocks 927 11 1.2 100.0 - 81.8 - - - 18.2 - - Oksoritod 693 33 4.8 100.0 - 87.9 - - - 12.1 - -
2000 Total 6,976 1,414 20.3 100.0 16.2 73.5 2.6 0.7 1.1 0.4 4.0 1.4 Lagoon 5,268 1,349 25.6 100.0 17.0 72.8 2.7 0.7 1.2 0.4 3.7 1.5 N. Namoneas 1,940 1,065 54.9 100.0 21.5 71.2 2.3 0.9 1.4 0.2 1.7 0.8 S. Namoneas 1,613 179 11.1 100.0 - 78.2 3.9 - 0.6 0.6 10.6 6.1 Faichuk 1,715 105 6.1 100.0 - 80.0 5.7 - 1.9 12.4 - Outer Islands 1,708 65 3.8 100.0 - 87.7 - - - 1.5 10.8 - Mortlocks 970 27 2.8 100.0 - 88.9 - - - - 11.1 - Oksoritod 738 38 5.1 100.0 - 86.8 - - - 2.6 10.5 - Source: 1994 & 2000 FSM Censuses, H04. Table 12.30 further examines data showing the availability of appliances and type of cooking facilities outside the housing units in 1994 and 2000. In both years, majority of the housing units with cooking facilities outside mainly cooked on wood-stove and open fire. In 2000, about 89 percent of the households with cooking facilities outside used wood stove and open fire. More households had cooking facilities outside than inside. In 2000 about 74 percent of the housing units in the lagoon and 95 percent of the housing units in the Outer Islands reported to have their main cooking facilities outside.
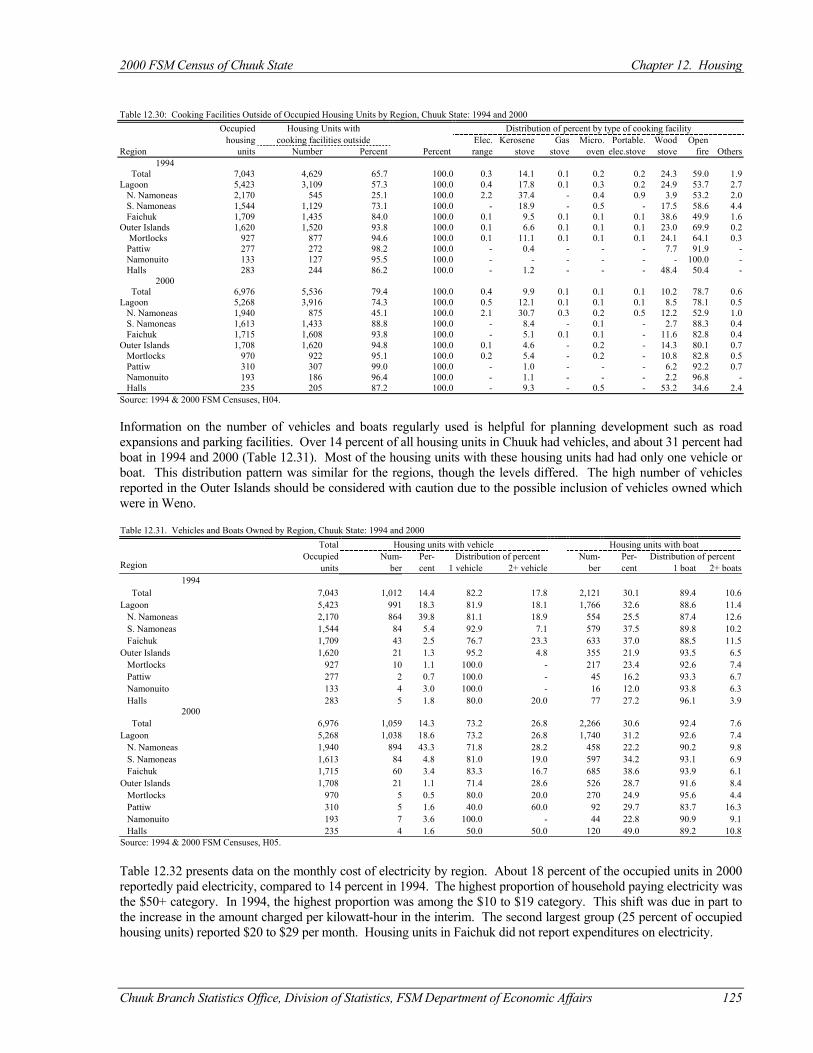
2000 FSM Census of Chuuk State Chapter 12. Housing
Chuuk Branch Statistics Office, Division of Statistics, FSM Department of Economic Affairs 125
Table 12.30: Cooking Facilities Outside of Occupied Housing Units by Region, Chuuk State: 1994 and 2000
Occupied Housing Units with Distribution of percent by type of cooking facility housing cooking facilities outside Elec. Kerosene Gas Micro. Portable. Wood Open Region units Number Percent Percent range stove stove oven elec.stove stove fire Others
1994 Total 7,043 4,629 65.7 100.0 0.3 14.1 0.1 0.2 0.2 24.3 59.0 1.9 Lagoon 5,423 3,109 57.3 100.0 0.4 17.8 0.1 0.3 0.2 24.9 53.7 2.7 N. Namoneas 2,170 545 25.1 100.0 2.2 37.4 - 0.4 0.9 3.9 53.2 2.0 S. Namoneas 1,544 1,129 73.1 100.0 - 18.9 - 0.5 - 17.5 58.6 4.4 Faichuk 1,709 1,435 84.0 100.0 0.1 9.5 0.1 0.1 0.1 38.6 49.9 1.6 Outer Islands 1,620 1,520 93.8 100.0 0.1 6.6 0.1 0.1 0.1 23.0 69.9 0.2 Mortlocks 927 877 94.6 100.0 0.1 11.1 0.1 0.1 0.1 24.1 64.1 0.3 Pattiw 277 272 98.2 100.0 - 0.4 - - - 7.7 91.9 - Namonuito 133 127 95.5 100.0 - - - - - - 100.0 - Halls 283 244 86.2 100.0 - 1.2 - - - 48.4 50.4 -
2000 Total 6,976 5,536 79.4 100.0 0.4 9.9 0.1 0.1 0.1 10.2 78.7 0.6 Lagoon 5,268 3,916 74.3 100.0 0.5 12.1 0.1 0.1 0.1 8.5 78.1 0.5 N. Namoneas 1,940 875 45.1 100.0 2.1 30.7 0.3 0.2 0.5 12.2 52.9 1.0 S. Namoneas 1,613 1,433 88.8 100.0 - 8.4 - 0.1 - 2.7 88.3 0.4 Faichuk 1,715 1,608 93.8 100.0 - 5.1 0.1 0.1 - 11.6 82.8 0.4 Outer Islands 1,708 1,620 94.8 100.0 0.1 4.6 - 0.2 - 14.3 80.1 0.7 Mortlocks 970 922 95.1 100.0 0.2 5.4 - 0.2 - 10.8 82.8 0.5 Pattiw 310 307 99.0 100.0 - 1.0 - - - 6.2 92.2 0.7 Namonuito 193 186 96.4 100.0 - 1.1 - - - 2.2 96.8 - Halls 235 205 87.2 100.0 - 9.3 - 0.5 - 53.2 34.6 2.4 Source: 1994 & 2000 FSM Censuses, H04. Information on the number of vehicles and boats regularly used is helpful for planning development such as road expansions and parking facilities. Over 14 percent of all housing units in Chuuk had vehicles, and about 31 percent had boat in 1994 and 2000 (Table 12.31). Most of the housing units with these housing units had had only one vehicle or boat. This distribution pattern was similar for the regions, though the levels differed. The high number of vehicles reported in the Outer Islands should be considered with caution due to the possible inclusion of vehicles owned which were in Weno. Table 12.31. Vehicles and Boats Owned by Region, Chuuk State: 1994 and 2000
Total Housing units with vehicle Housing units with boat Occupied Num- Per- Distribution of percent Num- Per- Distribution of percent
Region units ber cent 1 vehicle 2+ vehicle ber cent 1 boat 2+ boats 1994
Total 7,043 1,012 14.4 82.2 17.8 2,121 30.1 89.4 10.6 Lagoon 5,423 991 18.3 81.9 18.1 1,766 32.6 88.6 11.4 N. Namoneas 2,170 864 39.8 81.1 18.9 554 25.5 87.4 12.6 S. Namoneas 1,544 84 5.4 92.9 7.1 579 37.5 89.8 10.2 Faichuk 1,709 43 2.5 76.7 23.3 633 37.0 88.5 11.5 Outer Islands 1,620 21 1.3 95.2 4.8 355 21.9 93.5 6.5 Mortlocks 927 10 1.1 100.0 - 217 23.4 92.6 7.4 Pattiw 277 2 0.7 100.0 - 45 16.2 93.3 6.7 Namonuito 133 4 3.0 100.0 - 16 12.0 93.8 6.3 Halls 283 5 1.8 80.0 20.0 77 27.2 96.1 3.9
2000 Total 6,976 1,059 14.3 73.2 26.8 2,266 30.6 92.4 7.6 Lagoon 5,268 1,038 18.6 73.2 26.8 1,740 31.2 92.6 7.4 N. Namoneas 1,940 894 43.3 71.8 28.2 458 22.2 90.2 9.8 S. Namoneas 1,613 84 4.8 81.0 19.0 597 34.2 93.1 6.9 Faichuk 1,715 60 3.4 83.3 16.7 685 38.6 93.9 6.1 Outer Islands 1,708 21 1.1 71.4 28.6 526 28.7 91.6 8.4 Mortlocks 970 5 0.5 80.0 20.0 270 24.9 95.6 4.4 Pattiw 310 5 1.6 40.0 60.0 92 29.7 83.7 16.3 Namonuito 193 7 3.6 100.0 - 44 22.8 90.9 9.1 Halls 235 4 1.6 50.0 50.0 120 49.0 89.2 10.8 Source: 1994 & 2000 FSM Censuses, H05. Table 12.32 presents data on the monthly cost of electricity by region. About 18 percent of the occupied units in 2000 reportedly paid electricity, compared to 14 percent in 1994. The highest proportion of household paying electricity was the $50+ category. In 1994, the highest proportion was among the $10 to $19 category. This shift was due in part to the increase in the amount charged per kilowatt-hour in the interim. The second largest group (25 percent of occupied housing units) reported $20 to $29 per month. Housing units in Faichuk did not report expenditures on electricity.
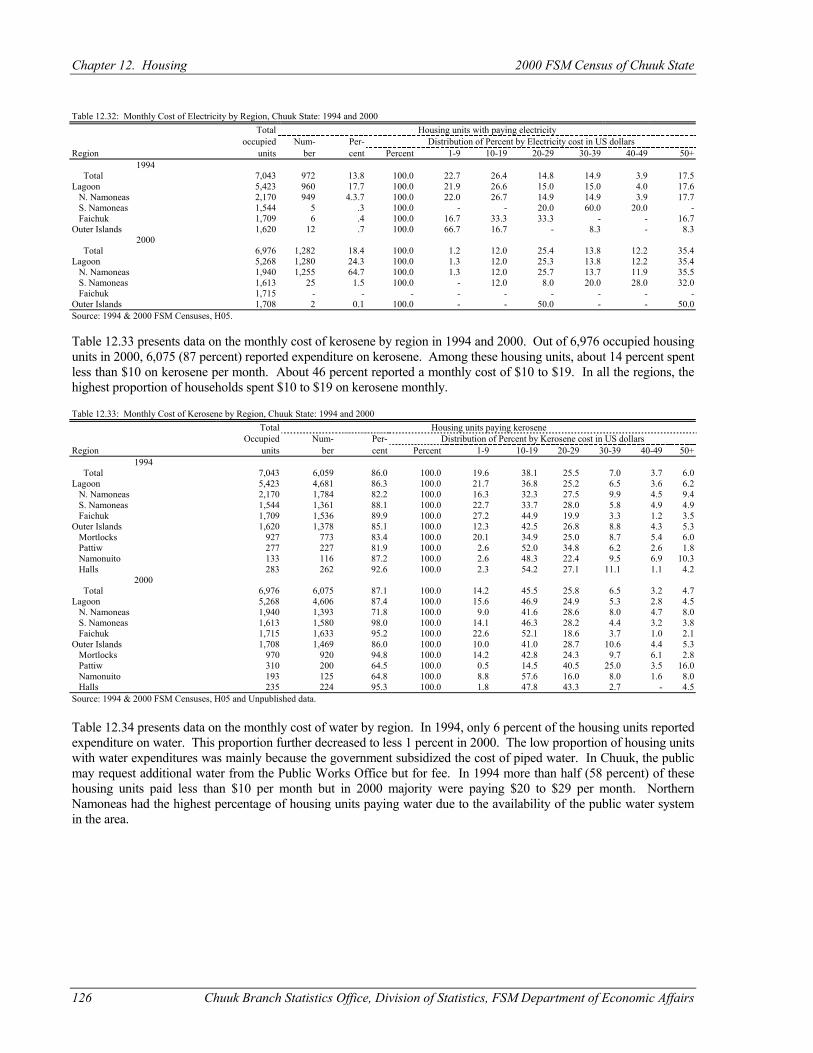
Chapter 12. Housing 2000 FSM Census of Chuuk State
126 Chuuk Branch Statistics Office, Division of Statistics, FSM Department of Economic Affairs
Table 12.32: Monthly Cost of Electricity by Region, Chuuk State: 1994 and 2000
Total Housing units with paying electricity occupied Num- Per- Distribution of Percent by Electricity cost in US dollars
Region units ber cent Percent 1-9 10-19 20-29 30-39 40-49 50+ 1994
Total 7,043 972 13.8 100.0 22.7 26.4 14.8 14.9 3.9 17.5 Lagoon 5,423 960 17.7 100.0 21.9 26.6 15.0 15.0 4.0 17.6 N. Namoneas 2,170 949 4.3.7 100.0 22.0 26.7 14.9 14.9 3.9 17.7 S. Namoneas 1,544 5 .3 100.0 - - 20.0 60.0 20.0 - Faichuk 1,709 6 .4 100.0 16.7 33.3 33.3 - - 16.7 Outer Islands 1,620 12 .7 100.0 66.7 16.7 - 8.3 - 8.3
2000 Total 6,976 1,282 18.4 100.0 1.2 12.0 25.4 13.8 12.2 35.4 Lagoon 5,268 1,280 24.3 100.0 1.3 12.0 25.3 13.8 12.2 35.4 N. Namoneas 1,940 1,255 64.7 100.0 1.3 12.0 25.7 13.7 11.9 35.5 S. Namoneas 1,613 25 1.5 100.0 - 12.0 8.0 20.0 28.0 32.0 Faichuk 1,715 - - - - - - - - - Outer Islands 1,708 2 0.1 100.0 - - 50.0 - - 50.0 Source: 1994 & 2000 FSM Censuses, H05. Table 12.33 presents data on the monthly cost of kerosene by region in 1994 and 2000. Out of 6,976 occupied housing units in 2000, 6,075 (87 percent) reported expenditure on kerosene. Among these housing units, about 14 percent spent less than $10 on kerosene per month. About 46 percent reported a monthly cost of $10 to $19. In all the regions, the highest proportion of households spent $10 to $19 on kerosene monthly. Table 12.33: Monthly Cost of Kerosene by Region, Chuuk State: 1994 and 2000
Total Housing units paying kerosene Occupied Num- Per- Distribution of Percent by Kerosene cost in US dollars
Region units ber cent Percent 1-9 10-19 20-29 30-39 40-49 50+ 1994
Total 7,043 6,059 86.0 100.0 19.6 38.1 25.5 7.0 3.7 6.0 Lagoon 5,423 4,681 86.3 100.0 21.7 36.8 25.2 6.5 3.6 6.2 N. Namoneas 2,170 1,784 82.2 100.0 16.3 32.3 27.5 9.9 4.5 9.4 S. Namoneas 1,544 1,361 88.1 100.0 22.7 33.7 28.0 5.8 4.9 4.9 Faichuk 1,709 1,536 89.9 100.0 27.2 44.9 19.9 3.3 1.2 3.5 Outer Islands 1,620 1,378 85.1 100.0 12.3 42.5 26.8 8.8 4.3 5.3 Mortlocks 927 773 83.4 100.0 20.1 34.9 25.0 8.7 5.4 6.0 Pattiw 277 227 81.9 100.0 2.6 52.0 34.8 6.2 2.6 1.8 Namonuito 133 116 87.2 100.0 2.6 48.3 22.4 9.5 6.9 10.3 Halls 283 262 92.6 100.0 2.3 54.2 27.1 11.1 1.1 4.2
2000 Total 6,976 6,075 87.1 100.0 14.2 45.5 25.8 6.5 3.2 4.7 Lagoon 5,268 4,606 87.4 100.0 15.6 46.9 24.9 5.3 2.8 4.5 N. Namoneas 1,940 1,393 71.8 100.0 9.0 41.6 28.6 8.0 4.7 8.0 S. Namoneas 1,613 1,580 98.0 100.0 14.1 46.3 28.2 4.4 3.2 3.8 Faichuk 1,715 1,633 95.2 100.0 22.6 52.1 18.6 3.7 1.0 2.1 Outer Islands 1,708 1,469 86.0 100.0 10.0 41.0 28.7 10.6 4.4 5.3 Mortlocks 970 920 94.8 100.0 14.2 42.8 24.3 9.7 6.1 2.8 Pattiw 310 200 64.5 100.0 0.5 14.5 40.5 25.0 3.5 16.0 Namonuito 193 125 64.8 100.0 8.8 57.6 16.0 8.0 1.6 8.0 Halls 235 224 95.3 100.0 1.8 47.8 43.3 2.7 - 4.5 Source: 1994 & 2000 FSM Censuses, H05 and Unpublished data. Table 12.34 presents data on the monthly cost of water by region. In 1994, only 6 percent of the housing units reported expenditure on water. This proportion further decreased to less 1 percent in 2000. The low proportion of housing units with water expenditures was mainly because the government subsidized the cost of piped water. In Chuuk, the public may request additional water from the Public Works Office but for fee. In 1994 more than half (58 percent) of these housing units paid less than $10 per month but in 2000 majority were paying $20 to $29 per month. Northern Namoneas had the highest percentage of housing units paying water due to the availability of the public water system in the area.
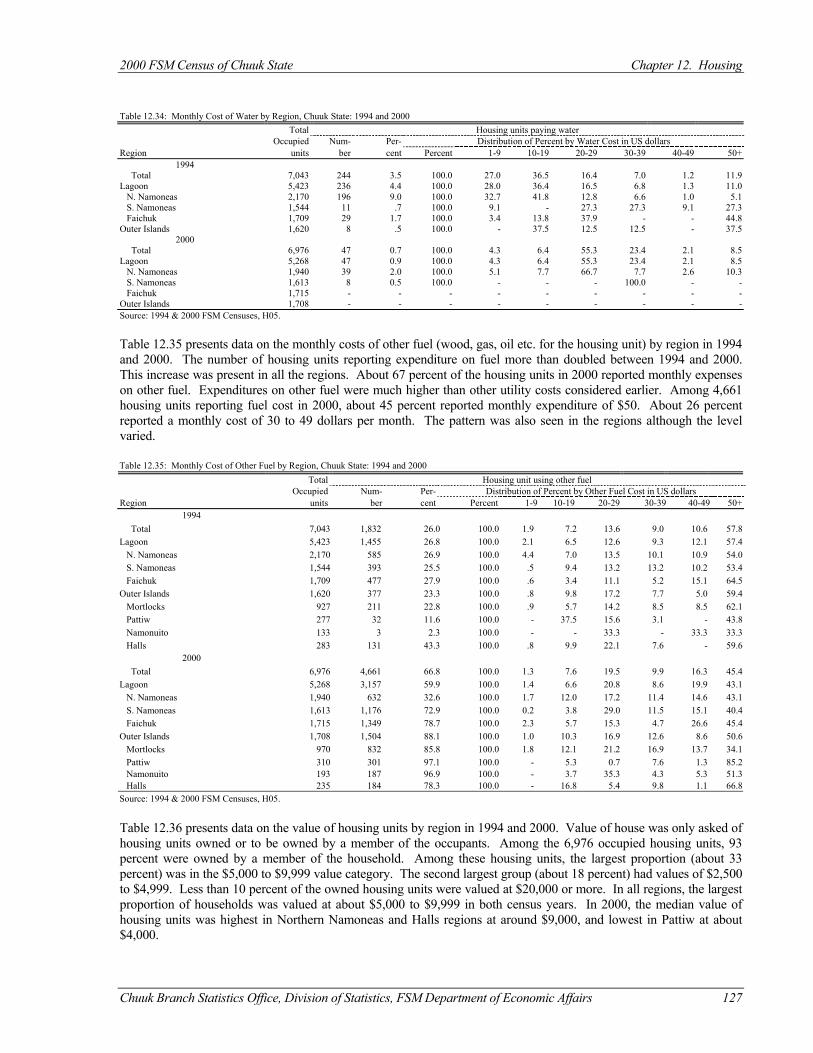
2000 FSM Census of Chuuk State Chapter 12. Housing
Chuuk Branch Statistics Office, Division of Statistics, FSM Department of Economic Affairs 127
Table 12.34: Monthly Cost of Water by Region, Chuuk State: 1994 and 2000
Total Housing units paying water Occupied Num- Per- Distribution of Percent by Water Cost in US dollars
Region units ber cent Percent 1-9 10-19 20-29 30-39 40-49 50+ 1994
Total 7,043 244 3.5 100.0 27.0 36.5 16.4 7.0 1.2 11.9 Lagoon 5,423 236 4.4 100.0 28.0 36.4 16.5 6.8 1.3 11.0 N. Namoneas 2,170 196 9.0 100.0 32.7 41.8 12.8 6.6 1.0 5.1 S. Namoneas 1,544 11 .7 100.0 9.1 - 27.3 27.3 9.1 27.3 Faichuk 1,709 29 1.7 100.0 3.4 13.8 37.9 - - 44.8 Outer Islands 1,620 8 .5 100.0 - 37.5 12.5 12.5 - 37.5
2000 Total 6,976 47 0.7 100.0 4.3 6.4 55.3 23.4 2.1 8.5 Lagoon 5,268 47 0.9 100.0 4.3 6.4 55.3 23.4 2.1 8.5 N. Namoneas 1,940 39 2.0 100.0 5.1 7.7 66.7 7.7 2.6 10.3 S. Namoneas 1,613 8 0.5 100.0 - - - 100.0 - - Faichuk 1,715 - - - - - - - - - Outer Islands 1,708 - - - - - - - - - Source: 1994 & 2000 FSM Censuses, H05. Table 12.35 presents data on the monthly costs of other fuel (wood, gas, oil etc. for the housing unit) by region in 1994 and 2000. The number of housing units reporting expenditure on fuel more than doubled between 1994 and 2000. This increase was present in all the regions. About 67 percent of the housing units in 2000 reported monthly expenses on other fuel. Expenditures on other fuel were much higher than other utility costs considered earlier. Among 4,661 housing units reporting fuel cost in 2000, about 45 percent reported monthly expenditure of $50. About 26 percent reported a monthly cost of 30 to 49 dollars per month. The pattern was also seen in the regions although the level varied. Table 12.35: Monthly Cost of Other Fuel by Region, Chuuk State: 1994 and 2000
Total Housing unit using other fuel Occupied Num- Per- Distribution of Percent by Other Fuel Cost in US dollars
Region units ber cent Percent 1-9 10-19 20-29 30-39 40-49 50+ 1994
Total 7,043 1,832 26.0 100.0 1.9 7.2 13.6 9.0 10.6 57.8 Lagoon 5,423 1,455 26.8 100.0 2.1 6.5 12.6 9.3 12.1 57.4 N. Namoneas 2,170 585 26.9 100.0 4.4 7.0 13.5 10.1 10.9 54.0 S. Namoneas 1,544 393 25.5 100.0 .5 9.4 13.2 13.2 10.2 53.4 Faichuk 1,709 477 27.9 100.0 .6 3.4 11.1 5.2 15.1 64.5 Outer Islands 1,620 377 23.3 100.0 .8 9.8 17.2 7.7 5.0 59.4 Mortlocks 927 211 22.8 100.0 .9 5.7 14.2 8.5 8.5 62.1 Pattiw 277 32 11.6 100.0 - 37.5 15.6 3.1 - 43.8 Namonuito 133 3 2.3 100.0 - - 33.3 - 33.3 33.3 Halls 283 131 43.3 100.0 .8 9.9 22.1 7.6 - 59.6
2000 Total 6,976 4,661 66.8 100.0 1.3 7.6 19.5 9.9 16.3 45.4 Lagoon 5,268 3,157 59.9 100.0 1.4 6.6 20.8 8.6 19.9 43.1 N. Namoneas 1,940 632 32.6 100.0 1.7 12.0 17.2 11.4 14.6 43.1 S. Namoneas 1,613 1,176 72.9 100.0 0.2 3.8 29.0 11.5 15.1 40.4 Faichuk 1,715 1,349 78.7 100.0 2.3 5.7 15.3 4.7 26.6 45.4 Outer Islands 1,708 1,504 88.1 100.0 1.0 10.3 16.9 12.6 8.6 50.6 Mortlocks 970 832 85.8 100.0 1.8 12.1 21.2 16.9 13.7 34.1 Pattiw 310 301 97.1 100.0 - 5.3 0.7 7.6 1.3 85.2 Namonuito 193 187 96.9 100.0 - 3.7 35.3 4.3 5.3 51.3 Halls 235 184 78.3 100.0 - 16.8 5.4 9.8 1.1 66.8 Source: 1994 & 2000 FSM Censuses, H05. Table 12.36 presents data on the value of housing units by region in 1994 and 2000. Value of house was only asked of housing units owned or to be owned by a member of the occupants. Among the 6,976 occupied housing units, 93 percent were owned by a member of the household. Among these housing units, the largest proportion (about 33 percent) was in the $5,000 to $9,999 value category. The second largest group (about 18 percent) had values of $2,500 to $4,999. Less than 10 percent of the owned housing units were valued at $20,000 or more. In all regions, the largest proportion of households was valued at about $5,000 to $9,999 in both census years. In 2000, the median value of housing units was highest in Northern Namoneas and Halls regions at around $9,000, and lowest in Pattiw at about $4,000.
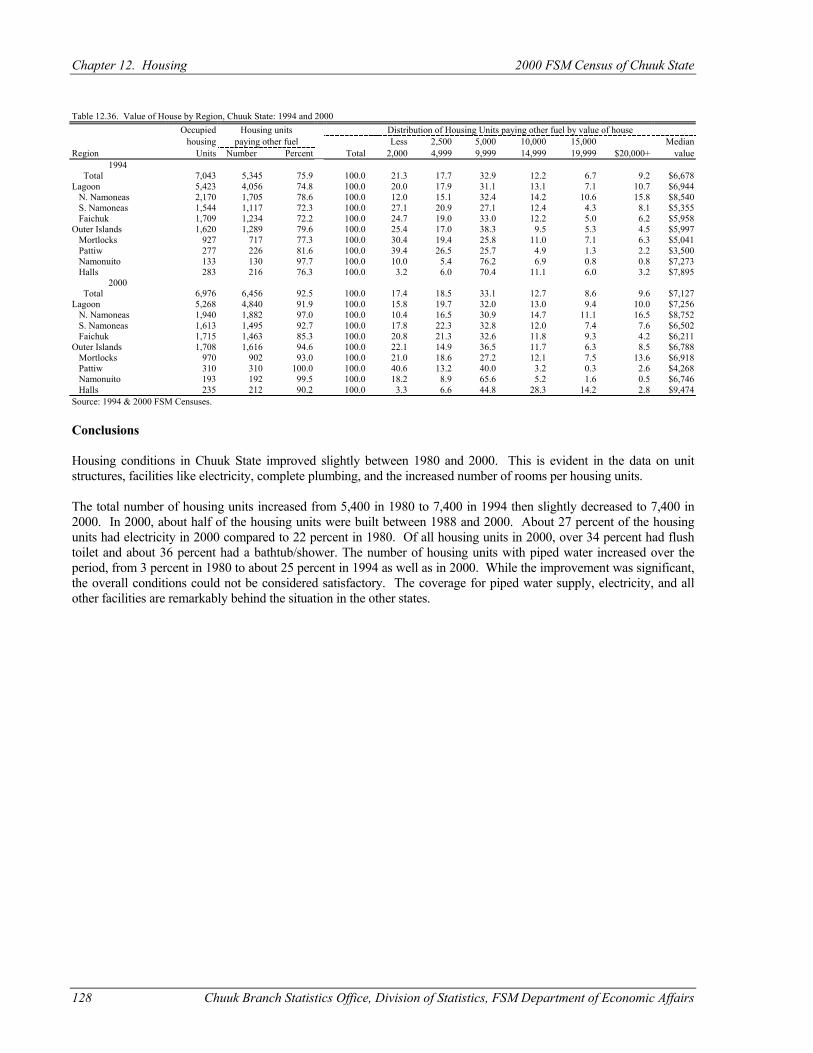
Chapter 12. Housing 2000 FSM Census of Chuuk State
128 Chuuk Branch Statistics Office, Division of Statistics, FSM Department of Economic Affairs
Table 12.36. Value of House by Region, Chuuk State: 1994 and 2000
Occupied Housing units Distribution of Housing Units paying other fuel by value of house housing paying other fuel Less 2,500 5,000 10,000 15,000 Median
Region Units Number Percent Total 2,000 4,999 9,999 14,999 19,999 $20,000+ value 1994
Total 7,043 5,345 75.9 100.0 21.3 17.7 32.9 12.2 6.7 9.2 $6,678 Lagoon 5,423 4,056 74.8 100.0 20.0 17.9 31.1 13.1 7.1 10.7 $6,944 N. Namoneas 2,170 1,705 78.6 100.0 12.0 15.1 32.4 14.2 10.6 15.8 $8,540 S. Namoneas 1,544 1,117 72.3 100.0 27.1 20.9 27.1 12.4 4.3 8.1 $5,355 Faichuk 1,709 1,234 72.2 100.0 24.7 19.0 33.0 12.2 5.0 6.2 $5,958 Outer Islands 1,620 1,289 79.6 100.0 25.4 17.0 38.3 9.5 5.3 4.5 $5,997 Mortlocks 927 717 77.3 100.0 30.4 19.4 25.8 11.0 7.1 6.3 $5,041 Pattiw 277 226 81.6 100.0 39.4 26.5 25.7 4.9 1.3 2.2 $3,500 Namonuito 133 130 97.7 100.0 10.0 5.4 76.2 6.9 0.8 0.8 $7,273 Halls 283 216 76.3 100.0 3.2 6.0 70.4 11.1 6.0 3.2 $7,895
2000 Total 6,976 6,456 92.5 100.0 17.4 18.5 33.1 12.7 8.6 9.6 $7,127 Lagoon 5,268 4,840 91.9 100.0 15.8 19.7 32.0 13.0 9.4 10.0 $7,256 N. Namoneas 1,940 1,882 97.0 100.0 10.4 16.5 30.9 14.7 11.1 16.5 $8,752 S. Namoneas 1,613 1,495 92.7 100.0 17.8 22.3 32.8 12.0 7.4 7.6 $6,502 Faichuk 1,715 1,463 85.3 100.0 20.8 21.3 32.6 11.8 9.3 4.2 $6,211 Outer Islands 1,708 1,616 94.6 100.0 22.1 14.9 36.5 11.7 6.3 8.5 $6,788 Mortlocks 970 902 93.0 100.0 21.0 18.6 27.2 12.1 7.5 13.6 $6,918 Pattiw 310 310 100.0 100.0 40.6 13.2 40.0 3.2 0.3 2.6 $4,268 Namonuito 193 192 99.5 100.0 18.2 8.9 65.6 5.2 1.6 0.5 $6,746 Halls 235 212 90.2 100.0 3.3 6.6 44.8 28.3 14.2 2.8 $9,474 Source: 1994 & 2000 FSM Censuses. Conclusions Housing conditions in Chuuk State improved slightly between 1980 and 2000. This is evident in the data on unit structures, facilities like electricity, complete plumbing, and the increased number of rooms per housing units. The total number of housing units increased from 5,400 in 1980 to 7,400 in 1994 then slightly decreased to 7,400 in 2000. In 2000, about half of the housing units were built between 1988 and 2000. About 27 percent of the housing units had electricity in 2000 compared to 22 percent in 1980. Of all housing units in 2000, over 34 percent had flush toilet and about 36 percent had a bathtub/shower. The number of housing units with piped water increased over the period, from 3 percent in 1980 to about 25 percent in 1994 as well as in 2000. While the improvement was significant, the overall conditions could not be considered satisfactory. The coverage for piped water supply, electricity, and all other facilities are remarkably behind the situation in the other states.
BIBLIOGRAPHY
Chuuk Branch Statistics Office, Division of Statistics, FSM Department of Economic Affairs 129
Arriaga, E.E., (1983). Estimating fertility from data on children ever born, by age of mother, U.S. Bureau of the Census, International Research Document no. 11, Washington D.C.
Arriaga, E.E., et al. (1994). Population Analysis with microcomputers, vol. I & II, UNFPA, USAID and U.S. Bureau
of the Census, Washington D.C. Bank of Hawai'i. (1989). An economic assessment of the Federated States of Micronesia. Bank of Hawaii,
Honolulu, HI. Brass, W. (1975). Methods for Estimating Fertility and Mortality from Limited and Defective Data, Caroline
Population Center, Laboratory for population studies, University of North Carolina, Chapel Hill. Brass, W., & Coale, A. J. (1968). Methods of Analysis and Estimation, The Demography of Tropical Africa,
Princeton, Princeton University Press, Chapter III. Coale, A.J., & Demeney, P. (1966). Regional Model Life Tables and Stable Populations. Princeton, New Jersey,
Princeton University Press. Coale, A.J., & J. Trussel. (1974). Model fertility schedule: variations on the age structure of child bearing in human
population, Population Index, vol. 40, NY. _____ (1977). Estimating the time to which Brass estimates apply, Population Bulletin of the United Nations, no.
10, NY. _____ (1988). Mortpak-Lite, the United Nations Software packages for mortality measurement, Population
Division, United Nations, New York, NY. Compact of the Free Association. (1982). Compact of Free Association and related agreements between the
Federated States of Micronesia and the United States of America. Plebiscite Commission. Kolonia, Pohnpei.
Connel, J., (1983). Migration, Employment and Development in the South Pacific, Country Report No. 3: Federated
States of Micronesia, South Pacific Commission, New Caledonia. Connell, J. (1990). Modernity and its Discontents: Migration and Change in the South Pacific. Migration
Development in the South Pacific, Pacific Research Monograph No. 24. Australian National University. Canberra, Australia.
Fenney, G. (1976). Estimating infant mortality rate from child survivorship data by age of mother, Asian Pacific
Census Newsletter, vol. 3, no. 2, pp. 12-16. _____ (1980). Estimating infant mortality trends from child survivorship data, Population Studies, vol. 34, no. 1,
NY. Firth, S. (1989). Sovereignty and Interdependence in the Contemporary Pacific. The Contemporary Pacific, 1,
pp 75-96. Gorenflo, L.J., & Levin, M.J. (1992). Changing Migration Patterns in the Federated States of Micronesia. A journal
of Micronesian studies, 3:1. pp. 29-71. Hezel, F.X., (1983). The First Taint of Civilization, University of Hawaii Press. Hezel, F.X., & Berg, M. L. (1979). Micronesia: Winds of Change, TTPI Printing Office, 1979. Hezel, F.X., & Levin, M.J. (1987). Micronesian emigration and the brain drain in Palau, Marshalls, and the
Federated States of Micronesia. Journal of the Pacific Society, 10, 16-34.
Bibliography 2000 FSM Census of Chuuk State
130 Chuuk Branch Statistics Office, Division of Statistics, FSM Department of Economic Affairs
_____ (1990) Micronesian emigration: Beyond the brain drain. In J. Connell (Ed.), Migration and development in the South Pacific (Pacific research Monograph No. 24, pp. 42-60). Australian National University, National Centre for Development Studies.
_____ (1996). New trend in Micronesian Migration, FSM Migrating to Guam and the Marianas, 1990-1993. Hezel, F.X., & McGrath, T.B. (1989). The great flight northward: FSM migration to Guam and the Northern
Mariana Islands. Pacific Studies, 13(1), 47-64. Levin, M.J. (1995). Micronesian Migrants to Guam and the Commonwealth of Northern Mariana Islands: A Study
of the Impact of the Compact of the Free Association, Washington D.C., U.S. Government Printing Office. Levin, M.J. (Draft). Census and Demography in the U.S. Pacific Islands, East-West Center, Honolulu, Hawaii. Levin, M. J. & Mailos, E. (1992). Homelessness on Guam. Levin, M.J., & Retherford, R.D. (1986). Recent fertility trends in the Pacific Islands, East-West Population Institute,
No. 101, East-West Center, Honolulu, Hawaii. Myers, R. (1940). Errors and Bias in the Reporting of Age in the Census Data, Transaction of the Actuarial Society
of America, vol. 41. Nan'yo-cho [South Seas Bureau]. (1927). Nan'yo gunto tosei, chosa hokoku, Taicho juyonen [Census of the
Japanese Mandate Territories, 1925]. Koror, Palau: Nan'yo-cho. _____ (1931). Nan'yo-gunto tosei, chosa-sho, Showa 5 nen [A summary of conditions in Mandate Territories, 1930].
(4 vols.). Koror, Palau: Nan'yo-cho. _____ (1937). Nan'yo-gunto tosei, chosa-sho, Showa 10 nen [A summary of conditions in Mandate Territories,
1935]. (2 vols.). Tokyo: Nan'yo-cho. OCC/Office of Census Coordinator. (1975). 1973 population of the Trust Territory of the Pacific Islands. Saipan:
U.S. Trust Territory of the Pacific Islands. ODA, UK & EPU, Malaysia/Overseas Development Administration, U.K. & Economic Planning Unit, Kuala
Lumpur, Malaysia. (1990). PEOPLE. Software package for making national and sub-national population projections, version 3.01, Malaysia.
OHC/Office of the High Commissioner. (1959). Census Report, 1958. U.S. Trust Territory of the Pacific Islands.
Agana, Guam. _____ TTPI Population Profiles, 1967. Special Report, Series No. 1. Trust Territory of the Pacific Islands. Agana,
Guam. OPB/Office of Planning and Budget, Yap State. (1987). Report on the 1987 Yap State Census of Population, vol. I,
Colonia, Yap, FSM. _____ (1988). Report on the 1987 Yap State Census of Population, vol. II, Colonia, Yap, FSM. OPS/Office of Planning and Statistics, FSM. (1988). 1985 Pohnpei State Census Report, Kolonia, Pohnpei, FSM. _____ (1989). 1986 Kosrae State Census Report, Tofol, Kosrae, FSM. _____ (1992). 1989 Chuuk State Census of Population and Housing, Palikir, Pohnpei, FSM. _____ (1992). Information Handbook, Federated States of Micronesia, (No. 1., Vol. 1). Palikir, Pohnpei, FSM.
2000 FSM Census of Chuuk State Bibliography
Chuuk Branch Statistics Office, Division of Statistics, FSM Department of Economic Affairs 131
Rubinstein, D. H. (1990). Micronesian Migrants to Guam and Saipan Post-Compact (1987), University of New South Wales.
_____ (1991). The Future of Micronesian Migration to Guam, Micronesian Area Research Center, UOG. Rubinstein, D. H., & Levin, M. J. (1992). Micronesian migration to Guam: Social and economic characteristics.
Asia and Pacific Migration Journal, 1, 350-385. Shinn, R. (1984). Trust Territory of the Pacific Islands. Oceania: A Regional Study, edited by F.M. Bunge and M.
W. Cooke, pp. 295-348. Foreign Area Studies, American University. Washington D.C.: Government Printing Office.
Shryock, H.S., et al. (1976). The method and materials of demography, condensed edition, NY. SPC/South Pacific Commission. (1995). Population Statistics, Statistical Bulletin No. 42, Noumea, New Caledonia. Sullivan, J. (1972). Models for the estimation of the probability of dying, birth, and exact ages of early childhood,
Population Studies, vol. 26, no. 1, pp. 77-79. UOG/University of Guam. (1993). 1992 Survey of Micronesians on Guam. USBC/US Bureau of the Census. (1984). 1980 Census of Population (vol. 1.1), characteristics of the population
(part 57), Trust Territory of the Pacific Islands, excluding the Northern Mariana Islands. Washington D.C.: US Government Printing Office.
_____ (1984). 1980 Census of Population (vol. 1.1), characteristics of the population (part 57), Trust Territory of
the Pacific Islands, excluding the Northern Mariana Islands. Washington D.C.: U.S. Government Printing Office.
_____ (1992a). 1990 census of population and housing: Summary Population and Housing Characteristics,
Commonwealth of the Northern Mariana Islands, Washington, D.C.: U.S. Government Printing Office. _____ (1992b). 1990 Census of Population and Housing: Summary Population and Housing Characteristics, Guam,
Washington, D.C.: U.S. Government Printing Office. UN/United Nations. (1952). Accuracy tests for census age distributions tabulated in five-year and ten-year age
groups, Population Bulletin, no. 2, New York. _____ (1967). Manual IV, Methods of Estimating Basic Demographic measures from incomplete data, Population
Studies, No. 42, NY. _____ (1983). Manual X, Indirect Techniques for Demographic Estimation, Population Studies, No. 81. NY.

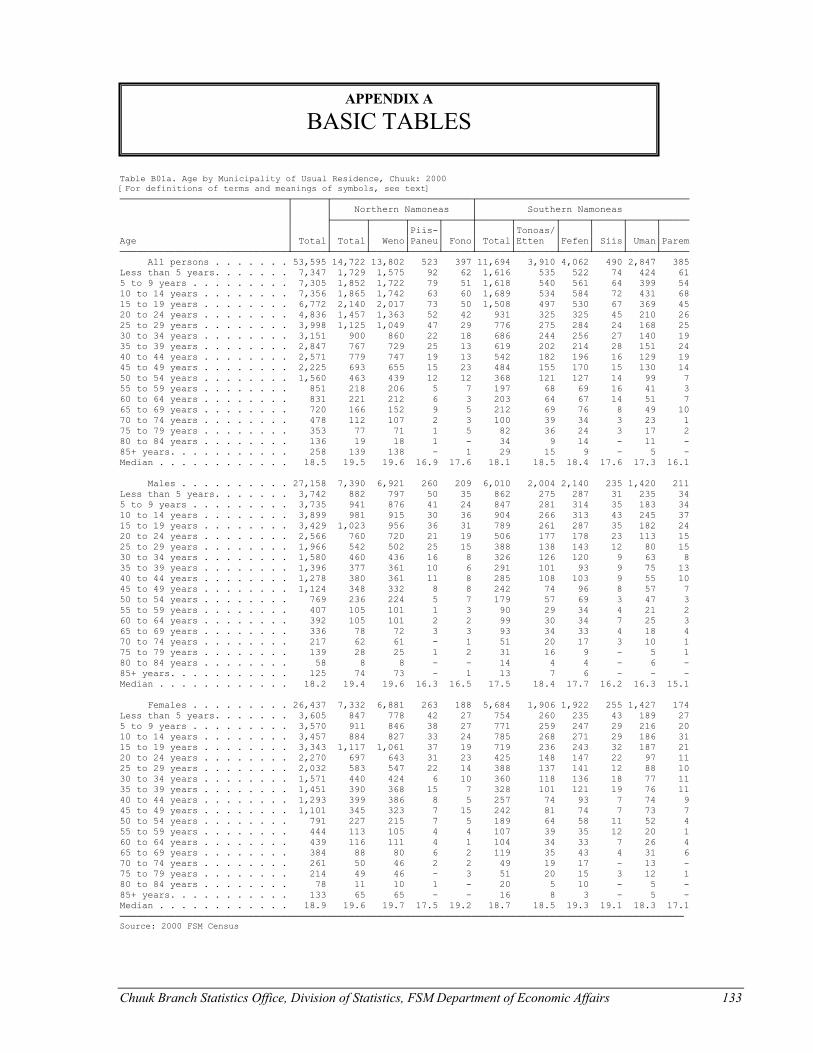
Chuuk Branch Statistics Office, Division of Statistics, FSM Department of Economic Affairs 133
Table B01a. Age by Municipality of Usual Residence, Chuuk: 2000 [For definitions of terms and meanings of symbols, see text] ──────────────────────────────┬──────┬─────────────────────────┬────────────────────────────────────── │ │ Northern Namoneas │ Southern Namoneas │ ├──────┬──────┬─────┬─────┼──────┬───────┬─────┬─────┬─────┬───── │ │ │ │Piis-│ │ │Tonoas/│ │ │ │ Age │ Total│ Total│ Weno│Paneu│ Fono│ Total│Etten │Fefen│ Siis│ Uman│Parem ──────────────────────────────┴──────┴──────┴──────┴─────┴─────┴──────┴───────┴─────┴─────┴─────┴───── All persons . . . . . . . 53,595 14,722 13,802 523 397 11,694 3,910 4,062 490 2,847 385 Less than 5 years. . . . . . . 7,347 1,729 1,575 92 62 1,616 535 522 74 424 61 5 to 9 years . . . . . . . . . 7,305 1,852 1,722 79 51 1,618 540 561 64 399 54 10 to 14 years . . . . . . . . 7,356 1,865 1,742 63 60 1,689 534 584 72 431 68 15 to 19 years . . . . . . . . 6,772 2,140 2,017 73 50 1,508 497 530 67 369 45 20 to 24 years . . . . . . . . 4,836 1,457 1,363 52 42 931 325 325 45 210 26 25 to 29 years . . . . . . . . 3,998 1,125 1,049 47 29 776 275 284 24 168 25 30 to 34 years . . . . . . . . 3,151 900 860 22 18 686 244 256 27 140 19 35 to 39 years . . . . . . . . 2,847 767 729 25 13 619 202 214 28 151 24 40 to 44 years . . . . . . . . 2,571 779 747 19 13 542 182 196 16 129 19 45 to 49 years . . . . . . . . 2,225 693 655 15 23 484 155 170 15 130 14 50 to 54 years . . . . . . . . 1,560 463 439 12 12 368 121 127 14 99 7 55 to 59 years . . . . . . . . 851 218 206 5 7 197 68 69 16 41 3 60 to 64 years . . . . . . . . 831 221 212 6 3 203 64 67 14 51 7 65 to 69 years . . . . . . . . 720 166 152 9 5 212 69 76 8 49 10 70 to 74 years . . . . . . . . 478 112 107 2 3 100 39 34 3 23 1 75 to 79 years . . . . . . . . 353 77 71 1 5 82 36 24 3 17 2 80 to 84 years . . . . . . . . 136 19 18 1 - 34 9 14 - 11 - 85+ years. . . . . . . . . . . 258 139 138 - 1 29 15 9 - 5 - Median . . . . . . . . . . . . 18.5 19.5 19.6 16.9 17.6 18.1 18.5 18.4 17.6 17.3 16.1 Males . . . . . . . . . . 27,158 7,390 6,921 260 209 6,010 2,004 2,140 235 1,420 211 Less than 5 years. . . . . . . 3,742 882 797 50 35 862 275 287 31 235 34 5 to 9 years . . . . . . . . . 3,735 941 876 41 24 847 281 314 35 183 34 10 to 14 years . . . . . . . . 3,899 981 915 30 36 904 266 313 43 245 37 15 to 19 years . . . . . . . . 3,429 1,023 956 36 31 789 261 287 35 182 24 20 to 24 years . . . . . . . . 2,566 760 720 21 19 506 177 178 23 113 15 25 to 29 years . . . . . . . . 1,966 542 502 25 15 388 138 143 12 80 15 30 to 34 years . . . . . . . . 1,580 460 436 16 8 326 126 120 9 63 8 35 to 39 years . . . . . . . . 1,396 377 361 10 6 291 101 93 9 75 13 40 to 44 years . . . . . . . . 1,278 380 361 11 8 285 108 103 9 55 10 45 to 49 years . . . . . . . . 1,124 348 332 8 8 242 74 96 8 57 7 50 to 54 years . . . . . . . . 769 236 224 5 7 179 57 69 3 47 3 55 to 59 years . . . . . . . . 407 105 101 1 3 90 29 34 4 21 2 60 to 64 years . . . . . . . . 392 105 101 2 2 99 30 34 7 25 3 65 to 69 years . . . . . . . . 336 78 72 3 3 93 34 33 4 18 4 70 to 74 years . . . . . . . . 217 62 61 - 1 51 20 17 3 10 1 75 to 79 years . . . . . . . . 139 28 25 1 2 31 16 9 - 5 1 80 to 84 years . . . . . . . . 58 8 8 - - 14 4 4 - 6 - 85+ years. . . . . . . . . . . 125 74 73 - 1 13 7 6 - - - Median . . . . . . . . . . . . 18.2 19.4 19.6 16.3 16.5 17.5 18.4 17.7 16.2 16.3 15.1 Females . . . . . . . . . 26,437 7,332 6,881 263 188 5,684 1,906 1,922 255 1,427 174 Less than 5 years. . . . . . . 3,605 847 778 42 27 754 260 235 43 189 27 5 to 9 years . . . . . . . . . 3,570 911 846 38 27 771 259 247 29 216 20 10 to 14 years . . . . . . . . 3,457 884 827 33 24 785 268 271 29 186 31 15 to 19 years . . . . . . . . 3,343 1,117 1,061 37 19 719 236 243 32 187 21 20 to 24 years . . . . . . . . 2,270 697 643 31 23 425 148 147 22 97 11 25 to 29 years . . . . . . . . 2,032 583 547 22 14 388 137 141 12 88 10 30 to 34 years . . . . . . . . 1,571 440 424 6 10 360 118 136 18 77 11 35 to 39 years . . . . . . . . 1,451 390 368 15 7 328 101 121 19 76 11 40 to 44 years . . . . . . . . 1,293 399 386 8 5 257 74 93 7 74 9 45 to 49 years . . . . . . . . 1,101 345 323 7 15 242 81 74 7 73 7 50 to 54 years . . . . . . . . 791 227 215 7 5 189 64 58 11 52 4 55 to 59 years . . . . . . . . 444 113 105 4 4 107 39 35 12 20 1 60 to 64 years . . . . . . . . 439 116 111 4 1 104 34 33 7 26 4 65 to 69 years . . . . . . . . 384 88 80 6 2 119 35 43 4 31 6 70 to 74 years . . . . . . . . 261 50 46 2 2 49 19 17 - 13 - 75 to 79 years . . . . . . . . 214 49 46 - 3 51 20 15 3 12 1 80 to 84 years . . . . . . . . 78 11 10 1 - 20 5 10 - 5 - 85+ years. . . . . . . . . . . 133 65 65 - - 16 8 3 - 5 - Median . . . . . . . . . . . . 18.9 19.6 19.7 17.5 19.2 18.7 18.5 19.3 19.1 18.3 17.1 ───────────────────────────────────────────────────────────────────────────────────────────────────── Source: 2000 FSM Census
APPENDIX A
BASIC TABLES
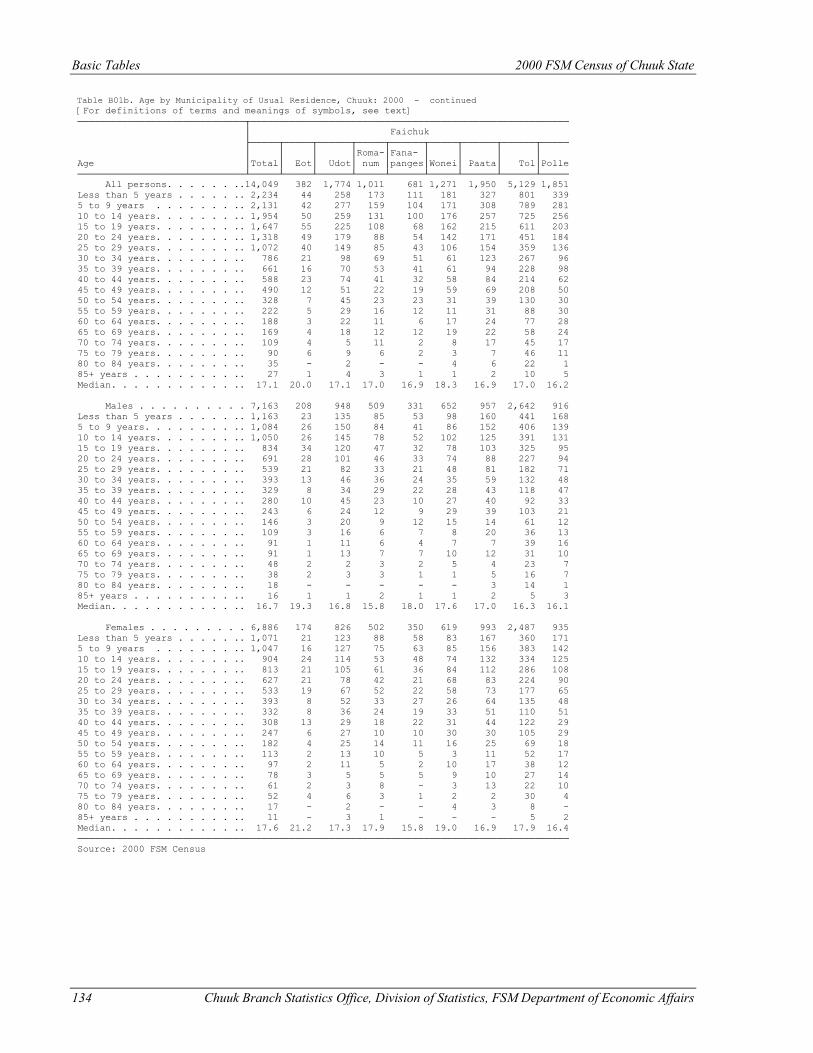
Basic Tables 2000 FSM Census of Chuuk State
134 Chuuk Branch Statistics Office, Division of Statistics, FSM Department of Economic Affairs
Table B01b. Age by Municipality of Usual Residence, Chuuk: 2000 - continued [For definitions of terms and meanings of symbols, see text] ──────────────────────────────┬───────────────────────────────────────────────────────── │ Faichuk ├─────┬─────┬──────┬─────┬──────┬─────┬──────┬──────┬───── │ │ │ │Roma-│Fana- │ │ │ │ Age │Total│ Eot│ Udot│ num │panges│Wonei│ Paata│ Tol│Polle ──────────────────────────────┴─────┴─────┴──────┴─────┴──────┴─────┴──────┴──────┴───── All persons. . . . . . ..14,049 382 1,774 1,011 681 1,271 1,950 5,129 1,851 Less than 5 years . . . . . .. 2,234 44 258 173 111 181 327 801 339 5 to 9 years . . . . . . . .. 2,131 42 277 159 104 171 308 789 281 10 to 14 years. . . . . . . .. 1,954 50 259 131 100 176 257 725 256 15 to 19 years. . . . . . . .. 1,647 55 225 108 68 162 215 611 203 20 to 24 years. . . . . . . .. 1,318 49 179 88 54 142 171 451 184 25 to 29 years. . . . . . . .. 1,072 40 149 85 43 106 154 359 136 30 to 34 years. . . . . . . .. 786 21 98 69 51 61 123 267 96 35 to 39 years. . . . . . . .. 661 16 70 53 41 61 94 228 98 40 to 44 years. . . . . . . .. 588 23 74 41 32 58 84 214 62 45 to 49 years. . . . . . . .. 490 12 51 22 19 59 69 208 50 50 to 54 years. . . . . . . .. 328 7 45 23 23 31 39 130 30 55 to 59 years. . . . . . . .. 222 5 29 16 12 11 31 88 30 60 to 64 years. . . . . . . .. 188 3 22 11 6 17 24 77 28 65 to 69 years. . . . . . . .. 169 4 18 12 12 19 22 58 24 70 to 74 years. . . . . . . .. 109 4 5 11 2 8 17 45 17 75 to 79 years. . . . . . . .. 90 6 9 6 2 3 7 46 11 80 to 84 years. . . . . . . .. 35 - 2 - - 4 6 22 1 85+ years . . . . . . . . . .. 27 1 4 3 1 1 2 10 5 Median. . . . . . . . . . . .. 17.1 20.0 17.1 17.0 16.9 18.3 16.9 17.0 16.2 Males . . . . . . . . . . 7,163 208 948 509 331 652 957 2,642 916 Less than 5 years . . . . . .. 1,163 23 135 85 53 98 160 441 168 5 to 9 years. . . . . . . . .. 1,084 26 150 84 41 86 152 406 139 10 to 14 years. . . . . . . .. 1,050 26 145 78 52 102 125 391 131 15 to 19 years. . . . . . . .. 834 34 120 47 32 78 103 325 95 20 to 24 years. . . . . . . .. 691 28 101 46 33 74 88 227 94 25 to 29 years. . . . . . . .. 539 21 82 33 21 48 81 182 71 30 to 34 years. . . . . . . .. 393 13 46 36 24 35 59 132 48 35 to 39 years. . . . . . . .. 329 8 34 29 22 28 43 118 47 40 to 44 years. . . . . . . .. 280 10 45 23 10 27 40 92 33 45 to 49 years. . . . . . . .. 243 6 24 12 9 29 39 103 21 50 to 54 years. . . . . . . .. 146 3 20 9 12 15 14 61 12 55 to 59 years. . . . . . . .. 109 3 16 6 7 8 20 36 13 60 to 64 years. . . . . . . .. 91 1 11 6 4 7 7 39 16 65 to 69 years. . . . . . . .. 91 1 13 7 7 10 12 31 10 70 to 74 years. . . . . . . .. 48 2 2 3 2 5 4 23 7 75 to 79 years. . . . . . . .. 38 2 3 3 1 1 5 16 7 80 to 84 years. . . . . . . .. 18 - - - - - 3 14 1 85+ years . . . . . . . . . .. 16 1 1 2 1 1 2 5 3 Median. . . . . . . . . . . .. 16.7 19.3 16.8 15.8 18.0 17.6 17.0 16.3 16.1 Females . . . . . . . . . 6,886 174 826 502 350 619 993 2,487 935 Less than 5 years . . . . . .. 1,071 21 123 88 58 83 167 360 171 5 to 9 years . . . . . . . .. 1,047 16 127 75 63 85 156 383 142 10 to 14 years. . . . . . . .. 904 24 114 53 48 74 132 334 125 15 to 19 years. . . . . . . .. 813 21 105 61 36 84 112 286 108 20 to 24 years. . . . . . . .. 627 21 78 42 21 68 83 224 90 25 to 29 years. . . . . . . .. 533 19 67 52 22 58 73 177 65 30 to 34 years. . . . . . . .. 393 8 52 33 27 26 64 135 48 35 to 39 years. . . . . . . .. 332 8 36 24 19 33 51 110 51 40 to 44 years. . . . . . . .. 308 13 29 18 22 31 44 122 29 45 to 49 years. . . . . . . .. 247 6 27 10 10 30 30 105 29 50 to 54 years. . . . . . . .. 182 4 25 14 11 16 25 69 18 55 to 59 years. . . . . . . .. 113 2 13 10 5 3 11 52 17 60 to 64 years. . . . . . . .. 97 2 11 5 2 10 17 38 12 65 to 69 years. . . . . . . .. 78 3 5 5 5 9 10 27 14 70 to 74 years. . . . . . . .. 61 2 3 8 - 3 13 22 10 75 to 79 years. . . . . . . .. 52 4 6 3 1 2 2 30 4 80 to 84 years. . . . . . . .. 17 - 2 - - 4 3 8 - 85+ years . . . . . . . . . .. 11 - 3 1 - - - 5 2 Median. . . . . . . . . . . .. 17.6 21.2 17.3 17.9 15.8 19.0 16.9 17.9 16.4 ──────────────────────────────────────────────────────────────────────────────────────── Source: 2000 FSM Census
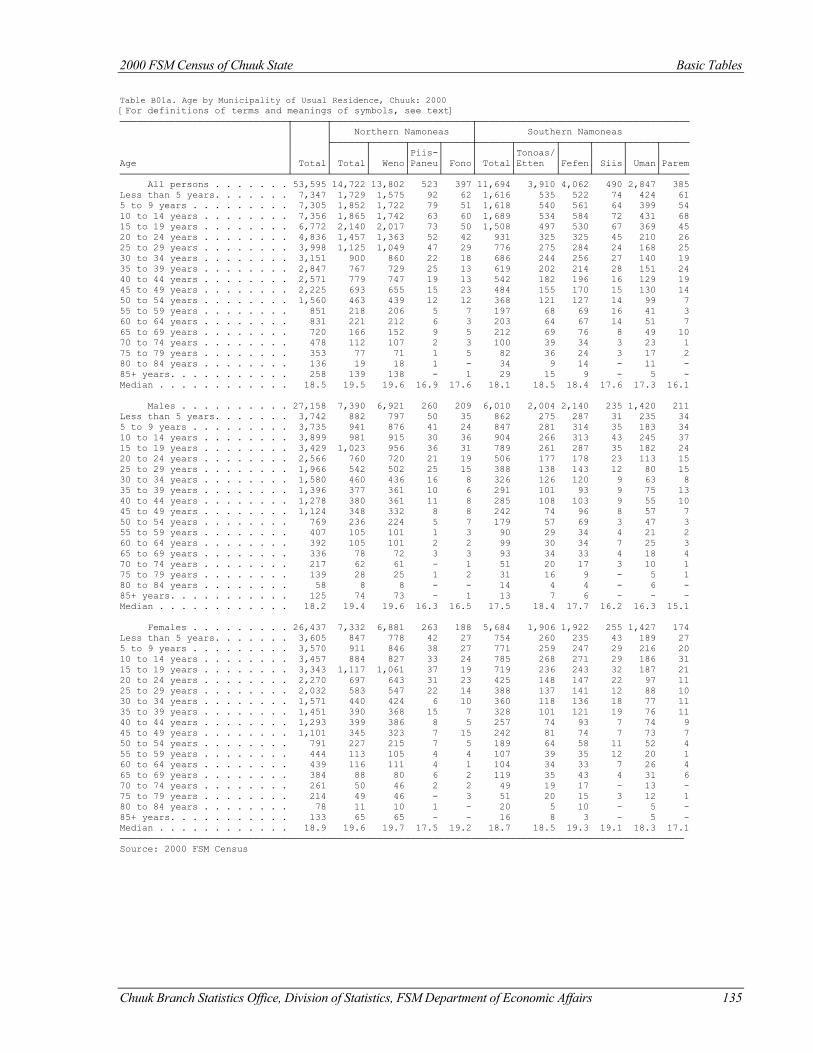
2000 FSM Census of Chuuk State Basic Tables
Chuuk Branch Statistics Office, Division of Statistics, FSM Department of Economic Affairs 135
Table B01a. Age by Municipality of Usual Residence, Chuuk: 2000 [For definitions of terms and meanings of symbols, see text] ──────────────────────────────┬──────┬─────────────────────────┬────────────────────────────────────── │ │ Northern Namoneas │ Southern Namoneas │ ├──────┬──────┬─────┬─────┼──────┬───────┬─────┬─────┬─────┬───── │ │ │ │Piis-│ │ │Tonoas/│ │ │ │ Age │ Total│ Total│ Weno│Paneu│ Fono│ Total│Etten │Fefen│ Siis│ Uman│Parem ──────────────────────────────┴──────┴──────┴──────┴─────┴─────┴──────┴───────┴─────┴─────┴─────┴───── All persons . . . . . . . 53,595 14,722 13,802 523 397 11,694 3,910 4,062 490 2,847 385 Less than 5 years. . . . . . . 7,347 1,729 1,575 92 62 1,616 535 522 74 424 61 5 to 9 years . . . . . . . . . 7,305 1,852 1,722 79 51 1,618 540 561 64 399 54 10 to 14 years . . . . . . . . 7,356 1,865 1,742 63 60 1,689 534 584 72 431 68 15 to 19 years . . . . . . . . 6,772 2,140 2,017 73 50 1,508 497 530 67 369 45 20 to 24 years . . . . . . . . 4,836 1,457 1,363 52 42 931 325 325 45 210 26 25 to 29 years . . . . . . . . 3,998 1,125 1,049 47 29 776 275 284 24 168 25 30 to 34 years . . . . . . . . 3,151 900 860 22 18 686 244 256 27 140 19 35 to 39 years . . . . . . . . 2,847 767 729 25 13 619 202 214 28 151 24 40 to 44 years . . . . . . . . 2,571 779 747 19 13 542 182 196 16 129 19 45 to 49 years . . . . . . . . 2,225 693 655 15 23 484 155 170 15 130 14 50 to 54 years . . . . . . . . 1,560 463 439 12 12 368 121 127 14 99 7 55 to 59 years . . . . . . . . 851 218 206 5 7 197 68 69 16 41 3 60 to 64 years . . . . . . . . 831 221 212 6 3 203 64 67 14 51 7 65 to 69 years . . . . . . . . 720 166 152 9 5 212 69 76 8 49 10 70 to 74 years . . . . . . . . 478 112 107 2 3 100 39 34 3 23 1 75 to 79 years . . . . . . . . 353 77 71 1 5 82 36 24 3 17 2 80 to 84 years . . . . . . . . 136 19 18 1 - 34 9 14 - 11 - 85+ years. . . . . . . . . . . 258 139 138 - 1 29 15 9 - 5 - Median . . . . . . . . . . . . 18.5 19.5 19.6 16.9 17.6 18.1 18.5 18.4 17.6 17.3 16.1 Males . . . . . . . . . . 27,158 7,390 6,921 260 209 6,010 2,004 2,140 235 1,420 211 Less than 5 years. . . . . . . 3,742 882 797 50 35 862 275 287 31 235 34 5 to 9 years . . . . . . . . . 3,735 941 876 41 24 847 281 314 35 183 34 10 to 14 years . . . . . . . . 3,899 981 915 30 36 904 266 313 43 245 37 15 to 19 years . . . . . . . . 3,429 1,023 956 36 31 789 261 287 35 182 24 20 to 24 years . . . . . . . . 2,566 760 720 21 19 506 177 178 23 113 15 25 to 29 years . . . . . . . . 1,966 542 502 25 15 388 138 143 12 80 15 30 to 34 years . . . . . . . . 1,580 460 436 16 8 326 126 120 9 63 8 35 to 39 years . . . . . . . . 1,396 377 361 10 6 291 101 93 9 75 13 40 to 44 years . . . . . . . . 1,278 380 361 11 8 285 108 103 9 55 10 45 to 49 years . . . . . . . . 1,124 348 332 8 8 242 74 96 8 57 7 50 to 54 years . . . . . . . . 769 236 224 5 7 179 57 69 3 47 3 55 to 59 years . . . . . . . . 407 105 101 1 3 90 29 34 4 21 2 60 to 64 years . . . . . . . . 392 105 101 2 2 99 30 34 7 25 3 65 to 69 years . . . . . . . . 336 78 72 3 3 93 34 33 4 18 4 70 to 74 years . . . . . . . . 217 62 61 - 1 51 20 17 3 10 1 75 to 79 years . . . . . . . . 139 28 25 1 2 31 16 9 - 5 1 80 to 84 years . . . . . . . . 58 8 8 - - 14 4 4 - 6 - 85+ years. . . . . . . . . . . 125 74 73 - 1 13 7 6 - - - Median . . . . . . . . . . . . 18.2 19.4 19.6 16.3 16.5 17.5 18.4 17.7 16.2 16.3 15.1 Females . . . . . . . . . 26,437 7,332 6,881 263 188 5,684 1,906 1,922 255 1,427 174 Less than 5 years. . . . . . . 3,605 847 778 42 27 754 260 235 43 189 27 5 to 9 years . . . . . . . . . 3,570 911 846 38 27 771 259 247 29 216 20 10 to 14 years . . . . . . . . 3,457 884 827 33 24 785 268 271 29 186 31 15 to 19 years . . . . . . . . 3,343 1,117 1,061 37 19 719 236 243 32 187 21 20 to 24 years . . . . . . . . 2,270 697 643 31 23 425 148 147 22 97 11 25 to 29 years . . . . . . . . 2,032 583 547 22 14 388 137 141 12 88 10 30 to 34 years . . . . . . . . 1,571 440 424 6 10 360 118 136 18 77 11 35 to 39 years . . . . . . . . 1,451 390 368 15 7 328 101 121 19 76 11 40 to 44 years . . . . . . . . 1,293 399 386 8 5 257 74 93 7 74 9 45 to 49 years . . . . . . . . 1,101 345 323 7 15 242 81 74 7 73 7 50 to 54 years . . . . . . . . 791 227 215 7 5 189 64 58 11 52 4 55 to 59 years . . . . . . . . 444 113 105 4 4 107 39 35 12 20 1 60 to 64 years . . . . . . . . 439 116 111 4 1 104 34 33 7 26 4 65 to 69 years . . . . . . . . 384 88 80 6 2 119 35 43 4 31 6 70 to 74 years . . . . . . . . 261 50 46 2 2 49 19 17 - 13 - 75 to 79 years . . . . . . . . 214 49 46 - 3 51 20 15 3 12 1 80 to 84 years . . . . . . . . 78 11 10 1 - 20 5 10 - 5 - 85+ years. . . . . . . . . . . 133 65 65 - - 16 8 3 - 5 - Median . . . . . . . . . . . . 18.9 19.6 19.7 17.5 19.2 18.7 18.5 19.3 19.1 18.3 17.1 ───────────────────────────────────────────────────────────────────────────────────────────────────── Source: 2000 FSM Census
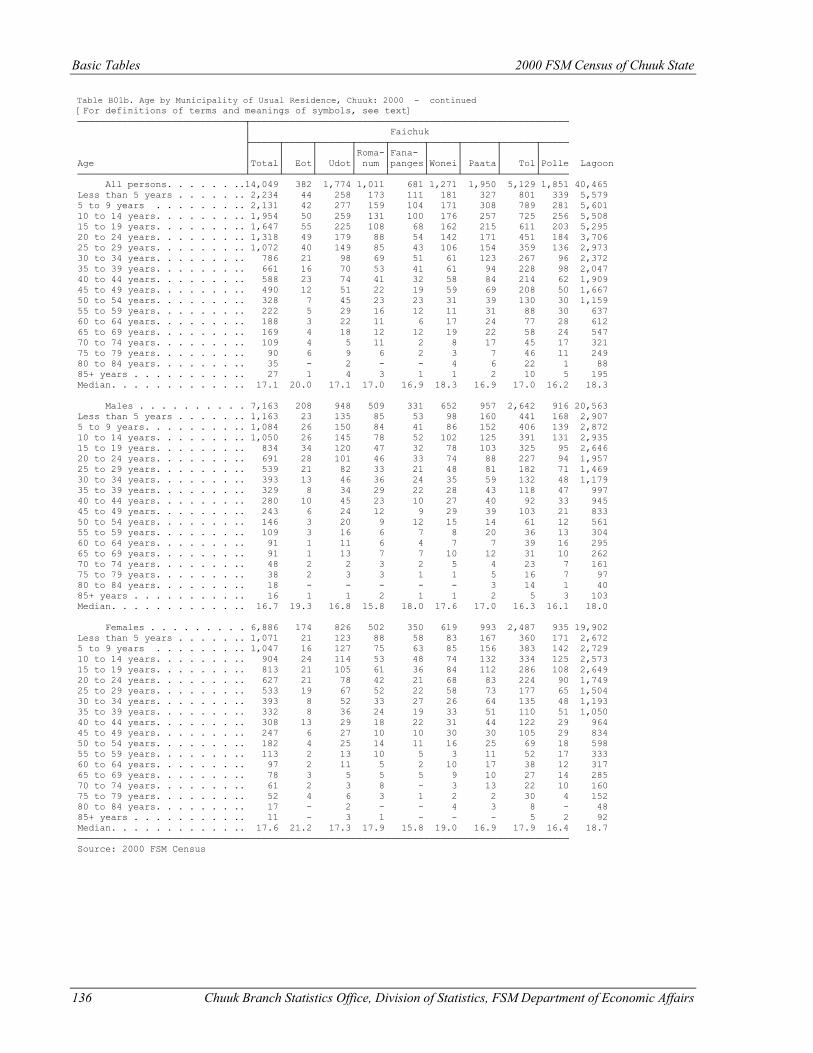
Basic Tables 2000 FSM Census of Chuuk State
136 Chuuk Branch Statistics Office, Division of Statistics, FSM Department of Economic Affairs
Table B01b. Age by Municipality of Usual Residence, Chuuk: 2000 - continued [For definitions of terms and meanings of symbols, see text] ──────────────────────────────┬───────────────────────────────────────────────────────── │ Faichuk ├─────┬─────┬──────┬─────┬──────┬─────┬──────┬──────┬───── │ │ │ │Roma-│Fana- │ │ │ │ Age │Total│ Eot│ Udot│ num │panges│Wonei│ Paata│ Tol│Polle Lagoon ──────────────────────────────┴─────┴─────┴──────┴─────┴──────┴─────┴──────┴──────┴───── All persons. . . . . . ..14,049 382 1,774 1,011 681 1,271 1,950 5,129 1,851 40,465 Less than 5 years . . . . . .. 2,234 44 258 173 111 181 327 801 339 5,579 5 to 9 years . . . . . . . .. 2,131 42 277 159 104 171 308 789 281 5,601 10 to 14 years. . . . . . . .. 1,954 50 259 131 100 176 257 725 256 5,508 15 to 19 years. . . . . . . .. 1,647 55 225 108 68 162 215 611 203 5,295 20 to 24 years. . . . . . . .. 1,318 49 179 88 54 142 171 451 184 3,706 25 to 29 years. . . . . . . .. 1,072 40 149 85 43 106 154 359 136 2,973 30 to 34 years. . . . . . . .. 786 21 98 69 51 61 123 267 96 2,372 35 to 39 years. . . . . . . .. 661 16 70 53 41 61 94 228 98 2,047 40 to 44 years. . . . . . . .. 588 23 74 41 32 58 84 214 62 1,909 45 to 49 years. . . . . . . .. 490 12 51 22 19 59 69 208 50 1,667 50 to 54 years. . . . . . . .. 328 7 45 23 23 31 39 130 30 1,159 55 to 59 years. . . . . . . .. 222 5 29 16 12 11 31 88 30 637 60 to 64 years. . . . . . . .. 188 3 22 11 6 17 24 77 28 612 65 to 69 years. . . . . . . .. 169 4 18 12 12 19 22 58 24 547 70 to 74 years. . . . . . . .. 109 4 5 11 2 8 17 45 17 321 75 to 79 years. . . . . . . .. 90 6 9 6 2 3 7 46 11 249 80 to 84 years. . . . . . . .. 35 - 2 - - 4 6 22 1 88 85+ years . . . . . . . . . .. 27 1 4 3 1 1 2 10 5 195 Median. . . . . . . . . . . .. 17.1 20.0 17.1 17.0 16.9 18.3 16.9 17.0 16.2 18.3 Males . . . . . . . . . . 7,163 208 948 509 331 652 957 2,642 916 20,563 Less than 5 years . . . . . .. 1,163 23 135 85 53 98 160 441 168 2,907 5 to 9 years. . . . . . . . .. 1,084 26 150 84 41 86 152 406 139 2,872 10 to 14 years. . . . . . . .. 1,050 26 145 78 52 102 125 391 131 2,935 15 to 19 years. . . . . . . .. 834 34 120 47 32 78 103 325 95 2,646 20 to 24 years. . . . . . . .. 691 28 101 46 33 74 88 227 94 1,957 25 to 29 years. . . . . . . .. 539 21 82 33 21 48 81 182 71 1,469 30 to 34 years. . . . . . . .. 393 13 46 36 24 35 59 132 48 1,179 35 to 39 years. . . . . . . .. 329 8 34 29 22 28 43 118 47 997 40 to 44 years. . . . . . . .. 280 10 45 23 10 27 40 92 33 945 45 to 49 years. . . . . . . .. 243 6 24 12 9 29 39 103 21 833 50 to 54 years. . . . . . . .. 146 3 20 9 12 15 14 61 12 561 55 to 59 years. . . . . . . .. 109 3 16 6 7 8 20 36 13 304 60 to 64 years. . . . . . . .. 91 1 11 6 4 7 7 39 16 295 65 to 69 years. . . . . . . .. 91 1 13 7 7 10 12 31 10 262 70 to 74 years. . . . . . . .. 48 2 2 3 2 5 4 23 7 161 75 to 79 years. . . . . . . .. 38 2 3 3 1 1 5 16 7 97 80 to 84 years. . . . . . . .. 18 - - - - - 3 14 1 40 85+ years . . . . . . . . . .. 16 1 1 2 1 1 2 5 3 103 Median. . . . . . . . . . . .. 16.7 19.3 16.8 15.8 18.0 17.6 17.0 16.3 16.1 18.0 Females . . . . . . . . . 6,886 174 826 502 350 619 993 2,487 935 19,902 Less than 5 years . . . . . .. 1,071 21 123 88 58 83 167 360 171 2,672 5 to 9 years . . . . . . . .. 1,047 16 127 75 63 85 156 383 142 2,729 10 to 14 years. . . . . . . .. 904 24 114 53 48 74 132 334 125 2,573 15 to 19 years. . . . . . . .. 813 21 105 61 36 84 112 286 108 2,649 20 to 24 years. . . . . . . .. 627 21 78 42 21 68 83 224 90 1,749 25 to 29 years. . . . . . . .. 533 19 67 52 22 58 73 177 65 1,504 30 to 34 years. . . . . . . .. 393 8 52 33 27 26 64 135 48 1,193 35 to 39 years. . . . . . . .. 332 8 36 24 19 33 51 110 51 1,050 40 to 44 years. . . . . . . .. 308 13 29 18 22 31 44 122 29 964 45 to 49 years. . . . . . . .. 247 6 27 10 10 30 30 105 29 834 50 to 54 years. . . . . . . .. 182 4 25 14 11 16 25 69 18 598 55 to 59 years. . . . . . . .. 113 2 13 10 5 3 11 52 17 333 60 to 64 years. . . . . . . .. 97 2 11 5 2 10 17 38 12 317 65 to 69 years. . . . . . . .. 78 3 5 5 5 9 10 27 14 285 70 to 74 years. . . . . . . .. 61 2 3 8 - 3 13 22 10 160 75 to 79 years. . . . . . . .. 52 4 6 3 1 2 2 30 4 152 80 to 84 years. . . . . . . .. 17 - 2 - - 4 3 8 - 48 85+ years . . . . . . . . . .. 11 - 3 1 - - - 5 2 92 Median. . . . . . . . . . . .. 17.6 21.2 17.3 17.9 15.8 19.0 16.9 17.9 16.4 18.7 ──────────────────────────────────────────────────────────────────────────────────────── Source: 2000 FSM Census
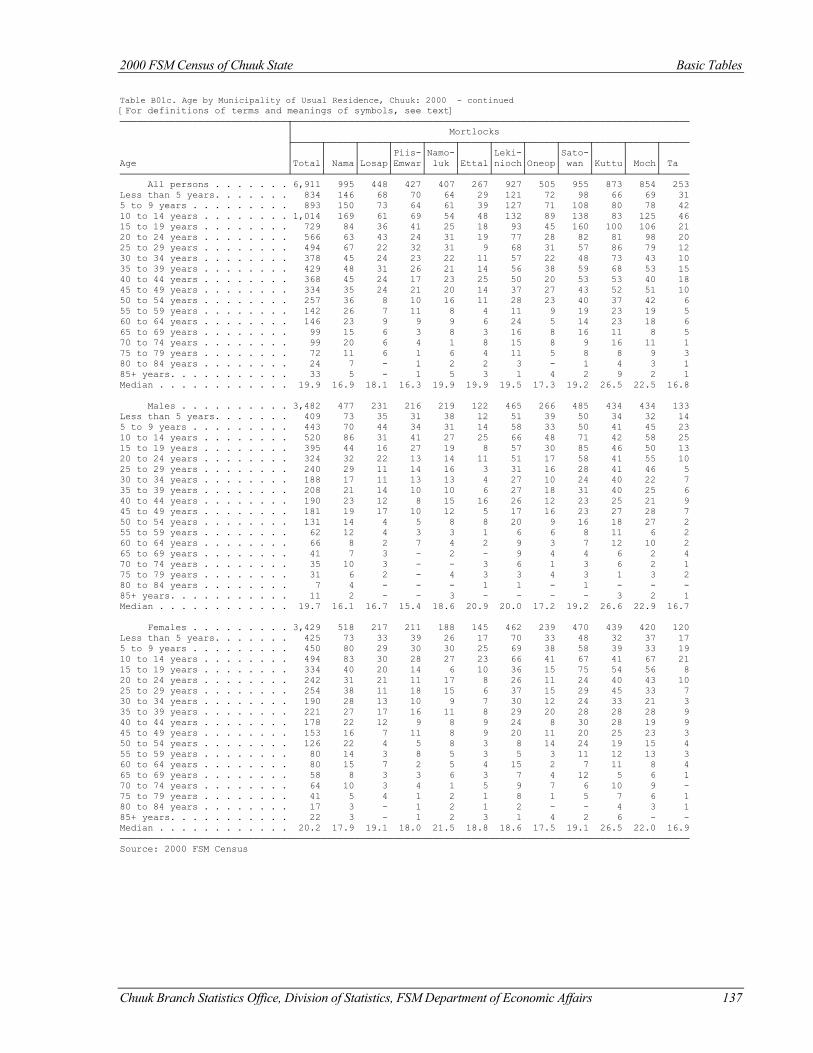
2000 FSM Census of Chuuk State Basic Tables
Chuuk Branch Statistics Office, Division of Statistics, FSM Department of Economic Affairs 137
Table B01c. Age by Municipality of Usual Residence, Chuuk: 2000 - continued [For definitions of terms and meanings of symbols, see text] ──────────────────────────────┬─────────────────────────────────────────────────────────────────────── │ Mortlocks ├─────┬─────┬─────┬─────┬─────┬─────┬─────┬─────┬─────┬─────┬─────┬───── │ │ │ │Piis-│Namo-│ │Leki-│ │Sato-│ │ │ Age │Total│ Nama│Losap│Emwar│ luk │Ettal│nioch│Oneop│ wan │Kuttu│ Moch│ Ta ──────────────────────────────┴─────┴─────┴─────┴─────┴─────┴─────┴─────┴─────┴─────┴─────┴─────┴───── All persons . . . . . . . 6,911 995 448 427 407 267 927 505 955 873 854 253 Less than 5 years. . . . . . . 834 146 68 70 64 29 121 72 98 66 69 31 5 to 9 years . . . . . . . . . 893 150 73 64 61 39 127 71 108 80 78 42 10 to 14 years . . . . . . . . 1,014 169 61 69 54 48 132 89 138 83 125 46 15 to 19 years . . . . . . . . 729 84 36 41 25 18 93 45 160 100 106 21 20 to 24 years . . . . . . . . 566 63 43 24 31 19 77 28 82 81 98 20 25 to 29 years . . . . . . . . 494 67 22 32 31 9 68 31 57 86 79 12 30 to 34 years . . . . . . . . 378 45 24 23 22 11 57 22 48 73 43 10 35 to 39 years . . . . . . . . 429 48 31 26 21 14 56 38 59 68 53 15 40 to 44 years . . . . . . . . 368 45 24 17 23 25 50 20 53 53 40 18 45 to 49 years . . . . . . . . 334 35 24 21 20 14 37 27 43 52 51 10 50 to 54 years . . . . . . . . 257 36 8 10 16 11 28 23 40 37 42 6 55 to 59 years . . . . . . . . 142 26 7 11 8 4 11 9 19 23 19 5 60 to 64 years . . . . . . . . 146 23 9 9 9 6 24 5 14 23 18 6 65 to 69 years . . . . . . . . 99 15 6 3 8 3 16 8 16 11 8 5 70 to 74 years . . . . . . . . 99 20 6 4 1 8 15 8 9 16 11 1 75 to 79 years . . . . . . . . 72 11 6 1 6 4 11 5 8 8 9 3 80 to 84 years . . . . . . . . 24 7 - 1 2 2 3 - 1 4 3 1 85+ years. . . . . . . . . . . 33 5 - 1 5 3 1 4 2 9 2 1 Median . . . . . . . . . . . . 19.9 16.9 18.1 16.3 19.9 19.9 19.5 17.3 19.2 26.5 22.5 16.8 Males . . . . . . . . . . 3,482 477 231 216 219 122 465 266 485 434 434 133 Less than 5 years. . . . . . . 409 73 35 31 38 12 51 39 50 34 32 14 5 to 9 years . . . . . . . . . 443 70 44 34 31 14 58 33 50 41 45 23 10 to 14 years . . . . . . . . 520 86 31 41 27 25 66 48 71 42 58 25 15 to 19 years . . . . . . . . 395 44 16 27 19 8 57 30 85 46 50 13 20 to 24 years . . . . . . . . 324 32 22 13 14 11 51 17 58 41 55 10 25 to 29 years . . . . . . . . 240 29 11 14 16 3 31 16 28 41 46 5 30 to 34 years . . . . . . . . 188 17 11 13 13 4 27 10 24 40 22 7 35 to 39 years . . . . . . . . 208 21 14 10 10 6 27 18 31 40 25 6 40 to 44 years . . . . . . . . 190 23 12 8 15 16 26 12 23 25 21 9 45 to 49 years . . . . . . . . 181 19 17 10 12 5 17 16 23 27 28 7 50 to 54 years . . . . . . . . 131 14 4 5 8 8 20 9 16 18 27 2 55 to 59 years . . . . . . . . 62 12 4 3 3 1 6 6 8 11 6 2 60 to 64 years . . . . . . . . 66 8 2 7 4 2 9 3 7 12 10 2 65 to 69 years . . . . . . . . 41 7 3 - 2 - 9 4 4 6 2 4 70 to 74 years . . . . . . . . 35 10 3 - - 3 6 1 3 6 2 1 75 to 79 years . . . . . . . . 31 6 2 - 4 3 3 4 3 1 3 2 80 to 84 years . . . . . . . . 7 4 - - - 1 1 - 1 - - - 85+ years. . . . . . . . . . . 11 2 - - 3 - - - - 3 2 1 Median . . . . . . . . . . . . 19.7 16.1 16.7 15.4 18.6 20.9 20.0 17.2 19.2 26.6 22.9 16.7 Females . . . . . . . . . 3,429 518 217 211 188 145 462 239 470 439 420 120 Less than 5 years. . . . . . . 425 73 33 39 26 17 70 33 48 32 37 17 5 to 9 years . . . . . . . . . 450 80 29 30 30 25 69 38 58 39 33 19 10 to 14 years . . . . . . . . 494 83 30 28 27 23 66 41 67 41 67 21 15 to 19 years . . . . . . . . 334 40 20 14 6 10 36 15 75 54 56 8 20 to 24 years . . . . . . . . 242 31 21 11 17 8 26 11 24 40 43 10 25 to 29 years . . . . . . . . 254 38 11 18 15 6 37 15 29 45 33 7 30 to 34 years . . . . . . . . 190 28 13 10 9 7 30 12 24 33 21 3 35 to 39 years . . . . . . . . 221 27 17 16 11 8 29 20 28 28 28 9 40 to 44 years . . . . . . . . 178 22 12 9 8 9 24 8 30 28 19 9 45 to 49 years . . . . . . . . 153 16 7 11 8 9 20 11 20 25 23 3 50 to 54 years . . . . . . . . 126 22 4 5 8 3 8 14 24 19 15 4 55 to 59 years . . . . . . . . 80 14 3 8 5 3 5 3 11 12 13 3 60 to 64 years . . . . . . . . 80 15 7 2 5 4 15 2 7 11 8 4 65 to 69 years . . . . . . . . 58 8 3 3 6 3 7 4 12 5 6 1 70 to 74 years . . . . . . . . 64 10 3 4 1 5 9 7 6 10 9 - 75 to 79 years . . . . . . . . 41 5 4 1 2 1 8 1 5 7 6 1 80 to 84 years . . . . . . . . 17 3 - 1 2 1 2 - - 4 3 1 85+ years. . . . . . . . . . . 22 3 - 1 2 3 1 4 2 6 - - Median . . . . . . . . . . . . 20.2 17.9 19.1 18.0 21.5 18.8 18.6 17.5 19.1 26.5 22.0 16.9 ────────────────────────────────────────────────────────────────────────────────────────────────────── Source: 2000 FSM Census
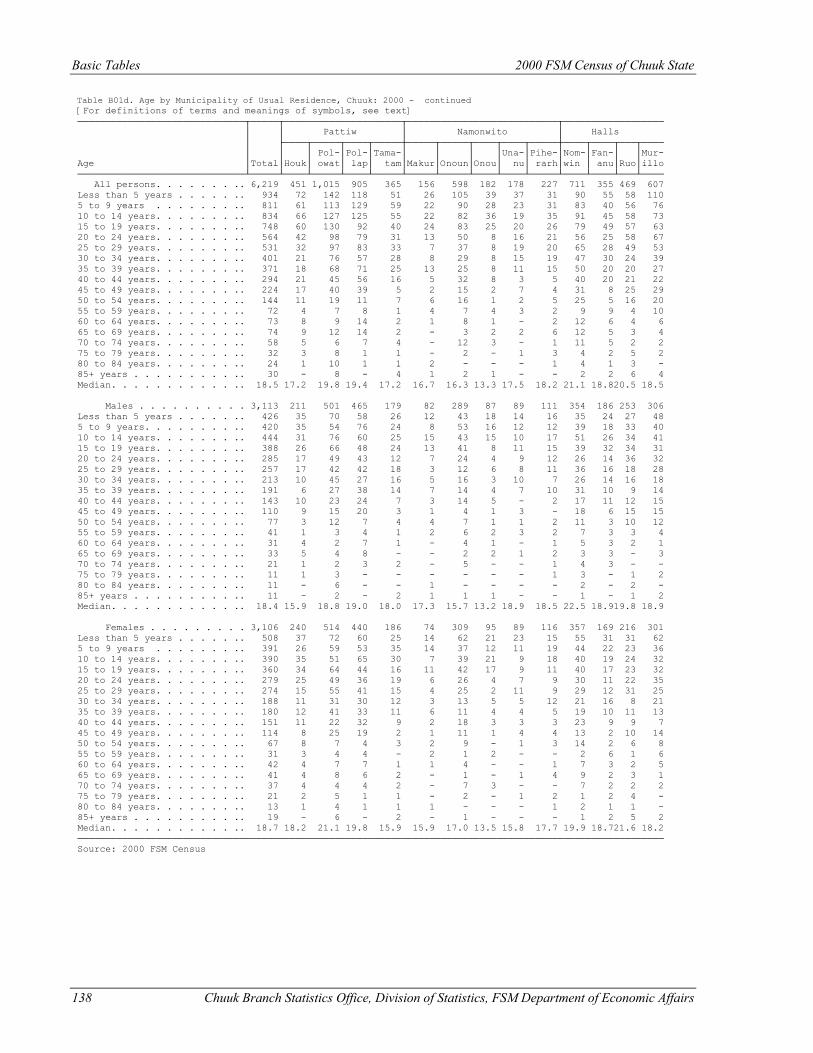
Basic Tables 2000 FSM Census of Chuuk State
138 Chuuk Branch Statistics Office, Division of Statistics, FSM Department of Economic Affairs
Table B01d. Age by Municipality of Usual Residence, Chuuk: 2000 - continued [For definitions of terms and meanings of symbols, see text] ──────────────────────────────┬─────┬─────────────────────┬───────────────────────────┬────────────────── │ │ Pattiw │ Namonwito │ Halls │ ├────┬─────┬────┬─────┼─────┬─────┬────┬────┬─────┼────┬────┬───┬──── │ │ │ Pol-│Pol-│Tama-│ │ │ │Una-│Pihe-│Nom-│Fan-│ │Mur- Age │Total│Houk│ owat│ lap│ tam│Makur│Onoun│Onou│ nu│ rarh│win │ anu│Ruo│illo ──────────────────────────────┴─────┴────┴─────┴────┴─────┴─────┴─────┴────┴────┴─────┴────┴────┴───┴──── All persons. . . . . . . .. 6,219 451 1,015 905 365 156 598 182 178 227 711 355 469 607 Less than 5 years . . . . . .. 934 72 142 118 51 26 105 39 37 31 90 55 58 110 5 to 9 years . . . . . . . .. 811 61 113 129 59 22 90 28 23 31 83 40 56 76 10 to 14 years. . . . . . . .. 834 66 127 125 55 22 82 36 19 35 91 45 58 73 15 to 19 years. . . . . . . .. 748 60 130 92 40 24 83 25 20 26 79 49 57 63 20 to 24 years. . . . . . . .. 564 42 98 79 31 13 50 8 16 21 56 25 58 67 25 to 29 years. . . . . . . .. 531 32 97 83 33 7 37 8 19 20 65 28 49 53 30 to 34 years. . . . . . . .. 401 21 76 57 28 8 29 8 15 19 47 30 24 39 35 to 39 years. . . . . . . .. 371 18 68 71 25 13 25 8 11 15 50 20 20 27 40 to 44 years. . . . . . . .. 294 21 45 56 16 5 32 8 3 5 40 20 21 22 45 to 49 years. . . . . . . .. 224 17 40 39 5 2 15 2 7 4 31 8 25 29 50 to 54 years. . . . . . . .. 144 11 19 11 7 6 16 1 2 5 25 5 16 20 55 to 59 years. . . . . . . .. 72 4 7 8 1 4 7 4 3 2 9 9 4 10 60 to 64 years. . . . . . . .. 73 8 9 14 2 1 8 1 - 2 12 6 4 6 65 to 69 years. . . . . . . .. 74 9 12 14 2 - 3 2 2 6 12 5 3 4 70 to 74 years. . . . . . . .. 58 5 6 7 4 - 12 3 - 1 11 5 2 2 75 to 79 years. . . . . . . .. 32 3 8 1 1 - 2 - 1 3 4 2 5 2 80 to 84 years. . . . . . . .. 24 1 10 1 1 2 - - - 1 4 1 3 - 85+ years . . . . . . . . . .. 30 - 8 - 4 1 2 1 - - 2 2 6 4 Median. . . . . . . . . . . .. 18.5 17.2 19.8 19.4 17.2 16.7 16.3 13.3 17.5 18.2 21.1 18.820.5 18.5 Males . . . . . . . . . . 3,113 211 501 465 179 82 289 87 89 111 354 186 253 306 Less than 5 years . . . . . .. 426 35 70 58 26 12 43 18 14 16 35 24 27 48 5 to 9 years. . . . . . . . .. 420 35 54 76 24 8 53 16 12 12 39 18 33 40 10 to 14 years. . . . . . . .. 444 31 76 60 25 15 43 15 10 17 51 26 34 41 15 to 19 years. . . . . . . .. 388 26 66 48 24 13 41 8 11 15 39 32 34 31 20 to 24 years. . . . . . . .. 285 17 49 43 12 7 24 4 9 12 26 14 36 32 25 to 29 years. . . . . . . .. 257 17 42 42 18 3 12 6 8 11 36 16 18 28 30 to 34 years. . . . . . . .. 213 10 45 27 16 5 16 3 10 7 26 14 16 18 35 to 39 years. . . . . . . .. 191 6 27 38 14 7 14 4 7 10 31 10 9 14 40 to 44 years. . . . . . . .. 143 10 23 24 7 3 14 5 - 2 17 11 12 15 45 to 49 years. . . . . . . .. 110 9 15 20 3 1 4 1 3 - 18 6 15 15 50 to 54 years. . . . . . . .. 77 3 12 7 4 4 7 1 1 2 11 3 10 12 55 to 59 years. . . . . . . .. 41 1 3 4 1 2 6 2 3 2 7 3 3 4 60 to 64 years. . . . . . . .. 31 4 2 7 1 - 4 1 - 1 5 3 2 1 65 to 69 years. . . . . . . .. 33 5 4 8 - - 2 2 1 2 3 3 - 3 70 to 74 years. . . . . . . .. 21 1 2 3 2 - 5 - - 1 4 3 - - 75 to 79 years. . . . . . . .. 11 1 3 - - - - - - 1 3 - 1 2 80 to 84 years. . . . . . . .. 11 - 6 - - 1 - - - - 2 - 2 - 85+ years . . . . . . . . . .. 11 - 2 - 2 1 1 1 - - 1 - 1 2 Median. . . . . . . . . . . .. 18.4 15.9 18.8 19.0 18.0 17.3 15.7 13.2 18.9 18.5 22.5 18.919.8 18.9 Females . . . . . . . . . 3,106 240 514 440 186 74 309 95 89 116 357 169 216 301 Less than 5 years . . . . . .. 508 37 72 60 25 14 62 21 23 15 55 31 31 62 5 to 9 years . . . . . . . .. 391 26 59 53 35 14 37 12 11 19 44 22 23 36 10 to 14 years. . . . . . . .. 390 35 51 65 30 7 39 21 9 18 40 19 24 32 15 to 19 years. . . . . . . .. 360 34 64 44 16 11 42 17 9 11 40 17 23 32 20 to 24 years. . . . . . . .. 279 25 49 36 19 6 26 4 7 9 30 11 22 35 25 to 29 years. . . . . . . .. 274 15 55 41 15 4 25 2 11 9 29 12 31 25 30 to 34 years. . . . . . . .. 188 11 31 30 12 3 13 5 5 12 21 16 8 21 35 to 39 years. . . . . . . .. 180 12 41 33 11 6 11 4 4 5 19 10 11 13 40 to 44 years. . . . . . . .. 151 11 22 32 9 2 18 3 3 3 23 9 9 7 45 to 49 years. . . . . . . .. 114 8 25 19 2 1 11 1 4 4 13 2 10 14 50 to 54 years. . . . . . . .. 67 8 7 4 3 2 9 - 1 3 14 2 6 8 55 to 59 years. . . . . . . .. 31 3 4 4 - 2 1 2 - - 2 6 1 6 60 to 64 years. . . . . . . .. 42 4 7 7 1 1 4 - - 1 7 3 2 5 65 to 69 years. . . . . . . .. 41 4 8 6 2 - 1 - 1 4 9 2 3 1 70 to 74 years. . . . . . . .. 37 4 4 4 2 - 7 3 - - 7 2 2 2 75 to 79 years. . . . . . . .. 21 2 5 1 1 - 2 - 1 2 1 2 4 - 80 to 84 years. . . . . . . .. 13 1 4 1 1 1 - - - 1 2 1 1 - 85+ years . . . . . . . . . .. 19 - 6 - 2 - 1 - - - 1 2 5 2 Median. . . . . . . . . . . .. 18.7 18.2 21.1 19.8 15.9 15.9 17.0 13.5 15.8 17.7 19.9 18.721.6 18.2 ───────────────────────────────────────────────────────────────────────────────────────────────────────── Source: 2000 FSM Census
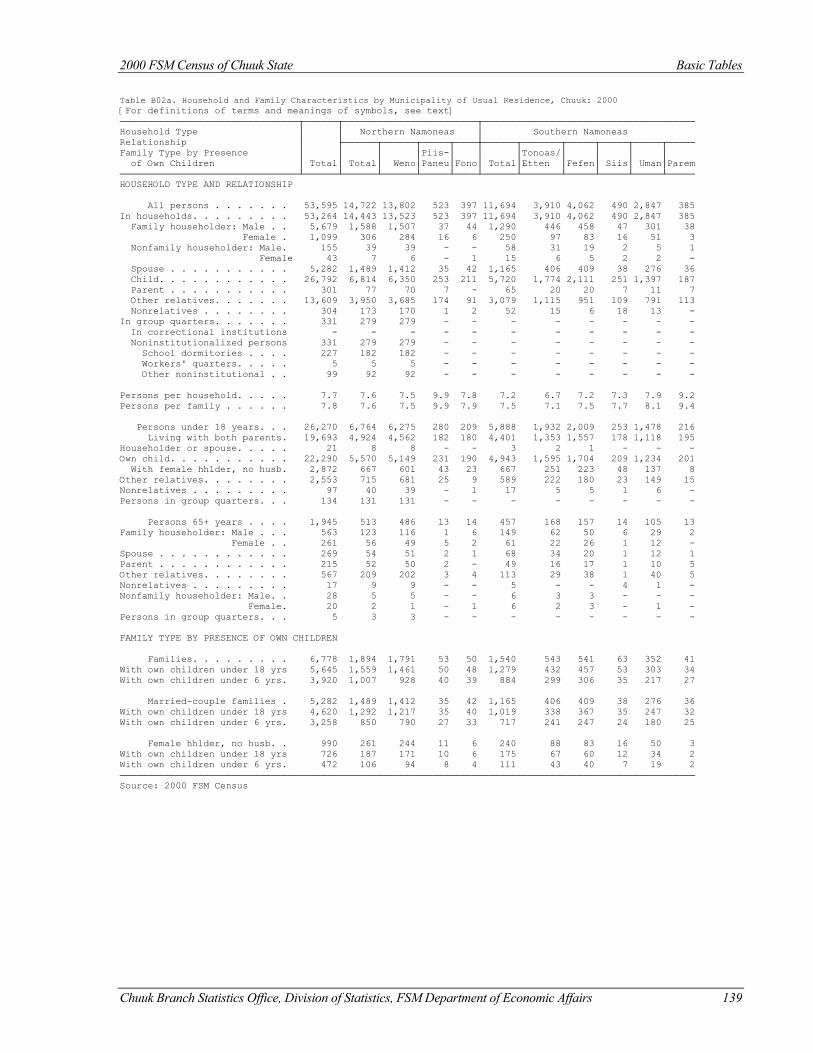
2000 FSM Census of Chuuk State Basic Tables
Chuuk Branch Statistics Office, Division of Statistics, FSM Department of Economic Affairs 139
Table B02a. Household and Family Characteristics by Municipality of Usual Residence, Chuuk: 2000 [For definitions of terms and meanings of symbols, see text] ────────────────────────────────┬──────┬────────────────────────┬────────────────────────────────────── Household Type │ │ Northern Namoneas │ Southern Namoneas Relationship │ ├──────┬──────┬─────┬────┼──────┬───────┬─────┬─────┬─────┬───── Family Type by Presence │ │ │ │Piis-│ │ │Tonoas/│ │ │ │ of Own Children │ Total│ Total│ Weno│Paneu│Fono│ Total│Etten │Fefen│ Siis│ Uman│Parem ────────────────────────────────┴──────┴──────┴──────┴─────┴────┴──────┴───────┴─────┴─────┴─────┴───── HOUSEHOLD TYPE AND RELATIONSHIP All persons . . . . . . . 53,595 14,722 13,802 523 397 11,694 3,910 4,062 490 2,847 385 In households. . . . . . . . . 53,264 14,443 13,523 523 397 11,694 3,910 4,062 490 2,847 385 Family householder: Male . . 5,679 1,588 1,507 37 44 1,290 446 458 47 301 38 Female . 1,099 306 284 16 6 250 97 83 16 51 3 Nonfamily householder: Male. 155 39 39 - - 58 31 19 2 5 1 Female 43 7 6 - 1 15 6 5 2 2 - Spouse . . . . . . . . . . . 5,282 1,489 1,412 35 42 1,165 406 409 38 276 36 Child. . . . . . . . . . . . 26,792 6,814 6,350 253 211 5,720 1,774 2,111 251 1,397 187 Parent . . . . . . . . . . . 301 77 70 7 - 65 20 20 7 11 7 Other relatives. . . . . . . 13,609 3,950 3,685 174 91 3,079 1,115 951 109 791 113 Nonrelatives . . . . . . . . 304 173 170 1 2 52 15 6 18 13 - In group quarters. . . . . . . 331 279 279 - - - - - - - - In correctional institutions - - - - - - - - - - - Noninstitutionalized persons 331 279 279 - - - - - - - - School dormitories . . . . 227 182 182 - - - - - - - - Workers' quarters. . . . . 5 5 5 - - - - - - - - Other noninstitutional . . 99 92 92 - - - - - - - - Persons per household. . . . . 7.7 7.6 7.5 9.9 7.8 7.2 6.7 7.2 7.3 7.9 9.2 Persons per family . . . . . . 7.8 7.6 7.5 9.9 7.9 7.5 7.1 7.5 7.7 8.1 9.4 Persons under 18 years. . . 26,270 6,764 6,275 280 209 5,888 1,932 2,009 253 1,478 216 Living with both parents. 19,693 4,924 4,562 182 180 4,401 1,353 1,557 178 1,118 195 Householder or spouse. . . . . 21 8 8 - - 3 2 1 - - - Own child. . . . . . . . . . . 22,290 5,570 5,149 231 190 4,943 1,595 1,704 209 1,234 201 With female hhlder, no husb. 2,872 667 601 43 23 667 251 223 48 137 8 Other relatives. . . . . . . . 2,553 715 681 25 9 589 222 180 23 149 15 Nonrelatives . . . . . . . . . 97 40 39 - 1 17 5 5 1 6 - Persons in group quarters. . . 134 131 131 - - - - - - - - Persons 65+ years . . . . 1,945 513 486 13 14 457 168 157 14 105 13 Family householder: Male . . . 563 123 116 1 6 149 62 50 6 29 2 Female . . 261 56 49 5 2 61 22 26 1 12 - Spouse . . . . . . . . . . . . 269 54 51 2 1 68 34 20 1 12 1 Parent . . . . . . . . . . . . 215 52 50 2 - 49 16 17 1 10 5 Other relatives. . . . . . . . 567 209 202 3 4 113 29 38 1 40 5 Nonrelatives . . . . . . . . . 17 9 9 - - 5 - - 4 1 - Nonfamily householder: Male. . 28 5 5 - - 6 3 3 - - - Female. 20 2 1 - 1 6 2 3 - 1 - Persons in group quarters. . . 5 3 3 - - - - - - - - FAMILY TYPE BY PRESENCE OF OWN CHILDREN Families. . . . . . . . . 6,778 1,894 1,791 53 50 1,540 543 541 63 352 41 With own children under 18 yrs 5,645 1,559 1,461 50 48 1,279 432 457 53 303 34 With own children under 6 yrs. 3,920 1,007 928 40 39 884 299 306 35 217 27 Married-couple families . 5,282 1,489 1,412 35 42 1,165 406 409 38 276 36 With own children under 18 yrs 4,620 1,292 1,217 35 40 1,019 338 367 35 247 32 With own children under 6 yrs. 3,258 850 790 27 33 717 241 247 24 180 25 Female hhlder, no husb. . 990 261 244 11 6 240 88 83 16 50 3 With own children under 18 yrs 726 187 171 10 6 175 67 60 12 34 2 With own children under 6 yrs. 472 106 94 8 4 111 43 40 7 19 2 ─────────────────────────────────────────────────────────────────────────────────────────────────────── Source: 2000 FSM Census
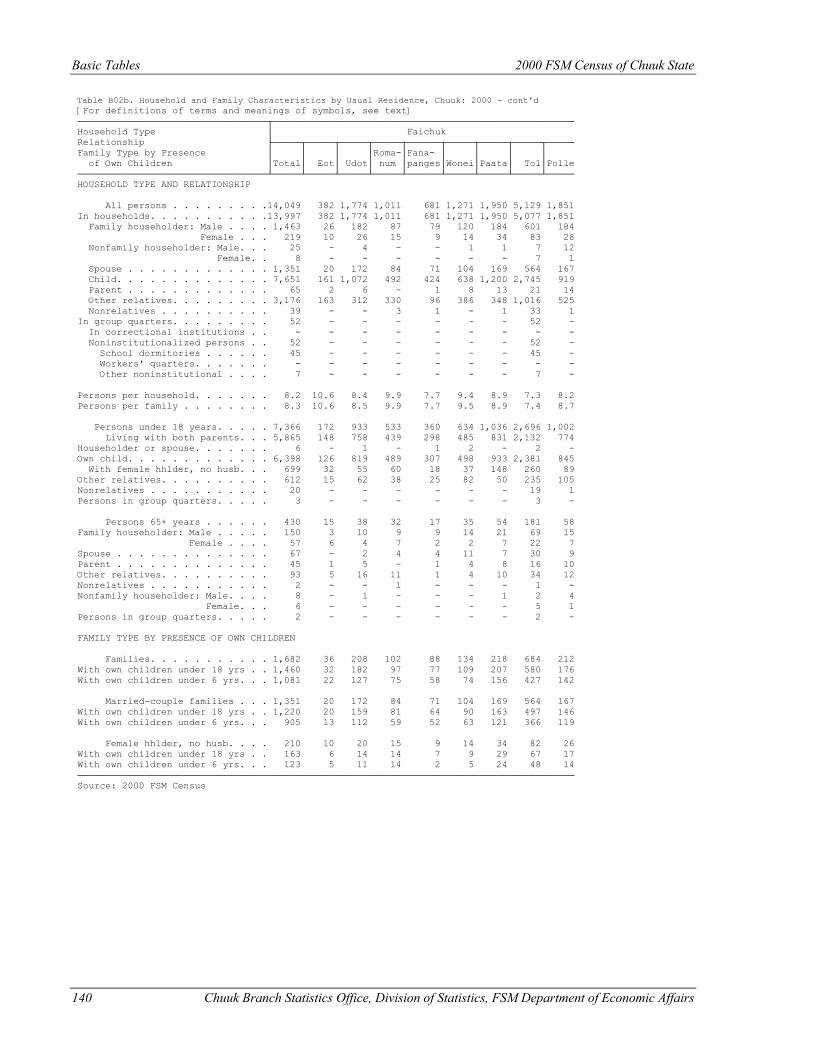
Basic Tables 2000 FSM Census of Chuuk State
140 Chuuk Branch Statistics Office, Division of Statistics, FSM Department of Economic Affairs
Table B02b. Household and Family Characteristics by Usual Residence, Chuuk: 2000 - cont'd [For definitions of terms and meanings of symbols, see text] ──────────────────────────────────┬────────────────────────────────────────────────────── Household Type │ Faichuk Relationship ├─────┬─────┬─────┬─────┬──────┬─────┬─────┬─────┬───── Family Type by Presence │ │ │ │Roma-│Fana- │ │ │ │ of Own Children │Total│ Eot│ Udot│ num │panges│Wonei│Paata│ Tol│Polle ──────────────────────────────────┴─────┴─────┴─────┴─────┴──────┴─────┴─────┴─────┴───── HOUSEHOLD TYPE AND RELATIONSHIP All persons . . . . . . . . .14,049 382 1,774 1,011 681 1,271 1,950 5,129 1,851 In households. . . . . . . . . . .13,997 382 1,774 1,011 681 1,271 1,950 5,077 1,851 Family householder: Male . . . . 1,463 26 182 87 79 120 184 601 184 Female . . . 219 10 26 15 9 14 34 83 28 Nonfamily householder: Male. . . 25 - 4 - - 1 1 7 12 Female. . 8 - - - - - - 7 1 Spouse . . . . . . . . . . . . . 1,351 20 172 84 71 104 169 564 167 Child. . . . . . . . . . . . . . 7,651 161 1,072 492 424 638 1,200 2,745 919 Parent . . . . . . . . . . . . . 65 2 6 - 1 8 13 21 14 Other relatives. . . . . . . . . 3,176 163 312 330 96 386 348 1,016 525 Nonrelatives . . . . . . . . . . 39 - - 3 1 - 1 33 1 In group quarters. . . . . . . . . 52 - - - - - - 52 - In correctional institutions . . - - - - - - - - - Noninstitutionalized persons . . 52 - - - - - - 52 - School dormitories . . . . . . 45 - - - - - - 45 - Workers' quarters. . . . . . . - - - - - - - - - Other noninstitutional . . . . 7 - - - - - - 7 - Persons per household. . . . . . . 8.2 10.6 8.4 9.9 7.7 9.4 8.9 7.3 8.2 Persons per family . . . . . . . . 8.3 10.6 8.5 9.9 7.7 9.5 8.9 7.4 8.7 Persons under 18 years. . . . . 7,366 172 933 533 360 634 1,036 2,696 1,002 Living with both parents. . . 5,865 148 758 439 298 485 831 2,132 774 Householder or spouse. . . . . . . 6 - 1 - 1 2 - 2 - Own child. . . . . . . . . . . . . 6,398 126 819 489 307 498 933 2,381 845 With female hhlder, no husb. . . 699 32 55 60 18 37 148 260 89 Other relatives. . . . . . . . . . 612 15 62 38 25 82 50 235 105 Nonrelatives . . . . . . . . . . . 20 - - - - - - 19 1 Persons in group quarters. . . . . 3 - - - - - - 3 - Persons 65+ years . . . . . . 430 15 38 32 17 35 54 181 58 Family householder: Male . . . . . 150 3 10 9 9 14 21 69 15 Female . . . . 57 6 4 7 2 2 7 22 7 Spouse . . . . . . . . . . . . . . 67 - 2 4 4 11 7 30 9 Parent . . . . . . . . . . . . . . 45 1 5 - 1 4 8 16 10 Other relatives. . . . . . . . . . 93 5 16 11 1 4 10 34 12 Nonrelatives . . . . . . . . . . . 2 - - 1 - - - 1 - Nonfamily householder: Male. . . . 8 - 1 - - - 1 2 4 Female. . . 6 - - - - - - 5 1 Persons in group quarters. . . . . 2 - - - - - - 2 - FAMILY TYPE BY PRESENCE OF OWN CHILDREN Families. . . . . . . . . . . 1,682 36 208 102 88 134 218 684 212 With own children under 18 yrs . . 1,460 32 182 97 77 109 207 580 176 With own children under 6 yrs. . . 1,081 22 127 75 58 74 156 427 142 Married-couple families . . . 1,351 20 172 84 71 104 169 564 167 With own children under 18 yrs . . 1,220 20 159 81 64 90 163 497 146 With own children under 6 yrs. . . 905 13 112 59 52 63 121 366 119 Female hhlder, no husb. . . . 210 10 20 15 9 14 34 82 26 With own children under 18 yrs . . 163 6 14 14 7 9 29 67 17 With own children under 6 yrs. . . 123 5 11 14 2 5 24 48 14 ───────────────────────────────────────────────────────────────────────────────────────── Source: 2000 FSM Census
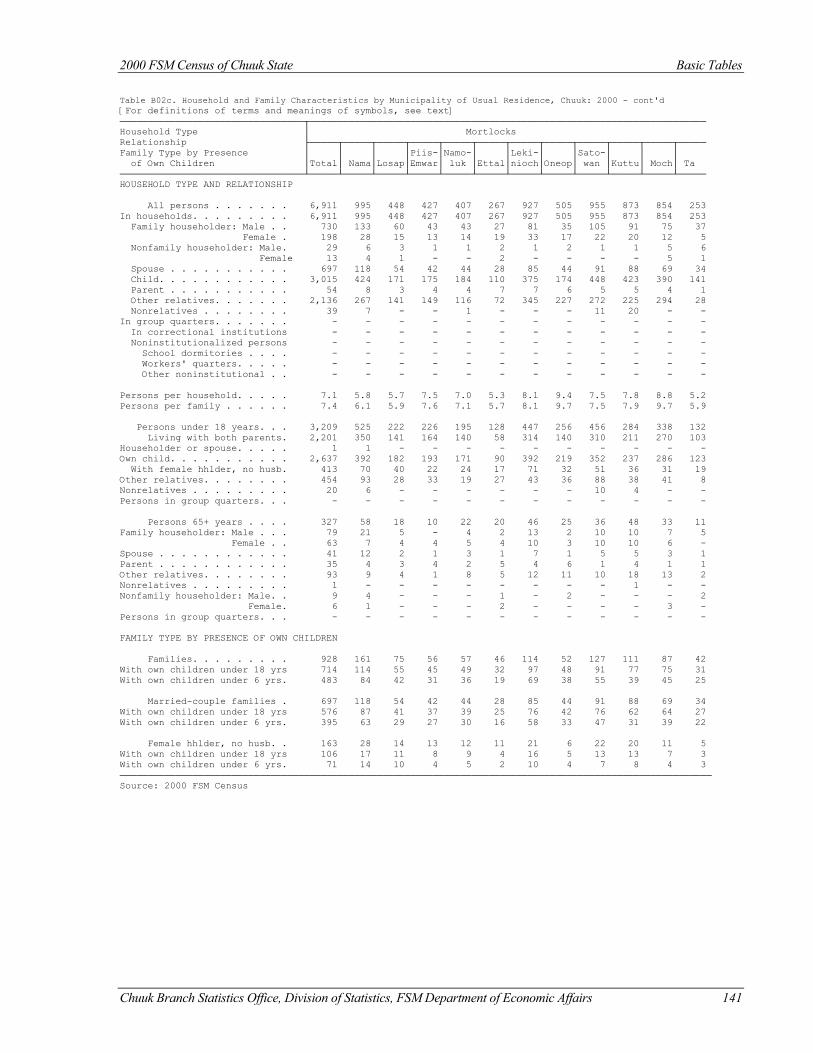
2000 FSM Census of Chuuk State Basic Tables
Chuuk Branch Statistics Office, Division of Statistics, FSM Department of Economic Affairs 141
Table B02c. Household and Family Characteristics by Municipality of Usual Residence, Chuuk: 2000 - cont'd [For definitions of terms and meanings of symbols, see text] ─────────────────────────────────┬─────────────────────────────────────────────────────────────────────── Household Type │ Mortlocks Relationship ├─────┬─────┬─────┬─────┬─────┬─────┬─────┬─────┬─────┬─────┬─────┬───── Family Type by Presence │ │ │ │Piis-│Namo-│ │Leki-│ │Sato-│ │ │ of Own Children │Total│ Nama│Losap│Emwar│ luk │Ettal│nioch│Oneop│ wan │Kuttu│ Moch│ Ta ─────────────────────────────────┴─────┴─────┴─────┴─────┴─────┴─────┴─────┴─────┴─────┴─────┴─────┴───── HOUSEHOLD TYPE AND RELATIONSHIP All persons . . . . . . . 6,911 995 448 427 407 267 927 505 955 873 854 253 In households. . . . . . . . . 6,911 995 448 427 407 267 927 505 955 873 854 253 Family householder: Male . . 730 133 60 43 43 27 81 35 105 91 75 37 Female . 198 28 15 13 14 19 33 17 22 20 12 5 Nonfamily householder: Male. 29 6 3 1 1 2 1 2 1 1 5 6 Female 13 4 1 - - 2 - - - - 5 1 Spouse . . . . . . . . . . . 697 118 54 42 44 28 85 44 91 88 69 34 Child. . . . . . . . . . . . 3,015 424 171 175 184 110 375 174 448 423 390 141 Parent . . . . . . . . . . . 54 8 3 4 4 7 7 6 5 5 4 1 Other relatives. . . . . . . 2,136 267 141 149 116 72 345 227 272 225 294 28 Nonrelatives . . . . . . . . 39 7 - - 1 - - - 11 20 - - In group quarters. . . . . . . - - - - - - - - - - - - In correctional institutions - - - - - - - - - - - - Noninstitutionalized persons - - - - - - - - - - - - School dormitories . . . . - - - - - - - - - - - - Workers' quarters. . . . . - - - - - - - - - - - - Other noninstitutional . . - - - - - - - - - - - - Persons per household. . . . . 7.1 5.8 5.7 7.5 7.0 5.3 8.1 9.4 7.5 7.8 8.8 5.2 Persons per family . . . . . . 7.4 6.1 5.9 7.6 7.1 5.7 8.1 9.7 7.5 7.9 9.7 5.9 Persons under 18 years. . . 3,209 525 222 226 195 128 447 256 456 284 338 132 Living with both parents. 2,201 350 141 164 140 58 314 140 310 211 270 103 Householder or spouse. . . . . 1 1 - - - - - - - - - - Own child. . . . . . . . . . . 2,637 392 182 193 171 90 392 219 352 237 286 123 With female hhlder, no husb. 413 70 40 22 24 17 71 32 51 36 31 19 Other relatives. . . . . . . . 454 93 28 33 19 27 43 36 88 38 41 8 Nonrelatives . . . . . . . . . 20 6 - - - - - - 10 4 - - Persons in group quarters. . . - - - - - - - - - - - - Persons 65+ years . . . . 327 58 18 10 22 20 46 25 36 48 33 11 Family householder: Male . . . 79 21 5 - 4 2 13 2 10 10 7 5 Female . . 63 7 4 4 5 4 10 3 10 10 6 - Spouse . . . . . . . . . . . . 41 12 2 1 3 1 7 1 5 5 3 1 Parent . . . . . . . . . . . . 35 4 3 4 2 5 4 6 1 4 1 1 Other relatives. . . . . . . . 93 9 4 1 8 5 12 11 10 18 13 2 Nonrelatives . . . . . . . . . 1 - - - - - - - - 1 - - Nonfamily householder: Male. . 9 4 - - - 1 - 2 - - - 2 Female. 6 1 - - - 2 - - - - 3 - Persons in group quarters. . . - - - - - - - - - - - - FAMILY TYPE BY PRESENCE OF OWN CHILDREN Families. . . . . . . . . 928 161 75 56 57 46 114 52 127 111 87 42 With own children under 18 yrs 714 114 55 45 49 32 97 48 91 77 75 31 With own children under 6 yrs. 483 84 42 31 36 19 69 38 55 39 45 25 Married-couple families . 697 118 54 42 44 28 85 44 91 88 69 34 With own children under 18 yrs 576 87 41 37 39 25 76 42 76 62 64 27 With own children under 6 yrs. 395 63 29 27 30 16 58 33 47 31 39 22 Female hhlder, no husb. . 163 28 14 13 12 11 21 6 22 20 11 5 With own children under 18 yrs 106 17 11 8 9 4 16 5 13 13 7 3 With own children under 6 yrs. 71 14 10 4 5 2 10 4 7 8 4 3 ────────────────────────────────────────────────────────────────────────────────────────────────────────── Source: 2000 FSM Census
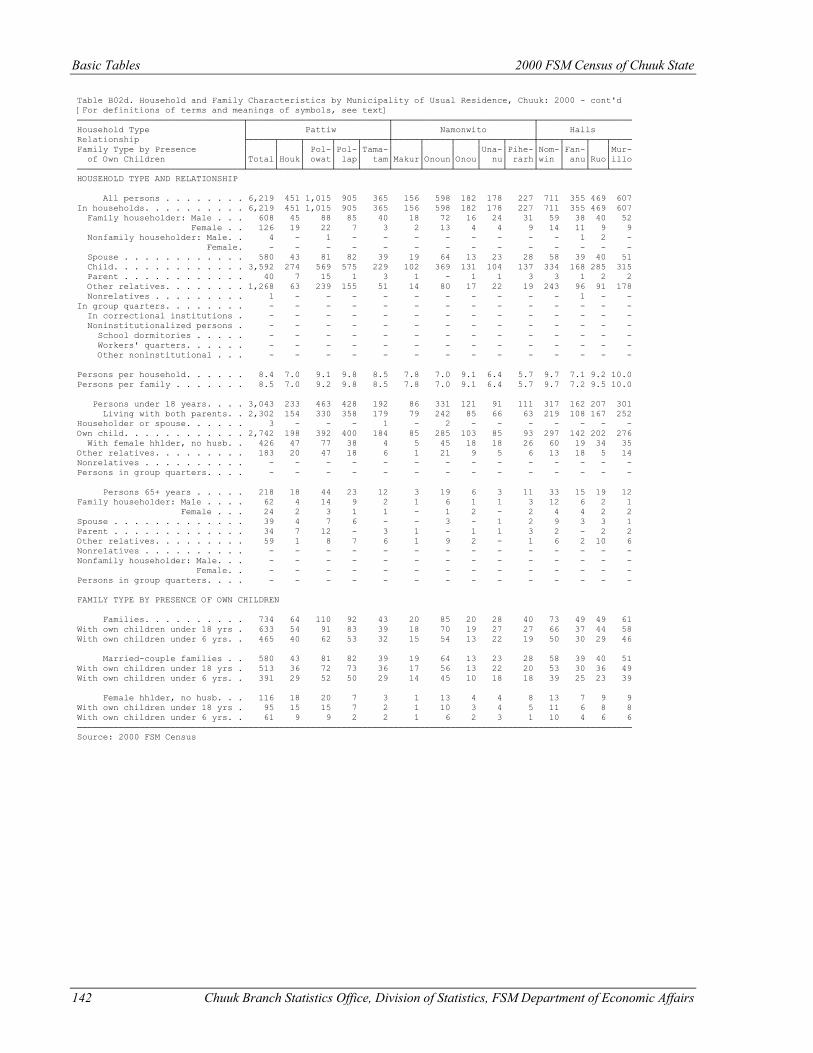
Basic Tables 2000 FSM Census of Chuuk State
142 Chuuk Branch Statistics Office, Division of Statistics, FSM Department of Economic Affairs
Table B02d. Household and Family Characteristics by Municipality of Usual Residence, Chuuk: 2000 - cont'd [For definitions of terms and meanings of symbols, see text] ────────────────────────────────┬───────────────────────────┬───────────────────────────┬────────────────── Household Type │ Pattiw │ Namonwito │ Halls Relationship ├─────┬────┬─────┬────┬─────┼─────┬─────┬────┬────┬─────┼────┬────┬───┬──── Family Type by Presence │ │ │ Pol-│Pol-│Tama-│ │ │ │Una-│Pihe-│Nom-│Fan-│ │Mur- of Own Children │Total│Houk│ owat│ lap│ tam│Makur│Onoun│Onou│ nu│ rarh│win │ anu│Ruo│illo ────────────────────────────────┴─────┴────┴─────┴────┴─────┴─────┴─────┴────┴────┴─────┴────┴────┴───┴──── HOUSEHOLD TYPE AND RELATIONSHIP All persons . . . . . . . . 6,219 451 1,015 905 365 156 598 182 178 227 711 355 469 607 In households. . . . . . . . . . 6,219 451 1,015 905 365 156 598 182 178 227 711 355 469 607 Family householder: Male . . . 608 45 88 85 40 18 72 16 24 31 59 38 40 52 Female . . 126 19 22 7 3 2 13 4 4 9 14 11 9 9 Nonfamily householder: Male. . 4 - 1 - - - - - - - - 1 2 - Female. - - - - - - - - - - - - - - Spouse . . . . . . . . . . . . 580 43 81 82 39 19 64 13 23 28 58 39 40 51 Child. . . . . . . . . . . . . 3,592 274 569 575 229 102 369 131 104 137 334 168 285 315 Parent . . . . . . . . . . . . 40 7 15 1 3 1 - 1 1 3 3 1 2 2 Other relatives. . . . . . . . 1,268 63 239 155 51 14 80 17 22 19 243 96 91 178 Nonrelatives . . . . . . . . . 1 - - - - - - - - - - 1 - - In group quarters. . . . . . . . - - - - - - - - - - - - - - In correctional institutions . - - - - - - - - - - - - - - Noninstitutionalized persons . - - - - - - - - - - - - - - School dormitories . . . . . - - - - - - - - - - - - - - Workers' quarters. . . . . . - - - - - - - - - - - - - - Other noninstitutional . . . - - - - - - - - - - - - - - Persons per household. . . . . . 8.4 7.0 9.1 9.8 8.5 7.8 7.0 9.1 6.4 5.7 9.7 7.1 9.2 10.0 Persons per family . . . . . . . 8.5 7.0 9.2 9.8 8.5 7.8 7.0 9.1 6.4 5.7 9.7 7.2 9.5 10.0 Persons under 18 years. . . . 3,043 233 463 428 192 86 331 121 91 111 317 162 207 301 Living with both parents. . 2,302 154 330 358 179 79 242 85 66 63 219 108 167 252 Householder or spouse. . . . . . 3 - - - 1 - 2 - - - - - - - Own child. . . . . . . . . . . . 2,742 198 392 400 184 85 285 103 85 93 297 142 202 276 With female hhlder, no husb. . 426 47 77 38 4 5 45 18 18 26 60 19 34 35 Other relatives. . . . . . . . . 183 20 47 18 6 1 21 9 5 6 13 18 5 14 Nonrelatives . . . . . . . . . . - - - - - - - - - - - - - - Persons in group quarters. . . . - - - - - - - - - - - - - - Persons 65+ years . . . . . 218 18 44 23 12 3 19 6 3 11 33 15 19 12 Family householder: Male . . . . 62 4 14 9 2 1 6 1 1 3 12 6 2 1 Female . . . 24 2 3 1 1 - 1 2 - 2 4 4 2 2 Spouse . . . . . . . . . . . . . 39 4 7 6 - - 3 - 1 2 9 3 3 1 Parent . . . . . . . . . . . . . 34 7 12 - 3 1 - 1 1 3 2 - 2 2 Other relatives. . . . . . . . . 59 1 8 7 6 1 9 2 - 1 6 2 10 6 Nonrelatives . . . . . . . . . . - - - - - - - - - - - - - - Nonfamily householder: Male. . . - - - - - - - - - - - - - - Female. . - - - - - - - - - - - - - - Persons in group quarters. . . . - - - - - - - - - - - - - - FAMILY TYPE BY PRESENCE OF OWN CHILDREN Families. . . . . . . . . . 734 64 110 92 43 20 85 20 28 40 73 49 49 61 With own children under 18 yrs . 633 54 91 83 39 18 70 19 27 27 66 37 44 58 With own children under 6 yrs. . 465 40 62 53 32 15 54 13 22 19 50 30 29 46 Married-couple families . . 580 43 81 82 39 19 64 13 23 28 58 39 40 51 With own children under 18 yrs . 513 36 72 73 36 17 56 13 22 20 53 30 36 49 With own children under 6 yrs. . 391 29 52 50 29 14 45 10 18 18 39 25 23 39 Female hhlder, no husb. . . 116 18 20 7 3 1 13 4 4 8 13 7 9 9 With own children under 18 yrs . 95 15 15 7 2 1 10 3 4 5 11 6 8 8 With own children under 6 yrs. . 61 9 9 2 2 1 6 2 3 1 10 4 6 6 ─────────────────────────────────────────────────────────────────────────────────────────────────────────── Source: 2000 FSM Census
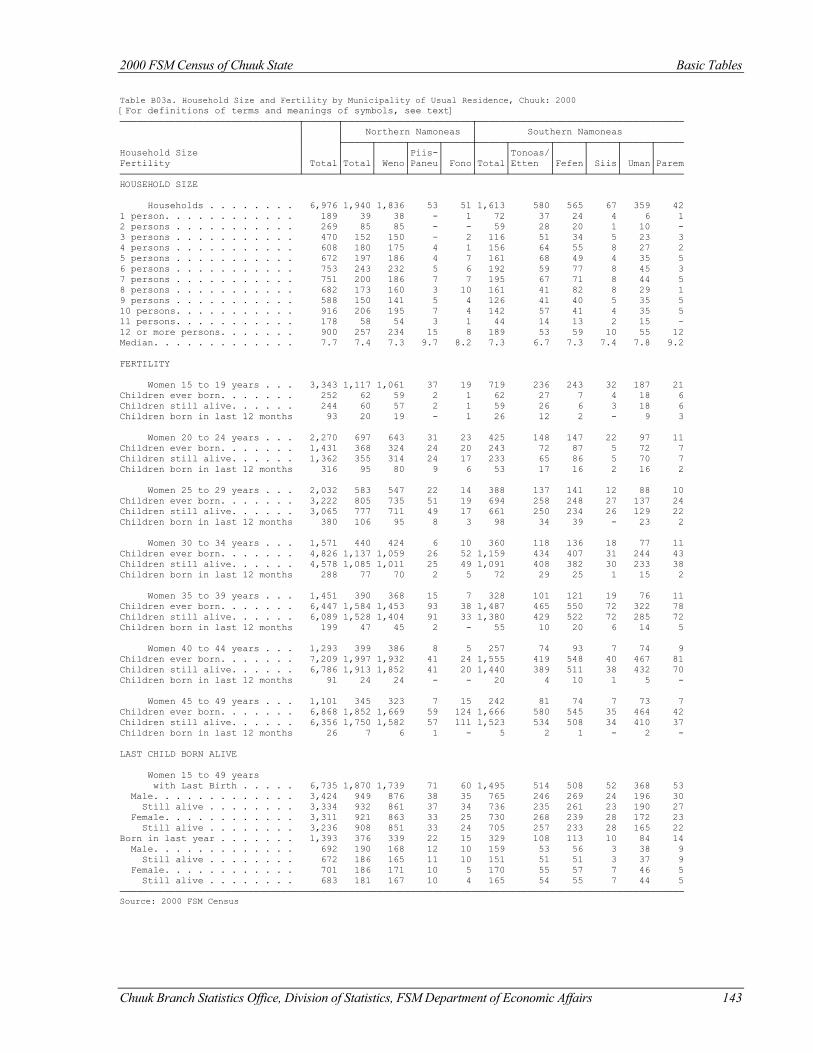
2000 FSM Census of Chuuk State Basic Tables
Chuuk Branch Statistics Office, Division of Statistics, FSM Department of Economic Affairs 143
Table B03a. Household Size and Fertility by Municipality of Usual Residence, Chuuk: 2000 [For definitions of terms and meanings of symbols, see text] ────────────────────────────────┬──────┬───────────────────────┬───────────────────────────────────── │ │ Northern Namoneas │ Southern Namoneas │ ├─────┬─────┬─────┬─────┼─────┬───────┬─────┬─────┬─────┬───── Household Size │ │ │ │Piis-│ │ │Tonoas/│ │ │ │ Fertility │ Total│Total│ Weno│Paneu│ Fono│Total│Etten │Fefen│ Siis│ Uman│Parem ────────────────────────────────┴──────┴─────┴─────┴─────┴─────┴─────┴───────┴─────┴─────┴─────┴───── HOUSEHOLD SIZE Households . . . . . . . . 6,976 1,940 1,836 53 51 1,613 580 565 67 359 42 1 person. . . . . . . . . . . . 189 39 38 - 1 72 37 24 4 6 1 2 persons . . . . . . . . . . . 269 85 85 - - 59 28 20 1 10 - 3 persons . . . . . . . . . . . 470 152 150 - 2 116 51 34 5 23 3 4 persons . . . . . . . . . . . 608 180 175 4 1 156 64 55 8 27 2 5 persons . . . . . . . . . . . 672 197 186 4 7 161 68 49 4 35 5 6 persons . . . . . . . . . . . 753 243 232 5 6 192 59 77 8 45 3 7 persons . . . . . . . . . . . 751 200 186 7 7 195 67 71 8 44 5 8 persons . . . . . . . . . . . 682 173 160 3 10 161 41 82 8 29 1 9 persons . . . . . . . . . . . 588 150 141 5 4 126 41 40 5 35 5 10 persons. . . . . . . . . . . 916 206 195 7 4 142 57 41 4 35 5 11 persons. . . . . . . . . . . 178 58 54 3 1 44 14 13 2 15 - 12 or more persons. . . . . . . 900 257 234 15 8 189 53 59 10 55 12 Median. . . . . . . . . . . . . 7.7 7.4 7.3 9.7 8.2 7.3 6.7 7.3 7.4 7.8 9.2 FERTILITY Women 15 to 19 years . . . 3,343 1,117 1,061 37 19 719 236 243 32 187 21 Children ever born. . . . . . . 252 62 59 2 1 62 27 7 4 18 6 Children still alive. . . . . . 244 60 57 2 1 59 26 6 3 18 6 Children born in last 12 months 93 20 19 - 1 26 12 2 - 9 3 Women 20 to 24 years . . . 2,270 697 643 31 23 425 148 147 22 97 11 Children ever born. . . . . . . 1,431 368 324 24 20 243 72 87 5 72 7 Children still alive. . . . . . 1,362 355 314 24 17 233 65 86 5 70 7 Children born in last 12 months 316 95 80 9 6 53 17 16 2 16 2 Women 25 to 29 years . . . 2,032 583 547 22 14 388 137 141 12 88 10 Children ever born. . . . . . . 3,222 805 735 51 19 694 258 248 27 137 24 Children still alive. . . . . . 3,065 777 711 49 17 661 250 234 26 129 22 Children born in last 12 months 380 106 95 8 3 98 34 39 - 23 2 Women 30 to 34 years . . . 1,571 440 424 6 10 360 118 136 18 77 11 Children ever born. . . . . . . 4,826 1,137 1,059 26 52 1,159 434 407 31 244 43 Children still alive. . . . . . 4,578 1,085 1,011 25 49 1,091 408 382 30 233 38 Children born in last 12 months 288 77 70 2 5 72 29 25 1 15 2 Women 35 to 39 years . . . 1,451 390 368 15 7 328 101 121 19 76 11 Children ever born. . . . . . . 6,447 1,584 1,453 93 38 1,487 465 550 72 322 78 Children still alive. . . . . . 6,089 1,528 1,404 91 33 1,380 429 522 72 285 72 Children born in last 12 months 199 47 45 2 - 55 10 20 6 14 5 Women 40 to 44 years . . . 1,293 399 386 8 5 257 74 93 7 74 9 Children ever born. . . . . . . 7,209 1,997 1,932 41 24 1,555 419 548 40 467 81 Children still alive. . . . . . 6,786 1,913 1,852 41 20 1,440 389 511 38 432 70 Children born in last 12 months 91 24 24 - - 20 4 10 1 5 - Women 45 to 49 years . . . 1,101 345 323 7 15 242 81 74 7 73 7 Children ever born. . . . . . . 6,868 1,852 1,669 59 124 1,666 580 545 35 464 42 Children still alive. . . . . . 6,356 1,750 1,582 57 111 1,523 534 508 34 410 37 Children born in last 12 months 26 7 6 1 - 5 2 1 - 2 - LAST CHILD BORN ALIVE Women 15 to 49 years with Last Birth . . . . . 6,735 1,870 1,739 71 60 1,495 514 508 52 368 53 Male. . . . . . . . . . . . . 3,424 949 876 38 35 765 246 269 24 196 30 Still alive . . . . . . . . 3,334 932 861 37 34 736 235 261 23 190 27 Female. . . . . . . . . . . . 3,311 921 863 33 25 730 268 239 28 172 23 Still alive . . . . . . . . 3,236 908 851 33 24 705 257 233 28 165 22 Born in last year . . . . . . . 1,393 376 339 22 15 329 108 113 10 84 14 Male. . . . . . . . . . . . . 692 190 168 12 10 159 53 56 3 38 9 Still alive . . . . . . . . 672 186 165 11 10 151 51 51 3 37 9 Female. . . . . . . . . . . . 701 186 171 10 5 170 55 57 7 46 5 Still alive . . . . . . . . 683 181 167 10 4 165 54 55 7 44 5 ───────────────────────────────────────────────────────────────────────────────────────────────────── Source: 2000 FSM Census
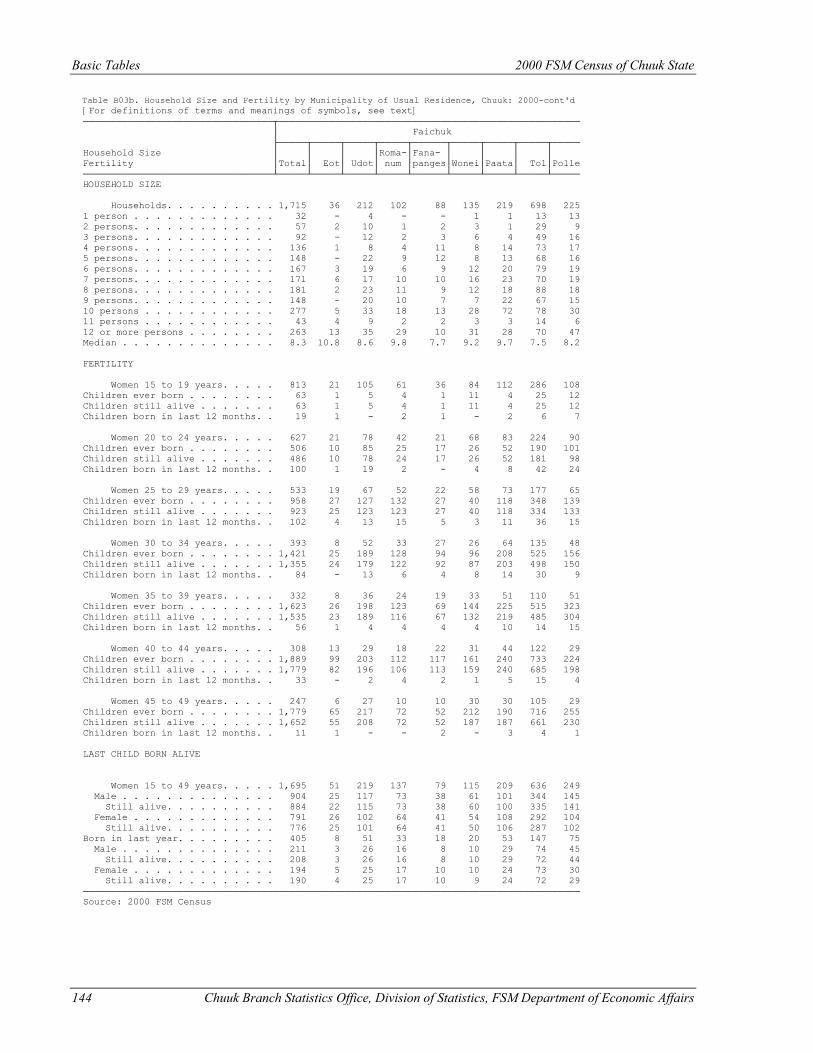
Basic Tables 2000 FSM Census of Chuuk State
144 Chuuk Branch Statistics Office, Division of Statistics, FSM Department of Economic Affairs
Table B03b. Household Size and Fertility by Municipality of Usual Residence, Chuuk: 2000-cont'd [For definitions of terms and meanings of symbols, see text] ──────────────────────────────────┬────────────────────────────────────────────────────── │ Faichuk ├─────┬─────┬─────┬─────┬──────┬─────┬─────┬─────┬───── Household Size │ │ │ │Roma-│Fana- │ │ │ │ Fertility │Total│ Eot│ Udot│ num │panges│Wonei│Paata│ Tol│Polle ──────────────────────────────────┴─────┴─────┴─────┴─────┴──────┴─────┴─────┴─────┴───── HOUSEHOLD SIZE Households. . . . . . . . . . 1,715 36 212 102 88 135 219 698 225 1 person . . . . . . . . . . . . . 32 - 4 - - 1 1 13 13 2 persons. . . . . . . . . . . . . 57 2 10 1 2 3 1 29 9 3 persons. . . . . . . . . . . . . 92 - 12 2 3 6 4 49 16 4 persons. . . . . . . . . . . . . 136 1 8 4 11 8 14 73 17 5 persons. . . . . . . . . . . . . 148 - 22 9 12 8 13 68 16 6 persons. . . . . . . . . . . . . 167 3 19 6 9 12 20 79 19 7 persons. . . . . . . . . . . . . 171 6 17 10 10 16 23 70 19 8 persons. . . . . . . . . . . . . 181 2 23 11 9 12 18 88 18 9 persons. . . . . . . . . . . . . 148 - 20 10 7 7 22 67 15 10 persons . . . . . . . . . . . . 277 5 33 18 13 28 72 78 30 11 persons . . . . . . . . . . . . 43 4 9 2 2 3 3 14 6 12 or more persons . . . . . . . . 263 13 35 29 10 31 28 70 47 Median . . . . . . . . . . . . . . 8.3 10.8 8.6 9.8 7.7 9.2 9.7 7.5 8.2 FERTILITY Women 15 to 19 years. . . . . 813 21 105 61 36 84 112 286 108 Children ever born . . . . . . . . 63 1 5 4 1 11 4 25 12 Children still alive . . . . . . . 63 1 5 4 1 11 4 25 12 Children born in last 12 months. . 19 1 - 2 1 - 2 6 7 Women 20 to 24 years. . . . . 627 21 78 42 21 68 83 224 90 Children ever born . . . . . . . . 506 10 85 25 17 26 52 190 101 Children still alive . . . . . . . 486 10 78 24 17 26 52 181 98 Children born in last 12 months. . 100 1 19 2 - 4 8 42 24 Women 25 to 29 years. . . . . 533 19 67 52 22 58 73 177 65 Children ever born . . . . . . . . 958 27 127 132 27 40 118 348 139 Children still alive . . . . . . . 923 25 123 123 27 40 118 334 133 Children born in last 12 months. . 102 4 13 15 5 3 11 36 15 Women 30 to 34 years. . . . . 393 8 52 33 27 26 64 135 48 Children ever born . . . . . . . . 1,421 25 189 128 94 96 208 525 156 Children still alive . . . . . . . 1,355 24 179 122 92 87 203 498 150 Children born in last 12 months. . 84 - 13 6 4 8 14 30 9 Women 35 to 39 years. . . . . 332 8 36 24 19 33 51 110 51 Children ever born . . . . . . . . 1,623 26 198 123 69 144 225 515 323 Children still alive . . . . . . . 1,535 23 189 116 67 132 219 485 304 Children born in last 12 months. . 56 1 4 4 4 4 10 14 15 Women 40 to 44 years. . . . . 308 13 29 18 22 31 44 122 29 Children ever born . . . . . . . . 1,889 99 203 112 117 161 240 733 224 Children still alive . . . . . . . 1,779 82 196 106 113 159 240 685 198 Children born in last 12 months. . 33 - 2 4 2 1 5 15 4 Women 45 to 49 years. . . . . 247 6 27 10 10 30 30 105 29 Children ever born . . . . . . . . 1,779 65 217 72 52 212 190 716 255 Children still alive . . . . . . . 1,652 55 208 72 52 187 187 661 230 Children born in last 12 months. . 11 1 - - 2 - 3 4 1 LAST CHILD BORN ALIVE Women 15 to 49 years. . . . . 1,695 51 219 137 79 115 209 636 249 Male . . . . . . . . . . . . . . 904 25 117 73 38 61 101 344 145 Still alive. . . . . . . . . . 884 22 115 73 38 60 100 335 141 Female . . . . . . . . . . . . . 791 26 102 64 41 54 108 292 104 Still alive. . . . . . . . . . 776 25 101 64 41 50 106 287 102 Born in last year. . . . . . . . . 405 8 51 33 18 20 53 147 75 Male . . . . . . . . . . . . . . 211 3 26 16 8 10 29 74 45 Still alive. . . . . . . . . . 208 3 26 16 8 10 29 72 44 Female . . . . . . . . . . . . . 194 5 25 17 10 10 24 73 30 Still alive. . . . . . . . . . 190 4 25 17 10 9 24 72 29 ───────────────────────────────────────────────────────────────────────────────────────── Source: 2000 FSM Census
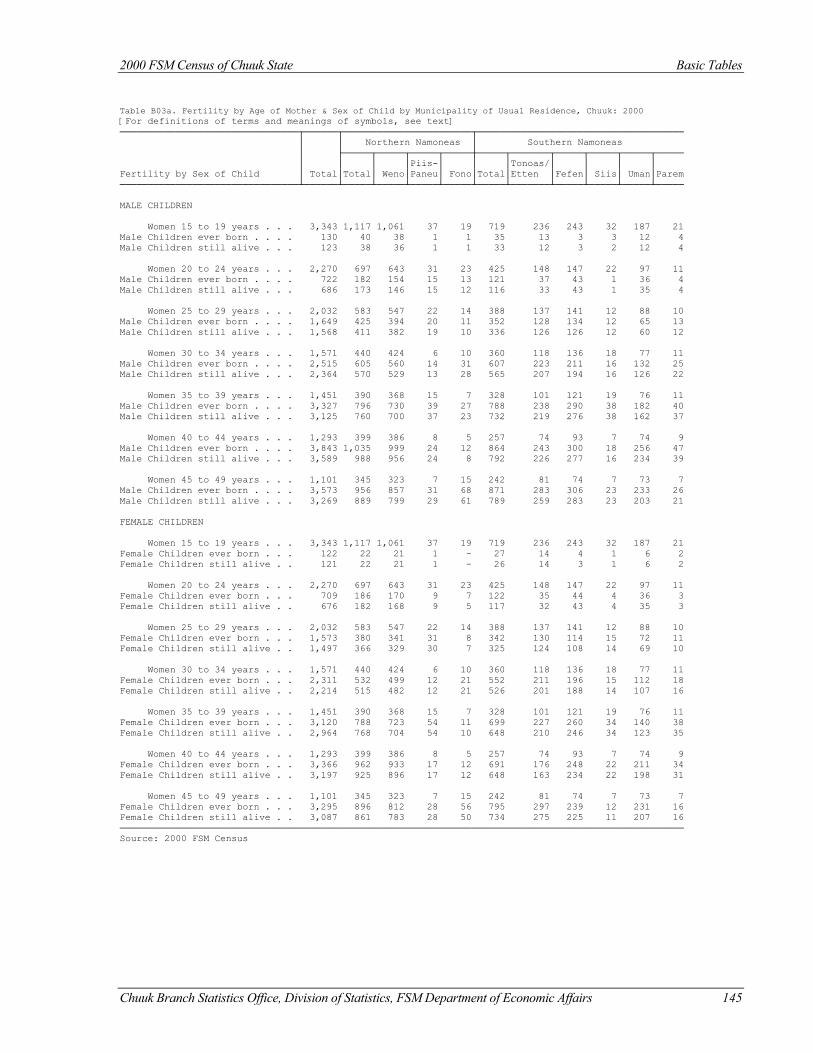
2000 FSM Census of Chuuk State Basic Tables
Chuuk Branch Statistics Office, Division of Statistics, FSM Department of Economic Affairs 145
Table B03a. Fertility by Age of Mother & Sex of Child by Municipality of Usual Residence, Chuuk: 2000 [For definitions of terms and meanings of symbols, see text] ────────────────────────────────┬──────┬───────────────────────┬───────────────────────────────────── │ │ Northern Namoneas │ Southern Namoneas │ ├─────┬─────┬─────┬─────┼─────┬───────┬─────┬─────┬─────┬───── │ │ │ │Piis-│ │ │Tonoas/│ │ │ │ Fertility by Sex of Child │ Total│Total│ Weno│Paneu│ Fono│Total│Etten │Fefen│ Siis│ Uman│Parem ────────────────────────────────┴──────┴─────┴─────┴─────┴─────┴─────┴───────┴─────┴─────┴─────┴───── MALE CHILDREN Women 15 to 19 years . . . 3,343 1,117 1,061 37 19 719 236 243 32 187 21 Male Children ever born . . . . 130 40 38 1 1 35 13 3 3 12 4 Male Children still alive . . . 123 38 36 1 1 33 12 3 2 12 4 Women 20 to 24 years . . . 2,270 697 643 31 23 425 148 147 22 97 11 Male Children ever born . . . . 722 182 154 15 13 121 37 43 1 36 4 Male Children still alive . . . 686 173 146 15 12 116 33 43 1 35 4 Women 25 to 29 years . . . 2,032 583 547 22 14 388 137 141 12 88 10 Male Children ever born . . . . 1,649 425 394 20 11 352 128 134 12 65 13 Male Children still alive . . . 1,568 411 382 19 10 336 126 126 12 60 12 Women 30 to 34 years . . . 1,571 440 424 6 10 360 118 136 18 77 11 Male Children ever born . . . . 2,515 605 560 14 31 607 223 211 16 132 25 Male Children still alive . . . 2,364 570 529 13 28 565 207 194 16 126 22 Women 35 to 39 years . . . 1,451 390 368 15 7 328 101 121 19 76 11 Male Children ever born . . . . 3,327 796 730 39 27 788 238 290 38 182 40 Male Children still alive . . . 3,125 760 700 37 23 732 219 276 38 162 37 Women 40 to 44 years . . . 1,293 399 386 8 5 257 74 93 7 74 9 Male Children ever born . . . . 3,843 1,035 999 24 12 864 243 300 18 256 47 Male Children still alive . . . 3,589 988 956 24 8 792 226 277 16 234 39 Women 45 to 49 years . . . 1,101 345 323 7 15 242 81 74 7 73 7 Male Children ever born . . . . 3,573 956 857 31 68 871 283 306 23 233 26 Male Children still alive . . . 3,269 889 799 29 61 789 259 283 23 203 21 FEMALE CHILDREN Women 15 to 19 years . . . 3,343 1,117 1,061 37 19 719 236 243 32 187 21 Female Children ever born . . . 122 22 21 1 - 27 14 4 1 6 2 Female Children still alive . . 121 22 21 1 - 26 14 3 1 6 2 Women 20 to 24 years . . . 2,270 697 643 31 23 425 148 147 22 97 11 Female Children ever born . . . 709 186 170 9 7 122 35 44 4 36 3 Female Children still alive . . 676 182 168 9 5 117 32 43 4 35 3 Women 25 to 29 years . . . 2,032 583 547 22 14 388 137 141 12 88 10 Female Children ever born . . . 1,573 380 341 31 8 342 130 114 15 72 11 Female Children still alive . . 1,497 366 329 30 7 325 124 108 14 69 10 Women 30 to 34 years . . . 1,571 440 424 6 10 360 118 136 18 77 11 Female Children ever born . . . 2,311 532 499 12 21 552 211 196 15 112 18 Female Children still alive . . 2,214 515 482 12 21 526 201 188 14 107 16 Women 35 to 39 years . . . 1,451 390 368 15 7 328 101 121 19 76 11 Female Children ever born . . . 3,120 788 723 54 11 699 227 260 34 140 38 Female Children still alive . . 2,964 768 704 54 10 648 210 246 34 123 35 Women 40 to 44 years . . . 1,293 399 386 8 5 257 74 93 7 74 9 Female Children ever born . . . 3,366 962 933 17 12 691 176 248 22 211 34 Female Children still alive . . 3,197 925 896 17 12 648 163 234 22 198 31 Women 45 to 49 years . . . 1,101 345 323 7 15 242 81 74 7 73 7 Female Children ever born . . . 3,295 896 812 28 56 795 297 239 12 231 16 Female Children still alive . . 3,087 861 783 28 50 734 275 225 11 207 16 ───────────────────────────────────────────────────────────────────────────────────────────────────── Source: 2000 FSM Census
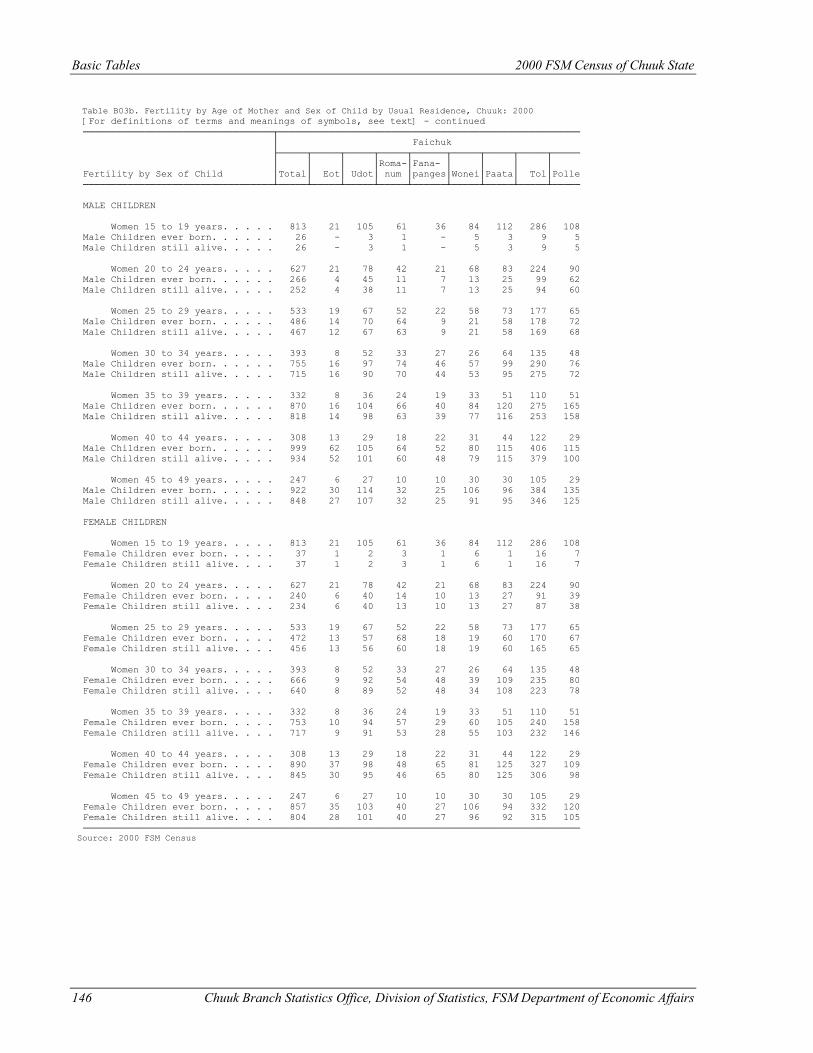
Basic Tables 2000 FSM Census of Chuuk State
146 Chuuk Branch Statistics Office, Division of Statistics, FSM Department of Economic Affairs
Table B03b. Fertility by Age of Mother and Sex of Child by Usual Residence, Chuuk: 2000 [For definitions of terms and meanings of symbols, see text] - continued ──────────────────────────────────┬────────────────────────────────────────────────────── │ Faichuk ├─────┬─────┬─────┬─────┬──────┬─────┬─────┬─────┬───── │ │ │ │Roma-│Fana- │ │ │ │ Fertility by Sex of Child │Total│ Eot│ Udot│ num │panges│Wonei│Paata│ Tol│Polle ──────────────────────────────────┴─────┴─────┴─────┴─────┴──────┴─────┴─────┴─────┴───── MALE CHILDREN Women 15 to 19 years. . . . . 813 21 105 61 36 84 112 286 108 Male Children ever born. . . . . . 26 - 3 1 - 5 3 9 5 Male Children still alive. . . . . 26 - 3 1 - 5 3 9 5 Women 20 to 24 years. . . . . 627 21 78 42 21 68 83 224 90 Male Children ever born. . . . . . 266 4 45 11 7 13 25 99 62 Male Children still alive. . . . . 252 4 38 11 7 13 25 94 60 Women 25 to 29 years. . . . . 533 19 67 52 22 58 73 177 65 Male Children ever born. . . . . . 486 14 70 64 9 21 58 178 72 Male Children still alive. . . . . 467 12 67 63 9 21 58 169 68 Women 30 to 34 years. . . . . 393 8 52 33 27 26 64 135 48 Male Children ever born. . . . . . 755 16 97 74 46 57 99 290 76 Male Children still alive. . . . . 715 16 90 70 44 53 95 275 72 Women 35 to 39 years. . . . . 332 8 36 24 19 33 51 110 51 Male Children ever born. . . . . . 870 16 104 66 40 84 120 275 165 Male Children still alive. . . . . 818 14 98 63 39 77 116 253 158 Women 40 to 44 years. . . . . 308 13 29 18 22 31 44 122 29 Male Children ever born. . . . . . 999 62 105 64 52 80 115 406 115 Male Children still alive. . . . . 934 52 101 60 48 79 115 379 100 Women 45 to 49 years. . . . . 247 6 27 10 10 30 30 105 29 Male Children ever born. . . . . . 922 30 114 32 25 106 96 384 135 Male Children still alive. . . . . 848 27 107 32 25 91 95 346 125 FEMALE CHILDREN Women 15 to 19 years. . . . . 813 21 105 61 36 84 112 286 108 Female Children ever born. . . . . 37 1 2 3 1 6 1 16 7 Female Children still alive. . . . 37 1 2 3 1 6 1 16 7 Women 20 to 24 years. . . . . 627 21 78 42 21 68 83 224 90 Female Children ever born. . . . . 240 6 40 14 10 13 27 91 39 Female Children still alive. . . . 234 6 40 13 10 13 27 87 38 Women 25 to 29 years. . . . . 533 19 67 52 22 58 73 177 65 Female Children ever born. . . . . 472 13 57 68 18 19 60 170 67 Female Children still alive. . . . 456 13 56 60 18 19 60 165 65 Women 30 to 34 years. . . . . 393 8 52 33 27 26 64 135 48 Female Children ever born. . . . . 666 9 92 54 48 39 109 235 80 Female Children still alive. . . . 640 8 89 52 48 34 108 223 78 Women 35 to 39 years. . . . . 332 8 36 24 19 33 51 110 51 Female Children ever born. . . . . 753 10 94 57 29 60 105 240 158 Female Children still alive. . . . 717 9 91 53 28 55 103 232 146 Women 40 to 44 years. . . . . 308 13 29 18 22 31 44 122 29 Female Children ever born. . . . . 890 37 98 48 65 81 125 327 109 Female Children still alive. . . . 845 30 95 46 65 80 125 306 98 Women 45 to 49 years. . . . . 247 6 27 10 10 30 30 105 29 Female Children ever born. . . . . 857 35 103 40 27 106 94 332 120 Female Children still alive. . . . 804 28 101 40 27 96 92 315 105 ───────────────────────────────────────────────────────────────────────────────────────── Source: 2000 FSM Census
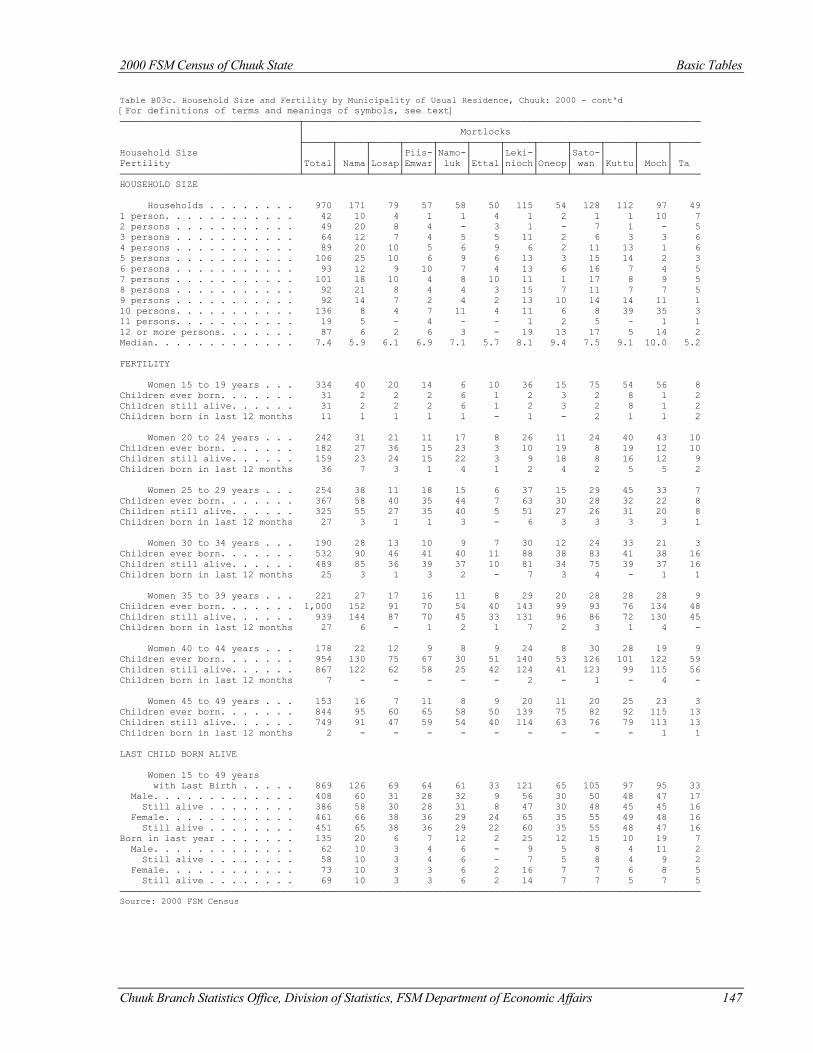
2000 FSM Census of Chuuk State Basic Tables
Chuuk Branch Statistics Office, Division of Statistics, FSM Department of Economic Affairs 147
Table B03c. Household Size and Fertility by Municipality of Usual Residence, Chuuk: 2000 - cont'd [For definitions of terms and meanings of symbols, see text] ────────────────────────────────┬─────────────────────────────────────────────────────────────────────── │ Mortlocks ├─────┬─────┬─────┬─────┬─────┬─────┬─────┬─────┬─────┬─────┬─────┬───── Household Size │ │ │ │Piis-│Namo-│ │Leki-│ │Sato-│ │ │ Fertility │Total│ Nama│Losap│Emwar│ luk │Ettal│nioch│Oneop│ wan │Kuttu│ Moch│ Ta ────────────────────────────────┴─────┴─────┴─────┴─────┴─────┴─────┴─────┴─────┴─────┴─────┴─────┴───── HOUSEHOLD SIZE Households . . . . . . . . 970 171 79 57 58 50 115 54 128 112 97 49 1 person. . . . . . . . . . . . 42 10 4 1 1 4 1 2 1 1 10 7 2 persons . . . . . . . . . . . 49 20 8 4 - 3 1 - 7 1 - 5 3 persons . . . . . . . . . . . 64 12 7 4 5 5 11 2 6 3 3 6 4 persons . . . . . . . . . . . 89 20 10 5 6 9 6 2 11 13 1 6 5 persons . . . . . . . . . . . 106 25 10 6 9 6 13 3 15 14 2 3 6 persons . . . . . . . . . . . 93 12 9 10 7 4 13 6 16 7 4 5 7 persons . . . . . . . . . . . 101 18 10 4 8 10 11 1 17 8 9 5 8 persons . . . . . . . . . . . 92 21 8 4 4 3 15 7 11 7 7 5 9 persons . . . . . . . . . . . 92 14 7 2 4 2 13 10 14 14 11 1 10 persons. . . . . . . . . . . 136 8 4 7 11 4 11 6 8 39 35 3 11 persons. . . . . . . . . . . 19 5 - 4 - - 1 2 5 - 1 1 12 or more persons. . . . . . . 87 6 2 6 3 - 19 13 17 5 14 2 Median. . . . . . . . . . . . . 7.4 5.9 6.1 6.9 7.1 5.7 8.1 9.4 7.5 9.1 10.0 5.2 FERTILITY Women 15 to 19 years . . . 334 40 20 14 6 10 36 15 75 54 56 8 Children ever born. . . . . . . 31 2 2 2 6 1 2 3 2 8 1 2 Children still alive. . . . . . 31 2 2 2 6 1 2 3 2 8 1 2 Children born in last 12 months 11 1 1 1 1 - 1 - 2 1 1 2 Women 20 to 24 years . . . 242 31 21 11 17 8 26 11 24 40 43 10 Children ever born. . . . . . . 182 27 36 15 23 3 10 19 8 19 12 10 Children still alive. . . . . . 159 23 24 15 22 3 9 18 8 16 12 9 Children born in last 12 months 36 7 3 1 4 1 2 4 2 5 5 2 Women 25 to 29 years . . . 254 38 11 18 15 6 37 15 29 45 33 7 Children ever born. . . . . . . 367 58 40 35 44 7 63 30 28 32 22 8 Children still alive. . . . . . 325 55 27 35 40 5 51 27 26 31 20 8 Children born in last 12 months 27 3 1 1 3 - 6 3 3 3 3 1 Women 30 to 34 years . . . 190 28 13 10 9 7 30 12 24 33 21 3 Children ever born. . . . . . . 532 90 46 41 40 11 88 38 83 41 38 16 Children still alive. . . . . . 489 85 36 39 37 10 81 34 75 39 37 16 Children born in last 12 months 25 3 1 3 2 - 7 3 4 - 1 1 Women 35 to 39 years . . . 221 27 17 16 11 8 29 20 28 28 28 9 Children ever born. . . . . . . 1,000 152 91 70 54 40 143 99 93 76 134 48 Children still alive. . . . . . 939 144 87 70 45 33 131 96 86 72 130 45 Children born in last 12 months 27 6 - 1 2 1 7 2 3 1 4 - Women 40 to 44 years . . . 178 22 12 9 8 9 24 8 30 28 19 9 Children ever born. . . . . . . 954 130 75 67 30 51 140 53 126 101 122 59 Children still alive. . . . . . 867 122 62 58 25 42 124 41 123 99 115 56 Children born in last 12 months 7 - - - - - 2 - 1 - 4 - Women 45 to 49 years . . . 153 16 7 11 8 9 20 11 20 25 23 3 Children ever born. . . . . . . 844 95 60 65 58 50 139 75 82 92 115 13 Children still alive. . . . . . 749 91 47 59 54 40 114 63 76 79 113 13 Children born in last 12 months 2 - - - - - - - - - 1 1 LAST CHILD BORN ALIVE Women 15 to 49 years with Last Birth . . . . . 869 126 69 64 61 33 121 65 105 97 95 33 Male. . . . . . . . . . . . . 408 60 31 28 32 9 56 30 50 48 47 17 Still alive . . . . . . . . 386 58 30 28 31 8 47 30 48 45 45 16 Female. . . . . . . . . . . . 461 66 38 36 29 24 65 35 55 49 48 16 Still alive . . . . . . . . 451 65 38 36 29 22 60 35 55 48 47 16 Born in last year . . . . . . . 135 20 6 7 12 2 25 12 15 10 19 7 Male. . . . . . . . . . . . . 62 10 3 4 6 - 9 5 8 4 11 2 Still alive . . . . . . . . 58 10 3 4 6 - 7 5 8 4 9 2 Female. . . . . . . . . . . . 73 10 3 3 6 2 16 7 7 6 8 5 Still alive . . . . . . . . 69 10 3 3 6 2 14 7 7 5 7 5 ──────────────────────────────────────────────────────────────────────────────────────────────────────── Source: 2000 FSM Census
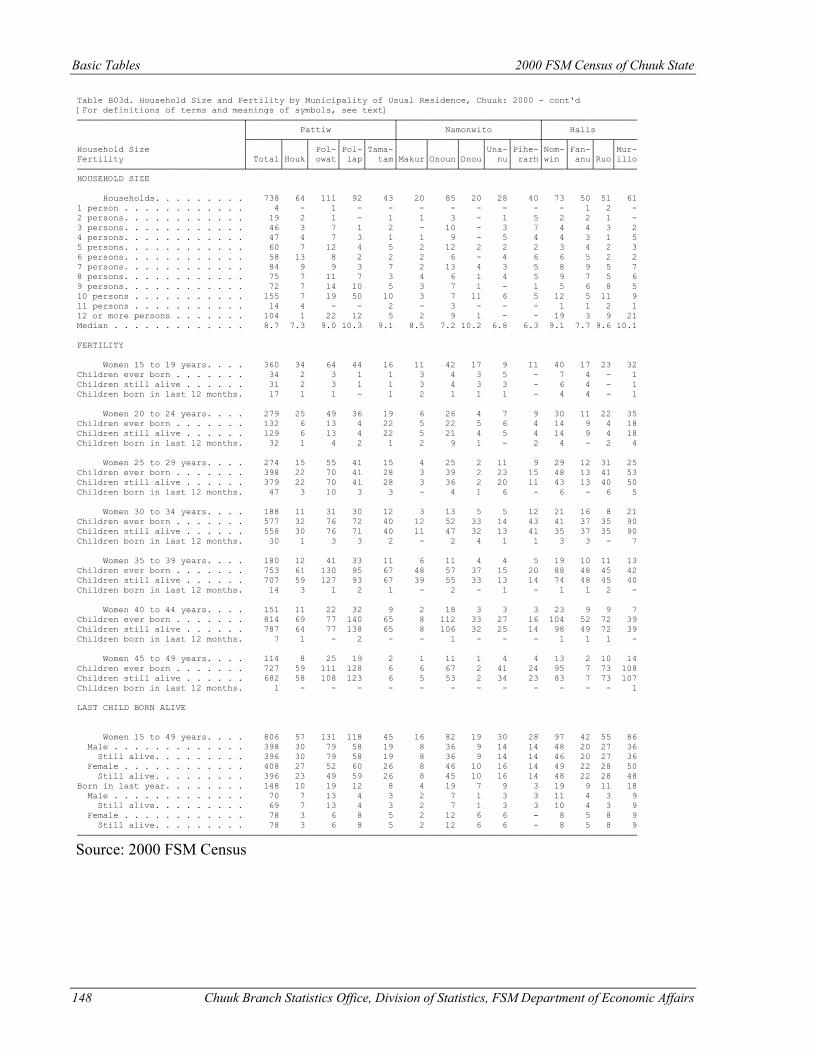
Basic Tables 2000 FSM Census of Chuuk State
148 Chuuk Branch Statistics Office, Division of Statistics, FSM Department of Economic Affairs
Table B03d. Household Size and Fertility by Municipality of Usual Residence, Chuuk: 2000 - cont'd [For definitions of terms and meanings of symbols, see text] ────────────────────────────────┬────────────────────────────┬───────────────────────────┬────────────────── │ Pattiw │ Namonwito │ Halls ├──────┬────┬─────┬────┬─────┼─────┬─────┬────┬────┬─────┼────┬────┬───┬──── Household Size │ │ │ Pol-│Pol-│Tama-│ │ │ │Una-│Pihe-│Nom-│Fan-│ │Mur- Fertility │ Total│Houk│ owat│ lap│ tam│Makur│Onoun│Onou│ nu│ rarh│win │ anu│Ruo│illo ────────────────────────────────┴──────┴────┴─────┴────┴─────┴─────┴─────┴────┴────┴─────┴────┴────┴───┴──── HOUSEHOLD SIZE Households. . . . . . . . . 738 64 111 92 43 20 85 20 28 40 73 50 51 61 1 person . . . . . . . . . . . . 4 - 1 - - - - - - - - 1 2 - 2 persons. . . . . . . . . . . . 19 2 1 - 1 1 3 - 1 5 2 2 1 - 3 persons. . . . . . . . . . . . 46 3 7 1 2 - 10 - 3 7 4 4 3 2 4 persons. . . . . . . . . . . . 47 4 7 3 1 1 9 - 5 4 4 3 1 5 5 persons. . . . . . . . . . . . 60 7 12 4 5 2 12 2 2 2 3 4 2 3 6 persons. . . . . . . . . . . . 58 13 8 2 2 2 6 - 4 6 6 5 2 2 7 persons. . . . . . . . . . . . 84 9 9 3 7 2 13 4 3 5 8 9 5 7 8 persons. . . . . . . . . . . . 75 7 11 7 3 4 6 1 4 5 9 7 5 6 9 persons. . . . . . . . . . . . 72 7 14 10 5 3 7 1 - 1 5 6 8 5 10 persons . . . . . . . . . . . 155 7 19 50 10 3 7 11 6 5 12 5 11 9 11 persons . . . . . . . . . . . 14 4 - - 2 - 3 - - - 1 1 2 1 12 or more persons . . . . . . . 104 1 22 12 5 2 9 1 - - 19 3 9 21 Median . . . . . . . . . . . . . 8.7 7.3 9.0 10.3 9.1 8.5 7.2 10.2 6.8 6.3 9.1 7.7 9.6 10.1 FERTILITY Women 15 to 19 years. . . . 360 34 64 44 16 11 42 17 9 11 40 17 23 32 Children ever born . . . . . . . 34 2 3 1 1 3 4 3 5 - 7 4 - 1 Children still alive . . . . . . 31 2 3 1 1 3 4 3 3 - 6 4 - 1 Children born in last 12 months. 17 1 1 - 1 2 1 1 1 - 4 4 - 1 Women 20 to 24 years. . . . 279 25 49 36 19 6 26 4 7 9 30 11 22 35 Children ever born . . . . . . . 132 6 13 4 22 5 22 5 6 4 14 9 4 18 Children still alive . . . . . . 129 6 13 4 22 5 21 4 5 4 14 9 4 18 Children born in last 12 months. 32 1 4 2 1 2 9 1 - 2 4 - 2 4 Women 25 to 29 years. . . . 274 15 55 41 15 4 25 2 11 9 29 12 31 25 Children ever born . . . . . . . 398 22 70 41 28 3 39 2 23 15 48 13 41 53 Children still alive . . . . . . 379 22 70 41 28 3 36 2 20 11 43 13 40 50 Children born in last 12 months. 47 3 10 3 3 - 4 1 6 - 6 - 6 5 Women 30 to 34 years. . . . 188 11 31 30 12 3 13 5 5 12 21 16 8 21 Children ever born . . . . . . . 577 32 76 72 40 12 52 33 14 43 41 37 35 90 Children still alive . . . . . . 558 30 76 71 40 11 47 32 13 41 35 37 35 90 Children born in last 12 months. 30 1 3 3 2 - 2 4 1 1 3 3 - 7 Women 35 to 39 years. . . . 180 12 41 33 11 6 11 4 4 5 19 10 11 13 Children ever born . . . . . . . 753 61 130 95 67 48 57 37 15 20 88 48 45 42 Children still alive . . . . . . 707 59 127 93 67 39 55 33 13 14 74 48 45 40 Children born in last 12 months. 14 3 1 2 1 - 2 - 1 - 1 1 2 - Women 40 to 44 years. . . . 151 11 22 32 9 2 18 3 3 3 23 9 9 7 Children ever born . . . . . . . 814 69 77 140 65 8 112 33 27 16 104 52 72 39 Children still alive . . . . . . 787 64 77 138 65 8 106 32 25 14 98 49 72 39 Children born in last 12 months. 7 1 - 2 - - 1 - - - 1 1 1 - Women 45 to 49 years. . . . 114 8 25 19 2 1 11 1 4 4 13 2 10 14 Children ever born . . . . . . . 727 59 111 128 6 6 67 2 41 24 95 7 73 108 Children still alive . . . . . . 682 58 108 123 6 5 53 2 34 23 83 7 73 107 Children born in last 12 months. 1 - - - - - - - - - - - - 1 LAST CHILD BORN ALIVE Women 15 to 49 years. . . . 806 57 131 118 45 16 82 19 30 28 97 42 55 86 Male . . . . . . . . . . . . . 398 30 79 58 19 8 36 9 14 14 48 20 27 36 Still alive. . . . . . . . . 396 30 79 58 19 8 36 9 14 14 46 20 27 36 Female . . . . . . . . . . . . 408 27 52 60 26 8 46 10 16 14 49 22 28 50 Still alive. . . . . . . . . 396 23 49 59 26 8 45 10 16 14 48 22 28 48 Born in last year. . . . . . . . 148 10 19 12 8 4 19 7 9 3 19 9 11 18 Male . . . . . . . . . . . . . 70 7 13 4 3 2 7 1 3 3 11 4 3 9 Still alive. . . . . . . . . 69 7 13 4 3 2 7 1 3 3 10 4 3 9 Female . . . . . . . . . . . . 78 3 6 8 5 2 12 6 6 - 8 5 8 9 Still alive. . . . . . . . . 78 3 6 8 5 2 12 6 6 - 8 5 8 9 ────────────────────────────────────────────────────────────────────────────────────────────────────────────
Source: 2000 FSM Census
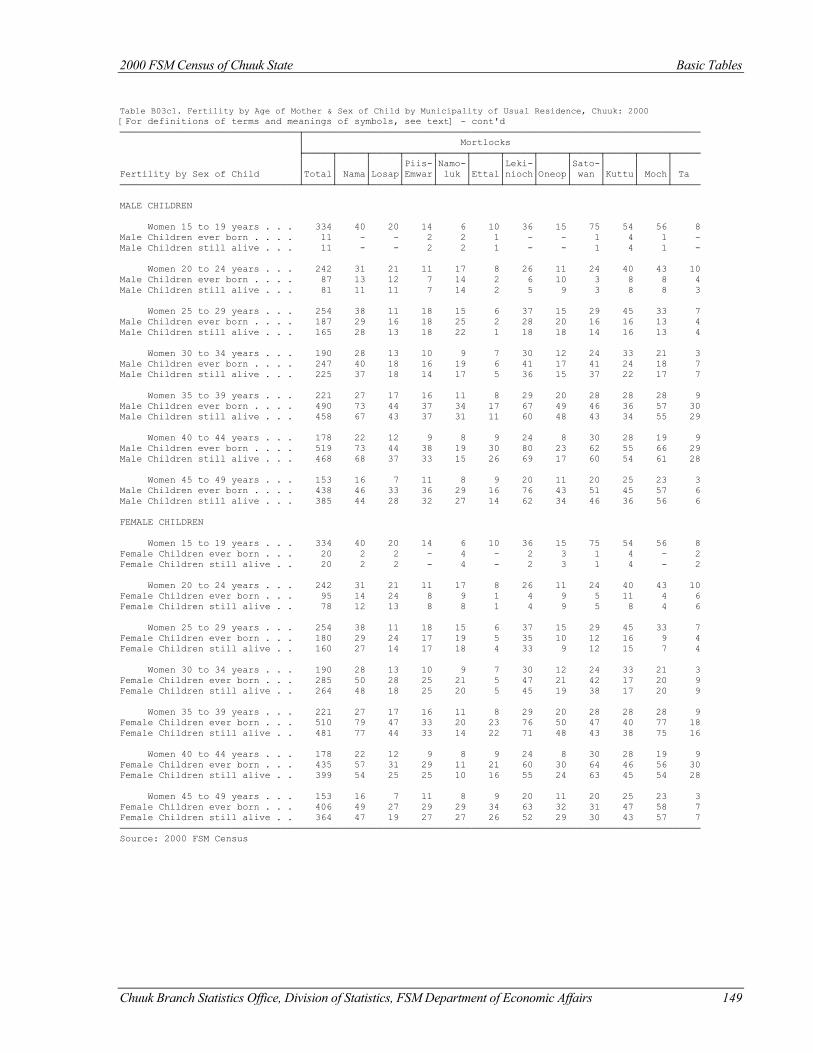
2000 FSM Census of Chuuk State Basic Tables
Chuuk Branch Statistics Office, Division of Statistics, FSM Department of Economic Affairs 149
Table B03c1. Fertility by Age of Mother & Sex of Child by Municipality of Usual Residence, Chuuk: 2000 [For definitions of terms and meanings of symbols, see text] - cont'd ────────────────────────────────┬─────────────────────────────────────────────────────────────────────── │ Mortlocks ├─────┬─────┬─────┬─────┬─────┬─────┬─────┬─────┬─────┬─────┬─────┬───── │ │ │ │Piis-│Namo-│ │Leki-│ │Sato-│ │ │ Fertility by Sex of Child │Total│ Nama│Losap│Emwar│ luk │Ettal│nioch│Oneop│ wan │Kuttu│ Moch│ Ta ────────────────────────────────┴─────┴─────┴─────┴─────┴─────┴─────┴─────┴─────┴─────┴─────┴─────┴───── MALE CHILDREN Women 15 to 19 years . . . 334 40 20 14 6 10 36 15 75 54 56 8 Male Children ever born . . . . 11 - - 2 2 1 - - 1 4 1 - Male Children still alive . . . 11 - - 2 2 1 - - 1 4 1 - Women 20 to 24 years . . . 242 31 21 11 17 8 26 11 24 40 43 10 Male Children ever born . . . . 87 13 12 7 14 2 6 10 3 8 8 4 Male Children still alive . . . 81 11 11 7 14 2 5 9 3 8 8 3 Women 25 to 29 years . . . 254 38 11 18 15 6 37 15 29 45 33 7 Male Children ever born . . . . 187 29 16 18 25 2 28 20 16 16 13 4 Male Children still alive . . . 165 28 13 18 22 1 18 18 14 16 13 4 Women 30 to 34 years . . . 190 28 13 10 9 7 30 12 24 33 21 3 Male Children ever born . . . . 247 40 18 16 19 6 41 17 41 24 18 7 Male Children still alive . . . 225 37 18 14 17 5 36 15 37 22 17 7 Women 35 to 39 years . . . 221 27 17 16 11 8 29 20 28 28 28 9 Male Children ever born . . . . 490 73 44 37 34 17 67 49 46 36 57 30 Male Children still alive . . . 458 67 43 37 31 11 60 48 43 34 55 29 Women 40 to 44 years . . . 178 22 12 9 8 9 24 8 30 28 19 9 Male Children ever born . . . . 519 73 44 38 19 30 80 23 62 55 66 29 Male Children still alive . . . 468 68 37 33 15 26 69 17 60 54 61 28 Women 45 to 49 years . . . 153 16 7 11 8 9 20 11 20 25 23 3 Male Children ever born . . . . 438 46 33 36 29 16 76 43 51 45 57 6 Male Children still alive . . . 385 44 28 32 27 14 62 34 46 36 56 6 FEMALE CHILDREN Women 15 to 19 years . . . 334 40 20 14 6 10 36 15 75 54 56 8 Female Children ever born . . . 20 2 2 - 4 - 2 3 1 4 - 2 Female Children still alive . . 20 2 2 - 4 - 2 3 1 4 - 2 Women 20 to 24 years . . . 242 31 21 11 17 8 26 11 24 40 43 10 Female Children ever born . . . 95 14 24 8 9 1 4 9 5 11 4 6 Female Children still alive . . 78 12 13 8 8 1 4 9 5 8 4 6 Women 25 to 29 years . . . 254 38 11 18 15 6 37 15 29 45 33 7 Female Children ever born . . . 180 29 24 17 19 5 35 10 12 16 9 4 Female Children still alive . . 160 27 14 17 18 4 33 9 12 15 7 4 Women 30 to 34 years . . . 190 28 13 10 9 7 30 12 24 33 21 3 Female Children ever born . . . 285 50 28 25 21 5 47 21 42 17 20 9 Female Children still alive . . 264 48 18 25 20 5 45 19 38 17 20 9 Women 35 to 39 years . . . 221 27 17 16 11 8 29 20 28 28 28 9 Female Children ever born . . . 510 79 47 33 20 23 76 50 47 40 77 18 Female Children still alive . . 481 77 44 33 14 22 71 48 43 38 75 16 Women 40 to 44 years . . . 178 22 12 9 8 9 24 8 30 28 19 9 Female Children ever born . . . 435 57 31 29 11 21 60 30 64 46 56 30 Female Children still alive . . 399 54 25 25 10 16 55 24 63 45 54 28 Women 45 to 49 years . . . 153 16 7 11 8 9 20 11 20 25 23 3 Female Children ever born . . . 406 49 27 29 29 34 63 32 31 47 58 7 Female Children still alive . . 364 47 19 27 27 26 52 29 30 43 57 7 ──────────────────────────────────────────────────────────────────────────────────────────────────────── Source: 2000 FSM Census
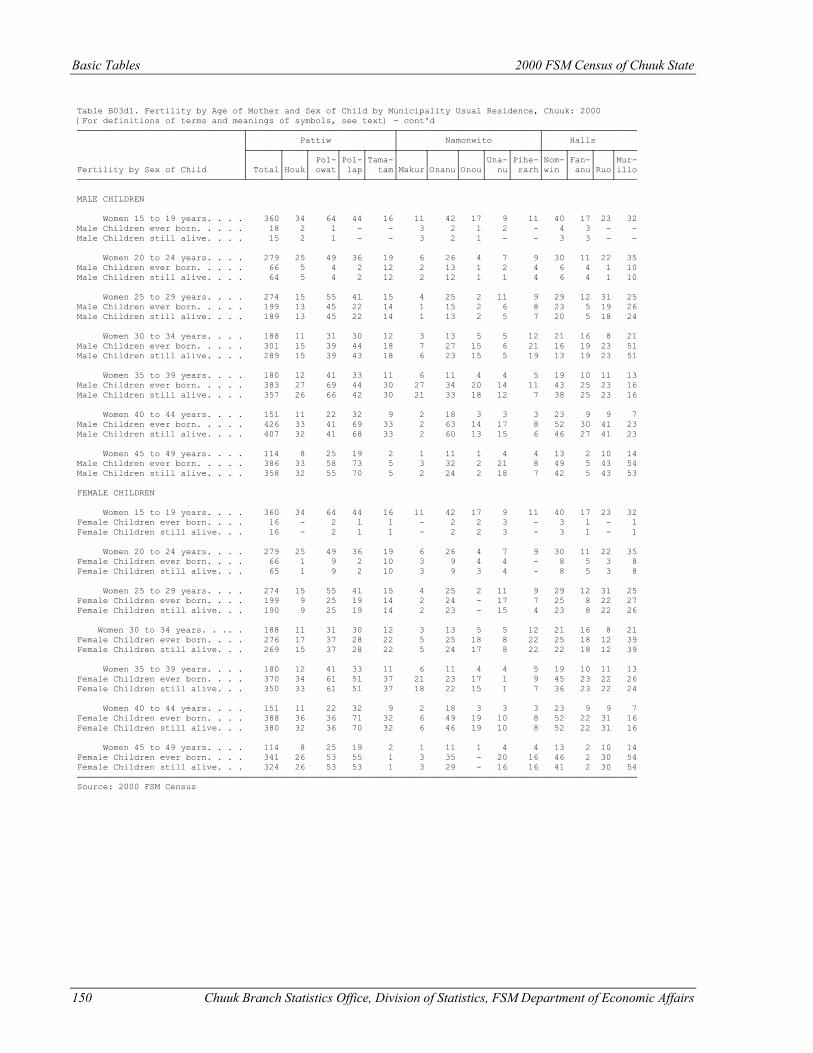
Basic Tables 2000 FSM Census of Chuuk State
150 Chuuk Branch Statistics Office, Division of Statistics, FSM Department of Economic Affairs
Table B03d1. Fertility by Age of Mother and Sex of Child by Municipality Usual Residence, Chuuk: 2000 [For definitions of terms and meanings of symbols, see text] - cont'd ────────────────────────────────┬────────────────────────────┬───────────────────────────┬────────────────── │ Pattiw │ Namonwito │ Halls ├──────┬────┬─────┬────┬─────┼─────┬─────┬────┬────┬─────┼────┬────┬───┬──── │ │ │ Pol-│Pol-│Tama-│ │ │ │Una-│Pihe-│Nom-│Fan-│ │Mur- Fertility by Sex of Child │ Total│Houk│ owat│ lap│ tam│Makur│Onanu│Onou│ nu│ rarh│win │ anu│Ruo│illo ────────────────────────────────┴──────┴────┴─────┴────┴─────┴─────┴─────┴────┴────┴─────┴────┴────┴───┴──── MALE CHILDREN Women 15 to 19 years. . . . 360 34 64 44 16 11 42 17 9 11 40 17 23 32 Male Children ever born. . . . . 18 2 1 - - 3 2 1 2 - 4 3 - - Male Children still alive. . . . 15 2 1 - - 3 2 1 - - 3 3 - - Women 20 to 24 years. . . . 279 25 49 36 19 6 26 4 7 9 30 11 22 35 Male Children ever born. . . . . 66 5 4 2 12 2 13 1 2 4 6 4 1 10 Male Children still alive. . . . 64 5 4 2 12 2 12 1 1 4 6 4 1 10 Women 25 to 29 years. . . . 274 15 55 41 15 4 25 2 11 9 29 12 31 25 Male Children ever born. . . . . 199 13 45 22 14 1 15 2 6 8 23 5 19 26 Male Children still alive. . . . 189 13 45 22 14 1 13 2 5 7 20 5 18 24 Women 30 to 34 years. . . . 188 11 31 30 12 3 13 5 5 12 21 16 8 21 Male Children ever born. . . . . 301 15 39 44 18 7 27 15 6 21 16 19 23 51 Male Children still alive. . . . 289 15 39 43 18 6 23 15 5 19 13 19 23 51 Women 35 to 39 years. . . . 180 12 41 33 11 6 11 4 4 5 19 10 11 13 Male Children ever born. . . . . 383 27 69 44 30 27 34 20 14 11 43 25 23 16 Male Children still alive. . . . 357 26 66 42 30 21 33 18 12 7 38 25 23 16 Women 40 to 44 years. . . . 151 11 22 32 9 2 18 3 3 3 23 9 9 7 Male Children ever born. . . . . 426 33 41 69 33 2 63 14 17 8 52 30 41 23 Male Children still alive. . . . 407 32 41 68 33 2 60 13 15 6 46 27 41 23 Women 45 to 49 years. . . . 114 8 25 19 2 1 11 1 4 4 13 2 10 14 Male Children ever born. . . . . 386 33 58 73 5 3 32 2 21 8 49 5 43 54 Male Children still alive. . . . 358 32 55 70 5 2 24 2 18 7 42 5 43 53 FEMALE CHILDREN Women 15 to 19 years. . . . 360 34 64 44 16 11 42 17 9 11 40 17 23 32 Female Children ever born. . . . 16 - 2 1 1 - 2 2 3 - 3 1 - 1 Female Children still alive. . . 16 - 2 1 1 - 2 2 3 - 3 1 - 1 Women 20 to 24 years. . . . 279 25 49 36 19 6 26 4 7 9 30 11 22 35 Female Children ever born. . . . 66 1 9 2 10 3 9 4 4 - 8 5 3 8 Female Children still alive. . . 65 1 9 2 10 3 9 3 4 - 8 5 3 8 Women 25 to 29 years. . . . 274 15 55 41 15 4 25 2 11 9 29 12 31 25 Female Children ever born. . . . 199 9 25 19 14 2 24 - 17 7 25 8 22 27 Female Children still alive. . . 190 9 25 19 14 2 23 - 15 4 23 8 22 26 Women 30 to 34 years. . .. . 188 11 31 30 12 3 13 5 5 12 21 16 8 21 Female Children ever born. . . . 276 17 37 28 22 5 25 18 8 22 25 18 12 39 Female Children still alive. . . 269 15 37 28 22 5 24 17 8 22 22 18 12 39 Women 35 to 39 years. . . . 180 12 41 33 11 6 11 4 4 5 19 10 11 13 Female Children ever born. . . . 370 34 61 51 37 21 23 17 1 9 45 23 22 26 Female Children still alive. . . 350 33 61 51 37 18 22 15 1 7 36 23 22 24 Women 40 to 44 years. . . . 151 11 22 32 9 2 18 3 3 3 23 9 9 7 Female Children ever born. . . . 388 36 36 71 32 6 49 19 10 8 52 22 31 16 Female Children still alive. . . 380 32 36 70 32 6 46 19 10 8 52 22 31 16 Women 45 to 49 years. . . . 114 8 25 19 2 1 11 1 4 4 13 2 10 14 Female Children ever born. . . . 341 26 53 55 1 3 35 - 20 16 46 2 30 54 Female Children still alive. . . 324 26 53 53 1 3 29 - 16 16 41 2 30 54 ──────────────────────────────────────────────────────────────────────────────────────────────────────────── Source: 2000 FSM Census
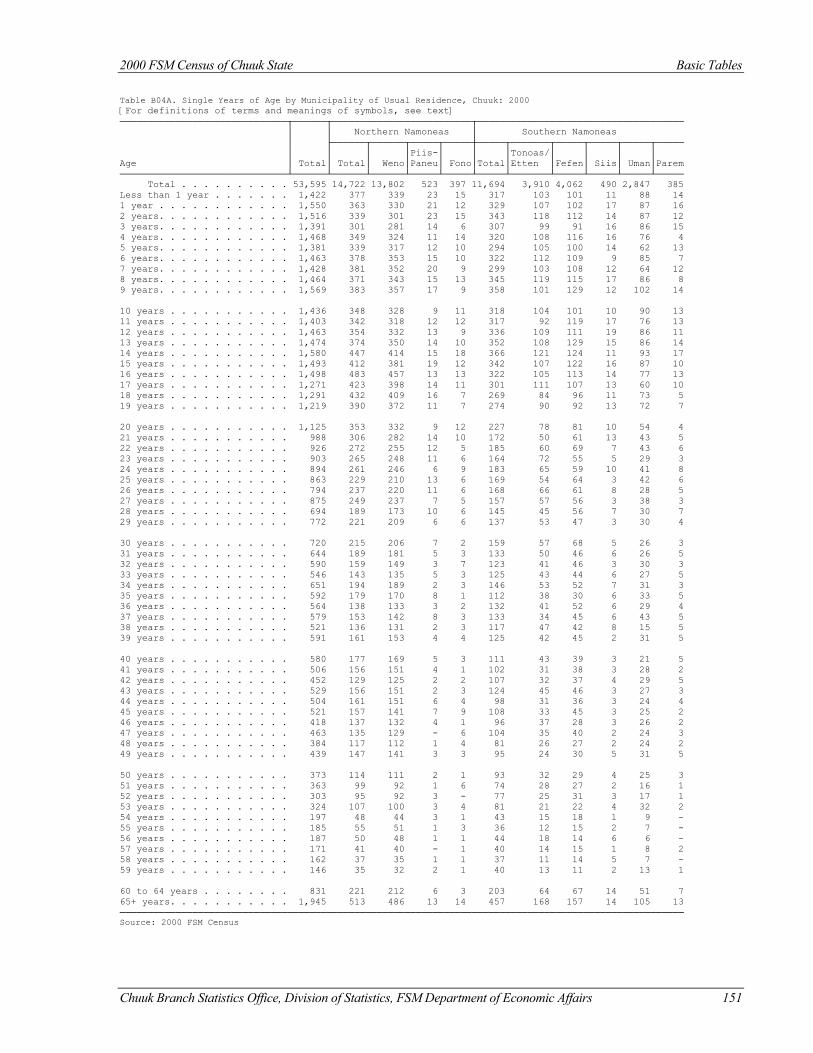
2000 FSM Census of Chuuk State Basic Tables
Chuuk Branch Statistics Office, Division of Statistics, FSM Department of Economic Affairs 151
Table B04A. Single Years of Age by Municipality of Usual Residence, Chuuk: 2000 [For definitions of terms and meanings of symbols, see text] ──────────────────────────────┬──────┬─────────────────────────┬───────────────────────────────────── │ │ Northern Namoneas │ Southern Namoneas │ ├──────┬──────┬─────┬─────┼─────┬───────┬─────┬─────┬─────┬───── │ │ │ │Piis-│ │ │Tonoas/│ │ │ │ Age │ Total│ Total│ Weno│Paneu│ Fono│Total│Etten │Fefen│ Siis│ Uman│Parem ──────────────────────────────┴──────┴──────┴──────┴─────┴─────┴─────┴───────┴─────┴─────┴─────┴───── Total . . . . . . . . . . 53,595 14,722 13,802 523 397 11,694 3,910 4,062 490 2,847 385 Less than 1 year . . . . . . . 1,422 377 339 23 15 317 103 101 11 88 14 1 year . . . . . . . . . . . . 1,550 363 330 21 12 329 107 102 17 87 16 2 years. . . . . . . . . . . . 1,516 339 301 23 15 343 118 112 14 87 12 3 years. . . . . . . . . . . . 1,391 301 281 14 6 307 99 91 16 86 15 4 years. . . . . . . . . . . . 1,468 349 324 11 14 320 108 116 16 76 4 5 years. . . . . . . . . . . . 1,381 339 317 12 10 294 105 100 14 62 13 6 years. . . . . . . . . . . . 1,463 378 353 15 10 322 112 109 9 85 7 7 years. . . . . . . . . . . . 1,428 381 352 20 9 299 103 108 12 64 12 8 years. . . . . . . . . . . . 1,464 371 343 15 13 345 119 115 17 86 8 9 years. . . . . . . . . . . . 1,569 383 357 17 9 358 101 129 12 102 14 10 years . . . . . . . . . . . 1,436 348 328 9 11 318 104 101 10 90 13 11 years . . . . . . . . . . . 1,403 342 318 12 12 317 92 119 17 76 13 12 years . . . . . . . . . . . 1,463 354 332 13 9 336 109 111 19 86 11 13 years . . . . . . . . . . . 1,474 374 350 14 10 352 108 129 15 86 14 14 years . . . . . . . . . . . 1,580 447 414 15 18 366 121 124 11 93 17 15 years . . . . . . . . . . . 1,493 412 381 19 12 342 107 122 16 87 10 16 years . . . . . . . . . . . 1,498 483 457 13 13 322 105 113 14 77 13 17 years . . . . . . . . . . . 1,271 423 398 14 11 301 111 107 13 60 10 18 years . . . . . . . . . . . 1,291 432 409 16 7 269 84 96 11 73 5 19 years . . . . . . . . . . . 1,219 390 372 11 7 274 90 92 13 72 7 20 years . . . . . . . . . . . 1,125 353 332 9 12 227 78 81 10 54 4 21 years . . . . . . . . . . . 988 306 282 14 10 172 50 61 13 43 5 22 years . . . . . . . . . . . 926 272 255 12 5 185 60 69 7 43 6 23 years . . . . . . . . . . . 903 265 248 11 6 164 72 55 5 29 3 24 years . . . . . . . . . . . 894 261 246 6 9 183 65 59 10 41 8 25 years . . . . . . . . . . . 863 229 210 13 6 169 54 64 3 42 6 26 years . . . . . . . . . . . 794 237 220 11 6 168 66 61 8 28 5 27 years . . . . . . . . . . . 875 249 237 7 5 157 57 56 3 38 3 28 years . . . . . . . . . . . 694 189 173 10 6 145 45 56 7 30 7 29 years . . . . . . . . . . . 772 221 209 6 6 137 53 47 3 30 4 30 years . . . . . . . . . . . 720 215 206 7 2 159 57 68 5 26 3 31 years . . . . . . . . . . . 644 189 181 5 3 133 50 46 6 26 5 32 years . . . . . . . . . . . 590 159 149 3 7 123 41 46 3 30 3 33 years . . . . . . . . . . . 546 143 135 5 3 125 43 44 6 27 5 34 years . . . . . . . . . . . 651 194 189 2 3 146 53 52 7 31 3 35 years . . . . . . . . . . . 592 179 170 8 1 112 38 30 6 33 5 36 years . . . . . . . . . . . 564 138 133 3 2 132 41 52 6 29 4 37 years . . . . . . . . . . . 579 153 142 8 3 133 34 45 6 43 5 38 years . . . . . . . . . . . 521 136 131 2 3 117 47 42 8 15 5 39 years . . . . . . . . . . . 591 161 153 4 4 125 42 45 2 31 5 40 years . . . . . . . . . . . 580 177 169 5 3 111 43 39 3 21 5 41 years . . . . . . . . . . . 506 156 151 4 1 102 31 38 3 28 2 42 years . . . . . . . . . . . 452 129 125 2 2 107 32 37 4 29 5 43 years . . . . . . . . . . . 529 156 151 2 3 124 45 46 3 27 3 44 years . . . . . . . . . . . 504 161 151 6 4 98 31 36 3 24 4 45 years . . . . . . . . . . . 521 157 141 7 9 108 33 45 3 25 2 46 years . . . . . . . . . . . 418 137 132 4 1 96 37 28 3 26 2 47 years . . . . . . . . . . . 463 135 129 - 6 104 35 40 2 24 3 48 years . . . . . . . . . . . 384 117 112 1 4 81 26 27 2 24 2 49 years . . . . . . . . . . . 439 147 141 3 3 95 24 30 5 31 5 50 years . . . . . . . . . . . 373 114 111 2 1 93 32 29 4 25 3 51 years . . . . . . . . . . . 363 99 92 1 6 74 28 27 2 16 1 52 years . . . . . . . . . . . 303 95 92 3 - 77 25 31 3 17 1 53 years . . . . . . . . . . . 324 107 100 3 4 81 21 22 4 32 2 54 years . . . . . . . . . . . 197 48 44 3 1 43 15 18 1 9 - 55 years . . . . . . . . . . . 185 55 51 1 3 36 12 15 2 7 - 56 years . . . . . . . . . . . 187 50 48 1 1 44 18 14 6 6 - 57 years . . . . . . . . . . . 171 41 40 - 1 40 14 15 1 8 2 58 years . . . . . . . . . . . 162 37 35 1 1 37 11 14 5 7 - 59 years . . . . . . . . . . . 146 35 32 2 1 40 13 11 2 13 1 60 to 64 years . . . . . . . . 831 221 212 6 3 203 64 67 14 51 7 65+ years. . . . . . . . . . . 1,945 513 486 13 14 457 168 157 14 105 13 ───────────────────────────────────────────────────────────────────────────────────────────────────── Source: 2000 FSM Census
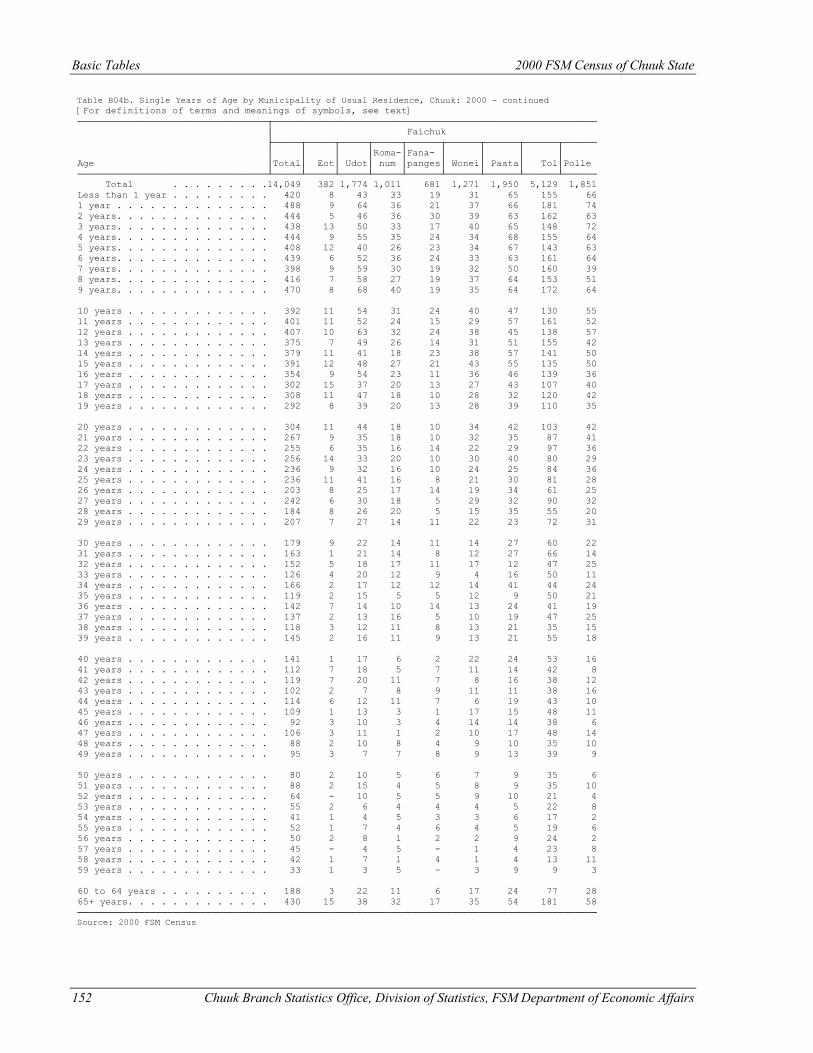
Basic Tables 2000 FSM Census of Chuuk State
152 Chuuk Branch Statistics Office, Division of Statistics, FSM Department of Economic Affairs
Table B04b. Single Years of Age by Municipality of Usual Residence, Chuuk: 2000 - continued [For definitions of terms and meanings of symbols, see text] ──────────────────────────────────┬────────────────────────────────────────────────────────── │ Faichuk ├─────┬─────┬─────┬─────┬──────┬──────┬──────┬──────┬────── │ │ │ │Roma-│Fana- │ │ │ │ Age │Total│ Eot│ Udot│ num │panges│ Wonei│ Paata│ Tol│Polle ──────────────────────────────────┴─────┴─────┴─────┴─────┴──────┴──────┴──────┴──────┴────── Total . . . . . . . . .14,049 382 1,774 1,011 681 1,271 1,950 5,129 1,851 Less than 1 year . . . . . . . . . 420 8 43 33 19 31 65 155 66 1 year . . . . . . . . . . . . . . 488 9 64 36 21 37 66 181 74 2 years. . . . . . . . . . . . . . 444 5 46 36 30 39 63 162 63 3 years. . . . . . . . . . . . . . 438 13 50 33 17 40 65 148 72 4 years. . . . . . . . . . . . . . 444 9 55 35 24 34 68 155 64 5 years. . . . . . . . . . . . . . 408 12 40 26 23 34 67 143 63 6 years. . . . . . . . . . . . . . 439 6 52 36 24 33 63 161 64 7 years. . . . . . . . . . . . . . 398 9 59 30 19 32 50 160 39 8 years. . . . . . . . . . . . . . 416 7 58 27 19 37 64 153 51 9 years. . . . . . . . . . . . . . 470 8 68 40 19 35 64 172 64 10 years . . . . . . . . . . . . . 392 11 54 31 24 40 47 130 55 11 years . . . . . . . . . . . . . 401 11 52 24 15 29 57 161 52 12 years . . . . . . . . . . . . . 407 10 63 32 24 38 45 138 57 13 years . . . . . . . . . . . . . 375 7 49 26 14 31 51 155 42 14 years . . . . . . . . . . . . . 379 11 41 18 23 38 57 141 50 15 years . . . . . . . . . . . . . 391 12 48 27 21 43 55 135 50 16 years . . . . . . . . . . . . . 354 9 54 23 11 36 46 139 36 17 years . . . . . . . . . . . . . 302 15 37 20 13 27 43 107 40 18 years . . . . . . . . . . . . . 308 11 47 18 10 28 32 120 42 19 years . . . . . . . . . . . . . 292 8 39 20 13 28 39 110 35 20 years . . . . . . . . . . . . . 304 11 44 18 10 34 42 103 42 21 years . . . . . . . . . . . . . 267 9 35 18 10 32 35 87 41 22 years . . . . . . . . . . . . . 255 6 35 16 14 22 29 97 36 23 years . . . . . . . . . . . . . 256 14 33 20 10 30 40 80 29 24 years . . . . . . . . . . . . . 236 9 32 16 10 24 25 84 36 25 years . . . . . . . . . . . . . 236 11 41 16 8 21 30 81 28 26 years . . . . . . . . . . . . . 203 8 25 17 14 19 34 61 25 27 years . . . . . . . . . . . . . 242 6 30 18 5 29 32 90 32 28 years . . . . . . . . . . . . . 184 8 26 20 5 15 35 55 20 29 years . . . . . . . . . . . . . 207 7 27 14 11 22 23 72 31 30 years . . . . . . . . . . . . . 179 9 22 14 11 14 27 60 22 31 years . . . . . . . . . . . . . 163 1 21 14 8 12 27 66 14 32 years . . . . . . . . . . . . . 152 5 18 17 11 17 12 47 25 33 years . . . . . . . . . . . . . 126 4 20 12 9 4 16 50 11 34 years . . . . . . . . . . . . . 166 2 17 12 12 14 41 44 24 35 years . . . . . . . . . . . . . 119 2 15 5 5 12 9 50 21 36 years . . . . . . . . . . . . . 142 7 14 10 14 13 24 41 19 37 years . . . . . . . . . . . . . 137 2 13 16 5 10 19 47 25 38 years . . . . . . . . . . . . . 118 3 12 11 8 13 21 35 15 39 years . . . . . . . . . . . . . 145 2 16 11 9 13 21 55 18 40 years . . . . . . . . . . . . . 141 1 17 6 2 22 24 53 16 41 years . . . . . . . . . . . . . 112 7 18 5 7 11 14 42 8 42 years . . . . . . . . . . . . . 119 7 20 11 7 8 16 38 12 43 years . . . . . . . . . . . . . 102 2 7 8 9 11 11 38 16 44 years . . . . . . . . . . . . . 114 6 12 11 7 6 19 43 10 45 years . . . . . . . . . . . . . 109 1 13 3 1 17 15 48 11 46 years . . . . . . . . . . . . . 92 3 10 3 4 14 14 38 6 47 years . . . . . . . . . . . . . 106 3 11 1 2 10 17 48 14 48 years . . . . . . . . . . . . . 88 2 10 8 4 9 10 35 10 49 years . . . . . . . . . . . . . 95 3 7 7 8 9 13 39 9 50 years . . . . . . . . . . . . . 80 2 10 5 6 7 9 35 6 51 years . . . . . . . . . . . . . 88 2 15 4 5 8 9 35 10 52 years . . . . . . . . . . . . . 64 - 10 5 5 9 10 21 4 53 years . . . . . . . . . . . . . 55 2 6 4 4 4 5 22 8 54 years . . . . . . . . . . . . . 41 1 4 5 3 3 6 17 2 55 years . . . . . . . . . . . . . 52 1 7 4 6 4 5 19 6 56 years . . . . . . . . . . . . . 50 2 8 1 2 2 9 24 2 57 years . . . . . . . . . . . . . 45 - 4 5 - 1 4 23 8 58 years . . . . . . . . . . . . . 42 1 7 1 4 1 4 13 11 59 years . . . . . . . . . . . . . 33 1 3 5 - 3 9 9 3 60 to 64 years . . . . . . . . . . 188 3 22 11 6 17 24 77 28 65+ years. . . . . . . . . . . . . 430 15 38 32 17 35 54 181 58 ───────────────────────────────────────────────────────────────────────────────────────────── Source: 2000 FSM Census
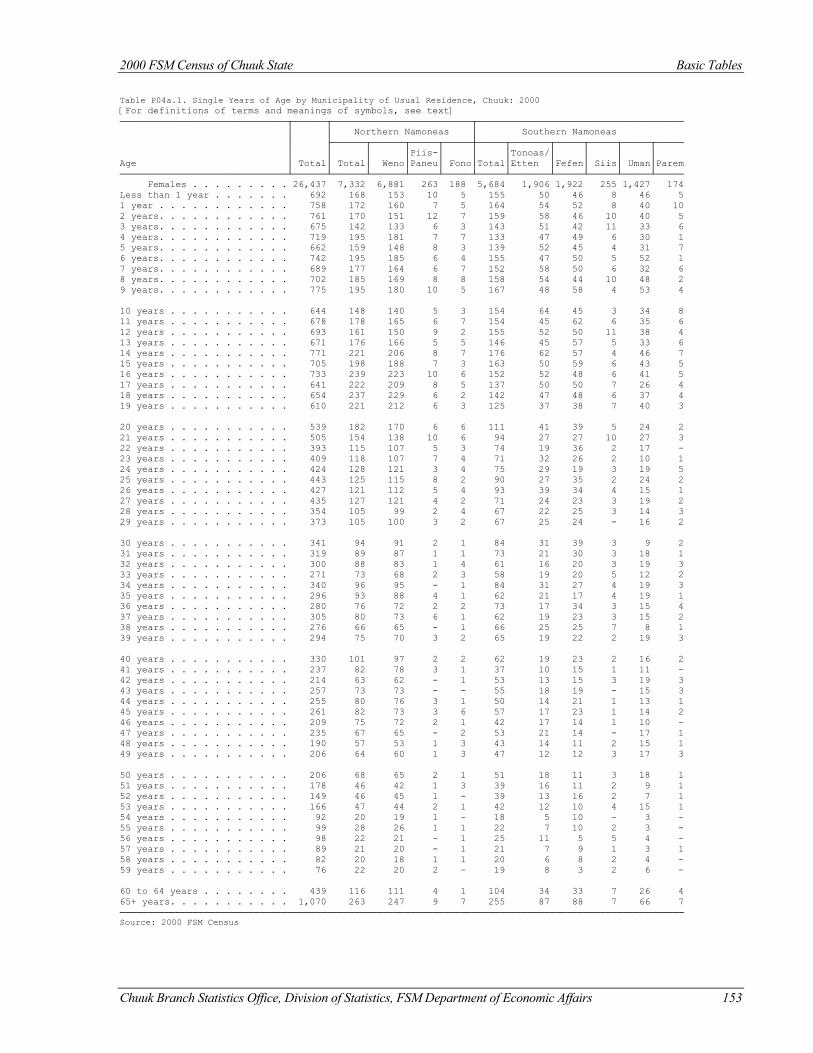
2000 FSM Census of Chuuk State Basic Tables
Chuuk Branch Statistics Office, Division of Statistics, FSM Department of Economic Affairs 153
Table P04a.1. Single Years of Age by Municipality of Usual Residence, Chuuk: 2000 [For definitions of terms and meanings of symbols, see text] ──────────────────────────────┬──────┬─────────────────────────┬───────────────────────────────────── │ │ Northern Namoneas │ Southern Namoneas │ ├──────┬──────┬─────┬─────┼─────┬───────┬─────┬─────┬─────┬───── │ │ │ │Piis-│ │ │Tonoas/│ │ │ │ Age │ Total│ Total│ Weno│Paneu│ Fono│Total│Etten │Fefen│ Siis│ Uman│Parem ──────────────────────────────┴──────┴──────┴──────┴─────┴─────┴─────┴───────┴─────┴─────┴─────┴───── Females . . . . . . . . . 26,437 7,332 6,881 263 188 5,684 1,906 1,922 255 1,427 174 Less than 1 year . . . . . . . 692 168 153 10 5 155 50 46 8 46 5 1 year . . . . . . . . . . . . 758 172 160 7 5 164 54 52 8 40 10 2 years. . . . . . . . . . . . 761 170 151 12 7 159 58 46 10 40 5 3 years. . . . . . . . . . . . 675 142 133 6 3 143 51 42 11 33 6 4 years. . . . . . . . . . . . 719 195 181 7 7 133 47 49 6 30 1 5 years. . . . . . . . . . . . 662 159 148 8 3 139 52 45 4 31 7 6 years. . . . . . . . . . . . 742 195 185 6 4 155 47 50 5 52 1 7 years. . . . . . . . . . . . 689 177 164 6 7 152 58 50 6 32 6 8 years. . . . . . . . . . . . 702 185 169 8 8 158 54 44 10 48 2 9 years. . . . . . . . . . . . 775 195 180 10 5 167 48 58 4 53 4 10 years . . . . . . . . . . . 644 148 140 5 3 154 64 45 3 34 8 11 years . . . . . . . . . . . 678 178 165 6 7 154 45 62 6 35 6 12 years . . . . . . . . . . . 693 161 150 9 2 155 52 50 11 38 4 13 years . . . . . . . . . . . 671 176 166 5 5 146 45 57 5 33 6 14 years . . . . . . . . . . . 771 221 206 8 7 176 62 57 4 46 7 15 years . . . . . . . . . . . 705 198 188 7 3 163 50 59 6 43 5 16 years . . . . . . . . . . . 733 239 223 10 6 152 52 48 6 41 5 17 years . . . . . . . . . . . 641 222 209 8 5 137 50 50 7 26 4 18 years . . . . . . . . . . . 654 237 229 6 2 142 47 48 6 37 4 19 years . . . . . . . . . . . 610 221 212 6 3 125 37 38 7 40 3 20 years . . . . . . . . . . . 539 182 170 6 6 111 41 39 5 24 2 21 years . . . . . . . . . . . 505 154 138 10 6 94 27 27 10 27 3 22 years . . . . . . . . . . . 393 115 107 5 3 74 19 36 2 17 - 23 years . . . . . . . . . . . 409 118 107 7 4 71 32 26 2 10 1 24 years . . . . . . . . . . . 424 128 121 3 4 75 29 19 3 19 5 25 years . . . . . . . . . . . 443 125 115 8 2 90 27 35 2 24 2 26 years . . . . . . . . . . . 427 121 112 5 4 93 39 34 4 15 1 27 years . . . . . . . . . . . 435 127 121 4 2 71 24 23 3 19 2 28 years . . . . . . . . . . . 354 105 99 2 4 67 22 25 3 14 3 29 years . . . . . . . . . . . 373 105 100 3 2 67 25 24 - 16 2 30 years . . . . . . . . . . . 341 94 91 2 1 84 31 39 3 9 2 31 years . . . . . . . . . . . 319 89 87 1 1 73 21 30 3 18 1 32 years . . . . . . . . . . . 300 88 83 1 4 61 16 20 3 19 3 33 years . . . . . . . . . . . 271 73 68 2 3 58 19 20 5 12 2 34 years . . . . . . . . . . . 340 96 95 - 1 84 31 27 4 19 3 35 years . . . . . . . . . . . 296 93 88 4 1 62 21 17 4 19 1 36 years . . . . . . . . . . . 280 76 72 2 2 73 17 34 3 15 4 37 years . . . . . . . . . . . 305 80 73 6 1 62 19 23 3 15 2 38 years . . . . . . . . . . . 276 66 65 - 1 66 25 25 7 8 1 39 years . . . . . . . . . . . 294 75 70 3 2 65 19 22 2 19 3 40 years . . . . . . . . . . . 330 101 97 2 2 62 19 23 2 16 2 41 years . . . . . . . . . . . 237 82 78 3 1 37 10 15 1 11 - 42 years . . . . . . . . . . . 214 63 62 - 1 53 13 15 3 19 3 43 years . . . . . . . . . . . 257 73 73 - - 55 18 19 - 15 3 44 years . . . . . . . . . . . 255 80 76 3 1 50 14 21 1 13 1 45 years . . . . . . . . . . . 261 82 73 3 6 57 17 23 1 14 2 46 years . . . . . . . . . . . 209 75 72 2 1 42 17 14 1 10 - 47 years . . . . . . . . . . . 235 67 65 - 2 53 21 14 - 17 1 48 years . . . . . . . . . . . 190 57 53 1 3 43 14 11 2 15 1 49 years . . . . . . . . . . . 206 64 60 1 3 47 12 12 3 17 3 50 years . . . . . . . . . . . 206 68 65 2 1 51 18 11 3 18 1 51 years . . . . . . . . . . . 178 46 42 1 3 39 16 11 2 9 1 52 years . . . . . . . . . . . 149 46 45 1 - 39 13 16 2 7 1 53 years . . . . . . . . . . . 166 47 44 2 1 42 12 10 4 15 1 54 years . . . . . . . . . . . 92 20 19 1 - 18 5 10 - 3 - 55 years . . . . . . . . . . . 99 28 26 1 1 22 7 10 2 3 - 56 years . . . . . . . . . . . 98 22 21 - 1 25 11 5 5 4 - 57 years . . . . . . . . . . . 89 21 20 - 1 21 7 9 1 3 1 58 years . . . . . . . . . . . 82 20 18 1 1 20 6 8 2 4 - 59 years . . . . . . . . . . . 76 22 20 2 - 19 8 3 2 6 - 60 to 64 years . . . . . . . . 439 116 111 4 1 104 34 33 7 26 4 65+ years. . . . . . . . . . . 1,070 263 247 9 7 255 87 88 7 66 7 ───────────────────────────────────────────────────────────────────────────────────────────────────── Source: 2000 FSM Census

Basic Tables 2000 FSM Census of Chuuk State
154 Chuuk Branch Statistics Office, Division of Statistics, FSM Department of Economic Affairs
Table B04b.1. Single Years of Age by Municipality of Usual Residence, Chuuk: 2000 - continued [For definitions of terms and meanings of symbols, see text] ──────────────────────────────────┬────────────────────────────────────────────────────────── │ Faichuk ├─────┬─────┬─────┬─────┬──────┬──────┬──────┬──────┬────── │ │ │ │Roma-│Fana- │ │ │ │ Age │Total│ Eot│ Udot│ num │panges│ Wonei│ Paata│ Tol│Polle ──────────────────────────────────┴─────┴─────┴─────┴─────┴──────┴──────┴──────┴──────┴────── Females . . . . . 6,886 174 826 502 350 619 993 2,487 935 Less than 1 year . . . . . . . . . 205 7 20 17 10 16 32 73 30 1 year . . . . . . . . . . . . . . 234 5 36 18 14 12 35 79 35 2 years. . . . . . . . . . . . . . 215 2 22 17 13 16 31 76 38 3 years. . . . . . . . . . . . . . 211 3 22 20 9 20 34 69 34 4 years. . . . . . . . . . . . . . 206 4 23 16 12 19 35 63 34 5 years. . . . . . . . . . . . . . 202 5 18 11 14 14 32 76 32 6 years. . . . . . . . . . . . . . 219 1 21 20 19 15 36 73 34 7 years. . . . . . . . . . . . . . 195 5 32 12 10 18 26 74 18 8 years. . . . . . . . . . . . . . 195 3 26 12 9 20 27 76 22 9 years. . . . . . . . . . . . . . 236 2 30 20 11 18 35 84 36 10 years . . . . . . . . . . . . . 155 5 22 14 6 15 21 47 25 11 years . . . . . . . . . . . . . 188 3 29 7 7 15 33 70 24 12 years . . . . . . . . . . . . . 193 7 26 14 15 12 26 67 26 13 years . . . . . . . . . . . . . 179 4 20 10 8 14 22 75 26 14 years . . . . . . . . . . . . . 189 5 17 8 12 18 30 75 24 15 years . . . . . . . . . . . . . 173 1 25 15 13 20 24 47 28 16 years . . . . . . . . . . . . . 183 4 24 11 8 17 26 72 21 17 years . . . . . . . . . . . . . 156 7 17 14 4 17 21 59 17 18 years . . . . . . . . . . . . . 158 5 23 12 5 14 17 58 24 19 years . . . . . . . . . . . . . 143 4 16 9 6 16 24 50 18 20 years . . . . . . . . . . . . . 139 4 20 9 4 15 16 50 21 21 years . . . . . . . . . . . . . 135 4 17 7 7 16 19 43 22 22 years . . . . . . . . . . . . . 109 2 13 11 3 8 14 45 13 23 years . . . . . . . . . . . . . 123 6 14 9 3 16 19 41 15 24 years . . . . . . . . . . . . . 121 5 14 6 4 13 15 45 19 25 years . . . . . . . . . . . . . 108 6 17 11 1 8 12 39 14 26 years . . . . . . . . . . . . . 104 6 12 10 10 10 17 29 10 27 years . . . . . . . . . . . . . 126 2 14 10 1 19 14 49 17 28 years . . . . . . . . . . . . . 93 4 8 11 4 8 19 25 14 29 years . . . . . . . . . . . . . 102 1 16 10 6 13 11 35 10 30 years . . . . . . . . . . . . . 89 4 13 5 6 3 14 32 12 31 years . . . . . . . . . . . . . 83 - 11 9 4 7 15 30 7 32 years . . . . . . . . . . . . . 81 3 11 9 6 8 5 25 14 33 years . . . . . . . . . . . . . 55 - 9 5 4 1 4 26 6 34 years . . . . . . . . . . . . . 85 1 8 5 7 7 26 22 9 35 years . . . . . . . . . . . . . 61 1 9 3 2 7 6 23 10 36 years . . . . . . . . . . . . . 63 3 5 4 6 7 12 16 10 37 years . . . . . . . . . . . . . 70 2 8 3 4 5 11 24 13 38 years . . . . . . . . . . . . . 65 2 7 8 3 6 11 20 8 39 years . . . . . . . . . . . . . 73 - 7 6 4 8 11 27 10 40 years . . . . . . . . . . . . . 91 1 8 4 1 13 16 38 10 41 years . . . . . . . . . . . . . 56 2 7 2 6 6 9 22 2 42 years . . . . . . . . . . . . . 55 4 8 - 2 4 9 23 5 43 years . . . . . . . . . . . . . 49 2 1 4 7 6 3 21 5 44 years . . . . . . . . . . . . . 57 4 5 8 6 2 7 18 7 45 years . . . . . . . . . . . . . 58 1 6 1 - 9 9 22 10 46 years . . . . . . . . . . . . . 46 1 5 2 4 7 5 20 2 47 years . . . . . . . . . . . . . 55 1 9 - - 5 6 26 8 48 years . . . . . . . . . . . . . 42 1 4 2 3 3 5 20 4 49 years . . . . . . . . . . . . . 46 2 3 5 3 6 5 17 5 50 years . . . . . . . . . . . . . 47 1 8 4 2 3 6 18 5 51 years . . . . . . . . . . . . . 50 2 7 1 2 5 4 23 6 52 years . . . . . . . . . . . . . 34 - 4 4 2 5 6 11 2 53 years . . . . . . . . . . . . . 29 - 3 2 2 2 4 11 5 54 years . . . . . . . . . . . . . 22 1 3 3 3 1 5 6 - 55 years . . . . . . . . . . . . . 31 1 4 2 3 1 2 15 3 56 years . . . . . . . . . . . . . 23 - 3 1 1 - 4 14 - 57 years . . . . . . . . . . . . . 22 - 1 4 - 1 1 10 5 58 years . . . . . . . . . . . . . 24 1 5 1 1 1 1 7 7 59 years . . . . . . . . . . . . . 13 - - 2 - - 3 6 2 60 to 64 years . . . . . . . . . . 97 2 11 5 2 10 17 38 12 65+ years. . . . . . . . . . . . . 219 9 19 17 6 18 28 92 30 ───────────────────────────────────────────────────────────────────────────────────────────── Source: 2000 FSM Census
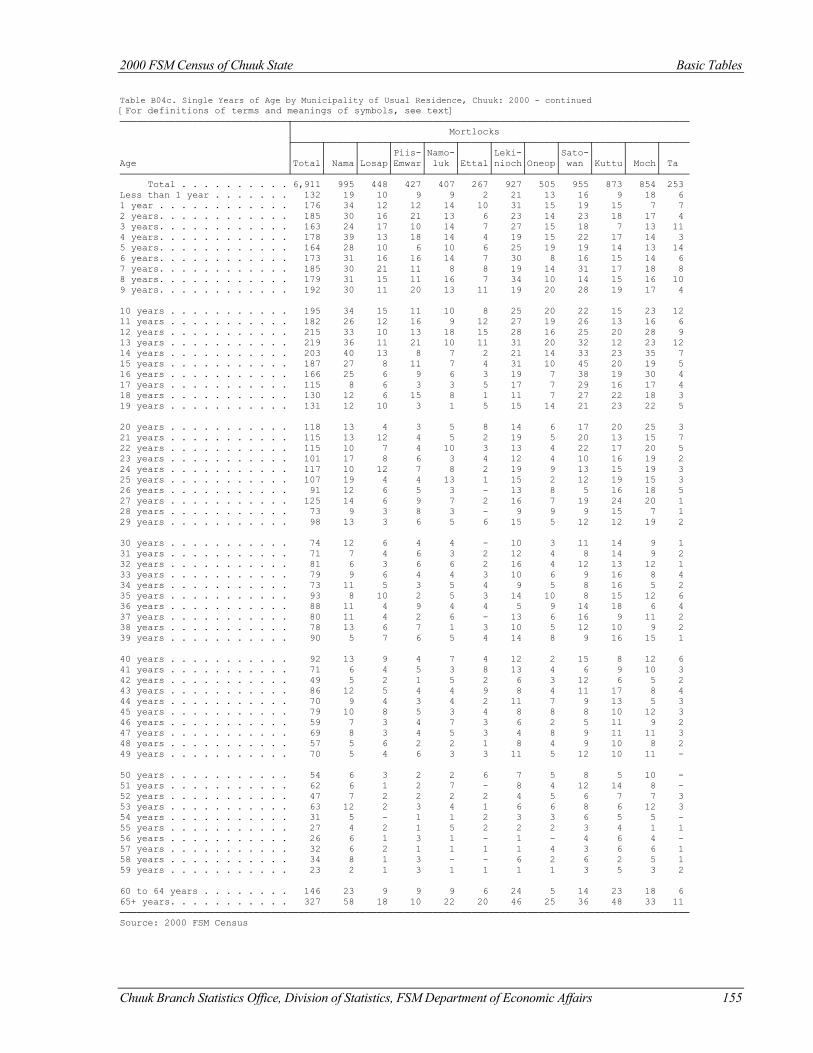
2000 FSM Census of Chuuk State Basic Tables
Chuuk Branch Statistics Office, Division of Statistics, FSM Department of Economic Affairs 155
Table B04c. Single Years of Age by Municipality of Usual Residence, Chuuk: 2000 - continued [For definitions of terms and meanings of symbols, see text] ──────────────────────────────┬─────────────────────────────────────────────────────────────────────── │ Mortlocks ├─────┬─────┬─────┬─────┬─────┬─────┬─────┬─────┬─────┬─────┬─────┬───── │ │ │ │Piis-│Namo-│ │Leki-│ │Sato-│ │ │ Age │Total│ Nama│Losap│Emwar│ luk │Ettal│nioch│Oneop│ wan │Kuttu│ Moch│ Ta ──────────────────────────────┴─────┴─────┴─────┴─────┴─────┴─────┴─────┴─────┴─────┴─────┴─────┴───── Total . . . . . . . . . . 6,911 995 448 427 407 267 927 505 955 873 854 253 Less than 1 year . . . . . . . 132 19 10 9 9 2 21 13 16 9 18 6 1 year . . . . . . . . . . . . 176 34 12 12 14 10 31 15 19 15 7 7 2 years. . . . . . . . . . . . 185 30 16 21 13 6 23 14 23 18 17 4 3 years. . . . . . . . . . . . 163 24 17 10 14 7 27 15 18 7 13 11 4 years. . . . . . . . . . . . 178 39 13 18 14 4 19 15 22 17 14 3 5 years. . . . . . . . . . . . 164 28 10 6 10 6 25 19 19 14 13 14 6 years. . . . . . . . . . . . 173 31 16 16 14 7 30 8 16 15 14 6 7 years. . . . . . . . . . . . 185 30 21 11 8 8 19 14 31 17 18 8 8 years. . . . . . . . . . . . 179 31 15 11 16 7 34 10 14 15 16 10 9 years. . . . . . . . . . . . 192 30 11 20 13 11 19 20 28 19 17 4 10 years . . . . . . . . . . . 195 34 15 11 10 8 25 20 22 15 23 12 11 years . . . . . . . . . . . 182 26 12 16 9 12 27 19 26 13 16 6 12 years . . . . . . . . . . . 215 33 10 13 18 15 28 16 25 20 28 9 13 years . . . . . . . . . . . 219 36 11 21 10 11 31 20 32 12 23 12 14 years . . . . . . . . . . . 203 40 13 8 7 2 21 14 33 23 35 7 15 years . . . . . . . . . . . 187 27 8 11 7 4 31 10 45 20 19 5 16 years . . . . . . . . . . . 166 25 6 9 6 3 19 7 38 19 30 4 17 years . . . . . . . . . . . 115 8 6 3 3 5 17 7 29 16 17 4 18 years . . . . . . . . . . . 130 12 6 15 8 1 11 7 27 22 18 3 19 years . . . . . . . . . . . 131 12 10 3 1 5 15 14 21 23 22 5 20 years . . . . . . . . . . . 118 13 4 3 5 8 14 6 17 20 25 3 21 years . . . . . . . . . . . 115 13 12 4 5 2 19 5 20 13 15 7 22 years . . . . . . . . . . . 115 10 7 4 10 3 13 4 22 17 20 5 23 years . . . . . . . . . . . 101 17 8 6 3 4 12 4 10 16 19 2 24 years . . . . . . . . . . . 117 10 12 7 8 2 19 9 13 15 19 3 25 years . . . . . . . . . . . 107 19 4 4 13 1 15 2 12 19 15 3 26 years . . . . . . . . . . . 91 12 6 5 3 - 13 8 5 16 18 5 27 years . . . . . . . . . . . 125 14 6 9 7 2 16 7 19 24 20 1 28 years . . . . . . . . . . . 73 9 3 8 3 - 9 9 9 15 7 1 29 years . . . . . . . . . . . 98 13 3 6 5 6 15 5 12 12 19 2 30 years . . . . . . . . . . . 74 12 6 4 4 - 10 3 11 14 9 1 31 years . . . . . . . . . . . 71 7 4 6 3 2 12 4 8 14 9 2 32 years . . . . . . . . . . . 81 6 3 6 6 2 16 4 12 13 12 1 33 years . . . . . . . . . . . 79 9 6 4 4 3 10 6 9 16 8 4 34 years . . . . . . . . . . . 73 11 5 3 5 4 9 5 8 16 5 2 35 years . . . . . . . . . . . 93 8 10 2 5 3 14 10 8 15 12 6 36 years . . . . . . . . . . . 88 11 4 9 4 4 5 9 14 18 6 4 37 years . . . . . . . . . . . 80 11 4 2 6 - 13 6 16 9 11 2 38 years . . . . . . . . . . . 78 13 6 7 1 3 10 5 12 10 9 2 39 years . . . . . . . . . . . 90 5 7 6 5 4 14 8 9 16 15 1 40 years . . . . . . . . . . . 92 13 9 4 7 4 12 2 15 8 12 6 41 years . . . . . . . . . . . 71 6 4 5 3 8 13 4 6 9 10 3 42 years . . . . . . . . . . . 49 5 2 1 5 2 6 3 12 6 5 2 43 years . . . . . . . . . . . 86 12 5 4 4 9 8 4 11 17 8 4 44 years . . . . . . . . . . . 70 9 4 3 4 2 11 7 9 13 5 3 45 years . . . . . . . . . . . 79 10 8 5 3 4 8 8 8 10 12 3 46 years . . . . . . . . . . . 59 7 3 4 7 3 6 2 5 11 9 2 47 years . . . . . . . . . . . 69 8 3 4 5 3 4 8 9 11 11 3 48 years . . . . . . . . . . . 57 5 6 2 2 1 8 4 9 10 8 2 49 years . . . . . . . . . . . 70 5 4 6 3 3 11 5 12 10 11 - 50 years . . . . . . . . . . . 54 6 3 2 2 6 7 5 8 5 10 - 51 years . . . . . . . . . . . 62 6 1 2 7 - 8 4 12 14 8 - 52 years . . . . . . . . . . . 47 7 2 2 2 2 4 5 6 7 7 3 53 years . . . . . . . . . . . 63 12 2 3 4 1 6 6 8 6 12 3 54 years . . . . . . . . . . . 31 5 - 1 1 2 3 3 6 5 5 - 55 years . . . . . . . . . . . 27 4 2 1 5 2 2 2 3 4 1 1 56 years . . . . . . . . . . . 26 6 1 3 1 - 1 - 4 6 4 - 57 years . . . . . . . . . . . 32 6 2 1 1 1 1 4 3 6 6 1 58 years . . . . . . . . . . . 34 8 1 3 - - 6 2 6 2 5 1 59 years . . . . . . . . . . . 23 2 1 3 1 1 1 1 3 5 3 2 60 to 64 years . . . . . . . . 146 23 9 9 9 6 24 5 14 23 18 6 65+ years. . . . . . . . . . . 327 58 18 10 22 20 46 25 36 48 33 11 ────────────────────────────────────────────────────────────────────────────────────────────────────── Source: 2000 FSM Census
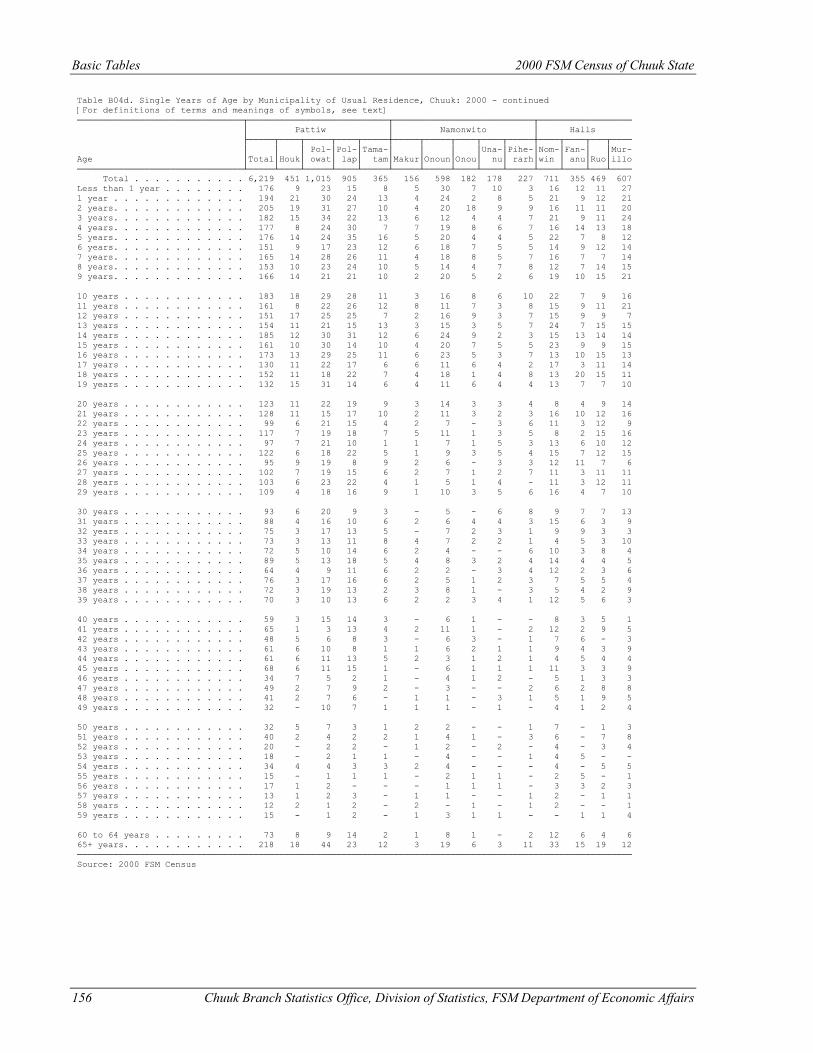
Basic Tables 2000 FSM Census of Chuuk State
156 Chuuk Branch Statistics Office, Division of Statistics, FSM Department of Economic Affairs
Table B04d. Single Years of Age by Municipality of Usual Residence, Chuuk: 2000 - continued [For definitions of terms and meanings of symbols, see text] ────────────────────────────────┬───────────────────────────┬───────────────────────────┬────────────────── │ Pattiw │ Namonwito │ Halls ├─────┬────┬─────┬────┬─────┼─────┬─────┬────┬────┬─────┼────┬────┬───┬──── │ │ │ Pol-│Pol-│Tama-│ │ │ │Una-│Pihe-│Nom-│Fan-│ │Mur- Age │Total│Houk│ owat│ lap│ tam│Makur│Onoun│Onou│ nu│ rarh│win │ anu│Ruo│illo ────────────────────────────────┴─────┴────┴─────┴────┴─────┴─────┴─────┴────┴────┴─────┴────┴────┴───┴──── Total . . . . . . . . . . . 6,219 451 1,015 905 365 156 598 182 178 227 711 355 469 607 Less than 1 year . . . . . . . . 176 9 23 15 8 5 30 7 10 3 16 12 11 27 1 year . . . . . . . . . . . . . 194 21 30 24 13 4 24 2 8 5 21 9 12 21 2 years. . . . . . . . . . . . . 205 19 31 27 10 4 20 18 9 9 16 11 11 20 3 years. . . . . . . . . . . . . 182 15 34 22 13 6 12 4 4 7 21 9 11 24 4 years. . . . . . . . . . . . . 177 8 24 30 7 7 19 8 6 7 16 14 13 18 5 years. . . . . . . . . . . . . 176 14 24 35 16 5 20 4 4 5 22 7 8 12 6 years. . . . . . . . . . . . . 151 9 17 23 12 6 18 7 5 5 14 9 12 14 7 years. . . . . . . . . . . . . 165 14 28 26 11 4 18 8 5 7 16 7 7 14 8 years. . . . . . . . . . . . . 153 10 23 24 10 5 14 4 7 8 12 7 14 15 9 years. . . . . . . . . . . . . 166 14 21 21 10 2 20 5 2 6 19 10 15 21 10 years . . . . . . . . . . . . 183 18 29 28 11 3 16 8 6 10 22 7 9 16 11 years . . . . . . . . . . . . 161 8 22 26 12 8 11 7 3 8 15 9 11 21 12 years . . . . . . . . . . . . 151 17 25 25 7 2 16 9 3 7 15 9 9 7 13 years . . . . . . . . . . . . 154 11 21 15 13 3 15 3 5 7 24 7 15 15 14 years . . . . . . . . . . . . 185 12 30 31 12 6 24 9 2 3 15 13 14 14 15 years . . . . . . . . . . . . 161 10 30 14 10 4 20 7 5 5 23 9 9 15 16 years . . . . . . . . . . . . 173 13 29 25 11 6 23 5 3 7 13 10 15 13 17 years . . . . . . . . . . . . 130 11 22 17 6 6 11 6 4 2 17 3 11 14 18 years . . . . . . . . . . . . 152 11 18 22 7 4 18 1 4 8 13 20 15 11 19 years . . . . . . . . . . . . 132 15 31 14 6 4 11 6 4 4 13 7 7 10 20 years . . . . . . . . . . . . 123 11 22 19 9 3 14 3 3 4 8 4 9 14 21 years . . . . . . . . . . . . 128 11 15 17 10 2 11 3 2 3 16 10 12 16 22 years . . . . . . . . . . . . 99 6 21 15 4 2 7 - 3 6 11 3 12 9 23 years . . . . . . . . . . . . 117 7 19 18 7 5 11 1 3 5 8 2 15 16 24 years . . . . . . . . . . . . 97 7 21 10 1 1 7 1 5 3 13 6 10 12 25 years . . . . . . . . . . . . 122 6 18 22 5 1 9 3 5 4 15 7 12 15 26 years . . . . . . . . . . . . 95 9 19 8 9 2 6 - 3 3 12 11 7 6 27 years . . . . . . . . . . . . 102 7 19 15 6 2 7 1 2 7 11 3 11 11 28 years . . . . . . . . . . . . 103 6 23 22 4 1 5 1 4 - 11 3 12 11 29 years . . . . . . . . . . . . 109 4 18 16 9 1 10 3 5 6 16 4 7 10 30 years . . . . . . . . . . . . 93 6 20 9 3 - 5 - 6 8 9 7 7 13 31 years . . . . . . . . . . . . 88 4 16 10 6 2 6 4 4 3 15 6 3 9 32 years . . . . . . . . . . . . 75 3 17 13 5 - 7 2 3 1 9 9 3 3 33 years . . . . . . . . . . . . 73 3 13 11 8 4 7 2 2 1 4 5 3 10 34 years . . . . . . . . . . . . 72 5 10 14 6 2 4 - - 6 10 3 8 4 35 years . . . . . . . . . . . . 89 5 13 18 5 4 8 3 2 4 14 4 4 5 36 years . . . . . . . . . . . . 64 4 9 11 6 2 2 - 3 4 12 2 3 6 37 years . . . . . . . . . . . . 76 3 17 16 6 2 5 1 2 3 7 5 5 4 38 years . . . . . . . . . . . . 72 3 19 13 2 3 8 1 - 3 5 4 2 9 39 years . . . . . . . . . . . . 70 3 10 13 6 2 2 3 4 1 12 5 6 3 40 years . . . . . . . . . . . . 59 3 15 14 3 - 6 1 - - 8 3 5 1 41 years . . . . . . . . . . . . 65 1 3 13 4 2 11 1 - 2 12 2 9 5 42 years . . . . . . . . . . . . 48 5 6 8 3 - 6 3 - 1 7 6 - 3 43 years . . . . . . . . . . . . 61 6 10 8 1 1 6 2 1 1 9 4 3 9 44 years . . . . . . . . . . . . 61 6 11 13 5 2 3 1 2 1 4 5 4 4 45 years . . . . . . . . . . . . 68 6 11 15 1 - 6 1 1 1 11 3 3 9 46 years . . . . . . . . . . . . 34 7 5 2 1 - 4 1 2 - 5 1 3 3 47 years . . . . . . . . . . . . 49 2 7 9 2 - 3 - - 2 6 2 8 8 48 years . . . . . . . . . . . . 41 2 7 6 - 1 1 - 3 1 5 1 9 5 49 years . . . . . . . . . . . . 32 - 10 7 1 1 1 - 1 - 4 1 2 4 50 years . . . . . . . . . . . . 32 5 7 3 1 2 2 - - 1 7 - 1 3 51 years . . . . . . . . . . . . 40 2 4 2 2 1 4 1 - 3 6 - 7 8 52 years . . . . . . . . . . . . 20 - 2 2 - 1 2 - 2 - 4 - 3 4 53 years . . . . . . . . . . . . 18 - 2 1 1 - 4 - - 1 4 5 - - 54 years . . . . . . . . . . . . 34 4 4 3 3 2 4 - - - 4 - 5 5 55 years . . . . . . . . . . . . 15 - 1 1 1 - 2 1 1 - 2 5 - 1 56 years . . . . . . . . . . . . 17 1 2 - - - 1 1 1 - 3 3 2 3 57 years . . . . . . . . . . . . 13 1 2 3 - 1 1 - - 1 2 - 1 1 58 years . . . . . . . . . . . . 12 2 1 2 - 2 - 1 - 1 2 - - 1 59 years . . . . . . . . . . . . 15 - 1 2 - 1 3 1 1 - - 1 1 4 60 to 64 years . . . . . . . . . 73 8 9 14 2 1 8 1 - 2 12 6 4 6 65+ years. . . . . . . . . . . . 218 18 44 23 12 3 19 6 3 11 33 15 19 12 ─────────────────────────────────────────────────────────────────────────────────────────────────────────── Source: 2000 FSM Census
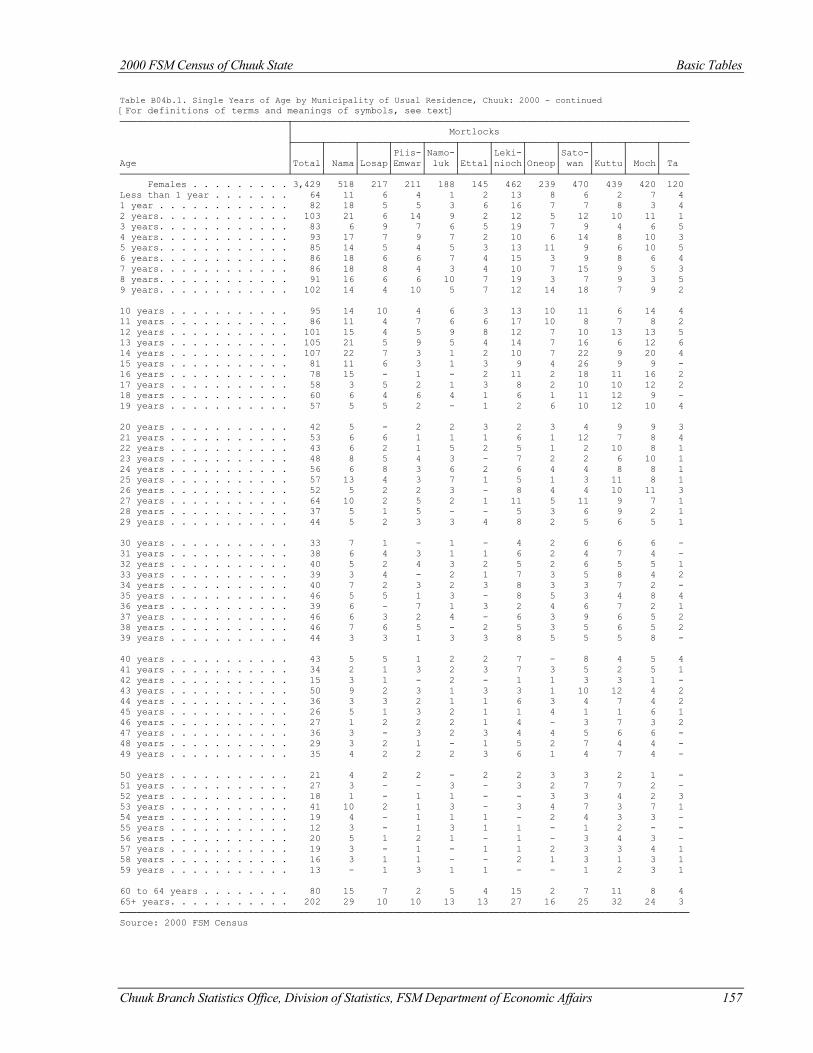
2000 FSM Census of Chuuk State Basic Tables
Chuuk Branch Statistics Office, Division of Statistics, FSM Department of Economic Affairs 157
Table B04b.1. Single Years of Age by Municipality of Usual Residence, Chuuk: 2000 - continued [For definitions of terms and meanings of symbols, see text] ──────────────────────────────┬─────────────────────────────────────────────────────────────────────── │ Mortlocks ├─────┬─────┬─────┬─────┬─────┬─────┬─────┬─────┬─────┬─────┬─────┬───── │ │ │ │Piis-│Namo-│ │Leki-│ │Sato-│ │ │ Age │Total│ Nama│Losap│Emwar│ luk │Ettal│nioch│Oneop│ wan │Kuttu│ Moch│ Ta ──────────────────────────────┴─────┴─────┴─────┴─────┴─────┴─────┴─────┴─────┴─────┴─────┴─────┴───── Females . . . . . . . . . 3,429 518 217 211 188 145 462 239 470 439 420 120 Less than 1 year . . . . . . . 64 11 6 4 1 2 13 8 6 2 7 4 1 year . . . . . . . . . . . . 82 18 5 5 3 6 16 7 7 8 3 4 2 years. . . . . . . . . . . . 103 21 6 14 9 2 12 5 12 10 11 1 3 years. . . . . . . . . . . . 83 6 9 7 6 5 19 7 9 4 6 5 4 years. . . . . . . . . . . . 93 17 7 9 7 2 10 6 14 8 10 3 5 years. . . . . . . . . . . . 85 14 5 4 5 3 13 11 9 6 10 5 6 years. . . . . . . . . . . . 86 18 6 6 7 4 15 3 9 8 6 4 7 years. . . . . . . . . . . . 86 18 8 4 3 4 10 7 15 9 5 3 8 years. . . . . . . . . . . . 91 16 6 6 10 7 19 3 7 9 3 5 9 years. . . . . . . . . . . . 102 14 4 10 5 7 12 14 18 7 9 2 10 years . . . . . . . . . . . 95 14 10 4 6 3 13 10 11 6 14 4 11 years . . . . . . . . . . . 86 11 4 7 6 6 17 10 8 7 8 2 12 years . . . . . . . . . . . 101 15 4 5 9 8 12 7 10 13 13 5 13 years . . . . . . . . . . . 105 21 5 9 5 4 14 7 16 6 12 6 14 years . . . . . . . . . . . 107 22 7 3 1 2 10 7 22 9 20 4 15 years . . . . . . . . . . . 81 11 6 3 1 3 9 4 26 9 9 - 16 years . . . . . . . . . . . 78 15 - 1 - 2 11 2 18 11 16 2 17 years . . . . . . . . . . . 58 3 5 2 1 3 8 2 10 10 12 2 18 years . . . . . . . . . . . 60 6 4 6 4 1 6 1 11 12 9 - 19 years . . . . . . . . . . . 57 5 5 2 - 1 2 6 10 12 10 4 20 years . . . . . . . . . . . 42 5 - 2 2 3 2 3 4 9 9 3 21 years . . . . . . . . . . . 53 6 6 1 1 1 6 1 12 7 8 4 22 years . . . . . . . . . . . 43 6 2 1 5 2 5 1 2 10 8 1 23 years . . . . . . . . . . . 48 8 5 4 3 - 7 2 2 6 10 1 24 years . . . . . . . . . . . 56 6 8 3 6 2 6 4 4 8 8 1 25 years . . . . . . . . . . . 57 13 4 3 7 1 5 1 3 11 8 1 26 years . . . . . . . . . . . 52 5 2 2 3 - 8 4 4 10 11 3 27 years . . . . . . . . . . . 64 10 2 5 2 1 11 5 11 9 7 1 28 years . . . . . . . . . . . 37 5 1 5 - - 5 3 6 9 2 1 29 years . . . . . . . . . . . 44 5 2 3 3 4 8 2 5 6 5 1 30 years . . . . . . . . . . . 33 7 1 - 1 - 4 2 6 6 6 - 31 years . . . . . . . . . . . 38 6 4 3 1 1 6 2 4 7 4 - 32 years . . . . . . . . . . . 40 5 2 4 3 2 5 2 6 5 5 1 33 years . . . . . . . . . . . 39 3 4 - 2 1 7 3 5 8 4 2 34 years . . . . . . . . . . . 40 7 2 3 2 3 8 3 3 7 2 - 35 years . . . . . . . . . . . 46 5 5 1 3 - 8 5 3 4 8 4 36 years . . . . . . . . . . . 39 6 - 7 1 3 2 4 6 7 2 1 37 years . . . . . . . . . . . 46 6 3 2 4 - 6 3 9 6 5 2 38 years . . . . . . . . . . . 46 7 6 5 - 2 5 3 5 6 5 2 39 years . . . . . . . . . . . 44 3 3 1 3 3 8 5 5 5 8 - 40 years . . . . . . . . . . . 43 5 5 1 2 2 7 - 8 4 5 4 41 years . . . . . . . . . . . 34 2 1 3 2 3 7 3 5 2 5 1 42 years . . . . . . . . . . . 15 3 1 - 2 - 1 1 3 3 1 - 43 years . . . . . . . . . . . 50 9 2 3 1 3 3 1 10 12 4 2 44 years . . . . . . . . . . . 36 3 3 2 1 1 6 3 4 7 4 2 45 years . . . . . . . . . . . 26 5 1 3 2 1 1 4 1 1 6 1 46 years . . . . . . . . . . . 27 1 2 2 2 1 4 - 3 7 3 2 47 years . . . . . . . . . . . 36 3 - 3 2 3 4 4 5 6 6 - 48 years . . . . . . . . . . . 29 3 2 1 - 1 5 2 7 4 4 - 49 years . . . . . . . . . . . 35 4 2 2 2 3 6 1 4 7 4 - 50 years . . . . . . . . . . . 21 4 2 2 - 2 2 3 3 2 1 - 51 years . . . . . . . . . . . 27 3 - - 3 - 3 2 7 7 2 - 52 years . . . . . . . . . . . 18 1 - 1 1 - - 3 3 4 2 3 53 years . . . . . . . . . . . 41 10 2 1 3 - 3 4 7 3 7 1 54 years . . . . . . . . . . . 19 4 - 1 1 1 - 2 4 3 3 - 55 years . . . . . . . . . . . 12 3 - 1 3 1 1 - 1 2 - - 56 years . . . . . . . . . . . 20 5 1 2 1 - 1 - 3 4 3 - 57 years . . . . . . . . . . . 19 3 - 1 - 1 1 2 3 3 4 1 58 years . . . . . . . . . . . 16 3 1 1 - - 2 1 3 1 3 1 59 years . . . . . . . . . . . 13 - 1 3 1 1 - - 1 2 3 1 60 to 64 years . . . . . . . . 80 15 7 2 5 4 15 2 7 11 8 4 65+ years. . . . . . . . . . . 202 29 10 10 13 13 27 16 25 32 24 3 ────────────────────────────────────────────────────────────────────────────────────────────────────── Source: 2000 FSM Census
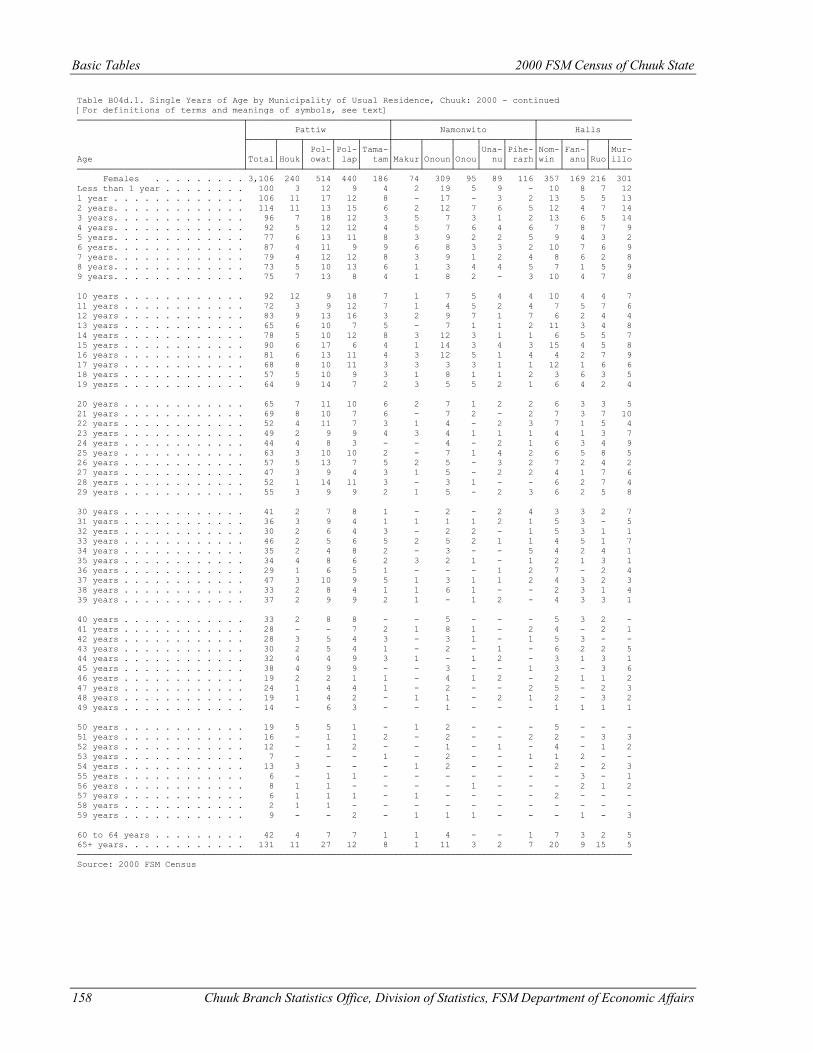
Basic Tables 2000 FSM Census of Chuuk State
158 Chuuk Branch Statistics Office, Division of Statistics, FSM Department of Economic Affairs
Table B04d.1. Single Years of Age by Municipality of Usual Residence, Chuuk: 2000 - continued [For definitions of terms and meanings of symbols, see text] ────────────────────────────────┬───────────────────────────┬───────────────────────────┬────────────────── │ Pattiw │ Namonwito │ Halls ├─────┬────┬─────┬────┬─────┼─────┬─────┬────┬────┬─────┼────┬────┬───┬──── │ │ │ Pol-│Pol-│Tama-│ │ │ │Una-│Pihe-│Nom-│Fan-│ │Mur- Age │Total│Houk│ owat│ lap│ tam│Makur│Onoun│Onou│ nu│ rarh│win │ anu│Ruo│illo ────────────────────────────────┴─────┴────┴─────┴────┴─────┴─────┴─────┴────┴────┴─────┴────┴────┴───┴──── Females . . . . . . . . . 3,106 240 514 440 186 74 309 95 89 116 357 169 216 301 Less than 1 year . . . . . . . . 100 3 12 9 4 2 19 5 9 - 10 8 7 12 1 year . . . . . . . . . . . . . 106 11 17 12 8 - 17 - 3 2 13 5 5 13 2 years. . . . . . . . . . . . . 114 11 13 15 6 2 12 7 6 5 12 4 7 14 3 years. . . . . . . . . . . . . 96 7 18 12 3 5 7 3 1 2 13 6 5 14 4 years. . . . . . . . . . . . . 92 5 12 12 4 5 7 6 4 6 7 8 7 9 5 years. . . . . . . . . . . . . 77 6 13 11 8 3 9 2 2 5 9 4 3 2 6 years. . . . . . . . . . . . . 87 4 11 9 9 6 8 3 3 2 10 7 6 9 7 years. . . . . . . . . . . . . 79 4 12 12 8 3 9 1 2 4 8 6 2 8 8 years. . . . . . . . . . . . . 73 5 10 13 6 1 3 4 4 5 7 1 5 9 9 years. . . . . . . . . . . . . 75 7 13 8 4 1 8 2 - 3 10 4 7 8 10 years . . . . . . . . . . . . 92 12 9 18 7 1 7 5 4 4 10 4 4 7 11 years . . . . . . . . . . . . 72 3 9 12 7 1 4 5 2 4 7 5 7 6 12 years . . . . . . . . . . . . 83 9 13 16 3 2 9 7 1 7 6 2 4 4 13 years . . . . . . . . . . . . 65 6 10 7 5 - 7 1 1 2 11 3 4 8 14 years . . . . . . . . . . . . 78 5 10 12 8 3 12 3 1 1 6 5 5 7 15 years . . . . . . . . . . . . 90 6 17 6 4 1 14 3 4 3 15 4 5 8 16 years . . . . . . . . . . . . 81 6 13 11 4 3 12 5 1 4 4 2 7 9 17 years . . . . . . . . . . . . 68 8 10 11 3 3 3 3 1 1 12 1 6 6 18 years . . . . . . . . . . . . 57 5 10 9 3 1 8 1 1 2 3 6 3 5 19 years . . . . . . . . . . . . 64 9 14 7 2 3 5 5 2 1 6 4 2 4 20 years . . . . . . . . . . . . 65 7 11 10 6 2 7 1 2 2 6 3 3 5 21 years . . . . . . . . . . . . 69 8 10 7 6 - 7 2 - 2 7 3 7 10 22 years . . . . . . . . . . . . 52 4 11 7 3 1 4 - 2 3 7 1 5 4 23 years . . . . . . . . . . . . 49 2 9 9 4 3 4 1 1 1 4 1 3 7 24 years . . . . . . . . . . . . 44 4 8 3 - - 4 - 2 1 6 3 4 9 25 years . . . . . . . . . . . . 63 3 10 10 2 - 7 1 4 2 6 5 8 5 26 years . . . . . . . . . . . . 57 5 13 7 5 2 5 - 3 2 7 2 4 2 27 years . . . . . . . . . . . . 47 3 9 4 3 1 5 - 2 2 4 1 7 6 28 years . . . . . . . . . . . . 52 1 14 11 3 - 3 1 - - 6 2 7 4 29 years . . . . . . . . . . . . 55 3 9 9 2 1 5 - 2 3 6 2 5 8 30 years . . . . . . . . . . . . 41 2 7 8 1 - 2 - 2 4 3 3 2 7 31 years . . . . . . . . . . . . 36 3 9 4 1 1 1 1 2 1 5 3 - 5 32 years . . . . . . . . . . . . 30 2 6 4 3 - 2 2 - 1 5 3 1 1 33 years . . . . . . . . . . . . 46 2 5 6 5 2 5 2 1 1 4 5 1 7 34 years . . . . . . . . . . . . 35 2 4 8 2 - 3 - - 5 4 2 4 1 35 years . . . . . . . . . . . . 34 4 8 6 2 3 2 1 - 1 2 1 3 1 36 years . . . . . . . . . . . . 29 1 6 5 1 - - - 1 2 7 - 2 4 37 years . . . . . . . . . . . . 47 3 10 9 5 1 3 1 1 2 4 3 2 3 38 years . . . . . . . . . . . . 33 2 8 4 1 1 6 1 - - 2 3 1 4 39 years . . . . . . . . . . . . 37 2 9 9 2 1 - 1 2 - 4 3 3 1 40 years . . . . . . . . . . . . 33 2 8 8 - - 5 - - - 5 3 2 - 41 years . . . . . . . . . . . . 28 - - 7 2 1 8 1 - 2 4 - 2 1 42 years . . . . . . . . . . . . 28 3 5 4 3 - 3 1 - 1 5 3 - - 43 years . . . . . . . . . . . . 30 2 5 4 1 - 2 - 1 - 6 2 2 5 44 years . . . . . . . . . . . . 32 4 4 9 3 1 - 1 2 - 3 1 3 1 45 years . . . . . . . . . . . . 38 4 9 9 - - 3 - - 1 3 - 3 6 46 years . . . . . . . . . . . . 19 2 2 1 1 - 4 1 2 - 2 1 1 2 47 years . . . . . . . . . . . . 24 1 4 4 1 - 2 - - 2 5 - 2 3 48 years . . . . . . . . . . . . 19 1 4 2 - 1 1 - 2 1 2 - 3 2 49 years . . . . . . . . . . . . 14 - 6 3 - - 1 - - - 1 1 1 1 50 years . . . . . . . . . . . . 19 5 5 1 - 1 2 - - - 5 - - - 51 years . . . . . . . . . . . . 16 - 1 1 2 - 2 - - 2 2 - 3 3 52 years . . . . . . . . . . . . 12 - 1 2 - - 1 - 1 - 4 - 1 2 53 years . . . . . . . . . . . . 7 - - - 1 - 2 - - 1 1 2 - - 54 years . . . . . . . . . . . . 13 3 - - - 1 2 - - - 2 - 2 3 55 years . . . . . . . . . . . . 6 - 1 1 - - - - - - - 3 - 1 56 years . . . . . . . . . . . . 8 1 1 - - - - 1 - - - 2 1 2 57 years . . . . . . . . . . . . 6 1 1 1 - 1 - - - - 2 - - - 58 years . . . . . . . . . . . . 2 1 1 - - - - - - - - - - - 59 years . . . . . . . . . . . . 9 - - 2 - 1 1 1 - - - 1 - 3 60 to 64 years . . . . . . . . . 42 4 7 7 1 1 4 - - 1 7 3 2 5 65+ years. . . . . . . . . . . . 131 11 27 12 8 1 11 3 2 7 20 9 15 5 ─────────────────────────────────────────────────────────────────────────────────────────────────────────── Source: 2000 FSM Census

2000 FSM Census of Chuuk State Basic Tables
Chuuk Branch Statistics Office, Division of Statistics, FSM Department of Economic Affairs 159
Table B05a. Place of Birth by Municipality of Usual Residence, Chuuk: 2000 [For definitions of terms and meanings of symbols, see text] ──────────────────────────────┬──────┬────────────────────────┬────────────────────────────────────── │ │ Northern Namoneas │ Southern Namoneas │ ├──────┬──────┬─────┬────┼──────┬───────┬─────┬─────┬─────┬───── │ │ │ │Piis-│ │ │Tonoas/│ │ │ │ Place of Birth │ Total│ Total│ Weno│Paneu│Fono│ Total│Etten │Fefen│ Siis│ Uman│Parem ──────────────────────────────┴──────┴──────┴──────┴─────┴────┴──────┴───────┴─────┴─────┴─────┴───── Total . . . . . . . . . . 53,595 14,722 13,802 523 397 11,694 3,910 4,062 490 2,847 385 Federated States of Micronesia 53,285 14,501 13,581 523 397 11,643 3,895 4,034 487 2,846 381 Yap Proper . . . . . . . . . 43 35 35 - - 2 - 2 - - - Yap Outer Islands. . . . . . 16 6 6 - - 1 1 - - - - Chuuk. . . . . . . . . . . . 53,093 14,359 13,439 523 397 11,628 3,893 4,029 487 2,846 373 Northern Namoneas. . . . . 11,148 10,503 9,656 493 354 114 39 51 1 16 7 Weno . . . . . . . . . . 10,179 9,560 9,547 6 7 96 35 39 1 14 7 Piis-Paneu . . . . . . . 575 565 78 487 - 5 2 1 - 2 - Fono . . . . . . . . . . 394 378 31 - 347 13 2 11 - - - Southern Namoneas. . . . . 12,273 827 809 7 11 11,323 3,777 3,890 483 2,815 358 Tonoas/Etten . . . . . . 4,087 228 225 3 - 3,799 3,745 34 - 15 5 Fefen. . . . . . . . . . 4,137 232 225 2 5 3,866 10 3,780 2 8 66 Siis . . . . . . . . . . 558 42 42 - - 506 - 19 481 - 6 Uman . . . . . . . . . . 3,154 314 306 2 6 2,827 13 24 - 2,790 - Parem. . . . . . . . . . 337 11 11 - - 325 9 33 - 2 281 Faichuk. . . . . . . . . . 14,844 1,085 1,067 16 2 123 45 57 3 11 7 Eot. . . . . . . . . . . 379 67 66 1 - 17 6 11 - - - Udot . . . . . . . . . . 1,935 175 167 8 - 22 10 10 - 1 1 Romanum. . . . . . . . . 1,051 53 51 1 1 1 - 1 - - - Fanapanges . . . . . . . 688 32 31 1 - - - - - - - Wonei. . . . . . . . . . 1,309 102 102 - - 11 5 3 2 1 - Paata. . . . . . . . . . 2,017 82 78 4 - 5 2 1 1 1 - Tol. . . . . . . . . . . 5,564 461 459 1 1 46 13 22 - 7 4 Polle. . . . . . . . . . 1,901 113 113 - - 21 9 9 - 1 2 Mortlocks. . . . . . . . . 8,174 1,466 1,450 1 15 61 30 28 - 2 1 Nama . . . . . . . . . . 1,317 322 320 - 2 13 5 8 - - - Losap. . . . . . . . . . 666 202 192 - 10 9 4 4 - - 1 Piis-Emwar . . . . . . . 489 50 48 - 2 7 6 1 - - - Namoluk. . . . . . . . . 495 91 90 - 1 1 1 - - - - Ettal. . . . . . . . . . 328 57 57 - - 1 1 - - - - Lekinioch. . . . . . . . 1,057 128 128 - - 10 1 8 - 1 - Oneop. . . . . . . . . . 676 162 162 - - 2 - 2 - - - Satowan. . . . . . . . . 1,069 155 155 - - 10 6 3 - 1 - Kuttu. . . . . . . . . . 774 102 102 - - 7 5 2 - - - Moch . . . . . . . . . . 989 142 141 1 - 1 1 - - - - Ta . . . . . . . . . . . 314 55 55 - - - - - - - - Pattiw . . . . . . . . . . 2,978 208 206 2 - 1 1 - - - - Houk . . . . . . . . . . 574 49 49 - - 1 1 - - - - Polowat. . . . . . . . . 1,006 59 59 - - - - - - - - Pollap . . . . . . . . . 998 91 91 - - - - - - - - Tamatam. . . . . . . . . 400 9 7 2 - - - - - - - Namonwito. . . . . . . . . 1,396 90 87 2 1 4 - 2 - 2 - Makur. . . . . . . . . . 157 9 8 - 1 - - - - - - Onoun. . . . . . . . . . 600 35 34 1 - 2 - - - 2 - Onou . . . . . . . . . . 188 9 9 - - - - - - - - Unanu. . . . . . . . . . 164 - - - - - - - - - - Piherarh . . . . . . . . 287 37 36 1 - 2 - 2 - - - Halls. . . . . . . . . . . 2,280 180 164 2 14 2 1 1 - - - Nomwin . . . . . . . . . 702 29 16 - 13 - - - - - - Fananu . . . . . . . . . 425 79 78 - 1 2 1 1 - - - Ruo. . . . . . . . . . . 487 22 22 - - - - - - - - Murillo. . . . . . . . . 666 50 48 2 - - - - - - - Pohnpei Proper . . . . . . . 112 87 87 - - 11 - 3 - - 8 Outer Islands. . . . . . . . 6 3 3 - - - - - - - - Kosrae . . . . . . . . . . . 15 11 11 - - 1 1 - - - - Guam . . . . . . . . . . . . . 90 49 49 - - 23 - 17 2 - 4 Northern Mariana Islands . . . 26 17 17 - - 8 1 7 - - - Palau. . . . . . . . . . . . . 10 10 10 - - - - - - - - Marshall Islands . . . . . . . 24 15 15 - - 6 6 - - - - Other Pacific Islands. . . . . 9 8 8 - - 1 1 - - - - Asia . . . . . . . . . . . . . 51 46 46 - - 5 5 - - - - China and Taiwan . . . . . . - - - - - - - - - - - Philippines. . . . . . . . . 44 40 40 - - 4 4 - - - - Japan. . . . . . . . . . . . 1 1 1 - - - - - - - - Other Asia . . . . . . . . . 6 5 5 - - 1 1 - - - - United States. . . . . . . . . 80 62 62 - - 7 2 3 1 1 - Hawaii . . . . . . . . . . . 5 5 5 - - - - - - - - Australia/New Zealand. . . . . 2 2 2 - - - - - - - - Elsewhere. . . . . . . . . . . 18 12 12 - - 1 - 1 - - - ───────────────────────────────────────────────────────────────────────────────────────────────────── Source: 2000 FSM Census
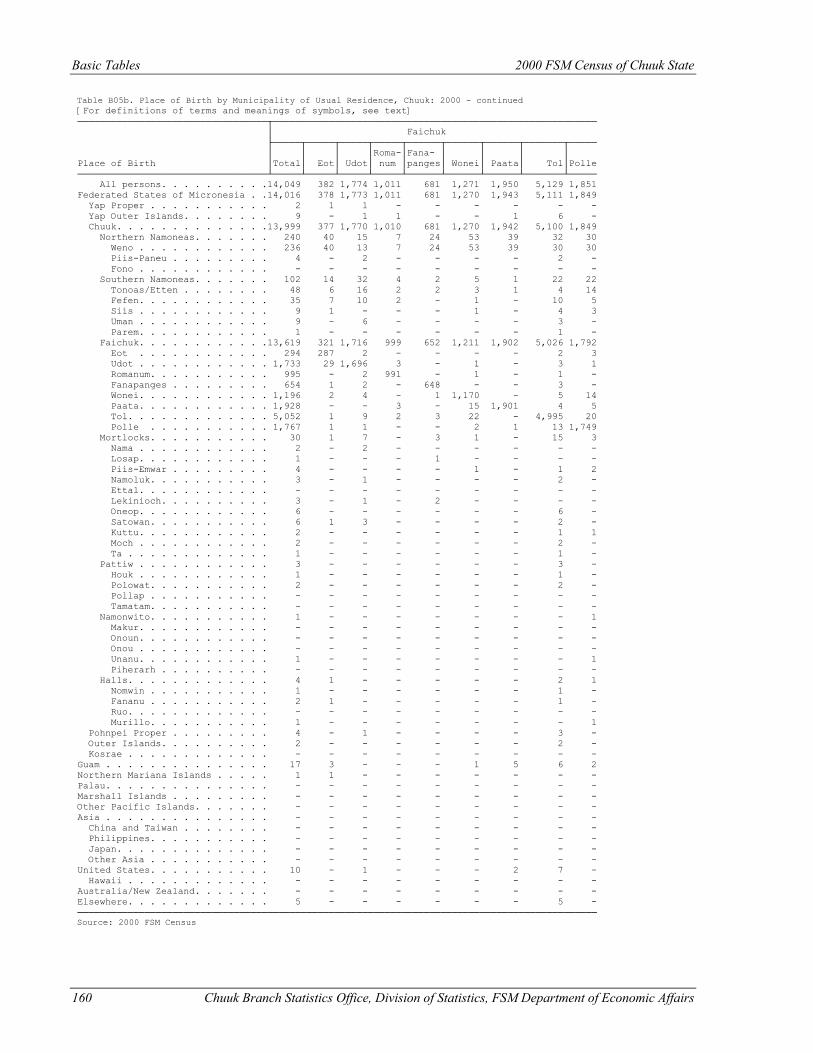
Basic Tables 2000 FSM Census of Chuuk State
160 Chuuk Branch Statistics Office, Division of Statistics, FSM Department of Economic Affairs
Table B05b. Place of Birth by Municipality of Usual Residence, Chuuk: 2000 - continued [For definitions of terms and meanings of symbols, see text] ──────────────────────────────────┬────────────────────────────────────────────────────────── │ Faichuk ├─────┬─────┬─────┬─────┬──────┬──────┬──────┬───────┬───── │ │ │ │Roma-│Fana- │ │ │ │ Place of Birth │Total│ Eot│ Udot│ num │panges│ Wonei│ Paata│ Tol│Polle ──────────────────────────────────┴─────┴─────┴─────┴─────┴──────┴──────┴──────┴───────┴───── All persons. . . . . . . . . .14,049 382 1,774 1,011 681 1,271 1,950 5,129 1,851 Federated States of Micronesia . .14,016 378 1,773 1,011 681 1,270 1,943 5,111 1,849 Yap Proper . . . . . . . . . . . 2 1 1 - - - - - - Yap Outer Islands. . . . . . . . 9 - 1 1 - - 1 6 - Chuuk. . . . . . . . . . . . . .13,999 377 1,770 1,010 681 1,270 1,942 5,100 1,849 Northern Namoneas. . . . . . . 240 40 15 7 24 53 39 32 30 Weno . . . . . . . . . . . . 236 40 13 7 24 53 39 30 30 Piis-Paneu . . . . . . . . . 4 - 2 - - - - 2 - Fono . . . . . . . . . . . . - - - - - - - - - Southern Namoneas. . . . . . . 102 14 32 4 2 5 1 22 22 Tonoas/Etten . . . . . . . . 48 6 16 2 2 3 1 4 14 Fefen. . . . . . . . . . . . 35 7 10 2 - 1 - 10 5 Siis . . . . . . . . . . . . 9 1 - - - 1 - 4 3 Uman . . . . . . . . . . . . 9 - 6 - - - - 3 - Parem. . . . . . . . . . . . 1 - - - - - - 1 - Faichuk. . . . . . . . . . . .13,619 321 1,716 999 652 1,211 1,902 5,026 1,792 Eot . . . . . . . . . . . . 294 287 2 - - - - 2 3 Udot . . . . . . . . . . . . 1,733 29 1,696 3 - 1 - 3 1 Romanum. . . . . . . . . . . 995 - 2 991 - 1 - 1 - Fanapanges . . . . . . . . . 654 1 2 - 648 - - 3 - Wonei. . . . . . . . . . . . 1,196 2 4 - 1 1,170 - 5 14 Paata. . . . . . . . . . . . 1,928 - - 3 - 15 1,901 4 5 Tol. . . . . . . . . . . . . 5,052 1 9 2 3 22 - 4,995 20 Polle . . . . . . . . . . . 1,767 1 1 - - 2 1 13 1,749 Mortlocks. . . . . . . . . . . 30 1 7 - 3 1 - 15 3 Nama . . . . . . . . . . . . 2 - 2 - - - - - - Losap. . . . . . . . . . . . 1 - - - 1 - - - - Piis-Emwar . . . . . . . . . 4 - - - - 1 - 1 2 Namoluk. . . . . . . . . . . 3 - 1 - - - - 2 - Ettal. . . . . . . . . . . . - - - - - - - - - Lekinioch. . . . . . . . . . 3 - 1 - 2 - - - - Oneop. . . . . . . . . . . . 6 - - - - - - 6 - Satowan. . . . . . . . . . . 6 1 3 - - - - 2 - Kuttu. . . . . . . . . . . . 2 - - - - - - 1 1 Moch . . . . . . . . . . . . 2 - - - - - - 2 - Ta . . . . . . . . . . . . . 1 - - - - - - 1 - Pattiw . . . . . . . . . . . . 3 - - - - - - 3 - Houk . . . . . . . . . . . . 1 - - - - - - 1 - Polowat. . . . . . . . . . . 2 - - - - - - 2 - Pollap . . . . . . . . . . . - - - - - - - - - Tamatam. . . . . . . . . . . - - - - - - - - - Namonwito. . . . . . . . . . . 1 - - - - - - - 1 Makur. . . . . . . . . . . . - - - - - - - - - Onoun. . . . . . . . . . . . - - - - - - - - - Onou . . . . . . . . . . . . - - - - - - - - - Unanu. . . . . . . . . . . . 1 - - - - - - - 1 Piherarh . . . . . . . . . . - - - - - - - - - Halls. . . . . . . . . . . . . 4 1 - - - - - 2 1 Nomwin . . . . . . . . . . . 1 - - - - - - 1 - Fananu . . . . . . . . . . . 2 1 - - - - - 1 - Ruo. . . . . . . . . . . . . - - - - - - - - - Murillo. . . . . . . . . . . 1 - - - - - - - 1 Pohnpei Proper . . . . . . . . . 4 - 1 - - - - 3 - Outer Islands. . . . . . . . . . 2 - - - - - - 2 - Kosrae . . . . . . . . . . . . . - - - - - - - - - Guam . . . . . . . . . . . . . . . 17 3 - - - 1 5 6 2 Northern Mariana Islands . . . . . 1 1 - - - - - - - Palau. . . . . . . . . . . . . . . - - - - - - - - - Marshall Islands . . . . . . . . . - - - - - - - - - Other Pacific Islands. . . . . . . - - - - - - - - - Asia . . . . . . . . . . . . . . . - - - - - - - - - China and Taiwan . . . . . . . . - - - - - - - - - Philippines. . . . . . . . . . . - - - - - - - - - Japan. . . . . . . . . . . . . . - - - - - - - - - Other Asia . . . . . . . . . . . - - - - - - - - - United States. . . . . . . . . . . 10 - 1 - - - 2 7 - Hawaii . . . . . . . . . . . . . - - - - - - - - - Australia/New Zealand. . . . . . . - - - - - - - - - Elsewhere. . . . . . . . . . . . . 5 - - - - - - 5 - ───────────────────────────────────────────────────────────────────────────────────────────── Source: 2000 FSM Census
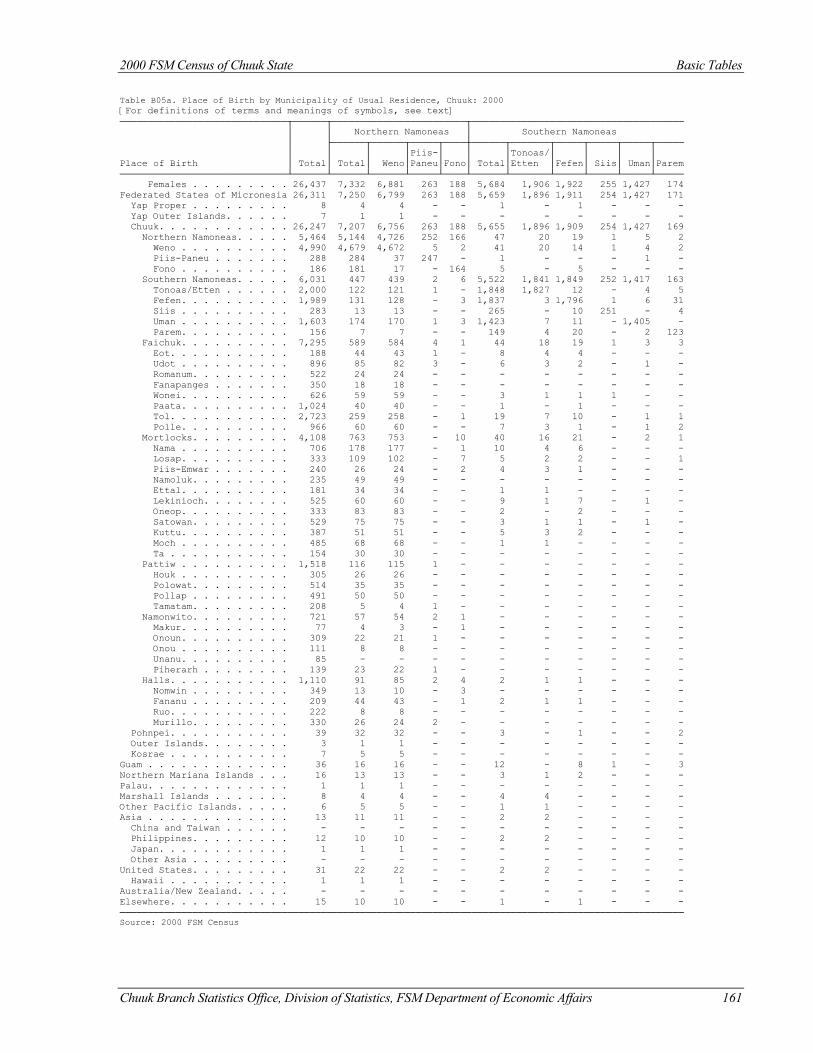
2000 FSM Census of Chuuk State Basic Tables
Chuuk Branch Statistics Office, Division of Statistics, FSM Department of Economic Affairs 161
Table B05a. Place of Birth by Municipality of Usual Residence, Chuuk: 2000 [For definitions of terms and meanings of symbols, see text] ──────────────────────────────┬──────┬────────────────────────┬────────────────────────────────────── │ │ Northern Namoneas │ Southern Namoneas │ ├──────┬──────┬─────┬────┼──────┬───────┬─────┬─────┬─────┬───── │ │ │ │Piis-│ │ │Tonoas/│ │ │ │ Place of Birth │ Total│ Total│ Weno│Paneu│Fono│ Total│Etten │Fefen│ Siis│ Uman│Parem ──────────────────────────────┴──────┴──────┴──────┴─────┴────┴──────┴───────┴─────┴─────┴─────┴───── Females . . . . . . . . . 26,437 7,332 6,881 263 188 5,684 1,906 1,922 255 1,427 174 Federated States of Micronesia 26,311 7,250 6,799 263 188 5,659 1,896 1,911 254 1,427 171 Yap Proper . . . . . . . . . 8 4 4 - - 1 - 1 - - - Yap Outer Islands. . . . . . 7 1 1 - - - - - - - - Chuuk. . . . . . . . . . . . 26,247 7,207 6,756 263 188 5,655 1,896 1,909 254 1,427 169 Northern Namoneas. . . . . 5,464 5,144 4,726 252 166 47 20 19 1 5 2 Weno . . . . . . . . . . 4,990 4,679 4,672 5 2 41 20 14 1 4 2 Piis-Paneu . . . . . . . 288 284 37 247 - 1 - - - 1 - Fono . . . . . . . . . . 186 181 17 - 164 5 - 5 - - - Southern Namoneas. . . . . 6,031 447 439 2 6 5,522 1,841 1,849 252 1,417 163 Tonoas/Etten . . . . . . 2,000 122 121 1 - 1,848 1,827 12 - 4 5 Fefen. . . . . . . . . . 1,989 131 128 - 3 1,837 3 1,796 1 6 31 Siis . . . . . . . . . . 283 13 13 - - 265 - 10 251 - 4 Uman . . . . . . . . . . 1,603 174 170 1 3 1,423 7 11 - 1,405 - Parem. . . . . . . . . . 156 7 7 - - 149 4 20 - 2 123 Faichuk. . . . . . . . . . 7,295 589 584 4 1 44 18 19 1 3 3 Eot. . . . . . . . . . . 188 44 43 1 - 8 4 4 - - - Udot . . . . . . . . . . 896 85 82 3 - 6 3 2 - 1 - Romanum. . . . . . . . . 522 24 24 - - - - - - - - Fanapanges . . . . . . . 350 18 18 - - - - - - - - Wonei. . . . . . . . . . 626 59 59 - - 3 1 1 1 - - Paata. . . . . . . . . . 1,024 40 40 - - 1 - 1 - - - Tol. . . . . . . . . . . 2,723 259 258 - 1 19 7 10 - 1 1 Polle. . . . . . . . . . 966 60 60 - - 7 3 1 - 1 2 Mortlocks. . . . . . . . . 4,108 763 753 - 10 40 16 21 - 2 1 Nama . . . . . . . . . . 706 178 177 - 1 10 4 6 - - - Losap. . . . . . . . . . 333 109 102 - 7 5 2 2 - - 1 Piis-Emwar . . . . . . . 240 26 24 - 2 4 3 1 - - - Namoluk. . . . . . . . . 235 49 49 - - - - - - - - Ettal. . . . . . . . . . 181 34 34 - - 1 1 - - - - Lekinioch. . . . . . . . 525 60 60 - - 9 1 7 - 1 - Oneop. . . . . . . . . . 333 83 83 - - 2 - 2 - - - Satowan. . . . . . . . . 529 75 75 - - 3 1 1 - 1 - Kuttu. . . . . . . . . . 387 51 51 - - 5 3 2 - - - Moch . . . . . . . . . . 485 68 68 - - 1 1 - - - - Ta . . . . . . . . . . . 154 30 30 - - - - - - - - Pattiw . . . . . . . . . . 1,518 116 115 1 - - - - - - - Houk . . . . . . . . . . 305 26 26 - - - - - - - - Polowat. . . . . . . . . 514 35 35 - - - - - - - - Pollap . . . . . . . . . 491 50 50 - - - - - - - - Tamatam. . . . . . . . . 208 5 4 1 - - - - - - - Namonwito. . . . . . . . . 721 57 54 2 1 - - - - - - Makur. . . . . . . . . . 77 4 3 - 1 - - - - - - Onoun. . . . . . . . . . 309 22 21 1 - - - - - - - Onou . . . . . . . . . . 111 8 8 - - - - - - - - Unanu. . . . . . . . . . 85 - - - - - - - - - - Piherarh . . . . . . . . 139 23 22 1 - - - - - - - Halls. . . . . . . . . . . 1,110 91 85 2 4 2 1 1 - - - Nomwin . . . . . . . . . 349 13 10 - 3 - - - - - - Fananu . . . . . . . . . 209 44 43 - 1 2 1 1 - - - Ruo. . . . . . . . . . . 222 8 8 - - - - - - - - Murillo. . . . . . . . . 330 26 24 2 - - - - - - - Pohnpei. . . . . . . . . . . 39 32 32 - - 3 - 1 - - 2 Outer Islands. . . . . . . . 3 1 1 - - - - - - - - Kosrae . . . . . . . . . . . 7 5 5 - - - - - - - - Guam . . . . . . . . . . . . . 36 16 16 - - 12 - 8 1 - 3 Northern Mariana Islands . . . 16 13 13 - - 3 1 2 - - - Palau. . . . . . . . . . . . . 1 1 1 - - - - - - - - Marshall Islands . . . . . . . 8 4 4 - - 4 4 - - - - Other Pacific Islands. . . . . 6 5 5 - - 1 1 - - - - Asia . . . . . . . . . . . . . 13 11 11 - - 2 2 - - - - China and Taiwan . . . . . . - - - - - - - - - - - Philippines. . . . . . . . . 12 10 10 - - 2 2 - - - - Japan. . . . . . . . . . . . 1 1 1 - - - - - - - - Other Asia . . . . . . . . . - - - - - - - - - - - United States. . . . . . . . . 31 22 22 - - 2 2 - - - - Hawaii . . . . . . . . . . . 1 1 1 - - - - - - - - Australia/New Zealand. . . . . - - - - - - - - - - - Elsewhere. . . . . . . . . . . 15 10 10 - - 1 - 1 - - - ───────────────────────────────────────────────────────────────────────────────────────────────────── Source: 2000 FSM Census

Basic Tables 2000 FSM Census of Chuuk State
162 Chuuk Branch Statistics Office, Division of Statistics, FSM Department of Economic Affairs
Table B05b. Place of Birth by Municipality of Usual Residence, Chuuk: 2000 - continued [For definitions of terms and meanings of symbols, see text] ──────────────────────────────────┬────────────────────────────────────────────────────────── │ Faichuk ├─────┬─────┬─────┬─────┬──────┬──────┬──────┬───────┬───── │ │ │ │Roma-│Fana- │ │ │ │ Place of Birth │Total│ Eot│ Udot│ num │panges│ Wonei│ Paata│ Tol│Polle ──────────────────────────────────┴─────┴─────┴─────┴─────┴──────┴──────┴──────┴───────┴───── Females . . . . . . . . . . . 6,886 174 826 502 350 619 993 2,487 935 Federated States of Micronesia . . 6,868 172 825 502 350 618 990 2,478 933 Yap Proper . . . . . . . . . . . 1 1 - - - - - - - Yap Outer Islands. . . . . . . . 6 - - - - - 1 5 - Chuuk. . . . . . . . . . . . . . 6,860 171 825 502 350 618 989 2,472 933 Northern Namoneas. . . . . . . 131 16 11 4 15 36 18 19 12 Weno . . . . . . . . . . . . 128 16 9 4 15 36 18 18 12 Piis-Paneu . . . . . . . . . 3 - 2 - - - - 1 - Fono . . . . . . . . . . . . - - - - - - - - - Southern Namoneas. . . . . . . 54 6 17 3 - 4 1 13 10 Tonoas/Etten . . . . . . . . 25 2 8 2 - 2 1 4 6 Fefen. . . . . . . . . . . . 20 3 6 1 - 1 - 7 2 Siis . . . . . . . . . . . . 5 1 - - - 1 - 1 2 Uman . . . . . . . . . . . . 4 - 3 - - - - 1 - Parem. . . . . . . . . . . . - - - - - - - - - Faichuk. . . . . . . . . . . . 6,654 148 793 495 333 577 970 2,428 910 Eot . . . . . . . . . . . . 135 132 1 - - - - 1 1 Udot . . . . . . . . . . . . 801 15 784 - - - - 1 1 Romanum. . . . . . . . . . . 498 - 2 495 - - - 1 - Fanapanges . . . . . . . . . 331 - 1 - 330 - - - - Wonei. . . . . . . . . . . . 564 1 1 - 1 553 - 2 6 Paata. . . . . . . . . . . . 982 - - - - 8 969 3 2 Tol. . . . . . . . . . . . . 2,444 - 3 - 2 16 - 2,415 8 Polle . . . . . . . . . . . 899 - 1 - - - 1 5 892 Mortlocks. . . . . . . . . . . 16 - 4 - 2 1 - 8 1 Nama . . . . . . . . . . . . 2 - 2 - - - - - - Losap. . . . . . . . . . . . 1 - - - 1 - - - - Piis-Emwar . . . . . . . . . 2 - - - - 1 - - 1 Namoluk. . . . . . . . . . . - - - - - - - - - Ettal. . . . . . . . . . . . - - - - - - - - - Lekinioch. . . . . . . . . . 1 - - - 1 - - - - Oneop. . . . . . . . . . . . 3 - - - - - - 3 - Satowan. . . . . . . . . . . 4 - 2 - - - - 2 - Kuttu. . . . . . . . . . . . 1 - - - - - - 1 - Moch . . . . . . . . . . . . 2 - - - - - - 2 - Ta . . . . . . . . . . . . . - - - - - - - - - Pattiw . . . . . . . . . . . . 3 - - - - - - 3 - Houk . . . . . . . . . . . . 1 - - - - - - 1 - Polowat. . . . . . . . . . . 2 - - - - - - 2 - Pollap . . . . . . . . . . . - - - - - - - - - Tamatam. . . . . . . . . . . - - - - - - - - - Namonwito. . . . . . . . . . . - - - - - - - - - Makur. . . . . . . . . . . . - - - - - - - - - Onoun. . . . . . . . . . . . - - - - - - - - - Onou . . . . . . . . . . . . - - - - - - - - - Unanu. . . . . . . . . . . . - - - - - - - - - Piherarh . . . . . . . . . . - - - - - - - - - Halls. . . . . . . . . . . . . 2 1 - - - - - 1 - Nomwin . . . . . . . . . . . - - - - - - - - - Fananu . . . . . . . . . . . 2 1 - - - - - 1 - Ruo. . . . . . . . . . . . . - - - - - - - - - Murillo. . . . . . . . . . . - - - - - - - - - Pohnpei Proper . . . . . . . . . - - - - - - - - - Outer Islands. . . . . . . . . . 1 - - - - - - 1 - Kosrae . . . . . . . . . . . . . - - - - - - - - - Guam . . . . . . . . . . . . . . . 7 2 - - - 1 2 - 2 Northern Mariana Islands . . . . . - - - - - - - - - Palau. . . . . . . . . . . . . . . - - - - - - - - - Marshall Islands . . . . . . . . . - - - - - - - - - Other Pacific Islands. . . . . . . - - - - - - - - - Asia . . . . . . . . . . . . . . . - - - - - - - - - China and Taiwan . . . . . . . . - - - - - - - - - Philippines. . . . . . . . . . . - - - - - - - - - Japan. . . . . . . . . . . . . . - - - - - - - - - Other Asia . . . . . . . . . . . - - - - - - - - - United States. . . . . . . . . . . 7 - 1 - - - 1 5 - Hawaii . . . . . . . . . . . . . - - - - - - - - - Australia/New Zealand. . . . . . . - - - - - - - - - Elsewhere. . . . . . . . . . . . . 4 - - - - - - 4 - ───────────────────────────────────────────────────────────────────────────────────────────── Source: 2000 FSM Census
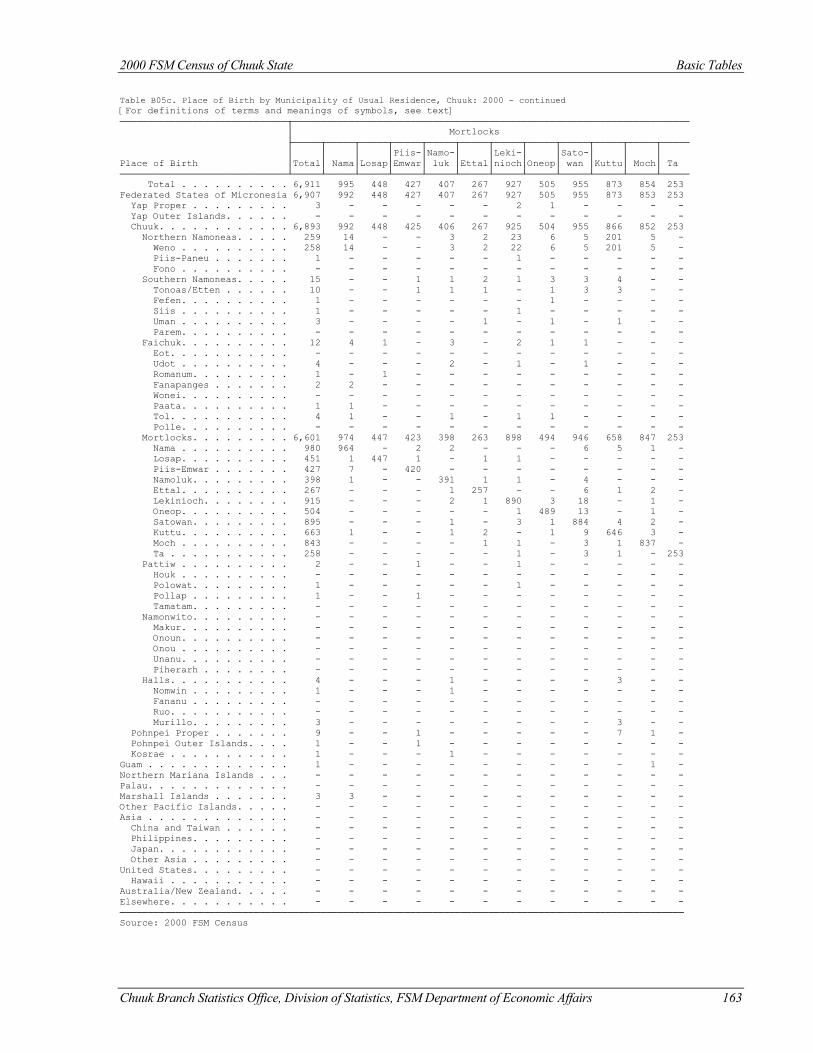
2000 FSM Census of Chuuk State Basic Tables
Chuuk Branch Statistics Office, Division of Statistics, FSM Department of Economic Affairs 163
Table B05c. Place of Birth by Municipality of Usual Residence, Chuuk: 2000 - continued [For definitions of terms and meanings of symbols, see text] ──────────────────────────────┬─────────────────────────────────────────────────────────────────────── │ Mortlocks ├─────┬─────┬─────┬─────┬─────┬─────┬─────┬─────┬─────┬─────┬─────┬───── │ │ │ │Piis-│Namo-│ │Leki-│ │Sato-│ │ │ Place of Birth │Total│ Nama│Losap│Emwar│ luk │Ettal│nioch│Oneop│ wan │Kuttu│ Moch│ Ta ──────────────────────────────┴─────┴─────┴─────┴─────┴─────┴─────┴─────┴─────┴─────┴─────┴─────┴───── Total . . . . . . . . . . 6,911 995 448 427 407 267 927 505 955 873 854 253 Federated States of Micronesia 6,907 992 448 427 407 267 927 505 955 873 853 253 Yap Proper . . . . . . . . . 3 - - - - - 2 1 - - - - Yap Outer Islands. . . . . . - - - - - - - - - - - - Chuuk. . . . . . . . . . . . 6,893 992 448 425 406 267 925 504 955 866 852 253 Northern Namoneas. . . . . 259 14 - - 3 2 23 6 5 201 5 - Weno . . . . . . . . . . 258 14 - - 3 2 22 6 5 201 5 - Piis-Paneu . . . . . . . 1 - - - - - 1 - - - - - Fono . . . . . . . . . . - - - - - - - - - - - - Southern Namoneas. . . . . 15 - - 1 1 2 1 3 3 4 - - Tonoas/Etten . . . . . . 10 - - 1 1 1 - 1 3 3 - - Fefen. . . . . . . . . . 1 - - - - - - 1 - - - - Siis . . . . . . . . . . 1 - - - - - 1 - - - - - Uman . . . . . . . . . . 3 - - - - 1 - 1 - 1 - - Parem. . . . . . . . . . - - - - - - - - - - - - Faichuk. . . . . . . . . . 12 4 1 - 3 - 2 1 1 - - - Eot. . . . . . . . . . . - - - - - - - - - - - - Udot . . . . . . . . . . 4 - - - 2 - 1 - 1 - - - Romanum. . . . . . . . . 1 - 1 - - - - - - - - - Fanapanges . . . . . . . 2 2 - - - - - - - - - - Wonei. . . . . . . . . . - - - - - - - - - - - - Paata. . . . . . . . . . 1 1 - - - - - - - - - - Tol. . . . . . . . . . . 4 1 - - 1 - 1 1 - - - - Polle. . . . . . . . . . - - - - - - - - - - - - Mortlocks. . . . . . . . . 6,601 974 447 423 398 263 898 494 946 658 847 253 Nama . . . . . . . . . . 980 964 - 2 2 - - - 6 5 1 - Losap. . . . . . . . . . 451 1 447 1 - 1 1 - - - - - Piis-Emwar . . . . . . . 427 7 - 420 - - - - - - - - Namoluk. . . . . . . . . 398 1 - - 391 1 1 - 4 - - - Ettal. . . . . . . . . . 267 - - - 1 257 - - 6 1 2 - Lekinioch. . . . . . . . 915 - - - 2 1 890 3 18 - 1 - Oneop. . . . . . . . . . 504 - - - - - 1 489 13 - 1 - Satowan. . . . . . . . . 895 - - - 1 - 3 1 884 4 2 - Kuttu. . . . . . . . . . 663 1 - - 1 2 - 1 9 646 3 - Moch . . . . . . . . . . 843 - - - - 1 1 - 3 1 837 - Ta . . . . . . . . . . . 258 - - - - - 1 - 3 1 - 253 Pattiw . . . . . . . . . . 2 - - 1 - - 1 - - - - - Houk . . . . . . . . . . - - - - - - - - - - - - Polowat. . . . . . . . . 1 - - - - - 1 - - - - - Pollap . . . . . . . . . 1 - - 1 - - - - - - - - Tamatam. . . . . . . . . - - - - - - - - - - - - Namonwito. . . . . . . . . - - - - - - - - - - - - Makur. . . . . . . . . . - - - - - - - - - - - - Onoun. . . . . . . . . . - - - - - - - - - - - - Onou . . . . . . . . . . - - - - - - - - - - - - Unanu. . . . . . . . . . - - - - - - - - - - - - Piherarh . . . . . . . . - - - - - - - - - - - - Halls. . . . . . . . . . . 4 - - - 1 - - - - 3 - - Nomwin . . . . . . . . . 1 - - - 1 - - - - - - - Fananu . . . . . . . . . - - - - - - - - - - - - Ruo. . . . . . . . . . . - - - - - - - - - - - - Murillo. . . . . . . . . 3 - - - - - - - - 3 - - Pohnpei Proper . . . . . . . 9 - - 1 - - - - - 7 1 - Pohnpei Outer Islands. . . . 1 - - 1 - - - - - - - - Kosrae . . . . . . . . . . . 1 - - - 1 - - - - - - - Guam . . . . . . . . . . . . . 1 - - - - - - - - - 1 - Northern Mariana Islands . . . - - - - - - - - - - - - Palau. . . . . . . . . . . . . - - - - - - - - - - - - Marshall Islands . . . . . . . 3 3 - - - - - - - - - - Other Pacific Islands. . . . . - - - - - - - - - - - - Asia . . . . . . . . . . . . . - - - - - - - - - - - - China and Taiwan . . . . . . - - - - - - - - - - - - Philippines. . . . . . . . . - - - - - - - - - - - - Japan. . . . . . . . . . . . - - - - - - - - - - - - Other Asia . . . . . . . . . - - - - - - - - - - - - United States. . . . . . . . . - - - - - - - - - - - - Hawaii . . . . . . . . . . . - - - - - - - - - - - - Australia/New Zealand. . . . . - - - - - - - - - - - - Elsewhere. . . . . . . . . . . - - - - - - - - - - - - ───────────────────────────────────────────────────────────────────────────────────────────────────── Source: 2000 FSM Census
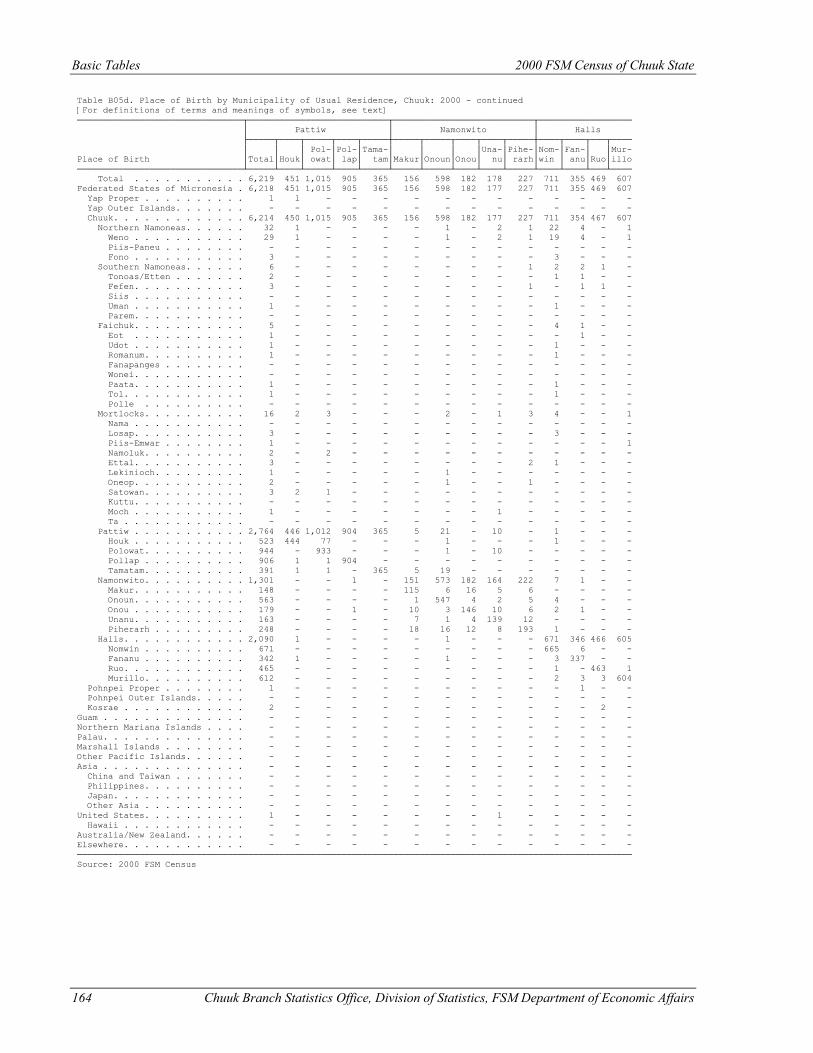
Basic Tables 2000 FSM Census of Chuuk State
164 Chuuk Branch Statistics Office, Division of Statistics, FSM Department of Economic Affairs
Table B05d. Place of Birth by Municipality of Usual Residence, Chuuk: 2000 - continued [For definitions of terms and meanings of symbols, see text] ────────────────────────────────┬───────────────────────────┬───────────────────────────┬────────────────── │ Pattiw │ Namonwito │ Halls ├─────┬────┬─────┬────┬─────┼─────┬─────┬────┬────┬─────┼────┬────┬───┬──── │ │ │ Pol-│Pol-│Tama-│ │ │ │Una-│Pihe-│Nom-│Fan-│ │Mur- Place of Birth │Total│Houk│ owat│ lap│ tam│Makur│Onoun│Onou│ nu│ rarh│win │ anu│Ruo│illo ────────────────────────────────┴─────┴────┴─────┴────┴─────┴─────┴─────┴────┴────┴─────┴────┴────┴───┴──── Total . . . . . . . . . . . 6,219 451 1,015 905 365 156 598 182 178 227 711 355 469 607 Federated States of Micronesia . 6,218 451 1,015 905 365 156 598 182 177 227 711 355 469 607 Yap Proper . . . . . . . . . . 1 1 - - - - - - - - - - - - Yap Outer Islands. . . . . . . - - - - - - - - - - - - - - Chuuk. . . . . . . . . . . . . 6,214 450 1,015 905 365 156 598 182 177 227 711 354 467 607 Northern Namoneas. . . . . . 32 1 - - - - 1 - 2 1 22 4 - 1 Weno . . . . . . . . . . . 29 1 - - - - 1 - 2 1 19 4 - 1 Piis-Paneu . . . . . . . . - - - - - - - - - - - - - - Fono . . . . . . . . . . . 3 - - - - - - - - - 3 - - - Southern Namoneas. . . . . . 6 - - - - - - - - 1 2 2 1 - Tonoas/Etten . . . . . . . 2 - - - - - - - - - 1 1 - - Fefen. . . . . . . . . . . 3 - - - - - - - - 1 - 1 1 - Siis . . . . . . . . . . . - - - - - - - - - - - - - - Uman . . . . . . . . . . . 1 - - - - - - - - - 1 - - - Parem. . . . . . . . . . . - - - - - - - - - - - - - - Faichuk. . . . . . . . . . . 5 - - - - - - - - - 4 1 - - Eot . . . . . . . . . . . 1 - - - - - - - - - - 1 - - Udot . . . . . . . . . . . 1 - - - - - - - - - 1 - - - Romanum. . . . . . . . . . 1 - - - - - - - - - 1 - - - Fanapanges . . . . . . . . - - - - - - - - - - - - - - Wonei. . . . . . . . . . . - - - - - - - - - - - - - - Paata. . . . . . . . . . . 1 - - - - - - - - - 1 - - - Tol. . . . . . . . . . . . 1 - - - - - - - - - 1 - - - Polle . . . . . . . . . . - - - - - - - - - - - - - - Mortlocks. . . . . . . . . . 16 2 3 - - - 2 - 1 3 4 - - 1 Nama . . . . . . . . . . . - - - - - - - - - - - - - - Losap. . . . . . . . . . . 3 - - - - - - - - - 3 - - - Piis-Emwar . . . . . . . . 1 - - - - - - - - - - - - 1 Namoluk. . . . . . . . . . 2 - 2 - - - - - - - - - - - Ettal. . . . . . . . . . . 3 - - - - - - - - 2 1 - - - Lekinioch. . . . . . . . . 1 - - - - - 1 - - - - - - - Oneop. . . . . . . . . . . 2 - - - - - 1 - - 1 - - - - Satowan. . . . . . . . . . 3 2 1 - - - - - - - - - - - Kuttu. . . . . . . . . . . - - - - - - - - - - - - - - Moch . . . . . . . . . . . 1 - - - - - - - 1 - - - - - Ta . . . . . . . . . . . . - - - - - - - - - - - - - - Pattiw . . . . . . . . . . . 2,764 446 1,012 904 365 5 21 - 10 - 1 - - - Houk . . . . . . . . . . . 523 444 77 - - - 1 - - - 1 - - - Polowat. . . . . . . . . . 944 - 933 - - - 1 - 10 - - - - - Pollap . . . . . . . . . . 906 1 1 904 - - - - - - - - - - Tamatam. . . . . . . . . . 391 1 1 - 365 5 19 - - - - - - - Namonwito. . . . . . . . . . 1,301 - - 1 - 151 573 182 164 222 7 1 - - Makur. . . . . . . . . . . 148 - - - - 115 6 16 5 6 - - - - Onoun. . . . . . . . . . . 563 - - - - 1 547 4 2 5 4 - - - Onou . . . . . . . . . . . 179 - - 1 - 10 3 146 10 6 2 1 - - Unanu. . . . . . . . . . . 163 - - - - 7 1 4 139 12 - - - - Piherarh . . . . . . . . . 248 - - - - 18 16 12 8 193 1 - - - Halls. . . . . . . . . . . . 2,090 1 - - - - 1 - - - 671 346 466 605 Nomwin . . . . . . . . . . 671 - - - - - - - - - 665 6 - - Fananu . . . . . . . . . . 342 1 - - - - 1 - - - 3 337 - - Ruo. . . . . . . . . . . . 465 - - - - - - - - - 1 - 463 1 Murillo. . . . . . . . . . 612 - - - - - - - - - 2 3 3 604 Pohnpei Proper . . . . . . . . 1 - - - - - - - - - - 1 - - Pohnpei Outer Islands. . . . . - - - - - - - - - - - - - - Kosrae . . . . . . . . . . . . 2 - - - - - - - - - - - 2 - Guam . . . . . . . . . . . . . . - - - - - - - - - - - - - - Northern Mariana Islands . . . . - - - - - - - - - - - - - - Palau. . . . . . . . . . . . . . - - - - - - - - - - - - - - Marshall Islands . . . . . . . . - - - - - - - - - - - - - - Other Pacific Islands. . . . . . - - - - - - - - - - - - - - Asia . . . . . . . . . . . . . . - - - - - - - - - - - - - - China and Taiwan . . . . . . . - - - - - - - - - - - - - - Philippines. . . . . . . . . . - - - - - - - - - - - - - - Japan. . . . . . . . . . . . . - - - - - - - - - - - - - - Other Asia . . . . . . . . . . - - - - - - - - - - - - - - United States. . . . . . . . . . 1 - - - - - - - 1 - - - - - Hawaii . . . . . . . . . . . . - - - - - - - - - - - - - - Australia/New Zealand. . . . . . - - - - - - - - - - - - - - Elsewhere. . . . . . . . . . . . - - - - - - - - - - - - - - ─────────────────────────────────────────────────────────────────────────────────────────────────────────── Source: 2000 FSM Census
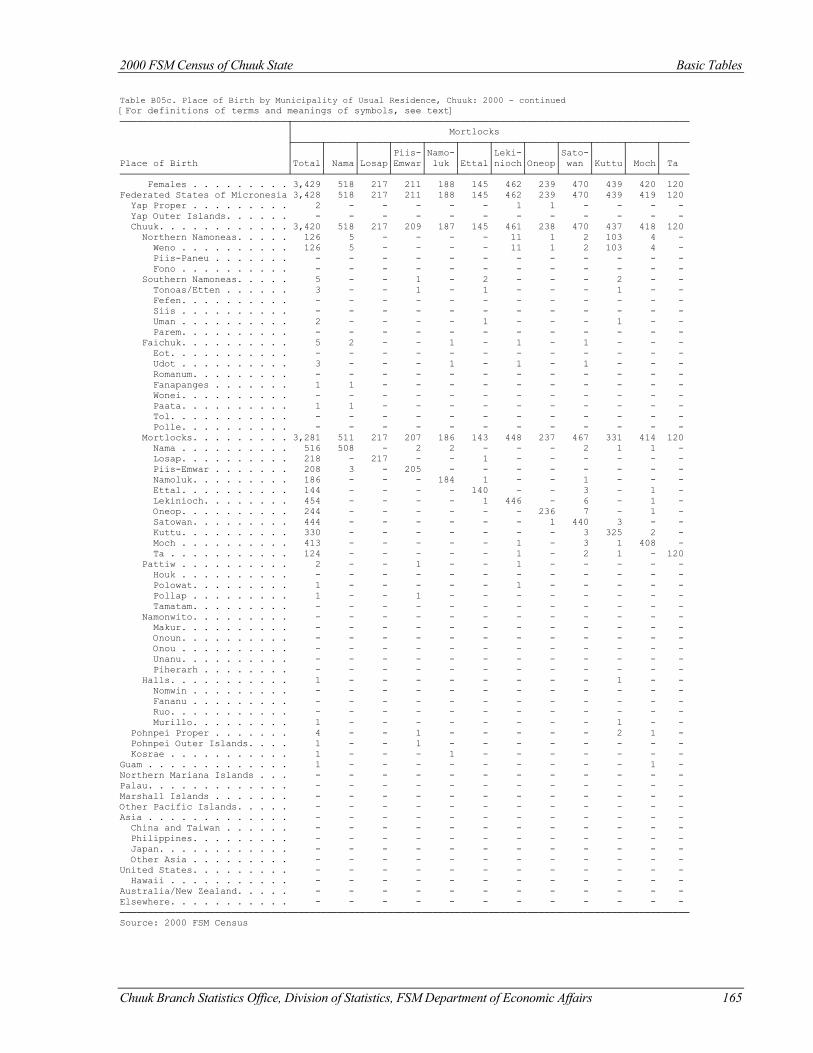
2000 FSM Census of Chuuk State Basic Tables
Chuuk Branch Statistics Office, Division of Statistics, FSM Department of Economic Affairs 165
Table B05c. Place of Birth by Municipality of Usual Residence, Chuuk: 2000 - continued [For definitions of terms and meanings of symbols, see text] ──────────────────────────────┬─────────────────────────────────────────────────────────────────────── │ Mortlocks ├─────┬─────┬─────┬─────┬─────┬─────┬─────┬─────┬─────┬─────┬─────┬───── │ │ │ │Piis-│Namo-│ │Leki-│ │Sato-│ │ │ Place of Birth │Total│ Nama│Losap│Emwar│ luk │Ettal│nioch│Oneop│ wan │Kuttu│ Moch│ Ta ──────────────────────────────┴─────┴─────┴─────┴─────┴─────┴─────┴─────┴─────┴─────┴─────┴─────┴───── Females . . . . . . . . . 3,429 518 217 211 188 145 462 239 470 439 420 120 Federated States of Micronesia 3,428 518 217 211 188 145 462 239 470 439 419 120 Yap Proper . . . . . . . . . 2 - - - - - 1 1 - - - - Yap Outer Islands. . . . . . - - - - - - - - - - - - Chuuk. . . . . . . . . . . . 3,420 518 217 209 187 145 461 238 470 437 418 120 Northern Namoneas. . . . . 126 5 - - - - 11 1 2 103 4 - Weno . . . . . . . . . . 126 5 - - - - 11 1 2 103 4 - Piis-Paneu . . . . . . . - - - - - - - - - - - - Fono . . . . . . . . . . - - - - - - - - - - - - Southern Namoneas. . . . . 5 - - 1 - 2 - - - 2 - - Tonoas/Etten . . . . . . 3 - - 1 - 1 - - - 1 - - Fefen. . . . . . . . . . - - - - - - - - - - - - Siis . . . . . . . . . . - - - - - - - - - - - - Uman . . . . . . . . . . 2 - - - - 1 - - - 1 - - Parem. . . . . . . . . . - - - - - - - - - - - - Faichuk. . . . . . . . . . 5 2 - - 1 - 1 - 1 - - - Eot. . . . . . . . . . . - - - - - - - - - - - - Udot . . . . . . . . . . 3 - - - 1 - 1 - 1 - - - Romanum. . . . . . . . . - - - - - - - - - - - - Fanapanges . . . . . . . 1 1 - - - - - - - - - - Wonei. . . . . . . . . . - - - - - - - - - - - - Paata. . . . . . . . . . 1 1 - - - - - - - - - - Tol. . . . . . . . . . . - - - - - - - - - - - - Polle. . . . . . . . . . - - - - - - - - - - - - Mortlocks. . . . . . . . . 3,281 511 217 207 186 143 448 237 467 331 414 120 Nama . . . . . . . . . . 516 508 - 2 2 - - - 2 1 1 - Losap. . . . . . . . . . 218 - 217 - - 1 - - - - - - Piis-Emwar . . . . . . . 208 3 - 205 - - - - - - - - Namoluk. . . . . . . . . 186 - - - 184 1 - - 1 - - - Ettal. . . . . . . . . . 144 - - - - 140 - - 3 - 1 - Lekinioch. . . . . . . . 454 - - - - 1 446 - 6 - 1 - Oneop. . . . . . . . . . 244 - - - - - - 236 7 - 1 - Satowan. . . . . . . . . 444 - - - - - - 1 440 3 - - Kuttu. . . . . . . . . . 330 - - - - - - - 3 325 2 - Moch . . . . . . . . . . 413 - - - - - 1 - 3 1 408 - Ta . . . . . . . . . . . 124 - - - - - 1 - 2 1 - 120 Pattiw . . . . . . . . . . 2 - - 1 - - 1 - - - - - Houk . . . . . . . . . . - - - - - - - - - - - - Polowat. . . . . . . . . 1 - - - - - 1 - - - - - Pollap . . . . . . . . . 1 - - 1 - - - - - - - - Tamatam. . . . . . . . . - - - - - - - - - - - - Namonwito. . . . . . . . . - - - - - - - - - - - - Makur. . . . . . . . . . - - - - - - - - - - - - Onoun. . . . . . . . . . - - - - - - - - - - - - Onou . . . . . . . . . . - - - - - - - - - - - - Unanu. . . . . . . . . . - - - - - - - - - - - - Piherarh . . . . . . . . - - - - - - - - - - - - Halls. . . . . . . . . . . 1 - - - - - - - - 1 - - Nomwin . . . . . . . . . - - - - - - - - - - - - Fananu . . . . . . . . . - - - - - - - - - - - - Ruo. . . . . . . . . . . - - - - - - - - - - - - Murillo. . . . . . . . . 1 - - - - - - - - 1 - - Pohnpei Proper . . . . . . . 4 - - 1 - - - - - 2 1 - Pohnpei Outer Islands. . . . 1 - - 1 - - - - - - - - Kosrae . . . . . . . . . . . 1 - - - 1 - - - - - - - Guam . . . . . . . . . . . . . 1 - - - - - - - - - 1 - Northern Mariana Islands . . . - - - - - - - - - - - - Palau. . . . . . . . . . . . . - - - - - - - - - - - - Marshall Islands . . . . . . . - - - - - - - - - - - - Other Pacific Islands. . . . . - - - - - - - - - - - - Asia . . . . . . . . . . . . . - - - - - - - - - - - - China and Taiwan . . . . . . - - - - - - - - - - - - Philippines. . . . . . . . . - - - - - - - - - - - - Japan. . . . . . . . . . . . - - - - - - - - - - - - Other Asia . . . . . . . . . - - - - - - - - - - - - United States. . . . . . . . . - - - - - - - - - - - - Hawaii . . . . . . . . . . . - - - - - - - - - - - - Australia/New Zealand. . . . . - - - - - - - - - - - - Elsewhere. . . . . . . . . . . - - - - - - - - - - - - ────────────────────────────────────────────────────────────────────────────────────────────────────── Source: 2000 FSM Census
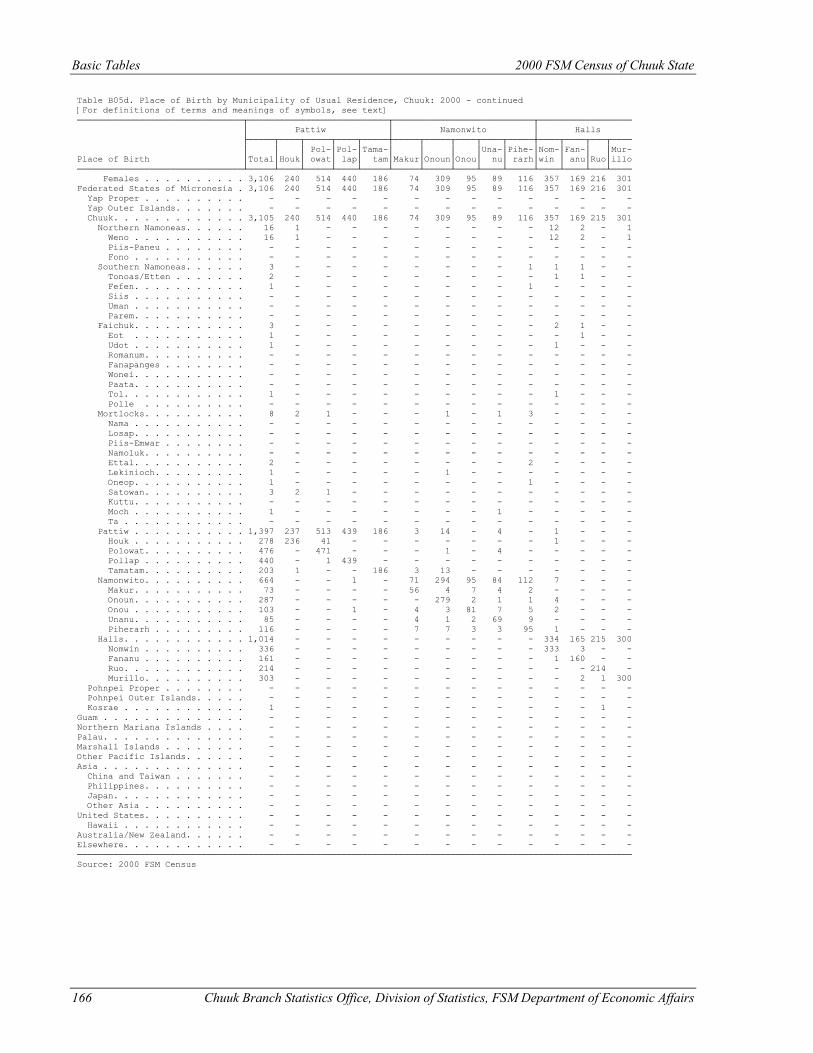
Basic Tables 2000 FSM Census of Chuuk State
166 Chuuk Branch Statistics Office, Division of Statistics, FSM Department of Economic Affairs
Table B05d. Place of Birth by Municipality of Usual Residence, Chuuk: 2000 - continued [For definitions of terms and meanings of symbols, see text] ────────────────────────────────┬───────────────────────────┬───────────────────────────┬────────────────── │ Pattiw │ Namonwito │ Halls ├─────┬────┬─────┬────┬─────┼─────┬─────┬────┬────┬─────┼────┬────┬───┬──── │ │ │ Pol-│Pol-│Tama-│ │ │ │Una-│Pihe-│Nom-│Fan-│ │Mur- Place of Birth │Total│Houk│ owat│ lap│ tam│Makur│Onoun│Onou│ nu│ rarh│win │ anu│Ruo│illo ────────────────────────────────┴─────┴────┴─────┴────┴─────┴─────┴─────┴────┴────┴─────┴────┴────┴───┴──── Females . . . . . . . . . . 3,106 240 514 440 186 74 309 95 89 116 357 169 216 301 Federated States of Micronesia . 3,106 240 514 440 186 74 309 95 89 116 357 169 216 301 Yap Proper . . . . . . . . . . - - - - - - - - - - - - - - Yap Outer Islands. . . . . . . - - - - - - - - - - - - - - Chuuk. . . . . . . . . . . . . 3,105 240 514 440 186 74 309 95 89 116 357 169 215 301 Northern Namoneas. . . . . . 16 1 - - - - - - - - 12 2 - 1 Weno . . . . . . . . . . . 16 1 - - - - - - - - 12 2 - 1 Piis-Paneu . . . . . . . . - - - - - - - - - - - - - - Fono . . . . . . . . . . . - - - - - - - - - - - - - - Southern Namoneas. . . . . . 3 - - - - - - - - 1 1 1 - - Tonoas/Etten . . . . . . . 2 - - - - - - - - - 1 1 - - Fefen. . . . . . . . . . . 1 - - - - - - - - 1 - - - - Siis . . . . . . . . . . . - - - - - - - - - - - - - - Uman . . . . . . . . . . . - - - - - - - - - - - - - - Parem. . . . . . . . . . . - - - - - - - - - - - - - - Faichuk. . . . . . . . . . . 3 - - - - - - - - - 2 1 - - Eot . . . . . . . . . . . 1 - - - - - - - - - - 1 - - Udot . . . . . . . . . . . 1 - - - - - - - - - 1 - - - Romanum. . . . . . . . . . - - - - - - - - - - - - - - Fanapanges . . . . . . . . - - - - - - - - - - - - - - Wonei. . . . . . . . . . . - - - - - - - - - - - - - - Paata. . . . . . . . . . . - - - - - - - - - - - - - - Tol. . . . . . . . . . . . 1 - - - - - - - - - 1 - - - Polle . . . . . . . . . . - - - - - - - - - - - - - - Mortlocks. . . . . . . . . . 8 2 1 - - - 1 - 1 3 - - - - Nama . . . . . . . . . . . - - - - - - - - - - - - - - Losap. . . . . . . . . . . - - - - - - - - - - - - - - Piis-Emwar . . . . . . . . - - - - - - - - - - - - - - Namoluk. . . . . . . . . . - - - - - - - - - - - - - - Ettal. . . . . . . . . . . 2 - - - - - - - - 2 - - - - Lekinioch. . . . . . . . . 1 - - - - - 1 - - - - - - - Oneop. . . . . . . . . . . 1 - - - - - - - - 1 - - - - Satowan. . . . . . . . . . 3 2 1 - - - - - - - - - - - Kuttu. . . . . . . . . . . - - - - - - - - - - - - - - Moch . . . . . . . . . . . 1 - - - - - - - 1 - - - - - Ta . . . . . . . . . . . . - - - - - - - - - - - - - - Pattiw . . . . . . . . . . . 1,397 237 513 439 186 3 14 - 4 - 1 - - - Houk . . . . . . . . . . . 278 236 41 - - - - - - - 1 - - - Polowat. . . . . . . . . . 476 - 471 - - - 1 - 4 - - - - - Pollap . . . . . . . . . . 440 - 1 439 - - - - - - - - - - Tamatam. . . . . . . . . . 203 1 - - 186 3 13 - - - - - - - Namonwito. . . . . . . . . . 664 - - 1 - 71 294 95 84 112 7 - - - Makur. . . . . . . . . . . 73 - - - - 56 4 7 4 2 - - - - Onoun. . . . . . . . . . . 287 - - - - - 279 2 1 1 4 - - - Onou . . . . . . . . . . . 103 - - 1 - 4 3 81 7 5 2 - - - Unanu. . . . . . . . . . . 85 - - - - 4 1 2 69 9 - - - - Piherarh . . . . . . . . . 116 - - - - 7 7 3 3 95 1 - - - Halls. . . . . . . . . . . . 1,014 - - - - - - - - - 334 165 215 300 Nomwin . . . . . . . . . . 336 - - - - - - - - - 333 3 - - Fananu . . . . . . . . . . 161 - - - - - - - - - 1 160 - - Ruo. . . . . . . . . . . . 214 - - - - - - - - - - - 214 - Murillo. . . . . . . . . . 303 - - - - - - - - - - 2 1 300 Pohnpei Proper . . . . . . . . - - - - - - - - - - - - - - Pohnpei Outer Islands. . . . . - - - - - - - - - - - - - - Kosrae . . . . . . . . . . . . 1 - - - - - - - - - - - 1 - Guam . . . . . . . . . . . . . . - - - - - - - - - - - - - - Northern Mariana Islands . . . . - - - - - - - - - - - - - - Palau. . . . . . . . . . . . . . - - - - - - - - - - - - - - Marshall Islands . . . . . . . . - - - - - - - - - - - - - - Other Pacific Islands. . . . . . - - - - - - - - - - - - - - Asia . . . . . . . . . . . . . . - - - - - - - - - - - - - - China and Taiwan . . . . . . . - - - - - - - - - - - - - - Philippines. . . . . . . . . . - - - - - - - - - - - - - - Japan. . . . . . . . . . . . . - - - - - - - - - - - - - - Other Asia . . . . . . . . . . - - - - - - - - - - - - - - United States. . . . . . . . . . - - - - - - - - - - - - - - Hawaii . . . . . . . . . . . . - - - - - - - - - - - - - - Australia/New Zealand. . . . . . - - - - - - - - - - - - - - Elsewhere. . . . . . . . . . . . - - - - - - - - - - - - - - ─────────────────────────────────────────────────────────────────────────────────────────────────────────── Source: 2000 FSM Census
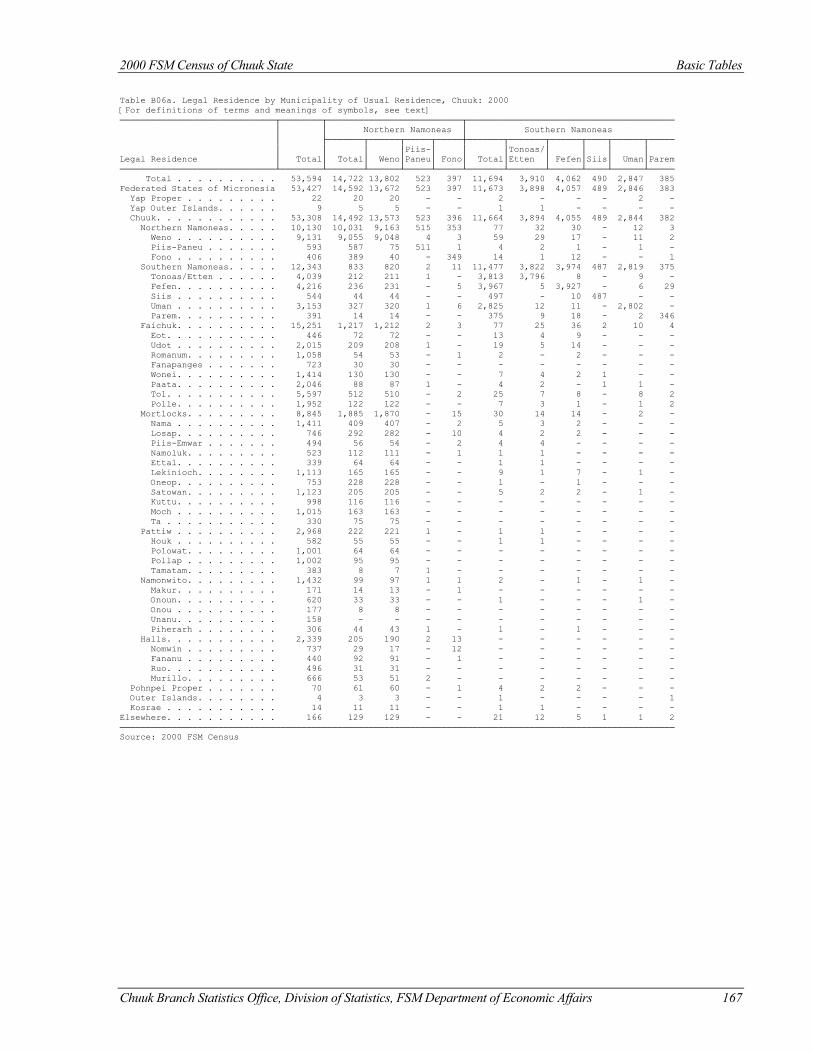
2000 FSM Census of Chuuk State Basic Tables
Chuuk Branch Statistics Office, Division of Statistics, FSM Department of Economic Affairs 167
Table B06a. Legal Residence by Municipality of Usual Residence, Chuuk: 2000 [For definitions of terms and meanings of symbols, see text] ──────────────────────────────┬────────┬──────────────────────────┬──────────────────────────────────────── │ │ Northern Namoneas │ Southern Namoneas │ ├───────┬──────┬─────┬─────┼───────┬───────┬──────┬────┬──────┬───── │ │ │ │Piis-│ │ │Tonoas/│ │ │ │ Legal Residence │ Total│ Total│ Weno│Paneu│ Fono│ Total│Etten │ Fefen│Siis│ Uman│Parem ──────────────────────────────┴────────┴───────┴──────┴─────┴─────┴───────┴───────┴──────┴────┴──────┴───── Total . . . . . . . . . . 53,594 14,722 13,802 523 397 11,694 3,910 4,062 490 2,847 385 Federated States of Micronesia 53,427 14,592 13,672 523 397 11,673 3,898 4,057 489 2,846 383 Yap Proper . . . . . . . . . 22 20 20 - - 2 - - - 2 - Yap Outer Islands. . . . . . 9 5 5 - - 1 1 - - - - Chuuk. . . . . . . . . . . . 53,308 14,492 13,573 523 396 11,664 3,894 4,055 489 2,844 382 Northern Namoneas. . . . . 10,130 10,031 9,163 515 353 77 32 30 - 12 3 Weno . . . . . . . . . . 9,131 9,055 9,048 4 3 59 29 17 - 11 2 Piis-Paneu . . . . . . . 593 587 75 511 1 4 2 1 - 1 - Fono . . . . . . . . . . 406 389 40 - 349 14 1 12 - - 1 Southern Namoneas. . . . . 12,343 833 820 2 11 11,477 3,822 3,974 487 2,819 375 Tonoas/Etten . . . . . . 4,039 212 211 1 - 3,813 3,796 8 - 9 - Fefen. . . . . . . . . . 4,216 236 231 - 5 3,967 5 3,927 - 6 29 Siis . . . . . . . . . . 544 44 44 - - 497 - 10 487 - - Uman . . . . . . . . . . 3,153 327 320 1 6 2,825 12 11 - 2,802 - Parem. . . . . . . . . . 391 14 14 - - 375 9 18 - 2 346 Faichuk. . . . . . . . . . 15,251 1,217 1,212 2 3 77 25 36 2 10 4 Eot. . . . . . . . . . . 446 72 72 - - 13 4 9 - - - Udot . . . . . . . . . . 2,015 209 208 1 - 19 5 14 - - - Romanum. . . . . . . . . 1,058 54 53 - 1 2 - 2 - - - Fanapanges . . . . . . . 723 30 30 - - - - - - - - Wonei. . . . . . . . . . 1,414 130 130 - - 7 4 2 1 - - Paata. . . . . . . . . . 2,046 88 87 1 - 4 2 - 1 1 - Tol. . . . . . . . . . . 5,597 512 510 - 2 25 7 8 - 8 2 Polle. . . . . . . . . . 1,952 122 122 - - 7 3 1 - 1 2 Mortlocks. . . . . . . . . 8,845 1,885 1,870 - 15 30 14 14 - 2 - Nama . . . . . . . . . . 1,411 409 407 - 2 5 3 2 - - - Losap. . . . . . . . . . 746 292 282 - 10 4 2 2 - - - Piis-Emwar . . . . . . . 494 56 54 - 2 4 4 - - - - Namoluk. . . . . . . . . 523 112 111 - 1 1 1 - - - - Ettal. . . . . . . . . . 339 64 64 - - 1 1 - - - - Lekinioch. . . . . . . . 1,113 165 165 - - 9 1 7 - 1 - Oneop. . . . . . . . . . 753 228 228 - - 1 - 1 - - - Satowan. . . . . . . . . 1,123 205 205 - - 5 2 2 - 1 - Kuttu. . . . . . . . . . 998 116 116 - - - - - - - - Moch . . . . . . . . . . 1,015 163 163 - - - - - - - - Ta . . . . . . . . . . . 330 75 75 - - - - - - - - Pattiw . . . . . . . . . . 2,968 222 221 1 - 1 1 - - - - Houk . . . . . . . . . . 582 55 55 - - 1 1 - - - - Polowat. . . . . . . . . 1,001 64 64 - - - - - - - - Pollap . . . . . . . . . 1,002 95 95 - - - - - - - - Tamatam. . . . . . . . . 383 8 7 1 - - - - - - - Namonwito. . . . . . . . . 1,432 99 97 1 1 2 - 1 - 1 - Makur. . . . . . . . . . 171 14 13 - 1 - - - - - - Onoun. . . . . . . . . . 620 33 33 - - 1 - - - 1 - Onou . . . . . . . . . . 177 8 8 - - - - - - - - Unanu. . . . . . . . . . 158 - - - - - - - - - - Piherarh . . . . . . . . 306 44 43 1 - 1 - 1 - - - Halls. . . . . . . . . . . 2,339 205 190 2 13 - - - - - - Nomwin . . . . . . . . . 737 29 17 - 12 - - - - - - Fananu . . . . . . . . . 440 92 91 - 1 - - - - - - Ruo. . . . . . . . . . . 496 31 31 - - - - - - - - Murillo. . . . . . . . . 666 53 51 2 - - - - - - - Pohnpei Proper . . . . . . . 70 61 60 - 1 4 2 2 - - - Outer Islands. . . . . . . . 4 3 3 - - 1 - - - - 1 Kosrae . . . . . . . . . . . 14 11 11 - - 1 1 - - - - Elsewhere. . . . . . . . . . . 166 129 129 - - 21 12 5 1 1 2 ─────────────────────────────────────────────────────────────────────────────────────────────────────────── Source: 2000 FSM Census
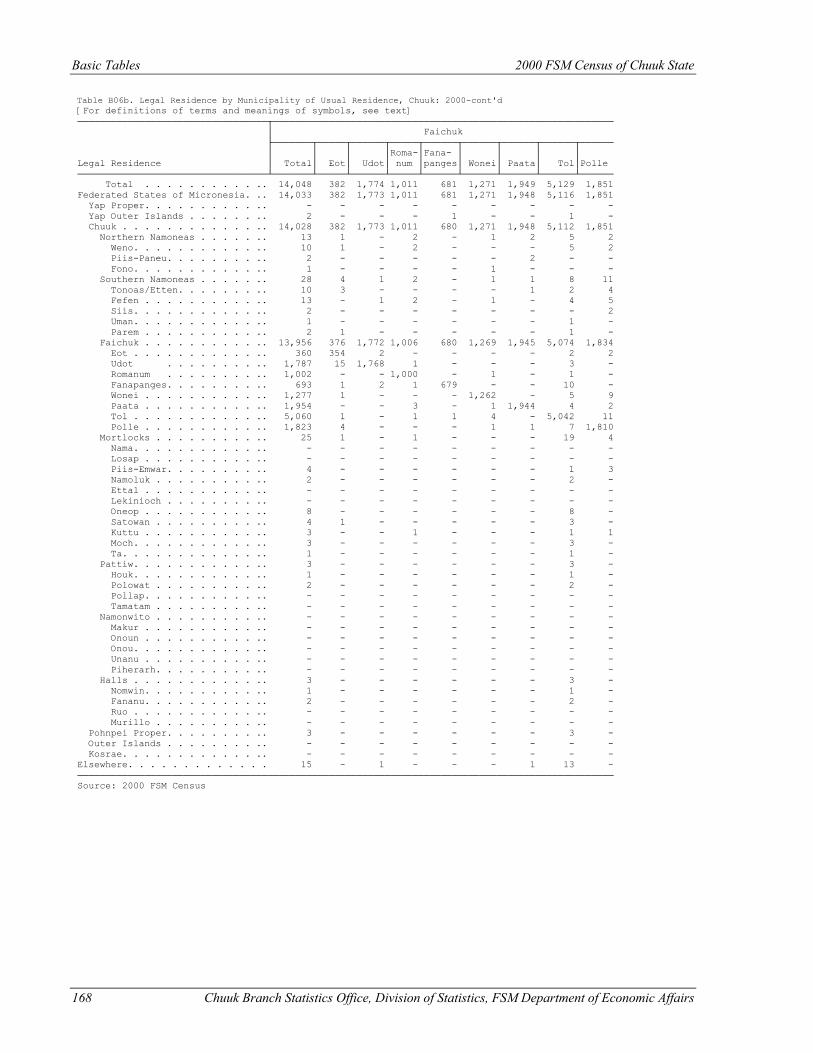
Basic Tables 2000 FSM Census of Chuuk State
168 Chuuk Branch Statistics Office, Division of Statistics, FSM Department of Economic Affairs
Table B06b. Legal Residence by Municipality of Usual Residence, Chuuk: 2000-cont'd [For definitions of terms and meanings of symbols, see text] ──────────────────────────────────┬───────────────────────────────────────────────────────────── │ Faichuk ├───────┬─────┬──────┬─────┬──────┬──────┬──────┬──────┬────── │ │ │ │Roma-│Fana- │ │ │ │ Legal Residence │ Total│ Eot│ Udot│ num │panges│ Wonei│ Paata│ Tol│Polle ──────────────────────────────────┴───────┴─────┴──────┴─────┴──────┴──────┴──────┴──────┴────── Total . . . . . . . . . . .. 14,048 382 1,774 1,011 681 1,271 1,949 5,129 1,851 Federated States of Micronesia. .. 14,033 382 1,773 1,011 681 1,271 1,948 5,116 1,851 Yap Proper. . . . . . . . . . .. - - - - - - - - - Yap Outer Islands . . . . . . .. 2 - - - 1 - - 1 - Chuuk . . . . . . . . . . . . .. 14,028 382 1,773 1,011 680 1,271 1,948 5,112 1,851 Northern Namoneas . . . . . .. 13 1 - 2 - 1 2 5 2 Weno. . . . . . . . . . . .. 10 1 - 2 - - - 5 2 Piis-Paneu. . . . . . . . .. 2 - - - - - 2 - - Fono. . . . . . . . . . . .. 1 - - - - 1 - - - Southern Namoneas . . . . . .. 28 4 1 2 - 1 1 8 11 Tonoas/Etten. . . . . . . .. 10 3 - - - - 1 2 4 Fefen . . . . . . . . . . .. 13 - 1 2 - 1 - 4 5 Siis. . . . . . . . . . . .. 2 - - - - - - - 2 Uman. . . . . . . . . . . .. 1 - - - - - - 1 - Parem . . . . . . . . . . .. 2 1 - - - - - 1 - Faichuk . . . . . . . . . . .. 13,956 376 1,772 1,006 680 1,269 1,945 5,074 1,834 Eot . . . . . . . . . . . .. 360 354 2 - - - - 2 2 Udot . . . . . . . . .. 1,787 15 1,768 1 - - - 3 - Romanum . . . . . . . . .. 1,002 - - 1,000 - 1 - 1 - Fanapanges. . . . . . . . .. 693 1 2 1 679 - - 10 - Wonei . . . . . . . . . . .. 1,277 1 - - - 1,262 - 5 9 Paata . . . . . . . . . . .. 1,954 - - 3 - 1 1,944 4 2 Tol . . . . . . . . . . . .. 5,060 1 - 1 1 4 - 5,042 11 Polle . . . . . . . . . . .. 1,823 4 - - - 1 1 7 1,810 Mortlocks . . . . . . . . . .. 25 1 - 1 - - - 19 4 Nama. . . . . . . . . . . .. - - - - - - - - - Losap . . . . . . . . . . .. - - - - - - - - - Piis-Emwar. . . . . . . . .. 4 - - - - - - 1 3 Namoluk . . . . . . . . . .. 2 - - - - - - 2 - Ettal . . . . . . . . . . .. - - - - - - - - - Lekinioch . . . . . . . . .. - - - - - - - - - Oneop . . . . . . . . . . .. 8 - - - - - - 8 - Satowan . . . . . . . . . .. 4 1 - - - - - 3 - Kuttu . . . . . . . . . . .. 3 - - 1 - - - 1 1 Moch. . . . . . . . . . . .. 3 - - - - - - 3 - Ta. . . . . . . . . . . . .. 1 - - - - - - 1 - Pattiw. . . . . . . . . . . .. 3 - - - - - - 3 - Houk. . . . . . . . . . . .. 1 - - - - - - 1 - Polowat . . . . . . . . . .. 2 - - - - - - 2 - Pollap. . . . . . . . . . .. - - - - - - - - - Tamatam . . . . . . . . . .. - - - - - - - - - Namonwito . . . . . . . . . .. - - - - - - - - - Makur . . . . . . . . . . .. - - - - - - - - - Onoun . . . . . . . . . . .. - - - - - - - - - Onou. . . . . . . . . . . .. - - - - - - - - - Unanu . . . . . . . . . . .. - - - - - - - - - Piherarh. . . . . . . . . .. - - - - - - - - - Halls . . . . . . . . . . . .. 3 - - - - - - 3 - Nomwin. . . . . . . . . . .. 1 - - - - - - 1 - Fananu. . . . . . . . . . .. 2 - - - - - - 2 - Ruo . . . . . . . . . . . .. - - - - - - - - - Murillo . . . . . . . . . .. - - - - - - - - - Pohnpei Proper. . . . . . . . .. 3 - - - - - - 3 - Outer Islands . . . . . . . . .. - - - - - - - - - Kosrae. . . . . . . . . . . . .. - - - - - - - - - Elsewhere. . . . . . . . . . . . . 15 - 1 - - - 1 13 - ──────────────────────────────────────────────────────────────────────────────────────────────── Source: 2000 FSM Census
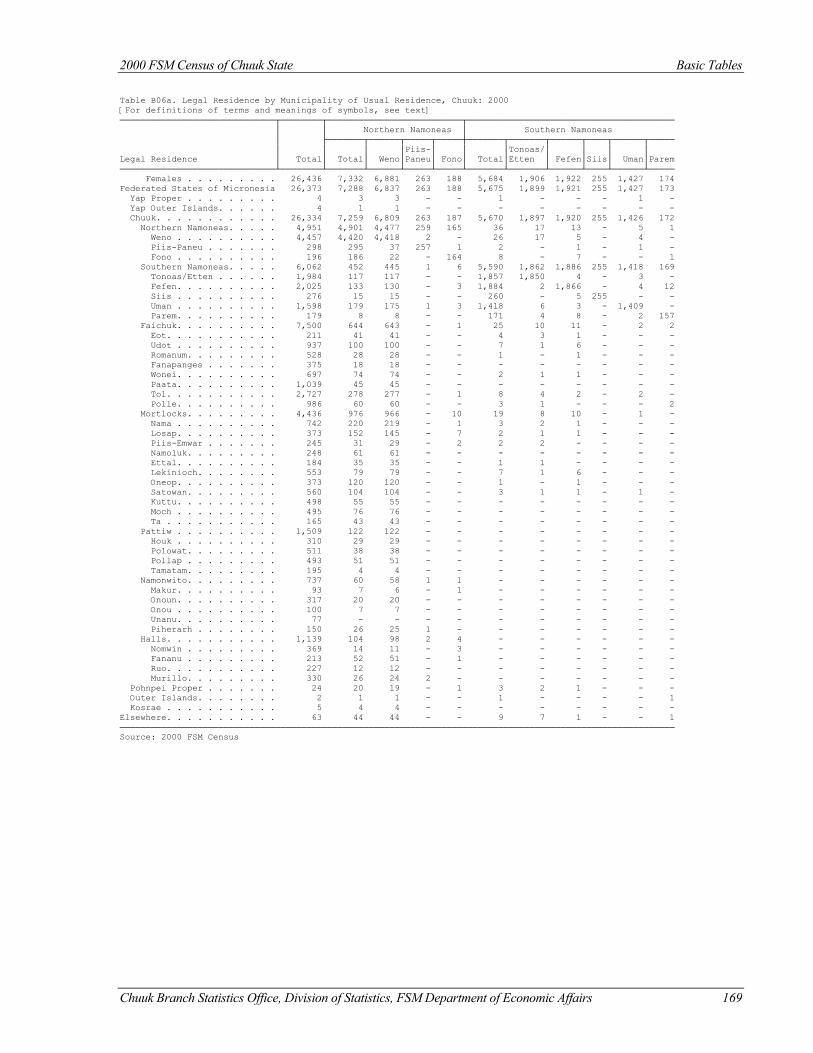
2000 FSM Census of Chuuk State Basic Tables
Chuuk Branch Statistics Office, Division of Statistics, FSM Department of Economic Affairs 169
Table B06a. Legal Residence by Municipality of Usual Residence, Chuuk: 2000 [For definitions of terms and meanings of symbols, see text] ──────────────────────────────┬────────┬──────────────────────────┬──────────────────────────────────────── │ │ Northern Namoneas │ Southern Namoneas │ ├───────┬──────┬─────┬─────┼───────┬───────┬──────┬────┬──────┬───── │ │ │ │Piis-│ │ │Tonoas/│ │ │ │ Legal Residence │ Total│ Total│ Weno│Paneu│ Fono│ Total│Etten │ Fefen│Siis│ Uman│Parem ──────────────────────────────┴────────┴───────┴──────┴─────┴─────┴───────┴───────┴──────┴────┴──────┴───── Females . . . . . . . . . 26,436 7,332 6,881 263 188 5,684 1,906 1,922 255 1,427 174 Federated States of Micronesia 26,373 7,288 6,837 263 188 5,675 1,899 1,921 255 1,427 173 Yap Proper . . . . . . . . . 4 3 3 - - 1 - - - 1 - Yap Outer Islands. . . . . . 4 1 1 - - - - - - - - Chuuk. . . . . . . . . . . . 26,334 7,259 6,809 263 187 5,670 1,897 1,920 255 1,426 172 Northern Namoneas. . . . . 4,951 4,901 4,477 259 165 36 17 13 - 5 1 Weno . . . . . . . . . . 4,457 4,420 4,418 2 - 26 17 5 - 4 - Piis-Paneu . . . . . . . 298 295 37 257 1 2 - 1 - 1 - Fono . . . . . . . . . . 196 186 22 - 164 8 - 7 - - 1 Southern Namoneas. . . . . 6,062 452 445 1 6 5,590 1,862 1,886 255 1,418 169 Tonoas/Etten . . . . . . 1,984 117 117 - - 1,857 1,850 4 - 3 - Fefen. . . . . . . . . . 2,025 133 130 - 3 1,884 2 1,866 - 4 12 Siis . . . . . . . . . . 276 15 15 - - 260 - 5 255 - - Uman . . . . . . . . . . 1,598 179 175 1 3 1,418 6 3 - 1,409 - Parem. . . . . . . . . . 179 8 8 - - 171 4 8 - 2 157 Faichuk. . . . . . . . . . 7,500 644 643 - 1 25 10 11 - 2 2 Eot. . . . . . . . . . . 211 41 41 - - 4 3 1 - - - Udot . . . . . . . . . . 937 100 100 - - 7 1 6 - - - Romanum. . . . . . . . . 528 28 28 - - 1 - 1 - - - Fanapanges . . . . . . . 375 18 18 - - - - - - - - Wonei. . . . . . . . . . 697 74 74 - - 2 1 1 - - - Paata. . . . . . . . . . 1,039 45 45 - - - - - - - - Tol. . . . . . . . . . . 2,727 278 277 - 1 8 4 2 - 2 - Polle. . . . . . . . . . 986 60 60 - - 3 1 - - - 2 Mortlocks. . . . . . . . . 4,436 976 966 - 10 19 8 10 - 1 - Nama . . . . . . . . . . 742 220 219 - 1 3 2 1 - - - Losap. . . . . . . . . . 373 152 145 - 7 2 1 1 - - - Piis-Emwar . . . . . . . 245 31 29 - 2 2 2 - - - - Namoluk. . . . . . . . . 248 61 61 - - - - - - - - Ettal. . . . . . . . . . 184 35 35 - - 1 1 - - - - Lekinioch. . . . . . . . 553 79 79 - - 7 1 6 - - - Oneop. . . . . . . . . . 373 120 120 - - 1 - 1 - - - Satowan. . . . . . . . . 560 104 104 - - 3 1 1 - 1 - Kuttu. . . . . . . . . . 498 55 55 - - - - - - - - Moch . . . . . . . . . . 495 76 76 - - - - - - - - Ta . . . . . . . . . . . 165 43 43 - - - - - - - - Pattiw . . . . . . . . . . 1,509 122 122 - - - - - - - - Houk . . . . . . . . . . 310 29 29 - - - - - - - - Polowat. . . . . . . . . 511 38 38 - - - - - - - - Pollap . . . . . . . . . 493 51 51 - - - - - - - - Tamatam. . . . . . . . . 195 4 4 - - - - - - - - Namonwito. . . . . . . . . 737 60 58 1 1 - - - - - - Makur. . . . . . . . . . 93 7 6 - 1 - - - - - - Onoun. . . . . . . . . . 317 20 20 - - - - - - - - Onou . . . . . . . . . . 100 7 7 - - - - - - - - Unanu. . . . . . . . . . 77 - - - - - - - - - - Piherarh . . . . . . . . 150 26 25 1 - - - - - - - Halls. . . . . . . . . . . 1,139 104 98 2 4 - - - - - - Nomwin . . . . . . . . . 369 14 11 - 3 - - - - - - Fananu . . . . . . . . . 213 52 51 - 1 - - - - - - Ruo. . . . . . . . . . . 227 12 12 - - - - - - - - Murillo. . . . . . . . . 330 26 24 2 - - - - - - - Pohnpei Proper . . . . . . . 24 20 19 - 1 3 2 1 - - - Outer Islands. . . . . . . . 2 1 1 - - 1 - - - - 1 Kosrae . . . . . . . . . . . 5 4 4 - - - - - - - - Elsewhere. . . . . . . . . . . 63 44 44 - - 9 7 1 - - 1 ─────────────────────────────────────────────────────────────────────────────────────────────────────────── Source: 2000 FSM Census
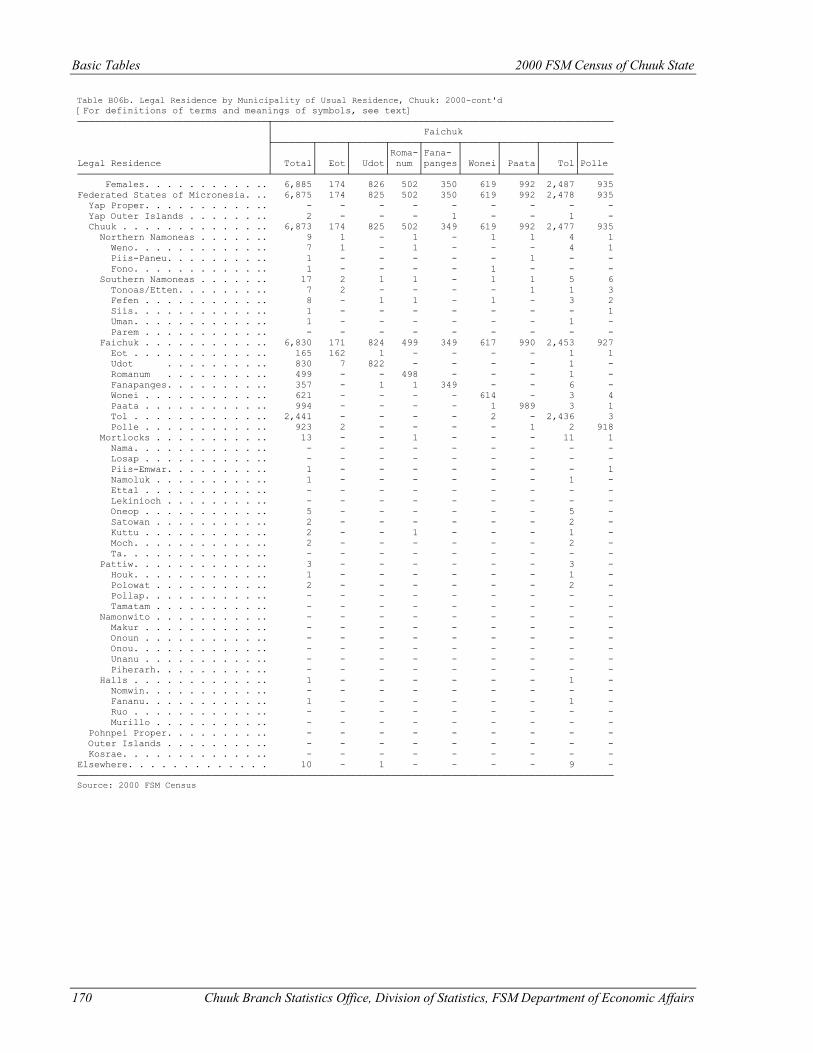
Basic Tables 2000 FSM Census of Chuuk State
170 Chuuk Branch Statistics Office, Division of Statistics, FSM Department of Economic Affairs
Table B06b. Legal Residence by Municipality of Usual Residence, Chuuk: 2000-cont'd [For definitions of terms and meanings of symbols, see text] ──────────────────────────────────┬───────────────────────────────────────────────────────────── │ Faichuk ├───────┬─────┬──────┬─────┬──────┬──────┬──────┬──────┬────── │ │ │ │Roma-│Fana- │ │ │ │ Legal Residence │ Total│ Eot│ Udot│ num │panges│ Wonei│ Paata│ Tol│Polle ──────────────────────────────────┴───────┴─────┴──────┴─────┴──────┴──────┴──────┴──────┴────── Females. . . . . . . . . . .. 6,885 174 826 502 350 619 992 2,487 935 Federated States of Micronesia. .. 6,875 174 825 502 350 619 992 2,478 935 Yap Proper. . . . . . . . . . .. - - - - - - - - - Yap Outer Islands . . . . . . .. 2 - - - 1 - - 1 - Chuuk . . . . . . . . . . . . .. 6,873 174 825 502 349 619 992 2,477 935 Northern Namoneas . . . . . .. 9 1 - 1 - 1 1 4 1 Weno. . . . . . . . . . . .. 7 1 - 1 - - - 4 1 Piis-Paneu. . . . . . . . .. 1 - - - - - 1 - - Fono. . . . . . . . . . . .. 1 - - - - 1 - - - Southern Namoneas . . . . . .. 17 2 1 1 - 1 1 5 6 Tonoas/Etten. . . . . . . .. 7 2 - - - - 1 1 3 Fefen . . . . . . . . . . .. 8 - 1 1 - 1 - 3 2 Siis. . . . . . . . . . . .. 1 - - - - - - - 1 Uman. . . . . . . . . . . .. 1 - - - - - - 1 - Parem . . . . . . . . . . .. - - - - - - - - - Faichuk . . . . . . . . . . .. 6,830 171 824 499 349 617 990 2,453 927 Eot . . . . . . . . . . . .. 165 162 1 - - - - 1 1 Udot . . . . . . . . .. 830 7 822 - - - - 1 - Romanum . . . . . . . . .. 499 - - 498 - - - 1 - Fanapanges. . . . . . . . .. 357 - 1 1 349 - - 6 - Wonei . . . . . . . . . . .. 621 - - - - 614 - 3 4 Paata . . . . . . . . . . .. 994 - - - - 1 989 3 1 Tol . . . . . . . . . . . .. 2,441 - - - - 2 - 2,436 3 Polle . . . . . . . . . . .. 923 2 - - - - 1 2 918 Mortlocks . . . . . . . . . .. 13 - - 1 - - - 11 1 Nama. . . . . . . . . . . .. - - - - - - - - - Losap . . . . . . . . . . .. - - - - - - - - - Piis-Emwar. . . . . . . . .. 1 - - - - - - - 1 Namoluk . . . . . . . . . .. 1 - - - - - - 1 - Ettal . . . . . . . . . . .. - - - - - - - - - Lekinioch . . . . . . . . .. - - - - - - - - - Oneop . . . . . . . . . . .. 5 - - - - - - 5 - Satowan . . . . . . . . . .. 2 - - - - - - 2 - Kuttu . . . . . . . . . . .. 2 - - 1 - - - 1 - Moch. . . . . . . . . . . .. 2 - - - - - - 2 - Ta. . . . . . . . . . . . .. - - - - - - - - - Pattiw. . . . . . . . . . . .. 3 - - - - - - 3 - Houk. . . . . . . . . . . .. 1 - - - - - - 1 - Polowat . . . . . . . . . .. 2 - - - - - - 2 - Pollap. . . . . . . . . . .. - - - - - - - - - Tamatam . . . . . . . . . .. - - - - - - - - - Namonwito . . . . . . . . . .. - - - - - - - - - Makur . . . . . . . . . . .. - - - - - - - - - Onoun . . . . . . . . . . .. - - - - - - - - - Onou. . . . . . . . . . . .. - - - - - - - - - Unanu . . . . . . . . . . .. - - - - - - - - - Piherarh. . . . . . . . . .. - - - - - - - - - Halls . . . . . . . . . . . .. 1 - - - - - - 1 - Nomwin. . . . . . . . . . .. - - - - - - - - - Fananu. . . . . . . . . . .. 1 - - - - - - 1 - Ruo . . . . . . . . . . . .. - - - - - - - - - Murillo . . . . . . . . . .. - - - - - - - - - Pohnpei Proper. . . . . . . . .. - - - - - - - - - Outer Islands . . . . . . . . .. - - - - - - - - - Kosrae. . . . . . . . . . . . .. - - - - - - - - - Elsewhere. . . . . . . . . . . . . 10 - 1 - - - - 9 - ──────────────────────────────────────────────────────────────────────────────────────────────── Source: 2000 FSM Census

2000 FSM Census of Chuuk State Basic Tables
Chuuk Branch Statistics Office, Division of Statistics, FSM Department of Economic Affairs 171
Table B06c. Legal Residence by Municipality of Usual Residence, Chuuk: 2000 - cont'd [For definitions of terms and meanings of symbols, see text] ──────────────────────────────┬─────────────────────────────────────────────────────────────────────── │ Mortlocks ├─────┬─────┬─────┬─────┬─────┬─────┬─────┬─────┬─────┬─────┬─────┬───── │ │ │ │Piis-│Namo-│ │Leki-│ │Sato-│ │ │ Legal Residence │Total│ Nama│Losap│Emwar│ luk │Ettal│nioch│Oneop│ wan │Kuttu│ Moch│ Ta ──────────────────────────────┴─────┴─────┴─────┴─────┴─────┴─────┴─────┴─────┴─────┴─────┴─────┴───── Total . . . . . . . . . . 6,911 995 448 427 407 267 927 505 955 873 854 253 Federated States of Micronesi. 6,911 995 448 427 407 267 927 505 955 873 854 253 Yap Proper . . . . . . . . . - - - - - - - - - - - - Yap Outer Islands. . . . . . 1 1 - - - - - - - - - - Chuuk. . . . . . . . . . . . 6,908 994 448 427 407 267 927 505 955 871 854 253 Northern Namoneas. . . . . 3 - - - - - - 1 1 - - 1 Weno . . . . . . . . . . 3 - - - - - - 1 1 - - 1 Piis-Paneu . . . . . . . - - - - - - - - - - - - Fono . . . . . . . . . . - - - - - - - - - - - - Southern Namoneas. . . . . 3 - - - - 1 1 1 - - - - Tonoas/Etten . . . . . . 2 - - - - 1 - 1 - - - - Fefen. . . . . . . . . . - - - - - - - - - - - - Siis . . . . . . . . . . 1 - - - - - 1 - - - - - Uman . . . . . . . . . . - - - - - - - - - - - - Parem. . . . . . . . . . - - - - - - - - - - - - Faichuk. . . . . . . . . . - - - - - - - - - - - - Eot. . . . . . . . . . . - - - - - - - - - - - - Udot . . . . . . . . . . - - - - - - - - - - - - Romanum. . . . . . . . . - - - - - - - - - - - - Fanapanges . . . . . . . - - - - - - - - - - - - Wonei. . . . . . . . . . - - - - - - - - - - - - Paata. . . . . . . . . . - - - - - - - - - - - - Tol. . . . . . . . . . . - - - - - - - - - - - - Polle. . . . . . . . . . - - - - - - - - - - - - Mortlocks. . . . . . . . . 6,901 994 448 427 406 266 926 503 954 871 854 252 Nama . . . . . . . . . . 997 989 - 2 - - 1 - 5 - - - Losap. . . . . . . . . . 450 - 448 - - 1 - - - - 1 - Piis-Emwar . . . . . . . 430 5 - 425 - - - - - - - - Namoluk. . . . . . . . . 408 - - - 405 - - - 3 - - - Ettal. . . . . . . . . . 272 - - - - 265 - - 5 - 2 - Lekinioch. . . . . . . . 939 - - - - - 925 1 12 - 1 - Oneop. . . . . . . . . . 516 - - - 1 - - 502 11 - 2 - Satowan. . . . . . . . . 908 - - - - - - - 907 1 - - Kuttu. . . . . . . . . . 879 - - - - - - - 7 870 2 - Moch . . . . . . . . . . 848 - - - - - - - 2 - 846 - Ta . . . . . . . . . . . 254 - - - - - - - 2 - - 252 Pattiw . . . . . . . . . . 1 - - - 1 - - - - - - - Houk . . . . . . . . . . - - - - - - - - - - - - Polowat. . . . . . . . . - - - - - - - - - - - - Pollap . . . . . . . . . 1 - - - 1 - - - - - - - Tamatam. . . . . . . . . - - - - - - - - - - - - Namonwito. . . . . . . . . - - - - - - - - - - - - Makur. . . . . . . . . . - - - - - - - - - - - - Onoun. . . . . . . . . . - - - - - - - - - - - - Onou . . . . . . . . . . - - - - - - - - - - - - Unanu. . . . . . . . . . - - - - - - - - - - - - Piherarh . . . . . . . . - - - - - - - - - - - - Halls. . . . . . . . . . . - - - - - - - - - - - - Nomwin . . . . . . . . . - - - - - - - - - - - - Fananu . . . . . . . . . - - - - - - - - - - - - Ruo. . . . . . . . . . . - - - - - - - - - - - - Murillo. . . . . . . . . - - - - - - - - - - - - Pohnpei Proper . . . . . . . 2 - - - - - - - - 2 - - Outer Islands. . . . . . . . - - - - - - - - - - - - Kosrae . . . . . . . . . . . - - - - - - - - - - - - Elsewhere. . . . . . . . . . . - - - - - - - - - - - - ────────────────────────────────────────────────────────────────────────────────────────────────────────── Source: 2000 FSM Census
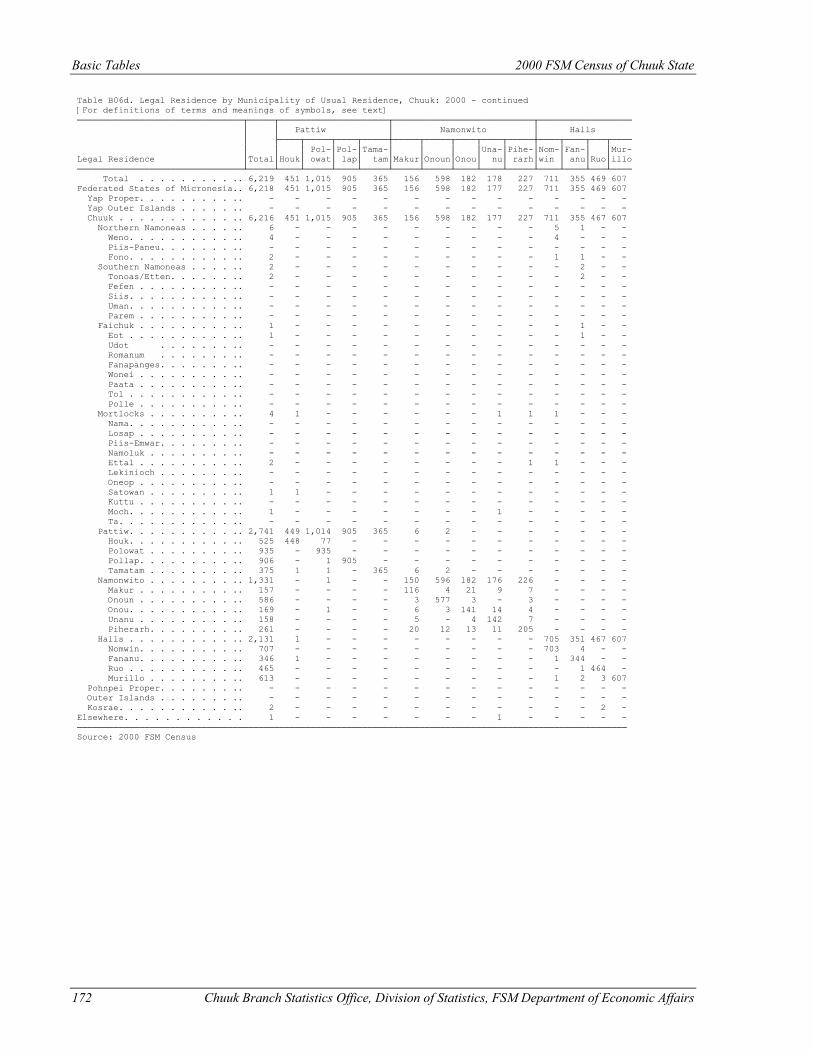
Basic Tables 2000 FSM Census of Chuuk State
172 Chuuk Branch Statistics Office, Division of Statistics, FSM Department of Economic Affairs
Table B06d. Legal Residence by Municipality of Usual Residence, Chuuk: 2000 - continued [For definitions of terms and meanings of symbols, see text] ────────────────────────────────┬─────┬─────────────────────┬───────────────────────────┬────────────────── │ │ Pattiw │ Namonwito │ Halls │ ├────┬─────┬────┬─────┼─────┬─────┬────┬────┬─────┼────┬────┬───┬──── │ │ │ Pol-│Pol-│Tama-│ │ │ │Una-│Pihe-│Nom-│Fan-│ │Mur- Legal Residence │Total│Houk│ owat│ lap│ tam│Makur│Onoun│Onou│ nu│ rarh│win │ anu│Ruo│illo ────────────────────────────────┴─────┴────┴─────┴────┴─────┴─────┴─────┴────┴────┴─────┴────┴────┴───┴──── Total . . . . . . . . . .. 6,219 451 1,015 905 365 156 598 182 178 227 711 355 469 607 Federated States of Micronesia.. 6,218 451 1,015 905 365 156 598 182 177 227 711 355 469 607 Yap Proper. . . . . . . . . .. - - - - - - - - - - - - - - Yap Outer Islands . . . . . .. - - - - - - - - - - - - - - Chuuk . . . . . . . . . . . .. 6,216 451 1,015 905 365 156 598 182 177 227 711 355 467 607 Northern Namoneas . . . . .. 6 - - - - - - - - - 5 1 - - Weno. . . . . . . . . . .. 4 - - - - - - - - - 4 - - - Piis-Paneu. . . . . . . .. - - - - - - - - - - - - - - Fono. . . . . . . . . . .. 2 - - - - - - - - - 1 1 - - Southern Namoneas . . . . .. 2 - - - - - - - - - - 2 - - Tonoas/Etten. . . . . . .. 2 - - - - - - - - - - 2 - - Fefen . . . . . . . . . .. - - - - - - - - - - - - - - Siis. . . . . . . . . . .. - - - - - - - - - - - - - - Uman. . . . . . . . . . .. - - - - - - - - - - - - - - Parem . . . . . . . . . .. - - - - - - - - - - - - - - Faichuk . . . . . . . . . .. 1 - - - - - - - - - - 1 - - Eot . . . . . . . . . . .. 1 - - - - - - - - - - 1 - - Udot . . . . . . . .. - - - - - - - - - - - - - - Romanum . . . . . . . .. - - - - - - - - - - - - - - Fanapanges. . . . . . . .. - - - - - - - - - - - - - - Wonei . . . . . . . . . .. - - - - - - - - - - - - - - Paata . . . . . . . . . .. - - - - - - - - - - - - - - Tol . . . . . . . . . . .. - - - - - - - - - - - - - - Polle . . . . . . . . . .. - - - - - - - - - - - - - - Mortlocks . . . . . . . . .. 4 1 - - - - - - 1 1 1 - - - Nama. . . . . . . . . . .. - - - - - - - - - - - - - - Losap . . . . . . . . . .. - - - - - - - - - - - - - - Piis-Emwar. . . . . . . .. - - - - - - - - - - - - - - Namoluk . . . . . . . . .. - - - - - - - - - - - - - - Ettal . . . . . . . . . .. 2 - - - - - - - - 1 1 - - - Lekinioch . . . . . . . .. - - - - - - - - - - - - - - Oneop . . . . . . . . . .. - - - - - - - - - - - - - - Satowan . . . . . . . . .. 1 1 - - - - - - - - - - - - Kuttu . . . . . . . . . .. - - - - - - - - - - - - - - Moch. . . . . . . . . . .. 1 - - - - - - - 1 - - - - - Ta. . . . . . . . . . . .. - - - - - - - - - - - - - - Pattiw. . . . . . . . . . .. 2,741 449 1,014 905 365 6 2 - - - - - - - Houk. . . . . . . . . . .. 525 448 77 - - - - - - - - - - - Polowat . . . . . . . . .. 935 - 935 - - - - - - - - - - - Pollap. . . . . . . . . .. 906 - 1 905 - - - - - - - - - - Tamatam . . . . . . . . .. 375 1 1 - 365 6 2 - - - - - - - Namonwito . . . . . . . . .. 1,331 - 1 - - 150 596 182 176 226 - - - - Makur . . . . . . . . . .. 157 - - - - 116 4 21 9 7 - - - - Onoun . . . . . . . . . .. 586 - - - - 3 577 3 - 3 - - - - Onou. . . . . . . . . . .. 169 - 1 - - 6 3 141 14 4 - - - - Unanu . . . . . . . . . .. 158 - - - - 5 - 4 142 7 - - - - Piherarh. . . . . . . . .. 261 - - - - 20 12 13 11 205 - - - - Halls . . . . . . . . . . .. 2,131 1 - - - - - - - - 705 351 467 607 Nomwin. . . . . . . . . .. 707 - - - - - - - - - 703 4 - - Fananu. . . . . . . . . .. 346 1 - - - - - - - - 1 344 - - Ruo . . . . . . . . . . .. 465 - - - - - - - - - - 1 464 - Murillo . . . . . . . . .. 613 - - - - - - - - - 1 2 3 607 Pohnpei Proper. . . . . . . .. - - - - - - - - - - - - - - Outer Islands . . . . . . . .. - - - - - - - - - - - - - - Kosrae. . . . . . . . . . . .. 2 - - - - - - - - - - - 2 - Elsewhere. . . . . . . . . . . . 1 - - - - - - - 1 - - - - - ────────────────────────────────────────────────────────────────────────────────────────────────────────── Source: 2000 FSM Census
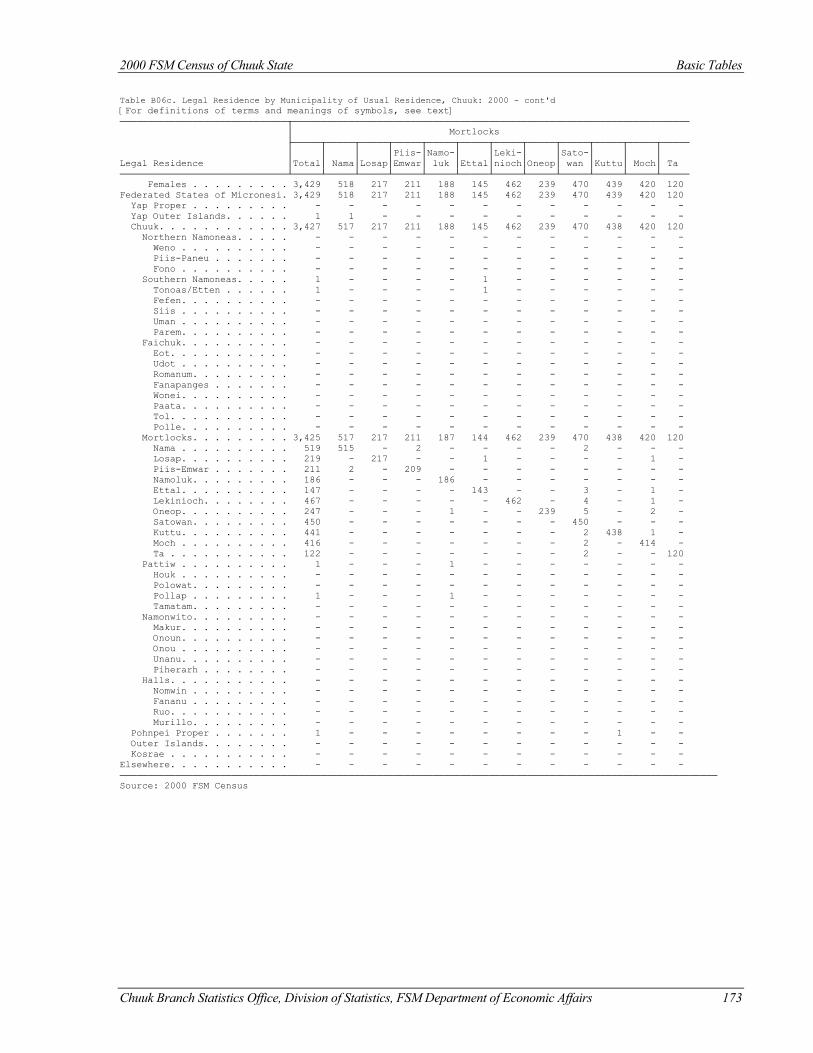
2000 FSM Census of Chuuk State Basic Tables
Chuuk Branch Statistics Office, Division of Statistics, FSM Department of Economic Affairs 173
Table B06c. Legal Residence by Municipality of Usual Residence, Chuuk: 2000 - cont'd [For definitions of terms and meanings of symbols, see text] ──────────────────────────────┬─────────────────────────────────────────────────────────────────────── │ Mortlocks ├─────┬─────┬─────┬─────┬─────┬─────┬─────┬─────┬─────┬─────┬─────┬───── │ │ │ │Piis-│Namo-│ │Leki-│ │Sato-│ │ │ Legal Residence │Total│ Nama│Losap│Emwar│ luk │Ettal│nioch│Oneop│ wan │Kuttu│ Moch│ Ta ──────────────────────────────┴─────┴─────┴─────┴─────┴─────┴─────┴─────┴─────┴─────┴─────┴─────┴───── Females . . . . . . . . . 3,429 518 217 211 188 145 462 239 470 439 420 120 Federated States of Micronesi. 3,429 518 217 211 188 145 462 239 470 439 420 120 Yap Proper . . . . . . . . . - - - - - - - - - - - - Yap Outer Islands. . . . . . 1 1 - - - - - - - - - - Chuuk. . . . . . . . . . . . 3,427 517 217 211 188 145 462 239 470 438 420 120 Northern Namoneas. . . . . - - - - - - - - - - - - Weno . . . . . . . . . . - - - - - - - - - - - - Piis-Paneu . . . . . . . - - - - - - - - - - - - Fono . . . . . . . . . . - - - - - - - - - - - - Southern Namoneas. . . . . 1 - - - - 1 - - - - - - Tonoas/Etten . . . . . . 1 - - - - 1 - - - - - - Fefen. . . . . . . . . . - - - - - - - - - - - - Siis . . . . . . . . . . - - - - - - - - - - - - Uman . . . . . . . . . . - - - - - - - - - - - - Parem. . . . . . . . . . - - - - - - - - - - - - Faichuk. . . . . . . . . . - - - - - - - - - - - - Eot. . . . . . . . . . . - - - - - - - - - - - - Udot . . . . . . . . . . - - - - - - - - - - - - Romanum. . . . . . . . . - - - - - - - - - - - - Fanapanges . . . . . . . - - - - - - - - - - - - Wonei. . . . . . . . . . - - - - - - - - - - - - Paata. . . . . . . . . . - - - - - - - - - - - - Tol. . . . . . . . . . . - - - - - - - - - - - - Polle. . . . . . . . . . - - - - - - - - - - - - Mortlocks. . . . . . . . . 3,425 517 217 211 187 144 462 239 470 438 420 120 Nama . . . . . . . . . . 519 515 - 2 - - - - 2 - - - Losap. . . . . . . . . . 219 - 217 - - 1 - - - - 1 - Piis-Emwar . . . . . . . 211 2 - 209 - - - - - - - - Namoluk. . . . . . . . . 186 - - - 186 - - - - - - - Ettal. . . . . . . . . . 147 - - - - 143 - - 3 - 1 - Lekinioch. . . . . . . . 467 - - - - - 462 - 4 - 1 - Oneop. . . . . . . . . . 247 - - - 1 - - 239 5 - 2 - Satowan. . . . . . . . . 450 - - - - - - - 450 - - - Kuttu. . . . . . . . . . 441 - - - - - - - 2 438 1 - Moch . . . . . . . . . . 416 - - - - - - - 2 - 414 - Ta . . . . . . . . . . . 122 - - - - - - - 2 - - 120 Pattiw . . . . . . . . . . 1 - - - 1 - - - - - - - Houk . . . . . . . . . . - - - - - - - - - - - - Polowat. . . . . . . . . - - - - - - - - - - - - Pollap . . . . . . . . . 1 - - - 1 - - - - - - - Tamatam. . . . . . . . . - - - - - - - - - - - - Namonwito. . . . . . . . . - - - - - - - - - - - - Makur. . . . . . . . . . - - - - - - - - - - - - Onoun. . . . . . . . . . - - - - - - - - - - - - Onou . . . . . . . . . . - - - - - - - - - - - - Unanu. . . . . . . . . . - - - - - - - - - - - - Piherarh . . . . . . . . - - - - - - - - - - - - Halls. . . . . . . . . . . - - - - - - - - - - - - Nomwin . . . . . . . . . - - - - - - - - - - - - Fananu . . . . . . . . . - - - - - - - - - - - - Ruo. . . . . . . . . . . - - - - - - - - - - - - Murillo. . . . . . . . . - - - - - - - - - - - - Pohnpei Proper . . . . . . . 1 - - - - - - - - 1 - - Outer Islands. . . . . . . . - - - - - - - - - - - - Kosrae . . . . . . . . . . . - - - - - - - - - - - - Elsewhere. . . . . . . . . . . - - - - - - - - - - - - ─────────────────────────────────────────────────────────────────────────────────────────────────────────── Source: 2000 FSM Census
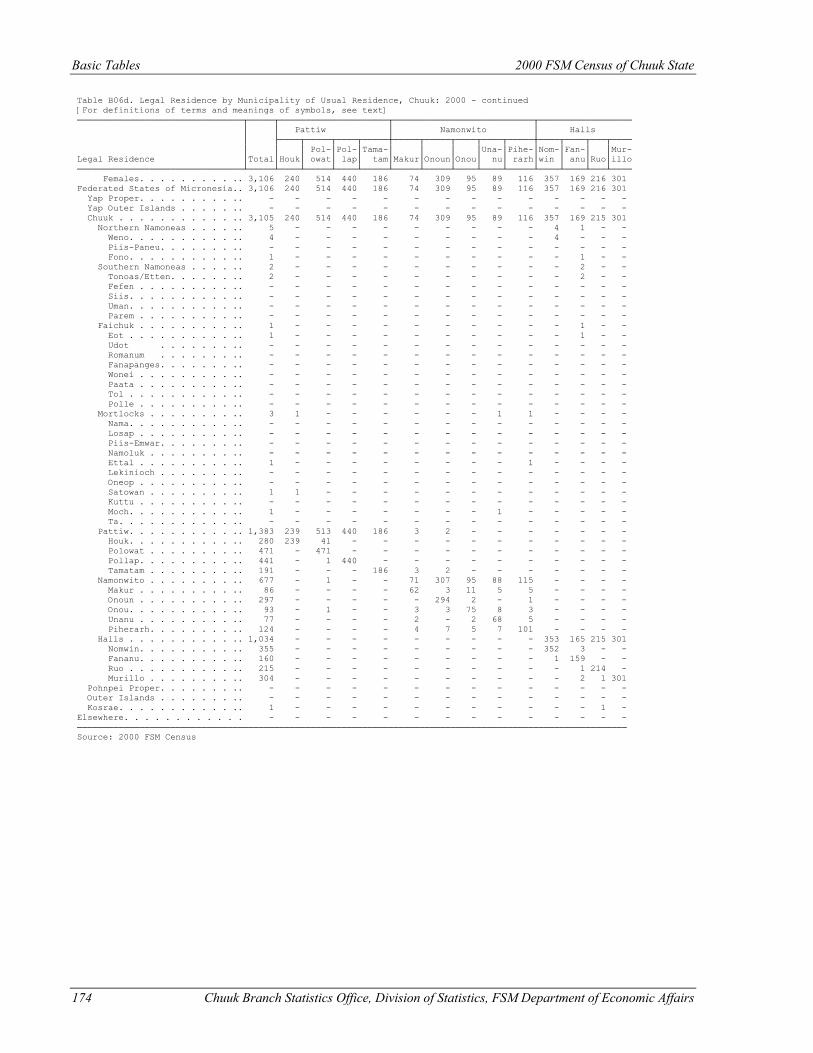
Basic Tables 2000 FSM Census of Chuuk State
174 Chuuk Branch Statistics Office, Division of Statistics, FSM Department of Economic Affairs
Table B06d. Legal Residence by Municipality of Usual Residence, Chuuk: 2000 - continued [For definitions of terms and meanings of symbols, see text] ────────────────────────────────┬─────┬─────────────────────┬───────────────────────────┬────────────────── │ │ Pattiw │ Namonwito │ Halls │ ├────┬─────┬────┬─────┼─────┬─────┬────┬────┬─────┼────┬────┬───┬──── │ │ │ Pol-│Pol-│Tama-│ │ │ │Una-│Pihe-│Nom-│Fan-│ │Mur- Legal Residence │Total│Houk│ owat│ lap│ tam│Makur│Onoun│Onou│ nu│ rarh│win │ anu│Ruo│illo ────────────────────────────────┴─────┴────┴─────┴────┴─────┴─────┴─────┴────┴────┴─────┴────┴────┴───┴──── Females. . . . . . . . . .. 3,106 240 514 440 186 74 309 95 89 116 357 169 216 301 Federated States of Micronesia.. 3,106 240 514 440 186 74 309 95 89 116 357 169 216 301 Yap Proper. . . . . . . . . .. - - - - - - - - - - - - - - Yap Outer Islands . . . . . .. - - - - - - - - - - - - - - Chuuk . . . . . . . . . . . .. 3,105 240 514 440 186 74 309 95 89 116 357 169 215 301 Northern Namoneas . . . . .. 5 - - - - - - - - - 4 1 - - Weno. . . . . . . . . . .. 4 - - - - - - - - - 4 - - - Piis-Paneu. . . . . . . .. - - - - - - - - - - - - - - Fono. . . . . . . . . . .. 1 - - - - - - - - - - 1 - - Southern Namoneas . . . . .. 2 - - - - - - - - - - 2 - - Tonoas/Etten. . . . . . .. 2 - - - - - - - - - - 2 - - Fefen . . . . . . . . . .. - - - - - - - - - - - - - - Siis. . . . . . . . . . .. - - - - - - - - - - - - - - Uman. . . . . . . . . . .. - - - - - - - - - - - - - - Parem . . . . . . . . . .. - - - - - - - - - - - - - - Faichuk . . . . . . . . . .. 1 - - - - - - - - - - 1 - - Eot . . . . . . . . . . .. 1 - - - - - - - - - - 1 - - Udot . . . . . . . .. - - - - - - - - - - - - - - Romanum . . . . . . . .. - - - - - - - - - - - - - - Fanapanges. . . . . . . .. - - - - - - - - - - - - - - Wonei . . . . . . . . . .. - - - - - - - - - - - - - - Paata . . . . . . . . . .. - - - - - - - - - - - - - - Tol . . . . . . . . . . .. - - - - - - - - - - - - - - Polle . . . . . . . . . .. - - - - - - - - - - - - - - Mortlocks . . . . . . . . .. 3 1 - - - - - - 1 1 - - - - Nama. . . . . . . . . . .. - - - - - - - - - - - - - - Losap . . . . . . . . . .. - - - - - - - - - - - - - - Piis-Emwar. . . . . . . .. - - - - - - - - - - - - - - Namoluk . . . . . . . . .. - - - - - - - - - - - - - - Ettal . . . . . . . . . .. 1 - - - - - - - - 1 - - - - Lekinioch . . . . . . . .. - - - - - - - - - - - - - - Oneop . . . . . . . . . .. - - - - - - - - - - - - - - Satowan . . . . . . . . .. 1 1 - - - - - - - - - - - - Kuttu . . . . . . . . . .. - - - - - - - - - - - - - - Moch. . . . . . . . . . .. 1 - - - - - - - 1 - - - - - Ta. . . . . . . . . . . .. - - - - - - - - - - - - - - Pattiw. . . . . . . . . . .. 1,383 239 513 440 186 3 2 - - - - - - - Houk. . . . . . . . . . .. 280 239 41 - - - - - - - - - - - Polowat . . . . . . . . .. 471 - 471 - - - - - - - - - - - Pollap. . . . . . . . . .. 441 - 1 440 - - - - - - - - - - Tamatam . . . . . . . . .. 191 - - - 186 3 2 - - - - - - - Namonwito . . . . . . . . .. 677 - 1 - - 71 307 95 88 115 - - - - Makur . . . . . . . . . .. 86 - - - - 62 3 11 5 5 - - - - Onoun . . . . . . . . . .. 297 - - - - - 294 2 - 1 - - - - Onou. . . . . . . . . . .. 93 - 1 - - 3 3 75 8 3 - - - - Unanu . . . . . . . . . .. 77 - - - - 2 - 2 68 5 - - - - Piherarh. . . . . . . . .. 124 - - - - 4 7 5 7 101 - - - - Halls . . . . . . . . . . .. 1,034 - - - - - - - - - 353 165 215 301 Nomwin. . . . . . . . . .. 355 - - - - - - - - - 352 3 - - Fananu. . . . . . . . . .. 160 - - - - - - - - - 1 159 - - Ruo . . . . . . . . . . .. 215 - - - - - - - - - - 1 214 - Murillo . . . . . . . . .. 304 - - - - - - - - - - 2 1 301 Pohnpei Proper. . . . . . . .. - - - - - - - - - - - - - - Outer Islands . . . . . . . .. - - - - - - - - - - - - - - Kosrae. . . . . . . . . . . .. 1 - - - - - - - - - - - 1 - Elsewhere. . . . . . . . . . . . - - - - - - - - - - - - - - ────────────────────────────────────────────────────────────────────────────────────────────────────────── Source: 2000 FSM Census
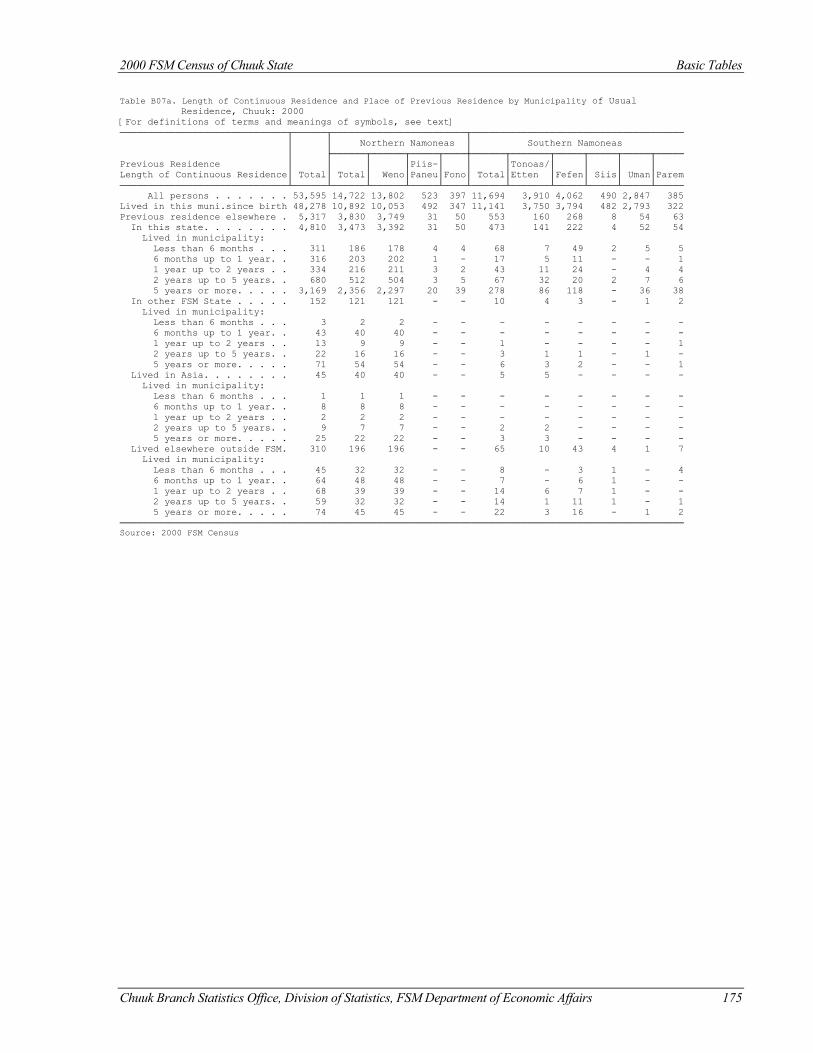
2000 FSM Census of Chuuk State Basic Tables
Chuuk Branch Statistics Office, Division of Statistics, FSM Department of Economic Affairs 175
Table B07a. Length of Continuous Residence and Place of Previous Residence by Municipality of Usual Residence, Chuuk: 2000 [For definitions of terms and meanings of symbols, see text] ──────────────────────────────┬──────┬────────────────────────┬────────────────────────────────────── │ │ Northern Namoneas │ Southern Namoneas │ ├──────┬──────┬─────┬────┼──────┬───────┬─────┬─────┬─────┬───── Previous Residence │ │ │ │Piis-│ │ │Tonoas/│ │ │ │ Length of Continuous Residence│ Total│ Total│ Weno│Paneu│Fono│ Total│Etten │Fefen│ Siis│ Uman│Parem ──────────────────────────────┴──────┴──────┴──────┴─────┴────┴──────┴───────┴─────┴─────┴─────┴───── All persons . . . . . . . 53,595 14,722 13,802 523 397 11,694 3,910 4,062 490 2,847 385 Lived in this muni.since birth 48,278 10,892 10,053 492 347 11,141 3,750 3,794 482 2,793 322 Previous residence elsewhere . 5,317 3,830 3,749 31 50 553 160 268 8 54 63 In this state. . . . . . . . 4,810 3,473 3,392 31 50 473 141 222 4 52 54 Lived in municipality: Less than 6 months . . . 311 186 178 4 4 68 7 49 2 5 5 6 months up to 1 year. . 316 203 202 1 - 17 5 11 - - 1 1 year up to 2 years . . 334 216 211 3 2 43 11 24 - 4 4 2 years up to 5 years. . 680 512 504 3 5 67 32 20 2 7 6 5 years or more. . . . . 3,169 2,356 2,297 20 39 278 86 118 - 36 38 In other FSM State . . . . . 152 121 121 - - 10 4 3 - 1 2 Lived in municipality: Less than 6 months . . . 3 2 2 - - - - - - - - 6 months up to 1 year. . 43 40 40 - - - - - - - - 1 year up to 2 years . . 13 9 9 - - 1 - - - - 1 2 years up to 5 years. . 22 16 16 - - 3 1 1 - 1 - 5 years or more. . . . . 71 54 54 - - 6 3 2 - - 1 Lived in Asia. . . . . . . . 45 40 40 - - 5 5 - - - - Lived in municipality: Less than 6 months . . . 1 1 1 - - - - - - - - 6 months up to 1 year. . 8 8 8 - - - - - - - - 1 year up to 2 years . . 2 2 2 - - - - - - - - 2 years up to 5 years. . 9 7 7 - - 2 2 - - - - 5 years or more. . . . . 25 22 22 - - 3 3 - - - - Lived elsewhere outside FSM. 310 196 196 - - 65 10 43 4 1 7 Lived in municipality: Less than 6 months . . . 45 32 32 - - 8 - 3 1 - 4 6 months up to 1 year. . 64 48 48 - - 7 - 6 1 - - 1 year up to 2 years . . 68 39 39 - - 14 6 7 1 - - 2 years up to 5 years. . 59 32 32 - - 14 1 11 1 - 1 5 years or more. . . . . 74 45 45 - - 22 3 16 - 1 2 ───────────────────────────────────────────────────────────────────────────────────────────────────── Source: 2000 FSM Census
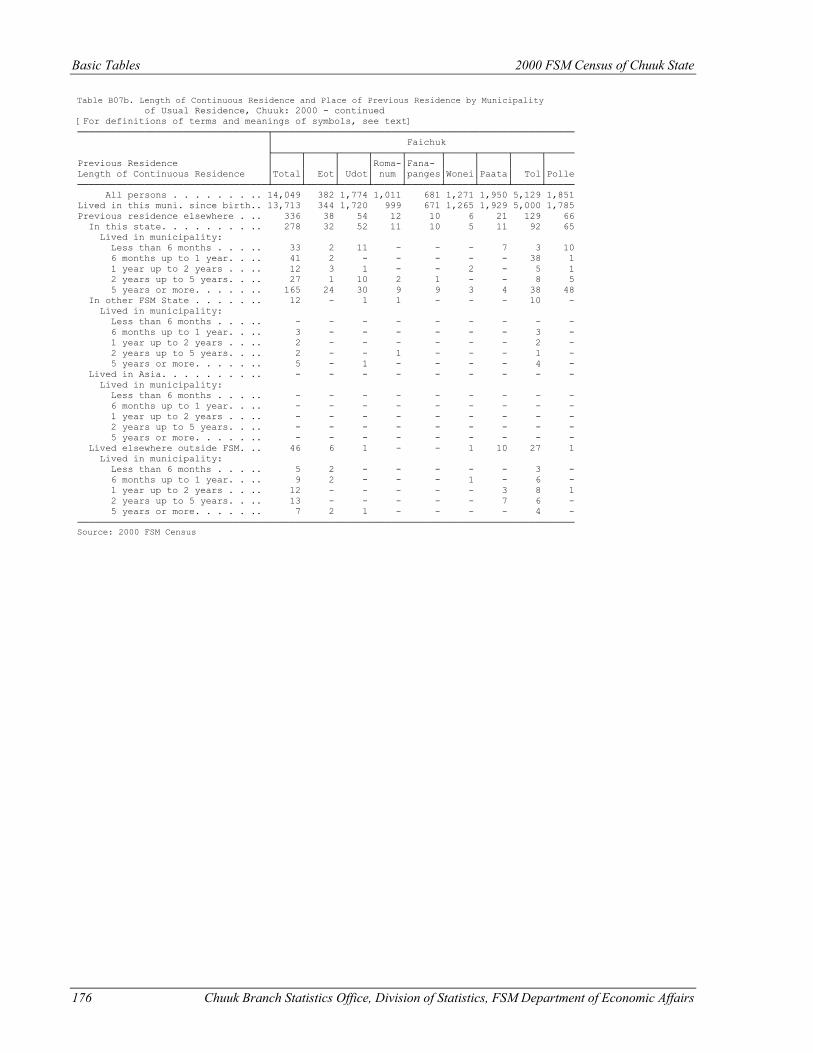
Basic Tables 2000 FSM Census of Chuuk State
176 Chuuk Branch Statistics Office, Division of Statistics, FSM Department of Economic Affairs
Table B07b. Length of Continuous Residence and Place of Previous Residence by Municipality of Usual Residence, Chuuk: 2000 - continued [For definitions of terms and meanings of symbols, see text] ──────────────────────────────────┬────────────────────────────────────────────────────── │ Faichuk ├─────┬─────┬─────┬─────┬──────┬─────┬─────┬─────┬───── Previous Residence │ │ │ │Roma-│Fana- │ │ │ │ Length of Continuous Residence │Total│ Eot│ Udot│ num │panges│Wonei│Paata│ Tol│Polle ──────────────────────────────────┴─────┴─────┴─────┴─────┴──────┴─────┴─────┴─────┴───── All persons . . . . . . . .. 14,049 382 1,774 1,011 681 1,271 1,950 5,129 1,851 Lived in this muni. since birth.. 13,713 344 1,720 999 671 1,265 1,929 5,000 1,785 Previous residence elsewhere . .. 336 38 54 12 10 6 21 129 66 In this state. . . . . . . . .. 278 32 52 11 10 5 11 92 65 Lived in municipality: Less than 6 months . . . .. 33 2 11 - - - 7 3 10 6 months up to 1 year. . .. 41 2 - - - - - 38 1 1 year up to 2 years . . .. 12 3 1 - - 2 - 5 1 2 years up to 5 years. . .. 27 1 10 2 1 - - 8 5 5 years or more. . . . . .. 165 24 30 9 9 3 4 38 48 In other FSM State . . . . . .. 12 - 1 1 - - - 10 - Lived in municipality: Less than 6 months . . . .. - - - - - - - - - 6 months up to 1 year. . .. 3 - - - - - - 3 - 1 year up to 2 years . . .. 2 - - - - - - 2 - 2 years up to 5 years. . .. 2 - - 1 - - - 1 - 5 years or more. . . . . .. 5 - 1 - - - - 4 - Lived in Asia. . . . . . . . .. - - - - - - - - - Lived in municipality: Less than 6 months . . . .. - - - - - - - - - 6 months up to 1 year. . .. - - - - - - - - - 1 year up to 2 years . . .. - - - - - - - - - 2 years up to 5 years. . .. - - - - - - - - - 5 years or more. . . . . .. - - - - - - - - - Lived elsewhere outside FSM. .. 46 6 1 - - 1 10 27 1 Lived in municipality: Less than 6 months . . . .. 5 2 - - - - - 3 - 6 months up to 1 year. . .. 9 2 - - - 1 - 6 - 1 year up to 2 years . . .. 12 - - - - - 3 8 1 2 years up to 5 years. . .. 13 - - - - - 7 6 - 5 years or more. . . . . .. 7 2 1 - - - - 4 - ───────────────────────────────────────────────────────────────────────────────────────── Source: 2000 FSM Census
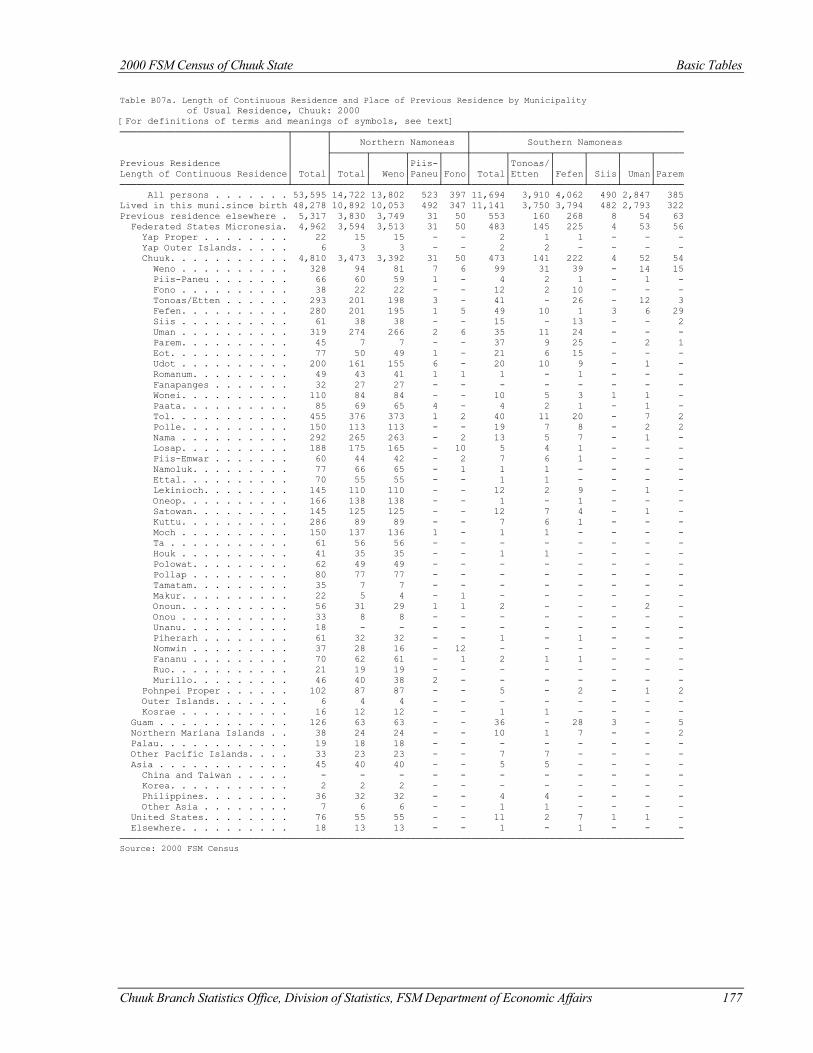
2000 FSM Census of Chuuk State Basic Tables
Chuuk Branch Statistics Office, Division of Statistics, FSM Department of Economic Affairs 177
Table B07a. Length of Continuous Residence and Place of Previous Residence by Municipality of Usual Residence, Chuuk: 2000 [For definitions of terms and meanings of symbols, see text] ──────────────────────────────┬──────┬────────────────────────┬────────────────────────────────────── │ │ Northern Namoneas │ Southern Namoneas │ ├──────┬──────┬─────┬────┼──────┬───────┬─────┬─────┬─────┬───── Previous Residence │ │ │ │Piis-│ │ │Tonoas/│ │ │ │ Length of Continuous Residence│ Total│ Total│ Weno│Paneu│Fono│ Total│Etten │Fefen│ Siis│ Uman│Parem ──────────────────────────────┴──────┴──────┴──────┴─────┴────┴──────┴───────┴─────┴─────┴─────┴───── All persons . . . . . . . 53,595 14,722 13,802 523 397 11,694 3,910 4,062 490 2,847 385 Lived in this muni.since birth 48,278 10,892 10,053 492 347 11,141 3,750 3,794 482 2,793 322 Previous residence elsewhere . 5,317 3,830 3,749 31 50 553 160 268 8 54 63 Federated States Micronesia. 4,962 3,594 3,513 31 50 483 145 225 4 53 56 Yap Proper . . . . . . . . 22 15 15 - - 2 1 1 - - - Yap Outer Islands. . . . . 6 3 3 - - 2 2 - - - - Chuuk. . . . . . . . . . . 4,810 3,473 3,392 31 50 473 141 222 4 52 54 Weno . . . . . . . . . . 328 94 81 7 6 99 31 39 - 14 15 Piis-Paneu . . . . . . . 66 60 59 1 - 4 2 1 - 1 - Fono . . . . . . . . . . 38 22 22 - - 12 2 10 - - - Tonoas/Etten . . . . . . 293 201 198 3 - 41 - 26 - 12 3 Fefen. . . . . . . . . . 280 201 195 1 5 49 10 1 3 6 29 Siis . . . . . . . . . . 61 38 38 - - 15 - 13 - - 2 Uman . . . . . . . . . . 319 274 266 2 6 35 11 24 - - - Parem. . . . . . . . . . 45 7 7 - - 37 9 25 - 2 1 Eot. . . . . . . . . . . 77 50 49 1 - 21 6 15 - - - Udot . . . . . . . . . . 200 161 155 6 - 20 10 9 - 1 - Romanum. . . . . . . . . 49 43 41 1 1 1 - 1 - - - Fanapanges . . . . . . . 32 27 27 - - - - - - - - Wonei. . . . . . . . . . 110 84 84 - - 10 5 3 1 1 - Paata. . . . . . . . . . 85 69 65 4 - 4 2 1 - 1 - Tol. . . . . . . . . . . 455 376 373 1 2 40 11 20 - 7 2 Polle. . . . . . . . . . 150 113 113 - - 19 7 8 - 2 2 Nama . . . . . . . . . . 292 265 263 - 2 13 5 7 - 1 - Losap. . . . . . . . . . 188 175 165 - 10 5 4 1 - - - Piis-Emwar . . . . . . . 60 44 42 - 2 7 6 1 - - - Namoluk. . . . . . . . . 77 66 65 - 1 1 1 - - - - Ettal. . . . . . . . . . 70 55 55 - - 1 1 - - - - Lekinioch. . . . . . . . 145 110 110 - - 12 2 9 - 1 - Oneop. . . . . . . . . . 166 138 138 - - 1 - 1 - - - Satowan. . . . . . . . . 145 125 125 - - 12 7 4 - 1 - Kuttu. . . . . . . . . . 286 89 89 - - 7 6 1 - - - Moch . . . . . . . . . . 150 137 136 1 - 1 1 - - - - Ta . . . . . . . . . . . 61 56 56 - - - - - - - - Houk . . . . . . . . . . 41 35 35 - - 1 1 - - - - Polowat. . . . . . . . . 62 49 49 - - - - - - - - Pollap . . . . . . . . . 80 77 77 - - - - - - - - Tamatam. . . . . . . . . 35 7 7 - - - - - - - - Makur. . . . . . . . . . 22 5 4 - 1 - - - - - - Onoun. . . . . . . . . . 56 31 29 1 1 2 - - - 2 - Onou . . . . . . . . . . 33 8 8 - - - - - - - - Unanu. . . . . . . . . . 18 - - - - - - - - - - Piherarh . . . . . . . . 61 32 32 - - 1 - 1 - - - Nomwin . . . . . . . . . 37 28 16 - 12 - - - - - - Fananu . . . . . . . . . 70 62 61 - 1 2 1 1 - - - Ruo. . . . . . . . . . . 21 19 19 - - - - - - - - Murillo. . . . . . . . . 46 40 38 2 - - - - - - - Pohnpei Proper . . . . . . 102 87 87 - - 5 - 2 - 1 2 Outer Islands. . . . . . . 6 4 4 - - - - - - - - Kosrae . . . . . . . . . . 16 12 12 - - 1 1 - - - - Guam . . . . . . . . . . . . 126 63 63 - - 36 - 28 3 - 5 Northern Mariana Islands . . 38 24 24 - - 10 1 7 - - 2 Palau. . . . . . . . . . . . 19 18 18 - - - - - - - - Other Pacific Islands. . . . 33 23 23 - - 7 7 - - - - Asia . . . . . . . . . . . . 45 40 40 - - 5 5 - - - - China and Taiwan . . . . . - - - - - - - - - - - Korea. . . . . . . . . . . 2 2 2 - - - - - - - - Philippines. . . . . . . . 36 32 32 - - 4 4 - - - - Other Asia . . . . . . . . 7 6 6 - - 1 1 - - - - United States. . . . . . . . 76 55 55 - - 11 2 7 1 1 - Elsewhere. . . . . . . . . . 18 13 13 - - 1 - 1 - - - ───────────────────────────────────────────────────────────────────────────────────────────────────── Source: 2000 FSM Census
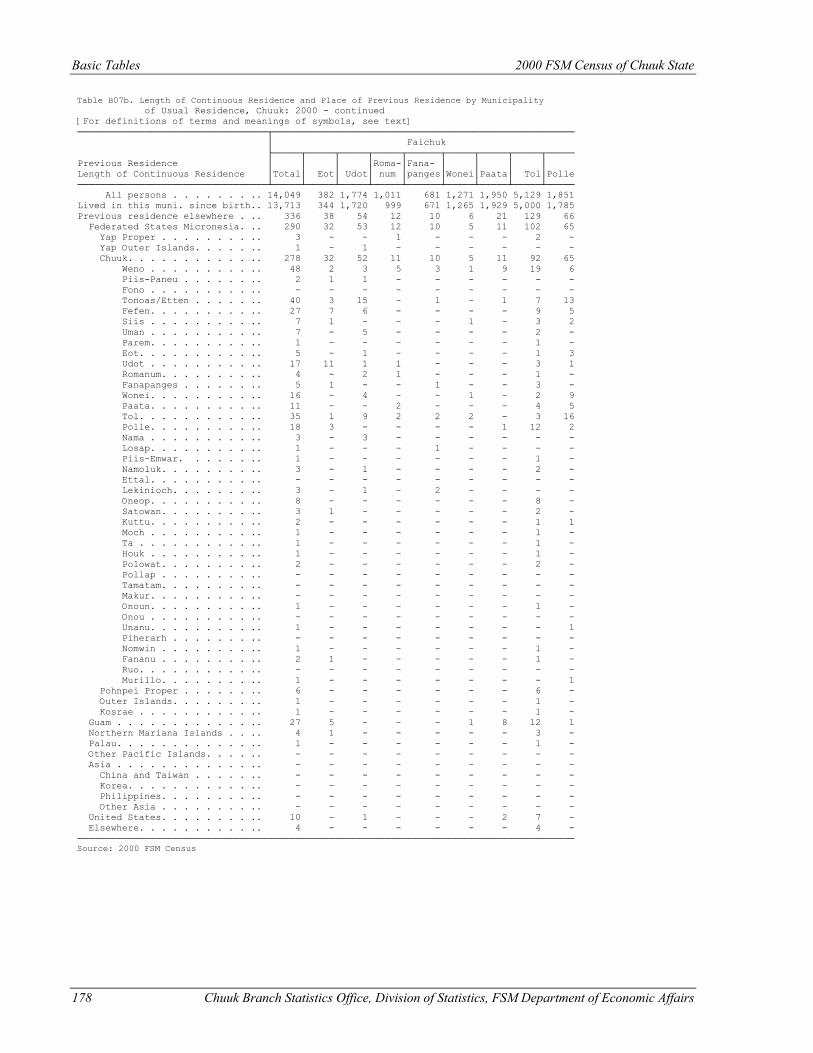
Basic Tables 2000 FSM Census of Chuuk State
178 Chuuk Branch Statistics Office, Division of Statistics, FSM Department of Economic Affairs
Table B07b. Length of Continuous Residence and Place of Previous Residence by Municipality of Usual Residence, Chuuk: 2000 - continued [For definitions of terms and meanings of symbols, see text] ──────────────────────────────────┬────────────────────────────────────────────────────── │ Faichuk ├─────┬─────┬─────┬─────┬──────┬─────┬─────┬─────┬───── Previous Residence │ │ │ │Roma-│Fana- │ │ │ │ Length of Continuous Residence │Total│ Eot│ Udot│ num │panges│Wonei│Paata│ Tol│Polle ──────────────────────────────────┴─────┴─────┴─────┴─────┴──────┴─────┴─────┴─────┴───── All persons . . . . . . . .. 14,049 382 1,774 1,011 681 1,271 1,950 5,129 1,851 Lived in this muni. since birth.. 13,713 344 1,720 999 671 1,265 1,929 5,000 1,785 Previous residence elsewhere . .. 336 38 54 12 10 6 21 129 66 Federated States Micronesia. .. 290 32 53 12 10 5 11 102 65 Yap Proper . . . . . . . . .. 3 - - 1 - - - 2 - Yap Outer Islands. . . . . .. 1 - 1 - - - - - - Chuuk. . . . . . . . . . . .. 278 32 52 11 10 5 11 92 65 Weno . . . . . . . . . .. 48 2 3 5 3 1 9 19 6 Piis-Paneu . . . . . . .. 2 1 1 - - - - - - Fono . . . . . . . . . .. - - - - - - - - - Tonoas/Etten . . . . . .. 40 3 15 - 1 - 1 7 13 Fefen. . . . . . . . . .. 27 7 6 - - - - 9 5 Siis . . . . . . . . . .. 7 1 - - - 1 - 3 2 Uman . . . . . . . . . .. 7 - 5 - - - - 2 - Parem. . . . . . . . . .. 1 - - - - - - 1 - Eot. . . . . . . . . . .. 5 - 1 - - - - 1 3 Udot . . . . . . . . . .. 17 11 1 1 - - - 3 1 Romanum. . . . . . . . .. 4 - 2 1 - - - 1 - Fanapanges . . . . . . .. 5 1 - - 1 - - 3 - Wonei. . . . . . . . . .. 16 - 4 - - 1 - 2 9 Paata. . . . . . . . . .. 11 - - 2 - - - 4 5 Tol. . . . . . . . . . .. 35 1 9 2 2 2 - 3 16 Polle. . . . . . . . . .. 18 3 - - - - 1 12 2 Nama . . . . . . . . . .. 3 - 3 - - - - - - Losap. . . . . . . . . .. 1 - - - 1 - - - - Piis-Emwar. . . . . . .. 1 - - - - - - 1 - Namoluk. . . . . . . . .. 3 - 1 - - - - 2 - Ettal. . . . . . . . . .. - - - - - - - - - Lekinioch. . . . . . . .. 3 - 1 - 2 - - - - Oneop. . . . . . . . . .. 8 - - - - - - 8 - Satowan. . . . . . . . .. 3 1 - - - - - 2 - Kuttu. . . . . . . . . .. 2 - - - - - - 1 1 Moch . . . . . . . . . .. 1 - - - - - - 1 - Ta . . . . . . . . . . .. 1 - - - - - - 1 - Houk . . . . . . . . . .. 1 - - - - - - 1 - Polowat. . . . . . . . .. 2 - - - - - - 2 - Pollap . . . . . . . . .. - - - - - - - - - Tamatam. . . . . . . . .. - - - - - - - - - Makur. . . . . . . . . .. - - - - - - - - - Onoun. . . . . . . . . .. 1 - - - - - - 1 - Onou . . . . . . . . . .. - - - - - - - - - Unanu. . . . . . . . . .. 1 - - - - - - - 1 Piherarh . . . . . . . .. - - - - - - - - - Nomwin . . . . . . . . .. 1 - - - - - - 1 - Fananu . . . . . . . . .. 2 1 - - - - - 1 - Ruo. . . . . . . . . . .. - - - - - - - - - Murillo. . . . . . . . .. 1 - - - - - - - 1 Pohnpei Proper . . . . . . .. 6 - - - - - - 6 - Outer Islands. . . . . . . .. 1 - - - - - - 1 - Kosrae . . . . . . . . . . .. 1 - - - - - - 1 - Guam . . . . . . . . . . . . .. 27 5 - - - 1 8 12 1 Northern Mariana Islands . . .. 4 1 - - - - - 3 - Palau. . . . . . . . . . . . .. 1 - - - - - - 1 - Other Pacific Islands. . . . .. - - - - - - - - - Asia . . . . . . . . . . . . .. - - - - - - - - - China and Taiwan . . . . . .. - - - - - - - - - Korea. . . . . . . . . . . .. - - - - - - - - - Philippines. . . . . . . . .. - - - - - - - - - Other Asia . . . . . . . . .. - - - - - - - - - United States. . . . . . . . .. 10 - 1 - - - 2 7 - Elsewhere. . . . . . . . . . .. 4 - - - - - - 4 - ───────────────────────────────────────────────────────────────────────────────────────── Source: 2000 FSM Census
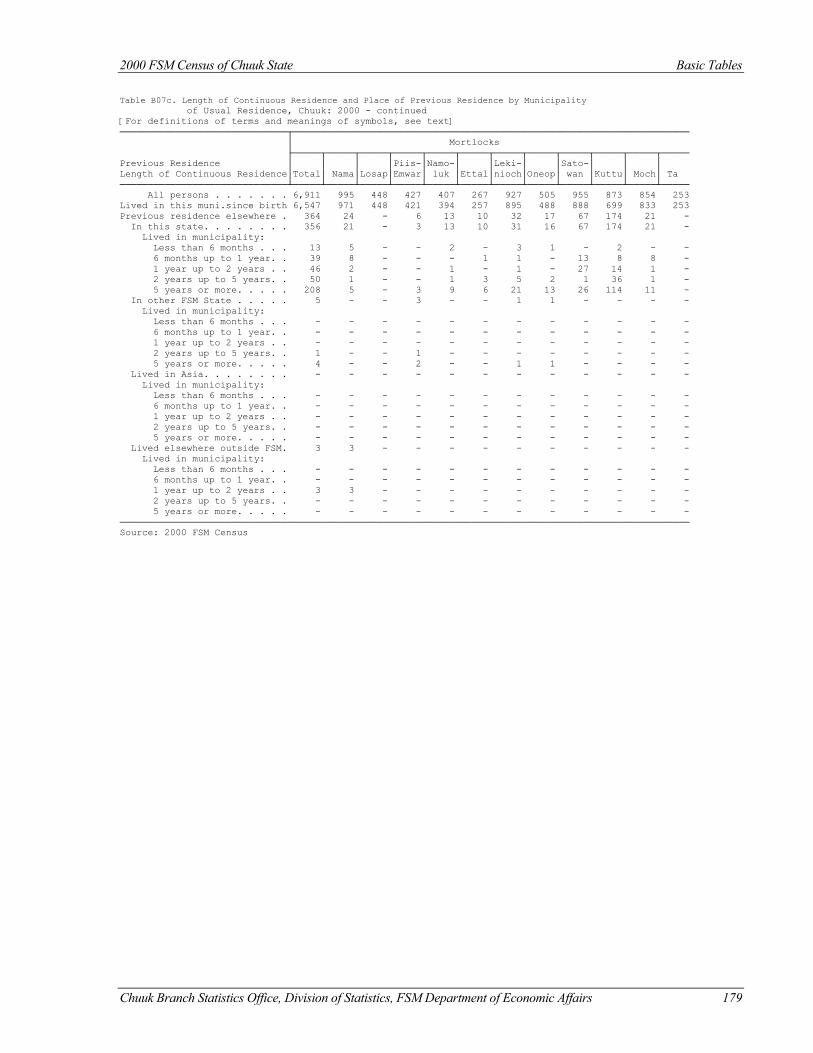
2000 FSM Census of Chuuk State Basic Tables
Chuuk Branch Statistics Office, Division of Statistics, FSM Department of Economic Affairs 179
Table B07c. Length of Continuous Residence and Place of Previous Residence by Municipality of Usual Residence, Chuuk: 2000 - continued [For definitions of terms and meanings of symbols, see text] ──────────────────────────────┬─────────────────────────────────────────────────────────────────────── │ Mortlocks ├─────┬─────┬─────┬─────┬─────┬─────┬─────┬─────┬─────┬─────┬─────┬───── Previous Residence │ │ │ │Piis-│Namo-│ │Leki-│ │Sato-│ │ │ Length of Continuous Residence│Total│ Nama│Losap│Emwar│ luk │Ettal│nioch│Oneop│ wan │Kuttu│ Moch│ Ta ──────────────────────────────┴─────┴─────┴─────┴─────┴─────┴─────┴─────┴─────┴─────┴─────┴─────┴───── All persons . . . . . . . 6,911 995 448 427 407 267 927 505 955 873 854 253 Lived in this muni.since birth 6,547 971 448 421 394 257 895 488 888 699 833 253 Previous residence elsewhere . 364 24 - 6 13 10 32 17 67 174 21 - In this state. . . . . . . . 356 21 - 3 13 10 31 16 67 174 21 - Lived in municipality: Less than 6 months . . . 13 5 - - 2 - 3 1 - 2 - - 6 months up to 1 year. . 39 8 - - - 1 1 - 13 8 8 - 1 year up to 2 years . . 46 2 - - 1 - 1 - 27 14 1 - 2 years up to 5 years. . 50 1 - - 1 3 5 2 1 36 1 - 5 years or more. . . . . 208 5 - 3 9 6 21 13 26 114 11 - In other FSM State . . . . . 5 - - 3 - - 1 1 - - - - Lived in municipality: Less than 6 months . . . - - - - - - - - - - - - 6 months up to 1 year. . - - - - - - - - - - - - 1 year up to 2 years . . - - - - - - - - - - - - 2 years up to 5 years. . 1 - - 1 - - - - - - - - 5 years or more. . . . . 4 - - 2 - - 1 1 - - - - Lived in Asia. . . . . . . . - - - - - - - - - - - - Lived in municipality: Less than 6 months . . . - - - - - - - - - - - - 6 months up to 1 year. . - - - - - - - - - - - - 1 year up to 2 years . . - - - - - - - - - - - - 2 years up to 5 years. . - - - - - - - - - - - - 5 years or more. . . . . - - - - - - - - - - - - Lived elsewhere outside FSM. 3 3 - - - - - - - - - - Lived in municipality: Less than 6 months . . . - - - - - - - - - - - - 6 months up to 1 year. . - - - - - - - - - - - - 1 year up to 2 years . . 3 3 - - - - - - - - - - 2 years up to 5 years. . - - - - - - - - - - - - 5 years or more. . . . . - - - - - - - - - - - - ────────────────────────────────────────────────────────────────────────────────────────────────────── Source: 2000 FSM Census
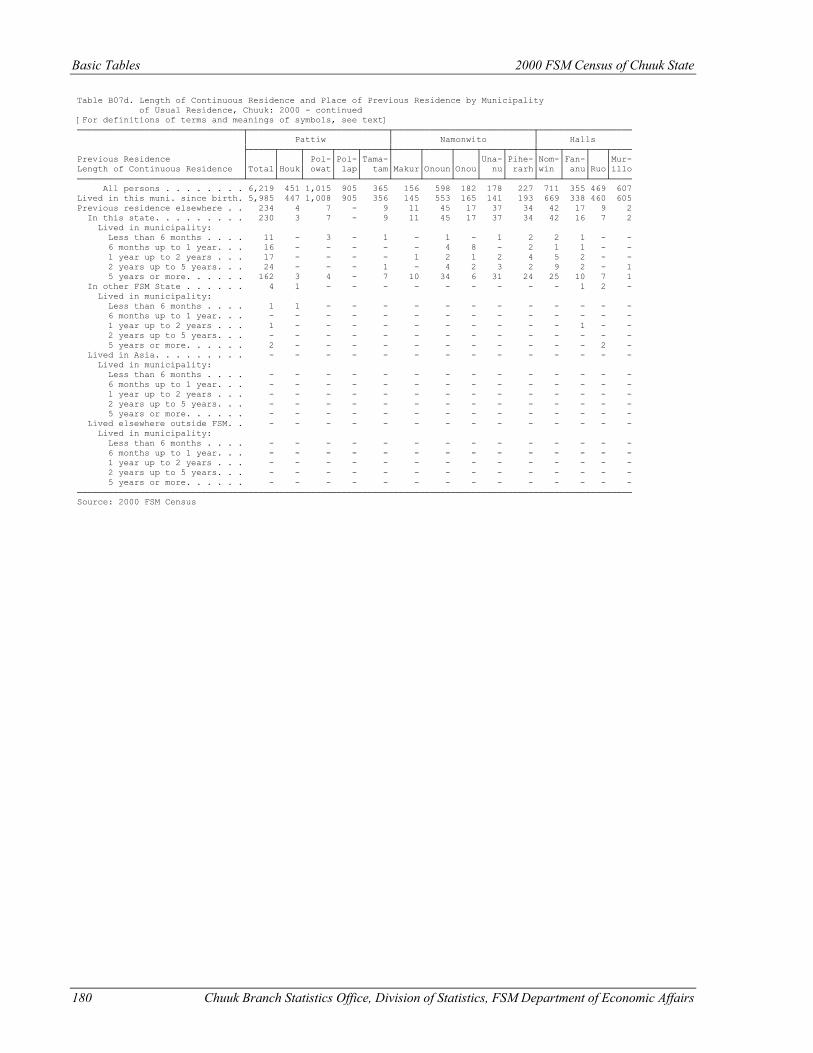
Basic Tables 2000 FSM Census of Chuuk State
180 Chuuk Branch Statistics Office, Division of Statistics, FSM Department of Economic Affairs
Table B07d. Length of Continuous Residence and Place of Previous Residence by Municipality of Usual Residence, Chuuk: 2000 - continued [For definitions of terms and meanings of symbols, see text] ────────────────────────────────┬───────────────────────────┬───────────────────────────┬────────────────── │ Pattiw │ Namonwito │ Halls ├─────┬────┬─────┬────┬─────┼─────┬─────┬────┬────┬─────┼────┬────┬───┬──── Previous Residence │ │ │ Pol-│Pol-│Tama-│ │ │ │Una-│Pihe-│Nom-│Fan-│ │Mur- Length of Continuous Residence │Total│Houk│ owat│ lap│ tam│Makur│Onoun│Onou│ nu│ rarh│win │ anu│Ruo│illo ────────────────────────────────┴─────┴────┴─────┴────┴─────┴─────┴─────┴────┴────┴─────┴────┴────┴───┴──── All persons . . . . . . . . 6,219 451 1,015 905 365 156 598 182 178 227 711 355 469 607 Lived in this muni. since birth. 5,985 447 1,008 905 356 145 553 165 141 193 669 338 460 605 Previous residence elsewhere . . 234 4 7 - 9 11 45 17 37 34 42 17 9 2 In this state. . . . . . . . . 230 3 7 - 9 11 45 17 37 34 42 16 7 2 Lived in municipality: Less than 6 months . . . . 11 - 3 - 1 - 1 - 1 2 2 1 - - 6 months up to 1 year. . . 16 - - - - - 4 8 - 2 1 1 - - 1 year up to 2 years . . . 17 - - - - 1 2 1 2 4 5 2 - - 2 years up to 5 years. . . 24 - - - 1 - 4 2 3 2 9 2 - 1 5 years or more. . . . . . 162 3 4 - 7 10 34 6 31 24 25 10 7 1 In other FSM State . . . . . . 4 1 - - - - - - - - - 1 2 - Lived in municipality: Less than 6 months . . . . 1 1 - - - - - - - - - - - - 6 months up to 1 year. . . - - - - - - - - - - - - - - 1 year up to 2 years . . . 1 - - - - - - - - - - 1 - - 2 years up to 5 years. . . - - - - - - - - - - - - - - 5 years or more. . . . . . 2 - - - - - - - - - - - 2 - Lived in Asia. . . . . . . . . - - - - - - - - - - - - - - Lived in municipality: Less than 6 months . . . . - - - - - - - - - - - - - - 6 months up to 1 year. . . - - - - - - - - - - - - - - 1 year up to 2 years . . . - - - - - - - - - - - - - - 2 years up to 5 years. . . - - - - - - - - - - - - - - 5 years or more. . . . . . - - - - - - - - - - - - - - Lived elsewhere outside FSM. . - - - - - - - - - - - - - - Lived in municipality: Less than 6 months . . . . - - - - - - - - - - - - - - 6 months up to 1 year. . . - - - - - - - - - - - - - - 1 year up to 2 years . . . - - - - - - - - - - - - - - 2 years up to 5 years. . . - - - - - - - - - - - - - - 5 years or more. . . . . . - - - - - - - - - - - - - - ─────────────────────────────────────────────────────────────────────────────────────────────────────────── Source: 2000 FSM Census
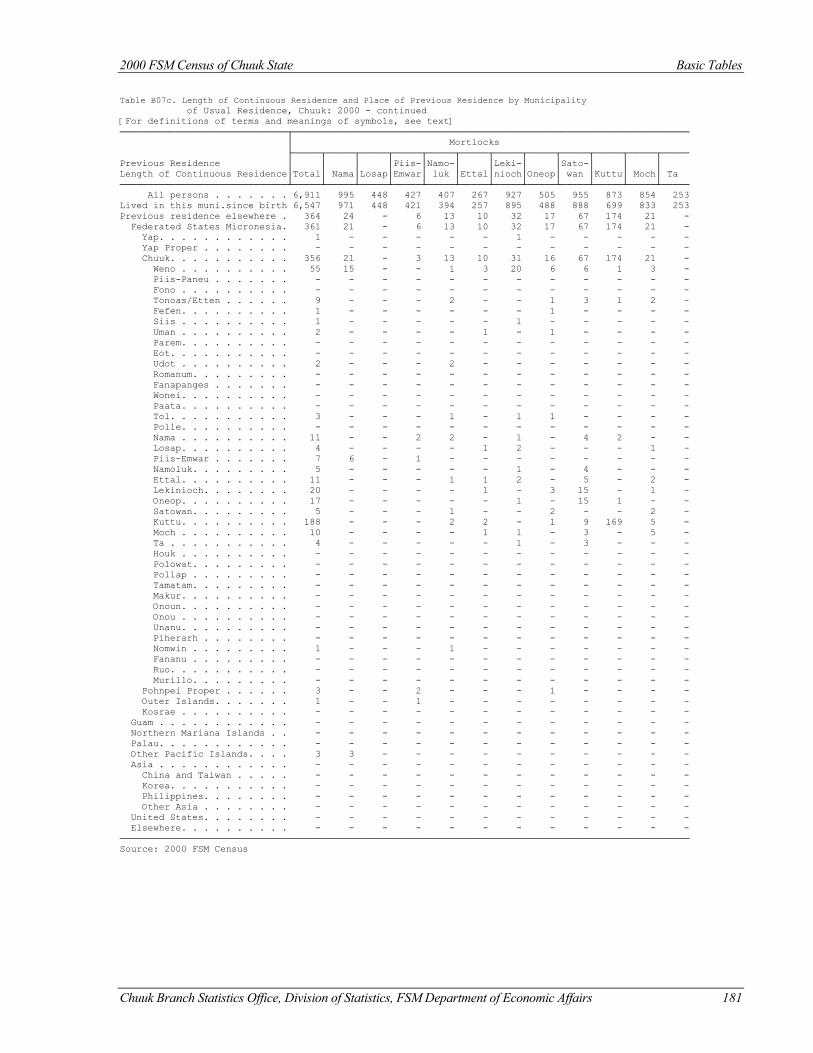
2000 FSM Census of Chuuk State Basic Tables
Chuuk Branch Statistics Office, Division of Statistics, FSM Department of Economic Affairs 181
Table B07c. Length of Continuous Residence and Place of Previous Residence by Municipality of Usual Residence, Chuuk: 2000 - continued [For definitions of terms and meanings of symbols, see text] ──────────────────────────────┬─────────────────────────────────────────────────────────────────────── │ Mortlocks ├─────┬─────┬─────┬─────┬─────┬─────┬─────┬─────┬─────┬─────┬─────┬───── Previous Residence │ │ │ │Piis-│Namo-│ │Leki-│ │Sato-│ │ │ Length of Continuous Residence│Total│ Nama│Losap│Emwar│ luk │Ettal│nioch│Oneop│ wan │Kuttu│ Moch│ Ta ──────────────────────────────┴─────┴─────┴─────┴─────┴─────┴─────┴─────┴─────┴─────┴─────┴─────┴───── All persons . . . . . . . 6,911 995 448 427 407 267 927 505 955 873 854 253 Lived in this muni.since birth 6,547 971 448 421 394 257 895 488 888 699 833 253 Previous residence elsewhere . 364 24 - 6 13 10 32 17 67 174 21 - Federated States Micronesia. 361 21 - 6 13 10 32 17 67 174 21 - Yap. . . . . . . . . . . . 1 - - - - - 1 - - - - - Yap Proper . . . . . . . . - - - - - - - - - - - - Chuuk. . . . . . . . . . . 356 21 - 3 13 10 31 16 67 174 21 - Weno . . . . . . . . . . 55 15 - - 1 3 20 6 6 1 3 - Piis-Paneu . . . . . . . - - - - - - - - - - - - Fono . . . . . . . . . . - - - - - - - - - - - - Tonoas/Etten . . . . . . 9 - - - 2 - - 1 3 1 2 - Fefen. . . . . . . . . . 1 - - - - - - 1 - - - - Siis . . . . . . . . . . 1 - - - - - 1 - - - - - Uman . . . . . . . . . . 2 - - - - 1 - 1 - - - - Parem. . . . . . . . . . - - - - - - - - - - - - Eot. . . . . . . . . . . - - - - - - - - - - - - Udot . . . . . . . . . . 2 - - - 2 - - - - - - - Romanum. . . . . . . . . - - - - - - - - - - - - Fanapanges . . . . . . . - - - - - - - - - - - - Wonei. . . . . . . . . . - - - - - - - - - - - - Paata. . . . . . . . . . - - - - - - - - - - - - Tol. . . . . . . . . . . 3 - - - 1 - 1 1 - - - - Polle. . . . . . . . . . - - - - - - - - - - - - Nama . . . . . . . . . . 11 - - 2 2 - 1 - 4 2 - - Losap. . . . . . . . . . 4 - - - - 1 2 - - - 1 - Piis-Emwar . . . . . . . 7 6 - 1 - - - - - - - - Namoluk. . . . . . . . . 5 - - - - - 1 - 4 - - - Ettal. . . . . . . . . . 11 - - - 1 1 2 - 5 - 2 - Lekinioch. . . . . . . . 20 - - - - 1 - 3 15 - 1 - Oneop. . . . . . . . . . 17 - - - - - 1 - 15 1 - - Satowan. . . . . . . . . 5 - - - 1 - - 2 - - 2 - Kuttu. . . . . . . . . . 188 - - - 2 2 - 1 9 169 5 - Moch . . . . . . . . . . 10 - - - - 1 1 - 3 - 5 - Ta . . . . . . . . . . . 4 - - - - - 1 - 3 - - - Houk . . . . . . . . . . - - - - - - - - - - - - Polowat. . . . . . . . . - - - - - - - - - - - - Pollap . . . . . . . . . - - - - - - - - - - - - Tamatam. . . . . . . . . - - - - - - - - - - - - Makur. . . . . . . . . . - - - - - - - - - - - - Onoun. . . . . . . . . . - - - - - - - - - - - - Onou . . . . . . . . . . - - - - - - - - - - - - Unanu. . . . . . . . . . - - - - - - - - - - - - Piherarh . . . . . . . . - - - - - - - - - - - - Nomwin . . . . . . . . . 1 - - - 1 - - - - - - - Fananu . . . . . . . . . - - - - - - - - - - - - Ruo. . . . . . . . . . . - - - - - - - - - - - - Murillo. . . . . . . . . - - - - - - - - - - - - Pohnpei Proper . . . . . . 3 - - 2 - - - 1 - - - - Outer Islands. . . . . . . 1 - - 1 - - - - - - - - Kosrae . . . . . . . . . . - - - - - - - - - - - - Guam . . . . . . . . . . . . - - - - - - - - - - - - Northern Mariana Islands . . - - - - - - - - - - - - Palau. . . . . . . . . . . . - - - - - - - - - - - - Other Pacific Islands. . . . 3 3 - - - - - - - - - - Asia . . . . . . . . . . . . - - - - - - - - - - - - China and Taiwan . . . . . - - - - - - - - - - - - Korea. . . . . . . . . . . - - - - - - - - - - - - Philippines. . . . . . . . - - - - - - - - - - - - Other Asia . . . . . . . . - - - - - - - - - - - - United States. . . . . . . . - - - - - - - - - - - - Elsewhere. . . . . . . . . . - - - - - - - - - - - - ────────────────────────────────────────────────────────────────────────────────────────────────────── Source: 2000 FSM Census
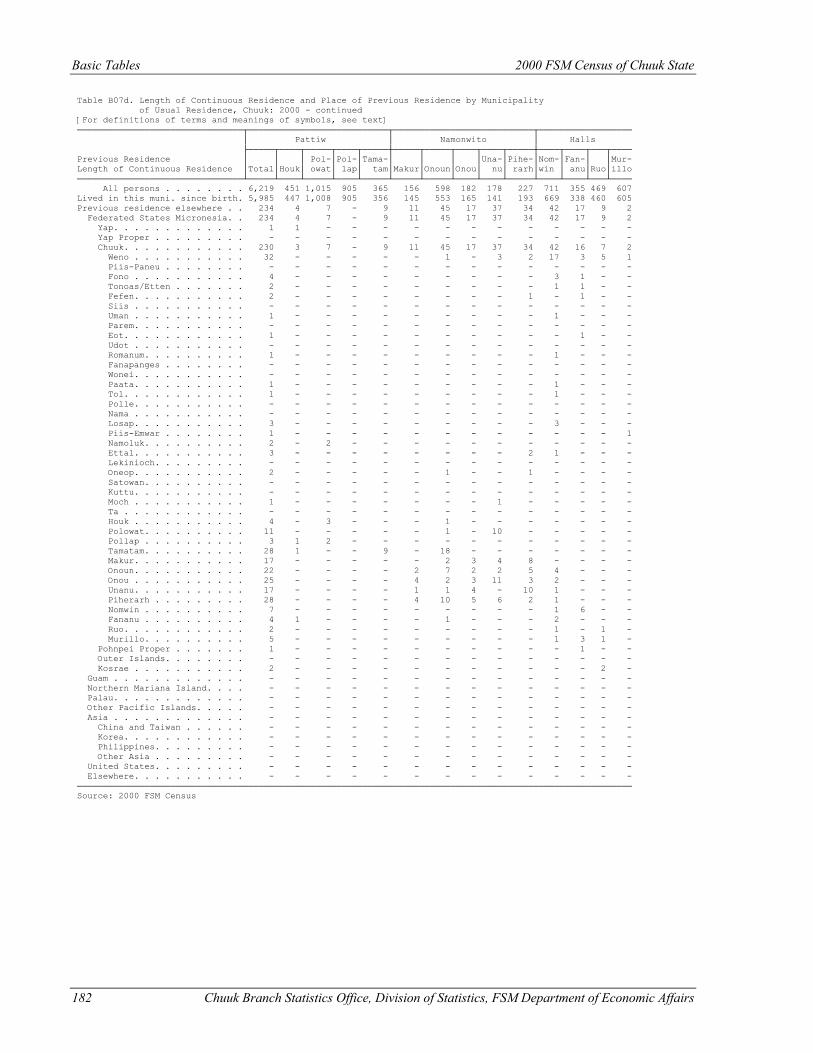
Basic Tables 2000 FSM Census of Chuuk State
182 Chuuk Branch Statistics Office, Division of Statistics, FSM Department of Economic Affairs
Table B07d. Length of Continuous Residence and Place of Previous Residence by Municipality of Usual Residence, Chuuk: 2000 - continued [For definitions of terms and meanings of symbols, see text] ────────────────────────────────┬───────────────────────────┬───────────────────────────┬────────────────── │ Pattiw │ Namonwito │ Halls ├─────┬────┬─────┬────┬─────┼─────┬─────┬────┬────┬─────┼────┬────┬───┬──── Previous Residence │ │ │ Pol-│Pol-│Tama-│ │ │ │Una-│Pihe-│Nom-│Fan-│ │Mur- Length of Continuous Residence │Total│Houk│ owat│ lap│ tam│Makur│Onoun│Onou│ nu│ rarh│win │ anu│Ruo│illo ────────────────────────────────┴─────┴────┴─────┴────┴─────┴─────┴─────┴────┴────┴─────┴────┴────┴───┴──── All persons . . . . . . . . 6,219 451 1,015 905 365 156 598 182 178 227 711 355 469 607 Lived in this muni. since birth. 5,985 447 1,008 905 356 145 553 165 141 193 669 338 460 605 Previous residence elsewhere . . 234 4 7 - 9 11 45 17 37 34 42 17 9 2 Federated States Micronesia. . 234 4 7 - 9 11 45 17 37 34 42 17 9 2 Yap. . . . . . . . . . . . . 1 1 - - - - - - - - - - - - Yap Proper . . . . . . . . . - - - - - - - - - - - - - - Chuuk. . . . . . . . . . . . 230 3 7 - 9 11 45 17 37 34 42 16 7 2 Weno . . . . . . . . . . . 32 - - - - - 1 - 3 2 17 3 5 1 Piis-Paneu . . . . . . . . - - - - - - - - - - - - - - Fono . . . . . . . . . . . 4 - - - - - - - - - 3 1 - - Tonoas/Etten . . . . . . . 2 - - - - - - - - - 1 1 - - Fefen. . . . . . . . . . . 2 - - - - - - - - 1 - 1 - - Siis . . . . . . . . . . . - - - - - - - - - - - - - - Uman . . . . . . . . . . . 1 - - - - - - - - - 1 - - - Parem. . . . . . . . . . . - - - - - - - - - - - - - - Eot. . . . . . . . . . . . 1 - - - - - - - - - - 1 - - Udot . . . . . . . . . . . - - - - - - - - - - - - - - Romanum. . . . . . . . . . 1 - - - - - - - - - 1 - - - Fanapanges . . . . . . . . - - - - - - - - - - - - - - Wonei. . . . . . . . . . . - - - - - - - - - - - - - - Paata. . . . . . . . . . . 1 - - - - - - - - - 1 - - - Tol. . . . . . . . . . . . 1 - - - - - - - - - 1 - - - Polle. . . . . . . . . . . - - - - - - - - - - - - - - Nama . . . . . . . . . . . - - - - - - - - - - - - - - Losap. . . . . . . . . . . 3 - - - - - - - - - 3 - - - Piis-Emwar . . . . . . . . 1 - - - - - - - - - - - - 1 Namoluk. . . . . . . . . . 2 - 2 - - - - - - - - - - - Ettal. . . . . . . . . . . 3 - - - - - - - - 2 1 - - - Lekinioch. . . . . . . . . - - - - - - - - - - - - - - Oneop. . . . . . . . . . . 2 - - - - - 1 - - 1 - - - - Satowan. . . . . . . . . . - - - - - - - - - - - - - - Kuttu. . . . . . . . . . . - - - - - - - - - - - - - - Moch . . . . . . . . . . . 1 - - - - - - - 1 - - - - - Ta . . . . . . . . . . . . - - - - - - - - - - - - - - Houk . . . . . . . . . . . 4 - 3 - - - 1 - - - - - - - Polowat. . . . . . . . . . 11 - - - - - 1 - 10 - - - - - Pollap . . . . . . . . . . 3 1 2 - - - - - - - - - - - Tamatam. . . . . . . . . . 28 1 - - 9 - 18 - - - - - - - Makur. . . . . . . . . . . 17 - - - - - 2 3 4 8 - - - - Onoun. . . . . . . . . . . 22 - - - - 2 7 2 2 5 4 - - - Onou . . . . . . . . . . . 25 - - - - 4 2 3 11 3 2 - - - Unanu. . . . . . . . . . . 17 - - - - 1 1 4 - 10 1 - - - Piherarh . . . . . . . . . 28 - - - - 4 10 5 6 2 1 - - - Nomwin . . . . . . . . . . 7 - - - - - - - - - 1 6 - - Fananu . . . . . . . . . . 4 1 - - - - 1 - - - 2 - - - Ruo. . . . . . . . . . . . 2 - - - - - - - - - 1 - 1 - Murillo. . . . . . . . . . 5 - - - - - - - - - 1 3 1 - Pohnpei Proper . . . . . . . 1 - - - - - - - - - - 1 - - Outer Islands. . . . . . . . - - - - - - - - - - - - - - Kosrae . . . . . . . . . . . 2 - - - - - - - - - - - 2 - Guam . . . . . . . . . . . . . - - - - - - - - - - - - - - Northern Mariana Island. . . . - - - - - - - - - - - - - - Palau. . . . . . . . . . . . . - - - - - - - - - - - - - - Other Pacific Islands. . . . . - - - - - - - - - - - - - - Asia . . . . . . . . . . . . . - - - - - - - - - - - - - - China and Taiwan . . . . . . - - - - - - - - - - - - - - Korea. . . . . . . . . . . . - - - - - - - - - - - - - - Philippines. . . . . . . . . - - - - - - - - - - - - - - Other Asia . . . . . . . . . - - - - - - - - - - - - - - United States. . . . . . . . . - - - - - - - - - - - - - - Elsewhere. . . . . . . . . . . - - - - - - - - - - - - - - ─────────────────────────────────────────────────────────────────────────────────────────────────────────── Source: 2000 FSM Census
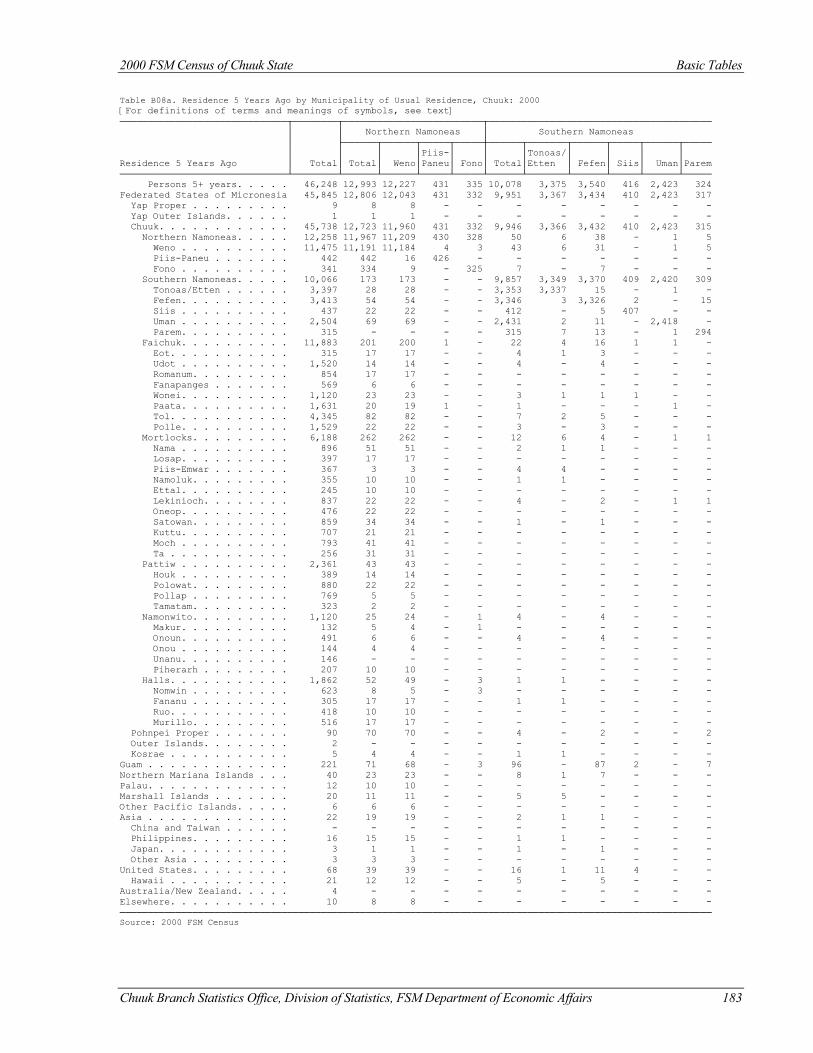
2000 FSM Census of Chuuk State Basic Tables
Chuuk Branch Statistics Office, Division of Statistics, FSM Department of Economic Affairs 183
Table B08a. Residence 5 Years Ago by Municipality of Usual Residence, Chuuk: 2000 [For definitions of terms and meanings of symbols, see text] ──────────────────────────────┬────────┬─────────────────────────┬──────────────────────────────────────── │ │ Northern Namoneas │ Southern Namoneas │ ├──────┬──────┬─────┬─────┼──────┬───────┬──────┬─────┬──────┬───── │ │ │ │Piis-│ │ │Tonoas/│ │ │ │ Residence 5 Years Ago │ Total│ Total│ Weno│Paneu│ Fono│ Total│Etten │ Fefen│ Siis│ Uman│Parem ──────────────────────────────┴────────┴──────┴──────┴─────┴─────┴──────┴───────┴──────┴─────┴──────┴───── Persons 5+ years. . . . . 46,248 12,993 12,227 431 335 10,078 3,375 3,540 416 2,423 324 Federated States of Micronesia 45,845 12,806 12,043 431 332 9,951 3,367 3,434 410 2,423 317 Yap Proper . . . . . . . . . 9 8 8 - - - - - - - - Yap Outer Islands. . . . . . 1 1 1 - - - - - - - - Chuuk. . . . . . . . . . . . 45,738 12,723 11,960 431 332 9,946 3,366 3,432 410 2,423 315 Northern Namoneas. . . . . 12,258 11,967 11,209 430 328 50 6 38 - 1 5 Weno . . . . . . . . . . 11,475 11,191 11,184 4 3 43 6 31 - 1 5 Piis-Paneu . . . . . . . 442 442 16 426 - - - - - - - Fono . . . . . . . . . . 341 334 9 - 325 7 - 7 - - - Southern Namoneas. . . . . 10,066 173 173 - - 9,857 3,349 3,370 409 2,420 309 Tonoas/Etten . . . . . . 3,397 28 28 - - 3,353 3,337 15 - 1 - Fefen. . . . . . . . . . 3,413 54 54 - - 3,346 3 3,326 2 - 15 Siis . . . . . . . . . . 437 22 22 - - 412 - 5 407 - - Uman . . . . . . . . . . 2,504 69 69 - - 2,431 2 11 - 2,418 - Parem. . . . . . . . . . 315 - - - - 315 7 13 - 1 294 Faichuk. . . . . . . . . . 11,883 201 200 1 - 22 4 16 1 1 - Eot. . . . . . . . . . . 315 17 17 - - 4 1 3 - - - Udot . . . . . . . . . . 1,520 14 14 - - 4 - 4 - - - Romanum. . . . . . . . . 854 17 17 - - - - - - - - Fanapanges . . . . . . . 569 6 6 - - - - - - - - Wonei. . . . . . . . . . 1,120 23 23 - - 3 1 1 1 - - Paata. . . . . . . . . . 1,631 20 19 1 - 1 - - - 1 - Tol. . . . . . . . . . . 4,345 82 82 - - 7 2 5 - - - Polle. . . . . . . . . . 1,529 22 22 - - 3 - 3 - - - Mortlocks. . . . . . . . . 6,188 262 262 - - 12 6 4 - 1 1 Nama . . . . . . . . . . 896 51 51 - - 2 1 1 - - - Losap. . . . . . . . . . 397 17 17 - - - - - - - - Piis-Emwar . . . . . . . 367 3 3 - - 4 4 - - - - Namoluk. . . . . . . . . 355 10 10 - - 1 1 - - - - Ettal. . . . . . . . . . 245 10 10 - - - - - - - - Lekinioch. . . . . . . . 837 22 22 - - 4 - 2 - 1 1 Oneop. . . . . . . . . . 476 22 22 - - - - - - - - Satowan. . . . . . . . . 859 34 34 - - 1 - 1 - - - Kuttu. . . . . . . . . . 707 21 21 - - - - - - - - Moch . . . . . . . . . . 793 41 41 - - - - - - - - Ta . . . . . . . . . . . 256 31 31 - - - - - - - - Pattiw . . . . . . . . . . 2,361 43 43 - - - - - - - - Houk . . . . . . . . . . 389 14 14 - - - - - - - - Polowat. . . . . . . . . 880 22 22 - - - - - - - - Pollap . . . . . . . . . 769 5 5 - - - - - - - - Tamatam. . . . . . . . . 323 2 2 - - - - - - - - Namonwito. . . . . . . . . 1,120 25 24 - 1 4 - 4 - - - Makur. . . . . . . . . . 132 5 4 - 1 - - - - - - Onoun. . . . . . . . . . 491 6 6 - - 4 - 4 - - - Onou . . . . . . . . . . 144 4 4 - - - - - - - - Unanu. . . . . . . . . . 146 - - - - - - - - - - Piherarh . . . . . . . . 207 10 10 - - - - - - - - Halls. . . . . . . . . . . 1,862 52 49 - 3 1 1 - - - - Nomwin . . . . . . . . . 623 8 5 - 3 - - - - - - Fananu . . . . . . . . . 305 17 17 - - 1 1 - - - - Ruo. . . . . . . . . . . 418 10 10 - - - - - - - - Murillo. . . . . . . . . 516 17 17 - - - - - - - - Pohnpei Proper . . . . . . . 90 70 70 - - 4 - 2 - - 2 Outer Islands. . . . . . . . 2 - - - - - - - - - - Kosrae . . . . . . . . . . . 5 4 4 - - 1 1 - - - - Guam . . . . . . . . . . . . . 221 71 68 - 3 96 - 87 2 - 7 Northern Mariana Islands . . . 40 23 23 - - 8 1 7 - - - Palau. . . . . . . . . . . . . 12 10 10 - - - - - - - - Marshall Islands . . . . . . . 20 11 11 - - 5 5 - - - - Other Pacific Islands. . . . . 6 6 6 - - - - - - - - Asia . . . . . . . . . . . . . 22 19 19 - - 2 1 1 - - - China and Taiwan . . . . . . - - - - - - - - - - - Philippines. . . . . . . . . 16 15 15 - - 1 1 - - - - Japan. . . . . . . . . . . . 3 1 1 - - 1 - 1 - - - Other Asia . . . . . . . . . 3 3 3 - - - - - - - - United States. . . . . . . . . 68 39 39 - - 16 1 11 4 - - Hawaii . . . . . . . . . . . 21 12 12 - - 5 - 5 - - - Australia/New Zealand. . . . . 4 - - - - - - - - - - Elsewhere. . . . . . . . . . . 10 8 8 - - - - - - - - ────────────────────────────────────────────────────────────────────────────────────────────────────────── Source: 2000 FSM Census
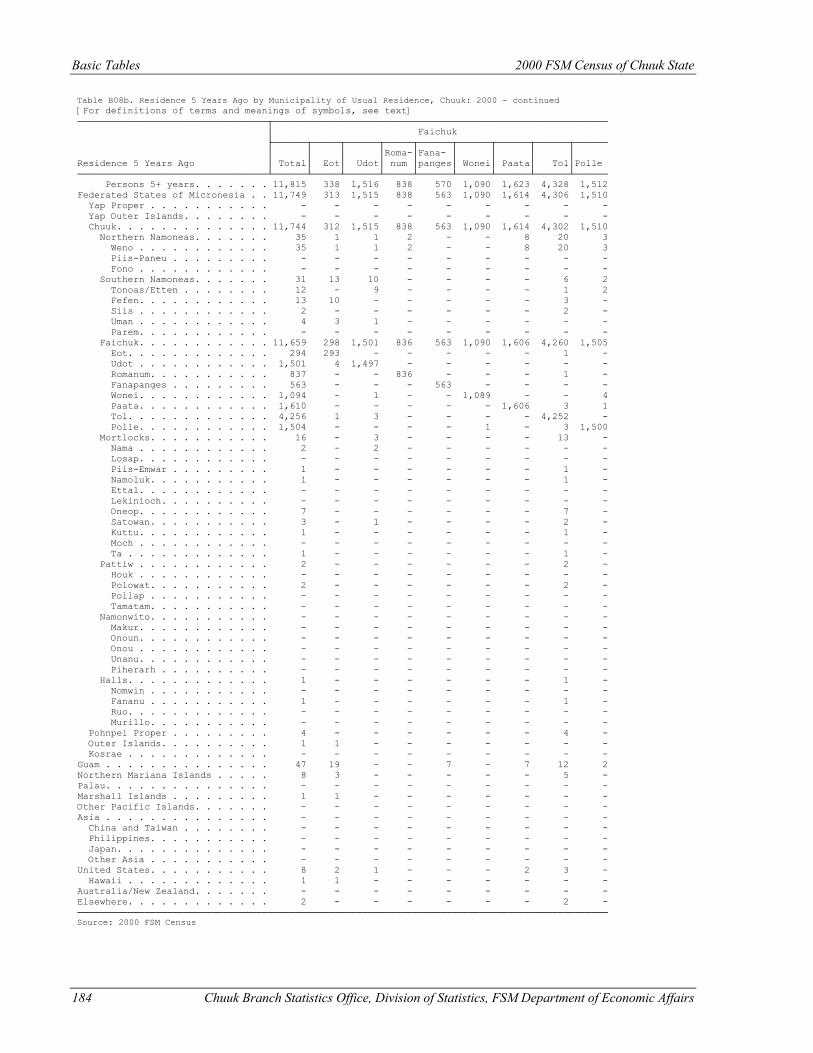
Basic Tables 2000 FSM Census of Chuuk State
184 Chuuk Branch Statistics Office, Division of Statistics, FSM Department of Economic Affairs
Table B08b. Residence 5 Years Ago by Municipality of Usual Residence, Chuuk: 2000 - continued [For definitions of terms and meanings of symbols, see text] ──────────────────────────────────┬──────────────────────────────────────────────────────────── │ Faichuk ├──────┬─────┬──────┬─────┬──────┬──────┬──────┬──────┬────── │ │ │ │Roma-│Fana- │ │ │ │ Residence 5 Years Ago │ Total│ Eot│ Udot│ num │panges│ Wonei│ Paata│ Tol│Polle ──────────────────────────────────┴──────┴─────┴──────┴─────┴──────┴──────┴──────┴──────┴────── Persons 5+ years. . . . . . . 11,815 338 1,516 838 570 1,090 1,623 4,328 1,512 Federated States of Micronesia . . 11,749 313 1,515 838 563 1,090 1,614 4,306 1,510 Yap Proper . . . . . . . . . . . - - - - - - - - - Yap Outer Islands. . . . . . . . - - - - - - - - - Chuuk. . . . . . . . . . . . . . 11,744 312 1,515 838 563 1,090 1,614 4,302 1,510 Northern Namoneas. . . . . . . 35 1 1 2 - - 8 20 3 Weno . . . . . . . . . . . . 35 1 1 2 - - 8 20 3 Piis-Paneu . . . . . . . . . - - - - - - - - - Fono . . . . . . . . . . . . - - - - - - - - - Southern Namoneas. . . . . . . 31 13 10 - - - - 6 2 Tonoas/Etten . . . . . . . . 12 - 9 - - - - 1 2 Fefen. . . . . . . . . . . . 13 10 - - - - - 3 - Siis . . . . . . . . . . . . 2 - - - - - - 2 - Uman . . . . . . . . . . . . 4 3 1 - - - - - - Parem. . . . . . . . . . . . - - - - - - - - - Faichuk. . . . . . . . . . . . 11,659 298 1,501 836 563 1,090 1,606 4,260 1,505 Eot. . . . . . . . . . . . . 294 293 - - - - - 1 - Udot . . . . . . . . . . . . 1,501 4 1,497 - - - - - - Romanum. . . . . . . . . . . 837 - - 836 - - - 1 - Fanapanges . . . . . . . . . 563 - - - 563 - - - - Wonei. . . . . . . . . . . . 1,094 - 1 - - 1,089 - - 4 Paata. . . . . . . . . . . . 1,610 - - - - - 1,606 3 1 Tol. . . . . . . . . . . . . 4,256 1 3 - - - - 4,252 - Polle. . . . . . . . . . . . 1,504 - - - - 1 - 3 1,500 Mortlocks. . . . . . . . . . . 16 - 3 - - - - 13 - Nama . . . . . . . . . . . . 2 - 2 - - - - - - Losap. . . . . . . . . . . . - - - - - - - - - Piis-Emwar . . . . . . . . . 1 - - - - - - 1 - Namoluk. . . . . . . . . . . 1 - - - - - - 1 - Ettal. . . . . . . . . . . . - - - - - - - - - Lekinioch. . . . . . . . . . - - - - - - - - - Oneop. . . . . . . . . . . . 7 - - - - - - 7 - Satowan. . . . . . . . . . . 3 - 1 - - - - 2 - Kuttu. . . . . . . . . . . . 1 - - - - - - 1 - Moch . . . . . . . . . . . . - - - - - - - - - Ta . . . . . . . . . . . . . 1 - - - - - - 1 - Pattiw . . . . . . . . . . . . 2 - - - - - - 2 - Houk . . . . . . . . . . . . - - - - - - - - - Polowat. . . . . . . . . . . 2 - - - - - - 2 - Pollap . . . . . . . . . . . - - - - - - - - - Tamatam. . . . . . . . . . . - - - - - - - - - Namonwito. . . . . . . . . . . - - - - - - - - - Makur. . . . . . . . . . . . - - - - - - - - - Onoun. . . . . . . . . . . . - - - - - - - - - Onou . . . . . . . . . . . . - - - - - - - - - Unanu. . . . . . . . . . . . - - - - - - - - - Piherarh . . . . . . . . . . - - - - - - - - - Halls. . . . . . . . . . . . . 1 - - - - - - 1 - Nomwin . . . . . . . . . . . - - - - - - - - - Fananu . . . . . . . . . . . 1 - - - - - - 1 - Ruo. . . . . . . . . . . . . - - - - - - - - - Murillo. . . . . . . . . . . - - - - - - - - - Pohnpei Proper . . . . . . . . . 4 - - - - - - 4 - Outer Islands. . . . . . . . . . 1 1 - - - - - - - Kosrae . . . . . . . . . . . . . - - - - - - - - - Guam . . . . . . . . . . . . . . . 47 19 - - 7 - 7 12 2 Northern Mariana Islands . . . . . 8 3 - - - - - 5 - Palau. . . . . . . . . . . . . . . - - - - - - - - - Marshall Islands . . . . . . . . . 1 1 - - - - - - - Other Pacific Islands. . . . . . . - - - - - - - - - Asia . . . . . . . . . . . . . . . - - - - - - - - - China and Taiwan . . . . . . . . - - - - - - - - - Philippines. . . . . . . . . . . - - - - - - - - - Japan. . . . . . . . . . . . . . - - - - - - - - - Other Asia . . . . . . . . . . . - - - - - - - - - United States. . . . . . . . . . . 8 2 1 - - - 2 3 - Hawaii . . . . . . . . . . . . . 1 1 - - - - - - - Australia/New Zealand. . . . . . . - - - - - - - - - Elsewhere. . . . . . . . . . . . . 2 - - - - - - 2 - ─────────────────────────────────────────────────────────────────────────────────────────────── Source: 2000 FSM Census
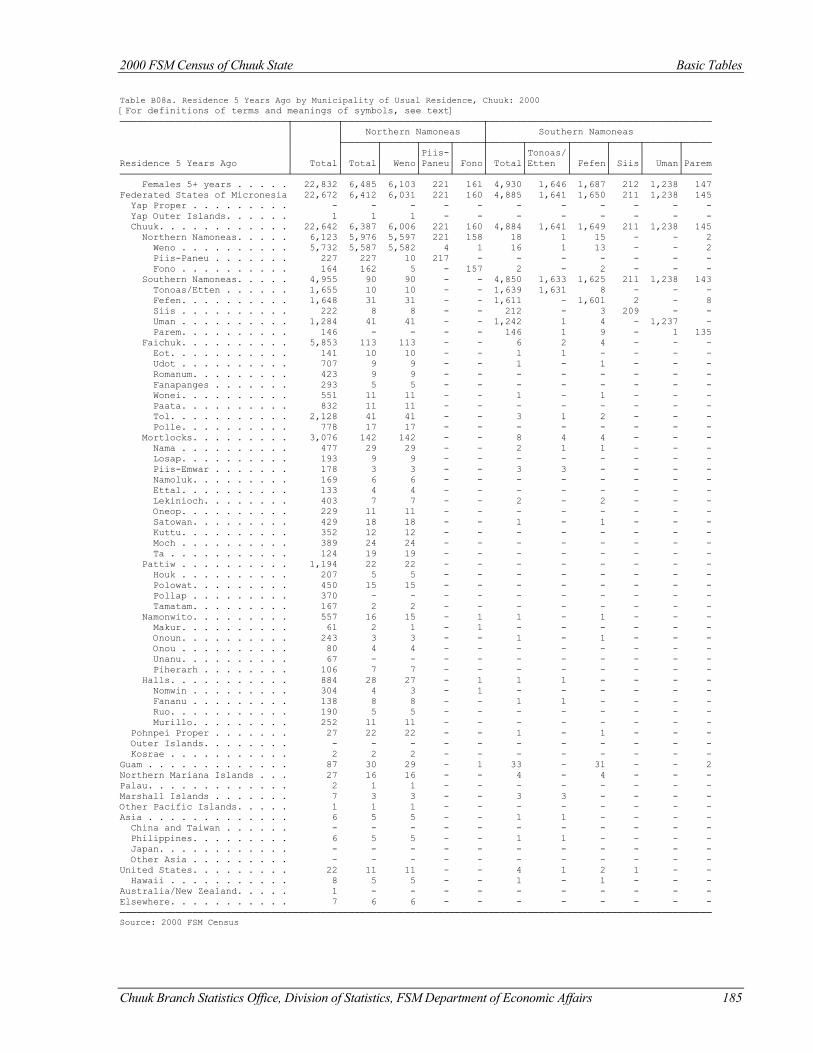
2000 FSM Census of Chuuk State Basic Tables
Chuuk Branch Statistics Office, Division of Statistics, FSM Department of Economic Affairs 185
Table B08a. Residence 5 Years Ago by Municipality of Usual Residence, Chuuk: 2000 [For definitions of terms and meanings of symbols, see text] ──────────────────────────────┬────────┬─────────────────────────┬──────────────────────────────────────── │ │ Northern Namoneas │ Southern Namoneas │ ├──────┬──────┬─────┬─────┼──────┬───────┬──────┬─────┬──────┬───── │ │ │ │Piis-│ │ │Tonoas/│ │ │ │ Residence 5 Years Ago │ Total│ Total│ Weno│Paneu│ Fono│ Total│Etten │ Fefen│ Siis│ Uman│Parem ──────────────────────────────┴────────┴──────┴──────┴─────┴─────┴──────┴───────┴──────┴─────┴──────┴───── Females 5+ years . . . . . 22,832 6,485 6,103 221 161 4,930 1,646 1,687 212 1,238 147 Federated States of Micronesia 22,672 6,412 6,031 221 160 4,885 1,641 1,650 211 1,238 145 Yap Proper . . . . . . . . . - - - - - - - - - - - Yap Outer Islands. . . . . . 1 1 1 - - - - - - - - Chuuk. . . . . . . . . . . . 22,642 6,387 6,006 221 160 4,884 1,641 1,649 211 1,238 145 Northern Namoneas. . . . . 6,123 5,976 5,597 221 158 18 1 15 - - 2 Weno . . . . . . . . . . 5,732 5,587 5,582 4 1 16 1 13 - - 2 Piis-Paneu . . . . . . . 227 227 10 217 - - - - - - - Fono . . . . . . . . . . 164 162 5 - 157 2 - 2 - - - Southern Namoneas. . . . . 4,955 90 90 - - 4,850 1,633 1,625 211 1,238 143 Tonoas/Etten . . . . . . 1,655 10 10 - - 1,639 1,631 8 - - - Fefen. . . . . . . . . . 1,648 31 31 - - 1,611 - 1,601 2 - 8 Siis . . . . . . . . . . 222 8 8 - - 212 - 3 209 - - Uman . . . . . . . . . . 1,284 41 41 - - 1,242 1 4 - 1,237 - Parem. . . . . . . . . . 146 - - - - 146 1 9 - 1 135 Faichuk. . . . . . . . . . 5,853 113 113 - - 6 2 4 - - - Eot. . . . . . . . . . . 141 10 10 - - 1 1 - - - - Udot . . . . . . . . . . 707 9 9 - - 1 - 1 - - - Romanum. . . . . . . . . 423 9 9 - - - - - - - - Fanapanges . . . . . . . 293 5 5 - - - - - - - - Wonei. . . . . . . . . . 551 11 11 - - 1 - 1 - - - Paata. . . . . . . . . . 832 11 11 - - - - - - - - Tol. . . . . . . . . . . 2,128 41 41 - - 3 1 2 - - - Polle. . . . . . . . . . 778 17 17 - - - - - - - - Mortlocks. . . . . . . . . 3,076 142 142 - - 8 4 4 - - - Nama . . . . . . . . . . 477 29 29 - - 2 1 1 - - - Losap. . . . . . . . . . 193 9 9 - - - - - - - - Piis-Emwar . . . . . . . 178 3 3 - - 3 3 - - - - Namoluk. . . . . . . . . 169 6 6 - - - - - - - - Ettal. . . . . . . . . . 133 4 4 - - - - - - - - Lekinioch. . . . . . . . 403 7 7 - - 2 - 2 - - - Oneop. . . . . . . . . . 229 11 11 - - - - - - - - Satowan. . . . . . . . . 429 18 18 - - 1 - 1 - - - Kuttu. . . . . . . . . . 352 12 12 - - - - - - - - Moch . . . . . . . . . . 389 24 24 - - - - - - - - Ta . . . . . . . . . . . 124 19 19 - - - - - - - - Pattiw . . . . . . . . . . 1,194 22 22 - - - - - - - - Houk . . . . . . . . . . 207 5 5 - - - - - - - - Polowat. . . . . . . . . 450 15 15 - - - - - - - - Pollap . . . . . . . . . 370 - - - - - - - - - - Tamatam. . . . . . . . . 167 2 2 - - - - - - - - Namonwito. . . . . . . . . 557 16 15 - 1 1 - 1 - - - Makur. . . . . . . . . . 61 2 1 - 1 - - - - - - Onoun. . . . . . . . . . 243 3 3 - - 1 - 1 - - - Onou . . . . . . . . . . 80 4 4 - - - - - - - - Unanu. . . . . . . . . . 67 - - - - - - - - - - Piherarh . . . . . . . . 106 7 7 - - - - - - - - Halls. . . . . . . . . . . 884 28 27 - 1 1 1 - - - - Nomwin . . . . . . . . . 304 4 3 - 1 - - - - - - Fananu . . . . . . . . . 138 8 8 - - 1 1 - - - - Ruo. . . . . . . . . . . 190 5 5 - - - - - - - - Murillo. . . . . . . . . 252 11 11 - - - - - - - - Pohnpei Proper . . . . . . . 27 22 22 - - 1 - 1 - - - Outer Islands. . . . . . . . - - - - - - - - - - - Kosrae . . . . . . . . . . . 2 2 2 - - - - - - - - Guam . . . . . . . . . . . . . 87 30 29 - 1 33 - 31 - - 2 Northern Mariana Islands . . . 27 16 16 - - 4 - 4 - - - Palau. . . . . . . . . . . . . 2 1 1 - - - - - - - - Marshall Islands . . . . . . . 7 3 3 - - 3 3 - - - - Other Pacific Islands. . . . . 1 1 1 - - - - - - - - Asia . . . . . . . . . . . . . 6 5 5 - - 1 1 - - - - China and Taiwan . . . . . . - - - - - - - - - - - Philippines. . . . . . . . . 6 5 5 - - 1 1 - - - - Japan. . . . . . . . . . . . - - - - - - - - - - - Other Asia . . . . . . . . . - - - - - - - - - - - United States. . . . . . . . . 22 11 11 - - 4 1 2 1 - - Hawaii . . . . . . . . . . . 8 5 5 - - 1 - 1 - - - Australia/New Zealand. . . . . 1 - - - - - - - - - - Elsewhere. . . . . . . . . . . 7 6 6 - - - - - - - - ────────────────────────────────────────────────────────────────────────────────────────────────────────── Source: 2000 FSM Census
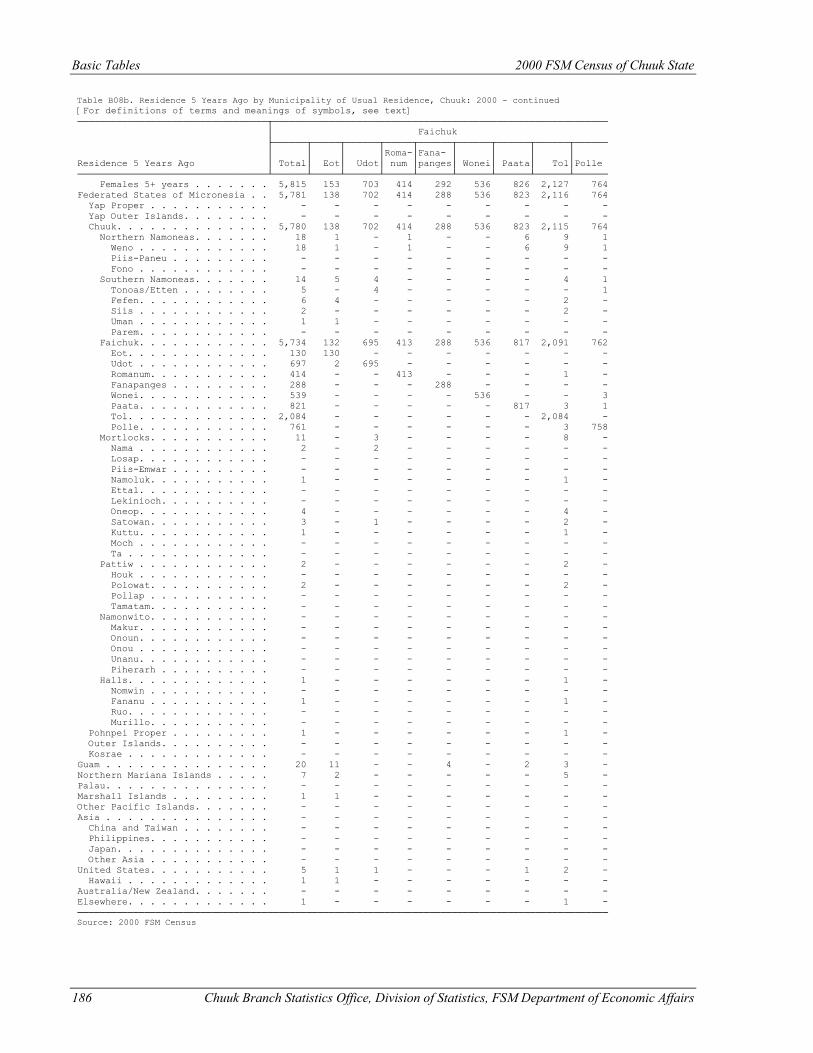
Basic Tables 2000 FSM Census of Chuuk State
186 Chuuk Branch Statistics Office, Division of Statistics, FSM Department of Economic Affairs
Table B08b. Residence 5 Years Ago by Municipality of Usual Residence, Chuuk: 2000 - continued [For definitions of terms and meanings of symbols, see text] ──────────────────────────────────┬──────────────────────────────────────────────────────────── │ Faichuk ├──────┬─────┬──────┬─────┬──────┬──────┬──────┬──────┬────── │ │ │ │Roma-│Fana- │ │ │ │ Residence 5 Years Ago │ Total│ Eot│ Udot│ num │panges│ Wonei│ Paata│ Tol│Polle ──────────────────────────────────┴──────┴─────┴──────┴─────┴──────┴──────┴──────┴──────┴────── Females 5+ years . . . . . . . 5,815 153 703 414 292 536 826 2,127 764 Federated States of Micronesia . . 5,781 138 702 414 288 536 823 2,116 764 Yap Proper . . . . . . . . . . . - - - - - - - - - Yap Outer Islands. . . . . . . . - - - - - - - - - Chuuk. . . . . . . . . . . . . . 5,780 138 702 414 288 536 823 2,115 764 Northern Namoneas. . . . . . . 18 1 - 1 - - 6 9 1 Weno . . . . . . . . . . . . 18 1 - 1 - - 6 9 1 Piis-Paneu . . . . . . . . . - - - - - - - - - Fono . . . . . . . . . . . . - - - - - - - - - Southern Namoneas. . . . . . . 14 5 4 - - - - 4 1 Tonoas/Etten . . . . . . . . 5 - 4 - - - - - 1 Fefen. . . . . . . . . . . . 6 4 - - - - - 2 - Siis . . . . . . . . . . . . 2 - - - - - - 2 - Uman . . . . . . . . . . . . 1 1 - - - - - - - Parem. . . . . . . . . . . . - - - - - - - - - Faichuk. . . . . . . . . . . . 5,734 132 695 413 288 536 817 2,091 762 Eot. . . . . . . . . . . . . 130 130 - - - - - - - Udot . . . . . . . . . . . . 697 2 695 - - - - - - Romanum. . . . . . . . . . . 414 - - 413 - - - 1 - Fanapanges . . . . . . . . . 288 - - - 288 - - - - Wonei. . . . . . . . . . . . 539 - - - - 536 - - 3 Paata. . . . . . . . . . . . 821 - - - - - 817 3 1 Tol. . . . . . . . . . . . . 2,084 - - - - - - 2,084 - Polle. . . . . . . . . . . . 761 - - - - - - 3 758 Mortlocks. . . . . . . . . . . 11 - 3 - - - - 8 - Nama . . . . . . . . . . . . 2 - 2 - - - - - - Losap. . . . . . . . . . . . - - - - - - - - - Piis-Emwar . . . . . . . . . - - - - - - - - - Namoluk. . . . . . . . . . . 1 - - - - - - 1 - Ettal. . . . . . . . . . . . - - - - - - - - - Lekinioch. . . . . . . . . . - - - - - - - - - Oneop. . . . . . . . . . . . 4 - - - - - - 4 - Satowan. . . . . . . . . . . 3 - 1 - - - - 2 - Kuttu. . . . . . . . . . . . 1 - - - - - - 1 - Moch . . . . . . . . . . . . - - - - - - - - - Ta . . . . . . . . . . . . . - - - - - - - - - Pattiw . . . . . . . . . . . . 2 - - - - - - 2 - Houk . . . . . . . . . . . . - - - - - - - - - Polowat. . . . . . . . . . . 2 - - - - - - 2 - Pollap . . . . . . . . . . . - - - - - - - - - Tamatam. . . . . . . . . . . - - - - - - - - - Namonwito. . . . . . . . . . . - - - - - - - - - Makur. . . . . . . . . . . . - - - - - - - - - Onoun. . . . . . . . . . . . - - - - - - - - - Onou . . . . . . . . . . . . - - - - - - - - - Unanu. . . . . . . . . . . . - - - - - - - - - Piherarh . . . . . . . . . . - - - - - - - - - Halls. . . . . . . . . . . . . 1 - - - - - - 1 - Nomwin . . . . . . . . . . . - - - - - - - - - Fananu . . . . . . . . . . . 1 - - - - - - 1 - Ruo. . . . . . . . . . . . . - - - - - - - - - Murillo. . . . . . . . . . . - - - - - - - - - Pohnpei Proper . . . . . . . . . 1 - - - - - - 1 - Outer Islands. . . . . . . . . . - - - - - - - - - Kosrae . . . . . . . . . . . . . - - - - - - - - - Guam . . . . . . . . . . . . . . . 20 11 - - 4 - 2 3 - Northern Mariana Islands . . . . . 7 2 - - - - - 5 - Palau. . . . . . . . . . . . . . . - - - - - - - - - Marshall Islands . . . . . . . . . 1 1 - - - - - - - Other Pacific Islands. . . . . . . - - - - - - - - - Asia . . . . . . . . . . . . . . . - - - - - - - - - China and Taiwan . . . . . . . . - - - - - - - - - Philippines. . . . . . . . . . . - - - - - - - - - Japan. . . . . . . . . . . . . . - - - - - - - - - Other Asia . . . . . . . . . . . - - - - - - - - - United States. . . . . . . . . . . 5 1 1 - - - 1 2 - Hawaii . . . . . . . . . . . . . 1 1 - - - - - - - Australia/New Zealand. . . . . . . - - - - - - - - - Elsewhere. . . . . . . . . . . . . 1 - - - - - - 1 - ─────────────────────────────────────────────────────────────────────────────────────────────── Source: 2000 FSM Census

2000 FSM Census of Chuuk State Basic Tables
Chuuk Branch Statistics Office, Division of Statistics, FSM Department of Economic Affairs 187
Table B08c. Residence 5 Years Ago by Municipality of Usual Residence, Chuuk: 2000 - continued [For definitions of terms and meanings of symbols, see text] ──────────────────────────────┬────────────────────────────────────────────────────────────────────── │ Mortlocks ├─────┬─────┬─────┬─────┬─────┬─────┬─────┬─────┬─────┬─────┬─────┬──── │ │ │ │Piis-│Namo-│ │Leki-│ │Sato-│ │ │ Residence 5 Years Ago │Total│ Nama│Losap│Emwar│ luk │Ettal│nioch│Oneop│ wan │Kuttu│ Moch│ Ta ──────────────────────────────┴─────┴─────┴─────┴─────┴─────┴─────┴─────┴─────┴─────┴─────┴─────┴──── Persons 5+ years. . . . . 6,077 849 380 357 343 238 806 433 857 807 785 222 Federated States of Micronesia 6,068 846 380 357 343 234 806 433 857 806 784 222 Yap Proper. . . . . . . . . - - - - - - - - - - - - Yap Outer Islands . . . . . - - - - - - - - - - - - Chuuk . . . . . . . . . . . 6,061 846 380 357 343 232 806 433 857 801 784 222 Northern Namoneas . . . . 161 4 - - 1 4 3 - 3 117 29 - Weno. . . . . . . . . . 161 4 - - 1 4 3 - 3 117 29 - Piis-Paneu. . . . . . . - - - - - - - - - - - - Fono. . . . . . . . . . - - - - - - - - - - - - Southern Namoneas . . . . 4 - - - - 1 - 1 - 1 1 - Tonoas/Etten. . . . . . 3 - - - - 1 - 1 - - 1 - Fefen . . . . . . . . . - - - - - - - - - - - - Siis. . . . . . . . . . 1 - - - - - - - - 1 - - Uman. . . . . . . . . . - - - - - - - - - - - - Parem . . . . . . . . . - - - - - - - - - - - - Faichuk . . . . . . . . . 1 - - - 1 - - - - - - - Eot . . . . . . . . . . - - - - - - - - - - - - Udot. . . . . . . . . . 1 - - - 1 - - - - - - - Romanum . . . . . . . . - - - - - - - - - - - - Fanapanges. . . . . . . - - - - - - - - - - - - Wonei . . . . . . . . . - - - - - - - - - - - - Paata . . . . . . . . . - - - - - - - - - - - - Tol . . . . . . . . . . - - - - - - - - - - - - Polle . . . . . . . . . - - - - - - - - - - - - Mortlocks . . . . . . . . 5,895 842 380 357 341 227 803 432 854 683 754 222 Nama. . . . . . . . . . 841 840 - - - - 1 - - - - - Losap . . . . . . . . . 380 - 380 - - - - - - - - - Piis-Emwar. . . . . . . 359 2 - 357 - - - - - - - - Namoluk . . . . . . . . 343 - - - 340 - - - 3 - - - Ettal . . . . . . . . . 234 - - - - 227 2 - 3 - 2 - Lekinioch . . . . . . . 811 - - - - - 800 - 11 - - - Oneop . . . . . . . . . 446 - - - - - - 432 11 1 2 - Satowan . . . . . . . . 821 - - - 1 - - - 818 2 - - Kuttu . . . . . . . . . 685 - - - - - - - 5 679 1 - Moch. . . . . . . . . . 751 - - - - - - - 1 1 749 - Ta. . . . . . . . . . . 224 - - - - - - - 2 - - 222 Pattiw. . . . . . . . . . - - - - - - - - - - - - Houk. . . . . . . . . . - - - - - - - - - - - - Polowat . . . . . . . . - - - - - - - - - - - - Pollap. . . . . . . . . - - - - - - - - - - - - Tamatam . . . . . . . . - - - - - - - - - - - - Namonwito . . . . . . . . - - - - - - - - - - - - Makur . . . . . . . . . - - - - - - - - - - - - Onoun . . . . . . . . . - - - - - - - - - - - - Onou. . . . . . . . . . - - - - - - - - - - - - Unanu . . . . . . . . . - - - - - - - - - - - - Piherarh. . . . . . . . - - - - - - - - - - - - Halls . . . . . . . . . . - - - - - - - - - - - - Nomwin. . . . . . . . . - - - - - - - - - - - - Fananu. . . . . . . . . - - - - - - - - - - - - Ruo . . . . . . . . . . - - - - - - - - - - - - Murillo . . . . . . . . - - - - - - - - - - - - Pohnpei . . . . . . . . . . 6 - - - - 2 - - - 4 - - Outer Islands . . . . . . . 1 - - - - - - - - 1 - - Kosrae. . . . . . . . . . . - - - - - - - - - - - - Guam. . . . . . . . . . . . . 2 - - - - - - - - 1 1 - Northern Mariana Islands. . . - - - - - - - - - - - - Palau . . . . . . . . . . . . - - - - - - - - - - - - Marshall Islands. . . . . . . 3 3 - - - - - - - - - - Other Pacific Islands . . . . - - - - - - - - - - - - Asia. . . . . . . . . . . . . - - - - - - - - - - - - China and Taiwan. . . . . . - - - - - - - - - - - - Philippines . . . . . . . . - - - - - - - - - - - - Japan . . . . . . . . . . . - - - - - - - - - - - - Other Asia. . . . . . . . . - - - - - - - - - - - - United States . . . . . . . . 4 - - - - 4 - - - - - - Hawaii. . . . . . . . . . . 3 - - - - 3 - - - - - - Australia/New Zealand . . . . - - - - - - - - - - - - Elsewhere . . . . . . . . . . - - - - - - - - - - - - ───────────────────────────────────────────────────────────────────────────────────────────────────── Source: 2000 FSM Census
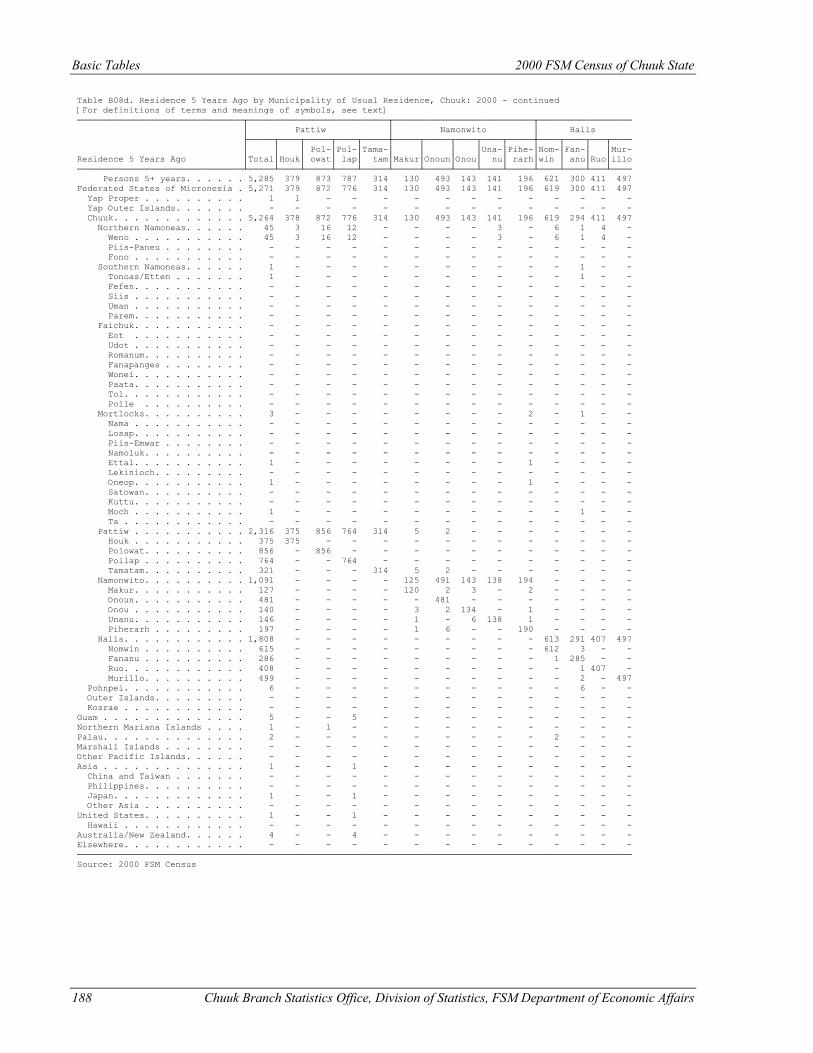
Basic Tables 2000 FSM Census of Chuuk State
188 Chuuk Branch Statistics Office, Division of Statistics, FSM Department of Economic Affairs
Table B08d. Residence 5 Years Ago by Municipality of Usual Residence, Chuuk: 2000 - continued [For definitions of terms and meanings of symbols, see text] ────────────────────────────────┬───────────────────────────┬───────────────────────────┬────────────────── │ Pattiw │ Namonwito │ Halls ├─────┬────┬─────┬────┬─────┼─────┬─────┬────┬────┬─────┼────┬────┬───┬──── │ │ │ Pol-│Pol-│Tama-│ │ │ │Una-│Pihe-│Nom-│Fan-│ │Mur- Residence 5 Years Ago │Total│Houk│ owat│ lap│ tam│Makur│Onoun│Onou│ nu│ rarh│win │ anu│Ruo│illo ────────────────────────────────┴─────┴────┴─────┴────┴─────┴─────┴─────┴────┴────┴─────┴────┴────┴───┴──── Persons 5+ years. . . . . . 5,285 379 873 787 314 130 493 143 141 196 621 300 411 497 Federated States of Micronesia . 5,271 379 872 776 314 130 493 143 141 196 619 300 411 497 Yap Proper . . . . . . . . . . 1 1 - - - - - - - - - - - - Yap Outer Islands. . . . . . . - - - - - - - - - - - - - - Chuuk. . . . . . . . . . . . . 5,264 378 872 776 314 130 493 143 141 196 619 294 411 497 Northern Namoneas. . . . . . 45 3 16 12 - - - - 3 - 6 1 4 - Weno . . . . . . . . . . . 45 3 16 12 - - - - 3 - 6 1 4 - Piis-Paneu . . . . . . . . - - - - - - - - - - - - - - Fono . . . . . . . . . . . - - - - - - - - - - - - - - Southern Namoneas. . . . . . 1 - - - - - - - - - - 1 - - Tonoas/Etten . . . . . . . 1 - - - - - - - - - - 1 - - Fefen. . . . . . . . . . . - - - - - - - - - - - - - - Siis . . . . . . . . . . . - - - - - - - - - - - - - - Uman . . . . . . . . . . . - - - - - - - - - - - - - - Parem. . . . . . . . . . . - - - - - - - - - - - - - - Faichuk. . . . . . . . . . . - - - - - - - - - - - - - - Eot . . . . . . . . . . . - - - - - - - - - - - - - - Udot . . . . . . . . . . . - - - - - - - - - - - - - - Romanum. . . . . . . . . . - - - - - - - - - - - - - - Fanapanges . . . . . . . . - - - - - - - - - - - - - - Wonei. . . . . . . . . . . - - - - - - - - - - - - - - Paata. . . . . . . . . . . - - - - - - - - - - - - - - Tol. . . . . . . . . . . . - - - - - - - - - - - - - - Polle . . . . . . . . . . - - - - - - - - - - - - - - Mortlocks. . . . . . . . . . 3 - - - - - - - - 2 - 1 - - Nama . . . . . . . . . . . - - - - - - - - - - - - - - Losap. . . . . . . . . . . - - - - - - - - - - - - - - Piis-Emwar . . . . . . . . - - - - - - - - - - - - - - Namoluk. . . . . . . . . . - - - - - - - - - - - - - - Ettal. . . . . . . . . . . 1 - - - - - - - - 1 - - - - Lekinioch. . . . . . . . . - - - - - - - - - - - - - - Oneop. . . . . . . . . . . 1 - - - - - - - - 1 - - - - Satowan. . . . . . . . . . - - - - - - - - - - - - - - Kuttu. . . . . . . . . . . - - - - - - - - - - - - - - Moch . . . . . . . . . . . 1 - - - - - - - - - - 1 - - Ta . . . . . . . . . . . . - - - - - - - - - - - - - - Pattiw . . . . . . . . . . . 2,316 375 856 764 314 5 2 - - - - - - - Houk . . . . . . . . . . . 375 375 - - - - - - - - - - - - Polowat. . . . . . . . . . 856 - 856 - - - - - - - - - - - Pollap . . . . . . . . . . 764 - - 764 - - - - - - - - - - Tamatam. . . . . . . . . . 321 - - - 314 5 2 - - - - - - - Namonwito. . . . . . . . . . 1,091 - - - - 125 491 143 138 194 - - - - Makur. . . . . . . . . . . 127 - - - - 120 2 3 - 2 - - - - Onoun. . . . . . . . . . . 481 - - - - - 481 - - - - - - - Onou . . . . . . . . . . . 140 - - - - 3 2 134 - 1 - - - - Unanu. . . . . . . . . . . 146 - - - - 1 - 6 138 1 - - - - Piherarh . . . . . . . . . 197 - - - - 1 6 - - 190 - - - - Halls. . . . . . . . . . . . 1,808 - - - - - - - - - 613 291 407 497 Nomwin . . . . . . . . . . 615 - - - - - - - - - 612 3 - - Fananu . . . . . . . . . . 286 - - - - - - - - - 1 285 - - Ruo. . . . . . . . . . . . 408 - - - - - - - - - - 1 407 - Murillo. . . . . . . . . . 499 - - - - - - - - - - 2 - 497 Pohnpei. . . . . . . . . . . . 6 - - - - - - - - - - 6 - - Outer Islands. . . . . . . . . - - - - - - - - - - - - - - Kosrae . . . . . . . . . . . . - - - - - - - - - - - - - - Guam . . . . . . . . . . . . . . 5 - - 5 - - - - - - - - - - Northern Mariana Islands . . . . 1 - 1 - - - - - - - - - - - Palau. . . . . . . . . . . . . . 2 - - - - - - - - - 2 - - - Marshall Islands . . . . . . . . - - - - - - - - - - - - - - Other Pacific Islands. . . . . . - - - - - - - - - - - - - - Asia . . . . . . . . . . . . . . 1 - - 1 - - - - - - - - - - China and Taiwan . . . . . . . - - - - - - - - - - - - - - Philippines. . . . . . . . . . - - - - - - - - - - - - - - Japan. . . . . . . . . . . . . 1 - - 1 - - - - - - - - - - Other Asia . . . . . . . . . . - - - - - - - - - - - - - - United States. . . . . . . . . . 1 - - 1 - - - - - - - - - - Hawaii . . . . . . . . . . . . - - - - - - - - - - - - - - Australia/New Zealand. . . . . . 4 - - 4 - - - - - - - - - - Elsewhere. . . . . . . . . . . . - - - - - - - - - - - - - - ─────────────────────────────────────────────────────────────────────────────────────────────────────────── Source: 2000 FSM Census
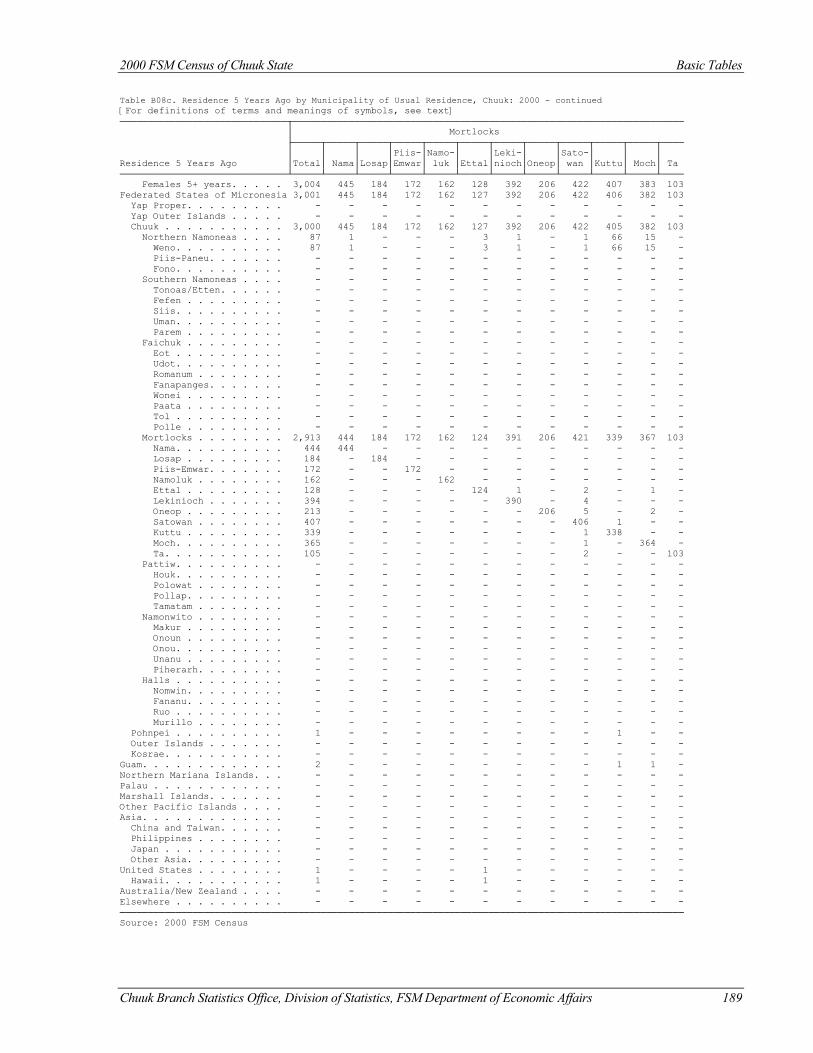
2000 FSM Census of Chuuk State Basic Tables
Chuuk Branch Statistics Office, Division of Statistics, FSM Department of Economic Affairs 189
Table B08c. Residence 5 Years Ago by Municipality of Usual Residence, Chuuk: 2000 - continued [For definitions of terms and meanings of symbols, see text] ──────────────────────────────┬────────────────────────────────────────────────────────────────────── │ Mortlocks ├─────┬─────┬─────┬─────┬─────┬─────┬─────┬─────┬─────┬─────┬─────┬──── │ │ │ │Piis-│Namo-│ │Leki-│ │Sato-│ │ │ Residence 5 Years Ago │Total│ Nama│Losap│Emwar│ luk │Ettal│nioch│Oneop│ wan │Kuttu│ Moch│ Ta ──────────────────────────────┴─────┴─────┴─────┴─────┴─────┴─────┴─────┴─────┴─────┴─────┴─────┴──── Females 5+ years. . . . . 3,004 445 184 172 162 128 392 206 422 407 383 103 Federated States of Micronesia 3,001 445 184 172 162 127 392 206 422 406 382 103 Yap Proper. . . . . . . . . - - - - - - - - - - - - Yap Outer Islands . . . . . - - - - - - - - - - - - Chuuk . . . . . . . . . . . 3,000 445 184 172 162 127 392 206 422 405 382 103 Northern Namoneas . . . . 87 1 - - - 3 1 - 1 66 15 - Weno. . . . . . . . . . 87 1 - - - 3 1 - 1 66 15 - Piis-Paneu. . . . . . . - - - - - - - - - - - - Fono. . . . . . . . . . - - - - - - - - - - - - Southern Namoneas . . . . - - - - - - - - - - - - Tonoas/Etten. . . . . . - - - - - - - - - - - - Fefen . . . . . . . . . - - - - - - - - - - - - Siis. . . . . . . . . . - - - - - - - - - - - - Uman. . . . . . . . . . - - - - - - - - - - - - Parem . . . . . . . . . - - - - - - - - - - - - Faichuk . . . . . . . . . - - - - - - - - - - - - Eot . . . . . . . . . . - - - - - - - - - - - - Udot. . . . . . . . . . - - - - - - - - - - - - Romanum . . . . . . . . - - - - - - - - - - - - Fanapanges. . . . . . . - - - - - - - - - - - - Wonei . . . . . . . . . - - - - - - - - - - - - Paata . . . . . . . . . - - - - - - - - - - - - Tol . . . . . . . . . . - - - - - - - - - - - - Polle . . . . . . . . . - - - - - - - - - - - - Mortlocks . . . . . . . . 2,913 444 184 172 162 124 391 206 421 339 367 103 Nama. . . . . . . . . . 444 444 - - - - - - - - - - Losap . . . . . . . . . 184 - 184 - - - - - - - - - Piis-Emwar. . . . . . . 172 - - 172 - - - - - - - - Namoluk . . . . . . . . 162 - - - 162 - - - - - - - Ettal . . . . . . . . . 128 - - - - 124 1 - 2 - 1 - Lekinioch . . . . . . . 394 - - - - - 390 - 4 - - - Oneop . . . . . . . . . 213 - - - - - - 206 5 - 2 - Satowan . . . . . . . . 407 - - - - - - - 406 1 - - Kuttu . . . . . . . . . 339 - - - - - - - 1 338 - - Moch. . . . . . . . . . 365 - - - - - - - 1 - 364 - Ta. . . . . . . . . . . 105 - - - - - - - 2 - - 103 Pattiw. . . . . . . . . . - - - - - - - - - - - - Houk. . . . . . . . . . - - - - - - - - - - - - Polowat . . . . . . . . - - - - - - - - - - - - Pollap. . . . . . . . . - - - - - - - - - - - - Tamatam . . . . . . . . - - - - - - - - - - - - Namonwito . . . . . . . . - - - - - - - - - - - - Makur . . . . . . . . . - - - - - - - - - - - - Onoun . . . . . . . . . - - - - - - - - - - - - Onou. . . . . . . . . . - - - - - - - - - - - - Unanu . . . . . . . . . - - - - - - - - - - - - Piherarh. . . . . . . . - - - - - - - - - - - - Halls . . . . . . . . . . - - - - - - - - - - - - Nomwin. . . . . . . . . - - - - - - - - - - - - Fananu. . . . . . . . . - - - - - - - - - - - - Ruo . . . . . . . . . . - - - - - - - - - - - - Murillo . . . . . . . . - - - - - - - - - - - - Pohnpei . . . . . . . . . . 1 - - - - - - - - 1 - - Outer Islands . . . . . . . - - - - - - - - - - - - Kosrae. . . . . . . . . . . - - - - - - - - - - - - Guam. . . . . . . . . . . . . 2 - - - - - - - - 1 1 - Northern Mariana Islands. . . - - - - - - - - - - - - Palau . . . . . . . . . . . . - - - - - - - - - - - - Marshall Islands. . . . . . . - - - - - - - - - - - - Other Pacific Islands . . . . - - - - - - - - - - - - Asia. . . . . . . . . . . . . - - - - - - - - - - - - China and Taiwan. . . . . . - - - - - - - - - - - - Philippines . . . . . . . . - - - - - - - - - - - - Japan . . . . . . . . . . . - - - - - - - - - - - - Other Asia. . . . . . . . . - - - - - - - - - - - - United States . . . . . . . . 1 - - - - 1 - - - - - - Hawaii. . . . . . . . . . . 1 - - - - 1 - - - - - - Australia/New Zealand . . . . - - - - - - - - - - - - Elsewhere . . . . . . . . . . - - - - - - - - - - - - ───────────────────────────────────────────────────────────────────────────────────────────────────── Source: 2000 FSM Census
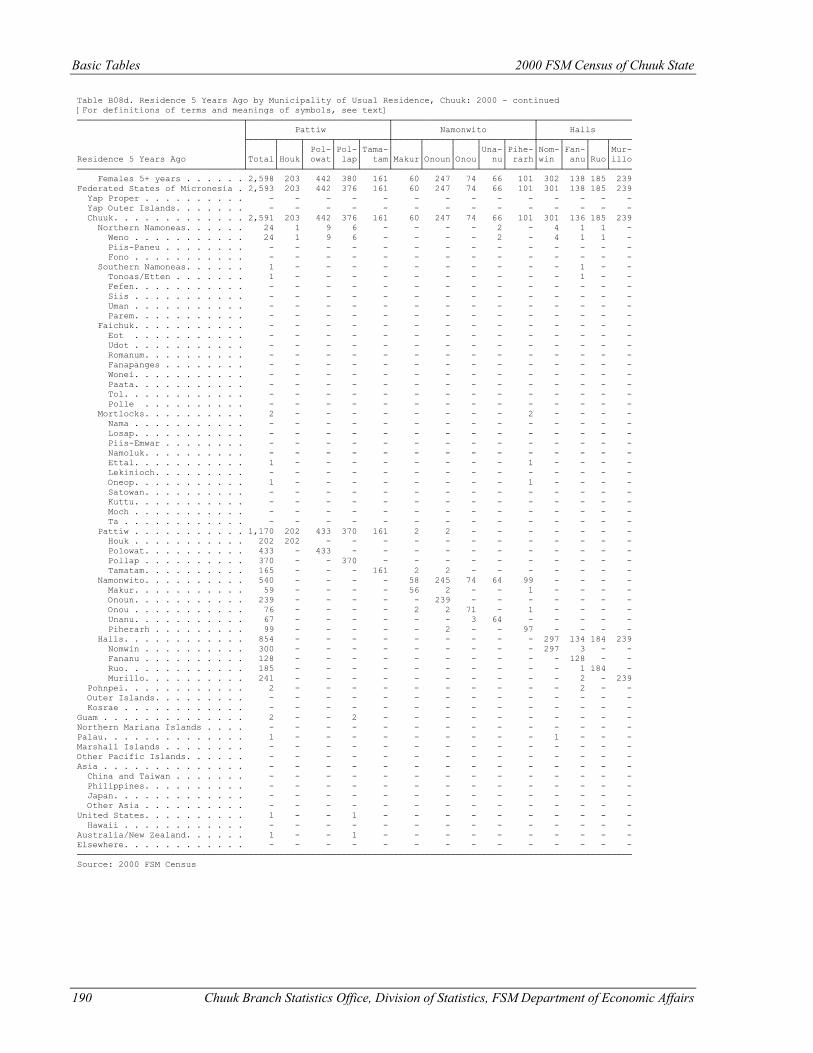
Basic Tables 2000 FSM Census of Chuuk State
190 Chuuk Branch Statistics Office, Division of Statistics, FSM Department of Economic Affairs
Table B08d. Residence 5 Years Ago by Municipality of Usual Residence, Chuuk: 2000 - continued [For definitions of terms and meanings of symbols, see text] ────────────────────────────────┬───────────────────────────┬───────────────────────────┬────────────────── │ Pattiw │ Namonwito │ Halls ├─────┬────┬─────┬────┬─────┼─────┬─────┬────┬────┬─────┼────┬────┬───┬──── │ │ │ Pol-│Pol-│Tama-│ │ │ │Una-│Pihe-│Nom-│Fan-│ │Mur- Residence 5 Years Ago │Total│Houk│ owat│ lap│ tam│Makur│Onoun│Onou│ nu│ rarh│win │ anu│Ruo│illo ────────────────────────────────┴─────┴────┴─────┴────┴─────┴─────┴─────┴────┴────┴─────┴────┴────┴───┴──── Females 5+ years . . . . . . 2,598 203 442 380 161 60 247 74 66 101 302 138 185 239 Federated States of Micronesia . 2,593 203 442 376 161 60 247 74 66 101 301 138 185 239 Yap Proper . . . . . . . . . . - - - - - - - - - - - - - - Yap Outer Islands. . . . . . . - - - - - - - - - - - - - - Chuuk. . . . . . . . . . . . . 2,591 203 442 376 161 60 247 74 66 101 301 136 185 239 Northern Namoneas. . . . . . 24 1 9 6 - - - - 2 - 4 1 1 - Weno . . . . . . . . . . . 24 1 9 6 - - - - 2 - 4 1 1 - Piis-Paneu . . . . . . . . - - - - - - - - - - - - - - Fono . . . . . . . . . . . - - - - - - - - - - - - - - Southern Namoneas. . . . . . 1 - - - - - - - - - - 1 - - Tonoas/Etten . . . . . . . 1 - - - - - - - - - - 1 - - Fefen. . . . . . . . . . . - - - - - - - - - - - - - - Siis . . . . . . . . . . . - - - - - - - - - - - - - - Uman . . . . . . . . . . . - - - - - - - - - - - - - - Parem. . . . . . . . . . . - - - - - - - - - - - - - - Faichuk. . . . . . . . . . . - - - - - - - - - - - - - - Eot . . . . . . . . . . . - - - - - - - - - - - - - - Udot . . . . . . . . . . . - - - - - - - - - - - - - - Romanum. . . . . . . . . . - - - - - - - - - - - - - - Fanapanges . . . . . . . . - - - - - - - - - - - - - - Wonei. . . . . . . . . . . - - - - - - - - - - - - - - Paata. . . . . . . . . . . - - - - - - - - - - - - - - Tol. . . . . . . . . . . . - - - - - - - - - - - - - - Polle . . . . . . . . . . - - - - - - - - - - - - - - Mortlocks. . . . . . . . . . 2 - - - - - - - - 2 - - - - Nama . . . . . . . . . . . - - - - - - - - - - - - - - Losap. . . . . . . . . . . - - - - - - - - - - - - - - Piis-Emwar . . . . . . . . - - - - - - - - - - - - - - Namoluk. . . . . . . . . . - - - - - - - - - - - - - - Ettal. . . . . . . . . . . 1 - - - - - - - - 1 - - - - Lekinioch. . . . . . . . . - - - - - - - - - - - - - - Oneop. . . . . . . . . . . 1 - - - - - - - - 1 - - - - Satowan. . . . . . . . . . - - - - - - - - - - - - - - Kuttu. . . . . . . . . . . - - - - - - - - - - - - - - Moch . . . . . . . . . . . - - - - - - - - - - - - - - Ta . . . . . . . . . . . . - - - - - - - - - - - - - - Pattiw . . . . . . . . . . . 1,170 202 433 370 161 2 2 - - - - - - - Houk . . . . . . . . . . . 202 202 - - - - - - - - - - - - Polowat. . . . . . . . . . 433 - 433 - - - - - - - - - - - Pollap . . . . . . . . . . 370 - - 370 - - - - - - - - - - Tamatam. . . . . . . . . . 165 - - - 161 2 2 - - - - - - - Namonwito. . . . . . . . . . 540 - - - - 58 245 74 64 99 - - - - Makur. . . . . . . . . . . 59 - - - - 56 2 - - 1 - - - - Onoun. . . . . . . . . . . 239 - - - - - 239 - - - - - - - Onou . . . . . . . . . . . 76 - - - - 2 2 71 - 1 - - - - Unanu. . . . . . . . . . . 67 - - - - - - 3 64 - - - - - Piherarh . . . . . . . . . 99 - - - - - 2 - - 97 - - - - Halls. . . . . . . . . . . . 854 - - - - - - - - - 297 134 184 239 Nomwin . . . . . . . . . . 300 - - - - - - - - - 297 3 - - Fananu . . . . . . . . . . 128 - - - - - - - - - - 128 - - Ruo. . . . . . . . . . . . 185 - - - - - - - - - - 1 184 - Murillo. . . . . . . . . . 241 - - - - - - - - - - 2 - 239 Pohnpei. . . . . . . . . . . . 2 - - - - - - - - - - 2 - - Outer Islands. . . . . . . . . - - - - - - - - - - - - - - Kosrae . . . . . . . . . . . . - - - - - - - - - - - - - - Guam . . . . . . . . . . . . . . 2 - - 2 - - - - - - - - - - Northern Mariana Islands . . . . - - - - - - - - - - - - - - Palau. . . . . . . . . . . . . . 1 - - - - - - - - - 1 - - - Marshall Islands . . . . . . . . - - - - - - - - - - - - - - Other Pacific Islands. . . . . . - - - - - - - - - - - - - - Asia . . . . . . . . . . . . . . - - - - - - - - - - - - - - China and Taiwan . . . . . . . - - - - - - - - - - - - - - Philippines. . . . . . . . . . - - - - - - - - - - - - - - Japan. . . . . . . . . . . . . - - - - - - - - - - - - - - Other Asia . . . . . . . . . . - - - - - - - - - - - - - - United States. . . . . . . . . . 1 - - 1 - - - - - - - - - - Hawaii . . . . . . . . . . . . - - - - - - - - - - - - - - Australia/New Zealand. . . . . . 1 - - 1 - - - - - - - - - - Elsewhere. . . . . . . . . . . . - - - - - - - - - - - - - - ─────────────────────────────────────────────────────────────────────────────────────────────────────────── Source: 2000 FSM Census
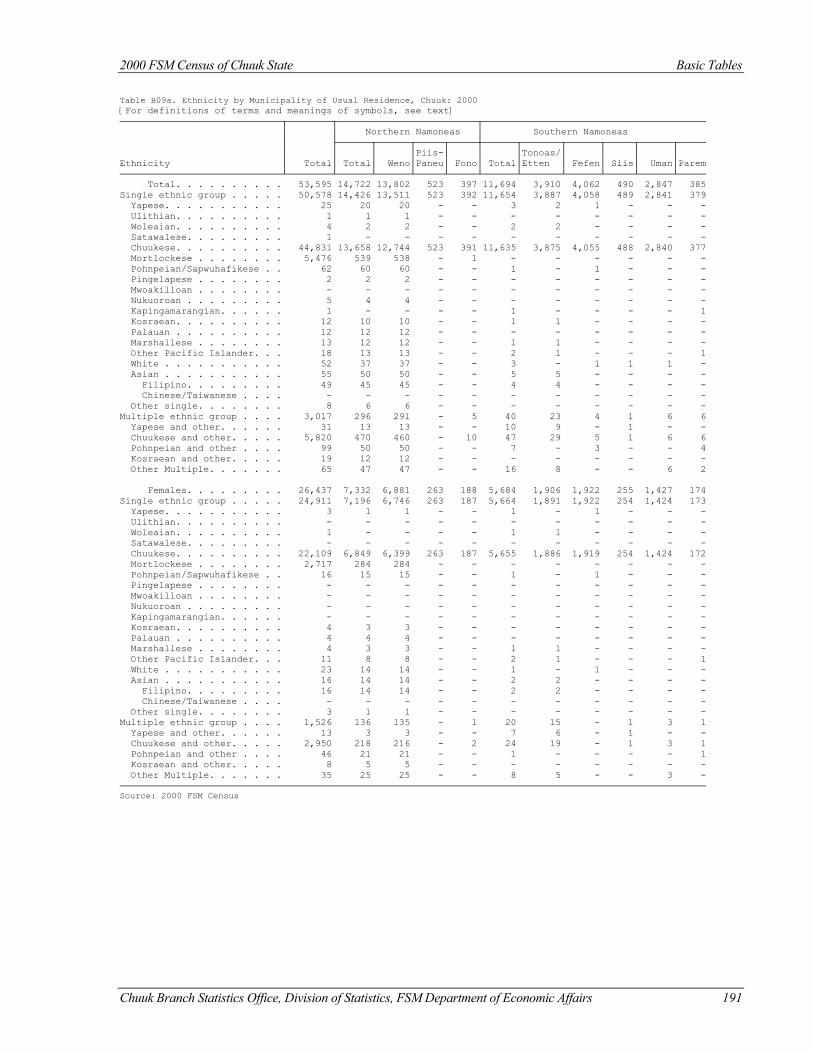
2000 FSM Census of Chuuk State Basic Tables
Chuuk Branch Statistics Office, Division of Statistics, FSM Department of Economic Affairs 191
Table B09a. Ethnicity by Municipality of Usual Residence, Chuuk: 2000 [For definitions of terms and meanings of symbols, see text] ─────────────────────────────┬────────┬─────────────────────────┬──────────────────────────────────────── │ │ Northern Namoneas │ Southern Namoneas │ ├──────┬──────┬─────┬─────┼──────┬───────┬──────┬─────┬──────┬───── │ │ │ │Piis-│ │ │Tonoas/│ │ │ │ Ethnicity │ Total│ Total│ Weno│Paneu│ Fono│ Total│Etten │ Fefen│ Siis│ Uman│Parem ─────────────────────────────┴────────┴──────┴──────┴─────┴─────┴──────┴───────┴──────┴─────┴──────┴───── Total. . . . . . . . . . 53,595 14,722 13,802 523 397 11,694 3,910 4,062 490 2,847 385 Single ethnic group . . . . . 50,578 14,426 13,511 523 392 11,654 3,887 4,058 489 2,841 379 Yapese. . . . . . . . . . . 25 20 20 - - 3 2 1 - - - Ulithian. . . . . . . . . . 1 1 1 - - - - - - - - Woleaian. . . . . . . . . . 4 2 2 - - 2 2 - - - - Satawalese. . . . . . . . . 1 - - - - - - - - - - Chuukese. . . . . . . . . . 44,831 13,658 12,744 523 391 11,635 3,875 4,055 488 2,840 377 Mortlockese . . . . . . . . 5,476 539 538 - 1 - - - - - - Pohnpeian/Sapwuhafikese . . 62 60 60 - - 1 - 1 - - - Pingelapese . . . . . . . . 2 2 2 - - - - - - - - Mwoakilloan . . . . . . . . - - - - - - - - - - - Nukuoroan . . . . . . . . . 5 4 4 - - - - - - - - Kapingamarangian. . . . . . 1 - - - - 1 - - - - 1 Kosraean. . . . . . . . . . 12 10 10 - - 1 1 - - - - Palauan . . . . . . . . . . 12 12 12 - - - - - - - - Marshallese . . . . . . . . 13 12 12 - - 1 1 - - - - Other Pacific Islander. . . 18 13 13 - - 2 1 - - - 1 White . . . . . . . . . . . 52 37 37 - - 3 - 1 1 1 - Asian . . . . . . . . . . . 55 50 50 - - 5 5 - - - - Filipino. . . . . . . . . 49 45 45 - - 4 4 - - - - Chinese/Taiwanese . . . . - - - - - - - - - - - Other single. . . . . . . . 8 6 6 - - - - - - - - Multiple ethnic group . . . . 3,017 296 291 - 5 40 23 4 1 6 6 Yapese and other. . . . . . 31 13 13 - - 10 9 - 1 - - Chuukese and other. . . . . 5,820 470 460 - 10 47 29 5 1 6 6 Pohnpeian and other . . . . 99 50 50 - - 7 - 3 - - 4 Kosraean and other. . . . . 19 12 12 - - - - - - - - Other Multiple. . . . . . . 65 47 47 - - 16 8 - - 6 2 Females. . . . . . . . . 26,437 7,332 6,881 263 188 5,684 1,906 1,922 255 1,427 174 Single ethnic group . . . . . 24,911 7,196 6,746 263 187 5,664 1,891 1,922 254 1,424 173 Yapese. . . . . . . . . . . 3 1 1 - - 1 - 1 - - - Ulithian. . . . . . . . . . - - - - - - - - - - - Woleaian. . . . . . . . . . 1 - - - - 1 1 - - - - Satawalese. . . . . . . . . - - - - - - - - - - - Chuukese. . . . . . . . . . 22,109 6,849 6,399 263 187 5,655 1,886 1,919 254 1,424 172 Mortlockese . . . . . . . . 2,717 284 284 - - - - - - - - Pohnpeian/Sapwuhafikese . . 16 15 15 - - 1 - 1 - - - Pingelapese . . . . . . . . - - - - - - - - - - - Mwoakilloan . . . . . . . . - - - - - - - - - - - Nukuoroan . . . . . . . . . - - - - - - - - - - - Kapingamarangian. . . . . . - - - - - - - - - - - Kosraean. . . . . . . . . . 4 3 3 - - - - - - - - Palauan . . . . . . . . . . 4 4 4 - - - - - - - - Marshallese . . . . . . . . 4 3 3 - - 1 1 - - - - Other Pacific Islander. . . 11 8 8 - - 2 1 - - - 1 White . . . . . . . . . . . 23 14 14 - - 1 - 1 - - - Asian . . . . . . . . . . . 16 14 14 - - 2 2 - - - - Filipino. . . . . . . . . 16 14 14 - - 2 2 - - - - Chinese/Taiwanese . . . . - - - - - - - - - - - Other single. . . . . . . . 3 1 1 - - - - - - - - Multiple ethnic group . . . . 1,526 136 135 - 1 20 15 - 1 3 1 Yapese and other. . . . . . 13 3 3 - - 7 6 - 1 - - Chuukese and other. . . . . 2,950 218 216 - 2 24 19 - 1 3 1 Pohnpeian and other . . . . 46 21 21 - - 1 - - - - 1 Kosraean and other. . . . . 8 5 5 - - - - - - - - Other Multiple. . . . . . . 35 25 25 - - 8 5 - - 3 - ───────────────────────────────────────────────────────────────────────────────────────────────────────── Source: 2000 FSM Census
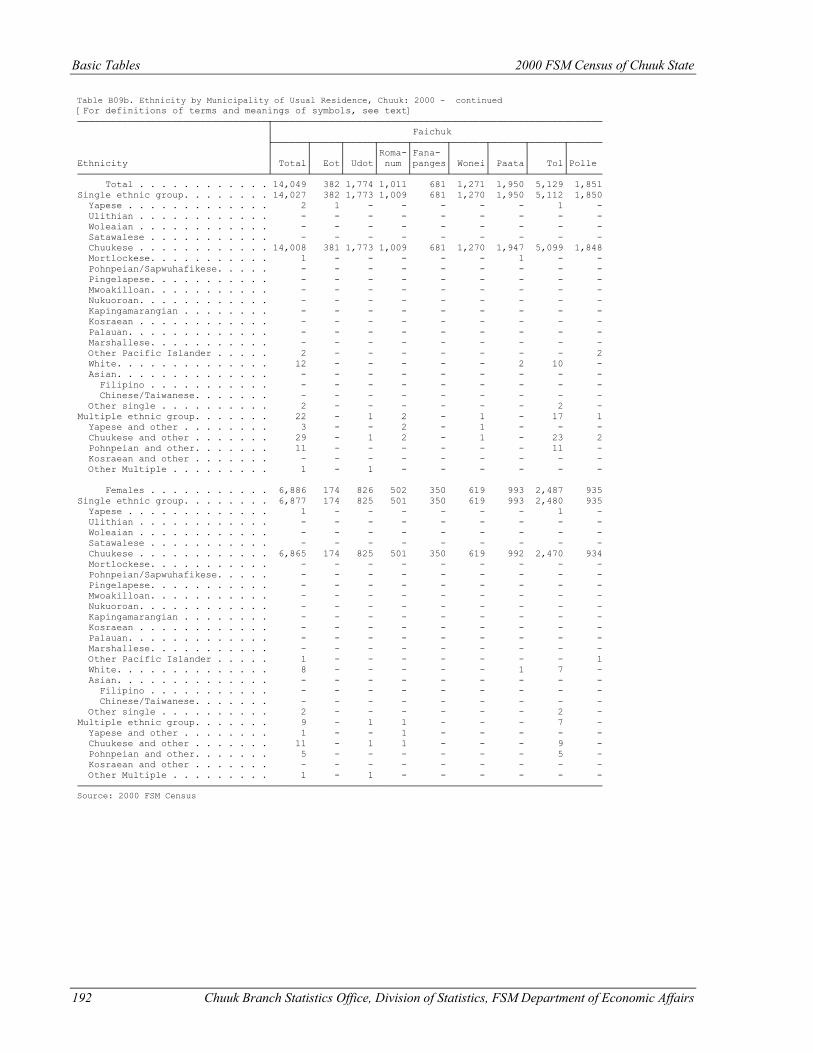
Basic Tables 2000 FSM Census of Chuuk State
192 Chuuk Branch Statistics Office, Division of Statistics, FSM Department of Economic Affairs
Table B09b. Ethnicity by Municipality of Usual Residence, Chuuk: 2000 - continued [For definitions of terms and meanings of symbols, see text] ──────────────────────────────────┬─────────────────────────────────────────────────────────── │ Faichuk ├──────┬─────┬─────┬─────┬──────┬──────┬──────┬──────┬────── │ │ │ │Roma-│Fana- │ │ │ │ Ethnicity │ Total│ Eot│ Udot│ num │panges│ Wonei│ Paata│ Tol│Polle ──────────────────────────────────┴──────┴─────┴─────┴─────┴──────┴──────┴──────┴──────┴────── Total . . . . . . . . . . . . 14,049 382 1,774 1,011 681 1,271 1,950 5,129 1,851 Single ethnic group. . . . . . . . 14,027 382 1,773 1,009 681 1,270 1,950 5,112 1,850 Yapese . . . . . . . . . . . . . 2 1 - - - - - 1 - Ulithian . . . . . . . . . . . . - - - - - - - - - Woleaian . . . . . . . . . . . . - - - - - - - - - Satawalese . . . . . . . . . . . - - - - - - - - - Chuukese . . . . . . . . . . . . 14,008 381 1,773 1,009 681 1,270 1,947 5,099 1,848 Mortlockese. . . . . . . . . . . 1 - - - - - 1 - - Pohnpeian/Sapwuhafikese. . . . . - - - - - - - - - Pingelapese. . . . . . . . . . . - - - - - - - - - Mwoakilloan. . . . . . . . . . . - - - - - - - - - Nukuoroan. . . . . . . . . . . . - - - - - - - - - Kapingamarangian . . . . . . . . - - - - - - - - - Kosraean . . . . . . . . . . . . - - - - - - - - - Palauan. . . . . . . . . . . . . - - - - - - - - - Marshallese. . . . . . . . . . . - - - - - - - - - Other Pacific Islander . . . . . 2 - - - - - - - 2 White. . . . . . . . . . . . . . 12 - - - - - 2 10 - Asian. . . . . . . . . . . . . . - - - - - - - - - Filipino . . . . . . . . . . . - - - - - - - - - Chinese/Taiwanese. . . . . . . - - - - - - - - - Other single . . . . . . . . . . 2 - - - - - - 2 - Multiple ethnic group. . . . . . . 22 - 1 2 - 1 - 17 1 Yapese and other . . . . . . . . 3 - - 2 - 1 - - - Chuukese and other . . . . . . . 29 - 1 2 - 1 - 23 2 Pohnpeian and other. . . . . . . 11 - - - - - - 11 - Kosraean and other . . . . . . . - - - - - - - - - Other Multiple . . . . . . . . . 1 - 1 - - - - - - Females . . . . . . . . . . . 6,886 174 826 502 350 619 993 2,487 935 Single ethnic group. . . . . . . . 6,877 174 825 501 350 619 993 2,480 935 Yapese . . . . . . . . . . . . . 1 - - - - - - 1 - Ulithian . . . . . . . . . . . . - - - - - - - - - Woleaian . . . . . . . . . . . . - - - - - - - - - Satawalese . . . . . . . . . . . - - - - - - - - - Chuukese . . . . . . . . . . . . 6,865 174 825 501 350 619 992 2,470 934 Mortlockese. . . . . . . . . . . - - - - - - - - - Pohnpeian/Sapwuhafikese. . . . . - - - - - - - - - Pingelapese. . . . . . . . . . . - - - - - - - - - Mwoakilloan. . . . . . . . . . . - - - - - - - - - Nukuoroan. . . . . . . . . . . . - - - - - - - - - Kapingamarangian . . . . . . . . - - - - - - - - - Kosraean . . . . . . . . . . . . - - - - - - - - - Palauan. . . . . . . . . . . . . - - - - - - - - - Marshallese. . . . . . . . . . . - - - - - - - - - Other Pacific Islander . . . . . 1 - - - - - - - 1 White. . . . . . . . . . . . . . 8 - - - - - 1 7 - Asian. . . . . . . . . . . . . . - - - - - - - - - Filipino . . . . . . . . . . . - - - - - - - - - Chinese/Taiwanese. . . . . . . - - - - - - - - - Other single . . . . . . . . . . 2 - - - - - - 2 - Multiple ethnic group. . . . . . . 9 - 1 1 - - - 7 - Yapese and other . . . . . . . . 1 - - 1 - - - - - Chuukese and other . . . . . . . 11 - 1 1 - - - 9 - Pohnpeian and other. . . . . . . 5 - - - - - - 5 - Kosraean and other . . . . . . . - - - - - - - - - Other Multiple . . . . . . . . . 1 - 1 - - - - - - ────────────────────────────────────────────────────────────────────────────────────────────── Source: 2000 FSM Census
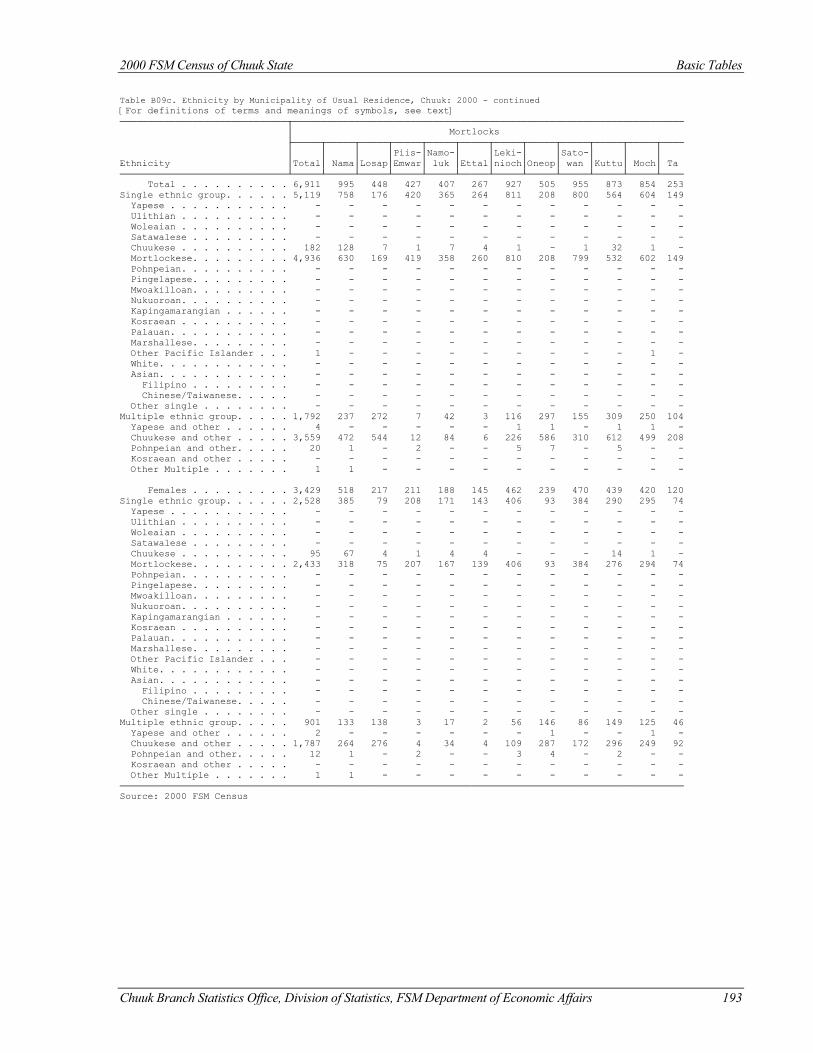
2000 FSM Census of Chuuk State Basic Tables
Chuuk Branch Statistics Office, Division of Statistics, FSM Department of Economic Affairs 193
Table B09c. Ethnicity by Municipality of Usual Residence, Chuuk: 2000 - continued [For definitions of terms and meanings of symbols, see text] ──────────────────────────────┬────────────────────────────────────────────────────────────────────── │ Mortlocks ├─────┬─────┬─────┬─────┬─────┬─────┬─────┬─────┬─────┬─────┬─────┬──── │ │ │ │Piis-│Namo-│ │Leki-│ │Sato-│ │ │ Ethnicity │Total│ Nama│Losap│Emwar│ luk │Ettal│nioch│Oneop│ wan │Kuttu│ Moch│ Ta ──────────────────────────────┴─────┴─────┴─────┴─────┴─────┴─────┴─────┴─────┴─────┴─────┴─────┴──── Total . . . . . . . . . . 6,911 995 448 427 407 267 927 505 955 873 854 253 Single ethnic group. . . . . . 5,119 758 176 420 365 264 811 208 800 564 604 149 Yapese . . . . . . . . . . . - - - - - - - - - - - - Ulithian . . . . . . . . . . - - - - - - - - - - - - Woleaian . . . . . . . . . . - - - - - - - - - - - - Satawalese . . . . . . . . . - - - - - - - - - - - - Chuukese . . . . . . . . . . 182 128 7 1 7 4 1 - 1 32 1 - Mortlockese. . . . . . . . . 4,936 630 169 419 358 260 810 208 799 532 602 149 Pohnpeian. . . . . . . . . . - - - - - - - - - - - - Pingelapese. . . . . . . . . - - - - - - - - - - - - Mwoakilloan. . . . . . . . . - - - - - - - - - - - - Nukuoroan. . . . . . . . . . - - - - - - - - - - - - Kapingamarangian . . . . . . - - - - - - - - - - - - Kosraean . . . . . . . . . . - - - - - - - - - - - - Palauan. . . . . . . . . . . - - - - - - - - - - - - Marshallese. . . . . . . . . - - - - - - - - - - - - Other Pacific Islander . . . 1 - - - - - - - - - 1 - White. . . . . . . . . . . . - - - - - - - - - - - - Asian. . . . . . . . . . . . - - - - - - - - - - - - Filipino . . . . . . . . . - - - - - - - - - - - - Chinese/Taiwanese. . . . . - - - - - - - - - - - - Other single . . . . . . . . - - - - - - - - - - - - Multiple ethnic group. . . . . 1,792 237 272 7 42 3 116 297 155 309 250 104 Yapese and other . . . . . . 4 - - - - - 1 1 - 1 1 - Chuukese and other . . . . . 3,559 472 544 12 84 6 226 586 310 612 499 208 Pohnpeian and other. . . . . 20 1 - 2 - - 5 7 - 5 - - Kosraean and other . . . . . - - - - - - - - - - - - Other Multiple . . . . . . . 1 1 - - - - - - - - - - Females . . . . . . . . . 3,429 518 217 211 188 145 462 239 470 439 420 120 Single ethnic group. . . . . . 2,528 385 79 208 171 143 406 93 384 290 295 74 Yapese . . . . . . . . . . . - - - - - - - - - - - - Ulithian . . . . . . . . . . - - - - - - - - - - - - Woleaian . . . . . . . . . . - - - - - - - - - - - - Satawalese . . . . . . . . . - - - - - - - - - - - - Chuukese . . . . . . . . . . 95 67 4 1 4 4 - - - 14 1 - Mortlockese. . . . . . . . . 2,433 318 75 207 167 139 406 93 384 276 294 74 Pohnpeian. . . . . . . . . . - - - - - - - - - - - - Pingelapese. . . . . . . . . - - - - - - - - - - - - Mwoakilloan. . . . . . . . . - - - - - - - - - - - - Nukuoroan. . . . . . . . . . - - - - - - - - - - - - Kapingamarangian . . . . . . - - - - - - - - - - - - Kosraean . . . . . . . . . . - - - - - - - - - - - - Palauan. . . . . . . . . . . - - - - - - - - - - - - Marshallese. . . . . . . . . - - - - - - - - - - - - Other Pacific Islander . . . - - - - - - - - - - - - White. . . . . . . . . . . . - - - - - - - - - - - - Asian. . . . . . . . . . . . - - - - - - - - - - - - Filipino . . . . . . . . . - - - - - - - - - - - - Chinese/Taiwanese. . . . . - - - - - - - - - - - - Other single . . . . . . . . - - - - - - - - - - - - Multiple ethnic group. . . . . 901 133 138 3 17 2 56 146 86 149 125 46 Yapese and other . . . . . . 2 - - - - - - 1 - - 1 - Chuukese and other . . . . . 1,787 264 276 4 34 4 109 287 172 296 249 92 Pohnpeian and other. . . . . 12 1 - 2 - - 3 4 - 2 - - Kosraean and other . . . . . - - - - - - - - - - - - Other Multiple . . . . . . . 1 1 - - - - - - - - - - ───────────────────────────────────────────────────────────────────────────────────────────────────── Source: 2000 FSM Census
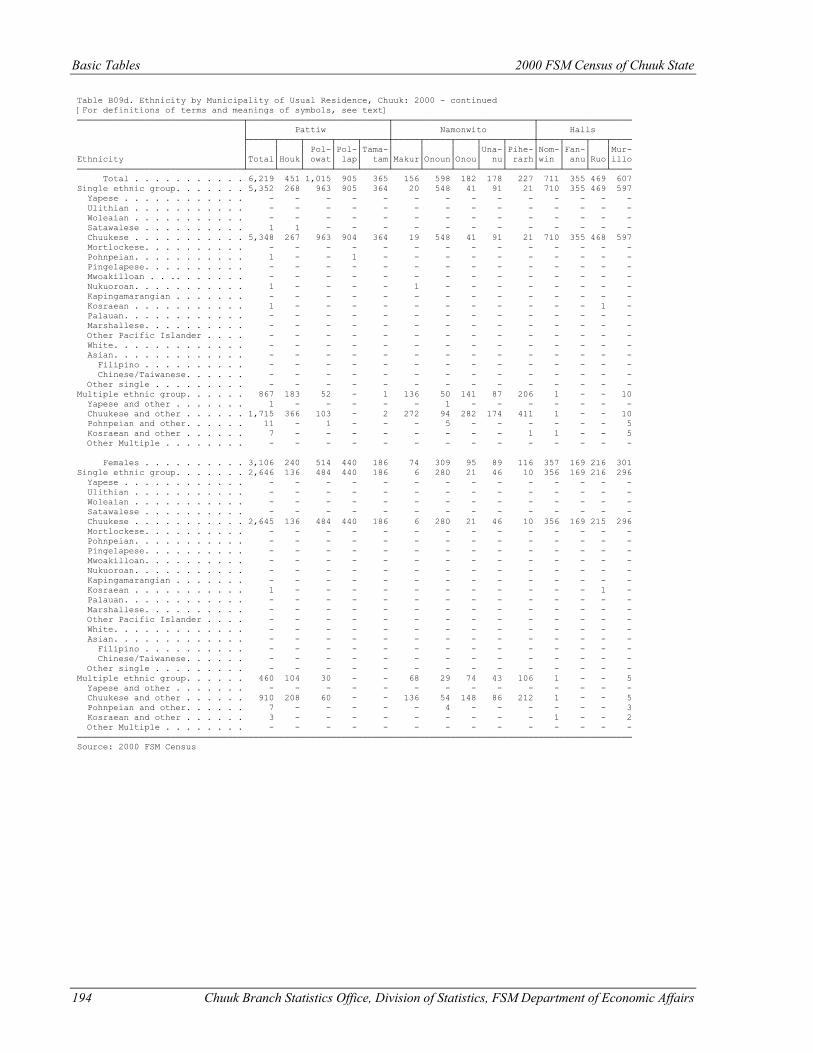
Basic Tables 2000 FSM Census of Chuuk State
194 Chuuk Branch Statistics Office, Division of Statistics, FSM Department of Economic Affairs
Table B09d. Ethnicity by Municipality of Usual Residence, Chuuk: 2000 - continued [For definitions of terms and meanings of symbols, see text] ────────────────────────────────┬───────────────────────────┬───────────────────────────┬────────────────── │ Pattiw │ Namonwito │ Halls ├─────┬────┬─────┬────┬─────┼─────┬─────┬────┬────┬─────┼────┬────┬───┬──── │ │ │ Pol-│Pol-│Tama-│ │ │ │Una-│Pihe-│Nom-│Fan-│ │Mur- Ethnicity │Total│Houk│ owat│ lap│ tam│Makur│Onoun│Onou│ nu│ rarh│win │ anu│Ruo│illo ────────────────────────────────┴─────┴────┴─────┴────┴─────┴─────┴─────┴────┴────┴─────┴────┴────┴───┴──── Total . . . . . . . . . . . 6,219 451 1,015 905 365 156 598 182 178 227 711 355 469 607 Single ethnic group. . . . . . . 5,352 268 963 905 364 20 548 41 91 21 710 355 469 597 Yapese . . . . . . . . . . . . - - - - - - - - - - - - - - Ulithian . . . . . . . . . . . - - - - - - - - - - - - - - Woleaian . . . . . . . . . . . - - - - - - - - - - - - - - Satawalese . . . . . . . . . . 1 1 - - - - - - - - - - - - Chuukese . . . . . . . . . . . 5,348 267 963 904 364 19 548 41 91 21 710 355 468 597 Mortlockese. . . . . . . . . . - - - - - - - - - - - - - - Pohnpeian. . . . . . . . . . . 1 - - 1 - - - - - - - - - - Pingelapese. . . . . . . . . . - - - - - - - - - - - - - - Mwoakilloan . . .. . . . . . . - - - - - - - - - - - - - - Nukuoroan. . . . . . . . . . . 1 - - - - 1 - - - - - - - - Kapingamarangian . . . . . . . - - - - - - - - - - - - - - Kosraean . . . . . . . . . . . 1 - - - - - - - - - - - 1 - Palauan. . . . . . . . . . . . - - - - - - - - - - - - - - Marshallese. . . . . . . . . . - - - - - - - - - - - - - - Other Pacific Islander . . . . - - - - - - - - - - - - - - White. . . . . . . . . . . . . - - - - - - - - - - - - - - Asian. . . . . . . . . . . . . - - - - - - - - - - - - - - Filipino . . . . . . . . . . - - - - - - - - - - - - - - Chinese/Taiwanese. . . . . . - - - - - - - - - - - - - - Other single . . . . . . . . . - - - - - - - - - - - - - - Multiple ethnic group. . . . . . 867 183 52 - 1 136 50 141 87 206 1 - - 10 Yapese and other . . . . . . . 1 - - - - - 1 - - - - - - - Chuukese and other . . . . . . 1,715 366 103 - 2 272 94 282 174 411 1 - - 10 Pohnpeian and other. . . . . . 11 - 1 - - - 5 - - - - - - 5 Kosraean and other . . . . . . 7 - - - - - - - - 1 1 - - 5 Other Multiple . . . . . . . . - - - - - - - - - - - - - - Females . . . . . . . . . . 3,106 240 514 440 186 74 309 95 89 116 357 169 216 301 Single ethnic group. . . . . . . 2,646 136 484 440 186 6 280 21 46 10 356 169 216 296 Yapese . . . . . . . . . . . . - - - - - - - - - - - - - - Ulithian . . . . . . . . . . . - - - - - - - - - - - - - - Woleaian . . . . . . . . . . . - - - - - - - - - - - - - - Satawalese . . . . . . . . . . - - - - - - - - - - - - - - Chuukese . . . . . . . . . . . 2,645 136 484 440 186 6 280 21 46 10 356 169 215 296 Mortlockese. . . . . . . . . . - - - - - - - - - - - - - - Pohnpeian. . . . . . . . . . . - - - - - - - - - - - - - - Pingelapese. . . . . . . . . . - - - - - - - - - - - - - - Mwoakilloan. . . . . . . . . . - - - - - - - - - - - - - - Nukuoroan. . . . . . . . . . . - - - - - - - - - - - - - - Kapingamarangian . . . . . . . - - - - - - - - - - - - - - Kosraean . . . . . . . . . . . 1 - - - - - - - - - - - 1 - Palauan. . . . . . . . . . . . - - - - - - - - - - - - - - Marshallese. . . . . . . . . . - - - - - - - - - - - - - - Other Pacific Islander . . . . - - - - - - - - - - - - - - White. . . . . . . . . . . . . - - - - - - - - - - - - - - Asian. . . . . . . . . . . . . - - - - - - - - - - - - - - Filipino . . . . . . . . . . - - - - - - - - - - - - - - Chinese/Taiwanese. . . . . . - - - - - - - - - - - - - - Other single . . . . . . . . . - - - - - - - - - - - - - - Multiple ethnic group. . . . . . 460 104 30 - - 68 29 74 43 106 1 - - 5 Yapese and other . . . . . . . - - - - - - - - - - - - - - Chuukese and other . . . . . . 910 208 60 - - 136 54 148 86 212 1 - - 5 Pohnpeian and other. . . . . . 7 - - - - - 4 - - - - - - 3 Kosraean and other . . . . . . 3 - - - - - - - - - 1 - - 2 Other Multiple . . . . . . . . - - - - - - - - - - - - - - ─────────────────────────────────────────────────────────────────────────────────────────────────────────── Source: 2000 FSM Census
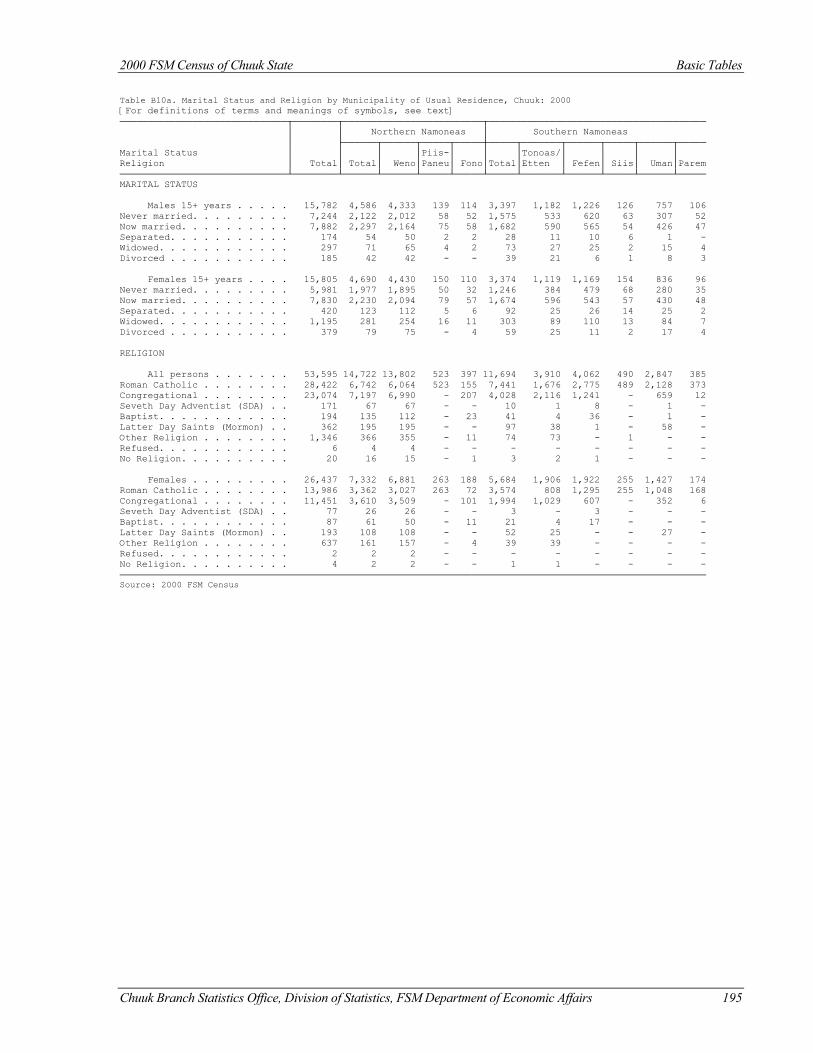
2000 FSM Census of Chuuk State Basic Tables
Chuuk Branch Statistics Office, Division of Statistics, FSM Department of Economic Affairs 195
Table B10a. Marital Status and Religion by Municipality of Usual Residence, Chuuk: 2000 [For definitions of terms and meanings of symbols, see text] ──────────────────────────────┬────────┬─────────────────────────┬─────────────────────────────────────── │ │ Northern Namoneas │ Southern Namoneas │ ├──────┬──────┬─────┬─────┼─────┬───────┬──────┬─────┬──────┬───── Marital Status │ │ │ │Piis-│ │ │Tonoas/│ │ │ │ Religion │ Total│ Total│ Weno│Paneu│ Fono│Total│Etten │ Fefen│ Siis│ Uman│Parem ──────────────────────────────┴────────┴──────┴──────┴─────┴─────┴─────┴───────┴──────┴─────┴──────┴───── MARITAL STATUS Males 15+ years . . . . . 15,782 4,586 4,333 139 114 3,397 1,182 1,226 126 757 106 Never married. . . . . . . . . 7,244 2,122 2,012 58 52 1,575 533 620 63 307 52 Now married. . . . . . . . . . 7,882 2,297 2,164 75 58 1,682 590 565 54 426 47 Separated. . . . . . . . . . . 174 54 50 2 2 28 11 10 6 1 - Widowed. . . . . . . . . . . . 297 71 65 4 2 73 27 25 2 15 4 Divorced . . . . . . . . . . . 185 42 42 - - 39 21 6 1 8 3 Females 15+ years . . . . 15,805 4,690 4,430 150 110 3,374 1,119 1,169 154 836 96 Never married. . . . . . . . . 5,981 1,977 1,895 50 32 1,246 384 479 68 280 35 Now married. . . . . . . . . . 7,830 2,230 2,094 79 57 1,674 596 543 57 430 48 Separated. . . . . . . . . . . 420 123 112 5 6 92 25 26 14 25 2 Widowed. . . . . . . . . . . . 1,195 281 254 16 11 303 89 110 13 84 7 Divorced . . . . . . . . . . . 379 79 75 - 4 59 25 11 2 17 4 RELIGION All persons . . . . . . . 53,595 14,722 13,802 523 397 11,694 3,910 4,062 490 2,847 385 Roman Catholic . . . . . . . . 28,422 6,742 6,064 523 155 7,441 1,676 2,775 489 2,128 373 Congregational . . . . . . . . 23,074 7,197 6,990 - 207 4,028 2,116 1,241 - 659 12 Seveth Day Adventist (SDA) . . 171 67 67 - - 10 1 8 - 1 - Baptist. . . . . . . . . . . . 194 135 112 - 23 41 4 36 - 1 - Latter Day Saints (Mormon) . . 362 195 195 - - 97 38 1 - 58 - Other Religion . . . . . . . . 1,346 366 355 - 11 74 73 - 1 - - Refused. . . . . . . . . . . . 6 4 4 - - - - - - - - No Religion. . . . . . . . . . 20 16 15 - 1 3 2 1 - - - Females . . . . . . . . . 26,437 7,332 6,881 263 188 5,684 1,906 1,922 255 1,427 174 Roman Catholic . . . . . . . . 13,986 3,362 3,027 263 72 3,574 808 1,295 255 1,048 168 Congregational . . . . . . . . 11,451 3,610 3,509 - 101 1,994 1,029 607 - 352 6 Seveth Day Adventist (SDA) . . 77 26 26 - - 3 - 3 - - - Baptist. . . . . . . . . . . . 87 61 50 - 11 21 4 17 - - - Latter Day Saints (Mormon) . . 193 108 108 - - 52 25 - - 27 - Other Religion . . . . . . . . 637 161 157 - 4 39 39 - - - - Refused. . . . . . . . . . . . 2 2 2 - - - - - - - - No Religion. . . . . . . . . . 4 2 2 - - 1 1 - - - - ───────────────────────────────────────────────────────────────────────────────────────────────────────── Source: 2000 FSM Census
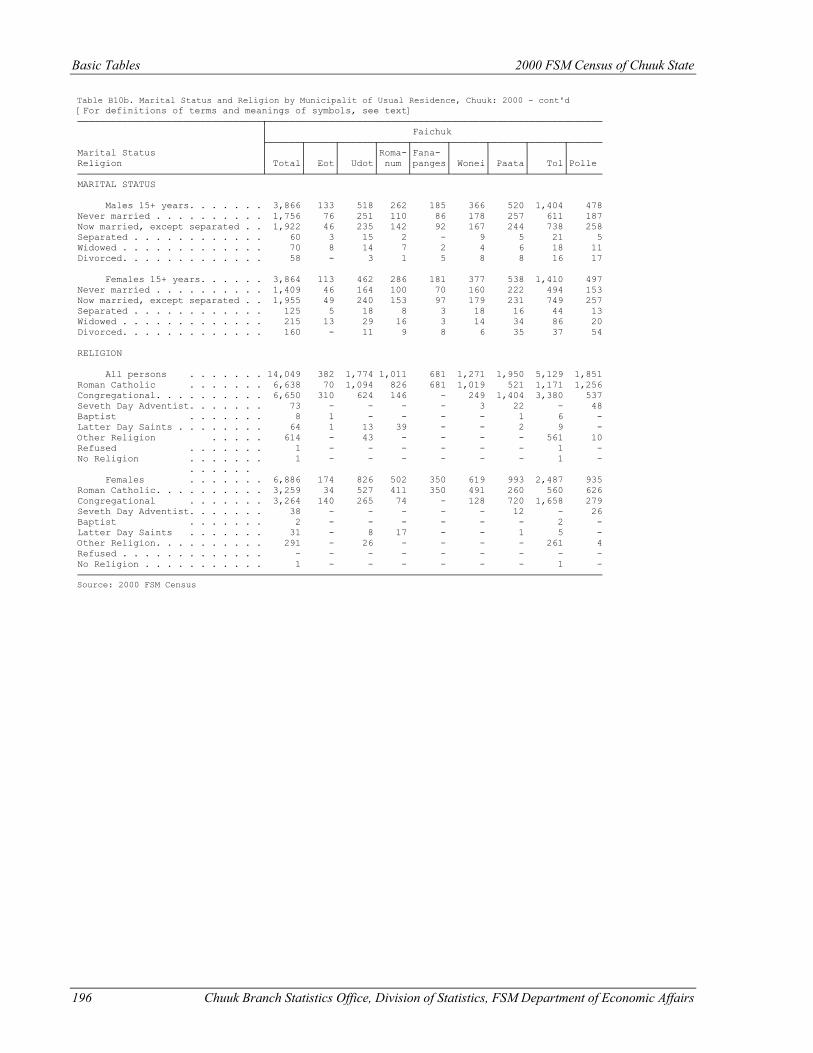
Basic Tables 2000 FSM Census of Chuuk State
196 Chuuk Branch Statistics Office, Division of Statistics, FSM Department of Economic Affairs
Table B10b. Marital Status and Religion by Municipalit of Usual Residence, Chuuk: 2000 - cont'd [For definitions of terms and meanings of symbols, see text] ─────────────────────────────────┬──────────────────────────────────────────────────────────── │ Faichuk ├──────┬─────┬──────┬─────┬──────┬──────┬──────┬──────┬────── Marital Status │ │ │ │Roma-│Fana- │ │ │ │ Religion │ Total│ Eot│ Udot│ num │panges│ Wonei│ Paata│ Tol│Polle ─────────────────────────────────┴──────┴─────┴──────┴─────┴──────┴──────┴──────┴──────┴────── MARITAL STATUS Males 15+ years. . . . . . . 3,866 133 518 262 185 366 520 1,404 478 Never married . . . . . . . . . . 1,756 76 251 110 86 178 257 611 187 Now married, except separated . . 1,922 46 235 142 92 167 244 738 258 Separated . . . . . . . . . . . . 60 3 15 2 - 9 5 21 5 Widowed . . . . . . . . . . . . . 70 8 14 7 2 4 6 18 11 Divorced. . . . . . . . . . . . . 58 - 3 1 5 8 8 16 17 Females 15+ years. . . . . . 3,864 113 462 286 181 377 538 1,410 497 Never married . . . . . . . . . . 1,409 46 164 100 70 160 222 494 153 Now married, except separated . . 1,955 49 240 153 97 179 231 749 257 Separated . . . . . . . . . . . . 125 5 18 8 3 18 16 44 13 Widowed . . . . . . . . . . . . . 215 13 29 16 3 14 34 86 20 Divorced. . . . . . . . . . . . . 160 - 11 9 8 6 35 37 54 RELIGION All persons . . . . . . . 14,049 382 1,774 1,011 681 1,271 1,950 5,129 1,851 Roman Catholic . . . . . . . 6,638 70 1,094 826 681 1,019 521 1,171 1,256 Congregational. . . . . . . . . . 6,650 310 624 146 - 249 1,404 3,380 537 Seveth Day Adventist. . . . . . . 73 - - - - 3 22 - 48 Baptist . . . . . . . 8 1 - - - - 1 6 - Latter Day Saints . . . . . . . . 64 1 13 39 - - 2 9 - Other Religion . . . . . 614 - 43 - - - - 561 10 Refused . . . . . . . 1 - - - - - - 1 - No Religion . . . . . . . 1 - - - - - - 1 - . . . . . . Females . . . . . . . 6,886 174 826 502 350 619 993 2,487 935 Roman Catholic. . . . . . . . . . 3,259 34 527 411 350 491 260 560 626 Congregational . . . . . . . 3,264 140 265 74 - 128 720 1,658 279 Seveth Day Adventist. . . . . . . 38 - - - - - 12 - 26 Baptist . . . . . . . 2 - - - - - - 2 - Latter Day Saints . . . . . . . 31 - 8 17 - - 1 5 - Other Religion. . . . . . . . . . 291 - 26 - - - - 261 4 Refused . . . . . . . . . . . . . - - - - - - - - - No Religion . . . . . . . . . . . 1 - - - - - - 1 - ────────────────────────────────────────────────────────────────────────────────────────────── Source: 2000 FSM Census
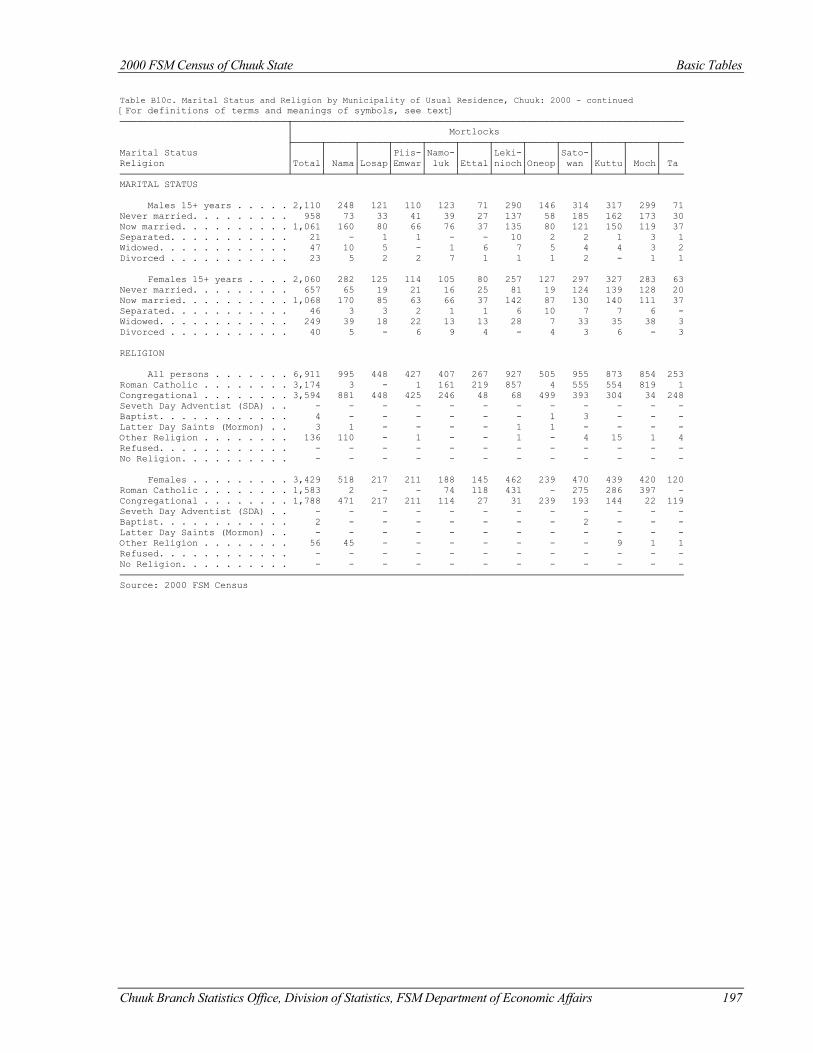
2000 FSM Census of Chuuk State Basic Tables
Chuuk Branch Statistics Office, Division of Statistics, FSM Department of Economic Affairs 197
Table B10c. Marital Status and Religion by Municipality of Usual Residence, Chuuk: 2000 - continued [For definitions of terms and meanings of symbols, see text] ──────────────────────────────┬────────────────────────────────────────────────────────────────────── │ Mortlocks ├─────┬─────┬─────┬─────┬─────┬─────┬─────┬─────┬─────┬─────┬─────┬──── Marital Status │ │ │ │Piis-│Namo-│ │Leki-│ │Sato-│ │ │ Religion │Total│ Nama│Losap│Emwar│ luk │Ettal│nioch│Oneop│ wan │Kuttu│ Moch│ Ta ──────────────────────────────┴─────┴─────┴─────┴─────┴─────┴─────┴─────┴─────┴─────┴─────┴─────┴──── MARITAL STATUS Males 15+ years . . . . . 2,110 248 121 110 123 71 290 146 314 317 299 71 Never married. . . . . . . . . 958 73 33 41 39 27 137 58 185 162 173 30 Now married. . . . . . . . . . 1,061 160 80 66 76 37 135 80 121 150 119 37 Separated. . . . . . . . . . . 21 - 1 1 - - 10 2 2 1 3 1 Widowed. . . . . . . . . . . . 47 10 5 - 1 6 7 5 4 4 3 2 Divorced . . . . . . . . . . . 23 5 2 2 7 1 1 1 2 - 1 1 Females 15+ years . . . . 2,060 282 125 114 105 80 257 127 297 327 283 63 Never married. . . . . . . . . 657 65 19 21 16 25 81 19 124 139 128 20 Now married. . . . . . . . . . 1,068 170 85 63 66 37 142 87 130 140 111 37 Separated. . . . . . . . . . . 46 3 3 2 1 1 6 10 7 7 6 - Widowed. . . . . . . . . . . . 249 39 18 22 13 13 28 7 33 35 38 3 Divorced . . . . . . . . . . . 40 5 - 6 9 4 - 4 3 6 - 3 RELIGION All persons . . . . . . . 6,911 995 448 427 407 267 927 505 955 873 854 253 Roman Catholic . . . . . . . . 3,174 3 - 1 161 219 857 4 555 554 819 1 Congregational . . . . . . . . 3,594 881 448 425 246 48 68 499 393 304 34 248 Seveth Day Adventist (SDA) . . - - - - - - - - - - - - Baptist. . . . . . . . . . . . 4 - - - - - - 1 3 - - - Latter Day Saints (Mormon) . . 3 1 - - - - 1 1 - - - - Other Religion . . . . . . . . 136 110 - 1 - - 1 - 4 15 1 4 Refused. . . . . . . . . . . . - - - - - - - - - - - - No Religion. . . . . . . . . . - - - - - - - - - - - - Females . . . . . . . . . 3,429 518 217 211 188 145 462 239 470 439 420 120 Roman Catholic . . . . . . . . 1,583 2 - - 74 118 431 - 275 286 397 - Congregational . . . . . . . . 1,788 471 217 211 114 27 31 239 193 144 22 119 Seveth Day Adventist (SDA) . . - - - - - - - - - - - - Baptist. . . . . . . . . . . . 2 - - - - - - - 2 - - - Latter Day Saints (Mormon) . . - - - - - - - - - - - - Other Religion . . . . . . . . 56 45 - - - - - - - 9 1 1 Refused. . . . . . . . . . . . - - - - - - - - - - - - No Religion. . . . . . . . . . - - - - - - - - - - - - ───────────────────────────────────────────────────────────────────────────────────────────────────── Source: 2000 FSM Census
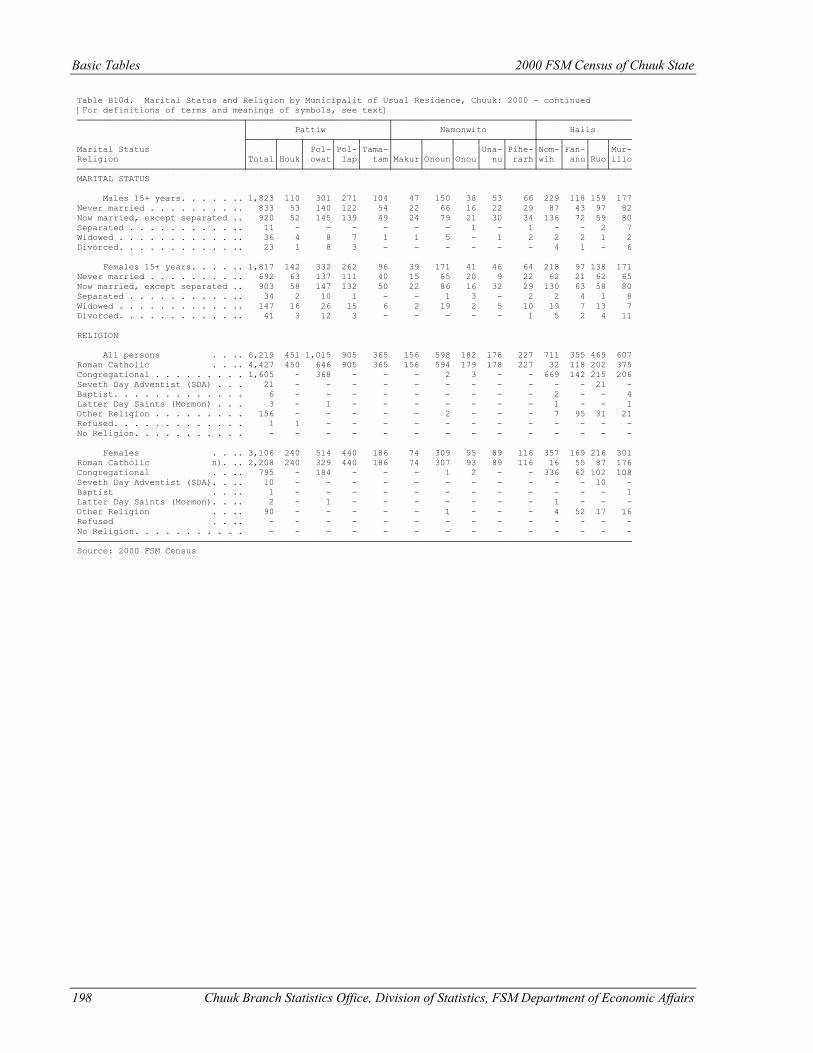
Basic Tables 2000 FSM Census of Chuuk State
198 Chuuk Branch Statistics Office, Division of Statistics, FSM Department of Economic Affairs
Table B10d. Marital Status and Religion by Municipalit of Usual Residence, Chuuk: 2000 - continued [For definitions of terms and meanings of symbols, see text] ────────────────────────────────┬───────────────────────────┬───────────────────────────┬────────────────── │ Pattiw │ Namonwito │ Halls ├─────┬────┬─────┬────┬─────┼─────┬─────┬────┬────┬─────┼────┬────┬───┬──── Marital Status │ │ │ Pol-│Pol-│Tama-│ │ │ │Una-│Pihe-│Nom-│Fan-│ │Mur- Religion │Total│Houk│ owat│ lap│ tam│Makur│Onoun│Onou│ nu│ rarh│win │ anu│Ruo│illo ────────────────────────────────┴─────┴────┴─────┴────┴─────┴─────┴─────┴────┴────┴─────┴────┴────┴───┴──── MARITAL STATUS Males 15+ years. . . . . .. 1,823 110 301 271 104 47 150 38 53 66 229 118 159 177 Never married . . . . . . . . .. 833 53 140 122 54 22 66 16 22 29 87 43 97 82 Now married, except separated .. 920 52 145 139 49 24 79 21 30 34 136 72 59 80 Separated . . . . . . . . . . .. 11 - - - - - - 1 - 1 - - 2 7 Widowed . . . . . . . . . . . .. 36 4 8 7 1 1 5 - 1 2 2 2 1 2 Divorced. . . . . . . . . . . .. 23 1 8 3 - - - - - - 4 1 - 6 Females 15+ years. . . . .. 1,817 142 332 262 96 39 171 41 46 64 218 97 138 171 Never married . . . . . . . . .. 692 63 137 111 40 15 65 20 9 22 62 21 62 65 Now married, except separated .. 903 58 147 132 50 22 86 16 32 29 130 63 58 80 Separated . . . . . . . . . . .. 34 2 10 1 - - 1 3 - 2 2 4 1 8 Widowed . . . . . . . . . . . .. 147 16 26 15 6 2 19 2 5 10 19 7 13 7 Divorced. . . . . . . . . . . .. 41 3 12 3 - - - - - 1 5 2 4 11 RELIGION All persons . . .. 6,219 451 1,015 905 365 156 598 182 178 227 711 355 469 607 Roman Catholic . . .. 4,427 450 646 905 365 156 594 179 178 227 32 118 202 375 Congregational . . . . . . . . . 1,605 - 368 - - - 2 3 - - 669 142 215 206 Seveth Day Adventist (SDA) . . . 21 - - - - - - - - - - - 21 - Baptist. . . . . . . . . . . . . 6 - - - - - - - - - 2 - - 4 Latter Day Saints (Mormon) . . . 3 - 1 - - - - - - - 1 - - 1 Other Religion . . . . . . . . . 156 - - - - - 2 - - - 7 95 31 21 Refused. . . . . . . . . . . . . 1 1 - - - - - - - - - - - - No Religion. . . . . . . . . . . - - - - - - - - - - - - - - Females . . .. 3,106 240 514 440 186 74 309 95 89 116 357 169 216 301 Roman Catholic n). .. 2,208 240 329 440 186 74 307 93 89 116 16 55 87 176 Congregational . . .. 795 - 184 - - - 1 2 - - 336 62 102 108 Seveth Day Adventist (SDA). . .. 10 - - - - - - - - - - - 10 - Baptist . . .. 1 - - - - - - - - - - - - 1 Latter Day Saints (Mormon). . .. 2 - 1 - - - - - - - 1 - - - Other Religion . . .. 90 - - - - - 1 - - - 4 52 17 16 Refused . . .. - - - - - - - - - - - - - - No Religion. . . . . . . . . . . - - - - - - - - - - - - - - ─────────────────────────────────────────────────────────────────────────────────────────────────────────── Source: 2000 FSM Census
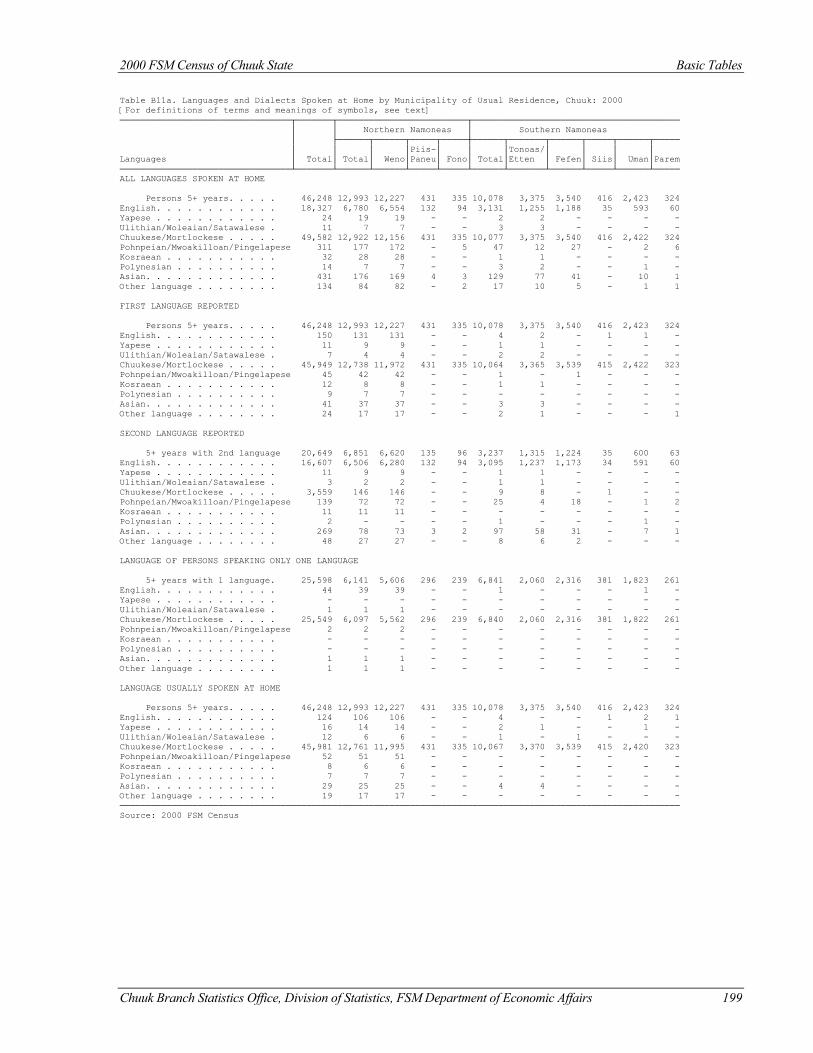
2000 FSM Census of Chuuk State Basic Tables
Chuuk Branch Statistics Office, Division of Statistics, FSM Department of Economic Affairs 199
Table B11a. Languages and Dialects Spoken at Home by Municipality of Usual Residence, Chuuk: 2000 [For definitions of terms and meanings of symbols, see text] ─────────────────────────────────┬───────┬─────────────────────────┬──────────────────────────────────────── │ │ Northern Namoneas │ Southern Namoneas │ ├──────┬──────┬─────┬─────┼──────┬───────┬──────┬─────┬──────┬───── │ │ │ │Piis-│ │ │Tonoas/│ │ │ │ Languages │ Total│ Total│ Weno│Paneu│ Fono│ Total│Etten │ Fefen│ Siis│ Uman│Parem ─────────────────────────────────┴───────┴──────┴──────┴─────┴─────┴──────┴───────┴──────┴─────┴──────┴───── ALL LANGUAGES SPOKEN AT HOME Persons 5+ years. . . . . 46,248 12,993 12,227 431 335 10,078 3,375 3,540 416 2,423 324 English. . . . . . . . . . . . 18,327 6,780 6,554 132 94 3,131 1,255 1,188 35 593 60 Yapese . . . . . . . . . . . . 24 19 19 - - 2 2 - - - - Ulithian/Woleaian/Satawalese . 11 7 7 - - 3 3 - - - - Chuukese/Mortlockese . . . . . 49,582 12,922 12,156 431 335 10,077 3,375 3,540 416 2,422 324 Pohnpeian/Mwoakilloan/Pingelapese 311 177 172 - 5 47 12 27 - 2 6 Kosraean . . . . . . . . . . . 32 28 28 - - 1 1 - - - - Polynesian . . . . . . . . . . 14 7 7 - - 3 2 - - 1 - Asian. . . . . . . . . . . . . 431 176 169 4 3 129 77 41 - 10 1 Other language . . . . . . . . 134 84 82 - 2 17 10 5 - 1 1 FIRST LANGUAGE REPORTED Persons 5+ years. . . . . 46,248 12,993 12,227 431 335 10,078 3,375 3,540 416 2,423 324 English. . . . . . . . . . . . 150 131 131 - - 4 2 - 1 1 - Yapese . . . . . . . . . . . . 11 9 9 - - 1 1 - - - - Ulithian/Woleaian/Satawalese . 7 4 4 - - 2 2 - - - - Chuukese/Mortlockese . . . . . 45,949 12,738 11,972 431 335 10,064 3,365 3,539 415 2,422 323 Pohnpeian/Mwoakilloan/Pingelapese 45 42 42 - - 1 - 1 - - - Kosraean . . . . . . . . . . . 12 8 8 - - 1 1 - - - - Polynesian . . . . . . . . . . 9 7 7 - - - - - - - - Asian. . . . . . . . . . . . . 41 37 37 - - 3 3 - - - - Other language . . . . . . . . 24 17 17 - - 2 1 - - - 1 SECOND LANGUAGE REPORTED 5+ years with 2nd language 20,649 6,851 6,620 135 96 3,237 1,315 1,224 35 600 63 English. . . . . . . . . . . . 16,607 6,506 6,280 132 94 3,095 1,237 1,173 34 591 60 Yapese . . . . . . . . . . . . 11 9 9 - - 1 1 - - - - Ulithian/Woleaian/Satawalese . 3 2 2 - - 1 1 - - - - Chuukese/Mortlockese . . . . . 3,559 146 146 - - 9 8 - 1 - - Pohnpeian/Mwoakilloan/Pingelapese 139 72 72 - - 25 4 18 - 1 2 Kosraean . . . . . . . . . . . 11 11 11 - - - - - - - - Polynesian . . . . . . . . . . 2 - - - - 1 - - - 1 - Asian. . . . . . . . . . . . . 269 78 73 3 2 97 58 31 - 7 1 Other language . . . . . . . . 48 27 27 - - 8 6 2 - - - LANGUAGE OF PERSONS SPEAKING ONLY ONE LANGUAGE 5+ years with 1 language. 25,598 6,141 5,606 296 239 6,841 2,060 2,316 381 1,823 261 English. . . . . . . . . . . . 44 39 39 - - 1 - - - 1 - Yapese . . . . . . . . . . . . - - - - - - - - - - - Ulithian/Woleaian/Satawalese . 1 1 1 - - - - - - - - Chuukese/Mortlockese . . . . . 25,549 6,097 5,562 296 239 6,840 2,060 2,316 381 1,822 261 Pohnpeian/Mwoakilloan/Pingelapese 2 2 2 - - - - - - - - Kosraean . . . . . . . . . . . - - - - - - - - - - - Polynesian . . . . . . . . . . - - - - - - - - - - - Asian. . . . . . . . . . . . . 1 1 1 - - - - - - - - Other language . . . . . . . . 1 1 1 - - - - - - - - LANGUAGE USUALLY SPOKEN AT HOME Persons 5+ years. . . . . 46,248 12,993 12,227 431 335 10,078 3,375 3,540 416 2,423 324 English. . . . . . . . . . . . 124 106 106 - - 4 - - 1 2 1 Yapese . . . . . . . . . . . . 16 14 14 - - 2 1 - - 1 - Ulithian/Woleaian/Satawalese . 12 6 6 - - 1 - 1 - - - Chuukese/Mortlockese . . . . . 45,981 12,761 11,995 431 335 10,067 3,370 3,539 415 2,420 323 Pohnpeian/Mwoakilloan/Pingelapese 52 51 51 - - - - - - - - Kosraean . . . . . . . . . . . 8 6 6 - - - - - - - - Polynesian . . . . . . . . . . 7 7 7 - - - - - - - - Asian. . . . . . . . . . . . . 29 25 25 - - 4 4 - - - - Other language . . . . . . . . 19 17 17 - - - - - - - - ──────────────────────────────────────────────────────────────────────────────────────────────────────────── Source: 2000 FSM Census
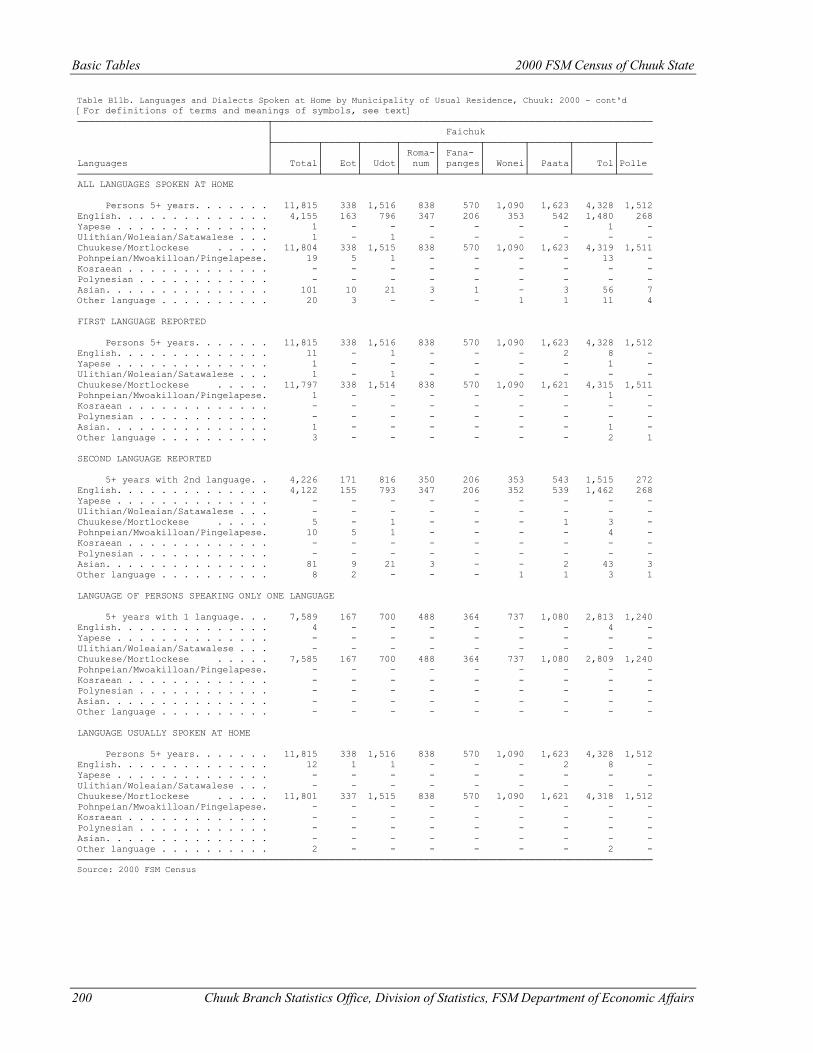
Basic Tables 2000 FSM Census of Chuuk State
200 Chuuk Branch Statistics Office, Division of Statistics, FSM Department of Economic Affairs
Table B11b. Languages and Dialects Spoken at Home by Municipality of Usual Residence, Chuuk: 2000 - cont'd [For definitions of terms and meanings of symbols, see text] ──────────────────────────────────┬──────────────────────────────────────────────────────────────────── │ Faichuk ├────────┬──────┬──────┬──────┬───────┬───────┬───────┬───────┬────── │ │ │ │ Roma-│ Fana- │ │ │ │ Languages │ Total│ Eot│ Udot│ num │ panges│ Wonei│ Paata│ Tol│Polle ──────────────────────────────────┴────────┴──────┴──────┴──────┴───────┴───────┴───────┴───────┴────── ALL LANGUAGES SPOKEN AT HOME Persons 5+ years. . . . . . . 11,815 338 1,516 838 570 1,090 1,623 4,328 1,512 English. . . . . . . . . . . . . . 4,155 163 796 347 206 353 542 1,480 268 Yapese . . . . . . . . . . . . . . 1 - - - - - - 1 - Ulithian/Woleaian/Satawalese . . . 1 - 1 - - - - - - Chuukese/Mortlockese . . . . . 11,804 338 1,515 838 570 1,090 1,623 4,319 1,511 Pohnpeian/Mwoakilloan/Pingelapese. 19 5 1 - - - - 13 - Kosraean . . . . . . . . . . . . . - - - - - - - - - Polynesian . . . . . . . . . . . . - - - - - - - - - Asian. . . . . . . . . . . . . . . 101 10 21 3 1 - 3 56 7 Other language . . . . . . . . . . 20 3 - - - 1 1 11 4 FIRST LANGUAGE REPORTED Persons 5+ years. . . . . . . 11,815 338 1,516 838 570 1,090 1,623 4,328 1,512 English. . . . . . . . . . . . . . 11 - 1 - - - 2 8 - Yapese . . . . . . . . . . . . . . 1 - - - - - - 1 - Ulithian/Woleaian/Satawalese . . . 1 - 1 - - - - - - Chuukese/Mortlockese . . . . . 11,797 338 1,514 838 570 1,090 1,621 4,315 1,511 Pohnpeian/Mwoakilloan/Pingelapese. 1 - - - - - - 1 - Kosraean . . . . . . . . . . . . . - - - - - - - - - Polynesian . . . . . . . . . . . . - - - - - - - - - Asian. . . . . . . . . . . . . . . 1 - - - - - - 1 - Other language . . . . . . . . . . 3 - - - - - - 2 1 SECOND LANGUAGE REPORTED 5+ years with 2nd language. . 4,226 171 816 350 206 353 543 1,515 272 English. . . . . . . . . . . . . . 4,122 155 793 347 206 352 539 1,462 268 Yapese . . . . . . . . . . . . . . - - - - - - - - - Ulithian/Woleaian/Satawalese . . . - - - - - - - - - Chuukese/Mortlockese . . . . . 5 - 1 - - - 1 3 - Pohnpeian/Mwoakilloan/Pingelapese. 10 5 1 - - - - 4 - Kosraean . . . . . . . . . . . . . - - - - - - - - - Polynesian . . . . . . . . . . . . - - - - - - - - - Asian. . . . . . . . . . . . . . . 81 9 21 3 - - 2 43 3 Other language . . . . . . . . . . 8 2 - - - 1 1 3 1 LANGUAGE OF PERSONS SPEAKING ONLY ONE LANGUAGE 5+ years with 1 language. . . 7,589 167 700 488 364 737 1,080 2,813 1,240 English. . . . . . . . . . . . . . 4 - - - - - - 4 - Yapese . . . . . . . . . . . . . . - - - - - - - - - Ulithian/Woleaian/Satawalese . . . - - - - - - - - - Chuukese/Mortlockese . . . . . 7,585 167 700 488 364 737 1,080 2,809 1,240 Pohnpeian/Mwoakilloan/Pingelapese. - - - - - - - - - Kosraean . . . . . . . . . . . . . - - - - - - - - - Polynesian . . . . . . . . . . . . - - - - - - - - - Asian. . . . . . . . . . . . . . . - - - - - - - - - Other language . . . . . . . . . . - - - - - - - - - LANGUAGE USUALLY SPOKEN AT HOME Persons 5+ years. . . . . . . 11,815 338 1,516 838 570 1,090 1,623 4,328 1,512 English. . . . . . . . . . . . . . 12 1 1 - - - 2 8 - Yapese . . . . . . . . . . . . . . - - - - - - - - - Ulithian/Woleaian/Satawalese . . . - - - - - - - - - Chuukese/Mortlockese . . . . . 11,801 337 1,515 838 570 1,090 1,621 4,318 1,512 Pohnpeian/Mwoakilloan/Pingelapese. - - - - - - - - - Kosraean . . . . . . . . . . . . . - - - - - - - - - Polynesian . . . . . . . . . . . . - - - - - - - - - Asian. . . . . . . . . . . . . . . - - - - - - - - - Other language . . . . . . . . . . 2 - - - - - - 2 - ─────────────────────────────────────────────────────────────────────────────────────────────────────── Source: 2000 FSM Census
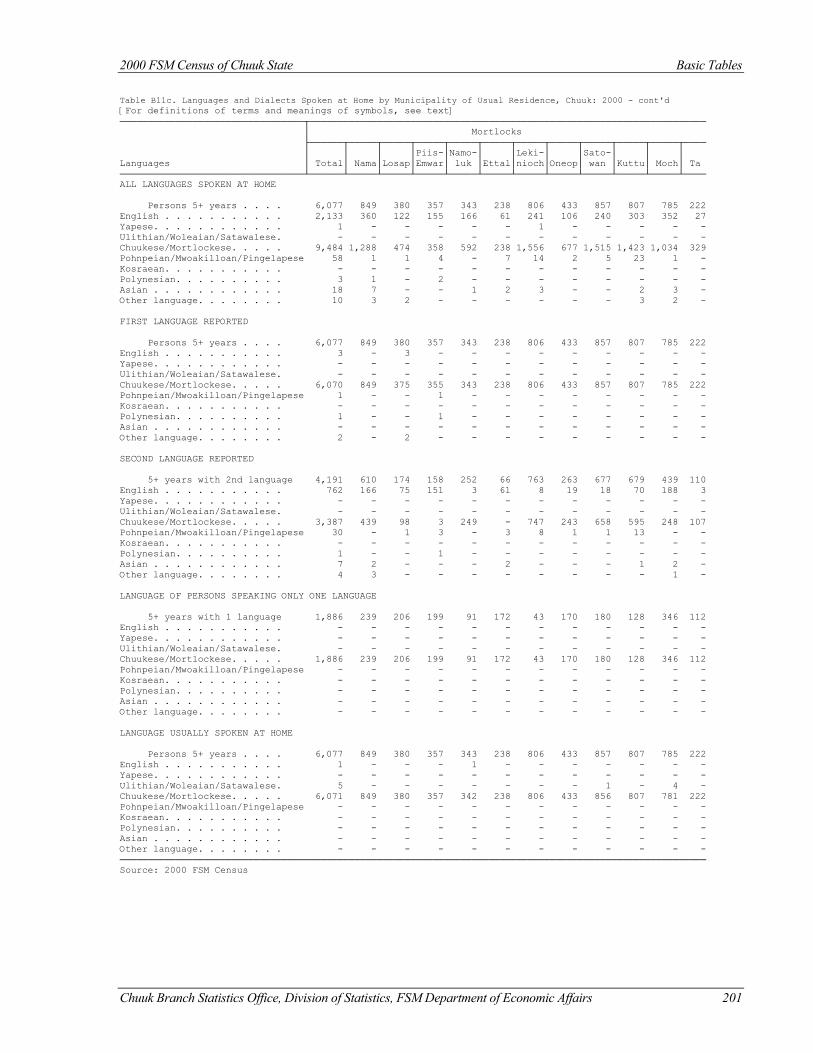
2000 FSM Census of Chuuk State Basic Tables
Chuuk Branch Statistics Office, Division of Statistics, FSM Department of Economic Affairs 201
Table B11c. Languages and Dialects Spoken at Home by Municipality of Usual Residence, Chuuk: 2000 - cont'd [For definitions of terms and meanings of symbols, see text] ─────────────────────────────────┬─────────────────────────────────────────────────────────────────────── │ Mortlocks ├──────┬─────┬─────┬─────┬─────┬─────┬─────┬─────┬─────┬─────┬─────┬──── │ │ │ │Piis-│Namo-│ │Leki-│ │Sato-│ │ │ Languages │ Total│ Nama│Losap│Emwar│ luk │Ettal│nioch│Oneop│ wan │Kuttu│ Moch│ Ta ─────────────────────────────────┴──────┴─────┴─────┴─────┴─────┴─────┴─────┴─────┴─────┴─────┴─────┴──── ALL LANGUAGES SPOKEN AT HOME Persons 5+ years . . . . 6,077 849 380 357 343 238 806 433 857 807 785 222 English . . . . . . . . . . . 2,133 360 122 155 166 61 241 106 240 303 352 27 Yapese. . . . . . . . . . . . 1 - - - - - 1 - - - - - Ulithian/Woleaian/Satawalese. - - - - - - - - - - - - Chuukese/Mortlockese. . . . . 9,484 1,288 474 358 592 238 1,556 677 1,515 1,423 1,034 329 Pohnpeian/Mwoakilloan/Pingelapese 58 1 1 4 - 7 14 2 5 23 1 - Kosraean. . . . . . . . . . . - - - - - - - - - - - - Polynesian. . . . . . . . . . 3 1 - 2 - - - - - - - - Asian . . . . . . . . . . . . 18 7 - - 1 2 3 - - 2 3 - Other language. . . . . . . . 10 3 2 - - - - - - 3 2 - FIRST LANGUAGE REPORTED Persons 5+ years . . . . 6,077 849 380 357 343 238 806 433 857 807 785 222 English . . . . . . . . . . . 3 - 3 - - - - - - - - - Yapese. . . . . . . . . . . . - - - - - - - - - - - - Ulithian/Woleaian/Satawalese. - - - - - - - - - - - - Chuukese/Mortlockese. . . . . 6,070 849 375 355 343 238 806 433 857 807 785 222 Pohnpeian/Mwoakilloan/Pingelapese 1 - - 1 - - - - - - - - Kosraean. . . . . . . . . . . - - - - - - - - - - - - Polynesian. . . . . . . . . . 1 - - 1 - - - - - - - - Asian . . . . . . . . . . . . - - - - - - - - - - - - Other language. . . . . . . . 2 - 2 - - - - - - - - - SECOND LANGUAGE REPORTED 5+ years with 2nd language 4,191 610 174 158 252 66 763 263 677 679 439 110 English . . . . . . . . . . . 762 166 75 151 3 61 8 19 18 70 188 3 Yapese. . . . . . . . . . . . - - - - - - - - - - - - Ulithian/Woleaian/Satawalese. - - - - - - - - - - - - Chuukese/Mortlockese. . . . . 3,387 439 98 3 249 - 747 243 658 595 248 107 Pohnpeian/Mwoakilloan/Pingelapese 30 - 1 3 - 3 8 1 1 13 - - Kosraean. . . . . . . . . . . - - - - - - - - - - - - Polynesian. . . . . . . . . . 1 - - 1 - - - - - - - - Asian . . . . . . . . . . . . 7 2 - - - 2 - - - 1 2 - Other language. . . . . . . . 4 3 - - - - - - - - 1 - LANGUAGE OF PERSONS SPEAKING ONLY ONE LANGUAGE 5+ years with 1 language 1,886 239 206 199 91 172 43 170 180 128 346 112 English . . . . . . . . . . . - - - - - - - - - - - - Yapese. . . . . . . . . . . . - - - - - - - - - - - - Ulithian/Woleaian/Satawalese. - - - - - - - - - - - - Chuukese/Mortlockese. . . . . 1,886 239 206 199 91 172 43 170 180 128 346 112 Pohnpeian/Mwoakilloan/Pingelapese - - - - - - - - - - - - Kosraean. . . . . . . . . . . - - - - - - - - - - - - Polynesian. . . . . . . . . . - - - - - - - - - - - - Asian . . . . . . . . . . . . - - - - - - - - - - - - Other language. . . . . . . . - - - - - - - - - - - - LANGUAGE USUALLY SPOKEN AT HOME Persons 5+ years . . . . 6,077 849 380 357 343 238 806 433 857 807 785 222 English . . . . . . . . . . . 1 - - - 1 - - - - - - - Yapese. . . . . . . . . . . . - - - - - - - - - - - - Ulithian/Woleaian/Satawalese. 5 - - - - - - - 1 - 4 - Chuukese/Mortlockese. . . . . 6,071 849 380 357 342 238 806 433 856 807 781 222 Pohnpeian/Mwoakilloan/Pingelapese - - - - - - - - - - - - Kosraean. . . . . . . . . . . - - - - - - - - - - - - Polynesian. . . . . . . . . . - - - - - - - - - - - - Asian . . . . . . . . . . . . - - - - - - - - - - - - Other language. . . . . . . . - - - - - - - - - - - - ───────────────────────────────────────────────────────────────────────────────────────────────────────── Source: 2000 FSM Census
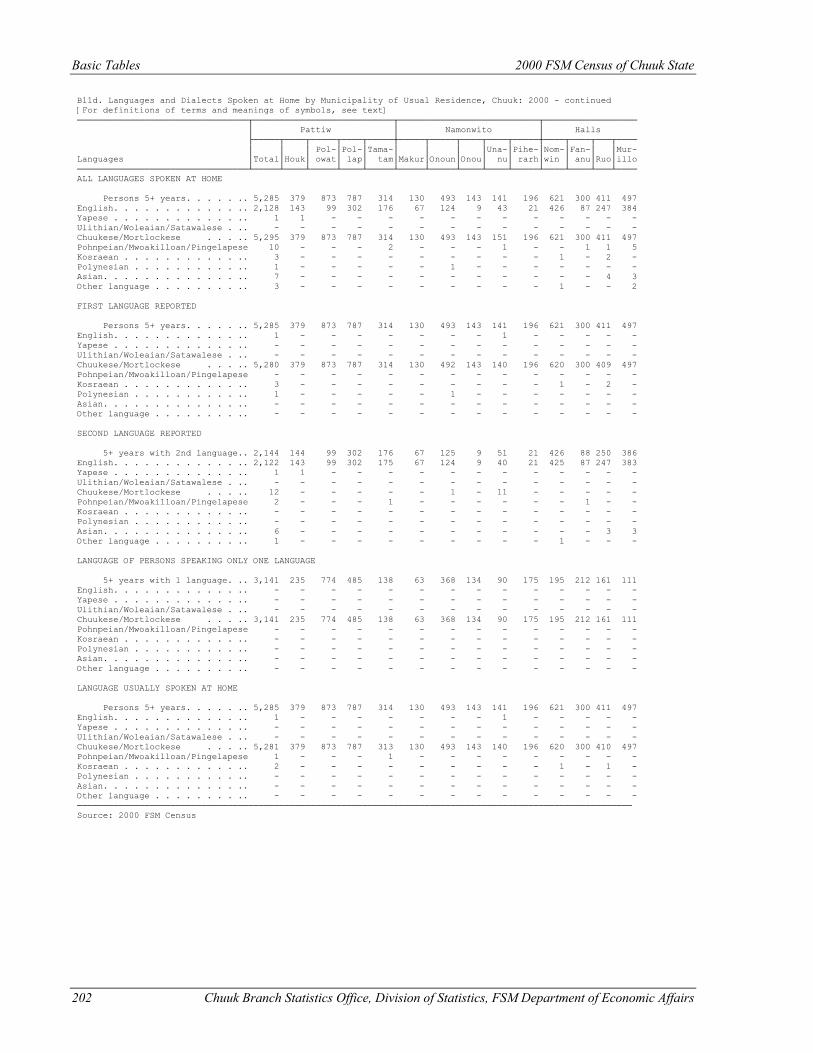
Basic Tables 2000 FSM Census of Chuuk State
202 Chuuk Branch Statistics Office, Division of Statistics, FSM Department of Economic Affairs
B11d. Languages and Dialects Spoken at Home by Municipality of Usual Residence, Chuuk: 2000 - continued [For definitions of terms and meanings of symbols, see text] ─────────────────────────────────┬───────────────────────────┬───────────────────────────┬────────────────── │ Pattiw │ Namonwito │ Halls ├─────┬────┬─────┬────┬─────┼─────┬─────┬────┬────┬─────┼────┬────┬───┬──── │ │ │ Pol-│Pol-│Tama-│ │ │ │Una-│Pihe-│Nom-│Fan-│ │Mur- Languages │Total│Houk│ owat│ lap│ tam│Makur│Onoun│Onou│ nu│ rarh│win │ anu│Ruo│illo ─────────────────────────────────┴─────┴────┴─────┴────┴─────┴─────┴─────┴────┴────┴─────┴────┴────┴───┴──── ALL LANGUAGES SPOKEN AT HOME Persons 5+ years. . . . . .. 5,285 379 873 787 314 130 493 143 141 196 621 300 411 497 English. . . . . . . . . . . . .. 2,128 143 99 302 176 67 124 9 43 21 426 87 247 384 Yapese . . . . . . . . . . . . .. 1 1 - - - - - - - - - - - - Ulithian/Woleaian/Satawalese . .. - - - - - - - - - - - - - - Chuukese/Mortlockese . . . .. 5,295 379 873 787 314 130 493 143 151 196 621 300 411 497 Pohnpeian/Mwoakilloan/Pingelapese 10 - - - 2 - - - 1 - - 1 1 5 Kosraean . . . . . . . . . . . .. 3 - - - - - - - - - 1 - 2 - Polynesian . . . . . . . . . . .. 1 - - - - - 1 - - - - - - - Asian. . . . . . . . . . . . . .. 7 - - - - - - - - - - - 4 3 Other language . . . . . . . . .. 3 - - - - - - - - - 1 - - 2 FIRST LANGUAGE REPORTED Persons 5+ years. . . . . .. 5,285 379 873 787 314 130 493 143 141 196 621 300 411 497 English. . . . . . . . . . . . .. 1 - - - - - - - 1 - - - - - Yapese . . . . . . . . . . . . .. - - - - - - - - - - - - - - Ulithian/Woleaian/Satawalese . .. - - - - - - - - - - - - - - Chuukese/Mortlockese . . . .. 5,280 379 873 787 314 130 492 143 140 196 620 300 409 497 Pohnpeian/Mwoakilloan/Pingelapese - - - - - - - - - - - - - - Kosraean . . . . . . . . . . . .. 3 - - - - - - - - - 1 - 2 - Polynesian . . . . . . . . . . .. 1 - - - - - 1 - - - - - - - Asian. . . . . . . . . . . . . .. - - - - - - - - - - - - - - Other language . . . . . . . . .. - - - - - - - - - - - - - - SECOND LANGUAGE REPORTED 5+ years with 2nd language.. 2,144 144 99 302 176 67 125 9 51 21 426 88 250 386 English. . . . . . . . . . . . .. 2,122 143 99 302 175 67 124 9 40 21 425 87 247 383 Yapese . . . . . . . . . . . . .. 1 1 - - - - - - - - - - - - Ulithian/Woleaian/Satawalese . .. - - - - - - - - - - - - - - Chuukese/Mortlockese . . . .. 12 - - - - - 1 - 11 - - - - - Pohnpeian/Mwoakilloan/Pingelapese 2 - - - 1 - - - - - - 1 - - Kosraean . . . . . . . . . . . .. - - - - - - - - - - - - - - Polynesian . . . . . . . . . . .. - - - - - - - - - - - - - - Asian. . . . . . . . . . . . . .. 6 - - - - - - - - - - - 3 3 Other language . . . . . . . . .. 1 - - - - - - - - - 1 - - - LANGUAGE OF PERSONS SPEAKING ONLY ONE LANGUAGE 5+ years with 1 language. .. 3,141 235 774 485 138 63 368 134 90 175 195 212 161 111 English. . . . . . . . . . . . .. - - - - - - - - - - - - - - Yapese . . . . . . . . . . . . .. - - - - - - - - - - - - - - Ulithian/Woleaian/Satawalese . .. - - - - - - - - - - - - - - Chuukese/Mortlockese . . . .. 3,141 235 774 485 138 63 368 134 90 175 195 212 161 111 Pohnpeian/Mwoakilloan/Pingelapese - - - - - - - - - - - - - - Kosraean . . . . . . . . . . . .. - - - - - - - - - - - - - - Polynesian . . . . . . . . . . .. - - - - - - - - - - - - - - Asian. . . . . . . . . . . . . .. - - - - - - - - - - - - - - Other language . . . . . . . . .. - - - - - - - - - - - - - - LANGUAGE USUALLY SPOKEN AT HOME Persons 5+ years. . . . . .. 5,285 379 873 787 314 130 493 143 141 196 621 300 411 497 English. . . . . . . . . . . . .. 1 - - - - - - - 1 - - - - - Yapese . . . . . . . . . . . . .. - - - - - - - - - - - - - - Ulithian/Woleaian/Satawalese . .. - - - - - - - - - - - - - - Chuukese/Mortlockese . . . .. 5,281 379 873 787 313 130 493 143 140 196 620 300 410 497 Pohnpeian/Mwoakilloan/Pingelapese 1 - - - 1 - - - - - - - - - Kosraean . . . . . . . . . . . .. 2 - - - - - - - - - 1 - 1 - Polynesian . . . . . . . . . . .. - - - - - - - - - - - - - - Asian. . . . . . . . . . . . . .. - - - - - - - - - - - - - - Other language . . . . . . . . .. - - - - - - - - - - - - - - ─────────────────────────────────────────────────────────────────────────────────────────────────────────── Source: 2000 FSM Census
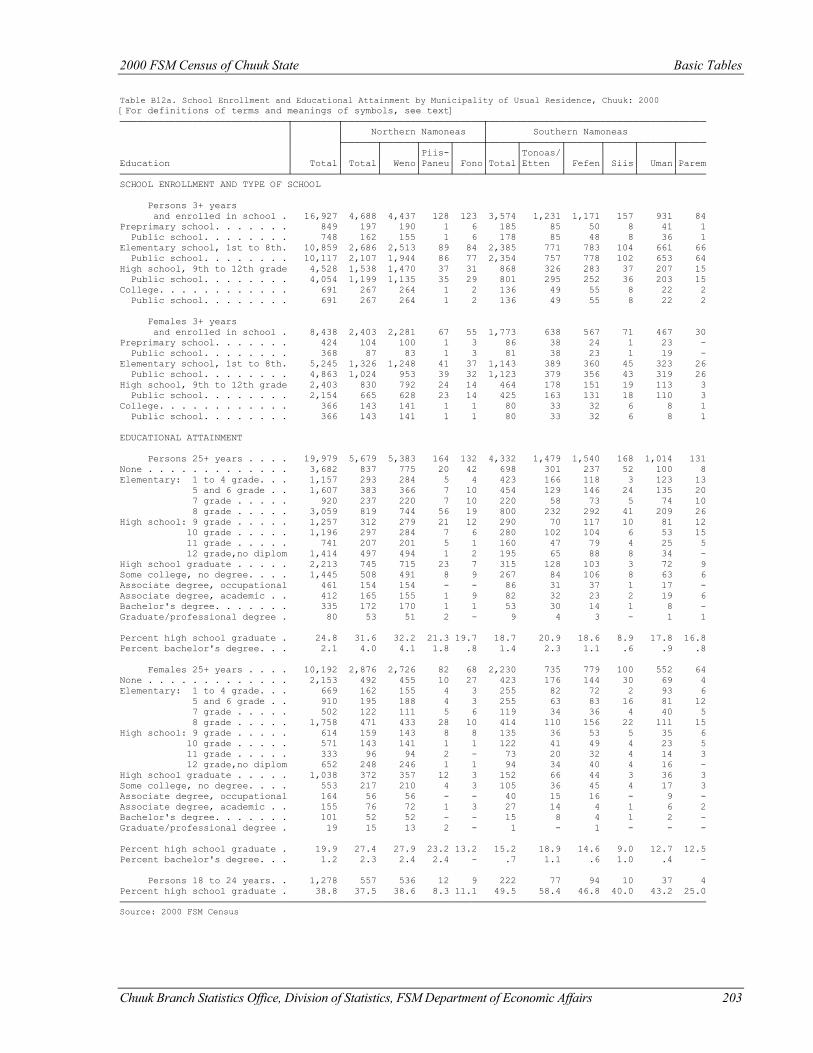
2000 FSM Census of Chuuk State Basic Tables
Table B12a. School Enrollment and Educational Attainment by Municipality of Usual Residence, Chuuk: 2000 [For definitions of terms and meanings of symbols, see text] ──────────────────────────────┬────────┬─────────────────────────┬─────────────────────────────────────── │ │ Northern Namoneas │ Southern Namoneas │ ├──────┬──────┬─────┬─────┼─────┬───────┬──────┬─────┬──────┬───── │ │ │ │Piis-│ │ │Tonoas/│ │ │ │ Education │ Total│ Total│ Weno│Paneu│ Fono│Total│Etten │ Fefen│ Siis│ Uman│Parem ──────────────────────────────┴────────┴──────┴──────┴─────┴─────┴─────┴───────┴──────┴─────┴──────┴───── SCHOOL ENROLLMENT AND TYPE OF SCHOOL Persons 3+ years and enrolled in school . 16,927 4,688 4,437 128 123 3,574 1,231 1,171 157 931 84 Preprimary school. . . . . . . 849 197 190 1 6 185 85 50 8 41 1 Public school. . . . . . . . 748 162 155 1 6 178 85 48 8 36 1 Elementary school, 1st to 8th. 10,859 2,686 2,513 89 84 2,385 771 783 104 661 66 Public school. . . . . . . . 10,117 2,107 1,944 86 77 2,354 757 778 102 653 64 High school, 9th to 12th grade 4,528 1,538 1,470 37 31 868 326 283 37 207 15 Public school. . . . . . . . 4,054 1,199 1,135 35 29 801 295 252 36 203 15 College. . . . . . . . . . . . 691 267 264 1 2 136 49 55 8 22 2 Public school. . . . . . . . 691 267 264 1 2 136 49 55 8 22 2 Females 3+ years and enrolled in school . 8,438 2,403 2,281 67 55 1,773 638 567 71 467 30 Preprimary school. . . . . . . 424 104 100 1 3 86 38 24 1 23 - Public school. . . . . . . . 368 87 83 1 3 81 38 23 1 19 - Elementary school, 1st to 8th. 5,245 1,326 1,248 41 37 1,143 389 360 45 323 26 Public school. . . . . . . . 4,863 1,024 953 39 32 1,123 379 356 43 319 26 High school, 9th to 12th grade 2,403 830 792 24 14 464 178 151 19 113 3 Public school. . . . . . . . 2,154 665 628 23 14 425 163 131 18 110 3 College. . . . . . . . . . . . 366 143 141 1 1 80 33 32 6 8 1 Public school. . . . . . . . 366 143 141 1 1 80 33 32 6 8 1 EDUCATIONAL ATTAINMENT Persons 25+ years . . . . 19,979 5,679 5,383 164 132 4,332 1,479 1,540 168 1,014 131 None . . . . . . . . . . . . . 3,682 837 775 20 42 698 301 237 52 100 8 Elementary: 1 to 4 grade. . . 1,157 293 284 5 4 423 166 118 3 123 13 5 and 6 grade . . 1,607 383 366 7 10 454 129 146 24 135 20 7 grade . . . . . 920 237 220 7 10 220 58 73 5 74 10 8 grade . . . . . 3,059 819 744 56 19 800 232 292 41 209 26 High school: 9 grade . . . . . 1,257 312 279 21 12 290 70 117 10 81 12 10 grade . . . . . 1,196 297 284 7 6 280 102 104 6 53 15 11 grade . . . . . 741 207 201 5 1 160 47 79 4 25 5 12 grade,no diplom 1,414 497 494 1 2 195 65 88 8 34 - High school graduate . . . . . 2,213 745 715 23 7 315 128 103 3 72 9 Some college, no degree. . . . 1,445 508 491 8 9 267 84 106 8 63 6 Associate degree, occupational 461 154 154 - - 86 31 37 1 17 - Associate degree, academic . . 412 165 155 1 9 82 32 23 2 19 6 Bachelor's degree. . . . . . . 335 172 170 1 1 53 30 14 1 8 - Graduate/professional degree . 80 53 51 2 - 9 4 3 - 1 1 Percent high school graduate . 24.8 31.6 32.2 21.3 19.7 18.7 20.9 18.6 8.9 17.8 16.8 Percent bachelor's degree. . . 2.1 4.0 4.1 1.8 .8 1.4 2.3 1.1 .6 .9 .8 Females 25+ years . . . . 10,192 2,876 2,726 82 68 2,230 735 779 100 552 64 None . . . . . . . . . . . . . 2,153 492 455 10 27 423 176 144 30 69 4 Elementary: 1 to 4 grade. . . 669 162 155 4 3 255 82 72 2 93 6 5 and 6 grade . . 910 195 188 4 3 255 63 83 16 81 12 7 grade . . . . . 502 122 111 5 6 119 34 36 4 40 5 8 grade . . . . . 1,758 471 433 28 10 414 110 156 22 111 15 High school: 9 grade . . . . . 614 159 143 8 8 135 36 53 5 35 6 10 grade . . . . . 571 143 141 1 1 122 41 49 4 23 5 11 grade . . . . . 333 96 94 2 - 73 20 32 4 14 3 12 grade,no diplom 652 248 246 1 1 94 34 40 4 16 - High school graduate . . . . . 1,038 372 357 12 3 152 66 44 3 36 3 Some college, no degree. . . . 553 217 210 4 3 105 36 45 4 17 3 Associate degree, occupational 164 56 56 - - 40 15 16 - 9 - Associate degree, academic . . 155 76 72 1 3 27 14 4 1 6 2 Bachelor's degree. . . . . . . 101 52 52 - - 15 8 4 1 2 - Graduate/professional degree . 19 15 13 2 - 1 - 1 - - - Percent high school graduate . 19.9 27.4 27.9 23.2 13.2 15.2 18.9 14.6 9.0 12.7 12.5 Percent bachelor's degree. . . 1.2 2.3 2.4 2.4 - .7 1.1 .6 1.0 .4 - Persons 18 to 24 years. . 1,278 557 536 12 9 222 77 94 10 37 4 Percent high school graduate . 38.8 37.5 38.6 8.3 11.1 49.5 58.4 46.8 40.0 43.2 25.0 ───────────────────────────────────────────────────────────────────────────────────────────────────────── Source: 2000 FSM Census
Chuuk Branch Statistics Office, Division of Statistics, FSM Department of Economic Affairs 203
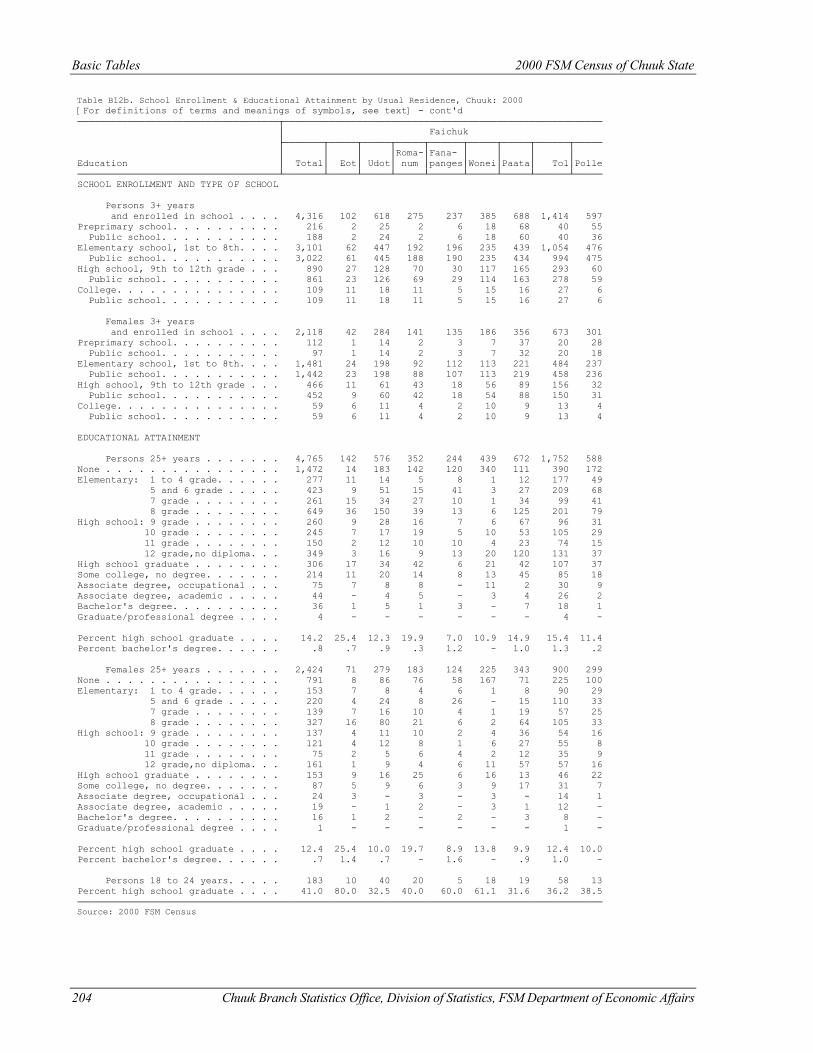
Basic Tables 2000 FSM Census of Chuuk State
Table B12b. School Enrollment & Educational Attainment by Usual Residence, Chuuk: 2000 [For definitions of terms and meanings of symbols, see text] - cont'd ────────────────────────────────────┬───────────────────────────────────────────────────────── │ Faichuk ├───────┬─────┬─────┬─────┬──────┬─────┬─────┬──────┬───── │ │ │ │Roma-│Fana- │ │ │ │ Education │ Total│ Eot│ Udot│ num │panges│Wonei│Paata│ Tol│Polle ────────────────────────────────────┴───────┴─────┴─────┴─────┴──────┴─────┴─────┴──────┴───── SCHOOL ENROLLMENT AND TYPE OF SCHOOL Persons 3+ years and enrolled in school . . . . 4,316 102 618 275 237 385 688 1,414 597 Preprimary school. . . . . . . . . . 216 2 25 2 6 18 68 40 55 Public school. . . . . . . . . . . 188 2 24 2 6 18 60 40 36 Elementary school, 1st to 8th. . . . 3,101 62 447 192 196 235 439 1,054 476 Public school. . . . . . . . . . . 3,022 61 445 188 190 235 434 994 475 High school, 9th to 12th grade . . . 890 27 128 70 30 117 165 293 60 Public school. . . . . . . . . . . 861 23 126 69 29 114 163 278 59 College. . . . . . . . . . . . . . . 109 11 18 11 5 15 16 27 6 Public school. . . . . . . . . . . 109 11 18 11 5 15 16 27 6 Females 3+ years and enrolled in school . . . . 2,118 42 284 141 135 186 356 673 301 Preprimary school. . . . . . . . . . 112 1 14 2 3 7 37 20 28 Public school. . . . . . . . . . . 97 1 14 2 3 7 32 20 18 Elementary school, 1st to 8th. . . . 1,481 24 198 92 112 113 221 484 237 Public school. . . . . . . . . . . 1,442 23 198 88 107 113 219 458 236 High school, 9th to 12th grade . . . 466 11 61 43 18 56 89 156 32 Public school. . . . . . . . . . . 452 9 60 42 18 54 88 150 31 College. . . . . . . . . . . . . . . 59 6 11 4 2 10 9 13 4 Public school. . . . . . . . . . . 59 6 11 4 2 10 9 13 4 EDUCATIONAL ATTAINMENT Persons 25+ years . . . . . . . 4,765 142 576 352 244 439 672 1,752 588 None . . . . . . . . . . . . . . . . 1,472 14 183 142 120 340 111 390 172 Elementary: 1 to 4 grade. . . . . . 277 11 14 5 8 1 12 177 49 5 and 6 grade . . . . . 423 9 51 15 41 3 27 209 68 7 grade . . . . . . . . 261 15 34 27 10 1 34 99 41 8 grade . . . . . . . . 649 36 150 39 13 6 125 201 79 High school: 9 grade . . . . . . . . 260 9 28 16 7 6 67 96 31 10 grade . . . . . . . . 245 7 17 19 5 10 53 105 29 11 grade . . . . . . . . 150 2 12 10 10 4 23 74 15 12 grade,no diploma. . . 349 3 16 9 13 20 120 131 37 High school graduate . . . . . . . . 306 17 34 42 6 21 42 107 37 Some college, no degree. . . . . . . 214 11 20 14 8 13 45 85 18 Associate degree, occupational . . . 75 7 8 8 - 11 2 30 9 Associate degree, academic . . . . . 44 - 4 5 - 3 4 26 2 Bachelor's degree. . . . . . . . . . 36 1 5 1 3 - 7 18 1 Graduate/professional degree . . . . 4 - - - - - - 4 - Percent high school graduate . . . . 14.2 25.4 12.3 19.9 7.0 10.9 14.9 15.4 11.4 Percent bachelor's degree. . . . . . .8 .7 .9 .3 1.2 - 1.0 1.3 .2 Females 25+ years . . . . . . . 2,424 71 279 183 124 225 343 900 299 None . . . . . . . . . . . . . . . . 791 8 86 76 58 167 71 225 100 Elementary: 1 to 4 grade. . . . . . 153 7 8 4 6 1 8 90 29 5 and 6 grade . . . . . 220 4 24 8 26 - 15 110 33 7 grade . . . . . . . . 139 7 16 10 4 1 19 57 25 8 grade . . . . . . . . 327 16 80 21 6 2 64 105 33 High school: 9 grade . . . . . . . . 137 4 11 10 2 4 36 54 16 10 grade . . . . . . . . 121 4 12 8 1 6 27 55 8 11 grade . . . . . . . . 75 2 5 6 4 2 12 35 9 12 grade,no diploma. . . 161 1 9 4 6 11 57 57 16 High school graduate . . . . . . . . 153 9 16 25 6 16 13 46 22 Some college, no degree. . . . . . . 87 5 9 6 3 9 17 31 7 Associate degree, occupational . . . 24 3 - 3 - 3 - 14 1 Associate degree, academic . . . . . 19 - 1 2 - 3 1 12 - Bachelor's degree. . . . . . . . . . 16 1 2 - 2 - 3 8 - Graduate/professional degree . . . . 1 - - - - - - 1 - Percent high school graduate . . . . 12.4 25.4 10.0 19.7 8.9 13.8 9.9 12.4 10.0 Percent bachelor's degree. . . . . . .7 1.4 .7 - 1.6 - .9 1.0 - Persons 18 to 24 years. . . . . 183 10 40 20 5 18 19 58 13 Percent high school graduate . . . . 41.0 80.0 32.5 40.0 60.0 61.1 31.6 36.2 38.5 ────────────────────────────────────────────────────────────────────────────────────────────── Source: 2000 FSM Census
204 Chuuk Branch Statistics Office, Division of Statistics, FSM Department of Economic Affairs
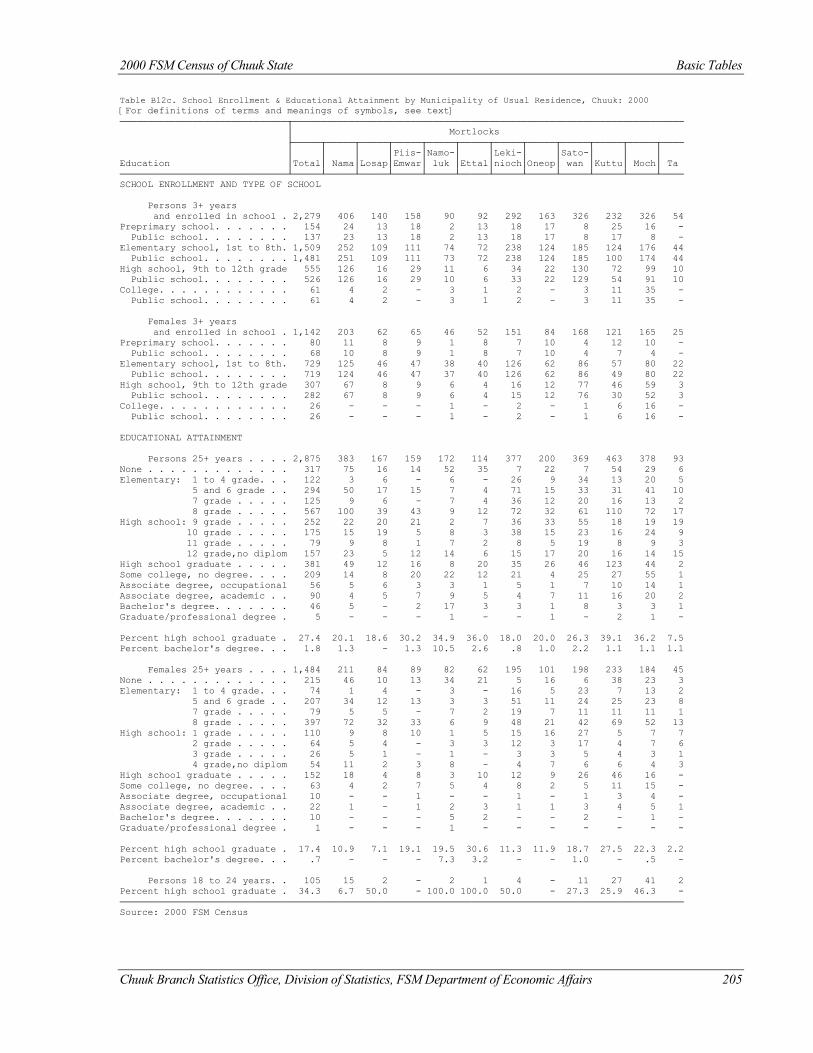
2000 FSM Census of Chuuk State Basic Tables
Table B12c. School Enrollment & Educational Attainment by Municipality of Usual Residence, Chuuk: 2000 [For definitions of terms and meanings of symbols, see text] ──────────────────────────────┬────────────────────────────────────────────────────────────────────── │ Mortlocks ├─────┬─────┬─────┬─────┬─────┬─────┬─────┬─────┬─────┬─────┬─────┬──── │ │ │ │Piis-│Namo-│ │Leki-│ │Sato-│ │ │ Education │Total│ Nama│Losap│Emwar│ luk │Ettal│nioch│Oneop│ wan │Kuttu│ Moch│ Ta ──────────────────────────────┴─────┴─────┴─────┴─────┴─────┴─────┴─────┴─────┴─────┴─────┴─────┴──── SCHOOL ENROLLMENT AND TYPE OF SCHOOL Persons 3+ years and enrolled in school . 2,279 406 140 158 90 92 292 163 326 232 326 54 Preprimary school. . . . . . . 154 24 13 18 2 13 18 17 8 25 16 - Public school. . . . . . . . 137 23 13 18 2 13 18 17 8 17 8 - Elementary school, 1st to 8th. 1,509 252 109 111 74 72 238 124 185 124 176 44 Public school. . . . . . . . 1,481 251 109 111 73 72 238 124 185 100 174 44 High school, 9th to 12th grade 555 126 16 29 11 6 34 22 130 72 99 10 Public school. . . . . . . . 526 126 16 29 10 6 33 22 129 54 91 10 College. . . . . . . . . . . . 61 4 2 - 3 1 2 - 3 11 35 - Public school. . . . . . . . 61 4 2 - 3 1 2 - 3 11 35 - Females 3+ years and enrolled in school . 1,142 203 62 65 46 52 151 84 168 121 165 25 Preprimary school. . . . . . . 80 11 8 9 1 8 7 10 4 12 10 - Public school. . . . . . . . 68 10 8 9 1 8 7 10 4 7 4 - Elementary school, 1st to 8th. 729 125 46 47 38 40 126 62 86 57 80 22 Public school. . . . . . . . 719 124 46 47 37 40 126 62 86 49 80 22 High school, 9th to 12th grade 307 67 8 9 6 4 16 12 77 46 59 3 Public school. . . . . . . . 282 67 8 9 6 4 15 12 76 30 52 3 College. . . . . . . . . . . . 26 - - - 1 - 2 - 1 6 16 - Public school. . . . . . . . 26 - - - 1 - 2 - 1 6 16 - EDUCATIONAL ATTAINMENT Persons 25+ years . . . . 2,875 383 167 159 172 114 377 200 369 463 378 93 None . . . . . . . . . . . . . 317 75 16 14 52 35 7 22 7 54 29 6 Elementary: 1 to 4 grade. . . 122 3 6 - 6 - 26 9 34 13 20 5 5 and 6 grade . . 294 50 17 15 7 4 71 15 33 31 41 10 7 grade . . . . . 125 9 6 - 7 4 36 12 20 16 13 2 8 grade . . . . . 567 100 39 43 9 12 72 32 61 110 72 17 High school: 9 grade . . . . . 252 22 20 21 2 7 36 33 55 18 19 19 10 grade . . . . . 175 15 19 5 8 3 38 15 23 16 24 9 11 grade . . . . . 79 9 8 1 7 2 8 5 19 8 9 3 12 grade,no diplom 157 23 5 12 14 6 15 17 20 16 14 15 High school graduate . . . . . 381 49 12 16 8 20 35 26 46 123 44 2 Some college, no degree. . . . 209 14 8 20 22 12 21 4 25 27 55 1 Associate degree, occupational 56 5 6 3 3 1 5 1 7 10 14 1 Associate degree, academic . . 90 4 5 7 9 5 4 7 11 16 20 2 Bachelor's degree. . . . . . . 46 5 - 2 17 3 3 1 8 3 3 1 Graduate/professional degree . 5 - - - 1 - - 1 - 2 1 - Percent high school graduate . 27.4 20.1 18.6 30.2 34.9 36.0 18.0 20.0 26.3 39.1 36.2 7.5 Percent bachelor's degree. . . 1.8 1.3 - 1.3 10.5 2.6 .8 1.0 2.2 1.1 1.1 1.1 Females 25+ years . . . . 1,484 211 84 89 82 62 195 101 198 233 184 45 None . . . . . . . . . . . . . 215 46 10 13 34 21 5 16 6 38 23 3 Elementary: 1 to 4 grade. . . 74 1 4 - 3 - 16 5 23 7 13 2 5 and 6 grade . . 207 34 12 13 3 3 51 11 24 25 23 8 7 grade . . . . . 79 5 5 - 7 2 19 7 11 11 11 1 8 grade . . . . . 397 72 32 33 6 9 48 21 42 69 52 13 High school: 1 grade . . . . . 110 9 8 10 1 5 15 16 27 5 7 7 2 grade . . . . . 64 5 4 - 3 3 12 3 17 4 7 6 3 grade . . . . . 26 5 1 - 1 - 3 3 5 4 3 1 4 grade,no diplom 54 11 2 3 8 - 4 7 6 6 4 3 High school graduate . . . . . 152 18 4 8 3 10 12 9 26 46 16 - Some college, no degree. . . . 63 4 2 7 5 4 8 2 5 11 15 - Associate degree, occupational 10 - - 1 - - 1 - 1 3 4 - Associate degree, academic . . 22 1 - 1 2 3 1 1 3 4 5 1 Bachelor's degree. . . . . . . 10 - - - 5 2 - - 2 - 1 - Graduate/professional degree . 1 - - - 1 - - - - - - - Percent high school graduate . 17.4 10.9 7.1 19.1 19.5 30.6 11.3 11.9 18.7 27.5 22.3 2.2 Percent bachelor's degree. . . .7 - - - 7.3 3.2 - - 1.0 - .5 - Persons 18 to 24 years. . 105 15 2 - 2 1 4 - 11 27 41 2 Percent high school graduate . 34.3 6.7 50.0 - 100.0 100.0 50.0 - 27.3 25.9 46.3 - ───────────────────────────────────────────────────────────────────────────────────────────────────── Source: 2000 FSM Census
Chuuk Branch Statistics Office, Division of Statistics, FSM Department of Economic Affairs 205
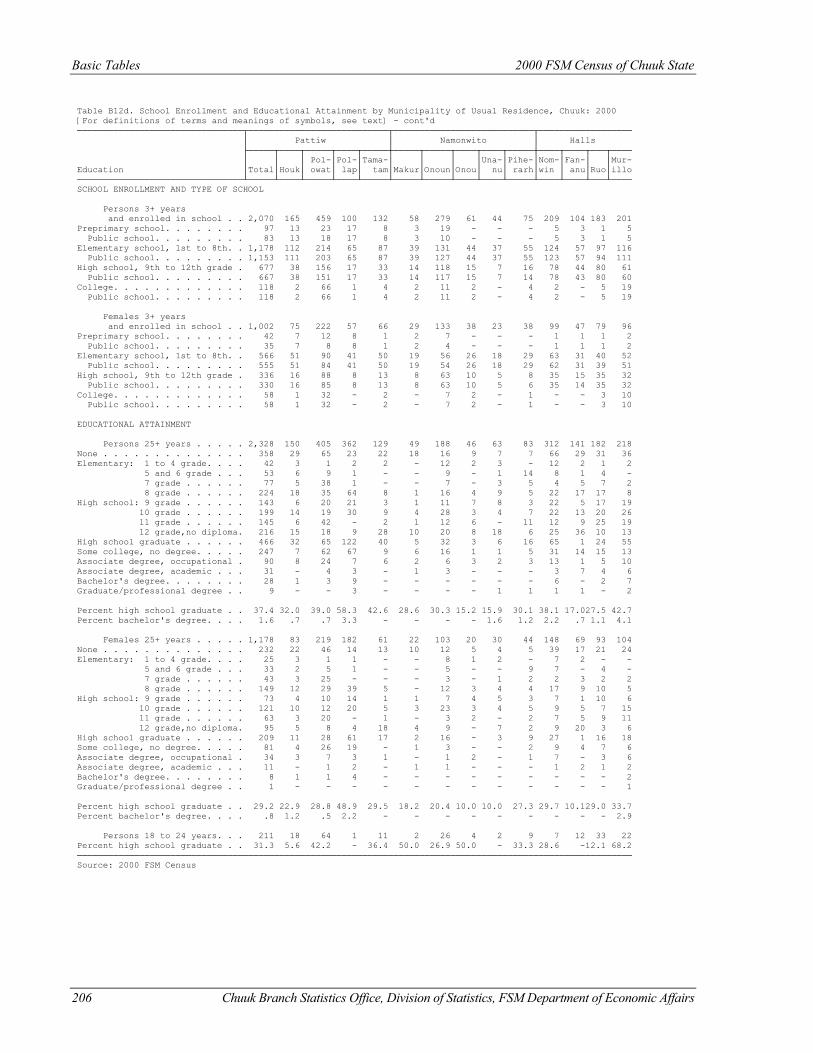
Basic Tables 2000 FSM Census of Chuuk State
Table B12d. School Enrollment and Educational Attainment by Municipality of Usual Residence, Chuuk: 2000 [For definitions of terms and meanings of symbols, see text] - cont'd ────────────────────────────────┬───────────────────────────┬───────────────────────────┬────────────────── │ Pattiw │ Namonwito │ Halls ├─────┬────┬─────┬────┬─────┼─────┬─────┬────┬────┬─────┼────┬────┬───┬──── │ │ │ Pol-│Pol-│Tama-│ │ │ │Una-│Pihe-│Nom-│Fan-│ │Mur- Education │Total│Houk│ owat│ lap│ tam│Makur│Onoun│Onou│ nu│ rarh│win │ anu│Ruo│illo ────────────────────────────────┴─────┴────┴─────┴────┴─────┴─────┴─────┴────┴────┴─────┴────┴────┴───┴──── SCHOOL ENROLLMENT AND TYPE OF SCHOOL Persons 3+ years and enrolled in school . . 2,070 165 459 100 132 58 279 61 44 75 209 104 183 201 Preprimary school. . . . . . . . 97 13 23 17 8 3 19 - - - 5 3 1 5 Public school. . . . . . . . . 83 13 18 17 8 3 10 - - - 5 3 1 5 Elementary school, 1st to 8th. . 1,178 112 214 65 87 39 131 44 37 55 124 57 97 116 Public school. . . . . . . . . 1,153 111 203 65 87 39 127 44 37 55 123 57 94 111 High school, 9th to 12th grade . 677 38 156 17 33 14 118 15 7 16 78 44 80 61 Public school. . . . . . . . . 667 38 151 17 33 14 117 15 7 14 78 43 80 60 College. . . . . . . . . . . . . 118 2 66 1 4 2 11 2 - 4 2 - 5 19 Public school. . . . . . . . . 118 2 66 1 4 2 11 2 - 4 2 - 5 19 Females 3+ years and enrolled in school . . 1,002 75 222 57 66 29 133 38 23 38 99 47 79 96 Preprimary school. . . . . . . . 42 7 12 8 1 2 7 - - - 1 1 1 2 Public school. . . . . . . . . 35 7 8 8 1 2 4 - - - 1 1 1 2 Elementary school, 1st to 8th. . 566 51 90 41 50 19 56 26 18 29 63 31 40 52 Public school. . . . . . . . . 555 51 84 41 50 19 54 26 18 29 62 31 39 51 High school, 9th to 12th grade . 336 16 88 8 13 8 63 10 5 8 35 15 35 32 Public school. . . . . . . . . 330 16 85 8 13 8 63 10 5 6 35 14 35 32 College. . . . . . . . . . . . . 58 1 32 - 2 - 7 2 - 1 - - 3 10 Public school. . . . . . . . . 58 1 32 - 2 - 7 2 - 1 - - 3 10 EDUCATIONAL ATTAINMENT Persons 25+ years . . . . . 2,328 150 405 362 129 49 188 46 63 83 312 141 182 218 None . . . . . . . . . . . . . . 358 29 65 23 22 18 16 9 7 7 66 29 31 36 Elementary: 1 to 4 grade. . . . 42 3 1 2 2 - 12 2 3 - 12 2 1 2 5 and 6 grade . . . 53 6 9 1 - - 9 - 1 14 8 1 4 - 7 grade . . . . . . 77 5 38 1 - - 7 - 3 5 4 5 7 2 8 grade . . . . . . 224 18 35 64 8 1 16 4 9 5 22 17 17 8 High school: 9 grade . . . . . . 143 6 20 21 3 1 11 7 8 3 22 5 17 19 10 grade . . . . . . 199 14 19 30 9 4 28 3 4 7 22 13 20 26 11 grade . . . . . . 145 6 42 - 2 1 12 6 - 11 12 9 25 19 12 grade,no diploma. 216 15 18 9 28 10 20 8 18 6 25 36 10 13 High school graduate . . . . . . 466 32 65 122 40 5 32 3 6 16 65 1 24 55 Some college, no degree. . . . . 247 7 62 67 9 6 16 1 1 5 31 14 15 13 Associate degree, occupational . 90 8 24 7 6 2 6 3 2 3 13 1 5 10 Associate degree, academic . . . 31 - 4 3 - 1 3 - - - 3 7 4 6 Bachelor's degree. . . . . . . . 28 1 3 9 - - - - - - 6 - 2 7 Graduate/professional degree . . 9 - - 3 - - - - 1 1 1 1 - 2 Percent high school graduate . . 37.4 32.0 39.0 58.3 42.6 28.6 30.3 15.2 15.9 30.1 38.1 17.027.5 42.7 Percent bachelor's degree. . . . 1.6 .7 .7 3.3 - - - - 1.6 1.2 2.2 .7 1.1 4.1 Females 25+ years . . . . . 1,178 83 219 182 61 22 103 20 30 44 148 69 93 104 None . . . . . . . . . . . . . . 232 22 46 14 13 10 12 5 4 5 39 17 21 24 Elementary: 1 to 4 grade. . . . 25 3 1 1 - - 8 1 2 - 7 2 - - 5 and 6 grade . . . 33 2 5 1 - - 5 - - 9 7 - 4 - 7 grade . . . . . . 43 3 25 - - - 3 - 1 2 2 3 2 2 8 grade . . . . . . 149 12 29 39 5 - 12 3 4 4 17 9 10 5 High school: 9 grade . . . . . . 73 4 10 14 1 1 7 4 5 3 7 1 10 6 10 grade . . . . . . 121 10 12 20 5 3 23 3 4 5 9 5 7 15 11 grade . . . . . . 63 3 20 - 1 - 3 2 - 2 7 5 9 11 12 grade,no diploma. 95 5 8 4 18 4 9 - 7 2 9 20 3 6 High school graduate . . . . . . 209 11 28 61 17 2 16 - 3 9 27 1 16 18 Some college, no degree. . . . . 81 4 26 19 - 1 3 - - 2 9 4 7 6 Associate degree, occupational . 34 3 7 3 1 - 1 2 - 1 7 - 3 6 Associate degree, academic . . . 11 - 1 2 - 1 1 - - - 1 2 1 2 Bachelor's degree. . . . . . . . 8 1 1 4 - - - - - - - - - 2 Graduate/professional degree . . 1 - - - - - - - - - - - - 1 Percent high school graduate . . 29.2 22.9 28.8 48.9 29.5 18.2 20.4 10.0 10.0 27.3 29.7 10.129.0 33.7 Percent bachelor's degree. . . . .8 1.2 .5 2.2 - - - - - - - - - 2.9 Persons 18 to 24 years. . . 211 18 64 1 11 2 26 4 2 9 7 12 33 22 Percent high school graduate . . 31.3 5.6 42.2 - 36.4 50.0 26.9 50.0 - 33.3 28.6 -12.1 68.2 ─────────────────────────────────────────────────────────────────────────────────────────────────────────── Source: 2000 FSM Census
206 Chuuk Branch Statistics Office, Division of Statistics, FSM Department of Economic Affairs
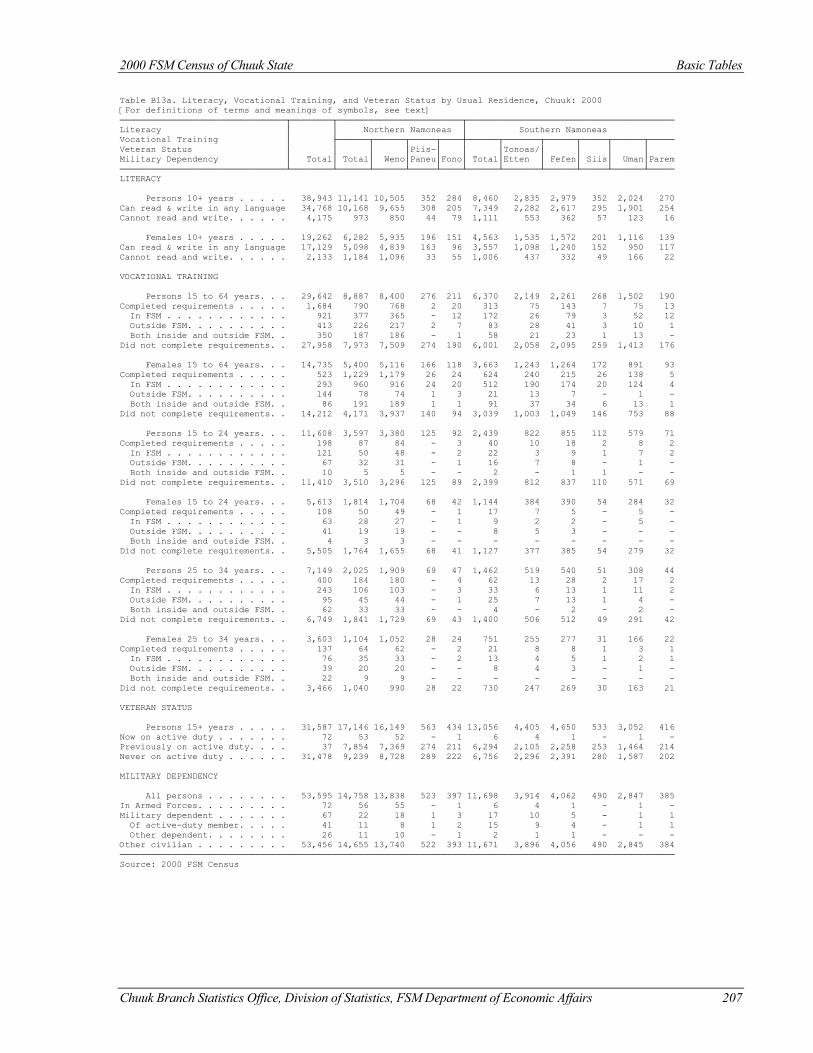
2000 FSM Census of Chuuk State Basic Tables
Chuuk Branch Statistics Office, Division of Statistics, FSM Department of Economic Affairs 207
Table B13a. Literacy, Vocational Training, and Veteran Status by Usual Residence, Chuuk: 2000 [For definitions of terms and meanings of symbols, see text] ────────────────────────────────┬────────┬────────────────────────┬──────────────────────────────────────── Literacy │ │ Northern Namoneas │ Southern Namoneas Vocational Training │ ├──────┬──────┬─────┬────┼──────┬───────┬──────┬─────┬──────┬───── Veteran Status │ │ │ │Piis-│ │ │Tonoas/│ │ │ │ Military Dependency │ Total│ Total│ Weno│Paneu│Fono│ Total│Etten │ Fefen│ Siis│ Uman│Parem ────────────────────────────────┴────────┴──────┴──────┴─────┴────┴──────┴───────┴──────┴─────┴──────┴───── LITERACY Persons 10+ years . . . . . 38,943 11,141 10,505 352 284 8,460 2,835 2,979 352 2,024 270 Can read & write in any language 34,768 10,168 9,655 308 205 7,349 2,282 2,617 295 1,901 254 Cannot read and write. . . . . . 4,175 973 850 44 79 1,111 553 362 57 123 16 Females 10+ years . . . . . 19,262 6,282 5,935 196 151 4,563 1,535 1,572 201 1,116 139 Can read & write in any language 17,129 5,098 4,839 163 96 3,557 1,098 1,240 152 950 117 Cannot read and write. . . . . . 2,133 1,184 1,096 33 55 1,006 437 332 49 166 22 VOCATIONAL TRAINING Persons 15 to 64 years. . . 29,642 8,887 8,400 276 211 6,370 2,149 2,261 268 1,502 190 Completed requirements . . . . . 1,684 790 768 2 20 313 75 143 7 75 13 In FSM . . . . . . . . . . . . 921 377 365 - 12 172 26 79 3 52 12 Outside FSM. . . . . . . . . . 413 226 217 2 7 83 28 41 3 10 1 Both inside and outside FSM. . 350 187 186 - 1 58 21 23 1 13 - Did not complete requirements. . 27,958 7,973 7,509 274 190 6,001 2,058 2,095 259 1,413 176 Females 15 to 64 years. . . 14,735 5,400 5,116 166 118 3,663 1,243 1,264 172 891 93 Completed requirements . . . . . 523 1,229 1,179 26 24 624 240 215 26 138 5 In FSM . . . . . . . . . . . . 293 960 916 24 20 512 190 174 20 124 4 Outside FSM. . . . . . . . . . 144 78 74 1 3 21 13 7 - 1 - Both inside and outside FSM. . 86 191 189 1 1 91 37 34 6 13 1 Did not complete requirements. . 14,212 4,171 3,937 140 94 3,039 1,003 1,049 146 753 88 Persons 15 to 24 years. . . 11,608 3,597 3,380 125 92 2,439 822 855 112 579 71 Completed requirements . . . . . 198 87 84 - 3 40 10 18 2 8 2 In FSM . . . . . . . . . . . . 121 50 48 - 2 22 3 9 1 7 2 Outside FSM. . . . . . . . . . 67 32 31 - 1 16 7 8 - 1 - Both inside and outside FSM. . 10 5 5 - - 2 - 1 1 - - Did not complete requirements. . 11,410 3,510 3,296 125 89 2,399 812 837 110 571 69 Females 15 to 24 years. . . 5,613 1,814 1,704 68 42 1,144 384 390 54 284 32 Completed requirements . . . . . 108 50 49 - 1 17 7 5 - 5 - In FSM . . . . . . . . . . . . 63 28 27 - 1 9 2 2 - 5 - Outside FSM. . . . . . . . . . 41 19 19 - - 8 5 3 - - - Both inside and outside FSM. . 4 3 3 - - - - - - - - Did not complete requirements. . 5,505 1,764 1,655 68 41 1,127 377 385 54 279 32 Persons 25 to 34 years. . . 7,149 2,025 1,909 69 47 1,462 519 540 51 308 44 Completed requirements . . . . . 400 184 180 - 4 62 13 28 2 17 2 In FSM . . . . . . . . . . . . 243 106 103 - 3 33 6 13 1 11 2 Outside FSM. . . . . . . . . . 95 45 44 - 1 25 7 13 1 4 - Both inside and outside FSM. . 62 33 33 - - 4 - 2 - 2 - Did not complete requirements. . 6,749 1,841 1,729 69 43 1,400 506 512 49 291 42 Females 25 to 34 years. . . 3,603 1,104 1,052 28 24 751 255 277 31 166 22 Completed requirements . . . . . 137 64 62 - 2 21 8 8 1 3 1 In FSM . . . . . . . . . . . . 76 35 33 - 2 13 4 5 1 2 1 Outside FSM. . . . . . . . . . 39 20 20 - - 8 4 3 - 1 - Both inside and outside FSM. . 22 9 9 - - - - - - - - Did not complete requirements. . 3,466 1,040 990 28 22 730 247 269 30 163 21 VETERAN STATUS Persons 15+ years . . . . . 31,587 17,146 16,149 563 434 13,056 4,405 4,650 533 3,052 416 Now on active duty . . . . . . . 72 53 52 - 1 6 4 1 - 1 - Previously on active duty. . . . 37 7,854 7,369 274 211 6,294 2,105 2,258 253 1,464 214 Never on active duty . . . . . . 31,478 9,239 8,728 289 222 6,756 2,296 2,391 280 1,587 202 MILITARY DEPENDENCY All persons . . . . . . . . 53,595 14,758 13,838 523 397 11,698 3,914 4,062 490 2,847 385 In Armed Forces. . . . . . . . . 72 56 55 - 1 6 4 1 - 1 - Military dependent . . . . . . . 67 22 18 1 3 17 10 5 - 1 1 Of active-duty member. . . . . 41 11 8 1 2 15 9 4 - 1 1 Other dependent. . . . . . . . 26 11 10 - 1 2 1 1 - - - Other civilian . . . . . . . . . 53,456 14,655 13,740 522 393 11,671 3,896 4,056 490 2,845 384 ─────────────────────────────────────────────────────────────────────────────────────────────────────────── Source: 2000 FSM Census
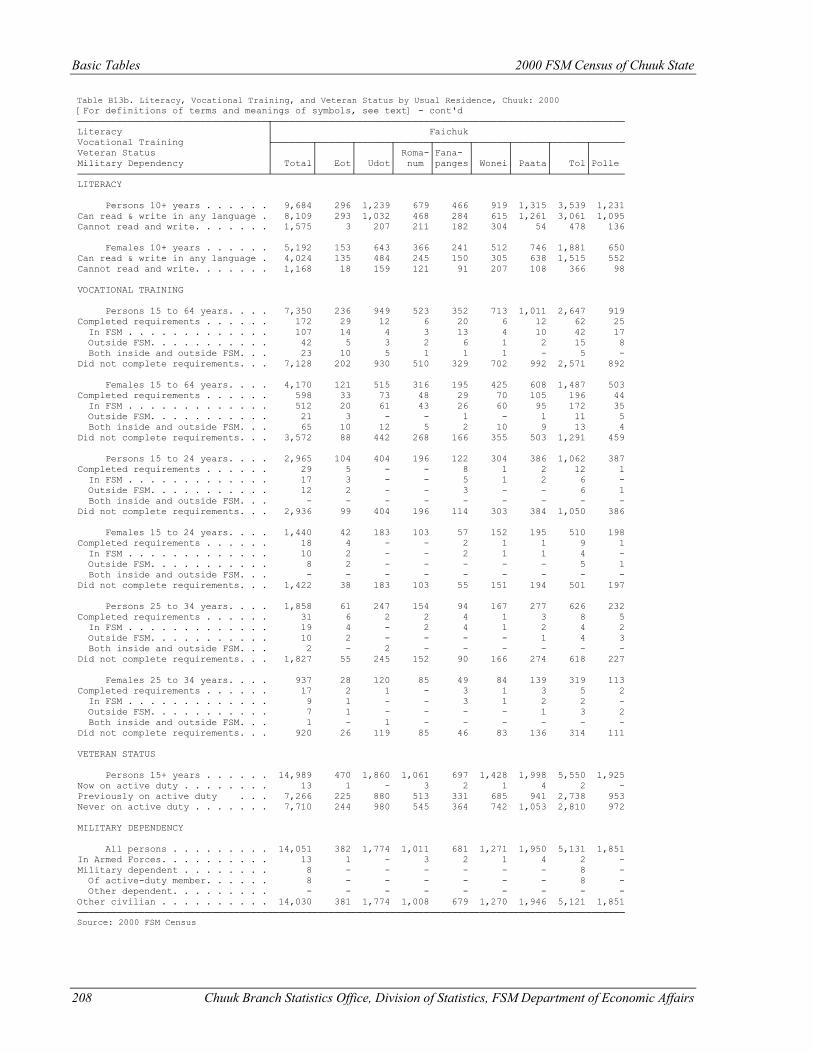
Basic Tables 2000 FSM Census of Chuuk State
208 Chuuk Branch Statistics Office, Division of Statistics, FSM Department of Economic Affairs
Table B13b. Literacy, Vocational Training, and Veteran Status by Usual Residence, Chuuk: 2000 [For definitions of terms and meanings of symbols, see text] - cont'd ──────────────────────────────────┬─────────────────────────────────────────────────────────────── Literacy │ Faichuk Vocational Training ├───────┬──────┬──────┬──────┬──────┬──────┬──────┬──────┬────── Veteran Status │ │ │ │ Roma-│Fana- │ │ │ │ Military Dependency │ Total│ Eot│ Udot│ num │panges│ Wonei│ Paata│ Tol│Polle ──────────────────────────────────┴───────┴──────┴──────┴──────┴──────┴──────┴──────┴──────┴────── LITERACY Persons 10+ years . . . . . . 9,684 296 1,239 679 466 919 1,315 3,539 1,231 Can read & write in any language . 8,109 293 1,032 468 284 615 1,261 3,061 1,095 Cannot read and write. . . . . . . 1,575 3 207 211 182 304 54 478 136 Females 10+ years . . . . . . 5,192 153 643 366 241 512 746 1,881 650 Can read & write in any language . 4,024 135 484 245 150 305 638 1,515 552 Cannot read and write. . . . . . . 1,168 18 159 121 91 207 108 366 98 VOCATIONAL TRAINING Persons 15 to 64 years. . . . 7,350 236 949 523 352 713 1,011 2,647 919 Completed requirements . . . . . . 172 29 12 6 20 6 12 62 25 In FSM . . . . . . . . . . . . . 107 14 4 3 13 4 10 42 17 Outside FSM. . . . . . . . . . . 42 5 3 2 6 1 2 15 8 Both inside and outside FSM. . . 23 10 5 1 1 1 - 5 - Did not complete requirements. . . 7,128 202 930 510 329 702 992 2,571 892 Females 15 to 64 years. . . . 4,170 121 515 316 195 425 608 1,487 503 Completed requirements . . . . . . 598 33 73 48 29 70 105 196 44 In FSM . . . . . . . . . . . . . 512 20 61 43 26 60 95 172 35 Outside FSM. . . . . . . . . . . 21 3 - - 1 - 1 11 5 Both inside and outside FSM. . . 65 10 12 5 2 10 9 13 4 Did not complete requirements. . . 3,572 88 442 268 166 355 503 1,291 459 Persons 15 to 24 years. . . . 2,965 104 404 196 122 304 386 1,062 387 Completed requirements . . . . . . 29 5 - - 8 1 2 12 1 In FSM . . . . . . . . . . . . . 17 3 - - 5 1 2 6 - Outside FSM. . . . . . . . . . . 12 2 - - 3 - - 6 1 Both inside and outside FSM. . . - - - - - - - - - Did not complete requirements. . . 2,936 99 404 196 114 303 384 1,050 386 Females 15 to 24 years. . . . 1,440 42 183 103 57 152 195 510 198 Completed requirements . . . . . . 18 4 - - 2 1 1 9 1 In FSM . . . . . . . . . . . . . 10 2 - - 2 1 1 4 - Outside FSM. . . . . . . . . . . 8 2 - - - - - 5 1 Both inside and outside FSM. . . - - - - - - - - - Did not complete requirements. . . 1,422 38 183 103 55 151 194 501 197 Persons 25 to 34 years. . . . 1,858 61 247 154 94 167 277 626 232 Completed requirements . . . . . . 31 6 2 2 4 1 3 8 5 In FSM . . . . . . . . . . . . . 19 4 - 2 4 1 2 4 2 Outside FSM. . . . . . . . . . . 10 2 - - - - 1 4 3 Both inside and outside FSM. . . 2 - 2 - - - - - - Did not complete requirements. . . 1,827 55 245 152 90 166 274 618 227 Females 25 to 34 years. . . . 937 28 120 85 49 84 139 319 113 Completed requirements . . . . . . 17 2 1 - 3 1 3 5 2 In FSM . . . . . . . . . . . . . 9 1 - - 3 1 2 2 - Outside FSM. . . . . . . . . . . 7 1 - - - - 1 3 2 Both inside and outside FSM. . . 1 - 1 - - - - - - Did not complete requirements. . . 920 26 119 85 46 83 136 314 111 VETERAN STATUS Persons 15+ years . . . . . . 14,989 470 1,860 1,061 697 1,428 1,998 5,550 1,925 Now on active duty . . . . . . . . 13 1 - 3 2 1 4 2 - Previously on active duty . . . 7,266 225 880 513 331 685 941 2,738 953 Never on active duty . . . . . . . 7,710 244 980 545 364 742 1,053 2,810 972 MILITARY DEPENDENCY All persons . . . . . . . . . 14,051 382 1,774 1,011 681 1,271 1,950 5,131 1,851 In Armed Forces. . . . . . . . . . 13 1 - 3 2 1 4 2 - Military dependent . . . . . . . . 8 - - - - - - 8 - Of active-duty member. . . . . . 8 - - - - - - 8 - Other dependent. . . . . . . . . - - - - - - - - - Other civilian . . . . . . . . . . 14,030 381 1,774 1,008 679 1,270 1,946 5,121 1,851 ────────────────────────────────────────────────────────────────────────────────────────────────── Source: 2000 FSM Census
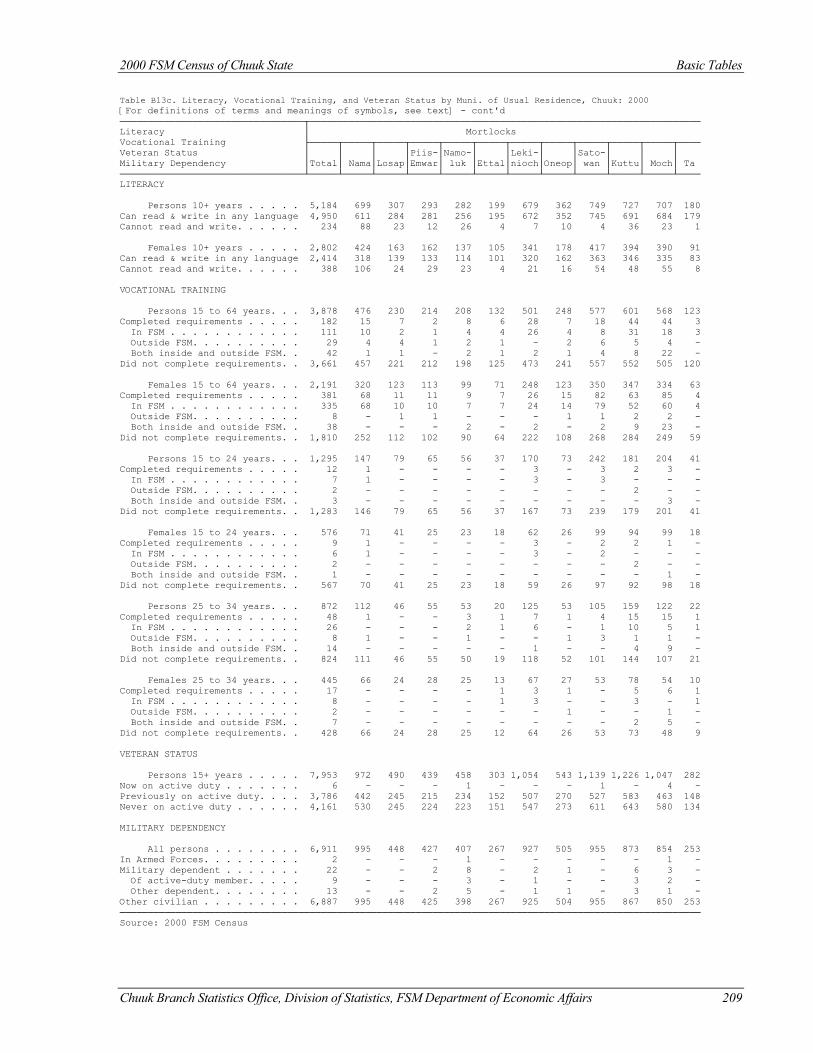
2000 FSM Census of Chuuk State Basic Tables
Chuuk Branch Statistics Office, Division of Statistics, FSM Department of Economic Affairs 209
Table B13c. Literacy, Vocational Training, and Veteran Status by Muni. of Usual Residence, Chuuk: 2000 [For definitions of terms and meanings of symbols, see text] - cont'd ─────────────────────────────────┬────────────────────────────────────────────────────────────────────── Literacy │ Mortlocks Vocational Training ├─────┬─────┬─────┬─────┬─────┬─────┬─────┬─────┬─────┬─────┬─────┬──── Veteran Status │ │ │ │Piis-│Namo-│ │Leki-│ │Sato-│ │ │ Military Dependency │Total│ Nama│Losap│Emwar│ luk │Ettal│nioch│Oneop│ wan │Kuttu│ Moch│ Ta ─────────────────────────────────┴─────┴─────┴─────┴─────┴─────┴─────┴─────┴─────┴─────┴─────┴─────┴──── LITERACY Persons 10+ years . . . . . 5,184 699 307 293 282 199 679 362 749 727 707 180 Can read & write in any language 4,950 611 284 281 256 195 672 352 745 691 684 179 Cannot read and write. . . . . . 234 88 23 12 26 4 7 10 4 36 23 1 Females 10+ years . . . . . 2,802 424 163 162 137 105 341 178 417 394 390 91 Can read & write in any language 2,414 318 139 133 114 101 320 162 363 346 335 83 Cannot read and write. . . . . . 388 106 24 29 23 4 21 16 54 48 55 8 VOCATIONAL TRAINING Persons 15 to 64 years. . . 3,878 476 230 214 208 132 501 248 577 601 568 123 Completed requirements . . . . . 182 15 7 2 8 6 28 7 18 44 44 3 In FSM . . . . . . . . . . . . 111 10 2 1 4 4 26 4 8 31 18 3 Outside FSM. . . . . . . . . . 29 4 4 1 2 1 - 2 6 5 4 - Both inside and outside FSM. . 42 1 1 - 2 1 2 1 4 8 22 - Did not complete requirements. . 3,661 457 221 212 198 125 473 241 557 552 505 120 Females 15 to 64 years. . . 2,191 320 123 113 99 71 248 123 350 347 334 63 Completed requirements . . . . . 381 68 11 11 9 7 26 15 82 63 85 4 In FSM . . . . . . . . . . . . 335 68 10 10 7 7 24 14 79 52 60 4 Outside FSM. . . . . . . . . . 8 - 1 1 - - - 1 1 2 2 - Both inside and outside FSM. . 38 - - - 2 - 2 - 2 9 23 - Did not complete requirements. . 1,810 252 112 102 90 64 222 108 268 284 249 59 Persons 15 to 24 years. . . 1,295 147 79 65 56 37 170 73 242 181 204 41 Completed requirements . . . . . 12 1 - - - - 3 - 3 2 3 - In FSM . . . . . . . . . . . . 7 1 - - - - 3 - 3 - - - Outside FSM. . . . . . . . . . 2 - - - - - - - - 2 - - Both inside and outside FSM. . 3 - - - - - - - - - 3 - Did not complete requirements. . 1,283 146 79 65 56 37 167 73 239 179 201 41 Females 15 to 24 years. . . 576 71 41 25 23 18 62 26 99 94 99 18 Completed requirements . . . . . 9 1 - - - - 3 - 2 2 1 - In FSM . . . . . . . . . . . . 6 1 - - - - 3 - 2 - - - Outside FSM. . . . . . . . . . 2 - - - - - - - - 2 - - Both inside and outside FSM. . 1 - - - - - - - - - 1 - Did not complete requirements. . 567 70 41 25 23 18 59 26 97 92 98 18 Persons 25 to 34 years. . . 872 112 46 55 53 20 125 53 105 159 122 22 Completed requirements . . . . . 48 1 - - 3 1 7 1 4 15 15 1 In FSM . . . . . . . . . . . . 26 - - - 2 1 6 - 1 10 5 1 Outside FSM. . . . . . . . . . 8 1 - - 1 - - 1 3 1 1 - Both inside and outside FSM. . 14 - - - - - 1 - - 4 9 - Did not complete requirements. . 824 111 46 55 50 19 118 52 101 144 107 21 Females 25 to 34 years. . . 445 66 24 28 25 13 67 27 53 78 54 10 Completed requirements . . . . . 17 - - - - 1 3 1 - 5 6 1 In FSM . . . . . . . . . . . . 8 - - - - 1 3 - - 3 - 1 Outside FSM. . . . . . . . . . 2 - - - - - - 1 - - 1 - Both inside and outside FSM. . 7 - - - - - - - - 2 5 - Did not complete requirements. . 428 66 24 28 25 12 64 26 53 73 48 9 VETERAN STATUS Persons 15+ years . . . . . 7,953 972 490 439 458 303 1,054 543 1,139 1,226 1,047 282 Now on active duty . . . . . . . 6 - - - 1 - - - 1 - 4 - Previously on active duty. . . . 3,786 442 245 215 234 152 507 270 527 583 463 148 Never on active duty . . . . . . 4,161 530 245 224 223 151 547 273 611 643 580 134 MILITARY DEPENDENCY All persons . . . . . . . . 6,911 995 448 427 407 267 927 505 955 873 854 253 In Armed Forces. . . . . . . . . 2 - - - 1 - - - - - 1 - Military dependent . . . . . . . 22 - - 2 8 - 2 1 - 6 3 - Of active-duty member. . . . . 9 - - - 3 - 1 - - 3 2 - Other dependent. . . . . . . . 13 - - 2 5 - 1 1 - 3 1 - Other civilian . . . . . . . . . 6,887 995 448 425 398 267 925 504 955 867 850 253 ──────────────────────────────────────────────────────────────────────────────────────────────────────── Source: 2000 FSM Census
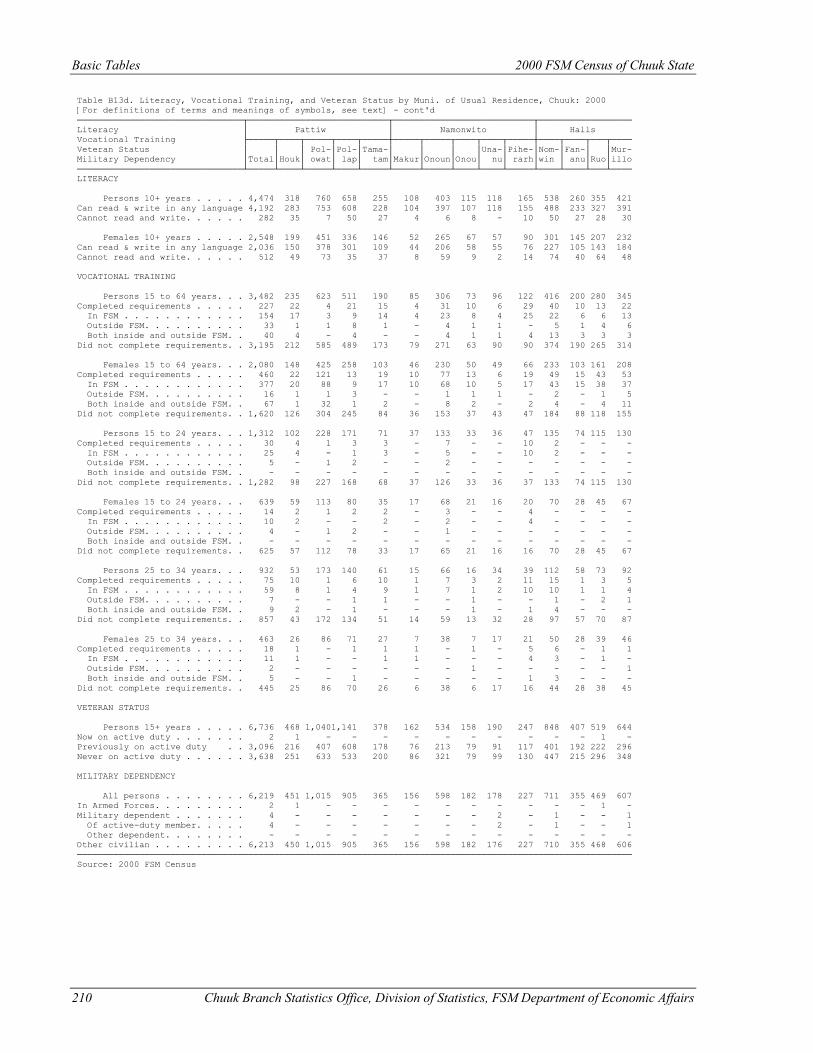
Basic Tables 2000 FSM Census of Chuuk State
210 Chuuk Branch Statistics Office, Division of Statistics, FSM Department of Economic Affairs
Table B13d. Literacy, Vocational Training, and Veteran Status by Muni. of Usual Residence, Chuuk: 2000 [For definitions of terms and meanings of symbols, see text] - cont'd ────────────────────────────────┬───────────────────────────┬───────────────────────────┬────────────────── Literacy │ Pattiw │ Namonwito │ Halls Vocational Training ├─────┬────┬─────┬────┬─────┼─────┬─────┬────┬────┬─────┼────┬────┬───┬──── Veteran Status │ │ │ Pol-│Pol-│Tama-│ │ │ │Una-│Pihe-│Nom-│Fan-│ │Mur- Military Dependency │Total│Houk│ owat│ lap│ tam│Makur│Onoun│Onou│ nu│ rarh│win │ anu│Ruo│illo ────────────────────────────────┴─────┴────┴─────┴────┴─────┴─────┴─────┴────┴────┴─────┴────┴────┴───┴──── LITERACY Persons 10+ years . . . . . 4,474 318 760 658 255 108 403 115 118 165 538 260 355 421 Can read & write in any language 4,192 283 753 608 228 104 397 107 118 155 488 233 327 391 Cannot read and write. . . . . . 282 35 7 50 27 4 6 8 - 10 50 27 28 30 Females 10+ years . . . . . 2,548 199 451 336 146 52 265 67 57 90 301 145 207 232 Can read & write in any language 2,036 150 378 301 109 44 206 58 55 76 227 105 143 184 Cannot read and write. . . . . . 512 49 73 35 37 8 59 9 2 14 74 40 64 48 VOCATIONAL TRAINING Persons 15 to 64 years. . . 3,482 235 623 511 190 85 306 73 96 122 416 200 280 345 Completed requirements . . . . . 227 22 4 21 15 4 31 10 6 29 40 10 13 22 In FSM . . . . . . . . . . . . 154 17 3 9 14 4 23 8 4 25 22 6 6 13 Outside FSM. . . . . . . . . . 33 1 1 8 1 - 4 1 1 - 5 1 4 6 Both inside and outside FSM. . 40 4 - 4 - - 4 1 1 4 13 3 3 3 Did not complete requirements. . 3,195 212 585 489 173 79 271 63 90 90 374 190 265 314 Females 15 to 64 years. . . 2,080 148 425 258 103 46 230 50 49 66 233 103 161 208 Completed requirements . . . . . 460 22 121 13 19 10 77 13 6 19 49 15 43 53 In FSM . . . . . . . . . . . . 377 20 88 9 17 10 68 10 5 17 43 15 38 37 Outside FSM. . . . . . . . . . 16 1 1 3 - - 1 1 1 - 2 - 1 5 Both inside and outside FSM. . 67 1 32 1 2 - 8 2 - 2 4 - 4 11 Did not complete requirements. . 1,620 126 304 245 84 36 153 37 43 47 184 88 118 155 Persons 15 to 24 years. . . 1,312 102 228 171 71 37 133 33 36 47 135 74 115 130 Completed requirements . . . . . 30 4 1 3 3 - 7 - - 10 2 - - - In FSM . . . . . . . . . . . . 25 4 - 1 3 - 5 - - 10 2 - - - Outside FSM. . . . . . . . . . 5 - 1 2 - - 2 - - - - - - - Both inside and outside FSM. . - - - - - - - - - - - - - - Did not complete requirements. . 1,282 98 227 168 68 37 126 33 36 37 133 74 115 130 Females 15 to 24 years. . . 639 59 113 80 35 17 68 21 16 20 70 28 45 67 Completed requirements . . . . . 14 2 1 2 2 - 3 - - 4 - - - - In FSM . . . . . . . . . . . . 10 2 - - 2 - 2 - - 4 - - - - Outside FSM. . . . . . . . . . 4 - 1 2 - - 1 - - - - - - - Both inside and outside FSM. . - - - - - - - - - - - - - - Did not complete requirements. . 625 57 112 78 33 17 65 21 16 16 70 28 45 67 Persons 25 to 34 years. . . 932 53 173 140 61 15 66 16 34 39 112 58 73 92 Completed requirements . . . . . 75 10 1 6 10 1 7 3 2 11 15 1 3 5 In FSM . . . . . . . . . . . . 59 8 1 4 9 1 7 1 2 10 10 1 1 4 Outside FSM. . . . . . . . . . 7 - - 1 1 - - 1 - - 1 - 2 1 Both inside and outside FSM. . 9 2 - 1 - - - 1 - 1 4 - - - Did not complete requirements. . 857 43 172 134 51 14 59 13 32 28 97 57 70 87 Females 25 to 34 years. . . 463 26 86 71 27 7 38 7 17 21 50 28 39 46 Completed requirements . . . . . 18 1 - 1 1 1 - 1 - 5 6 - 1 1 In FSM . . . . . . . . . . . . 11 1 - - 1 1 - - - 4 3 - 1 - Outside FSM. . . . . . . . . . 2 - - - - - - 1 - - - - - 1 Both inside and outside FSM. . 5 - - 1 - - - - - 1 3 - - - Did not complete requirements. . 445 25 86 70 26 6 38 6 17 16 44 28 38 45 VETERAN STATUS Persons 15+ years . . . . . 6,736 468 1,0401,141 378 162 534 158 190 247 848 407 519 644 Now on active duty . . . . . . . 2 1 - - - - - - - - - - 1 - Previously on active duty . . 3,096 216 407 608 178 76 213 79 91 117 401 192 222 296 Never on active duty . . . . . . 3,638 251 633 533 200 86 321 79 99 130 447 215 296 348 MILITARY DEPENDENCY All persons . . . . . . . . 6,219 451 1,015 905 365 156 598 182 178 227 711 355 469 607 In Armed Forces. . . . . . . . . 2 1 - - - - - - - - - - 1 - Military dependent . . . . . . . 4 - - - - - - - 2 - 1 - - 1 Of active-duty member. . . . . 4 - - - - - - - 2 - 1 - - 1 Other dependent. . . . . . . . - - - - - - - - - - - - - - Other civilian . . . . . . . . . 6,213 450 1,015 905 365 156 598 182 176 227 710 355 468 606 ─────────────────────────────────────────────────────────────────────────────────────────────────────────── Source: 2000 FSM Census
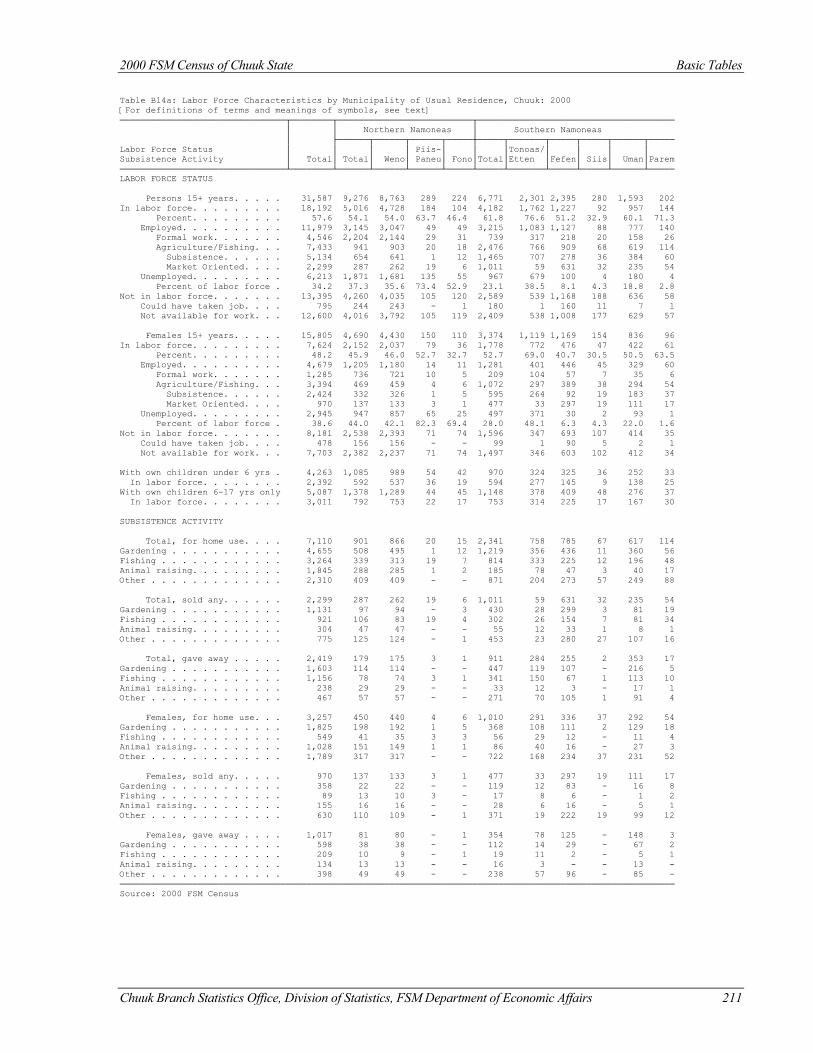
2000 FSM Census of Chuuk State Basic Tables
Chuuk Branch Statistics Office, Division of Statistics, FSM Department of Economic Affairs 211
Table B14a: Labor Force Characteristics by Municipality of Usual Residence, Chuuk: 2000 [For definitions of terms and meanings of symbols, see text] ────────────────────────────────┬────────┬──────────────────────────┬────────────────────────────────────── │ │ Northern Namoneas │ Southern Namoneas │ ├──────┬──────┬──────┬─────┼─────┬───────┬─────┬─────┬──────┬───── Labor Force Status │ │ │ │ Piis-│ │ │Tonoas/│ │ │ │ Subsistence Activity │ Total│ Total│ Weno│ Paneu│ Fono│Total│Etten │Fefen│ Siis│ Uman│Parem ────────────────────────────────┴────────┴──────┴──────┴──────┴─────┴─────┴───────┴─────┴─────┴──────┴───── LABOR FORCE STATUS Persons 15+ years. . . . . 31,587 9,276 8,763 289 224 6,771 2,301 2,395 280 1,593 202 In labor force. . . . . . . . . 18,192 5,016 4,728 184 104 4,182 1,762 1,227 92 957 144 Percent. . . . . . . . . 57.6 54.1 54.0 63.7 46.4 61.8 76.6 51.2 32.9 60.1 71.3 Employed. . . . . . . . . . 11,979 3,145 3,047 49 49 3,215 1,083 1,127 88 777 140 Formal work. . . . . . . 4,546 2,204 2,144 29 31 739 317 218 20 158 26 Agriculture/Fishing. . . 7,433 941 903 20 18 2,476 766 909 68 619 114 Subsistence. . . . . . 5,134 654 641 1 12 1,465 707 278 36 384 60 Market Oriented. . . . 2,299 287 262 19 6 1,011 59 631 32 235 54 Unemployed. . . . . . . . . 6,213 1,871 1,681 135 55 967 679 100 4 180 4 Percent of labor force . 34.2 37.3 35.6 73.4 52.9 23.1 38.5 8.1 4.3 18.8 2.8 Not in labor force. . . . . . . 13,395 4,260 4,035 105 120 2,589 539 1,168 188 636 58 Could have taken job. . . . 795 244 243 - 1 180 1 160 11 7 1 Not available for work. . . 12,600 4,016 3,792 105 119 2,409 538 1,008 177 629 57 Females 15+ years. . . . . 15,805 4,690 4,430 150 110 3,374 1,119 1,169 154 836 96 In labor force. . . . . . . . . 7,624 2,152 2,037 79 36 1,778 772 476 47 422 61 Percent. . . . . . . . . 48.2 45.9 46.0 52.7 32.7 52.7 69.0 40.7 30.5 50.5 63.5 Employed. . . . . . . . . . 4,679 1,205 1,180 14 11 1,281 401 446 45 329 60 Formal work. . . . . . . 1,285 736 721 10 5 209 104 57 7 35 6 Agriculture/Fishing. . . 3,394 469 459 4 6 1,072 297 389 38 294 54 Subsistence. . . . . . 2,424 332 326 1 5 595 264 92 19 183 37 Market Oriented. . . . 970 137 133 3 1 477 33 297 19 111 17 Unemployed. . . . . . . . . 2,945 947 857 65 25 497 371 30 2 93 1 Percent of labor force . 38.6 44.0 42.1 82.3 69.4 28.0 48.1 6.3 4.3 22.0 1.6 Not in labor force. . . . . . . 8,181 2,538 2,393 71 74 1,596 347 693 107 414 35 Could have taken job. . . . 478 156 156 - - 99 1 90 5 2 1 Not available for work. . . 7,703 2,382 2,237 71 74 1,497 346 603 102 412 34 With own children under 6 yrs . 4,263 1,085 989 54 42 970 324 325 36 252 33 In labor force. . . . . . . . 2,392 592 537 36 19 594 277 145 9 138 25 With own children 6-17 yrs only 5,087 1,378 1,289 44 45 1,148 378 409 48 276 37 In labor force. . . . . . . . 3,011 792 753 22 17 753 314 225 17 167 30 SUBSISTENCE ACTIVITY Total, for home use. . . . 7,110 901 866 20 15 2,341 758 785 67 617 114 Gardening . . . . . . . . . . . 4,655 508 495 1 12 1,219 356 436 11 360 56 Fishing . . . . . . . . . . . . 3,264 339 313 19 7 814 333 225 12 196 48 Animal raising. . . . . . . . . 1,845 288 285 1 2 185 78 47 3 40 17 Other . . . . . . . . . . . . . 2,310 409 409 - - 871 204 273 57 249 88 Total, sold any. . . . . . 2,299 287 262 19 6 1,011 59 631 32 235 54 Gardening . . . . . . . . . . . 1,131 97 94 - 3 430 28 299 3 81 19 Fishing . . . . . . . . . . . . 921 106 83 19 4 302 26 154 7 81 34 Animal raising. . . . . . . . . 304 47 47 - - 55 12 33 1 8 1 Other . . . . . . . . . . . . . 775 125 124 - 1 453 23 280 27 107 16 Total, gave away . . . . . 2,419 179 175 3 1 911 284 255 2 353 17 Gardening . . . . . . . . . . . 1,603 114 114 - - 447 119 107 - 216 5 Fishing . . . . . . . . . . . . 1,156 78 74 3 1 341 150 67 1 113 10 Animal raising. . . . . . . . . 238 29 29 - - 33 12 3 - 17 1 Other . . . . . . . . . . . . . 467 57 57 - - 271 70 105 1 91 4 Females, for home use. . . 3,257 450 440 4 6 1,010 291 336 37 292 54 Gardening . . . . . . . . . . . 1,825 198 192 1 5 368 108 111 2 129 18 Fishing . . . . . . . . . . . . 549 41 35 3 3 56 29 12 - 11 4 Animal raising. . . . . . . . . 1,028 151 149 1 1 86 40 16 - 27 3 Other . . . . . . . . . . . . . 1,789 317 317 - - 722 168 234 37 231 52 Females, sold any. . . . . 970 137 133 3 1 477 33 297 19 111 17 Gardening . . . . . . . . . . . 358 22 22 - - 119 12 83 - 16 8 Fishing . . . . . . . . . . . . 89 13 10 3 - 17 8 6 - 1 2 Animal raising. . . . . . . . . 155 16 16 - - 28 6 16 - 5 1 Other . . . . . . . . . . . . . 630 110 109 - 1 371 19 222 19 99 12 Females, gave away . . . . 1,017 81 80 - 1 354 78 125 - 148 3 Gardening . . . . . . . . . . . 598 38 38 - - 112 14 29 - 67 2 Fishing . . . . . . . . . . . . 209 10 9 - 1 19 11 2 - 5 1 Animal raising. . . . . . . . . 134 13 13 - - 16 3 - - 13 - Other . . . . . . . . . . . . . 398 49 49 - - 238 57 96 - 85 - ─────────────────────────────────────────────────────────────────────────────────────────────────────────── Source: 2000 FSM Census

Basic Tables 2000 FSM Census of Chuuk State
212 Chuuk Branch Statistics Office, Division of Statistics, FSM Department of Economic Affairs
Table B14b. Labor Force Characteristics by Municipality of Usual Residence, Chuuk: 2000 - cont'd [For definitions of terms and meanings of symbols, see text] ─────────────────────────────────┬─────────────────────────────────────────────────────────────── │ Faichuk ├────────┬──────┬──────┬──────┬──────┬──────┬──────┬──────┬───── Labor Force Status │ │ │ │ Roma-│Fana- │ │ │ │ Subsistence Activity │ Total│ Eot│ Udot│ num │panges│ Wonei│ Paata│ Tol│Polle ─────────────────────────────────┴────────┴──────┴──────┴──────┴──────┴──────┴──────┴──────┴───── LABOR FORCE STATUS Persons 15+ years . . . . . . 7,730 246 980 548 366 743 1,058 2,814 975 In labor force . . . . . . . . . . 4,725 87 741 287 251 558 707 1,495 599 Percent . . . . . . . . . . 61.1 35.4 75.6 52.4 68.6 75.1 66.8 53.1 61.4 Employed . . . . . . . . . . . 2,846 70 191 94 138 411 529 1,130 283 Formal work . . . . . . . . 607 31 113 39 14 38 46 266 60 Agriculture/Fishing . . . . 2,239 39 78 55 124 373 483 864 223 Subsistence . . . . . . . 1,452 9 46 6 54 357 378 505 97 Market Oriented . . . . . 787 30 32 49 70 16 105 359 126 Unemployed . . . . . . . . . . 1,879 17 550 193 113 147 178 365 316 Percent of labor force. . . 39.8 19.5 74.2 67.2 45.0 26.3 25.2 24.4 52.8 Not in labor force . . . . . . . . 3,005 159 239 261 115 185 351 1,319 376 Could have taken job . . . . . 219 - 8 2 1 2 - 176 30 Not available for work . . . . 2,786 159 231 259 114 183 351 1,143 346 Females 15+ years . . . . . . 3,864 113 462 286 181 377 538 1,410 497 In labor force . . . . . . . . . . 1,921 24 319 93 106 255 287 594 243 Percent . . . . . . . . . . 49.7 21.2 69.0 32.5 58.6 67.6 53.3 42.1 48.9 Employed . . . . . . . . . . . 1,151 21 64 25 65 192 227 423 134 Formal work . . . . . . . . 188 6 24 13 6 20 10 86 23 Agriculture/Fishing . . . . 963 15 40 12 59 172 217 337 111 Subsistence . . . . . . . 711 5 25 3 34 165 179 240 60 Market Oriented . . . . . 252 10 15 9 25 7 38 97 51 Unemployed . . . . . . . . . . 770 3 255 68 41 63 60 171 109 Percent of labor force. . . 40.1 12.5 79.9 73.1 38.7 24.7 20.9 28.8 44.9 Not in labor force . . . . . . . . 1,943 89 143 193 75 122 251 816 254 Could have taken job . . . . . 147 - 6 2 1 2 - 114 22 Not available for work . . . . 1,796 89 137 191 74 120 251 702 232 With own children under 6 yrs. . . 1,191 29 137 94 58 79 162 466 166 In labor force . . . . . . . . . 624 9 105 33 34 53 92 215 83 With own children 6-17 yrs only. . 1,317 31 164 105 66 104 187 501 159 In labor force . . . . . . . . . 724 9 122 27 37 74 105 264 86 SUBSISTENCE ACTIVITY Total, for home use . . . . . 2,189 39 75 36 117 359 482 862 219 Gardening. . . . . . . . . . . . . 1,828 31 62 17 51 347 415 702 203 Fishing. . . . . . . . . . . . . . 1,262 29 44 30 53 281 279 438 108 Animal raising . . . . . . . . . . 320 9 14 5 4 27 35 202 24 Other. . . . . . . . . . . . . . . 303 13 16 8 39 4 82 131 10 Total, sold any . . . . . . . 787 30 32 49 70 16 105 359 126 Gardening. . . . . . . . . . . . . 548 19 23 20 9 14 89 262 112 Fishing. . . . . . . . . . . . . . 408 21 15 37 44 7 78 163 43 Animal raising . . . . . . . . . . 114 9 7 4 - 1 26 59 8 Other. . . . . . . . . . . . . . . 133 14 15 10 20 2 20 50 2 Total, gave away. . . . . . . 1,012 12 24 10 4 301 80 380 201 Gardening. . . . . . . . . . . . . 880 11 18 7 3 294 73 290 184 Fishing. . . . . . . . . . . . . . 582 4 13 7 1 213 57 218 69 Animal raising . . . . . . . . . . 55 1 3 2 - 11 6 22 10 Other. . . . . . . . . . . . . . . 43 2 3 2 1 - 13 20 2 Females, for home use . . . . 943 15 39 10 53 167 216 335 108 Gardening. . . . . . . . . . . . . 760 14 34 6 25 163 153 261 104 Fishing. . . . . . . . . . . . . . 333 7 16 9 2 106 89 61 43 Animal raising . . . . . . . . . . 178 7 7 3 1 14 13 115 18 Other. . . . . . . . . . . . . . . 236 8 10 6 39 3 74 90 6 Females, sold any . . . . . . 252 10 15 9 25 7 38 97 51 Gardening. . . . . . . . . . . . . 177 7 11 5 5 7 28 65 49 Fishing. . . . . . . . . . . . . . 48 2 4 6 1 - 22 9 4 Animal raising . . . . . . . . . . 53 7 5 3 - - 10 21 7 Other. . . . . . . . . . . . . . . 94 8 10 6 20 1 13 35 1 Females, gave away. . . . . . 402 6 11 3 1 140 33 113 95 Gardening. . . . . . . . . . . . . 366 5 10 1 - 139 26 94 91 Fishing. . . . . . . . . . . . . . 143 2 5 2 - 78 19 18 19 Animal raising . . . . . . . . . . 28 - 2 1 - 6 2 9 8 Other. . . . . . . . . . . . . . . 27 1 1 2 1 - 7 14 1 ───────────────────────────────────────────────────────────────────────────────────────────────── Source: 2000 FSM Census
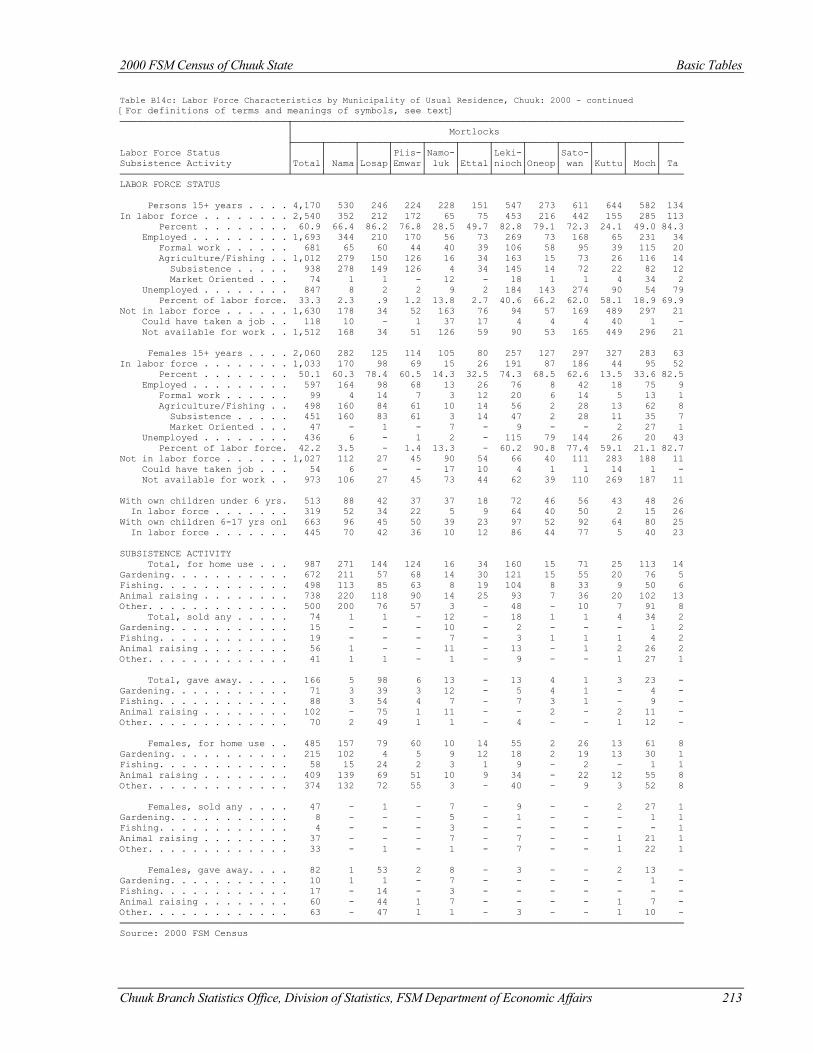
2000 FSM Census of Chuuk State Basic Tables
Chuuk Branch Statistics Office, Division of Statistics, FSM Department of Economic Affairs 213
Table B14c: Labor Force Characteristics by Municipality of Usual Residence, Chuuk: 2000 - continued [For definitions of terms and meanings of symbols, see text] ──────────────────────────────┬────────────────────────────────────────────────────────────────────── │ Mortlocks ├─────┬─────┬─────┬─────┬─────┬─────┬─────┬─────┬─────┬─────┬─────┬──── Labor Force Status │ │ │ │Piis-│Namo-│ │Leki-│ │Sato-│ │ │ Subsistence Activity │Total│ Nama│Losap│Emwar│ luk │Ettal│nioch│Oneop│ wan │Kuttu│ Moch│ Ta ──────────────────────────────┴─────┴─────┴─────┴─────┴─────┴─────┴─────┴─────┴─────┴─────┴─────┴──── LABOR FORCE STATUS Persons 15+ years . . . . 4,170 530 246 224 228 151 547 273 611 644 582 134 In labor force . . . . . . . . 2,540 352 212 172 65 75 453 216 442 155 285 113 Percent . . . . . . . . 60.9 66.4 86.2 76.8 28.5 49.7 82.8 79.1 72.3 24.1 49.0 84.3 Employed . . . . . . . . . 1,693 344 210 170 56 73 269 73 168 65 231 34 Formal work . . . . . . 681 65 60 44 40 39 106 58 95 39 115 20 Agriculture/Fishing . . 1,012 279 150 126 16 34 163 15 73 26 116 14 Subsistence . . . . . 938 278 149 126 4 34 145 14 72 22 82 12 Market Oriented . . . 74 1 1 - 12 - 18 1 1 4 34 2 Unemployed . . . . . . . . 847 8 2 2 9 2 184 143 274 90 54 79 Percent of labor force. 33.3 2.3 .9 1.2 13.8 2.7 40.6 66.2 62.0 58.1 18.9 69.9 Not in labor force . . . . . . 1,630 178 34 52 163 76 94 57 169 489 297 21 Could have taken a job . . 118 10 - 1 37 17 4 4 4 40 1 - Not available for work . . 1,512 168 34 51 126 59 90 53 165 449 296 21 Females 15+ years . . . . 2,060 282 125 114 105 80 257 127 297 327 283 63 In labor force . . . . . . . . 1,033 170 98 69 15 26 191 87 186 44 95 52 Percent . . . . . . . . 50.1 60.3 78.4 60.5 14.3 32.5 74.3 68.5 62.6 13.5 33.6 82.5 Employed . . . . . . . . . 597 164 98 68 13 26 76 8 42 18 75 9 Formal work . . . . . . 99 4 14 7 3 12 20 6 14 5 13 1 Agriculture/Fishing . . 498 160 84 61 10 14 56 2 28 13 62 8 Subsistence . . . . . 451 160 83 61 3 14 47 2 28 11 35 7 Market Oriented . . . 47 - 1 - 7 - 9 - - 2 27 1 Unemployed . . . . . . . . 436 6 - 1 2 - 115 79 144 26 20 43 Percent of labor force. 42.2 3.5 - 1.4 13.3 - 60.2 90.8 77.4 59.1 21.1 82.7 Not in labor force . . . . . . 1,027 112 27 45 90 54 66 40 111 283 188 11 Could have taken job . . . 54 6 - - 17 10 4 1 1 14 1 - Not available for work . . 973 106 27 45 73 44 62 39 110 269 187 11 With own children under 6 yrs. 513 88 42 37 37 18 72 46 56 43 48 26 In labor force . . . . . . . 319 52 34 22 5 9 64 40 50 2 15 26 With own children 6-17 yrs onl 663 96 45 50 39 23 97 52 92 64 80 25 In labor force . . . . . . . 445 70 42 36 10 12 86 44 77 5 40 23 SUBSISTENCE ACTIVITY Total, for home use . . . 987 271 144 124 16 34 160 15 71 25 113 14 Gardening. . . . . . . . . . . 672 211 57 68 14 30 121 15 55 20 76 5 Fishing. . . . . . . . . . . . 498 113 85 63 8 19 104 8 33 9 50 6 Animal raising . . . . . . . . 738 220 118 90 14 25 93 7 36 20 102 13 Other. . . . . . . . . . . . . 500 200 76 57 3 - 48 - 10 7 91 8 Total, sold any . . . . . 74 1 1 - 12 - 18 1 1 4 34 2 Gardening. . . . . . . . . . . 15 - - - 10 - 2 - - - 1 2 Fishing. . . . . . . . . . . . 19 - - - 7 - 3 1 1 1 4 2 Animal raising . . . . . . . . 56 1 - - 11 - 13 - 1 2 26 2 Other. . . . . . . . . . . . . 41 1 1 - 1 - 9 - - 1 27 1 Total, gave away. . . . . 166 5 98 6 13 - 13 4 1 3 23 - Gardening. . . . . . . . . . . 71 3 39 3 12 - 5 4 1 - 4 - Fishing. . . . . . . . . . . . 88 3 54 4 7 - 7 3 1 - 9 - Animal raising . . . . . . . . 102 - 75 1 11 - - 2 - 2 11 - Other. . . . . . . . . . . . . 70 2 49 1 1 - 4 - - 1 12 - Females, for home use . . 485 157 79 60 10 14 55 2 26 13 61 8 Gardening. . . . . . . . . . . 215 102 4 5 9 12 18 2 19 13 30 1 Fishing. . . . . . . . . . . . 58 15 24 2 3 1 9 - 2 - 1 1 Animal raising . . . . . . . . 409 139 69 51 10 9 34 - 22 12 55 8 Other. . . . . . . . . . . . . 374 132 72 55 3 - 40 - 9 3 52 8 Females, sold any . . . . 47 - 1 - 7 - 9 - - 2 27 1 Gardening. . . . . . . . . . . 8 - - - 5 - 1 - - - 1 1 Fishing. . . . . . . . . . . . 4 - - - 3 - - - - - - 1 Animal raising . . . . . . . . 37 - - - 7 - 7 - - 1 21 1 Other. . . . . . . . . . . . . 33 - 1 - 1 - 7 - - 1 22 1 Females, gave away. . . . 82 1 53 2 8 - 3 - - 2 13 - Gardening. . . . . . . . . . . 10 1 1 - 7 - - - - - 1 - Fishing. . . . . . . . . . . . 17 - 14 - 3 - - - - - - - Animal raising . . . . . . . . 60 - 44 1 7 - - - - 1 7 - Other. . . . . . . . . . . . . 63 - 47 1 1 - 3 - - 1 10 - ───────────────────────────────────────────────────────────────────────────────────────────────────── Source: 2000 FSM Census
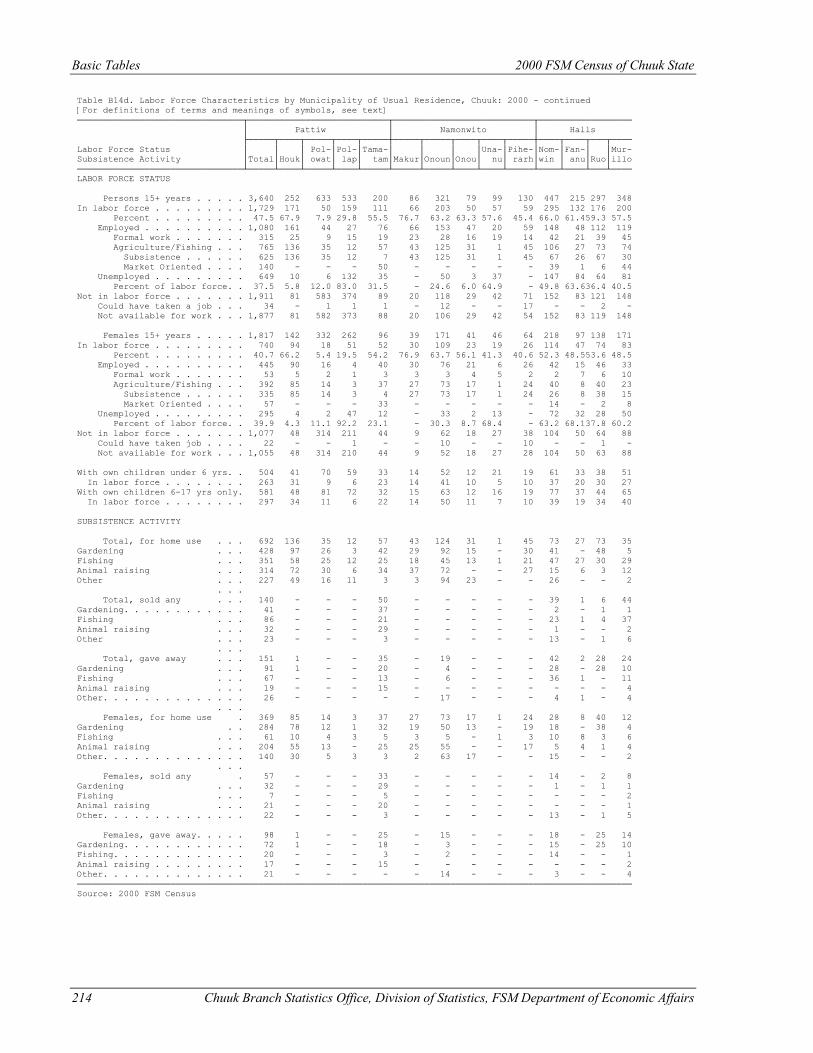
Basic Tables 2000 FSM Census of Chuuk State
214 Chuuk Branch Statistics Office, Division of Statistics, FSM Department of Economic Affairs
Table B14d. Labor Force Characteristics by Municipality of Usual Residence, Chuuk: 2000 - continued [For definitions of terms and meanings of symbols, see text] ────────────────────────────────┬───────────────────────────┬───────────────────────────┬────────────────── │ Pattiw │ Namonwito │ Halls ├─────┬────┬─────┬────┬─────┼─────┬─────┬────┬────┬─────┼────┬────┬───┬──── Labor Force Status │ │ │ Pol-│Pol-│Tama-│ │ │ │Una-│Pihe-│Nom-│Fan-│ │Mur- Subsistence Activity │Total│Houk│ owat│ lap│ tam│Makur│Onoun│Onou│ nu│ rarh│win │ anu│Ruo│illo ────────────────────────────────┴─────┴────┴─────┴────┴─────┴─────┴─────┴────┴────┴─────┴────┴────┴───┴──── LABOR FORCE STATUS Persons 15+ years . . . . . 3,640 252 633 533 200 86 321 79 99 130 447 215 297 348 In labor force . . . . . . . . . 1,729 171 50 159 111 66 203 50 57 59 295 132 176 200 Percent . . . . . . . . . 47.5 67.9 7.9 29.8 55.5 76.7 63.2 63.3 57.6 45.4 66.0 61.459.3 57.5 Employed . . . . . . . . . . 1,080 161 44 27 76 66 153 47 20 59 148 48 112 119 Formal work . . . . . . . 315 25 9 15 19 23 28 16 19 14 42 21 39 45 Agriculture/Fishing . . . 765 136 35 12 57 43 125 31 1 45 106 27 73 74 Subsistence . . . . . . 625 136 35 12 7 43 125 31 1 45 67 26 67 30 Market Oriented . . . . 140 - - - 50 - - - - - 39 1 6 44 Unemployed . . . . . . . . . 649 10 6 132 35 - 50 3 37 - 147 84 64 81 Percent of labor force. . 37.5 5.8 12.0 83.0 31.5 - 24.6 6.0 64.9 - 49.8 63.636.4 40.5 Not in labor force . . . . . . . 1,911 81 583 374 89 20 118 29 42 71 152 83 121 148 Could have taken a job . . . 34 - 1 1 1 - 12 - - 17 - - 2 - Not available for work . . . 1,877 81 582 373 88 20 106 29 42 54 152 83 119 148 Females 15+ years . . . . . 1,817 142 332 262 96 39 171 41 46 64 218 97 138 171 In labor force . . . . . . . . . 740 94 18 51 52 30 109 23 19 26 114 47 74 83 Percent . . . . . . . . . 40.7 66.2 5.4 19.5 54.2 76.9 63.7 56.1 41.3 40.6 52.3 48.553.6 48.5 Employed . . . . . . . . . . 445 90 16 4 40 30 76 21 6 26 42 15 46 33 Formal work . . . . . . . 53 5 2 1 3 3 3 4 5 2 2 7 6 10 Agriculture/Fishing . . . 392 85 14 3 37 27 73 17 1 24 40 8 40 23 Subsistence . . . . . . 335 85 14 3 4 27 73 17 1 24 26 8 38 15 Market Oriented . . . . 57 - - - 33 - - - - - 14 - 2 8 Unemployed . . . . . . . . . 295 4 2 47 12 - 33 2 13 - 72 32 28 50 Percent of labor force. . 39.9 4.3 11.1 92.2 23.1 - 30.3 8.7 68.4 - 63.2 68.137.8 60.2 Not in labor force . . . . . . . 1,077 48 314 211 44 9 62 18 27 38 104 50 64 88 Could have taken job . . . . 22 - - 1 - - 10 - - 10 - - 1 - Not available for work . . . 1,055 48 314 210 44 9 52 18 27 28 104 50 63 88 With own children under 6 yrs. . 504 41 70 59 33 14 52 12 21 19 61 33 38 51 In labor force . . . . . . . . 263 31 9 6 23 14 41 10 5 10 37 20 30 27 With own children 6-17 yrs only. 581 48 81 72 32 15 63 12 16 19 77 37 44 65 In labor force . . . . . . . . 297 34 11 6 22 14 50 11 7 10 39 19 34 40 SUBSISTENCE ACTIVITY Total, for home use . . . 692 136 35 12 57 43 124 31 1 45 73 27 73 35 Gardening . . . 428 97 26 3 42 29 92 15 - 30 41 - 48 5 Fishing . . . 351 58 25 12 25 18 45 13 1 21 47 27 30 29 Animal raising . . . 314 72 30 6 34 37 72 - - 27 15 6 3 12 Other . . . 227 49 16 11 3 3 94 23 - - 26 - - 2 . . . Total, sold any . . . 140 - - - 50 - - - - - 39 1 6 44 Gardening. . . . . . . . . . . . 41 - - - 37 - - - - - 2 - 1 1 Fishing . . . 86 - - - 21 - - - - - 23 1 4 37 Animal raising . . . 32 - - - 29 - - - - - 1 - - 2 Other . . . 23 - - - 3 - - - - - 13 - 1 6 . . . Total, gave away . . . 151 1 - - 35 - 19 - - - 42 2 28 24 Gardening . . . 91 1 - - 20 - 4 - - - 28 - 28 10 Fishing . . . 67 - - - 13 - 6 - - - 36 1 - 11 Animal raising . . . 19 - - - 15 - - - - - - - - 4 Other. . . . . . . . . . . . . . 26 - - - - - 17 - - - 4 1 - 4 . . . Females, for home use . 369 85 14 3 37 27 73 17 1 24 28 8 40 12 Gardening . . 284 78 12 1 32 19 50 13 - 19 18 - 38 4 Fishing . . . 61 10 4 3 5 3 5 - 1 3 10 8 3 6 Animal raising . . . 204 55 13 - 25 25 55 - - 17 5 4 1 4 Other. . . . . . . . . . . . . . 140 30 5 3 3 2 63 17 - - 15 - - 2 . . . Females, sold any . 57 - - - 33 - - - - - 14 - 2 8 Gardening . . . 32 - - - 29 - - - - - 1 - 1 1 Fishing . . . 7 - - - 5 - - - - - - - - 2 Animal raising . . . 21 - - - 20 - - - - - - - - 1 Other. . . . . . . . . . . . . . 22 - - - 3 - - - - - 13 - 1 5 Females, gave away. . . . . 98 1 - - 25 - 15 - - - 18 - 25 14 Gardening. . . . . . . . . . . . 72 1 - - 18 - 3 - - - 15 - 25 10 Fishing. . . . . . . . . . . . . 20 - - - 3 - 2 - - - 14 - - 1 Animal raising . . . . . . . . . 17 - - - 15 - - - - - - - - 2 Other. . . . . . . . . . . . . . 21 - - - - - 14 - - - 3 - - 4 ─────────────────────────────────────────────────────────────────────────────────────────────────────────── Source: 2000 FSM Census
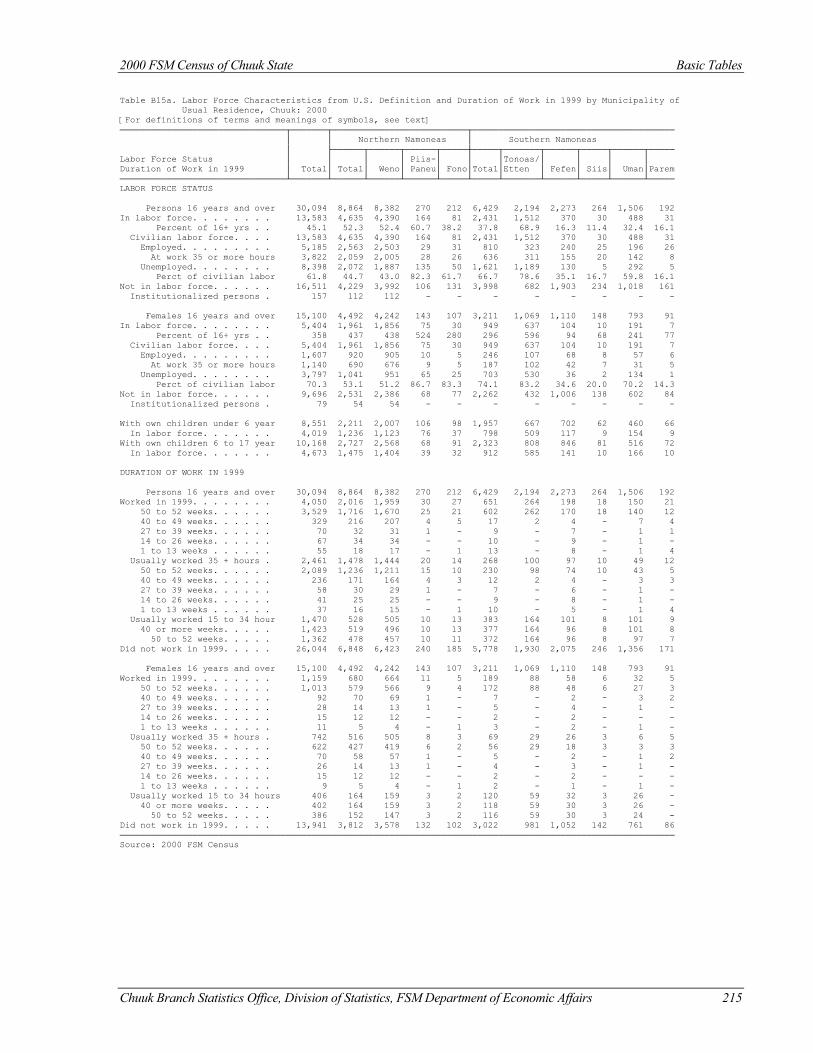
2000 FSM Census of Chuuk State Basic Tables
Chuuk Branch Statistics Office, Division of Statistics, FSM Department of Economic Affairs 215
Table B15a. Labor Force Characteristics from U.S. Definition and Duration of Work in 1999 by Municipality of Usual Residence, Chuuk: 2000 [For definitions of terms and meanings of symbols, see text] ────────────────────────────────┬───────┬──────────────────────────┬─────────────────────────────────────── │ │ Northern Namoneas │ Southern Namoneas │ ├──────┬──────┬──────┬─────┼─────┬───────┬──────┬─────┬──────┬───── Labor Force Status │ │ │ │ Piis-│ │ │Tonoas/│ │ │ │ Duration of Work in 1999 │ Total│ Total│ Weno│ Paneu│ Fono│Total│Etten │ Fefen│ Siis│ Uman│Parem ────────────────────────────────┴───────┴──────┴──────┴──────┴─────┴─────┴───────┴──────┴─────┴──────┴───── LABOR FORCE STATUS Persons 16 years and over 30,094 8,864 8,382 270 212 6,429 2,194 2,273 264 1,506 192 In labor force. . . . . . . . 13,583 4,635 4,390 164 81 2,431 1,512 370 30 488 31 Percent of 16+ yrs . . 45.1 52.3 52.4 60.7 38.2 37.8 68.9 16.3 11.4 32.4 16.1 Civilian labor force. . . . 13,583 4,635 4,390 164 81 2,431 1,512 370 30 488 31 Employed. . . . . . . . . 5,185 2,563 2,503 29 31 810 323 240 25 196 26 At work 35 or more hours 3,822 2,059 2,005 28 26 636 311 155 20 142 8 Unemployed. . . . . . . . 8,398 2,072 1,887 135 50 1,621 1,189 130 5 292 5 Perct of civilian labor 61.8 44.7 43.0 82.3 61.7 66.7 78.6 35.1 16.7 59.8 16.1 Not in labor force. . . . . . 16,511 4,229 3,992 106 131 3,998 682 1,903 234 1,018 161 Institutionalized persons . 157 112 112 - - - - - - - - Females 16 years and over 15,100 4,492 4,242 143 107 3,211 1,069 1,110 148 793 91 In labor force. . . . . . . . 5,404 1,961 1,856 75 30 949 637 104 10 191 7 Percent of 16+ yrs . . 358 437 438 524 280 296 596 94 68 241 77 Civilian labor force. . . . 5,404 1,961 1,856 75 30 949 637 104 10 191 7 Employed. . . . . . . . . 1,607 920 905 10 5 246 107 68 8 57 6 At work 35 or more hours 1,140 690 676 9 5 187 102 42 7 31 5 Unemployed. . . . . . . . 3,797 1,041 951 65 25 703 530 36 2 134 1 Perct of civilian labor 70.3 53.1 51.2 86.7 83.3 74.1 83.2 34.6 20.0 70.2 14.3 Not in labor force. . . . . . 9,696 2,531 2,386 68 77 2,262 432 1,006 138 602 84 Institutionalized persons . 79 54 54 - - - - - - - - With own children under 6 year 8,551 2,211 2,007 106 98 1,957 667 702 62 460 66 In labor force. . . . . . . 4,019 1,236 1,123 76 37 798 509 117 9 154 9 With own children 6 to 17 year 10,168 2,727 2,568 68 91 2,323 808 846 81 516 72 In labor force. . . . . . . 4,673 1,475 1,404 39 32 912 585 141 10 166 10 DURATION OF WORK IN 1999 Persons 16 years and over 30,094 8,864 8,382 270 212 6,429 2,194 2,273 264 1,506 192 Worked in 1999. . . . . . . . 4,050 2,016 1,959 30 27 651 264 198 18 150 21 50 to 52 weeks. . . . . . 3,529 1,716 1,670 25 21 602 262 170 18 140 12 40 to 49 weeks. . . . . . 329 216 207 4 5 17 2 4 - 7 4 27 to 39 weeks. . . . . . 70 32 31 1 - 9 - 7 - 1 1 14 to 26 weeks. . . . . . 67 34 34 - - 10 - 9 - 1 - 1 to 13 weeks . . . . . . 55 18 17 - 1 13 - 8 - 1 4 Usually worked 35 + hours . 2,461 1,478 1,444 20 14 268 100 97 10 49 12 50 to 52 weeks. . . . . . 2,089 1,236 1,211 15 10 230 98 74 10 43 5 40 to 49 weeks. . . . . . 236 171 164 4 3 12 2 4 - 3 3 27 to 39 weeks. . . . . . 58 30 29 1 - 7 - 6 - 1 - 14 to 26 weeks. . . . . . 41 25 25 - - 9 - 8 - 1 - 1 to 13 weeks . . . . . . 37 16 15 - 1 10 - 5 - 1 4 Usually worked 15 to 34 hour 1,470 528 505 10 13 383 164 101 8 101 9 40 or more weeks. . . . . 1,423 519 496 10 13 377 164 96 8 101 8 50 to 52 weeks. . . . . 1,362 478 457 10 11 372 164 96 8 97 7 Did not work in 1999. . . . . 26,044 6,848 6,423 240 185 5,778 1,930 2,075 246 1,356 171 Females 16 years and over 15,100 4,492 4,242 143 107 3,211 1,069 1,110 148 793 91 Worked in 1999. . . . . . . . 1,159 680 664 11 5 189 88 58 6 32 5 50 to 52 weeks. . . . . . 1,013 579 566 9 4 172 88 48 6 27 3 40 to 49 weeks. . . . . . 92 70 69 1 - 7 - 2 - 3 2 27 to 39 weeks. . . . . . 28 14 13 1 - 5 - 4 - 1 - 14 to 26 weeks. . . . . . 15 12 12 - - 2 - 2 - - - 1 to 13 weeks . . . . . . 11 5 4 - 1 3 - 2 - 1 - Usually worked 35 + hours . 742 516 505 8 3 69 29 26 3 6 5 50 to 52 weeks. . . . . . 622 427 419 6 2 56 29 18 3 3 3 40 to 49 weeks. . . . . . 70 58 57 1 - 5 - 2 - 1 2 27 to 39 weeks. . . . . . 26 14 13 1 - 4 - 3 - 1 - 14 to 26 weeks. . . . . . 15 12 12 - - 2 - 2 - - - 1 to 13 weeks . . . . . . 9 5 4 - 1 2 - 1 - 1 - Usually worked 15 to 34 hours 406 164 159 3 2 120 59 32 3 26 - 40 or more weeks. . . . . 402 164 159 3 2 118 59 30 3 26 - 50 to 52 weeks. . . . . 386 152 147 3 2 116 59 30 3 24 - Did not work in 1999. . . . . 13,941 3,812 3,578 132 102 3,022 981 1,052 142 761 86 ─────────────────────────────────────────────────────────────────────────────────────────────────────────── Source: 2000 FSM Census
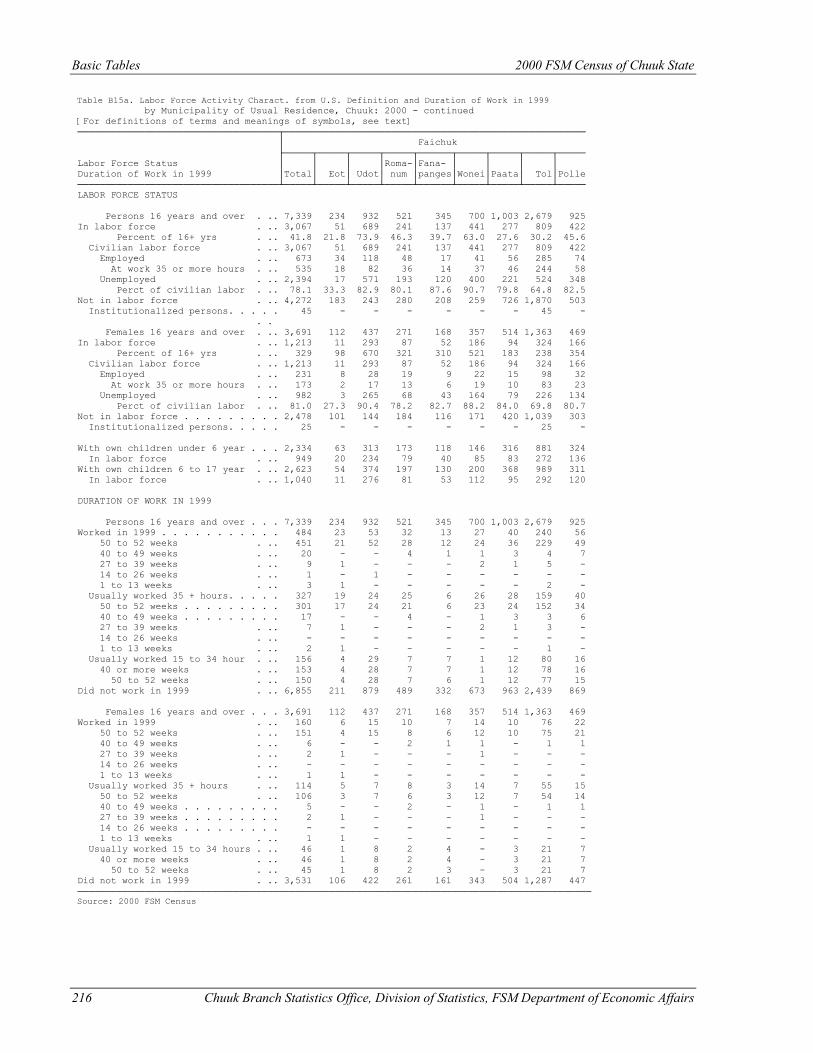
Basic Tables 2000 FSM Census of Chuuk State
216 Chuuk Branch Statistics Office, Division of Statistics, FSM Department of Economic Affairs
Table B15a. Labor Force Activity Charact. from U.S. Definition and Duration of Work in 1999 by Municipality of Usual Residence, Chuuk: 2000 - continued [For definitions of terms and meanings of symbols, see text] ────────────────────────────────────┬────────────────────────────────────────────────────── │ Faichuk ├─────┬─────┬─────┬─────┬──────┬─────┬─────┬─────┬───── Labor Force Status │ │ │ │Roma-│Fana- │ │ │ │ Duration of Work in 1999 │Total│ Eot│ Udot│ num │panges│Wonei│Paata│ Tol│Polle ────────────────────────────────────┴─────┴─────┴─────┴─────┴──────┴─────┴─────┴─────┴───── LABOR FORCE STATUS Persons 16 years and over . .. 7,339 234 932 521 345 700 1,003 2,679 925 In labor force . .. 3,067 51 689 241 137 441 277 809 422 Percent of 16+ yrs . .. 41.8 21.8 73.9 46.3 39.7 63.0 27.6 30.2 45.6 Civilian labor force . .. 3,067 51 689 241 137 441 277 809 422 Employed . .. 673 34 118 48 17 41 56 285 74 At work 35 or more hours . .. 535 18 82 36 14 37 46 244 58 Unemployed . .. 2,394 17 571 193 120 400 221 524 348 Perct of civilian labor . .. 78.1 33.3 82.9 80.1 87.6 90.7 79.8 64.8 82.5 Not in labor force . .. 4,272 183 243 280 208 259 726 1,870 503 Institutionalized persons. . . . . 45 - - - - - - 45 - . . Females 16 years and over . .. 3,691 112 437 271 168 357 514 1,363 469 In labor force . .. 1,213 11 293 87 52 186 94 324 166 Percent of 16+ yrs . .. 329 98 670 321 310 521 183 238 354 Civilian labor force . .. 1,213 11 293 87 52 186 94 324 166 Employed . .. 231 8 28 19 9 22 15 98 32 At work 35 or more hours . .. 173 2 17 13 6 19 10 83 23 Unemployed . .. 982 3 265 68 43 164 79 226 134 Perct of civilian labor . .. 81.0 27.3 90.4 78.2 82.7 88.2 84.0 69.8 80.7 Not in labor force . . . . . . . . . 2,478 101 144 184 116 171 420 1,039 303 Institutionalized persons. . . . . 25 - - - - - - 25 - With own children under 6 year . . . 2,334 63 313 173 118 146 316 881 324 In labor force . .. 949 20 234 79 40 85 83 272 136 With own children 6 to 17 year . .. 2,623 54 374 197 130 200 368 989 311 In labor force . .. 1,040 11 276 81 53 112 95 292 120 DURATION OF WORK IN 1999 Persons 16 years and over . . . 7,339 234 932 521 345 700 1,003 2,679 925 Worked in 1999 . . . . . . . . . . . 484 23 53 32 13 27 40 240 56 50 to 52 weeks . .. 451 21 52 28 12 24 36 229 49 40 to 49 weeks . .. 20 - - 4 1 1 3 4 7 27 to 39 weeks . .. 9 1 - - - 2 1 5 - 14 to 26 weeks . .. 1 - 1 - - - - - - 1 to 13 weeks . .. 3 1 - - - - - 2 - Usually worked 35 + hours. . . . . 327 19 24 25 6 26 28 159 40 50 to 52 weeks . . . . . . . . . 301 17 24 21 6 23 24 152 34 40 to 49 weeks . . . . . . . . . 17 - - 4 - 1 3 3 6 27 to 39 weeks . .. 7 1 - - - 2 1 3 - 14 to 26 weeks . .. - - - - - - - - - 1 to 13 weeks . .. 2 1 - - - - - 1 - Usually worked 15 to 34 hour . .. 156 4 29 7 7 1 12 80 16 40 or more weeks . .. 153 4 28 7 7 1 12 78 16 50 to 52 weeks . .. 150 4 28 7 6 1 12 77 15 Did not work in 1999 . .. 6,855 211 879 489 332 673 963 2,439 869 Females 16 years and over . . . 3,691 112 437 271 168 357 514 1,363 469 Worked in 1999 . .. 160 6 15 10 7 14 10 76 22 50 to 52 weeks . .. 151 4 15 8 6 12 10 75 21 40 to 49 weeks . .. 6 - - 2 1 1 - 1 1 27 to 39 weeks . .. 2 1 - - - 1 - - - 14 to 26 weeks . .. - - - - - - - - - 1 to 13 weeks . .. 1 1 - - - - - - - Usually worked 35 + hours . .. 114 5 7 8 3 14 7 55 15 50 to 52 weeks . .. 106 3 7 6 3 12 7 54 14 40 to 49 weeks . . . . . . . . . 5 - - 2 - 1 - 1 1 27 to 39 weeks . . . . . . . . . 2 1 - - - 1 - - - 14 to 26 weeks . . . . . . . . . - - - - - - - - - 1 to 13 weeks . .. 1 1 - - - - - - - Usually worked 15 to 34 hours . .. 46 1 8 2 4 - 3 21 7 40 or more weeks . .. 46 1 8 2 4 - 3 21 7 50 to 52 weeks . .. 45 1 8 2 3 - 3 21 7 Did not work in 1999 . .. 3,531 106 422 261 161 343 504 1,287 447 ──────────────────────────────────────────────────────────────────────────────────────────── Source: 2000 FSM Census
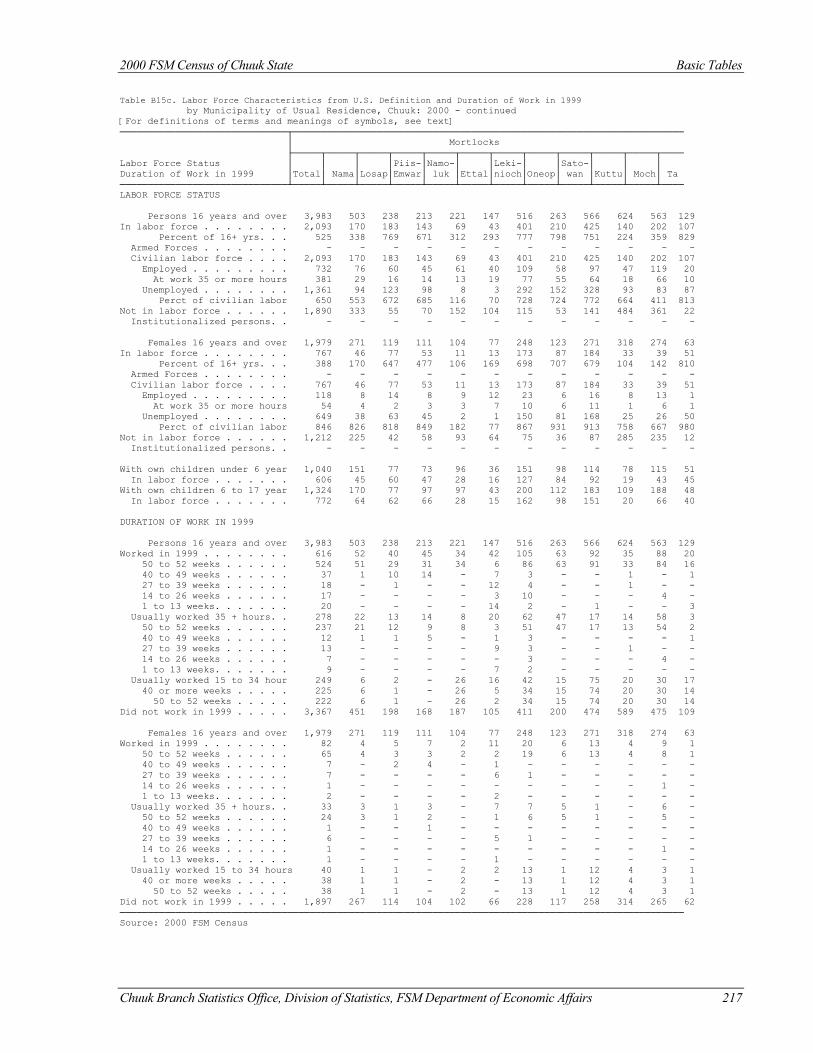
2000 FSM Census of Chuuk State Basic Tables
Chuuk Branch Statistics Office, Division of Statistics, FSM Department of Economic Affairs 217
Table B15c. Labor Force Characteristics from U.S. Definition and Duration of Work in 1999 by Municipality of Usual Residence, Chuuk: 2000 - continued [For definitions of terms and meanings of symbols, see text] ──────────────────────────────┬────────────────────────────────────────────────────────────────────── │ Mortlocks ├─────┬─────┬─────┬─────┬─────┬─────┬─────┬─────┬─────┬─────┬─────┬──── Labor Force Status │ │ │ │Piis-│Namo-│ │Leki-│ │Sato-│ │ │ Duration of Work in 1999 │Total│ Nama│Losap│Emwar│ luk │Ettal│nioch│Oneop│ wan │Kuttu│ Moch│ Ta ──────────────────────────────┴─────┴─────┴─────┴─────┴─────┴─────┴─────┴─────┴─────┴─────┴─────┴──── LABOR FORCE STATUS Persons 16 years and over 3,983 503 238 213 221 147 516 263 566 624 563 129 In labor force . . . . . . . . 2,093 170 183 143 69 43 401 210 425 140 202 107 Percent of 16+ yrs. . . 525 338 769 671 312 293 777 798 751 224 359 829 Armed Forces . . . . . . . . - - - - - - - - - - - - Civilian labor force . . . . 2,093 170 183 143 69 43 401 210 425 140 202 107 Employed . . . . . . . . . 732 76 60 45 61 40 109 58 97 47 119 20 At work 35 or more hours 381 29 16 14 13 19 77 55 64 18 66 10 Unemployed . . . . . . . . 1,361 94 123 98 8 3 292 152 328 93 83 87 Perct of civilian labor 650 553 672 685 116 70 728 724 772 664 411 813 Not in labor force . . . . . . 1,890 333 55 70 152 104 115 53 141 484 361 22 Institutionalized persons. . - - - - - - - - - - - - Females 16 years and over 1,979 271 119 111 104 77 248 123 271 318 274 63 In labor force . . . . . . . . 767 46 77 53 11 13 173 87 184 33 39 51 Percent of 16+ yrs. . . 388 170 647 477 106 169 698 707 679 104 142 810 Armed Forces . . . . . . . . - - - - - - - - - - - - Civilian labor force . . . . 767 46 77 53 11 13 173 87 184 33 39 51 Employed . . . . . . . . . 118 8 14 8 9 12 23 6 16 8 13 1 At work 35 or more hours 54 4 2 3 3 7 10 6 11 1 6 1 Unemployed . . . . . . . . 649 38 63 45 2 1 150 81 168 25 26 50 Perct of civilian labor 846 826 818 849 182 77 867 931 913 758 667 980 Not in labor force . . . . . . 1,212 225 42 58 93 64 75 36 87 285 235 12 Institutionalized persons. . - - - - - - - - - - - - With own children under 6 year 1,040 151 77 73 96 36 151 98 114 78 115 51 In labor force . . . . . . . 606 45 60 47 28 16 127 84 92 19 43 45 With own children 6 to 17 year 1,324 170 77 97 97 43 200 112 183 109 188 48 In labor force . . . . . . . 772 64 62 66 28 15 162 98 151 20 66 40 DURATION OF WORK IN 1999 Persons 16 years and over 3,983 503 238 213 221 147 516 263 566 624 563 129 Worked in 1999 . . . . . . . . 616 52 40 45 34 42 105 63 92 35 88 20 50 to 52 weeks . . . . . . 524 51 29 31 34 6 86 63 91 33 84 16 40 to 49 weeks . . . . . . 37 1 10 14 - 7 3 - - 1 - 1 27 to 39 weeks . . . . . . 18 - 1 - - 12 4 - - 1 - - 14 to 26 weeks . . . . . . 17 - - - - 3 10 - - - 4 - 1 to 13 weeks. . . . . . . 20 - - - - 14 2 - 1 - - 3 Usually worked 35 + hours. . 278 22 13 14 8 20 62 47 17 14 58 3 50 to 52 weeks . . . . . . 237 21 12 9 8 3 51 47 17 13 54 2 40 to 49 weeks . . . . . . 12 1 1 5 - 1 3 - - - - 1 27 to 39 weeks . . . . . . 13 - - - - 9 3 - - 1 - - 14 to 26 weeks . . . . . . 7 - - - - - 3 - - - 4 - 1 to 13 weeks. . . . . . . 9 - - - - 7 2 - - - - - Usually worked 15 to 34 hour 249 6 2 - 26 16 42 15 75 20 30 17 40 or more weeks . . . . . 225 6 1 - 26 5 34 15 74 20 30 14 50 to 52 weeks . . . . . 222 6 1 - 26 2 34 15 74 20 30 14 Did not work in 1999 . . . . . 3,367 451 198 168 187 105 411 200 474 589 475 109 Females 16 years and over 1,979 271 119 111 104 77 248 123 271 318 274 63 Worked in 1999 . . . . . . . . 82 4 5 7 2 11 20 6 13 4 9 1 50 to 52 weeks . . . . . . 65 4 3 3 2 2 19 6 13 4 8 1 40 to 49 weeks . . . . . . 7 - 2 4 - 1 - - - - - - 27 to 39 weeks . . . . . . 7 - - - - 6 1 - - - - - 14 to 26 weeks . . . . . . 1 - - - - - - - - - 1 - 1 to 13 weeks. . . . . . . 2 - - - - 2 - - - - - - Usually worked 35 + hours. . 33 3 1 3 - 7 7 5 1 - 6 - 50 to 52 weeks . . . . . . 24 3 1 2 - 1 6 5 1 - 5 - 40 to 49 weeks . . . . . . 1 - - 1 - - - - - - - - 27 to 39 weeks . . . . . . 6 - - - - 5 1 - - - - - 14 to 26 weeks . . . . . . 1 - - - - - - - - - 1 - 1 to 13 weeks. . . . . . . 1 - - - - 1 - - - - - - Usually worked 15 to 34 hours 40 1 1 - 2 2 13 1 12 4 3 1 40 or more weeks . . . . . 38 1 1 - 2 - 13 1 12 4 3 1 50 to 52 weeks . . . . . 38 1 1 - 2 - 13 1 12 4 3 1 Did not work in 1999 . . . . . 1,897 267 114 104 102 66 228 117 258 314 265 62 ───────────────────────────────────────────────────────────────────────────────────────────────────── Source: 2000 FSM Census
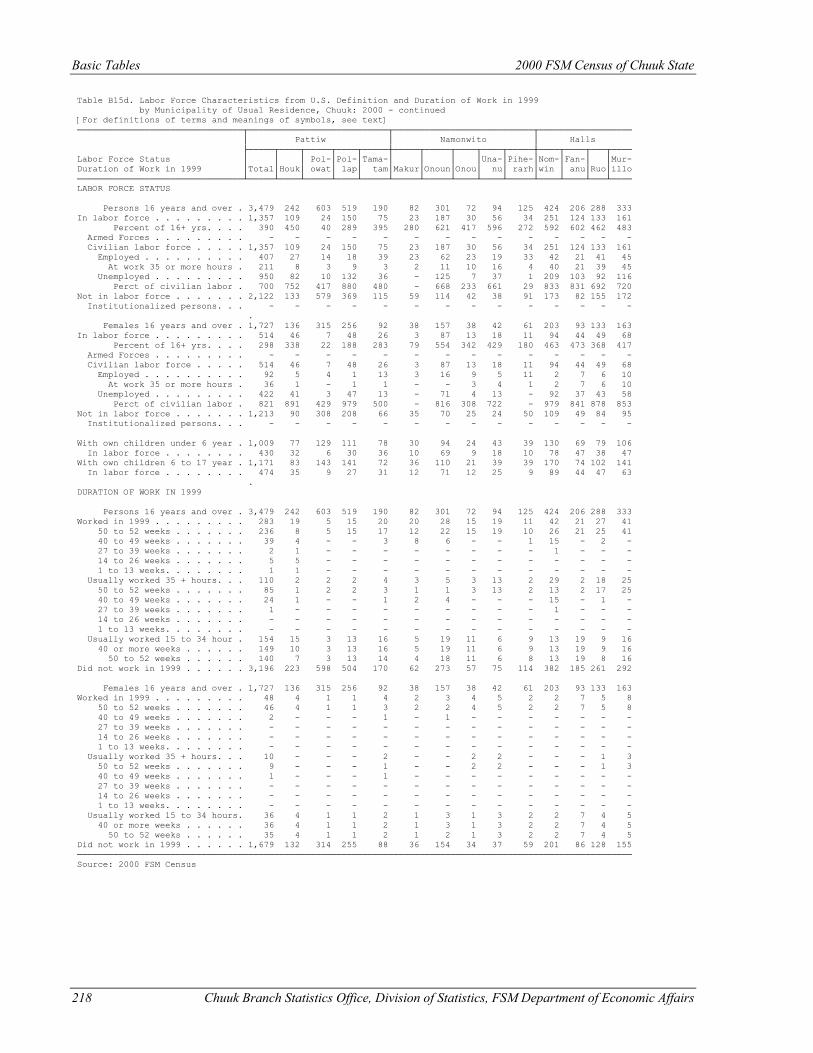
Basic Tables 2000 FSM Census of Chuuk State
218 Chuuk Branch Statistics Office, Division of Statistics, FSM Department of Economic Affairs
Table B15d. Labor Force Characteristics from U.S. Definition and Duration of Work in 1999 by Municipality of Usual Residence, Chuuk: 2000 - continued [For definitions of terms and meanings of symbols, see text] ────────────────────────────────┬───────────────────────────┬───────────────────────────┬────────────────── │ Pattiw │ Namonwito │ Halls ├─────┬────┬─────┬────┬─────┼─────┬─────┬────┬────┬─────┼────┬────┬───┬──── Labor Force Status │ │ │ Pol-│Pol-│Tama-│ │ │ │Una-│Pihe-│Nom-│Fan-│ │Mur- Duration of Work in 1999 │Total│Houk│ owat│ lap│ tam│Makur│Onoun│Onou│ nu│ rarh│win │ anu│Ruo│illo ────────────────────────────────┴─────┴────┴─────┴────┴─────┴─────┴─────┴────┴────┴─────┴────┴────┴───┴──── LABOR FORCE STATUS Persons 16 years and over . 3,479 242 603 519 190 82 301 72 94 125 424 206 288 333 In labor force . . . . . . . . . 1,357 109 24 150 75 23 187 30 56 34 251 124 133 161 Percent of 16+ yrs. . . . 390 450 40 289 395 280 621 417 596 272 592 602 462 483 Armed Forces . . . . . . . . . - - - - - - - - - - - - - - Civilian labor force . . . . . 1,357 109 24 150 75 23 187 30 56 34 251 124 133 161 Employed . . . . . . . . . . 407 27 14 18 39 23 62 23 19 33 42 21 41 45 At work 35 or more hours . 211 8 3 9 3 2 11 10 16 4 40 21 39 45 Unemployed . . . . . . . . . 950 82 10 132 36 - 125 7 37 1 209 103 92 116 Perct of civilian labor . 700 752 417 880 480 - 668 233 661 29 833 831 692 720 Not in labor force . . . . . . . 2,122 133 579 369 115 59 114 42 38 91 173 82 155 172 Institutionalized persons. . . - - - - - - - - - - - - - - . Females 16 years and over . 1,727 136 315 256 92 38 157 38 42 61 203 93 133 163 In labor force . . . . . . . . . 514 46 7 48 26 3 87 13 18 11 94 44 49 68 Percent of 16+ yrs. . . . 298 338 22 188 283 79 554 342 429 180 463 473 368 417 Armed Forces . . . . . . . . . - - - - - - - - - - - - - - Civilian labor force . . . . . 514 46 7 48 26 3 87 13 18 11 94 44 49 68 Employed . . . . . . . . . . 92 5 4 1 13 3 16 9 5 11 2 7 6 10 At work 35 or more hours . 36 1 - 1 1 - - 3 4 1 2 7 6 10 Unemployed . . . . . . . . . 422 41 3 47 13 - 71 4 13 - 92 37 43 58 Perct of civilian labor . 821 891 429 979 500 - 816 308 722 - 979 841 878 853 Not in labor force . . . . . . . 1,213 90 308 208 66 35 70 25 24 50 109 49 84 95 Institutionalized persons. . . - - - - - - - - - - - - - - With own children under 6 year . 1,009 77 129 111 78 30 94 24 43 39 130 69 79 106 In labor force . . . . . . . . 430 32 6 30 36 10 69 9 18 10 78 47 38 47 With own children 6 to 17 year . 1,171 83 143 141 72 36 110 21 39 39 170 74 102 141 In labor force . . . . . . . . 474 35 9 27 31 12 71 12 25 9 89 44 47 63 . DURATION OF WORK IN 1999 Persons 16 years and over . 3,479 242 603 519 190 82 301 72 94 125 424 206 288 333 Worked in 1999 . . . . . . . . . 283 19 5 15 20 20 28 15 19 11 42 21 27 41 50 to 52 weeks . . . . . . . 236 8 5 15 17 12 22 15 19 10 26 21 25 41 40 to 49 weeks . . . . . . . 39 4 - - 3 8 6 - - 1 15 - 2 - 27 to 39 weeks . . . . . . . 2 1 - - - - - - - - 1 - - - 14 to 26 weeks . . . . . . . 5 5 - - - - - - - - - - - - 1 to 13 weeks. . . . . . . . 1 1 - - - - - - - - - - - - Usually worked 35 + hours. . . 110 2 2 2 4 3 5 3 13 2 29 2 18 25 50 to 52 weeks . . . . . . . 85 1 2 2 3 1 1 3 13 2 13 2 17 25 40 to 49 weeks . . . . . . . 24 1 - - 1 2 4 - - - 15 - 1 - 27 to 39 weeks . . . . . . . 1 - - - - - - - - - 1 - - - 14 to 26 weeks . . . . . . . - - - - - - - - - - - - - - 1 to 13 weeks. . . . . . . . - - - - - - - - - - - - - - Usually worked 15 to 34 hour . 154 15 3 13 16 5 19 11 6 9 13 19 9 16 40 or more weeks . . . . . . 149 10 3 13 16 5 19 11 6 9 13 19 9 16 50 to 52 weeks . . . . . . 140 7 3 13 14 4 18 11 6 8 13 19 8 16 Did not work in 1999 . . . . . . 3,196 223 598 504 170 62 273 57 75 114 382 185 261 292 Females 16 years and over . 1,727 136 315 256 92 38 157 38 42 61 203 93 133 163 Worked in 1999 . . . . . . . . . 48 4 1 1 4 2 3 4 5 2 2 7 5 8 50 to 52 weeks . . . . . . . 46 4 1 1 3 2 2 4 5 2 2 7 5 8 40 to 49 weeks . . . . . . . 2 - - - 1 - 1 - - - - - - - 27 to 39 weeks . . . . . . . - - - - - - - - - - - - - - 14 to 26 weeks . . . . . . . - - - - - - - - - - - - - - 1 to 13 weeks. . . . . . . . - - - - - - - - - - - - - - Usually worked 35 + hours. . . 10 - - - 2 - - 2 2 - - - 1 3 50 to 52 weeks . . . . . . . 9 - - - 1 - - 2 2 - - - 1 3 40 to 49 weeks . . . . . . . 1 - - - 1 - - - - - - - - - 27 to 39 weeks . . . . . . . - - - - - - - - - - - - - - 14 to 26 weeks . . . . . . . - - - - - - - - - - - - - - 1 to 13 weeks. . . . . . . . - - - - - - - - - - - - - - Usually worked 15 to 34 hours. 36 4 1 1 2 1 3 1 3 2 2 7 4 5 40 or more weeks . . . . . . 36 4 1 1 2 1 3 1 3 2 2 7 4 5 50 to 52 weeks . . . . . . 35 4 1 1 2 1 2 1 3 2 2 7 4 5 Did not work in 1999 . . . . . . 1,679 132 314 255 88 36 154 34 37 59 201 86 128 155 ─────────────────────────────────────────────────────────────────────────────────────────────────────────── Source: 2000 FSM Census
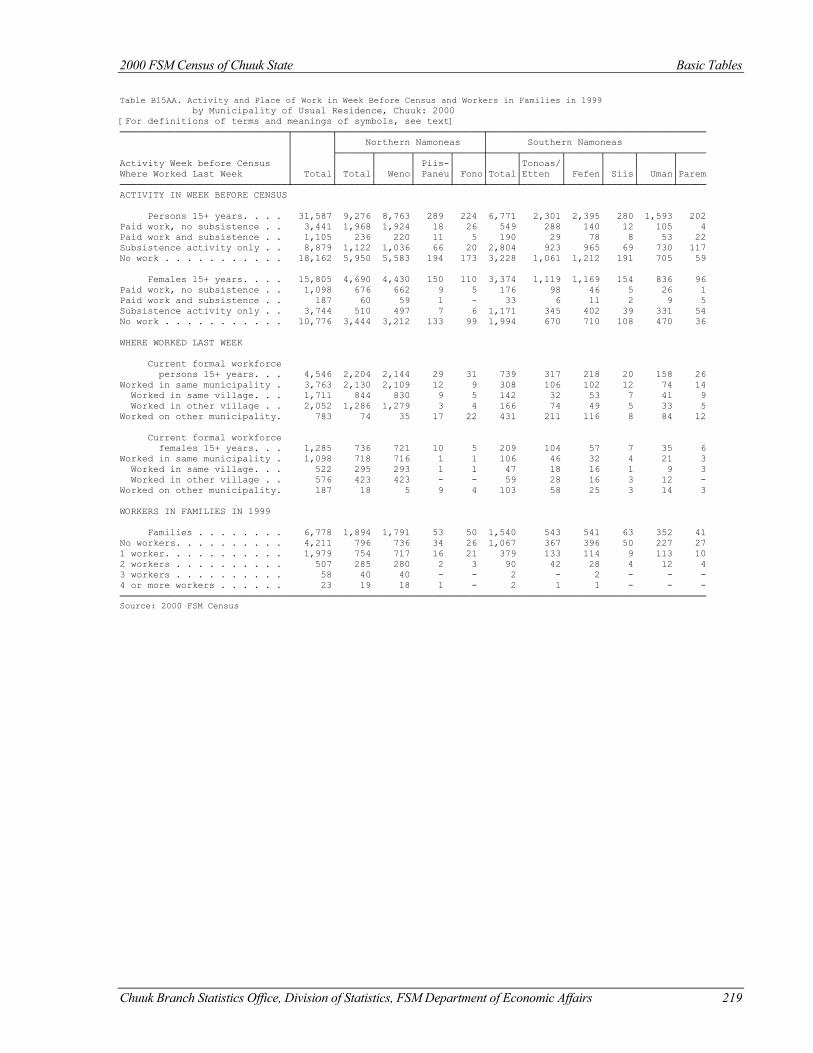
2000 FSM Census of Chuuk State Basic Tables
Chuuk Branch Statistics Office, Division of Statistics, FSM Department of Economic Affairs 219
Table B15AA. Activity and Place of Work in Week Before Census and Workers in Families in 1999 by Municipality of Usual Residence, Chuuk: 2000 [For definitions of terms and meanings of symbols, see text] ──────────────────────────────┬───────┬──────────────────────────┬─────────────────────────────────────── │ │ Northern Namoneas │ Southern Namoneas │ ├──────┬──────┬──────┬─────┼─────┬───────┬──────┬─────┬──────┬───── Activity Week before Census │ │ │ │ Piis-│ │ │Tonoas/│ │ │ │ Where Worked Last Week │ Total│ Total│ Weno│ Paneu│ Fono│Total│Etten │ Fefen│ Siis│ Uman│Parem ──────────────────────────────┴───────┴──────┴──────┴──────┴─────┴─────┴───────┴──────┴─────┴──────┴───── ACTIVITY IN WEEK BEFORE CENSUS Persons 15+ years. . . . 31,587 9,276 8,763 289 224 6,771 2,301 2,395 280 1,593 202 Paid work, no subsistence . . 3,441 1,968 1,924 18 26 549 288 140 12 105 4 Paid work and subsistence . . 1,105 236 220 11 5 190 29 78 8 53 22 Subsistence activity only . . 8,879 1,122 1,036 66 20 2,804 923 965 69 730 117 No work . . . . . . . . . . . 18,162 5,950 5,583 194 173 3,228 1,061 1,212 191 705 59 Females 15+ years. . . . 15,805 4,690 4,430 150 110 3,374 1,119 1,169 154 836 96 Paid work, no subsistence . . 1,098 676 662 9 5 176 98 46 5 26 1 Paid work and subsistence . . 187 60 59 1 - 33 6 11 2 9 5 Subsistence activity only . . 3,744 510 497 7 6 1,171 345 402 39 331 54 No work . . . . . . . . . . . 10,776 3,444 3,212 133 99 1,994 670 710 108 470 36 WHERE WORKED LAST WEEK Current formal workforce persons 15+ years. . . 4,546 2,204 2,144 29 31 739 317 218 20 158 26 Worked in same municipality . 3,763 2,130 2,109 12 9 308 106 102 12 74 14 Worked in same village. . . 1,711 844 830 9 5 142 32 53 7 41 9 Worked in other village . . 2,052 1,286 1,279 3 4 166 74 49 5 33 5 Worked on other municipality. 783 74 35 17 22 431 211 116 8 84 12 Current formal workforce females 15+ years. . . 1,285 736 721 10 5 209 104 57 7 35 6 Worked in same municipality . 1,098 718 716 1 1 106 46 32 4 21 3 Worked in same village. . . 522 295 293 1 1 47 18 16 1 9 3 Worked in other village . . 576 423 423 - - 59 28 16 3 12 - Worked on other municipality. 187 18 5 9 4 103 58 25 3 14 3 WORKERS IN FAMILIES IN 1999 Families . . . . . . . . 6,778 1,894 1,791 53 50 1,540 543 541 63 352 41 No workers. . . . . . . . . . 4,211 796 736 34 26 1,067 367 396 50 227 27 1 worker. . . . . . . . . . . 1,979 754 717 16 21 379 133 114 9 113 10 2 workers . . . . . . . . . . 507 285 280 2 3 90 42 28 4 12 4 3 workers . . . . . . . . . . 58 40 40 - - 2 - 2 - - - 4 or more workers . . . . . . 23 19 18 1 - 2 1 1 - - - ───────────────────────────────────────────────────────────────────────────────────────────────────────── Source: 2000 FSM Census
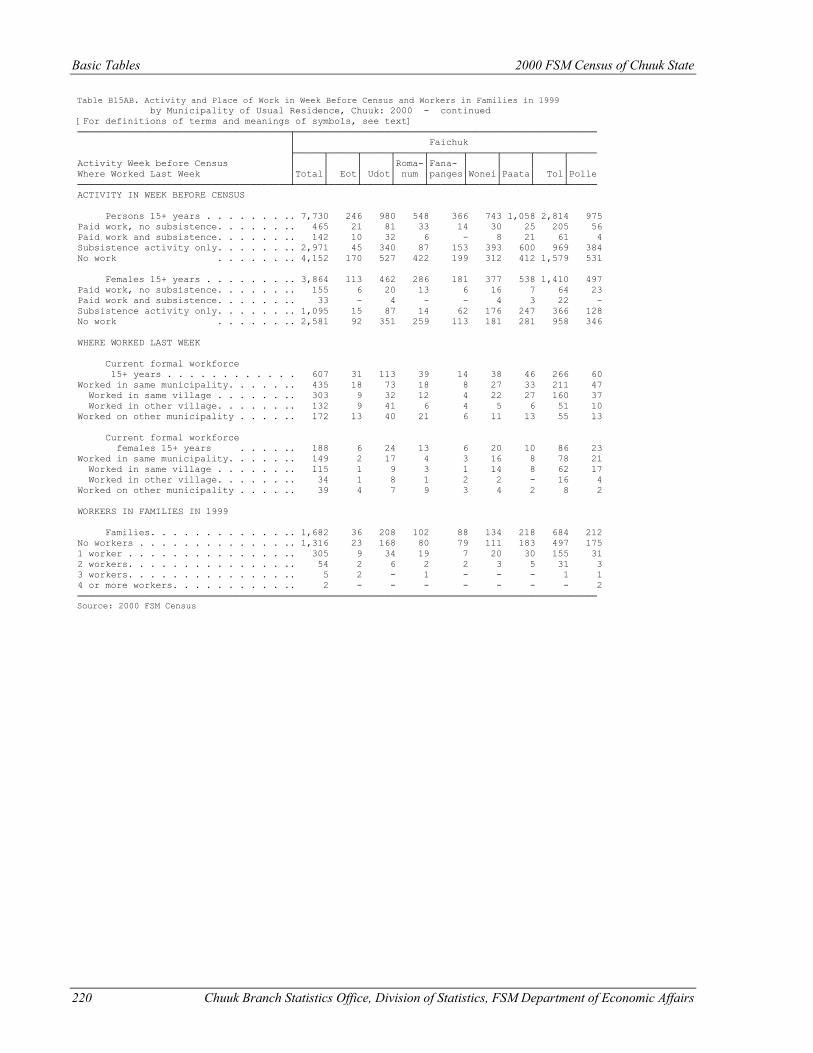
Basic Tables 2000 FSM Census of Chuuk State
220 Chuuk Branch Statistics Office, Division of Statistics, FSM Department of Economic Affairs
Table B15AB. Activity and Place of Work in Week Before Census and Workers in Families in 1999 by Municipality of Usual Residence, Chuuk: 2000 - continued [For definitions of terms and meanings of symbols, see text] ──────────────────────────────────────┬────────────────────────────────────────────────────── │ Faichuk ├─────┬─────┬─────┬─────┬──────┬─────┬─────┬─────┬───── Activity Week before Census │ │ │ │Roma-│Fana- │ │ │ │ Where Worked Last Week │Total│ Eot│ Udot│ num │panges│Wonei│Paata│ Tol│Polle ──────────────────────────────────────┴─────┴─────┴─────┴─────┴──────┴─────┴─────┴─────┴───── ACTIVITY IN WEEK BEFORE CENSUS Persons 15+ years . . . . . . . .. 7,730 246 980 548 366 743 1,058 2,814 975 Paid work, no subsistence. . . . . . .. 465 21 81 33 14 30 25 205 56 Paid work and subsistence. . . . . . .. 142 10 32 6 - 8 21 61 4 Subsistence activity only. . . . . . .. 2,971 45 340 87 153 393 600 969 384 No work . . . . . . .. 4,152 170 527 422 199 312 412 1,579 531 Females 15+ years . . . . . . . .. 3,864 113 462 286 181 377 538 1,410 497 Paid work, no subsistence. . . . . . .. 155 6 20 13 6 16 7 64 23 Paid work and subsistence. . . . . . .. 33 - 4 - - 4 3 22 - Subsistence activity only. . . . . . .. 1,095 15 87 14 62 176 247 366 128 No work . . . . . . .. 2,581 92 351 259 113 181 281 958 346 WHERE WORKED LAST WEEK Current formal workforce 15+ years . . . . . . . . . . . . 607 31 113 39 14 38 46 266 60 Worked in same municipality. . . . . .. 435 18 73 18 8 27 33 211 47 Worked in same village . . . . . . .. 303 9 32 12 4 22 27 160 37 Worked in other village. . . . . . .. 132 9 41 6 4 5 6 51 10 Worked on other municipality . . . . .. 172 13 40 21 6 11 13 55 13 Current formal workforce females 15+ years . . . . .. 188 6 24 13 6 20 10 86 23 Worked in same municipality. . . . . .. 149 2 17 4 3 16 8 78 21 Worked in same village . . . . . . .. 115 1 9 3 1 14 8 62 17 Worked in other village. . . . . . .. 34 1 8 1 2 2 - 16 4 Worked on other municipality . . . . .. 39 4 7 9 3 4 2 8 2 WORKERS IN FAMILIES IN 1999 Families. . . . . . . . . . . . .. 1,682 36 208 102 88 134 218 684 212 No workers . . . . . . . . . . . . . .. 1,316 23 168 80 79 111 183 497 175 1 worker . . . . . . . . . . . . . . .. 305 9 34 19 7 20 30 155 31 2 workers. . . . . . . . . . . . . . .. 54 2 6 2 2 3 5 31 3 3 workers. . . . . . . . . . . . . . .. 5 2 - 1 - - - 1 1 4 or more workers. . . . . . . . . . .. 2 - - - - - - - 2 ───────────────────────────────────────────────────────────────────────────────────────────── Source: 2000 FSM Census
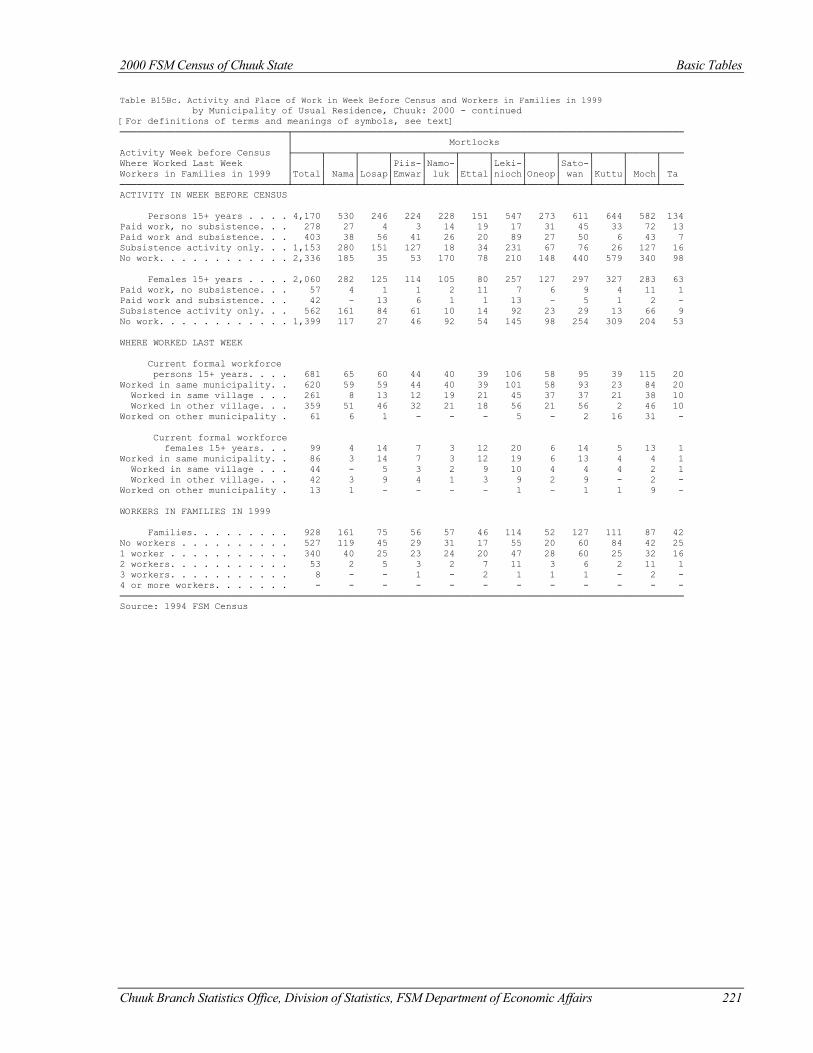
2000 FSM Census of Chuuk State Basic Tables
Chuuk Branch Statistics Office, Division of Statistics, FSM Department of Economic Affairs 221
Table B15Bc. Activity and Place of Work in Week Before Census and Workers in Families in 1999 by Municipality of Usual Residence, Chuuk: 2000 - continued [For definitions of terms and meanings of symbols, see text] ──────────────────────────────┬────────────────────────────────────────────────────────────────────── │ Mortlocks Activity Week before Census ├─────┬─────┬─────┬─────┬─────┬─────┬─────┬─────┬─────┬─────┬─────┬──── Where Worked Last Week │ │ │ │Piis-│Namo-│ │Leki-│ │Sato-│ │ │ Workers in Families in 1999 │Total│ Nama│Losap│Emwar│ luk │Ettal│nioch│Oneop│ wan │Kuttu│ Moch│ Ta ──────────────────────────────┴─────┴─────┴─────┴─────┴─────┴─────┴─────┴─────┴─────┴─────┴─────┴──── ACTIVITY IN WEEK BEFORE CENSUS Persons 15+ years . . . . 4,170 530 246 224 228 151 547 273 611 644 582 134 Paid work, no subsistence. . . 278 27 4 3 14 19 17 31 45 33 72 13 Paid work and subsistence. . . 403 38 56 41 26 20 89 27 50 6 43 7 Subsistence activity only. . . 1,153 280 151 127 18 34 231 67 76 26 127 16 No work. . . . . . . . . . . . 2,336 185 35 53 170 78 210 148 440 579 340 98 Females 15+ years . . . . 2,060 282 125 114 105 80 257 127 297 327 283 63 Paid work, no subsistence. . . 57 4 1 1 2 11 7 6 9 4 11 1 Paid work and subsistence. . . 42 - 13 6 1 1 13 - 5 1 2 - Subsistence activity only. . . 562 161 84 61 10 14 92 23 29 13 66 9 No work. . . . . . . . . . . . 1,399 117 27 46 92 54 145 98 254 309 204 53 WHERE WORKED LAST WEEK Current formal workforce persons 15+ years. . . . 681 65 60 44 40 39 106 58 95 39 115 20 Worked in same municipality. . 620 59 59 44 40 39 101 58 93 23 84 20 Worked in same village . . . 261 8 13 12 19 21 45 37 37 21 38 10 Worked in other village. . . 359 51 46 32 21 18 56 21 56 2 46 10 Worked on other municipality . 61 6 1 - - - 5 - 2 16 31 - Current formal workforce females 15+ years. . . 99 4 14 7 3 12 20 6 14 5 13 1 Worked in same municipality. . 86 3 14 7 3 12 19 6 13 4 4 1 Worked in same village . . . 44 - 5 3 2 9 10 4 4 4 2 1 Worked in other village. . . 42 3 9 4 1 3 9 2 9 - 2 - Worked on other municipality . 13 1 - - - - 1 - 1 1 9 - WORKERS IN FAMILIES IN 1999 Families. . . . . . . . . 928 161 75 56 57 46 114 52 127 111 87 42 No workers . . . . . . . . . . 527 119 45 29 31 17 55 20 60 84 42 25 1 worker . . . . . . . . . . . 340 40 25 23 24 20 47 28 60 25 32 16 2 workers. . . . . . . . . . . 53 2 5 3 2 7 11 3 6 2 11 1 3 workers. . . . . . . . . . . 8 - - 1 - 2 1 1 1 - 2 - 4 or more workers. . . . . . . - - - - - - - - - - - - ───────────────────────────────────────────────────────────────────────────────────────────────────── Source: 1994 FSM Census
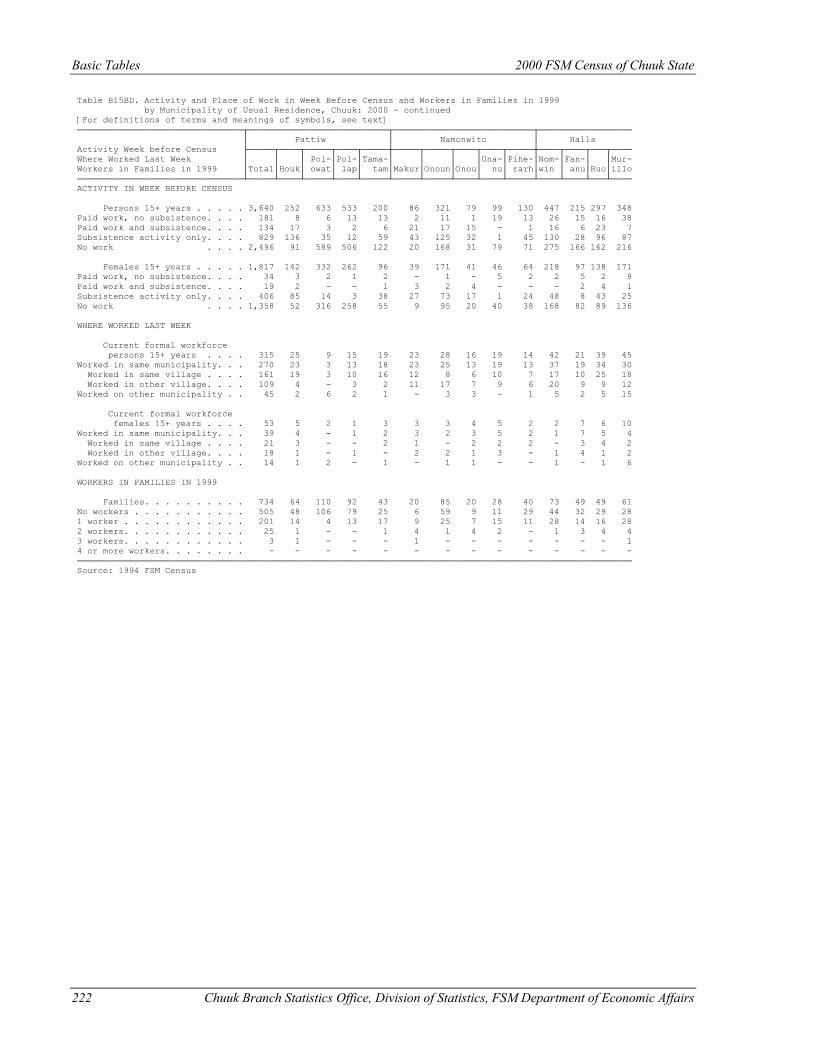
Basic Tables 2000 FSM Census of Chuuk State
222 Chuuk Branch Statistics Office, Division of Statistics, FSM Department of Economic Affairs
Table B15BD. Activity and Place of Work in Week Before Census and Workers in Families in 1999 by Municipality of Usual Residence, Chuuk: 2000 - continued [For definitions of terms and meanings of symbols, see text] ────────────────────────────────┬───────────────────────────┬───────────────────────────┬────────────────── │ Pattiw │ Namonwito │ Halls Activity Week before Census ├─────┬────┬─────┬────┬─────┼─────┬─────┬────┬────┬─────┼────┬────┬───┬──── Where Worked Last Week │ │ │ Pol-│Pol-│Tama-│ │ │ │Una-│Pihe-│Nom-│Fan-│ │Mur- Workers in Families in 1999 │Total│Houk│ owat│ lap│ tam│Makur│Onoun│Onou│ nu│ rarh│win │ anu│Ruo│illo ────────────────────────────────┴─────┴────┴─────┴────┴─────┴─────┴─────┴────┴────┴─────┴────┴────┴───┴──── ACTIVITY IN WEEK BEFORE CENSUS Persons 15+ years . . . . . 3,640 252 633 533 200 86 321 79 99 130 447 215 297 348 Paid work, no subsistence. . . . 181 8 6 13 13 2 11 1 19 13 26 15 16 38 Paid work and subsistence. . . . 134 17 3 2 6 21 17 15 - 1 16 6 23 7 Subsistence activity only. . . . 829 136 35 12 59 43 125 32 1 45 130 28 96 87 No work . . . . 2,496 91 589 506 122 20 168 31 79 71 275 166 162 216 Females 15+ years . . . . . 1,817 142 332 262 96 39 171 41 46 64 218 97 138 171 Paid work, no subsistence. . . . 34 3 2 1 2 - 1 - 5 2 2 5 2 9 Paid work and subsistence. . . . 19 2 - - 1 3 2 4 - - - 2 4 1 Subsistence activity only. . . . 406 85 14 3 38 27 73 17 1 24 48 8 43 25 No work . . . . 1,358 52 316 258 55 9 95 20 40 38 168 82 89 136 WHERE WORKED LAST WEEK Current formal workforce persons 15+ years . . . . 315 25 9 15 19 23 28 16 19 14 42 21 39 45 Worked in same municipality. . . 270 23 3 13 18 23 25 13 19 13 37 19 34 30 Worked in same village . . . . 161 19 3 10 16 12 8 6 10 7 17 10 25 18 Worked in other village. . . . 109 4 - 3 2 11 17 7 9 6 20 9 9 12 Worked on other municipality . . 45 2 6 2 1 - 3 3 - 1 5 2 5 15 Current formal workforce females 15+ years . . . . 53 5 2 1 3 3 3 4 5 2 2 7 6 10 Worked in same municipality. . . 39 4 - 1 2 3 2 3 5 2 1 7 5 4 Worked in same village . . . . 21 3 - - 2 1 - 2 2 2 - 3 4 2 Worked in other village. . . . 18 1 - 1 - 2 2 1 3 - 1 4 1 2 Worked on other municipality . . 14 1 2 - 1 - 1 1 - - 1 - 1 6 WORKERS IN FAMILIES IN 1999 Families. . . . . . . . . . 734 64 110 92 43 20 85 20 28 40 73 49 49 61 No workers . . . . . . . . . . . 505 48 106 79 25 6 59 9 11 29 44 32 29 28 1 worker . . . . . . . . . . . . 201 14 4 13 17 9 25 7 15 11 28 14 16 28 2 workers. . . . . . . . . . . . 25 1 - - 1 4 1 4 2 - 1 3 4 4 3 workers. . . . . . . . . . . . 3 1 - - - 1 - - - - - - - 1 4 or more workers. . . . . . . . - - - - - - - - - - - - - - ─────────────────────────────────────────────────────────────────────────────────────────────────────────── Source: 1994 FSM Census
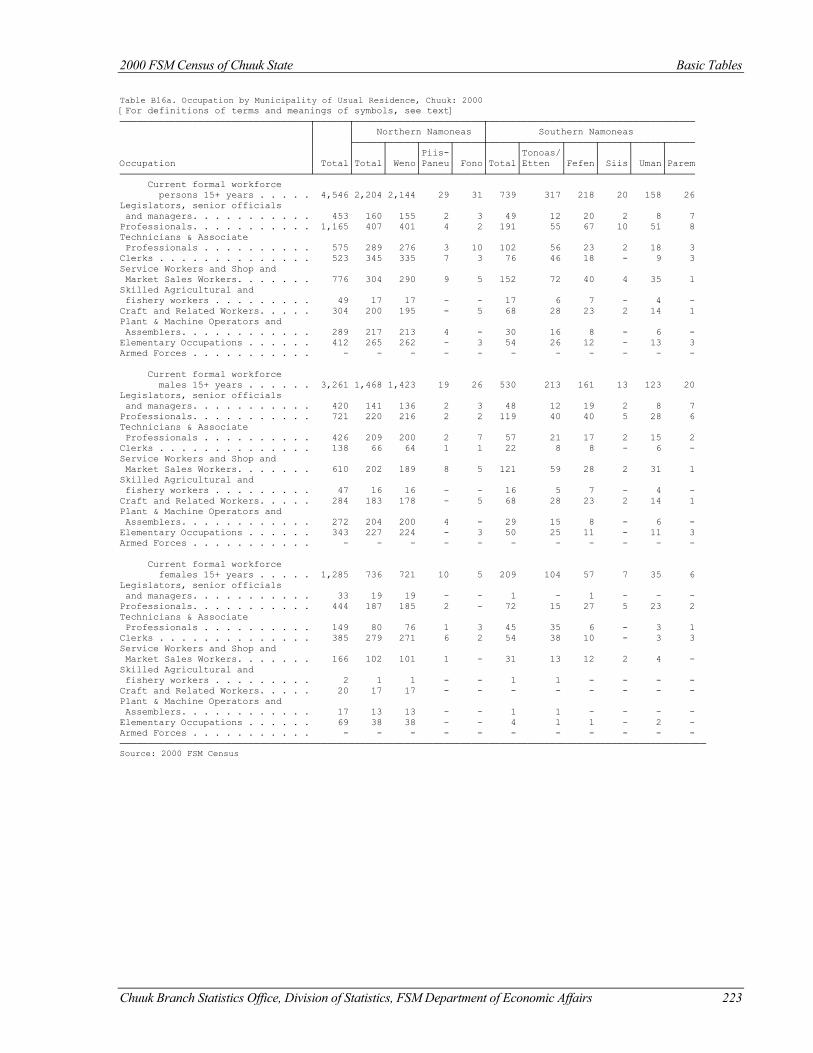
2000 FSM Census of Chuuk State Basic Tables
Chuuk Branch Statistics Office, Division of Statistics, FSM Department of Economic Affairs 223
Table B16a. Occupation by Municipality of Usual Residence, Chuuk: 2000 [For definitions of terms and meanings of symbols, see text] ──────────────────────────────────┬──────┬───────────────────────┬───────────────────────────────────── │ │ Northern Namoneas │ Southern Namoneas │ ├─────┬─────┬─────┬─────┼─────┬───────┬─────┬─────┬─────┬───── │ │ │ │Piis-│ │ │Tonoas/│ │ │ │ Occupation │ Total│Total│ Weno│Paneu│ Fono│Total│Etten │Fefen│ Siis│ Uman│Parem ──────────────────────────────────┴──────┴─────┴─────┴─────┴─────┴─────┴───────┴─────┴─────┴─────┴───── Current formal workforce persons 15+ years . . . . . 4,546 2,204 2,144 29 31 739 317 218 20 158 26 Legislators, senior officials and managers. . . . . . . . . . . 453 160 155 2 3 49 12 20 2 8 7 Professionals. . . . . . . . . . . 1,165 407 401 4 2 191 55 67 10 51 8 Technicians & Associate Professionals . . . . . . . . . . 575 289 276 3 10 102 56 23 2 18 3 Clerks . . . . . . . . . . . . . . 523 345 335 7 3 76 46 18 - 9 3 Service Workers and Shop and Market Sales Workers. . . . . . . 776 304 290 9 5 152 72 40 4 35 1 Skilled Agricultural and fishery workers . . . . . . . . . 49 17 17 - - 17 6 7 - 4 - Craft and Related Workers. . . . . 304 200 195 - 5 68 28 23 2 14 1 Plant & Machine Operators and Assemblers. . . . . . . . . . . . 289 217 213 4 - 30 16 8 - 6 - Elementary Occupations . . . . . . 412 265 262 - 3 54 26 12 - 13 3 Armed Forces . . . . . . . . . . . - - - - - - - - - - - Current formal workforce males 15+ years . . . . . . 3,261 1,468 1,423 19 26 530 213 161 13 123 20 Legislators, senior officials and managers. . . . . . . . . . . 420 141 136 2 3 48 12 19 2 8 7 Professionals. . . . . . . . . . . 721 220 216 2 2 119 40 40 5 28 6 Technicians & Associate Professionals . . . . . . . . . . 426 209 200 2 7 57 21 17 2 15 2 Clerks . . . . . . . . . . . . . . 138 66 64 1 1 22 8 8 - 6 - Service Workers and Shop and Market Sales Workers. . . . . . . 610 202 189 8 5 121 59 28 2 31 1 Skilled Agricultural and fishery workers . . . . . . . . . 47 16 16 - - 16 5 7 - 4 - Craft and Related Workers. . . . . 284 183 178 - 5 68 28 23 2 14 1 Plant & Machine Operators and Assemblers. . . . . . . . . . . . 272 204 200 4 - 29 15 8 - 6 - Elementary Occupations . . . . . . 343 227 224 - 3 50 25 11 - 11 3 Armed Forces . . . . . . . . . . . - - - - - - - - - - - Current formal workforce females 15+ years . . . . . 1,285 736 721 10 5 209 104 57 7 35 6 Legislators, senior officials and managers. . . . . . . . . . . 33 19 19 - - 1 - 1 - - - Professionals. . . . . . . . . . . 444 187 185 2 - 72 15 27 5 23 2 Technicians & Associate Professionals . . . . . . . . . . 149 80 76 1 3 45 35 6 - 3 1 Clerks . . . . . . . . . . . . . . 385 279 271 6 2 54 38 10 - 3 3 Service Workers and Shop and Market Sales Workers. . . . . . . 166 102 101 1 - 31 13 12 2 4 - Skilled Agricultural and fishery workers . . . . . . . . . 2 1 1 - - 1 1 - - - - Craft and Related Workers. . . . . 20 17 17 - - - - - - - - Plant & Machine Operators and Assemblers. . . . . . . . . . . . 17 13 13 - - 1 1 - - - - Elementary Occupations . . . . . . 69 38 38 - - 4 1 1 - 2 - Armed Forces . . . . . . . . . . . - - - - - - - - - - - ───────────────────────────────────────────────────────────────────────────────────────────────────────── Source: 2000 FSM Census
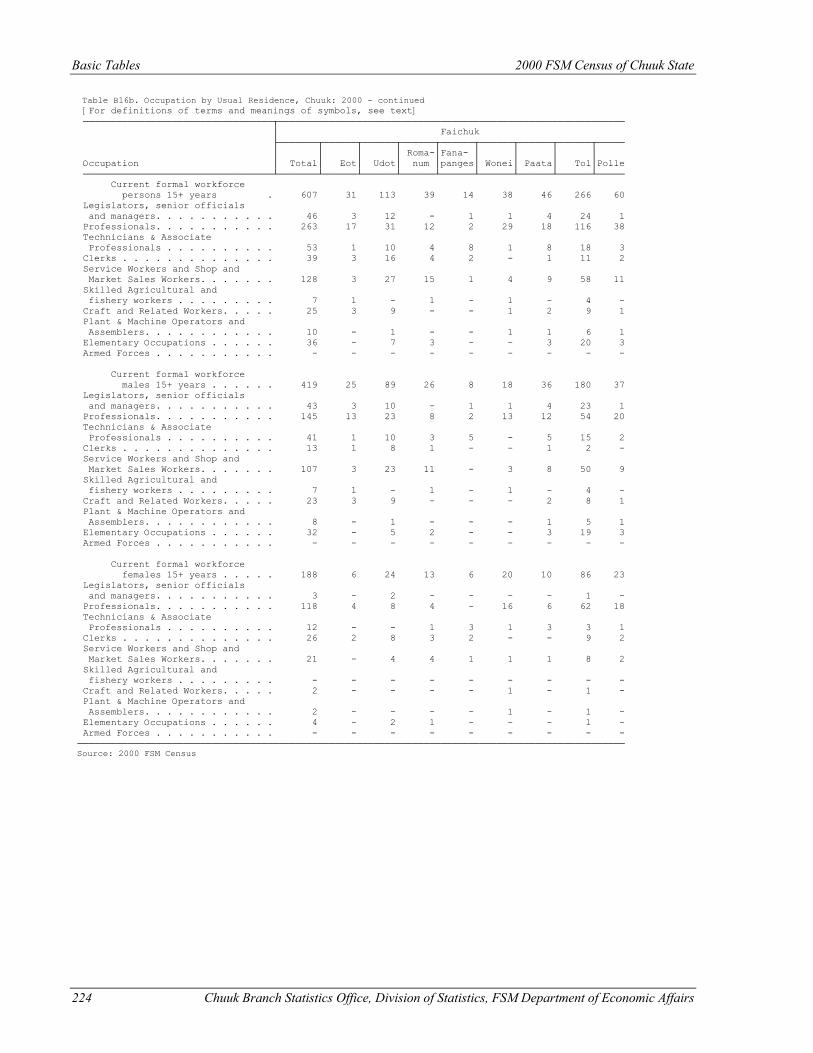
Basic Tables 2000 FSM Census of Chuuk State
224 Chuuk Branch Statistics Office, Division of Statistics, FSM Department of Economic Affairs
Table B16b. Occupation by Usual Residence, Chuuk: 2000 - continued [For definitions of terms and meanings of symbols, see text] ──────────────────────────────────┬────────────────────────────────────────────────────────────── │ Faichuk ├───────┬──────┬──────┬──────┬──────┬──────┬──────┬──────┬───── │ │ │ │ Roma-│Fana- │ │ │ │ Occupation │ Total│ Eot│ Udot│ num │panges│ Wonei│ Paata│ Tol│Polle ──────────────────────────────────┴───────┴──────┴──────┴──────┴──────┴──────┴──────┴──────┴───── Current formal workforce persons 15+ years . 607 31 113 39 14 38 46 266 60 Legislators, senior officials and managers. . . . . . . . . . . 46 3 12 - 1 1 4 24 1 Professionals. . . . . . . . . . . 263 17 31 12 2 29 18 116 38 Technicians & Associate Professionals . . . . . . . . . . 53 1 10 4 8 1 8 18 3 Clerks . . . . . . . . . . . . . . 39 3 16 4 2 - 1 11 2 Service Workers and Shop and Market Sales Workers. . . . . . . 128 3 27 15 1 4 9 58 11 Skilled Agricultural and fishery workers . . . . . . . . . 7 1 - 1 - 1 - 4 - Craft and Related Workers. . . . . 25 3 9 - - 1 2 9 1 Plant & Machine Operators and Assemblers. . . . . . . . . . . . 10 - 1 - - 1 1 6 1 Elementary Occupations . . . . . . 36 - 7 3 - - 3 20 3 Armed Forces . . . . . . . . . . . - - - - - - - - - Current formal workforce males 15+ years . . . . . . 419 25 89 26 8 18 36 180 37 Legislators, senior officials and managers. . . . . . . . . . . 43 3 10 - 1 1 4 23 1 Professionals. . . . . . . . . . . 145 13 23 8 2 13 12 54 20 Technicians & Associate Professionals . . . . . . . . . . 41 1 10 3 5 - 5 15 2 Clerks . . . . . . . . . . . . . . 13 1 8 1 - - 1 2 - Service Workers and Shop and Market Sales Workers. . . . . . . 107 3 23 11 - 3 8 50 9 Skilled Agricultural and fishery workers . . . . . . . . . 7 1 - 1 - 1 - 4 - Craft and Related Workers. . . . . 23 3 9 - - - 2 8 1 Plant & Machine Operators and Assemblers. . . . . . . . . . . . 8 - 1 - - - 1 5 1 Elementary Occupations . . . . . . 32 - 5 2 - - 3 19 3 Armed Forces . . . . . . . . . . . - - - - - - - - - Current formal workforce females 15+ years . . . . . 188 6 24 13 6 20 10 86 23 Legislators, senior officials and managers. . . . . . . . . . . 3 - 2 - - - - 1 - Professionals. . . . . . . . . . . 118 4 8 4 - 16 6 62 18 Technicians & Associate Professionals . . . . . . . . . . 12 - - 1 3 1 3 3 1 Clerks . . . . . . . . . . . . . . 26 2 8 3 2 - - 9 2 Service Workers and Shop and Market Sales Workers. . . . . . . 21 - 4 4 1 1 1 8 2 Skilled Agricultural and fishery workers . . . . . . . . . - - - - - - - - - Craft and Related Workers. . . . . 2 - - - - 1 - 1 - Plant & Machine Operators and Assemblers. . . . . . . . . . . . 2 - - - - 1 - 1 - Elementary Occupations . . . . . . 4 - 2 1 - - - 1 - Armed Forces . . . . . . . . . . . - - - - - - - - - ────────────────────────────────────────────────────────────────────────────────────────────────── Source: 2000 FSM Census
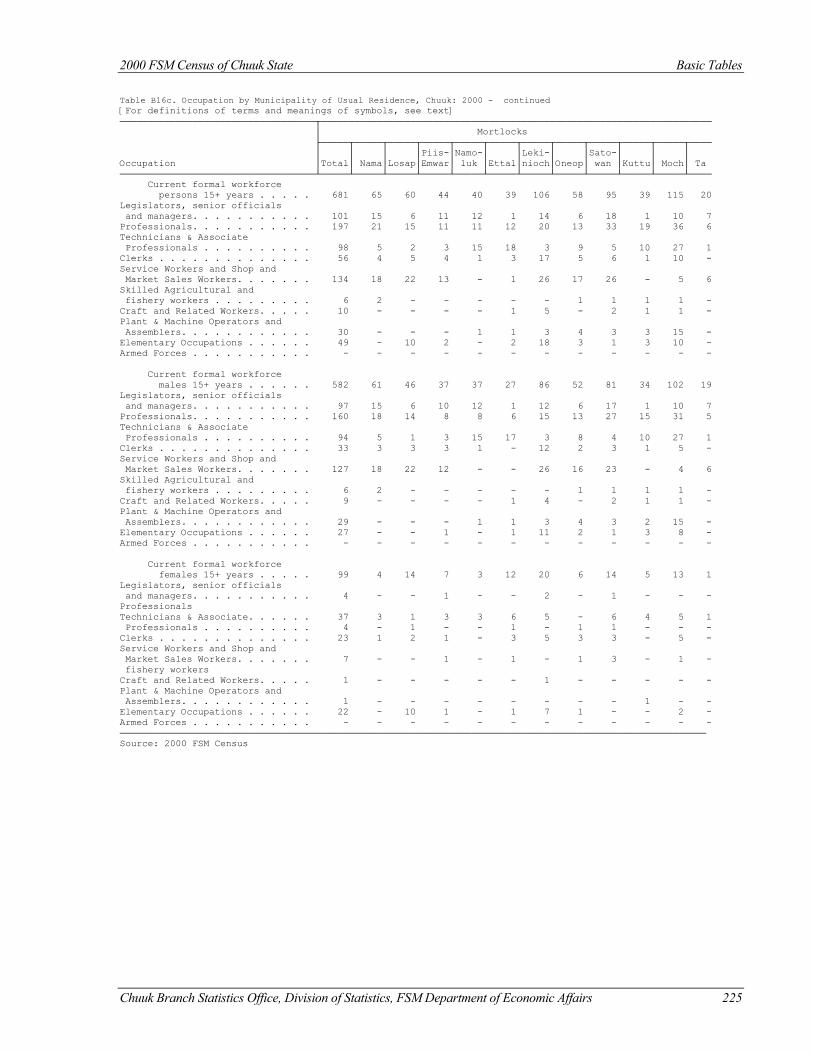
2000 FSM Census of Chuuk State Basic Tables
Chuuk Branch Statistics Office, Division of Statistics, FSM Department of Economic Affairs 225
Table B16c. Occupation by Municipality of Usual Residence, Chuuk: 2000 - continued [For definitions of terms and meanings of symbols, see text] ───────────────────────────────────┬────────────────────────────────────────────────────────────────────── │ Mortlocks ├─────┬─────┬─────┬─────┬─────┬─────┬─────┬─────┬─────┬─────┬─────┬──── │ │ │ │Piis-│Namo-│ │Leki-│ │Sato-│ │ │ Occupation │Total│ Nama│Losap│Emwar│ luk │Ettal│nioch│Oneop│ wan │Kuttu│ Moch│ Ta ───────────────────────────────────┴─────┴─────┴─────┴─────┴─────┴─────┴─────┴─────┴─────┴─────┴─────┴──── Current formal workforce persons 15+ years . . . . . 681 65 60 44 40 39 106 58 95 39 115 20 Legislators, senior officials and managers. . . . . . . . . . . 101 15 6 11 12 1 14 6 18 1 10 7 Professionals. . . . . . . . . . . 197 21 15 11 11 12 20 13 33 19 36 6 Technicians & Associate Professionals . . . . . . . . . . 98 5 2 3 15 18 3 9 5 10 27 1 Clerks . . . . . . . . . . . . . . 56 4 5 4 1 3 17 5 6 1 10 - Service Workers and Shop and Market Sales Workers. . . . . . . 134 18 22 13 - 1 26 17 26 - 5 6 Skilled Agricultural and fishery workers . . . . . . . . . 6 2 - - - - - 1 1 1 1 - Craft and Related Workers. . . . . 10 - - - - 1 5 - 2 1 1 - Plant & Machine Operators and Assemblers. . . . . . . . . . . . 30 - - - 1 1 3 4 3 3 15 - Elementary Occupations . . . . . . 49 - 10 2 - 2 18 3 1 3 10 - Armed Forces . . . . . . . . . . . - - - - - - - - - - - - Current formal workforce males 15+ years . . . . . . 582 61 46 37 37 27 86 52 81 34 102 19 Legislators, senior officials and managers. . . . . . . . . . . 97 15 6 10 12 1 12 6 17 1 10 7 Professionals. . . . . . . . . . . 160 18 14 8 8 6 15 13 27 15 31 5 Technicians & Associate Professionals . . . . . . . . . . 94 5 1 3 15 17 3 8 4 10 27 1 Clerks . . . . . . . . . . . . . . 33 3 3 3 1 - 12 2 3 1 5 - Service Workers and Shop and Market Sales Workers. . . . . . . 127 18 22 12 - - 26 16 23 - 4 6 Skilled Agricultural and fishery workers . . . . . . . . . 6 2 - - - - - 1 1 1 1 - Craft and Related Workers. . . . . 9 - - - - 1 4 - 2 1 1 - Plant & Machine Operators and Assemblers. . . . . . . . . . . . 29 - - - 1 1 3 4 3 2 15 - Elementary Occupations . . . . . . 27 - - 1 - 1 11 2 1 3 8 - Armed Forces . . . . . . . . . . . - - - - - - - - - - - - Current formal workforce females 15+ years . . . . . 99 4 14 7 3 12 20 6 14 5 13 1 Legislators, senior officials and managers. . . . . . . . . . . 4 - - 1 - - 2 - 1 - - - Professionals Technicians & Associate. . . . . . 37 3 1 3 3 6 5 - 6 4 5 1 Professionals . . . . . . . . . . 4 - 1 - - 1 - 1 1 - - - Clerks . . . . . . . . . . . . . . 23 1 2 1 - 3 5 3 3 - 5 - Service Workers and Shop and Market Sales Workers. . . . . . . 7 - - 1 - 1 - 1 3 - 1 - fishery workers Craft and Related Workers. . . . . 1 - - - - - 1 - - - - - Plant & Machine Operators and Assemblers. . . . . . . . . . . . 1 - - - - - - - - 1 - - Elementary Occupations . . . . . . 22 - 10 1 - 1 7 1 - - 2 - Armed Forces . . . . . . . . . . . - - - - - - - - - - - - ───────────────────────────────────────────────────────────────────────────────────────────────────────── Source: 2000 FSM Census
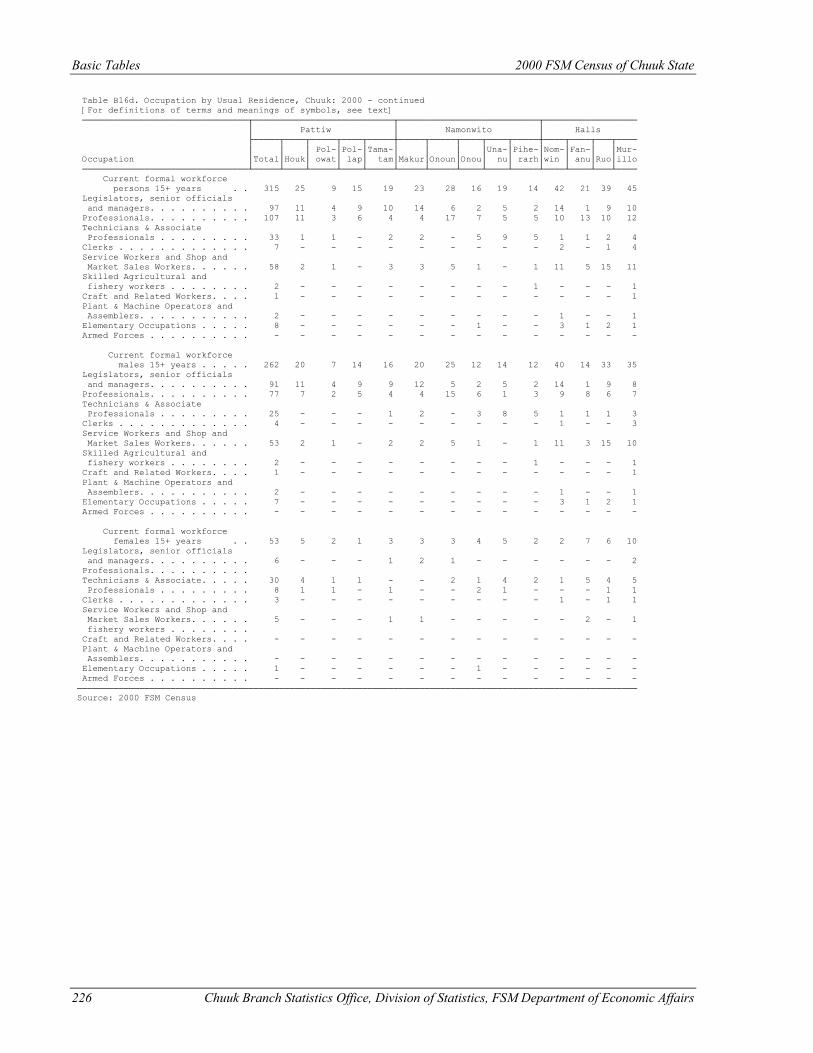
Basic Tables 2000 FSM Census of Chuuk State
226 Chuuk Branch Statistics Office, Division of Statistics, FSM Department of Economic Affairs
Table B16d. Occupation by Usual Residence, Chuuk: 2000 - continued [For definitions of terms and meanings of symbols, see text] ────────────────────────────────┬───────────────────────────┬───────────────────────────┬────────────────── │ Pattiw │ Namonwito │ Halls ├─────┬────┬─────┬────┬─────┼─────┬─────┬────┬────┬─────┼────┬────┬───┬──── │ │ │ Pol-│Pol-│Tama-│ │ │ │Una-│Pihe-│Nom-│Fan-│ │Mur- Occupation │Total│Houk│ owat│ lap│ tam│Makur│Onoun│Onou│ nu│ rarh│win │ anu│Ruo│illo ────────────────────────────────┴─────┴────┴─────┴────┴─────┴─────┴─────┴────┴────┴─────┴────┴────┴───┴──── Current formal workforce persons 15+ years . . 315 25 9 15 19 23 28 16 19 14 42 21 39 45 Legislators, senior officials and managers. . . . . . . . . . 97 11 4 9 10 14 6 2 5 2 14 1 9 10 Professionals. . . . . . . . . . 107 11 3 6 4 4 17 7 5 5 10 13 10 12 Technicians & Associate Professionals . . . . . . . . . 33 1 1 - 2 2 - 5 9 5 1 1 2 4 Clerks . . . . . . . . . . . . . 7 - - - - - - - - - 2 - 1 4 Service Workers and Shop and Market Sales Workers. . . . . . 58 2 1 - 3 3 5 1 - 1 11 5 15 11 Skilled Agricultural and fishery workers . . . . . . . . 2 - - - - - - - - 1 - - - 1 Craft and Related Workers. . . . 1 - - - - - - - - - - - - 1 Plant & Machine Operators and Assemblers. . . . . . . . . . . 2 - - - - - - - - - 1 - - 1 Elementary Occupations . . . . . 8 - - - - - - 1 - - 3 1 2 1 Armed Forces . . . . . . . . . . - - - - - - - - - - - - - - Current formal workforce males 15+ years . . . . . 262 20 7 14 16 20 25 12 14 12 40 14 33 35 Legislators, senior officials and managers. . . . . . . . . . 91 11 4 9 9 12 5 2 5 2 14 1 9 8 Professionals. . . . . . . . . . 77 7 2 5 4 4 15 6 1 3 9 8 6 7 Technicians & Associate Professionals . . . . . . . . . 25 - - - 1 2 - 3 8 5 1 1 1 3 Clerks . . . . . . . . . . . . . 4 - - - - - - - - - 1 - - 3 Service Workers and Shop and Market Sales Workers. . . . . . 53 2 1 - 2 2 5 1 - 1 11 3 15 10 Skilled Agricultural and fishery workers . . . . . . . . 2 - - - - - - - - 1 - - - 1 Craft and Related Workers. . . . 1 - - - - - - - - - - - - 1 Plant & Machine Operators and Assemblers. . . . . . . . . . . 2 - - - - - - - - - 1 - - 1 Elementary Occupations . . . . . 7 - - - - - - - - - 3 1 2 1 Armed Forces . . . . . . . . . . - - - - - - - - - - - - - - Current formal workforce females 15+ years . . 53 5 2 1 3 3 3 4 5 2 2 7 6 10 Legislators, senior officials and managers. . . . . . . . . . 6 - - - 1 2 1 - - - - - - 2 Professionals. . . . . . . . . . Technicians & Associate. . . . . 30 4 1 1 - - 2 1 4 2 1 5 4 5 Professionals . . . . . . . . . 8 1 1 - 1 - - 2 1 - - - 1 1 Clerks . . . . . . . . . . . . . 3 - - - - - - - - - 1 - 1 1 Service Workers and Shop and Market Sales Workers. . . . . . 5 - - - 1 1 - - - - - 2 - 1 fishery workers . . . . . . . . Craft and Related Workers. . . . - - - - - - - - - - - - - - Plant & Machine Operators and Assemblers. . . . . . . . . . . - - - - - - - - - - - - - - Elementary Occupations . . . . . 1 - - - - - - 1 - - - - - - Armed Forces . . . . . . . . . . - - - - - - - - - - - - - - ──────────────────────────────────────────────────────────────────────────────────────────────────────────── Source: 2000 FSM Census
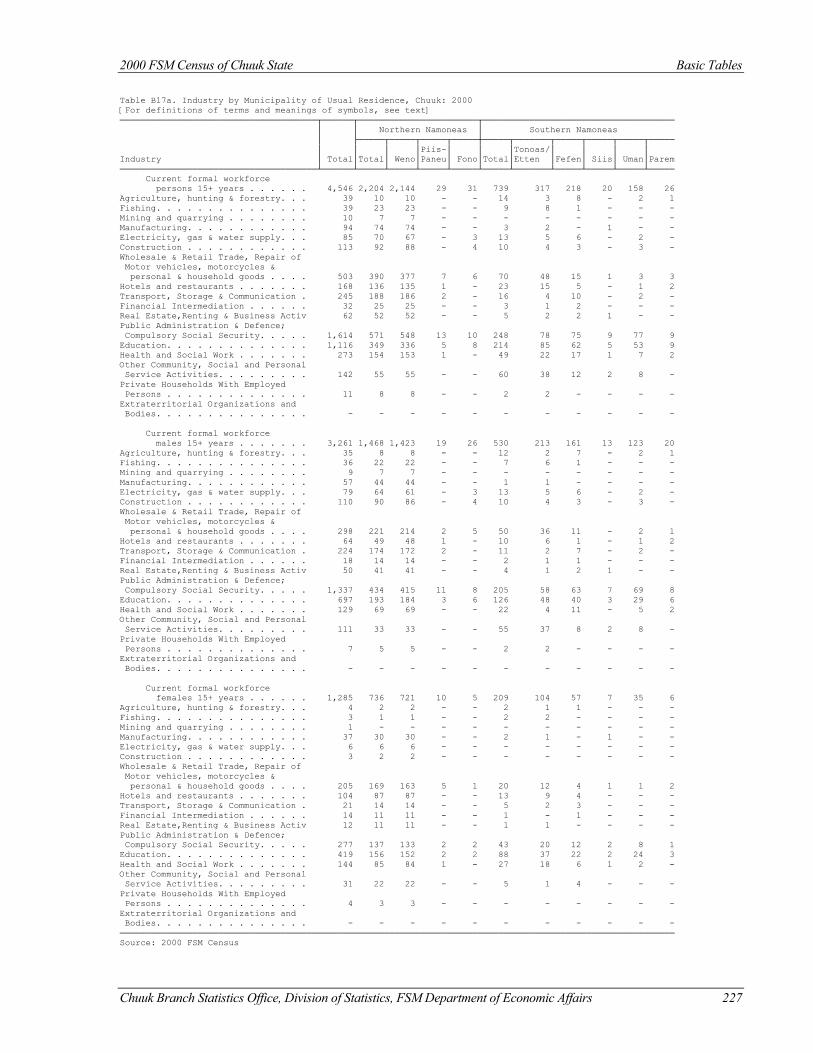
2000 FSM Census of Chuuk State Basic Tables
Chuuk Branch Statistics Office, Division of Statistics, FSM Department of Economic Affairs 227
Table B17a. Industry by Municipality of Usual Residence, Chuuk: 2000 [For definitions of terms and meanings of symbols, see text] ──────────────────────────────────────┬──────┬───────────────────────┬───────────────────────────────────── │ │ Northern Namoneas │ Southern Namoneas │ ├─────┬─────┬─────┬─────┼─────┬───────┬─────┬─────┬─────┬───── │ │ │ │Piis-│ │ │Tonoas/│ │ │ │ Industry │ Total│Total│ Weno│Paneu│ Fono│Total│Etten │Fefen│ Siis│ Uman│Parem ──────────────────────────────────────┴──────┴─────┴─────┴─────┴─────┴─────┴───────┴─────┴─────┴─────┴───── Current formal workforce persons 15+ years . . . . . . 4,546 2,204 2,144 29 31 739 317 218 20 158 26 Agriculture, hunting & forestry. . . 39 10 10 - - 14 3 8 - 2 1 Fishing. . . . . . . . . . . . . . . 39 23 23 - - 9 8 1 - - - Mining and quarrying . . . . . . . . 10 7 7 - - - - - - - - Manufacturing. . . . . . . . . . . . 94 74 74 - - 3 2 - 1 - - Electricity, gas & water supply. . . 85 70 67 - 3 13 5 6 - 2 - Construction . . . . . . . . . . . . 113 92 88 - 4 10 4 3 - 3 - Wholesale & Retail Trade, Repair of Motor vehicles, motorcycles & personal & household goods . . . . 503 390 377 7 6 70 48 15 1 3 3 Hotels and restaurants . . . . . . . 168 136 135 1 - 23 15 5 - 1 2 Transport, Storage & Communication . 245 188 186 2 - 16 4 10 - 2 - Financial Intermediation . . . . . . 32 25 25 - - 3 1 2 - - - Real Estate,Renting & Business Activ 62 52 52 - - 5 2 2 1 - - Public Administration & Defence; Compulsory Social Security. . . . . 1,614 571 548 13 10 248 78 75 9 77 9 Education. . . . . . . . . . . . . . 1,116 349 336 5 8 214 85 62 5 53 9 Health and Social Work . . . . . . . 273 154 153 1 - 49 22 17 1 7 2 Other Community, Social and Personal Service Activities. . . . . . . . . 142 55 55 - - 60 38 12 2 8 - Private Households With Employed Persons . . . . . . . . . . . . . . 11 8 8 - - 2 2 - - - - Extraterritorial Organizations and Bodies. . . . . . . . . . . . . . . - - - - - - - - - - - Current formal workforce males 15+ years . . . . . . . 3,261 1,468 1,423 19 26 530 213 161 13 123 20 Agriculture, hunting & forestry. . . 35 8 8 - - 12 2 7 - 2 1 Fishing. . . . . . . . . . . . . . . 36 22 22 - - 7 6 1 - - - Mining and quarrying . . . . . . . . 9 7 7 - - - - - - - - Manufacturing. . . . . . . . . . . . 57 44 44 - - 1 1 - - - - Electricity, gas & water supply. . . 79 64 61 - 3 13 5 6 - 2 - Construction . . . . . . . . . . . . 110 90 86 - 4 10 4 3 - 3 - Wholesale & Retail Trade, Repair of Motor vehicles, motorcycles & personal & household goods . . . . 298 221 214 2 5 50 36 11 - 2 1 Hotels and restaurants . . . . . . . 64 49 48 1 - 10 6 1 - 1 2 Transport, Storage & Communication . 224 174 172 2 - 11 2 7 - 2 - Financial Intermediation . . . . . . 18 14 14 - - 2 1 1 - - - Real Estate,Renting & Business Activ 50 41 41 - - 4 1 2 1 - - Public Administration & Defence; Compulsory Social Security. . . . . 1,337 434 415 11 8 205 58 63 7 69 8 Education. . . . . . . . . . . . . . 697 193 184 3 6 126 48 40 3 29 6 Health and Social Work . . . . . . . 129 69 69 - - 22 4 11 - 5 2 Other Community, Social and Personal Service Activities. . . . . . . . . 111 33 33 - - 55 37 8 2 8 - Private Households With Employed Persons . . . . . . . . . . . . . . 7 5 5 - - 2 2 - - - - Extraterritorial Organizations and Bodies. . . . . . . . . . . . . . . - - - - - - - - - - - Current formal workforce females 15+ years . . . . . . 1,285 736 721 10 5 209 104 57 7 35 6 Agriculture, hunting & forestry. . . 4 2 2 - - 2 1 1 - - - Fishing. . . . . . . . . . . . . . . 3 1 1 - - 2 2 - - - - Mining and quarrying . . . . . . . . 1 - - - - - - - - - - Manufacturing. . . . . . . . . . . . 37 30 30 - - 2 1 - 1 - - Electricity, gas & water supply. . . 6 6 6 - - - - - - - - Construction . . . . . . . . . . . . 3 2 2 - - - - - - - - Wholesale & Retail Trade, Repair of Motor vehicles, motorcycles & personal & household goods . . . . 205 169 163 5 1 20 12 4 1 1 2 Hotels and restaurants . . . . . . . 104 87 87 - - 13 9 4 - - - Transport, Storage & Communication . 21 14 14 - - 5 2 3 - - - Financial Intermediation . . . . . . 14 11 11 - - 1 - 1 - - - Real Estate,Renting & Business Activ 12 11 11 - - 1 1 - - - - Public Administration & Defence; Compulsory Social Security. . . . . 277 137 133 2 2 43 20 12 2 8 1 Education. . . . . . . . . . . . . . 419 156 152 2 2 88 37 22 2 24 3 Health and Social Work . . . . . . . 144 85 84 1 - 27 18 6 1 2 - Other Community, Social and Personal Service Activities. . . . . . . . . 31 22 22 - - 5 1 4 - - - Private Households With Employed Persons . . . . . . . . . . . . . . 4 3 3 - - - - - - - - Extraterritorial Organizations and Bodies. . . . . . . . . . . . . . . - - - - - - - - - - - ─────────────────────────────────────────────────────────────────────────────────────────────────────────── Source: 2000 FSM Census

Basic Tables 2000 FSM Census of Chuuk State
228 Chuuk Branch Statistics Office, Division of Statistics, FSM Department of Economic Affairs
Table B17b. Industry by Municipality of Usual Residence, Chuuk: 2000 - continued [For definitions of terms and meanings of symbols, see text] ───────────────────────────────────────────┬────────────────────────────────────────────────────── │ Faichuk ├─────┬─────┬─────┬─────┬──────┬─────┬─────┬─────┬───── │ │ │ │Roma-│Fana- │ │ │ │ Industry │Total│ Eot│ Udot│ num │panges│Wonei│Paata│ Tol│Polle ───────────────────────────────────────────┴─────┴─────┴─────┴─────┴──────┴─────┴─────┴─────┴───── Current formal workforce persons 15+ years . . . . . . . 607 31 113 39 14 38 46 266 60 Agriculture, hunting & forestry . . . . . . 5 - - - - - 1 4 - Fishing . . . . . . . . . . . . . . . . . . 1 - 1 - - - - - - Mining and quarrying. . . . . . . . . . . . 2 1 - - - - - 1 - Manufacturing . . . . . . . . . . . . . . . 5 - - - - 2 - 2 1 Electricity, gas & water supply . . . . . . 2 - 1 - - - - 1 - Construction. . . . . . . . . . . . . . . . 6 - 1 - - - - 4 1 Wholesale & Retail Trade, Repair of Motor vehicles, motorcycles & personal & household goods. . . . . . . . 28 - 13 4 2 - - 8 1 Hotels and restaurants. . . . . . . . . . . 8 - 4 4 - - - - - Transport, Storage & Communication. . . . . 8 - - - 1 1 1 5 - Financial Intermediation . . . . . . . . . 2 - 1 - - - - 1 - Real Estate,Renting & Business Activ. . . . 2 - 1 - - - 1 - - Public Administration & Defence; Compulsory social Security . . . . . . . . 207 18 54 16 4 8 13 74 20 Education . . . . . . . . . . . . . . . . . 287 9 23 13 6 25 22 154 35 Health and Social Work. . . . . . . . . . . 30 2 5 2 1 2 5 11 2 Other Community, Social and Personal Service Activities . . . . . . . . . . . . 13 1 8 - - - 3 1 - Private Households With Employed Persons. . . . . . . . . . . . . . . . . . 1 - 1 - - - - - - Extraterritorial Organizations and Bodies . . . . . . . . . . . . . . . . . . - - - - - - - - - Current formal workforce males 15+ years . . . . . . . . . .. 419 25 89 26 8 18 36 180 37 Agriculture, hunting & forestry. . . . . .. 5 - - - - - 1 4 - Fishing. . . . . . . . . . . . . . . . . .. 1 - 1 - - - - - - Mining and quarrying . . . . . . . . . . .. 2 1 - - - - - 1 - Manufacturing. . . . . . . . . . . . . . .. 1 - - - - - - 1 - Electricity, gas & water supply . . . . . . 2 - 1 - - - - 1 - Construction. . . . . . . . . . . . . . . . 5 - 1 - - - - 3 1 Wholesale & Retail Trade, Repair of Motor vehicles, motorcycles & personal & household goods. . . . . . . . 16 - 8 1 - - - 6 1 Hotels and restaurants . . . . . . . . . . 4 - 3 1 - - - - - Transport, Storage & Communication. . . . . 7 - - - - 1 1 5 - Financial Intermediation. . . . . . . . . . 2 - 1 - - - - 1 - Real Estate,Renting & Business Activ. . . . 2 - 1 - - - 1 - - Public Administration & Defence; Compulsory Social Security . . . . . . . . 178 17 45 14 4 6 13 64 15 Education . . . . . . . . . . . . . . . . . 165 7 18 8 3 11 15 84 19 Health and Social Work. . . . . . . . . . . 18 - 3 2 1 - 2 9 1 Other Community, Social and Personal Service Activities . . . . . . . . . . . . 11 - 7 - - - 3 1 - Private Households With Employed Persons. . . . . . . . . . . . . . . . . . - - - - - - - - - Extraterritorial Organizations and Bodies . . . . . . . . . . . . . . . . . . - - - - - - - - - Current formal workforce females 15+ years . . . . . . . . .. 188 6 24 13 6 20 10 86 23 Agriculture, hunting & forestry . . . . . . - - - - - - - - - Fishing . . . . . . . . . . . . . . . . . . - - - - - - - - - Mining and quarrying. . . . . . . . . . . . - - - - - - - - - Manufacturing . . . . . . . . . . . . . . . 4 - - - - 2 - 1 1 Electricity, gas & water supply . . . . . . - - - - - - - - - Construction. . . . . . . . . . . . . . . . 1 - - - - - - 1 - Wholesale & Retail Trade, Repair of Motor vehicles, motorcycles & personal & household goods. . . . . . . . 12 - 5 3 2 - - 2 - Hotels and restaurants. . . . . . . . . . . 4 - 1 3 - - - - - Transport, Storage & Communication. . . . . 1 - - - 1 - - - - Financial Intermediation . . . . . . . . . - - - - - - - - - Real Estate,Renting & Business Activ. . . . - - - - - - - - - Public Administration & Defence; Compulsory social Security . . . . . . . . 29 1 9 2 - 2 - 10 5 Education . . . . . . . . . . . . . . . . . 122 2 5 5 3 14 7 70 16 Health and Social Work. . . . . . . . . . . 12 2 2 - - 2 3 2 1 Other Community, Social and Personal Service Activities . . . . . . . . . . . . 2 1 1 - - - - - - Private Households With Employed Persons. . . . . . . . . . . . . . . . . . 1 - 1 - - - - - - Extraterritorial Organizations and Bodies . . . . . . . . . . . . . . . . . . - - - - - - - - - ────────────────────────────────────────────────────────────────────────────────────────────────── Source: 2000 FSM Census
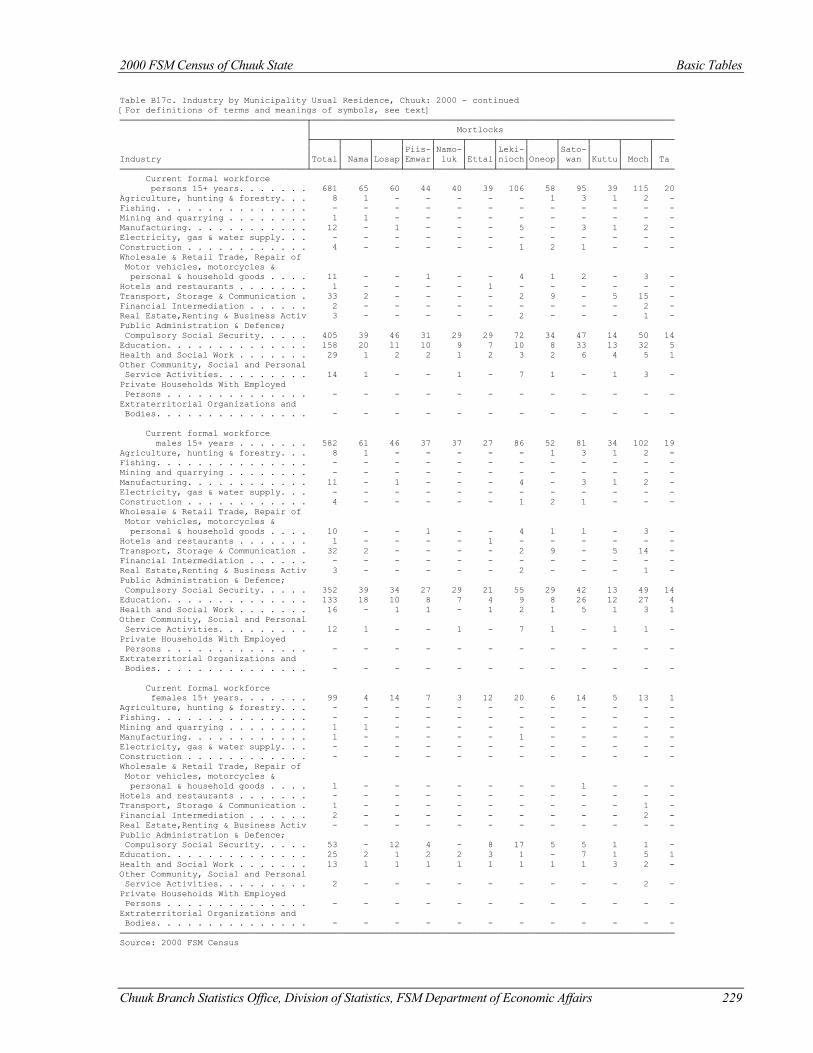
2000 FSM Census of Chuuk State Basic Tables
Chuuk Branch Statistics Office, Division of Statistics, FSM Department of Economic Affairs 229
Table B17c. Industry by Municipality Usual Residence, Chuuk: 2000 - continued [For definitions of terms and meanings of symbols, see text] ────────────────────────────────────┬────────────────────────────────────────────────────────────────────── │ Mortlocks ├─────┬─────┬─────┬─────┬─────┬─────┬─────┬─────┬─────┬─────┬─────┬──── │ │ │ │Piis-│Namo-│ │Leki-│ │Sato-│ │ │ Industry │Total│ Nama│Losap│Emwar│ luk │Ettal│nioch│Oneop│ wan │Kuttu│ Moch│ Ta ────────────────────────────────────┴─────┴─────┴─────┴─────┴─────┴─────┴─────┴─────┴─────┴─────┴─────┴──── Current formal workforce persons 15+ years. . . . . . . 681 65 60 44 40 39 106 58 95 39 115 20 Agriculture, hunting & forestry. . . 8 1 - - - - - 1 3 1 2 - Fishing. . . . . . . . . . . . . . . - - - - - - - - - - - - Mining and quarrying . . . . . . . . 1 1 - - - - - - - - - - Manufacturing. . . . . . . . . . . . 12 - 1 - - - 5 - 3 1 2 - Electricity, gas & water supply. . . - - - - - - - - - - - - Construction . . . . . . . . . . . . 4 - - - - - 1 2 1 - - - Wholesale & Retail Trade, Repair of Motor vehicles, motorcycles & personal & household goods . . . . 11 - - 1 - - 4 1 2 - 3 - Hotels and restaurants . . . . . . . 1 - - - - 1 - - - - - - Transport, Storage & Communication . 33 2 - - - - 2 9 - 5 15 - Financial Intermediation . . . . . . 2 - - - - - - - - - 2 - Real Estate,Renting & Business Activ 3 - - - - - 2 - - - 1 - Public Administration & Defence; Compulsory Social Security. . . . . 405 39 46 31 29 29 72 34 47 14 50 14 Education. . . . . . . . . . . . . . 158 20 11 10 9 7 10 8 33 13 32 5 Health and Social Work . . . . . . . 29 1 2 2 1 2 3 2 6 4 5 1 Other Community, Social and Personal Service Activities. . . . . . . . . 14 1 - - 1 - 7 1 - 1 3 - Private Households With Employed Persons . . . . . . . . . . . . . . - - - - - - - - - - - - Extraterritorial Organizations and Bodies. . . . . . . . . . . . . . . - - - - - - - - - - - - Current formal workforce males 15+ years . . . . . . . 582 61 46 37 37 27 86 52 81 34 102 19 Agriculture, hunting & forestry. . . 8 1 - - - - - 1 3 1 2 - Fishing. . . . . . . . . . . . . . . - - - - - - - - - - - - Mining and quarrying . . . . . . . . - - - - - - - - - - - - Manufacturing. . . . . . . . . . . . 11 - 1 - - - 4 - 3 1 2 - Electricity, gas & water supply. . . - - - - - - - - - - - - Construction . . . . . . . . . . . . 4 - - - - - 1 2 1 - - - Wholesale & Retail Trade, Repair of Motor vehicles, motorcycles & personal & household goods . . . . 10 - - 1 - - 4 1 1 - 3 - Hotels and restaurants . . . . . . . 1 - - - - 1 - - - - - - Transport, Storage & Communication . 32 2 - - - - 2 9 - 5 14 - Financial Intermediation . . . . . . - - - - - - - - - - - - Real Estate,Renting & Business Activ 3 - - - - - 2 - - - 1 - Public Administration & Defence; Compulsory Social Security. . . . . 352 39 34 27 29 21 55 29 42 13 49 14 Education. . . . . . . . . . . . . . 133 18 10 8 7 4 9 8 26 12 27 4 Health and Social Work . . . . . . . 16 - 1 1 - 1 2 1 5 1 3 1 Other Community, Social and Personal Service Activities. . . . . . . . . 12 1 - - 1 - 7 1 - 1 1 - Private Households With Employed Persons . . . . . . . . . . . . . . - - - - - - - - - - - - Extraterritorial Organizations and Bodies. . . . . . . . . . . . . . . - - - - - - - - - - - - Current formal workforce females 15+ years. . . . . . . 99 4 14 7 3 12 20 6 14 5 13 1 Agriculture, hunting & forestry. . . - - - - - - - - - - - - Fishing. . . . . . . . . . . . . . . - - - - - - - - - - - - Mining and quarrying . . . . . . . . 1 1 - - - - - - - - - - Manufacturing. . . . . . . . . . . . 1 - - - - - 1 - - - - - Electricity, gas & water supply. . . - - - - - - - - - - - - Construction . . . . . . . . . . . . - - - - - - - - - - - - Wholesale & Retail Trade, Repair of Motor vehicles, motorcycles & personal & household goods . . . . 1 - - - - - - - 1 - - - Hotels and restaurants . . . . . . . - - - - - - - - - - - - Transport, Storage & Communication . 1 - - - - - - - - - 1 - Financial Intermediation . . . . . . 2 - - - - - - - - - 2 - Real Estate,Renting & Business Activ - - - - - - - - - - - - Public Administration & Defence; Compulsory Social Security. . . . . 53 - 12 4 - 8 17 5 5 1 1 - Education. . . . . . . . . . . . . . 25 2 1 2 2 3 1 - 7 1 5 1 Health and Social Work . . . . . . . 13 1 1 1 1 1 1 1 1 3 2 - Other Community, Social and Personal Service Activities. . . . . . . . . 2 - - - - - - - - - 2 - Private Households With Employed Persons . . . . . . . . . . . . . . - - - - - - - - - - - - Extraterritorial Organizations and Bodies. . . . . . . . . . . . . . . - - - - - - - - - - - - ─────────────────────────────────────────────────────────────────────────────────────────────────────────── Source: 2000 FSM Census
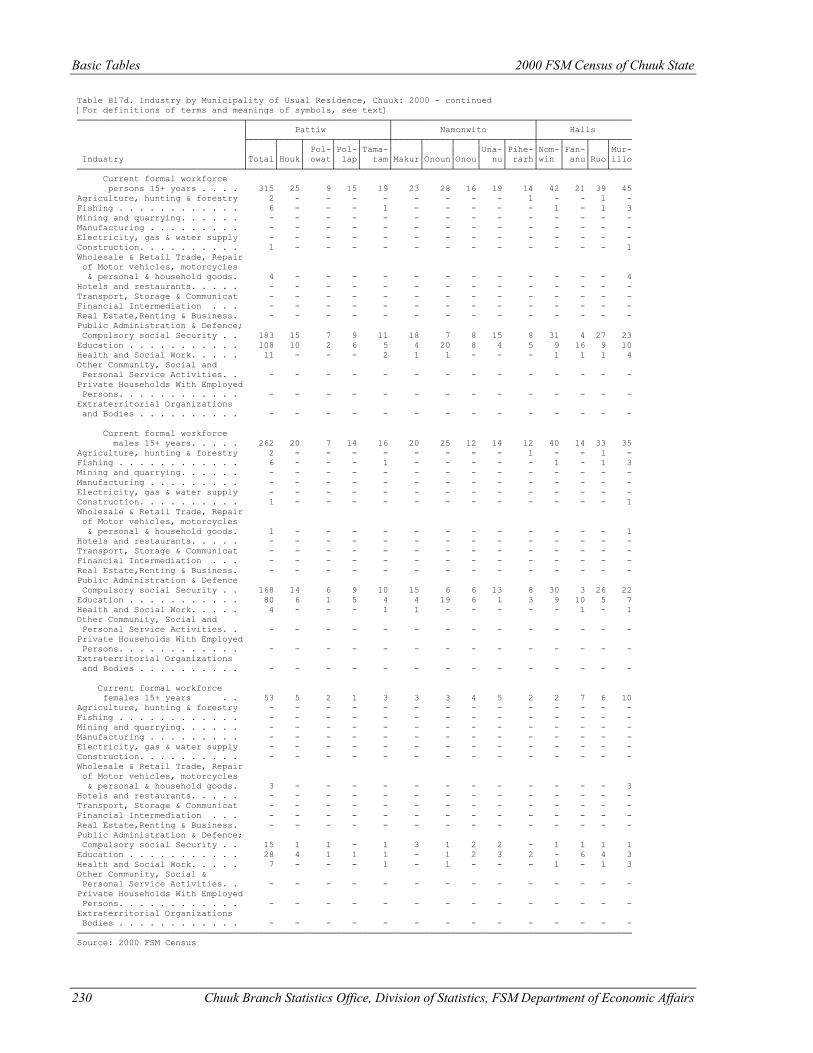
Basic Tables 2000 FSM Census of Chuuk State
230 Chuuk Branch Statistics Office, Division of Statistics, FSM Department of Economic Affairs
Table B17d. Industry by Municipality of Usual Residence, Chuuk: 2000 - continued [For definitions of terms and meanings of symbols, see text] ────────────────────────────────┬───────────────────────────┬───────────────────────────┬────────────────── │ Pattiw │ Namonwito │ Halls ├─────┬────┬─────┬────┬─────┼─────┬─────┬────┬────┬─────┼────┬────┬───┬──── │ │ │ Pol-│Pol-│Tama-│ │ │ │Una-│Pihe-│Nom-│Fan-│ │Mur- Industry │Total│Houk│ owat│ lap│ tam│Makur│Onoun│Onou│ nu│ rarh│win │ anu│Ruo│illo ────────────────────────────────┴─────┴────┴─────┴────┴─────┴─────┴─────┴────┴────┴─────┴────┴────┴───┴──── Current formal workforce persons 15+ years . . . . 315 25 9 15 19 23 28 16 19 14 42 21 39 45 Agriculture, hunting & forestry 2 - - - - - - - - 1 - - 1 - Fishing . . . . . . . . . . . . 6 - - - 1 - - - - - 1 - 1 3 Mining and quarrying. . . . . . - - - - - - - - - - - - - - Manufacturing . . . . . . . . . - - - - - - - - - - - - - - Electricity, gas & water supply - - - - - - - - - - - - - - Construction. . . . . . . . . . 1 - - - - - - - - - - - - 1 Wholesale & Retail Trade, Repair of Motor vehicles, motorcycles & personal & household goods. 4 - - - - - - - - - - - - 4 Hotels and restaurants. . . . . - - - - - - - - - - - - - - Transport, Storage & Communicat - - - - - - - - - - - - - - Financial Intermediation . . . - - - - - - - - - - - - - - Real Estate,Renting & Business. - - - - - - - - - - - - - - Public Administration & Defence; Compulsory social Security . . 183 15 7 9 11 18 7 8 15 8 31 4 27 23 Education . . . . . . . . . . . 108 10 2 6 5 4 20 8 4 5 9 16 9 10 Health and Social Work. . . . . 11 - - - 2 1 1 - - - 1 1 1 4 Other Community, Social and Personal Service Activities. . - - - - - - - - - - - - - - Private Households With Employed Persons. . . . . . . . . . . . - - - - - - - - - - - - - - Extraterritorial Organizations and Bodies . . . . . . . . . . - - - - - - - - - - - - - - Current formal workforce males 15+ years. . . . . 262 20 7 14 16 20 25 12 14 12 40 14 33 35 Agriculture, hunting & forestry 2 - - - - - - - - 1 - - 1 - Fishing . . . . . . . . . . . . 6 - - - 1 - - - - - 1 - 1 3 Mining and quarrying. . . . . . - - - - - - - - - - - - - - Manufacturing . . . . . . . . . - - - - - - - - - - - - - - Electricity, gas & water supply - - - - - - - - - - - - - - Construction. . . . . . . . . . 1 - - - - - - - - - - - - 1 Wholesale & Retail Trade, Repair of Motor vehicles, motorcycles & personal & household goods. 1 - - - - - - - - - - - - 1 Hotels and restaurants. . . . . - - - - - - - - - - - - - - Transport, Storage & Communicat - - - - - - - - - - - - - - Financial Intermediation . . . - - - - - - - - - - - - - - Real Estate,Renting & Business. - - - - - - - - - - - - - - Public Administration & Defence Compulsory social Security . . 168 14 6 9 10 15 6 6 13 8 30 3 26 22 Education . . . . . . . . . . . 80 6 1 5 4 4 19 6 1 3 9 10 5 7 Health and Social Work. . . . . 4 - - - 1 1 - - - - - 1 - 1 Other Community, Social and Personal Service Activities. . - - - - - - - - - - - - - - Private Households With Employed Persons. . . . . . . . . . . . - - - - - - - - - - - - - - Extraterritorial Organizations and Bodies . . . . . . . . . . - - - - - - - - - - - - - - Current formal workforce females 15+ years . . 53 5 2 1 3 3 3 4 5 2 2 7 6 10 Agriculture, hunting & forestry - - - - - - - - - - - - - - Fishing . . . . . . . . . . . . - - - - - - - - - - - - - - Mining and quarrying. . . . . . - - - - - - - - - - - - - - Manufacturing . . . . . . . . . - - - - - - - - - - - - - - Electricity, gas & water supply - - - - - - - - - - - - - - Construction. . . . . . . . . . - - - - - - - - - - - - - - Wholesale & Retail Trade, Repair of Motor vehicles, motorcycles & personal & household goods. 3 - - - - - - - - - - - - 3 Hotels and restaurants. . . . . - - - - - - - - - - - - - - Transport, Storage & Communicat - - - - - - - - - - - - - - Financial Intermediation . . . - - - - - - - - - - - - - - Real Estate,Renting & Business. - - - - - - - - - - - - - - Public Administration & Defence; Compulsory social Security . . 15 1 1 - 1 3 1 2 2 - 1 1 1 1 Education . . . . . . . . . . . 28 4 1 1 1 - 1 2 3 2 - 6 4 3 Health and Social Work. . . . . 7 - - - 1 - 1 - - - 1 - 1 3 Other Community, Social & Personal Service Activities. . - - - - - - - - - - - - - - Private Households With Employed Persons. . . . . . . . . . . . - - - - - - - - - - - - - - Extraterritorial Organizations Bodies . . . . . . . . . . . . - - - - - - - - - - - - - - ─────────────────────────────────────────────────────────────────────────────────────────────────────────── Source: 2000 FSM Census
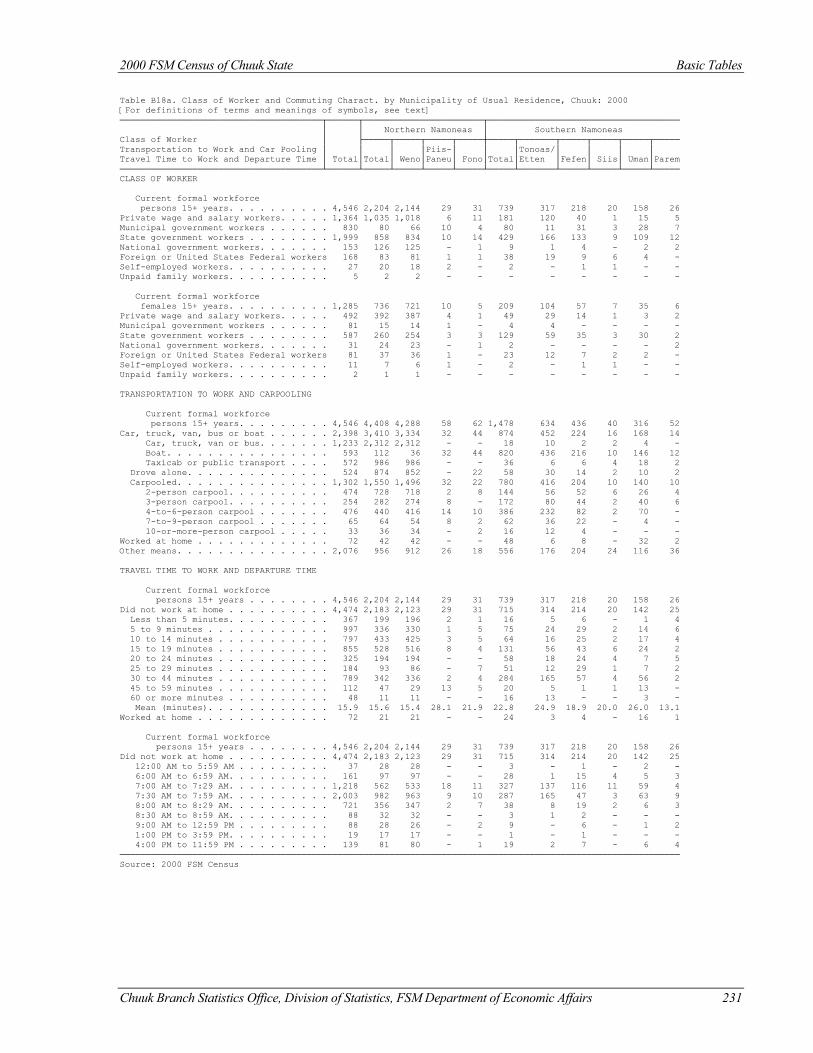
2000 FSM Census of Chuuk State Basic Tables
Chuuk Branch Statistics Office, Division of Statistics, FSM Department of Economic Affairs 231
Table B18a. Class of Worker and Commuting Charact. by Municipality of Usual Residence, Chuuk: 2000 [For definitions of terms and meanings of symbols, see text] ───────────────────────────────────────┬──────┬───────────────────────┬───────────────────────────────────── │ │ Northern Namoneas │ Southern Namoneas Class of Worker │ ├─────┬─────┬─────┬─────┼─────┬───────┬─────┬─────┬─────┬───── Transportation to Work and Car Pooling │ │ │ │Piis-│ │ │Tonoas/│ │ │ │ Travel Time to Work and Departure Time │ Total│Total│ Weno│Paneu│ Fono│Total│Etten │Fefen│ Siis│ Uman│Parem ───────────────────────────────────────┴──────┴─────┴─────┴─────┴─────┴─────┴───────┴─────┴─────┴─────┴───── CLASS OF WORKER Current formal workforce persons 15+ years. . . . . . . . . . 4,546 2,204 2,144 29 31 739 317 218 20 158 26 Private wage and salary workers. . . . . 1,364 1,035 1,018 6 11 181 120 40 1 15 5 Municipal government workers . . . . . . 830 80 66 10 4 80 11 31 3 28 7 State government workers . . . . . . . . 1,999 858 834 10 14 429 166 133 9 109 12 National government workers. . . . . . . 153 126 125 - 1 9 1 4 - 2 2 Foreign or United States Federal workers 168 83 81 1 1 38 19 9 6 4 - Self-employed workers. . . . . . . . . . 27 20 18 2 - 2 - 1 1 - - Unpaid family workers. . . . . . . . . . 5 2 2 - - - - - - - - Current formal workforce females 15+ years. . . . . . . . . . 1,285 736 721 10 5 209 104 57 7 35 6 Private wage and salary workers. . . . . 492 392 387 4 1 49 29 14 1 3 2 Municipal government workers . . . . . . 81 15 14 1 - 4 4 - - - - State government workers . . . . . . . . 587 260 254 3 3 129 59 35 3 30 2 National government workers. . . . . . . 31 24 23 - 1 2 - - - - 2 Foreign or United States Federal workers 81 37 36 1 - 23 12 7 2 2 - Self-employed workers. . . . . . . . . . 11 7 6 1 - 2 - 1 1 - - Unpaid family workers. . . . . . . . . . 2 1 1 - - - - - - - - TRANSPORTATION TO WORK AND CARPOOLING Current formal workforce persons 15+ years. . . . . . . . . 4,546 4,408 4,288 58 62 1,478 634 436 40 316 52 Car, truck, van, bus or boat . . . . . . 2,398 3,410 3,334 32 44 874 452 224 16 168 14 Car, truck, van or bus. . . . . . . 1,233 2,312 2,312 - - 18 10 2 2 4 - Boat. . . . . . . . . . . . . . . . 593 112 36 32 44 820 436 216 10 146 12 Taxicab or public transport . . . . 572 986 986 - - 36 6 6 4 18 2 Drove alone. . . . . . . . . . . . . . 524 874 852 - 22 58 30 14 2 10 2 Carpooled. . . . . . . . . . . . . . . 1,302 1,550 1,496 32 22 780 416 204 10 140 10 2-person carpool. . . . . . . . . . 474 728 718 2 8 144 56 52 6 26 4 3-person carpool. . . . . . . . . . 254 282 274 8 - 172 80 44 2 40 6 4-to-6-person carpool . . . . . . . 476 440 416 14 10 386 232 82 2 70 - 7-to-9-person carpool . . . . . . . 65 64 54 8 2 62 36 22 - 4 - 10-or-more-person carpool . . . . . 33 36 34 - 2 16 12 4 - - - Worked at home . . . . . . . . . . . . . 72 42 42 - - 48 6 8 - 32 2 Other means. . . . . . . . . . . . . . . 2,076 956 912 26 18 556 176 204 24 116 36 TRAVEL TIME TO WORK AND DEPARTURE TIME Current formal workforce persons 15+ years . . . . . . . . 4,546 2,204 2,144 29 31 739 317 218 20 158 26 Did not work at home . . . . . . . . . . 4,474 2,183 2,123 29 31 715 314 214 20 142 25 Less than 5 minutes. . . . . . . . . . 367 199 196 2 1 16 5 6 - 1 4 5 to 9 minutes . . . . . . . . . . . . 997 336 330 1 5 75 24 29 2 14 6 10 to 14 minutes . . . . . . . . . . . 797 433 425 3 5 64 16 25 2 17 4 15 to 19 minutes . . . . . . . . . . . 855 528 516 8 4 131 56 43 6 24 2 20 to 24 minutes . . . . . . . . . . . 325 194 194 - - 58 18 24 4 7 5 25 to 29 minutes . . . . . . . . . . . 184 93 86 - 7 51 12 29 1 7 2 30 to 44 minutes . . . . . . . . . . . 789 342 336 2 4 284 165 57 4 56 2 45 to 59 minutes . . . . . . . . . . . 112 47 29 13 5 20 5 1 1 13 - 60 or more minutes . . . . . . . . . . 48 11 11 - - 16 13 - - 3 - Mean (minutes). . . . . . . . . . . . 15.9 15.6 15.4 28.1 21.9 22.8 24.9 18.9 20.0 26.0 13.1 Worked at home . . . . . . . . . . . . . 72 21 21 - - 24 3 4 - 16 1 Current formal workforce persons 15+ years . . . . . . . . 4,546 2,204 2,144 29 31 739 317 218 20 158 26 Did not work at home . . . . . . . . . . 4,474 2,183 2,123 29 31 715 314 214 20 142 25 12:00 AM to 5:59 AM . . . . . . . . . 37 28 28 - - 3 - 1 - 2 - 6:00 AM to 6:59 AM. . . . . . . . . . 161 97 97 - - 28 1 15 4 5 3 7:00 AM to 7:29 AM. . . . . . . . . . 1,218 562 533 18 11 327 137 116 11 59 4 7:30 AM to 7:59 AM. . . . . . . . . . 2,003 982 963 9 10 287 165 47 3 63 9 8:00 AM to 8:29 AM. . . . . . . . . . 721 356 347 2 7 38 8 19 2 6 3 8:30 AM to 8:59 AM. . . . . . . . . . 88 32 32 - - 3 1 2 - - - 9:00 AM to 12:59 PM . . . . . . . . . 88 28 26 - 2 9 - 6 - 1 2 1:00 PM to 3:59 PM. . . . . . . . . . 19 17 17 - - 1 - 1 - - - 4:00 PM to 11:59 PM . . . . . . . . . 139 81 80 - 1 19 2 7 - 6 4 ──────────────────────────────────────────────────────────────────────────────────────────────────────────── Source: 2000 FSM Census
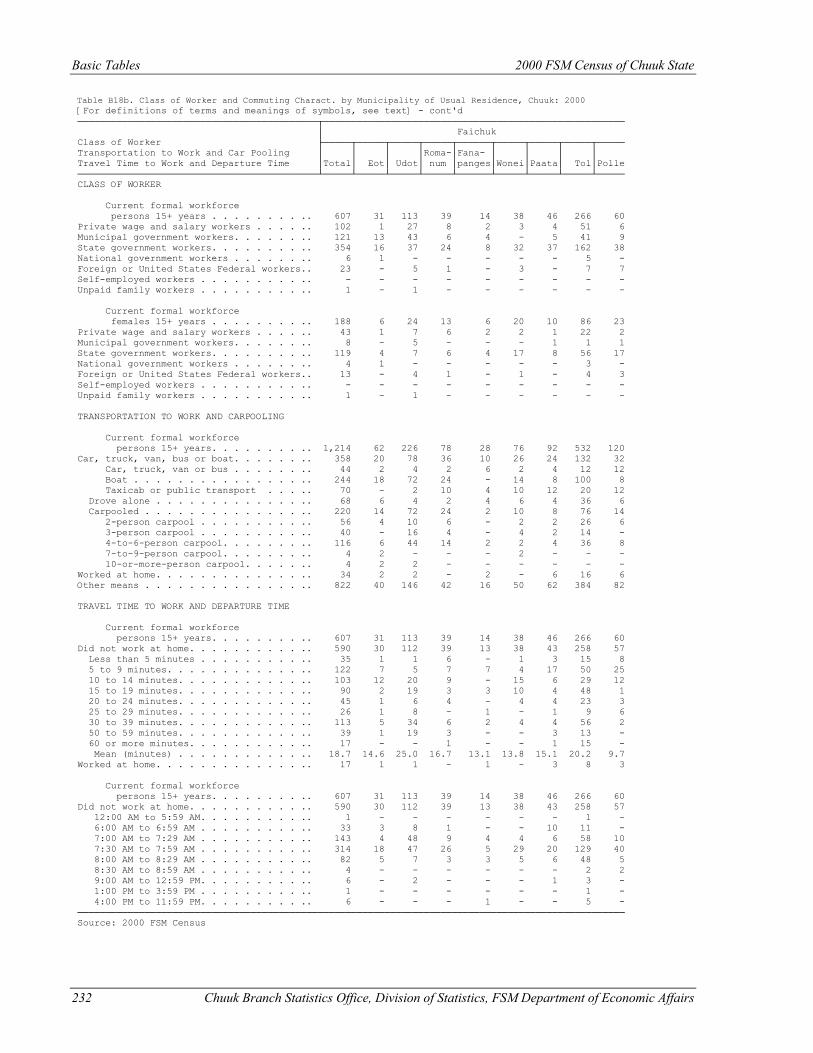
Basic Tables 2000 FSM Census of Chuuk State
232 Chuuk Branch Statistics Office, Division of Statistics, FSM Department of Economic Affairs
Table B18b. Class of Worker and Commuting Charact. by Municipality of Usual Residence, Chuuk: 2000 [For definitions of terms and meanings of symbols, see text] - cont'd ───────────────────────────────────────────┬────────────────────────────────────────────────────── │ Faichuk Class of Worker ├─────┬─────┬─────┬─────┬──────┬─────┬─────┬─────┬───── Transportation to Work and Car Pooling │ │ │ │Roma-│Fana- │ │ │ │ Travel Time to Work and Departure Time │Total│ Eot│ Udot│ num │panges│Wonei│Paata│ Tol│Polle ───────────────────────────────────────────┴─────┴─────┴─────┴─────┴──────┴─────┴─────┴─────┴───── CLASS OF WORKER Current formal workforce persons 15+ years . . . . . . . . .. 607 31 113 39 14 38 46 266 60 Private wage and salary workers . . . . .. 102 1 27 8 2 3 4 51 6 Municipal government workers. . . . . . .. 121 13 43 6 4 - 5 41 9 State government workers. . . . . . . . .. 354 16 37 24 8 32 37 162 38 National government workers . . . . . . .. 6 1 - - - - - 5 - Foreign or United States Federal workers.. 23 - 5 1 - 3 - 7 7 Self-employed workers . . . . . . . . . .. - - - - - - - - - Unpaid family workers . . . . . . . . . .. 1 - 1 - - - - - - Current formal workforce females 15+ years . . . . . . . . .. 188 6 24 13 6 20 10 86 23 Private wage and salary workers . . . . .. 43 1 7 6 2 2 1 22 2 Municipal government workers. . . . . . .. 8 - 5 - - - 1 1 1 State government workers. . . . . . . . .. 119 4 7 6 4 17 8 56 17 National government workers . . . . . . .. 4 1 - - - - - 3 - Foreign or United States Federal workers.. 13 - 4 1 - 1 - 4 3 Self-employed workers . . . . . . . . . .. - - - - - - - - - Unpaid family workers . . . . . . . . . .. 1 - 1 - - - - - - TRANSPORTATION TO WORK AND CARPOOLING Current formal workforce persons 15+ years. . . . . . . . .. 1,214 62 226 78 28 76 92 532 120 Car, truck, van, bus or boat. . . . . . .. 358 20 78 36 10 26 24 132 32 Car, truck, van or bus . . . . . . .. 44 2 4 2 6 2 4 12 12 Boat . . . . . . . . . . . . . . . .. 244 18 72 24 - 14 8 100 8 Taxicab or public transport . . . .. 70 - 2 10 4 10 12 20 12 Drove alone . . . . . . . . . . . . . .. 68 6 4 2 4 6 4 36 6 Carpooled . . . . . . . . . . . . . . .. 220 14 72 24 2 10 8 76 14 2-person carpool . . . . . . . . . .. 56 4 10 6 - 2 2 26 6 3-person carpool . . . . . . . . . .. 40 - 16 4 - 4 2 14 - 4-to-6-person carpool. . . . . . . .. 116 6 44 14 2 2 4 36 8 7-to-9-person carpool. . . . . . . .. 4 2 - - - 2 - - - 10-or-more-person carpool. . . . . .. 4 2 2 - - - - - - Worked at home. . . . . . . . . . . . . .. 34 2 2 - 2 - 6 16 6 Other means . . . . . . . . . . . . . . .. 822 40 146 42 16 50 62 384 82 TRAVEL TIME TO WORK AND DEPARTURE TIME Current formal workforce persons 15+ years. . . . . . . . .. 607 31 113 39 14 38 46 266 60 Did not work at home. . . . . . . . . . .. 590 30 112 39 13 38 43 258 57 Less than 5 minutes . . . . . . . . . .. 35 1 1 6 - 1 3 15 8 5 to 9 minutes. . . . . . . . . . . . .. 122 7 5 7 7 4 17 50 25 10 to 14 minutes. . . . . . . . . . . .. 103 12 20 9 - 15 6 29 12 15 to 19 minutes. . . . . . . . . . . .. 90 2 19 3 3 10 4 48 1 20 to 24 minutes. . . . . . . . . . . .. 45 1 6 4 - 4 4 23 3 25 to 29 minutes. . . . . . . . . . . .. 26 1 8 - 1 - 1 9 6 30 to 39 minutes. . . . . . . . . . . .. 113 5 34 6 2 4 4 56 2 50 to 59 minutes. . . . . . . . . . . .. 39 1 19 3 - - 3 13 - 60 or more minutes. . . . . . . . . . .. 17 - - 1 - - 1 15 - Mean (minutes) . . . . . . . . . . . .. 18.7 14.6 25.0 16.7 13.1 13.8 15.1 20.2 9.7 Worked at home. . . . . . . . . . . . . .. 17 1 1 - 1 - 3 8 3 Current formal workforce persons 15+ years. . . . . . . . .. 607 31 113 39 14 38 46 266 60 Did not work at home. . . . . . . . . . .. 590 30 112 39 13 38 43 258 57 12:00 AM to 5:59 AM. . . . . . . . . .. 1 - - - - - - 1 - 6:00 AM to 6:59 AM . . . . . . . . . .. 33 3 8 1 - - 10 11 - 7:00 AM to 7:29 AM . . . . . . . . . .. 143 4 48 9 4 4 6 58 10 7:30 AM to 7:59 AM . . . . . . . . . .. 314 18 47 26 5 29 20 129 40 8:00 AM to 8:29 AM . . . . . . . . . .. 82 5 7 3 3 5 6 48 5 8:30 AM to 8:59 AM . . . . . . . . . .. 4 - - - - - - 2 2 9:00 AM to 12:59 PM. . . . . . . . . .. 6 - 2 - - - 1 3 - 1:00 PM to 3:59 PM . . . . . . . . . .. 1 - - - - - - 1 - 4:00 PM to 11:59 PM. . . . . . . . . .. 6 - - - 1 - - 5 - ────────────────────────────────────────────────────────────────────────────────────────────────── Source: 2000 FSM Census
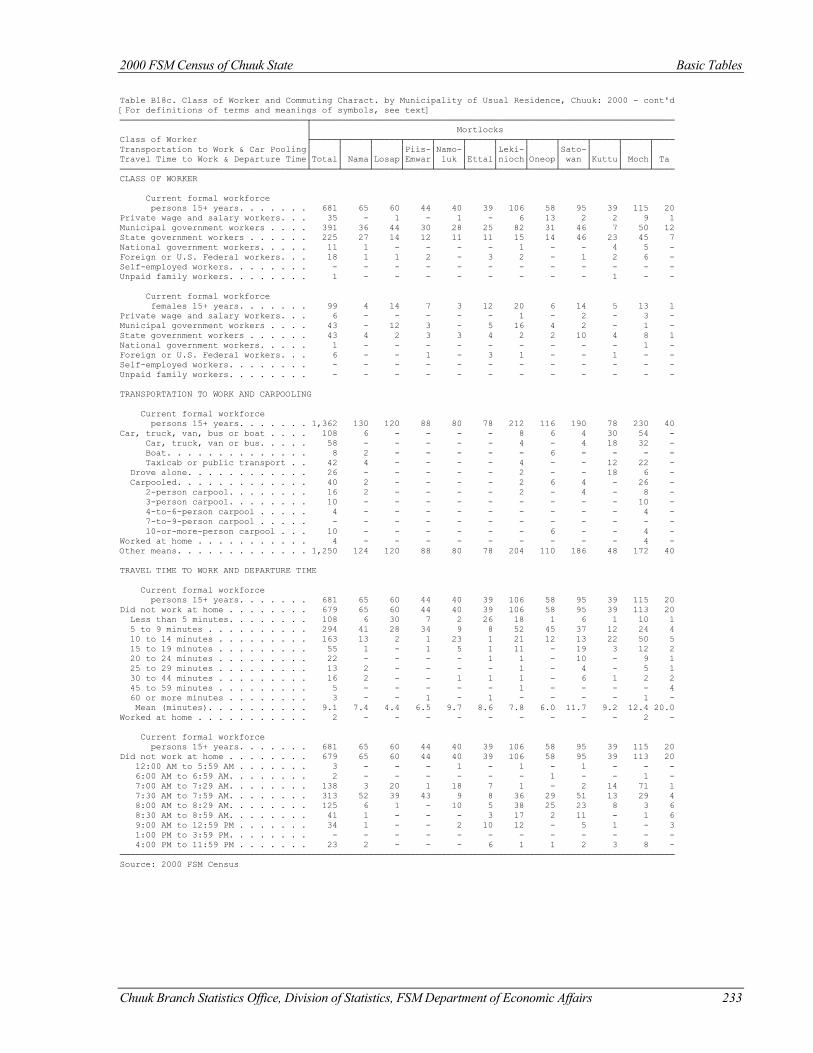
2000 FSM Census of Chuuk State Basic Tables
Chuuk Branch Statistics Office, Division of Statistics, FSM Department of Economic Affairs 233
Table B18c. Class of Worker and Commuting Charact. by Municipality of Usual Residence, Chuuk: 2000 - cont'd [For definitions of terms and meanings of symbols, see text] ────────────────────────────────────┬────────────────────────────────────────────────────────────────────── │ Mortlocks Class of Worker ├─────┬─────┬─────┬─────┬─────┬─────┬─────┬─────┬─────┬─────┬─────┬──── Transportation to Work & Car Pooling│ │ │ │Piis-│Namo-│ │Leki-│ │Sato-│ │ │ Travel Time to Work & Departure Time│Total│ Nama│Losap│Emwar│ luk │Ettal│nioch│Oneop│ wan │Kuttu│ Moch│ Ta ────────────────────────────────────┴─────┴─────┴─────┴─────┴─────┴─────┴─────┴─────┴─────┴─────┴─────┴──── CLASS OF WORKER Current formal workforce persons 15+ years. . . . . . . 681 65 60 44 40 39 106 58 95 39 115 20 Private wage and salary workers. . . 35 - 1 - 1 - 6 13 2 2 9 1 Municipal government workers . . . . 391 36 44 30 28 25 82 31 46 7 50 12 State government workers . . . . . . 225 27 14 12 11 11 15 14 46 23 45 7 National government workers. . . . . 11 1 - - - - 1 - - 4 5 - Foreign or U.S. Federal workers. . . 18 1 1 2 - 3 2 - 1 2 6 - Self-employed workers. . . . . . . . - - - - - - - - - - - - Unpaid family workers. . . . . . . . 1 - - - - - - - - 1 - - Current formal workforce females 15+ years. . . . . . . 99 4 14 7 3 12 20 6 14 5 13 1 Private wage and salary workers. . . 6 - - - - - 1 - 2 - 3 - Municipal government workers . . . . 43 - 12 3 - 5 16 4 2 - 1 - State government workers . . . . . . 43 4 2 3 3 4 2 2 10 4 8 1 National government workers. . . . . 1 - - - - - - - - - 1 - Foreign or U.S. Federal workers. . . 6 - - 1 - 3 1 - - 1 - - Self-employed workers. . . . . . . . - - - - - - - - - - - - Unpaid family workers. . . . . . . . - - - - - - - - - - - - TRANSPORTATION TO WORK AND CARPOOLING Current formal workforce persons 15+ years. . . . . . . 1,362 130 120 88 80 78 212 116 190 78 230 40 Car, truck, van, bus or boat . . . . 108 6 - - - - 8 6 4 30 54 - Car, truck, van or bus. . . . . 58 - - - - - 4 - 4 18 32 - Boat. . . . . . . . . . . . . . 8 2 - - - - - 6 - - - - Taxicab or public transport . . 42 4 - - - - 4 - - 12 22 - Drove alone. . . . . . . . . . . . 26 - - - - - 2 - - 18 6 - Carpooled. . . . . . . . . . . . . 40 2 - - - - 2 6 4 - 26 - 2-person carpool. . . . . . . . 16 2 - - - - 2 - 4 - 8 - 3-person carpool. . . . . . . . 10 - - - - - - - - - 10 - 4-to-6-person carpool . . . . . 4 - - - - - - - - - 4 - 7-to-9-person carpool . . . . . - - - - - - - - - - - - 10-or-more-person carpool . . . 10 - - - - - - 6 - - 4 - Worked at home . . . . . . . . . . . 4 - - - - - - - - - 4 - Other means. . . . . . . . . . . . . 1,250 124 120 88 80 78 204 110 186 48 172 40 TRAVEL TIME TO WORK AND DEPARTURE TIME Current formal workforce persons 15+ years. . . . . . . 681 65 60 44 40 39 106 58 95 39 115 20 Did not work at home . . . . . . . . 679 65 60 44 40 39 106 58 95 39 113 20 Less than 5 minutes. . . . . . . . 108 6 30 7 2 26 18 1 6 1 10 1 5 to 9 minutes . . . . . . . . . . 294 41 28 34 9 8 52 45 37 12 24 4 10 to 14 minutes . . . . . . . . . 163 13 2 1 23 1 21 12 13 22 50 5 15 to 19 minutes . . . . . . . . . 55 1 - 1 5 1 11 - 19 3 12 2 20 to 24 minutes . . . . . . . . . 22 - - - - 1 1 - 10 - 9 1 25 to 29 minutes . . . . . . . . . 13 2 - - - - 1 - 4 - 5 1 30 to 44 minutes . . . . . . . . . 16 2 - - 1 1 1 - 6 1 2 2 45 to 59 minutes . . . . . . . . . 5 - - - - - 1 - - - - 4 60 or more minutes . . . . . . . . 3 - - 1 - 1 - - - - 1 - Mean (minutes). . . . . . . . . . 9.1 7.4 4.4 6.5 9.7 8.6 7.8 6.0 11.7 9.2 12.4 20.0 Worked at home . . . . . . . . . . . 2 - - - - - - - - - 2 - Current formal workforce persons 15+ years. . . . . . . 681 65 60 44 40 39 106 58 95 39 115 20 Did not work at home . . . . . . . . 679 65 60 44 40 39 106 58 95 39 113 20 12:00 AM to 5:59 AM . . . . . . . 3 - - - 1 - 1 - 1 - - - 6:00 AM to 6:59 AM. . . . . . . . 2 - - - - - - 1 - - 1 - 7:00 AM to 7:29 AM. . . . . . . . 138 3 20 1 18 7 1 - 2 14 71 1 7:30 AM to 7:59 AM. . . . . . . . 313 52 39 43 9 8 36 29 51 13 29 4 8:00 AM to 8:29 AM. . . . . . . . 125 6 1 - 10 5 38 25 23 8 3 6 8:30 AM to 8:59 AM. . . . . . . . 41 1 - - - 3 17 2 11 - 1 6 9:00 AM to 12:59 PM . . . . . . . 34 1 - - 2 10 12 - 5 1 - 3 1:00 PM to 3:59 PM. . . . . . . . - - - - - - - - - - - - 4:00 PM to 11:59 PM . . . . . . . 23 2 - - - 6 1 1 2 3 8 - ─────────────────────────────────────────────────────────────────────────────────────────────────────────── Source: 2000 FSM Census
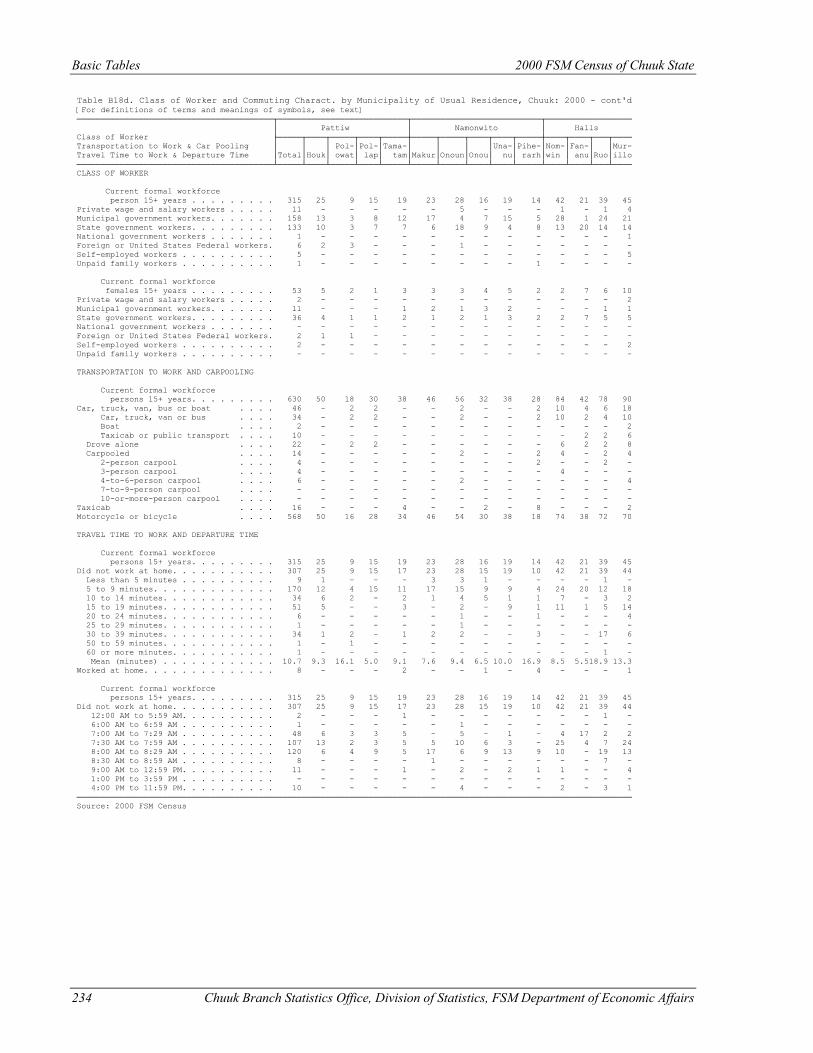
Basic Tables 2000 FSM Census of Chuuk State
234 Chuuk Branch Statistics Office, Division of Statistics, FSM Department of Economic Affairs
Table B18d. Class of Worker and Commuting Charact. by Municipality of Usual Residence, Chuuk: 2000 - cont'd [For definitions of terms and meanings of symbols, see text] ─────────────────────────────────────────┬───────────────────────────┬───────────────────────────┬────────────────── │ Pattiw │ Namonwito │ Halls Class of Worker ├─────┬────┬─────┬────┬─────┼─────┬─────┬────┬────┬─────┼────┬────┬───┬──── Transportation to Work & Car Pooling │ │ │ Pol-│Pol-│Tama-│ │ │ │Una-│Pihe-│Nom-│Fan-│ │Mur- Travel Time to Work & Departure Time │Total│Houk│ owat│ lap│ tam│Makur│Onoun│Onou│ nu│ rarh│win │ anu│Ruo│illo ─────────────────────────────────────────┴─────┴────┴─────┴────┴─────┴─────┴─────┴────┴────┴─────┴────┴────┴───┴──── CLASS OF WORKER Current formal workforce person 15+ years . . . . . . . . . 315 25 9 15 19 23 28 16 19 14 42 21 39 45 Private wage and salary workers . . . . . 11 - - - - - 5 - - - 1 - 1 4 Municipal government workers. . . . . . . 158 13 3 8 12 17 4 7 15 5 28 1 24 21 State government workers. . . . . . . . . 133 10 3 7 7 6 18 9 4 8 13 20 14 14 National government workers . . . . . . . 1 - - - - - - - - - - - - 1 Foreign or United States Federal workers. 6 2 3 - - - 1 - - - - - - - Self-employed workers . . . . . . . . . . 5 - - - - - - - - - - - - 5 Unpaid family workers . . . . . . . . . . 1 - - - - - - - - 1 - - - - Current formal workforce females 15+ years . . . . . . . . . 53 5 2 1 3 3 3 4 5 2 2 7 6 10 Private wage and salary workers . . . . . 2 - - - - - - - - - - - - 2 Municipal government workers. . . . . . . 11 - - - 1 2 1 3 2 - - - 1 1 State government workers. . . . . . . . . 36 4 1 1 2 1 2 1 3 2 2 7 5 5 National government workers . . . . . . . - - - - - - - - - - - - - - Foreign or United States Federal workers. 2 1 1 - - - - - - - - - - - Self-employed workers . . . . . . . . . . 2 - - - - - - - - - - - - 2 Unpaid family workers . . . . . . . . . . - - - - - - - - - - - - - - TRANSPORTATION TO WORK AND CARPOOLING Current formal workforce persons 15+ years. . . . . . . . . 630 50 18 30 38 46 56 32 38 28 84 42 78 90 Car, truck, van, bus or boat . . . . 46 - 2 2 - - 2 - - 2 10 4 6 18 Car, truck, van or bus . . . . 34 - 2 2 - - 2 - - 2 10 2 4 10 Boat . . . . 2 - - - - - - - - - - - - 2 Taxicab or public transport . . . . 10 - - - - - - - - - - 2 2 6 Drove alone . . . . 22 - 2 2 - - - - - - 6 2 2 8 Carpooled . . . . 14 - - - - - 2 - - 2 4 - 2 4 2-person carpool . . . . 4 - - - - - - - - 2 - - 2 - 3-person carpool . . . . 4 - - - - - - - - - 4 - - - 4-to-6-person carpool . . . . 6 - - - - - 2 - - - - - - 4 7-to-9-person carpool . . . . - - - - - - - - - - - - - - 10-or-more-person carpool . . . . - - - - - - - - - - - - - - Taxicab . . . . 16 - - - 4 - - 2 - 8 - - - 2 Motorcycle or bicycle . . . . 568 50 16 28 34 46 54 30 38 18 74 38 72 70 TRAVEL TIME TO WORK AND DEPARTURE TIME Current formal workforce persons 15+ years. . . . . . . . . 315 25 9 15 19 23 28 16 19 14 42 21 39 45 Did not work at home. . . . . . . . . . . 307 25 9 15 17 23 28 15 19 10 42 21 39 44 Less than 5 minutes . . . . . . . . . . 9 1 - - - 3 3 1 - - - - 1 - 5 to 9 minutes. . . . . . . . . . . . . 170 12 4 15 11 17 15 9 9 4 24 20 12 18 10 to 14 minutes. . . . . . . . . . . . 34 6 2 - 2 1 4 5 1 1 7 - 3 2 15 to 19 minutes. . . . . . . . . . . . 51 5 - - 3 - 2 - 9 1 11 1 5 14 20 to 24 minutes. . . . . . . . . . . . 6 - - - - - 1 - - 1 - - - 4 25 to 29 minutes. . . . . . . . . . . . 1 - - - - - 1 - - - - - - - 30 to 39 minutes. . . . . . . . . . . . 34 1 2 - 1 2 2 - - 3 - - 17 6 50 to 59 minutes. . . . . . . . . . . . 1 - 1 - - - - - - - - - - - 60 or more minutes. . . . . . . . . . . 1 - - - - - - - - - - - 1 - Mean (minutes) . . . . . . . . . . . . 10.7 9.3 16.1 5.0 9.1 7.6 9.4 6.5 10.0 16.9 8.5 5.518.9 13.3 Worked at home. . . . . . . . . . . . . . 8 - - - 2 - - 1 - 4 - - - 1 Current formal workforce persons 15+ years. . . . . . . . . 315 25 9 15 19 23 28 16 19 14 42 21 39 45 Did not work at home. . . . . . . . . . . 307 25 9 15 17 23 28 15 19 10 42 21 39 44 12:00 AM to 5:59 AM. . . . . . . . . . 2 - - - 1 - - - - - - - 1 - 6:00 AM to 6:59 AM . . . . . . . . . . 1 - - - - - 1 - - - - - - - 7:00 AM to 7:29 AM . . . . . . . . . . 48 6 3 3 5 - 5 - 1 - 4 17 2 2 7:30 AM to 7:59 AM . . . . . . . . . . 107 13 2 3 5 5 10 6 3 - 25 4 7 24 8:00 AM to 8:29 AM . . . . . . . . . . 120 6 4 9 5 17 6 9 13 9 10 - 19 13 8:30 AM to 8:59 AM . . . . . . . . . . 8 - - - - 1 - - - - - - 7 - 9:00 AM to 12:59 PM. . . . . . . . . . 11 - - - 1 - 2 - 2 1 1 - - 4 1:00 PM to 3:59 PM . . . . . . . . . . - - - - - - - - - - - - - - 4:00 PM to 11:59 PM. . . . . . . . . . 10 - - - - - 4 - - - 2 - 3 1 ──────────────────────────────────────────────────────────────────────────────────────────────────────────────────── Source: 2000 FSM Census
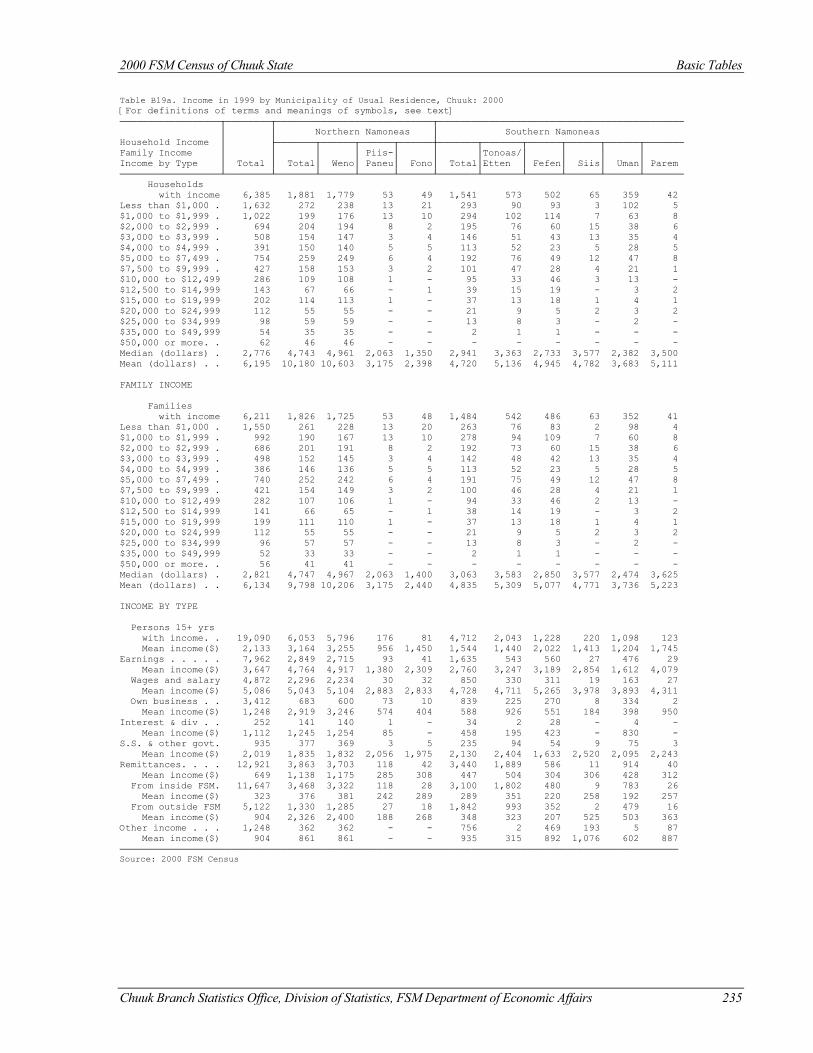
2000 FSM Census of Chuuk State Basic Tables
Chuuk Branch Statistics Office, Division of Statistics, FSM Department of Economic Affairs 235
Table B19a. Income in 1999 by Municipality of Usual Residence, Chuuk: 2000 [For definitions of terms and meanings of symbols, see text] ──────────────────┬────────┬────────────────────────────┬──────────────────────────────────────────── │ │ Northern Namoneas │ Southern Namoneas Household Income │ ├───────┬──────┬──────┬──────┼───────┬───────┬──────┬──────┬──────┬─────── Family Income │ │ │ │ Piis-│ │ │Tonoas/│ │ │ │ Income by Type │ Total │ Total│ Weno│ Paneu│ Fono│ Total│Etten │ Fefen│ Siis│ Uman│ Parem ──────────────────┴────────┴───────┴──────┴──────┴──────┴───────┴───────┴──────┴──────┴──────┴─────── Households with income 6,385 1,881 1,779 53 49 1,541 573 502 65 359 42 Less than $1,000 . 1,632 272 238 13 21 293 90 93 3 102 5 $1,000 to $1,999 . 1,022 199 176 13 10 294 102 114 7 63 8 $2,000 to $2,999 . 694 204 194 8 2 195 76 60 15 38 6 $3,000 to $3,999 . 508 154 147 3 4 146 51 43 13 35 4 $4,000 to $4,999 . 391 150 140 5 5 113 52 23 5 28 5 $5,000 to $7,499 . 754 259 249 6 4 192 76 49 12 47 8 $7,500 to $9,999 . 427 158 153 3 2 101 47 28 4 21 1 $10,000 to $12,499 286 109 108 1 - 95 33 46 3 13 - $12,500 to $14,999 143 67 66 - 1 39 15 19 - 3 2 $15,000 to $19,999 202 114 113 1 - 37 13 18 1 4 1 $20,000 to $24,999 112 55 55 - - 21 9 5 2 3 2 $25,000 to $34,999 98 59 59 - - 13 8 3 - 2 - $35,000 to $49,999 54 35 35 - - 2 1 1 - - - $50,000 or more. . 62 46 46 - - - - - - - - Median (dollars) . 2,776 4,743 4,961 2,063 1,350 2,941 3,363 2,733 3,577 2,382 3,500 Mean (dollars) . . 6,195 10,180 10,603 3,175 2,398 4,720 5,136 4,945 4,782 3,683 5,111 FAMILY INCOME Families with income 6,211 1,826 1,725 53 48 1,484 542 486 63 352 41 Less than $1,000 . 1,550 261 228 13 20 263 76 83 2 98 4 $1,000 to $1,999 . 992 190 167 13 10 278 94 109 7 60 8 $2,000 to $2,999 . 686 201 191 8 2 192 73 60 15 38 6 $3,000 to $3,999 . 498 152 145 3 4 142 48 42 13 35 4 $4,000 to $4,999 . 386 146 136 5 5 113 52 23 5 28 5 $5,000 to $7,499 . 740 252 242 6 4 191 75 49 12 47 8 $7,500 to $9,999 . 421 154 149 3 2 100 46 28 4 21 1 $10,000 to $12,499 282 107 106 1 - 94 33 46 2 13 - $12,500 to $14,999 141 66 65 - 1 38 14 19 - 3 2 $15,000 to $19,999 199 111 110 1 - 37 13 18 1 4 1 $20,000 to $24,999 112 55 55 - - 21 9 5 2 3 2 $25,000 to $34,999 96 57 57 - - 13 8 3 - 2 - $35,000 to $49,999 52 33 33 - - 2 1 1 - - - $50,000 or more. . 56 41 41 - - - - - - - - Median (dollars) . 2,821 4,747 4,967 2,063 1,400 3,063 3,583 2,850 3,577 2,474 3,625 Mean (dollars) . . 6,134 9,798 10,206 3,175 2,440 4,835 5,309 5,077 4,771 3,736 5,223 INCOME BY TYPE Persons 15+ yrs with income. . 19,090 6,053 5,796 176 81 4,712 2,043 1,228 220 1,098 123 Mean income($) 2,133 3,164 3,255 956 1,450 1,544 1,440 2,022 1,413 1,204 1,745 Earnings . . . . . 7,962 2,849 2,715 93 41 1,635 543 560 27 476 29 Mean income($) 3,647 4,764 4,917 1,380 2,309 2,760 3,247 3,189 2,854 1,612 4,079 Wages and salary 4,872 2,296 2,234 30 32 850 330 311 19 163 27 Mean income($) 5,086 5,043 5,104 2,883 2,833 4,728 4,711 5,265 3,978 3,893 4,311 Own business . . 3,412 683 600 73 10 839 225 270 8 334 2 Mean income($) 1,248 2,919 3,246 574 404 588 926 551 184 398 950 Interest & div . . 252 141 140 1 - 34 2 28 - 4 - Mean income($) 1,112 1,245 1,254 85 - 458 195 423 - 830 - S.S. & other govt. 935 377 369 3 5 235 94 54 9 75 3 Mean income($) 2,019 1,835 1,832 2,056 1,975 2,130 2,404 1,633 2,520 2,095 2,243 Remittances. . . . 12,921 3,863 3,703 118 42 3,440 1,889 586 11 914 40 Mean income($) 649 1,138 1,175 285 308 447 504 304 306 428 312 From inside FSM. 11,647 3,468 3,322 118 28 3,100 1,802 480 9 783 26 Mean income($) 323 376 381 242 289 289 351 220 258 192 257 From outside FSM 5,122 1,330 1,285 27 18 1,842 993 352 2 479 16 Mean income($) 904 2,326 2,400 188 268 348 323 207 525 503 363 Other income . . . 1,248 362 362 - - 756 2 469 193 5 87 Mean income($) 904 861 861 - - 935 315 892 1,076 602 887 ──────────────────────────────────────────────────────────────────────────────────────────────────── Source: 2000 FSM Census
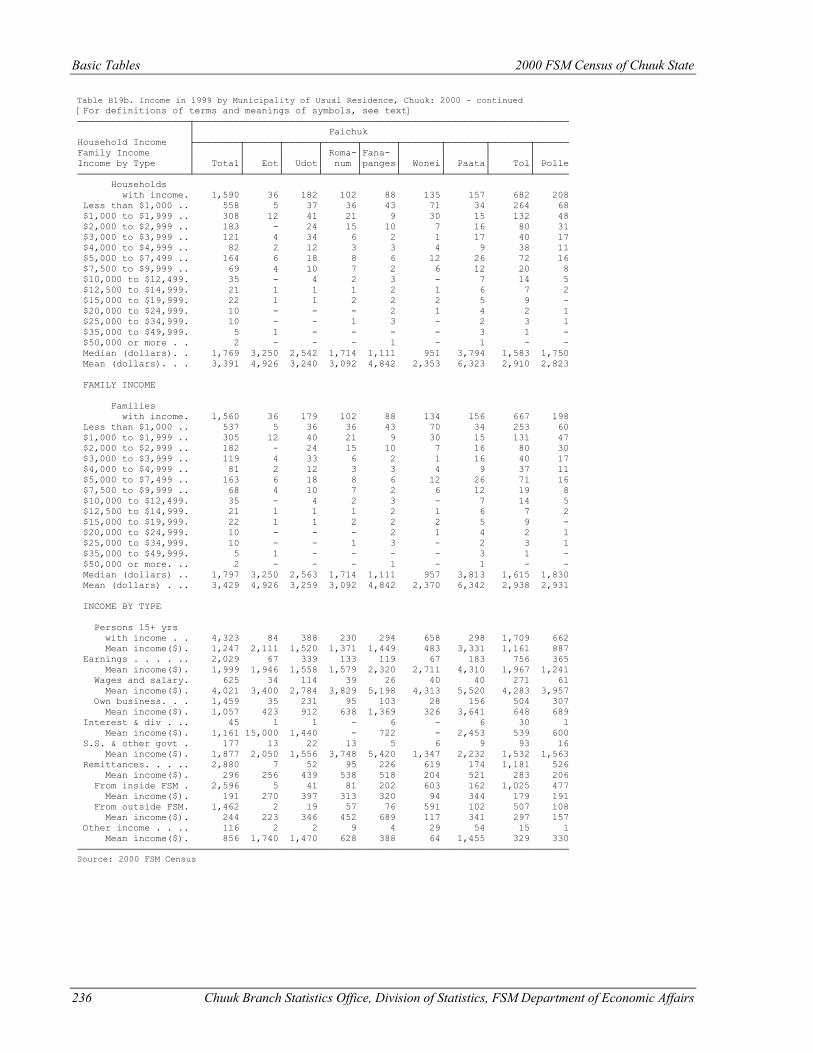
Basic Tables 2000 FSM Census of Chuuk State
236 Chuuk Branch Statistics Office, Division of Statistics, FSM Department of Economic Affairs
Table B19b. Income in 1999 by Municipality of Usual Residence, Chuuk: 2000 - continued [For definitions of terms and meanings of symbols, see text] ────────────────────┬─────────────────────────────────────────────────────────────────── │ Faichuk Household Income ├────────┬──────┬──────┬──────┬──────┬───────┬───────┬───────┬────── Family Income │ │ │ │ Roma-│Fana- │ │ │ │ Income by Type │ Total│ Eot│ Udot│ num │panges│ Wonei│ Paata│ Tol│ Polle ────────────────────┴────────┴──────┴──────┴──────┴──────┴───────┴───────┴───────┴────── Households with income. 1,590 36 182 102 88 135 157 682 208 Less than $1,000 .. 558 5 37 36 43 71 34 264 68 $1,000 to $1,999 .. 308 12 41 21 9 30 15 132 48 $2,000 to $2,999 .. 183 - 24 15 10 7 16 80 31 $3,000 to $3,999 .. 121 4 34 6 2 1 17 40 17 $4,000 to $4,999 .. 82 2 12 3 3 4 9 38 11 $5,000 to $7,499 .. 164 6 18 8 6 12 26 72 16 $7,500 to $9,999 .. 69 4 10 7 2 6 12 20 8 $10,000 to $12,499. 35 - 4 2 3 - 7 14 5 $12,500 to $14,999. 21 1 1 1 2 1 6 7 2 $15,000 to $19,999. 22 1 1 2 2 2 5 9 - $20,000 to $24,999. 10 - - - 2 1 4 2 1 $25,000 to $34,999. 10 - - 1 3 - 2 3 1 $35,000 to $49,999. 5 1 - - - - 3 1 - $50,000 or more . . 2 - - - 1 - 1 - - Median (dollars). . 1,769 3,250 2,542 1,714 1,111 951 3,794 1,583 1,750 Mean (dollars). . . 3,391 4,926 3,240 3,092 4,842 2,353 6,323 2,910 2,823 FAMILY INCOME Families with income. 1,560 36 179 102 88 134 156 667 198 Less than $1,000 .. 537 5 36 36 43 70 34 253 60 $1,000 to $1,999 .. 305 12 40 21 9 30 15 131 47 $2,000 to $2,999 .. 182 - 24 15 10 7 16 80 30 $3,000 to $3,999 .. 119 4 33 6 2 1 16 40 17 $4,000 to $4,999 .. 81 2 12 3 3 4 9 37 11 $5,000 to $7,499 .. 163 6 18 8 6 12 26 71 16 $7,500 to $9,999 .. 68 4 10 7 2 6 12 19 8 $10,000 to $12,499. 35 - 4 2 3 - 7 14 5 $12,500 to $14,999. 21 1 1 1 2 1 6 7 2 $15,000 to $19,999. 22 1 1 2 2 2 5 9 - $20,000 to $24,999. 10 - - - 2 1 4 2 1 $25,000 to $34,999. 10 - - 1 3 - 2 3 1 $35,000 to $49,999. 5 1 - - - - 3 1 - $50,000 or more. .. 2 - - - 1 - 1 - - Median (dollars) .. 1,797 3,250 2,563 1,714 1,111 957 3,813 1,615 1,830 Mean (dollars) . .. 3,429 4,926 3,259 3,092 4,842 2,370 6,342 2,938 2,931 INCOME BY TYPE Persons 15+ yrs with income . . 4,323 84 388 230 294 658 298 1,709 662 Mean income($). 1,247 2,111 1,520 1,371 1,449 483 3,331 1,161 887 Earnings . . . . .. 2,029 67 339 133 119 67 183 756 365 Mean income($). 1,999 1,946 1,558 1,579 2,320 2,711 4,310 1,967 1,241 Wages and salary. 625 34 114 39 26 40 40 271 61 Mean income($). 4,021 3,400 2,784 3,829 5,198 4,313 5,520 4,283 3,957 Own business. . . 1,459 35 231 95 103 28 156 504 307 Mean income($). 1,057 423 912 638 1,369 326 3,641 648 689 Interest & div . .. 45 1 1 - 6 - 6 30 1 Mean income($). 1,161 15,000 1,440 - 722 - 2,453 539 600 S.S. & other govt . 177 13 22 13 5 6 9 93 16 Mean income($). 1,877 2,050 1,556 3,748 5,420 1,347 2,232 1,532 1,563 Remittances. . . .. 2,880 7 52 95 226 619 174 1,181 526 Mean income($). 296 256 439 538 518 204 521 283 206 From inside FSM . 2,596 5 41 81 202 603 162 1,025 477 Mean income($). 191 270 397 313 320 94 344 179 191 From outside FSM. 1,462 2 19 57 76 591 102 507 108 Mean income($). 244 223 346 452 689 117 341 297 157 Other income . . .. 116 2 2 9 4 29 54 15 1 Mean income($). 856 1,740 1,470 628 388 64 1,455 329 330 ──────────────────────────────────────────────────────────────────────────────────────── Source: 2000 FSM Census
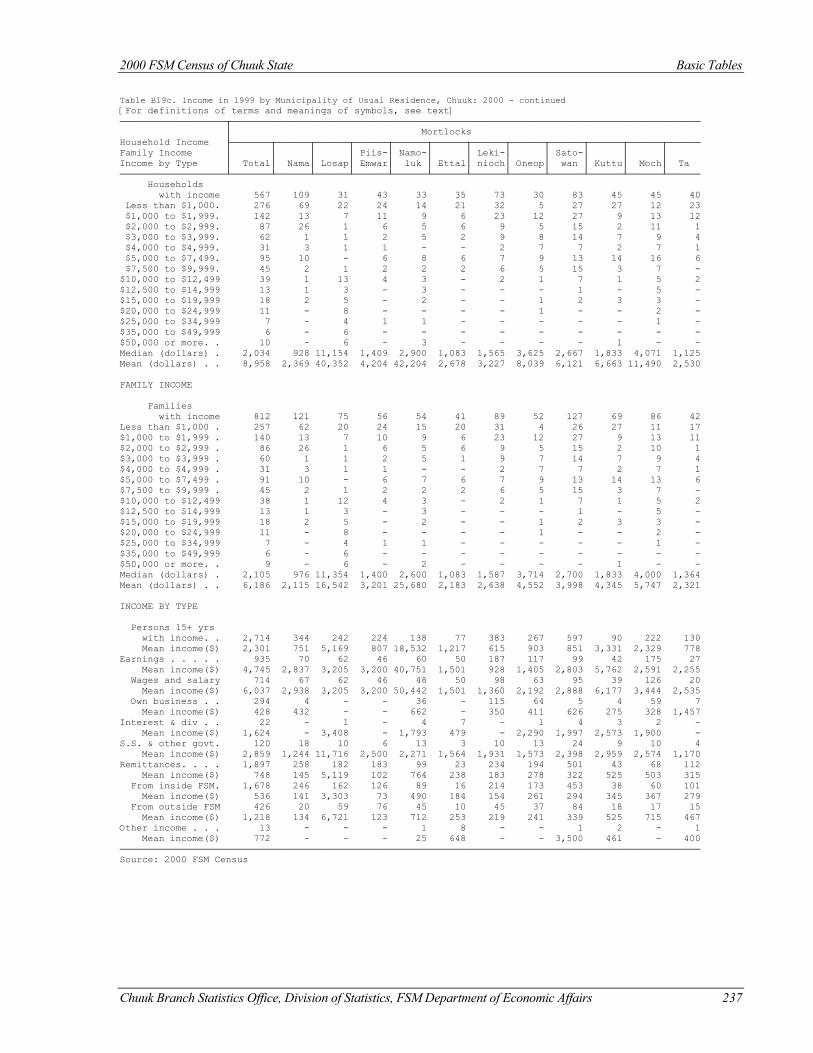
2000 FSM Census of Chuuk State Basic Tables
Chuuk Branch Statistics Office, Division of Statistics, FSM Department of Economic Affairs 237
Table B19c. Income in 1999 by Municipality of Usual Residence, Chuuk: 2000 - continued [For definitions of terms and meanings of symbols, see text] ───────────────────┬──────────────────────────────────────────────────────────────────────────────────── │ Mortlocks Household Income ├───────┬──────┬──────┬──────┬──────┬──────┬──────┬──────┬──────┬──────┬──────┬────── Family Income │ │ │ │ Piis-│ Namo-│ │ Leki-│ │ Sato-│ │ │ Income by Type │ Total│ Nama│ Losap│ Emwar│ luk │ Ettal│ nioch│ Oneop│ wan │ Kuttu│ Moch│ Ta ───────────────────┴───────┴──────┴──────┴──────┴──────┴──────┴──────┴──────┴──────┴──────┴──────┴────── Households with income 567 109 31 43 33 35 73 30 83 45 45 40 Less than $1,000. 276 69 22 24 14 21 32 5 27 27 12 23 $1,000 to $1,999. 142 13 7 11 9 6 23 12 27 9 13 12 $2,000 to $2,999. 87 26 1 6 5 6 9 5 15 2 11 1 $3,000 to $3,999. 62 1 1 2 5 2 9 8 14 7 9 4 $4,000 to $4,999. 31 3 1 1 - - 2 7 7 2 7 1 $5,000 to $7,499. 95 10 - 6 8 6 7 9 13 14 16 6 $7,500 to $9,999. 45 2 1 2 2 2 6 5 15 3 7 - $10,000 to $12,499 39 1 13 4 3 - 2 1 7 1 5 2 $12,500 to $14,999 13 1 3 - 3 - - - 1 - 5 - $15,000 to $19,999 18 2 5 - 2 - - 1 2 3 3 - $20,000 to $24,999 11 - 8 - - - - 1 - - 2 - $25,000 to $34,999 7 - 4 1 1 - - - - - 1 - $35,000 to $49,999 6 - 6 - - - - - - - - - $50,000 or more. . 10 - 6 - 3 - - - - 1 - - Median (dollars) . 2,034 928 11,154 1,409 2,900 1,083 1,565 3,625 2,667 1,833 4,071 1,125 Mean (dollars) . . 8,958 2,369 40,352 4,204 42,204 2,678 3,227 8,039 6,121 6,663 11,490 2,530 FAMILY INCOME Families with income 812 121 75 56 54 41 89 52 127 69 86 42 Less than $1,000 . 257 62 20 24 15 20 31 4 26 27 11 17 $1,000 to $1,999 . 140 13 7 10 9 6 23 12 27 9 13 11 $2,000 to $2,999 . 86 26 1 6 5 6 9 5 15 2 10 1 $3,000 to $3,999 . 60 1 1 2 5 1 9 7 14 7 9 4 $4,000 to $4,999 . 31 3 1 1 - - 2 7 7 2 7 1 $5,000 to $7,499 . 91 10 - 6 7 6 7 9 13 14 13 6 $7,500 to $9,999 . 45 2 1 2 2 2 6 5 15 3 7 - $10,000 to $12,499 38 1 12 4 3 - 2 1 7 1 5 2 $12,500 to $14,999 13 1 3 - 3 - - - 1 - 5 - $15,000 to $19,999 18 2 5 - 2 - - 1 2 3 3 - $20,000 to $24,999 11 - 8 - - - - 1 - - 2 - $25,000 to $34,999 7 - 4 1 1 - - - - - 1 - $35,000 to $49,999 6 - 6 - - - - - - - - - $50,000 or more. . 9 - 6 - 2 - - - - 1 - - Median (dollars) . 2,105 976 11,354 1,400 2,600 1,083 1,587 3,714 2,700 1,833 4,000 1,364 Mean (dollars) . . 6,186 2,115 16,542 3,201 25,680 2,183 2,638 4,552 3,998 4,345 5,747 2,321 INCOME BY TYPE Persons 15+ yrs with income. . 2,714 344 242 224 138 77 383 267 597 90 222 130 Mean income($) 2,301 751 5,169 807 18,532 1,217 615 903 851 3,331 2,329 778 Earnings . . . . . 935 70 62 46 60 50 187 117 99 42 175 27 Mean income($) 4,745 2,837 3,205 3,200 40,751 1,501 928 1,405 2,803 5,762 2,591 2,255 Wages and salary 714 67 62 46 48 50 98 63 95 39 126 20 Mean income($) 6,037 2,938 3,205 3,200 50,442 1,501 1,360 2,192 2,888 6,177 3,444 2,535 Own business . . 294 4 - - 36 - 115 64 5 4 59 7 Mean income($) 428 432 - - 662 - 350 411 626 275 328 1,457 Interest & div . . 22 - 1 - 4 7 - 1 4 3 2 - Mean income($) 1,624 - 3,408 - 1,793 479 - 2,290 1,997 2,573 1,900 - S.S. & other govt. 120 18 10 6 13 3 10 13 24 9 10 4 Mean income($) 2,859 1,244 11,716 2,500 2,271 1,564 1,931 1,573 2,398 2,959 2,574 1,170 Remittances. . . . 1,897 258 182 183 99 23 234 194 501 43 68 112 Mean income($) 748 145 5,119 102 764 238 183 278 322 525 503 315 From inside FSM. 1,678 246 162 126 89 16 214 173 453 38 60 101 Mean income($) 536 141 3,303 73 490 184 154 261 294 345 367 279 From outside FSM 426 20 59 76 45 10 45 37 84 18 17 15 Mean income($) 1,218 134 6,721 123 712 253 219 241 339 525 715 467 Other income . . . 13 - - - 1 8 - - 1 2 - 1 Mean income($) 772 - - - 25 648 - - 3,500 461 - 400 ──────────────────────────────────────────────────────────────────────────────────────────────────────── Source: 2000 FSM Census
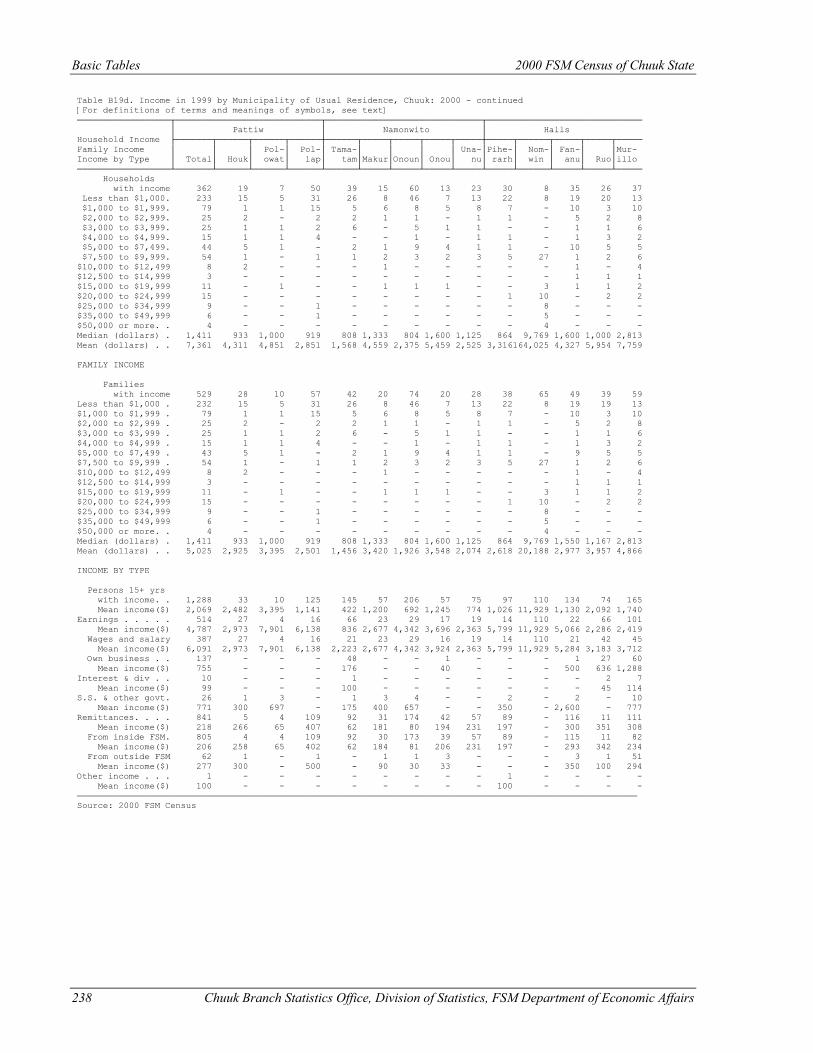
Basic Tables 2000 FSM Census of Chuuk State
238 Chuuk Branch Statistics Office, Division of Statistics, FSM Department of Economic Affairs
Table B19d. Income in 1999 by Municipality of Usual Residence, Chuuk: 2000 - continued [For definitions of terms and meanings of symbols, see text] ──────────────────┬────────────────────────────┬──────────────────────────────┬────────────────────────────── │ Pattiw │ Namonwito │ Halls Household Income ├───────┬──────┬──────┬──────┼──────┬─────┬─────┬─────┬─────┼─────┬──────┬─────┬─────┬───── Family Income │ │ │ Pol-│ Pol-│ Tama-│ │ │ │ Una-│Pihe-│ Nom-│ Fan-│ │Mur- Income by Type │ Total│ Houk│ owat│ lap│ tam│Makur│Onoun│ Onou│ nu│ rarh│ win │ anu│ Ruo│illo ──────────────────┴───────┴──────┴──────┴──────┴──────┴─────┴─────┴─────┴─────┴─────┴──────┴─────┴─────┴───── Households with income 362 19 7 50 39 15 60 13 23 30 8 35 26 37 Less than $1,000. 233 15 5 31 26 8 46 7 13 22 8 19 20 13 $1,000 to $1,999. 79 1 1 15 5 6 8 5 8 7 - 10 3 10 $2,000 to $2,999. 25 2 - 2 2 1 1 - 1 1 - 5 2 8 $3,000 to $3,999. 25 1 1 2 6 - 5 1 1 - - 1 1 6 $4,000 to $4,999. 15 1 1 4 - - 1 - 1 1 - 1 3 2 $5,000 to $7,499. 44 5 1 - 2 1 9 4 1 1 - 10 5 5 $7,500 to $9,999. 54 1 - 1 1 2 3 2 3 5 27 1 2 6 $10,000 to $12,499 8 2 - - - 1 - - - - - 1 - 4 $12,500 to $14,999 3 - - - - - - - - - - 1 1 1 $15,000 to $19,999 11 - 1 - - 1 1 1 - - 3 1 1 2 $20,000 to $24,999 15 - - - - - - - - 1 10 - 2 2 $25,000 to $34,999 9 - - 1 - - - - - - 8 - - - $35,000 to $49,999 6 - - 1 - - - - - - 5 - - - $50,000 or more. . 4 - - - - - - - - - 4 - - - Median (dollars) . 1,411 933 1,000 919 808 1,333 804 1,600 1,125 864 9,769 1,600 1,000 2,813 Mean (dollars) . . 7,361 4,311 4,851 2,851 1,568 4,559 2,375 5,459 2,525 3,316164,025 4,327 5,954 7,759 FAMILY INCOME Families with income 529 28 10 57 42 20 74 20 28 38 65 49 39 59 Less than $1,000 . 232 15 5 31 26 8 46 7 13 22 8 19 19 13 $1,000 to $1,999 . 79 1 1 15 5 6 8 5 8 7 - 10 3 10 $2,000 to $2,999 . 25 2 - 2 2 1 1 - 1 1 - 5 2 8 $3,000 to $3,999 . 25 1 1 2 6 - 5 1 1 - - 1 1 6 $4,000 to $4,999 . 15 1 1 4 - - 1 - 1 1 - 1 3 2 $5,000 to $7,499 . 43 5 1 - 2 1 9 4 1 1 - 9 5 5 $7,500 to $9,999 . 54 1 - 1 1 2 3 2 3 5 27 1 2 6 $10,000 to $12,499 8 2 - - - 1 - - - - - 1 - 4 $12,500 to $14,999 3 - - - - - - - - - - 1 1 1 $15,000 to $19,999 11 - 1 - - 1 1 1 - - 3 1 1 2 $20,000 to $24,999 15 - - - - - - - - 1 10 - 2 2 $25,000 to $34,999 9 - - 1 - - - - - - 8 - - - $35,000 to $49,999 6 - - 1 - - - - - - 5 - - - $50,000 or more. . 4 - - - - - - - - - 4 - - - Median (dollars) . 1,411 933 1,000 919 808 1,333 804 1,600 1,125 864 9,769 1,550 1,167 2,813 Mean (dollars) . . 5,025 2,925 3,395 2,501 1,456 3,420 1,926 3,548 2,074 2,618 20,188 2,977 3,957 4,866 INCOME BY TYPE Persons 15+ yrs with income. . 1,288 33 10 125 145 57 206 57 75 97 110 134 74 165 Mean income($) 2,069 2,482 3,395 1,141 422 1,200 692 1,245 774 1,026 11,929 1,130 2,092 1,740 Earnings . . . . . 514 27 4 16 66 23 29 17 19 14 110 22 66 101 Mean income($) 4,787 2,973 7,901 6,138 836 2,677 4,342 3,696 2,363 5,799 11,929 5,066 2,286 2,419 Wages and salary 387 27 4 16 21 23 29 16 19 14 110 21 42 45 Mean income($) 6,091 2,973 7,901 6,138 2,223 2,677 4,342 3,924 2,363 5,799 11,929 5,284 3,183 3,712 Own business . . 137 - - - 48 - - 1 - - - 1 27 60 Mean income($) 755 - - - 176 - - 40 - - - 500 636 1,288 Interest & div . . 10 - - - 1 - - - - - - - 2 7 Mean income($) 99 - - - 100 - - - - - - - 45 114 S.S. & other govt. 26 1 3 - 1 3 4 - - 2 - 2 - 10 Mean income($) 771 300 697 - 175 400 657 - - 350 - 2,600 - 777 Remittances. . . . 841 5 4 109 92 31 174 42 57 89 - 116 11 111 Mean income($) 218 266 65 407 62 181 80 194 231 197 - 300 351 308 From inside FSM. 805 4 4 109 92 30 173 39 57 89 - 115 11 82 Mean income($) 206 258 65 402 62 184 81 206 231 197 - 293 342 234 From outside FSM 62 1 - 1 - 1 1 3 - - - 3 1 51 Mean income($) 277 300 - 500 - 90 30 33 - - - 350 100 294 Other income . . . 1 - - - - - - - - 1 - - - - Mean income($) 100 - - - - - - - - 100 - - - - ──────────────────────────────────────────────────────────────────────────────────────────────────────────── Source: 2000 FSM Census
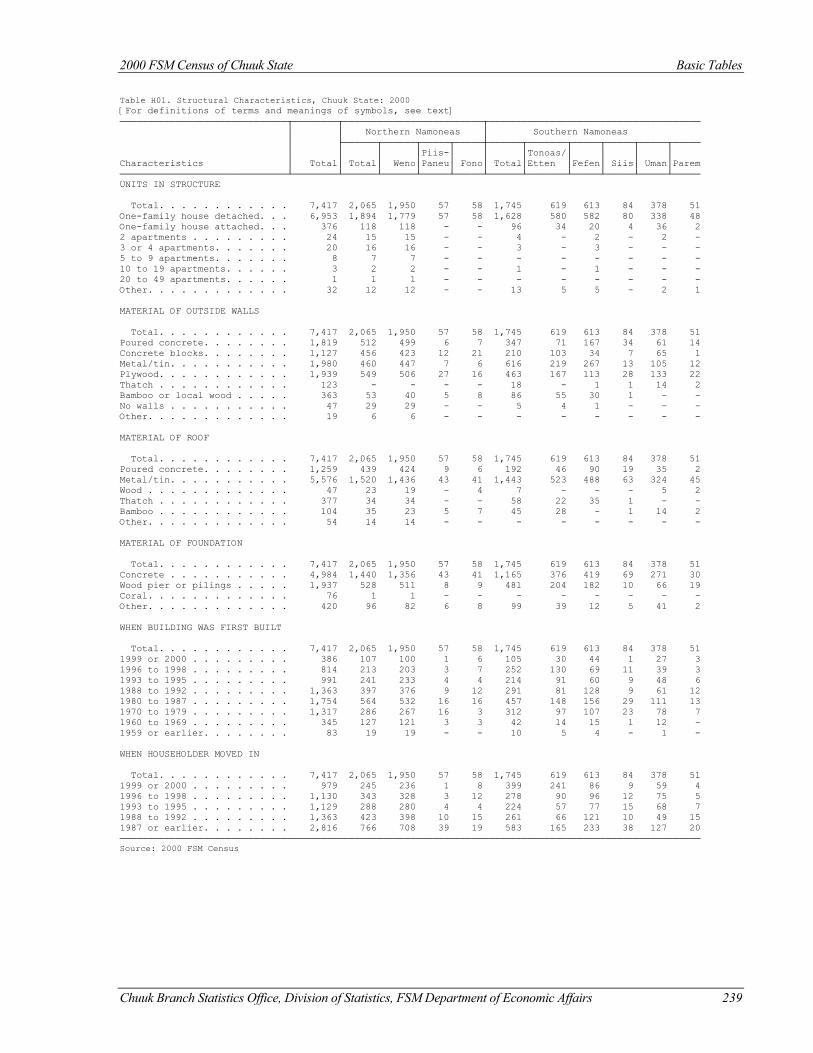
2000 FSM Census of Chuuk State Basic Tables
Chuuk Branch Statistics Office, Division of Statistics, FSM Department of Economic Affairs 239
Table H01. Structural Characteristics, Chuuk State: 2000 [For definitions of terms and meanings of symbols, see text] ──────────────────────────────┬────────┬─────────────────────────┬────────────────────────────────────── │ │ Northern Namoneas │ Southern Namoneas │ ├──────┬──────┬─────┬─────┼──────┬───────┬─────┬─────┬─────┬───── │ │ │ │Piis-│ │ │Tonoas/│ │ │ │ Characteristics │ Total│ Total│ Weno│Paneu│ Fono│ Total│Etten │Fefen│ Siis│ Uman│Parem ──────────────────────────────┴────────┴──────┴──────┴─────┴─────┴──────┴───────┴─────┴─────┴─────┴───── UNITS IN STRUCTURE Total. . . . . . . . . . . . 7,417 2,065 1,950 57 58 1,745 619 613 84 378 51 One-family house detached. . . 6,953 1,894 1,779 57 58 1,628 580 582 80 338 48 One-family house attached. . . 376 118 118 - - 96 34 20 4 36 2 2 apartments . . . . . . . . . 24 15 15 - - 4 - 2 - 2 - 3 or 4 apartments. . . . . . . 20 16 16 - - 3 - 3 - - - 5 to 9 apartments. . . . . . . 8 7 7 - - - - - - - - 10 to 19 apartments. . . . . . 3 2 2 - - 1 - 1 - - - 20 to 49 apartments. . . . . . 1 1 1 - - - - - - - - Other. . . . . . . . . . . . . 32 12 12 - - 13 5 5 - 2 1 MATERIAL OF OUTSIDE WALLS Total. . . . . . . . . . . . 7,417 2,065 1,950 57 58 1,745 619 613 84 378 51 Poured concrete. . . . . . . . 1,819 512 499 6 7 347 71 167 34 61 14 Concrete blocks. . . . . . . . 1,127 456 423 12 21 210 103 34 7 65 1 Metal/tin. . . . . . . . . . . 1,980 460 447 7 6 616 219 267 13 105 12 Plywood. . . . . . . . . . . . 1,939 549 506 27 16 463 167 113 28 133 22 Thatch . . . . . . . . . . . . 123 - - - - 18 - 1 1 14 2 Bamboo or local wood . . . . . 363 53 40 5 8 86 55 30 1 - - No walls . . . . . . . . . . . 47 29 29 - - 5 4 1 - - - Other. . . . . . . . . . . . . 19 6 6 - - - - - - - - MATERIAL OF ROOF Total. . . . . . . . . . . . 7,417 2,065 1,950 57 58 1,745 619 613 84 378 51 Poured concrete. . . . . . . . 1,259 439 424 9 6 192 46 90 19 35 2 Metal/tin. . . . . . . . . . . 5,576 1,520 1,436 43 41 1,443 523 488 63 324 45 Wood . . . . . . . . . . . . . 47 23 19 - 4 7 - - - 5 2 Thatch . . . . . . . . . . . . 377 34 34 - - 58 22 35 1 - - Bamboo . . . . . . . . . . . . 104 35 23 5 7 45 28 - 1 14 2 Other. . . . . . . . . . . . . 54 14 14 - - - - - - - - MATERIAL OF FOUNDATION Total. . . . . . . . . . . . 7,417 2,065 1,950 57 58 1,745 619 613 84 378 51 Concrete . . . . . . . . . . . 4,984 1,440 1,356 43 41 1,165 376 419 69 271 30 Wood pier or pilings . . . . . 1,937 528 511 8 9 481 204 182 10 66 19 Coral. . . . . . . . . . . . . 76 1 1 - - - - - - - - Other. . . . . . . . . . . . . 420 96 82 6 8 99 39 12 5 41 2 WHEN BUILDING WAS FIRST BUILT Total. . . . . . . . . . . . 7,417 2,065 1,950 57 58 1,745 619 613 84 378 51 1999 or 2000 . . . . . . . . . 386 107 100 1 6 105 30 44 1 27 3 1996 to 1998 . . . . . . . . . 814 213 203 3 7 252 130 69 11 39 3 1993 to 1995 . . . . . . . . . 991 241 233 4 4 214 91 60 9 48 6 1988 to 1992 . . . . . . . . . 1,363 397 376 9 12 291 81 128 9 61 12 1980 to 1987 . . . . . . . . . 1,754 564 532 16 16 457 148 156 29 111 13 1970 to 1979 . . . . . . . . . 1,317 286 267 16 3 312 97 107 23 78 7 1960 to 1969 . . . . . . . . . 345 127 121 3 3 42 14 15 1 12 - 1959 or earlier. . . . . . . . 83 19 19 - - 10 5 4 - 1 - WHEN HOUSEHOLDER MOVED IN Total. . . . . . . . . . . . 7,417 2,065 1,950 57 58 1,745 619 613 84 378 51 1999 or 2000 . . . . . . . . . 979 245 236 1 8 399 241 86 9 59 4 1996 to 1998 . . . . . . . . . 1,130 343 328 3 12 278 90 96 12 75 5 1993 to 1995 . . . . . . . . . 1,129 288 280 4 4 224 57 77 15 68 7 1988 to 1992 . . . . . . . . . 1,363 423 398 10 15 261 66 121 10 49 15 1987 or earlier. . . . . . . . 2,816 766 708 39 19 583 165 233 38 127 20 ──────────────────────────────────────────────────────────────────────────────────────────────────────── Source: 2000 FSM Census
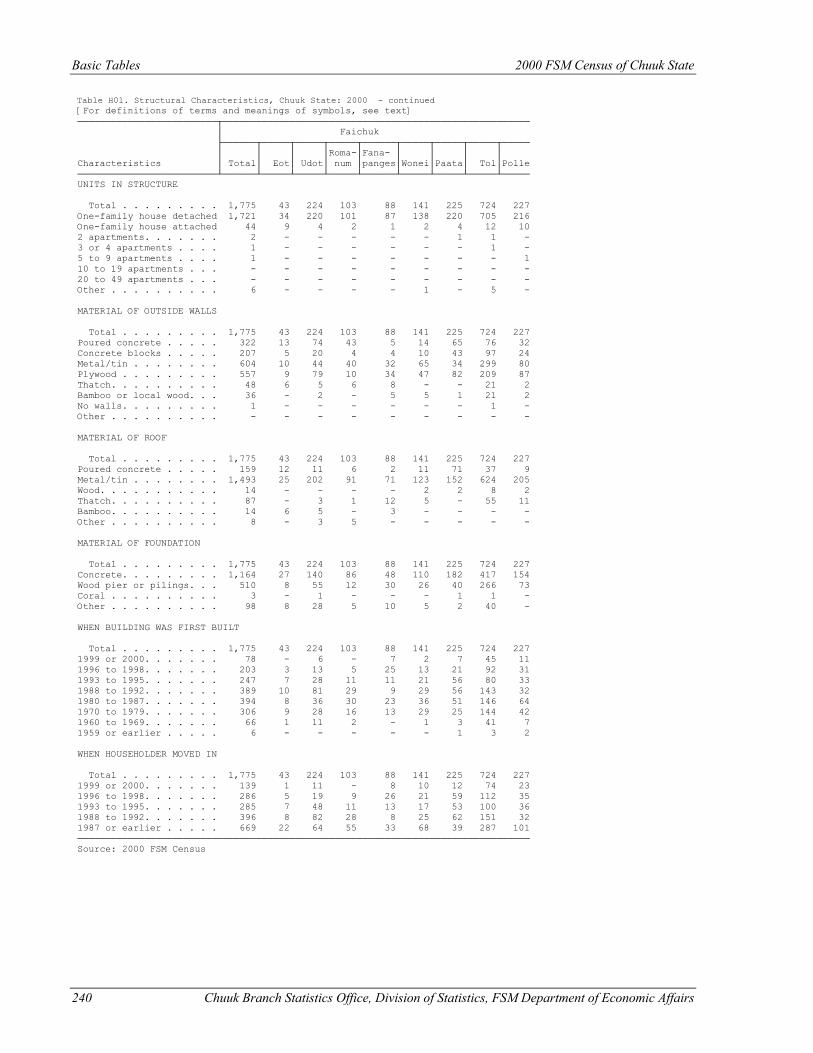
Basic Tables 2000 FSM Census of Chuuk State
240 Chuuk Branch Statistics Office, Division of Statistics, FSM Department of Economic Affairs
Table H01. Structural Characteristics, Chuuk State: 2000 - continued [For definitions of terms and meanings of symbols, see text] ─────────────────────────┬─────────────────────────────────────────────────────── │ Faichuk ├──────┬─────┬─────┬─────┬──────┬─────┬─────┬─────┬───── │ │ │ │Roma-│Fana- │ │ │ │ Characteristics │ Total│ Eot│ Udot│ num │panges│Wonei│Paata│ Tol│Polle ─────────────────────────┴──────┴─────┴─────┴─────┴──────┴─────┴─────┴─────┴───── UNITS IN STRUCTURE Total . . . . . . . . . 1,775 43 224 103 88 141 225 724 227 One-family house detached 1,721 34 220 101 87 138 220 705 216 One-family house attached 44 9 4 2 1 2 4 12 10 2 apartments. . . . . . . 2 - - - - - 1 1 - 3 or 4 apartments . . . . 1 - - - - - - 1 - 5 to 9 apartments . . . . 1 - - - - - - - 1 10 to 19 apartments . . . - - - - - - - - - 20 to 49 apartments . . . - - - - - - - - - Other . . . . . . . . . . 6 - - - - 1 - 5 - MATERIAL OF OUTSIDE WALLS Total . . . . . . . . . 1,775 43 224 103 88 141 225 724 227 Poured concrete . . . . . 322 13 74 43 5 14 65 76 32 Concrete blocks . . . . . 207 5 20 4 4 10 43 97 24 Metal/tin . . . . . . . . 604 10 44 40 32 65 34 299 80 Plywood . . . . . . . . . 557 9 79 10 34 47 82 209 87 Thatch. . . . . . . . . . 48 6 5 6 8 - - 21 2 Bamboo or local wood. . . 36 - 2 - 5 5 1 21 2 No walls. . . . . . . . . 1 - - - - - - 1 - Other . . . . . . . . . . - - - - - - - - - MATERIAL OF ROOF Total . . . . . . . . . 1,775 43 224 103 88 141 225 724 227 Poured concrete . . . . . 159 12 11 6 2 11 71 37 9 Metal/tin . . . . . . . . 1,493 25 202 91 71 123 152 624 205 Wood. . . . . . . . . . . 14 - - - - 2 2 8 2 Thatch. . . . . . . . . . 87 - 3 1 12 5 - 55 11 Bamboo. . . . . . . . . . 14 6 5 - 3 - - - - Other . . . . . . . . . . 8 - 3 5 - - - - - MATERIAL OF FOUNDATION Total . . . . . . . . . 1,775 43 224 103 88 141 225 724 227 Concrete. . . . . . . . . 1,164 27 140 86 48 110 182 417 154 Wood pier or pilings. . . 510 8 55 12 30 26 40 266 73 Coral . . . . . . . . . . 3 - 1 - - - 1 1 - Other . . . . . . . . . . 98 8 28 5 10 5 2 40 - WHEN BUILDING WAS FIRST BUILT Total . . . . . . . . . 1,775 43 224 103 88 141 225 724 227 1999 or 2000. . . . . . . 78 - 6 - 7 2 7 45 11 1996 to 1998. . . . . . . 203 3 13 5 25 13 21 92 31 1993 to 1995. . . . . . . 247 7 28 11 11 21 56 80 33 1988 to 1992. . . . . . . 389 10 81 29 9 29 56 143 32 1980 to 1987. . . . . . . 394 8 36 30 23 36 51 146 64 1970 to 1979. . . . . . . 306 9 28 16 13 29 25 144 42 1960 to 1969. . . . . . . 66 1 11 2 - 1 3 41 7 1959 or earlier . . . . . 6 - - - - - 1 3 2 WHEN HOUSEHOLDER MOVED IN Total . . . . . . . . . 1,775 43 224 103 88 141 225 724 227 1999 or 2000. . . . . . . 139 1 11 - 8 10 12 74 23 1996 to 1998. . . . . . . 286 5 19 9 26 21 59 112 35 1993 to 1995. . . . . . . 285 7 48 11 13 17 53 100 36 1988 to 1992. . . . . . . 396 8 82 28 8 25 62 151 32 1987 or earlier . . . . . 669 22 64 55 33 68 39 287 101 ───────────────────────────────────────────────────────────────────────────────── Source: 2000 FSM Census
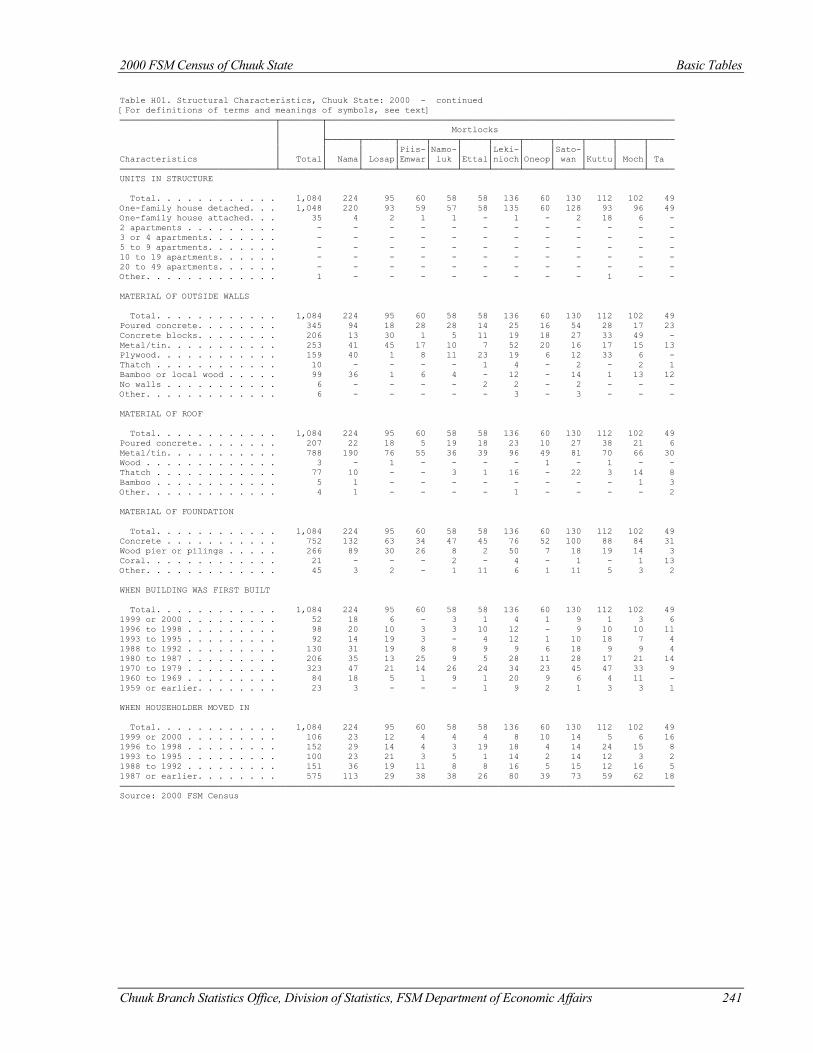
2000 FSM Census of Chuuk State Basic Tables
Chuuk Branch Statistics Office, Division of Statistics, FSM Department of Economic Affairs 241
Table H01. Structural Characteristics, Chuuk State: 2000 - continued [For definitions of terms and meanings of symbols, see text] ──────────────────────────────┬────────┬─────────────────────────────────────────────────────────────────── │ │ Mortlocks │ ├──────┬──────┬─────┬─────┬─────┬─────┬─────┬─────┬─────┬─────┬───── │ │ │ │Piis-│Namo-│ │Leki-│ │Sato-│ │ │ Characteristics │ Total│ Nama│ Losap│Emwar│ luk │Ettal│nioch│Oneop│ wan │Kuttu│ Moch│ Ta ──────────────────────────────┴────────┴──────┴──────┴─────┴─────┴─────┴─────┴─────┴─────┴─────┴─────┴───── UNITS IN STRUCTURE Total. . . . . . . . . . . . 1,084 224 95 60 58 58 136 60 130 112 102 49 One-family house detached. . . 1,048 220 93 59 57 58 135 60 128 93 96 49 One-family house attached. . . 35 4 2 1 1 - 1 - 2 18 6 - 2 apartments . . . . . . . . . - - - - - - - - - - - - 3 or 4 apartments. . . . . . . - - - - - - - - - - - - 5 to 9 apartments. . . . . . . - - - - - - - - - - - - 10 to 19 apartments. . . . . . - - - - - - - - - - - - 20 to 49 apartments. . . . . . - - - - - - - - - - - - Other. . . . . . . . . . . . . 1 - - - - - - - - 1 - - MATERIAL OF OUTSIDE WALLS Total. . . . . . . . . . . . 1,084 224 95 60 58 58 136 60 130 112 102 49 Poured concrete. . . . . . . . 345 94 18 28 28 14 25 16 54 28 17 23 Concrete blocks. . . . . . . . 206 13 30 1 5 11 19 18 27 33 49 - Metal/tin. . . . . . . . . . . 253 41 45 17 10 7 52 20 16 17 15 13 Plywood. . . . . . . . . . . . 159 40 1 8 11 23 19 6 12 33 6 - Thatch . . . . . . . . . . . . 10 - - - - 1 4 - 2 - 2 1 Bamboo or local wood . . . . . 99 36 1 6 4 - 12 - 14 1 13 12 No walls . . . . . . . . . . . 6 - - - - 2 2 - 2 - - - Other. . . . . . . . . . . . . 6 - - - - - 3 - 3 - - - MATERIAL OF ROOF Total. . . . . . . . . . . . 1,084 224 95 60 58 58 136 60 130 112 102 49 Poured concrete. . . . . . . . 207 22 18 5 19 18 23 10 27 38 21 6 Metal/tin. . . . . . . . . . . 788 190 76 55 36 39 96 49 81 70 66 30 Wood . . . . . . . . . . . . . 3 - 1 - - - - 1 - 1 - - Thatch . . . . . . . . . . . . 77 10 - - 3 1 16 - 22 3 14 8 Bamboo . . . . . . . . . . . . 5 1 - - - - - - - - 1 3 Other. . . . . . . . . . . . . 4 1 - - - - 1 - - - - 2 MATERIAL OF FOUNDATION Total. . . . . . . . . . . . 1,084 224 95 60 58 58 136 60 130 112 102 49 Concrete . . . . . . . . . . . 752 132 63 34 47 45 76 52 100 88 84 31 Wood pier or pilings . . . . . 266 89 30 26 8 2 50 7 18 19 14 3 Coral. . . . . . . . . . . . . 21 - - - 2 - 4 - 1 - 1 13 Other. . . . . . . . . . . . . 45 3 2 - 1 11 6 1 11 5 3 2 WHEN BUILDING WAS FIRST BUILT Total. . . . . . . . . . . . 1,084 224 95 60 58 58 136 60 130 112 102 49 1999 or 2000 . . . . . . . . . 52 18 6 - 3 1 4 1 9 1 3 6 1996 to 1998 . . . . . . . . . 98 20 10 3 3 10 12 - 9 10 10 11 1993 to 1995 . . . . . . . . . 92 14 19 3 - 4 12 1 10 18 7 4 1988 to 1992 . . . . . . . . . 130 31 19 8 8 9 9 6 18 9 9 4 1980 to 1987 . . . . . . . . . 206 35 13 25 9 5 28 11 28 17 21 14 1970 to 1979 . . . . . . . . . 323 47 21 14 26 24 34 23 45 47 33 9 1960 to 1969 . . . . . . . . . 84 18 5 1 9 1 20 9 6 4 11 - 1959 or earlier. . . . . . . . 23 3 - - - 1 9 2 1 3 3 1 WHEN HOUSEHOLDER MOVED IN Total. . . . . . . . . . . . 1,084 224 95 60 58 58 136 60 130 112 102 49 1999 or 2000 . . . . . . . . . 106 23 12 4 4 4 8 10 14 5 6 16 1996 to 1998 . . . . . . . . . 152 29 14 4 3 19 18 4 14 24 15 8 1993 to 1995 . . . . . . . . . 100 23 21 3 5 1 14 2 14 12 3 2 1988 to 1992 . . . . . . . . . 151 36 19 11 8 8 16 5 15 12 16 5 1987 or earlier. . . . . . . . 575 113 29 38 38 26 80 39 73 59 62 18 ─────────────────────────────────────────────────────────────────────────────────────────────────────────── Source: 2000 FSM Census
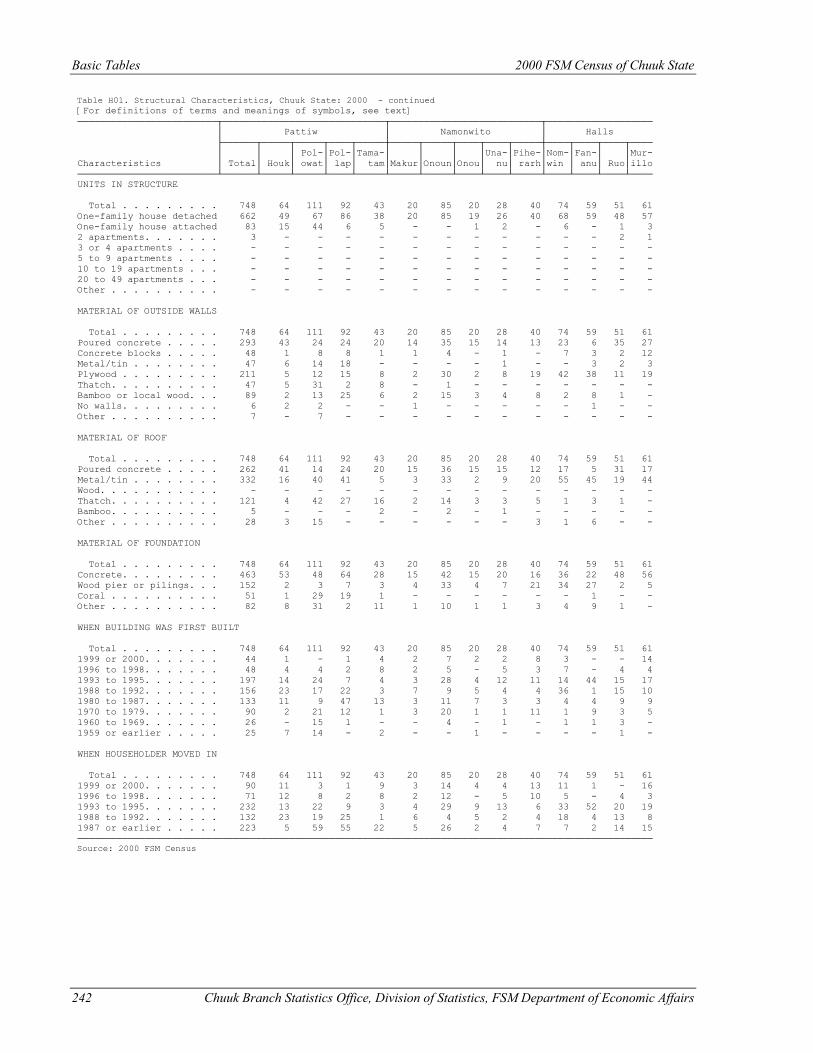
Basic Tables 2000 FSM Census of Chuuk State
242 Chuuk Branch Statistics Office, Division of Statistics, FSM Department of Economic Affairs
Table H01. Structural Characteristics, Chuuk State: 2000 - continued [For definitions of terms and meanings of symbols, see text] ─────────────────────────┬─────────────────────────────┬───────────────────────────┬─────────────────── │ Pattiw │ Namonwito │ Halls ├──────┬─────┬─────┬────┬─────┼─────┬─────┬────┬────┬─────┼────┬────┬────┬──── │ │ │ Pol-│Pol-│Tama-│ │ │ │Una-│Pihe-│Nom-│Fan-│ │Mur- Characteristics │ Total│ Houk│ owat│ lap│ tam│Makur│Onoun│Onou│ nu│ rarh│win │ anu│ Ruo│illo ─────────────────────────┴──────┴─────┴─────┴────┴─────┴─────┴─────┴────┴────┴─────┴────┴────┴────┴──── UNITS IN STRUCTURE Total . . . . . . . . . 748 64 111 92 43 20 85 20 28 40 74 59 51 61 One-family house detached 662 49 67 86 38 20 85 19 26 40 68 59 48 57 One-family house attached 83 15 44 6 5 - - 1 2 - 6 - 1 3 2 apartments. . . . . . . 3 - - - - - - - - - - - 2 1 3 or 4 apartments . . . . - - - - - - - - - - - - - - 5 to 9 apartments . . . . - - - - - - - - - - - - - - 10 to 19 apartments . . . - - - - - - - - - - - - - - 20 to 49 apartments . . . - - - - - - - - - - - - - - Other . . . . . . . . . . - - - - - - - - - - - - - - MATERIAL OF OUTSIDE WALLS Total . . . . . . . . . 748 64 111 92 43 20 85 20 28 40 74 59 51 61 Poured concrete . . . . . 293 43 24 24 20 14 35 15 14 13 23 6 35 27 Concrete blocks . . . . . 48 1 8 8 1 1 4 - 1 - 7 3 2 12 Metal/tin . . . . . . . . 47 6 14 18 - - - - 1 - - 3 2 3 Plywood . . . . . . . . . 211 5 12 15 8 2 30 2 8 19 42 38 11 19 Thatch. . . . . . . . . . 47 5 31 2 8 - 1 - - - - - - - Bamboo or local wood. . . 89 2 13 25 6 2 15 3 4 8 2 8 1 - No walls. . . . . . . . . 6 2 2 - - 1 - - - - - 1 - - Other . . . . . . . . . . 7 - 7 - - - - - - - - - - - MATERIAL OF ROOF Total . . . . . . . . . 748 64 111 92 43 20 85 20 28 40 74 59 51 61 Poured concrete . . . . . 262 41 14 24 20 15 36 15 15 12 17 5 31 17 Metal/tin . . . . . . . . 332 16 40 41 5 3 33 2 9 20 55 45 19 44 Wood. . . . . . . . . . . - - - - - - - - - - - - - - Thatch. . . . . . . . . . 121 4 42 27 16 2 14 3 3 5 1 3 1 - Bamboo. . . . . . . . . . 5 - - - 2 - 2 - 1 - - - - - Other . . . . . . . . . . 28 3 15 - - - - - - 3 1 6 - - MATERIAL OF FOUNDATION Total . . . . . . . . . 748 64 111 92 43 20 85 20 28 40 74 59 51 61 Concrete. . . . . . . . . 463 53 48 64 28 15 42 15 20 16 36 22 48 56 Wood pier or pilings. . . 152 2 3 7 3 4 33 4 7 21 34 27 2 5 Coral . . . . . . . . . . 51 1 29 19 1 - - - - - - 1 - - Other . . . . . . . . . . 82 8 31 2 11 1 10 1 1 3 4 9 1 - WHEN BUILDING WAS FIRST BUILT Total . . . . . . . . . 748 64 111 92 43 20 85 20 28 40 74 59 51 61 1999 or 2000. . . . . . . 44 1 - 1 4 2 7 2 2 8 3 - - 14 1996 to 1998. . . . . . . 48 4 4 2 8 2 5 - 5 3 7 - 4 4 1993 to 1995. . . . . . . 197 14 24 7 4 3 28 4 12 11 14 44 15 17 1988 to 1992. . . . . . . 156 23 17 22 3 7 9 5 4 4 36 1 15 10 1980 to 1987. . . . . . . 133 11 9 47 13 3 11 7 3 3 4 4 9 9 1970 to 1979. . . . . . . 90 2 21 12 1 3 20 1 1 11 1 9 3 5 1960 to 1969. . . . . . . 26 - 15 1 - - 4 - 1 - 1 1 3 - 1959 or earlier . . . . . 25 7 14 - 2 - - 1 - - - - 1 - WHEN HOUSEHOLDER MOVED IN Total . . . . . . . . . 748 64 111 92 43 20 85 20 28 40 74 59 51 61 1999 or 2000. . . . . . . 90 11 3 1 9 3 14 4 4 13 11 1 - 16 1996 to 1998. . . . . . . 71 12 8 2 8 2 12 - 5 10 5 - 4 3 1993 to 1995. . . . . . . 232 13 22 9 3 4 29 9 13 6 33 52 20 19 1988 to 1992. . . . . . . 132 23 19 25 1 6 4 5 2 4 18 4 13 8 1987 or earlier . . . . . 223 5 59 55 22 5 26 2 4 7 7 2 14 15 ─────────────────────────────────────────────────────────────────────────────────────────────────────── Source: 2000 FSM Census
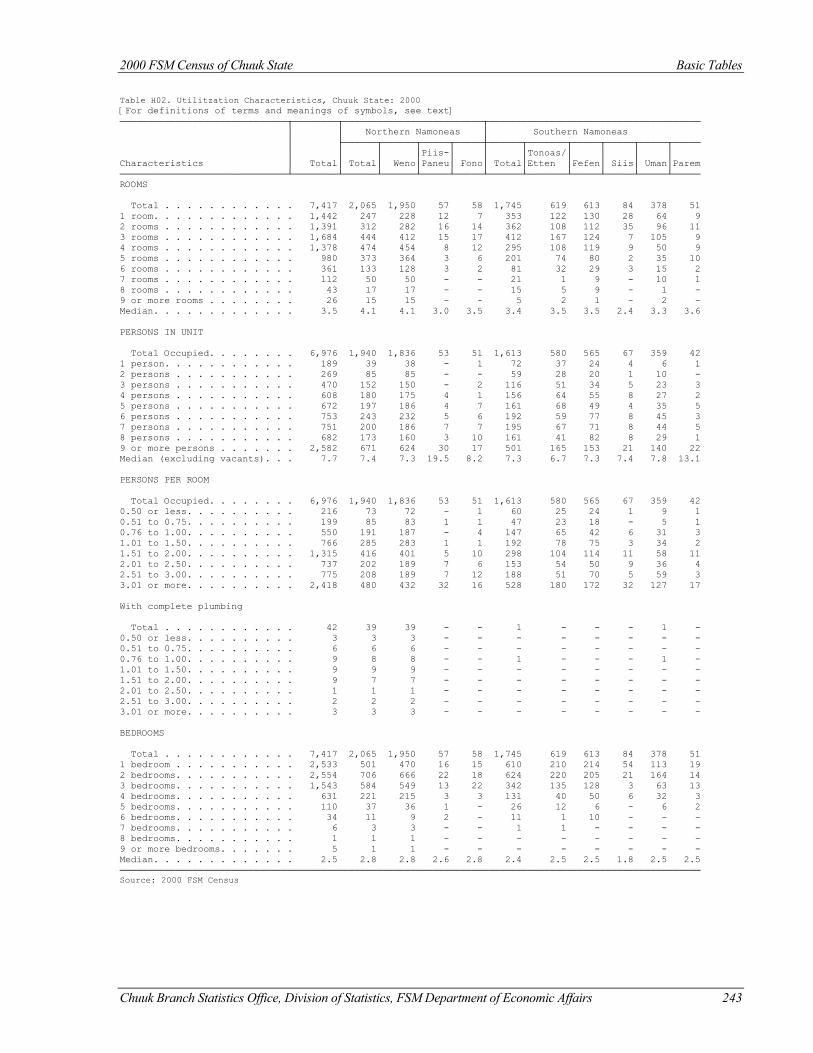
2000 FSM Census of Chuuk State Basic Tables
Chuuk Branch Statistics Office, Division of Statistics, FSM Department of Economic Affairs 243
Table H02. Utilitzation Characteristics, Chuuk State: 2000 [For definitions of terms and meanings of symbols, see text] ──────────────────────────────┬────────┬─────────────────────────┬────────────────────────────────────── │ │ Northern Namoneas │ Southern Namoneas │ ├──────┬──────┬─────┬─────┼──────┬───────┬─────┬─────┬─────┬───── │ │ │ │Piis-│ │ │Tonoas/│ │ │ │ Characteristics │ Total│ Total│ Weno│Paneu│ Fono│ Total│Etten │Fefen│ Siis│ Uman│Parem ──────────────────────────────┴────────┴──────┴──────┴─────┴─────┴──────┴───────┴─────┴─────┴─────┴───── ROOMS Total . . . . . . . . . . . . 7,417 2,065 1,950 57 58 1,745 619 613 84 378 51 1 room. . . . . . . . . . . . . 1,442 247 228 12 7 353 122 130 28 64 9 2 rooms . . . . . . . . . . . . 1,391 312 282 16 14 362 108 112 35 96 11 3 rooms . . . . . . . . . . . . 1,684 444 412 15 17 412 167 124 7 105 9 4 rooms . . . . . . . . . . . . 1,378 474 454 8 12 295 108 119 9 50 9 5 rooms . . . . . . . . . . . . 980 373 364 3 6 201 74 80 2 35 10 6 rooms . . . . . . . . . . . . 361 133 128 3 2 81 32 29 3 15 2 7 rooms . . . . . . . . . . . . 112 50 50 - - 21 1 9 - 10 1 8 rooms . . . . . . . . . . . . 43 17 17 - - 15 5 9 - 1 - 9 or more rooms . . . . . . . . 26 15 15 - - 5 2 1 - 2 - Median. . . . . . . . . . . . . 3.5 4.1 4.1 3.0 3.5 3.4 3.5 3.5 2.4 3.3 3.6 PERSONS IN UNIT Total Occupied. . . . . . . . 6,976 1,940 1,836 53 51 1,613 580 565 67 359 42 1 person. . . . . . . . . . . . 189 39 38 - 1 72 37 24 4 6 1 2 persons . . . . . . . . . . . 269 85 85 - - 59 28 20 1 10 - 3 persons . . . . . . . . . . . 470 152 150 - 2 116 51 34 5 23 3 4 persons . . . . . . . . . . . 608 180 175 4 1 156 64 55 8 27 2 5 persons . . . . . . . . . . . 672 197 186 4 7 161 68 49 4 35 5 6 persons . . . . . . . . . . . 753 243 232 5 6 192 59 77 8 45 3 7 persons . . . . . . . . . . . 751 200 186 7 7 195 67 71 8 44 5 8 persons . . . . . . . . . . . 682 173 160 3 10 161 41 82 8 29 1 9 or more persons . . . . . . . 2,582 671 624 30 17 501 165 153 21 140 22 Median (excluding vacants). . . 7.7 7.4 7.3 19.5 8.2 7.3 6.7 7.3 7.4 7.8 13.1 PERSONS PER ROOM Total Occupied. . . . . . . . 6,976 1,940 1,836 53 51 1,613 580 565 67 359 42 0.50 or less. . . . . . . . . . 216 73 72 - 1 60 25 24 1 9 1 0.51 to 0.75. . . . . . . . . . 199 85 83 1 1 47 23 18 - 5 1 0.76 to 1.00. . . . . . . . . . 550 191 187 - 4 147 65 42 6 31 3 1.01 to 1.50. . . . . . . . . . 766 285 283 1 1 192 78 75 3 34 2 1.51 to 2.00. . . . . . . . . . 1,315 416 401 5 10 298 104 114 11 58 11 2.01 to 2.50. . . . . . . . . . 737 202 189 7 6 153 54 50 9 36 4 2.51 to 3.00. . . . . . . . . . 775 208 189 7 12 188 51 70 5 59 3 3.01 or more. . . . . . . . . . 2,418 480 432 32 16 528 180 172 32 127 17 With complete plumbing Total . . . . . . . . . . . . 42 39 39 - - 1 - - - 1 - 0.50 or less. . . . . . . . . . 3 3 3 - - - - - - - - 0.51 to 0.75. . . . . . . . . . 6 6 6 - - - - - - - - 0.76 to 1.00. . . . . . . . . . 9 8 8 - - 1 - - - 1 - 1.01 to 1.50. . . . . . . . . . 9 9 9 - - - - - - - - 1.51 to 2.00. . . . . . . . . . 9 7 7 - - - - - - - - 2.01 to 2.50. . . . . . . . . . 1 1 1 - - - - - - - - 2.51 to 3.00. . . . . . . . . . 2 2 2 - - - - - - - - 3.01 or more. . . . . . . . . . 3 3 3 - - - - - - - - BEDROOMS Total . . . . . . . . . . . . 7,417 2,065 1,950 57 58 1,745 619 613 84 378 51 1 bedroom . . . . . . . . . . . 2,533 501 470 16 15 610 210 214 54 113 19 2 bedrooms. . . . . . . . . . . 2,554 706 666 22 18 624 220 205 21 164 14 3 bedrooms. . . . . . . . . . . 1,543 584 549 13 22 342 135 128 3 63 13 4 bedrooms. . . . . . . . . . . 631 221 215 3 3 131 40 50 6 32 3 5 bedrooms. . . . . . . . . . . 110 37 36 1 - 26 12 6 - 6 2 6 bedrooms. . . . . . . . . . . 34 11 9 2 - 11 1 10 - - - 7 bedrooms. . . . . . . . . . . 6 3 3 - - 1 1 - - - - 8 bedrooms. . . . . . . . . . . 1 1 1 - - - - - - - - 9 or more bedrooms. . . . . . . 5 1 1 - - - - - - - - Median. . . . . . . . . . . . . 2.5 2.8 2.8 2.6 2.8 2.4 2.5 2.5 1.8 2.5 2.5 ──────────────────────────────────────────────────────────────────────────────────────────────────────── Source: 2000 FSM Census
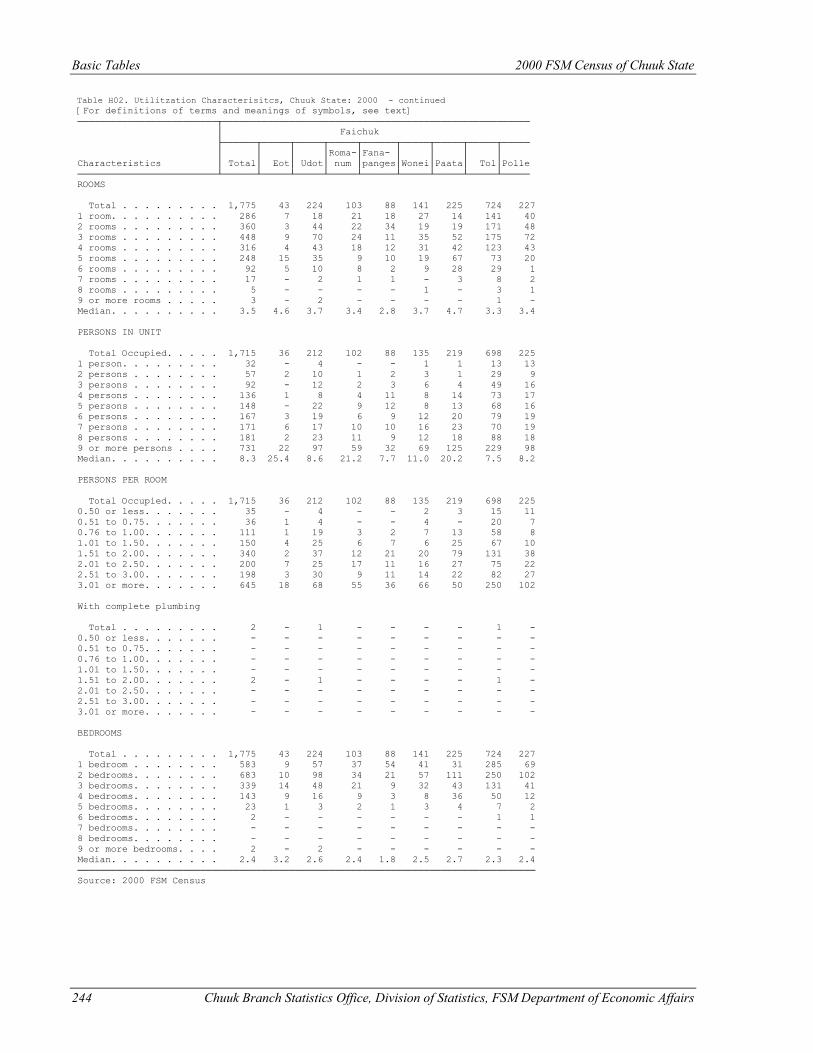
Basic Tables 2000 FSM Census of Chuuk State
244 Chuuk Branch Statistics Office, Division of Statistics, FSM Department of Economic Affairs
Table H02. Utilitzation Characterisitcs, Chuuk State: 2000 - continued [For definitions of terms and meanings of symbols, see text] ─────────────────────────┬─────────────────────────────────────────────────────── │ Faichuk ├──────┬─────┬─────┬─────┬──────┬─────┬─────┬─────┬───── │ │ │ │Roma-│Fana- │ │ │ │ Characteristics │ Total│ Eot│ Udot│ num │panges│Wonei│Paata│ Tol│Polle ─────────────────────────┴──────┴─────┴─────┴─────┴──────┴─────┴─────┴─────┴───── ROOMS Total . . . . . . . . . 1,775 43 224 103 88 141 225 724 227 1 room. . . . . . . . . . 286 7 18 21 18 27 14 141 40 2 rooms . . . . . . . . . 360 3 44 22 34 19 19 171 48 3 rooms . . . . . . . . . 448 9 70 24 11 35 52 175 72 4 rooms . . . . . . . . . 316 4 43 18 12 31 42 123 43 5 rooms . . . . . . . . . 248 15 35 9 10 19 67 73 20 6 rooms . . . . . . . . . 92 5 10 8 2 9 28 29 1 7 rooms . . . . . . . . . 17 - 2 1 1 - 3 8 2 8 rooms . . . . . . . . . 5 - - - - 1 - 3 1 9 or more rooms . . . . . 3 - 2 - - - - 1 - Median. . . . . . . . . . 3.5 4.6 3.7 3.4 2.8 3.7 4.7 3.3 3.4 PERSONS IN UNIT Total Occupied. . . . . 1,715 36 212 102 88 135 219 698 225 1 person. . . . . . . . . 32 - 4 - - 1 1 13 13 2 persons . . . . . . . . 57 2 10 1 2 3 1 29 9 3 persons . . . . . . . . 92 - 12 2 3 6 4 49 16 4 persons . . . . . . . . 136 1 8 4 11 8 14 73 17 5 persons . . . . . . . . 148 - 22 9 12 8 13 68 16 6 persons . . . . . . . . 167 3 19 6 9 12 20 79 19 7 persons . . . . . . . . 171 6 17 10 10 16 23 70 19 8 persons . . . . . . . . 181 2 23 11 9 12 18 88 18 9 or more persons . . . . 731 22 97 59 32 69 125 229 98 Median. . . . . . . . . . 8.3 25.4 8.6 21.2 7.7 11.0 20.2 7.5 8.2 PERSONS PER ROOM Total Occupied. . . . . 1,715 36 212 102 88 135 219 698 225 0.50 or less. . . . . . . 35 - 4 - - 2 3 15 11 0.51 to 0.75. . . . . . . 36 1 4 - - 4 - 20 7 0.76 to 1.00. . . . . . . 111 1 19 3 2 7 13 58 8 1.01 to 1.50. . . . . . . 150 4 25 6 7 6 25 67 10 1.51 to 2.00. . . . . . . 340 2 37 12 21 20 79 131 38 2.01 to 2.50. . . . . . . 200 7 25 17 11 16 27 75 22 2.51 to 3.00. . . . . . . 198 3 30 9 11 14 22 82 27 3.01 or more. . . . . . . 645 18 68 55 36 66 50 250 102 With complete plumbing Total . . . . . . . . . 2 - 1 - - - - 1 - 0.50 or less. . . . . . . - - - - - - - - - 0.51 to 0.75. . . . . . . - - - - - - - - - 0.76 to 1.00. . . . . . . - - - - - - - - - 1.01 to 1.50. . . . . . . - - - - - - - - - 1.51 to 2.00. . . . . . . 2 - 1 - - - - 1 - 2.01 to 2.50. . . . . . . - - - - - - - - - 2.51 to 3.00. . . . . . . - - - - - - - - - 3.01 or more. . . . . . . - - - - - - - - - BEDROOMS Total . . . . . . . . . 1,775 43 224 103 88 141 225 724 227 1 bedroom . . . . . . . . 583 9 57 37 54 41 31 285 69 2 bedrooms. . . . . . . . 683 10 98 34 21 57 111 250 102 3 bedrooms. . . . . . . . 339 14 48 21 9 32 43 131 41 4 bedrooms. . . . . . . . 143 9 16 9 3 8 36 50 12 5 bedrooms. . . . . . . . 23 1 3 2 1 3 4 7 2 6 bedrooms. . . . . . . . 2 - - - - - - 1 1 7 bedrooms. . . . . . . . - - - - - - - - - 8 bedrooms. . . . . . . . - - - - - - - - - 9 or more bedrooms. . . . 2 - 2 - - - - - - Median. . . . . . . . . . 2.4 3.2 2.6 2.4 1.8 2.5 2.7 2.3 2.4 ────────────────────────────────────────────────────────────────────────────────── Source: 2000 FSM Census
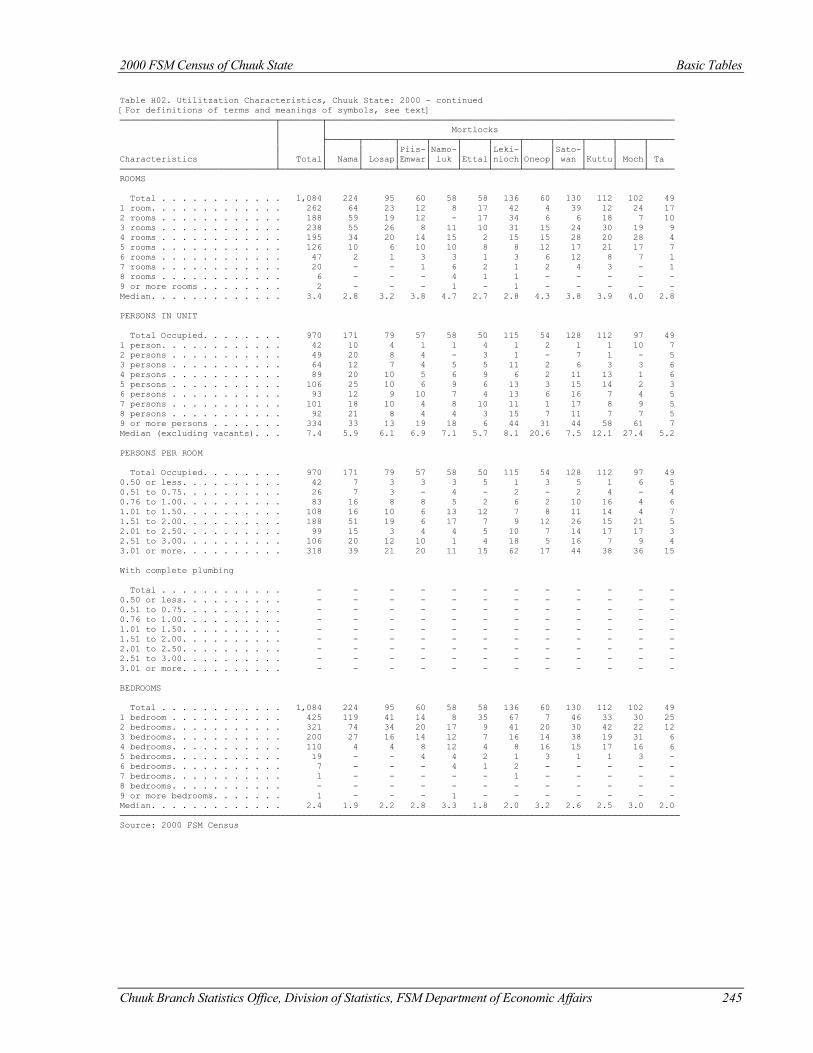
2000 FSM Census of Chuuk State Basic Tables
Chuuk Branch Statistics Office, Division of Statistics, FSM Department of Economic Affairs 245
Table H02. Utilitzation Characteristics, Chuuk State: 2000 - continued [For definitions of terms and meanings of symbols, see text] ──────────────────────────────┬────────┬─────────────────────────────────────────────────────────────────── │ │ Mortlocks │ ├──────┬──────┬─────┬─────┬─────┬─────┬─────┬─────┬─────┬─────┬───── │ │ │ │Piis-│Namo-│ │Leki-│ │Sato-│ │ │ Characteristics │ Total│ Nama│ Losap│Emwar│ luk │Ettal│nioch│Oneop│ wan │Kuttu│ Moch│ Ta ──────────────────────────────┴────────┴──────┴──────┴─────┴─────┴─────┴─────┴─────┴─────┴─────┴─────┴───── ROOMS Total . . . . . . . . . . . . 1,084 224 95 60 58 58 136 60 130 112 102 49 1 room. . . . . . . . . . . . . 262 64 23 12 8 17 42 4 39 12 24 17 2 rooms . . . . . . . . . . . . 188 59 19 12 - 17 34 6 6 18 7 10 3 rooms . . . . . . . . . . . . 238 55 26 8 11 10 31 15 24 30 19 9 4 rooms . . . . . . . . . . . . 195 34 20 14 15 2 15 15 28 20 28 4 5 rooms . . . . . . . . . . . . 126 10 6 10 10 8 8 12 17 21 17 7 6 rooms . . . . . . . . . . . . 47 2 1 3 3 1 3 6 12 8 7 1 7 rooms . . . . . . . . . . . . 20 - - 1 6 2 1 2 4 3 - 1 8 rooms . . . . . . . . . . . . 6 - - - 4 1 1 - - - - - 9 or more rooms . . . . . . . . 2 - - - 1 - 1 - - - - - Median. . . . . . . . . . . . . 3.4 2.8 3.2 3.8 4.7 2.7 2.8 4.3 3.8 3.9 4.0 2.8 PERSONS IN UNIT Total Occupied. . . . . . . . 970 171 79 57 58 50 115 54 128 112 97 49 1 person. . . . . . . . . . . . 42 10 4 1 1 4 1 2 1 1 10 7 2 persons . . . . . . . . . . . 49 20 8 4 - 3 1 - 7 1 - 5 3 persons . . . . . . . . . . . 64 12 7 4 5 5 11 2 6 3 3 6 4 persons . . . . . . . . . . . 89 20 10 5 6 9 6 2 11 13 1 6 5 persons . . . . . . . . . . . 106 25 10 6 9 6 13 3 15 14 2 3 6 persons . . . . . . . . . . . 93 12 9 10 7 4 13 6 16 7 4 5 7 persons . . . . . . . . . . . 101 18 10 4 8 10 11 1 17 8 9 5 8 persons . . . . . . . . . . . 92 21 8 4 4 3 15 7 11 7 7 5 9 or more persons . . . . . . . 334 33 13 19 18 6 44 31 44 58 61 7 Median (excluding vacants). . . 7.4 5.9 6.1 6.9 7.1 5.7 8.1 20.6 7.5 12.1 27.4 5.2 PERSONS PER ROOM Total Occupied. . . . . . . . 970 171 79 57 58 50 115 54 128 112 97 49 0.50 or less. . . . . . . . . . 42 7 3 3 3 5 1 3 5 1 6 5 0.51 to 0.75. . . . . . . . . . 26 7 3 - 4 - 2 - 2 4 - 4 0.76 to 1.00. . . . . . . . . . 83 16 8 8 5 2 6 2 10 16 4 6 1.01 to 1.50. . . . . . . . . . 108 16 10 6 13 12 7 8 11 14 4 7 1.51 to 2.00. . . . . . . . . . 188 51 19 6 17 7 9 12 26 15 21 5 2.01 to 2.50. . . . . . . . . . 99 15 3 4 4 5 10 7 14 17 17 3 2.51 to 3.00. . . . . . . . . . 106 20 12 10 1 4 18 5 16 7 9 4 3.01 or more. . . . . . . . . . 318 39 21 20 11 15 62 17 44 38 36 15 With complete plumbing Total . . . . . . . . . . . . - - - - - - - - - - - - 0.50 or less. . . . . . . . . . - - - - - - - - - - - - 0.51 to 0.75. . . . . . . . . . - - - - - - - - - - - - 0.76 to 1.00. . . . . . . . . . - - - - - - - - - - - - 1.01 to 1.50. . . . . . . . . . - - - - - - - - - - - - 1.51 to 2.00. . . . . . . . . . - - - - - - - - - - - - 2.01 to 2.50. . . . . . . . . . - - - - - - - - - - - - 2.51 to 3.00. . . . . . . . . . - - - - - - - - - - - - 3.01 or more. . . . . . . . . . - - - - - - - - - - - - BEDROOMS Total . . . . . . . . . . . . 1,084 224 95 60 58 58 136 60 130 112 102 49 1 bedroom . . . . . . . . . . . 425 119 41 14 8 35 67 7 46 33 30 25 2 bedrooms. . . . . . . . . . . 321 74 34 20 17 9 41 20 30 42 22 12 3 bedrooms. . . . . . . . . . . 200 27 16 14 12 7 16 14 38 19 31 6 4 bedrooms. . . . . . . . . . . 110 4 4 8 12 4 8 16 15 17 16 6 5 bedrooms. . . . . . . . . . . 19 - - 4 4 2 1 3 1 1 3 - 6 bedrooms. . . . . . . . . . . 7 - - - 4 1 2 - - - - - 7 bedrooms. . . . . . . . . . . 1 - - - - - 1 - - - - - 8 bedrooms. . . . . . . . . . . - - - - - - - - - - - - 9 or more bedrooms. . . . . . . 1 - - - 1 - - - - - - - Median. . . . . . . . . . . . . 2.4 1.9 2.2 2.8 3.3 1.8 2.0 3.2 2.6 2.5 3.0 2.0 ──────────────────────────────────────────────────────────────────────────────────────────────────────────── Source: 2000 FSM Census
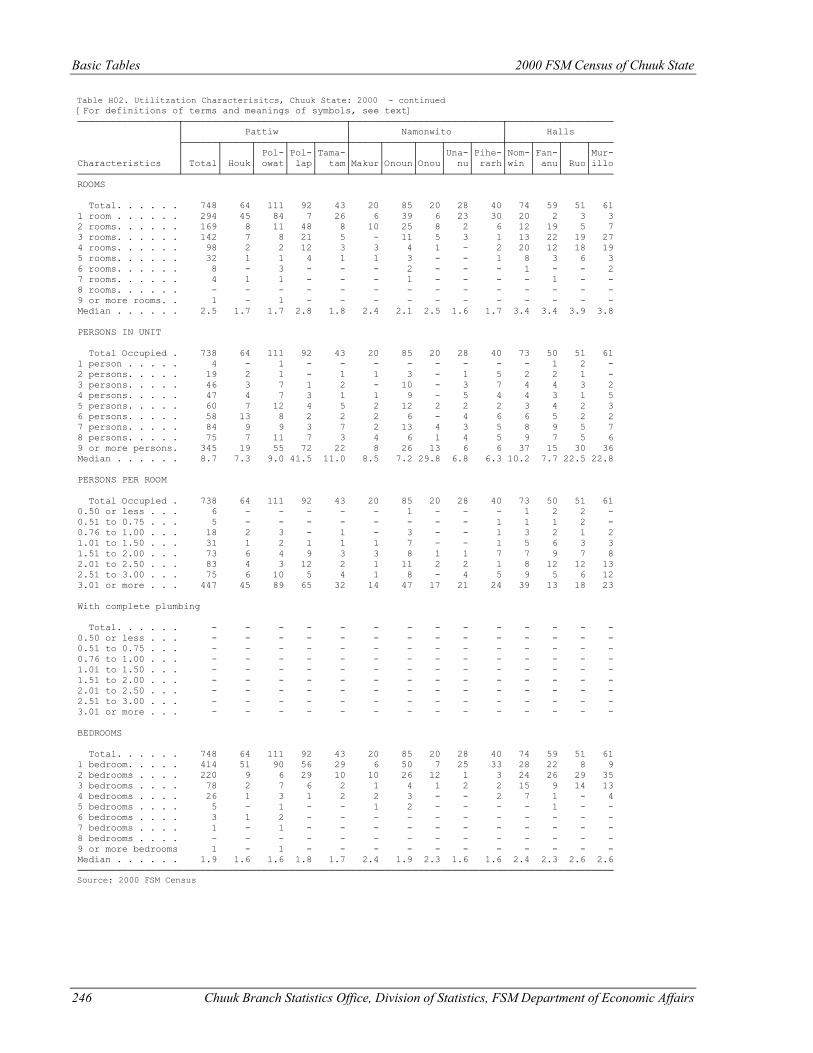
Basic Tables 2000 FSM Census of Chuuk State
246 Chuuk Branch Statistics Office, Division of Statistics, FSM Department of Economic Affairs
Table H02. Utilitzation Characterisitcs, Chuuk State: 2000 - continued [For definitions of terms and meanings of symbols, see text] ──────────────────┬─────────────────────────────┬───────────────────────────┬─────────────────── │ Pattiw │ Namonwito │ Halls ├──────┬─────┬─────┬────┬─────┼─────┬─────┬────┬────┬─────┼────┬────┬────┬──── │ │ │ Pol-│Pol-│Tama-│ │ │ │Una-│Pihe-│Nom-│Fan-│ │Mur- Characteristics │ Total│ Houk│ owat│ lap│ tam│Makur│Onoun│Onou│ nu│ rarh│win │ anu│ Ruo│illo ──────────────────┴──────┴─────┴─────┴────┴─────┴─────┴─────┴────┴────┴─────┴────┴────┴────┴──── ROOMS Total. . . . . . 748 64 111 92 43 20 85 20 28 40 74 59 51 61 1 room . . . . . . 294 45 84 7 26 6 39 6 23 30 20 2 3 3 2 rooms. . . . . . 169 8 11 48 8 10 25 8 2 6 12 19 5 7 3 rooms. . . . . . 142 7 8 21 5 - 11 5 3 1 13 22 19 27 4 rooms. . . . . . 98 2 2 12 3 3 4 1 - 2 20 12 18 19 5 rooms. . . . . . 32 1 1 4 1 1 3 - - 1 8 3 6 3 6 rooms. . . . . . 8 - 3 - - - 2 - - - 1 - - 2 7 rooms. . . . . . 4 1 1 - - - 1 - - - - 1 - - 8 rooms. . . . . . - - - - - - - - - - - - - - 9 or more rooms. . 1 - 1 - - - - - - - - - - - Median . . . . . . 2.5 1.7 1.7 2.8 1.8 2.4 2.1 2.5 1.6 1.7 3.4 3.4 3.9 3.8 PERSONS IN UNIT Total Occupied . 738 64 111 92 43 20 85 20 28 40 73 50 51 61 1 person . . . . . 4 - 1 - - - - - - - - 1 2 - 2 persons. . . . . 19 2 1 - 1 1 3 - 1 5 2 2 1 - 3 persons. . . . . 46 3 7 1 2 - 10 - 3 7 4 4 3 2 4 persons. . . . . 47 4 7 3 1 1 9 - 5 4 4 3 1 5 5 persons. . . . . 60 7 12 4 5 2 12 2 2 2 3 4 2 3 6 persons. . . . . 58 13 8 2 2 2 6 - 4 6 6 5 2 2 7 persons. . . . . 84 9 9 3 7 2 13 4 3 5 8 9 5 7 8 persons. . . . . 75 7 11 7 3 4 6 1 4 5 9 7 5 6 9 or more persons. 345 19 55 72 22 8 26 13 6 6 37 15 30 36 Median . . . . . . 8.7 7.3 9.0 41.5 11.0 8.5 7.2 29.8 6.8 6.3 10.2 7.7 22.5 22.8 PERSONS PER ROOM Total Occupied . 738 64 111 92 43 20 85 20 28 40 73 50 51 61 0.50 or less . . . 6 - - - - - 1 - - - 1 2 2 - 0.51 to 0.75 . . . 5 - - - - - - - - 1 1 1 2 - 0.76 to 1.00 . . . 18 2 3 - 1 - 3 - - 1 3 2 1 2 1.01 to 1.50 . . . 31 1 2 1 1 1 7 - - 1 5 6 3 3 1.51 to 2.00 . . . 73 6 4 9 3 3 8 1 1 7 7 9 7 8 2.01 to 2.50 . . . 83 4 3 12 2 1 11 2 2 1 8 12 12 13 2.51 to 3.00 . . . 75 6 10 5 4 1 8 - 4 5 9 5 6 12 3.01 or more . . . 447 45 89 65 32 14 47 17 21 24 39 13 18 23 With complete plumbing Total. . . . . . - - - - - - - - - - - - - - 0.50 or less . . . - - - - - - - - - - - - - - 0.51 to 0.75 . . . - - - - - - - - - - - - - - 0.76 to 1.00 . . . - - - - - - - - - - - - - - 1.01 to 1.50 . . . - - - - - - - - - - - - - - 1.51 to 2.00 . . . - - - - - - - - - - - - - - 2.01 to 2.50 . . . - - - - - - - - - - - - - - 2.51 to 3.00 . . . - - - - - - - - - - - - - - 3.01 or more . . . - - - - - - - - - - - - - - BEDROOMS Total. . . . . . 748 64 111 92 43 20 85 20 28 40 74 59 51 61 1 bedroom. . . . . 414 51 90 56 29 6 50 7 25 33 28 22 8 9 2 bedrooms . . . . 220 9 6 29 10 10 26 12 1 3 24 26 29 35 3 bedrooms . . . . 78 2 7 6 2 1 4 1 2 2 15 9 14 13 4 bedrooms . . . . 26 1 3 1 2 2 3 - - 2 7 1 - 4 5 bedrooms . . . . 5 - 1 - - 1 2 - - - - 1 - - 6 bedrooms . . . . 3 1 2 - - - - - - - - - - - 7 bedrooms . . . . 1 - 1 - - - - - - - - - - - 8 bedrooms . . . . - - - - - - - - - - - - - - 9 or more bedrooms 1 - 1 - - - - - - - - - - - Median . . . . . . 1.9 1.6 1.6 1.8 1.7 2.4 1.9 2.3 1.6 1.6 2.4 2.3 2.6 2.6 ──────────────────────────────────────────────────────────────────────────────────────────────── Source: 2000 FSM Census
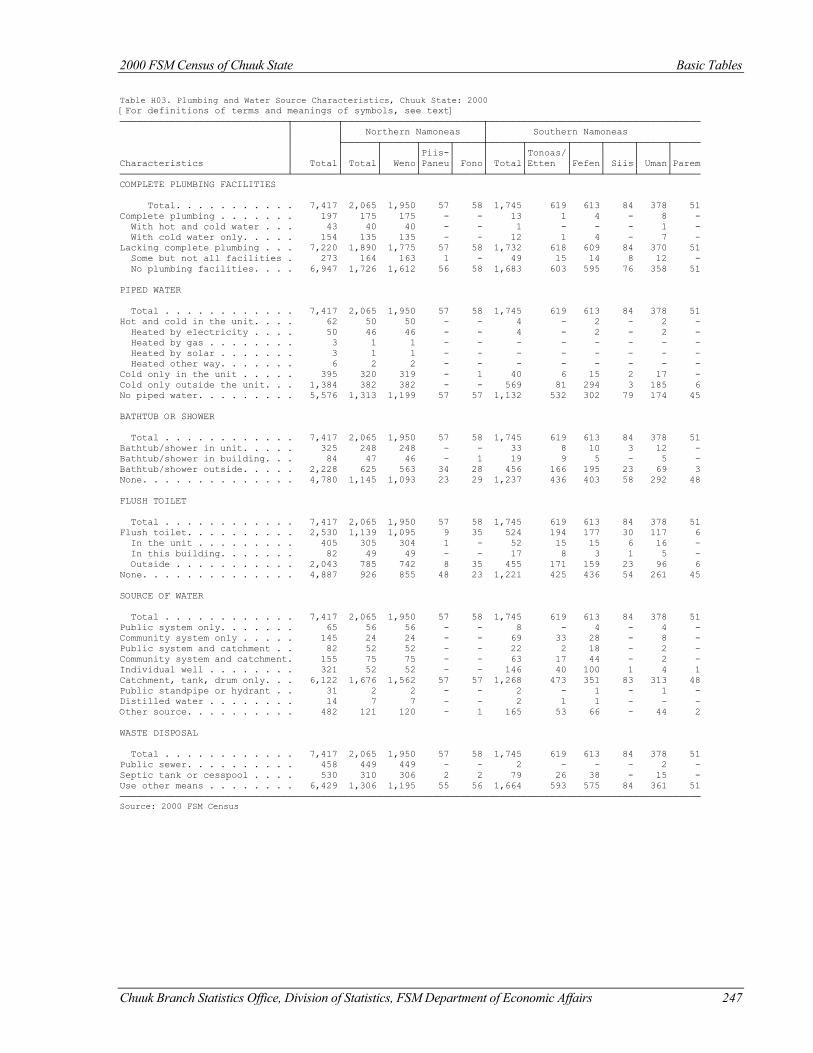
2000 FSM Census of Chuuk State Basic Tables
Chuuk Branch Statistics Office, Division of Statistics, FSM Department of Economic Affairs 247
Table H03. Plumbing and Water Source Characteristics, Chuuk State: 2000 [For definitions of terms and meanings of symbols, see text] ──────────────────────────────┬────────┬─────────────────────────┬────────────────────────────────────── │ │ Northern Namoneas │ Southern Namoneas │ ├──────┬──────┬─────┬─────┼──────┬───────┬─────┬─────┬─────┬───── │ │ │ │Piis-│ │ │Tonoas/│ │ │ │ Characteristics │ Total│ Total│ Weno│Paneu│ Fono│ Total│Etten │Fefen│ Siis│ Uman│Parem ──────────────────────────────┴────────┴──────┴──────┴─────┴─────┴──────┴───────┴─────┴─────┴─────┴───── COMPLETE PLUMBING FACILITIES Total. . . . . . . . . . . 7,417 2,065 1,950 57 58 1,745 619 613 84 378 51 Complete plumbing . . . . . . . 197 175 175 - - 13 1 4 - 8 - With hot and cold water . . . 43 40 40 - - 1 - - - 1 - With cold water only. . . . . 154 135 135 - - 12 1 4 - 7 - Lacking complete plumbing . . . 7,220 1,890 1,775 57 58 1,732 618 609 84 370 51 Some but not all facilities . 273 164 163 1 - 49 15 14 8 12 - No plumbing facilities. . . . 6,947 1,726 1,612 56 58 1,683 603 595 76 358 51 PIPED WATER Total . . . . . . . . . . . . 7,417 2,065 1,950 57 58 1,745 619 613 84 378 51 Hot and cold in the unit. . . . 62 50 50 - - 4 - 2 - 2 - Heated by electricity . . . . 50 46 46 - - 4 - 2 - 2 - Heated by gas . . . . . . . . 3 1 1 - - - - - - - - Heated by solar . . . . . . . 3 1 1 - - - - - - - - Heated other way. . . . . . . 6 2 2 - - - - - - - - Cold only in the unit . . . . . 395 320 319 - 1 40 6 15 2 17 - Cold only outside the unit. . . 1,384 382 382 - - 569 81 294 3 185 6 No piped water. . . . . . . . . 5,576 1,313 1,199 57 57 1,132 532 302 79 174 45 BATHTUB OR SHOWER Total . . . . . . . . . . . . 7,417 2,065 1,950 57 58 1,745 619 613 84 378 51 Bathtub/shower in unit. . . . . 325 248 248 - - 33 8 10 3 12 - Bathtub/shower in building. . . 84 47 46 - 1 19 9 5 - 5 - Bathtub/shower outside. . . . . 2,228 625 563 34 28 456 166 195 23 69 3 None. . . . . . . . . . . . . . 4,780 1,145 1,093 23 29 1,237 436 403 58 292 48 FLUSH TOILET Total . . . . . . . . . . . . 7,417 2,065 1,950 57 58 1,745 619 613 84 378 51 Flush toilet. . . . . . . . . . 2,530 1,139 1,095 9 35 524 194 177 30 117 6 In the unit . . . . . . . . . 405 305 304 1 - 52 15 15 6 16 - In this building. . . . . . . 82 49 49 - - 17 8 3 1 5 - Outside . . . . . . . . . . . 2,043 785 742 8 35 455 171 159 23 96 6 None. . . . . . . . . . . . . . 4,887 926 855 48 23 1,221 425 436 54 261 45 SOURCE OF WATER Total . . . . . . . . . . . . 7,417 2,065 1,950 57 58 1,745 619 613 84 378 51 Public system only. . . . . . . 65 56 56 - - 8 - 4 - 4 - Community system only . . . . . 145 24 24 - - 69 33 28 - 8 - Public system and catchment . . 82 52 52 - - 22 2 18 - 2 - Community system and catchment. 155 75 75 - - 63 17 44 - 2 - Individual well . . . . . . . . 321 52 52 - - 146 40 100 1 4 1 Catchment, tank, drum only. . . 6,122 1,676 1,562 57 57 1,268 473 351 83 313 48 Public standpipe or hydrant . . 31 2 2 - - 2 - 1 - 1 - Distilled water . . . . . . . . 14 7 7 - - 2 1 1 - - - Other source. . . . . . . . . . 482 121 120 - 1 165 53 66 - 44 2 WASTE DISPOSAL Total . . . . . . . . . . . . 7,417 2,065 1,950 57 58 1,745 619 613 84 378 51 Public sewer. . . . . . . . . . 458 449 449 - - 2 - - - 2 - Septic tank or cesspool . . . . 530 310 306 2 2 79 26 38 - 15 - Use other means . . . . . . . . 6,429 1,306 1,195 55 56 1,664 593 575 84 361 51 ──────────────────────────────────────────────────────────────────────────────────────────────────────── Source: 2000 FSM Census
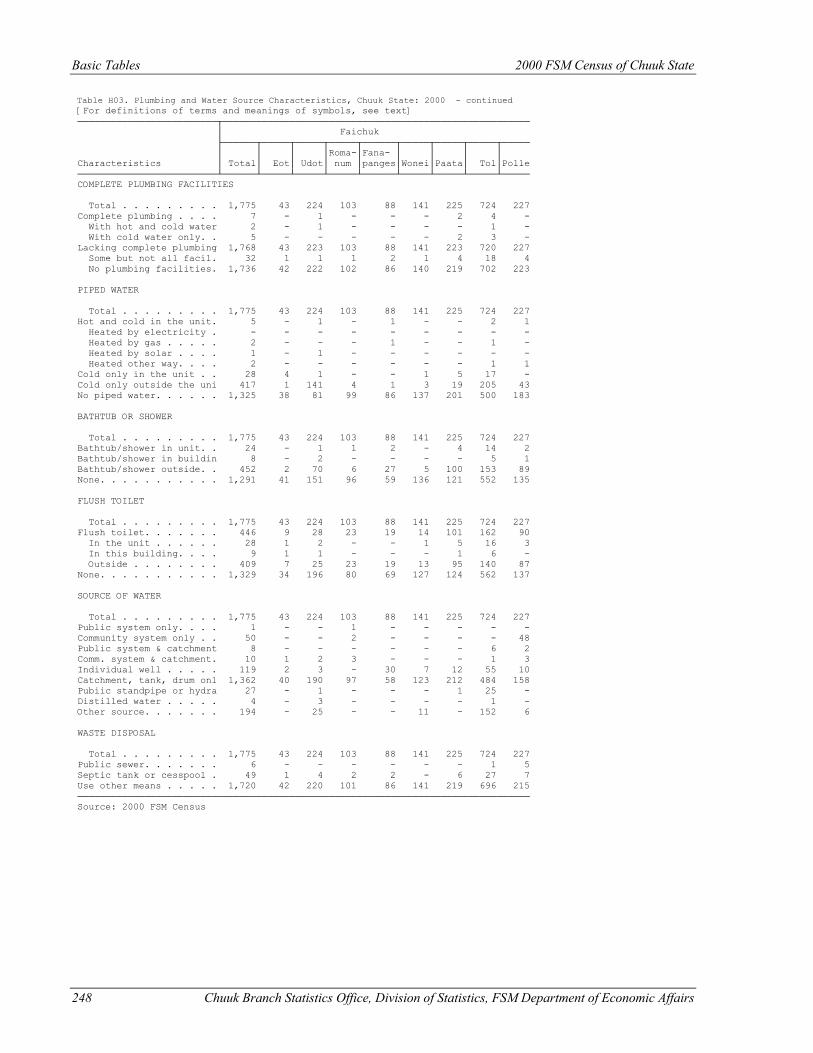
Basic Tables 2000 FSM Census of Chuuk State
248 Chuuk Branch Statistics Office, Division of Statistics, FSM Department of Economic Affairs
Table H03. Plumbing and Water Source Characteristics, Chuuk State: 2000 - continued [For definitions of terms and meanings of symbols, see text] ─────────────────────────┬─────────────────────────────────────────────────────── │ Faichuk ├──────┬─────┬─────┬─────┬──────┬─────┬─────┬─────┬───── │ │ │ │Roma-│Fana- │ │ │ │ Characteristics │ Total│ Eot│ Udot│ num │panges│Wonei│Paata│ Tol│Polle ─────────────────────────┴──────┴─────┴─────┴─────┴──────┴─────┴─────┴─────┴───── COMPLETE PLUMBING FACILITIES Total . . . . . . . . . 1,775 43 224 103 88 141 225 724 227 Complete plumbing . . . . 7 - 1 - - - 2 4 - With hot and cold water 2 - 1 - - - - 1 - With cold water only. . 5 - - - - - 2 3 - Lacking complete plumbing 1,768 43 223 103 88 141 223 720 227 Some but not all facil. 32 1 1 1 2 1 4 18 4 No plumbing facilities. 1,736 42 222 102 86 140 219 702 223 PIPED WATER Total . . . . . . . . . 1,775 43 224 103 88 141 225 724 227 Hot and cold in the unit. 5 - 1 - 1 - - 2 1 Heated by electricity . - - - - - - - - - Heated by gas . . . . . 2 - - - 1 - - 1 - Heated by solar . . . . 1 - 1 - - - - - - Heated other way. . . . 2 - - - - - - 1 1 Cold only in the unit . . 28 4 1 - - 1 5 17 - Cold only outside the uni 417 1 141 4 1 3 19 205 43 No piped water. . . . . . 1,325 38 81 99 86 137 201 500 183 BATHTUB OR SHOWER Total . . . . . . . . . 1,775 43 224 103 88 141 225 724 227 Bathtub/shower in unit. . 24 - 1 1 2 - 4 14 2 Bathtub/shower in buildin 8 - 2 - - - - 5 1 Bathtub/shower outside. . 452 2 70 6 27 5 100 153 89 None. . . . . . . . . . . 1,291 41 151 96 59 136 121 552 135 FLUSH TOILET Total . . . . . . . . . 1,775 43 224 103 88 141 225 724 227 Flush toilet. . . . . . . 446 9 28 23 19 14 101 162 90 In the unit . . . . . . 28 1 2 - - 1 5 16 3 In this building. . . . 9 1 1 - - - 1 6 - Outside . . . . . . . . 409 7 25 23 19 13 95 140 87 None. . . . . . . . . . . 1,329 34 196 80 69 127 124 562 137 SOURCE OF WATER Total . . . . . . . . . 1,775 43 224 103 88 141 225 724 227 Public system only. . . . 1 - - 1 - - - - - Community system only . . 50 - - 2 - - - - 48 Public system & catchment 8 - - - - - - 6 2 Comm. system & catchment. 10 1 2 3 - - - 1 3 Individual well . . . . . 119 2 3 - 30 7 12 55 10 Catchment, tank, drum onl 1,362 40 190 97 58 123 212 484 158 Pubiic standpipe or hydra 27 - 1 - - - 1 25 - Distilled water . . . . . 4 - 3 - - - - 1 - Other source. . . . . . . 194 - 25 - - 11 - 152 6 WASTE DISPOSAL Total . . . . . . . . . 1,775 43 224 103 88 141 225 724 227 Public sewer. . . . . . . 6 - - - - - - 1 5 Septic tank or cesspool . 49 1 4 2 2 - 6 27 7 Use other means . . . . . 1,720 42 220 101 86 141 219 696 215 ───────────────────────────────────────────────────────────────────────────────── Source: 2000 FSM Census
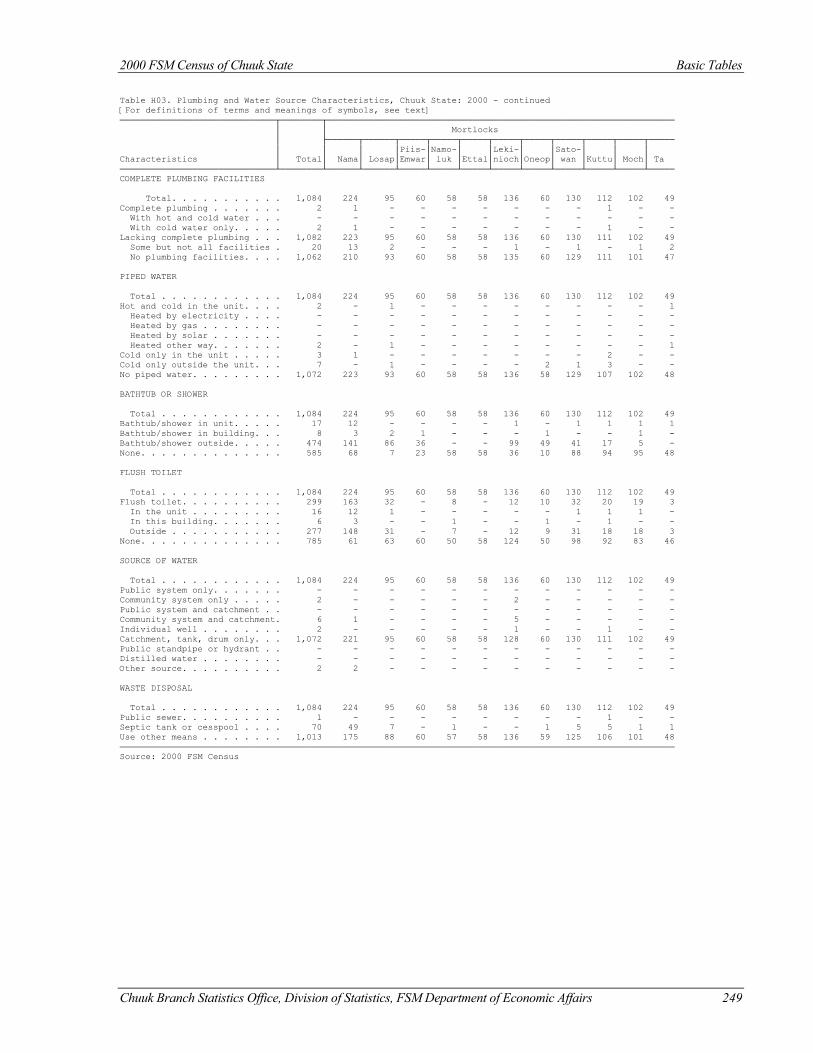
2000 FSM Census of Chuuk State Basic Tables
Chuuk Branch Statistics Office, Division of Statistics, FSM Department of Economic Affairs 249
Table H03. Plumbing and Water Source Characteristics, Chuuk State: 2000 - continued [For definitions of terms and meanings of symbols, see text] ──────────────────────────────┬────────┬─────────────────────────────────────────────────────────────────── │ │ Mortlocks │ ├──────┬──────┬─────┬─────┬─────┬─────┬─────┬─────┬─────┬─────┬───── │ │ │ │Piis-│Namo-│ │Leki-│ │Sato-│ │ │ Characteristics │ Total│ Nama│ Losap│Emwar│ luk │Ettal│nioch│Oneop│ wan │Kuttu│ Moch│ Ta ──────────────────────────────┴────────┴──────┴──────┴─────┴─────┴─────┴─────┴─────┴─────┴─────┴─────┴───── COMPLETE PLUMBING FACILITIES Total. . . . . . . . . . . 1,084 224 95 60 58 58 136 60 130 112 102 49 Complete plumbing . . . . . . . 2 1 - - - - - - - 1 - - With hot and cold water . . . - - - - - - - - - - - - With cold water only. . . . . 2 1 - - - - - - - 1 - - Lacking complete plumbing . . . 1,082 223 95 60 58 58 136 60 130 111 102 49 Some but not all facilities . 20 13 2 - - - 1 - 1 - 1 2 No plumbing facilities. . . . 1,062 210 93 60 58 58 135 60 129 111 101 47 PIPED WATER Total . . . . . . . . . . . . 1,084 224 95 60 58 58 136 60 130 112 102 49 Hot and cold in the unit. . . . 2 - 1 - - - - - - - - 1 Heated by electricity . . . . - - - - - - - - - - - - Heated by gas . . . . . . . . - - - - - - - - - - - - Heated by solar . . . . . . . - - - - - - - - - - - - Heated other way. . . . . . . 2 - 1 - - - - - - - - 1 Cold only in the unit . . . . . 3 1 - - - - - - - 2 - - Cold only outside the unit. . . 7 - 1 - - - - 2 1 3 - - No piped water. . . . . . . . . 1,072 223 93 60 58 58 136 58 129 107 102 48 BATHTUB OR SHOWER Total . . . . . . . . . . . . 1,084 224 95 60 58 58 136 60 130 112 102 49 Bathtub/shower in unit. . . . . 17 12 - - - - 1 - 1 1 1 1 Bathtub/shower in building. . . 8 3 2 1 - - - 1 - - 1 - Bathtub/shower outside. . . . . 474 141 86 36 - - 99 49 41 17 5 - None. . . . . . . . . . . . . . 585 68 7 23 58 58 36 10 88 94 95 48 FLUSH TOILET Total . . . . . . . . . . . . 1,084 224 95 60 58 58 136 60 130 112 102 49 Flush toilet. . . . . . . . . . 299 163 32 - 8 - 12 10 32 20 19 3 In the unit . . . . . . . . . 16 12 1 - - - - - 1 1 1 - In this building. . . . . . . 6 3 - - 1 - - 1 - 1 - - Outside . . . . . . . . . . . 277 148 31 - 7 - 12 9 31 18 18 3 None. . . . . . . . . . . . . . 785 61 63 60 50 58 124 50 98 92 83 46 SOURCE OF WATER Total . . . . . . . . . . . . 1,084 224 95 60 58 58 136 60 130 112 102 49 Public system only. . . . . . . - - - - - - - - - - - - Community system only . . . . . 2 - - - - - 2 - - - - - Public system and catchment . . - - - - - - - - - - - - Community system and catchment. 6 1 - - - - 5 - - - - - Individual well . . . . . . . . 2 - - - - - 1 - - 1 - - Catchment, tank, drum only. . . 1,072 221 95 60 58 58 128 60 130 111 102 49 Public standpipe or hydrant . . - - - - - - - - - - - - Distilled water . . . . . . . . - - - - - - - - - - - - Other source. . . . . . . . . . 2 2 - - - - - - - - - - WASTE DISPOSAL Total . . . . . . . . . . . . 1,084 224 95 60 58 58 136 60 130 112 102 49 Public sewer. . . . . . . . . . 1 - - - - - - - - 1 - - Septic tank or cesspool . . . . 70 49 7 - 1 - - 1 5 5 1 1 Use other means . . . . . . . . 1,013 175 88 60 57 58 136 59 125 106 101 48 ─────────────────────────────────────────────────────────────────────────────────────────────────────────── Source: 2000 FSM Census
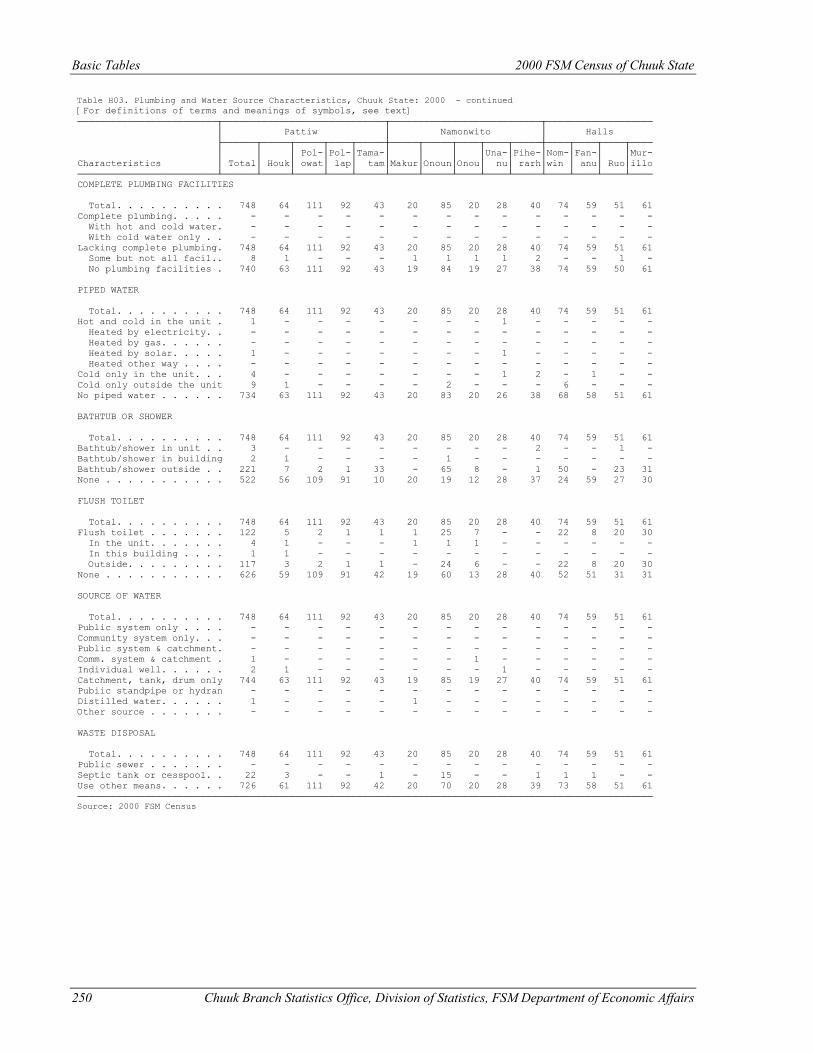
Basic Tables 2000 FSM Census of Chuuk State
250 Chuuk Branch Statistics Office, Division of Statistics, FSM Department of Economic Affairs
Table H03. Plumbing and Water Source Characteristics, Chuuk State: 2000 - continued [For definitions of terms and meanings of symbols, see text] ─────────────────────────┬─────────────────────────────┬───────────────────────────┬─────────────────── │ Pattiw │ Namonwito │ Halls ├──────┬─────┬─────┬────┬─────┼─────┬─────┬────┬────┬─────┼────┬────┬────┬──── │ │ │ Pol-│Pol-│Tama-│ │ │ │Una-│Pihe-│Nom-│Fan-│ │Mur- Characteristics │ Total│ Houk│ owat│ lap│ tam│Makur│Onoun│Onou│ nu│ rarh│win │ anu│ Ruo│illo ─────────────────────────┴──────┴─────┴─────┴────┴─────┴─────┴─────┴────┴────┴─────┴────┴────┴────┴──── COMPLETE PLUMBING FACILITIES Total. . . . . . . . . . 748 64 111 92 43 20 85 20 28 40 74 59 51 61 Complete plumbing. . . . . - - - - - - - - - - - - - - With hot and cold water. - - - - - - - - - - - - - - With cold water only . . - - - - - - - - - - - - - - Lacking complete plumbing. 748 64 111 92 43 20 85 20 28 40 74 59 51 61 Some but not all facil.. 8 1 - - - 1 1 1 1 2 - - 1 - No plumbing facilities . 740 63 111 92 43 19 84 19 27 38 74 59 50 61 PIPED WATER Total. . . . . . . . . . 748 64 111 92 43 20 85 20 28 40 74 59 51 61 Hot and cold in the unit . 1 - - - - - - - 1 - - - - - Heated by electricity. . - - - - - - - - - - - - - - Heated by gas. . . . . . - - - - - - - - - - - - - - Heated by solar. . . . . 1 - - - - - - - 1 - - - - - Heated other way . . . . - - - - - - - - - - - - - - Cold only in the unit. . . 4 - - - - - - - 1 2 - 1 - - Cold only outside the unit 9 1 - - - - 2 - - - 6 - - - No piped water . . . . . . 734 63 111 92 43 20 83 20 26 38 68 58 51 61 BATHTUB OR SHOWER Total. . . . . . . . . . 748 64 111 92 43 20 85 20 28 40 74 59 51 61 Bathtub/shower in unit . . 3 - - - - - - - - 2 - - 1 - Bathtub/shower in building 2 1 - - - - 1 - - - - - - - Bathtub/shower outside . . 221 7 2 1 33 - 65 8 - 1 50 - 23 31 None . . . . . . . . . . . 522 56 109 91 10 20 19 12 28 37 24 59 27 30 FLUSH TOILET Total. . . . . . . . . . 748 64 111 92 43 20 85 20 28 40 74 59 51 61 Flush toilet . . . . . . . 122 5 2 1 1 1 25 7 - - 22 8 20 30 In the unit. . . . . . . 4 1 - - - 1 1 1 - - - - - - In this building . . . . 1 1 - - - - - - - - - - - - Outside. . . . . . . . . 117 3 2 1 1 - 24 6 - - 22 8 20 30 None . . . . . . . . . . . 626 59 109 91 42 19 60 13 28 40 52 51 31 31 SOURCE OF WATER Total. . . . . . . . . . 748 64 111 92 43 20 85 20 28 40 74 59 51 61 Public system only . . . . - - - - - - - - - - - - - - Community system only. . . - - - - - - - - - - - - - - Public system & catchment. - - - - - - - - - - - - - - Comm. system & catchment . 1 - - - - - - 1 - - - - - - Individual well. . . . . . 2 1 - - - - - - 1 - - - - - Catchment, tank, drum only 744 63 111 92 43 19 85 19 27 40 74 59 51 61 Pubiic standpipe or hydran - - - - - - - - - - - - - - Distilled water. . . . . . 1 - - - - 1 - - - - - - - - Other source . . . . . . . - - - - - - - - - - - - - - WASTE DISPOSAL Total. . . . . . . . . . 748 64 111 92 43 20 85 20 28 40 74 59 51 61 Public sewer . . . . . . . - - - - - - - - - - - - - - Septic tank or cesspool. . 22 3 - - 1 - 15 - - 1 1 1 - - Use other means. . . . . . 726 61 111 92 42 20 70 20 28 39 73 58 51 61 ─────────────────────────────────────────────────────────────────────────────────────────────────────── Source: 2000 FSM Census
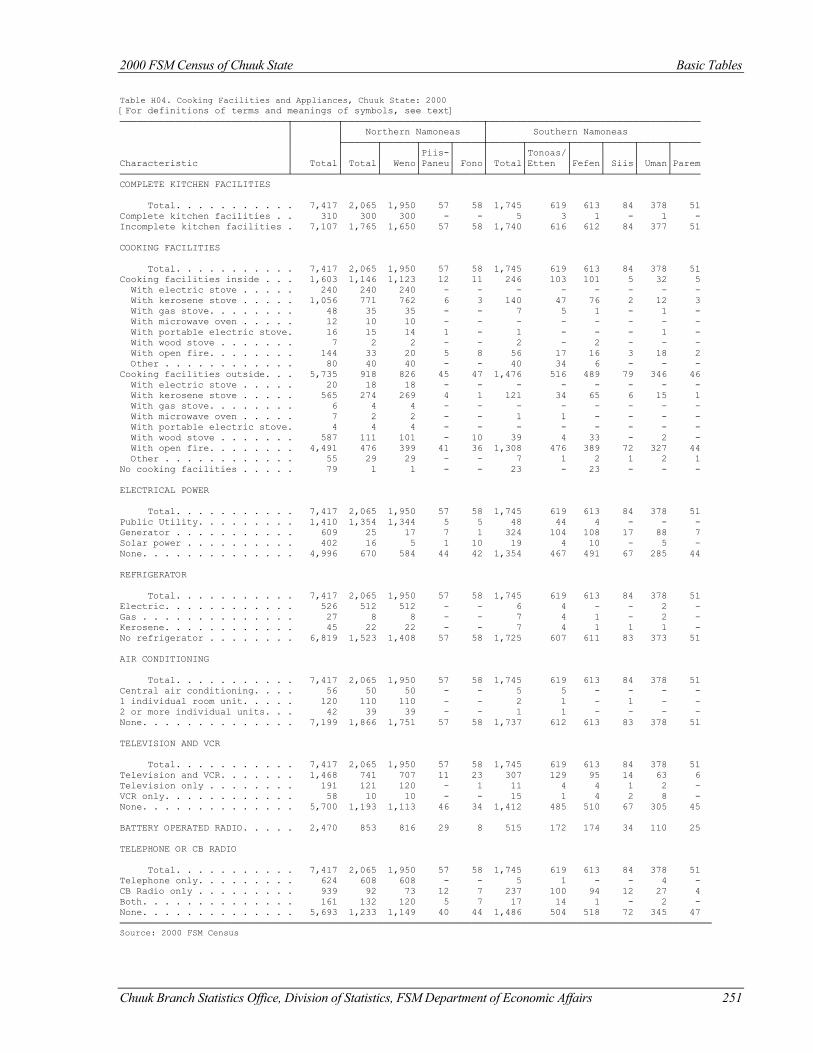
2000 FSM Census of Chuuk State Basic Tables
Chuuk Branch Statistics Office, Division of Statistics, FSM Department of Economic Affairs 251
Table H04. Cooking Facilities and Appliances, Chuuk State: 2000 [For definitions of terms and meanings of symbols, see text] ──────────────────────────────┬────────┬─────────────────────────┬────────────────────────────────────── │ │ Northern Namoneas │ Southern Namoneas │ ├──────┬──────┬─────┬─────┼──────┬───────┬─────┬─────┬─────┬───── │ │ │ │Piis-│ │ │Tonoas/│ │ │ │ Characteristic │ Total│ Total│ Weno│Paneu│ Fono│ Total│Etten │Fefen│ Siis│ Uman│Parem ──────────────────────────────┴────────┴──────┴──────┴─────┴─────┴──────┴───────┴─────┴─────┴─────┴───── COMPLETE KITCHEN FACILITIES Total. . . . . . . . . . . 7,417 2,065 1,950 57 58 1,745 619 613 84 378 51 Complete kitchen facilities . . 310 300 300 - - 5 3 1 - 1 - Incomplete kitchen facilities . 7,107 1,765 1,650 57 58 1,740 616 612 84 377 51 COOKING FACILITIES Total. . . . . . . . . . . 7,417 2,065 1,950 57 58 1,745 619 613 84 378 51 Cooking facilities inside . . . 1,603 1,146 1,123 12 11 246 103 101 5 32 5 With electric stove . . . . . 240 240 240 - - - - - - - - With kerosene stove . . . . . 1,056 771 762 6 3 140 47 76 2 12 3 With gas stove. . . . . . . . 48 35 35 - - 7 5 1 - 1 - With microwave oven . . . . . 12 10 10 - - - - - - - - With portable electric stove. 16 15 14 1 - 1 - - - 1 - With wood stove . . . . . . . 7 2 2 - - 2 - 2 - - - With open fire. . . . . . . . 144 33 20 5 8 56 17 16 3 18 2 Other . . . . . . . . . . . . 80 40 40 - - 40 34 6 - - - Cooking facilities outside. . . 5,735 918 826 45 47 1,476 516 489 79 346 46 With electric stove . . . . . 20 18 18 - - - - - - - - With kerosene stove . . . . . 565 274 269 4 1 121 34 65 6 15 1 With gas stove. . . . . . . . 6 4 4 - - - - - - - - With microwave oven . . . . . 7 2 2 - - 1 1 - - - - With portable electric stove. 4 4 4 - - - - - - - - With wood stove . . . . . . . 587 111 101 - 10 39 4 33 - 2 - With open fire. . . . . . . . 4,491 476 399 41 36 1,308 476 389 72 327 44 Other . . . . . . . . . . . . 55 29 29 - - 7 1 2 1 2 1 No cooking facilities . . . . . 79 1 1 - - 23 - 23 - - - ELECTRICAL POWER Total. . . . . . . . . . . 7,417 2,065 1,950 57 58 1,745 619 613 84 378 51 Public Utility. . . . . . . . . 1,410 1,354 1,344 5 5 48 44 4 - - - Generator . . . . . . . . . . . 609 25 17 7 1 324 104 108 17 88 7 Solar power . . . . . . . . . . 402 16 5 1 10 19 4 10 - 5 - None. . . . . . . . . . . . . . 4,996 670 584 44 42 1,354 467 491 67 285 44 REFRIGERATOR Total. . . . . . . . . . . 7,417 2,065 1,950 57 58 1,745 619 613 84 378 51 Electric. . . . . . . . . . . . 526 512 512 - - 6 4 - - 2 - Gas . . . . . . . . . . . . . . 27 8 8 - - 7 4 1 - 2 - Kerosene. . . . . . . . . . . . 45 22 22 - - 7 4 1 1 1 - No refrigerator . . . . . . . . 6,819 1,523 1,408 57 58 1,725 607 611 83 373 51 AIR CONDITIONING Total. . . . . . . . . . . 7,417 2,065 1,950 57 58 1,745 619 613 84 378 51 Central air conditioning. . . . 56 50 50 - - 5 5 - - - - 1 individual room unit. . . . . 120 110 110 - - 2 1 - 1 - - 2 or more individual units. . . 42 39 39 - - 1 1 - - - - None. . . . . . . . . . . . . . 7,199 1,866 1,751 57 58 1,737 612 613 83 378 51 TELEVISION AND VCR Total. . . . . . . . . . . 7,417 2,065 1,950 57 58 1,745 619 613 84 378 51 Television and VCR. . . . . . . 1,468 741 707 11 23 307 129 95 14 63 6 Television only . . . . . . . . 191 121 120 - 1 11 4 4 1 2 - VCR only. . . . . . . . . . . . 58 10 10 - - 15 1 4 2 8 - None. . . . . . . . . . . . . . 5,700 1,193 1,113 46 34 1,412 485 510 67 305 45 BATTERY OPERATED RADIO. . . . . 2,470 853 816 29 8 515 172 174 34 110 25 TELEPHONE OR CB RADIO Total. . . . . . . . . . . 7,417 2,065 1,950 57 58 1,745 619 613 84 378 51 Telephone only. . . . . . . . . 624 608 608 - - 5 1 - - 4 - CB Radio only . . . . . . . . . 939 92 73 12 7 237 100 94 12 27 4 Both. . . . . . . . . . . . . . 161 132 120 5 7 17 14 1 - 2 - None. . . . . . . . . . . . . . 5,693 1,233 1,149 40 44 1,486 504 518 72 345 47 ────────────────────────────────────────────────────────────────────────────────────────────────────────── Source: 2000 FSM Census
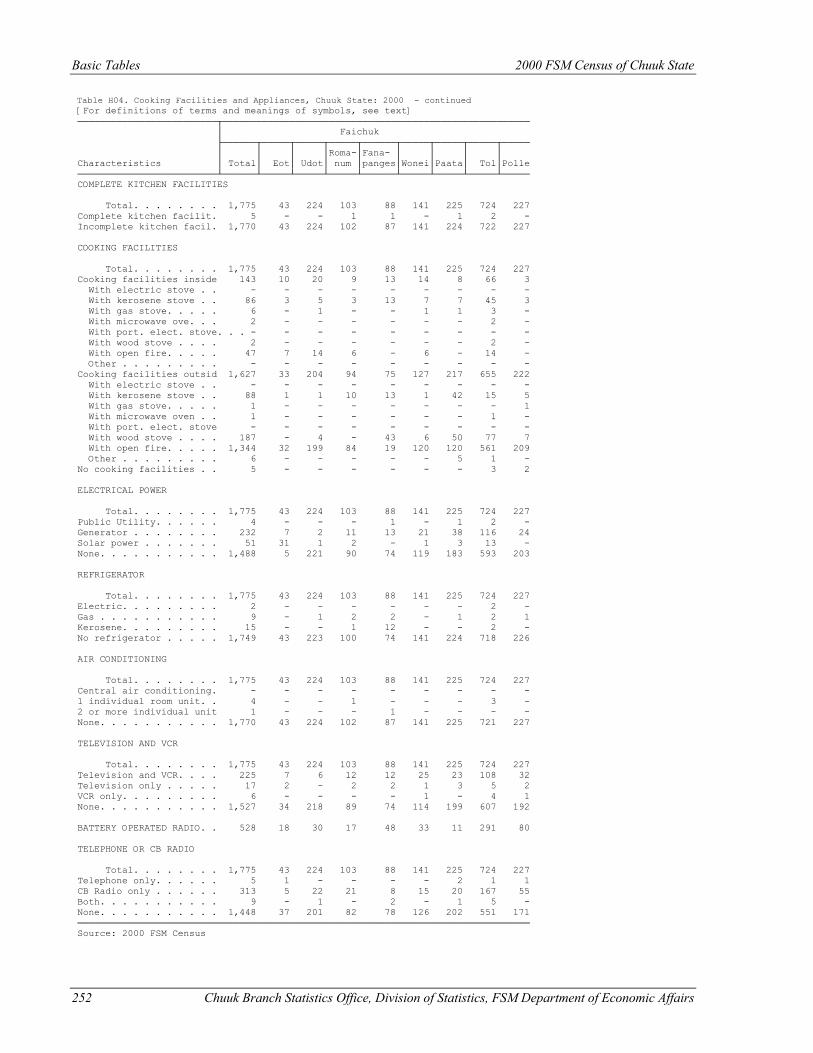
Basic Tables 2000 FSM Census of Chuuk State
252 Chuuk Branch Statistics Office, Division of Statistics, FSM Department of Economic Affairs
Table H04. Cooking Facilities and Appliances, Chuuk State: 2000 - continued [For definitions of terms and meanings of symbols, see text] ─────────────────────────┬─────────────────────────────────────────────────────── │ Faichuk ├──────┬─────┬─────┬─────┬──────┬─────┬─────┬─────┬───── │ │ │ │Roma-│Fana- │ │ │ │ Characteristics │ Total│ Eot│ Udot│ num │panges│Wonei│Paata│ Tol│Polle ─────────────────────────┴──────┴─────┴─────┴─────┴──────┴─────┴─────┴─────┴───── COMPLETE KITCHEN FACILITIES Total. . . . . . . . 1,775 43 224 103 88 141 225 724 227 Complete kitchen facilit. 5 - - 1 1 - 1 2 - Incomplete kitchen facil. 1,770 43 224 102 87 141 224 722 227 COOKING FACILITIES Total. . . . . . . . 1,775 43 224 103 88 141 225 724 227 Cooking facilities inside 143 10 20 9 13 14 8 66 3 With electric stove . . - - - - - - - - - With kerosene stove . . 86 3 5 3 13 7 7 45 3 With gas stove. . . . . 6 - 1 - - 1 1 3 - With microwave ove. . . 2 - - - - - - 2 - With port. elect. stove. . . - - - - - - - - - With wood stove . . . . 2 - - - - - - 2 - With open fire. . . . . 47 7 14 6 - 6 - 14 - Other . . . . . . . . . - - - - - - - - - Cooking facilities outsid 1,627 33 204 94 75 127 217 655 222 With electric stove . . - - - - - - - - - With kerosene stove . . 88 1 1 10 13 1 42 15 5 With gas stove. . . . . 1 - - - - - - - 1 With microwave oven . . 1 - - - - - - 1 - With port. elect. stove - - - - - - - - - With wood stove . . . . 187 - 4 - 43 6 50 77 7 With open fire. . . . . 1,344 32 199 84 19 120 120 561 209 Other . . . . . . . . . 6 - - - - - 5 1 - No cooking facilities . . 5 - - - - - - 3 2 ELECTRICAL POWER Total. . . . . . . . 1,775 43 224 103 88 141 225 724 227 Public Utility. . . . . . 4 - - - 1 - 1 2 - Generator . . . . . . . . 232 7 2 11 13 21 38 116 24 Solar power . . . . . . . 51 31 1 2 - 1 3 13 - None. . . . . . . . . . . 1,488 5 221 90 74 119 183 593 203 REFRIGERATOR Total. . . . . . . . 1,775 43 224 103 88 141 225 724 227 Electric. . . . . . . . . 2 - - - - - - 2 - Gas . . . . . . . . . . . 9 - 1 2 2 - 1 2 1 Kerosene. . . . . . . . . 15 - - 1 12 - - 2 - No refrigerator . . . . . 1,749 43 223 100 74 141 224 718 226 AIR CONDITIONING Total. . . . . . . . 1,775 43 224 103 88 141 225 724 227 Central air conditioning. - - - - - - - - - 1 individual room unit. . 4 - - 1 - - - 3 - 2 or more individual unit 1 - - - 1 - - - - None. . . . . . . . . . . 1,770 43 224 102 87 141 225 721 227 TELEVISION AND VCR Total. . . . . . . . 1,775 43 224 103 88 141 225 724 227 Television and VCR. . . . 225 7 6 12 12 25 23 108 32 Television only . . . . . 17 2 - 2 2 1 3 5 2 VCR only. . . . . . . . . 6 - - - - 1 - 4 1 None. . . . . . . . . . . 1,527 34 218 89 74 114 199 607 192 BATTERY OPERATED RADIO. . 528 18 30 17 48 33 11 291 80 TELEPHONE OR CB RADIO Total. . . . . . . . 1,775 43 224 103 88 141 225 724 227 Telephone only. . . . . . 5 1 - - - - 2 1 1 CB Radio only . . . . . . 313 5 22 21 8 15 20 167 55 Both. . . . . . . . . . . 9 - 1 - 2 - 1 5 - None. . . . . . . . . . . 1,448 37 201 82 78 126 202 551 171 ───────────────────────────────────────────────────────────────────────────────── Source: 2000 FSM Census
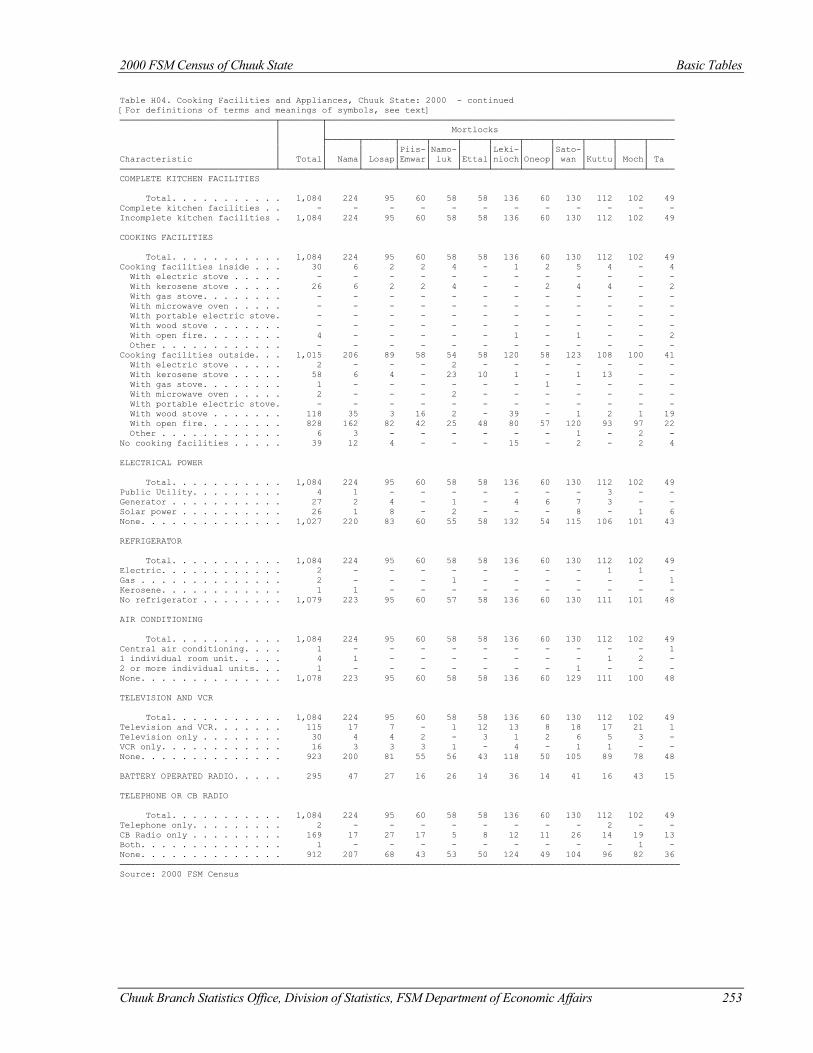
2000 FSM Census of Chuuk State Basic Tables
Chuuk Branch Statistics Office, Division of Statistics, FSM Department of Economic Affairs 253
Table H04. Cooking Facilities and Appliances, Chuuk State: 2000 - continued [For definitions of terms and meanings of symbols, see text] ──────────────────────────────┬────────┬─────────────────────────────────────────────────────────────────── │ │ Mortlocks │ ├──────┬──────┬─────┬─────┬─────┬─────┬─────┬─────┬─────┬─────┬───── │ │ │ │Piis-│Namo-│ │Leki-│ │Sato-│ │ │ Characteristic │ Total│ Nama│ Losap│Emwar│ luk │Ettal│nioch│Oneop│ wan │Kuttu│ Moch│ Ta ──────────────────────────────┴────────┴──────┴──────┴─────┴─────┴─────┴─────┴─────┴─────┴─────┴─────┴───── COMPLETE KITCHEN FACILITIES Total. . . . . . . . . . . 1,084 224 95 60 58 58 136 60 130 112 102 49 Complete kitchen facilities . . - - - - - - - - - - - - Incomplete kitchen facilities . 1,084 224 95 60 58 58 136 60 130 112 102 49 COOKING FACILITIES Total. . . . . . . . . . . 1,084 224 95 60 58 58 136 60 130 112 102 49 Cooking facilities inside . . . 30 6 2 2 4 - 1 2 5 4 - 4 With electric stove . . . . . - - - - - - - - - - - - With kerosene stove . . . . . 26 6 2 2 4 - - 2 4 4 - 2 With gas stove. . . . . . . . - - - - - - - - - - - - With microwave oven . . . . . - - - - - - - - - - - - With portable electric stove. - - - - - - - - - - - - With wood stove . . . . . . . - - - - - - - - - - - - With open fire. . . . . . . . 4 - - - - - 1 - 1 - - 2 Other . . . . . . . . . . . . - - - - - - - - - - - - Cooking facilities outside. . . 1,015 206 89 58 54 58 120 58 123 108 100 41 With electric stove . . . . . 2 - - - 2 - - - - - - - With kerosene stove . . . . . 58 6 4 - 23 10 1 - 1 13 - - With gas stove. . . . . . . . 1 - - - - - - 1 - - - - With microwave oven . . . . . 2 - - - 2 - - - - - - - With portable electric stove. - - - - - - - - - - - - With wood stove . . . . . . . 118 35 3 16 2 - 39 - 1 2 1 19 With open fire. . . . . . . . 828 162 82 42 25 48 80 57 120 93 97 22 Other . . . . . . . . . . . . 6 3 - - - - - - 1 - 2 - No cooking facilities . . . . . 39 12 4 - - - 15 - 2 - 2 4 ELECTRICAL POWER Total. . . . . . . . . . . 1,084 224 95 60 58 58 136 60 130 112 102 49 Public Utility. . . . . . . . . 4 1 - - - - - - - 3 - - Generator . . . . . . . . . . . 27 2 4 - 1 - 4 6 7 3 - - Solar power . . . . . . . . . . 26 1 8 - 2 - - - 8 - 1 6 None. . . . . . . . . . . . . . 1,027 220 83 60 55 58 132 54 115 106 101 43 REFRIGERATOR Total. . . . . . . . . . . 1,084 224 95 60 58 58 136 60 130 112 102 49 Electric. . . . . . . . . . . . 2 - - - - - - - - 1 1 - Gas . . . . . . . . . . . . . . 2 - - - 1 - - - - - - 1 Kerosene. . . . . . . . . . . . 1 1 - - - - - - - - - - No refrigerator . . . . . . . . 1,079 223 95 60 57 58 136 60 130 111 101 48 AIR CONDITIONING Total. . . . . . . . . . . 1,084 224 95 60 58 58 136 60 130 112 102 49 Central air conditioning. . . . 1 - - - - - - - - - - 1 1 individual room unit. . . . . 4 1 - - - - - - - 1 2 - 2 or more individual units. . . 1 - - - - - - - 1 - - - None. . . . . . . . . . . . . . 1,078 223 95 60 58 58 136 60 129 111 100 48 TELEVISION AND VCR Total. . . . . . . . . . . 1,084 224 95 60 58 58 136 60 130 112 102 49 Television and VCR. . . . . . . 115 17 7 - 1 12 13 8 18 17 21 1 Television only . . . . . . . . 30 4 4 2 - 3 1 2 6 5 3 - VCR only. . . . . . . . . . . . 16 3 3 3 1 - 4 - 1 1 - - None. . . . . . . . . . . . . . 923 200 81 55 56 43 118 50 105 89 78 48 BATTERY OPERATED RADIO. . . . . 295 47 27 16 26 14 36 14 41 16 43 15 TELEPHONE OR CB RADIO Total. . . . . . . . . . . 1,084 224 95 60 58 58 136 60 130 112 102 49 Telephone only. . . . . . . . . 2 - - - - - - - - 2 - - CB Radio only . . . . . . . . . 169 17 27 17 5 8 12 11 26 14 19 13 Both. . . . . . . . . . . . . . 1 - - - - - - - - - 1 - None. . . . . . . . . . . . . . 912 207 68 43 53 50 124 49 104 96 82 36 ──────────────────────────────────────────────────────────────────────────────────────────────────────────── Source: 2000 FSM Census
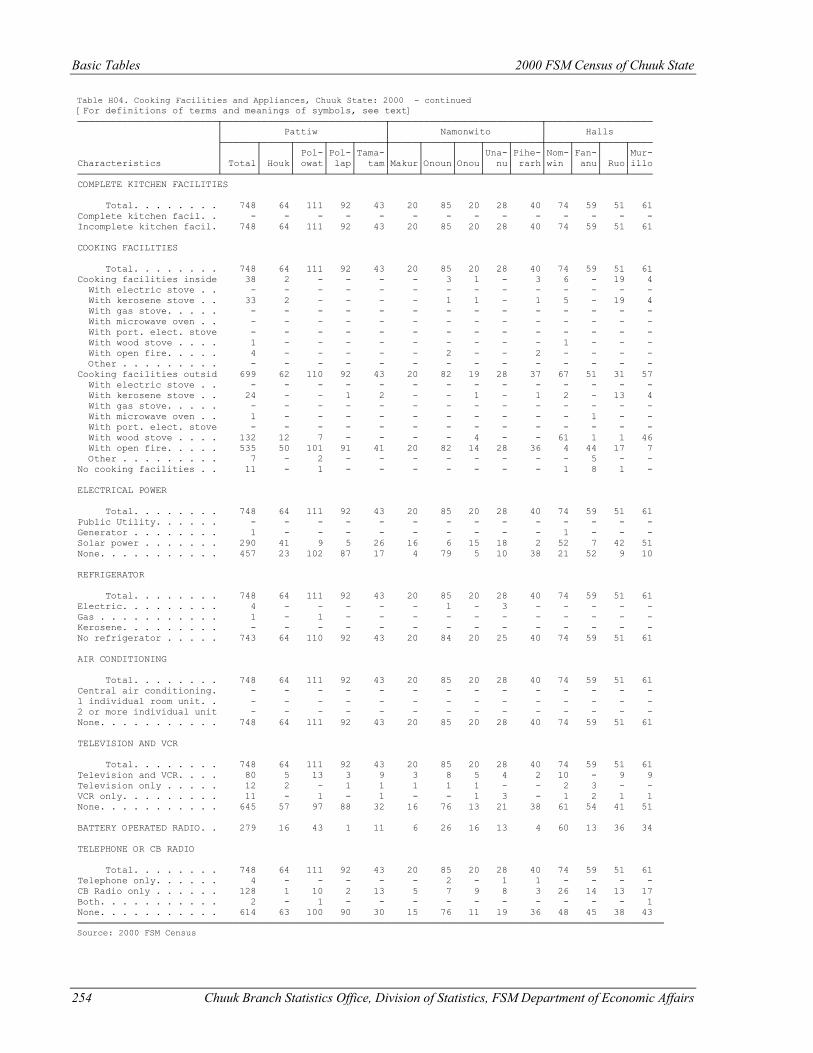
Basic Tables 2000 FSM Census of Chuuk State
254 Chuuk Branch Statistics Office, Division of Statistics, FSM Department of Economic Affairs
Table H04. Cooking Facilities and Appliances, Chuuk State: 2000 - continued [For definitions of terms and meanings of symbols, see text] ─────────────────────────┬─────────────────────────────┬───────────────────────────┬─────────────────── │ Pattiw │ Namonwito │ Halls ├──────┬─────┬─────┬────┬─────┼─────┬─────┬────┬────┬─────┼────┬────┬────┬──── │ │ │ Pol-│Pol-│Tama-│ │ │ │Una-│Pihe-│Nom-│Fan-│ │Mur- Characteristics │ Total│ Houk│ owat│ lap│ tam│Makur│Onoun│Onou│ nu│ rarh│win │ anu│ Ruo│illo ─────────────────────────┴──────┴─────┴─────┴────┴─────┴─────┴─────┴────┴────┴─────┴────┴────┴────┴──── COMPLETE KITCHEN FACILITIES Total. . . . . . . . 748 64 111 92 43 20 85 20 28 40 74 59 51 61 Complete kitchen facil. . - - - - - - - - - - - - - - Incomplete kitchen facil. 748 64 111 92 43 20 85 20 28 40 74 59 51 61 COOKING FACILITIES Total. . . . . . . . 748 64 111 92 43 20 85 20 28 40 74 59 51 61 Cooking facilities inside 38 2 - - - - 3 1 - 3 6 - 19 4 With electric stove . . - - - - - - - - - - - - - - With kerosene stove . . 33 2 - - - - 1 1 - 1 5 - 19 4 With gas stove. . . . . - - - - - - - - - - - - - - With microwave oven . . - - - - - - - - - - - - - - With port. elect. stove - - - - - - - - - - - - - - With wood stove . . . . 1 - - - - - - - - - 1 - - - With open fire. . . . . 4 - - - - - 2 - - 2 - - - - Other . . . . . . . . . - - - - - - - - - - - - - - Cooking facilities outsid 699 62 110 92 43 20 82 19 28 37 67 51 31 57 With electric stove . . - - - - - - - - - - - - - - With kerosene stove . . 24 - - 1 2 - - 1 - 1 2 - 13 4 With gas stove. . . . . - - - - - - - - - - - - - - With microwave oven . . 1 - - - - - - - - - - 1 - - With port. elect. stove - - - - - - - - - - - - - - With wood stove . . . . 132 12 7 - - - - 4 - - 61 1 1 46 With open fire. . . . . 535 50 101 91 41 20 82 14 28 36 4 44 17 7 Other . . . . . . . . . 7 - 2 - - - - - - - - 5 - - No cooking facilities . . 11 - 1 - - - - - - - 1 8 1 - ELECTRICAL POWER Total. . . . . . . . 748 64 111 92 43 20 85 20 28 40 74 59 51 61 Public Utility. . . . . . - - - - - - - - - - - - - - Generator . . . . . . . . 1 - - - - - - - - - 1 - - - Solar power . . . . . . . 290 41 9 5 26 16 6 15 18 2 52 7 42 51 None. . . . . . . . . . . 457 23 102 87 17 4 79 5 10 38 21 52 9 10 REFRIGERATOR Total. . . . . . . . 748 64 111 92 43 20 85 20 28 40 74 59 51 61 Electric. . . . . . . . . 4 - - - - - 1 - 3 - - - - - Gas . . . . . . . . . . . 1 - 1 - - - - - - - - - - - Kerosene. . . . . . . . . - - - - - - - - - - - - - - No refrigerator . . . . . 743 64 110 92 43 20 84 20 25 40 74 59 51 61 AIR CONDITIONING Total. . . . . . . . 748 64 111 92 43 20 85 20 28 40 74 59 51 61 Central air conditioning. - - - - - - - - - - - - - - 1 individual room unit. . - - - - - - - - - - - - - - 2 or more individual unit - - - - - - - - - - - - - - None. . . . . . . . . . . 748 64 111 92 43 20 85 20 28 40 74 59 51 61 TELEVISION AND VCR Total. . . . . . . . 748 64 111 92 43 20 85 20 28 40 74 59 51 61 Television and VCR. . . . 80 5 13 3 9 3 8 5 4 2 10 - 9 9 Television only . . . . . 12 2 - 1 1 1 1 1 - - 2 3 - - VCR only. . . . . . . . . 11 - 1 - 1 - - 1 3 - 1 2 1 1 None. . . . . . . . . . . 645 57 97 88 32 16 76 13 21 38 61 54 41 51 BATTERY OPERATED RADIO. . 279 16 43 1 11 6 26 16 13 4 60 13 36 34 TELEPHONE OR CB RADIO Total. . . . . . . . 748 64 111 92 43 20 85 20 28 40 74 59 51 61 Telephone only. . . . . . 4 - - - - - 2 - 1 1 - - - - CB Radio only . . . . . . 128 1 10 2 13 5 7 9 8 3 26 14 13 17 Both. . . . . . . . . . . 2 - 1 - - - - - - - - - - 1 None. . . . . . . . . . . 614 63 100 90 30 15 76 11 19 36 48 45 38 43 ───────────────────────────────────────────────────────────────────────────────────────────────────────── Source: 2000 FSM Census
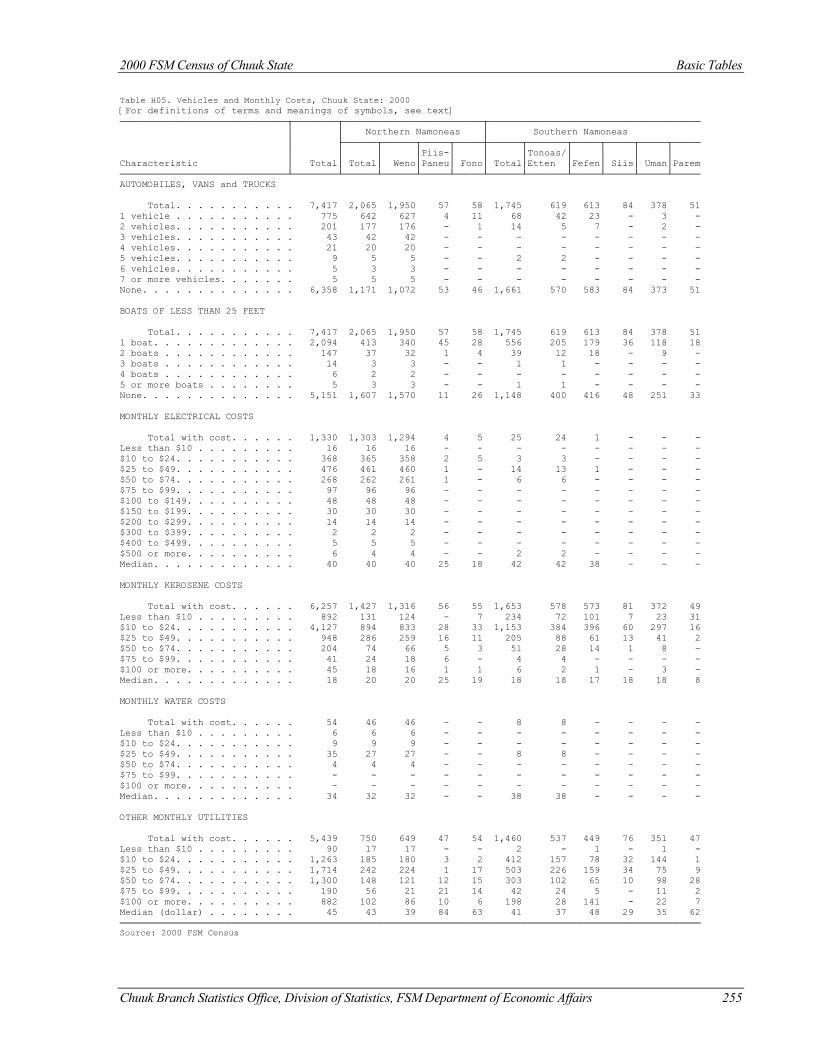
2000 FSM Census of Chuuk State Basic Tables
Chuuk Branch Statistics Office, Division of Statistics, FSM Department of Economic Affairs 255
Table H05. Vehicles and Monthly Costs, Chuuk State: 2000 [For definitions of terms and meanings of symbols, see text] ──────────────────────────────┬────────┬─────────────────────────┬────────────────────────────────────── │ │ Northern Namoneas │ Southern Namoneas │ ├──────┬──────┬─────┬─────┼──────┬───────┬─────┬─────┬─────┬───── │ │ │ │Piis-│ │ │Tonoas/│ │ │ │ Characteristic │ Total│ Total│ Weno│Paneu│ Fono│ Total│Etten │Fefen│ Siis│ Uman│Parem ──────────────────────────────┴────────┴──────┴──────┴─────┴─────┴──────┴───────┴─────┴─────┴─────┴───── AUTOMOBILES, VANS and TRUCKS Total. . . . . . . . . . . 7,417 2,065 1,950 57 58 1,745 619 613 84 378 51 1 vehicle . . . . . . . . . . . 775 642 627 4 11 68 42 23 - 3 - 2 vehicles. . . . . . . . . . . 201 177 176 - 1 14 5 7 - 2 - 3 vehicles. . . . . . . . . . . 43 42 42 - - - - - - - - 4 vehicles. . . . . . . . . . . 21 20 20 - - - - - - - - 5 vehicles. . . . . . . . . . . 9 5 5 - - 2 2 - - - - 6 vehicles. . . . . . . . . . . 5 3 3 - - - - - - - - 7 or more vehicles. . . . . . . 5 5 5 - - - - - - - - None. . . . . . . . . . . . . . 6,358 1,171 1,072 53 46 1,661 570 583 84 373 51 BOATS OF LESS THAN 25 FEET Total. . . . . . . . . . . 7,417 2,065 1,950 57 58 1,745 619 613 84 378 51 1 boat. . . . . . . . . . . . . 2,094 413 340 45 28 556 205 179 36 118 18 2 boats . . . . . . . . . . . . 147 37 32 1 4 39 12 18 - 9 - 3 boats . . . . . . . . . . . . 14 3 3 - - 1 1 - - - - 4 boats . . . . . . . . . . . . 6 2 2 - - - - - - - - 5 or more boats . . . . . . . . 5 3 3 - - 1 1 - - - - None. . . . . . . . . . . . . . 5,151 1,607 1,570 11 26 1,148 400 416 48 251 33 MONTHLY ELECTRICAL COSTS Total with cost. . . . . . 1,330 1,303 1,294 4 5 25 24 1 - - - Less than $10 . . . . . . . . . 16 16 16 - - - - - - - - $10 to $24. . . . . . . . . . . 368 365 358 2 5 3 3 - - - - $25 to $49. . . . . . . . . . . 476 461 460 1 - 14 13 1 - - - $50 to $74. . . . . . . . . . . 268 262 261 1 - 6 6 - - - - $75 to $99. . . . . . . . . . . 97 96 96 - - - - - - - - $100 to $149. . . . . . . . . . 48 48 48 - - - - - - - - $150 to $199. . . . . . . . . . 30 30 30 - - - - - - - - $200 to $299. . . . . . . . . . 14 14 14 - - - - - - - - $300 to $399. . . . . . . . . . 2 2 2 - - - - - - - - $400 to $499. . . . . . . . . . 5 5 5 - - - - - - - - $500 or more. . . . . . . . . . 6 4 4 - - 2 2 - - - - Median. . . . . . . . . . . . . 40 40 40 25 18 42 42 38 - - - MONTHLY KEROSENE COSTS Total with cost. . . . . . 6,257 1,427 1,316 56 55 1,653 578 573 81 372 49 Less than $10 . . . . . . . . . 892 131 124 - 7 234 72 101 7 23 31 $10 to $24. . . . . . . . . . . 4,127 894 833 28 33 1,153 384 396 60 297 16 $25 to $49. . . . . . . . . . . 948 286 259 16 11 205 88 61 13 41 2 $50 to $74. . . . . . . . . . . 204 74 66 5 3 51 28 14 1 8 - $75 to $99. . . . . . . . . . . 41 24 18 6 - 4 4 - - - - $100 or more. . . . . . . . . . 45 18 16 1 1 6 2 1 - 3 - Median. . . . . . . . . . . . . 18 20 20 25 19 18 18 17 18 18 8 MONTHLY WATER COSTS Total with cost. . . . . . 54 46 46 - - 8 8 - - - - Less than $10 . . . . . . . . . 6 6 6 - - - - - - - - $10 to $24. . . . . . . . . . . 9 9 9 - - - - - - - - $25 to $49. . . . . . . . . . . 35 27 27 - - 8 8 - - - - $50 to $74. . . . . . . . . . . 4 4 4 - - - - - - - - $75 to $99. . . . . . . . . . . - - - - - - - - - - - $100 or more. . . . . . . . . . - - - - - - - - - - - Median. . . . . . . . . . . . . 34 32 32 - - 38 38 - - - - OTHER MONTHLY UTILITIES Total with cost. . . . . . 5,439 750 649 47 54 1,460 537 449 76 351 47 Less than $10 . . . . . . . . . 90 17 17 - - 2 - 1 - 1 - $10 to $24. . . . . . . . . . . 1,263 185 180 3 2 412 157 78 32 144 1 $25 to $49. . . . . . . . . . . 1,714 242 224 1 17 503 226 159 34 75 9 $50 to $74. . . . . . . . . . . 1,300 148 121 12 15 303 102 65 10 98 28 $75 to $99. . . . . . . . . . . 190 56 21 21 14 42 24 5 - 11 2 $100 or more. . . . . . . . . . 882 102 86 10 6 198 28 141 - 22 7 Median (dollar) . . . . . . . . 45 43 39 84 63 41 37 48 29 35 62 ──────────────────────────────────────────────────────────────────────────────────────────────────────── Source: 2000 FSM Census
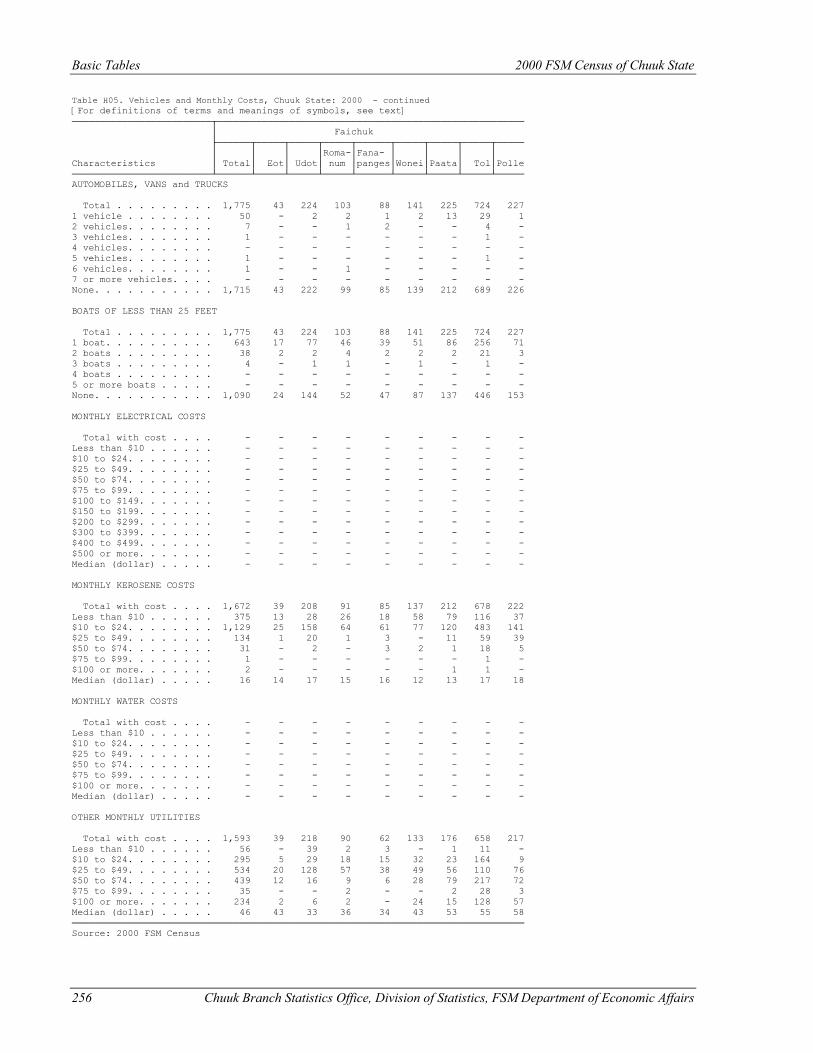
Basic Tables 2000 FSM Census of Chuuk State
256 Chuuk Branch Statistics Office, Division of Statistics, FSM Department of Economic Affairs
Table H05. Vehicles and Monthly Costs, Chuuk State: 2000 - continued [For definitions of terms and meanings of symbols, see text] ─────────────────────────┬─────────────────────────────────────────────────────── │ Faichuk ├──────┬─────┬─────┬─────┬──────┬─────┬─────┬─────┬───── │ │ │ │Roma-│Fana- │ │ │ │ Characteristics │ Total│ Eot│ Udot│ num │panges│Wonei│Paata│ Tol│Polle ─────────────────────────┴──────┴─────┴─────┴─────┴──────┴─────┴─────┴─────┴───── AUTOMOBILES, VANS and TRUCKS Total . . . . . . . . . 1,775 43 224 103 88 141 225 724 227 1 vehicle . . . . . . . . 50 - 2 2 1 2 13 29 1 2 vehicles. . . . . . . . 7 - - 1 2 - - 4 - 3 vehicles. . . . . . . . 1 - - - - - - 1 - 4 vehicles. . . . . . . . - - - - - - - - - 5 vehicles. . . . . . . . 1 - - - - - - 1 - 6 vehicles. . . . . . . . 1 - - 1 - - - - - 7 or more vehicles. . . . - - - - - - - - - None. . . . . . . . . . . 1,715 43 222 99 85 139 212 689 226 BOATS OF LESS THAN 25 FEET Total . . . . . . . . . 1,775 43 224 103 88 141 225 724 227 1 boat. . . . . . . . . . 643 17 77 46 39 51 86 256 71 2 boats . . . . . . . . . 38 2 2 4 2 2 2 21 3 3 boats . . . . . . . . . 4 - 1 1 - 1 - 1 - 4 boats . . . . . . . . . - - - - - - - - - 5 or more boats . . . . . - - - - - - - - - None. . . . . . . . . . . 1,090 24 144 52 47 87 137 446 153 MONTHLY ELECTRICAL COSTS Total with cost . . . . - - - - - - - - - Less than $10 . . . . . . - - - - - - - - - $10 to $24. . . . . . . . - - - - - - - - - $25 to $49. . . . . . . . - - - - - - - - - $50 to $74. . . . . . . . - - - - - - - - - $75 to $99. . . . . . . . - - - - - - - - - $100 to $149. . . . . . . - - - - - - - - - $150 to $199. . . . . . . - - - - - - - - - $200 to $299. . . . . . . - - - - - - - - - $300 to $399. . . . . . . - - - - - - - - - $400 to $499. . . . . . . - - - - - - - - - $500 or more. . . . . . . - - - - - - - - - Median (dollar) . . . . . - - - - - - - - - MONTHLY KEROSENE COSTS Total with cost . . . . 1,672 39 208 91 85 137 212 678 222 Less than $10 . . . . . . 375 13 28 26 18 58 79 116 37 $10 to $24. . . . . . . . 1,129 25 158 64 61 77 120 483 141 $25 to $49. . . . . . . . 134 1 20 1 3 - 11 59 39 $50 to $74. . . . . . . . 31 - 2 - 3 2 1 18 5 $75 to $99. . . . . . . . 1 - - - - - - 1 - $100 or more. . . . . . . 2 - - - - - 1 1 - Median (dollar) . . . . . 16 14 17 15 16 12 13 17 18 MONTHLY WATER COSTS Total with cost . . . . - - - - - - - - - Less than $10 . . . . . . - - - - - - - - - $10 to $24. . . . . . . . - - - - - - - - - $25 to $49. . . . . . . . - - - - - - - - - $50 to $74. . . . . . . . - - - - - - - - - $75 to $99. . . . . . . . - - - - - - - - - $100 or more. . . . . . . - - - - - - - - - Median (dollar) . . . . . - - - - - - - - - OTHER MONTHLY UTILITIES Total with cost . . . . 1,593 39 218 90 62 133 176 658 217 Less than $10 . . . . . . 56 - 39 2 3 - 1 11 - $10 to $24. . . . . . . . 295 5 29 18 15 32 23 164 9 $25 to $49. . . . . . . . 534 20 128 57 38 49 56 110 76 $50 to $74. . . . . . . . 439 12 16 9 6 28 79 217 72 $75 to $99. . . . . . . . 35 - - 2 - - 2 28 3 $100 or more. . . . . . . 234 2 6 2 - 24 15 128 57 Median (dollar) . . . . . 46 43 33 36 34 43 53 55 58 ───────────────────────────────────────────────────────────────────────────────── Source: 2000 FSM Census
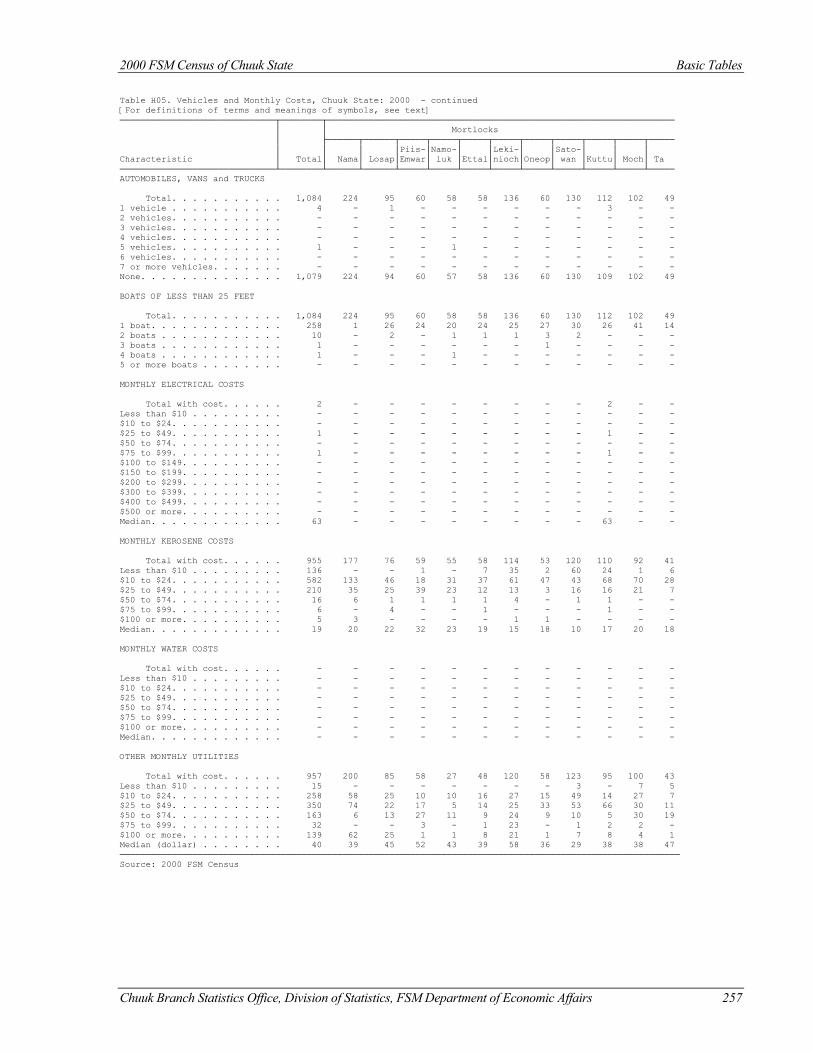
2000 FSM Census of Chuuk State Basic Tables
Chuuk Branch Statistics Office, Division of Statistics, FSM Department of Economic Affairs 257
Table H05. Vehicles and Monthly Costs, Chuuk State: 2000 - continued [For definitions of terms and meanings of symbols, see text] ──────────────────────────────┬────────┬─────────────────────────────────────────────────────────────────── │ │ Mortlocks │ ├──────┬──────┬─────┬─────┬─────┬─────┬─────┬─────┬─────┬─────┬───── │ │ │ │Piis-│Namo-│ │Leki-│ │Sato-│ │ │ Characteristic │ Total│ Nama│ Losap│Emwar│ luk │Ettal│nioch│Oneop│ wan │Kuttu│ Moch│ Ta ──────────────────────────────┴────────┴──────┴──────┴─────┴─────┴─────┴─────┴─────┴─────┴─────┴─────┴───── AUTOMOBILES, VANS and TRUCKS Total. . . . . . . . . . . 1,084 224 95 60 58 58 136 60 130 112 102 49 1 vehicle . . . . . . . . . . . 4 - 1 - - - - - - 3 - - 2 vehicles. . . . . . . . . . . - - - - - - - - - - - - 3 vehicles. . . . . . . . . . . - - - - - - - - - - - - 4 vehicles. . . . . . . . . . . - - - - - - - - - - - - 5 vehicles. . . . . . . . . . . 1 - - - 1 - - - - - - - 6 vehicles. . . . . . . . . . . - - - - - - - - - - - - 7 or more vehicles. . . . . . . - - - - - - - - - - - - None. . . . . . . . . . . . . . 1,079 224 94 60 57 58 136 60 130 109 102 49 BOATS OF LESS THAN 25 FEET Total. . . . . . . . . . . 1,084 224 95 60 58 58 136 60 130 112 102 49 1 boat. . . . . . . . . . . . . 258 1 26 24 20 24 25 27 30 26 41 14 2 boats . . . . . . . . . . . . 10 - 2 - 1 1 1 3 2 - - - 3 boats . . . . . . . . . . . . 1 - - - - - - 1 - - - - 4 boats . . . . . . . . . . . . 1 - - - 1 - - - - - - - 5 or more boats . . . . . . . . - - - - - - - - - - - - MONTHLY ELECTRICAL COSTS Total with cost. . . . . . 2 - - - - - - - - 2 - - Less than $10 . . . . . . . . . - - - - - - - - - - - - $10 to $24. . . . . . . . . . . - - - - - - - - - - - - $25 to $49. . . . . . . . . . . 1 - - - - - - - - 1 - - $50 to $74. . . . . . . . . . . - - - - - - - - - - - - $75 to $99. . . . . . . . . . . 1 - - - - - - - - 1 - - $100 to $149. . . . . . . . . . - - - - - - - - - - - - $150 to $199. . . . . . . . . . - - - - - - - - - - - - $200 to $299. . . . . . . . . . - - - - - - - - - - - - $300 to $399. . . . . . . . . . - - - - - - - - - - - - $400 to $499. . . . . . . . . . - - - - - - - - - - - - $500 or more. . . . . . . . . . - - - - - - - - - - - - Median. . . . . . . . . . . . . 63 - - - - - - - - 63 - - MONTHLY KEROSENE COSTS Total with cost. . . . . . 955 177 76 59 55 58 114 53 120 110 92 41 Less than $10 . . . . . . . . . 136 - - 1 - 7 35 2 60 24 1 6 $10 to $24. . . . . . . . . . . 582 133 46 18 31 37 61 47 43 68 70 28 $25 to $49. . . . . . . . . . . 210 35 25 39 23 12 13 3 16 16 21 7 $50 to $74. . . . . . . . . . . 16 6 1 1 1 1 4 - 1 1 - - $75 to $99. . . . . . . . . . . 6 - 4 - - 1 - - - 1 - - $100 or more. . . . . . . . . . 5 3 - - - - 1 1 - - - - Median. . . . . . . . . . . . . 19 20 22 32 23 19 15 18 10 17 20 18 MONTHLY WATER COSTS Total with cost. . . . . . - - - - - - - - - - - - Less than $10 . . . . . . . . . - - - - - - - - - - - - $10 to $24. . . . . . . . . . . - - - - - - - - - - - - $25 to $49. . . . . . . . . . . - - - - - - - - - - - - $50 to $74. . . . . . . . . . . - - - - - - - - - - - - $75 to $99. . . . . . . . . . . - - - - - - - - - - - - $100 or more. . . . . . . . . . - - - - - - - - - - - - Median. . . . . . . . . . . . . - - - - - - - - - - - - OTHER MONTHLY UTILITIES Total with cost. . . . . . 957 200 85 58 27 48 120 58 123 95 100 43 Less than $10 . . . . . . . . . 15 - - - - - - - 3 - 7 5 $10 to $24. . . . . . . . . . . 258 58 25 10 10 16 27 15 49 14 27 7 $25 to $49. . . . . . . . . . . 350 74 22 17 5 14 25 33 53 66 30 11 $50 to $74. . . . . . . . . . . 163 6 13 27 11 9 24 9 10 5 30 19 $75 to $99. . . . . . . . . . . 32 - - 3 - 1 23 - 1 2 2 - $100 or more. . . . . . . . . . 139 62 25 1 1 8 21 1 7 8 4 1 Median (dollar) . . . . . . . . 40 39 45 52 43 39 58 36 29 38 38 47 ──────────────────────────────────────────────────────────────────────────────────────────────────────────── Source: 2000 FSM Census
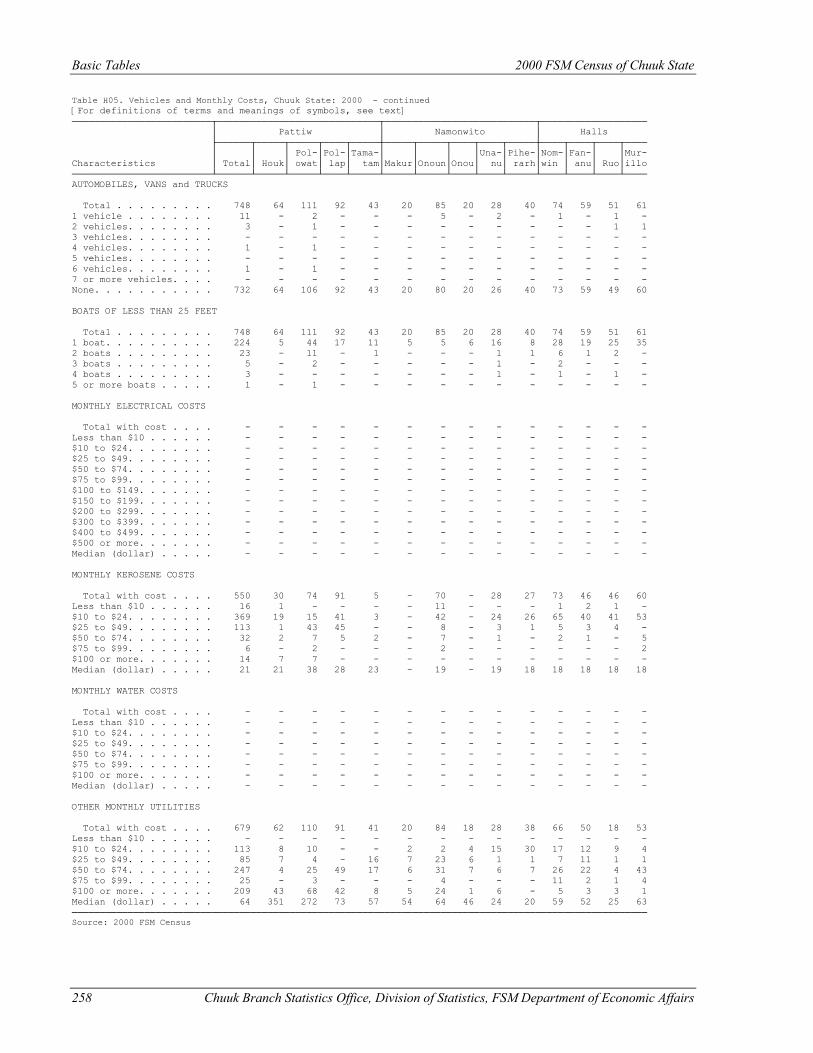
Basic Tables 2000 FSM Census of Chuuk State
258 Chuuk Branch Statistics Office, Division of Statistics, FSM Department of Economic Affairs
Table H05. Vehicles and Monthly Costs, Chuuk State: 2000 - continued [For definitions of terms and meanings of symbols, see text] ─────────────────────────┬─────────────────────────────┬───────────────────────────┬─────────────────── │ Pattiw │ Namonwito │ Halls ├──────┬─────┬─────┬────┬─────┼─────┬─────┬────┬────┬─────┼────┬────┬────┬──── │ │ │ Pol-│Pol-│Tama-│ │ │ │Una-│Pihe-│Nom-│Fan-│ │Mur- Characteristics │ Total│ Houk│ owat│ lap│ tam│Makur│Onoun│Onou│ nu│ rarh│win │ anu│ Ruo│illo ─────────────────────────┴──────┴─────┴─────┴────┴─────┴─────┴─────┴────┴────┴─────┴────┴────┴────┴──── AUTOMOBILES, VANS and TRUCKS Total . . . . . . . . . 748 64 111 92 43 20 85 20 28 40 74 59 51 61 1 vehicle . . . . . . . . 11 - 2 - - - 5 - 2 - 1 - 1 - 2 vehicles. . . . . . . . 3 - 1 - - - - - - - - - 1 1 3 vehicles. . . . . . . . - - - - - - - - - - - - - - 4 vehicles. . . . . . . . 1 - 1 - - - - - - - - - - - 5 vehicles. . . . . . . . - - - - - - - - - - - - - - 6 vehicles. . . . . . . . 1 - 1 - - - - - - - - - - - 7 or more vehicles. . . . - - - - - - - - - - - - - - None. . . . . . . . . . . 732 64 106 92 43 20 80 20 26 40 73 59 49 60 BOATS OF LESS THAN 25 FEET Total . . . . . . . . . 748 64 111 92 43 20 85 20 28 40 74 59 51 61 1 boat. . . . . . . . . . 224 5 44 17 11 5 5 6 16 8 28 19 25 35 2 boats . . . . . . . . . 23 - 11 - 1 - - - 1 1 6 1 2 - 3 boats . . . . . . . . . 5 - 2 - - - - - 1 - 2 - - - 4 boats . . . . . . . . . 3 - - - - - - - 1 - 1 - 1 - 5 or more boats . . . . . 1 - 1 - - - - - - - - - - - MONTHLY ELECTRICAL COSTS Total with cost . . . . - - - - - - - - - - - - - - Less than $10 . . . . . . - - - - - - - - - - - - - - $10 to $24. . . . . . . . - - - - - - - - - - - - - - $25 to $49. . . . . . . . - - - - - - - - - - - - - - $50 to $74. . . . . . . . - - - - - - - - - - - - - - $75 to $99. . . . . . . . - - - - - - - - - - - - - - $100 to $149. . . . . . . - - - - - - - - - - - - - - $150 to $199. . . . . . . - - - - - - - - - - - - - - $200 to $299. . . . . . . - - - - - - - - - - - - - - $300 to $399. . . . . . . - - - - - - - - - - - - - - $400 to $499. . . . . . . - - - - - - - - - - - - - - $500 or more. . . . . . . - - - - - - - - - - - - - - Median (dollar) . . . . . - - - - - - - - - - - - - - MONTHLY KEROSENE COSTS Total with cost . . . . 550 30 74 91 5 - 70 - 28 27 73 46 46 60 Less than $10 . . . . . . 16 1 - - - - 11 - - - 1 2 1 - $10 to $24. . . . . . . . 369 19 15 41 3 - 42 - 24 26 65 40 41 53 $25 to $49. . . . . . . . 113 1 43 45 - - 8 - 3 1 5 3 4 - $50 to $74. . . . . . . . 32 2 7 5 2 - 7 - 1 - 2 1 - 5 $75 to $99. . . . . . . . 6 - 2 - - - 2 - - - - - - 2 $100 or more. . . . . . . 14 7 7 - - - - - - - - - - - Median (dollar) . . . . . 21 21 38 28 23 - 19 - 19 18 18 18 18 18 MONTHLY WATER COSTS Total with cost . . . . - - - - - - - - - - - - - - Less than $10 . . . . . . - - - - - - - - - - - - - - $10 to $24. . . . . . . . - - - - - - - - - - - - - - $25 to $49. . . . . . . . - - - - - - - - - - - - - - $50 to $74. . . . . . . . - - - - - - - - - - - - - - $75 to $99. . . . . . . . - - - - - - - - - - - - - - $100 or more. . . . . . . - - - - - - - - - - - - - - Median (dollar) . . . . . - - - - - - - - - - - - - - OTHER MONTHLY UTILITIES Total with cost . . . . 679 62 110 91 41 20 84 18 28 38 66 50 18 53 Less than $10 . . . . . . - - - - - - - - - - - - - - $10 to $24. . . . . . . . 113 8 10 - - 2 2 4 15 30 17 12 9 4 $25 to $49. . . . . . . . 85 7 4 - 16 7 23 6 1 1 7 11 1 1 $50 to $74. . . . . . . . 247 4 25 49 17 6 31 7 6 7 26 22 4 43 $75 to $99. . . . . . . . 25 - 3 - - - 4 - - - 11 2 1 4 $100 or more. . . . . . . 209 43 68 42 8 5 24 1 6 - 5 3 3 1 Median (dollar) . . . . . 64 351 272 73 57 54 64 46 24 20 59 52 25 63 ─────────────────────────────────────────────────────────────────────────────────────────────────────── Source: 2000 FSM Census
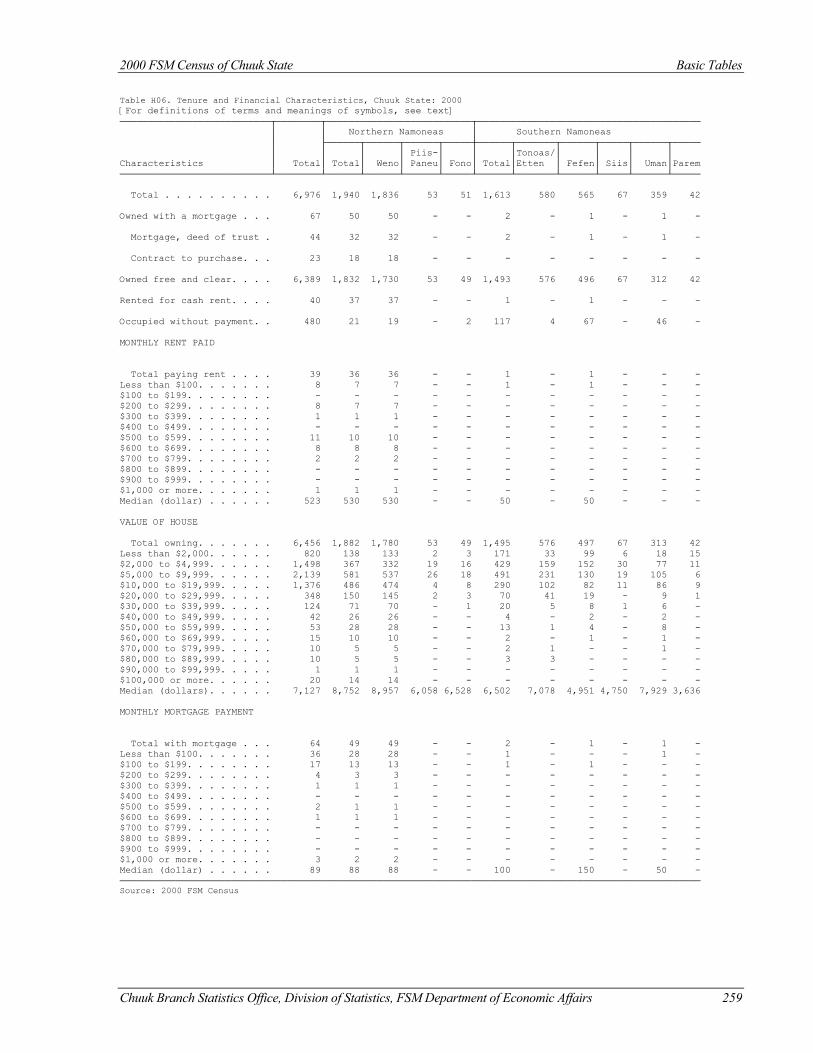
2000 FSM Census of Chuuk State Basic Tables
Chuuk Branch Statistics Office, Division of Statistics, FSM Department of Economic Affairs 259
Table H06. Tenure and Financial Characteristics, Chuuk State: 2000 [For definitions of terms and meanings of symbols, see text] ───────────────────────────┬────────┬──────────────────────────┬──────────────────────────────────────── │ │ Northern Namoneas │ Southern Namoneas │ ├──────┬──────┬──────┬─────┼──────┬───────┬──────┬─────┬──────┬───── │ │ │ │ Piis-│ │ │Tonoas/│ │ │ │ Characteristics │ Total│ Total│ Weno│ Paneu│ Fono│ Total│Etten │ Fefen│ Siis│ Uman│Parem ───────────────────────────┴────────┴──────┴──────┴──────┴─────┴──────┴───────┴──────┴─────┴──────┴───── Total . . . . . . . . . . 6,976 1,940 1,836 53 51 1,613 580 565 67 359 42 Owned with a mortgage . . . 67 50 50 - - 2 - 1 - 1 - Mortgage, deed of trust . 44 32 32 - - 2 - 1 - 1 - Contract to purchase. . . 23 18 18 - - - - - - - - Owned free and clear. . . . 6,389 1,832 1,730 53 49 1,493 576 496 67 312 42 Rented for cash rent. . . . 40 37 37 - - 1 - 1 - - - Occupied without payment. . 480 21 19 - 2 117 4 67 - 46 - MONTHLY RENT PAID Total paying rent . . . . 39 36 36 - - 1 - 1 - - - Less than $100. . . . . . . 8 7 7 - - 1 - 1 - - - $100 to $199. . . . . . . . - - - - - - - - - - - $200 to $299. . . . . . . . 8 7 7 - - - - - - - - $300 to $399. . . . . . . . 1 1 1 - - - - - - - - $400 to $499. . . . . . . . - - - - - - - - - - - $500 to $599. . . . . . . . 11 10 10 - - - - - - - - $600 to $699. . . . . . . . 8 8 8 - - - - - - - - $700 to $799. . . . . . . . 2 2 2 - - - - - - - - $800 to $899. . . . . . . . - - - - - - - - - - - $900 to $999. . . . . . . . - - - - - - - - - - - $1,000 or more. . . . . . . 1 1 1 - - - - - - - - Median (dollar) . . . . . . 523 530 530 - - 50 - 50 - - - VALUE OF HOUSE Total owning. . . . . . . 6,456 1,882 1,780 53 49 1,495 576 497 67 313 42 Less than $2,000. . . . . . 820 138 133 2 3 171 33 99 6 18 15 $2,000 to $4,999. . . . . . 1,498 367 332 19 16 429 159 152 30 77 11 $5,000 to $9,999. . . . . . 2,139 581 537 26 18 491 231 130 19 105 6 $10,000 to $19,999. . . . . 1,376 486 474 4 8 290 102 82 11 86 9 $20,000 to $29,999. . . . . 348 150 145 2 3 70 41 19 - 9 1 $30,000 to $39,999. . . . . 124 71 70 - 1 20 5 8 1 6 - $40,000 to $49,999. . . . . 42 26 26 - - 4 - 2 - 2 - $50,000 to $59,999. . . . . 53 28 28 - - 13 1 4 - 8 - $60,000 to $69,999. . . . . 15 10 10 - - 2 - 1 - 1 - $70,000 to $79,999. . . . . 10 5 5 - - 2 1 - - 1 - $80,000 to $89,999. . . . . 10 5 5 - - 3 3 - - - - $90,000 to $99,999. . . . . 1 1 1 - - - - - - - - $100,000 or more. . . . . . 20 14 14 - - - - - - - - Median (dollars). . . . . . 7,127 8,752 8,957 6,058 6,528 6,502 7,078 4,951 4,750 7,929 3,636 MONTHLY MORTGAGE PAYMENT Total with mortgage . . . 64 49 49 - - 2 - 1 - 1 - Less than $100. . . . . . . 36 28 28 - - 1 - - - 1 - $100 to $199. . . . . . . . 17 13 13 - - 1 - 1 - - - $200 to $299. . . . . . . . 4 3 3 - - - - - - - - $300 to $399. . . . . . . . 1 1 1 - - - - - - - - $400 to $499. . . . . . . . - - - - - - - - - - - $500 to $599. . . . . . . . 2 1 1 - - - - - - - - $600 to $699. . . . . . . . 1 1 1 - - - - - - - - $700 to $799. . . . . . . . - - - - - - - - - - - $800 to $899. . . . . . . . - - - - - - - - - - - $900 to $999. . . . . . . . - - - - - - - - - - - $1,000 or more. . . . . . . 3 2 2 - - - - - - - - Median (dollar) . . . . . . 89 88 88 - - 100 - 150 - 50 - ──────────────────────────────────────────────────────────────────────────────────────────────────────── Source: 2000 FSM Census
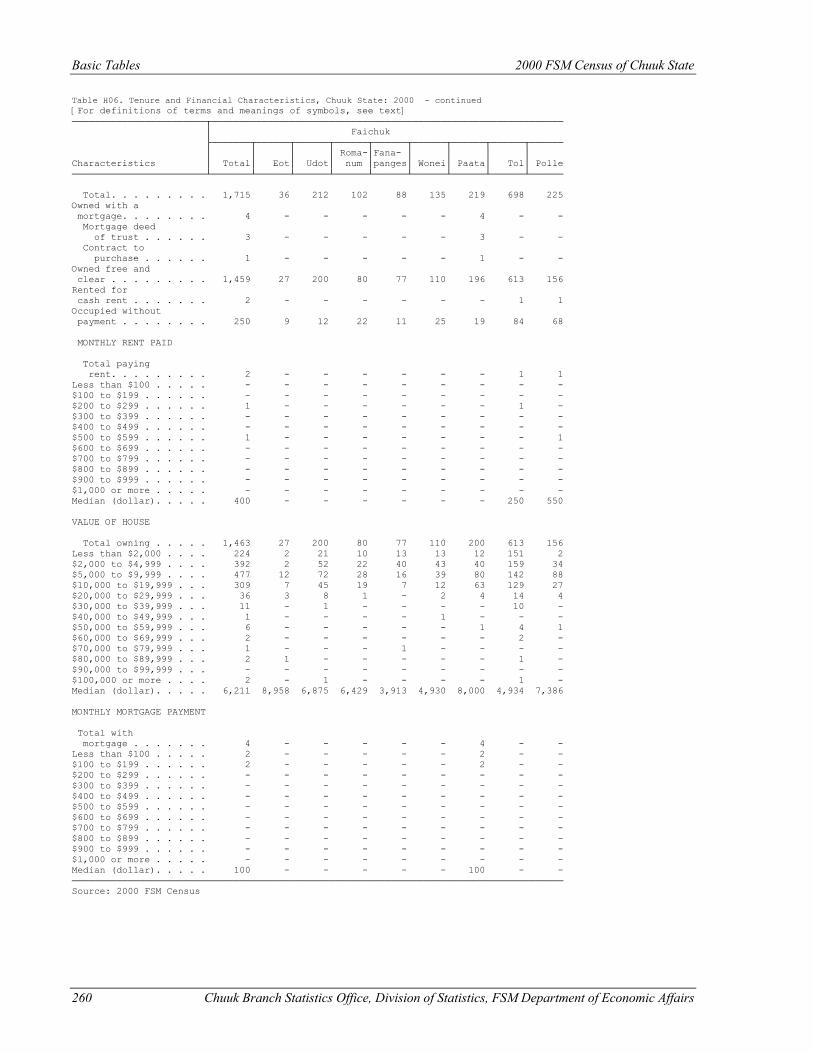
Basic Tables 2000 FSM Census of Chuuk State
260 Chuuk Branch Statistics Office, Division of Statistics, FSM Department of Economic Affairs
Table H06. Tenure and Financial Characteristics, Chuuk State: 2000 - continued [For definitions of terms and meanings of symbols, see text] ────────────────────────┬─────────────────────────────────────────────────────────────── │ Faichuk ├───────┬──────┬──────┬──────┬──────┬──────┬──────┬──────┬────── │ │ │ │ Roma-│Fana- │ │ │ │ Characteristics │ Total│ Eot│ Udot│ num │panges│ Wonei│ Paata│ Tol│ Polle ────────────────────────┴───────┴──────┴──────┴──────┴──────┴──────┴──────┴──────┴────── Total. . . . . . . . . 1,715 36 212 102 88 135 219 698 225 Owned with a mortgage. . . . . . . . 4 - - - - - 4 - - Mortgage deed of trust . . . . . . 3 - - - - - 3 - - Contract to purchase . . . . . . 1 - - - - - 1 - - Owned free and clear . . . . . . . . . 1,459 27 200 80 77 110 196 613 156 Rented for cash rent . . . . . . . 2 - - - - - - 1 1 Occupied without payment . . . . . . . . 250 9 12 22 11 25 19 84 68 MONTHLY RENT PAID Total paying rent. . . . . . . . . 2 - - - - - - 1 1 Less than $100 . . . . . - - - - - - - - - $100 to $199 . . . . . . - - - - - - - - - $200 to $299 . . . . . . 1 - - - - - - 1 - $300 to $399 . . . . . . - - - - - - - - - $400 to $499 . . . . . . - - - - - - - - - $500 to $599 . . . . . . 1 - - - - - - - 1 $600 to $699 . . . . . . - - - - - - - - - $700 to $799 . . . . . . - - - - - - - - - $800 to $899 . . . . . . - - - - - - - - - $900 to $999 . . . . . . - - - - - - - - - $1,000 or more . . . . . - - - - - - - - - Median (dollar). . . . . 400 - - - - - - 250 550 VALUE OF HOUSE Total owning . . . . . 1,463 27 200 80 77 110 200 613 156 Less than $2,000 . . . . 224 2 21 10 13 13 12 151 2 $2,000 to $4,999 . . . . 392 2 52 22 40 43 40 159 34 $5,000 to $9,999 . . . . 477 12 72 28 16 39 80 142 88 $10,000 to $19,999 . . . 309 7 45 19 7 12 63 129 27 $20,000 to $29,999 . . . 36 3 8 1 - 2 4 14 4 $30,000 to $39,999 . . . 11 - 1 - - - - 10 - $40,000 to $49,999 . . . 1 - - - - 1 - - - $50,000 to $59,999 . . . 6 - - - - - 1 4 1 $60,000 to $69,999 . . . 2 - - - - - - 2 - $70,000 to $79,999 . . . 1 - - - 1 - - - - $80,000 to $89,999 . . . 2 1 - - - - - 1 - $90,000 to $99,999 . . . - - - - - - - - - $100,000 or more . . . . 2 - 1 - - - - 1 - Median (dollar). . . . . 6,211 8,958 6,875 6,429 3,913 4,930 8,000 4,934 7,386 MONTHLY MORTGAGE PAYMENT Total with mortgage . . . . . . . 4 - - - - - 4 - - Less than $100 . . . . . 2 - - - - - 2 - - $100 to $199 . . . . . . 2 - - - - - 2 - - $200 to $299 . . . . . . - - - - - - - - - $300 to $399 . . . . . . - - - - - - - - - $400 to $499 . . . . . . - - - - - - - - - $500 to $599 . . . . . . - - - - - - - - - $600 to $699 . . . . . . - - - - - - - - - $700 to $799 . . . . . . - - - - - - - - - $800 to $899 . . . . . . - - - - - - - - - $900 to $999 . . . . . . - - - - - - - - - $1,000 or more . . . . . - - - - - - - - - Median (dollar). . . . . 100 - - - - - 100 - - ──────────────────────────────────────────────────────────────────────────────────────── Source: 2000 FSM Census
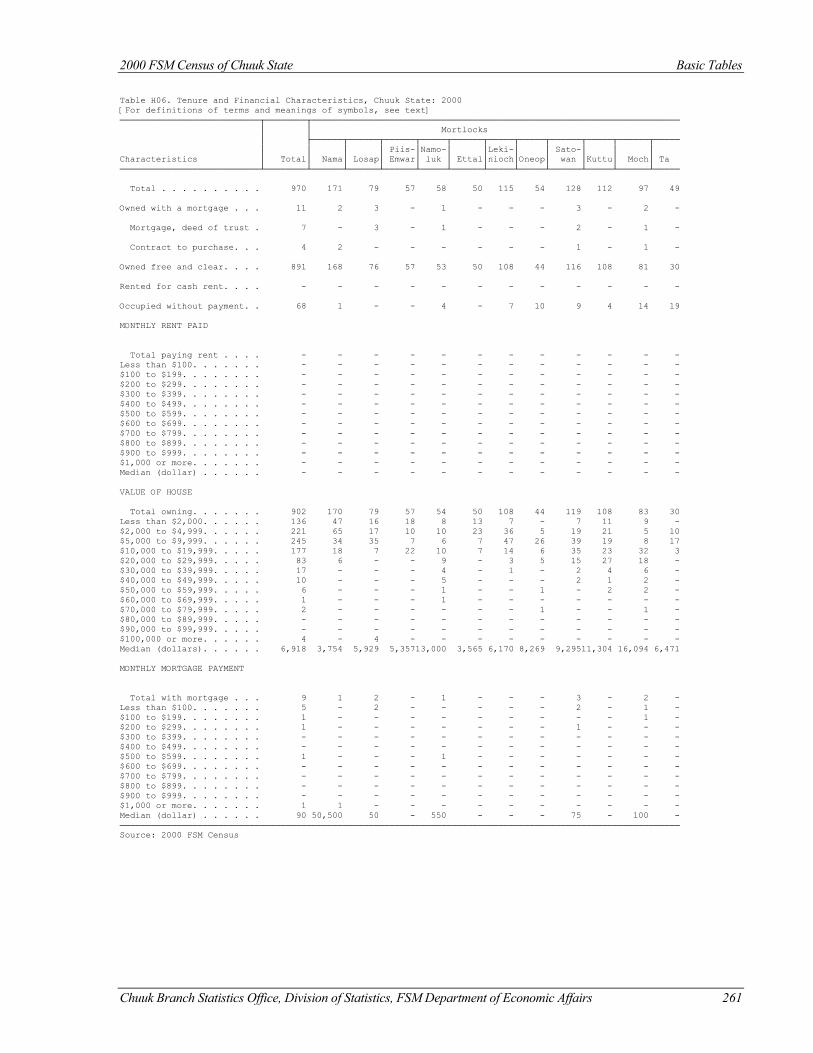
2000 FSM Census of Chuuk State Basic Tables
Chuuk Branch Statistics Office, Division of Statistics, FSM Department of Economic Affairs 261
Table H06. Tenure and Financial Characteristics, Chuuk State: 2000 [For definitions of terms and meanings of symbols, see text] ───────────────────────────┬────────┬─────────────────────────────────────────────────────────────────────── │ │ Mortlocks │ ├──────┬──────┬──────┬─────┬──────┬─────┬─────┬──────┬─────┬──────┬───── │ │ │ │ Piis-│Namo-│ │Leki-│ │ Sato-│ │ │ Characteristics │ Total│ Nama│ Losap│ Emwar│ luk │ Ettal│nioch│Oneop│ wan │Kuttu│ Moch│ Ta ───────────────────────────┴────────┴──────┴──────┴──────┴─────┴──────┴─────┴─────┴──────┴─────┴──────┴───── Total . . . . . . . . . . 970 171 79 57 58 50 115 54 128 112 97 49 Owned with a mortgage . . . 11 2 3 - 1 - - - 3 - 2 - Mortgage, deed of trust . 7 - 3 - 1 - - - 2 - 1 - Contract to purchase. . . 4 2 - - - - - - 1 - 1 - Owned free and clear. . . . 891 168 76 57 53 50 108 44 116 108 81 30 Rented for cash rent. . . . - - - - - - - - - - - - Occupied without payment. . 68 1 - - 4 - 7 10 9 4 14 19 MONTHLY RENT PAID Total paying rent . . . . - - - - - - - - - - - - Less than $100. . . . . . . - - - - - - - - - - - - $100 to $199. . . . . . . . - - - - - - - - - - - - $200 to $299. . . . . . . . - - - - - - - - - - - - $300 to $399. . . . . . . . - - - - - - - - - - - - $400 to $499. . . . . . . . - - - - - - - - - - - - $500 to $599. . . . . . . . - - - - - - - - - - - - $600 to $699. . . . . . . . - - - - - - - - - - - - $700 to $799. . . . . . . . - - - - - - - - - - - - $800 to $899. . . . . . . . - - - - - - - - - - - - $900 to $999. . . . . . . . - - - - - - - - - - - - $1,000 or more. . . . . . . - - - - - - - - - - - - Median (dollar) . . . . . . - - - - - - - - - - - - VALUE OF HOUSE Total owning. . . . . . . 902 170 79 57 54 50 108 44 119 108 83 30 Less than $2,000. . . . . . 136 47 16 18 8 13 7 - 7 11 9 - $2,000 to $4,999. . . . . . 221 65 17 10 10 23 36 5 19 21 5 10 $5,000 to $9,999. . . . . . 245 34 35 7 6 7 47 26 39 19 8 17 $10,000 to $19,999. . . . . 177 18 7 22 10 7 14 6 35 23 32 3 $20,000 to $29,999. . . . . 83 6 - - 9 - 3 5 15 27 18 - $30,000 to $39,999. . . . . 17 - - - 4 - 1 - 2 4 6 - $40,000 to $49,999. . . . . 10 - - - 5 - - - 2 1 2 - $50,000 to $59,999. . . . . 6 - - - 1 - - 1 - 2 2 - $60,000 to $69,999. . . . . 1 - - - 1 - - - - - - - $70,000 to $79,999. . . . . 2 - - - - - - 1 - - 1 - $80,000 to $89,999. . . . . - - - - - - - - - - - - $90,000 to $99,999. . . . . - - - - - - - - - - - - $100,000 or more. . . . . . 4 - 4 - - - - - - - - - Median (dollars). . . . . . 6,918 3,754 5,929 5,35713,000 3,565 6,170 8,269 9,29511,304 16,094 6,471 MONTHLY MORTGAGE PAYMENT Total with mortgage . . . 9 1 2 - 1 - - - 3 - 2 - Less than $100. . . . . . . 5 - 2 - - - - - 2 - 1 - $100 to $199. . . . . . . . 1 - - - - - - - - - 1 - $200 to $299. . . . . . . . 1 - - - - - - - 1 - - - $300 to $399. . . . . . . . - - - - - - - - - - - - $400 to $499. . . . . . . . - - - - - - - - - - - - $500 to $599. . . . . . . . 1 - - - 1 - - - - - - - $600 to $699. . . . . . . . - - - - - - - - - - - - $700 to $799. . . . . . . . - - - - - - - - - - - - $800 to $899. . . . . . . . - - - - - - - - - - - - $900 to $999. . . . . . . . - - - - - - - - - - - - $1,000 or more. . . . . . . 1 1 - - - - - - - - - - Median (dollar) . . . . . . 90 50,500 50 - 550 - - - 75 - 100 - ──────────────────────────────────────────────────────────────────────────────────────────────────────────── Source: 2000 FSM Census
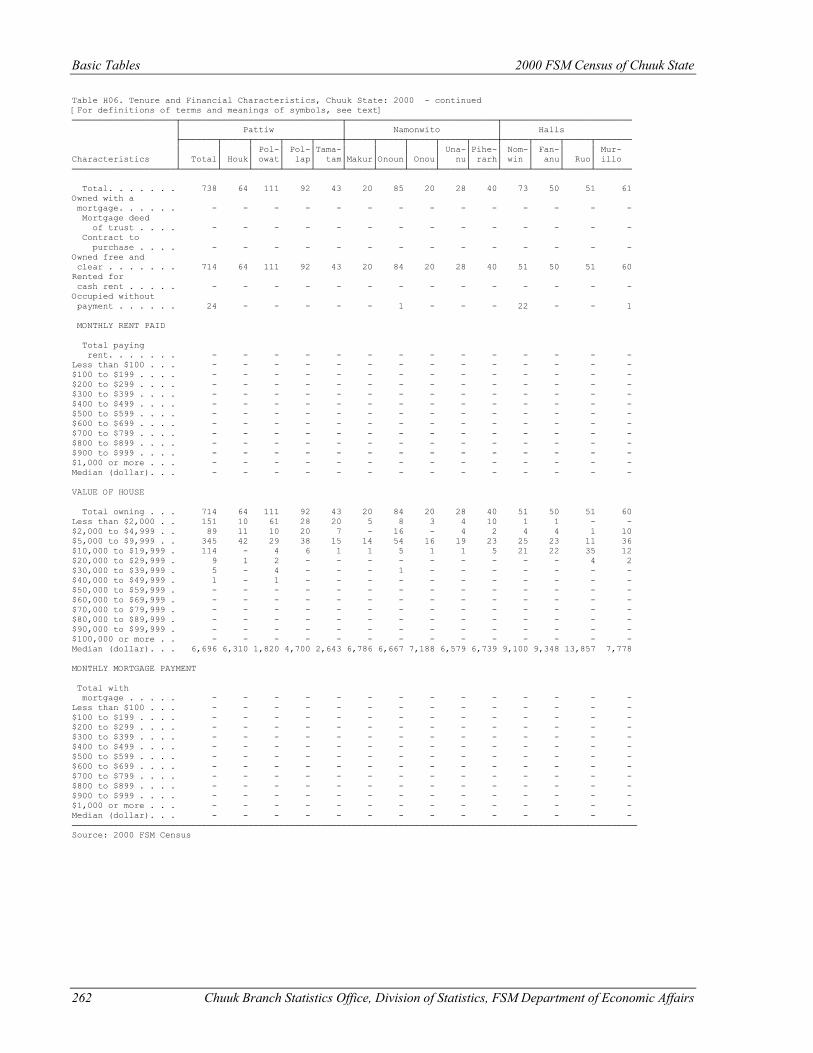
Basic Tables 2000 FSM Census of Chuuk State
262 Chuuk Branch Statistics Office, Division of Statistics, FSM Department of Economic Affairs
Table H06. Tenure and Financial Characteristics, Chuuk State: 2000 - continued [For definitions of terms and meanings of symbols, see text] ────────────────────┬───────────────────────────────┬─────────────────────────────┬───────────────────────── │ Pattiw │ Namonwito │ Halls ├───────┬─────┬─────┬─────┬─────┼─────┬─────┬─────┬─────┬─────┼─────┬─────┬─────┬─────── │ │ │ Pol-│ Pol-│Tama-│ │ │ │ Una-│Pihe-│ Nom-│ Fan-│ │ Mur- Characteristics │ Total│ Houk│ owat│ lap│ tam│Makur│Onoun│ Onou│ nu│ rarh│ win │ anu│ Ruo│ illo ────────────────────┴───────┴─────┴─────┴─────┴─────┴─────┴─────┴─────┴─────┴─────┴─────┴─────┴─────┴─────── Total. . . . . . . 738 64 111 92 43 20 85 20 28 40 73 50 51 61 Owned with a mortgage. . . . . . - - - - - - - - - - - - - - Mortgage deed of trust . . . . - - - - - - - - - - - - - - Contract to purchase . . . . - - - - - - - - - - - - - - Owned free and clear . . . . . . . 714 64 111 92 43 20 84 20 28 40 51 50 51 60 Rented for cash rent . . . . . - - - - - - - - - - - - - - Occupied without payment . . . . . . 24 - - - - - 1 - - - 22 - - 1 MONTHLY RENT PAID Total paying rent. . . . . . . - - - - - - - - - - - - - - Less than $100 . . . - - - - - - - - - - - - - - $100 to $199 . . . . - - - - - - - - - - - - - - $200 to $299 . . . . - - - - - - - - - - - - - - $300 to $399 . . . . - - - - - - - - - - - - - - $400 to $499 . . . . - - - - - - - - - - - - - - $500 to $599 . . . . - - - - - - - - - - - - - - $600 to $699 . . . . - - - - - - - - - - - - - - $700 to $799 . . . . - - - - - - - - - - - - - - $800 to $899 . . . . - - - - - - - - - - - - - - $900 to $999 . . . . - - - - - - - - - - - - - - $1,000 or more . . . - - - - - - - - - - - - - - Median (dollar). . . - - - - - - - - - - - - - - VALUE OF HOUSE Total owning . . . 714 64 111 92 43 20 84 20 28 40 51 50 51 60 Less than $2,000 . . 151 10 61 28 20 5 8 3 4 10 1 1 - - $2,000 to $4,999 . . 89 11 10 20 7 - 16 - 4 2 4 4 1 10 $5,000 to $9,999 . . 345 42 29 38 15 14 54 16 19 23 25 23 11 36 $10,000 to $19,999 . 114 - 4 6 1 1 5 1 1 5 21 22 35 12 $20,000 to $29,999 . 9 1 2 - - - - - - - - - 4 2 $30,000 to $39,999 . 5 - 4 - - - 1 - - - - - - - $40,000 to $49,999 . 1 - 1 - - - - - - - - - - - $50,000 to $59,999 . - - - - - - - - - - - - - - $60,000 to $69,999 . - - - - - - - - - - - - - - $70,000 to $79,999 . - - - - - - - - - - - - - - $80,000 to $89,999 . - - - - - - - - - - - - - - $90,000 to $99,999 . - - - - - - - - - - - - - - $100,000 or more . . - - - - - - - - - - - - - - Median (dollar). . . 6,696 6,310 1,820 4,700 2,643 6,786 6,667 7,188 6,579 6,739 9,100 9,348 13,857 7,778 MONTHLY MORTGAGE PAYMENT Total with mortgage . . . . . - - - - - - - - - - - - - - Less than $100 . . . - - - - - - - - - - - - - - $100 to $199 . . . . - - - - - - - - - - - - - - $200 to $299 . . . . - - - - - - - - - - - - - - $300 to $399 . . . . - - - - - - - - - - - - - - $400 to $499 . . . . - - - - - - - - - - - - - - $500 to $599 . . . . - - - - - - - - - - - - - - $600 to $699 . . . . - - - - - - - - - - - - - - $700 to $799 . . . . - - - - - - - - - - - - - - $800 to $899 . . . . - - - - - - - - - - - - - - $900 to $999 . . . . - - - - - - - - - - - - - - $1,000 or more . . . - - - - - - - - - - - - - - Median (dollar). . . - - - - - - - - - - - - - - ───────────────────────────────────────────────────────────────────────────────────────────────────────────── Source: 2000 FSM Census
APPENDIX B
QUESTIONNAIRE
Chuuk Branch Statistics Office, Division of Statistics, FSM Department of Economic Affairs 263
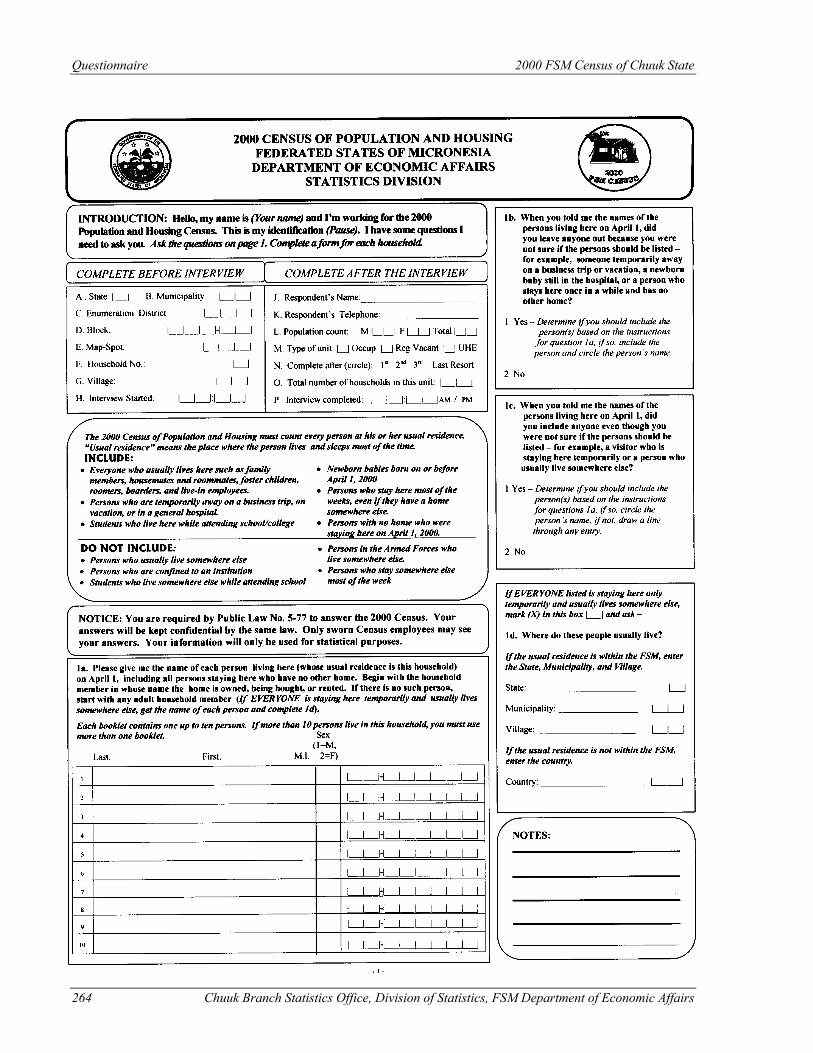
Questionnaire 2000 FSM Census of Chuuk State
264 Chuuk Branch Statistics Office, Division of Statistics, FSM Department of Economic Affairs
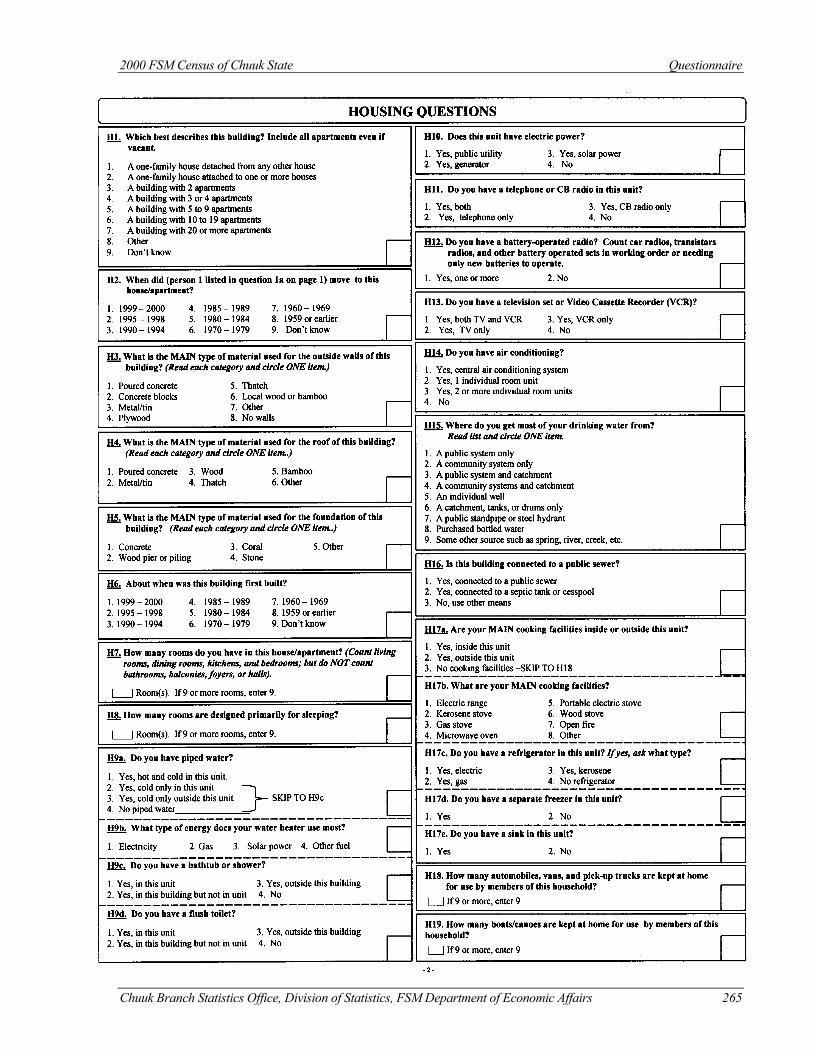
2000 FSM Census of Chuuk State Questionnaire
Chuuk Branch Statistics Office, Division of Statistics, FSM Department of Economic Affairs 265
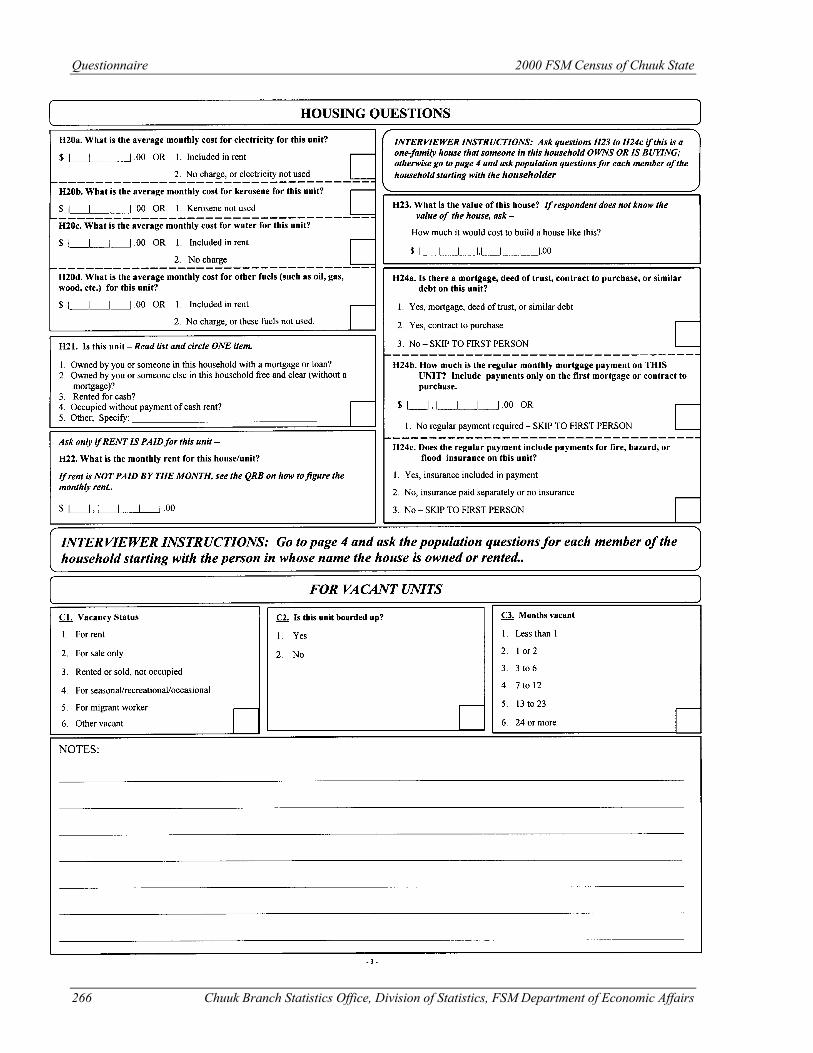
Questionnaire 2000 FSM Census of Chuuk State
266 Chuuk Branch Statistics Office, Division of Statistics, FSM Department of Economic Affairs
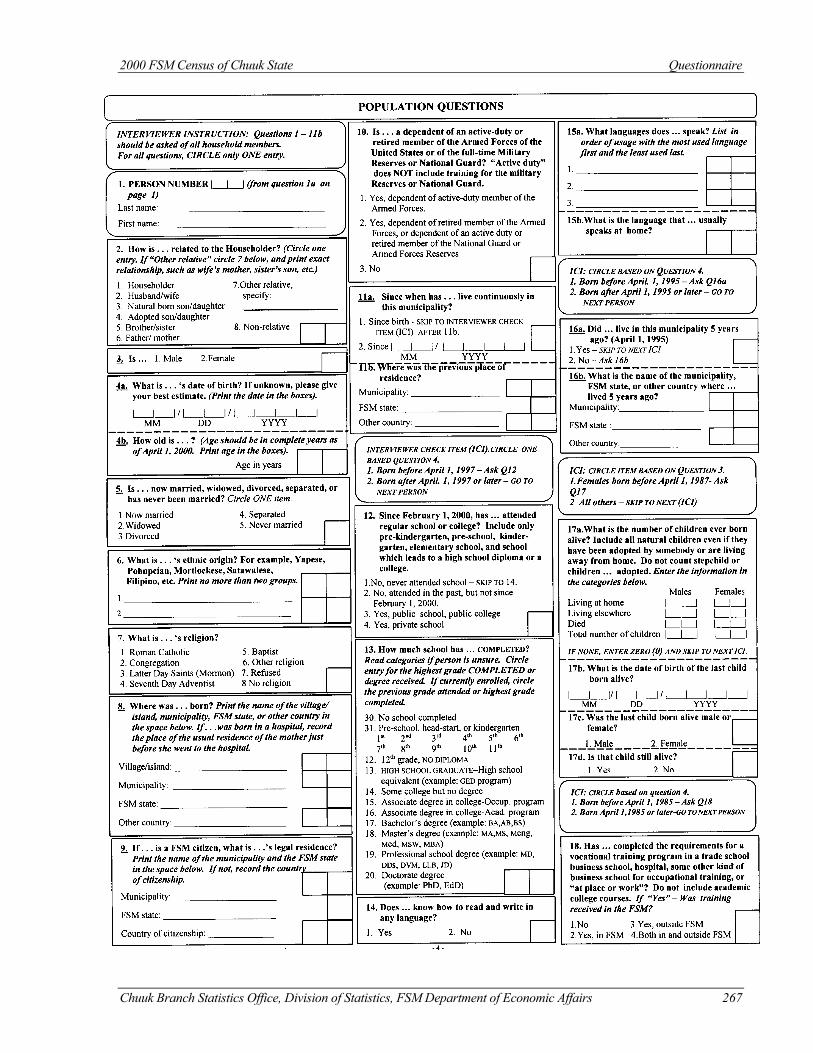
2000 FSM Census of Chuuk State Questionnaire
Chuuk Branch Statistics Office, Division of Statistics, FSM Department of Economic Affairs 267
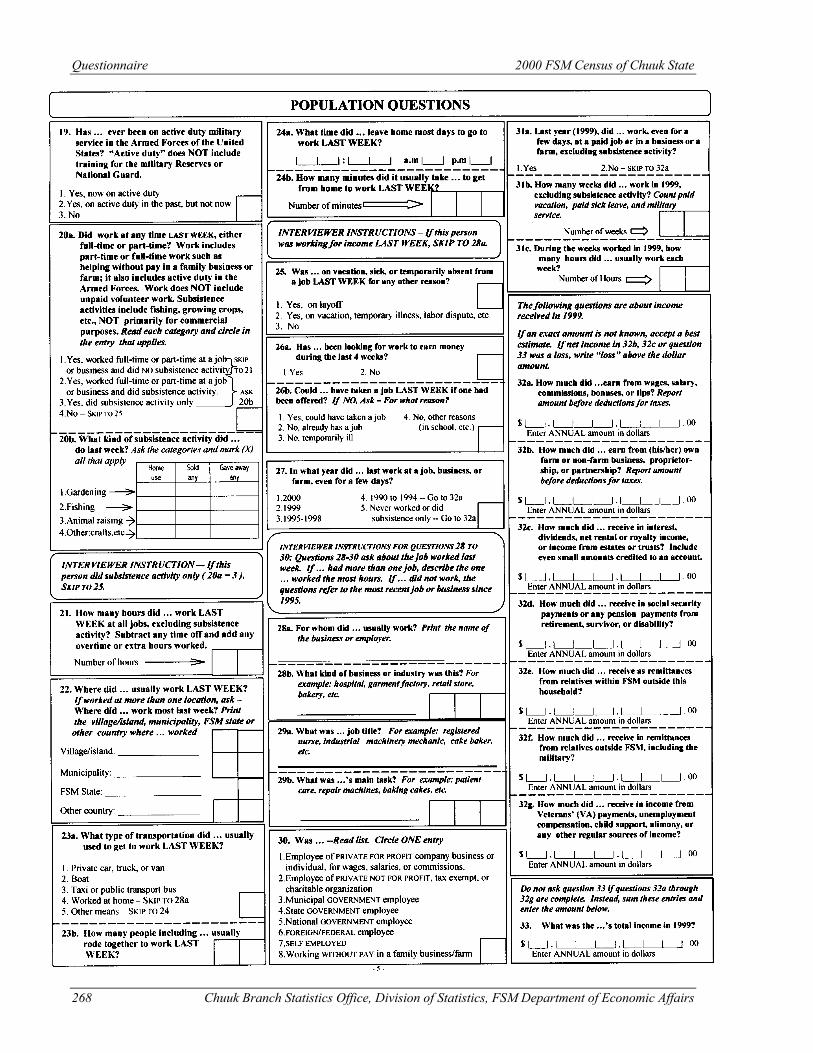
Questionnaire 2000 FSM Census of Chuuk State
268 Chuuk Branch Statistics Office, Division of Statistics, FSM Department of Economic Affairs
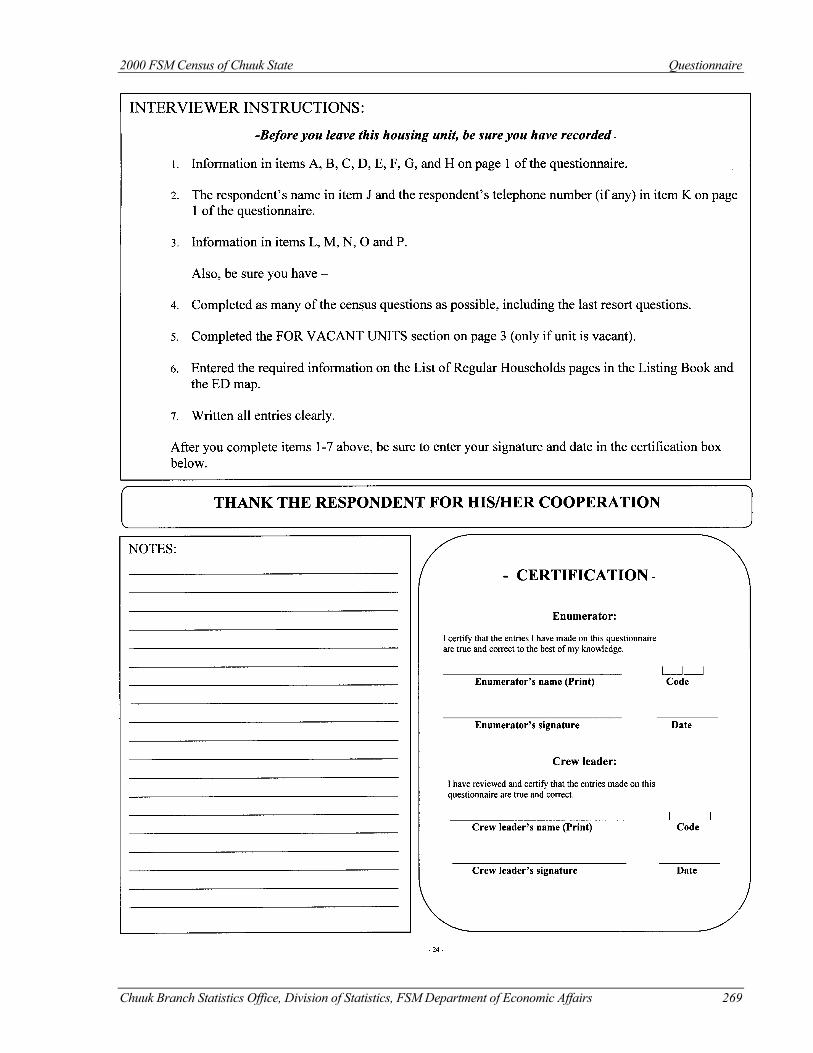
2000 FSM Census of Chuuk State Questionnaire
Chuuk Branch Statistics Office, Division of Statistics, FSM Department of Economic Affairs 269
Related Documents