Chenango County Profile 2017 A collection of recent demographic, social and economic data Compiled by Jan Vink Cornell Program on Applied Demographics

Welcome message from author
This document is posted to help you gain knowledge. Please leave a comment to let me know what you think about it! Share it to your friends and learn new things together.
Transcript
Chenango County Profile
2017
A collection of recent demographic, social and economic data
Compiled by
Jan Vink
Cornell Program on Applied Demographics
Chenango County Profile
Page 1 of 31
This profile is a part of a set of profiles generated for each county in New York State. The profiles were developed and generated by the Cornell Program on Applied Demographics. The work is sponsored by the New York State Data Center in the New York State Department of Labor.
Cornell Program on Applied Demographics:
The Program on Applied Demographics (PAD) brings skills in demographics, economics, statistics, data gathering and data analysis together to provide a variety of organizations with data, information and advice. PAD is located in the Department of Policy Analysis and Management within the College of Human Ecology at Cornell University. PAD is also affiliated with the Cornell Institute for Social and Economic Research and the Cornell Population Center.
For more information: http://pad.human.cornell.edu/
New York State Data Center:
The New York State Data Center (NYSDC) is located in the Division of Research and Statistics within the New York State Department of Labor. The State Data Center operates as part of a nationwide effort to improve public access to data provided by the U.S. Census Bureau. The U.S. Census Bureau collects and tabulates data on a multitude of subjects such as population, social, economic and housing demographics, labor force data, health care, migration and transportation. These data play a critical role in understanding our local and larger surrounding communities. Census data also influence state and federal funding, aid decision making in the legislative process, and determine each state's number of congressional seats. As the lead agency in New York for the SDC program, the New York State Data Center helps users navigate through the multitude of surveys and products provided by the U.S. Census Bureau.
For more information: https://labor.ny.gov/nys-data-center/
All profiles are freely downloadable as PDF documents on the PAD website:
http://pad.human.cornell.edu/profiles/index.cfm
This profile is an update from the County Profile produced in 2013. The 2013 profile also contained information on agriculture related items and can be found at https://pad.human.cornell.edu/profiles/2013/Chenango.pdf
Chenango County Profile
Page 2 of 31
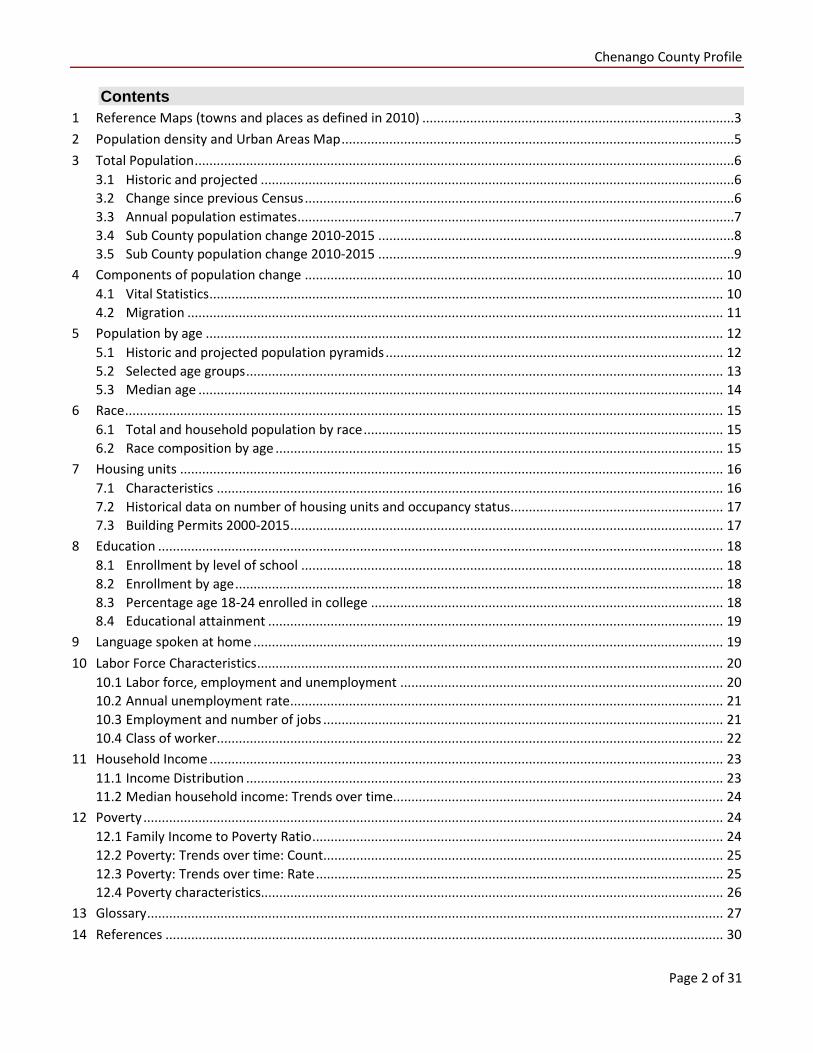
Contents 1 Reference Maps (towns and places as defined in 2010) .....................................................................................3 2 Population density and Urban Areas Map ...........................................................................................................5 3 Total Population ...................................................................................................................................................6
3.1 Historic and projected .................................................................................................................................6 3.2 Change since previous Census .....................................................................................................................6 3.3 Annual population estimates .......................................................................................................................7 3.4 Sub County population change 2010-2015 .................................................................................................8 3.5 Sub County population change 2010-2015 .................................................................................................9
4 Components of population change .................................................................................................................. 10 4.1 Vital Statistics ............................................................................................................................................ 10 4.2 Migration .................................................................................................................................................. 11
5 Population by age ............................................................................................................................................. 12 5.1 Historic and projected population pyramids ............................................................................................ 12 5.2 Selected age groups .................................................................................................................................. 13 5.3 Median age ............................................................................................................................................... 14
6 Race ................................................................................................................................................................... 15 6.1 Total and household population by race .................................................................................................. 15 6.2 Race composition by age .......................................................................................................................... 15
7 Housing units .................................................................................................................................................... 16 7.1 Characteristics .......................................................................................................................................... 16 7.2 Historical data on number of housing units and occupancy status .......................................................... 17 7.3 Building Permits 2000-2015 ...................................................................................................................... 17
8 Education .......................................................................................................................................................... 18 8.1 Enrollment by level of school ................................................................................................................... 18 8.2 Enrollment by age ..................................................................................................................................... 18 8.3 Percentage age 18-24 enrolled in college ................................................................................................ 18 8.4 Educational attainment ............................................................................................................................ 19
9 Language spoken at home ................................................................................................................................ 19 10 Labor Force Characteristics ............................................................................................................................... 20
10.1 Labor force, employment and unemployment ........................................................................................ 20 10.2 Annual unemployment rate ...................................................................................................................... 21 10.3 Employment and number of jobs ............................................................................................................. 21 10.4 Class of worker .......................................................................................................................................... 22
11 Household Income ............................................................................................................................................ 23 11.1 Income Distribution .................................................................................................................................. 23 11.2 Median household income: Trends over time.......................................................................................... 24
12 Poverty .............................................................................................................................................................. 24 12.1 Family Income to Poverty Ratio ................................................................................................................ 24 12.2 Poverty: Trends over time: Count ............................................................................................................. 25 12.3 Poverty: Trends over time: Rate ............................................................................................................... 25 12.4 Poverty characteristics.............................................................................................................................. 26
13 Glossary ............................................................................................................................................................. 27 14 References ........................................................................................................................................................ 30
Chenango County Profile
Page 3 of 31
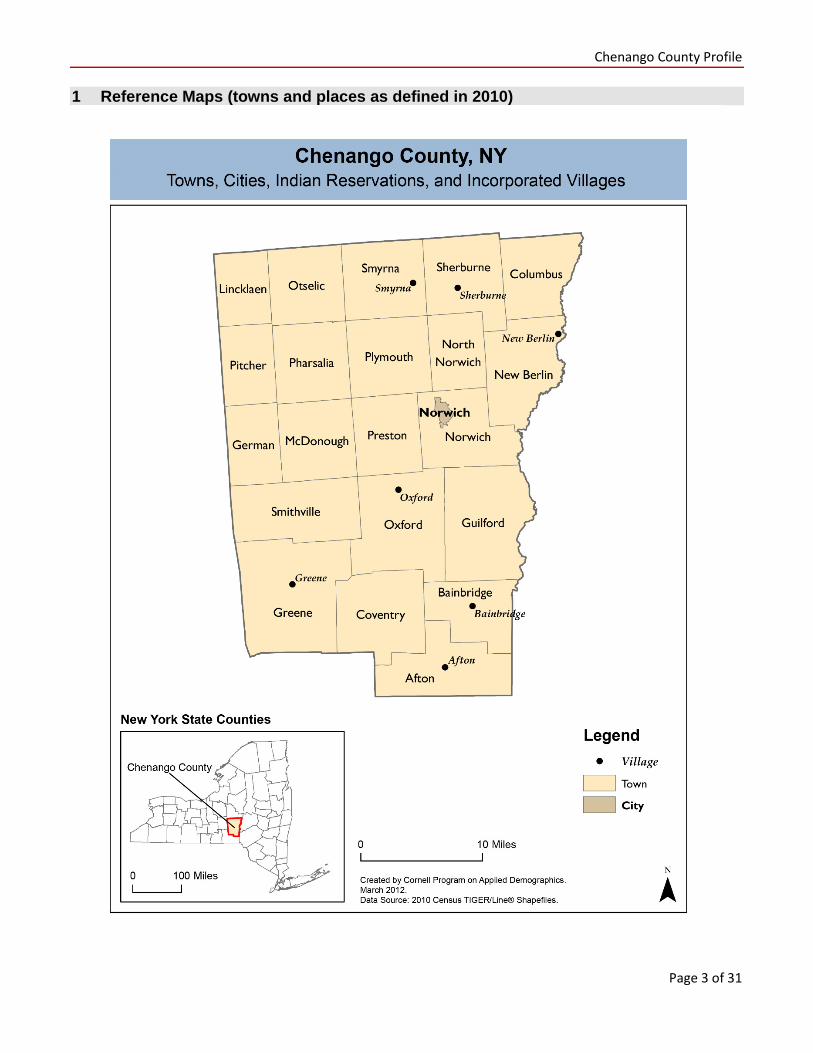
1 Reference Maps (towns and places as defined in 2010)
Chenango County Profile
Page 4 of 31
Chenango County Profile
Page 5 of 31
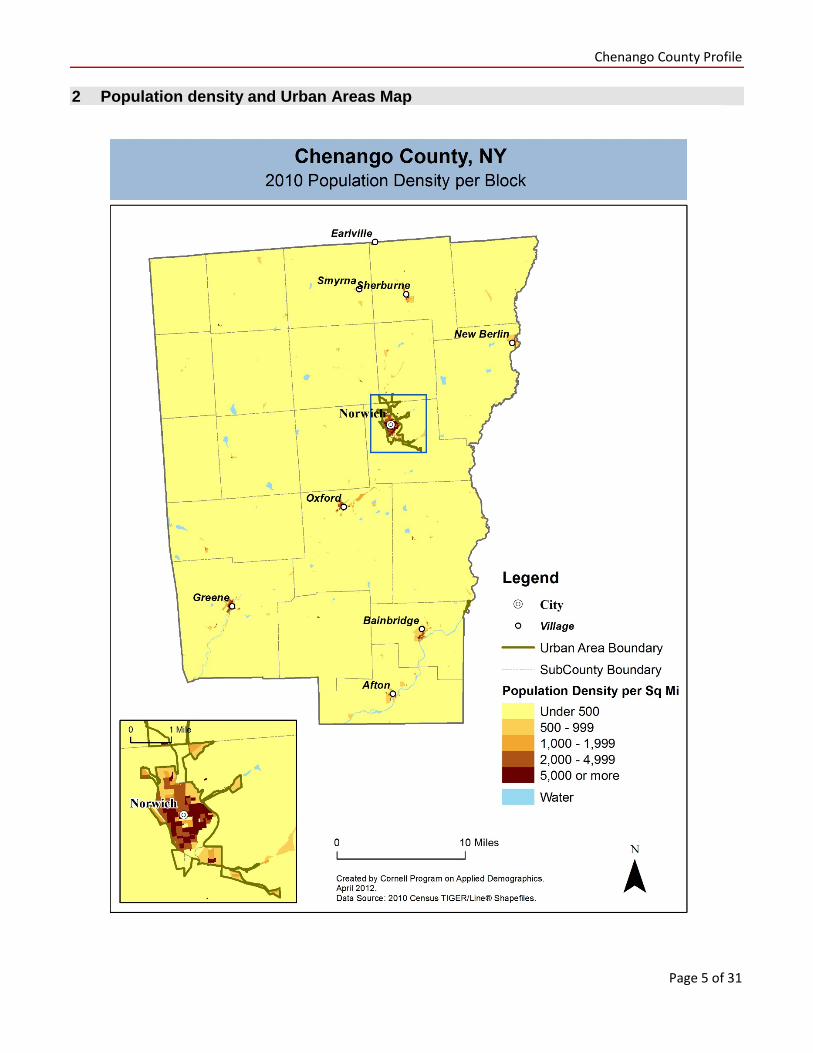
2 Population density and Urban Areas Map
Chenango County Profile
Page 6 of 31
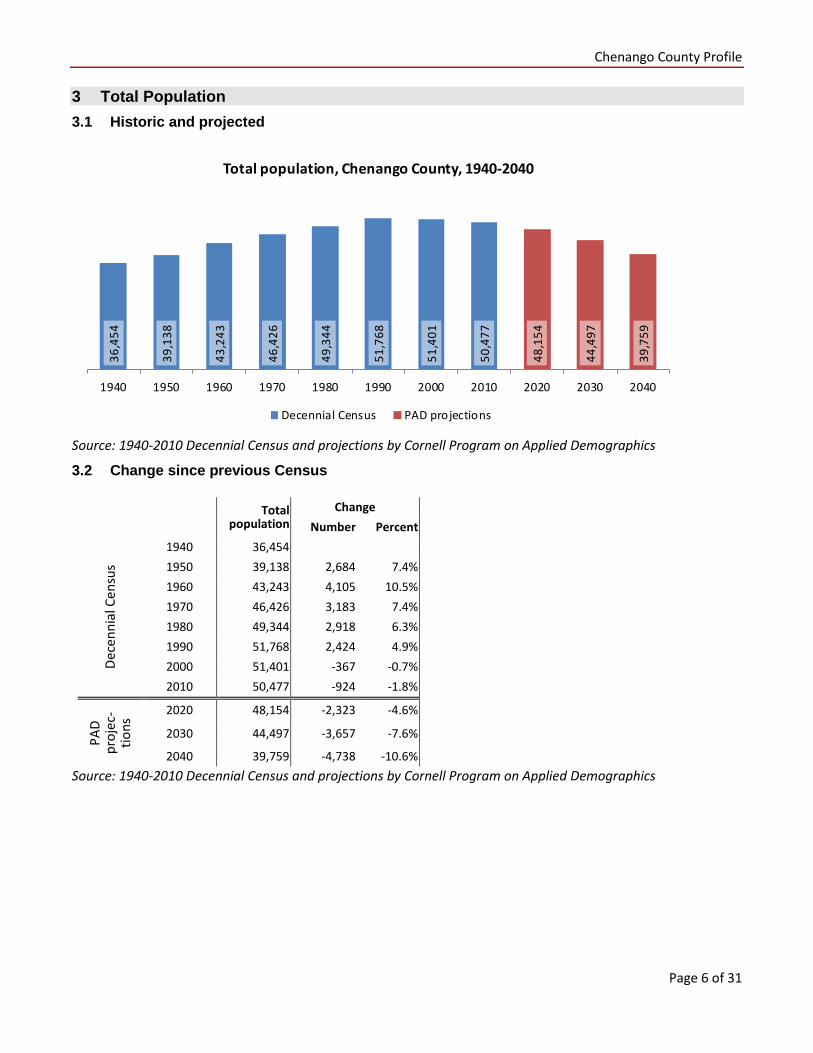
3 Total Population 3.1 Historic and projected
Source: 1940-2010 Decennial Census and projections by Cornell Program on Applied Demographics
3.2 Change since previous Census
Total
population Change
Number Percent
Dece
nnia
l Cen
sus
1940 36,454 1950 39,138 2,684 7.4% 1960 43,243 4,105 10.5% 1970 46,426 3,183 7.4% 1980 49,344 2,918 6.3% 1990 51,768 2,424 4.9% 2000 51,401 -367 -0.7% 2010 50,477 -924 -1.8%
PAD
proj
ec-
tions
2020 48,154 -2,323 -4.6%
2030 44,497 -3,657 -7.6%
2040 39,759 -4,738 -10.6% Source: 1940-2010 Decennial Census and projections by Cornell Program on Applied Demographics
36,4
54
39,1
38
43,2
43
46,4
26
49,3
44
51,7
68
51,4
01
50,4
77
48,1
54
44,4
97
39,7
59
1940 1950 1960 1970 1980 1990 2000 2010 2020 2030 2040
Total population, Chenango County, 1940-2040
Decennial Census PAD projections
Chenango County Profile
Page 7 of 31
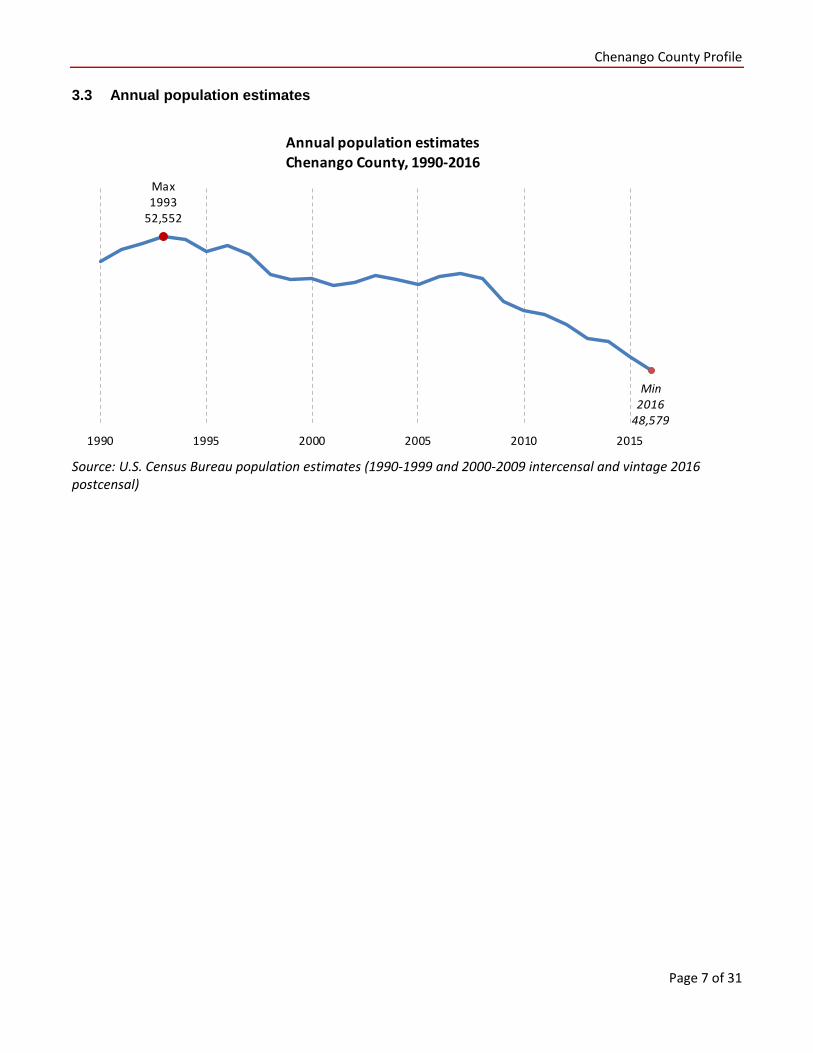
3.3 Annual population estimates
Source: U.S. Census Bureau population estimates (1990-1999 and 2000-2009 intercensal and vintage 2016 postcensal)
Min2016
48,579
Max1993
52,552
1990 1995 2000 2005 2010 2015
Annual population estimatesChenango County, 1990-2016
Chenango County Profile
Page 8 of 31
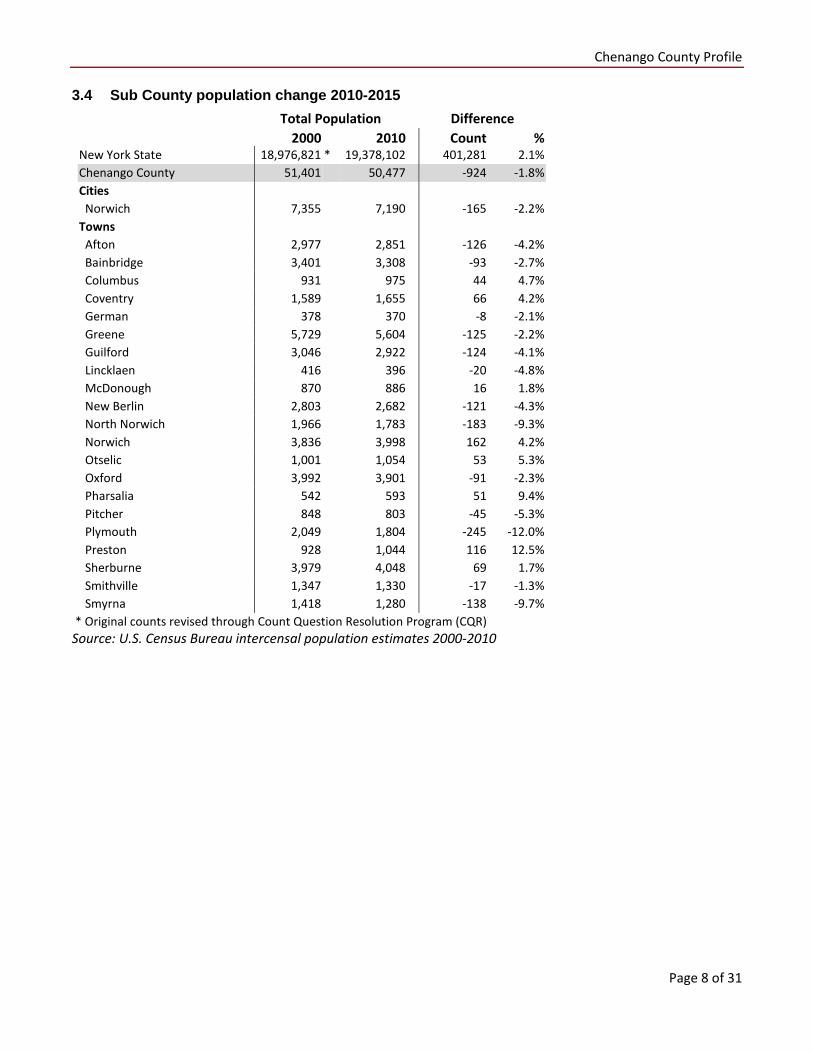
3.4 Sub County population change 2010-2015
Total Population Difference
2000 2010
Count %
New York State 18,976,821 * 19,378,102 401,281 2.1% Chenango County 51,401 50,477 -924 -1.8% Cities Norwich 7,355 7,190 -165 -2.2% Towns Afton 2,977 2,851 -126 -4.2% Bainbridge 3,401 3,308 -93 -2.7% Columbus 931 975 44 4.7% Coventry 1,589 1,655 66 4.2% German 378 370 -8 -2.1% Greene 5,729 5,604 -125 -2.2% Guilford 3,046 2,922 -124 -4.1% Lincklaen 416 396 -20 -4.8% McDonough 870 886 16 1.8% New Berlin 2,803 2,682 -121 -4.3% North Norwich 1,966 1,783 -183 -9.3% Norwich 3,836 3,998 162 4.2% Otselic 1,001 1,054 53 5.3% Oxford 3,992 3,901 -91 -2.3% Pharsalia 542 593 51 9.4% Pitcher 848 803 -45 -5.3% Plymouth 2,049 1,804 -245 -12.0% Preston 928 1,044 116 12.5% Sherburne 3,979 4,048 69 1.7% Smithville 1,347 1,330 -17 -1.3% Smyrna 1,418 1,280 -138 -9.7%
* Original counts revised through Count Question Resolution Program (CQR) Source: U.S. Census Bureau intercensal population estimates 2000-2010
Chenango County Profile
Page 9 of 31
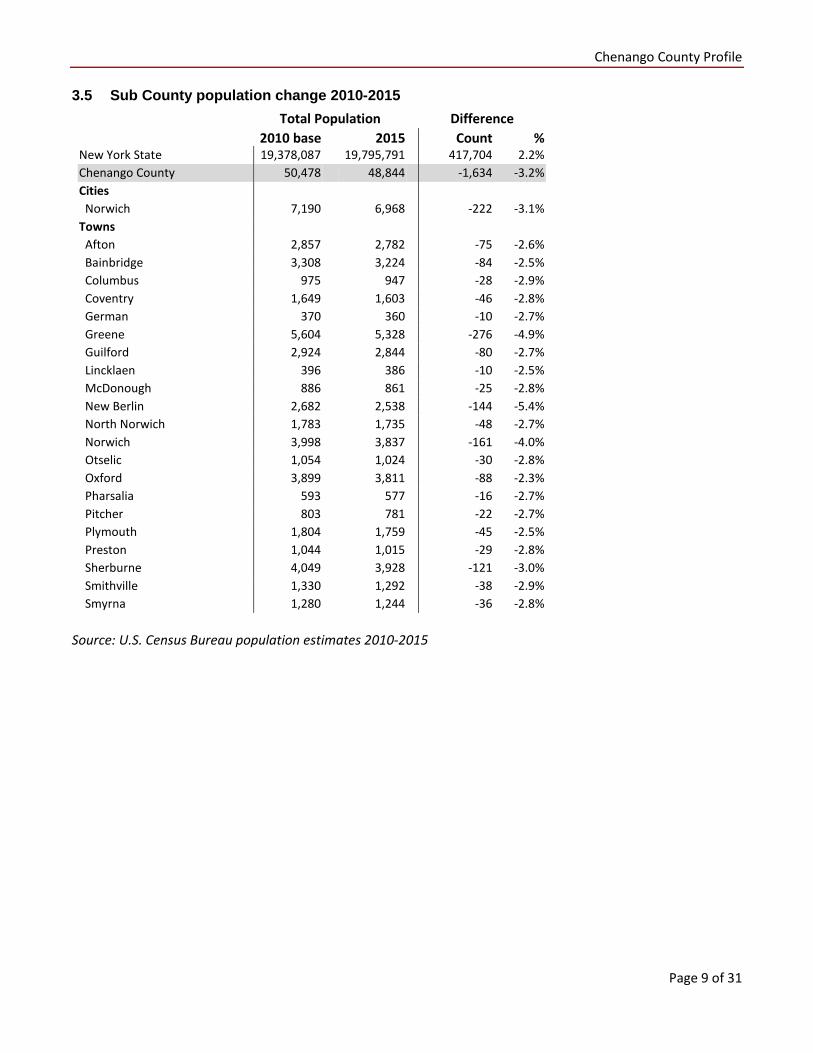
3.5 Sub County population change 2010-2015
Total Population Difference
2010 base 2015
Count %
New York State 19,378,087 19,795,791 417,704 2.2% Chenango County 50,478 48,844 -1,634 -3.2% Cities Norwich 7,190 6,968 -222 -3.1% Towns Afton 2,857 2,782 -75 -2.6% Bainbridge 3,308 3,224 -84 -2.5% Columbus 975 947 -28 -2.9% Coventry 1,649 1,603 -46 -2.8% German 370 360 -10 -2.7% Greene 5,604 5,328 -276 -4.9% Guilford 2,924 2,844 -80 -2.7% Lincklaen 396 386 -10 -2.5% McDonough 886 861 -25 -2.8% New Berlin 2,682 2,538 -144 -5.4% North Norwich 1,783 1,735 -48 -2.7% Norwich 3,998 3,837 -161 -4.0% Otselic 1,054 1,024 -30 -2.8% Oxford 3,899 3,811 -88 -2.3% Pharsalia 593 577 -16 -2.7% Pitcher 803 781 -22 -2.7% Plymouth 1,804 1,759 -45 -2.5% Preston 1,044 1,015 -29 -2.8% Sherburne 4,049 3,928 -121 -3.0% Smithville 1,330 1,292 -38 -2.9% Smyrna 1,280 1,244 -36 -2.8%
Source: U.S. Census Bureau population estimates 2010-2015
Chenango County Profile
Page 10 of 31
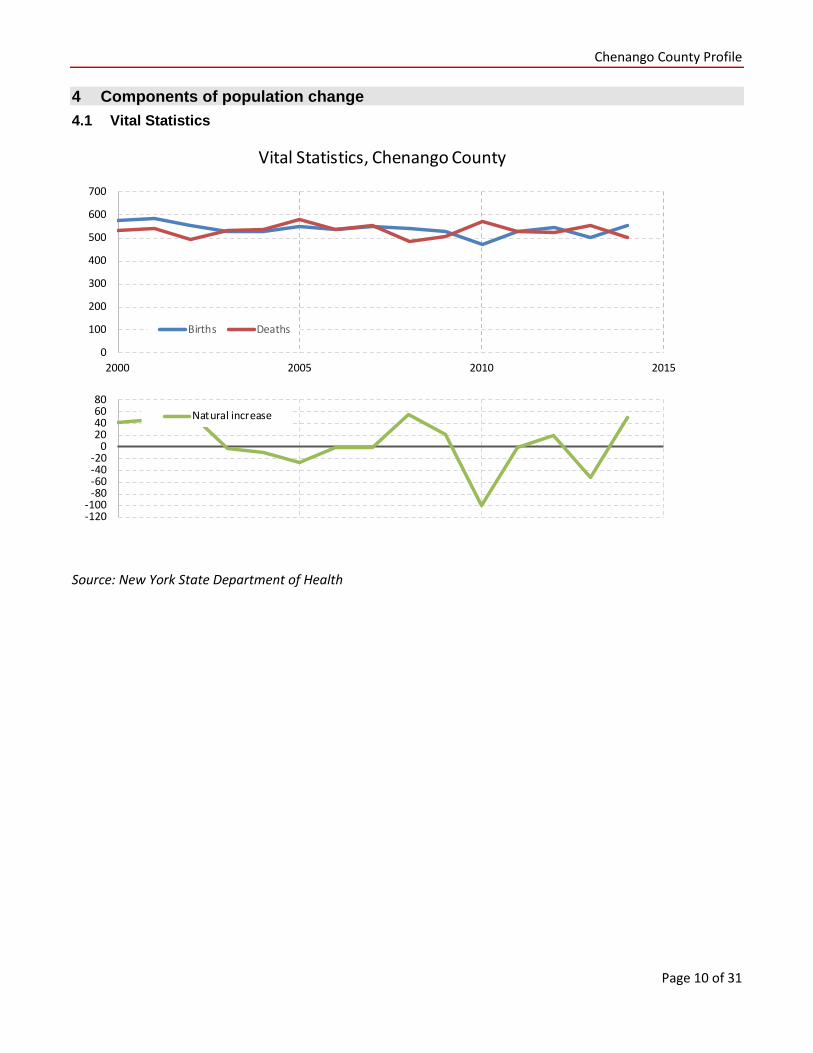
4 Components of population change 4.1 Vital Statistics
Source: New York State Department of Health
0
100
200
300
400
500
600
700
2000 2005 2010 2015
Vital Statistics, Chenango County
Births Deaths
-120-100
-80-60-40-20
020406080
Natural increase
Chenango County Profile
Page 11 of 31
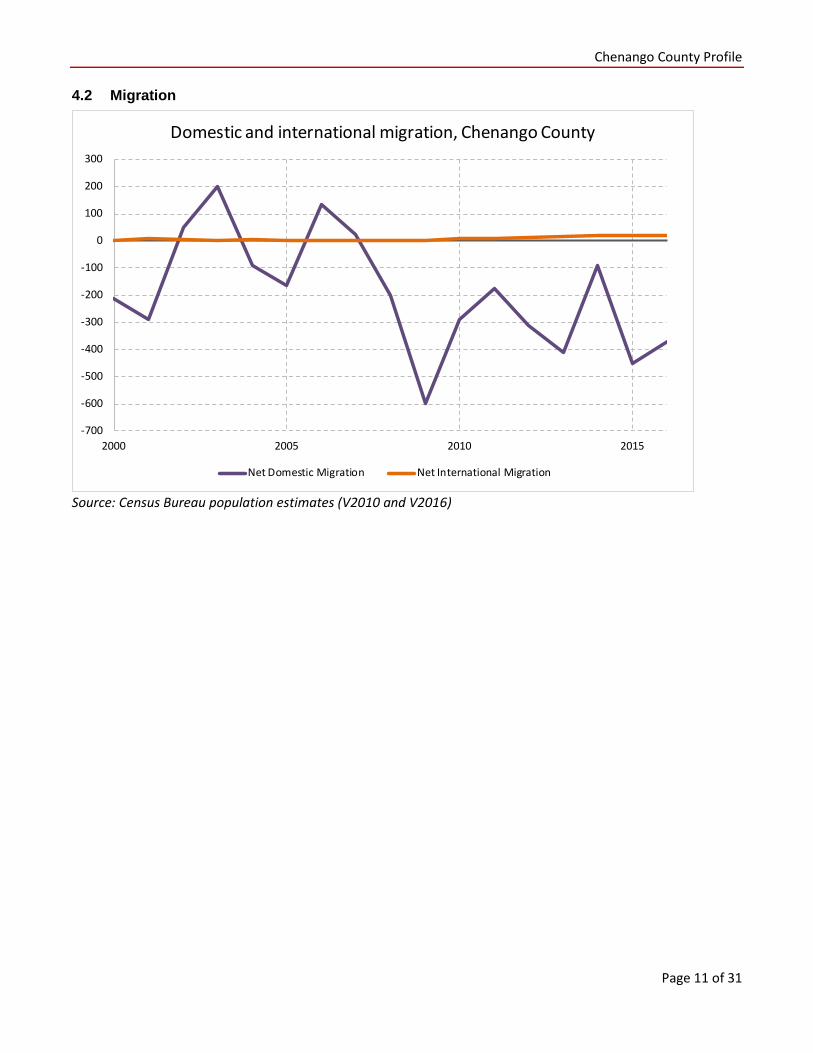
4.2 Migration
Source: Census Bureau population estimates (V2010 and V2016)
-700
-600
-500
-400
-300
-200
-100
0
100
200
300
2000 2005 2010 2015
Domestic and international migration, Chenango County
Net Domestic Migration Net International Migration
Chenango County Profile
Page 12 of 31
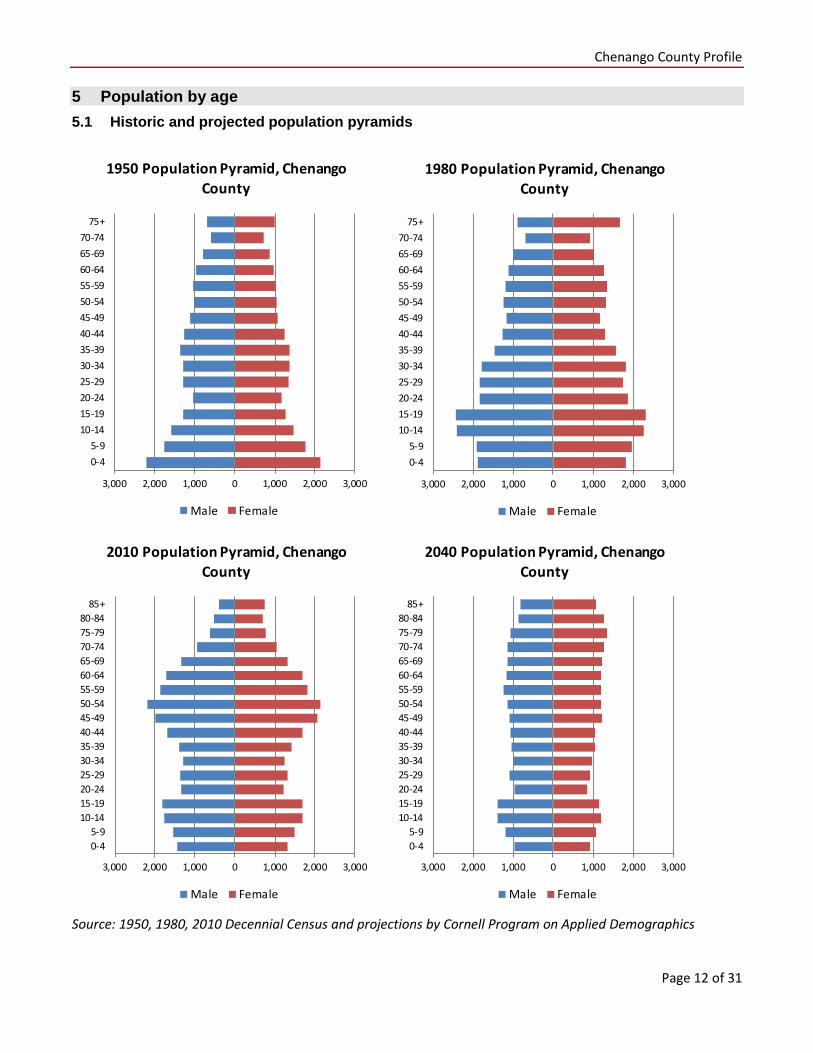
5 Population by age 5.1 Historic and projected population pyramids
Source: 1950, 1980, 2010 Decennial Census and projections by Cornell Program on Applied Demographics
3,000 2,000 1,000 0 1,000 2,000 3,000
0-45-9
10-1415-1920-2425-2930-3435-3940-4445-4950-5455-5960-6465-6970-74
75+
1950 Population Pyramid, Chenango County
Male Female
3,000 2,000 1,000 0 1,000 2,000 3,000
0-45-9
10-1415-1920-2425-2930-3435-3940-4445-4950-5455-5960-6465-6970-74
75+
1980 Population Pyramid, Chenango County
Male Female
3,000 2,000 1,000 0 1,000 2,000 3,000
0-45-9
10-1415-1920-2425-2930-3435-3940-4445-4950-5455-5960-6465-6970-7475-7980-84
85+
2010 Population Pyramid, Chenango County
Male Female
3,000 2,000 1,000 0 1,000 2,000 3,000
0-45-9
10-1415-1920-2425-2930-3435-3940-4445-4950-5455-5960-6465-6970-7475-7980-84
85+
2040 Population Pyramid, Chenango County
Male Female
Chenango County Profile
Page 13 of 31
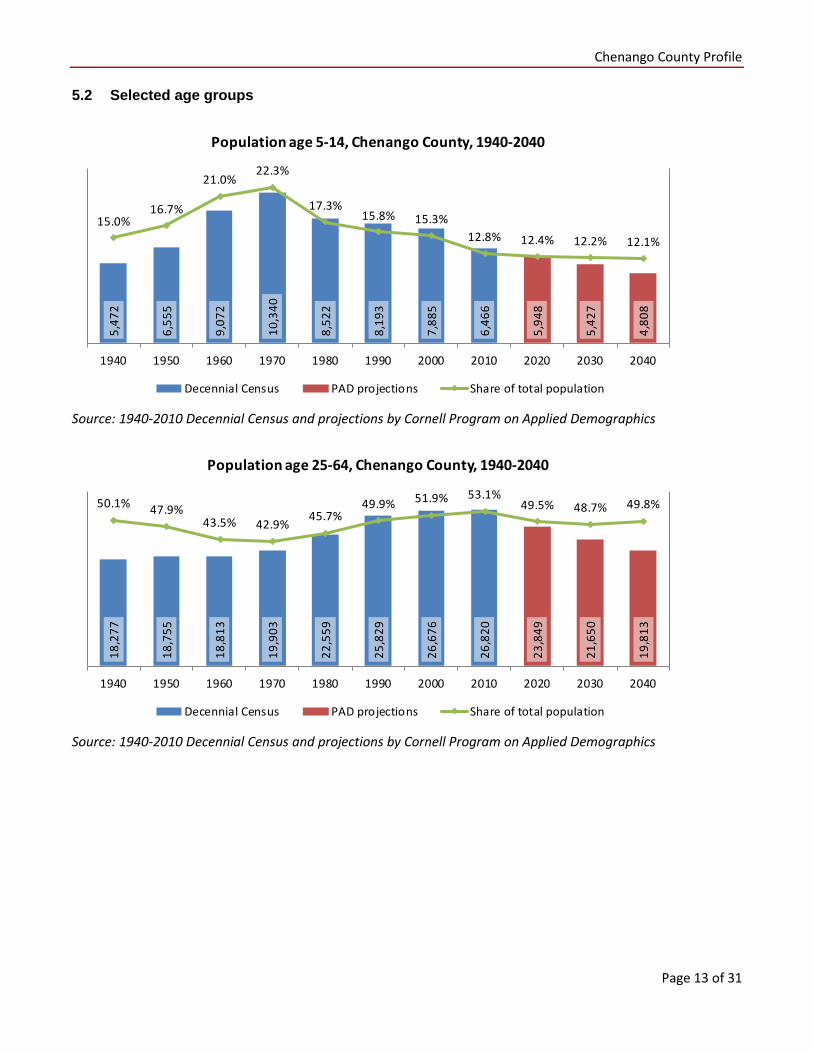
5.2 Selected age groups
Source: 1940-2010 Decennial Census and projections by Cornell Program on Applied Demographics
Source: 1940-2010 Decennial Census and projections by Cornell Program on Applied Demographics
5,47
2
6,55
5
9,07
2
10,3
40
8,52
2
8,19
3
7,88
5
6,46
6
5,94
8
5,42
7
4,80
8
15.0%16.7%
21.0%22.3%
17.3%15.8% 15.3%
12.8% 12.4% 12.2% 12.1%
1940 1950 1960 1970 1980 1990 2000 2010 2020 2030 2040
Population age 5-14, Chenango County, 1940-2040
Decennial Census PAD projections Share of total population
18,2
77
18,7
55
18,8
13
19,9
03
22,5
59
25,8
29
26,6
76
26,8
20
23,8
49
21,6
50
19,8
13
50.1% 47.9%43.5% 42.9%
45.7%49.9% 51.9% 53.1%
49.5% 48.7% 49.8%
1940 1950 1960 1970 1980 1990 2000 2010 2020 2030 2040
Population age 25-64, Chenango County, 1940-2040
Decennial Census PAD projections Share of total population
Chenango County Profile
Page 14 of 31
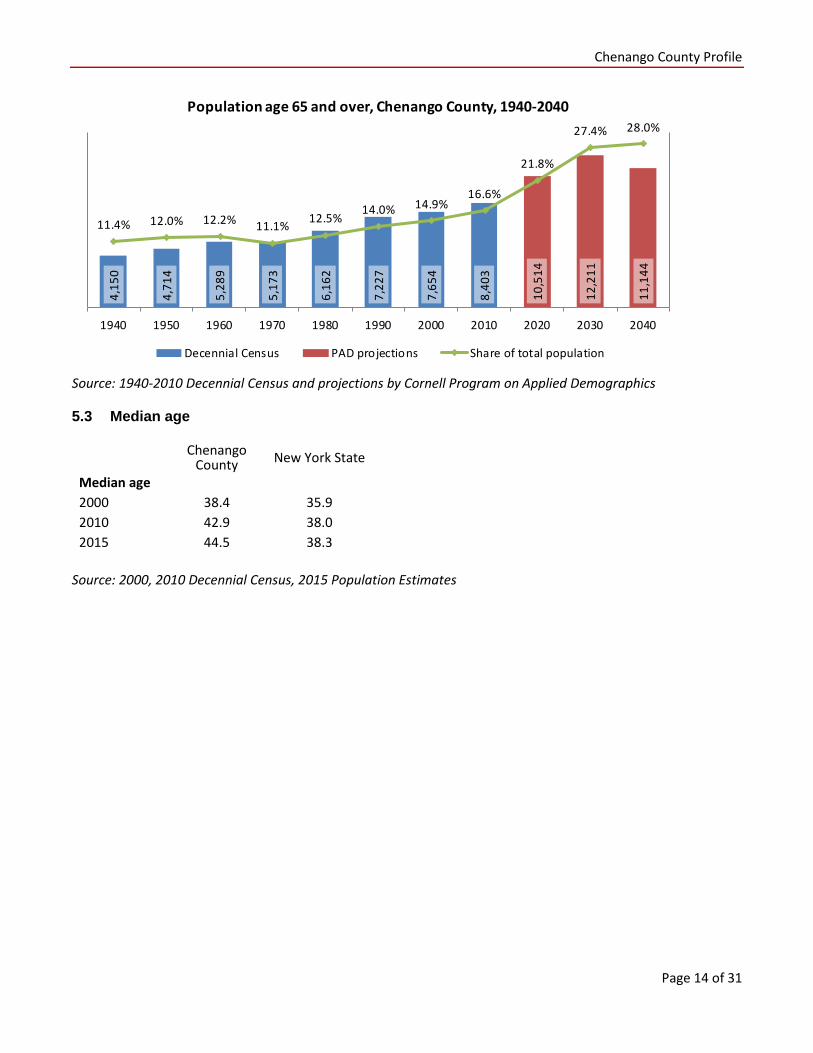
Source: 1940-2010 Decennial Census and projections by Cornell Program on Applied Demographics
5.3 Median age
Chenango
County New York State
Median age 2000 38.4 35.9 2010 42.9 38.0 2015 44.5 38.3
Source: 2000, 2010 Decennial Census, 2015 Population Estimates
4,15
0
4,71
4
5,28
9
5,17
3
6,16
2
7,22
7
7,65
4
8,40
3
10,5
14
12,2
11
11,1
44
11.4% 12.0% 12.2% 11.1% 12.5%14.0% 14.9%
16.6%
21.8%
27.4% 28.0%
1940 1950 1960 1970 1980 1990 2000 2010 2020 2030 2040
Population age 65 and over, Chenango County, 1940-2040
Decennial Census PAD projections Share of total population
Chenango County Profile
Page 15 of 31
6 Race 6.1 Total and household population by race
Total In households In Group Quarters
Count Percentage Count Percentage Count
Total population 50,477 100% 49,681 100% 796
Not Hispanic or Latino
One race
White 48,265 95.6% 47,534 95.7% 731
Black or African American 323 0.6% 275 0.6% 48
American Indian and Alaska Native 151 0.3% 150 0.3% 1
Asian 200 0.4% 194 0.4% 6
Native Hawaiian and Other Pacific Islander 4 0.0% - - -
Some other race 30 0.1% - - -
Two or more races 575 1.1% 573 1.2% 2
Hispanic or Latino (of any race) 929 1.8% 921 1.9% 8 Source: 2010 Decennial Census
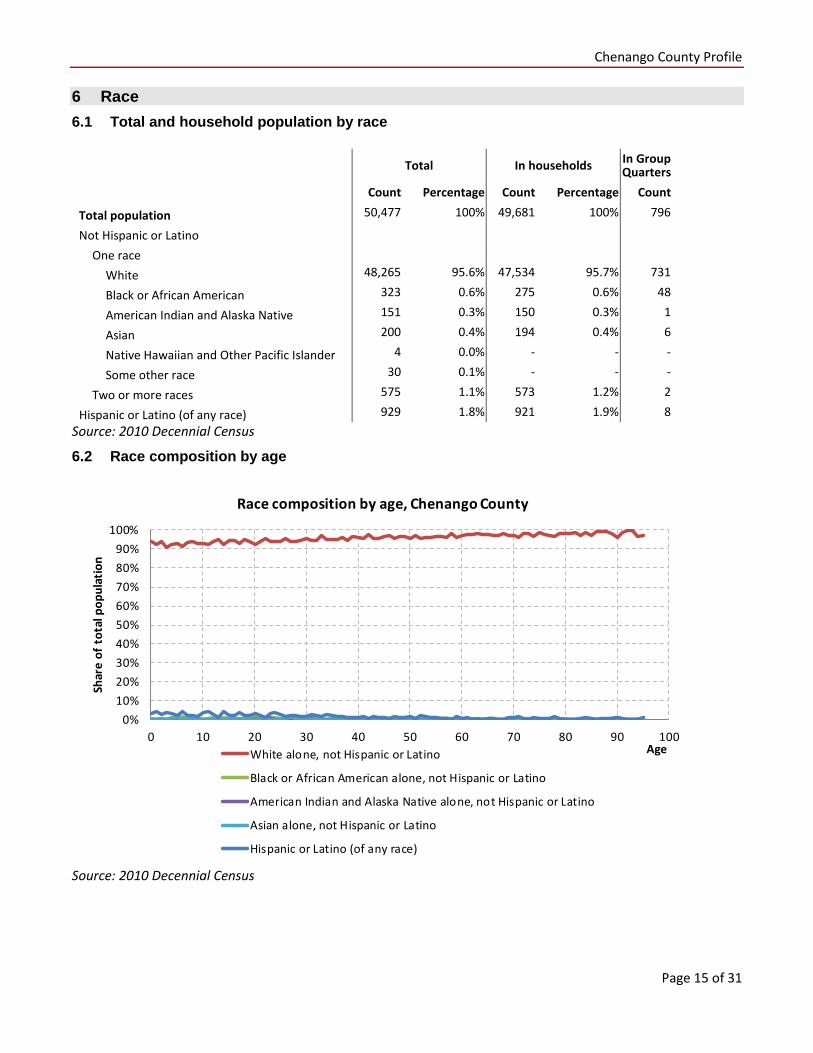
6.2 Race composition by age
Source: 2010 Decennial Census
0%10%20%30%40%50%60%70%80%90%
100%
0 10 20 30 40 50 60 70 80 90 100
Shar
e of
tot
al p
opul
atio
n
Age
Race composition by age, Chenango County
White alone, not Hispanic or Latino
Black or African American alone, not Hispanic or Latino
American Indian and Alaska Native alone, not Hispanic or Latino
Asian alone, not Hispanic or Latino
Hispanic or Latino (of any race)
Chenango County Profile
Page 16 of 31
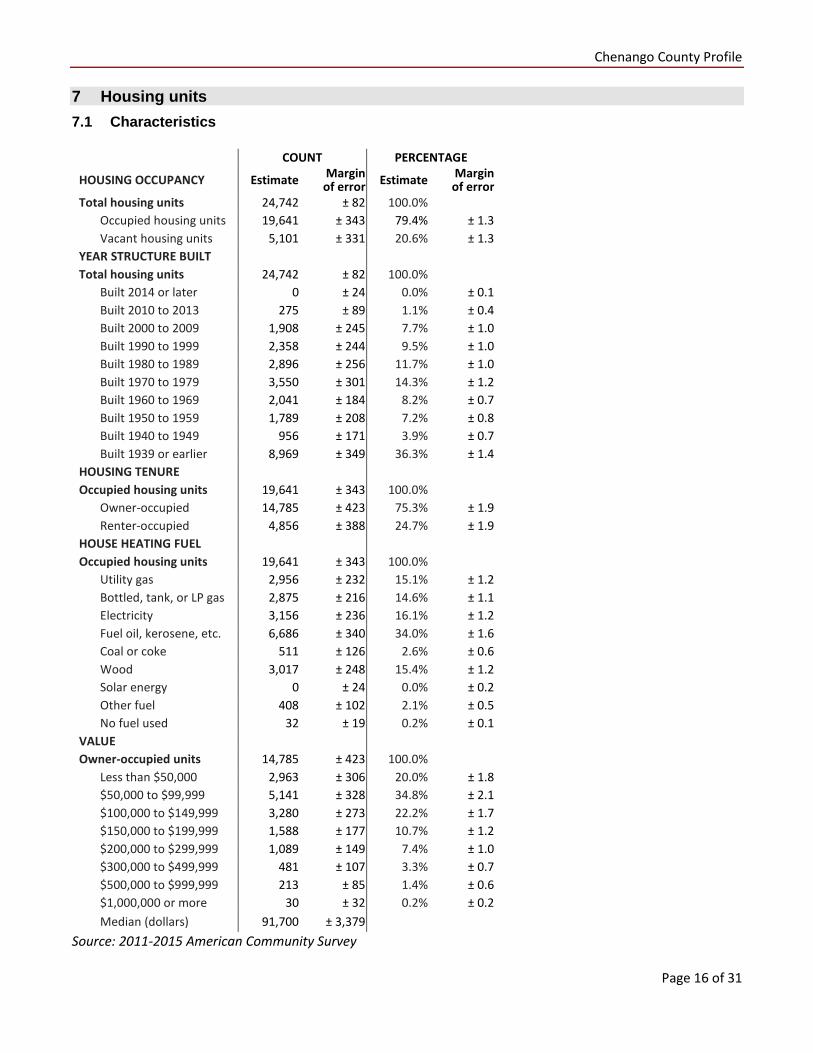
7 Housing units 7.1 Characteristics
COUNT PERCENTAGE
HOUSING OCCUPANCY Estimate Margin of error Estimate Margin
of error Total housing units 24,742 ± 82 100.0%
Occupied housing units 19,641 ± 343 79.4% ± 1.3
Vacant housing units 5,101 ± 331 20.6% ± 1.3
YEAR STRUCTURE BUILT Total housing units 24,742 ± 82 100.0%
Built 2014 or later 0 ± 24 0.0% ± 0.1
Built 2010 to 2013 275 ± 89 1.1% ± 0.4
Built 2000 to 2009 1,908 ± 245 7.7% ± 1.0
Built 1990 to 1999 2,358 ± 244 9.5% ± 1.0
Built 1980 to 1989 2,896 ± 256 11.7% ± 1.0
Built 1970 to 1979 3,550 ± 301 14.3% ± 1.2
Built 1960 to 1969 2,041 ± 184 8.2% ± 0.7
Built 1950 to 1959 1,789 ± 208 7.2% ± 0.8
Built 1940 to 1949 956 ± 171 3.9% ± 0.7
Built 1939 or earlier 8,969 ± 349 36.3% ± 1.4
HOUSING TENURE Occupied housing units 19,641 ± 343 100.0%
Owner-occupied 14,785 ± 423 75.3% ± 1.9
Renter-occupied 4,856 ± 388 24.7% ± 1.9
HOUSE HEATING FUEL Occupied housing units 19,641 ± 343 100.0%
Utility gas 2,956 ± 232 15.1% ± 1.2
Bottled, tank, or LP gas 2,875 ± 216 14.6% ± 1.1
Electricity 3,156 ± 236 16.1% ± 1.2
Fuel oil, kerosene, etc. 6,686 ± 340 34.0% ± 1.6
Coal or coke 511 ± 126 2.6% ± 0.6
Wood 3,017 ± 248 15.4% ± 1.2
Solar energy 0 ± 24 0.0% ± 0.2
Other fuel 408 ± 102 2.1% ± 0.5
No fuel used 32 ± 19 0.2% ± 0.1
VALUE Owner-occupied units 14,785 ± 423 100.0%
Less than $50,000 2,963 ± 306 20.0% ± 1.8
$50,000 to $99,999 5,141 ± 328 34.8% ± 2.1
$100,000 to $149,999 3,280 ± 273 22.2% ± 1.7
$150,000 to $199,999 1,588 ± 177 10.7% ± 1.2
$200,000 to $299,999 1,089 ± 149 7.4% ± 1.0
$300,000 to $499,999 481 ± 107 3.3% ± 0.7
$500,000 to $999,999 213 ± 85 1.4% ± 0.6
$1,000,000 or more 30 ± 32 0.2% ± 0.2
Median (dollars) 91,700 ± 3,379
Source: 2011-2015 American Community Survey
Chenango County Profile
Page 17 of 31
7.2 Historical data on number of housing units and occupancy status
Year Number of
Housing Units
Change since
previous Census
Occupied Occupancy rate Vacant
1970 15,427 13,839 89.7% 1,588 1980 18,864 22.3% 16,858 89.4% 2,006 1990 22,164 17.5% 19,141 86.4% 3,023 2000 23,890 7.8% 19,926 83.4% 3,964 2010 24,710 3.4% 20,436 82.7% 4,274
Source: 1970-2010 Decennial Census
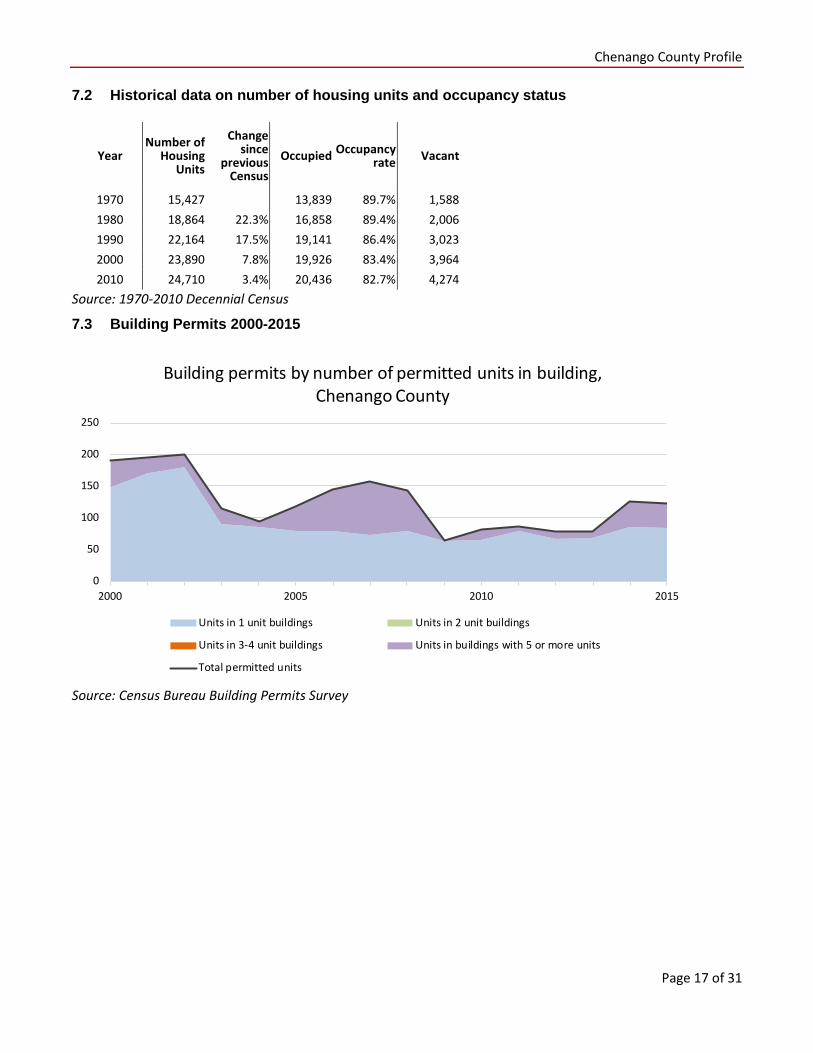
7.3 Building Permits 2000-2015
Source: Census Bureau Building Permits Survey
0
50
100
150
200
250
2000 2005 2010 2015
Building permits by number of permitted units in building, Chenango County
Units in 1 unit buildings Units in 2 unit buildings
Units in 3-4 unit buildings Units in buildings with 5 or more units
Total permitted units
Chenango County Profile
Page 18 of 31
8 Education 8.1 Enrollment by level of school
Estimate Margin of error
Total enrolled in school 10,845 ± 308 Nursery school, preschool 563 ± 135 Kindergarten to 12th grade 8,283 ± 160 Kindergarten 542 ± 123 Elementary: grade 1 to grade 4 2,282 ± 174 Elementary: grade 5 to grade 8 2,582 ± 169 High school: grade 9 to grade 12 2,877 ± 151 College, undergraduate 1,673 ± 270 Graduate, professional school 326 ± 120
Source: 2011-2015 American Community Survey
8.2 Enrollment by age
Estimate Margin of error
3 and 4 years 48.0% ± 9.3 5 to 9 years 97.1% ± 1.4 10 to 14 years 98.2% ± 1.3 15 to 17 years 93.0% ± 4.6 18 and 19 years 72.1% ± 6.3 20 to 24 years 27.3% ± 5.0 25 to 34 years 8.6% ± 2.7 35 years and over 1.7% ± 0.5
Source: 2011-2015 American Community Survey
8.3 Percentage age 18-24 enrolled in college
Estimate Margin of error
Population 18 to 24 years 4,003 ± 59 Enrolled in college or graduate school 26.3% ± 4.2
Males 18 to 24 years 2,090 ± 55 Enrolled in college or graduate school 20.9% ± 4.4
Females 18 to 24 years 1,913 ± 39 Enrolled in college or graduate school 32.1% ± 6.7
Source: 2011-2015 American Community Survey
Chenango County Profile
Page 19 of 31
8.4 Educational attainment
COUNT PERCENTAGE
Estimate Margin of error Estimate Margin
of error Population 25 years and over 34,918 ± 74 100% EDUCATIONAL ATTAINMENT
Less than 9th grade 1,249 ± 200 3.6% ± 0.6 9th to 12th grade, no diploma 3,218 ± 278 9.2% ± 0.8 High school graduate (includes equivalency) 13,675 ± 482 39.2% ± 1.4 Some college, no degree 6,736 ± 356 19.3% ± 1.0 Associate's degree 3,952 ± 309 11.3% ± 0.9 Bachelor's degree 3,315 ± 298 9.5% ± 0.9 Graduate or professional degree 2,773 ± 320 7.9% ± 0.9
Percent high school graduate or higher 87.2% ± 1.0 Percent bachelor's degree or higher 17.4% ± 1.2
Source: 2011-2015 American Community Survey
9 Language spoken at home
COUNT PERCENTAGE SPEAK ENGLISH LESS THAN "VERY WELL"
Estimate Margin of error
Estimate Margin of error
Estimate Margin of error
Population 5 years and over 46,989 ± 31 100% LANGUAGE SPOKEN AT HOME English only 45,479 ± 234 96.8% ± 0.5 Language other than English 1,510 ± 229 3.2% ± 0.5 533 ± 158
Spanish 693 ± 132 1.5% ± 0.3 330 ± 119 Other Indo-European languages 674 ± 179 1.4% ± 0.4 165 ± 80 Asian and Pacific Islander languages 97 ± 43 0.2% ± 0.1 38 ± 33 Other languages 46 ± 43 0.1% ± 0.1 0 ± 24
Source: 2011-2015 American Community Survey
Chenango County Profile
Page 20 of 31
10 Labor Force Characteristics 10.1 Labor force, employment and unemployment
TOTAL IN LABOR FORCE EMPLOYED UNEMPLOYMENT
RATE
Estimate Margin
of error
Estimate Margin
of error
Estimate Margin
of error
Estimate Margin
of error
Population 16 years and over 40,359 ± 117 57.8% ± 1.3 53.6% ± 1.4 7.1% ± 1.0 AGE
16 to 19 years 2,551 ± 130 34.7% ± 5.2 27.8% ± 4.6 19.8% ± 5.6
20 to 24 years 2,890 ± 49 78.8% ± 3.8 68.1% ± 4.6 13.3% ± 3.4
25 to 29 years 2,600 ± 69 77.7% ± 4.7 69.4% ± 5.5 10.5% ± 3.9
30 to 34 years 2,629 ± 78 80.5% ± 4.6 75.0% ± 5.3 6.7% ± 3.2
35 to 44 years 5,649 ± 63 78.9% ± 3.6 73.9% ± 4.0 6.2% ± 1.9
45 to 54 years 7,574 ± 62 76.7% ± 2.7 73.1% ± 2.6 4.5% ± 1.3
55 to 59 years 4,223 ± 238 67.6% ± 5.0 63.6% ± 5.1 5.9% ± 2.0
60 to 64 years 3,175 ± 226 50.0% ± 4.9 48.2% ± 4.7 3.5% ± 1.9
65 to 74 years 5,172 ± 43 21.5% ± 2.6 20.9% ± 2.6 2.8% ± 1.9
75 years and over 3,896 ± 36 5.5% ± 1.6 5.0% ± 1.5 10.2% ± 8.2
RACE AND HISPANIC OR LATINO ORIGIN
White alone 39,035 ± 133 57.7% ± 1.3 53.6% ± 1.4 7.0% ± 1.0
Black or African American alone 359 ± 50 39.8% ± 14.3 39.8% ± 14.3 0.0% ± 18.8
American Indian and Alaska Native alone 131 ± 47 56.5% ± 17.2 38.2% ± 17.7 32.4% ± 26.5
Asian alone 239 ± 55 76.6% ± 11.4 74.1% ± 11.9 3.3% ± 5.6
Two or more races 406 ± 114 62.8% ± 11.0 57.6% ± 11.1 8.2% ± 8.0
Hispanic or Latino origin (of any race) 730 ± 21 65.6% ± 7.0 58.8% ± 8.7 10.4% ± 8.6
White alone, not Hispanic or Latino 38,564 ± 104 57.7% ± 1.3 53.6% ± 1.4 6.9% ± 1.0
SEX Population 20 to 64 years 28,740 ± 80 73.5% ± 1.5 68.4% ± 1.6 6.7% ± 1.0
Male 14,415 ± 77 76.3% ± 1.8 70.7% ± 1.9 7.0% ± 1.3
Female 14,325 ± 59 70.7% ± 2.4 66.2% ± 2.4 6.4% ± 1.3
With own children under 18 years 4,694 ± 246 72.9% ± 4.0 68.3% ± 4.1 6.3% ± 2.2
EDUCATIONAL ATTAINMENT Population 25 to 64 years 25,850 ± 79 72.9% ± 1.6 68.5% ± 1.7 5.9% ± 1.0
Less than high school graduate 2,570 ± 280 43.1% ± 5.2 37.3% ± 5.0 13.4% ± 5.8
High school graduate (includes equivalency) 9,816 ± 381 70.9% ± 2.9 65.6% ± 3.2 7.5% ± 1.9
Some college or associate's degree 8,635 ± 394 78.3% ± 2.6 74.3% ± 2.6 4.8% ± 1.4
Bachelor's degree or higher 4,829 ± 410 83.0% ± 2.5 80.6% ± 2.9 3.0% ± 1.4
Table formula: LABOR FORCE = # EMPLOYED + # UNEMPLOYED % IN LABOR FORCE = LABOR FORCE / TOTAL * 100% % EMPLOYED = # EMPLOYED / TOTAL * 100% UNEMPLOYMENT RATE = # UNEMPLOYED / LABOR FORCE * 100% Source: 2011-2015 American Community Survey
Chenango County Profile
Page 21 of 31
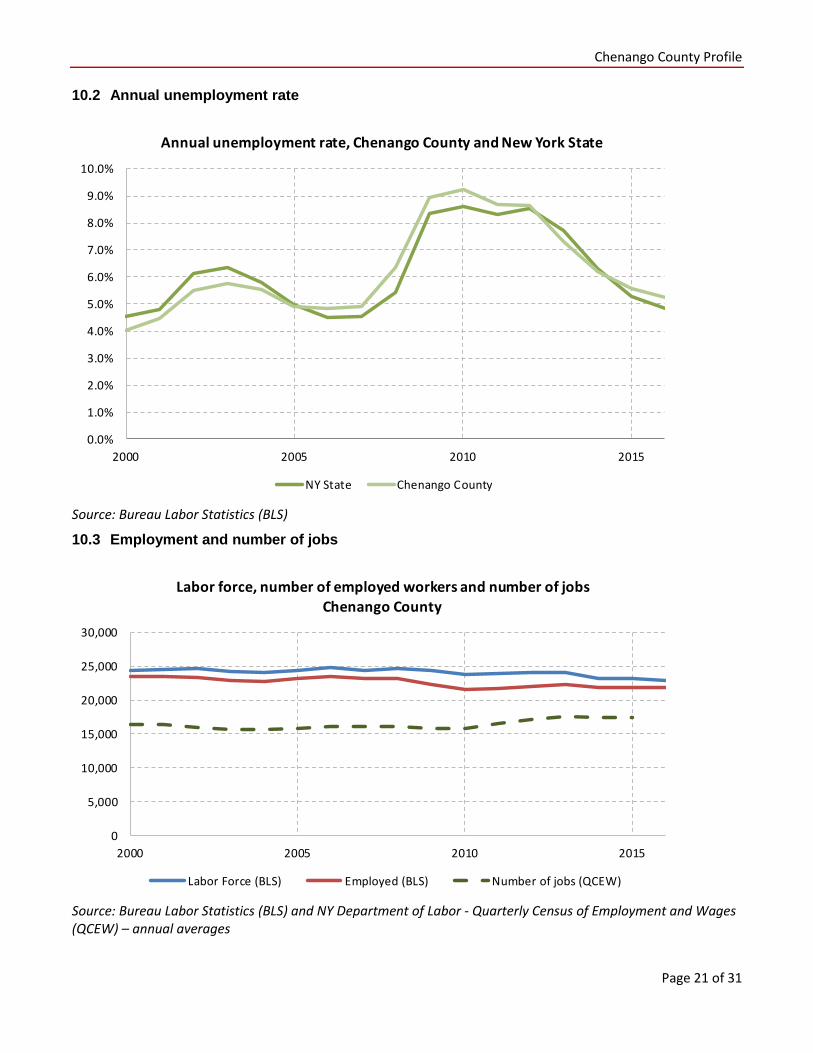
10.2 Annual unemployment rate
Source: Bureau Labor Statistics (BLS)
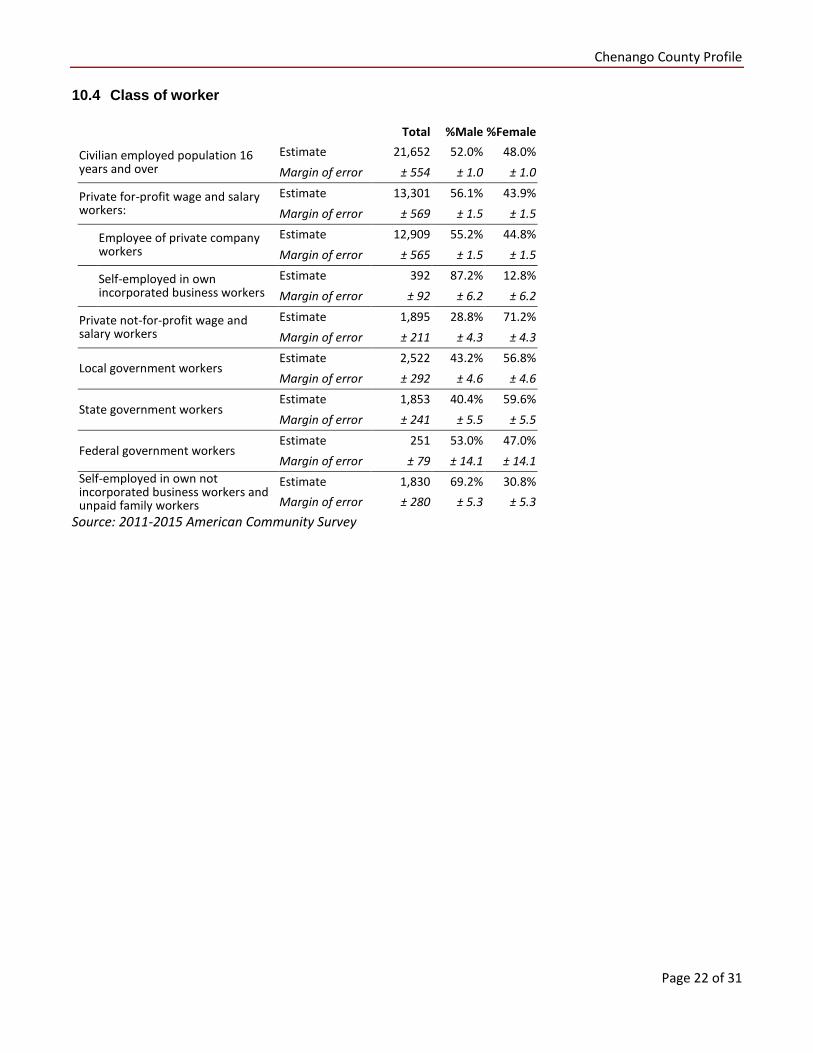
10.3 Employment and number of jobs
Source: Bureau Labor Statistics (BLS) and NY Department of Labor - Quarterly Census of Employment and Wages (QCEW) – annual averages
0.0%
1.0%
2.0%
3.0%
4.0%
5.0%
6.0%
7.0%
8.0%
9.0%
10.0%
2000 2005 2010 2015
Annual unemployment rate, Chenango County and New York State
NY State Chenango County
0
5,000
10,000
15,000
20,000
25,000
30,000
2000 2005 2010 2015
Labor force, number of employed workers and number of jobsChenango County
Labor Force (BLS) Employed (BLS) Number of jobs (QCEW)
Chenango County Profile
Page 22 of 31
10.4 Class of worker
Total %Male %Female
Civilian employed population 16 years and over
Estimate 21,652 52.0% 48.0% Margin of error ± 554 ± 1.0 ± 1.0
Private for-profit wage and salary workers:
Estimate 13,301 56.1% 43.9% Margin of error ± 569 ± 1.5 ± 1.5
Employee of private company workers
Estimate 12,909 55.2% 44.8%
Margin of error ± 565 ± 1.5 ± 1.5
Self-employed in own incorporated business workers
Estimate 392 87.2% 12.8%
Margin of error ± 92 ± 6.2 ± 6.2
Private not-for-profit wage and salary workers
Estimate 1,895 28.8% 71.2% Margin of error ± 211 ± 4.3 ± 4.3
Local government workers Estimate 2,522 43.2% 56.8% Margin of error ± 292 ± 4.6 ± 4.6
State government workers Estimate 1,853 40.4% 59.6% Margin of error ± 241 ± 5.5 ± 5.5
Federal government workers Estimate 251 53.0% 47.0% Margin of error ± 79 ± 14.1 ± 14.1
Self-employed in own not incorporated business workers and unpaid family workers
Estimate 1,830 69.2% 30.8% Margin of error ± 280 ± 5.3 ± 5.3
Source: 2011-2015 American Community Survey
Chenango County Profile
Page 23 of 31
11 Household Income 11.1 Income Distribution
Estimate
Margin of error
Interval width (in
$1,000)
Est. per $1,000 section
Total: 19,641 ± 343
Less than $10,000 1,340 ± 200 10 134.0
$10,000 to $14,999 1,337 ± 195 5 267.4
$15,000 to $19,999 1,281 ± 154 5 256.2
$20,000 to $24,999 1,445 ± 177 5 289.0
$25,000 to $29,999 1,259 ± 187 5 251.8
$30,000 to $34,999 1,053 ± 154 5 210.6
$35,000 to $39,999 942 ± 148 5 188.4
$40,000 to $44,999 1,054 ± 157 5 210.8
$45,000 to $49,999 855 ± 135 5 171.0
$50,000 to $59,999 1,552 ± 177 10 155.2
$60,000 to $74,999 2,441 ± 254 15 162.7
$75,000 to $99,999 2,377 ± 239 25 95.1
$100,000 to $124,999 1,388 ± 191 25 55.5
$125,000 to $149,999 669 ± 141 25 26.8
$150,000 to $199,999 437 ± 72 50 8.7
$200,000 or more 211 ± 66 - -
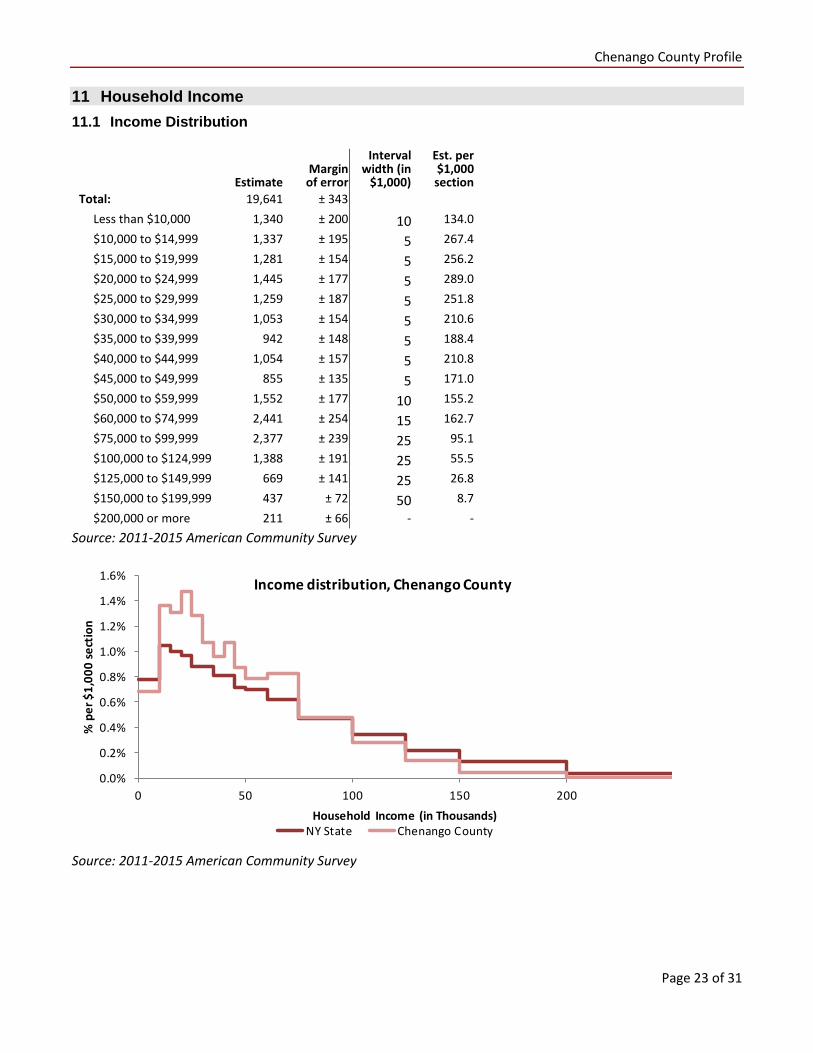
Source: 2011-2015 American Community Survey
Source: 2011-2015 American Community Survey
0.0%
0.2%
0.4%
0.6%
0.8%
1.0%
1.2%
1.4%
1.6%
0 50 100 150 200
% p
er $
1,00
0 se
ctio
n
Household Income (in Thousands)
Income distribution, Chenango County
NY State Chenango County
Chenango County Profile
Page 24 of 31
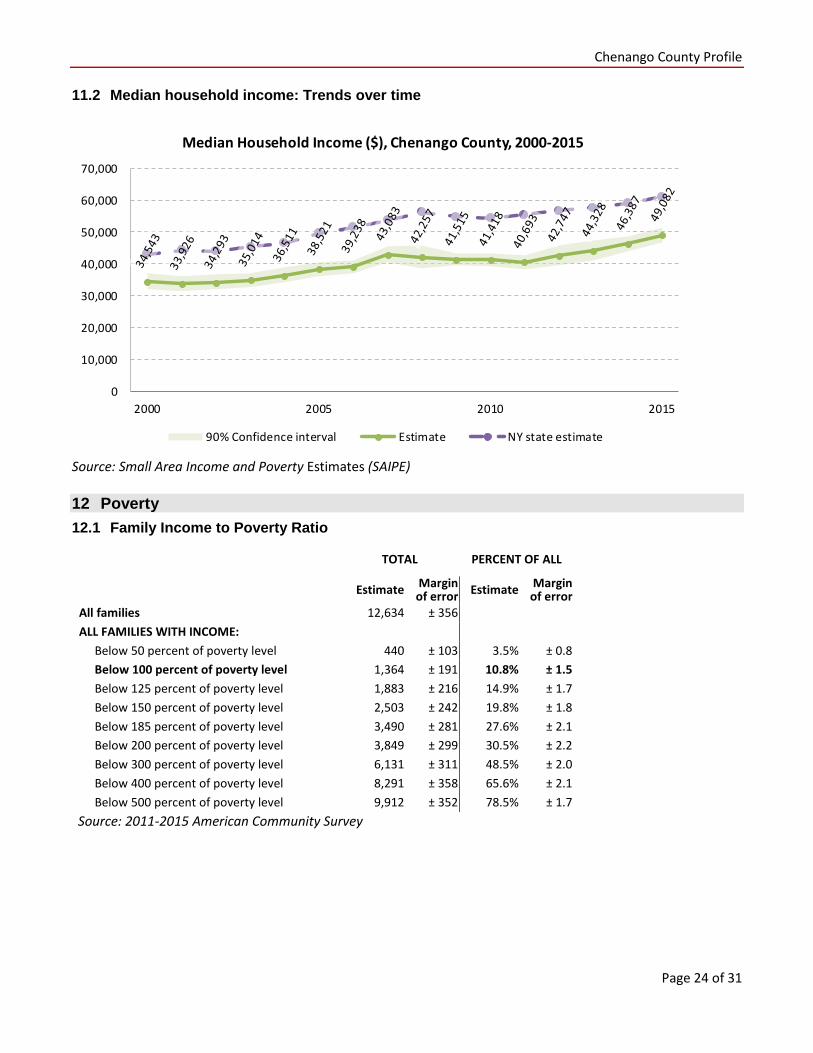
11.2 Median household income: Trends over time
Source: Small Area Income and Poverty Estimates (SAIPE)
12 Poverty 12.1 Family Income to Poverty Ratio
TOTAL PERCENT OF ALL
Estimate Margin of error Estimate Margin
of error All families 12,634 ± 356 ALL FAMILIES WITH INCOME:
Below 50 percent of poverty level 440 ± 103 3.5% ± 0.8
Below 100 percent of poverty level 1,364 ± 191 10.8% ± 1.5
Below 125 percent of poverty level 1,883 ± 216 14.9% ± 1.7
Below 150 percent of poverty level 2,503 ± 242 19.8% ± 1.8
Below 185 percent of poverty level 3,490 ± 281 27.6% ± 2.1
Below 200 percent of poverty level 3,849 ± 299 30.5% ± 2.2
Below 300 percent of poverty level 6,131 ± 311 48.5% ± 2.0
Below 400 percent of poverty level 8,291 ± 358 65.6% ± 2.1
Below 500 percent of poverty level 9,912 ± 352 78.5% ± 1.7
Source: 2011-2015 American Community Survey
0
10,000
20,000
30,000
40,000
50,000
60,000
70,000
2000 2005 2010 2015
Median Household Income ($), Chenango County, 2000-2015
90% Confidence interval Estimate NY state estimate
Chenango County Profile
Page 25 of 31
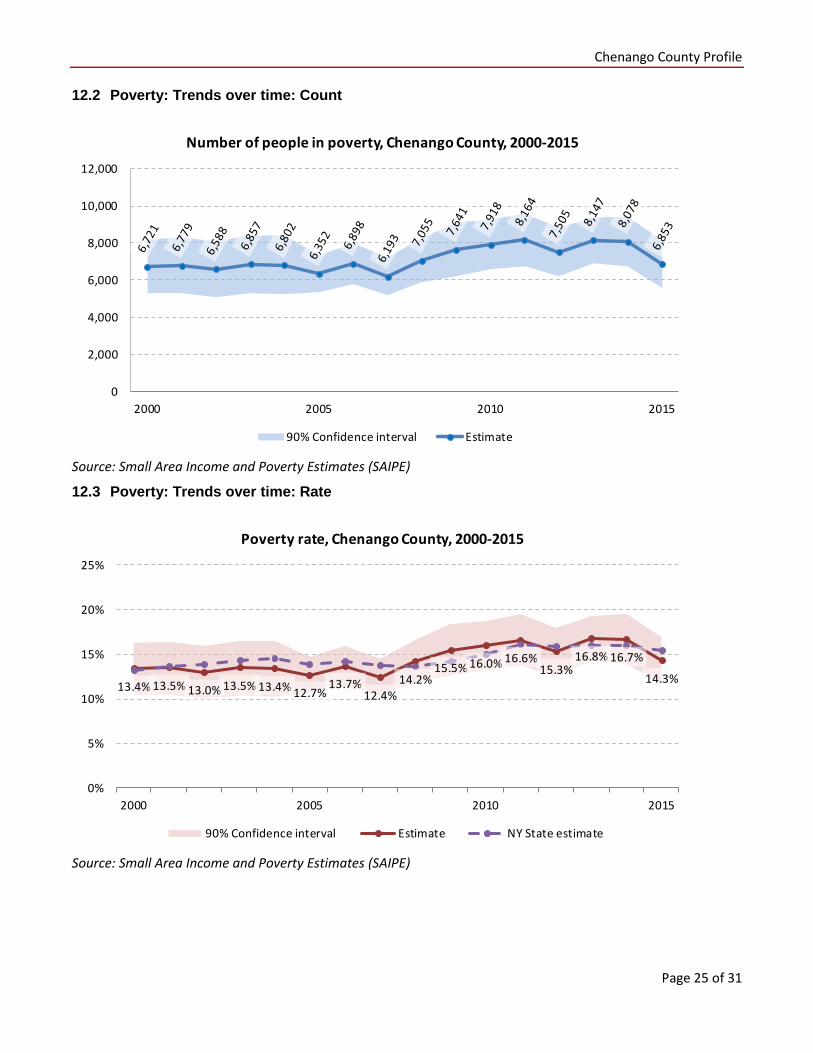
12.2 Poverty: Trends over time: Count
Source: Small Area Income and Poverty Estimates (SAIPE)
12.3 Poverty: Trends over time: Rate
Source: Small Area Income and Poverty Estimates (SAIPE)
0
2,000
4,000
6,000
8,000
10,000
12,000
2000 2005 2010 2015
Number of people in poverty, Chenango County, 2000-2015
90% Confidence interval Estimate
13.4% 13.5% 13.0% 13.5% 13.4% 12.7%13.7%
12.4%14.2%
15.5% 16.0% 16.6%15.3%
16.8% 16.7%
14.3%
0%
5%
10%
15%
20%
25%
2000 2005 2010 2015
Poverty rate, Chenango County, 2000-2015
90% Confidence interval Estimate NY State estimate
Chenango County Profile
Page 26 of 31
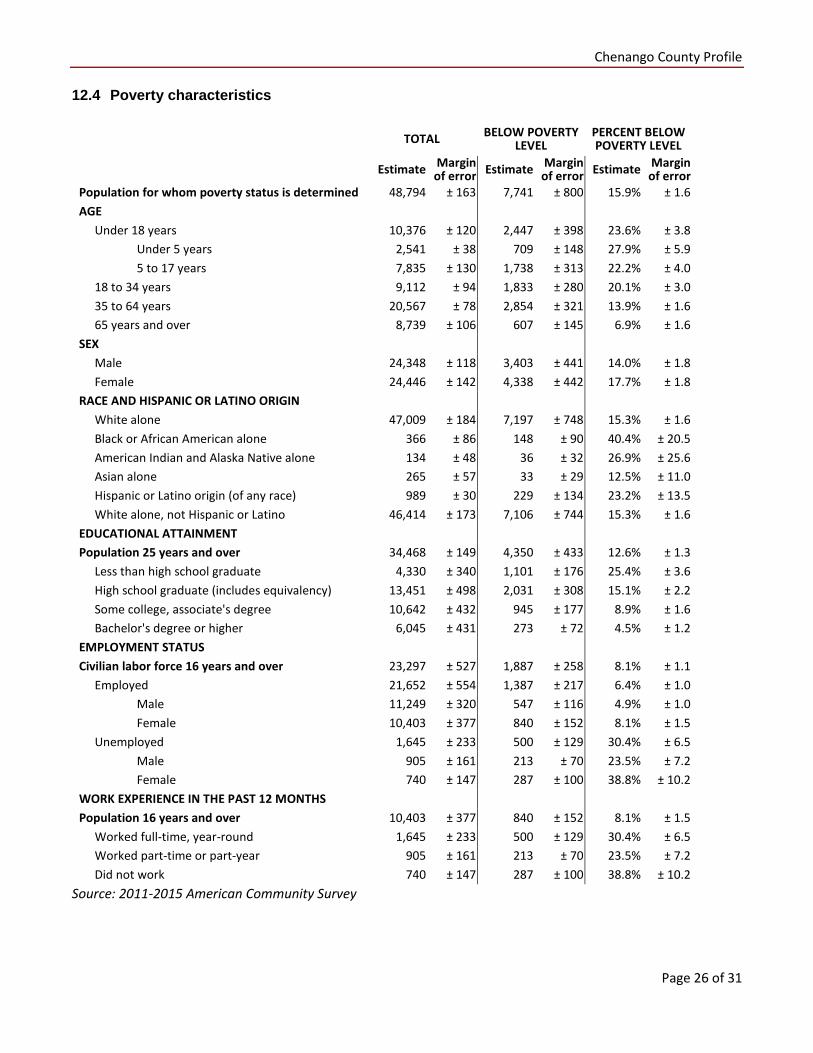
12.4 Poverty characteristics
TOTAL BELOW POVERTY
LEVEL PERCENT BELOW POVERTY LEVEL
Estimate Margin of error Estimate Margin
of error Estimate Margin of error
Population for whom poverty status is determined 48,794 ± 163 7,741 ± 800 15.9% ± 1.6 AGE
Under 18 years 10,376 ± 120 2,447 ± 398 23.6% ± 3.8
Under 5 years 2,541 ± 38 709 ± 148 27.9% ± 5.9
5 to 17 years 7,835 ± 130 1,738 ± 313 22.2% ± 4.0
18 to 34 years 9,112 ± 94 1,833 ± 280 20.1% ± 3.0
35 to 64 years 20,567 ± 78 2,854 ± 321 13.9% ± 1.6
65 years and over 8,739 ± 106 607 ± 145 6.9% ± 1.6
SEX
Male 24,348 ± 118 3,403 ± 441 14.0% ± 1.8
Female 24,446 ± 142 4,338 ± 442 17.7% ± 1.8
RACE AND HISPANIC OR LATINO ORIGIN
White alone 47,009 ± 184 7,197 ± 748 15.3% ± 1.6
Black or African American alone 366 ± 86 148 ± 90 40.4% ± 20.5
American Indian and Alaska Native alone 134 ± 48 36 ± 32 26.9% ± 25.6
Asian alone 265 ± 57 33 ± 29 12.5% ± 11.0
Hispanic or Latino origin (of any race) 989 ± 30 229 ± 134 23.2% ± 13.5
White alone, not Hispanic or Latino 46,414 ± 173 7,106 ± 744 15.3% ± 1.6
EDUCATIONAL ATTAINMENT Population 25 years and over 34,468 ± 149 4,350 ± 433 12.6% ± 1.3
Less than high school graduate 4,330 ± 340 1,101 ± 176 25.4% ± 3.6
High school graduate (includes equivalency) 13,451 ± 498 2,031 ± 308 15.1% ± 2.2
Some college, associate's degree 10,642 ± 432 945 ± 177 8.9% ± 1.6
Bachelor's degree or higher 6,045 ± 431 273 ± 72 4.5% ± 1.2
EMPLOYMENT STATUS Civilian labor force 16 years and over 23,297 ± 527 1,887 ± 258 8.1% ± 1.1
Employed 21,652 ± 554 1,387 ± 217 6.4% ± 1.0
Male 11,249 ± 320 547 ± 116 4.9% ± 1.0
Female 10,403 ± 377 840 ± 152 8.1% ± 1.5
Unemployed 1,645 ± 233 500 ± 129 30.4% ± 6.5
Male 905 ± 161 213 ± 70 23.5% ± 7.2
Female 740 ± 147 287 ± 100 38.8% ± 10.2
WORK EXPERIENCE IN THE PAST 12 MONTHS Population 16 years and over 10,403 ± 377 840 ± 152 8.1% ± 1.5
Worked full-time, year-round 1,645 ± 233 500 ± 129 30.4% ± 6.5
Worked part-time or part-year 905 ± 161 213 ± 70 23.5% ± 7.2
Did not work 740 ± 147 287 ± 100 38.8% ± 10.2
Source: 2011-2015 American Community Survey
Chenango County Profile
Page 27 of 31
13 Glossary
American Community Survey (ACS) - The American Community Survey is an ongoing survey of the population that provides data every year on a variety of social and economic characteristics—age, sex, race, family and relationships, income and benefits, health insurance, education, veteran status, disabilities, where you work and how you get there, where you live and how much you pay for some essentials. The ACS replaced the information previously gathered by what was known as the “long form” of the decennial censuses. The ACS provides communities, companies and other institutions with current information they need to plan investments and services. Information from the survey generates data that help determine how more than $400 billion in federal and state funds are distributed each year. Every estimate presented in the American Community Survey, as in other surveys, has an uncertainty associated with it. Often the magnitude of that uncertainty is expressed as the Margin of Error.
Confidence Interval (CI) - indication of the degree of uncertainty about a sample estimates. Confidence intervals have been traditionally reported at the 90, 95 and 99 percent levels. A 90 percent confidence interval can be interpreted, for example, roughly as providing 90 percent certainty that the interval defined by the upper and lower bounds contain the true value of the characteristic. If a Margin of Error is given, the lower bound of the confidence interval is equal to the estimate minus the Margin of Error and the upper bound is equal to the estimate plus the Margin of Error. (See further, Margin of Error definition below.)
County subdivision or Minor Civil Division (MCD) - The Census Bureau geography for primary administrative units below the county level in New York is collectively referred to as county subdivisions or minor civil divisions. These include towns, cities and Indian Reservations.
Decennial Census - the Census of the population and housing taken every 10 years in the United States, at the start of each decade, since 1790.
Employed – either “at work” or “with a job, but not at work”.
Group Quarters Population - all U.S. residents who live in group living facilities including correctional institutions, juvenile facilities, skilled nursing facilities, college residence halls, military barracks, group homes, and workers' dormitories.
Household Population - all U.S. residents who live in housing units such as single family homes, townhouses, apartments, and mobile homes.
Intercensal Population Estimates - estimates produced for the years between two decennial censuses when both the beginning and ending populations are known. They are produced once a decade by adjusting the existing time series of postcensal estimates for the entire decade to smooth the transition from one decennial census count to the next. They differ from the postcensal estimates that are released annually because the difference between the April 1 postcensal estimate and April 1 census count for the end of the decade is redistributed across the estimates for that decade. For dates when both postcensal and intercensal estimates are available, intercensal estimates are preferred.
Labor Force - consists of people classified as employed or unemployed.
Margin of Error (MOE) - a measure of the precision of an estimate at a given level of confidence. The confidence level of a margin of error indicates the likelihood that the difference between the population value (which you
Chenango County Profile
Page 28 of 31
would get if you could measure the whole population instead of a sample) and the estimate is less than or equal to the margin of error. The range from the estimate minus the margin of error to the estimate plus the margin of error is called the confidence interval. All ACS estimates are published with their margins of error at the 90 percent confidence level. Margins of error are useful in assessing the reliability of estimates and whether differences between estimates are significant.
Numeric Population Change - difference between the population of an area at the beginning and end of a time period. It is computed by taking the difference between the population at one point in time (t1) and some future time (t2).
Percent Population Change - difference between the population of an area at the beginning and end of a time period, expressed as a percentage of the beginning population. It is computed by dividing the population change (t2 - t1) by t1 and multiplying the result by 100.
Population Estimates - The calculated number of people living in an area as of a specified point in time, usually July 1st. The estimated population is calculated using a component of change model that incorporates information on natural increase (births, deaths) and net migration (net domestic migration, net international migration) that has occurred in an area since the latest decennial census. A procedure for estimating the current population using a procedure involving a “base population” value at time t -1, adding to that the births during the interval t-1 to t, subtracting the deaths during that interval t-1 to t, and then adding the net domestic and net international migration that occurred during that interval.
Population Density - Total number of people per areal unit like a square mile or square kilometer.
Population Pyramids - A graphical way of portraying a population’s age and sex composition at a given slice in time. The first horizontal bar, constituting the base of the graph, is the youngest age group (typically 0-4) with the number of males in that age group on the left and the number of females in that age group on the right. On top of that age group is another horizontal bar for the next age group (e.g. 5-9) and so forth with the top bar typically for those aged 75 and over. In a population with lots of births and deaths, the shape typically forms a pyramid with a broad base and a narrow top. It is one of the most basic ways to understand population change over time as well as between different geographic units of a similar status (e.g. counties).
Postcensal Estimates - estimates produced for the years after a decennial census when only the beginning population is known. They are produced and revised each year, targeted to July 1 of that year.
Projection - estimated population at some future time based on assumptions about births, deaths, migration, and ages.
Race/Ethnicity - the Census Bureau collects racial data in accordance with guidelines provided by the U.S. Office of Management and Budget (OMB), and these data are based on self-identification. The racial categories included in the census questionnaire generally reflect a social definition of race recognized in this country and not an attempt to define race biologically, anthropologically, or genetically. In addition, it is recognized that the categories of the race item include racial and national origin or sociocultural groups. People may choose to report more than one race to indicate their racial mixture, such as “American Indian” and “White.” People who identify their origin as Hispanic, Latino, or Spanish may be of any race. OMB requires five minimum categories: White, Black or African American, American Indian or Alaska Native, Asian, and Native Hawaiian or Other Pacific Islander. Hispanics may be classified as white or black. So we generally separate them out as an ethnic group first.
Chenango County Profile
Page 29 of 31
Unemployed – Not employed, but actively looking for work and available to accept a job.
Unemployment rate – Fraction of the Labor Force that is unemployed.
Urban Area – A densely settled area with at least 2,500 people. If the total number of people is less than 50,000 the Census Bureau calls it an Urban Cluster, otherwise an Urbanized Area.
Vintage - each year, the U.S. Census Bureau produces and publishes estimates of the population for each state and county, as well as the nation as a whole. These are called “vintages.” In producing these vintages, the Bureau utilizes administrative data from a number of sources to estimate 1) the change in population since the most recent decennial census, and 2) the population for each year since the most recent decennial census. With each annual release of population estimates (vintage), the entire time series of estimates beginning on April 1, 2010 is revised and updated.
Vital Statistics - quantitative data concerning a population, such as the number of births, marriages, and deaths.
Chenango County Profile
Page 30 of 31
14 References
Chenango County homepage: https://www.co.chenango.ny.us/
At Cornell:
• Program on Applied Demographics (PAD) URL: http://pad.human.cornell.edu/
o More county trends: https://pad.human.cornell.edu/counties/trends1geo.cfm?geo=17 • Community and Regional Development Institute (CaRDI)
URL: https://cardi.cals.cornell.edu/ • Cornell Cooperative Extensions (CCE)
Home page: http://www.cce.cornell.edu o Chenango local office: http://ccechenango99.squarespace.com/
Data sources and background information:
• New York State Data Center o https://labor.ny.gov/nys-data-center/index.shtm
• U.S. Census Bureau - general o QuickFacts: https://www.census.gov/quickfacts/table/PST045216/36,36017 o American FactFinder: http://factfinder.census.gov/
• U.S. Census Bureau - population o Decennial Census
Background: https://www.census.gov/2010census/ Demographic Profile:
http://factfinder2.census.gov/bkmk/table/1.0/en/DEC/10_SF1/SF1DP1/0500000US36017
o American Community Survey (ACS) Background: https://www.census.gov/programs-surveys/acs/ Social Data Profile:
http://factfinder2.census.gov/bkmk/table/1.0/en/ACS/15_5YR/DP02/0500000US36017 Economic Data Profile:
http://factfinder2.census.gov/bkmk/table/1.0/en/ACS/15_5YR/DP03/0500000US36017 Housing Data Profile:
http://factfinder2.census.gov/bkmk/table/1.0/en/ACS/15_5YR/DP04/0500000US36017 Demographics Data Profile:
http://factfinder2.census.gov/bkmk/table/1.0/en/ACS/15_5YR/DP05/0500000US36017 o Population estimates:
General: https://www.census.gov/programs-surveys/popest.html Explorer: https://www.census.gov/censusexplorer/censusexplorer-popest.html
• U.S. Census Bureau – Small Area Income & Poverty Estimates (SAIPE) o http://www.census.gov/did/www/saipe/
• U.S. Census Bureau - Public Use Quarterly Workforce Indicators (QWI) – annual averages o https://qwiexplorer.ces.census.gov/static/explore.html
• U.S. Census Bureau – Building Permits Survey o https://www.census.gov/construction/bps/
Chenango County Profile
Page 31 of 31
• Bureau Labor Statistics (BLS) o Local Area Unemployment Statistics: http://www.bls.gov/lau/ o Quarterly Census of Employment and Wages (QCEW): https://www.bls.gov/cew/data.htm
• NY Department of Labor - o Labor statistics: https://labor.ny.gov/stats/index.shtm o Quarterly Census of Employment and Wages (QCEW): https://labor.ny.gov/stats/LSQCEW.shtm
• NY State Department of Health o Vital Statistics: https://www.health.ny.gov/statistics/vital_statistics/
• Bureau of Economic Analysis (BEA) – Local Area Personal Income and Employment: http://bea.gov/iTable/iTable.cfm?ReqID=70&step=1
Alternative sites for data retrieval:
• The Nelson A. Rockefeller Institute of Government – New York State Statistical Yearbooks http://www.rockinst.org/nys_statistics/
• Headwaters Economics: Economic Profile System – Human Dimensions Toolkit http://headwaterseconomics.org/tools/eps-hdt
• National Historical Geographic Information System (NHGIS) https://www.nhgis.org/
• Social Explorer http://www.socialexplorer.com/pub/home/home.aspx
• Stats America http://www.statsamerica.org/Default.aspx
• Missouri Census Data Center http://mcdc.missouri.edu/
• DataFerret http://dataferrett.census.gov/
• Investigative Reporters and Editors (IRE) Census project http://census.ire.org/
Related Documents