Chelsea Global Advisors Markets Are Cyclical. Knowledge is Cumulative. Investment Management Services Client Brochure

Chelsea Global Advisors Markets Are Cyclical. Knowledge is Cumulative. Investment Management Services Client Brochure.
Dec 17, 2015
Welcome message from author
This document is posted to help you gain knowledge. Please leave a comment to let me know what you think about it! Share it to your friends and learn new things together.
Transcript

Chelsea Global AdvisorsMarkets Are Cyclical. Knowledge is Cumulative.
Investment Management Services
Client Brochure
2
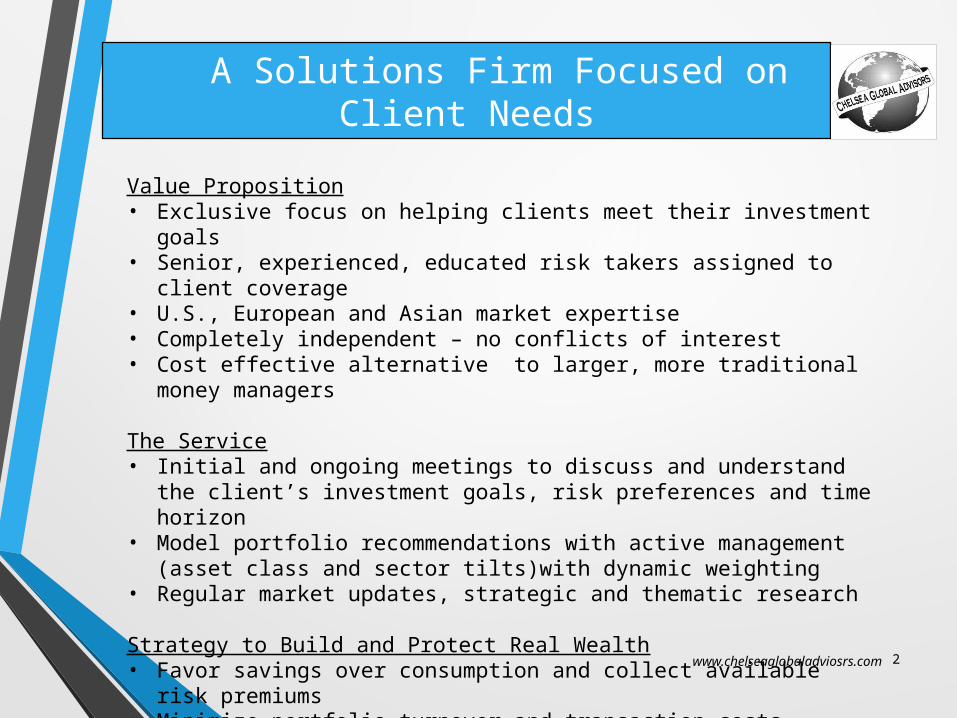
A Solutions Firm Focused on Client Needs
Value Proposition• Exclusive focus on helping clients meet their investment goals• Senior, experienced, educated risk takers assigned to client
coverage• U.S., European and Asian market expertise• Completely independent – no conflicts of interest• Cost effective alternative to larger, more traditional money
managers
The Service• Initial and ongoing meetings to discuss and understand the client’s
investment goals, risk preferences and time horizon• Model portfolio recommendations with active management (asset
class and sector tilts)with dynamic weighting• Regular market updates, strategic and thematic research
Strategy to Build and Protect Real Wealth• Favor savings over consumption and collect available risk
premiums • Minimize portfolio turnover and transaction costs• Minimize and defer tax consequencesD
www.chelseaglobaladviosrs.com
3
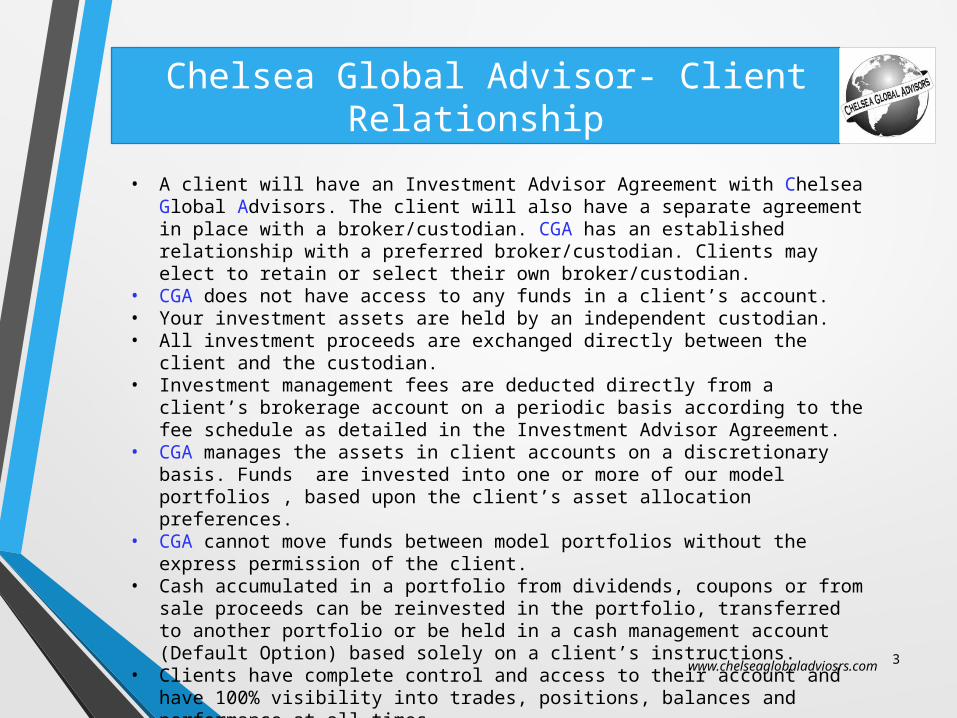
Chelsea Global Advisor- Client Relationship
• A client will have an Investment Advisor Agreement with Chelsea Global Advisors. The client will also have a separate agreement in place with a broker/custodian. CGA has an established relationship with a preferred broker/custodian. Clients may elect to retain or select their own broker/custodian.
• CGA does not have access to any funds in a client’s account.• Your investment assets are held by an independent custodian. • All investment proceeds are exchanged directly between the client and the
custodian. • Investment management fees are deducted directly from a client’s
brokerage account on a periodic basis according to the fee schedule as detailed in the Investment Advisor Agreement.
• CGA manages the assets in client accounts on a discretionary basis. Funds are invested into one or more of our model portfolios , based upon the client’s asset allocation preferences.
• CGA cannot move funds between model portfolios without the express permission of the client.
• Cash accumulated in a portfolio from dividends, coupons or from sale proceeds can be reinvested in the portfolio, transferred to another portfolio or be held in a cash management account (Default Option) based solely on a client’s instructions.
• Clients have complete control and access to their account and have 100% visibility into trades, positions, balances and performance at all times.
• Transaction fees are paid (or are deducted from proceeds), by the client directly to the broker/custodian. CGA does not receive any pecuniary or other benefit from transaction fees.
www.chelseaglobaladviosrs.com
4
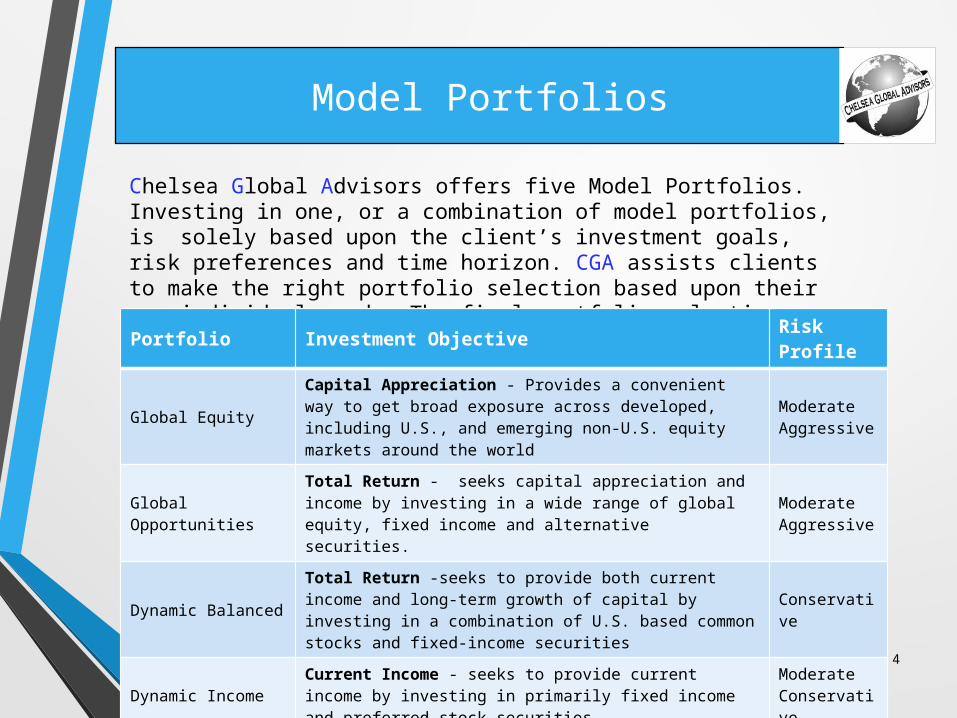
Model Portfolios
Chelsea Global Advisors offers five Model Portfolios. Investing in one, or a combination of model portfolios, is solely based upon the client’s investment goals, risk preferences and time horizon. CGA assists clients to make the right portfolio selection based upon their own individual needs. The final portfolio selection decision is always made by the client.
www.chelseaglobaladviosrs.com
Portfolio Investment ObjectiveRisk Profile
Global EquityCapital Appreciation - Provides a convenient way to get broad exposure across developed, including U.S., and emerging non-U.S. equity markets around the world
Moderate Aggressive
Global Opportunities
Total Return - seeks capital appreciation and income by investing in a wide range of global equity, fixed income and alternative securities.
Moderate Aggressive
Dynamic Balanced
Total Return -seeks to provide both current income and long-term growth of capital by investing in a combination of U.S. based common stocks and fixed-income securities
Conservative
Dynamic IncomeCurrent Income - seeks to provide current income by investing in primarily fixed income and preferred stock securities
Moderate Conservative
Real ReturnTotal Return - seeks to achieve real return ( i.e. keeps pace with inflation) consisting of capital appreciation and current income.
Moderate Aggressive
5
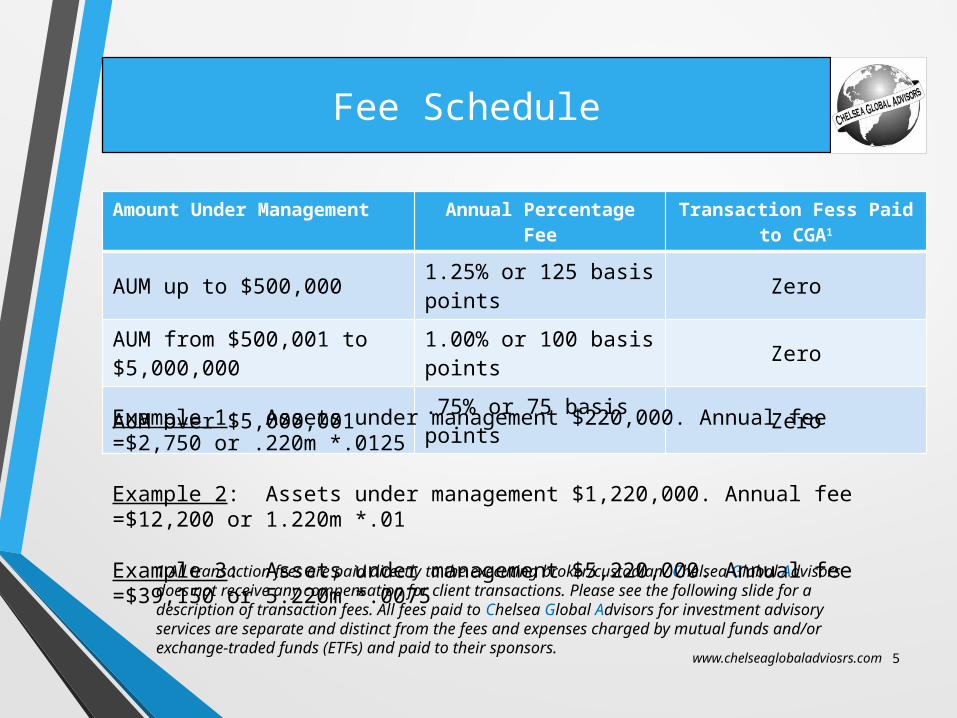
Fee Schedule
www.chelseaglobaladviosrs.com
Amount Under Management
Annual Percentage Fee
Transaction Fess Paid to CGA1
AUM up to $500,000 1.25% or 125 basis points Zero
AUM from $500,001 to $5,000,000
1.00% or 100 basis points Zero
AUM over $5,000,001 .75% or 75 basis points Zero
1.All transaction fees are paid directly to the executing broker/custodian. Chelsea Global Advisors does not receive any compensation for client transactions. Please see the following slide for a description of transaction fees. All fees paid to Chelsea Global Advisors for investment advisory services are separate and distinct from the fees and expenses charged by mutual funds and/or exchange-traded funds (ETFs) and paid to their sponsors.
Example 1: Assets under management $220,000. Annual fee =$2,750 or .220m *.0125
Example 2: Assets under management $1,220,000. Annual fee =$12,200 or 1.220m *.01
Example 3: Assets under management $5,220,000. Annual fee =$39,150 or 5.220m *.0075
6
Executing Broker and Custodian
www.chelseaglobaladviosrs.com
• Chelsea Global Advisors has selected Interactive Brokers to provide execution, clearing, custodial and reporting services for its investment management clients. Clients may elect to retain or select their own broker/custodian.
• CGA performed a due diligence analysis of six potential brokers before selecting Interactive Brokers (IB). IB is registered with the Securities and Exchange Commission, 16 Self Regulatory Organizations or SROs and with 52 States and Territories. The Company, established in 1998, is a registered broker dealer (CRD#36418) and is regulated by FINRA’s Boston District Office. Interactive Broker’s Group is a publicly traded company on NASDAQ Symbol: IBKR.
• Barron’s Magazine voted IB the best online broker for 2014 for the third consecutive year based upon a combination of factors including range of offerings, customer service and costs.
• IB execution commissions rates are significantly below other brokers. Example: 100 shares of a U.S. Listed Equity bought or sold will cost $1.00 at IB.
• Interactive Brokers has ,subject to change, a required minimum account balance of $10,000. An activity fee, a maximum of $6 per month, is charged to accounts where monthly commissions fall below the required minimum. The activity fee cannot exceed $72 in one calendar year.
• CGA performs ongoing due diligence reviews of IB to ensure its services continue to meet client needs and expectations.
7
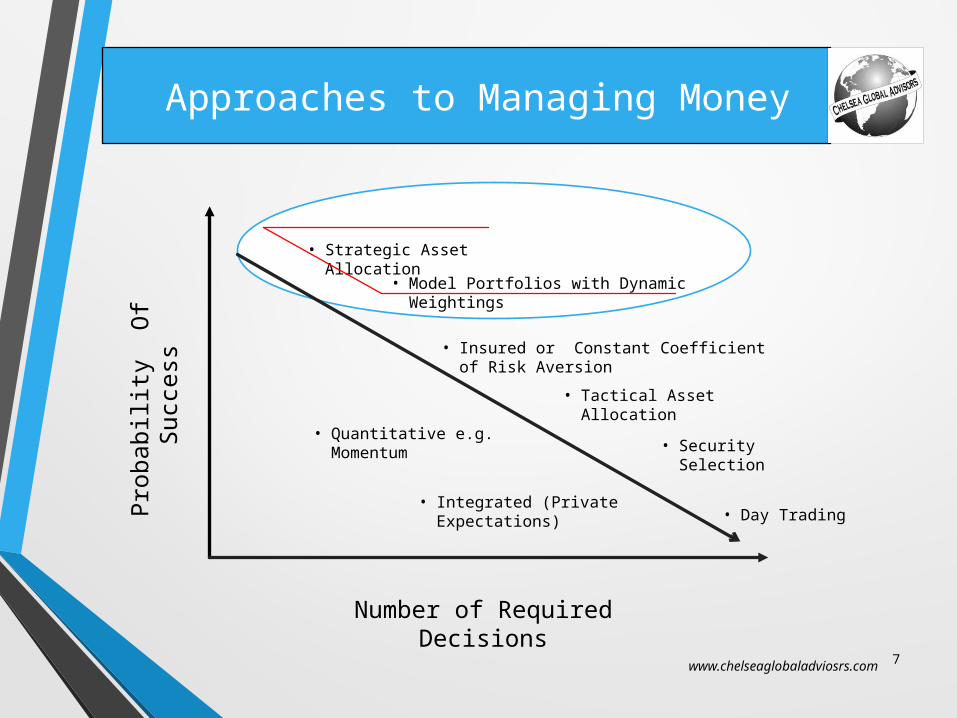
Approaches to Managing Money
Number of Required Decisions
Pro
babili
ty
Of
Su
ccess
• Strategic Asset Allocation
• Insured or Constant Coefficient of Risk Aversion
• Tactical Asset Allocation
• Day Trading
• Security Selection
• Model Portfolios with Dynamic Weightings
• Integrated (Private Expectations)
• Quantitative e.g. Momentum
www.chelseaglobaladviosrs.com
8
A Simple Yet Powerful Equation
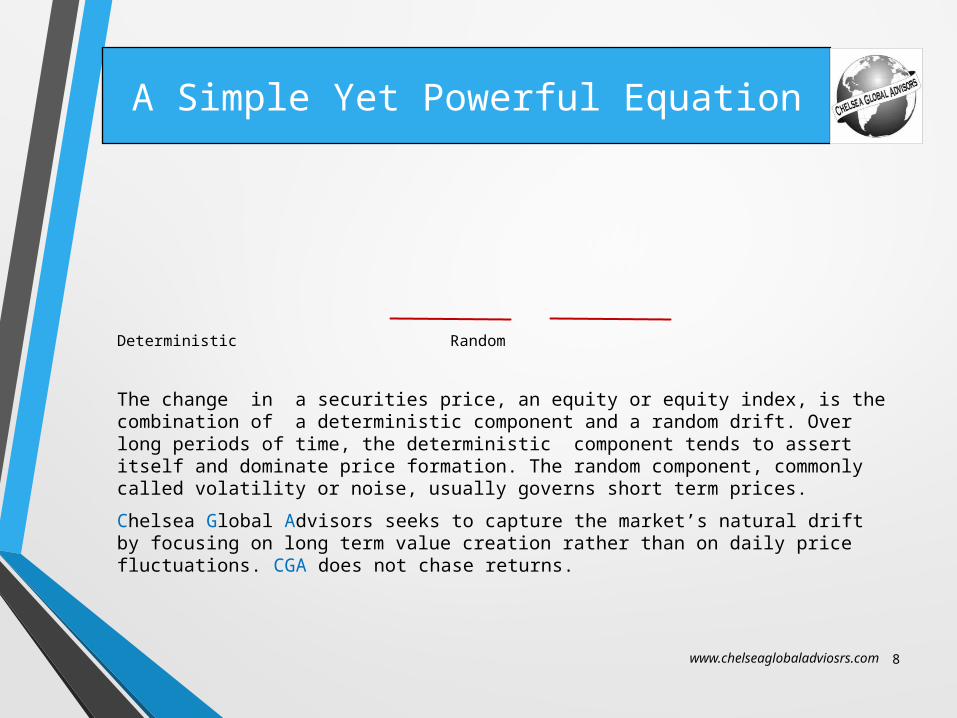
Deterministic Random
The change in a securities price, an equity or equity index, is the combination of a deterministic component and a random drift. Over long periods of time, the deterministic component tends to assert itself and dominate price formation. The random component, commonly called volatility or noise, usually governs short term prices.
Chelsea Global Advisors seeks to capture the market’s natural drift by focusing on long term value creation rather than on daily price fluctuations. CGA does not chase returns.
www.chelseaglobaladviosrs.com
9
The Fundamental Law of Active Management1
www.chelseaglobaladviosrs.com
Information Ratio (IR) measures a managers ability to generate excess returns relative to a benchmark. Investment managers strive to have consistently high Information Ratios.
IR = IC * Square root BR or equals an information coefficient times breath. The information coefficient (IC) is a correlation value that measures the managers ability or skill to forecast returns that are realized. Breath (BR) is the number of independent strategies that a manager can add to a portfolio that have low correlations to existing ones.
The implications of the fundamental law of active management are:
•Combine models or approaches that have low correlation with one another•Avoid market timing strategies•There is a high hurdle to reach before tactical asset allocation management makes sense i.e. strategic asset allocation is a preferred approach
1.Grinold (1989). Journal of Portfolio Management
10
Does Stock Picking Make Sense?
www.chelseaglobaladviosrs.com
The financial literature is full of empirical studies that strongly suggest that over time, and inclusive of fees, stock pickers cannot and do not outperform passive index strategies. Whilst Chelsea Global Advisors, LCC generally agrees with this observation, we do believe that certain market conditions are favorable to stock selection strategies. Those conditions include:
•High return dispersion1amongst individual stocks •High equity market volatility•Good market liquidity conditions•Below average valuations e.g. P/E ratios below historical norms•Tepid and stable macro economic environment where the debate about the prospects for future growth and inflation are intense e.g. there are large differences of opinions
1 Dispersion or cross sectional standard deviation of returns: Source: Credit Derivatives Insights 9th ed.2015
11
Market Drift: An Investor’s Best Friend
“The market does not articulate its positive insights while negatives are front and center. We appreciate that it is disconcerting to read the morning newspapers regarding global strife, corruption, inhumanity to man and nature and still have and optimistic outlook.” Birinyi Associates
• Ongoing 32 year bull market in high quality sovereign bonds
• Strong positive drift to equity risk returns during past 130 years
• Total Factor Productivity (the return on technology, capital and labor) continues to improve
• ‘Bubbles’ that leave productive assets in place (e.g.Dot.com bubble of 1997-2000) are very different from buying frenzies of scarcity assets (e.g. Real Estate, Gold or Oil)
It is critical to know the long term distribution of returns in your chosen asset class and avoid chasing returns. www.chelseaglobaladviosrs.com
12
Portfolio Construction
Problem: r Portfolio returnN Normalized Standard Distributionμ Mean return of assetsΣ Covariance matrix of asset returnsSolution: = * Weight assigned to asset i Risk aversion coefficientμ Mean return of asset iΣ-1 Inverse covariance matrixThe challenges to finding an optimal solution include parameter estimation, an unwieldy covariance matrix and the fact that the historical data is backward looking. Also, the solution tends to be unstable, meaning that as the vectors of mean returns and covariances change though time, even slightly, the recommended weights can change drastically.
www.chelseaglobaladviosrs.com
13
Allocation to Risky Assets
Assume a world with only one risky asset, the S&P 500 Index and one risk free security, a T-Bill. Consider the mean observable return of the S&P 500, μ, has been 10% and the standard deviation, or σ is 20%.Further assume that you have a risk aversion coefficient of 1.30, consistent with the average for most Americans.1 How much should you allocate to the risky S&P 500 Index? = * = 38%The ‘optimal’ portfolio would invest 38% of its funds to the S&P 500 and the balance or 62%, to the risk free T-Bill.
www.chelseaglobaladviosrs.com
1.Risk Aversion at the Country Level, Working Paper 2014-005B, Federal Reserve Bank of St. LouisResearch Division. Lower risk aversion coefficients indicate more willingness to face uncertainty and drawdowns in return for the prospect of higher returns. Reducing the risk aversion coefficient from 1.3 to 1.0 would result in a higher allocation to the S&P 500 and a lower allocation to the T-Bill.
14www.chelseaglobaladviosrs.com
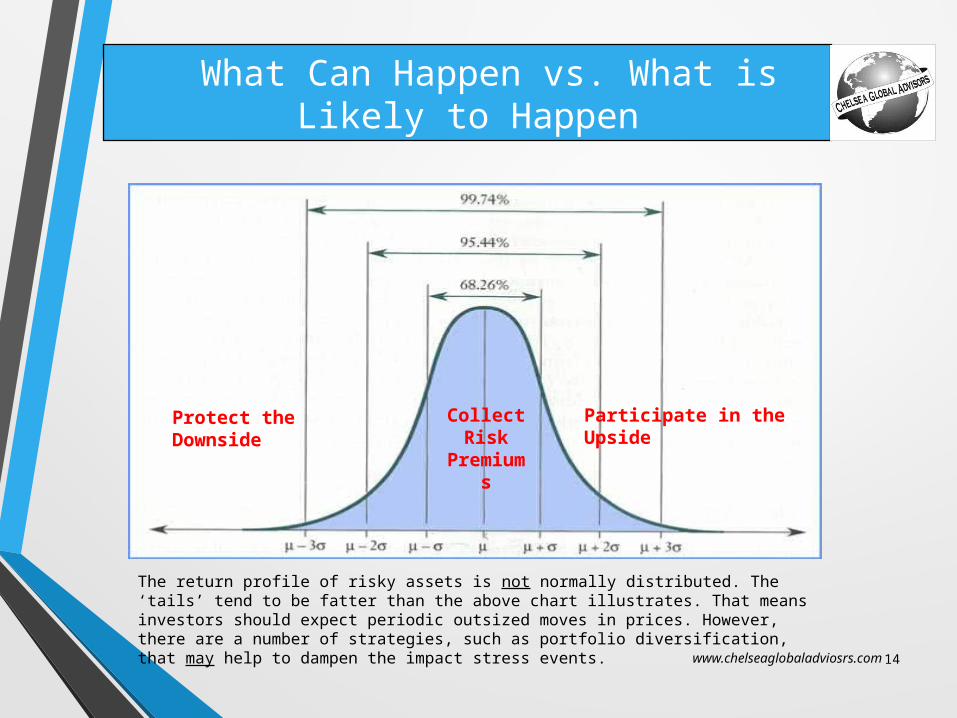
What Can Happen vs. What is Likely to Happen
Participate in the Upside
Protect the Downside
Collect Risk
Premiums
The return profile of risky assets is not normally distributed. The ‘tails’ tend to be fatter than the above chart illustrates. That means investors should expect periodic outsized moves in prices. However, there are a number of strategies, such as portfolio diversification, that may help to dampen the impact stress events.
15
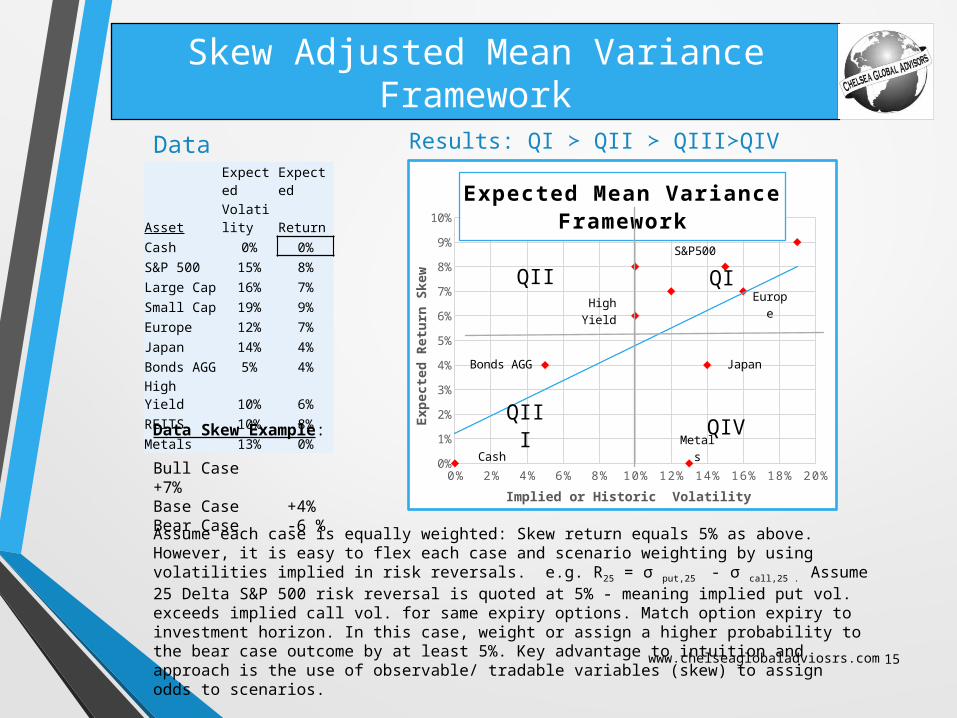
Skew Adjusted Mean Variance Framework
DataExpected
Expected
AssetVolatility Return
Cash 0% 0%
S&P 500 15% 8%
Large Cap 16% 7%
Small Cap 19% 9%
Europe 12% 7%
Japan 14% 4%
Bonds AGG 5% 4%
High Yield 10% 6%
REITS 10% 8%
Metals 13% 0%
Results: QI ≻ QII ≻ QIII≻QIV
0 % 2 % 4 % 6 % 8 % 1 0 % 1 2 % 1 4 % 1 6 % 1 8 % 2 0 %0%
1%
2%
3%
4%
5%
6%
7%
8%
9%
10%
Expected Mean Variance Framework
Implied or Historic Volatility
Expecte
d R
etu
rn S
kew
Metals
S&P500
Cash
Eu-rope
Bonds AGG
QIVQIII
QIQIIHigh Yield
Japan
Data Skew Example: Bull Case +7% Base Case +4%Bear Case -6 %
Assume each case is equally weighted: Skew return equals 5% as above. However, it is easy to flex each case and scenario weighting by using volatilities implied in risk reversals. e.g. R25 = σ put,25 - σ call,25 . Assume 25 Delta S&P 500 risk reversal is quoted at 5% - meaning implied put vol. exceeds implied call vol. for same expiry options. Match option expiry to investment horizon. In this case, weight or assign a higher probability to the bear case outcome by at least 5%. Key advantage to intuition and approach is the use of observable/ tradable variables (skew) to assign odds to scenarios. www.chelseaglobaladviosrs.com
16
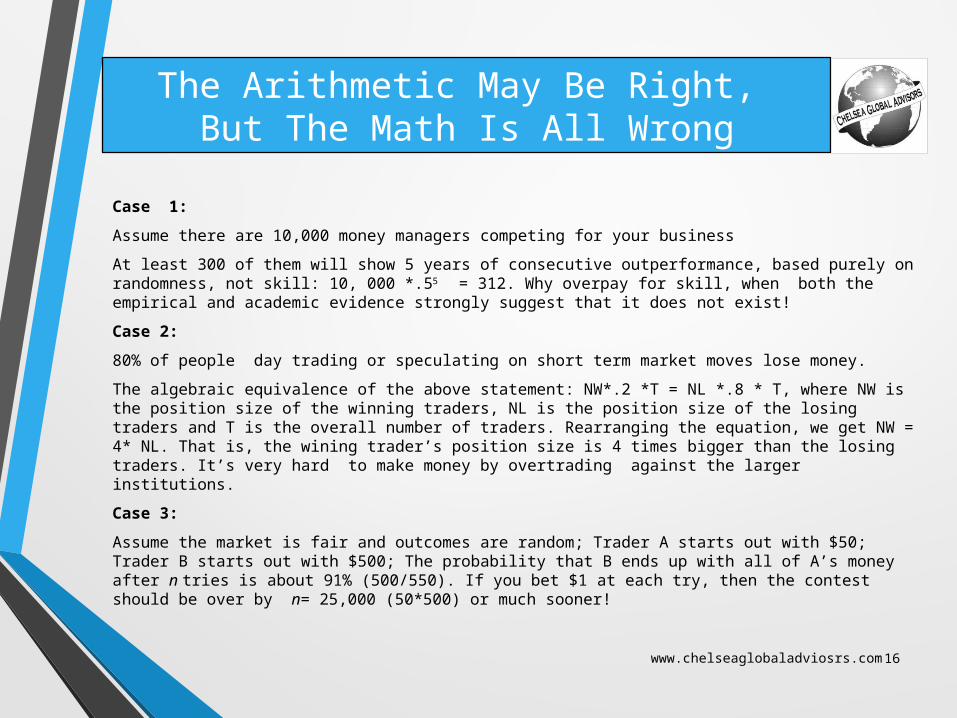
The Arithmetic May Be Right, But The Math Is All Wrong
Case 1:
Assume there are 10,000 money managers competing for your business
At least 300 of them will show 5 years of consecutive outperformance, based purely on randomness, not skill: 10, 000 *.55 = 312. Why overpay for skill, when both the empirical and academic evidence strongly suggest that it does not exist!
Case 2:
80% of people day trading or speculating on short term market moves lose money.
The algebraic equivalence of the above statement: NW*.2 *T = NL *.8 * T, where NW is the position size of the winning traders, NL is the position size of the losing traders and T is the overall number of traders. Rearranging the equation, we get NW = 4* NL. That is, the wining trader’s position size is 4 times bigger than the losing traders. It’s very hard to make money by overtrading against the larger institutions.
Case 3:
Assume the market is fair and outcomes are random; Trader A starts out with $50; Trader B starts out with $500; The probability that B ends up with all of A’s money after n tries is about 91% (500/550). If you bet $1 at each try, then the contest should be over by n= 25,000 (50*500) or much sooner!
www.chelseaglobaladviosrs.com
17
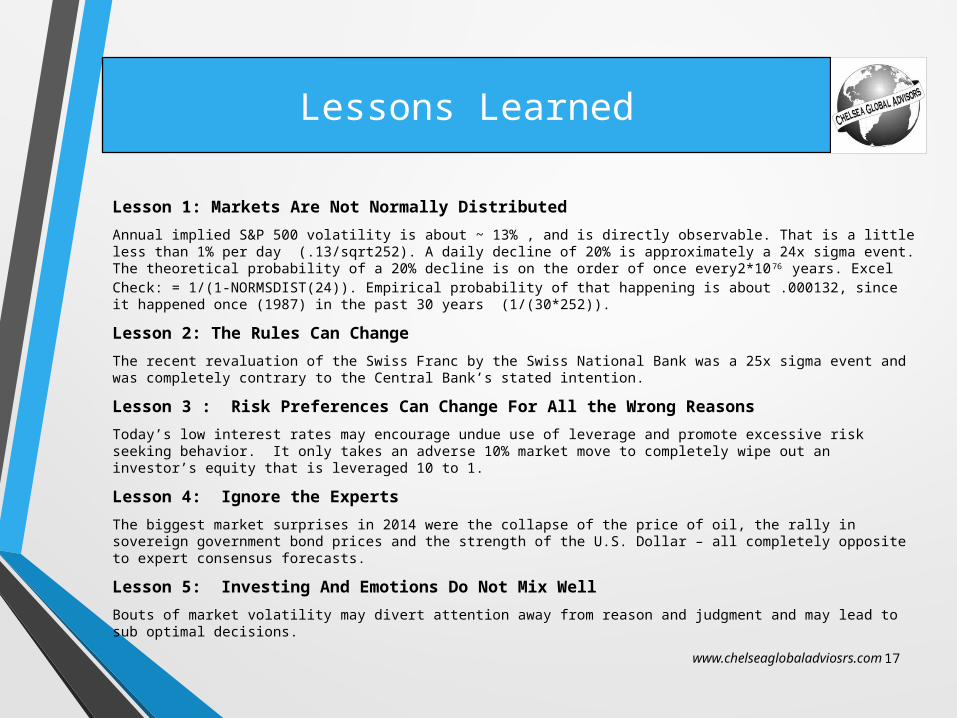
Lessons Learned
Lesson 1: Markets Are Not Normally Distributed
Annual implied S&P 500 volatility is about ~ 13% , and is directly observable. That is a little less than 1% per day (.13/sqrt252). A daily decline of 20% is approximately a 24x sigma event. The theoretical probability of a 20% decline is on the order of once every2*1076
years. Excel Check: = 1/(1-NORMSDIST(24)). Empirical probability of that happening is about .000132, since it happened once (1987) in the past 30 years (1/(30*252)).
Lesson 2: The Rules Can Change
The recent revaluation of the Swiss Franc by the Swiss National Bank was a 25x sigma event and was completely contrary to the Central Bank’s stated intention.
Lesson 3 : Risk Preferences Can Change For All the Wrong Reasons
Today’s low interest rates may encourage undue use of leverage and promote excessive risk seeking behavior. It only takes an adverse 10% market move to completely wipe out an investor’s equity that is leveraged 10 to 1.
Lesson 4: Ignore the Experts
The biggest market surprises in 2014 were the collapse of the price of oil, the rally in sovereign government bond prices and the strength of the U.S. Dollar – all completely opposite to expert consensus forecasts.
Lesson 5: Investing And Emotions Do Not Mix Well
Bouts of market volatility may divert attention away from reason and judgment and may lead to sub optimal decisions.
www.chelseaglobaladviosrs.com

18
Rights and Responsibilities of a CGA Client
• You have the right to professional, courteous and consistent service. • You have the right to work with an experienced and trustworthy Financial Advisor.• You have the right to expect financial recommendations based upon your specific goals,
risk preferences and time horizon.• You have the right to access your account information, including balances, positions and
performance at all times.• You have the right to full and fair disclosure of all investment management fees,
transaction costs and other charges at all times.• You have the right to expect your Financial Advisor to always put your interests first, with
no conflicts. • You have the right to expect your Financial Advisor to address and resolve any client
complaints immediately.• You have the right to full confidentiality and protection of your personal and financial data.• You have the right to have all information presented in clear and understandable terms.• You have the right to open and frequent communication with your Financial Advisor.• You have the right to ask questions. • You have the responsibility to disclose current, and any changes to, your financial
situation including goals, needs and constraints.• You have the responsibility to understand and acknowledge that investing involves risk
and it is possible to lose money on any investment.• You have the responsibility to review account statements, transactions and balances to
ensure your instructions are being followed and to alert CGA of any errors or omissions .• You have the responsibility to seek professional tax and accounting advice where
appropriate. • You have the responsibility to sign and accept the CGA Investment Management
Agreement and to execute a separate agreement between yourself and the executing broker/custodian.
www.chelseaglobaladviosrs.com

19
Contact Us:
On the Web www.chelseaglobaladvisors.com
Email: [email protected]
Phone: (347) 618-1891
(347) 939-9488
Business Address
Chelsea Global Advisors, LLC
42 West 15th Street
New York, NY 10011
Chelsea Global Advisors
www.chelseaglobaladviosrs.com
Related Documents