Preface ii Chapter 1 Introduction 1 Chapter 2 Foundations 5 Chapter 3 Quality Assurance and Quality Control 20 Chapter 4 Reporting Defensible Uncertainty and Obtaining Representative Samples 39 Chapter 5 Chemical Fundamentals: Partitioning, Equilibria, and Acid/ Base Chemistry 47 Chapter 6 Instrumentation 59 Chapter 7 Drugs as Physical Evidence: Seized Drugs and Their Analysis 68 Chapter 8 Forensic Drug Analysis: Selected Drug Classes 77 Chapter 9 Drugs in the Body 84 Chapter 10 Forensic Toxicology 92 Chapter 11 The Chemistry of Combustion and Arson 96 Chapter 12 Explosives 103 Chapter 13 Firearms and Associated Chemistry Evidence 111 Chapter 14 The Chemistry of Colors and Colorants 115 Chapter 15 The Chemistry of Polymers 121 Chapter 16 Forensic Analysis of Inks and Paints 125 Chapter 17 Chemical Analysis of Materials: Paper and Fiber 131

Welcome message from author
This document is posted to help you gain knowledge. Please leave a comment to let me know what you think about it! Share it to your friends and learn new things together.
Transcript
Preface ii Chapter 1 Introduction 1 Chapter 2 Foundations 5 Chapter 3 Quality Assurance and Quality Control 20 Chapter 4 Reporting Defensible Uncertainty and Obtaining
Representative Samples 39 Chapter 5 Chemical Fundamentals: Partitioning, Equilibria, and
Acid/ Base Chemistry 47 Chapter 6 Instrumentation 59 Chapter 7 Drugs as Physical Evidence: Seized Drugs and Their Analysis 68 Chapter 8 Forensic Drug Analysis: Selected Drug Classes 77 Chapter 9 Drugs in the Body 84 Chapter 10 Forensic Toxicology 92 Chapter 11 The Chemistry of Combustion and Arson 96 Chapter 12 Explosives 103 Chapter 13 Firearms and Associated Chemistry Evidence 111 Chapter 14 The Chemistry of Colors and Colorants 115 Chapter 15 The Chemistry of Polymers 121 Chapter 16 Forensic Analysis of Inks and Paints 125 Chapter 17 Chemical Analysis of Materials: Paper and Fiber 131
Solutions Manual for Forensic Chemistry
Copyright © 2013 Pearson Education, Inc. ii
Preface
This solutions guide accompanies the second edition of the text. For the instructor, this manual
should help clarify concepts and principles as applied in the homework. For the student, this
manual should be the last book opened. Why? In my experience, students tend to use the
solutions manual in a less than optimal way. For example, here is the wrong way to use a
solutions manual:
1. Obtain the assigned homework from the instructor.
2. Open the solutions manual and copy the results for each problem, cleverly altering them
so that it does not appear that you in fact used the solutions manual.*
3. Quit.
4. When test time comes around, study the solutions manual and hope to survive.
This is not learning; this is jockeying to do well on a test. Now, here is the correct way to use the
solutions manual:
1. Obtain the assignment, also doing extra problems that are similar to those assigned.
2. Work the problem, making sure to reinforce concepts as you go. For example, if the
problem involves an acid/base extraction, refer back to that section of the text and refresh
your memory.
3. Check and honestly critique your work; focus on “honestly.”
4. Do the next problem.
5. When finished with the assignment and related problems, open the solutions manual.
6. Check your work.
7. Close the solutions manual and put it far away from you.
8. Redo the problems you missed.
9. Return to step 4 and repeat.
10. When test time comes, you are ready.
* FYI, you are kidding yourself if you think this works.
Solutions Manual for Forensic Chemistry
Copyright © 2013 Pearson Education, Inc. iii
Notes:
Frequent mention is made of the following references; they are abbreviated within:
“Clarke’s Handbook” refers to:
Galichet, L. Y., et al., ed. Clarke’s Analysis of Drugs and Poisons, Vol 1. and Vol. 2
London: Pharmaceutical Press, 2004. (Volume 2 contains monograms on the individual
drugs and is referenced most frequently.)
PDR refers to:
Physicians’ Desk Reference, 58th
ed. Montvale, NJ: Thomson PDR, 2004.
Physicians’ Desk Reference for Nonprescription Drugs and Dietary Supplements, 22nd
ed.
Montvale, NJ: Medical Economics—Thomson Healthcare, 2001.
CRC Handbook refers to:
Handbook of Chemistry and Physics, 84th
ed. Boca Raton, FL: CRC Press, 2003–2004.
Merck refers to:
O’Neil, M. J., et al., ed. The Merck Index: An Encyclopedia of Chemicals, Drugs, and
Biologicals. Whitehouse Station, NJ: Merck Research Laboratories—Merck and Co., 2001.
For illustrative purposes and in spreadsheet printouts, extra significant digits may appear in
intermediate calculations. This is to avoid rounding errors and make the process and procedure
used clear.
Errata: The solutions manual was completed after the first printing of the book went to press.
Errors in the questions that were found are noted in the solutions manual and corrections applied;
subsequent printings will have the corrections applied.
Solutions Manual for Forensic Chemistry
Copyright © 2013 Pearson Education, Inc. 1
Introduction CCHHAAPPTTEERR
11
From the chapter
1. Compare and contrast the adversarial system and the scientific method. List the
strengths and weaknesses of both in the context of criminal and civil law.
The scientific method is based on experiment and observation, postulations of relationships,
iterative testing, and drawing conclusions based on the results. The adversarial system is based
on arguments from opposing parties. The scientific method does not by design pit one side
against another. Certainly, there are arguments in science, but the arguments are resolved by
experiment and observation. The process may take decades, but if the data is consistent and
reproducible, conclusions are drawn and consensus is reached. Adversaries argue based on
differing viewpoints, interpretations, and agendas. Science can be used to support or refute
interpretations of events and evidence, but the outcome depends on the strength of the argument
and the skill of those making it.
The adversarial system is well-suited to situations in which social and human (for lack of a better
term) issues are involved. A person may have committed murder, but the reasons and
circumstances are critical to the deliberation. Science, on the other hand, seeks to elucidate
natural laws and to apply them to derive new knowledge. Ideally, there is no social element;
gravity does not take into account mitigating circumstances, for example. This process is
essential for understanding the laws of the universe since consistency and reproducibility are
required to derive them. It is not an ideal system for dealing with human beings.
2. During a Daubert hearing, what entity ultimately decides on admissibility?
The judge, who acts as the gatekeeper.
Solutions Manual for Forensic Chemistry
Copyright © 2013 Pearson Education, Inc. 2
3. What role does peer review play in science and in the law? Compare and contrast.
Argument before a judge, jury, or lawyers is loosely analogous to peer review. The appeals
process could also be placed in the category since professionals of the law review the work done
by other professionals. Peer review is more obvious and central in science where it is an integral
part of the dissemination process. Scientific findings are submitted to peer-reviewed journals
where editors assign qualified reviewers to comment on and judge the work. They may accept it
as is, request more information or work, or recommend that it not be published. Publication in a
peer-reviewed journal is validation of acceptance by those with similar skills, background, and
understanding of the mechanism of science; materials published in non-peer-reviewed journals
or sources generally are not given the same weight or credibility as peer-reviewed data.
4. Describe how a preponderance of inclusive circumstantial evidence can become
conclusive in the eyes of a jury.
The Wayne Williams case is the perfect example of this phenomenon. Had a few dog hairs been
found on victims, such a finding would place under suspicion only those people who owned or
might have come in contact with dogs, a large percentage of the population. It was the unique
combination of hairs and fibers that was compelling. Consider your own home. What types of
hairs and fibers would be found there? How would that compare with a friend’s environment?
You might both have the same blue carpet if you live in the same apartment building or dorm,
but the hairs to be found in your two rooms would be different, as would fibers from clothing
and articles of furniture. Link enough of such observations together and it becomes clear that
your apartment is a much different environment than even one next door.
Integrative
1. A great scientist can still be a terrible forensic scientist; a person who gives wonderful
testimony can be a terrible forensic scientist. Comment on these observations and the
implication for forensic chemistry.
Forensic science and forensic chemistry require understanding and skills in comparison. It is not
always an easy skill to acquire nor is the forensic mindset necessarily a natural one. In addition, a
Solutions Manual for Forensic Chemistry
Copyright © 2013 Pearson Education, Inc. 3
forensic scientist must be able to apply advanced techniques and knowledge to the analysis of
evidence, yet present the results clearly and concisely to an audience without a comparable body
of knowledge or experience. Thus, forensic scientists must be good communicators and good
teachers. A great research scientist might be able to communicate with peers, but may struggle to
distill the complexities of his or her work such that anyone with a high school education could
grasp the concepts. Conversely, a person may be able to concisely and brilliantly present findings
that are completely wrong; the skill of the presentation coupled with the audience’s lack of
background can result in acceptance of incorrect information. A forensic chemist must be the
master of the chemistry and of the forensic aspects—to speak the truth (derived from science) in
the public forum.
2. Can jurors ask questions of expert witnesses? Comment on your findings regarding this
issue.
Except under rare circumstances, they cannot. They also are not usually allowed to take notes;
however, practices are changing in some states. For example, in Arizona, jurors may submit
questions for expert witnesses to the judge, who screens the questions and then will ask those
that are probative and appropriate. In some cases, jurors are also allowed to take notes and to
take these notes into deliberation.
How jurors interact with expert witnesses and how scientific evidence is presented is becoming
an increasingly difficult issue, given the complexity of scientific testimony. Complicating this
issue is the general lack of scientific background in jurors, judges, and lawyers. It is hard to
imagine reforms not occurring as the complexity of testimony continually increases.
Food for thought
1. Is the analysis of drugs using instruments such as mass spectrometers and infrared
spectrometry based on comparison?
Arguably yes. Identifications are made by comparing data to that stored in a library.
Solutions Manual for Forensic Chemistry
Copyright © 2013 Pearson Education, Inc. 4
2. How important is the way in which scientific evidence is presented? Comment on the
relative importance of content versus presentation. Why is learning how to testify such an
important skill?
See Integrative question #1 above. A forensic scientist must be able to communicate findings
concisely and clearly to the court so the trier-of-fact can properly weigh the information. Poorly
communicated evidence can be as damaging as poor scientific practice.
Solutions Manual for Forensic Chemistry
Copyright © 2013 Pearson Education, Inc. 5
Foundations CCHHAAPPTTEERR
22 From the chapter
1. A standard of Pb2+
for a gunshot residue analysis using atomic absorption is prepared by
first dissolving 1.0390 g dried Pb(NO3)2 in distilled water containing 1% nitric acid. The
solution is brought to volume in a class A 500 mL volumetric flask with an uncertainty of
+/- 0.20 mL. This solution is diluted 1/10 by taking 10 mL (via an Eppendorf pipette,
tolerance +/- 1.3 µL) and diluting this in 1% nitric acid to a final volume of 100 mL in a
volumetric flask with a tolerance of +/- 0.08 mL. The balance has an uncertainty of +/-
0.0002 g.
a) Using conventional rounding rules, calculate the concentration of the final solution in
ppm of Pb2+
.
The calculations should be done together and the results rounded at the end. The only exception
to this is with the formula weight for the lead nitrate, which is rounded separately as an
addition/subtraction. Using the periodic table in the textbook:
Formula weight of Pb(NO3)2 = 207.2 + (2 x 14.01) + (2 x 3 x 16.) = 331.22
For this calculation, using this periodic table is a problem since the formula weight will
needlessly limit the number of significant figures. Thus, a periodic table with more reported
digits is needed, even though Pb will remain as is. The new calculation:
Formula weight of Pb(NO3)2 = 207.2 + (2 x 14.00674) + (6 x 15.9994) = 331.2
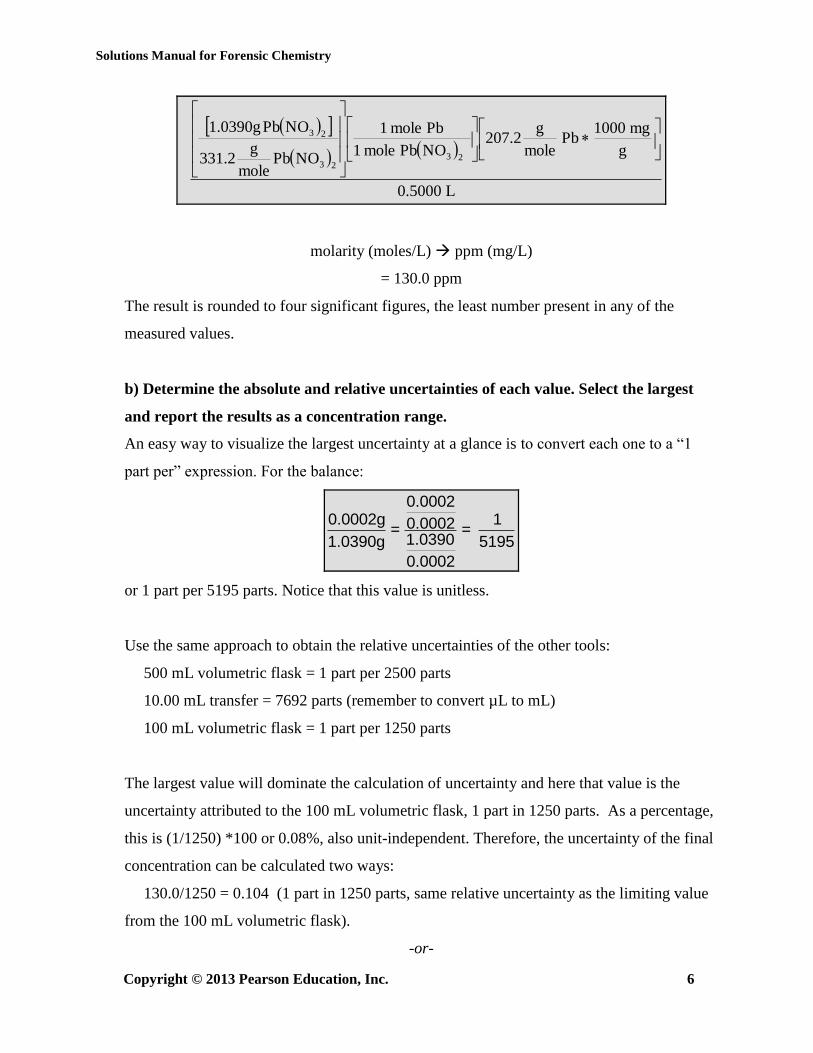
To obtain the concentration in ppm (mg/L), the molarity is calculated and then converted to the
final value. Note that the moles of Pb in the sample are equal to the moles of Pb(NO3)2 since
there is a 1:1 mole ratio of lead in lead nitrate:
Solutions Manual for Forensic Chemistry
Copyright © 2013 Pearson Education, Inc. 6
L0.5000
g
mg1000Pb
mole
g207.2
NOPbmole1
Pbmole1
NOPbmole
g331.2
NOPb1.0390g
2323
23
molarity (moles/L) ppm (mg/L)
= 130.0 ppm
The result is rounded to four significant figures, the least number present in any of the
measured values.
b) Determine the absolute and relative uncertainties of each value. Select the largest
and report the results as a concentration range.
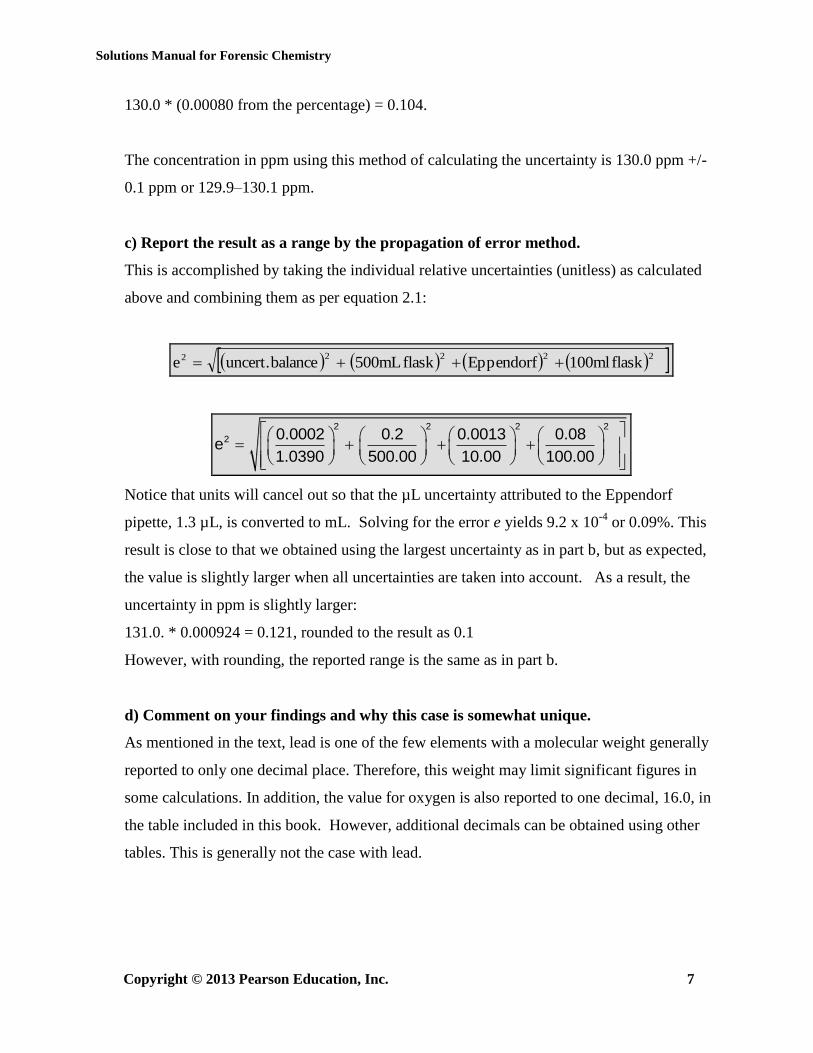
An easy way to visualize the largest uncertainty at a glance is to convert each one to a “1
part per” expression. For the balance:
0.00020.0002g 10.0002= =
1.03901.0390g 5195
0.0002
or 1 part per 5195 parts. Notice that this value is unitless.
Use the same approach to obtain the relative uncertainties of the other tools:
500 mL volumetric flask = 1 part per 2500 parts
10.00 mL transfer = 7692 parts (remember to convert µL to mL)
100 mL volumetric flask = 1 part per 1250 parts
The largest value will dominate the calculation of uncertainty and here that value is the
uncertainty attributed to the 100 mL volumetric flask, 1 part in 1250 parts. As a percentage,
this is (1/1250) *100 or 0.08%, also unit-independent. Therefore, the uncertainty of the final
concentration can be calculated two ways:
130.0/1250 = 0.104 (1 part in 1250 parts, same relative uncertainty as the limiting value
from the 100 mL volumetric flask).
-or-
Solutions Manual for Forensic Chemistry
Copyright © 2013 Pearson Education, Inc. 7
130.0 * (0.00080 from the percentage) = 0.104.
The concentration in ppm using this method of calculating the uncertainty is 130.0 ppm +/-
0.1 ppm or 129.9–130.1 ppm.
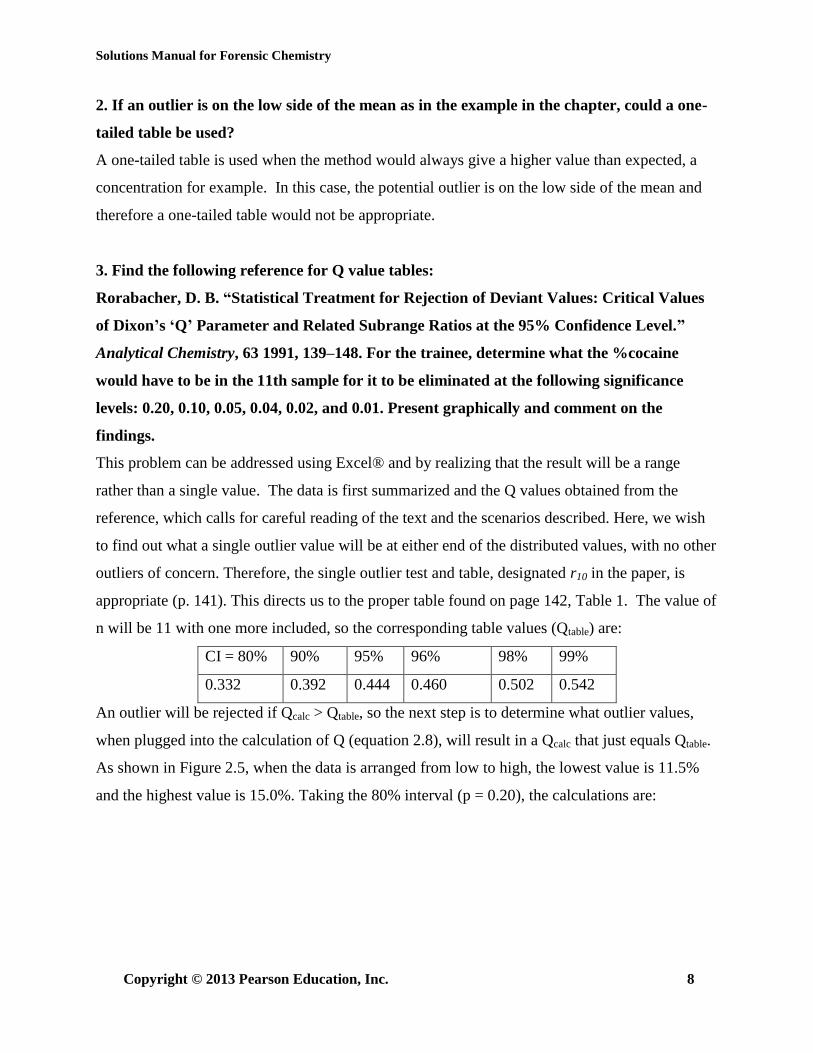
c) Report the result as a range by the propagation of error method.
This is accomplished by taking the individual relative uncertainties (unitless) as calculated
above and combining them as per equation 2.1:
22222 flask100mlEppendorfflask500mLbalanceuncert.e
2 2 2 2
2 0.0002 0.2 0.0013 0.08e
1.0390 500.00 10.00 100.00
Notice that units will cancel out so that the µL uncertainty attributed to the Eppendorf
pipette, 1.3 µL, is converted to mL. Solving for the error e yields 9.2 x 10⁻⁴
or 0.09%. This
result is close to that we obtained using the largest uncertainty as in part b, but as expected,
the value is slightly larger when all uncertainties are taken into account. As a result, the
uncertainty in ppm is slightly larger:
131.0. * 0.000924 = 0.121, rounded to the result as 0.1
However, with rounding, the reported range is the same as in part b.
d) Comment on your findings and why this case is somewhat unique.
As mentioned in the text, lead is one of the few elements with a molecular weight generally
reported to only one decimal place. Therefore, this weight may limit significant figures in
some calculations. In addition, the value for oxygen is also reported to one decimal, 16.0, in
the table included in this book. However, additional decimals can be obtained using other
tables. This is generally not the case with lead.
Solutions Manual for Forensic Chemistry
Copyright © 2013 Pearson Education, Inc. 8
2. If an outlier is on the low side of the mean as in the example in the chapter, could a one-
tailed table be used?
A one-tailed table is used when the method would always give a higher value than expected, a
concentration for example. In this case, the potential outlier is on the low side of the mean and
therefore a one-tailed table would not be appropriate.
3. Find the following reference for Q value tables:
Rorabacher, D. B. “Statistical Treatment for Rejection of Deviant Values: Critical Values
of Dixon’s ‘Q’ Parameter and Related Subrange Ratios at the 95% Confidence Level.”
Analytical Chemistry, 63 1991, 139–148. For the trainee, determine what the %cocaine
would have to be in the 11th sample for it to be eliminated at the following significance
levels: 0.20, 0.10, 0.05, 0.04, 0.02, and 0.01. Present graphically and comment on the
findings.
This problem can be addressed using Excel® and by realizing that the result will be a range
rather than a single value. The data is first summarized and the Q values obtained from the
reference, which calls for careful reading of the text and the scenarios described. Here, we wish
to find out what a single outlier value will be at either end of the distributed values, with no other
outliers of concern. Therefore, the single outlier test and table, designated r10 in the paper, is
appropriate (p. 141). This directs us to the proper table found on page 142, Table 1. The value of
n will be 11 with one more included, so the corresponding table values (Qtable) are:
CI = 80% 90% 95% 96% 98% 99%
0.332 0.392 0.444 0.460 0.502 0.542
An outlier will be rejected if Qcalc > Qtable, so the next step is to determine what outlier values,
when plugged into the calculation of Q (equation 2.8), will result in a Qcalc that just equals Qtable.
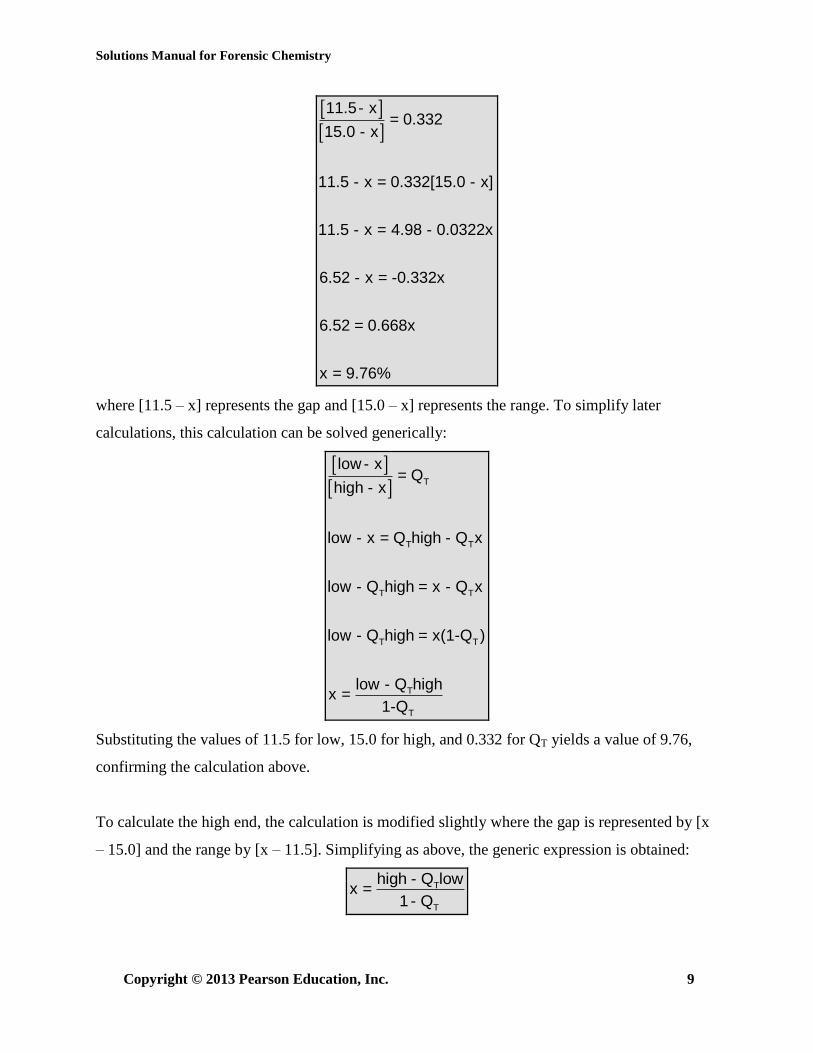
As shown in Figure 2.5, when the data is arranged from low to high, the lowest value is 11.5%
and the highest value is 15.0%. Taking the 80% interval (p = 0.20), the calculations are:
Solutions Manual for Forensic Chemistry
Copyright © 2013 Pearson Education, Inc. 9
11.5- x= 0.332
15.0 - x
11.5 - x = 0.332[15.0 - x]
11.5 - x = 4.98 - 0.0322x
6.52 - x = -0.332x
6.52 = 0.668x
x = 9.76%
where [11.5 – x] represents the gap and [15.0 – x] represents the range. To simplify later
calculations, this calculation can be solved generically:
T
T T
T T
T T
T
T
low - x= Q
high - x
low - x = Q high - Q x
low - Q high = x - Q x
low - Q high = x(1-Q )
low - Q highx =
1-Q
Substituting the values of 11.5 for low, 15.0 for high, and 0.332 for QT yields a value of 9.76,
confirming the calculation above.
To calculate the high end, the calculation is modified slightly where the gap is represented by [x
– 15.0] and the range by [x – 11.5]. Simplifying as above, the generic expression is obtained:
T
T
high - Q lowx =
1- Q
Solutions Manual for Forensic Chemistry
Copyright © 2013 Pearson Education, Inc. 10
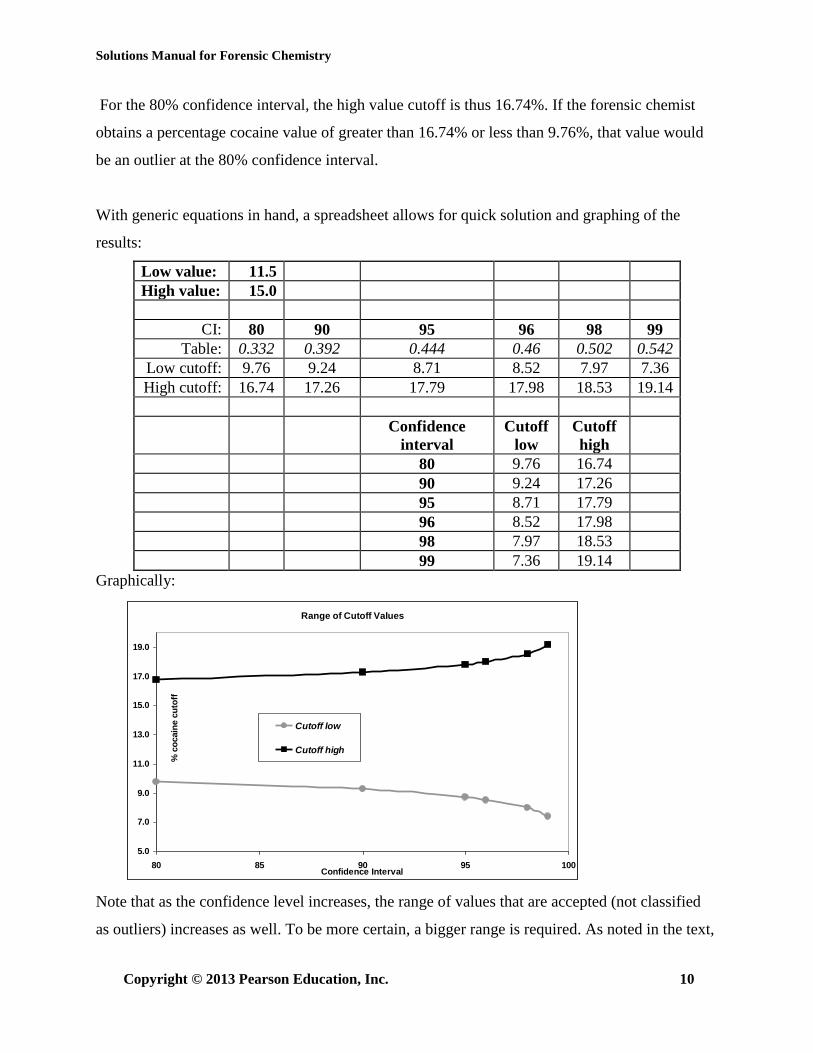
For the 80% confidence interval, the high value cutoff is thus 16.74%. If the forensic chemist
obtains a percentage cocaine value of greater than 16.74% or less than 9.76%, that value would
be an outlier at the 80% confidence interval.
With generic equations in hand, a spreadsheet allows for quick solution and graphing of the
results:
Low value: 11.5
High value: 15.0
CI: 80 90 95 96 98 99
Table: 0.332 0.392 0.444 0.46 0.502 0.542
Low cutoff: 9.76 9.24 8.71 8.52 7.97 7.36
High cutoff: 16.74 17.26 17.79 17.98 18.53 19.14
Confidence
interval
Cutoff
low
Cutoff
high
80 9.76 16.74
90 9.24 17.26
95 8.71 17.79
96 8.52 17.98
98 7.97 18.53
99 7.36 19.14
Graphically:
Range of Cutoff Values
5.0
7.0
9.0
11.0
13.0
15.0
17.0
19.0
80 85 90 95 100Confidence Interval
% c
ocain
e c
uto
ff
Cutoff low
Cutoff high
Note that as the confidence level increases, the range of values that are accepted (not classified
as outliers) increases as well. To be more certain, a bigger range is required. As noted in the text,
Solutions Manual for Forensic Chemistry
Copyright © 2013 Pearson Education, Inc. 11
a larger range does not mean the data is “better”; in fact, the data can be less useful because the
range is too large.
4. Differentiate clearly between statistical and analytical errors.
A statistical error is one that is traceable to normal fluctuations due to random errors, which are
small and equally positive and negative. An analytical error is traceable to, and due only to,
laboratory procedures.
5. Justify/explain the use of the factor 3 in equation 2.13.
The factor 3 represents three standard deviations. The range of +/- 3 standard deviation units
includes 99.7% of all possible outcomes, assuming that the underlying distribution is Gaussian.
Refer to Figure 2.7.
6. In the quote from NAS report (page 13 of the text), what aspects of NUSAP are
specifically addressed?
Sources of uncertainty (S, A, P), and the scale (A assessment).
“…they should identify, as appropriate, the sources of uncertainty in the procedures and
conclusions along with estimates of their scale (to indicate the level of confidence in the
results).”
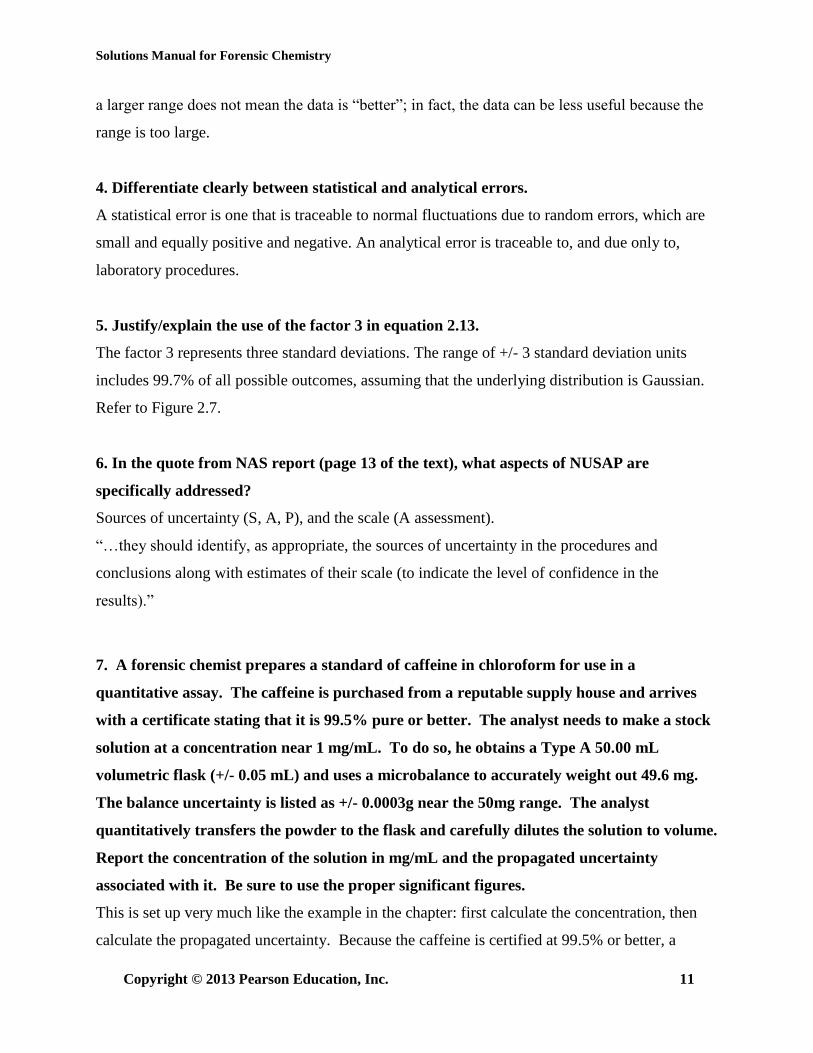
7. A forensic chemist prepares a standard of caffeine in chloroform for use in a
quantitative assay. The caffeine is purchased from a reputable supply house and arrives
with a certificate stating that it is 99.5% pure or better. The analyst needs to make a stock
solution at a concentration near 1 mg/mL. To do so, he obtains a Type A 50.00 mL
volumetric flask (+/- 0.05 mL) and uses a microbalance to accurately weight out 49.6 mg.
The balance uncertainty is listed as +/- 0.0003g near the 50mg range. The analyst
quantitatively transfers the powder to the flask and carefully dilutes the solution to volume.
Report the concentration of the solution in mg/mL and the propagated uncertainty
associated with it. Be sure to use the proper significant figures.
This is set up very much like the example in the chapter: first calculate the concentration, then
calculate the propagated uncertainty. Because the caffeine is certified at 99.5% or better, a
Solutions Manual for Forensic Chemistry
Copyright © 2013 Pearson Education, Inc. 12
correction was not applied and the value as stated is used. Note that significant figures will be
dealt with at the end of the calculation; extras are shown in the intermediate steps as needed for
clarity.
Calculation of the quantity:
49.6mg
caffeine(mg/mL) = = 0.99250.00mL
Propagation of uncertainty:
2 2
-3
t 0 1
0.0003g 0.05mLu = + = 6.13 x10 x 0.992mg/mL = 0.006 mg/mL
0.0496g 50.00mL
Range:
0.992 mg/mL +/- 0.006 mg/mL or 0.986-0.998 mg/mL
8. An analyst proposes a new method for the analysis of blood alcohol. As part of a method
validation study, she analyzes a blind sample 5 times and obtains the following results:
0.055%, 0.054%, 0.055%, 0.052%, and 0.056%.
a) Are there outliers in the data?
We’ll use the Grubbs test since it is recommended by ISO. The questioned point is 0.052 since
when the data points are arranged in order, the gap is largest between it and the nearest point:
0.052
0.054
0.055 (2)
0.056
The mean of this data set is 0.0544 and s is 0.00152:
G = |0.052 – 0.0544| / 0.00152 or 1.58. The Gtable value for 4 degrees of freedom is 2.132 at the
95% CI, so the calculated value is less than the table value and the point is retained. There are no
outliers.
b) Based on the results of the outlier analysis and subsequent actions, calculate the mean
and %RSD of the analyst’s results.
The mean and s are above; the %RSD = 2.8%.
Solutions Manual for Forensic Chemistry
Copyright © 2013 Pearson Education, Inc. 13
c) If the true value of the blind sample is 0.053% +/- 0.002% (based on a range of +/- 2s), is
the mean value obtained by the analyst the same as the true value at p = 0.05?
We are given a mean value for the questioned data and a way to obtain the standard deviation. If
the range is +/-2s and equals 0.002%, then s = 0.001. However, lacking a value of n for the
questioned result, we cannot use equation 2.11. Therefore, there are no tests described in the text
that could be applied. All that can be said given the information presented is that the ranges
overlap.
9. In the scenario presented in Figure 2.5 and discussed in the section 2.5, would it matter
if the data is normally distributed for application of a hypothesis test?
Yes, it could. The tests we have discussed are all based on the normal distribution. If the data is
not normally distributed, the test statistic can become meaningless. If there is doubt about the
normality of a distribution, a hypothesis test can be used.
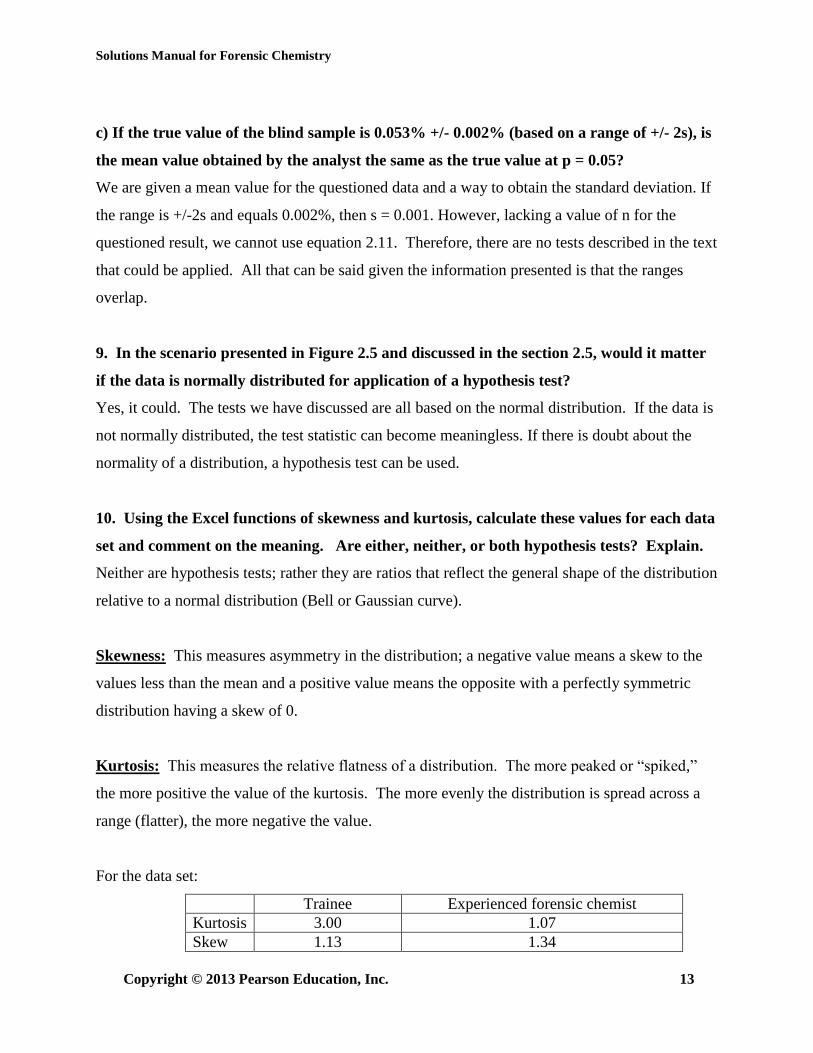
10. Using the Excel functions of skewness and kurtosis, calculate these values for each data
set and comment on the meaning. Are either, neither, or both hypothesis tests? Explain.
Neither are hypothesis tests; rather they are ratios that reflect the general shape of the distribution
relative to a normal distribution (Bell or Gaussian curve).
Skewness: This measures asymmetry in the distribution; a negative value means a skew to the
values less than the mean and a positive value means the opposite with a perfectly symmetric
distribution having a skew of 0.
Kurtosis: This measures the relative flatness of a distribution. The more peaked or “spiked,”
the more positive the value of the kurtosis. The more evenly the distribution is spread across a
range (flatter), the more negative the value.
For the data set:
Trainee Experienced forensic chemist
Kurtosis 3.00 1.07
Skew 1.13 1.34
Solutions Manual for Forensic Chemistry
Copyright © 2013 Pearson Education, Inc. 14
Both are slightly skewed to values greater than the mean and the trainee’s data is more peaked
than that of the forensic chemist. However, without a specific hypothesis test, no further
conclusions can be drawn.
Integrative
1. Locate one or more hypothesis tests that can be used to determine if a distribution is
normal or not. Describe and apply to the two distributions presented in Figure 2.5.
Discuss the results. HINT: There are many resources available for this including use of
the R statistical package, available on-line for free at The R Project for Statistical
Computing, http://www.r-project.org/, last accessed June 2010.
The specific answer here depends on the resources used. The author utilized XLSTAT Version
2010.3.08 (AddIn Software, New York, New York) and R to conduct three tests for normalcy on
the trainee and forensic chemist data (n=10). In all cases, the null hypothesis (H0) is that the
distribution of the data is not significantly different from a normal distribution at the 95% level.
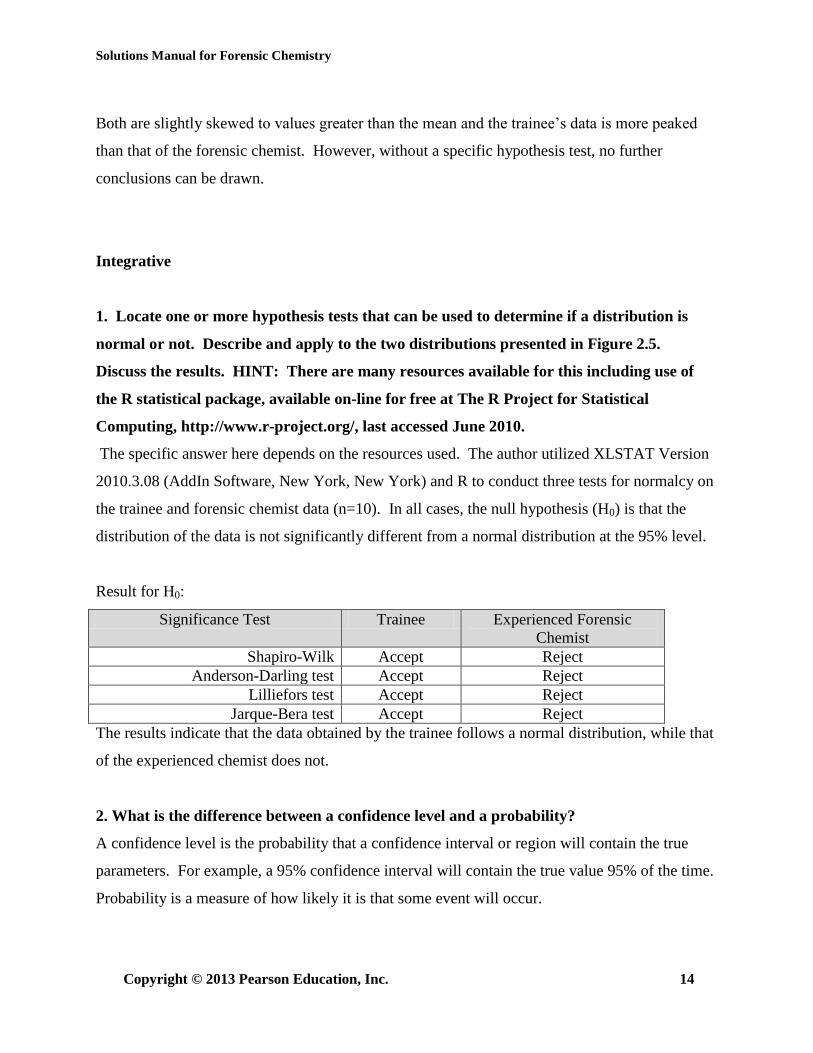
Result for H0:
Significance Test Trainee Experienced Forensic
Chemist
Shapiro-Wilk Accept Reject
Anderson-Darling test Accept Reject
Lilliefors test Accept Reject
Jarque-Bera test Accept Reject
The results indicate that the data obtained by the trainee follows a normal distribution, while that
of the experienced chemist does not.
2. What is the difference between a confidence level and a probability?
A confidence level is the probability that a confidence interval or region will contain the true
parameters. For example, a 95% confidence interval will contain the true value 95% of the time.
Probability is a measure of how likely it is that some event will occur.
Solutions Manual for Forensic Chemistry
Copyright © 2013 Pearson Education, Inc. 15
3. A university instructs its professors to assign grades in the range of 0.0 for an F to 4.0 for
an A+. The letter grade is not recorded, only the number. When students’ GPAs are
calculated, they are reported with three decimal places. Can this be justified by the rules of
significant figures?
No. If the professors only report grades to one decimal place, the results can only be reported to
two decimal places if the last digit is included to prevent rounding error. Three decimal places
cannot be kept by the normal rules of significant figures.
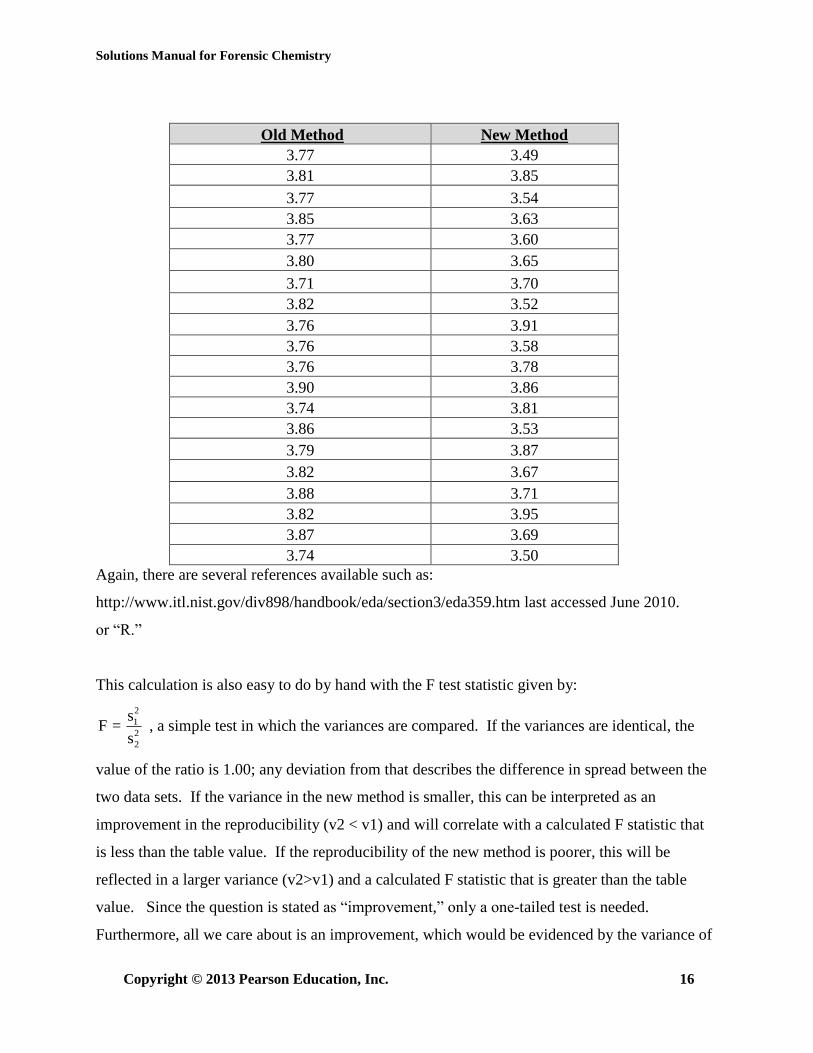
4. A toxicology laboratory associated with a state Medical Examiner’s office purchases a
new type of extraction system with the hope of improving on their current method of
screening for fentanyl in post-mortem blood samples. To validate the change, they run 20
samples using the older extraction method and the same 20 samples using the new method
(results given in µg/L). The question the laboratory director asks is “Is this new method
more reproducible than the old method?” You elect to use a hypothesis test to answer the
question, specifically the F-test. Use on-line or other resources to learn about the F-test
and apply it to the question at hand. Explain why the F test works, what your null
hypothesis is, and if the data supports rejecting or accepting the null hypothesis at the 95%
level (p = 0.05). Is the new method “better” in terms of reproducibility?
Solutions Manual for Forensic Chemistry
Copyright © 2013 Pearson Education, Inc. 16
Old Method New Method
3.77 3.49
3.81 3.85
3.77 3.54
3.85 3.63
3.77 3.60
3.80 3.65
3.71 3.70
3.82 3.52
3.76 3.91
3.76 3.58
3.76 3.78
3.90 3.86
3.74 3.81
3.86 3.53
3.79 3.87
3.82 3.67
3.88 3.71
3.82 3.95
3.87 3.69
3.74 3.50
Again, there are several references available such as:
http://www.itl.nist.gov/div898/handbook/eda/section3/eda359.htm last accessed June 2010.
or “R.”
This calculation is also easy to do by hand with the F test statistic given by:
2
1
2
2
sF =
s , a simple test in which the variances are compared. If the variances are identical, the
value of the ratio is 1.00; any deviation from that describes the difference in spread between the
two data sets. If the variance in the new method is smaller, this can be interpreted as an
improvement in the reproducibility (v2 < v1) and will correlate with a calculated F statistic that
is less than the table value. If the reproducibility of the new method is poorer, this will be
reflected in a larger variance (v2>v1) and a calculated F statistic that is greater than the table
value. Since the question is stated as “improvement,” only a one-tailed test is needed.
Furthermore, all we care about is an improvement, which would be evidenced by the variance of
Solutions Manual for Forensic Chemistry
Copyright © 2013 Pearson Education, Inc. 17
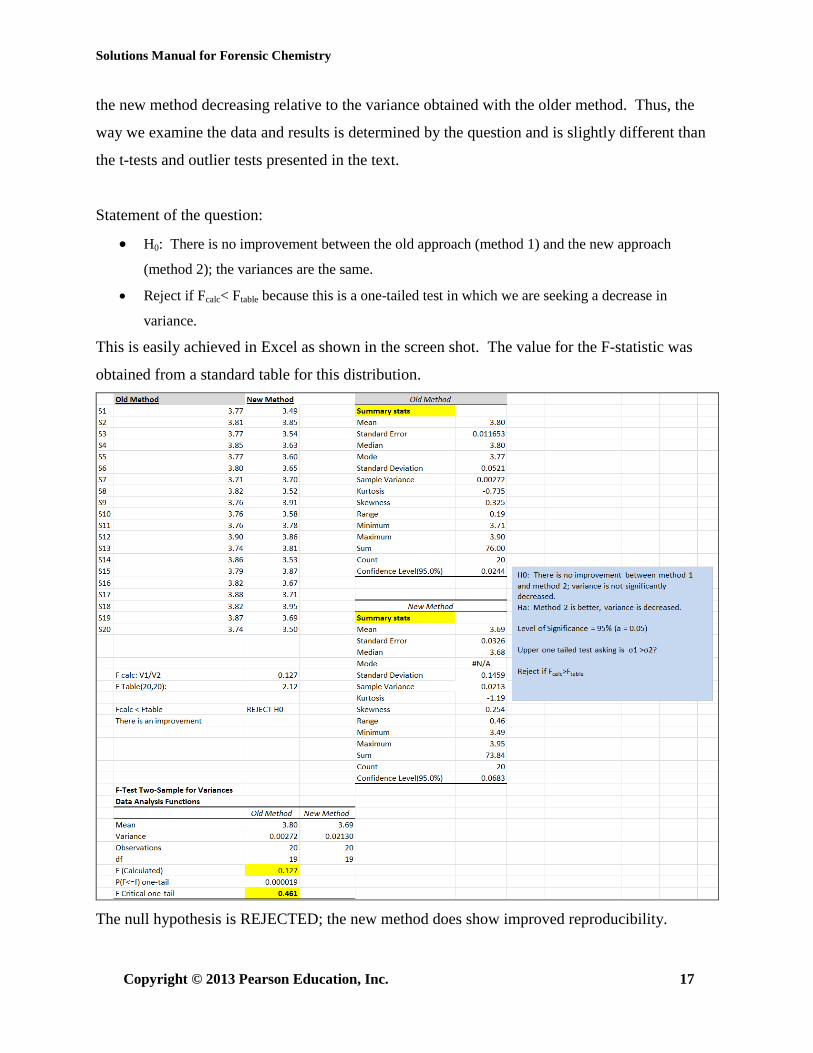
the new method decreasing relative to the variance obtained with the older method. Thus, the
way we examine the data and results is determined by the question and is slightly different than
the t-tests and outlier tests presented in the text.
Statement of the question:
H0: There is no improvement between the old approach (method 1) and the new approach
(method 2); the variances are the same.
Reject if Fcalc< Ftable because this is a one-tailed test in which we are seeking a decrease in
variance.
This is easily achieved in Excel as shown in the screen shot. The value for the F-statistic was
obtained from a standard table for this distribution.
The null hypothesis is REJECTED; the new method does show improved reproducibility.
Solutions Manual for Forensic Chemistry
Copyright © 2013 Pearson Education, Inc. 18
5. Why can there never be such a thing as a true value?
Because there is no way to know what the true value is. The only way to determine a true value
is by measuring it and every measurement introduces some uncertainty. Even preparing a sample
involves measurement (weighing, etc.) and so the true value can never be determined based on
preparation method.
6. A government agency, the National Institute of Standards and Technology, provides
certified reference materials to forensic labs. Research how the NIST certifies a reference
material and comment on how this approach facilitates reliability.
An excellent reference for this appeared in a recent A-page article in the journal Analytical
Chemistry, April 1, 2005, 136A–141A. This article, entitled “Traceability of Single Element
Calibration Solutions” describes the process of certifying elemental standards and how and to
what these materials are traceable. The other reference is NIST itself, which maintains a terrific
website with a wealth of useful information for the forensic scientist and forensic chemist.
Specifically, this website defines the relevant terms as*:
“NIST Certified Value - Value and its uncertainty assigned by NIST in conformance with
the NIST uncertainty policy. A NIST certified value is obtained by one or more of the
following measurement modes:
1. A definitive (or primary) method using specialized instrumentation capable of high
accuracy and precision and whose errors have been thoroughly investigated and
corrected; or,
2. Two or more independent methods at NIST using commercial instrumentation that is
calibration based and with differing sources of systematic errors; or,
3. Interlaboratory data from selected laboratories using multiple methods and NIST
SRMs as controls.
NOTE: The sources of error with this mode will generally result in uncertainties greater
than those for the other two modes.
NIST Noncertified Values - Values that do not meet the criteria for NIST certified values.
Such values may be referred to as NIST reference values or NIST information values.
NOTE: Noncertified values are often upgraded to certified values after additional
measurements are performed and/or improved methodologies are applied.”
Solutions Manual for Forensic Chemistry
Copyright © 2013 Pearson Education, Inc. 19
In other words, a certified value can be determined using a single analytical technique if that
technique is validated and clearly understood. For the single element standards described in the
Analytical Chemistry article, the technique used is high-performance inductively coupled
plasma-optical emission spectroscopy, or HP-ICP-OES, coupled with an internal standard
calibration.
7. What is the difference between a hypothetical question and a hypothesis-based question?
A hypothesis-based question is one that is stated such that a statistical significance test or
hypothesis test can be applied. Examples from this chapter include the comparison of two means
and the determination of outliers. Forensic chemists sometimes face hypothetical questions on
the witness stand. Such questions are not answerable based on direct knowledge of the analyst.
Such questions are often designed such that the analyst must offer a hypothesis to answer a
question, but not in the statistical sense.
8. What court cases (Chapter 1) apply to the concepts of utility and reliability?
Reliability is addressed most directly in Frye (where general acceptance is the main criteria for
reliability) and Daubert, in which judges (the gatekeepers) are given many tools to use for
determining reliability. GE vs. Joiner most directly addresses the question of utility and to what
degree data or information really pertains to a given case.
Related Documents