Short term changes in zooplankton density and community structure in response to different sources of dissolved organic carbon in an unconstrained lowland river: evidence for food web support Simon M. Mitrovic a,b* , Douglas P. Westhorpe a,b , Tsuyoshi Kobayashi c , Darren Baldwin d , David Ryan b and James N. Hitchcock a a University of Technology, Sydney, Centre for Environmental Sustainability, School of Environment, Broadway, NSW, Australia b New South Wales Office of Water, New South Wales, Australia c Office of Environment and Heritage, Department of Premier and Cabinet, NSW, Australia d CSIRO Land and Water and the Murray-Darling Freshwater Research Centre, La Trobe University, Wodonga-Victoria, Australia. * Corresponding author [email protected] Keywords – zooplankton, dissolved organic carbon, glucose, food webs, mesocosms Running Title – Zooplankton responses to dissolved organic carbon amendment 1 1 2 3 4 5 6 7 8 9 10 11 12 13 14 15 16 17 18 19 20 21 22 23

Welcome message from author
This document is posted to help you gain knowledge. Please leave a comment to let me know what you think about it! Share it to your friends and learn new things together.
Transcript

Short term changes in zooplankton density and community structure in response to
different sources of dissolved organic carbon in an unconstrained lowland river:
evidence for food web support
Simon M. Mitrovic a,b*, Douglas P. Westhorpe a,b, Tsuyoshi Kobayashi c, Darren Baldwin d,
David Ryanb and James N. Hitchcock a
a University of Technology, Sydney, Centre for Environmental Sustainability, School of
Environment, Broadway, NSW, Australia
b New South Wales Office of Water, New South Wales, Australia
c Office of Environment and Heritage, Department of Premier and Cabinet, NSW, Australia
d CSIRO Land and Water and the Murray-Darling Freshwater Research Centre, La Trobe
University, Wodonga-Victoria, Australia.
* Corresponding author [email protected]
Keywords – zooplankton, dissolved organic carbon, glucose, food webs, mesocosms
Running Title – Zooplankton responses to dissolved organic carbon amendment
1
1
2
3
4
5
6
7
8
9
10
11
12
13
14
15
16
Abstract
The zooplankton community changes that may occur with increases in concentration of
allochthonous dissolved organic carbon (DOC) are not well understood in unconstrained
lowland rivers. We examined in mesocoms over 8 days the short term responses of river
zooplankton to amendments of DOC from two different sources, glucose and leachates of a
common riparian tree (Eucalyptus camaldulensis; river red gum) both alone and with
inorganic nutrients added. DOC additions with and without nutrients increased heterotrophic
respiration and led to significant increases in bacterial biomass. These responses varied
between glucose and leachate addition. In treatments with added DOC, zooplankton density
significantly increased relative to controls. Some zooplankton genera only responded to the
leachate as a DOC source, and community structures significantly varied between the control
and the glucose and leachate amendments. Zooplankton are particularly important in lowland
river systems as they are key organisms for the transfer of carbon to higher trophic levels and
this study indicates allochthonous DOC has the potential to be an important basal resource to
lowland river food webs. This may be particularly important in lowland sections of
unconstrained flood plain rivers during and immediately following floods when allochthonous
DOC is more available.
Introduction
Dissolved organic carbon (DOC) in aquatic systems derives from two distinct sources;
autochthonous primary production within the system or allochthonous organic carbon
entering the system from watershed sources (Cole et al., 2002). When allochthonous sources
of DOC enter aquatic systems, bacterioplankton production may be de-coupled from its
dependence on autochthonous carbon and can greatly exceed that based solely on
autochthonous DOC production (Jansson et al., 2000) despite a smaller proportion of the
DOC being bioavailable (Wilcox et al., 2005). These external sources of allochthonous DOC
can mobilise new energy and may support the production of consumers such as zooplankton
via a food chain based on bacteria in the receiving waters such as lakes (Carpenter et al.,
2005) and streams (Hall Jr & Meyer, 1998).
The importance of allochthonous DOC in subsidising (sensu Polis et al., 1997) food webs is
becoming clearer in some aquatic ecosystems (e.g. Carpenter et al., 2005). For example it has
been suggested that allochthonous DOC as a basal resource accounts for up to 70% of the
carbon utilised by zooplankton (Cole et al., 2011). Zooplankton are particularly important, as
2
17
18
19
20
21
22
23
24
25
26
27
28
29
30
31
32
33
34
35
36
37
38
39
40
41
42
43
44
45
46
47
48

they are a key organism for the transfer of carbon to higher trophic levels (Humphries et al.,
1999). Microzooplankton such as protozoans, rotifers and juvenile copepods are the major
planktonic consumers throughout the year in freshwater rivers (Kobayashi et al., 1998) and
many are consumers of bacteria, algae or both (Kobayashi et al., 1996). However, the role of
allochthonous sources of DOC in the structuring and/or subsidising of food webs in
unconstrained (floodplain) lowland rivers remains uncertain. In their key synthesis paper,
Thorp and Delong (2002) recognise that substantial loads of carbon can enter the channel in
unconstrained lowland rivers (the flood-pulse concept sensu Junk et al., 1989), but they
contend that most of this carbon is recalcitrant; and the fraction that is relatively bioavailable
is mostly limited to fuelling microbial activity with little or no leakage into the rest of the
metazoan aquatic food-web. They called this model of lowland river function “the revised
riverine productivity model” (Thorp & Delong, 2002). In support of their argument they cite
numerous studies, mostly based on stable isotope analysis, that show that carbon in higher
levels of the food webs in lowland rivers from across the globe is almost entirely derived from
autochthonous sources.
Many rivers of the Murray-Darling Basin become unconstrained floodplain rivers in their
lowland sections with large areas of lateral connectivity to floodplains during flood events.
Although Oliver and Merrick (Oliver & Merrick, 2006) showed that metabolised organic
carbon along a 1000 km reach of the Murray River was predominantly derived from
phytoplankton, that study was undertaken during a period of restricted river-floodplain
interactions. When substantial inundation of the Murray River floodplain did occur after over
a decade of drought, 2000 kms of the river and the lower reaches of its tributaries became
hypoxic (Whitworth et al., 2012); hypoxic conditions persisted for up to 6 months. The
principal driver of hypoxia was microbial metabolism of dissolved organic carbon (DOC)
leached from floodplain sources, mostly litter of the dominant riparian tree, the river red gum,
Eucalyptus camaldulensis (Baldwin, 1999). However, the question of whether or not the
DOC leached into the Murray River during the flood subsidised the riverine food web or
simply remained within the microbial loop was not established.
In order to explore the importance of DOC in subsidising and/or structuring riverine
zooplankton communities we undertook a mesocosm study examining the responses of the
planktonic food web (up to zooplankton) to amended DOC concentration with and without
added inorganic nutrients. We used two sources of DOC – a source more typical of DOC
3
49
50
51
52
53
54
55
56
57
58
59
60
61
62
63
64
65
66
67
68
69
70
71
72
73
74
75
76
77
78
79
80

derived from floodwater (leachate from Eucalyptus camaldulensis) and for comparison, a
highly bioavailable source (glucose) which is commonly used as a carbon source in
mesocoms (e.g. Faithfull et al., 2012, Hitchcock et al., 2010). We hypothesised that DOC
amendment would increase both bacterial production and bacterioplankton biomass activity
and, that increases in the bacterioplankton would affect zooplankton density and community
structure. We also hypothesised that the different sources of DOC would lead to different
zooplankton communities, as different microbial communities may develop for the different
DOC sources with more complex carbon molecules in the leachate amendments.
Methods
Description of the study area and site
The Namoi catchment in the central north of New South Wales (NSW) is a region covering an
approximate area of 43 000 km2 and forms part of the large Murray-Darling Basin Drainage
System located in eastern Australia. The Namoi River feeds into the Barwon-Darling River,
the only major river system of this large, semi-arid region. Flows are mainly regulated by
Keepit Dam (storage capacity of 425 x 106 m3) and Split Rock Dam (storage capacity of 397 x
106 m3) on the Namoi River and from Chaffey Dam (capacity 62 x 106 m3) on the Peel River.
The study was performed at Boggabri along the Namoi River within the mid to lower
landform zones of the Namoi System (Fig. 1). It has an elevation of ~250 m above sea level
and average annual rainfall of 500-600 mm (DLWC, 2000). The dominant riparian tree
species in the lower catchment were native river red gums and exotic weeping willows (Salix
babylonica). Flooding events are generally the result of upper and mid catchment rain events
which are more common during the summer period.
Experimental design
The mesocosm experiment was performed between the 17th and 25th of April 2007 at
Boggabri on the Namoi River, NSW Australia (30o 40’ 05’’ S; 150 o 03’ 21’’ E) after an
extended period of low flows (>3 months). The experiment was performed using twenty 70 L
plastic mescosms (height 1 m, diameter 0.9 m). About 2000 L of experimental river water
was collected at Boggabri (Fig. 1) from a deep pool at a depth of about 0.3 m using a pump
and stored in a large container, and transported to the experimental facility near the river
within 1 hour of collection. The experimental water was added to each 70 L mesocosm by
hose pipe. Mesocosms were rinsed three times with river water prior to filling. The water in
4
81
82
83
84
85
86
87
88
89
90
91
92
93
94
95
96
97
98
99
100
101
102
103
104
105
106
107
108
109
110
111

the tank was continuously mixed gently to ensure the random distributions of plankton
populations. After filling all twenty mesocosms, they were placed in a roofed, semi-sun area
and kept uncovered to ensure free gas exchange from the water surface. The community
structure of plankton in each mesocosm was similar to that in the river.
The mesocosms were filled in the morning of the 17th April (hereafter referred to as Day 0).
Similar to Karlsson et al. (2007) experiments ran over 8 days, with each of the five treatments
performed in quadruplicate and randomly assigned to mesocosms. Due to the warm water
temperature (approximately 20°C) and dominance by rotifers, we deemed this an appropriate
length of time to allow zooplankton to respond, while minimising possible enclosure effects
of longer experiments. Treatments were a control, amendment with glucose, amendment with
glucose and the inorganic nutrients phosphorus and nitrogen (hereafter glucose + nutrients),
amendment with red gum leachate and amendment with red gum leachate and nutrients
(hereafter red gum + nutrients). The ‘+ nutrients’ treatments were included because in lake
manipulation studies Carpenter et al., (2005) found that nutrient enrichment reduced the
importance of allochthonous carbon subsidies to zooplankton and fish.
A 20 g L-1 solution of carbon as glucose was prepared with distilled water using Sigma®
chemicals. A DOC stock solution of red gum leachate was prepared by soaking
approximately 500 g of E. camaldulensis leaves in approximately 1 L of distilled water for 72
hr at less than 5°C in a dark environment, thus minimising microbial utilisation of readily
bioavailable DOC (Hauer & Lamberti, 2011). Leachate solutions were then filtered using a
0.2 µm (polycarbonate membrane) filter to sterilise by removal of bacteria and other particles
(Hauer & Lamberti, 2011). The DOC concentration of these solutions was determined before
experiments to allow appropriate dilution for experiments. Glucose and red gum amendments
were added to increase DOC levels to approximately 20 mg L-1. This falls within the range of
DOC concentrations reported during high flow events within the mid to lower Namoi River
(Westhorpe & Mitrovic, 2013). Nitrogen was added as KNO3 (approximately 0.5 mg L-1) and
phosphorus as KH2PO4 (approximately 0.2 mg L-1).
Measurements of physico-chemical conditions
Dissolved oxygen was measured daily (at approximately 9 am) using a Hydrolab Surveyor
and MS5 sonde probe by placing the sonde 10 cm below the surface of each mesocosm prior
to any homogenisation. Water temperature, conductivity and pH were recorded on each
5
112
113
114
115
116
117
118
119
120
121
122
123
124
125
126
127
128
129
130
131
132
133
134
135
136
137
138
139
140
141
142

occasion. The probe was rinsed with distilled water between readings to avoid any carry over
between mesocosms. After homogenisation through stirring with clean paddles, a single
sample per mesocosm (4 replicates for each treatment and control) was taken for 20cm below
the surface for all variables. Samples were taken for bacterial biomass (5 mL) on days 0, 1, 3,
6 and 8. Grab samples for chlorophyll a (200 mL), DOC (100 mL) and nutrients (20 mL)
were taken on days 0, 3, 6 and 8. DOC samples were pre-filtered in the field (0.45 µm
Sartorius Minisart filters - cellulose acetate membrane; Sartorius Stedim Biotech, Goettingen,
Germany) attached to disposable plastic syringes, acidified with hydrochloric acid and
refrigerated at 4oC. Samples were analysed in the laboratory by the High Temperature
Combustion Method (APHA, 1998). Nutrient samples were taken after filtration through 0.45
µm pore size syringe filters in pre-washed and sample rinsed PET bottles. Samples were
analysed for filterable reactive phosphorus (FRP) and oxidised nitrogen (NOx-N). The FRP
sub-samples were analysed using the ascorbic acid method and the NOx-N sub-samples were
analysed using an automated cadmium reduction method (APHA, 1998). Samples for
chlorophyll a determination were chilled in the dark until return to the laboratory within 5
hours. Samples were then filtered onto GF/C filters then frozen until subsequent
determination by Standard Methods (APHA, 1998) using the grinding technique and acetone
as a solute with correction for phaeophytin
Sampling and enumeration of bacterioplankton
Bacterioplankton samples (5 mL) were collected in sterile centrifuge tubes and fixed with 0.4
mL of concentrated 0.2 µm filtered formalin (37% Formaldehyde) and stored at 4 oC. In the
laboratory, subsamples (2 mL) were stained with DAPI (4’6-diamindion-2-phenylindole) at a
final concentration of 1 mg mL-1 for 15 minutes and filtered through a polycarbonate black
0.2 µm pore-sized filter (Porter & Feig, 1980). Polycarbonate filters were mounted on to
microscope slides and non-fluorescence immersion oil used. Slides were examined at ×100
using a fluorescence-equipped Olympus BX41 compound microscope. For each slide, ten
pictures of random views (≥ 500 total cells) were captured using an Olympus DP72 camera
and CellSens Standard software (version 1.3). Images were analysed for cell abundance and
volume using CellC software (Selinummi et al., 2005). Bacterial biomass was calculated
using a conversion factor of 0.28 pg C µm-3 (Simon & Azam, 1989).
Sampling, enumeration and identification of zooplankton
6
143
144
145
146
147
148
149
150
151
152
153
154
155
156
157
158
159
160
161
162
163
164
165
166
167
168
169
170
171
172
173

Samples for zooplankton identification and enumeration were taken with a Haney-type trap
(4.2 L) (Gawler & Chapuis, 1987) on days 0, 5 and 8. Samples were collected from each
mesocosm on each day, except for day 0 where 4 random mesocosms were sampled to
determine the initial zooplankton community structure. Zooplankton were retrieved by
filtering through a 35 µm mesh nylon netting (Likens & Gilbert, 1970) glued to the bottom of
a Perspex cylinder and preserved with a 70% v/v ethanol solution. A 1 mL Eppendorf
automatic pipette and a Sedgewick-Rafter counting chamber were used for sub-sampling and
counting of zooplankton. The disposable tip of the pipette was cut to make a 4 mm diameter
opening so that large crustacean zooplankton would not be under-subsampled (Edmondson &
Vinberg, 1971). Each sample bottle was stirred thoroughly in order to ensure the random
distribution of the specimens within the sample bottle. A 1 mL sub-sample was taken with
the automatic pipette and placed in the counting chamber and the zooplankton counted under
a Leica DM2500 compound microscope at a magnification of x50. Preliminary counting of
five replicate samples established that the coefficient of variation was reduced to ~10% when
the mean number of specimens counted exceeded 100. Therefore, subsampling and counting
were repeated until a minimum of 100 specimens of the most abundant taxon were counted.
Zooplankton, except copepods were identified to the genus level using the taxonomic keys
and descriptions of Shiel (1995) and Kobayashi et al., (2009). Copepods were identified as
either nauplii or cyclopoid copepodites (cyclopoids hereafter) as calanoid, harpacticoida and
adult stage copepods were mostly absent from this study. Ciliates were grouped together
except for the genus Vorticella which was quantified separately.
Data Analysis
Repeated measures analysis of variance (ANOVA), with treatments and time as factors, were
used to assess the dissolved oxygen, bacteria, chlorophyll a and DOC data. Before analysis
data were transformed to reduce skewness and to homogenise variances. The data were
analysed in Statistica Version 7 (2004) and Graph Pad Prism. When the ANOVA main test
provided significant results, specific pair-wise differences were located using the Bonferroni
post-hoc test (Zar, 1984).
Non-parametric permutational multivariate analysis of variance (PERMANOVA) (Anderson,
2001a, Anderson, 2001b) was used to assess zooplankton community responses. The
PERMANOVA main test examined the differences between treatments and days. Specific
contrasts were also examined between the following groupings: control/amended; glucose/red
7
174
175
176
177
178
179
180
181
182
183
184
185
186
187
188
189
190
191
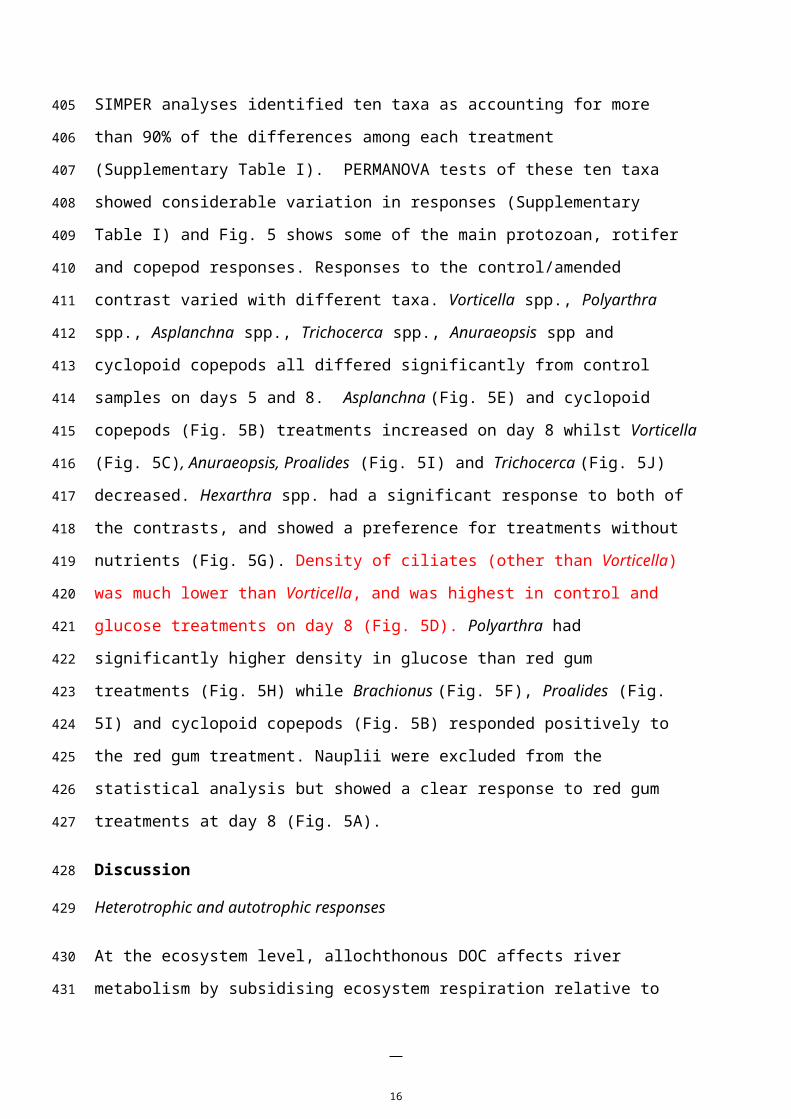
192
193
194
195
196
197
198
199
200
201
202
203
204
205

gum; and nutrients/no nutrients. PERMANOVA provides a distinct advantage when testing
multiple contrasts because frequency distributions are freshly generated for each contrast.
This avoids the problem of accumulated type I errors that are commonly encountered with
parametric post-hoc tests. The PERMANOVA test was treated as an orthogonal design with
days 5 and 8 as time factors. The a priori decision was made that if a significant interaction
was found between treatments and time, then contrasts would be examined separately for days
5 and 8. If the interaction term was not significant, then contrasts were examined across the
pooled days.
Multivariate PERMANOVA tests were performed on the zooplankton community data and
were followed by similarity percentages (SIMPER) analyses to establish which individual
taxa were most influential in driving the differences among factors. Univariate
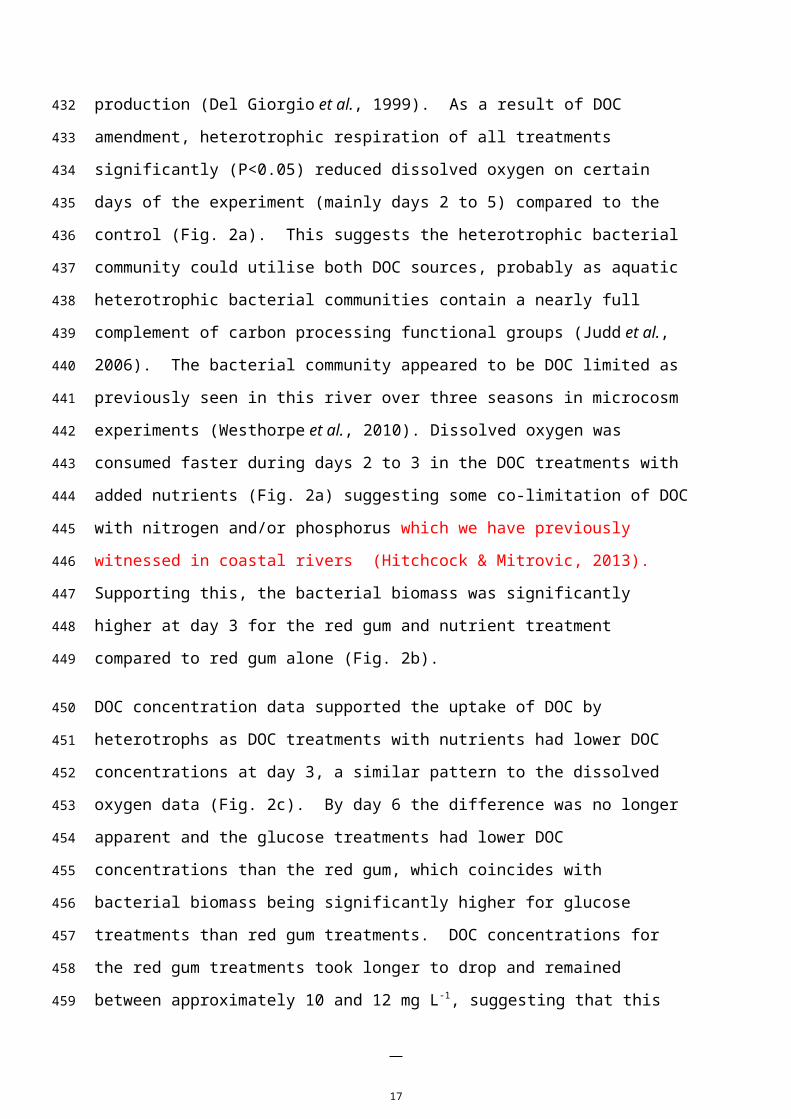
PERMANOVA tests were performed using the same test design that was applied to the
zooplankton community, on total zooplankton density and each individual taxon that had been
identified as influential by the SIMPER analyses. Nauplii were included in the total
zooplankton counts, but excluded from the community analyses because it was possible that
calanoid and cyclopoids were included, in unknown numbers, in the nauplii counts. Non-
metric multidimensional scaling (nMDS) was used to visually represent the trajectory of
change in zooplankton communities across all treatment and time factors. All zooplankton
densities were log10(x+1) transformed prior to analysis. The data were analysed in PRIMER
V6.1.13 and PERMANOVA+ V1.0.3.
Results
Physico-chemical, bacteria and chlorophyll a changes
Water temperatures over the course of the experiment ranged from 18 to 22.5°C with a mean
temperature of 20.2°C with no significant differences between treatments (P>0.05).
Dissolved oxygen differed significantly (P<0.001) among treatments and with time (Table I
and II; Fig. 2a). By day 2, dissolved oxygen levels in DOC treatments with nutrients had
dropped significantly (P<0.05) below the control and remained significantly different until
day 6. The glucose + nutrients and red gum + nutrients treatments had lower dissolved
oxygen levels on these days than the glucose alone and red gum alone treatments. Glucose
alone was significantly lower than the control on days 4 to 6 while the red gum alone
treatment was lower on days 3 and 5 (P<0.05).
8
206
207
208
209
210
211
212
213
214
215
216
217
218
219
220
221
222
223
224
225
226
227
228
229
230
231
232
233
234
235
236

Bacterial biomass as pg C mL-1 differed significantly among treatments (P<0.01) and with
time (P<0.001) (Table I and 2; Fig. 2b). When DOC was added as glucose, with or without
nutrients, bacterial biomass peaked at day 6 and was significantly higher than the control
(P<0.001). At day 8 both glucose treatments decreased in bacterial biomass and only the
glucose alone had a significantly higher biomass than the control (P<0.001). The treatment
with DOC added as red gum showed increasing bacterial biomass across the experiment and
was significantly higher than the control (P<0.05) at days 3, 6 and 8. The red gum + nutrients
treatment peaked at day 3 and was significantly higher than the control (P<0.001), before
declining in biomass at days 6 and 8.
DOC concentrations during the experiment are shown in Fig. 2c. The amendments with
glucose and the red gum leachate at the start of the experiment (day 0) increased all levels up
to approximately 20 mg L-1. The ambient DOC level in the control was 4.7 ±0.04 mg L-1 and
this did not vary greatly over the experiment. At day 3, DOC utilisation showed similar
patterns to the dissolved oxygen results, with the treatments amended with nutrients
consuming DOC at a significantly (P<0.001) greater rate than those without (Table I and II).
By days 6 and 8, the glucose amendments had significantly lower DOC concentrations than
the red gum treatments (P<0.001) although they remained higher than the control. The red
gum + nutrients treatment had significantly lower DOC concentrations than red gum alone
(P<0.001).
Chlorophyll a concentrations decreased in all treatments across the 8 days (Fig. 2d). Results
differed significantly with treatment and time (Table I and II). The glucose treatment had
significantly lower chlorophyll a concentrations than the control at day 6 (P<0.01). The
glucose + nutrients treatment demonstrated no significantly different concentrations to the
control. When DOC was added as red gum leachate, chlorophyll a concentrations were
significantly lower than the control at days 6 and 8 (P<0.01) and with nutrients at days 3, 6
and 8 (P<0.05).
Zooplankton responses
A total of 19 taxonomic groups of zooplankton were identified. Total zooplankton density
increased in all treatments from day 0 to day 5, with the largest increase occurring in the
glucose, red gum and red gum + nutrients treatments (Fig. 3). Densities across all treatments
declined in roughly the same proportions between days 5 and 8 with the glucose + nutrients
9
237
238
239
240
241
242
243
244
245
246
247
248
249
250
251
252
253
254
255
256
257
258
259
260
261
262
263
264
265
266
267

amendment still lower than the other amendments. PERMANOVA tests identified strongly
significant differences among treatments and days (Supplementary Table I; p<0.005 in both
tests), but there was no significant interaction between the two. The control/amended and
glucose/red gum contrasts were strongly significant (p<0.005 in both tests), but no significant
difference was found in the nutrient/no nutrient contrast (p = 0.27).
Multivariate PERMANOVA tests of zooplankton community structure identified strong
significant differences among treatments and days, and a significant interaction between both
factors (Supplementary Table I; p<0.005 in all three tests). Subsequently the three contrasts
were tested separately across days 5 and 8 (Supplementary Table I). Fig. 4 shows clearly that
the trajectories of the zooplankton communities for glucose, red gum as well as red gum +
nutrients were very similar at day 5. By day 8, the two red gum treatments continued to
respond similarly, whilst the two glucose treatments were less similar at day 8. The control
samples were consistently the most distinct of the treatments.
SIMPER analyses identified ten taxa as accounting for more than 90% of the differences
among each treatment (Supplementary Table I). PERMANOVA tests of these ten taxa
showed considerable variation in responses (Supplementary Table I) and Fig. 5 shows some
of the main protozoan, rotifer and copepod responses. Responses to the control/amended
contrast varied with different taxa. Vorticella spp., Polyarthra spp., Asplanchna spp.,
Trichocerca spp., Anuraeopsis spp and cyclopoid copepods all differed significantly from
control samples on days 5 and 8. Asplanchna (Fig. 5E) and cyclopoid copepods (Fig. 5B)
treatments increased on day 8 whilst Vorticella (Fig. 5C), Anuraeopsis, Proalides (Fig. 5I)
and Trichocerca (Fig. 5J) decreased. Hexarthra spp. had a significant response to both of the
contrasts, and showed a preference for treatments without nutrients (Fig. 5G). Density of
ciliates (other than Vorticella) was much lower than Vorticella, and was highest in control and
glucose treatments on day 8 (Fig. 5D). Polyarthra had significantly higher density in glucose
than red gum treatments (Fig. 5H) while Brachionus (Fig. 5F), Proalides (Fig. 5I) and
cyclopoid copepods (Fig. 5B) responded positively to the red gum treatment. Nauplii were
excluded from the statistical analysis but showed a clear response to red gum treatments at
day 8 (Fig. 5A).
Discussion
Heterotrophic and autotrophic responses
10
268
269
270
271
272
273
274
275
276
277
278
279
280
281
282
283
284
285
286
287
288
289
290
291
292
293
294
295
296
297
298

At the ecosystem level, allochthonous DOC affects river metabolism by subsidising
ecosystem respiration relative to production (Del Giorgio et al., 1999). As a result of DOC
amendment, heterotrophic respiration of all treatments significantly (P<0.05) reduced
dissolved oxygen on certain days of the experiment (mainly days 2 to 5) compared to the
control (Fig. 2a). This suggests the heterotrophic bacterial community could utilise both
DOC sources, probably as aquatic heterotrophic bacterial communities contain a nearly full
complement of carbon processing functional groups (Judd et al., 2006). The bacterial
community appeared to be DOC limited as previously seen in this river over three seasons in
microcosm experiments (Westhorpe et al., 2010). Dissolved oxygen was consumed faster
during days 2 to 3 in the DOC treatments with added nutrients (Fig. 2a) suggesting some co-
limitation of DOC with nitrogen and/or phosphorus which we have previously witnessed in
coastal rivers (Hitchcock & Mitrovic, 2013). Supporting this, the bacterial biomass was
significantly higher at day 3 for the red gum and nutrient treatment compared to red gum
alone (Fig. 2b).
DOC concentration data supported the uptake of DOC by heterotrophs as DOC treatments
with nutrients had lower DOC concentrations at day 3, a similar pattern to the dissolved
oxygen data (Fig. 2c). By day 6 the difference was no longer apparent and the glucose
treatments had lower DOC concentrations than the red gum, which coincides with bacterial
biomass being significantly higher for glucose treatments than red gum treatments. DOC
concentrations for the red gum treatments took longer to drop and remained between
approximately 10 and 12 mg L-1, suggesting that this source of carbon took longer to be
utilised by bacteria. This may be as glucose is low molecular weight and considered highly
labile (Berggren et al., 2010) whilst naturally occurring DOC is a diverse mix of different
compounds of differing molecular weights and labilities (Baldwin, 1999).
Chlorophyll a declined in the control and all treatments with time (Fig. 2d). The causes of the
chlorophyll a decline relative to the control are not understood, however it may have been
influenced by bacteria being able to out-compete phytoplankton for available nutrients when
DOC was added (and no longer limiting), due to a higher surface area to volume ratio of
bacteria (Blomqvist et al., 2001). Drakare et al., (2002) found that high flows carrying DOC
into a lake led to low primary production despite good conditions for phytoplankton growth.
In their study, primary production did not exceed bacterial production for approximately 20
days after a high flow episode had replenished DOC concentrations. Chlorophyll a may have
11
299
300
301
302
303
304
305
306
307
308
309
310
311
312
313
314
315
316
317
318
319
320
321
322
323
324
325
326
327
328
329
330

also been reduced by grazing effects as the zooplankton communities changed with time and
also treatment and there may also have been some direct inhibition of phytoplankton by the
leachate. Chlorophyll a decline in the control replicates may have been due to reduced light
availability in the mesocosms as they were partly shaded. Although light penetration was not
changed in these experiments with addition of leachates, it should be considered that it could
be substantially reduced with increased flows, rendering the phytoplankton more susceptible
to light limitation (Jassby et al., 1993). In the Namoi River increases in turbidity greater than
500 NTU can occur with high flow events (Westhorpe et al., 2008). This could further
augment heterotrophic bacteria compared to phytoplankton as relatively more nutrients
become available to the heterotrophic bacteria.
Zooplankton responses to DOC source
Treatments with amendments of all DOC sources increased in density of total zooplankton
compared to the control (Fig. 3). This was most pronounced for the red gum, red gum +
nutrients and the glucose treatment. For protozoan taxa such as Vorticella, DOC amendment
was associated with large increases in density relative to the control but was independent of
the added DOC source (Fig. 5C). The increase in Vorticella is likely mediated through the
large increase of bacterial biomass in DOC treatments which are its primary food source
(Sanders et al., 1989). Due to their short generation times, ciliates are known to respond fast
to increases in food resources (Sommer et al., 1986). Other ciliates (excluding Vorticella)
however remained in much lower abundance (Fig. 5D) which may be due to grazing from
higher trophic organisms or competition with Vorticella or other organisms for resources.
Protozoans have been shown to be a preferred food source for many metazoan zooplankton
(Gifford & Dagg, 1988) and Vorticella has been shown to be an important prey species to
zooplankton (Packard, 2001). In this experiment Vorticella may have played a role in
supporting rotifer species, however they did not appear important for copepods as whilst
Vorticella was high in abundance in all treatments (Fig. 5C), cyclopoids and nauplii only had
a high abundance in red gum treatments (Fig. 5A,B).
Rotifers are known to have some of the fastest growth rates of the metazooplankton and can
peak in density shortly after ciliates (Sommer et al., 1986). In our study, several rotifers
responded rapidly to the different DOC amendments compared to the control such as
Asplanchna, Proalides and Brachionus, with growth rates of between 0.23 and 0.47 d-1, which
was probably influenced by the high water temperature of ~20°C. Similar and greater growth
12
331
332
333
334
335
336
337
338
339
340
341
342
343
344
345
346
347
348
349
350
351
352
353
354
355
356
357
358
359
360
361
362

rates have been seen in other food source experiments such as 0.8 d-1 (Rothhaupt, 1990) and
0.7 d-1 (Jensen et al., 2006) for Brachionus spp. suggesting food availability and quality was
greatly improved with the addition of DOC. Rotifers may have a wide diet which varies
between taxa and can feed on both autotrophic and heterotrophic organisms (Arndt, 1993,
Gilbert & Jack, 1993). Of the species observed in our experiment bacterivory has been
observed amongst Hexarthra, Proalides, Anuraeopsis, Keratella (Arndt, 1993 and references
therein) potentially creating a short and efficient food web. Other species such as Asplanchna,
Brachionus, Polyarthra and Proalides have been shown to feed on other components of the
microbial loop such flagellates and ciliates, and the larger species such as Asplanchna and
Trichocerca may consume other rotifers (Arndt, 1993 and references therein). These
differences in feeding strategies may explain the different response times between rotifer
genera such as Keratella density peaking early at day 5 (Fig. 5K) and Asplanchna density
peaking later at day 8 (Fig. 5E).
There were also differences in the rotifer response between the glucose and red gum carbon
additions (Supplementary Table 1). Polyarthra responded more to the glucose (Fig. 5H)
whilst Brachionus (Fig. 5F) and Proaliades (Fig. 5I) mainly responded to red gum leachate.
These results are possibly due to the different carbon sources favouring different components
of either the bacterial and/or flagellate community, leading to resources that favoured
Polyarthra in the glucose treatments, and Brachionus and Proaliades in the red gum
treatments. The smaller heterotrophic flagellates and ciliates were not sampled in this study
but may have been important and their inclusion should be considered in future studies.
The different carbon sources also led to significantly different cyclopoid copepod responses.
Though the initial experimental conditions did not appear to favour cyclopoid survival, by day
8 of the experiment nauplii and copepodite densities were significantly higher in the red gum
treatments, compared to the control and glucose treatments (Fig. 5A,B). These changes are
most likely related to differences in the availability and quality of resources. Cyclopoids are
generally considered omnivores, though food preference will vary between species (Adrian &
Frost, 1993). As there was little difference in chlorophyll a between treatments in this
experiment (Fig. 2D) the increased densities are likely due to difference among heterotrophic
organisms. The main differences that we measured of potential prey items of cyclopoids that
could explain these results are the higher densities of Brachionus and Proalides. Brachionus
in particular is considered a good food source and is a common prey of cyclopoid copepods
13
363
364
365
366
367
368
369
370
371
372
373
374
375
376
377
378
379
380
381
382
383
384
385
386
387
388
389
390
391
392
393
394

(Kumar & Rao, 2001) and is regularly used in copepod growth cultures (Lubzens et al.,
1985). It’s possible therefore that the increased Brachionus density, supported by favourable
small flagellate or ciliate resources, led to increased cyclopoid density in the red gum
treatments.
Gulati and DeMotts (1997) review on the role of food quality for zooplankton highlighted the
importance of polyunsaturated fatty acids as a main factor affecting growth and reproduction.
As bacteria cannot produce long chained polyunsaturated fatty acids, intermediate organisms
are needed for their synthesis (Breteler et al., 1999). Lubzens et al. (1985) showed in
laboratory cultures that Brachionus plicatilis was cable of synthesising such acids, adding
further evidence that Brachionus spp. may have been important to cyclopoid development in
this experiment. Possible differences in the densities of small flagellates and ciliates that were
not measured here may also be responsible for these differences as they are an important food
source for some copepod species (Broglio et al., 2003, Nakamura & Turner, 1997) and some
have been shown to provide essential fatty acids to metazoans (Breteler et al., 1999, Martin-
Creuzburg et al., 2005).
Another possible explanation is that the organisms in the red gum treatments were a higher
quality food source than those raised on the glucose addition. There is at least some
observational evidence that glucose additions lead to bacterial population distinct from natural
assemblages (Havskum et al., 2003, Hitchcock & Mitrovic, 2013). Whilst there is little
information on how different DOC sources may affect bacterial nutritional quality in
ecological studies, in laboratory cultures different growth mediums may lead to different fatty
acid profiles of bacteria (Kaneda, 1971). It is possible therefore that red gum leachate may
have induced a more diverse or nutritionally healthy bacterial community compared to those
in the glucose treatment leading to intermediary organisms such as flagellates or rotifers of
favourable quality to cyclopoids.
Our results suggest that the use of glucose as a DOC source may not be as representative as
leaf leachates or complex DOC sources for mesocosm experiments that examine changes in
zooplankton community structure. The MDS plot of zooplankton community in this
experiment highlights how different the responses were between glucose and leachate (Fig.
4). Whilst glucose is a simple carbohydrate, the red gum leachate is comprised of a variety
of different organic compounds such as carbohydrates, amino, phenolic and carboxylic acids
as well as a variety of micro-nutrients. Glucose has been frequently used as a DOC source in
14
395
396
397
398
399
400
401
402
403
404
405
406
407
408
409
410
411
412
413
414
415
416
417
418
419
420
421
422
423
424
425
426

addition experiments however a comparison of responses to glucose and more complex DOC
sources has not been carried out to our knowledge. The different responses of certain
zooplankton taxa to the red gum leachate, compared to the glucose treatment, indicating this
should be considered in interpreting the results of experiments using simpler forms of DOC.
This suggests the effect of different carbon sources on heterotrophic diversity and nutritional
quality in aquatic systems may be an important area of future research.
Role of allochthonous carbon in food webs
Although bacterioplankton often use autochthonously produced DOC preferentially over
allochthonous sources (Kritzberg et al., 2006), the watershed can supply large amounts of
allochthonous assimilable organic carbon, contributing to significant increases in bacterial
production (Wilcox et al., 2005). There is considerable debate concerning the degree of
allochthonous organic matter subsidization of secondary productivity in aquatic environments
(Carpenter et al., 2005). Some evidence has suggested bacterial carbon pools are a minor
source for higher trophic levels. Sobczak et al., (2005) found that zooplankton in the
Sacramento and San Joaquin River preferentially consumed higher quality autochthonous
particulate matter over the more abundant low quality allochthonous organic matter. Pollard
and Ducklow (2011) found that despite high bacterial production driven by allochthonous
DOC in the Brisbane River, Australia, most production could not leave the microbial loop due
to viral lysis.
However, a growing number of studies are finding substantial subsidisation of the flow of
terrestrial organic carbon to zooplankton and fish (e.g. Hoffman et al., 2007, Hoffman et al.,
2008). In freshwater lakes, allochthonous carbon has been reported to support approximately
43% to 75% of bacterial growth (Kritzberg et al., 2006) and a recent study by Cole et al.,
(2011) found that allochthony of some zooplankton taxa is greater than 20% and in some
cases is up to 70% of the organism’s diet. Wilcox et al., (2005) found significant microbial
and invertebrate responses in a stream following the addition of labile carbon which
stimulated food web processes even in a system abundant with organic matter.
Only a few examples of allochthonous carbon subsidies to the food webs or its influence on
metabolism of lowland rivers are available (e.g. Bunn et al., 2003). Vink et al., (2005)
quantified ecosystem metabolism in the middle reaches of a river and showed that
phytoplankton production dominated ecosystem production. However, the authors speculated
15
427
428
429
430
431
432
433
434
435
436
437
438
439
440
441
442
443
444
445
446
447
448
449
450
451
452
453
454
455
456
457
that the high contribution of phytoplankton in the Murrumbidgee system could be a
consequence of flow regulation and resultant loss of riverine connectivity with adjacent
floodplains. Oliver and Merrick (2006) found autochthonous organic carbon fuelled riverine
metabolism of some regulated rivers, primarily by reductions in flow and subsequent
reduction in organic matter. Hoffman et al., (2008) investigated the sources of organic matter
supporting lower food web production in a tidal freshwater portion of an estuary and found
that the degree to which zooplankton were supported by autochthonous sources declined
exponentially with discharge.
Elucidation of the different pathways of energy subsidisation and its effects on the
fundamental properties of food web dynamics and carbon cycling is an expanding frontier of
ecological research. The impacts of cross-ecosystem subsidies depend on the characteristics
of the imported material, the route of entry into the food web, the types of consumers present
and the productivity of the recipient system (Cole et al., 2006). Here we have shown how
zooplankton of an unconstrained lowland floodplain river may respond to amendments of two
DOC sources using mesocosm experiments. DOC amendment to the mesocosms was shown
to influence bacterioplankton and protozoan dynamics and influence zooplankton community
structure. The extrapolation of these mesocosm results to the river situation requires further
study to see if similar patterns are observed. DOC concentrations remain elevated for periods
of greater than a week after inflows (Westhorpe & Mitrovic, 2013) and due to the length the
river system flow peaks may travel for weeks allowing time for planktonic community
changes to occur. Our results support the contention that DOC supply may stimulate
heterotrophic bacterioplankton and may alter zooplankton density and community structure.
Acknowledgements
This work was funded by the New South Wales Government’s Integrated Monitoring of
Environmental Flows Program. Dr. John Brayan, Adam Crawford, Jon Holliday and staff of
the NSW Office of Water laboratory are thanked for analysis of water quality parameters.
Thanks to Rebecca Herron for assisting with the determination of bacterial abundance and
John Lemon for looking after the experimental location. We would like to thank Dr Bruce
Chessman for very helpful comments to improve this manuscript.
References
16
458
459
460
461
462
463
464
465
466
467
468
469
470
471
472
473
474
475
476
477
478
479
480
481
482
483
484
485
486
487
Adrian, R. and Frost, T. M. (1993) Omnivory in cyclopoid copepods: comparisons of algae
and invertebrates as food for three, differenfly sized species. Journal of Plankton
Research, 15, 643-658.
Anderson, M. J. (2001a) A new method for non-parametric multivariate analysis of variance.
Austral Ecology, 26, 32-46.
Anderson, M. J. (2001b) Permutation tests for univariate or multivariate analysis of variance
and regression. Canadian journal of fisheries and aquatic sciences, 58, 626-639.
APHA (1998) Standard methods for the examination of water and wastewater. Washington,
DC Standard Methods for the Examination of Water and Wastewater, 20.
Arndt, H. (1993) Rotifers as predators on components of the microbial web (bacteria,
heterotrophic flagellates, ciliates)—a review. Hydrobiologia, 255, 231-246.
Baldwin, D. S. (1999) Dissolved organic matter and phosphorus leached from fresh and
‘terrestrially’aged river red gum leaves: implications for assessing river–floodplain
interactions. Freshwater Biology, 41, 675-685.
Berggren, M., Laudon, H., Haei, M., Strom, L. and Jansson, M. (2010) Efficient aquatic
bacterial metabolism of dissolved low-molecular-weight compounds from terrestrial
sources. Isme Journal, 4, 408-416.
Blomqvist, P., Jansson, M., Drakare, S., Bergström, A. and Brydsten, L. (2001) Effects of
additions of DOC on pelagic biota in a clearwater system: results from a whole lake
experiment in northern Sweden. Microbial Ecology, 42, 383-394.
Breteler, W. K., Schogt, N., Baas, M., Schouten, S. and Kraay, G. (1999) Trophic upgrading
of food quality by protozoans enhancing copepod growth: role of essential lipids.
Marine Biology, 135, 191-198.
Broglio, E., Jonasdottir, S., Calbet, A., Jakobsen, H. H. and Saiz, E. (2003) Effect of
heterotrophic versus autotrophic food on feeding and reproduction of the calanoid
copepod Acartia tonsa: relationship with prey fatty acid composition. Aquatic
Microbial Ecology, 31, 267-278.
Bunn, S. E., Davies, P. M. and Winning, M. (2003) Sources of organic carbon supporting the
food web of an arid zone floodplain river. Freshwater Biology, 48, 619-635.
Carpenter, S. R., Cole, J. J., Pace, M. L., Van De Bogert, M., Bade, D. L., Bastviken, D.,
Gille, C. M., Hodgson, J. R., Kitchell, J. F. and Kritzberg, E. S. (2005) Ecosystem
subsidies: Terrestrial support of aquatic food webs from C-13 addition to contrasting
lakes. Ecology, 86, 2737-2750.
17
488
489
490
491
492
493
494
495
496
497
498
499
500
501
502
503
504
505
506
507
508
509
510
511
512
513
514
515
516
517
518
519
520

Cole, J. J., Carpenter, S. R., Kitchell, J., Pace, M. L., Solomon, C. T. and Weidel, B. (2011)
Strong evidence for terrestrial support of zooplankton in small lakes based on stable
isotopes of carbon, nitrogen, and hydrogen. Proceedings of the National Academy of
Sciences, 108, 1975.
Cole, J. J., Carpenter, S. R., Kitchell, J. F. and Pace, M. L. (2002) Pathways of organic carbon
utilization in small lakes: Results from a whole-lake C-13 addition and coupled model.
Limnology and Oceanography, 47, 1664-1675.
Cole, J. J., Carpenter, S. R., Pace, M. L., Van De Bogert, M. C., Kitchell, J. L. and Hodgson,
J. R. (2006) Differential support of lake food webs by three types of terrestrial organic
carbon. Ecology Letters, 9, 558-568.
Del Giorgio, P. A., Cole, J. J., Caraco, N. F. and Peters, R. H. (1999) Linking planktonic
biomass and metabolism to net gas fluxes in northern temperate lakes. Ecology, 80,
1422-1431.
DLWC (2000) Namoi: State of the rivers report 2000. New South Wales Department of Land
and Water Conservation, Australia.
Drakare, S., Blomqvist, P., Bergstrom, A. K. and Jansson, M. (2002) Primary production and
phytoplankton composition in relation to DOC input and bacterioplankton production
in humic Lake Ortrasket. Freshwater Biology, 47, 41-52.
Edmondson, W. T. and Vinberg, G. G. (1971) manual on methods for the assessment of
secondary productivity in fresh waters.
Faithfull, C., Huss, M., Vrede, T., Karlsson, J. and Bergstrom, A. K. (2012) Transfer of
bacterial production based on labile carbon to higher trophic levels in an oligotrophic
pelagic system. Canadian Journal of Fisheries and Aquatic Sciences, 69, 85-93.
Gawler, M. and Chapuis, R. (1987) An improved version of the Haney grazing chamber.
Freshwater Biology, 18, 1-4.
Gifford, D. and Dagg, M. (1988) Feeding of the estuarine copepod Acartia tonsa Dana:
carnivory vs. herbivory in natural microplankton assemblages. Bulletin of Marine
Science, 43, 458-468.
Gilbert, J. J. and Jack, J. D. (1993) Rotifers as predators on small ciliates. Rotifer Symposium
VI. Springer, pp. 247-253.
Gulati, R. and Demott, W. (1997) The role of food quality for zooplankton: remarks on the
state‐of‐the‐art, perspectives and priorities. Freshwater Biology, 38, 753-768.
Hadwen, W. L., Fellows, C. S., Westhorpe, D. P., Rees, G. N., Mitrovic, S. M., Taylor, B.,
Baldwin, D. S., Silvester, E. and Croome, R. (2009) Longitudinal trends in river
18
521
522
523
524
525
526
527
528
529
530
531
532
533
534
535
536
537
538
539
540
541
542
543
544
545
546
547
548
549
550
551
552
553
554

functioning: Patterns of nutrient and carbon processing in three Australian rivers.
River Research and Applications, 26, 1129-1152.
Hall Jr, R. O. and Meyer, J. L. (1998) The trophic significance of bacteria in a detritus-based
stream food web. Ecology, 79, 1995-2012.
Hauer, F. R. and Lamberti, G. A. (2011) Methods in stream ecology. Academic Press.
Havskum, H., Thingstad, T. F., Scharek, R., Peters, F., Berdalet, E., Sala, M. M., Alcaraz, M.,
Bangsholt, J. C., Zweifel, U. L. and Hagström, Å. (2003) Silicate and labile DOC
interfere in structuring the microbial food web via algal-bacterial competition for
mineral nutrients: Results of a mesocosm experiment. Limnology and Oceanography,
48, 129-140.
Hitchcock, J. N. and Mitrovic, S. M. (2013) Different resource limitation by carbon, nitrogen
and phosphorus between base flow and high flow conditions for estuarine bacteria and
phytoplankton. Estuarine, Coastal and Shelf Science, 135, 106-115.
Hitchcock, J. N., Mitrovic, S. M., Kobayashi, T. and Westhorpe, D. P. (2010) Responses of
Estuarine Bacterioplankton, Phytoplankton and Zooplankton to Dissolved Organic
Carbon (DOC) and Inorganic Nutrient Additions. Estuaries and Coasts, 33, 78-91.
Hoffman, J. C., Bronk, D. A. and Olney, J. E. (2007) Contribution of allochthonous carbon to
American shad production in the Mattaponi River, Virginia, using stable isotopes.
Estuaries and Coasts, 30, 1034-1048.
Hoffman, J. C., Bronk, D. A. and Olney, J. E. (2008) Organic matter sources supporting lower
food web production in the tidal freshwater portion of the York River estuary,
Virginia. Estuaries and Coasts, 31, 898-911.
Humphries, P., King, A. J. and Koehn, J. D. (1999) Fish, flows and flood plains: links
between freshwater fishes and their environment in the Murray-Darling River system,
Australia. Environmental Biology of Fishes, 56, 129-151.
Jansson, M., Bergström, A., Blomqvist, P. and Drakare, S. (2000) Allochthonous organic
carbon and phytoplankton/bacterioplankton production relationships in lakes. Ecology,
81, 3250-3255.
Jassby, A., Cloern, J. and Powell, T. (1993) Organic carbon sources and sinks in San
Francisco Bay: Variability induced by river flow. Marine ecology progress series.
Oldendorf, 95, 39-54.
Jensen, T. C., Anderson, T. R., Daufresne, M. and Hessen, D. O. (2006) Does excess carbon
affect respiration of the rotifer Brachionus calyciflorus Pallas? Freshwater Biology,
51, 2320-2333.
19
555
556
557
558
559
560
561
562
563
564
565
566
567
568
569
570
571
572
573
574
575
576
577
578
579
580
581
582
583
584
585
586
587
588

Judd, K., Crump, B. and Kling, G. (2006) Variation in dissolved organic matter controls
bacterial production and community composition. Ecology, 87, 2068-2079.
Junk, W., Bayley, P. and Sparks, R. (1989) The flood pulse concept in river-floodplain
systems. Canadian Special Publication of Fisheries and Aquatic Sciences, 106, 110-
127.
Kaneda, T. (1971) Factors affecting the relative ratio of fatty acids in Bacillus cereus.
Canadian journal of microbiology, 17, 269-275.
Karlsson, J., Lymer, D., Vrede, K. and Jansson, M. (2007) Differences in efficiency of carbon
transfer from dissolved organic carbon to two zooplankton groups: an enclosure
experiment in an oligotrophic lake. Aquatic Sciences, 69, 108-114.
Kobayashi, T., Gibbs, P., Dixon, P. and Shiel, R. J. (1996) Grazing by a river zooplankton
community: importance of microzooplankton. Marine and Freshwater Research, 47,
1025-1036.
Kobayashi, T., Shiel, R., Gibbs, P. and Dixon, P. (1998) Freshwater zooplankton in the
Hawkesbury-Nepean River: comparison of community structure with other rivers.
Hydrobiologia, 377, 133-145.
Kobayashi, T., Shiel, R. J., King, A. J. and Miskiewicz, A. G. (2009) Freshwater
zooplankton:diversity and biology. In: I. M. Suthers and D. Rissik (eds) Plankton.
CSIRO Publishing, Collingwood, Vic.
Kritzberg, E., Cole, J., Pace, M. and Granéli, W. (2006) Bacterial Growth on Allochthonous
Carbon in Humic and Nutrient-enriched Lakes: Results from Whole-Lake 13 C
Addition Experiments. Ecosystems, 9, 489-499.
Kumar, R. and Rao, T. R. (2001) Effect of the cyclopoid copepod Mesocyclops
thermocyclopoides on the interactions between the predatory rotifer Asplanchna
intermedia and its prey Brachionus calyciflorus and B. angularis. Hydrobiologia, 453,
261-268.
Likens, G. E. and Gilbert, J. J. (1970) Notes on quantitative sampling of natural populations
of planktonic rotifers. Limnology and Oceanography, 15, 816-820.
Lubzens, E., Marko, A. and Tietz, A. (1985) De novo synthesis of fatty acids in the rotifer,
Brachionus plicatilis. Aquaculture, 47, 27-37.
Martin-Creuzburg, D., Bec, A. and Von Elert, E. (2005) Trophic upgrading of
picocyanobacterial carbon by ciliates for nutrition of Daphnia magna. Aquatic
microbial ecology, 41, 271-280.
20
589
590
591
592
593
594
595
596
597
598
599
600
601
602
603
604
605
606
607
608
609
610
611
612
613
614
615
616
617
618
619
620
621
Nakamura, Y. and Turner, J. T. (1997) Predation and respiration by the small cyclopoid
copepod Oithona similisr: How important is feeding on ciliates and heterotrophic
flagellates? Journal of Plankton Research, 19, 1275-1288.
Oliver, R. L. and Merrick, C. J. (2006) Partitioning of river metabolism identifies
phytoplankton as a major contributor in the regulated Murray River (Australia).
Freshwater Biology, 51, 1131-1148.
Packard, A. T. (2001) Clearance rates and prey selectivity of the predaceous cladoceran
Polyphemus pediculus. Hydrobiologia, 442, 177-184.
Polis, G. A., Anderson, W. B. and Holt, R. D. (1997) Toward an integration of landscape and
food web ecology: the dynamics of spatially subsidized food webs. Annual review of
ecology and systematics, 289-316.
Pollard, P. C. and Ducklow, H. (2011) Ultrahigh bacterial production in a eutrophic
subtropical Australian river: Does viral lysis short-circuit the microbial loop?
Limnology and Oceanography, 56, 1115-1129.
Porter, K. and Feig, Y. (1980) The use of DAPI for identifying and counting aquatic
microflora. Limnology and Oceanography, 25, 943-948.
Rothhaupt, K. O. (1990) Population growth rates of two closely related rotifer species: effects
of food quantity, particle size, and nutritional quality. Freshwater Biology, 23, 561-
570.
Sanders, R., Porter, K., Bennett, S. and Debiase, A. (1989) Seasonal patterns of bacterivory
by flagellates, ciliates, rotifers, and cladocerans in a freshwater planktonic community.
Limnology and Oceanography, 34, 673-687.
Selinummi, J., Seppala, J., Yli-Harja, O. and Puhakka, J. A. (2005) Software for
quantification of labeled bacteria from digital microscope images by automated image
analysis. BioTechniques, 39, 859.
Shiel, R. J. (1995) A guide to identification of rotifers, cladocerans and copepods from
Australian inland waters. Vol., Co-operative Research Centre for Freshwater Ecology
Canberra.
Simon, M. and Azam, F. (1989) Protein content and protein synthesis rates of planktonic
marine bacteria. Marine ecology progress series. Oldendorf, 51, 201-213.
Sobczak, W., Cloern, J., Jassby, A., Cole, B., Schraga, T. and Arnsberg, A. (2005) Detritus
fuels ecosystem metabolism but not metazoan food webs in San Francisco estuary's
freshwater Delta. Estuaries and Coasts, 28, 124-137.
21
622
623
624
625
626
627
628
629
630
631
632
633
634
635
636
637
638
639
640
641
642
643
644
645
646
647
648
649
650
651
652
653
654
Sommer, U., Gliwicz, Z. M., Lampert, W. and Duncan, A. (1986) The PEG-model of
seasonal succession of planktonic events in fresh waters. Archiv für Hydrobiologie,
106, 433-471.
Thorp, J. and Delong, M. (2002) Dominance of autochthonous autotrophic carbon in food
webs of heterotrophic rivers. Oikos, 96, 543-550.
Thorp, J., Delong, M., Greenwood, K. and Casper, A. (1998) Isotopic analysis of three food
web theories in constricted and floodplain regions of a large river. Oecologia, 117,
551-563.
Vink, S., Bormans, M., Ford, P. and Grigg, N. (2005) Quantifying ecosystem metabolism in
the middle reaches of Murrumbidgee River during irrigation flow releases. Marine
and Freshwater Research, 56, 227.
Westhorpe, D., Mitrovic, S. and Chessman, B. (2008) Integrated monitoring of environmental
flows: wetting terrestrial organic matter hypothesis: technical report: IMEF phase 1,
1998–2005. NSW Department of Water and Energy, Sydney.
Westhorpe, D., Mitrovic, S., Ryan, D. and Kobayashi, T. (2010) Limitation of lowland
riverine bacterioplankton by dissolved organic carbon and inorganic nutrients.
Hydrobiologia, 652, 101-117.
Westhorpe, D. P. and Mitrovic, S. M. (2013) Dissolved organic carbon mobilisation in
relation to variable discharges and environmental flows in a highly regulated lowland
river. Marine and Freshwater Research, 63, 1218-1230.
Whitworth, K. L., Baldwin, D. S. and Kerr, J. L. (2012) Drought, floods and water quality:
drivers of a severe hypoxic blackwater event in a major river system (the southern
Murray–Darling Basin, Australia). Journal of Hydrology, 450, 190-198.
Wilcox, H., Wallace, J., Meyer, J. and Benstead, J. (2005) Effects of labile carbon addition on
a headwater stream food web. Limnology and Oceanography, 50, 1300-1312.
Zar, J. (1984) Biostatistical analysis. 2nd. Edition. Englewood Cliffs: New Jersey.
22
655
656
657
658
659
660
661
662
663
664
665
666
667
668
669
670
671
672
673
674
675
676
677
678
679
680
681
682
683

Table I. Summary of repeated measures analysis of variance for dissolved oxygen, bacterial
biomass, chlorophyll a and DOC.
Source df F p
Dissolved oxygen Time 7 141.42 <0.001
Treatment 4 47.94 <0.001
Time*Treatme
nt 28 9.73 <0.001
Bacterial biomass Time 4 110.9 <0.001
Treatment 4 12.65 <0.01
Time*Treatme
nt 16 27.56 <0.001
Chlorophyll a Time 3 185.5 <0.0001
Treatment 4 5.088 <0.01
Time*Treatme
nt 12 3.351 <0.01
DOC Time 12 1863 <0.001
Treatment 3 519.7 <0.001
Time*Treatme
nt 4 249 <0.001
23
684
685
686
687
688
689
690

Table II. Summary of repeated measures analysis of variance Bonferroni post-hoc test results
for dissolved oxygen, bacterial biomass, chlorophyll a and DOC. C=control, G = glucose, GN
= glucose and nutrients, R = red gum, RN = red gum and nutrients. Level of statistical
significance indicated by: *** p < 0.001, ** p < 0.01, * p < 0.05.
Da
y
C x
G
C x
GN C x R
C x
RN G x R
G x
GN
R x
RN
GN x
RN
Dissolved Oxygen 1
2 * *
3 ** * * *
4 * * *
5 * * * *
6 *
7
8
Bacterial biomass 3 * *** ** ***
6 *** *** ** *** ***
8 *** *** *** **
Chlorophyll a 3 *
6 ** ** *
8 *** *
DOC 3 *** *** *** *** *** *** ***
6 *** *** *** *** *** *** ***
8 * *** *** *** *** *** ***
24
691
692
693
694
695
696
697
698
699

List of Figures
Fig. 1. Namoi River catchment and location of the study site at Boggabri, NSW, Australia.
Fig. 2. Changes in dissolved oxygen concentrations (a), bacterial biomass (b), DOC
concentrations (c) and chlorophyll a concentrations (d) over the course of the
experiment (n=4; ± standard error for all except bacterial biomass n=2; ± standard
error).
Fig. 3. Changes in mean zooplankton concentrations over the course of the experiment
(n=4; ± standard error).
Fig. 4. nMDS plot of mean zooplankton concentrations (Log10(x+1) transformed for each
treatment type across 3-days (0, 5 and 8 days).
Fig. 5. Changes in mean density for some important taxa over the course of the experiment
(n=4; ± standard error).
25
700
701
702
703
704
705
706
707
708
709
710
711
712
713
714
715
716
717
718
Related Documents