Cellular and Molecular Pathogenesis of Salmonid Alphavirus 1 in Atlantic Salmon Salmo salar L. THESIS SUBMITTED FOR THE DEGREE OF DOCTOR OF PHILOSOPHY IN AQUATIC VETERINARY STUDIES By Tharangani Kaushallya Herath BVSc March 2010 INSTITUTE OF AQUACULTURE

Welcome message from author
This document is posted to help you gain knowledge. Please leave a comment to let me know what you think about it! Share it to your friends and learn new things together.
Transcript
Cellular and Molecular Pathogenesis of
Salmonid Alphavirus 1 in
Atlantic Salmon Salmo salar L.
THESIS SUBMITTED FOR THE DEGREE OF
DOCTOR OF PHILOSOPHY IN
AQUATIC VETERINARY STUDIES
By
Tharangani Kaushallya Herath
BVSc
March 2010
INSTITUTE OF AQUACULTURE

i
To Nilantha, Vinethma
and
my mum Indu

ii
Declaration
I, hereby declare that the work and the results presented in this thesis have been carried
out by myself at the Institute of Aquaculture, University of Stirling, Scotland and have
not been submitted for any other degree or qualification. All information from other
sources has been acknowledged.
Tharangani K. Herath

iii
Acknowledgements
This thesis has greatly benefited from the knowledge, guidance and the expertise of my
supervisors, Dr Kim D. Thompson, Professor Alexandra Adams and Professor
Randolph H. Richards - thank you for your kindness. I would also like to acknowledge
The Commonwealth Scholarship and Fellowship Plan UK for selecting me for a
Commonwealth Scholarship with the partnership of The Higher Education Ministry and
The Wayamba University of Sri Lanka. I was also supported by The Rodden Trust
during financial hardship – thank you for your generosity. The Fisheries Society of The
British Isles and The Society of General Microbiology are also kindly acknowledged for
providing travel grants to participate in scientific conferences.
A very special acknowledgment to Dr. James Bron for his assistance in confocal
imaging, microarray analysis and for his help in understanding some difficult statistical
jargon. Thank you also to Professor Hugh W. Ferguson, Dr. John Taggart, Dr William
Starkey, Dr. Matteo Minghetti, Dr. Amer Diab and Dr. Janina Costa for their practical
guidance, advice and opinions on this thesis. A huge acknowledgement to the non-
academic staff of the Institute of Aquaculture especially Ms Fiona Muir, Mrs Jacqueline
Ireland, Mr. Linton Brown, Mrs. Debbie Faichney, Mr. Niall Auchinachie, Mrs Cathryn
Dickson, Mrs Hilary McEwan, Mrs. Beatrice Campbell, Mr. Charlie Harrower, Ms Jane
Lewis, Mrs. Elizabeth Stenhouse, Ms. Anda Kilpatrick, Ms. Joanne Higgins and Mrs.
Melanie Cruickshank. Thank you very much for your skilful practical support!
A big thanks to my office friends Dr. Sarah Barker, Dr. Fara Manji, Dr. Remi Gratacap,
Dr. Adriyana Garzia Vasquaz, Dr. Jorge Del Pozo Gonzalez, Mairi Cowen, Sean
Monaghan and Matthijs Metselaar for their company, laughs and for their opinion in
science. Guys you were fantastic, I will miss you a lot! A very special thanks to Mrs.

iv
Sophie Fridman for being an amazing friend to me and to my family, good luck for the
thesis. Thank you very much Dr. and Mrs. Siriwardena you were always there for us, I
will remember you all forever!
I cannot forget Professor Neil Horadagoda, who has shown me the essence of pathology
and research; you will always be remembered and acknowledged! I also sincerely
acknowledge my colleagues, especially Professor J.M.P.K Jayasinghe and Professor
T.B Wanninayake at The Department of Aquaculture and Fisheries, Wayamba
University of Sri Lanka for taking care of my duties during my period away for PhD
studies.
Finally to my family, my loving husband Nilantha, I know you are there for me all the
time, thanks for giving time and encouragement for me to be positive. Vinethma, you
have been a blessing for us, you were the hope, you grew up with the thesis and thanks
for giving pleasure and enthusiasm to our life. (Thanks for selecting pretty pink for
some of the graphs!). Thanks for my parents and the family for always believing in me
to achieve this goal!
v
List of abbreviations
+ssRN positive sense single stranded RNA
µg microgram
µl microlitre
µm micrometre
µM micromolar
AEC amino-ethyl carbazol reagent
ANOVA analysis of variance
ApoREG apoptosis regulatory factor
aRNA amplified RNA
BcL-2 B cell aggressive lymphoma gene
BLAST basic alignment search tool
bp base pairs
BSA bovine serum albumin
cDNA complementary DNA
CHH-1 Chum salmon heart -1 cells
CHSE-214 Chinook salmon embryo 214 cells
CMC cell mediated cytotoxicity
CMS Cardiomyopathy syndrome
CPE cytopathic effect
CPV cytopathic vacuole
cRNA in vitro copied RNA
Ct threshold cycle
Cy cyanine
d.p.i days post infection
d.p.in days post inoculation
DAP death associated protein
DD death domain
dH2O distilled water
DISC death inducing signalling complex
DMSO dimethyl sulphoxide
DNA deoxyribonucleic acid
DPBS Dulbecco‟s phosphate buffered saline without Ca and Mg
dsDNA double stranded DNA
dsRNA double stranded RNA
E efficiency of qPCR
e.g. example
EE early endosomes
ELF-1α translation elongation factor 1 α
eLF2α translation elongation factor 2α
EM electron microscopy
EMEM Eagle‟s Minimal Essential Medium
EPC Epithelioma papulosum cyprinid
ER endoplasmic reticulum
EST expressed sequence tags
et al. et alia (and others)
EtBr ethidium bromide
FAO Food and Agriculture Organization
FCS foetal calf serum
FHM Fathead minnow
g gram
GM growth medium
vi
h hours
H&E haematoxylin and eosin
H2O2 hydrogen peroxide
HBSS Hank‟s buffered salt solution
HSMI Heart and skeletal muscle inflammation
i.e. id est (that is )
I.P. Intraperitoneal
IFAT immuno fluorescent antibody technique
Ig immunoglobulin
IHC immunohistochemistry
IHNV infectious heamatopoietic necrosis virus
IL interleukin
INF interferon
IPNV Infectious pancreatic necrosis virus
IPVN immunoperoxidase based virus neutralisation
IRF interferon regulatory factors
ISAV Infectious salmon anaemia virus
ISG interferon stimulated genes
ICVT International Committee for Virus Taxonomy
IU international units
JAK Janus kinases
JAK/STAT Janus Kinases and Signal Transducers and Activators of Transcription
JCVI J. Craig Venter Institute
Kb kilo base
L litre
L-15 Leibovitz-15
LE late endosomes
M molar
MA microarray
mAb monoclonal antibody
MAPK mitogen activated protein kinase
mg milligram
MHC major histocompatibility class
min minute
ml millilitre
MM maintenance medium
mM millimolar
MOI multiplicity of infection
mRNA messenger ribonucleic acid
NCBI National Center for Biotechnology Information
NEAA non essential amino acids
NF-κB nuclear factor kappa-light-chain-enhancer
ng nano gram
NK cell natural killer cell
nm nanometre
NOX nitric oxide
nsP non-structural protein
NSPD Norwegian salmon pancreas disease
OIE Office International des Epizooties
PAMP pathogen associated molecular pattern
PBS phosphate buffered saline
PD pancreas disease
PKR double-stranded RNA-activated protein kinase
qPCR quantitative polymerase chain reaction
qRT-PCR quantitative reverse transcription polymerase chain reaction
vii
r2 correlation co-efficiency
RAG recombinant activator factor
RC reference control
RER rough endoplamic reticulum
RFP finger proteins
-RNA (-) strand RNA
RNA ribonucleic acid
RT reverse transcription
RTG-2 rainbow trout trout gonad cells
RT-PCR reverse transcription polymerase chain reaction
SAV salmonid alphavirus
SD sleeping disease
SD standard deviation
SE standard error
sec seconds
SEM scanning electron microscopy
SG SYBR green
SHK-1 salmon head kidney -1 cells
SPD salmon pancreas disease
SPDV salmon pancreas disease virus
SSC saline-sodium citrate buffer
SSE suppression subtractive hybridisation
STAT signal transducers and activators of transcription
TAE Tris acetate EDTA
TBS Tris buffered saline
Tc T-cytotoxic cells
TCID50 50% tissues culture infective dose
TEM Transmission electron microscopy
Th T-helper cells
TLR Toll like receptors
TNF-α tumour necrosis factor alpha
Trypsin /EDTA trypsin in 0.01 % ethylenediaminetetraacetic acid
TTBS Tris buffered saline with Tween-20
TUNEL Terminal deoxynucleotidyl transferase end labelling
TYK tyrosine kinase
UK United Kingdom
USA United States of America
UV ultraviolet
V volt
v/v volume/volume
VHSV viral haemorrhagic septicaemia virus
VN virus neutralisation
w/v weight/volume
ZFPs zinc finger proteins
viii
Abstract
Salmonid alphaviruses (SAV) are a group of viruses that have recently emerged as a
serious threat to the salmonid aquaculture industry in Europe. Over recent years,
diseases caused by SAV have severely hampered the Scottish, Irish and Norwegian
Atlantic salmon industry, and are considered to be among the major economically
important viral diseases affecting the industry at present. Amongst the six subtypes
characterised so far, Salmonid alphavirus 1 (SAV1) causes severe pathology in the
heart, pancreas and the skeletal muscle of Atlantic salmon leading to death and growth
retardation in the affected fish. The biochemical characteristics of the virus and the
sequential pathology of the diseases caused by SAV have been described; however the
mechanisms responsible for causing the disease and the host defence mechanisms
against the virus are poorly defined. This thesis therefore examined the pathogenesis of
SAV infection at the cellular and molecular level in vivo in salmon and in vitro in
salmonid cells, with a special emphasis on host immune defence mechanisms against
the virus.
SAV was first isolated from Chinook salmon embryo-214 (CHSE-214) cells in 1995 in
Ireland. Several cell lines have since been used to grow the virus. In the present study,
three established salmonid cell lines, Chum salmon heart -1 (CHH-1), CHSE-214 and
Salmon head kidney -1 (SHK-1) were evaluated for their ability to support the isolation
of SAV-1 from infected fish tissue, with CHH-1 cells giving the fastest cytopathic
effect (CPE) during primary isolation. The CPE appeared as localised cell-rounding on
CHH-1 and CHSE-214 cells, although in SHK-1 cells, the cells were seen to slough off
the monolayer relatively later than with the other two cell lines during the infection.
ix
The host response to SAV infection was evaluated by experimentally infecting Atlantic
salmon parr using a cell culture-adapted virus isolate. A quantitative reverse
transcription polymerase chain reaction (qRT-PCR) was developed to examine the virus
load in the fish, from which it was found that the highest viral RNA copy number was
detected at 5 day post infection (d.p.i), of the 90 day experimental infection period.
Characteristic pathological lesions were only seen in the pancreas and the heart but not
in the skeletal muscles of the infected fish. A gene expression study using qRT-PCR
revealed the rapid induction of interferon (INF) and INF-associated genes in the head
kidney of the infected fish compared to the control fish. The Mx protein was found to be
highly expressed in the heart and the mucous membranes of infected fish by
immunohistochemistry. Interestingly, the pathological changes that were seen occurred
some time after the peak expression of genes associated with the INF-1-pathway. When
the host-virus interaction of Atlantic salmon infected with SAV was examined using a
microarray, a potent first line defence response was observed, together with the
signatures of early activation of the adaptive immune response during the initial stages
of the infection. Genes associated with transcription, translation and lipid metabolism
were significantly differentially expressed in virus infected fish compared to control
fish. A large array of antiviral genes was significantly expressed, amongst which were
some of the genes also described in mammalian alphavirus infections. Genes associated
with apoptosis and anti-apoptosis were also seen to be differentially regulated showing
the complexity of the host-virus interaction. Collectively, all of these findings suggest
that a non-specific antiviral immune response takes place providing rapid immune
protection during the early stages of SAV infection in salmon.
In the study on morphogenesis of SAV in salmonid cells using electron microscopy
(EM), a rapid internalization of virus into the cells and generation of replication
x
complexes using the secretory pathway of the cell, similar to mammalian alphavirus
replication was observed. The mature viruses were released through surface projections,
acquiring envelopes from the host cell membrane. From the ultrastructural studies of the
salmonid cells infected with SAV, a progressive chromatin marginalisation and
condensation could be seen, leading to cellular fragmentation, forming membrane
bound apoptotic bodies, characteristic of progressive apoptosis. The activation of
caspase-3 in the cytoplasm and genomic DNA damage were also seen in the infected
fish cells, indicating that apoptosis is the main cause of cell death during SAV infection.
The results of this study have increased our knowledge and understanding of the cellular
and molecular mechanisms involved in the pathogenesis of SAV infection, emphasising
the importance of the first line defence mechanisms against SAV infection in salmon.
This has given an interesting insight into the host mechanisms used to combat the virus
during infection, and will undoubtedly be useful for designing new vaccines and
management strategies for prevention and control of this important disease.
xi
Publications and Presentations from the Thesis
Publications
T K. Herath, J. Z. Costa, K.D. Thompson, A. Adams and R. H. Richards (2009).
Alternative Cell Lines for the Isolation of Salmon Alphavirus-1. Icelandic Agricultural
Sciences (22)19-27.
Manuscript in preparation
T K. Herath, K.D. Thompson, J. E. Bron, J.B. Taggart .A. Adams and R. H. Richards
Transcriptomic analysis of salmon alphavirus 1 infection (in preparation).
T K. Herath, K.D. Thompson, A. Adams and R. H. Richards. Interferon-mediated
antiviral response in experimentally induced salmonid Alphavirus 1 infection in
Atlantic salmon (in preparation).
T K. Herath, K.D. Thompson, A. Adams, R. H. Richards and H.W. Ferguson. The
ultra structural morphogenesis of Salmonid Alphavirus (in preparation).
Scientific conferences and meetings
T.K. Herath, K.D. Thompson, J. E. Bron, J.B. Taggart, R. H. Richards and A. Adams.
Transcriptomic analysis of Atlantic salmon host response to experimentally induced
SAV-1 infection. 14th
EAFP international conference, 14th
-19th
September 2009,
Prague, Czech Republic (Oral presentation).
xii
T.K. Herath, J. E. Bron, K.D. Thompson, A. Adams, R. H. Richards and J.B. Taggart.
Host response to salmonid alphavirus infection. Fourth integrative physiology post-
graduate students‟ conference 27-29th
May 2009, University of Aberdeen, Aberdeen,
UK (Invited oral presentation).
Tharangani Herath, Kim Thompson, Alexandra Adams, James Bron and Randolph
Richards. Apoptosis in pathogenesis of salmon pancreas disease. International
symposium on Scottish Aquaculture, A sustainable future. 21-22nd
April 2009, The
Edinburgh Conference Centre, Heriot-Watt University Edinburgh, UK (Poster
presentation).
Tharangani Herath, Kim Thompson, Alexandra Adams and Randolph Richards,
Pathogenesis and early defence mechanisms of Salmonid alphavirus 1 infection. PhD
research conference, 28th
October 2008, Institute of Aquaculture, University of Stirling
(Oral presentation).
T. K Herath, K.D. Thompson, A. Adams and R.H Richards. Apoptosis-induced cell
death in salmonid alphavirus infection. International conference on Fish Diseases and
Fish Immunology. 6 – 9th
September 2008, Reykjavik, Iceland (Poster presentation).
T.K. Herath, J. E. Bron, K.D. Thompson, A. Adams, R. H. Richards and J.B. Taggart.
Gene expression profiling of Atlantic salmon experimentally infected with salmonid
Alphavirus. Annual Scottish Fish immunology Research Centre meeting, 21st August
2008, University of Aberdeen, UK (Oral presentation).
Tharangani Herath, Kim Thompson, Alexandra Adams, Amer Diab, Matteo Minghetti
and Randolph Richards. Early antiviral response in Atlantic salmon experimentally
infected with Salmonid alphavirus 1. American Fisheries Society Fish Health Section,
xiii
14th
annual meeting. 9-12th
July 2008, Atlantic Veterinary College, University of Prince
Edward Island, Canada (Oral presentation).
T. K Herath, K.D Thompson, A. Adams, R.H. Richards and H.W Ferguson.
Utrastructural morphogenesis of Salmonid alphavirus 1. American Fisheries Society,
Fish Health Section, 14th
annual meeting. 9-12th
July 2008, Atlantic Veterinary
College, University of Prince Edward Island, Canada (Poster presentation).
Tharangani Herath, Kim Thompson, Alexandra Adams, Amer Diab, Matteo Minghetti
and Randolph Richards. Antiviral gene expression in Atlantic salmon experimentally
infected with salmonid alphavirus 1. EADGENE 4th
annual meeting on Animal
Genomics. 9-12th
June 2008, Edinburgh, UK (Poster presentation).
Tharangani Herath, Kim Thompson, Alexandra Adams and Randolph Richards. PD
work at Institute of Aquaculture; an up date. Trination PD meeting 5-9th
November
2007, Bergen Norway (Oral presentation).
Tharangani Herath, Kim Thompson, Alexandra Adams and Randolph Richards. PD
work at Institute of Aquaculture; an up date. Trination PD meeting 8-9th
May 2008,
Galway, Ireland (Oral presentation).
Tharangani Herath, Kim Thompson, Alexandra Adams Randolph Richards, PD work
at Institute of Aquaculture; an up date. Trination PD meeting 5-8th
March 2009
University of Stirling, UK (Oral presentation).
xiv
Table of Contents
Declaration ................................................................................................................................................. ii
Acknowledgements ................................................................................................................................... iii
List of abbreviations .................................................................................................................................. v
Abstract ................................................................................................................................................... viii
Publications and Presentations from the Thesis .................................................................................... xi
Table of Contents .................................................................................................................................... xiv
List of Figures ........................................................................................................................................ xvii
List of Tables .......................................................................................................................................... xxv
Chapter 1 .................................................................................................................................................... 1
General Introduction
1.1 Background ............................................................................................................................... 1
1.2 Fish health and fish viral diseases in global aquaculture .......................................................... 1
1.3 Alphavirus (Family Togaviridae) ............................................................................................. 4
1.4 Salmonid alphavirus ................................................................................................................. 5
1. 4. 1 Diseases caused by salmonid alphaviruses ..................................................................... 5
1. 4. 2 Salmonid alphavirus structure ........................................................................................ 9
1. 4. 3 Pathology of SAV .......................................................................................................... 12
1. 4. 4 Pathogenesis of SAV...................................................................................................... 15
1. 4. 5 Differential diagnosis .................................................................................................... 16
1. 4. 6 Diagnostic tools for SAV ............................................................................................... 17
1. 4. 7 Defense mechanisms ..................................................................................................... 21
1. 4. 8 Disease transmission ..................................................................................................... 22
1. 4. 9 Treatment and Control .................................................................................................. 23
1. 4. 10 Epizootiology and economic importance ...................................................................... 24
1.5 Fish immune system and immune response to viral diseases ................................................. 25
1. 5. 1 Morphology of immune system of fish ........................................................................... 26
1. 5. 2 Innate immune system of fish ........................................................................................ 28
1. 5. 3 Adaptive immune system ............................................................................................... 30
1.6 Functional genomics for studying immune system of salmon ................................................ 32
1.7 Aims and Objectives ............................................................................................................... 35
Chapter 2 .................................................................................................................................................. 36
Isolation and Quantification of Salmonid Alphavirus 1 Following Experimental Infection in
Atlantic Salmon
2.1 Introduction ............................................................................................................................ 36
2.2 Materials and Methods............................................................................................................ 42
2. 2. 1 Cell cultures .................................................................................................................. 42
2. 2. 2 Culture of the virus ........................................................................................................ 43
2. 2. 3 Virus titration by 50 % Tissue Culture Infective Dose (TCID50). .................................. 44
2. 2. 4 Experimental infection of Atlantic salmon with SAV1 ................................................... 45
2. 2. 5 Isolation of SAV1 on CHSE-214 cells ........................................................................... 45
2. 2. 6 Comparison of CHH-1, CHSE-214 and SHK-1 cells for virus isolation ....................... 46
2. 2. 7 Detection and quantification of viral RNA .................................................................... 47
2.2.7.1 RNA extraction ......................................................................................................... 47
2.2.7.2 Reverse transcription of RNA .................................................................................. 48
2.2.7.3 RT-PCR .................................................................................................................... 48
2.2.7.4 In- vitro transcription of RNA .................................................................................. 49
2.2.7.5 Construction of in-vitro transcribed RNA standards ................................................ 51
2.2.7.6 Standard curve preparation and quantification of SAV load in kidney tissue .......... 51
2.3 Results .................................................................................................................................... 53
xv
2. 3. 1 Isolation of SAV-1 on CHSE-214 cells .......................................................................... 53
2. 3. 2 Comparison of different cell lines for virus isolation, morphology and titration .......... 54
2. 3. 3 Detection and quantification of viral RNA .................................................................... 58
2.3.3.1 Generation of cRNA standards and standard curve .................................................. 58
2.3.3.2 Detection and quantification of SAV-1 in kidney tissues by RT-PCR and qRT-PCR
61
2.4 Discussion ............................................................................................................................... 63
Chapter 3 .................................................................................................................................................. 70
Interferon-mediated Antiviral Response in Experimentally Induced Salmonid Alphavirus 1
Infection in Atlantic Salmon
3.1 Introduction ............................................................................................................................ 70
3.2 Materials and methods ............................................................................................................ 75
3. 2. 1 Experimental infection and sample collection............................................................... 75
3. 2. 2 Histopathology .............................................................................................................. 75
3. 2. 3 Real time PCR for INF-I, INF –II and Mx protein expression ...................................... 76
3. 2. 4 Immunohistochemistry for Mx protein .......................................................................... 78
3.3 Results .................................................................................................................................... 81
3. 3. 1 Histopathology .............................................................................................................. 81
3. 3. 2 Real time PCR for INF-I, INF-II and Mx protein expression ........................................ 89
3. 3. 3 Immunohistochemistry for Mx protein expression ........................................................ 92
3.4 Discussion ............................................................................................................................... 94
Chapter 4 ................................................................................................................................................ 106
Transcriptomic Analysis of the Host Response in Early Stage Salmonid Alphavirus Infection in
Atlantic Salmon
4.1 Introduction .......................................................................................................................... 106
4.2 Materials and Methods.......................................................................................................... 111
4. 2. 1 RNA Amplification ...................................................................................................... 111
4. 2. 2 Dye coupling and purification ..................................................................................... 112
4. 2. 3 Microarray hybridization and scanning ...................................................................... 113
4. 2. 4 Data processing .......................................................................................................... 114
4. 2. 5 Validation of differential expression by RT-PCR ........................................................ 116
4.3 Results .................................................................................................................................. 117
4. 3. 1 Host response .............................................................................................................. 119
4.3.1.1 Innate immune response ......................................................................................... 120
4.3.1.2 Complement system ............................................................................................... 122
4.3.1.3 Adaptive immune response .................................................................................... 125
4.3.1.4 Virus induced and antiviral response ...................................................................... 128
4.3.1.5 Cell death associated genes .................................................................................... 128
4.3.1.6 qRT-PCR ................................................................................................................ 131
4.4 Discussion ............................................................................................................................. 131
Chapter 5 ................................................................................................................................................ 145
Ultrastructural Morphogenesis of Salmonid Alphavirus 1
5.1 Introduction .......................................................................................................................... 145
5.2 Materials and methods .......................................................................................................... 150
5. 2. 1 Culture of the virus ...................................................................................................... 150
5. 2. 2 Growth curve ............................................................................................................... 150
5. 2. 3 Transmission electron microscopy .............................................................................. 151
5. 2. 4 Negative staining of SAV-1 for electron microscopy ................................................... 152
5.3 Results .................................................................................................................................. 153
5. 3. 1 Growth curve ............................................................................................................... 153
5. 3. 2 Transmission electron microscopy .............................................................................. 153
5. 3. 3 Negative staining of virus ............................................................................................ 163
xvi
5.4 Discussion ............................................................................................................................. 164
Chapter 6 ................................................................................................................................................ 171
Apoptosis Induced Cell Death in Salmonid Alphavirus 1
6.1 Introduction .......................................................................................................................... 171
6.2 Materials and Methods.......................................................................................................... 176
6. 2. 1 Preparation of stock virus ........................................................................................... 176
6. 2. 2 Infection of cells with virus ......................................................................................... 176
6. 2. 3 Transmission electron microscopy .............................................................................. 177
6. 2. 4 Scanning electron microscopy..................................................................................... 177
6. 2. 5 DNA extraction and gel electrophoresis ..................................................................... 177
6. 2. 6 Determining apoptosis using immunofluorescent confocal microscopy
………………………………………………………………………………….178
6.2.6.1 Caspase-3 staining .................................................................................................. 179
6.2.6.2 Hoechst 33258 staining .......................................................................................... 179
6.2.6.3 Confocal imaging ................................................................................................... 180
6.2.6.4 Image analysis ........................................................................................................ 180
6.3 Results .................................................................................................................................. 182
6. 3. 1 Transmission electron microscopy .............................................................................. 182
6. 3. 2 Scanning electron microscopy..................................................................................... 185
6. 3. 3 DNA laddering ............................................................................................................ 185
6. 3. 4 Apoptosis under confocal microscopy ......................................................................... 186
6.4 Discussion ............................................................................................................................. 192
Chapter 7 ................................................................................................................................................ 198
General Discussion
References ............................................................................................................................................... 213
Appendix ................................................................................................................................................. 236
xvii
List of Figures
Figure 1. 1 Schematic diagram of SAV structure and the genome organization. The
genomic RNA of the virus is surrounded by capsid proteins forming the nuclocapsid.
The 5‟ end of the positive sense single strand RNA genome of the virus genome
encodes 4 structural proteins while the 3‟ end encodes 5 structural proteins. The
envelope of the virus is acquired while budding through the plasma membrane and it
surrounds the nucleocapsid. The surface of the envelope is enriched with virus
glycoprotein spikes. ......................................................................................................... 8
Figure 1. 2 Transverse electron micrograph of salmonid alphavirus 1 budding from
CHSE-214 cell culture. ................................................................................................... 11
Figure 2. 1 Schematic representation of the principles of SYBR Green real time PCR
(Adapted from Bustin, 2001). The level of fluorescence increases when it binds to the
double stranded DNA and dissociates upon DNA denaturation. The level of
fluorescence increases in every PCR amplification during extension and is monitored
for quantification in qPCR. ( Double stranded DNA bound to SYBR green and
single stranded DNA ) .................................................................................................... 41
Figure 2. 2 (a) T7 Promoter sequence (b) Attaching RNA polymerase corresponding to
promoter 1 will make the same sequence as the original RNA, also called sense RNA. If
using promoter 2, anti-sense RNA will be transcribed (in-situ hybridization) ............... 49
Figure 2. 3 The development of a cytopathic effect (CPE) on CHSE-214 cells with
SAV1 infected kidney sampled at different times (1-90 Day post infection). None of the
fish were positive for CPE from 21 Day post infection. ................................................. 54
Figure 2. 4 Cytopathic effect (CPE) in three different cell lines inoculated with kidney
homogenate sampled at 3 d.p.i. from SAV1 infected salmon. (a) Non-infected Chinook
salmon embryo-214 (CHSE-214) cells. (b) Infected CHSE-214 cells on 6 day post-
inoculation (d.p.in). (c) Non-infected Chum salmon heart -1 (CHH-1) cells. (d) infected
CHH-1 cells on 6 d.p.in. (e) Non-infected Salmon head kidney-1 (SHK-1) cells. (f)
Infected SHK-1 cells on 20 d.p.in. .................................................................................. 57
Figure 2. 5 Production of a 227 bp PCR product by the primer pair on a 1 % agarose gel
electrophoresis (a) tagged with T7 promotor and (b) un-tagged normal primer and (x)
the 100 bp PCR ladder. ................................................................................................... 58
Figure 2. 6 Results of quantitative reverse-transcription polymerase reaction (qRT-PCR)
for in-vitro transcribed RNA (cRNA) optimization (a) standard curve generated from ct
values (y-axis) versus 10-fold dilution of cDNA derived from cRNA (x-axis), (b) qRT-
PCR amplification curves for ten-fold dilutions of the standards (c,d) dissociation curve
analysis of qRT-PCR of the standard samples. ............................................................... 59
Figure 2. 7 Number of fish positive for SAV by reverse transcription polymerase chain
reaction (RT-PCR) and quantitative real-time reverse transcription polymerase chain
reaction (qRT-PCR) following analysis of kidneys sampled at different times (1-90 day
xviii
post infection) of experimentally induced SAV1 infection. Note no fish were positive
for any of the test by 90 d.p.i .......................................................................................... 62
Figure 2. 8 Copy number of the virus detected by SYBR Green qRT-PCR in fish
infected with SAV positive fish at 1-90 day post infection (d.p.i). Red solid line
indicates the sample mean and the open circles represent positive individual fish. Note
one fish became positive for virus at 42 d.p.i . ............................................................... 63
Figure 3. 1 Schematic representation of virus induced interferon –I (IFN-I) pathway of
vertebrates adapted from Robertsen, (2006). Recognition of virus encoded double
stranded RNA (dsRNA) by the cell activates the transcription factors nuclear factor
kappa B (NF-kB) and interferon regulatory factor – 3 (IRF-3). Nuclear translocation of
phosphorylated IRF-3 and transcriptional co-activator CBP/p300 complex and the NF-
kB initiate the transcription of INF-I associated genes. IFN-I receptors are present in
most vertebrate cells. Binding of secreted INF-I to the Interferon-I receptors (INFRI,
INFR2) on the cell membrane stimulates the Janus kinase (JAK) and thyrosine kinase
(Tyk2) and signals phosphorylation of STAT. The activated STAT coupled with
interferon regulatory factor 9 (IRF9) enters the nucleus. Binding of STAT complex with
interferon-stimulated responsive elements in the promoter regions of interferon-
stimulated genes leads to transcription of antiviral protein (i.e Mx protein). ................. 72
Figure 3. 2 Schematic representation of pathogen (i.e. virus) induced interferon-γ (INF-
γ) pathway adapted from Robertsen, (2006). Both innate and adaptive immune
responses stimulate INF- γ production in vertebrate cells. Natural Killer cells (NK cells)
that are stimulated by interleukin-12 and -18 initiate production of INF- γ as a non-
specific immune response during the innate immune response. In the adaptive-immune
response T-helper cells initiate the production of INF-γ. Coupling of INF-γ to the INF- γ
receptors stimulates the JAK-STAT pathway and results in nuclear translocation of
STAT 1 and STAT 2. Binding of STAT with the specific site of the INF- γ responsive
genes (GAS) in the nucleus initiates the transcription of a wide range of INF- γ
responsive genes resulting in up-regulation of macrophage mediated virus destruction
and antiviral protein (i.e. PKR, OAS) synthesis. ............................................................ 73
Figure 3. 3 Number of fish that had histopathological changes in the heart at different
times (1- 90 Day post-infection). .................................................................................... 82
Figure 3. 4 Light microscopy of H&E stained sections of heart (a) spongy (S) and
compact (C) layers of a healthy heart from a control fish and (b) lower magnification of
multifocal cell infiltration (*),(c) extensive mononuclear cell infiltration (*) in spongy
layer of the ventricle on 14 d.p.i, (d) extensive mononuclear infiltration (M) in
epicardium on 10 d.p.i. of fish experimentally infected with SAV1 (Scale bar a,c =60
µm b = 100 µm, d = 60 µm). .......................................................................................... 83
Figure 3. 5 Light microscopy of H&E stained sections of heart (a) lower magnification
of myocardial degeneration (arrow) of spongy layer on 14 d.p.i (b) higher magnification
of myocardial degeneration (thick arrow) and nuclear pyknosis, and (c) mural thrombi
formation on the endocardial surface (thin arrow) of the ventricle on 14 d.p.i. of fish
experimentally infected with (Scale bar a, c = 60 µm, b = 30)....................................... 84
xix
Figure 3. 6 Mean score for pathological changes in the heart of SAV1 infected fish over
time (1- 90 Day post-infection). ..................................................................................... 85
Figure 3. 7 Number of fish that had histopathological changes in the pancreas over time
(1- 90 Day post-infection) ............................................................................................... 86
Figure 3. 8 Light microscopy of H&E stained sections of the pancreas of Atlantic
salmon. (a) healthy exocrine pancreas (EX) and adjacent adipose tissue (A) of control
fish (b) severe cell rounding and necrosis of exocrine pancreas (arrow head) and
apoptosis (arrow) at 7 d.p.i (c) lower magnification of severe exocrine degeneration
(arrow head) and unaffected endocrine pancreas (EN) with (d) extensive mononuclear
infiltration (*) in the damaged exocrine pancreas 14 d.p.i of fish experimentally infected
with SAV1 (Scale bar a - d = 60 µm) ............................................................................. 87
Figure 3. 9 Light microscopy of H&E stained sections of the pancreas of Atlantic
salmon (a) severe loss of exocrine pancreas with mild mononuclear cell infiltration at 21
d.p.i, (b) complete absence of exocrine pancreas on 21 (c) undamaged endocrine
pancreas (EN) with complete absence of exocrine pancreas at 21 d.p.i and (d) exocrine
pancreas recovery with mild fibroplasia (FI) in adipose tissue in fish experimentally
infected SAV1 (Scale bar a, c = 60 µm, b = 30) ............................................................. 88
Figure 3. 10 Mean score for pathological changes in the pancreas of SAV1 infected fish
over time (1- 90 Day post-infection). ............................................................................. 90
Figure 3. 11 Kinetics of real time RT-PCR expression of (a) interferon-I, (b) Mx protein
and (c) INF-II in kidney of fish injected intra-peritoneally with salmonid alphavirus 1
compared to the control injected with cell culture supernatant. The data represent the
average expression level ± SE relative to translation elongation factor 1α (n=5).
Statistical significance levels have been indicated (* ) (P ≤ 0.05). ................................ 91
Figure 3. 12 Immunohistochemistry study of Mx protein expression in the heart of
Atlantic salmon. (a) Lower magnification and (b) higher magnification of the ventricle
in the control fish with no Mx staining. (c) Diffuse immunostaining in the spongy (S)
and compact layer (C). Note the venus arteriosus (Vs) with no staining (VS) (d) diffuse
staining in the spongy myocardium of the ventricle at 10 d.p.i. (e) accumulation of
staining around the nuclei of cardiomyocytes and (f) Higher magnification of the
spongy myocardium with diffuse immunostaining at 10 d.p.i. in fish experimentally
infected with SAV1 (Scale bar a, d = 60 µm, b,e & f =30 µm and c= 4 µm) ................ 93
Figure 3. 13 Mean score ±SE of immunohistochemistry staining for Mx protein in the
heart over the time. The significant difference between SAV 1 infected and control fish
(p ≤0.05) at each time point and between previous time point of sampling are denoted
by * and • respectively. ................................................................................................... 94
Figure 3. 14 Immunohistochemistry study of Mx protein in the kidney of Atlantic
salmon (a) Control and (b) infected with SAV1 at 1d.p.i (c) control and (d) infected at 3
d.p.i (e) control and (f) infected at 7 d.p.i. Note higher degree of staining in the infected
fish compared to control and the accumulation of stain in the tubular system at all three
time points of sampling. (Scale bar 60 µm) .................................................................... 95
xx
Figure 3. 15 Mean score ± SE of Mx protein expression in the kidney over the time
(n=5). The significant difference between infected with SAV1and control fish (p≤0.05)
at each time point is denoted by *. .................................................................................. 96
Figure 3. 16 Immunohistochemistry staining of Mx protein expression of control and
exprimentallty infected with SAV1 of Atlantic salmon gill. Gill filaments at 5 d.p.i (a)
control with mild (b) SAV1 infected fish moderate staining and 10 d.p.i (c) control with
mild (d) SAV1 infected with diffuse staining. Note goblet cells with high intensity of
staining. (Scale bar a, b & c,= 60 µm, d = 30 µm) ......................................................... 97
Figure 3. 17 Mean score ± SE of Mx protein expression in the gill over time (n=5). The
significant difference between infected with SAV1 and control fish (p≤0.05) at each
time point is denoted by *. .............................................................................................. 98
Figure 3. 18 Immunohistochemistry (IHC) staining of Mx protein in the skin of Atlantic
salmon at 3 d.p.i. (a) Mild staining in control fish and intense staining in the skin of
SAV1 infected fish (b) lower magnification and (c) higher magnification at 3 d.p.i. Note
IHC staining is mainly accumulated around the goblet cells. ......................................... 99
Figure 3. 19 Mean score ± SE of Mx protein expression in the skin over time (n=5).
The significant difference between SAV1 infected and control fish (p≤0.05) at each
time point is denoted by *. ............................................................................................ 100
Figure 4. 1 The gene expression of SAV1 exposed verses un-exposed fish. Normalized,
differentially expressed genes (significant and non-significant ) identified by
volcano plots. Genes with p-values < 0.05 and log2 expression ratios were plotted
against log10 expression ratio for the three different time points (a) 1 d.p.i, (b) 3 d.p.i and
(c) 5 d.p.i. ...................................................................................................................... 121
Figure 4. 2 Heat map of significantly, differentially expressed, cellular stress associated
genes of Atlantic salmon head kidney during an experimentally induced salmonid
alphavirus infection. Columns represent time points with significantly, differentially
expressed genes of challenged fish compared to un-challenged fish at 1, 3, and 5 d.p.i.
Shades of red denotes gene up-regulation and green denotes down-regulation. Note, the
numeric in each box indicate the fold change of the particular gene at the given time
point. ............................................................................................................................. 122
Figure 4. 3 Heat map of significantly, differentially expressed, cellular transport and
vesicular trafficking associated genes of Atlantic salmon head kidney during an
experimentally induced salmonid alphavirus infection. Columns represent time points
with significantly, differentially expressed genes of challenged fish compared to un-
challenged fish at 1, 3, and 5 d.p.i. Shades of red denotes gene up-regulation and green
denotes down-regulation. Note, the numeric in each box indicate the fold change of the
particular gene at the given time point. ......................................................................... 123
Figure 4. 4 Heat map of significantly, differentially expressed, cellular transcription,
translation and metabolism associated genes of Atlantic salmon head kidney during an
experimentally induced salmonid alphavirus infection. Columns represent time points
with significantly, differentially expressed genes of challenged fish compared to un-
xxi
challenged fish at 1, 3, and 5 d.p.i. Shades of red denotes gene up-regulation and green
denotes down-regulation. Note, the numeric in each box indicate the fold change of the
particular gene at the given time point. ......................................................................... 124
Figure 4.5 Heat map of significantly, differentially expressed, innate immune
recognition associated genes of Atlantic salmon head kidney during an experimentally
induced salmonid alphavirus infection. Columns represent time points with
significantly, differentially expressed genes of challenged fish compared to un-
challenged fish at 1, 3, and 5 d.p.i. Shades of red denotes gene up-regulation and green
denotes down-regulation. Note, the numeric in each box indicate the fold change of the
particular gene at the given time point. ......................................................................... 126
Figure 4. 6 Heat map of significantly, differentially expressed, adaptive immune
recognition associated genes of Atlantic salmon head kidney during an experimentally
induced salmonid alphavirus infection. Columns represent time points with
significantly, differentially expressed genes of challenged fish compared to un-
challenged fish at 1, 3, and 5 d.p.i. Shades of red denotes gene up-regulation and green
denotes down-regulation. Note, the numeric in each box indicate the fold change of the
particular gene at the given time point. ......................................................................... 127
Figure 4. 7 Heat map of significantly, differentially expressed, virus induced genes of
Atlantic salmon head kidney during an experimentally induced salmonid alphavirus
infection. Columns represent time points with significantly, differentially expressed
genes of challenged fish compared to un-challenged fish at 1, 3, and 5 d.p.i. Shades of
red denotes gene up-regulation and green denotes down-regulation. Note, the numeric in
each box indicate the fold change of the particular gene at the given time point. ........ 129
Figure 4. 8 Heat map of significantly, differentially expressed, apoptosis associated
genes of Atlantic salmon head kidney during an experimentally induced salmonid
alphavirus infection. Columns represent time points with significantly, differentially
expressed genes of challenged fish compared to un-challenged fish at 1, 3, and 5 d.p.i.
Shades of red denotes gene up-regulation and green denotes down-regulation. Note, the
numeric in each box indicate the fold change of the particular gene at the given time
point. ............................................................................................................................. 130
Figure 4. 9 Quantitative RT-PCR (qRT-PCR) of selected genes. The results of 9
significantly differentially regulated genes from microarray analysis were validated by
qRT-PCR. The relative expression ratios (Log 2) of infected fish were calculated
compared to control fish by the ΔΔct method. Both control and infected fish expression
values were normalised using three housekeeping genes; translation elongation factor 1,
Beta actin (actin) and flat liner Coffilin. (Chemokine CC like protein, CHC-CC,
Interferon stimulated gene-15 (ISG-15), Interferon regulatory factor 2 (INFR2), Major
histocompatability class_I (MHC_I), Virus induced protein TC (TC-VIP), Serum
amyloid (SAA), B-cell lymphoma associated -2 (BCL-2), Zinc-finger protein (ZFP),
Apoptosis regulatory factor (APOPREG) ..................................................................... 132
Figure 5. 1 Schematic diagram of genome replication and protein synthesis of
alphaviruses (adapted from Strauss & Strauss, 1994). Genomic RNA (+) consisting of
two open reading frames. RNA for non-structural proteins and structural proteins are
xxii
transcribed into viral encoded (-) strand complementary RNA. Synthesis of RNA for
poly-protein P1234 (shown above the genomic RNA) codes for 4 non-structural
proteins nsP1-4 and RNA for poly-protein c-p62-6K-E1 codes for structural protein E1-
E3, C capsid, protein 6K (shown below the Genomic RNA). ...................................... 148
Figure 5. 2 Growth curve of SAV-1 isolate F93-125 in CHSE-214 cells. Virus
supernatant without cells and with cells after a single freeze-thawing cycle were
harvested at 1-21 Day post infection and back titrated on CHSE-214 cells in order to
determine the TCID50 of the extra-cellular and total virus respectively. The amount of
cell-associated virus was extrapolated by subtracting extra-cellular virus from the total
virus yield. .................................................................................................................... 154
Figure 5. 3 Transmission electron micrograph of CHSE-214 cells inoculated with
SAV1. (a) An early endosome (EE) near to the plasma membrane and the nucleus (N) at
4 h.p.in, (b) multiple EE in the cytoplasm, enriched with electron dense particles,
presumably internalised virus particles at 4 h.p.in. and (c) large vacuoles enriched with
amorphous material suggestive of late endosomes (LE) at 8 h.p.in. ............................ 156
Figure 5. 4 Transmission electron micrograph of CHSE-214 cells inoculated with SAV1
at 8 h.p.in (a) Early endosomes (EE) with few intact looking viruses, and (b) Late
endosomes (LE) enriched with degenerating material called a residual body (*) with
vesicles at the periphery (white arrows). ...................................................................... 157
Figure 5. 5 Ultra-structure of membrane associated replication complexes of SAV1 in
CHSE-214 cells at 24 h.p.in (a) a typical alphavirus replication complex with cytopathic
vacuoles (CPV) in association with rough endoplasmic reticulum (RER). .................. 158
Figure 5. 6 Ultra-structure of membrane associated replication complexes of SAV-1 in
CHSE-214 cells at 24 h.p.in (a) Spherules (SP) with electron dense centre and neck
continuing to cytoplasm (arrow). Note rough endoplasmic reticulum (RER) around the
CPV, (b) Spherules (SP) associated with fuzzy coated vesicles forming a CPV and the
adjacent RER and (c) CPV II with spherules (thin arrow) note that there was no CPV-
RER association and also the virus budding from plasma membrane (thick arrow). ... 159
Figure 5. 7 Transmission electron micrograph of SAV1 infected CHSE-214 cells at 24
h.p.in. (a) lower magnification of the cytoplasm with multiple prominent Golgi-
apparatus (G) and fuzzy-coated vesicle (FZV) (b) Formation of fuzzy coated vesicles
from the Golgi cistern (C) and fuzzy coated vesicles (FZV) (c) A vesicles with fuzzy
coat (FZV) near to the plasma membrane. ................................................................... 160
Figure 5. 8 Transmission electron micrographs of CHSE-214 cells inoculated SAV1 (a)
Virus budding (arrow) through a membrane projection and a complete virion (V) at 24
h.p.in, (b) budding virus (arrow) and mature virions (V) near to a coated pit (CP) ..... 161 Figure 5. 9 Transmission electron micrographs of CHSE-214 cells inoculated with
SAV1 at 48 h.p.in. (a) Lower magnification and (b) higher magnification of multiple
virus buds (arrow) along the plasma membrane. .......................................................... 162
Figure 5. 10 Transmission electron micrograph of negatively stained SAV1.
Supernatant from CHSE-214 infected with the virus for 7 days was clarified and
pelleted. The cell pellet was stained with 2 % phosphotungstic acid. Note the globular
xxiii
nature of the virus particles which were surrounded by surface projections. Some
disrupted virus particles were also noted (D) ............................................................... 163
Figure 6. 1 A simplified schematic illustration of the caspase mediated apoptotic
pathway. Please see the text for description. DISC (death inducing signaling complex),
FasL (fas-ligand) and Apaf-1 (apoptotic protease activating factor-1) are involved in the
process .......................................................................................................................... 173
Figure 6. 2 Transmission electron micrographs of CHH-1 cells (a) negative control at 24
h p.in. and infected with SAV1 (b) 24 (c) & (d) 48 h p.in. (b, c & d) Progressive
chromatin condensation (arrow) and chromatin margination (dashed arrow) were
noticed in the nucleus (N) of the virus infected cells characteristic of cells undergoing
death. (c) Apoptosis (AP) was seen at 48 h.p.in with electron dense micronuclei. ..... 183
Figure 6. 3 Transmission electron micrograph of (a) CHSE-214 and (b) CHH-1 cells
infected with SAV-1 at 48 h p.in. with severe progressive apoptosis characterised by
formation of apoptotic bodies (arrow) and electron dense micronuclei (*). Nuclear
chromatin condensation (thick arrow) was noticed in some of the cells that still
maintained the cellular architecture. Nucleus (N). ....................................................... 184
Figure 6. 4 Scanning electron micrographs of CHSE-214 cells at 48 h.p.in. (a) Mock
infected cells, (b & c) SAV1 infected cells with (c) cellular blebbing suggesting
apoptosis. ...................................................................................................................... 185
Figure 6. 5 Electrophoresis of DNA from CHH-1 cells and SAV1 infected CHH-1 cells
on 1.2% agarose gel (1) uninfected control 0h, (2)-(6) mock infected and harvested at
4h, 8h, 24h, 48h, 96 h p.in and (7-11) SAV-1 infected and harvested at 4h, 8h, 24h, 48h,
96 h p.in. Lane 12 100 bp ladder. ................................................................................. 186
Figure 6. 6 Confocal micrograph of CHH-1 cells. (a-b) Mock infected cells, and the
cells infected with SAV1 isolates F02-143 (c-d) and P42p (e-f) at 3 d.p.in. Cell
rounding (red arrow) was seen in F02-143 (c) and P42p (e) infected cells in the gray
channel and nuclear fragmentation and a high level of caspase-3 expression (red arrow)
in (d) F02-143 and (e) P42p infected cells ................................................................... 187
Figure 6. 7 SAV infection can induce cell death in CHH-1 cells. Confocal microscope
images of (a-d) control cells and (e-h) SAV1 (F02-143 isolate) infected cells under
different laser channels; (a) control (e) infected cells with irregular cellular margins and
blebbing (white arrow) in the gray channel (b) normal nuclei (yellow arrow) of control
and (f) damaged and fragmented nuclei (red arrow) of infected cells stained with
Hoechst 33258 in the blue channel, (c) control and (g) infected cells stained with Texas
red to visualise caspase-3 expression (green arrow) in the red channel and the overlay of
double fluorescent staining (d) control and (h) infected cells undergoing apoptosis
(white arrow) at 5 d.p.in. (Nuclear stain Hoechst 33258 and caspase 3 Texas red). .... 188 Figure 6. 8 Confocal microscope image of CHH-1 cells infected with F02-143 SAV1
isolate at 3 d.p.in. The damaged nuclei were either misshapen (white arrow) or
fragmented (red arrow). Cells with damaged nuclei showed a high level of caspase-3
expression. (Nuclear stain Hoechst 33258 and caspase 3 Texas red). .......................... 189
xxiv
Figure 6. 9 Confocal micrographs of control and SAV1 infected CHH-1 cells at 7 d.p.in.
Control cells (a-c), and SAV1 infected cells with isolate F02-143 (d-f) and isolate
P42p (g-i) isolate at 7 d.p.in. Compared to control cells (a) nuclei of infected cells were
severely damaged and fragmented (d & g) and a high level of caspase-3 expression was
noted in the F02-143 (e) and P42p (h) infected cells. The cells with damaged nuclei
were saturated with caspase-3 indicating ongoing apoptosis (f & i) compared to
uninfected cells (c) in the overlay. (Nuclear stain Hoechst 33258 and caspase 3 Texas
red) ................................................................................................................................ 190
Figure 6. 10 The mean nuclear size obtained from image analysis of control (mock) and
SAV1 infected (P42p and F02-143) CHH-1 cells at 1, 3, 5, and 7 days post infection. It
was significantly different (p≤ 0.05) between control and infected P42p (*) and F02-143
() at all sampling points. The mean nuclear size of the virus infected cells infected with
isolates P42p and the F02-143 were significantly different (p≤ 0.05) at 1 and 5 days post
infection (••). (Error bars ± Standard error of mean) .................................................... 191
Figure 6. 11 The mean caspase intensity obtained from image analysis of control
(mock) and SAV1 infected (P42p and F02-143) CHH-1 cells at 1, 3, 5, and 7 days post
infection (Error bars ± Standard error of mean) …………………………………… 193
xxv
List of Tables
Table 1.1 Geographical distribution and natural and experimental hosts of different
SAV subtypes (Fringuelli et al., 2008). .......................................................................... 10
Table 1.2 A diagnostic panel for PD, adapted from McLoughlin & Graham (2007). .... 17
Table 2. 1 Thermal cycling conditions used in the Techne Quantica® Thermal cycler for
the qRT-PCR assay to quantify SAV. ............................................................................ 52
Table 2. 2 Development of a cytopathic effect in Chinook salmon embryo cells (CHSE-
214), Chum salmon heart -1 (CHH-1) and Salmon head kidney -1 (SHK-1) cells during
primary virus isolation, absorbing kidney homogenate of fish and the subsequent two
passages of the virus (n=5). CHSE-214 and CHH-1 cell cultures were harvested at 10
day post-inoculation on passage 1 and 2, and therefore no data are available after this
time point. Samples derived from SHK-1 cells were not used for viral titre estimation
and the experiment was stopped after passage 1. P0- Primary inoculation, P1-Passage 1,
P2-Passage 2. .................................................................................................................. 56
Table 2. 3 Reproducibility of qRT-PCR for SAV with primer 227 using cDNA derived
from in-vitro transcribed cRNA for three different runs. (Ct-cycle – threshold, R2 -
correlation coefficiency, E - efficiency, S.D.- standard deviation, CV% - coefficincy of
variation). ........................................................................................................................ 60
Table 2. 4 Dissociation curve (Tm value) analysis for the dilutions used to prepare the
standard curve for three runs. (SD – standared deviation) ............................................. 61
Table 3. 1 The scale that developed by Christie et al., (2007) was used (with
modifications) to score the lesions in the heart and the pancreas of Atlantic salmon
infected with SAV1. ....................................................................................................... 77
Table 3. 2 Thermal cycling conditions used in the Techne Quantica® Thermal cycler for
the qRT-PCR assay to quantify INF-I associated genes. ................................................ 78
Table 3. 3 Primer sequences for different genes, product size (amplicon bp),
temperature and optimized efficiency of the qRT-PCR assay used to demonstrate INF
pathway associated gene expression during SAV1 infection in Atlantic salmon.
Translation elongation factorv 1α was used as the house keeping gene to quantify
relative expression of INF-I, Mx protein and INF II. The primer name denotes the
forward (F) and reverse (R) sequence. ............................................................................ 79
Table 4. 1 Primers used for quantitative reverse transcription PCR (qRT-PCR). ........ 118
Table 4. 2 Microarray and qRT-PCR fold changes (FC) of the transcripts used for qRT-
PCR assay ..................................................................................................................... 133
Table 6. 1 Properties of the fluorescent dyes used to measure different apoptotic targets.
...................................................................................................................................... 180
1
Chapter 1
General Introduction
1.1 Background
The overall expectation of this thesis was to explore the mechanisms of disease
associated with salmonid alphavirus 1 (SAV1) infection in Atlantic salmon (Salmo
salar L.) and in established salmonid cell lines, with a special emphasis on the immune
response of infected fish. Salmonid alphaviruses have caused severe losses to the
European salmon farming industry during recent years, although the actual loss to the
industry still remains to be disclosed. Host–pathogen interactions and the defence
mechanisms against SAV infections are still poorly understood. Understanding the
mechanisms of the disease at a cellular and molecular level, in relation to the
environment in which the host lives, will help in improving current management
practices (Slauson & Cooper, 2002). This may also assist in the development of new
strategies for controling and preventing SAV-associated disease, and ultimately
eradicate the disease. Such strategies will hopefully ensure healthy stocks and the
sustainability of the aquaculture industry while achieving production targets.
1.2 Fish health and fish viral diseases in global aquaculture
Global aquaculture production has increased tremendously during the last five decades
(Liu & Sumalia, 2007) supplying half of the seafood demand globally for human
consumption in 2008 (FAO, 2008). Aquaculture is also regarded as the fastest growing
2
food animal industry in the world at present. Atlantic salmon is the most popular
cultured species in coldwater, marine aquaculture. Farmed salmon production has
steadily increased over the last few decades, achieving live-weight production from 500
tons in 1970 to over 1.3 million tons in 2005, and accounting for 11 % of the overall
harvest of aquaculture in 2008 (FAO, 2008). The leading salmon producers in the
world, Norway, Chile, UK and Canada together provide over 85 % of the total world
farmed salmon (Liu & Sumalia, 2007). This impressive level of growth is in part
attributed to the decline in wild marine fisheries resources (Gozlan et al., 2006) and the
emergence of welfare and conservation concerns of wild fish stocks, in addition to the
increase in global fish and shellfish consumption because of the emphasis given to
healthy eating habits.
Diseases are the cause of the most significant losses to the aquaculture industry, losses
of the entire stock sometimes occurring over a few days. Viral diseases are a major
threat to the industry and several new viral diseases have been described in salmon
aquaculture following commercialisation of the species (Hogstad, 1993; Gozlan et al.,
2006; Liu & Sumalia, 2007). Therefore, effective fish health management plays a vital
role in maintaining the sustainability of the industry, and has been given much more
consideration in recent decades (Adams & Thompson, 2006). The viruses that cause
enzootics in aquaculture may be present naturally in the environment, or may have been
introduced in to the site (Gozlan et al., 2006). As an example, many of the newly
emerged viral diseases such as Infectious Salmon Anaemia Virus (ISAV) and SAV in
salmon were identified only after commercialisation of the industry a few decades ago,
and were designated as diseases with „unknown aetiology‟ initially. This suggests that
3
these viruses were already present in the environment without causing any disease, but
optimisation of the conditions for fish farming may have also optimised the conditions
for virus replication and transmission and in turn become epizootics. A recent report
indicated that at least 94 pathogenic agents of known aetiology have been introduced to
European waters via stock movements during recent aquaculture intensification (Gozlan
et al., 2006). Therefore health and wellbeing of fish in aquaculture needs close
monitoring with the introduction of effective disease control strategies.
The increased occurrence of viral disease in hatcheries and during the grow-out stages
of salmon farming could result from increased stress and high stocking densities used in
the intensified farming system. Poor hygiene measures, improper disease monitoring
programmes and poor bio-security increases the risk of disease outbreaks (Murray &
Peeler, 2004). Viral infections that originate in the farming environment not only
threaten other farmed fish but also wild fish and fisheries, thus leading to increasing
concerns by animal welfare groups (Gozlan et al., 2006).
The reports of viral diseases in fish date back to the middle ages. In the text relating fish
diseases published in 1904 by Bruno Hofer of Germany, the person who was considered
to be the father of fish pathology, noted that reports of carp pox were documented as
early as in 1563 by a mediaeval zoologist K. Von Genser (Wolf, 1988). Although little
was known about viral diseases of fish up until 30 years ago, our knowledge of fish
viral diseases has increased impressively during the last two decades At present, the
viruses known to be pathogenic to fish are divided into 11 families, including two
families of DNA viruses (Family Iridoviridae and Herpesviridae) and nine families of
RNA viruses (Picornaviridae, Birnaviridae, Reoviridae, Rhabdoviridae,
4
Orthomyxoviridae, Paramyxoviridae, Retroviridae, Coronaviridae and Togaviridae).
Emergence of diseases associated with RNA viruses in fish has increased the attention
of public and veterinary bodies. The fish disease commission of the Office International
des Epizooties (OIE), France has elaborated the fish diseases that have a socio-
economic and public health impact on aquatic animals transported internationally and
aquatic animal products. However, some of the newly emerged diseases that cause
severe damage to the industry such as SAV, are not listed as notifiable by OIE, possibly
due to the lack of information on the economic importance of the disease and the extent
of its global importance and geographic distribution. However, SAV is classified as a
notifiable disease by the Food Safety Authority in Norway, the major salmon producing
country in the world (Graham et al., 2008; Viljugrein et al., 2009; Aldrin et al., 2010).
1.3 Alphavirus (Family Togaviridae)
The alphaviruses, of the family Togaviridae, are a group of RNA viruses with a world
wide distribution with the exception of Antarctica (Strauss & Strauss, 1994).
Alphaviruses have been isolated and identified from both vertebrates and invertebrates.
Typically, alphaviruses are transmitted by an arthropod vector (i.e. mosquitoes of Aedes
and Culex families and haematophagus arthropods such as mites, bugs and ticks), with
the exception of teleost alphaviruses. At least 27 serologically distinct alphavirus
species have been reported causing different diseases in vertebrates (Klimstra & Ryman,
2009). Alphaviruses can replicate in a broad range of vertebrate hosts, including
mammals, birds, reptiles and fish. Birds and small mammals serve as the natural
reservoirs for the virus, while humans act as a dead-end host in the life cycle of the virus
(Strauss & Strauss, 1994). The diseases caused by alphaviruses are associated with
either encephalitis (Eastern equine encephalitis EEE, Venezuelan equine encephalitis
5
VEE, Western equine encephalitis WEE) or poly-arthritis (Chikungunya, O‟Nyong-
Nyong, Ross river, Sindbis, Semliki forest) (Powers et al., 2001). SAV is the only
alphavirus so far reported to cause disease in fish (McLoughlin & Graham, 2007) and is
considered to be atypical, with the ability of cross transmission between hosts,
independently from vectors during the life cycle, compared to the classical arthropod
borne alphavirus life cycle of other vertebrates (McLoughlin & Graham, 2007).
1.4 Salmonid alphavirus
1. 4. 1 Diseases caused by salmonid alphaviruses
Salmonid alphaviruses cause a severe, multi-systemic disease in farmed Atlantic salmon
and rainbow trout (Oncorhynchus mykiss Walbaum) and are a newly emmerged group
of viruses in Europe. They have been classified into six genotypically and
geographically distinct subtypes; i.e. SAV1 (Weston et al., 1999), SAV2 (Villoing et
al., 2000a), SAV3 (Hodneland et al., 2005) and SAV 4, 5, and 6 (Fringuelli et al.,
2008). Subtypes (SAV1, 3, 4, 5 and 6) are responsible for causing pancreas disease
(PD) in Atlantic salmon, while SAV2 causes sleeping disease (SD) in fresh water reared
rainbow trout and Atlantic salmon at seawater phase in Scotland, and SAV3 causes
Norwegian salmon pancreas disease (NSPD) in Atlantic salmon and rainbow trout in
Norway (Fringuelli et al., 2008; Graham et al., 2010). Subtypes SAV1, 2, 4 and 5 have
been found in the UK, and SAV1, 4 and 6 are reported as causing outbreaks in Ireland.
The third sub type, SAV3, has only been reported from Norway (Hodneland et al.,
2005; Hodneland & Endresen, 2006; Fringuelli et al., 2008). Apart from Europe, PD
had been reported once in the USA (Kent & Elston, 1987) and toga-like virus particles
have been found associated with a disease outbreak reported as a dual infection with
ISAV and alphavirus in salmon in New Brunswick, Canada (Kibenge et al., 2000).
6
However, neither virus isolation nor sequence identity was attempted on samples taken
during these outbreaks (McLoughlin & Graham, 2007; Graham et al., 2010).
The conditions occurring in farmed Atlantic salmon referred to as exocrine pancreas
disease (Munro et al., 1984; McLoughlin & Graham, 2007; Graham et al., 2010),
polymyopathy syndrome and sudden death syndrome (Rodger, 1991) are all thought to
be PD, named differently because of the variation seen in clinical and histopathology
signs (McLoughlin & Graham, 2007). The different subtypes that have now been
identified based on sequencing viral RNA shows sequence homogeneity to the other
alphaviruses.
Pancreas disease or salmon pancreas disease (SPD) of farmed Atlantic salmon has been
reported as occurring in Scotland since 1976 (Munro et al., 1984; McVicar, 1987,
Wheatley et al., 1994). For some time the nature of the disease and the clinical signs
associated with it led scientists to believe that the disease was of viral aetiology
(McVicar, 1987; Raynard & Houghton, 1993), although the actual agent that was
responsible for the disease, a Toga-like virus, was only isolated in Ireland by Nelson
and others in 1995 by co-cultivating the head kidney of diseased fish in CHSE -214
cells (Nelson et al., 1995). The virus that causes salmon pancreas disease (SPDV) was
later identified as an alphavirus of the family Togaviridae (Weston et al, 1999). The
biochemical characteristics of SPDV were similar to many other alphaviruses (Welsh et
al., 2000). Two of the major proteins of the virus with molecular weights of 55 kDa and
50 kDa were identified as E1 and E2 glycoproteins (Weston et al., 1999; Welsh et al.,
2000) (Figure 1.1).
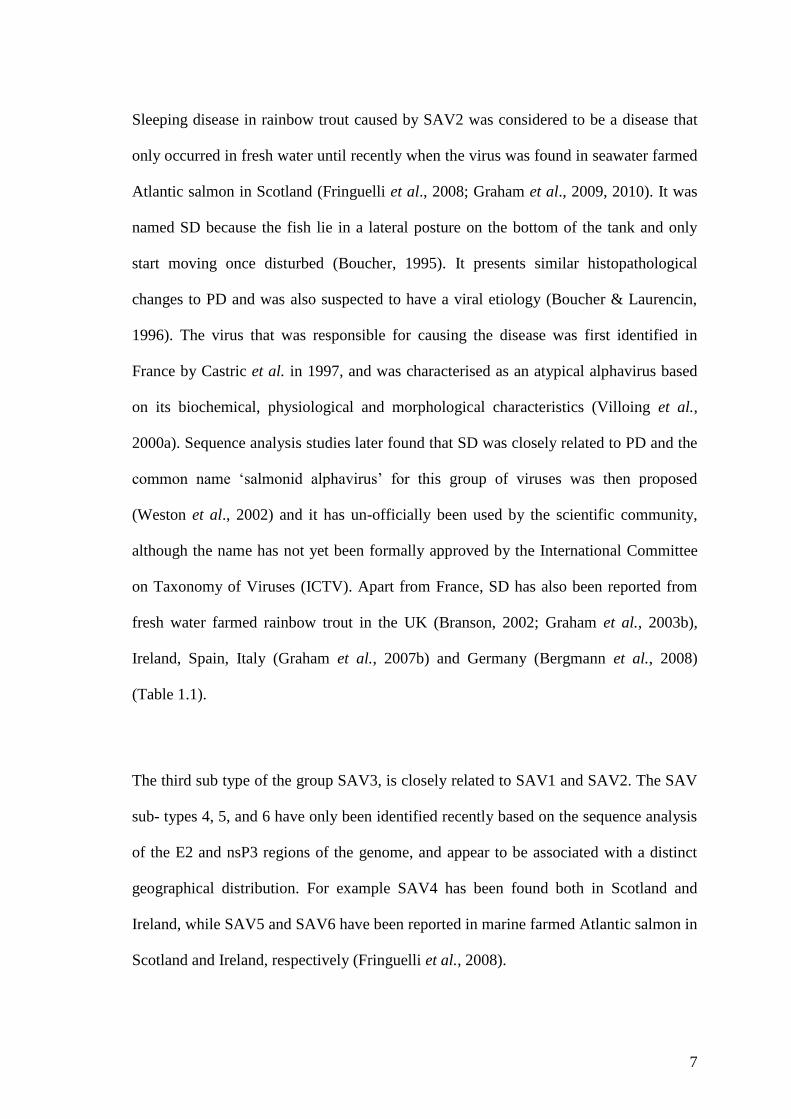
7
Sleeping disease in rainbow trout caused by SAV2 was considered to be a disease that
only occurred in fresh water until recently when the virus was found in seawater farmed
Atlantic salmon in Scotland (Fringuelli et al., 2008; Graham et al., 2009, 2010). It was
named SD because the fish lie in a lateral posture on the bottom of the tank and only
start moving once disturbed (Boucher, 1995). It presents similar histopathological
changes to PD and was also suspected to have a viral etiology (Boucher & Laurencin,
1996). The virus that was responsible for causing the disease was first identified in
France by Castric et al. in 1997, and was characterised as an atypical alphavirus based
on its biochemical, physiological and morphological characteristics (Villoing et al.,
2000a). Sequence analysis studies later found that SD was closely related to PD and the
common name „salmonid alphavirus‟ for this group of viruses was then proposed
(Weston et al., 2002) and it has un-officially been used by the scientific community,
although the name has not yet been formally approved by the International Committee
on Taxonomy of Viruses (ICTV). Apart from France, SD has also been reported from
fresh water farmed rainbow trout in the UK (Branson, 2002; Graham et al., 2003b),
Ireland, Spain, Italy (Graham et al., 2007b) and Germany (Bergmann et al., 2008)
(Table 1.1).
The third sub type of the group SAV3, is closely related to SAV1 and SAV2. The SAV
sub- types 4, 5, and 6 have only been identified recently based on the sequence analysis
of the E2 and nsP3 regions of the genome, and appear to be associated with a distinct
geographical distribution. For example SAV4 has been found both in Scotland and
Ireland, while SAV5 and SAV6 have been reported in marine farmed Atlantic salmon in
Scotland and Ireland, respectively (Fringuelli et al., 2008).
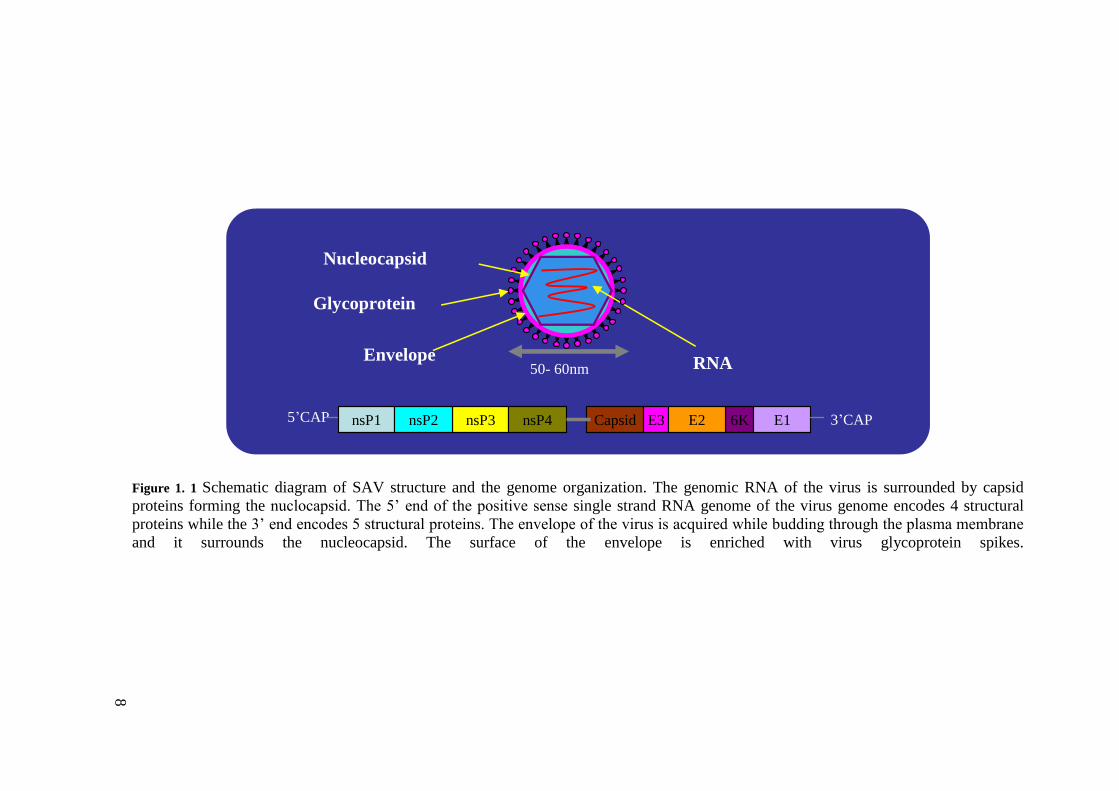
8
Figure 1. 1 Schematic diagram of SAV structure and the genome organization. The genomic RNA of the virus is surrounded by capsid
proteins forming the nuclocapsid. The 5‟ end of the positive sense single strand RNA genome of the virus genome encodes 4 structural
proteins while the 3‟ end encodes 5 structural proteins. The envelope of the virus is acquired while budding through the plasma membrane
and it surrounds the nucleocapsid. The surface of the envelope is enriched with virus glycoprotein spikes.
Glycoprotein
Nucleocapsid
RNAEnvelope
50- 60nm
3‟CAPnsP1 nsP3nsP2 nsP4 Capsid E3 6KE2 E15‟CAP
Glycoprotein
Nucleocapsid
RNAEnvelope
50- 60nm
3‟CAPnsP1 nsP3nsP2 nsP4 Capsid E3 6KE2 E15‟CAP
89
9
These genetically and geographically distinct SAV sub-types cross-react serologically
with each other, and it is therefore impossible to distinguish them from one another,
unless sequencing or highly-sensitive molecular methods such as qRT-PCR are used.
Cross infection in Atlantic salmon, rainbow trout and brown trout with SAV1, SAV2
and SAV3 has also been demonstrated experimentally (Table 1.1). As PD and SD
occurred in sea water and freshwater under natural condtions in salmon and rainbow
trout respectively has allowed differential diagnosis of these two conditions from each
other under natural conditions, but this has now changed with the recent identification
of SAV2 from Atlantic salmon in sea water in Scotland (Fringuelli et al., 2008).
1. 4. 2 Salmonid alphavirus structure
Sequencing of the 3‟ end of the SAV genome has demonstrated the presence of a
conserved sequence typical of alphaviruses (Weston et al., 1999, 2002; Villoing et al.,
2000a; Fringuelli et al., 2008). Mature virions are approximately 65.5 ± 4.3 nm
diameter (Nelson et al., 1995) and are composed of a positive sense, single stranded
RNA (+ssRNA) genome packed with capsid protein forming the nucleocapsid of the
virus. The capsid proteins of classical alphaviruses are arranged in pentamers and
hexamers to form T=4 icosahedral symmetry (Strauss and Strauss, 1994; Cann, 2005).
The nucleocapsid of the virus is enveloped with a phospholipid bilayer, the composition
of which resembles the host plasma membrane. The viral glycoproteins are anchored to
the envelope and appear as spikes (Figure 1.1)
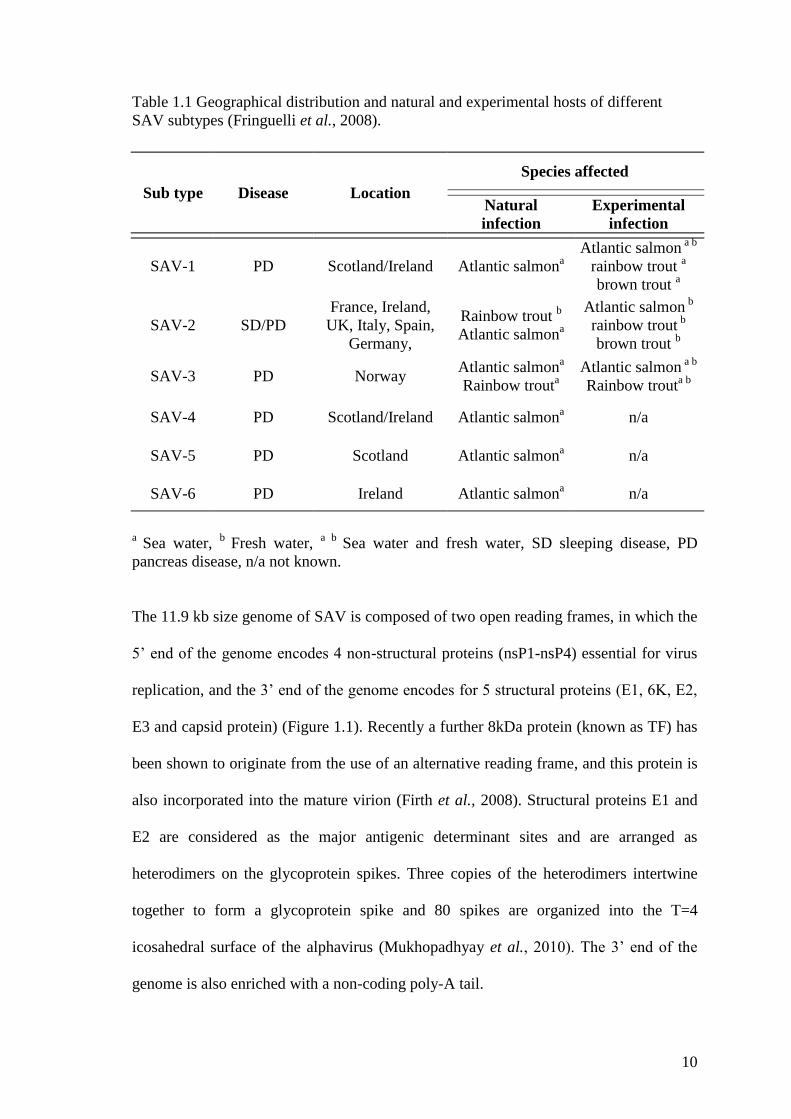
10
Table 1.1 Geographical distribution and natural and experimental hosts of different
SAV subtypes (Fringuelli et al., 2008).
Sub type Disease Location
Species affected
Natural
infection
Experimental
infection
SAV-1 PD Scotland/Ireland Atlantic salmona
Atlantic salmon a b
rainbow trout a
brown trout a
SAV-2 SD/PD
France, Ireland,
UK, Italy, Spain,
Germany,
Rainbow trout b
Atlantic salmona
Atlantic salmon b
rainbow trout b
brown trout b
SAV-3 PD Norway Atlantic salmon
a
Rainbow trouta
Atlantic salmon a b
Rainbow trouta b
SAV-4 PD Scotland/Ireland Atlantic salmona n/a
SAV-5 PD Scotland Atlantic salmona n/a
SAV-6 PD Ireland Atlantic salmona n/a
a Sea water,
b Fresh water,
a b Sea water and fresh water, SD sleeping disease, PD
pancreas disease, n/a not known.
The 11.9 kb size genome of SAV is composed of two open reading frames, in which the
5‟ end of the genome encodes 4 non-structural proteins (nsP1-nsP4) essential for virus
replication, and the 3‟ end of the genome encodes for 5 structural proteins (E1, 6K, E2,
E3 and capsid protein) (Figure 1.1). Recently a further 8kDa protein (known as TF) has
been shown to originate from the use of an alternative reading frame, and this protein is
also incorporated into the mature virion (Firth et al., 2008). Structural proteins E1 and
E2 are considered as the major antigenic determinant sites and are arranged as
heterodimers on the glycoprotein spikes. Three copies of the heterodimers intertwine
together to form a glycoprotein spike and 80 spikes are organized into the T=4
icosahedral surface of the alphavirus (Mukhopadhyay et al., 2010). The 3‟ end of the
genome is also enriched with a non-coding poly-A tail.
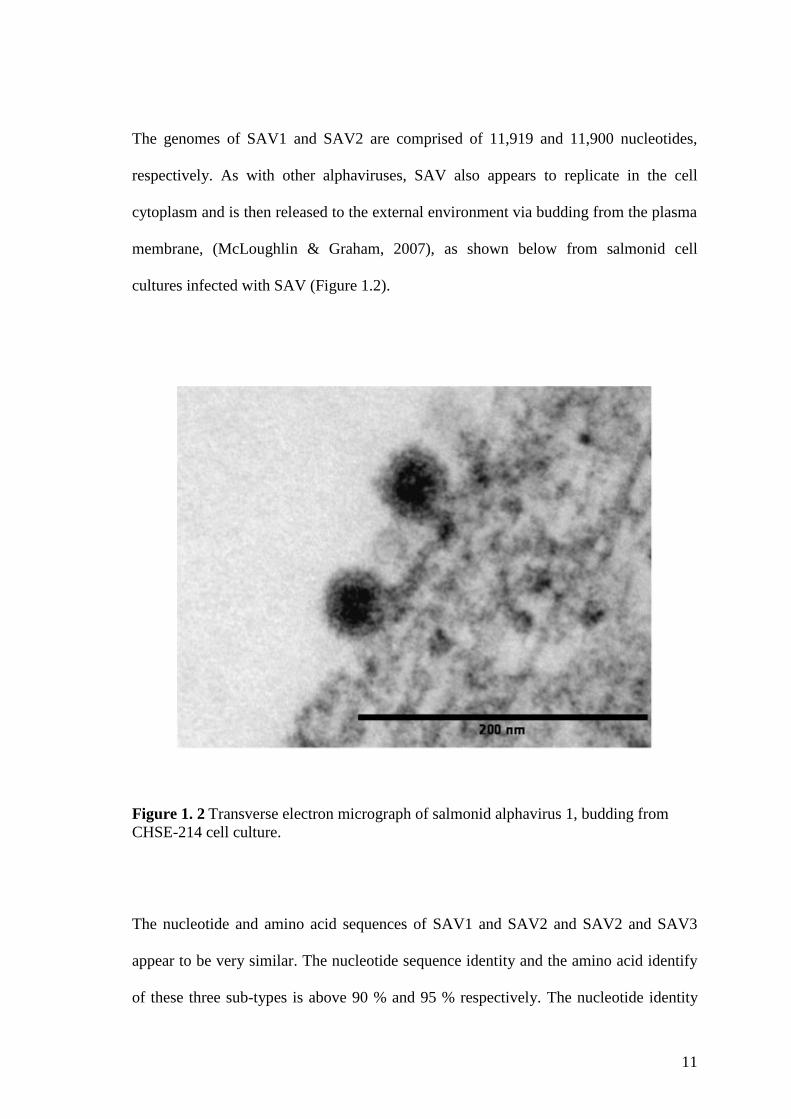
11
The genomes of SAV1 and SAV2 are comprised of 11,919 and 11,900 nucleotides,
respectively. As with other alphaviruses, SAV also appears to replicate in the cell
cytoplasm and is then released to the external environment via budding from the plasma
membrane, (McLoughlin & Graham, 2007), as shown below from salmonid cell
cultures infected with SAV (Figure 1.2).
Figure 1. 2 Transverse electron micrograph of salmonid alphavirus 1, budding from
CHSE-214 cell culture.
The nucleotide and amino acid sequences of SAV1 and SAV2 and SAV2 and SAV3
appear to be very similar. The nucleotide sequence identity and the amino acid identify
of these three sub-types is above 90 % and 95 % respectively. The nucleotide identity
12
between SAV1 and SAV2 reference strains is 95% and 93.6%, respectively while
showing a low level of homogenity (30-40%) with other alphaviruses (Weston et al.,
2002; McLoughlin & Graham, 2007). The SAVs differ structurally from mammalian
alphaviruses by containing larger structural and non-structural proteins, on the
unglycosylated E3 region, and the presence of short untranslated regions in the 5‟ and 3‟
ends of the genome.
1. 4. 3 Pathology of SAV
Clinical signs
The clinical presentation of PD can be per-acute, acute or chronic and fish can recover
from the disease depending on the length and the severity of the signs presented in the
fish (McLoughlin & Graham, 2007). The main clinical signs associated with PD in sea
water reared Atlantic salmon (SAV1 and SAV3) are sudden inappetence, lethargy,
crowding into corners, fish swimming close to the surface of the cages, increased
amount of yellow faecal casts in the cages, illthrift, listlessness, inability to maintain
posture and finally mortality (Munro et al., 1984; Ferguson et al., 1986b; McVicar,
1987; McLoughlin et al., 2002). The clinical signs of chronic PD can also include slow
growth and emaciation, resulting in „runts‟ in the affected population (Desvignes et al.,
2002; McLoughlin et al., 2002). Fin-erosion and ulceration commonly seen in diseased
fish are considered to be secondary complications of the infection. In some instances,
regurgitation of ingested food is seen, suggesting degeneration of the oesophageal
striated muscles (Ferguson et al., 1986a, 1986b). Severe heart and skeletal muscle
failure can lead to sudden death in healthy looking fish in good condition (McLoughlin
et al., 2002). Spiral swimming, fish lying down in the bottom of the tank as if dead and
then moving when handled is a clinical feature of fish with severe muscle damage
13
(McLoughlin & Graham, 2007). Impaired swimming can occur in SAV-affected fish as
a result of the skeletal muscle lesions associated with SAV (Ferguson et al., 1986b).
The poor condition of the fish after recovery results from lack of feeding and/or
digestive enzymes during the infection.
The sleeping nature of the rainbow trout infected with SD, as mentioned earlier, is
presumed to be caused by extensive necrosis of the red skeletal muscle (McLoughlin &
Graham, 2007). Significant bilateral exophthalmia, poor feeding performance,
emaciation and low body fat levels have been observed in experimental infections 5-7
weeks post infection. All ages of rainbow trout are susceptible to SD but the severity of
the clinical disease is greatest in fingerlings (10-15g). The clinical disease in older fish
is milder, and infection can be present in fish even without showing apparent signs. The
SD can extend up to 42 d.p.i along with lethargic swimming behavior in affected
populations. Some of the immobile fish are hyper-excitable in response to disturbance
(Boucher, 1995).
Gross pathology
The earliest gross signs of PD outbreaks are the absence of food in the gut of the fish
and increased faecal casts in tanks. In some instances, petechiation in the fat around the
pyloric caeca can be observed. During extended periods of infection, emaciated fish
with long thin bodies with very little body fat can result and this results in downgrading
of the stocks (McLoughlin et al., 2002). Pale and mottled livers are sometimes observed
in field outbreaks and although these have never been reported under experimental
conditions, they could possibly be a complication secondary to the heart pathology and
the pancreatic damage (Ferguson, et al., 1986b; Taksdal et al., 2007).
14
Histopathology
The characteristic histopathology of SAV essentially involves different combinations of
lesions, of different severity in the exocrine pancreas, heart and skeletal muscle. In some
instances, lesions associated with the oesophagus (Ferguson et al., 1986a, 1986b) and
the kidney (Taksdal et al., 2007) were also reported. The presence of exocrine
pancreatic lesions was the first sign to be seen in histology in SAV affected fish and this
was was considered as the hallmark in diagnosing the disease (Munro et al., 1984) until
the association with myopathy was described by Ferguson and others (1986b). The
classical lesions of SAV include severe acute exocrine necrosis of the pancreas followed
by chronic fibroplasia in recovering animals (Ferguson et al., 1986b; McVicar, 1987;
McLoughlin et al., 1995, 1996, 1997, 2002). Pancreatic lesions of NSPD were said to
be more similar to Infectious Pancreatic Necrosis virus (IPNV) infection than to
pancreatic lesions seen in PD reported in Scotland and Ireland (Poppe et al., 1989), but
SD gives similar lesions in the pancreas to that of PD.
Although the presence of heart and skeletal myopathies were not consistently seen in
the study by McVicar (1987), they are frequently associated with the pathogenesis of
SAV as seen by Ferguson et al., (1986b), and Rodger et al., (1994). The cardiac lesions
seen in SAV-affected fish consist of different degrees of focal to diffuse myocardial
degeneration and necrosis in both spongy and compact layers of the ventricle and the
atrium, in addition to inflammation characterised by mononuclear cell infiltration
(Ferguson et al., 1986b; McLoughlin & Graham, 2007). The SD associated cardiac
lesions seen during natural and experimental infections are also consistent with the heart
lesions seen during PD, however heart lesions do not always occur with NSPD (Taksdal
15
et al., 2007). Skeletal lesions associated with SAV appear 2-3 weeks after the first signs
of lesions in the pancreas, and are characterised by hyaline degeneration, a variable
degree of inflammation and fibrosis in both red and white skeletal muscles (Ferguson et
al., 1986b; Murphy et al., 1992; McLoughlin et al., 2002). Skeletal lesions in rainbow
trout during SD are considered to be more severe than the lesions seen with PD in
Atlantic salmon (Ferguson, 2006).
The presence of interstitial cells filled with eosinophilic granular materials along the
sinusoids of the kidney were also seen in NSPD induced by SAV3 (Taksdal et al., 2007)
and have occasionally been seen in some reported cases of PD occurring in the Shetland
Islands, Scotland (McLoughlin & Graham, 2007). Focal gliosis in the brain of fish
experimentally infected with SAV1 indicate the involvement of nervous tissue in the
infection (McLoughlin & Graham, 2007). Degeneration of oesophageal muscles has
also been reported in earlier descriptions of the diseases, but has not been reported
recently (Ferguson et al., 1986b; Ferguson, 2006).
1. 4. 4 Pathogenesis of SAV
The description of the pathogenesis of SAV has so far been based on the sequential
pathology of fish naturally and experimentally infected with SAV. Initially, the
presence of low levels of selenium and Vitamin E in the plasma of PD-affected fish led
to the conclusion that PD was a result of some nutritional deficiency in salmon
(Ferguson et al., 1986a; Bell et al., 1987; Raynard et al., 1991; Pringle et al., 1992;
Grant et al., 1994; Rodger et al., 1995), until it was discovered that the disease could be
cross transmitted from diseased fish to healthy fish using kidney homogenates
(McVicar, 1990; Raynard & Houghton, 1993; Wheatley et al., 1994). The optimum
16
temperature for spread of the disease was found to be around 14oC and the infectious
material was sensitive to chloroform suggesting the involvement of an enveloped virus
(Nelson et al., 1995). McLoughlin et al. (1996) have confirmed that virus grown in cell
culture could reproduce the disease in Atlantic salmon post-smolts, the clinical signs of
which were indistinguishable from field outbreaks, causing lesions in the pancreas,
heart and skeletal muscles. Cross transmission studies carried out under experimental
conditions revealed a different degree of susceptibility between Atlantic salmon,
rainbow trout and brown trout (Boucher et al., 1995) and variation in the strain
susceptibility to the disease by Atlantic salmon (McLoughlin et al., 2006). In two
parallel experimental infections, conducted by injecting SAV1 derived from cell culture
grown virus and SAV3 infected clinical material into fish, disease signs were observed
to different degrees, suggesting variations in the degree of pathological outcome due to
complex host, pathogen, and environment interaction. However, none of the
experimental infections resulted in mortalities, as occur in field outbreaks (McLoughlin
& Graham, 2007), until recently though this has apparently been shown by a Norwegian
research group (unpublished data).
1. 4. 5 Differential diagnosis
Other conditions that are differentially diagnosed from SAV infections in Atlantic
salmon include IPNV infection, Cardiomyopathy Syndrome (CMS) and Heart and
Skeletal Muscle Inflammation (HSMI) (Ferguson, 2006; McLoughlin & Graham,
2007). IPNV is a widespread infectious disease of Atlantic salmon with known viral
aetiology (Aquabirnaviridae) and also affects the exocrine pancreas, similar to SAV. It
17
can be easily differentiated from SAV infections by the presence of characteristic
catarrhal enteritis and the absence of cardiac or skeletal pathology and by
immunohistochemistry (McLoughlin et al., 2002; McLoughlin & Graham, 2007). HSMI
and CMS are newly described diseases in farmed Atlantic salmon in Scotland and
Norway (Ferguson et al., 1990; Rodger & Turnbull, 2000; Kongtorp et al., 2004b). Both
of these diseases appear similar to PD, and occur in the sea water phase of the Atlantic
salmon life cycle. HSMI occurs in fish 5-9 months after they have been transferred to
sea and CMS is said to occur in salmon in the second year at sea. Both diseases have
been confirmed to be caused by an infectious agent recently and are suspected to be of
viral aetiology (Kongtorp et al., 2004a; Bruno & Noguera, 2009; Fritsvold et al., 2009;
Kongtorp & Taksdal, 2009). They both cause severe lesions in the heart of infected fish
just like PD, but can still be differentially diagnosed from PD by the absence of
pancreatic lesions (McLoughlin & Graham, 2007). However detection of SAV
antibodies in the HSMI affected fish and concurrent occurrence of CMS and SAV have
been seen in the field, making differential diagnosis difficult.
1. 4. 6 Diagnostic tools for SAV
Clinical signs and histopathology are used conventionally for diagnosis of SAV, how
ever, the severity, and the distribution of lesions in the affected tissues and the clinical
signs differ depending of the stage of the disease (per-acute, acute, sub-acute, chronic
and recovery). Therefore, virus isolation, serology, RT-PCR and qRT-PCR techniques
are all used in combination together with the clinical and histological findings to
confirm the disease (Table 1.2).
Table 1.2 A diagnostic panel for PD, adapted from McLoughlin & Graham (2007).
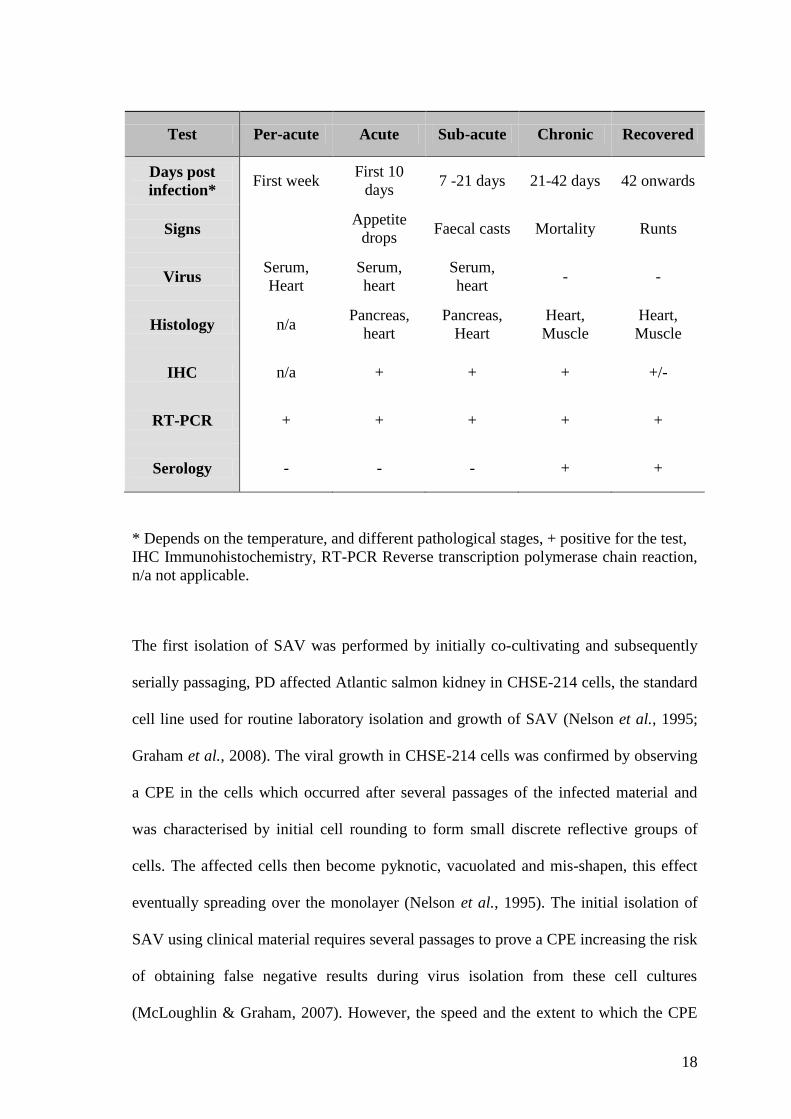
18
Test Per-acute Acute Sub-acute Chronic Recovered
Days post
infection* First week
First 10
days 7 -21 days 21-42 days 42 onwards
Signs Appetite
drops Faecal casts Mortality Runts
Virus Serum,
Heart
Serum,
heart
Serum,
heart - -
Histology n/a Pancreas,
heart
Pancreas,
Heart
Heart,
Muscle
Heart,
Muscle
IHC n/a + + + +/-
RT-PCR + + + + +
Serology - - - + +
* Depends on the temperature, and different pathological stages, + positive for the test,
IHC Immunohistochemistry, RT-PCR Reverse transcription polymerase chain reaction,
n/a not applicable.
The first isolation of SAV was performed by initially co-cultivating and subsequently
serially passaging, PD affected Atlantic salmon kidney in CHSE-214 cells, the standard
cell line used for routine laboratory isolation and growth of SAV (Nelson et al., 1995;
Graham et al., 2008). The viral growth in CHSE-214 cells was confirmed by observing
a CPE in the cells which occurred after several passages of the infected material and
was characterised by initial cell rounding to form small discrete reflective groups of
cells. The affected cells then become pyknotic, vacuolated and mis-shapen, this effect
eventually spreading over the monolayer (Nelson et al., 1995). The initial isolation of
SAV using clinical material requires several passages to prove a CPE increasing the risk
of obtaining false negative results during virus isolation from these cell cultures
(McLoughlin & Graham, 2007). However, the speed and the extent to which the CPE
19
develops on the cell monolayers increases through serial passaging while adapting virus
to the cell cultures. The delay of isolation of virus from the cell cultures is regarded as
one of the main reasons for the delay in characterising the aetiology of the diseases as it
took nearly seventeen years from the first report of the disease in 1978 (McVicar, 1987)
to virus isolation in 1995 (Nelson et al., 1995). Epithelioma papulosum cyprinid (EPC),
Fathead minnow (FHM), bluegill fry-2 cells, rainbow trout fibroblast cell and rainbow
trout gonad (RTG-2) cells have all been tested in addition to CHSE-214 cells in this
initial virus isolation work, but CHSE-214 and RTG-2 were the only cell lines to
produce a reliable CPE (Graham et al., 2008). However, in a recent study SAV was
shown to be able to grow also in Atlantic salmon head kidney derived cells (TO), SHK-
1 and Blue fin 2 (BF-2) cells (Graham et al., 2008). Serum has been identified as the
best clinical material to use for SAV isolation in cell cultures and the use of serum from
an acute stage of an outbreak increases the possibility of obtaining a positive result. The
ability to use comparatively fewer samples from live animals leads to serum becoming
source of clinical material to use for SAV isolation (McLoughlin & Graham, 2007). A
virus-specific monoclonal antibody (mAb) based on an immunostaining technique was
developed (Todd et al., 2001) to avoid obtaining the false negative results which occur
from CPE-based virus isolation. Use of serum samples as the clinical material and the
immunostaining as the detection method has greatly increased the sensitivity of the cell
culture virus isolation technique and is presently the most common method employed
for SAV diagnostics (Graham et al., 2007a, 2008; McLoughlin & Graham, 2007). The
same immunostaining method can also employed as virus neutralisation test to detect
the presence or absence of virus specific neutralising antibodies in SAV affected fish.
(Graham et al., 2003a). This immunoperoxidase based virus neutralization (IPVN) test
was adopted from a 24 well costar plate was based conventional virus neutralisation
20
(VN) test developed by McLoughlin et al, (1996), in which interpretation of results was
based on end point titration by observing the development of CPE. In contrast to the
IPVN method that is able to give results as fast as 3 days post inoculation (d.p.in), the
VN test is only able to give results after 7 d.p.in. The ability to simultaneously detect
the neutralising antibody titer and the presence of virus has increased the usefulness of
this improved method and is widely being used for SAV diagnostics and research
(Graham et al., 2005, 2006a; McLoughlin et al., 2006). Hence all subtypes of SAV fall
within a single serotype (Christie et al., 1998; McLoughlin et al., 1998; Graham et al.,
2003a, 2007a), IPVN can easily be employed for detecting virus or determining sero-
prevalence of SAV infections (Graham et al., 2007a, 2010).
A two-step reverse transcription polymerase chain reaction RT-PCR assay developed by
Villoing et al., (2000b) was first used to detect SAV2 in natural outbreaks, but was
found to be able to detect all SAV (Graham et al., 2006b). Several conventional RT-
PCR tests were subsequently developed in different laboratories (Hodneland et al.,
2005; Graham et al., 2006b), although none of the tests was able to differentiate the
sub-types without post PCR sequence analysis. The TaqMan based qRT-PCR developed
by Hodneland & Endresen (2006) was able to differentiate SAV1, SAV2, and SAV3
differentially, increasing the usefulness of quantitative molecular techniques for SAV
diagnostics. A SYBR green (SG) based qRT-PCR was also developed to quantify SAV
in serum and tissues (Graham et al., 2006b). Recently, 6 different sub-types of SAV
have been characterised using cycle sequencing on a large number of virus isolates
obtained from different geographical locations in Europe (Fringuelli et al., 2008;
Graham et al., 2009, 2010; Karlsen, et al., 2009).
21
1. 4. 7 Defence mechanisms
A broad range immune response of PD-affected fish was observed under both natural
(McVicar, 1987) and experimental (Houghton, 1994) conditions even before confirming
the aetiology of the disease. Production of neutralizing antibodies in SAV-affected fish
is known to play a significant role in clearing the virus and providing long lasting
immunity. Passive immunisation of fish with convalescent sera from naturally infected
fish or sera raised in salmon experimentally injected with kidney homogenate from
diseased fish has been shown to give 100 % protection, without any pathology,
highlighting the presence of neutralising antibodies in SAV infected fish (Murphy et al.,
1995; Houghton & Ellis, 1996). The appearance of neutralising antibody in the diseased
fish was first detected around 10-16 days after initial infection, and fish become
seroconverted by 21-28 days of infection (McLoughlin et al., 1998; Desvignes et al.,
2002). Even though virus specific antibodies do not provide any information on the
clinical status of the infection or the type of the virus involved, serology still plays a
significant role in SAV diagnostics.
Increased phagocyte activity of the head kidney leukocytes and high lysozyme and
complement levels in the infected fish at early stages of infection have been
demonstrated by Desvignes et al., (2002). The non-specific defence mechanisms
associated with SAV are poorly characterised although it is known that mammalian
alphavirus expresses a rapid INF mediated antiviral response.
22
1. 4. 8 Disease transmission
In general all the alphavirus infections are arthropod borne (arboviruses), which use
haematophagous arthropods, probably mosquitoes or ticks as vectors in their life cycle
with the virus able to replicate within these hosts (Weston et al., 1999). However vector
involvement has yet to be identified in SAV infections. Co-habitation infections
between healthy and virus infected fish are seen under both natural and experimental
infections indicating horizontal transmission of the virus (Raynard and Houghton, 1993;
Houghton and Ellis, 1996; McLoughlin et al., 1996) highlighting the SAV is
biologically distinct from other alpha viruses. The phylogenetic studies (Fringuelli et
al., 2008) and epidemiology modelling studies (Viljugrein et al., 2009; Aldrin et al.,
2010) also strongly support horizontal transmission of the disease.
Sea lice (Lepeophtheirus salmonis) and Caligus elongatus are suspected to be vectors in
SAV transmission (Weston et al., 1999). The resent isolation of alpha virus from
elephant seal louse (Lepidophthirus macrorhini) (Linn et al., 2001) gives a promising
positive indication of the presence of vectors in the transmission cycle. In addition,
SAV3 was found in L salmonis taken from diseased fish using real time PCR but it was
not confirmed whether the virus was from the tissues of the parasite or poorly digested
blood of salmon present in the gut of the parasite (Karlsen et al., 2006). Information on
the carrier status of SAV is not fully known. Graham et al., (2006b) using qRT-PCR has
observed the presence of viral RNA in the hearts of infected fish for extended period
(90 days), suggesting a possible carrier stage of SAV, however studies are needed to
confirm the significance of this with respect to the carrier status of the fish.
23
1. 4. 9 Treatment and Control
SAV appears to be confined to salmonids in Europe, although the possibility of global
spread cannot be ignored with the extensive movement of stocks. Good management
practices such as all in-all out stocking followed by an appropriate fallow period are
recommended. In clinical outbreaks, many farms tend to withhold food for 5-10 days
and this appears to decrease the number of mortalities. But, SAV infection can extend
up to 2-3 months to infect the whole stock, and the above practice appeared to be not
very feasible as a control measure, during the full length of the clinical phase of the
infection. Instead, properly planned dietary management is always recommended in
farms that are at risk and/or clinically ill. In addition new diets targetting SAV clinical
outbreaks are now available in the field.
A commercially available SAV vaccine produced by Intervet Shering-plough is one of
the few successful viral vaccines against viral diseases in fish. The first vaccination trial
was carried out using a simple formalin-inactivated vaccine and was able to produce
100 % protection in vaccinated fish post-challenge. The success rate of this vaccination
is considerably high, eliciting an effective immune protection in the vaccinated stocks,
but the duration of the cross protection given against a novel viral attack appears
variable. This highlights the need for a better vaccine and a vaccination regime against
SAV for the prevention and control of the disease. A variation in disease susceptibility
of Atlantic salmon has been observed between fish with different genetic origin, and
fish of different smolting stages. This has led to establishing breeding programms by
commercial groups to select SAV resistant strains for aquaculture.
24
1. 4. 10 Epizootiology and economical importance
The severity of an SAV outbreak, and associated mortalities, can vary greatly depending
on the smolt strain, geographical location, water temperature and feeding regime. The
disease was initially observed in salmon in the first year of sea transfer but now can be
seen in salmon in their second year at sea (McLoughlin & Graham, 2007). The factors
contributing to the massive economic losses of the salmon aquaculture industry by SAV
include mortalities that range from 5-50 %, poor growth and runting in up to 10 % of
the surviving fish after a disease outbreak, and the grading losses at the time of
processing due to discoloured muscle resulting from damaged skeletal muscle
(McLoughlin & Graham, 2007).
Pancreas disease was first reported in the mid-1980s in Ireland, and is now considered
endemic to Irish waters. The occurrence of the disease has increased over time, and in
2007, more than 90 % of the marine sites have been diagnosed positive for SAV
(Rodger & Mitchell, 2007). It is identified as the most significant infectious disease in
the Irish salmon industry. The clinical disease can be seen at any time of the year and
the mortality rate of the affected site can vary from 1 % - 48 %. A repeat occurrence of
the infection at the same site in following years is common in Ireland, suggesting the
existence of virus reservoirs at the site.
In Scotland, the number of SPD outbreaks and the distribution of the farms that are
positive for PD virus have considerably increased in recent years. The SPD outbreaks in
Scotland are reported throughout the year, with peak occurrence detected around August
and September (Murray & Kilburn, 2009). The disease caused by SAV has accounted
25
for at least 11 % of total the annual biomass loss, to the Scottish salmon industry
(Murray & Kilburn, 2009).
Pancreas disease was first reported in Norway in the 1980s (Poppe et al., 1989), and
now remains a problem for both sea reared Atlantic salmon and rainbow trout. The
occurrence of NPDV outbreaks is reported throughout the year with the highest number
of cases reported between May and October. Since 2007, Norwegian authorities have
listed PD as a list-B notifieable disease within the country, setting up geographical
zones, confining PD positive geographical areas, aiming to prevent the spread of the
disease to the PD negative sites (Aldrin et al., 2010).
1.5 Fish immune system and immune response to viral diseases
Teleosts form the link between vertebrates and invertebrates, and are considered as the
most primitive vertebrate in an evolutionary sense to exhibit both innate and acquired
immunity. As a result, the adaptive immune system of fish is comparatively primitive to
that of the higher vertebrates, although the innate immune system is advanced in
comparison to invertebrates (Plouffe et al., 2005; Whyte, 2007). There is a complex
interaction between the innate and the adaptive immune response. The fish immune
system inherently elicits a potent immune response as it is continuously challenged by
the pathogenic organism existing in the aquatic environment and it faces some extreme
environmental conditions. Viral diseases have become one of the major challenges in
aquaculture health management today and understanding the immune response towards
viral diseases is essential for the future sustainability of the industry.
26
1. 5. 1 Morphology of immune system of fish
The major lymphoid organs present in teleosts are the head kidney, spleen, thymus, and
mucosal-associated lymphoid tissue in skin, gill and gut. Macroscopic and microscopic
morphology of fish immune organs are distinctly different from mammals. Unlike
mammals, fish lack bone marrow and lymph nodes, and their head kidney is the main
immune organ involved in lymphoid cell formation. In general their lymphoid tissue is
composed of lymphatic cells, and a reticular frame work that maintains the structural
integrity of the cellular components of the immune system. The cellular elements of the
fish lymphoid tissue comprise lymphocytes, monocytes, macrophages, granulocytes
(neutrophils, eosinophils, basophils) and thrombocytes (Press & Evensen, 1999; Roberts
& Pearson, 2005). Non-specific cytotoxic cells, mast cells/eosinophilic granular cells,
rodlet cells and dendritic cells are also reported from fish (Press & Evensen, 1999; Reite
& Evensen, 2006). Melanomacrophages, a distinct type of cells enriched with melanin,
haemosiderin, and lipofucsin are supposed to be involved in phagocytosis and are
present in all the lymphoid organs in fish (Roberts & Pearson, 2005; Ferguson, 2006).
The kidney is located in the retroperitoneal region of the body cavity of fish and is
composed predominantly of cells of the lympho-myeloid lineage. Fish head kidney
tissue is involved in haematopoiesis as well as acting as a secondary lymphoid organ
(Dalmo et al., 1997). The tissue itself is mainly composed of sinusoids lined by
endothelial cells, the adventitial cells which cover the endothelial cells adluminally and
the reticular cells that are involved in phagocytosis. The sinusoidal macrophages and the
endothelial cells of the head kidney are involved in trapping particles and substances
from the circulation (Dalmo et al., 1997). In addition, lymphoid cells of the head kidney
27
are also involved in antibody production and immune memory (Press & Evensen,
1999).
In teleosts, the spleen is composed mainly of a reticular cell network supporting blood-
filled sinusoids that contain a diverse cell population and it is involved in
haematopoiesis, clearance of macromolecules, antigen degradation, and processing
(Watts et al., 2001). The red pulp and the white pulp of the spleen can be easily
differentiated in fish. Melanomacrophage centres are one of the distinct features seen in
the spleen of fish and are involved in the destruction of erythrocytes (Press & Evensen,
1999).
The thymus is a paired organ that is situated in the dorsolateral region of the gill
chambers, and consists of thymocytes separated from the external environment by a
layer of epithelial cells. The cortex of the thymus is densely populated with thymocytes
and some epithelial cells present in the medulla are believed to be involved in
thymocyte maturation (Press & Evensen, 1999). The thymus appears to undergo
involution during post-spawning and its size varies with seasonal changes (Press &
Evensen, 1999).
Mucosal-associated lymphoid tissue can be seen in the gut, skin and gill of fish and acts
as a local defence tissue in fish. Although gut associated lymphoid tissue is present in
fish it is not organized as in mammals. The eosinophilic granular cells that are present
between the stratum compactum and the circular muscle layer are believed to be
involved in immune function such as inflammation and vasodilatation (Reite &
28
Evensen, 2006). Leukocytes and plasma cells are also present in skin and gill and act as
localised defense cells.
1. 5. 2 Innate immune system of fish
The innate or non-specific immune system is present in most multi-cellular organisms.
In fish the innate immune system plays an integral part in the defence against pathogens
due to an underdeveloped, slowly responding adaptive immune system, compared to
mammals (Watts et al., 2001; Whyte, 2007). It is regarded as the „first line of defence‟
and as a „signal of danger‟ to the presence of foreign material, including pathogens. It
also helps in activating the specific immune system during an infection to elicit specific
immunity and long-lasting immune memory (Whyte, 2007). As an ectotherm, the innate
immune system of fish is temperature independent, allowing them to respond at a
variety of temperatures. (Magnadóttir, 2006).
The innate immune system comprises of physical, humoral and cellular factors
(Magnadóttir, 2006; Whyte, 2007). The mucous layer and the epithelial cell lineage in
the skin, gill and gut act as the main physical barriers that protect fish from pathogen
entry. Mucus is rich in a variety of antimicrobial components such as antimicrobial
peptides (defensins), lectins, pentraxins, and lysozymes, complement proteins and IgM
(Yano, 1996). More recently IgT has also been identified and may have a role in
mucosal immunity (Sunyer et al., 2009). Many humoral factors are also involved in the
innate immune function such as growth inhibitors (i.e transferins, INF and Mx protein),
serum protease inhibitors (α2 macroglobulin, α1 anti-trypsin), various lytic factors
(lysozymes, cathepsin, chitinase), complement, agglutinins, precipitins, natural
29
antibodies, cytokines including interleukin (IL)-1, IL-6, tumor necrosis factor- α (TNF-
α), chemokines, acute phase proteins and antibacterial peptides. Acute phase proteins
(C-reactive protein, serum amyloid) are also present in fish as humoral factors (Watts et
al., 2001).
The complement systems which can be activated through either classical, alternative or
lectin-mediated pathways have all been characterised in fish. Different complement
components have lytic, pro-inflammatory, opsonic, and chemotactic properties which
can induce non-specific phagocytic activity (Boshra et al., 2006). The complement
pathway also bridges the innate and adaptive immune systems (Sunyer, et al., 2003). In
teleosts, complement factor C3, is present in a variety of different forms giving a greater
efficiency to the alternative pathway, compared to mammals (Watts et al., 2001). The
complement system can be activated over a wider temperature range, and its activity
varies depending on the season.
Non specific cytotoxic cells (NCC) and professional phagocytic cells (neutrophils and
macrophages) are the main types of cell involved in non-specifically eliminating
pathogens from fish (Moody et al., 1985; Fischer et al., 2006). Dendritic cells also
participate in the innate defenses of fish (Graham and Secombes, 1988).
The innate immune system of fish can be modulated by different physical and biological
factors including temperature, seasonal factors, pollution, handling and over-crowding,
diet and food additives, such as immunostimulants and probiotics, drugs, vaccines, and
importantly pathogens. Upon pathogen entry the innate immune system recognises the
30
stimuli as non-self by binding to Toll-like receptors (TLR), identifying molecules that
are associated with the microbes such as polysaccharides, lipopolysaccharides,
peptidoglycans, bacterial DNA and double stranded viral RNA (Magnadóttir, 2006).
Molecules released as a result of tissue damage such as host DNA, RNA, heat shock
proteins, chaperones and oligomannose of pre-secreted glycol proteins can also trigger
the innate immune reaction. When the immune responses are induced by foreign
molecules, opsonization and phagocytosis begins. Nitric oxide or reactive oxygen
species based pathways are also involved in killing phagocytosed pathogens. Different
cell signalling pathways, for example, the complement cascade and natural cytotoxic
cells are activated as an acute phase response to eliminate pathogens.
1. 5. 3 Adaptive immune system
The adaptive immune system in fish is comparable to higher vertebrates, with the
presence of all fundamental features including immunoglobulins (Ig), T-cells and T-cell
receptors, the Major Histocompatibility complex (MHC) and Recognition Activator
Genes 1 and 2 (RAG1 and RAG2) (Watts et al., 2001). However, the adaptive immune
system in fish, in comparson to mammals, has a low antibody repertoire, low immune
memory, slow lymphocyte development and lacks in affinity maturation of B-cells
(Magnadóttir, 2006), although it is still able to elicit a long lasting immune response
during infections. These differences mean that the adaptive immune system in fish is
less sophisticated than mammals. This appears to indicate that the adaptive immune
system is less important to fish for their biological function, rather than of an inferiority
compared to mammals (Kaattari, 1994; Watts et al., 2001).
31
IgM was the only antibody known to be present in fish until IgD, IgT and IgZ were
recently characterised (Randelli et al., 2008; Sunyer et al., 2009) unlike mammals
which have five classes of Ig, including IgA, IgD, IgG, IgE, and IgM. Fish IgM is
present in serum, and mucous secretions of the skin and the gut. The molecular
arrangement of teleost IgM is different from mammals as the light and heavy chains are
held together by a non-covalent bond instead of disulphide bonds seen in mammalian
IgM (Alvarez-Pellitero, 2008). The monomers of fish IgM are present as single
monomers or in tetrameric form while IgM in mammals is in pentameric form (Watts et
al., 2001). The non covalent binding of IgM tetramers found in fish is believed to
enhance the ability of the molecule to bind to different types of epitopes, adjusting their
orientation (Solem & Stenvik, 2006). The antibody molecules (Ab) of fish possess
relatively low intrinsic affinity and the antigen binding sites are limited in
heterogenicity compared to mammals (Kaattari, 1994; Solem & Stenvik, 2006). The
teleost IgM molecule is capable in opsonising pathogens to enhance phagocytosis by
macrophages (Secombes & Fletcher, 1992; Solem & Stenvik, 2006). They are also able
to activate the classical complement pathway, and act as effective agglutinators to
foreign molecules. Due to the temperature dependent nature of the specific immune
system, the antibody response of fish can be delayed for weeks (Watts et al., 2001).
Information on specific cell-mediated immunity is not widely known in teleosts. Both T
and B-lymphocytes are present in fish including salmonids, although the types and the
function of different cell repertoires are still to be confirmed (Fischer et al., 2006). The
signatures for the presence for the T-cells were reported in fish a few decades ago and
the cloning of T-cell receptors, MHC-I, MHC-II molecules and T-cell surface markers
CD3, CD4 and CD8 represented a breakthrough in studies on T-cells, examining how
32
the associated adaptive immune mechanisms operate in fish (Secombes & Zou, 2005;
Alvarez-Pellitero, 2008; Randelli et al., 2008). There are two types of T-cells present,
T-helper cells (Th) which are enriched with CD4 on the surface and cytotoxic T-cells
(Tc) which express CD8 receptors. The antigen bound to the MHC class I and II are
recognised by CD8 and CD4 present on the T cells respectively. Therefore MHC class
molecules act as a bridge connecting the innate and adaptive immune response.
1.6 Functional genomics for studying immune system of salmon
Genomics is the development and application of genome-based technologies for
studying the biological significance of genes under given conditions. It has become a
key tool for comparative immunology research, and has now advanced to the next
generation sequencing and whole genome sequencing. The measurements in changes in
genes and gene function can be obtained by mapping the organism‟s DNA (genetic
interaction mapping), or studying transcriptomics to evaluate changes in messenger
ribonucleic acid (mRNA) expression using microarray (MA), serial analysis of gene
expression (SEGE), suppression subtractive hybridisation (SSH) or at a protein level
using proteomics (Ng et al., 2005).
As one of the major aquaculture species, Atlantic salmon has been extensively used for
genomic analysis in an attempt to explore the genome of Atlantic salmon to improve the
growth, development, reproduction, disease resistance and response to infectious
disease (von Schalburg et al., 2005). Exploration of the salmonid genome is also used
extensively to gain evolutionary information to help to solve the mysteries of how gene
duplication took place, which is fundamental for describing the importance of gene
33
families, duplication and deletion of gene segments and mutations, to help in
understanding various gene functions. Such information, such as physiological
mechanisms of sex determination, is unarguably helpful in discovering important
parameters for the expansion of Atlantic salmon aquaculture.
A large amount of genomic data from salmon has been discovered by cloning and
generating of cDNA libraries. The expressed sequence tags (ESTs) enable the
development of functional genomic tools such as microarray and SSH for salmon (Ng et
al., 2005; von Schalburg et al., 2005; Rise et al., 2006; Miller & Maclean, 2008;
Taggart et al., 2008). Cooperation between different research groups involved in
developing arrays through the distribution of ESTs means that most of the data is now
publicly available in the National Centre for Biotechnology Information (NCBI) and the
J. Craig Venter Institute (JCVI) database (Miller & Maclean, 2008; Taggart et al.,
2008).
The emphasis on identifying the genes responsible for immune function in salmon and
rainbow trout has been extensively explored during recent years (Martin et al., 2008).
The discovery of shared homology between higher vertebrates and teleostean immune
systems further strengthens the trend of exploring immune signatures using different
species of fish, such as zebrafish (Danio reiro), medaka (Oryzias latipes) and more
recently salmonids as model organisms to understand evolutionary immunology (Korth
& Katze, 2002; Rise et al., 2006; Martin et al., 2008; Miller & Maclean, 2008). Apart
from comparative and evolutionary immunology, functional genomics has been
extensively used to study the health and disease control of fish and to assist in the
34
development of commercial vaccines against salmonid diseases (Cummings, 2002;
Martin et al., 2006).
The ability to study global gene expression in the host during infection, using functional
genomics, enables understanding of the whole disease mechanism rather than
examining the different aspects separately. The information on host response to SAV is
poorly known and a thorough understanding is required in order to design proper
mitigating measures. The response of the host to SAV therefore is an ideal subject to
study using functional genomics.
35
Aims and Objectives
The main aim of this thesis was to investigate the disease mechanisms involved in
SAV1 infection in Atlantic salmon with respect to pathogenesis and host defence
mechanisms at the tissue, cellular and molecular level. The objectives to achieve this
were;
1. To isolate SAV from the head kidney of Atlantic salmon experimentally infected
with SAV1 using different cell lines and to assess the virus load present in this host
tissues (Chapter 2).
2. To assess the INF-mediated antiviral response observed in SAV1 infection and
evaluate the pathology of the disease in relation to INF-mediated tissue response
(Chapter 3).
3. To assess the host response to SAV1 infection using transcriptomics and qRT-PCR
(Chapter 4)
4. To study the morphogenesis of SAV1 in situ in cell cultures to evaluate the
replication pathway of the virus (Chapter 5)
5. To study the cell death mechanisms involved in SAV1 infection (Chapter 6)
36
Chapter 2
Isolation and Quantification of Salmonid Alphavirus 1
Following Experimental Infection in Atlantic Salmon
2.1 Introduction
Understanding how diseases progress during an infection, by elucidating pathogenesis
and the transmission process is important for developing effective control strategies and
therapeutics (Berger et al., 2001). Changes in the interaction between the pathogen and
its host facilitate the pathogen‟s success in establishing infection under favourable
conditions (Cann, 2005). Such interaction also allows the pathogen to spread through its
host and in turn disseminate the disease in the fish population. The success of the
infection depends on factors relating to both the pathogen and the host. In viral diseases,
the number of viral particles present and the virulence of the virus are factors relating to
the pathogen, while the susceptibility of the host relies on a number of physical factors
such as age, physiological status and immune status of the host. Being able to detect the
virus and measure the kinetic status of the virus load in a population during infection are
therefore useful for assessing the progression of the disease (Preiser et al., 2000;
Niesters, 2001).
Virus isolation from clinical samples is conventionally carried out using cell cultures
and observing the development of a CPE caused by the virus on the cells. This method
is considered the gold standard for the diagnosis of many different viral diseases of
aquatic organisms, and is often used to certify that stocks of fish as disease-free
(Anonymous, 2003). However, in recent years, the development of molecular methods
37
to detect viral nucleic acids has improved, allowing more sensitive detection and
quantification of viruses compared to conventional methods, especially for slow
growing viruses (Berger et al., 2001). The introduction of quantitative molecular
methods such as quantitative real-time PCR (qPCR) and qRT-PCR have led viral
disease diagnosis and research into a new era. These methods have greatly improved
diagnosis and thus control of viral diseases in clinical and veterinary medicine (Mackay
et al., 2002; Bustin et al., 2005; Bustin & Mueller, 2005). Such technologies have been
applied in many aspects of disease control for aquaculture, including disease diagnosis,
epidemiology, pathogenesis, immunology, prophylaxis and disease management
(Cunningham, 2002; Graham et al., 2006b; Hodneland & Endresen, 2006; Workenhe et
al., 2008a, b).
The qPCR and qRT-PCR are both rapid and sensitive molecular tools, in which the
former is used to quantify the DNA, while the latter is used to quantify RNA by
generating a complementary DNA (cDNA) using reverse transcriptase (Valasek &
Repa, 2005). Both methods are easily employed for the quantitative analysis of
pathogens during infections. They are also considered more sensitive than conventional
PCR. For quantification and detection of the virus during qPCR, measurements take
place during the log phase of the amplification when the reaction conditions are optimal
for PCR amplification (Bustin, 2000). The absence of post-PCR manipulation in qPCR
also helps decrease the risk of contamination, which is often seen with conventional
PCR (Mackay et al., 2002). Furthermore, the products of conventional PCR are detected
by agarose gel-electrophoresis in the presence of ethidium bromide (EtBr), visualising
the band under ultra-violet light. The use of EtBr, a hazardous chemical, is not required
in qPCR (Mackay et al., 2002). Due to low cost and less laborious pre-optimization
38
required compared to qPCR, the conventional PCR is still widely in used in disease
diagnosis.
The results of the qPCR\qRT-PCR can either be obtained as absolute or relative values.
Absolute quantification of qPCR data requires the generation of a standard curve of a
relevant standard, such as plasmid DNA or in-vitro transcribed RNA with a known copy
number (Bustin, 2002, 2005). The results obtained from relative quantification of qRT-
PCR data, on the other hand, are as a ratio of the test result normalized to a control
sample relative to a reference house-keeping gene (Pfaffl, et al., 2001, 2002, 2004;
Pfaffl, 2006). Relative quantification is mainly used to measure levels of mRNA in gene
expression studies (Pfaffl & Hageleit, 2001; Pfaffl, 2006). For virus infections, absolute
quantification appears more relevant, to allow the amount of pathogen present to be
determined (Bustin, 2000; Workenhe et al., 2008a). However, in absolute quantification
final quantity of the viral RNA is also, albeit to a less extent, interpreted relatively by
comparison to a relavent unit e.g. copies per defined ng of total RNA, copies per
genome, copies per cell, copies per gram of tissue, volume of plasma or serum (Niester,
2001). Thus, the accuracy of absolute quantificaton in real time PCR is always
dependent on the reproduciblity of identical standard curves of target transcripts
included in the same assays as test sample qPCR\qRT-PCR amplifications. In contrast,
in relative quantification, as results are always measured comparatively to a house
keeping gene, the unit of measurement is arbitrary and results of relative quantification
are comparable across multiple qPCR assays. Data normalization is one of the essential
steps to be carried out in qPCR (Bustin, 2002). Using matched sample size, ensuring
good quality RNA and incorporating same quantities in RT step in qRT-PCR and
39
normalization using suitable and unregulated references or housekeeping genes is
essential to obtain accurate and reliable qPCR\qRT-PCR result (Huggett, 2005).
Determining the increase in a fluorescent reporter during the PCR amplification in real-
time is used to indicate the amount of target amplified during qPCR. Several different
types of chemistry and instrumentations are available for this purpose. These are based
on different types of fluorogenic reporters such as, SG, hydrolysis probes, molecular
beacons, hybridisation probes, sunrise and scorpion primers and peptide nucleic acid
light-up probes (Bustin, 2000; Valasek & Repa, 2005). The reaction using SG is
considered the simplest and least expensive method to use and can easily be employed
for both absolute and relative quantification of target transcripts (Niesters, 2001; Bustin
et al., 2005; Graham et al., 2006b; Workenhe et al., 2008a). SG is a DNA fluorescent
dye, which binds to the minor grooves in double-stranded DNA and therefore the
increase in production of double-stranded DNA (dsDNA) during the qPCR
amplification. Increases in the amount of fluorescence present in the reaction can be
monitored in real-time in qPCR to quantify the level of target transcripts present (Figure
2.1). Binding to all dsDNA without differentiating specific target from primer-dimer or
non-specific products generated during the PCR cycle is a major draw-back with SG
real-time chemistry. Pre-optimisation of the assay, however, can ensure the assay
specificity (Niesters, 2001). A successful PCR reaction should give a single peak in
melting curve analysis. Multiple melting points can be the result of primer-dimer
formation, non-specific products in the cycle or amplification of reaction contaminants
(Valasek & Repa, 2005). Therefore, careful interpretation of the results is needed to
confirm that a single peak is present.
40
Different qRT-PCR assays have been developed to quantify a variety of RNA viruses in
salmon (Munir & Kibenge, 2004; Starkey et al., 2006; Workenhe et al., 2008a)
including SAV (Graham et al., 2006b; Hodneland & Endresen, 2006). The assay
developed based on SG real time chemistry by Graham et al., (2006b) detected the
presence of SAV in cell cultures, serum and tissues. Hodneland & Endresen (2006)
described three different sequence-specific, highly sensitive Taqman probe qRT-PCR
assays, one of which enabled the differential detection of SAV1, SAV2 and SAV3,
while the other two assays detected SAV1 and SAV3 specifically. However, none of the
assays attempted to measure the actual viral RNA copy number present in the samples,
which is important in the sense of determining the level of infection present in the
individual fish or groups of fish. For SAV diagnosis, cultivation and passage of the
virus in cell culture can be extremely time consuming and requires experienced
personnel to interpret the presence of a CPE, which is difficult to see during the initial
stages of development (Nelson et al., 1995). Although different cell lines have been
tested for SAV1 growth, little information is available on the use of these cell lines for
primary virus isolation from clinically infected material. There is a need for optimised
cell culture assays for rapid isolation of SAV1 for fast and effective diagnostics
(McLoughlin & Graham 2007). Therefore, in the present study, three established
salmonid cell lines, CHSE-214, CHH-1 (Fryer & Lannan, 1994) and SHK-1 cells
(Dannevig et al., 1997), were compared for their ability to isolate SAV1 from
experimentally infected Atlantic salmon based on their growth characteristics and CPE
development. Further, the establishment and propagation of the SAV infection was
observed by an SG-based qRT-PCR assay, using the primers described by Graham et
al., (2006b), to determine the RNA copy numbers in SAV1 infected fish with the help
of a standard curve prepared using in-vitro transcribed RNA.
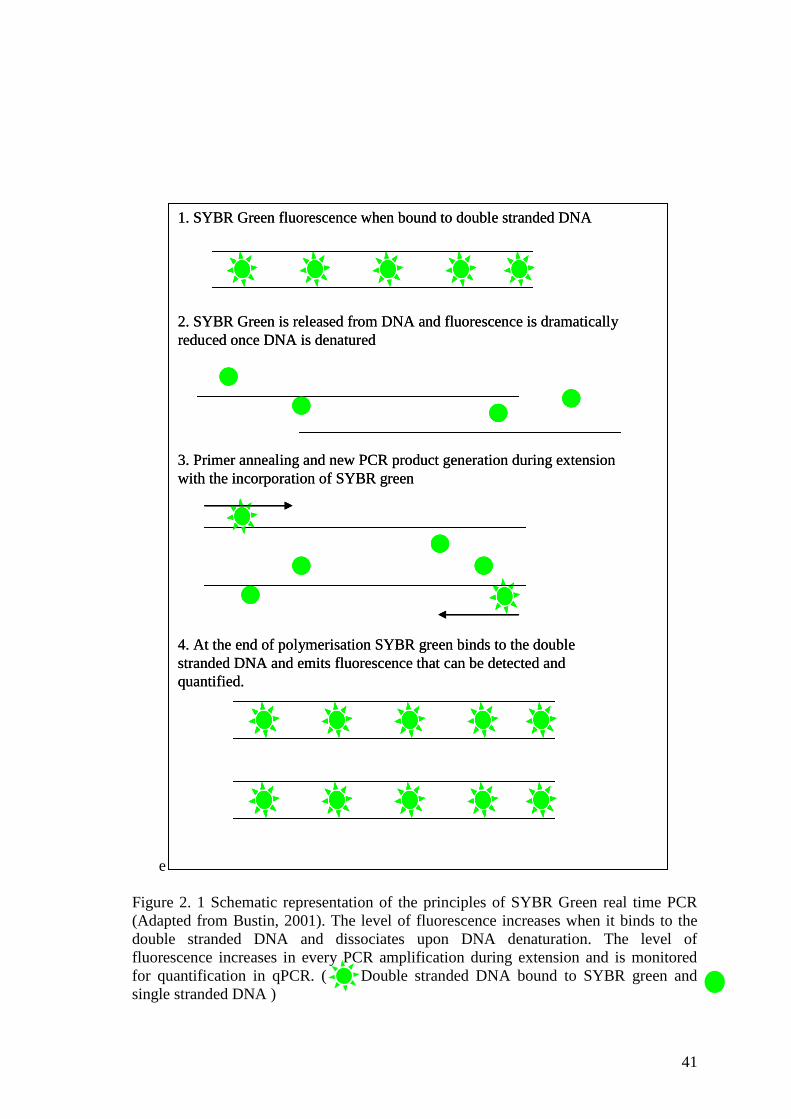
41
e
Figure 2. 1 Schematic representation of the principles of SYBR Green real time PCR
(Adapted from Bustin, 2001). The level of fluorescence increases when it binds to the
double stranded DNA and dissociates upon DNA denaturation. The level of
fluorescence increases in every PCR amplification during extension and is monitored
for quantification in qPCR. ( Double stranded DNA bound to SYBR green and
single stranded DNA )
1. SYBR Green fluorescence when bound to double stranded DNA
2. SYBR Green is released from DNA and fluorescence is dramatically
reduced once DNA is denatured
3. Primer annealing and new PCR product generation during extension
with the incorporation of SYBR green
4. At the end of polymerisation SYBR green binds to the double
stranded DNA and emits fluorescence that can be detected and
quantified.
42
2.2 Materials and Methods
2. 2. 1 Cell cultures
The cell lines, CHSE-214, CHH-1 and SHK-1 were used for the study. All chemicals
and media were purchased from Invitrogen, Paisley, UK and disposable plastics were
obtained from Fisher Scientific, Leicestershire, UK unless otherwise stated. The former
two cell lines were cultured in a growth medium (GM) containing Eagle‟s Minimal
Essential Medium (EMEM), 2 mM L-glutamine, 1% non essential amino acids (NEAA)
and 10 % (v/v) foetal calf serum (FCS) (Biosera, Ringmer, UK). For virus isolation,
maintenance medium (MM) was prepared by adding antibiotics (penicillin 100 IU/ml,
streptomycin 100 mg/ml and kanamycin 100 mg/ml) to the culture medium, while
maintaining the serum concentration at 5 % (v/v). The GM and MM for SHK-1 cells, on
the other hand, consisted of Leibovitz L-15 medium with GlutaMax, supplemented with
2 µM L-glutamine, 40 µM mercaptoethanol, 5 % (v/v) Australian foetal calf serum,
penicillin (100 IU/ml) and streptomycin (100 mg/ml).
Propagation and maintenance of these cells were carried out following standard
procedures. Briefly, 7-8 day old CHSE-214 and CHH-1 cells were washed x2 with
Dulbecco‟s phosphate buffered saline (DPBS) and trypsinised for 4 min using x1
Trypsin /EDTA (x1 trypsin in 0.01 % of ethylenediaminetetraacetic acid). The flasks
were then gently tapped to dislodge the cells from the bottom of the flask and mixed
with aliquots of GM (i.e. 3 ml for cells in 25 ml flasks) to split cells into a 1:3 ratio and
incubated in a 4 % CO2 incubator at 22oC for 18-24 h before infecting with the virus.
The SHK-1 cells were split into 1:2 ratios, in the same manner as described above from
10 day old stock flasks and grown in L-15 medium in 22oC for 48 h before being used
for virus isolation.
43
2. 2. 2 Culture of the virus
An SAV1 isolate (F93-125) (Nelson et al, 1995; Weston et al., 2002) that originated
from an Irish outbreak of SPD, kindly provided by Dr. David Smail (Marine Scotland,
Aberdeen, UK) was used in this study. Stock virus was taken from -70oC stocks and
was passaged four times in CHSE-214 cells. At the initial passage, the neat virus from
the stocks was absorbed onto the preformed CHSE-214 monolayers and harvested at 7
d.p.i by centrifuging the supernatant at 3500 x g for 10 min. In the subsequent passages,
the virus supernatant was diluted 1:10 with Hank‟s buffered salt solution (HBSS)
supplemented with 2% (v/v) foetal calf serum and was absorbed onto preformed CHSE-
214 cells in 25 ml tissue culture flasks.
To prepare stock virus for the experimental infection, three replicates of 75 ml tissue
culture flasks were seeded with CHSE-214 cells (3x10⁷ cells/flask) and absorbed with
1:10 dilution of virus prepared from the third passage of stock virus for 4 h at 15oC in
the presence of 1 % carbon dioxide. The GM was then carefully added to the flasks and
they were incubated at 15oC in a 1 % CO2 incubator while monitoring daily for cellular
changes relative to uninfected control flasks (re-supplemented with the same GM).
After the development of a CPE, cells were harvested 9 d.p.i. Then, a single cycle of
freeze-thawing at -70oC was performed before the supernatant was clarified at 3500 x g
for 10 min at 4oC in an Eppendorf 5804R centrifuge. The clarified supernatant was
aliquoted and stored at -20oC. One aliquot was back-titrated onto CHSE-214 cells to
determine the 50 % Tissue Culture Infective Dose (TCID50).
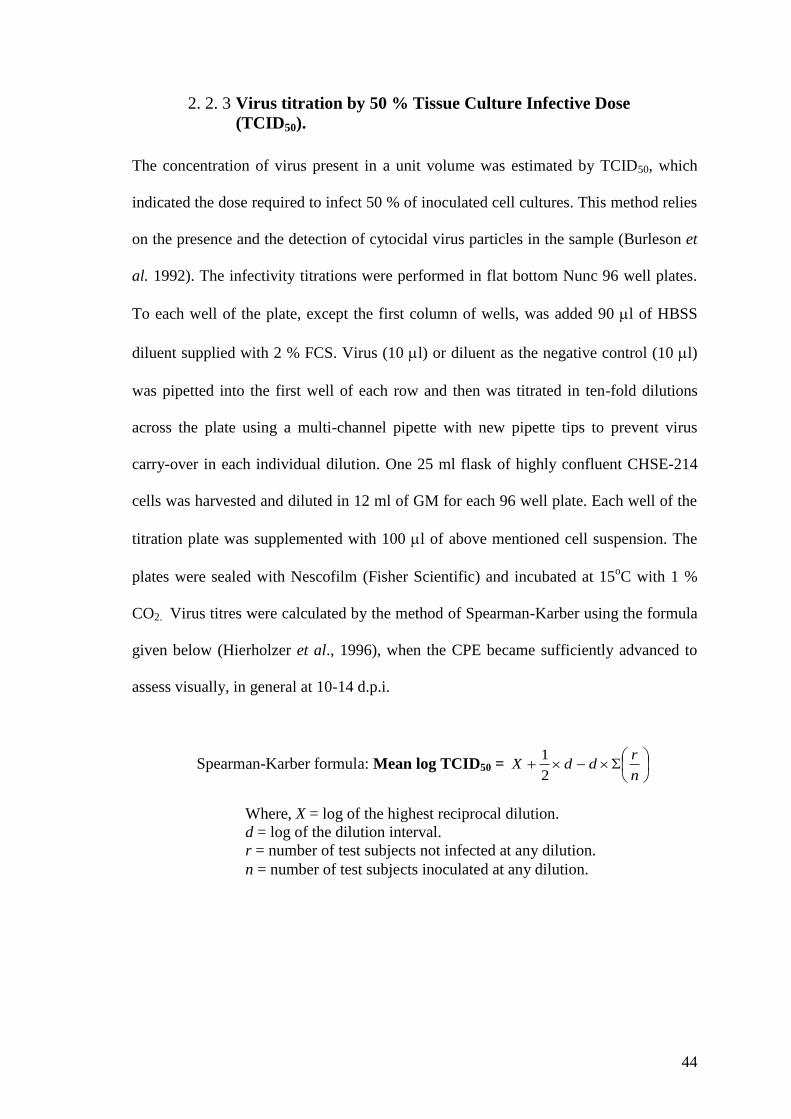
44
2. 2. 3 Virus titration by 50 % Tissue Culture Infective Dose
(TCID50).
The concentration of virus present in a unit volume was estimated by TCID50, which
indicated the dose required to infect 50 % of inoculated cell cultures. This method relies
on the presence and the detection of cytocidal virus particles in the sample (Burleson et
al. 1992). The infectivity titrations were performed in flat bottom Nunc 96 well plates.
To each well of the plate, except the first column of wells, was added 90 l of HBSS
diluent supplied with 2 % FCS. Virus (10 l) or diluent as the negative control (10 l)
was pipetted into the first well of each row and then was titrated in ten-fold dilutions
across the plate using a multi-channel pipette with new pipette tips to prevent virus
carry-over in each individual dilution. One 25 ml flask of highly confluent CHSE-214
cells was harvested and diluted in 12 ml of GM for each 96 well plate. Each well of the
titration plate was supplemented with 100 l of above mentioned cell suspension. The
plates were sealed with Nescofilm (Fisher Scientific) and incubated at 15oC with 1 %
CO2. Virus titres were calculated by the method of Spearman-Karber using the formula
given below (Hierholzer et al., 1996), when the CPE became sufficiently advanced to
assess visually, in general at 10-14 d.p.i.
Spearman-Karber formula: Mean log TCID50 =
n
rddX
2
1
Where, X = log of the highest reciprocal dilution.
d = log of the dilution interval.
r = number of test subjects not infected at any dilution.
n = number of test subjects inoculated at any dilution.
45
2. 2. 4 Experimental infection of Atlantic salmon with SAV1
Atlantic salmon parr (mean weight 48.5±9.2g, mean length 17.0±1.5 cm), obtained from
Howietoun Hatchery, Scotland, UK, were experimentally infected with SAV1 following
a one month quarantine period at the Aquaculture Research Facility, Institute of
Aquaculture, University of Stirling, UK. The stock virus prepared above was injected
I.P. into 50 fish (0.2 ml of 1 x107.33
/ TCID50 virus/fish), while control fish were injected
with 0.2 ml of CHSE-214 cell culture supernatant. Challenged and control populations
were held separately in 50 l fibreglass tanks supplied with flow-through water with a
mean water temperature of 11±1oC and monitored twice daily throughout the
experimental period of 90 d.p.i. The head kidney of fish was aseptically sampled from
5, SAV1 injected and 5, control salmon at 0.5, 1, 3, 5, 7, 10, 14, 21, 42 and 90 d.p.i. The
head kidney tissue was divided into two samples, one for virus isolation by cell culture
and one for RNA extraction. Samples for virus isolation were collected into sterile
Bijoux bottles and placed on ice until processed while the remainder was fixed in
RNAlater®
(Applied Biosystems, Warrington, UK) in Nunc 1.5 ml Cryo-tubes.
2. 2. 5 Isolation of SAV1 on CHSE-214 cells
For virus isolation, the aseptically collected head kidneys from 1, 3, 5, 7, 10, 14, 21, 42,
and 90 d.p.i were macerated on the same day after sampling with sterile sand to prepare
a 1:50 (w/v) dilution of the kidney homogenate in HBSS supplemented with 2 % FCS,
penicillin (100 IU/ml), streptomycin (100 mg/ml) and kanamycin (100 mg/ml). The
kidney homogenate was clarified by centrifuging at 2000 x g for 15 min at 4oC
(Eppendorf 5804R). Supernatants were then filtered through a 45 µm filter into sterile
universals. The clarified kidney homogenates (100 µl), and 1:100 and 1:1000 (v/v)
46
dilutions of these (100 µl), were absorbed onto 18-24 h old preformed CHSE-214 cell
(2x10⁵/well) monolayers in 24 well plates and incubated at 15
oC in a 1 % CO2
incubator. After 4 h MM was carefully added on to the cell monolayers and plates were
transferred back into the same incubator conditions. Plates were observed every other
day for 28 days for the development of a CPE.
2. 2. 6 Comparison of CHH-1, CHSE-214 and SHK-1 cells for virus
isolation
Frozen (-20oC) kidney homogenates prepared from samples taken from fish on 3 d.p.i.,
and which were all CPE positive on CHSE-214 cells in the initial virus isolation, were
thawed and absorbed onto the preformed monolayers of CHSE-214, CHH-1 and SHK-1
cells cultured in 24 well plates. Following absorption, MM was added to the CHSE-214
and CHH-1 cells, while L-15 with supplements was added to the SHK-1 cells. Cells
were incubated at 15oC and observed daily for the development of a CPE over the
course of 25 days.
Aliquots of cell culture supernatants of the first passage from the infected CHSE-214
and CHH-1 monolayers were harvested after 10 days of incubation and stored at -20oC
until the TCID50 was estimated for each sample. A ten-fold dilution series of each
supernatant was made in 96 well plates using HBSS, and these were then absorbed for 1
h onto preformed CHSE-214 and CHH-1 monolayers prepared in 96 well plates, using
three replicates for each sample. The TCID50 was estimated according to the method
described in Chapter 2.2.3 reading the plate after 15 d.p.i. The titres were compared
47
using a 2-sample t test, using Minitab v13 statistical software for Windows (Minitab
Ltd, Coventry UK).
2. 2. 7 Detection and quantification of viral RNA
2.2.7.1 RNA extraction
After overnight infiltration at 4oC, the RNAlater
® was decanted from the head kidney
tissues and these were then stored at -70oC until required for RNA extraction. This was
carried out using TRI Reagent® (Applied Biosystems) as directed by the manufacturer.
For this, 30-40 mg of the kidney sample was macerated individually with 0.8 ml of TRI
Reagent®
in nuclease free 1.5 ml eppendorf tubes (Fisher Scientific) with plastic pestles
(Fisher Scientific). The homogenate was mixed with 0.16 ml of chilled chloroform
(Sigma-Aldrich, Dorset, UK) and incubated at room temperature (RT) (22oC) for 15
min. Samples were then centrifuged at 12,000 x g for 15 min at 4oC. The supernatant
was transferred to a fresh tube and 0.4 ml of chilled isopropanol was added (Sigma-
Aldrich). The tubes were mixed several times by inverting, and then incubated for 10
min at RT before centrifuging at 4oC at 12,000 x g for 10 min. The supernatant was
removed and pellets washed with 75 % chilled ethanol by centrifuging at 10,000 x g for
5 min. The RNA pellet was eluted in 30 µl of nuclease-free water and quantified on a
Nano-drop 1000 spectrophotometer (Labtec Inc, Arizona, USA) before storing at -70oC.
The quality of the RNA was examined by electrophoresis on a 1 % agarose gel (Sigma
Aldrich), prepared in Tris-Acetate-EDTA (TAE) buffer and stained with 0.05 %
ethidium bromide (Sigma Aldrich) and run at 80 V for 30 min.
48
2.2.7.2 Reverse transcription of RNA
Total RNA was reverse-transcribed to construct cDNA for the subsequent molecular
applications using a Reverse-iTTM
MAX 1st strand synthesis kit (Abgene, Epsom, UK)
according to the manufacturer‟s instructions. Briefly, 1 µg of total RNA was mixed in a
1:3 ratio with anchored oligo-dT (500 ng/µl) and random hexamers (400 ng/µl), heated
for 5 min at 70oC, then kept on ice for 2 min before adding 2 µl, 5mM dNTP, 4 µl 5x
first strand synthesis buffer, 1 µl (50 IU/µl) Reverse-iTTM
MAX RTase blend, 1 µl
QRTase enhancer and then nuclease-free water to make the final reaction volume up to
20 µl. This mixture was incubated at 42°C for 1 h to allow cDNA synthesis to take
place, followed by 10 min incubation at 75oC for enzyme inactivation and stored at -
20oC prior to use.
2.2.7.3 RT-PCR
All primers necessary for molecular applications were purchased from MWG Biotech
(London, UK). The RT-PCR to detect the presence of SAV in the head kidney tissue of
experimentally infected and control fish was performed using a primer pair that
produces a 539 base pair (bp) product (Hodneland & Endresen, 2006). For the PCR, 25
µl of reaction mixture containing 2 µl cDNA, 1.25 µl forward (5′-
CGGGTGAAACATCTCTGCG-3′) and reverse (5′CTTGCCCTGGGTGATACTGG-3)
primers (10 µM/ml), 8 µl nuclease free H2O and 12.5 µl 2X ReddyMixTM
PCR Master
mix (composed of 0.625 U Thermoprime Taq DNA polymerase, 75mM Tris-HCL,
20mM (NH4)2SO4, 1.5 mM MgCl2, 0.01% (v/v) Tween® 20, 0.2 mM each of dNTP,
dCTP, dGTP, and dTTP) (Abgene). The thermal cycle conditions consisted of 95oC
initial denaturing for 5 min, followed by 40 cycles of 20s denaturing at 95oC, 30 s
annealing at 55oC and 1 min extension at 72
oC prior to final extension at 72
oC for 5
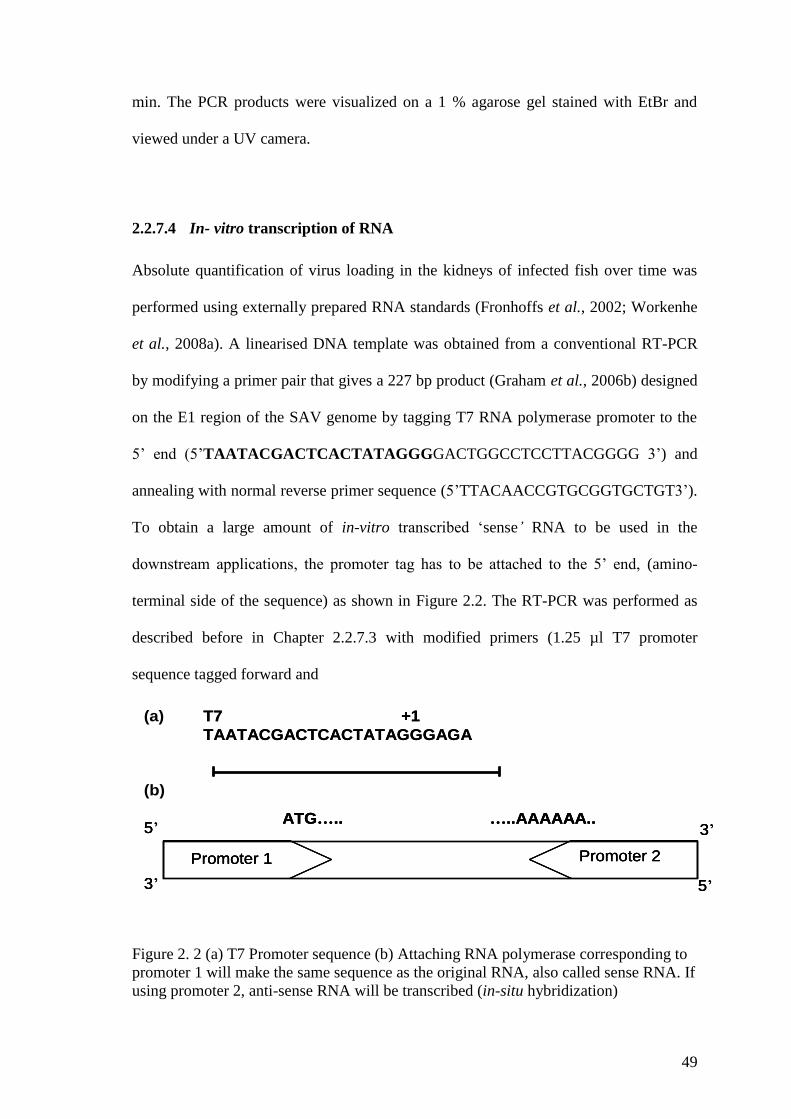
49
min. The PCR products were visualized on a 1 % agarose gel stained with EtBr and
viewed under a UV camera.
2.2.7.4 In- vitro transcription of RNA
Absolute quantification of virus loading in the kidneys of infected fish over time was
performed using externally prepared RNA standards (Fronhoffs et al., 2002; Workenhe
et al., 2008a). A linearised DNA template was obtained from a conventional RT-PCR
by modifying a primer pair that gives a 227 bp product (Graham et al., 2006b) designed
on the E1 region of the SAV genome by tagging T7 RNA polymerase promoter to the
5‟ end (5‟TAATACGACTCACTATAGGGGACTGGCCTCCTTACGGGG 3‟) and
annealing with normal reverse primer sequence (5‟TTACAACCGTGCGGTGCTGT3‟).
To obtain a large amount of in-vitro transcribed „sense’ RNA to be used in the
downstream applications, the promoter tag has to be attached to the 5‟ end, (amino-
terminal side of the sequence) as shown in Figure 2.2. The RT-PCR was performed as
described before in Chapter 2.2.7.3 with modified primers (1.25 µl T7 promoter
sequence tagged forward and
Figure 2. 2 (a) T7 Promoter sequence (b) Attaching RNA polymerase corresponding to
promoter 1 will make the same sequence as the original RNA, also called sense RNA. If
using promoter 2, anti-sense RNA will be transcribed (in-situ hybridization)
T7 +1
TAATACGACTCACTATAGGGAGA
Promoter 1 Promoter 2
5‟
3‟
3‟
5‟
ATG….. …..AAAAAA..
(a)
(b)
T7 +1
TAATACGACTCACTATAGGGAGA
Promoter 1 Promoter 2
5‟
3‟
3‟
5‟
ATG….. …..AAAAAA..
Promoter 1 Promoter 2
5‟
3‟
3‟
5‟
ATG….. …..AAAAAA..
(a)
(b)
50
normal reverse primers at 10 µM ml-1
concentration) at an annealing temperature of
58oC. The PCR product was then purified using QIAquick PCR purification kit
(Qiagen, Crawley, UK.) and the purity and the uniqueness of the size of the product was
assessed on 1 % agarose gels. The DNA content of the purified PCR product was
measured on a Nanodrop 1000 before being used as the template for the in-vitro
transcription process to obtain a large amount of sense primer using a MEGAscript®
high yield transcription kit (Ambion, UK).
The in-vitro transcription reaction was assembled at room temperature (21-25oC) by
mixing 0.2 µg of DNA obtained from PCR, 2 µl of 10x reaction buffer, 2 µl of each
nucleotide solution (UTP, ATP, CTP,GTP), 2 µl of enzyme mix and the final volume
was scaled up to 20 µl with nuclease free water. The reaction mix was incubated for 14
h at 37oC. The reaction was terminated by adding 1 µl of TURBO DNAse to the
mixture and incubated for 15 min at 37oC. The RNA transcripts obtained from in-vitro
transcription (cRNA) were then purified with phenol:chloroform extraction and
isopropanol precipitation. This method was chosen, based on the manufacturer‟s
recommendations for transcripts that encoded products less than 500 bp in size. For this,
115 µl of nuclease free water and 15 µl of ammonium acetate were mixed into the in-
vitro transcribed RNA solution. This was thoroughly mixed, then was extracted first
with an equal volume of phenol:chloroform and again with an equal volume of
chloroform. To precipitate the cRNA, an equal volume of isopropanol was added to the
aqueous phase, placed in a new tube, and chilled at -20oC for 20 min before centrifuging
at 13,000 x g for 15 min at 4oC. The cRNA pellet was finally washed with cold ethanol
and resuspended in nuclease free water.
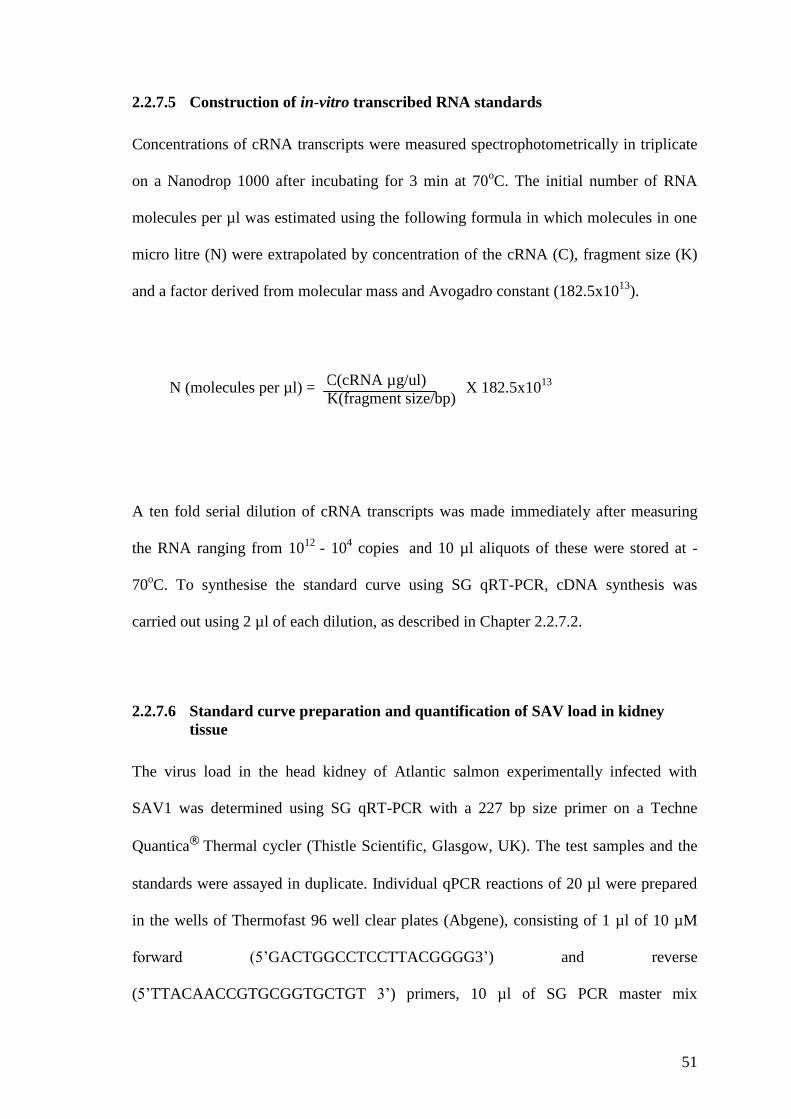
51
2.2.7.5 Construction of in-vitro transcribed RNA standards
Concentrations of cRNA transcripts were measured spectrophotometrically in triplicate
on a Nanodrop 1000 after incubating for 3 min at 70oC. The initial number of RNA
molecules per µl was estimated using the following formula in which molecules in one
micro litre (N) were extrapolated by concentration of the cRNA (C), fragment size (K)
and a factor derived from molecular mass and Avogadro constant (182.5x10¹³
).
A ten fold serial dilution of cRNA transcripts was made immediately after measuring
the RNA ranging from 1012
- 104 copies
and 10 µl aliquots of these were stored at -
70oC. To synthesise the standard curve using SG qRT-PCR, cDNA synthesis was
carried out using 2 µl of each dilution, as described in Chapter 2.2.7.2.
2.2.7.6 Standard curve preparation and quantification of SAV load in kidney
tissue
The virus load in the head kidney of Atlantic salmon experimentally infected with
SAV1 was determined using SG qRT-PCR with a 227 bp size primer on a Techne
Quantica®
Thermal cycler (Thistle Scientific, Glasgow, UK). The test samples and the
standards were assayed in duplicate. Individual qPCR reactions of 20 µl were prepared
in the wells of Thermofast 96 well clear plates (Abgene), consisting of 1 µl of 10 µM
forward (5‟GACTGGCCTCCTTACGGGG3‟) and reverse
(5‟TTACAACCGTGCGGTGCTGT 3‟) primers, 10 µl of SG PCR master mix
= C(cRNA µg/ul)
K(fragment size/bp) X 182.5x10
13 N (molecules per µl) =
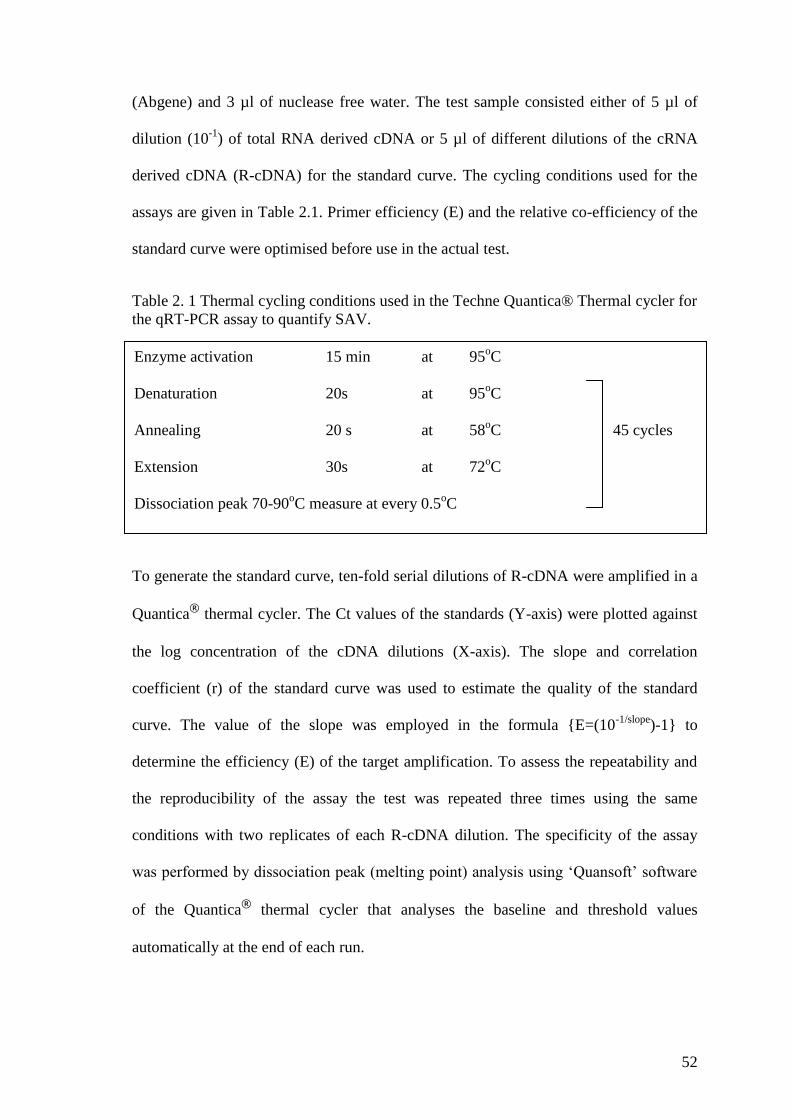
52
(Abgene) and 3 µl of nuclease free water. The test sample consisted either of 5 µl of
dilution (10-1
) of total RNA derived cDNA or 5 µl of different dilutions of the cRNA
derived cDNA (R-cDNA) for the standard curve. The cycling conditions used for the
assays are given in Table 2.1. Primer efficiency (E) and the relative co-efficiency of the
standard curve were optimised before use in the actual test.
Table 2. 1 Thermal cycling conditions used in the Techne Quantica® Thermal cycler for
the qRT-PCR assay to quantify SAV.
To generate the standard curve, ten-fold serial dilutions of R-cDNA were amplified in a
Quantica®
thermal cycler. The Ct values of the standards (Y-axis) were plotted against
the log concentration of the cDNA dilutions (X-axis). The slope and correlation
coefficient (r) of the standard curve was used to estimate the quality of the standard
curve. The value of the slope was employed in the formula {E=(10-1/slope
)-1} to
determine the efficiency (E) of the target amplification. To assess the repeatability and
the reproducibility of the assay the test was repeated three times using the same
conditions with two replicates of each R-cDNA dilution. The specificity of the assay
was performed by dissociation peak (melting point) analysis using „Quansoft‟ software
of the Quantica®
thermal cycler that analyses the baseline and threshold values
automatically at the end of each run.
Enzyme activation 15 min at 95oC
Denaturation 20s at 95oC
Annealing 20 s at 58oC 45 cycles
Extension 30s at 72oC
Dissociation peak 70-90oC measure at every 0.5
oC
53
In order to measure the absolute SAV RNA copy number, 10-1
dilutions of the cDNA
obtained from reverse transcription of total RNA (1 µg) of the head kidney of both
infected and control fish sampled at 0.5 1, 3, 5, 7, 10, 14, 21, 42 and 90 d.p.i were
analyzed by qRT-PCR with a standard curve employed in each plate. The viral copy
number in 1 µg of total RNA from the head kidney of virus infected fish was estimated
by multiplying the viral genome copies equivalent in 20 µl of the qRT-PCR reaction
mix (n) that was estimated by the „Consoft‟ software by a factor (200/10x20/5) based on
the use of 5 µl of cDNA from 200 µl of 10-1
dilution. Statistical analysis was performed
with Minitab v13 statistical software for Windows. The actual copy number resulting
from the qRT-PCR was tested for normality (Anderson-Darling test) and compared for
the significance between time points using one-way ANOVA (≤ 0.05) and Fisher‟s
individual error rate in Minitab v13 statistical software for Windows. Results of 42 d.p.i
were not included in the significance test.
2.3 Results
2. 3. 1 Isolation of SAV-1 on CHSE-214 cells
Initially CHSE-214 cells were used to detect the presence of virus from the infected
kidney samples to establish the best sampling point for the subsequent studies (i.e.
d.p.i.). All CHSE-214 cells absorbed with kidney homogenate sampled from fish at 1
d.p.i. developed a CPE in the cells (Figure 2.3) from 21 d.p.i. In contrast, kidney
sampled at 3 d.p.i. produced a CPE on CHSE-214 cells from 10 d.p.i. Three out of the
five infected kidney samples taken at 5 and 7 d.p.i. developed a CPE on cells. However,
no CPE was obtained with samples taken from fish at 21 d.p.i. or thereafter, or with any
of the control fish.
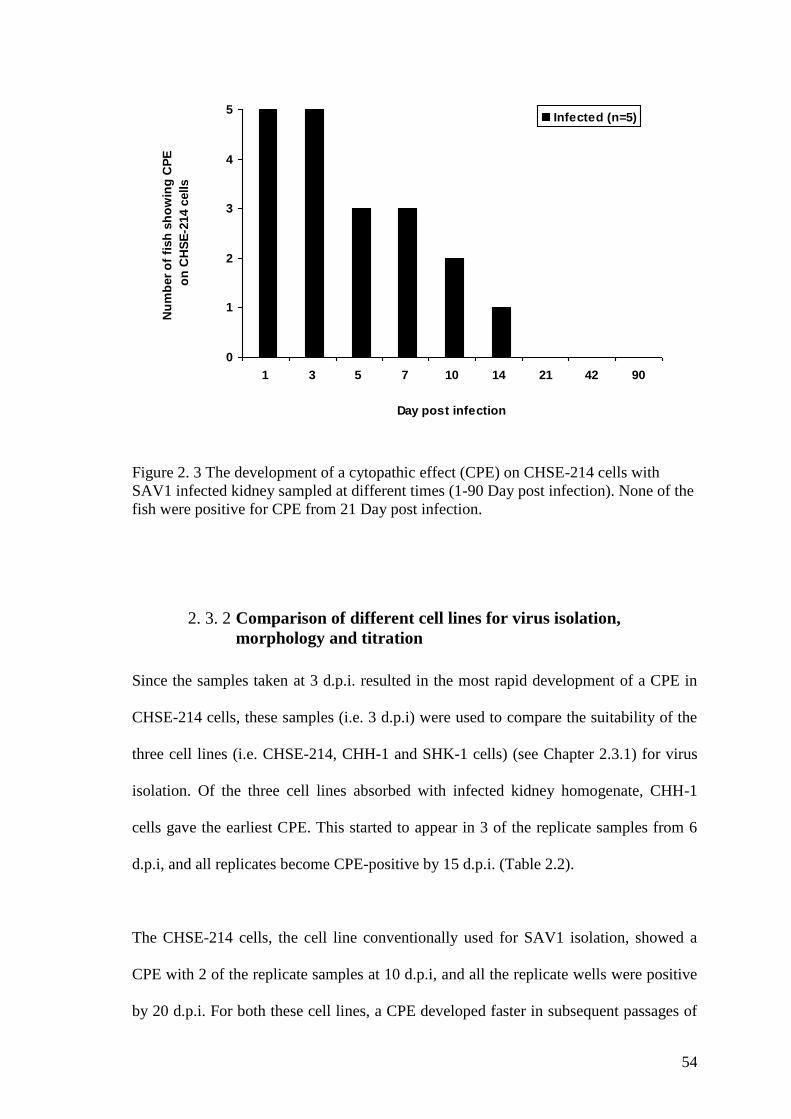
54
Figure 2. 3 The development of a cytopathic effect (CPE) on CHSE-214 cells with
SAV1 infected kidney sampled at different times (1-90 Day post infection). None of the
fish were positive for CPE from 21 Day post infection.
2. 3. 2 Comparison of different cell lines for virus isolation,
morphology and titration
Since the samples taken at 3 d.p.i. resulted in the most rapid development of a CPE in
CHSE-214 cells, these samples (i.e. 3 d.p.i) were used to compare the suitability of the
three cell lines (i.e. CHSE-214, CHH-1 and SHK-1 cells) (see Chapter 2.3.1) for virus
isolation. Of the three cell lines absorbed with infected kidney homogenate, CHH-1
cells gave the earliest CPE. This started to appear in 3 of the replicate samples from 6
d.p.i, and all replicates become CPE-positive by 15 d.p.i. (Table 2.2).
The CHSE-214 cells, the cell line conventionally used for SAV1 isolation, showed a
CPE with 2 of the replicate samples at 10 d.p.i, and all the replicate wells were positive
by 20 d.p.i. For both these cell lines, a CPE developed faster in subsequent passages of
0
1
2
3
4
5
1 3 5 7 10 14 21 42 90
Day post infection
Nu
mb
er
of
fish
sh
ow
ing
CP
E
on
CH
SE
-214 c
ells
Infected (n=5)

55
the virus (Table 2.2). In contrast, the CPE which developed in SHK-1 cells started to
appear at 20 d.p.i. and only 4 fish were positive for virus with this cell line by 25 d.p.i.
However, all samples were CPE-positive in subsequent passages on SHK-1 cells (Table
2.2). The mean TCID50 obtained on CHSE-214 (1x103.64±1.76
) and CHH-1 (1x103.36±1.4
)
cells were not significantly different (p ≤ 0.05) from each other on the first passage of
the virus. The virus titre on SHK-1 cells was not measured due to the slow development
of the CPE in this cell line.
The morphological appearance of the CPE was similar in both CHSE-214 and CHH-1
cells, starting as a localized rounding of cells on the surface of the cell monolayer,
which then spread over the cell line with cells sloughing off the edges of the affected
areas. In contrast, SHK-1 cells started to loosen from the monolayer when it started to
produce a CPE from 20 d.p.i. (Figure 2.4).
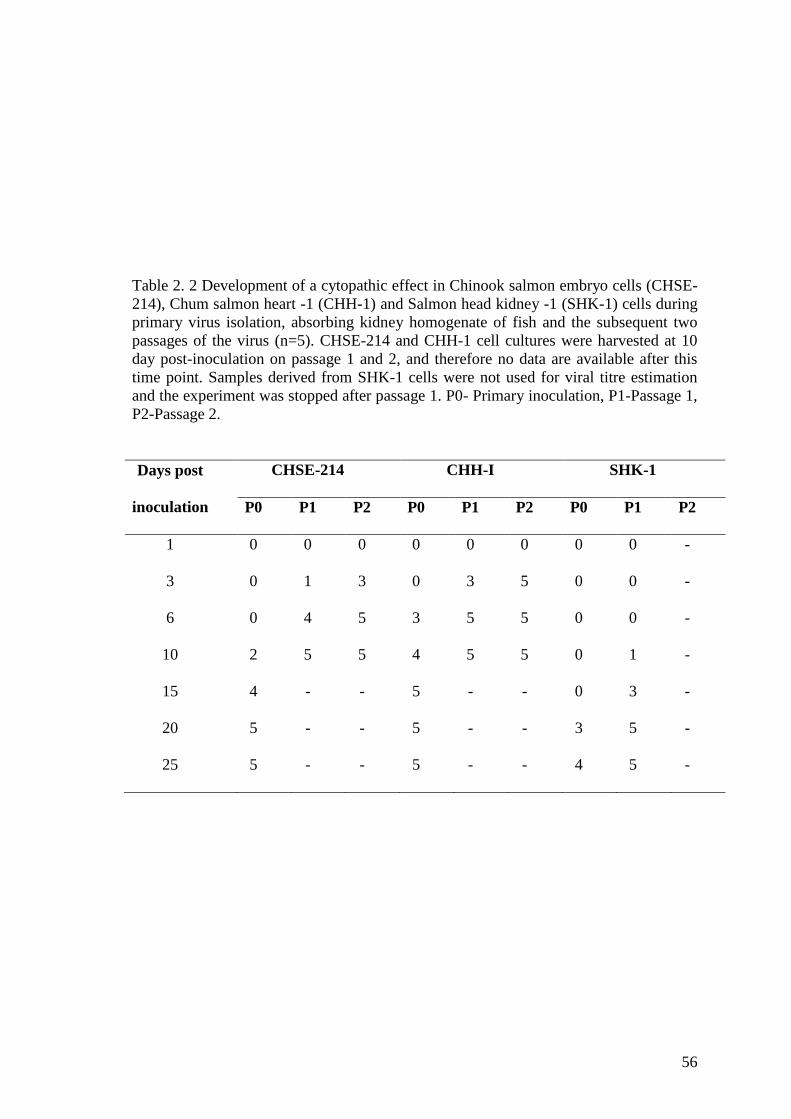
56
Table 2. 2 Development of a cytopathic effect in Chinook salmon embryo cells (CHSE-
214), Chum salmon heart -1 (CHH-1) and Salmon head kidney -1 (SHK-1) cells during
primary virus isolation, absorbing kidney homogenate of fish and the subsequent two
passages of the virus (n=5). CHSE-214 and CHH-1 cell cultures were harvested at 10
day post-inoculation on passage 1 and 2, and therefore no data are available after this
time point. Samples derived from SHK-1 cells were not used for viral titre estimation
and the experiment was stopped after passage 1. P0- Primary inoculation, P1-Passage 1,
P2-Passage 2.
Days post
inoculation
CHSE-214 CHH-I SHK-1
P0 P1 P2 P0 P1 P2 P0 P1 P2
1
3
6
10
15
20
25
0
0
0
2
4
5
5
0
1
4
5
-
-
-
0
3
5
5
-
-
-
0
0
3
4
5
5
5
0
3
5
5
-
-
-
0
5
5
5
-
-
-
0
0
0
0
0
3
4
0
0
0
1
3
5
5
-
-
-
-
-
-
-
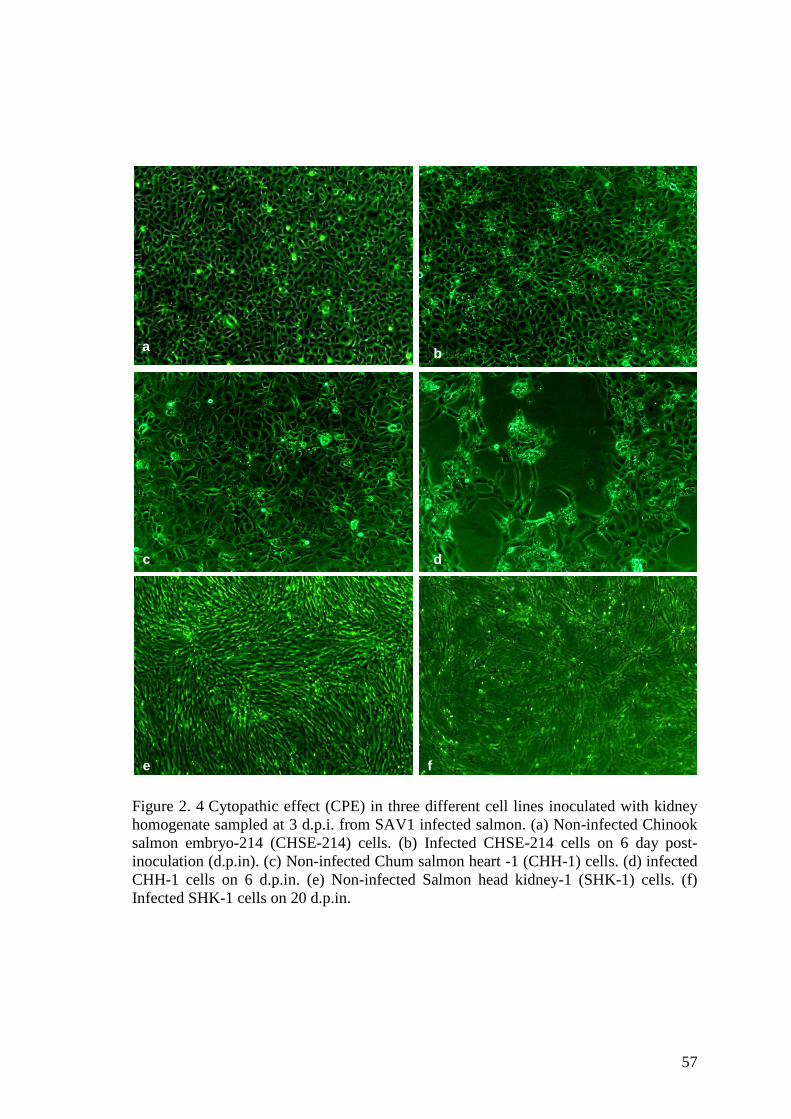
57
Figure 2. 4 Cytopathic effect (CPE) in three different cell lines inoculated with kidney
homogenate sampled at 3 d.p.i. from SAV1 infected salmon. (a) Non-infected Chinook
salmon embryo-214 (CHSE-214) cells. (b) Infected CHSE-214 cells on 6 day post-
inoculation (d.p.in). (c) Non-infected Chum salmon heart -1 (CHH-1) cells. (d) infected
CHH-1 cells on 6 d.p.in. (e) Non-infected Salmon head kidney-1 (SHK-1) cells. (f)
Infected SHK-1 cells on 20 d.p.in.
D
Aa
b
c d
e f
D
Aa
b
c d
e f
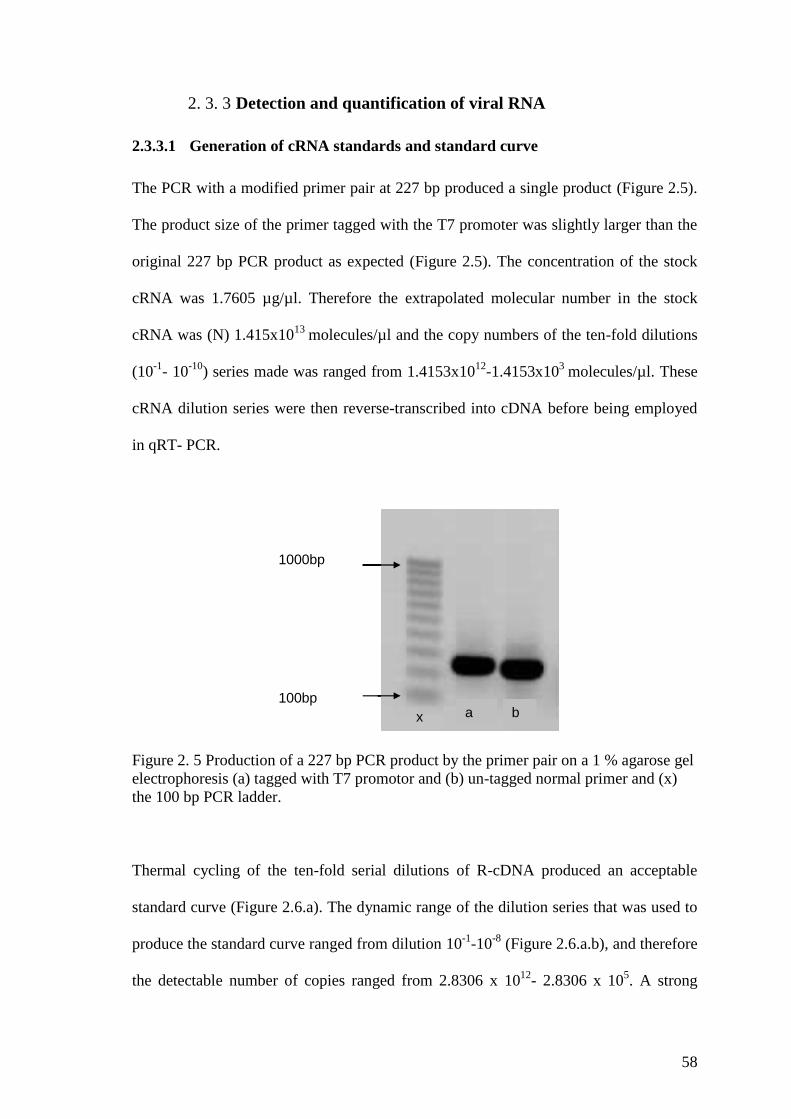
58
2. 3. 3 Detection and quantification of viral RNA
2.3.3.1 Generation of cRNA standards and standard curve
The PCR with a modified primer pair at 227 bp produced a single product (Figure 2.5).
The product size of the primer tagged with the T7 promoter was slightly larger than the
original 227 bp PCR product as expected (Figure 2.5). The concentration of the stock
cRNA was 1.7605 µg/µl. Therefore the extrapolated molecular number in the stock
cRNA was (N) 1.415x10¹³
molecules/µl and the copy numbers of the ten-fold dilutions
(10-1
- 10-10
) series made was ranged from 1.4153x10¹²
-1.4153x10³
molecules/µl. These
cRNA dilution series were then reverse-transcribed into cDNA before being employed
in qRT- PCR.
Figure 2. 5 Production of a 227 bp PCR product by the primer pair on a 1 % agarose gel
electrophoresis (a) tagged with T7 promotor and (b) un-tagged normal primer and (x)
the 100 bp PCR ladder.
Thermal cycling of the ten-fold serial dilutions of R-cDNA produced an acceptable
standard curve (Figure 2.6.a). The dynamic range of the dilution series that was used to
produce the standard curve ranged from dilution 10-1
-10-8
(Figure 2.6.a.b), and therefore
the detectable number of copies ranged from 2.8306 x 10¹²
- 2.8306 x 10⁵. A strong
1000bp
100bpbax
1000bp
100bpba
1000bp
100bp
1000bp
100bpba bax
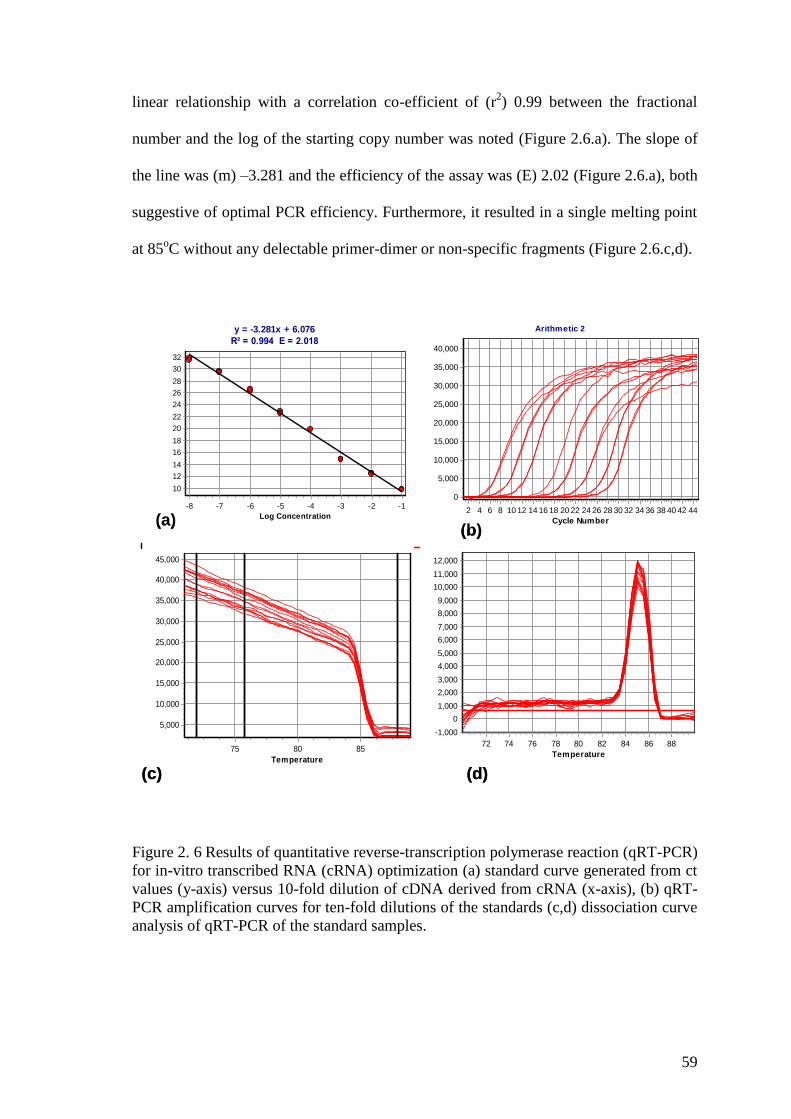
59
linear relationship with a correlation co-efficient of (r2) 0.99 between the fractional
number and the log of the starting copy number was noted (Figure 2.6.a). The slope of
the line was (m) –3.281 and the efficiency of the assay was (E) 2.02 (Figure 2.6.a), both
suggestive of optimal PCR efficiency. Furthermore, it resulted in a single melting point
at 85oC without any delectable primer-dimer or non-specific fragments (Figure 2.6.c,d).
Figure 2. 6 Results of quantitative reverse-transcription polymerase reaction (qRT-PCR)
for in-vitro transcribed RNA (cRNA) optimization (a) standard curve generated from ct
values (y-axis) versus 10-fold dilution of cDNA derived from cRNA (x-axis), (b) qRT-
PCR amplification curves for ten-fold dilutions of the standards (c,d) dissociation curve
analysis of qRT-PCR of the standard samples.
y = -3.281x + 6.076
R² = 0.994 E = 2.018
Log Concentration
-1-2-3-4-5-6-7-8
Cycle
Nu
mb
er
32
30
28
26
24
22
20
18
16
14
12
10
Arithmetic 2
Cycle Number
4442403836343230282624222018161412108642
Rela
tive F
luo
rescen
ce
40,000
35,000
30,000
25,000
20,000
15,000
10,000
5,000
0
Temperature
888684828078767472
-dF
/dT
12,000
11,000
10,000
9,000
8,000
7,000
6,000
5,000
4,000
3,000
2,000
1,000
0
-1,000
Temperature
858075
Flu
ore
scen
ce
45,000
40,000
35,000
30,000
25,000
20,000
15,000
10,000
5,000
(a)(b)
(d)(c)
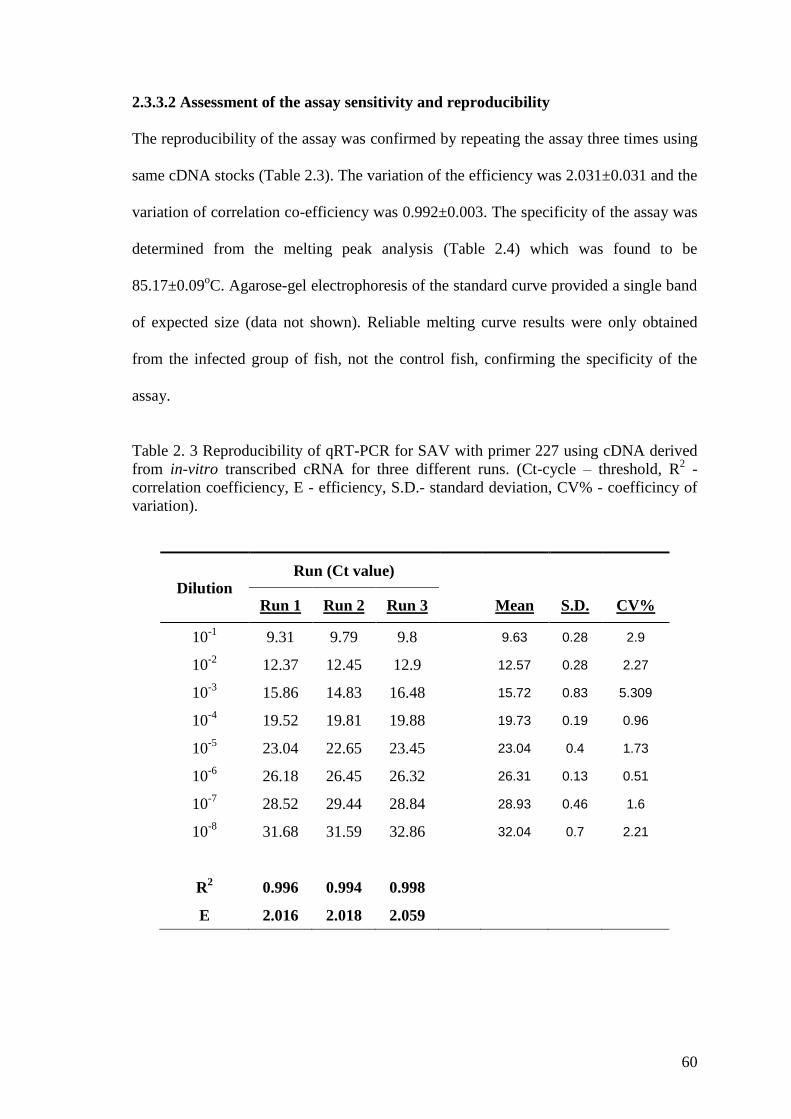
60
2.3.3.2 Assessment of the assay sensitivity and reproducibility
The reproducibility of the assay was confirmed by repeating the assay three times using
same cDNA stocks (Table 2.3). The variation of the efficiency was 2.031±0.031 and the
variation of correlation co-efficiency was 0.992±0.003. The specificity of the assay was
determined from the melting peak analysis (Table 2.4) which was found to be
85.17±0.09oC. Agarose-gel electrophoresis of the standard curve provided a single band
of expected size (data not shown). Reliable melting curve results were only obtained
from the infected group of fish, not the control fish, confirming the specificity of the
assay.
Table 2. 3 Reproducibility of qRT-PCR for SAV with primer 227 using cDNA derived
from in-vitro transcribed cRNA for three different runs. (Ct-cycle – threshold, R2 -
correlation coefficiency, E - efficiency, S.D.- standard deviation, CV% - coefficincy of
variation).
Dilution Run (Ct value)
Run 1 Run 2 Run 3 Mean S.D. CV%
10-1
9.31 9.79 9.8 9.63 0.28 2.9
10-2
12.37 12.45 12.9 12.57 0.28 2.27
10-3
15.86 14.83 16.48 15.72 0.83 5.309
10-4
19.52 19.81 19.88 19.73 0.19 0.96
10-5
23.04 22.65 23.45 23.04 0.4 1.73
10-6
26.18 26.45 26.32 26.31 0.13 0.51
10-7
28.52 29.44 28.84 28.93 0.46 1.6
10-8
31.68 31.59 32.86 32.04 0.7 2.21
R2 0.996 0.994 0.998
E 2.016 2.018 2.059
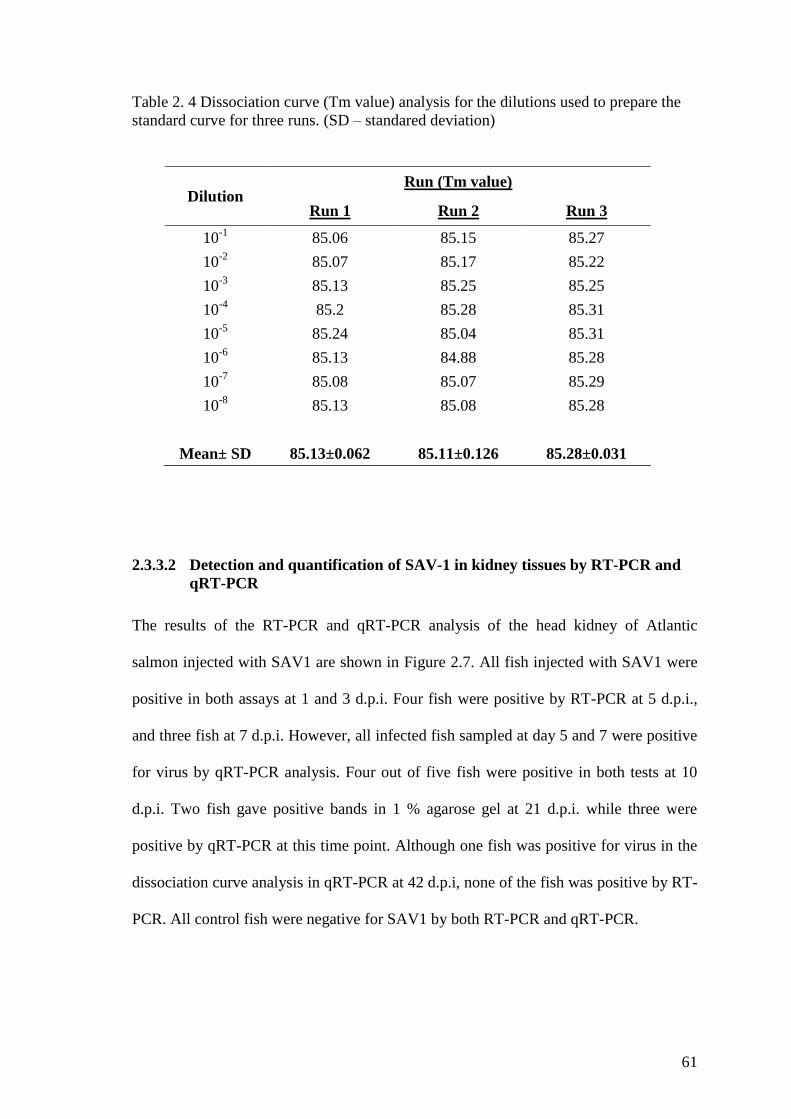
61
Table 2. 4 Dissociation curve (Tm value) analysis for the dilutions used to prepare the
standard curve for three runs. (SD – standared deviation)
Dilution Run (Tm value)
Run 1 Run 2 Run 3
10-1
85.06 85.15 85.27
10-2
85.07 85.17 85.22
10-3
85.13 85.25 85.25
10-4
85.2 85.28 85.31
10-5
85.24 85.04 85.31
10-6
85.13 84.88 85.28
10-7
85.08 85.07 85.29
10-8
85.13 85.08 85.28
Mean± SD 85.13±0.062 85.11±0.126 85.28±0.031
2.3.3.2 Detection and quantification of SAV-1 in kidney tissues by RT-PCR and
qRT-PCR
The results of the RT-PCR and qRT-PCR analysis of the head kidney of Atlantic
salmon injected with SAV1 are shown in Figure 2.7. All fish injected with SAV1 were
positive in both assays at 1 and 3 d.p.i. Four fish were positive by RT-PCR at 5 d.p.i.,
and three fish at 7 d.p.i. However, all infected fish sampled at day 5 and 7 were positive
for virus by qRT-PCR analysis. Four out of five fish were positive in both tests at 10
d.p.i. Two fish gave positive bands in 1 % agarose gel at 21 d.p.i. while three were
positive by qRT-PCR at this time point. Although one fish was positive for virus in the
dissociation curve analysis in qRT-PCR at 42 d.p.i, none of the fish was positive by RT-
PCR. All control fish were negative for SAV1 by both RT-PCR and qRT-PCR.
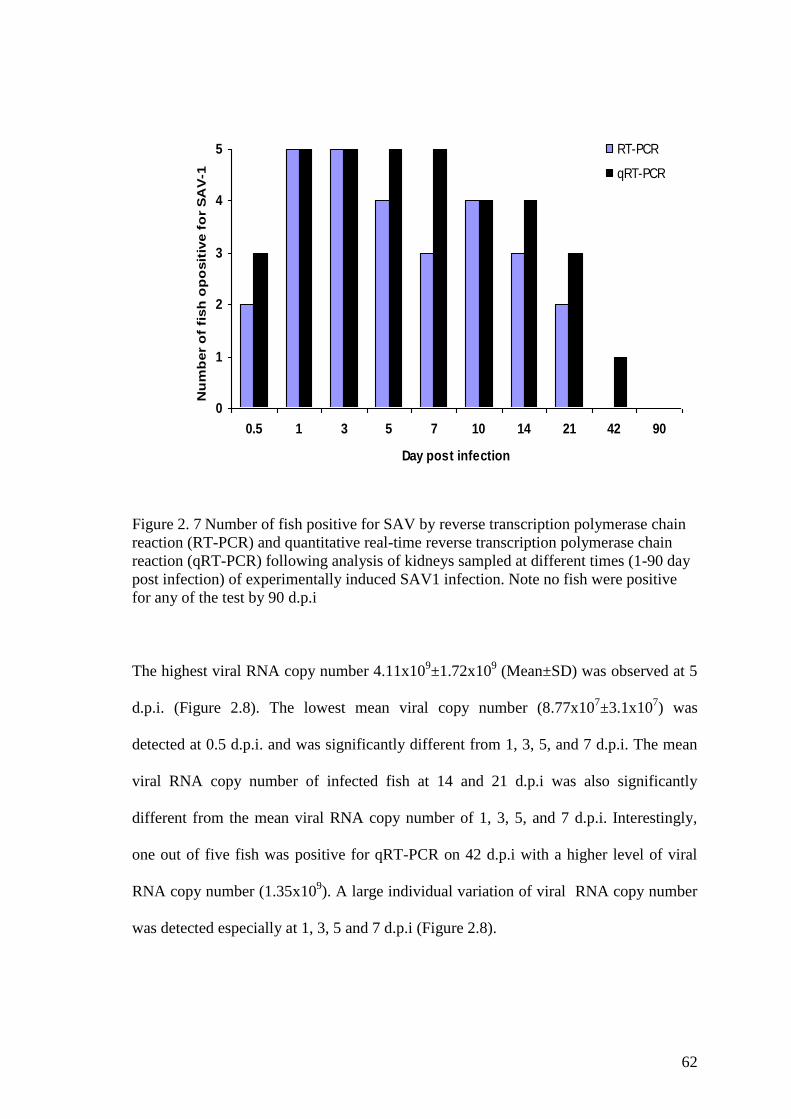
62
Figure 2. 7 Number of fish positive for SAV by reverse transcription polymerase chain
reaction (RT-PCR) and quantitative real-time reverse transcription polymerase chain
reaction (qRT-PCR) following analysis of kidneys sampled at different times (1-90 day
post infection) of experimentally induced SAV1 infection. Note no fish were positive
for any of the test by 90 d.p.i
The highest viral RNA copy number 4.11x10⁹±1.72x10
9 (Mean±SD) was observed at 5
d.p.i. (Figure 2.8). The lowest mean viral copy number (8.77x10⁷±3.1x10
7) was
detected at 0.5 d.p.i. and was significantly different from 1, 3, 5, and 7 d.p.i. The mean
viral RNA copy number of infected fish at 14 and 21 d.p.i was also significantly
different from the mean viral RNA copy number of 1, 3, 5, and 7 d.p.i. Interestingly,
one out of five fish was positive for qRT-PCR on 42 d.p.i with a higher level of viral
RNA copy number (1.35x10⁹). A large individual variation of viral RNA copy number
was detected especially at 1, 3, 5 and 7 d.p.i (Figure 2.8).
0
1
2
3
4
5
0.5 1 3 5 7 10 14 21 42 90
Day post infection
Nu
mb
er
of
fish
op
osit
ive f
or
SA
V-1
RT-PCR
qRT-PCR
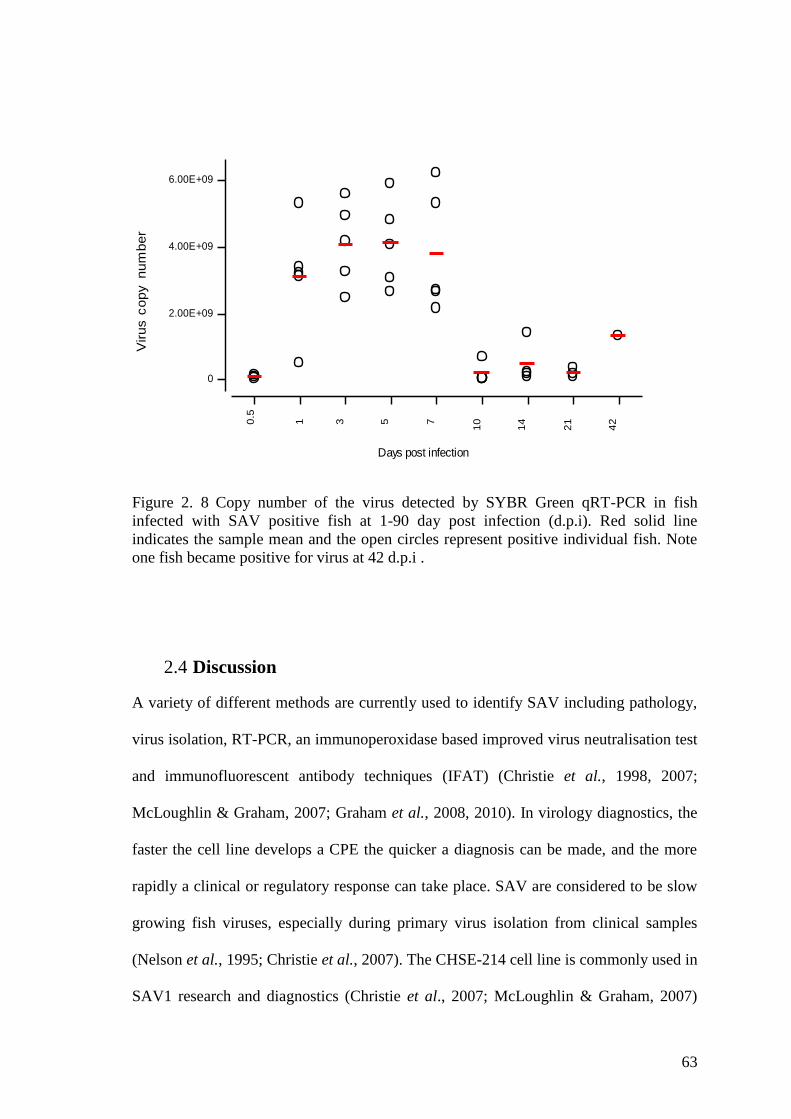
63
Figure 2. 8 Copy number of the virus detected by SYBR Green qRT-PCR in fish
infected with SAV positive fish at 1-90 day post infection (d.p.i). Red solid line
indicates the sample mean and the open circles represent positive individual fish. Note
one fish became positive for virus at 42 d.p.i .
2.4 Discussion
A variety of different methods are currently used to identify SAV including pathology,
virus isolation, RT-PCR, an immunoperoxidase based improved virus neutralisation test
and immunofluorescent antibody techniques (IFAT) (Christie et al., 1998, 2007;
McLoughlin & Graham, 2007; Graham et al., 2008, 2010). In virology diagnostics, the
faster the cell line develops a CPE the quicker a diagnosis can be made, and the more
rapidly a clinical or regulatory response can take place. SAV are considered to be slow
growing fish viruses, especially during primary virus isolation from clinical samples
(Nelson et al., 1995; Christie et al., 2007). The CHSE-214 cell line is commonly used in
SAV1 research and diagnostics (Christie et al., 2007; McLoughlin & Graham, 2007)
42
21
14
1075310
.5
6.00E+09
4.00E+09
2.00E+09
0
Days post infection
Vir
us
co
py
nu
mb
er
64
however, a number of drawbacks have been reported with use of this cell line in primary
virus isolation, such as a delayed CPE on primary inoculation and the requirement for
several passages to develop a visible CPE. In some instances, this leads to increased
false negative results (Nicola et al., 1999; Jewhurst et al., 2004). The suitability of
different cell lines for effective diagnosis of SAV1 was therefore examined using CHH-
1 and SHK-1 along with CHSE-214 cells, with the aim evaluating them as a possible
alternative for SAV1 isolation instead of CHSE-214. In addition, the amount of virus
present in the head kidney of experimentally infected Atlantic salmon was also
measured using a qRT-PCR to study the virus kinetics during establishment and
propagation of experimentally induced SAV1 infection.
From initial virus isolation using CHSE-214 cells, high numbers of fish were found to
be infected with SAV during the 1st week post infection. A CPE started to develop with
the kidney samples taken at 1 d.p.i only after 20 d.p.in compared to the kidney samples
taken at 3 d.p.i which gave a CPE from day 10 after primary inoculation. The late
development of CPE from samples taken at 1 d.p.i could possibly be due to the low
level of infectious particles in the sample or could also be from contamination by
remnants of the original I.P. injection.
From the results of the cell culture, the kidney homogenates prepared from 3 d.p.i.
samples were used for the subsequent comparative studies because it was assumed that
these samples had a higher virus load compared to the other sampling points. With
regard to virus isolation, the appearance of a CPE was faster in CHH-1 cells compared
with the other two cell lines, although the virus titre was not significantly different to
that obtained with CHSE-214 cells after the first passage of the virus. On the other hand
65
SHK-1 cells produced a CPE much later than the other two cell lines, with CPE starting
to appear around 20 d.p.in.
The CHH-1 cells are fibroblast cells that originated from Chum salmon (Oncorhynchus
keta Walbaum) heart (Lannan et al., 1984; Fryer & Lannan, 1994) and were found to
perform better for primary SAV1 isolation and propagation in this experiment compared
to conventional CHSE-214 cells, which are epithelial cells that originate from Chinook
salmon (Oncorhynchus tshawytscha Walbaum) embryo. As the CHH-1 cell line is of
cardiac origin, it may be useful for studying the host response to the virus in-vitro, since
the heart is one of the major target organs of this virus.
The SHK-1 cells are macrophage-like, derived from Atlantic salmon head kidney
leukocytes (Dannevig et al., 1997), and have been used in immunological, antiviral and
host pathogen interaction studies in-vitro for different viral diseases affecting salmonids
(Jensen & Robertsen, 2002; Martin et al., 2007) including SAV (Gahlawat et al., 2009).
The CPE development in SHK-1 was delayed compared to the other two cell lines used
in this study supporting the observation of Graham et al., (2008) who also found that
not all SAV isolates grew in this cell line and always gave a lower titre than CHSE-214.
In a recent study by Gahlawat et al., (2009), that was conducted to observe antiviral
gene expression, they also found SHK cells to be relatively resistant to SAV infection.
No CPE was reported even at 14 d.p.in, the day the last sample was taken. However, the
ability of SHK-1 cells to support SAV1 isolation and propagation as seen in this study
suggests that this cell line is still a useful tool for studying the immunological and anti-
viral mechanisms of the host against this group of viruses. On the other hand, CHSE-
214 cells do not have an inherent ability to produce an antiviral effect against the virus
66
(Jensen et al., 2002) which limits their usefulness for host-pathogen interaction studies
in-vitro.
Detecting ongoing viral infection rapidly and quantitatively in fish is important for
effective disease diagnosis and for studies examining virus-host interactions. It is
known that SAV isolation from clinical samples is difficult; therefore an RT-PCR assay
was performed to confirm the presence of virus in the tissue samples using a pre-
optimized primer pair that produced a 536 bp PCR product (Hodneland & Endresen,
2006). Similar to cell culture results, RT-PCR also detected high numbers of SAV1
positive fish at the early stage of infection but with increased sensitivity. Overall, 60 %
of fish were positive for the virus by RT-PCR over the 90 day experimental period
compared with the cell culture where only 42 % of the fish were positive.
Actual quantification of copy number of the viral RNA present in kidney tissue of
infected fish was performed using a 227 bp primer designed from the E1 region of the
SAV genome (Graham et al., 2006b). In contrast to the original assay described by
Graham et al., (2006b), which used cloned synthetic transcripts, the present qRT-PCR
assay was developed using RNA transcribed in-vitro. Absolute quantification of the
target gene using a synthetic transcript was used here to measure the actual number of
molecules present in the test sample with the help of the standard curve (Fronhoffs et
al., 2002). In this, the forward primer sequence of the target transcript was modified by
tagging a T7 promoter, which acts as a polymerase to generate large amounts of
synthetic RNA transcripts in-vitro. The PCR product obtained was used as the template
and the T7 promoter initiates the transcription reaction. The target copy number of the
purified RNA was then estimated as described by Fronhoffs et al., (2002) to obtain a
67
standard curve for absolute quantification of the viral RNA copy number. T7 promoter-
based transcription is the most commonly used method for RNA synthesis in-vitro in
molecular biology applications including real-time PCR (Fronhoffs et al., 2002). In this
method, the same primer was used both to prepare the synthetic RNA and for the qRT-
PCR. Hence the same transcript was amplified in both test and the standard samples in
the same plate, the actual number of target molecules present in the test sample were
determined in relation to the amount of RNA transcripts present in the standards
(Fronhoffs et al., 2002; Workenhe et al., 2008a). Viral RNA quantification using
synthetic RNA, as described here, was recently performed for quantifying ISAV
(Workenhe et al., 2008a). Use of in-vitro transcribed RNA for the absolute
quantification has simplified the absolute qRT-PCR assay avoiding the need for cloning
to generate synthetic transcripts to obtain the standard curve.
The SG real time chemistry used in this study was chosen due to its low cost and
simplicity. The ability to simultaneously detect the virus load and the presence or
absence of the virus in the test samples enhances the usefulness of the assay compared
to conventional RT-PCR. To improve the sensitivity of the assay fluorogenic probes
(Hodneland & Endresen, 2006) or molecular beacon methods could have been used, but
SG proved suitable enough for the present study and allowed the main objectives to be
accomplished (i.e. quantifying the target transcripts to evaluate the virus load over time
and to examine the kinetics of viral infection). High repeatability was demonstrated
during pre-optimization of the assay and the results were similar to these of the initial
assay performed by Graham et al., (2006b) using the same primer pair. The melting
peak analysis showed a single product that peaked around 85oC suggesting high
specificity. A wider dynamic range was observed for the assay with detection of viral
68
copies between 1012
and 105. This was a ten-fold increase of target transcript detection
compared to the original assay described by Graham et al., (2006b).
In general qRT-PCR assays are considered to be 10-100 times more sensitive than
conventional RT-PCR. In this study, out of the total fish injected with the virus, 58 %
and 68 % fish were positive for SAV by RT-PCR and qRT-PCR respectively, indicating
high sensitivity of the qRT-PCR assay. In general, theose fish that were positive by
qRT-PCR but not by RT-PCR had high Ct values suggesting that only fish that had high
viral content were reported positive by RT-PCR. The highest mean of target transcripts
was observed in the sample taken at 5 d.p.i.. The sample of 3 d.p.i, which has given the
fastest CPE on CHSE-214 at the initial virus isolation also had a high level of
transcripts, but had 1x10⁶ copies less than samples taken at 5 d.p.i. This difference
could possibly be due to the variation in the level of virus present in individual fish. The
low amount of target molecules present in samples taken at 0.5 d.p.i and 1 d.p.i was
significantly different and suggest that active replication of virus had possibly
commenced around 1 d.p.i in the infected fish. Although the level of viral RNA does
not directly indicate the virulence or infectivity of the virus (Niesters, 2001), it still
provides useful supportive information to confirm the results of cell culture. Further
more, the high viral copy numbers at the early stages and the mean copy number were
not significantly different between time points of 1, 3, 5 and 7 d.p.i. in this experiment
and could possibly be an indirect reflection of viraemia in infected fish. The dramatic
reduction in virus loading at 10 d.p.i, and thereafter could be reflective of antibody
associated viral clearance, as seen around 10-14 d.p.i. in a similar experiment carried
out by Christie et al., (2007). The detection of virus in fish that was positive at 42 d.p.i,
69
and the infection in this could be possibly be result from initial I.P. injection of SAV1 in
which establishment of infection may have delyaed.
In summary, the qRT-PCR assay developed here enabled quantification of viral-load of
SAV in the head kidney over time, giving an indication of how the virus establishes
infection in experimentally infected fish, and this information will be used in host-virus
interaction studies in future chapters to describe the pathogenesis and immune
mechanisms associated with SAV1 infection. The qRT-PCR assay appeared to be more
sensitive than conventional cell culture and RT-PCR, and therefore will be useful for
assessing the virus-load in field samples. It has also been shown that CHH-1 cells give a
faster CPE than the conventionally used CHSE-214 cells, which is interesting as these
cells are derived from heart, one of the target organs of the disease
70
Chapter 3
Interferon-mediated Antiviral Response in
Experimentally Induced Salmonid Alphavirus 1
Infection in Atlantic Salmon
3.1 Introduction
Understanding the host immune response to disease can help in the improvement of
vaccines and therapeutics to combat disease outbreaks. It is known that innate immune
mechanisms play a vital role in protecting fish against viral diseases (Whyte, 2007), and
this has been an active area of discussion in recent years in order to manage diseases in
aquaculture (Martin et al., 2008). Interferons are cytokines that induce an antiviral state
in cells as a first line of defence against pathogens in vertebrates, particularly against
viruses (Abbas et al., 2000). These molecules have also been reported in teleosts
including salmon (Robertsen et al., 2003; Robertsen 2006, 2008). The classical IFNs or
IFN-I consist of two types of molecule INF α and INF β (INF α/β), and are induced in
all nucleated vertebrate cells by the presence of double stranded RNA (dsRNA), such
viruses or poly I:C (Abbas et al., 2000; Sen, 2001). Interferon II (IFN-II), on the other
hand, is represented solely by INF-γ and is produced by natural killer cell (NK cell) and
Th1 cells after stimulation with Interleukin-12 (IL-12), IL-18, mitogen, or antigens
(Schroder et al., 2004; Zou et al., 2005). This protective cytokine can act on many
different cell types, including macrophages, T-cells, and NK cells (Zou et al., 2005;
Castro et al., 2008). Both IFN-I and IFN-II signal to the nucleus of the cell via the Janus
kinases and Signal Transducers and Activators of Transcription (Jak/STAT) pathway
using different receptors and mediators. Formation of complexes of IFN-I and
heterodymaric IFN-I receptors (IFNAR1 and IFNAR2) activate Jak1, and tyrosine
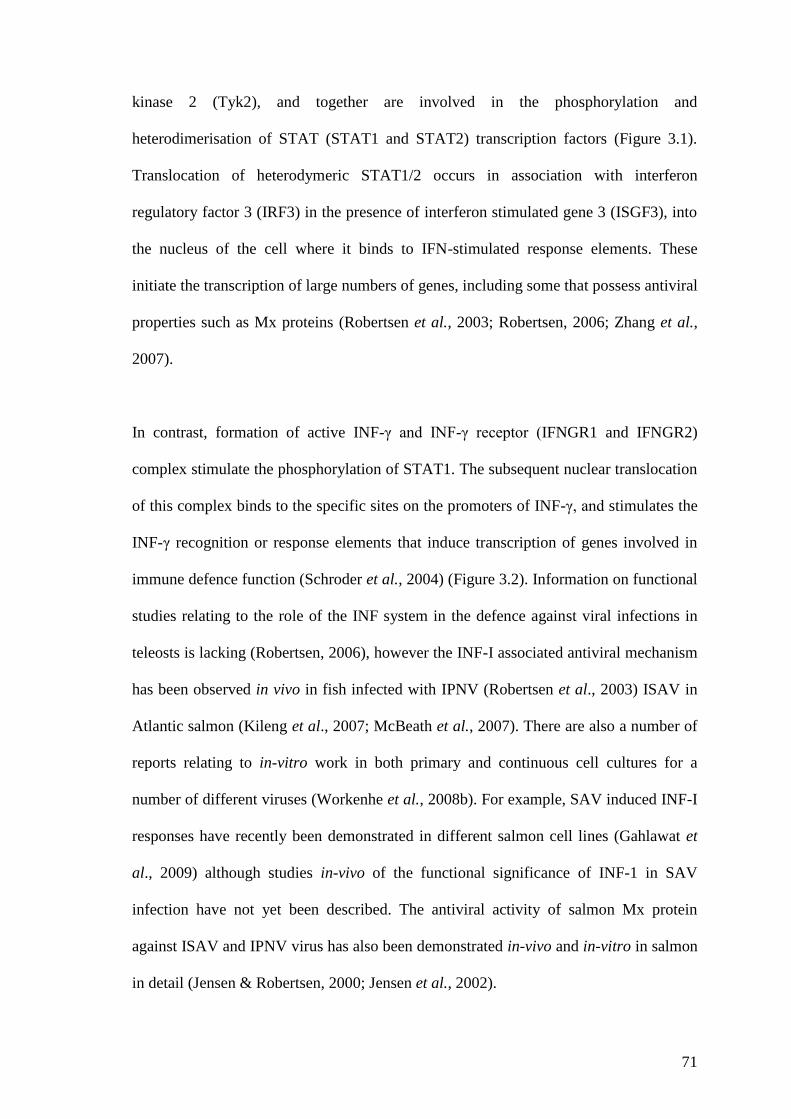
71
kinase 2 (Tyk2), and together are involved in the phosphorylation and
heterodimerisation of STAT (STAT1 and STAT2) transcription factors (Figure 3.1).
Translocation of heterodymeric STAT1/2 occurs in association with interferon
regulatory factor 3 (IRF3) in the presence of interferon stimulated gene 3 (ISGF3), into
the nucleus of the cell where it binds to IFN-stimulated response elements. These
initiate the transcription of large numbers of genes, including some that possess antiviral
properties such as Mx proteins (Robertsen et al., 2003; Robertsen, 2006; Zhang et al.,
2007).
In contrast, formation of active INF-γ and INF-γ receptor (IFNGR1 and IFNGR2)
complex stimulate the phosphorylation of STAT1. The subsequent nuclear translocation
of this complex binds to the specific sites on the promoters of INF-γ, and stimulates the
INF-γ recognition or response elements that induce transcription of genes involved in
immune defence function (Schroder et al., 2004) (Figure 3.2). Information on functional
studies relating to the role of the INF system in the defence against viral infections in
teleosts is lacking (Robertsen, 2006), however the INF-I associated antiviral mechanism
has been observed in vivo in fish infected with IPNV (Robertsen et al., 2003) ISAV in
Atlantic salmon (Kileng et al., 2007; McBeath et al., 2007). There are also a number of
reports relating to in-vitro work in both primary and continuous cell cultures for a
number of different viruses (Workenhe et al., 2008b). For example, SAV induced INF-I
responses have recently been demonstrated in different salmon cell lines (Gahlawat et
al., 2009) although studies in-vivo of the functional significance of INF-1 in SAV
infection have not yet been described. The antiviral activity of salmon Mx protein
against ISAV and IPNV virus has also been demonstrated in-vivo and in-vitro in salmon
in detail (Jensen & Robertsen, 2000; Jensen et al., 2002).
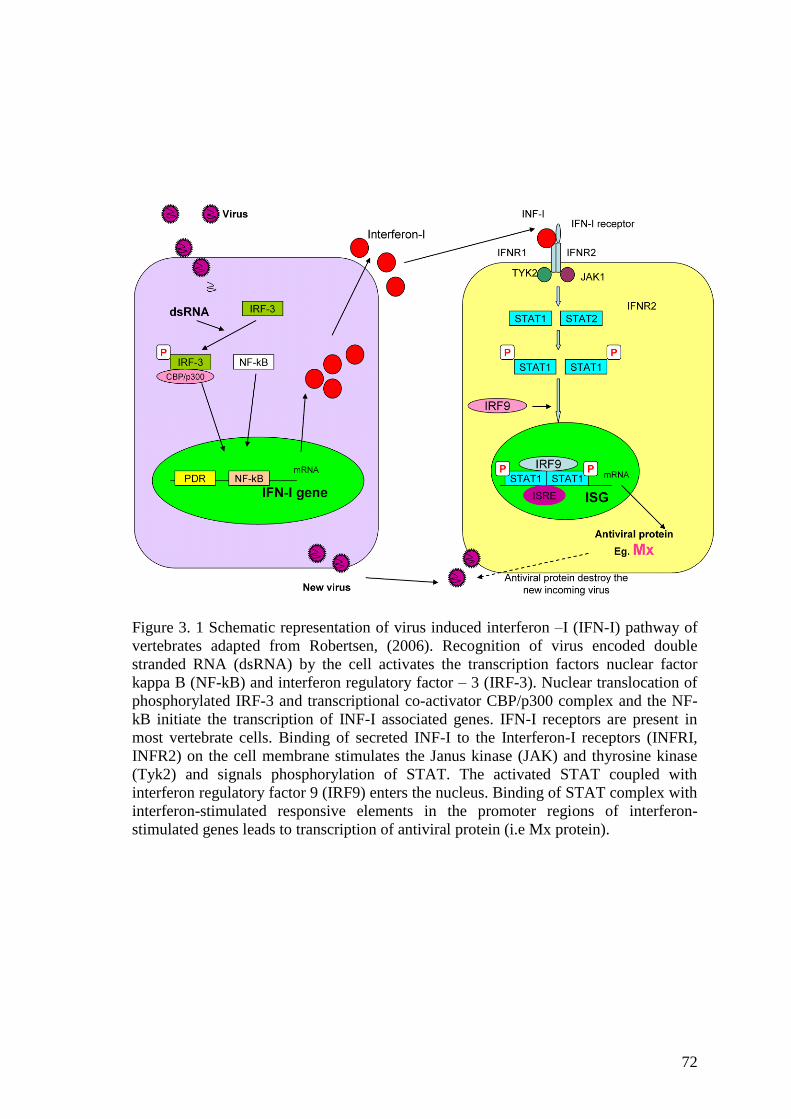
72
Figure 3. 1 Schematic representation of virus induced interferon –I (IFN-I) pathway of
vertebrates adapted from Robertsen, (2006). Recognition of virus encoded double
stranded RNA (dsRNA) by the cell activates the transcription factors nuclear factor
kappa B (NF-kB) and interferon regulatory factor – 3 (IRF-3). Nuclear translocation of
phosphorylated IRF-3 and transcriptional co-activator CBP/p300 complex and the NF-
kB initiate the transcription of INF-I associated genes. IFN-I receptors are present in
most vertebrate cells. Binding of secreted INF-I to the Interferon-I receptors (INFRI,
INFR2) on the cell membrane stimulates the Janus kinase (JAK) and thyrosine kinase
(Tyk2) and signals phosphorylation of STAT. The activated STAT coupled with
interferon regulatory factor 9 (IRF9) enters the nucleus. Binding of STAT complex with
interferon-stimulated responsive elements in the promoter regions of interferon-
stimulated genes leads to transcription of antiviral protein (i.e Mx protein).
73
Figure 3. 2 Schematic representation of pathogen (i.e. virus) induced interferon-γ (INF-
γ) pathway adapted from Robertsen, (2006). Both innate and adaptive immune
responses stimulate INF- γ production in vertebrate cells. Natural Killer cells (NK cells)
that are stimulated by interleukin-12 and -18 initiate production of INF- γ as a non-
specific immune response during the innate immune response. In the adaptive-immune
response T-helper cells initiate the production of INF-γ. Coupling of INF-γ to the INF- γ
receptors stimulates the JAK-STAT pathway and results in nuclear translocation of
STAT 1 and STAT 2. Binding of STAT with the specific site of the INF- γ responsive
genes (GAS) in the nucleus initiates the transcription of a wide range of INF- γ
responsive genes resulting in up-regulation of macrophage mediated virus destruction
and antiviral protein (i.e. PKR, OAS) synthesis.
NK cells T-helper cells
Innate immune system
IL-12, IL-18
INFγ
Virus
INFγ receptor
Adaptive immune system
MHC antigen presentation
STAT1
JAK1JAK2
STAT1
STAT1
PP
STAT1
GAS
STAT1
PP
STAT1
STAT1
PP
STAT1
Macrophages
Activate production of
Phagocyte oxidase
Nitric oxide synthase
Guanylate binding protein
MHC-II
Most of other cells
PKR
OAS
MHC-I
mRNA
74
The gene encoding INF-γ has recently been sequenced in salmonids (Zou et al., 2005;
Robertsen, 2006; Purcell et al., 2009), although the evidence for functional activities of
these molecules was described some time before (Graham & Secombes, 1988). In
general, INF-γ is involved in both the innate and the cell-mediated adaptive immune
responses and is involved in combating both intra-cellular and extra-cellular pathogens
(Schroder et al., 2004; Castro et al., 2008).
Administration of INF-I in-vivo reduces viraemia and pathogenesis suggesting it could
possibly be used as an antiviral treatment. It has also been reported that the virus
becomes more virulent in mammals in natural viral infections in the absence of an INF
system (Sen, 2001). Further, Mx protein-associated immune protection has been
observed in DNA vaccinated fish against viral haemorrhagic septicaemia virus (VHSV)
during the early stages of the virus challenge used to assess the protection provided by
the DNA vaccine (McLauchlan et al., 2003; Acosta et al., 2005). In an evolutionary
sense there is a dynamic equilibrium between the virus and the host‟s INF system. The
INF system is able to manipulate the virus replication cycle either via the INF pathway
or the immune system and most probably affects a single or a number of steps in the
virus replication cycle such as virus penetration and un-coating, mRNA transcription,
viral protein synthesis, viral genome replication, assembly, or release depending on the
group of viruses involved and the target tissues specific for the particular virus being
examined (Robertsen et al., 2003; Zhang et al., 2007). However it has become evident
that viruses also possess unique mechanisms in protecting themselves from the INF
system (Cann, 2005).
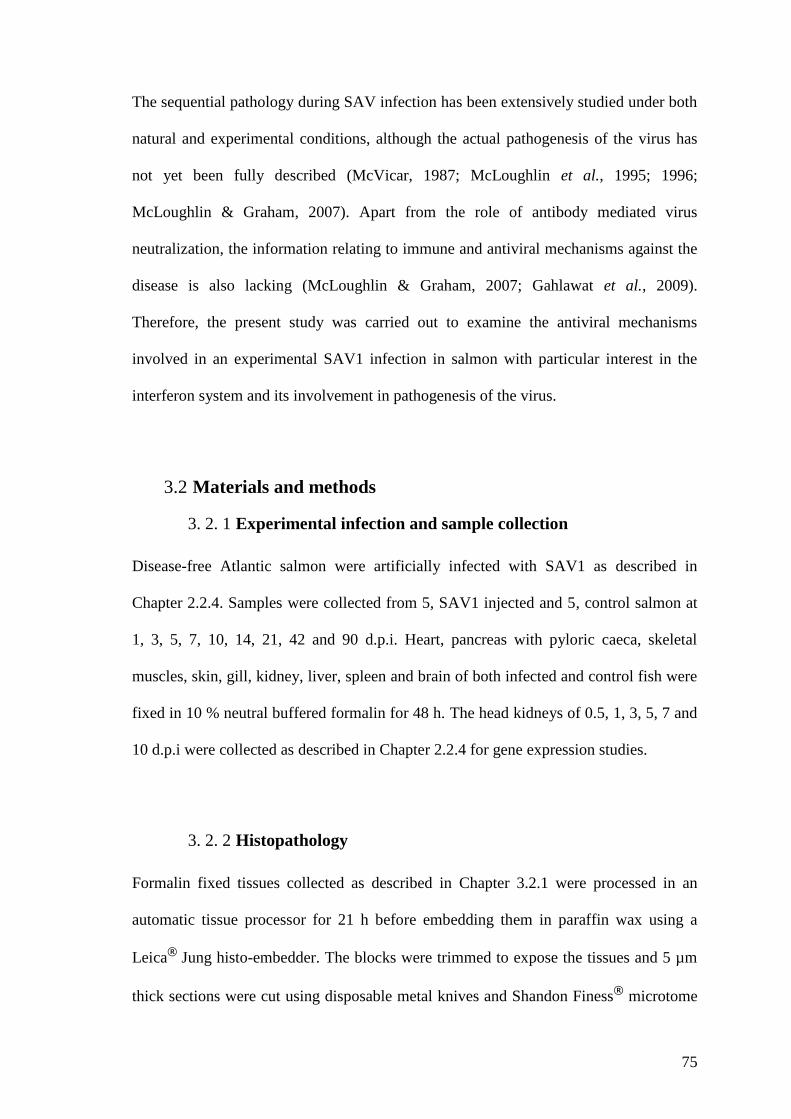
75
The sequential pathology during SAV infection has been extensively studied under both
natural and experimental conditions, although the actual pathogenesis of the virus has
not yet been fully described (McVicar, 1987; McLoughlin et al., 1995; 1996;
McLoughlin & Graham, 2007). Apart from the role of antibody mediated virus
neutralization, the information relating to immune and antiviral mechanisms against the
disease is also lacking (McLoughlin & Graham, 2007; Gahlawat et al., 2009).
Therefore, the present study was carried out to examine the antiviral mechanisms
involved in an experimental SAV1 infection in salmon with particular interest in the
interferon system and its involvement in pathogenesis of the virus.
3.2 Materials and methods
3. 2. 1 Experimental infection and sample collection
Disease-free Atlantic salmon were artificially infected with SAV1 as described in
Chapter 2.2.4. Samples were collected from 5, SAV1 injected and 5, control salmon at
1, 3, 5, 7, 10, 14, 21, 42 and 90 d.p.i. Heart, pancreas with pyloric caeca, skeletal
muscles, skin, gill, kidney, liver, spleen and brain of both infected and control fish were
fixed in 10 % neutral buffered formalin for 48 h. The head kidneys of 0.5, 1, 3, 5, 7 and
10 d.p.i were collected as described in Chapter 2.2.4 for gene expression studies.
3. 2. 2 Histopathology
Formalin fixed tissues collected as described in Chapter 3.2.1 were processed in an
automatic tissue processor for 21 h before embedding them in paraffin wax using a
Leica®
Jung histo-embedder. The blocks were trimmed to expose the tissues and 5 µm
thick sections were cut using disposable metal knives and Shandon Finess®
microtome
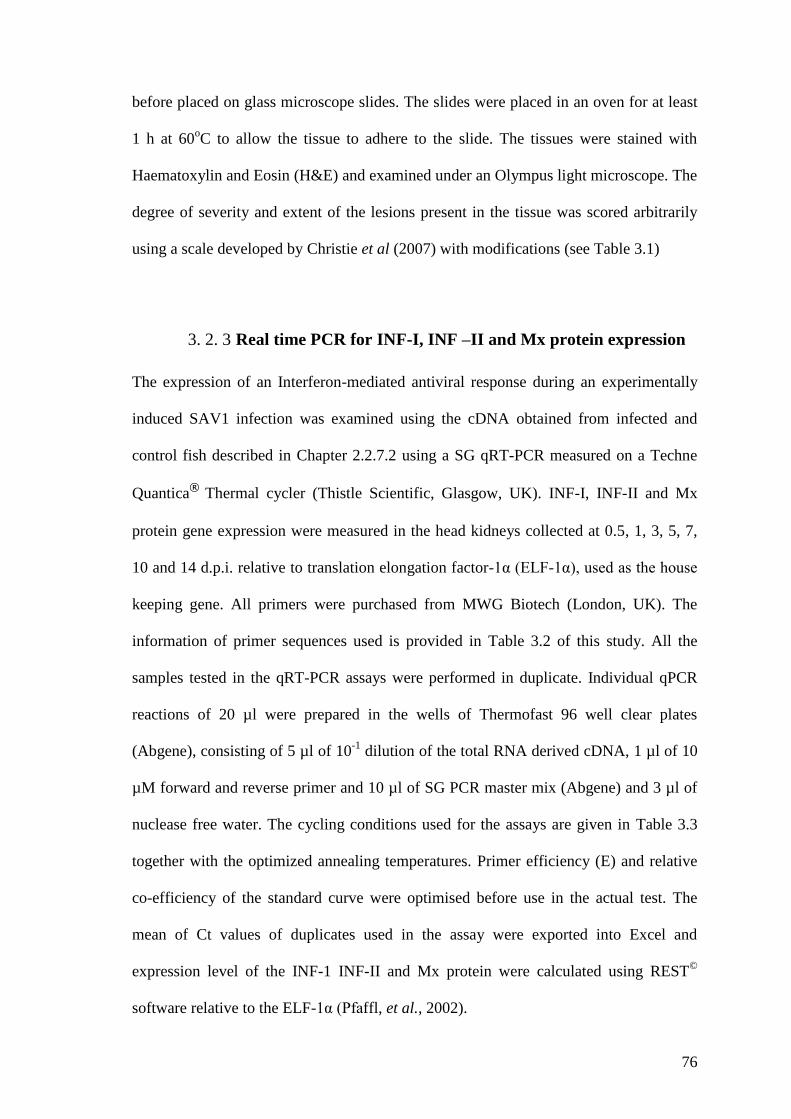
76
before placed on glass microscope slides. The slides were placed in an oven for at least
1 h at 60oC to allow the tissue to adhere to the slide. The tissues were stained with
Haematoxylin and Eosin (H&E) and examined under an Olympus light microscope. The
degree of severity and extent of the lesions present in the tissue was scored arbitrarily
using a scale developed by Christie et al (2007) with modifications (see Table 3.1)
3. 2. 3 Real time PCR for INF-I, INF –II and Mx protein expression
The expression of an Interferon-mediated antiviral response during an experimentally
induced SAV1 infection was examined using the cDNA obtained from infected and
control fish described in Chapter 2.2.7.2 using a SG qRT-PCR measured on a Techne
Quantica®
Thermal cycler (Thistle Scientific, Glasgow, UK). INF-I, INF-II and Mx
protein gene expression were measured in the head kidneys collected at 0.5, 1, 3, 5, 7,
10 and 14 d.p.i. relative to translation elongation factor-1α (ELF-1α), used as the house
keeping gene. All primers were purchased from MWG Biotech (London, UK). The
information of primer sequences used is provided in Table 3.2 of this study. All the
samples tested in the qRT-PCR assays were performed in duplicate. Individual qPCR
reactions of 20 µl were prepared in the wells of Thermofast 96 well clear plates
(Abgene), consisting of 5 µl of 10-1
dilution of the total RNA derived cDNA, 1 µl of 10
µM forward and reverse primer and 10 µl of SG PCR master mix (Abgene) and 3 µl of
nuclease free water. The cycling conditions used for the assays are given in Table 3.3
together with the optimized annealing temperatures. Primer efficiency (E) and relative
co-efficiency of the standard curve were optimised before use in the actual test. The
mean of Ct values of duplicates used in the assay were exported into Excel and
expression level of the INF-1 INF-II and Mx protein were calculated using REST©
software relative to the ELF-1α (Pfaffl, et al., 2002).
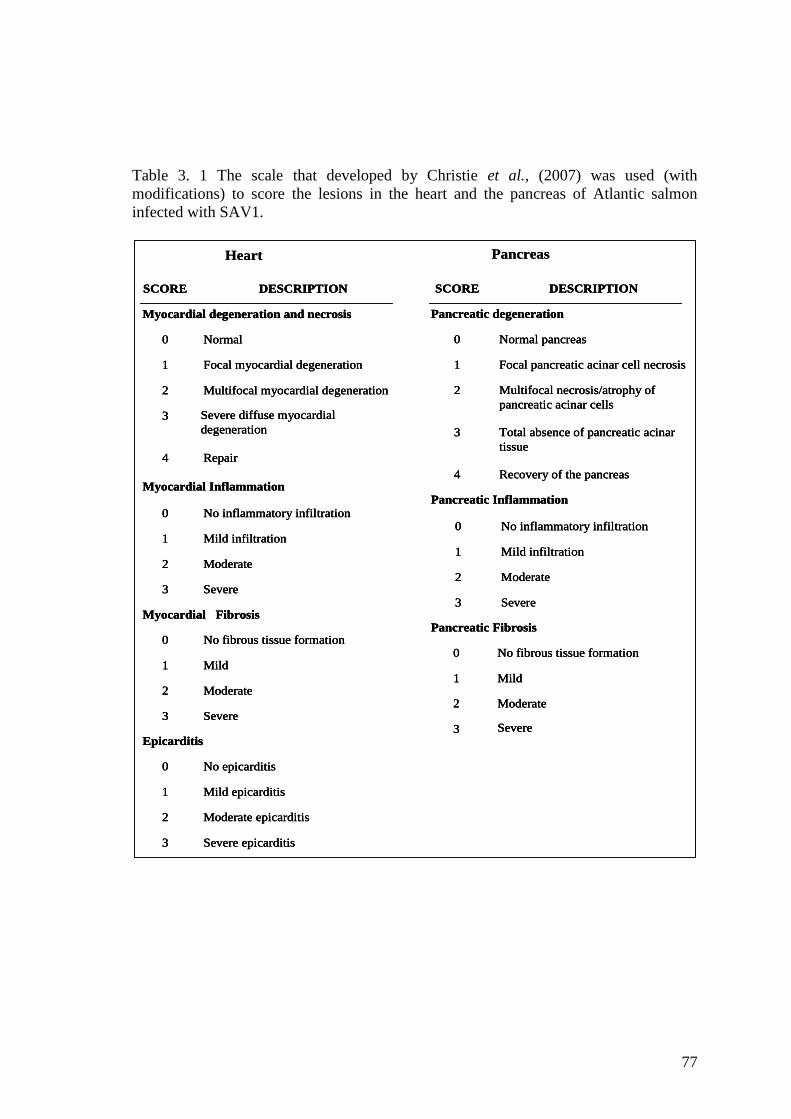
77
Table 3. 1 The scale that developed by Christie et al., (2007) was used (with
modifications) to score the lesions in the heart and the pancreas of Atlantic salmon
infected with SAV1.
Pancreas
DESCRIPTION SCORE
Recovery of the pancreas4
Total absence of pancreatic acinar
tissue
3
Multifocal necrosis/atrophy of
pancreatic acinar cells
2
Focal pancreatic acinar cell necrosis1
Normal pancreas0
Pancreatic degeneration
Severe 3
Moderate2
Mild infiltration1
No inflammatory infiltration0
Myocardial Inflammation
Severe 3
Moderate2
Mild 1
No fibrous tissue formation0
Myocardial Fibrosis
Heart
DESCRIPTION SCORE
Severe diffuse myocardial
degeneration
3
Repair4
Multifocal myocardial degeneration2
Focal myocardial degeneration1
Normal0
Myocardial degeneration and necrosis
Severe 3
Moderate2
Mild infiltration1
No inflammatory infiltration0
Pancreatic Inflammation
Severe epicarditis3
Moderate epicarditis2
Mild epicarditis1
No epicarditis0
EpicarditisSevere 3
Moderate2
Mild 1
No fibrous tissue formation0
Pancreatic Fibrosis
Pancreas
DESCRIPTION SCORE
Recovery of the pancreas4
Total absence of pancreatic acinar
tissue
3
Multifocal necrosis/atrophy of
pancreatic acinar cells
2
Focal pancreatic acinar cell necrosis1
Normal pancreas0
Pancreatic degeneration
DESCRIPTION SCORE
Recovery of the pancreas4
Total absence of pancreatic acinar
tissue
3
Multifocal necrosis/atrophy of
pancreatic acinar cells
2
Focal pancreatic acinar cell necrosis1
Normal pancreas0
Pancreatic degeneration
Severe 3
Moderate2
Mild infiltration1
No inflammatory infiltration0
Myocardial Inflammation
Severe 3
Moderate2
Mild infiltration1
No inflammatory infiltration0
Myocardial Inflammation
Severe 3
Moderate2
Mild 1
No fibrous tissue formation0
Myocardial Fibrosis
Severe 3
Moderate2
Mild 1
No fibrous tissue formation0
Myocardial Fibrosis
Heart
DESCRIPTION SCORE
Severe diffuse myocardial
degeneration
3
Repair4
Multifocal myocardial degeneration2
Focal myocardial degeneration1
Normal0
Myocardial degeneration and necrosis
DESCRIPTION SCORE
Severe diffuse myocardial
degeneration
3
Repair4
Multifocal myocardial degeneration2
Focal myocardial degeneration1
Normal0
Myocardial degeneration and necrosis
Severe 3
Moderate2
Mild infiltration1
No inflammatory infiltration0
Pancreatic Inflammation
Severe 3
Moderate2
Mild infiltration1
No inflammatory infiltration0
Pancreatic Inflammation
Severe epicarditis3
Moderate epicarditis2
Mild epicarditis1
No epicarditis0
Epicarditis
Severe epicarditis3
Moderate epicarditis2
Mild epicarditis1
No epicarditis0
EpicarditisSevere 3
Moderate2
Mild 1
No fibrous tissue formation0
Pancreatic Fibrosis
Severe 3
Moderate2
Mild 1
No fibrous tissue formation0
Pancreatic Fibrosis
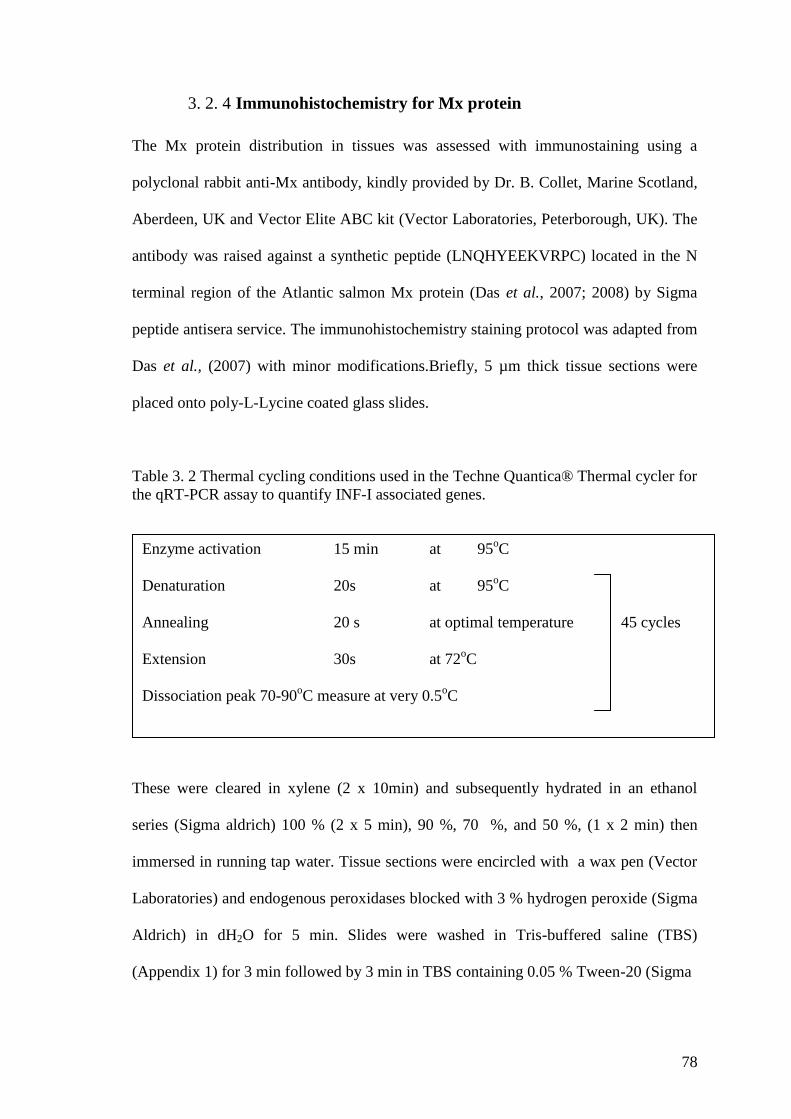
78
3. 2. 4 Immunohistochemistry for Mx protein
The Mx protein distribution in tissues was assessed with immunostaining using a
polyclonal rabbit anti-Mx antibody, kindly provided by Dr. B. Collet, Marine Scotland,
Aberdeen, UK and Vector Elite ABC kit (Vector Laboratories, Peterborough, UK). The
antibody was raised against a synthetic peptide (LNQHYEEKVRPC) located in the N
terminal region of the Atlantic salmon Mx protein (Das et al., 2007; 2008) by Sigma
peptide antisera service. The immunohistochemistry staining protocol was adapted from
Das et al., (2007) with minor modifications.Briefly, 5 µm thick tissue sections were
placed onto poly-L-Lycine coated glass slides.
Table 3. 2 Thermal cycling conditions used in the Techne Quantica® Thermal cycler for
the qRT-PCR assay to quantify INF-I associated genes.
These were cleared in xylene (2 x 10min) and subsequently hydrated in an ethanol
series (Sigma aldrich) 100 % (2 x 5 min), 90 %, 70 %, and 50 %, (1 x 2 min) then
immersed in running tap water. Tissue sections were encircled with a wax pen (Vector
Laboratories) and endogenous peroxidases blocked with 3 % hydrogen peroxide (Sigma
Aldrich) in dH2O for 5 min. Slides were washed in Tris-buffered saline (TBS)
(Appendix 1) for 3 min followed by 3 min in TBS containing 0.05 % Tween-20 (Sigma
Enzyme activation 15 min at 95oC
Denaturation 20s at 95oC
Annealing 20 s at optimal temperature 45 cycles
Extension 30s at 72oC
Dissociation peak 70-90oC measure at very 0.5
oC
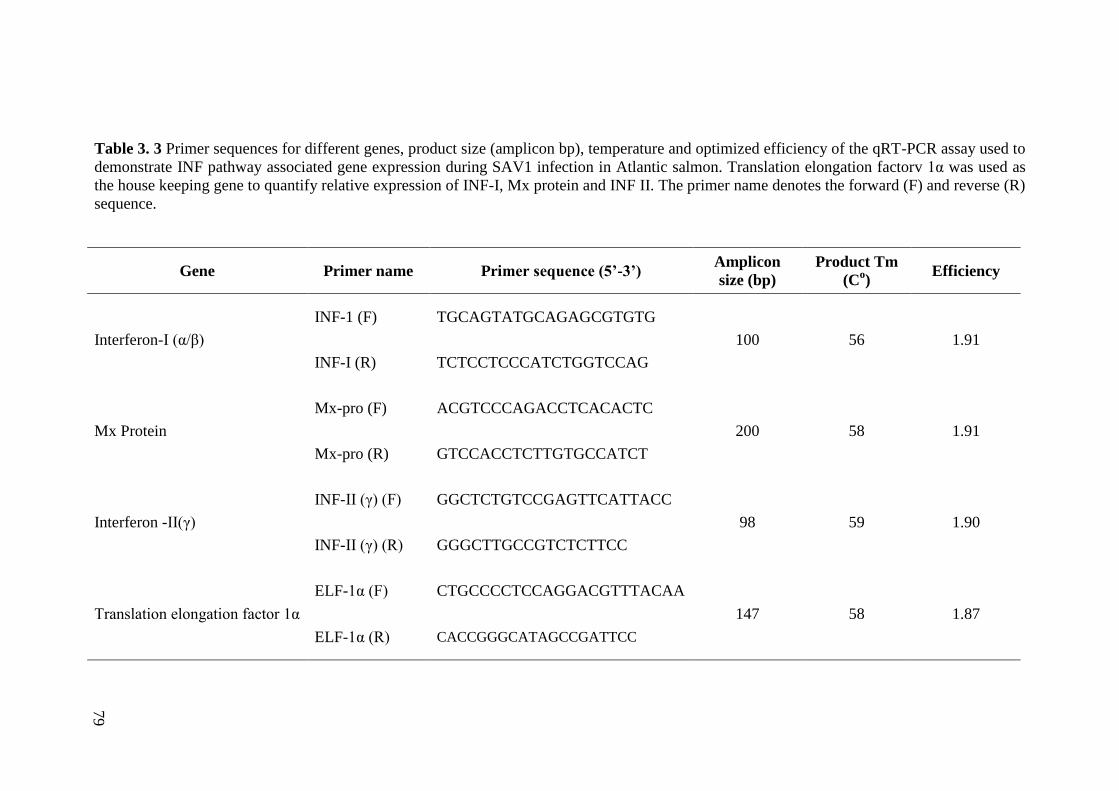
79
Table 3. 3 Primer sequences for different genes, product size (amplicon bp), temperature and optimized efficiency of the qRT-PCR assay used to
demonstrate INF pathway associated gene expression during SAV1 infection in Atlantic salmon. Translation elongation factorv 1α was used as
the house keeping gene to quantify relative expression of INF-I, Mx protein and INF II. The primer name denotes the forward (F) and reverse (R)
sequence.
Gene Primer name Primer sequence (5’-3’) Amplicon
size (bp)
Product Tm
(Co)
Efficiency
Interferon-I (α/β)
INF-1 (F) TGCAGTATGCAGAGCGTGTG
100 56 1.91
INF-I (R) TCTCCTCCCATCTGGTCCAG
Mx Protein
Mx-pro (F) ACGTCCCAGACCTCACACTC
200 58 1.91
Mx-pro (R) GTCCACCTCTTGTGCCATCT
Interferon -II(γ)
INF-II (γ) (F) GGCTCTGTCCGAGTTCATTACC
98 59 1.90
INF-II (γ) (R) GGGCTTGCCGTCTCTTCC
Translation elongation factor 1α
ELF-1α (F) CTGCCCCTCCAGGACGTTTACAA
147 58 1.87
ELF-1α (R) CACCGGGCATAGCCGATTCC
79
80
Aldrich) (TTBS) (Appendix 1). All the sections were incubated with 10 % horse serum
provided with the Vector ABC kit in a humid box for 30 min at room temperature to
saturate the non-specific protein binding sites. Excess serum was removed by tapping
the slides before incubating with 100 µl of Mx polyclonal antibody diluted in PBS
(1:400) in a humid box overnight at 4oC. The next day slides were washed with TTBS
before incubating with horse anti-rabbit Ig for 30 min in RT (22oC) according to the
manufacturer‟s instructions. Slides were rinsed in TTBS for 5 min followed by a 5 min
wash in TBS prior to incubating with 150 µl of amino-ethyl carbazol (AEC) reagent
(Sigma Aldrich) for 10 min and washed with dH2O. Sections were counter stained with
Mayer‟s haematoxylin for 2 min and the reaction was stopped by immersing in running
tap water. Slides were then mounted with Citifluor (Citifluor Ltd, Leicester, UK), an
aqueous based mounting media mixed with PBS in a 1:1 ratio and observed under an
Olympus light microscope for the presence of Mx protein. The amount of Mx protein
present was scored on three randomly selected fields (x 400) on different organs,
mucous membranes (gill, skin and gut) and target organs of the virus (heart, pancreas,
skeletal muscles, kidney) using a scale developed to quantify the signal strength (no
signal= 0, very few cells stained = 1 (<5 %), a few cells stained =2 (<20%), more cells
stained = 3 (<70 %), cells diffusely stained = 4 (90%). The significance of the signal
strength between time points was compared using Kruskal-Wallis test. The significance
of the signal strength at each time point relative to the previous time point and between
infected and control tissues were evaluated using a Mann-Whitney U-test.
81
3.3 Results
3. 3. 1 Histopathology
Pathological changes were evident in the heart and pancreas of the experimentally
infected fish, while the histology of the control fish appeared normal. The heart lesions
were observed in the infected fish from 10 d.p.i. (Figure 3.3). Four of the
experimentally infected fish showed signs of cardiac lesions by 10 d.p.i while all 5 fish
sampled on both 14 and 21 d.p.i had lesions in the heart. Three out of the five fish
sampled had lesions in the heart on 42 d.p.i. Only one fish showed heart lesions on 90
d.p.i (Figure 3.3). The lesions in the affected hearts were noted on the pericardium and
compact and spongy myocardium of the ventricle consisted of mild to moderate
cardiomyocyte degeneration and cellular infiltration in the ventricle. A moderate to
severe, localised to diffuse mononuclear cell infiltration was noted both in the spongy
and the compact myocardium (Figure 3.4 b, c). The epicardium of the infected fish was
infiltrated with mononuclear cells (Figure 3.4.d). The degenerated cardiomyocytes
become strongly eosinophilic, shrunken and granular with pyknotic nuclei, further to
loss of striation (Figure 3.5 a, b, c). and formation of mural thrombi on the endocardial
surface was also noticed in infected fish (Figure 3.5.d).
The inflammation characterised by mononuclear infiltration was in the epicardium
(epicarditis) and the ventricular myocardium and started to appear 7 d.p.i. and it steadily
increased in the epicardium until 14 d.p.i and until 42 d.pi in the ventricle (Figure 3.6).
The myocardial degeneration also started to appear from 7 d.p.i with the highest score
of fish showing degenerative lesions in the heart at 21 d.p.i. (Figure 3.6). Only one fish
showed mild degenerative lesions in the heart at 90 d.p.i, but no signs of fibrosis or
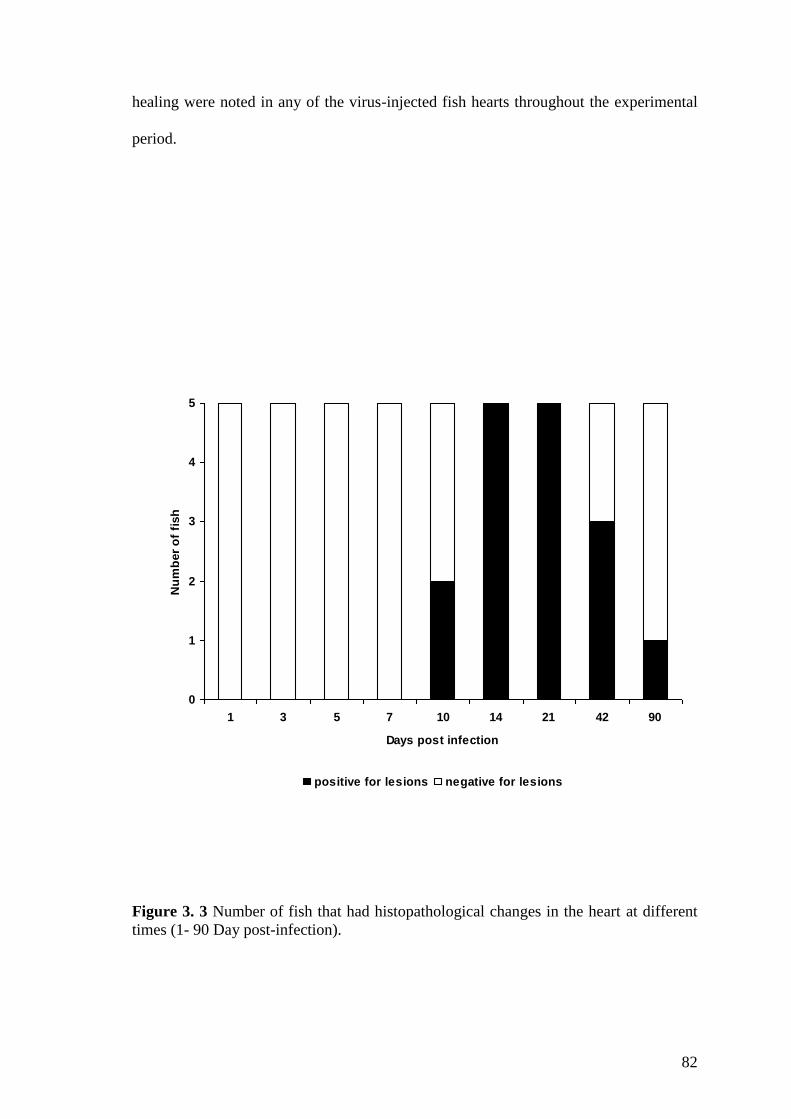
82
healing were noted in any of the virus-injected fish hearts throughout the experimental
period.
Figure 3. 3 Number of fish that had histopathological changes in the heart at different
times (1- 90 Day post-infection).
0
1
2
3
4
5
1 3 5 7 10 14 21 42 90
Days post infection
Nu
mb
er
of
fish
positive for lesions negative for lesions
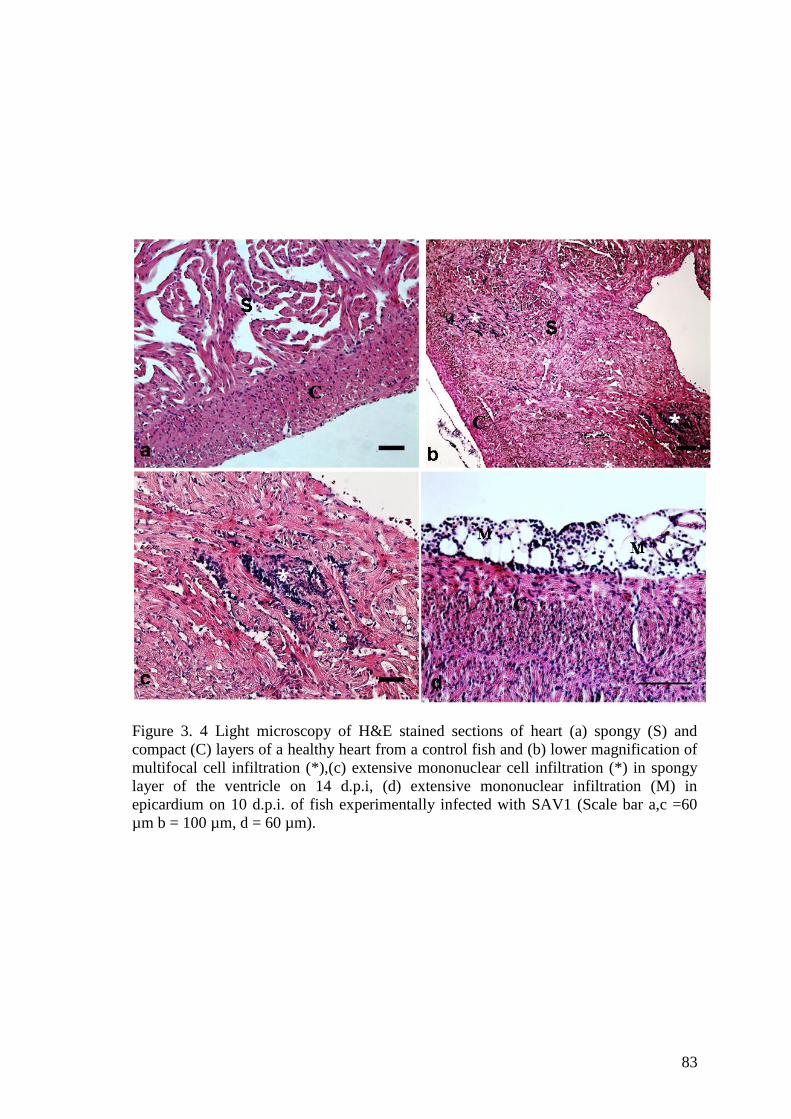
83
Figure 3. 4 Light microscopy of H&E stained sections of heart (a) spongy (S) and
compact (C) layers of a healthy heart from a control fish and (b) lower magnification of
multifocal cell infiltration (*),(c) extensive mononuclear cell infiltration (*) in spongy
layer of the ventricle on 14 d.p.i, (d) extensive mononuclear infiltration (M) in
epicardium on 10 d.p.i. of fish experimentally infected with SAV1 (Scale bar a,c =60
µm b = 100 µm, d = 60 µm).
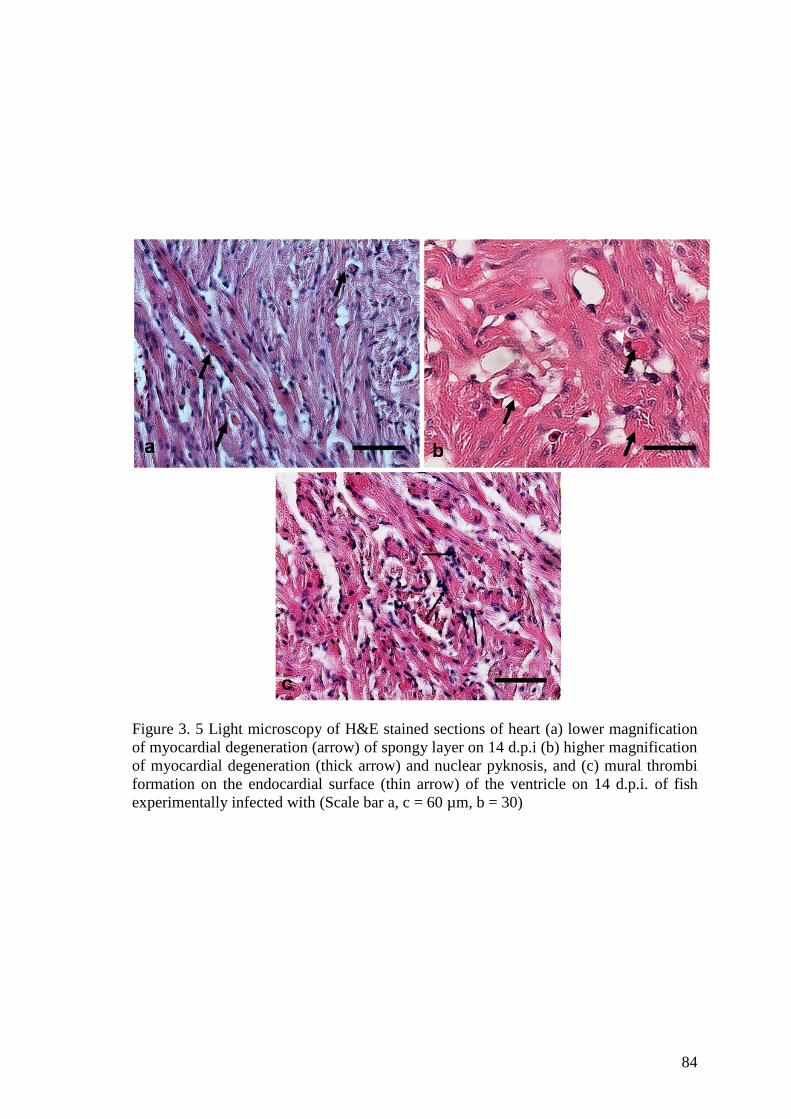
84
Figure 3. 5 Light microscopy of H&E stained sections of heart (a) lower magnification
of myocardial degeneration (arrow) of spongy layer on 14 d.p.i (b) higher magnification
of myocardial degeneration (thick arrow) and nuclear pyknosis, and (c) mural thrombi
formation on the endocardial surface (thin arrow) of the ventricle on 14 d.p.i. of fish
experimentally infected with (Scale bar a, c = 60 µm, b = 30)
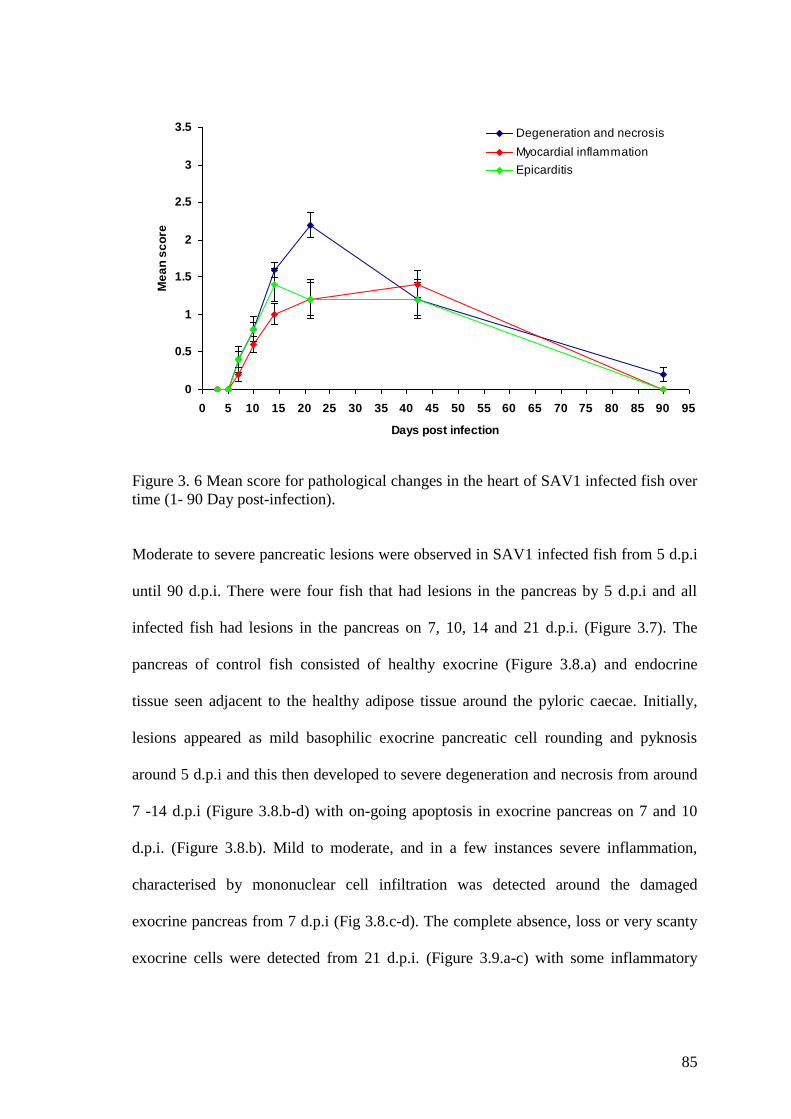
85
Figure 3. 6 Mean score for pathological changes in the heart of SAV1 infected fish over
time (1- 90 Day post-infection).
Moderate to severe pancreatic lesions were observed in SAV1 infected fish from 5 d.p.i
until 90 d.p.i. There were four fish that had lesions in the pancreas by 5 d.p.i and all
infected fish had lesions in the pancreas on 7, 10, 14 and 21 d.p.i. (Figure 3.7). The
pancreas of control fish consisted of healthy exocrine (Figure 3.8.a) and endocrine
tissue seen adjacent to the healthy adipose tissue around the pyloric caecae. Initially,
lesions appeared as mild basophilic exocrine pancreatic cell rounding and pyknosis
around 5 d.p.i and this then developed to severe degeneration and necrosis from around
7 -14 d.p.i (Figure 3.8.b-d) with on-going apoptosis in exocrine pancreas on 7 and 10
d.p.i. (Figure 3.8.b). Mild to moderate, and in a few instances severe inflammation,
characterised by mononuclear cell infiltration was detected around the damaged
exocrine pancreas from 7 d.p.i (Fig 3.8.c-d). The complete absence, loss or very scanty
exocrine cells were detected from 21 d.p.i. (Figure 3.9.a-c) with some inflammatory
0
0.5
1
1.5
2
2.5
3
3.5
0 5 10 15 20 25 30 35 40 45 50 55 60 65 70 75 80 85 90 95
Days post infection
Me
an
sc
ore
Degeneration and necrosis
Myocardial inflammation
Epicarditis
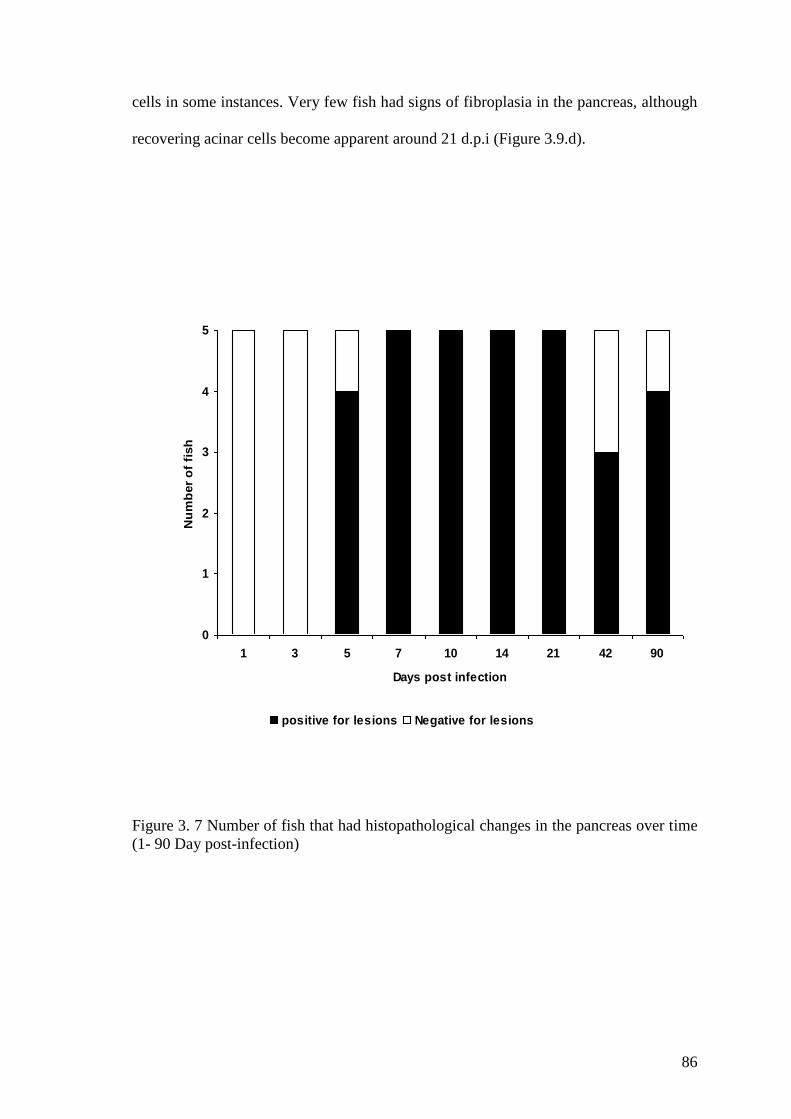
86
cells in some instances. Very few fish had signs of fibroplasia in the pancreas, although
recovering acinar cells become apparent around 21 d.p.i (Figure 3.9.d).
Figure 3. 7 Number of fish that had histopathological changes in the pancreas over time
(1- 90 Day post-infection)
0
1
2
3
4
5
1 3 5 7 10 14 21 42 90
Days post infection
Nu
mb
er
of
fish
positive for lesions Negative for lesions
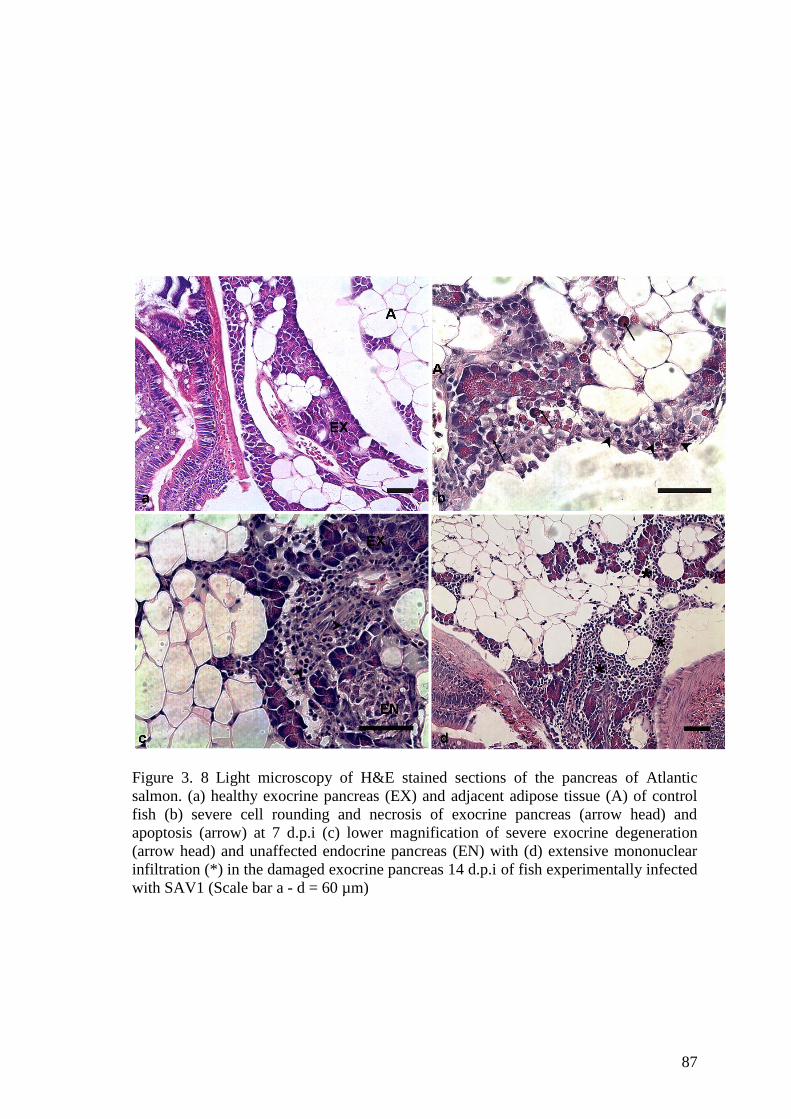
87
Figure 3. 8 Light microscopy of H&E stained sections of the pancreas of Atlantic
salmon. (a) healthy exocrine pancreas (EX) and adjacent adipose tissue (A) of control
fish (b) severe cell rounding and necrosis of exocrine pancreas (arrow head) and
apoptosis (arrow) at 7 d.p.i (c) lower magnification of severe exocrine degeneration
(arrow head) and unaffected endocrine pancreas (EN) with (d) extensive mononuclear
infiltration (*) in the damaged exocrine pancreas 14 d.p.i of fish experimentally infected
with SAV1 (Scale bar a - d = 60 µm)
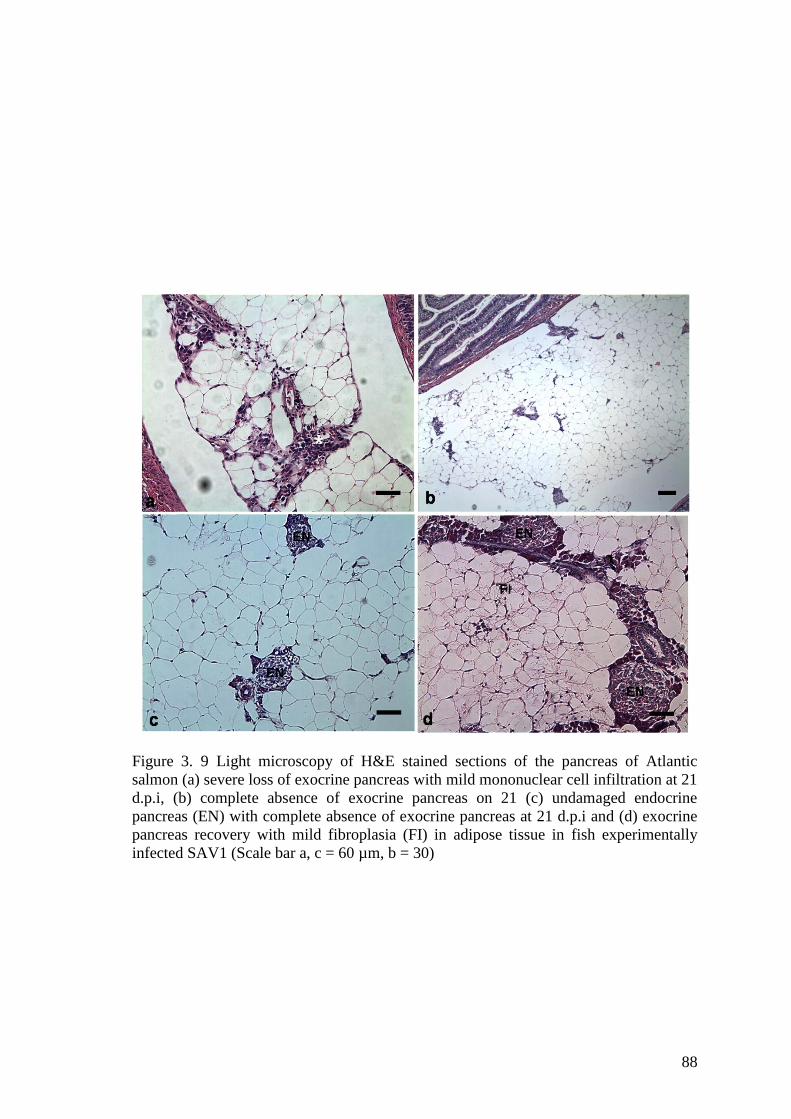
88
Figure 3. 9 Light microscopy of H&E stained sections of the pancreas of Atlantic
salmon (a) severe loss of exocrine pancreas with mild mononuclear cell infiltration at 21
d.p.i, (b) complete absence of exocrine pancreas on 21 (c) undamaged endocrine
pancreas (EN) with complete absence of exocrine pancreas at 21 d.p.i and (d) exocrine
pancreas recovery with mild fibroplasia (FI) in adipose tissue in fish experimentally
infected SAV1 (Scale bar a, c = 60 µm, b = 30)
89
The highest proportion of fish with acinar cell degeneration and necrosis was detected at
14 d.p.i. (Figure 3.10). The degree of tissue inflammation was highest at 10 d.p.i. and
signs of the exocrine pancreatic recovery were apparent from 21 d.p.i with advanced
regeneration occurring later at around 90 d.p.i. (Figure 3.10). A mild fibroplasia was
simultaneously noted in recovering pancreas from 21 d.p.i. (Figure 3.10).
3. 3. 2 Real time PCR for INF-I, INFII and Mx protein expression
The expression of INF-1, Mx protein and INF-II relative to the ELF-1α house-keeping
gene in the head kidney of infected fish compared to the control fish at 12h and 1, 3, 5,
7,10, 14 d.p.i. is shown in Figure 3.11. All three target genes were found to be down-
regulated at 12 h p.i. and then started to be up-regulated from 1 d.p.i. The INF-1
expression in infected fish was significantly different from that of control fish at all
sampling points except 12 h.p.i and 5 d.p.i. with maximum INF-1 expression occurring
3 d.p.i with a 250 fold increase. The highest fold change of Mx protein was also
detected on 3 d.p.i in the infected fish compared to controls and the levels of expression
were significantly different between infected and control fish at all the sampling points
except 12 h.p.i. and 10 d.p.i (Figure 3.11.b). The peak expression of INF-II was
detected at 7 d.p.i. and the expression in infected fish were significantly different from
control fish at all the sampling points except 12 h.p.i (Figure 3.11.c).
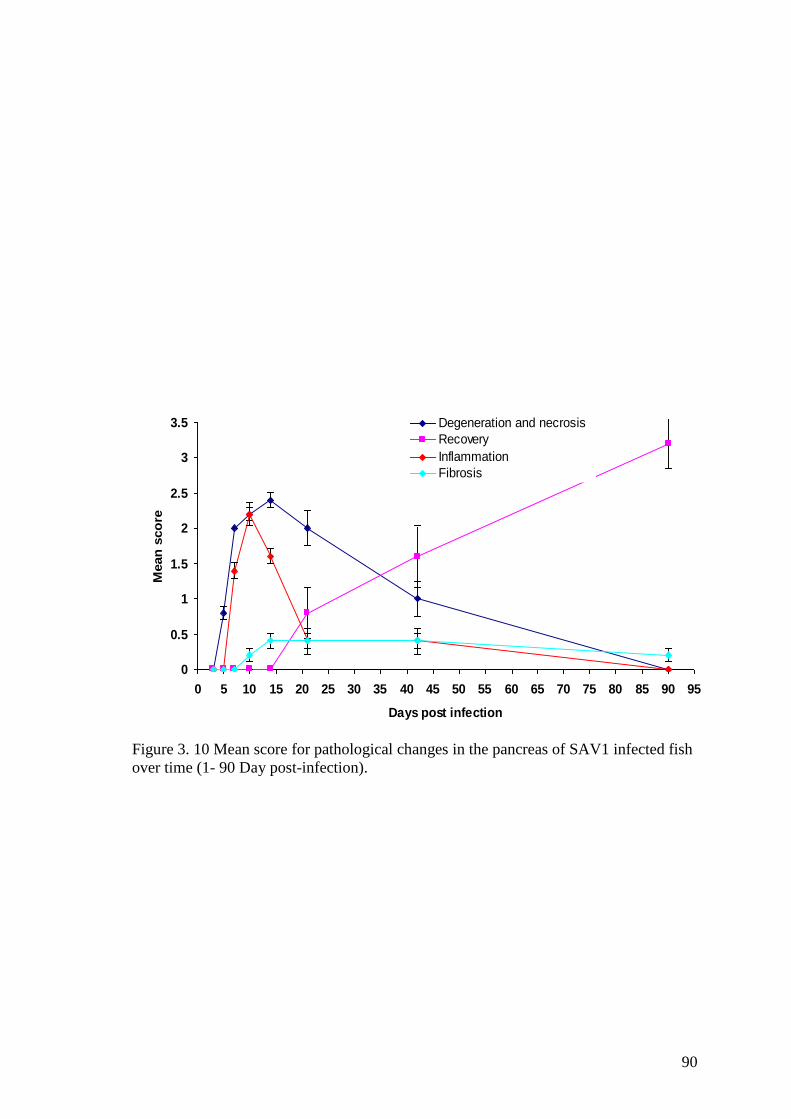
90
Figure 3. 10 Mean score for pathological changes in the pancreas of SAV1 infected fish
over time (1- 90 Day post-infection).
0
0.5
1
1.5
2
2.5
3
3.5
0 5 10 15 20 25 30 35 40 45 50 55 60 65 70 75 80 85 90 95
Days post infection
Mean
sco
re
Degeneration and necrosis
Recovery
Inflammation
Fibrosis
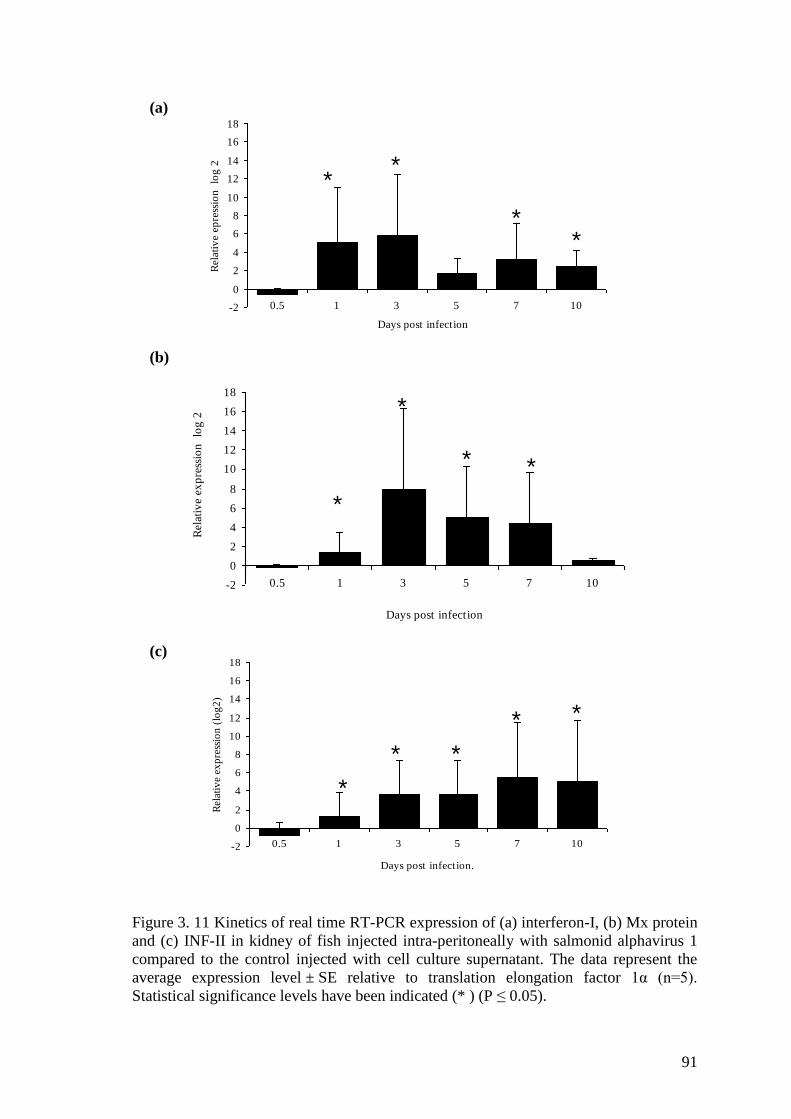
91
Figure 3. 11 Kinetics of real time RT-PCR expression of (a) interferon-I, (b) Mx protein
and (c) INF-II in kidney of fish injected intra-peritoneally with salmonid alphavirus 1
compared to the control injected with cell culture supernatant. The data represent the
average expression level ± SE relative to translation elongation factor 1α (n=5).
Statistical significance levels have been indicated (* ) (P ≤ 0.05).
-2
0
2
4
6
8
10
12
14
16
18
0.5 1 3 5 7 10
Days post infection
Rel
ativ
e ep
ress
ion
lo
g 2
* *
* *
-2
0
2
4
6
8
10
12
14
16
18
0.5 1 3 5 7 10
Days post infection
Rel
ativ
e ex
pre
ssio
n
log
2
*
*
* *
-2
0
2
4
6
8
10
12
14
16
18
0.5 1 3 5 7 10
Days post infection.
Rel
ativ
e ex
pre
ssio
n (
log
2)
*
* *
* *
(a)
(b)
(c)
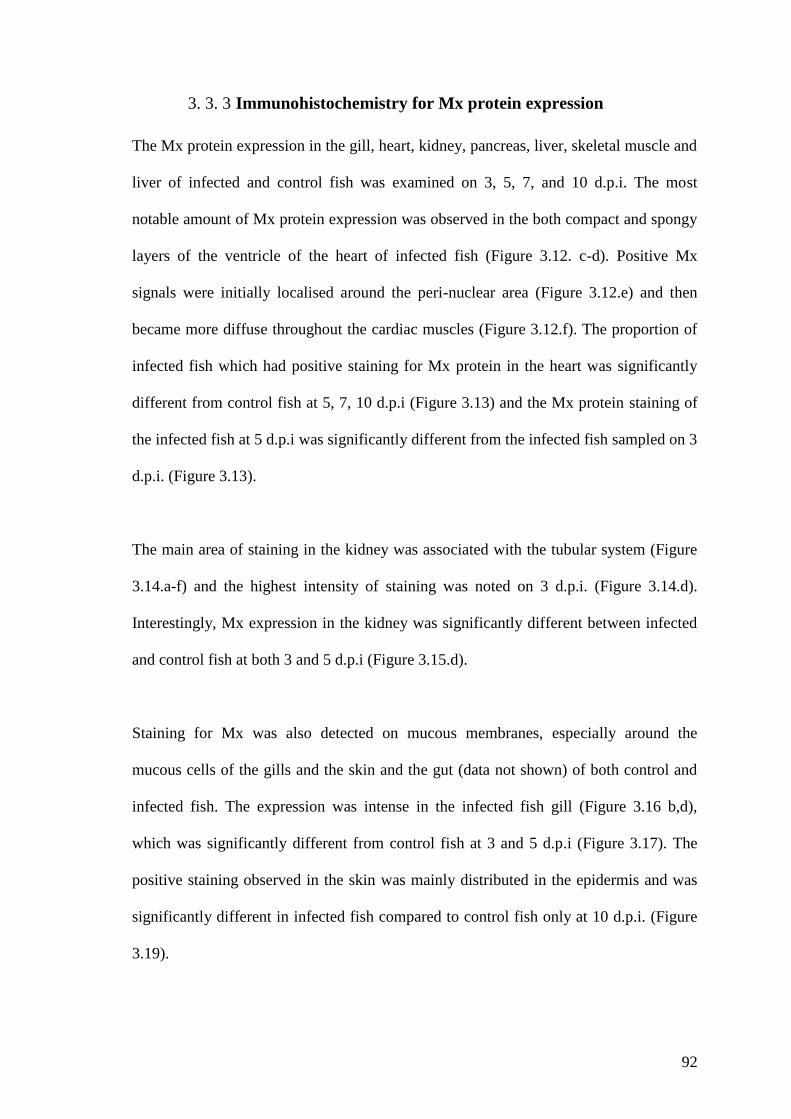
92
3. 3. 3 Immunohistochemistry for Mx protein expression
The Mx protein expression in the gill, heart, kidney, pancreas, liver, skeletal muscle and
liver of infected and control fish was examined on 3, 5, 7, and 10 d.p.i. The most
notable amount of Mx protein expression was observed in the both compact and spongy
layers of the ventricle of the heart of infected fish (Figure 3.12. c-d). Positive Mx
signals were initially localised around the peri-nuclear area (Figure 3.12.e) and then
became more diffuse throughout the cardiac muscles (Figure 3.12.f). The proportion of
infected fish which had positive staining for Mx protein in the heart was significantly
different from control fish at 5, 7, 10 d.p.i (Figure 3.13) and the Mx protein staining of
the infected fish at 5 d.p.i was significantly different from the infected fish sampled on 3
d.p.i. (Figure 3.13).
The main area of staining in the kidney was associated with the tubular system (Figure
3.14.a-f) and the highest intensity of staining was noted on 3 d.p.i. (Figure 3.14.d).
Interestingly, Mx expression in the kidney was significantly different between infected
and control fish at both 3 and 5 d.p.i (Figure 3.15.d).
Staining for Mx was also detected on mucous membranes, especially around the
mucous cells of the gills and the skin and the gut (data not shown) of both control and
infected fish. The expression was intense in the infected fish gill (Figure 3.16 b,d),
which was significantly different from control fish at 3 and 5 d.p.i (Figure 3.17). The
positive staining observed in the skin was mainly distributed in the epidermis and was
significantly different in infected fish compared to control fish only at 10 d.p.i. (Figure
3.19).
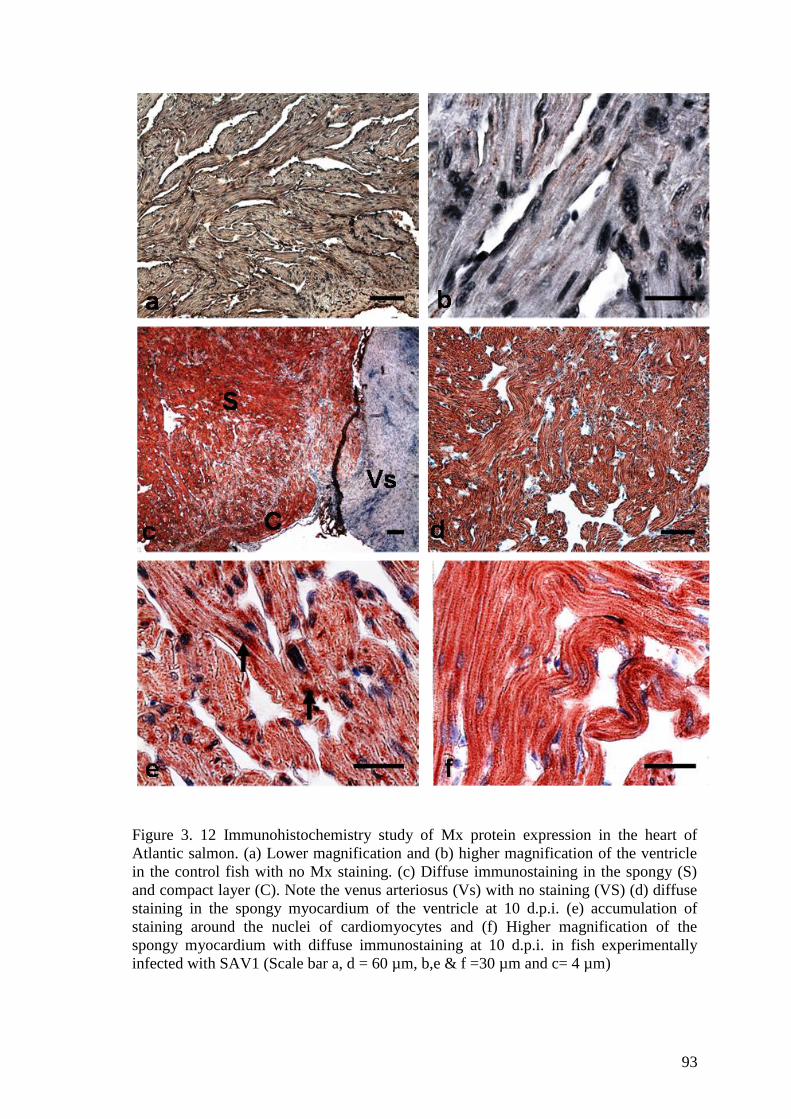
93
Figure 3. 12 Immunohistochemistry study of Mx protein expression in the heart of
Atlantic salmon. (a) Lower magnification and (b) higher magnification of the ventricle
in the control fish with no Mx staining. (c) Diffuse immunostaining in the spongy (S)
and compact layer (C). Note the venus arteriosus (Vs) with no staining (VS) (d) diffuse
staining in the spongy myocardium of the ventricle at 10 d.p.i. (e) accumulation of
staining around the nuclei of cardiomyocytes and (f) Higher magnification of the
spongy myocardium with diffuse immunostaining at 10 d.p.i. in fish experimentally
infected with SAV1 (Scale bar a, d = 60 µm, b,e & f =30 µm and c= 4 µm)
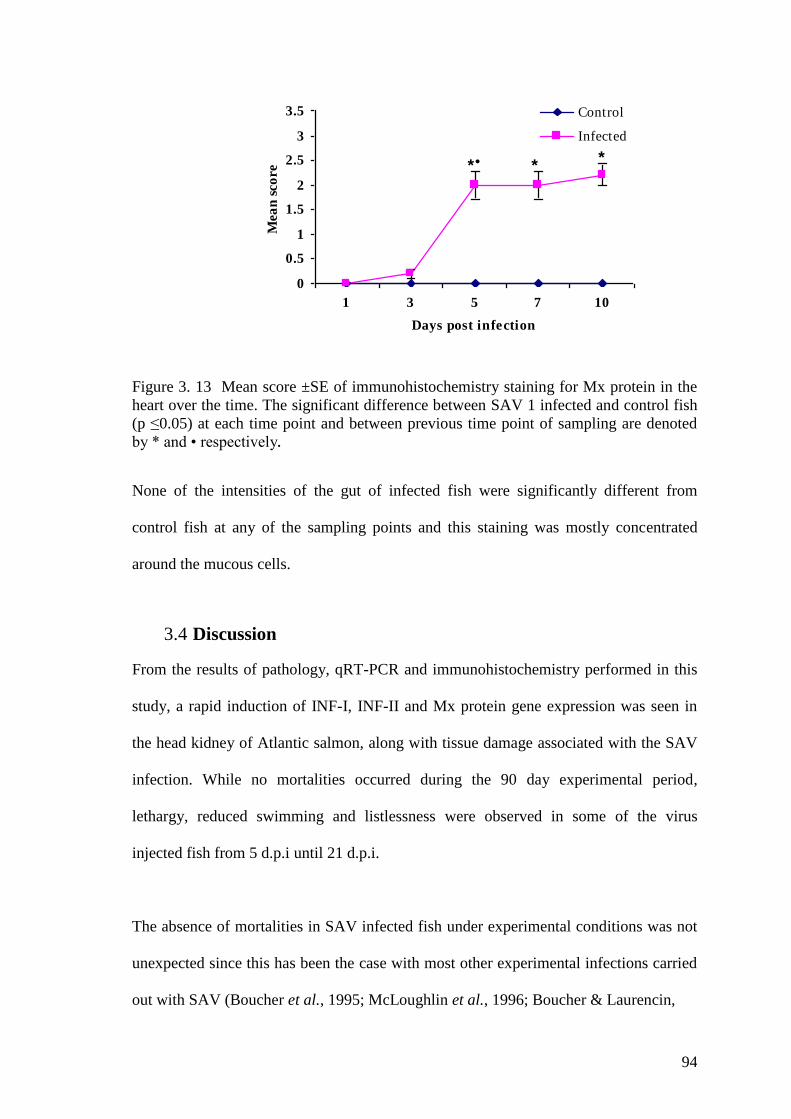
94
Figure 3. 13 Mean score ±SE of immunohistochemistry staining for Mx protein in the
heart over the time. The significant difference between SAV 1 infected and control fish
(p ≤0.05) at each time point and between previous time point of sampling are denoted
by * and • respectively.
None of the intensities of the gut of infected fish were significantly different from
control fish at any of the sampling points and this staining was mostly concentrated
around the mucous cells.
3.4 Discussion
From the results of pathology, qRT-PCR and immunohistochemistry performed in this
study, a rapid induction of INF-I, INF-II and Mx protein gene expression was seen in
the head kidney of Atlantic salmon, along with tissue damage associated with the SAV
infection. While no mortalities occurred during the 90 day experimental period,
lethargy, reduced swimming and listlessness were observed in some of the virus
injected fish from 5 d.p.i until 21 d.p.i.
The absence of mortalities in SAV infected fish under experimental conditions was not
unexpected since this has been the case with most other experimental infections carried
out with SAV (Boucher et al., 1995; McLoughlin et al., 1996; Boucher & Laurencin,
0
0.5
1
1.5
2
2.5
3
3.5
1 3 5 7 10
Days post infection
Mea
n s
co
re
Control
Infected
* •
* *
•
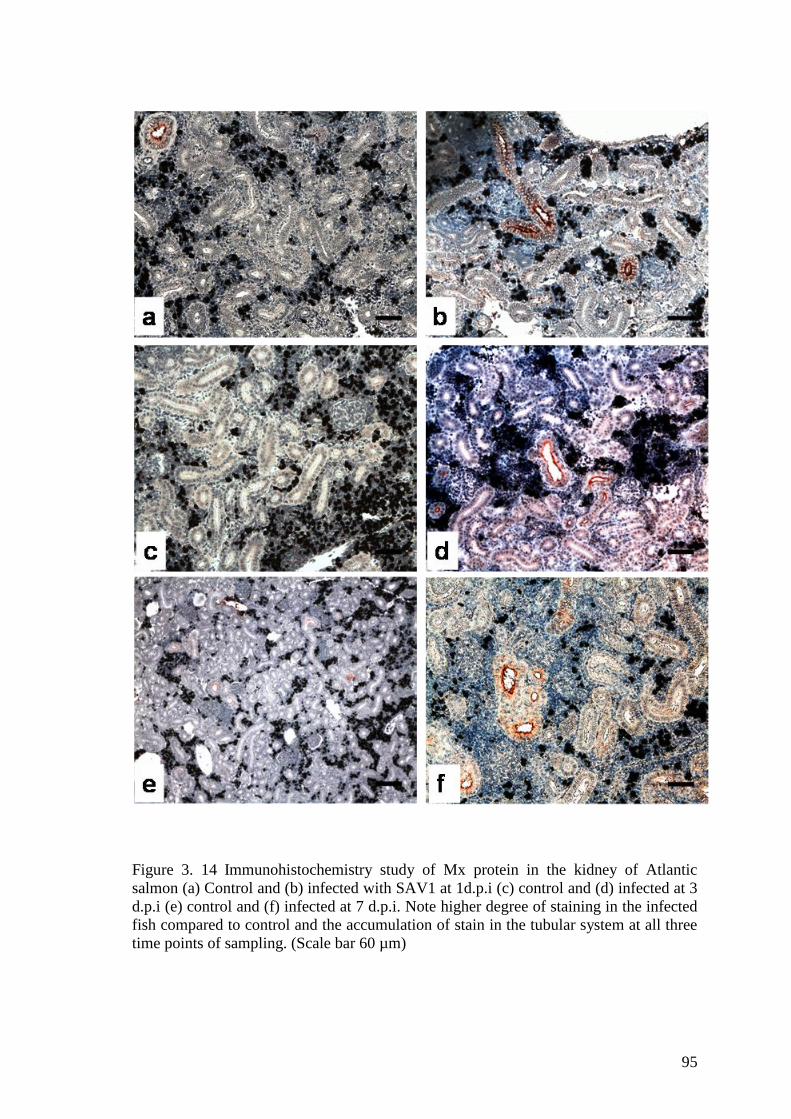
95
Figure 3. 14 Immunohistochemistry study of Mx protein in the kidney of Atlantic
salmon (a) Control and (b) infected with SAV1 at 1d.p.i (c) control and (d) infected at 3
d.p.i (e) control and (f) infected at 7 d.p.i. Note higher degree of staining in the infected
fish compared to control and the accumulation of stain in the tubular system at all three
time points of sampling. (Scale bar 60 µm)
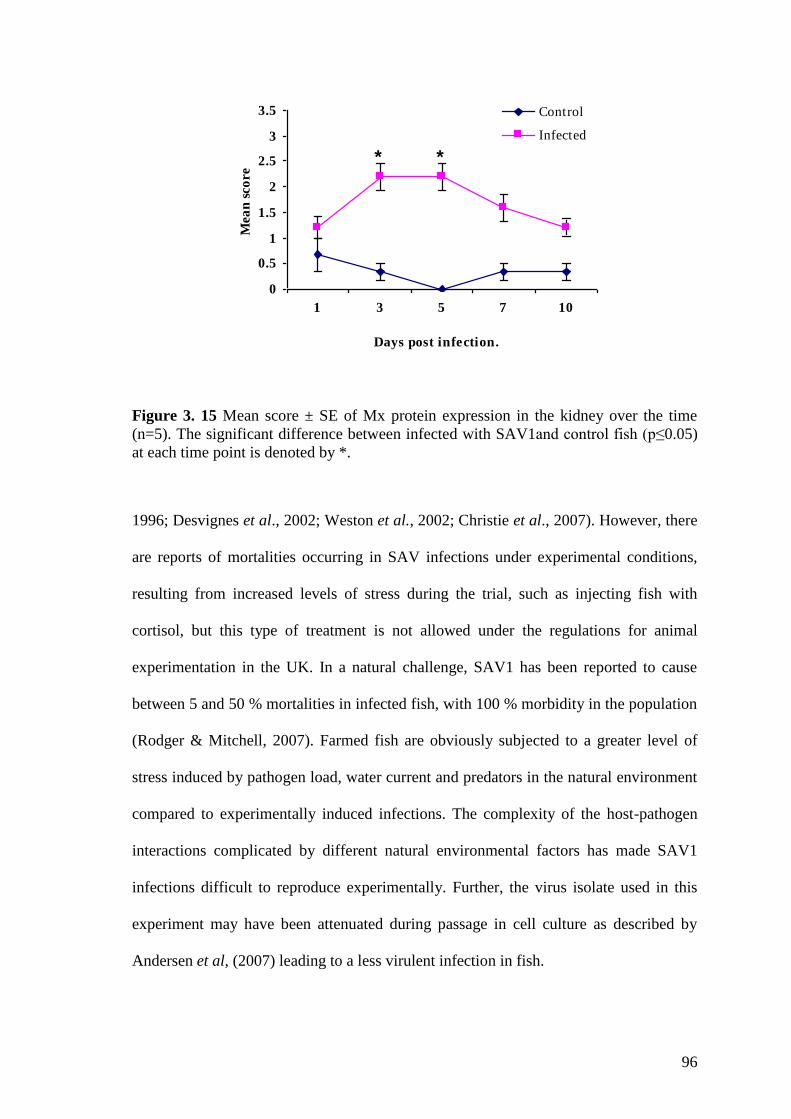
96
Figure 3. 15 Mean score ± SE of Mx protein expression in the kidney over the time
(n=5). The significant difference between infected with SAV1and control fish (p≤0.05)
at each time point is denoted by *.
1996; Desvignes et al., 2002; Weston et al., 2002; Christie et al., 2007). However, there
are reports of mortalities occurring in SAV infections under experimental conditions,
resulting from increased levels of stress during the trial, such as injecting fish with
cortisol, but this type of treatment is not allowed under the regulations for animal
experimentation in the UK. In a natural challenge, SAV1 has been reported to cause
between 5 and 50 % mortalities in infected fish, with 100 % morbidity in the population
(Rodger & Mitchell, 2007). Farmed fish are obviously subjected to a greater level of
stress induced by pathogen load, water current and predators in the natural environment
compared to experimentally induced infections. The complexity of the host-pathogen
interactions complicated by different natural environmental factors has made SAV1
infections difficult to reproduce experimentally. Further, the virus isolate used in this
experiment may have been attenuated during passage in cell culture as described by
Andersen et al, (2007) leading to a less virulent infection in fish.
0
0.5
1
1.5
2
2.5
3
3.5
1 3 5 7 10
Days post infection.
Mea
n s
co
re
Control
Infected
* *
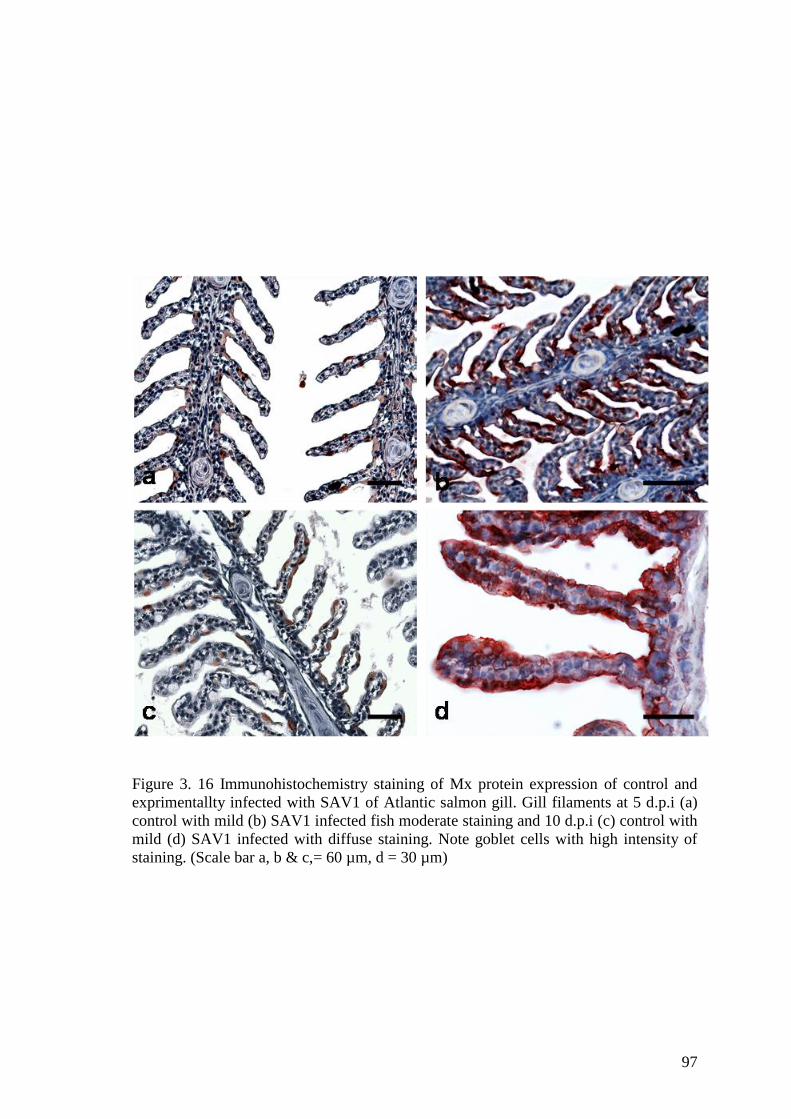
97
Figure 3. 16 Immunohistochemistry staining of Mx protein expression of control and
exprimentallty infected with SAV1 of Atlantic salmon gill. Gill filaments at 5 d.p.i (a)
control with mild (b) SAV1 infected fish moderate staining and 10 d.p.i (c) control with
mild (d) SAV1 infected with diffuse staining. Note goblet cells with high intensity of
staining. (Scale bar a, b & c,= 60 µm, d = 30 µm)
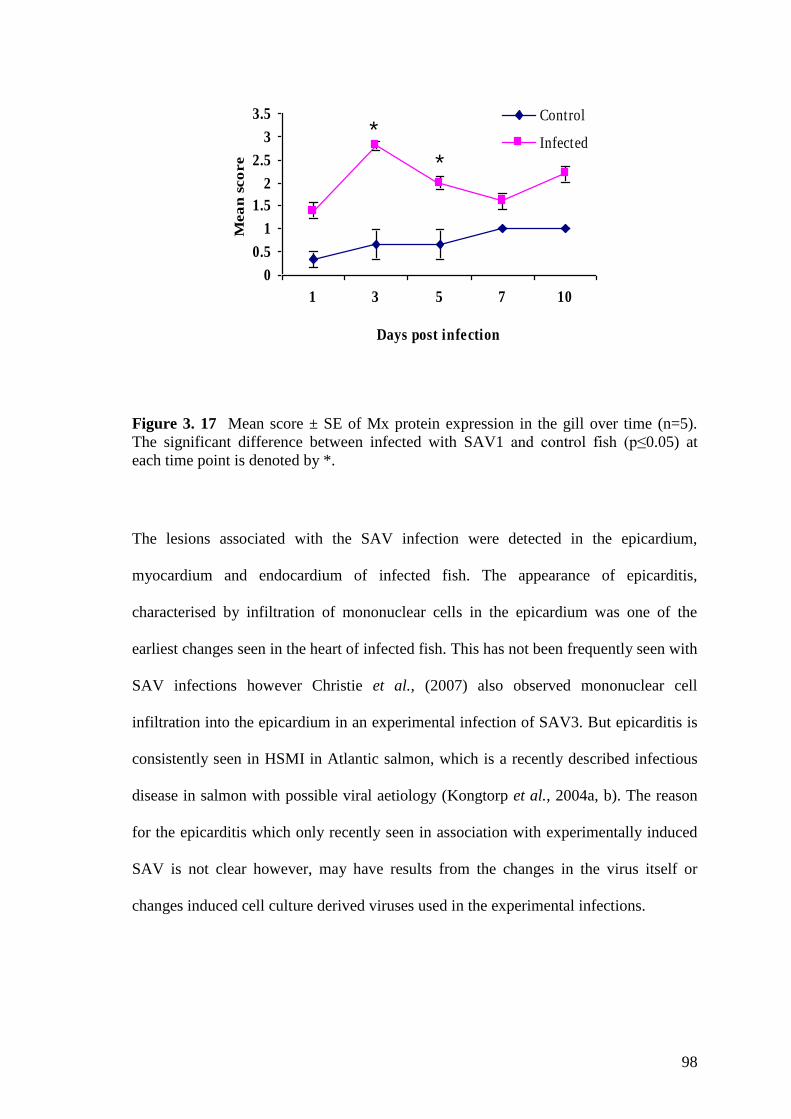
98
Figure 3. 17 Mean score ± SE of Mx protein expression in the gill over time (n=5).
The significant difference between infected with SAV1 and control fish (p≤0.05) at
each time point is denoted by *.
The lesions associated with the SAV infection were detected in the epicardium,
myocardium and endocardium of infected fish. The appearance of epicarditis,
characterised by infiltration of mononuclear cells in the epicardium was one of the
earliest changes seen in the heart of infected fish. This has not been frequently seen with
SAV infections however Christie et al., (2007) also observed mononuclear cell
infiltration into the epicardium in an experimental infection of SAV3. But epicarditis is
consistently seen in HSMI in Atlantic salmon, which is a recently described infectious
disease in salmon with possible viral aetiology (Kongtorp et al., 2004a, b). The reason
for the epicarditis which only recently seen in association with experimentally induced
SAV is not clear however, may have results from the changes in the virus itself or
changes induced cell culture derived viruses used in the experimental infections.
0
0.5
1
1.5
2
2.5
3
3.5
1 3 5 7 10
Days post infection
Mea
n s
co
re
Control
Infected
*
*
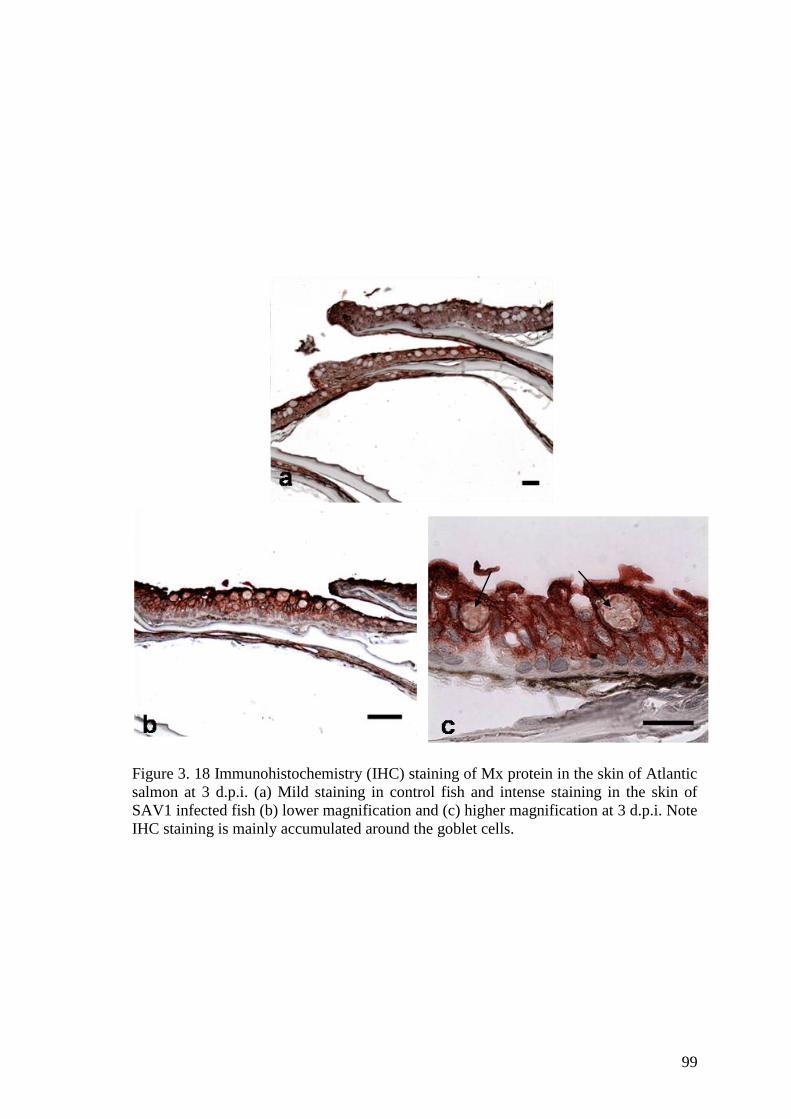
99
Figure 3. 18 Immunohistochemistry (IHC) staining of Mx protein in the skin of Atlantic
salmon at 3 d.p.i. (a) Mild staining in control fish and intense staining in the skin of
SAV1 infected fish (b) lower magnification and (c) higher magnification at 3 d.p.i. Note
IHC staining is mainly accumulated around the goblet cells.
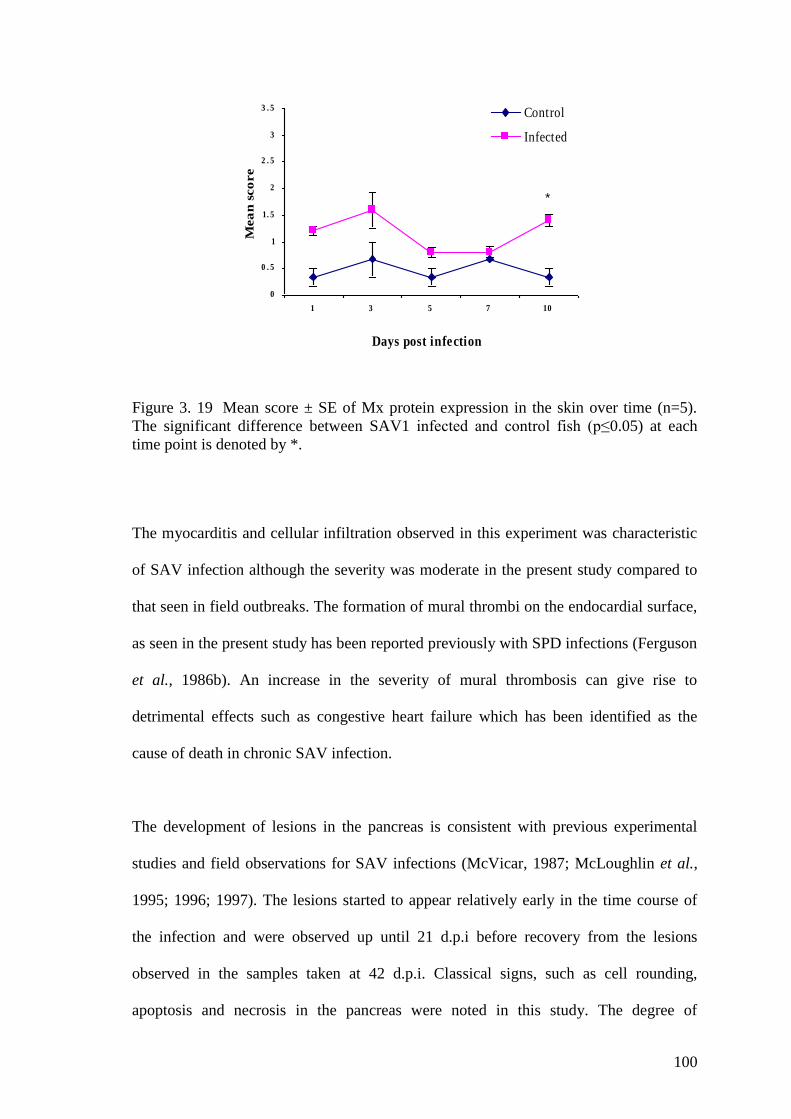
100
Figure 3. 19 Mean score ± SE of Mx protein expression in the skin over time (n=5).
The significant difference between SAV1 infected and control fish (p≤0.05) at each
time point is denoted by *.
The myocarditis and cellular infiltration observed in this experiment was characteristic
of SAV infection although the severity was moderate in the present study compared to
that seen in field outbreaks. The formation of mural thrombi on the endocardial surface,
as seen in the present study has been reported previously with SPD infections (Ferguson
et al., 1986b). An increase in the severity of mural thrombosis can give rise to
detrimental effects such as congestive heart failure which has been identified as the
cause of death in chronic SAV infection.
The development of lesions in the pancreas is consistent with previous experimental
studies and field observations for SAV infections (McVicar, 1987; McLoughlin et al.,
1995; 1996; 1997). The lesions started to appear relatively early in the time course of
the infection and were observed up until 21 d.p.i before recovery from the lesions
observed in the samples taken at 42 d.p.i. Classical signs, such as cell rounding,
apoptosis and necrosis in the pancreas were noted in this study. The degree of
0
0 . 5
1
1. 5
2
2 . 5
3
3 . 5
1 3 5 7 10
Days post infection
Mea
n s
co
re
Control
Infected
*
101
fibroplasia was relatively mild in affected pancreas and associated fat tissues. Similar
levels of low grade fibroplasia were also seen in SAV3 field infections (Taksdal et al.,
2007), and it could possibly be the result of an early recovery with less inflammation
present in affected tissues (Buckley et al., 2001). The presence of few fish in the study
showing mild to moderate mononuclear cell infiltration indicates possible inflammation
and subsequent recovery of the pancreas. Interestingly, these findings indicate that acute
SAV infection can recover without showing any signs of fibroplasia in the pancreas.
Salmonids are known to produce a rapid INF-1 and Mx response during a variety of
different virus infections (Robertsen, 2008). Similarly, i.p injection of SAV1 was also
found to induce a rapid INF-I, INF-II and Mx protein response in the head kidney
tissues of Atlantic salmon. Peak INF-I and Mx protein expression were seen at 3 d.p.i.
This was faster than the expression of these genes seen in similar studies conducted
focusing on IPNV and ISAV infections in salmon (McBeath et al., 2007) and may
indicate a difference in host response against different viral infections.
Mammalian alphaviruses are known to be potent inducers of INF-I and a large number
of interferon stimulated genes (ISG) including Mx protein (Landis et al., 1998;
Johnston et al., 2001; Zhang et al., 2007; Ryman & Klimstra, 2008). In this experiment
activation of INF-1 and Mx protein was detected in the very early stages of the infection
peaking at 3. d.p.i. A significant increase in INF-1 and Mx protein gene expression from
day 3 d.p.i was indicative of active virus replication and establishment of infection in
the head kidney of the challenged fish. However a dramatic drop in INF-1 expression
was observed by 5 d.p.i although this apparently increased again on 7 d.p.i. In contrast,
Mx protein expression steadily dropped after peaking at 3 d.p.i. The drop in INF-I
102
expression at 5 d.p.i could possibly be the result of individual variation in fish sampled
at this time point (since fish were being sacrificed for sampling) rather than an actual
drop of gene expression in respect to virus infection. The rate and degree of the
infection is the factor that determines the degree of an INF-1 response and therefore it is
not uncommon to see this type of transient regulation of cytokines and associated genes
in cellular milieu, as well as a different degree of host response towards the virus
infection (Robertsen, 2006; Haller et al., 2007b). Similar results were noted in some of
the other studies carried out in salmon using ISAV and IPNV infections (McBeath et
al., 2007). However with regards to the high Mx transcription observed in this
experiment, the functional significance of INF-1 should be irrespective of the low level
of INF-transcription detected.
The exact molecular mechanism by which Mx protein can destroy the virus is unknown
(Leong et al., 1998; Lee & Vidal, 2002; Haller et al., 2007a, b). In general, Mx protein
molecules stack with each other to form a co-polymer near to the membranous
structures in the cytoplasm such as endoplamic reticulum (ER) and Golgi boundaries.
These co-polymers are believed to be involved in wrapping the viral nucleoproteins,
preventing formation of replication complexes in RNA viruses or re-directing them to
alternative sites in which genome replication cannot take place (Haller et al., 2007a).
Further, the formation of Mx protein and virus nucleocapsid complexes was mostly
localised near to the nuclear membranes (MacKenzie et al. 2006). As a positive
stranded RNA virus that extensively uses plasma membranes in replication (Helenius,
1995), SAV1 nucleocapsid could possibly be interacting with Mx protein on the cellular
membranes and subjected to destruction. The strong immunohistochemistry (IHC)
staining co-localised around the peri-nuclear region of the cardiomyocytes at 5 d.p.i
103
could have resulted from the formation of such Mx complexes. The diffuse staining
observed at late sampling points (i.e. 10 d.p.i) was indicative of extensive Mx protein
recruitment to the site with the advancement of the infection as described by Haller et
al. (2007a). However, this has provided interesting information on Mx protein
expression indicating that innate immune mechanisms operate in salmonid heart during
viral infections, supporting the evidence that Mx protein is a reliable marker in
monitoring INF-1 production in salmonid heart diseases.
Expression of INF-γ was also up-regulated in the early stages of the infection peaking at
7 d.p.i. In mammals, INF-γ stimulates the production of reactive oxygen and nitrogen
species to kill intra-cellular pathogens and induces the production of antiviral proteins
such as 2‟5‟-oligoadenylate synthetase, dsRNA-dependent protein kinase, guanylate
binding protein and adenosine deaminase (Schroder et al., 2004). Furthermore, it also
regulates the leukocyte trafficking to the injured site, enhances T-cell proliferation and
antigen presentation (Abbas et al., 2000). However, very little is known about the INF-γ
activity in viral diseases and its involvement in the immune response in salmon
(Robertsen, 2008). In this study, parallel expression of both INF-I and II suggests its
possible involvement in exerting an innate immune response to the infection. The
expression was only monitored in the head kidney tissue, which is a tissue rich in
immune cells and it showed the possibility of using this organ as an indicator for
monitoring INF-γ response. The exact cells involved in producing these molecules are
still not clearly defined in fish although it has been demonstrated that lineages of NK
cells and cytotoxic CD8+ cells are involved in mammalian INF-γ production (Fischer et
al., 2006). Gene expression alone does not provide clarification for this and therefore,
104
further morphological evidence would be beneficial in predicting the exact function and
involvement of salmon INF-γ in immune response to viral disease.
The IHC signalling of Mx protein expression in kidney was mostly restricted to the
tubules and a significant difference in signal strength was noted in infected fish at all
time points supporting the expression of Mx protein in SAV1 infections in kidney
tubules. However it would be interesting to evaluate this further to assess the
involvement of kidney tubules in SAV pathogenesis.
The mucous membranes of salmon should play a significant role in the pathogenesis of
SAV. In contrast to a vector involved lifecycle in mammalian alphavirus, atypical SAV
(Villoing et al., 2000a) should use mucous membranes as the portal of entry to the host.
There is no information available on the virus shedding mechanism so far in SAV
however co-habitation infection was demonstrated. The intense Mx signals seen in the
mucous membranes of infected fish with IHC staining seen in the present study
suggested a high pathogen load associated with these tissues and its possible
involvement in virus destruction. Interestingly, the IHC signal for Mx protein was seen
on the outside of the cells in the mucous membranes in addition to mucous cells,
suggesting the wide distribution and possible reticular cell involvement in Mx
production. The intra-peritoneal route used to induce the infection in this experiment is
not a natural means of establishing SAV infection. However the involvement of mucous
membrane (i.e. gills gut and skin) seen with the Mx protein IHC provides a suspicion of
active involvement of cells in these tissues for virus infection and would therefore be
useful in further assessment in understanding the pathogenesis of the disease.
105
The histological lesions observed in the fish were confined to the heart and the pancreas
of the infected fish although skeletal muscles are also reported to be involved in the
infection (Boucher et al., 1995; McLoughlin et al., 1995; 1997; McLoughlin & Graham,
2007). Skeletal lesions are the last pathology to be observed in sequential pathology for
SAV infections, and the absence of these during the experimental infection could
possibly be a result of rapid virus clearance via potent INF-mediated innate immune
response or different tissue tropisms of the particular virus used in this study. The
inverse relation of Mx expression and the severity of pathology in the heart also support
this hypothesis in which Mx production could possibly clear the virus preventing
progression of the infection in the heart. Furthermore, in the pancreas, the severe
pathology would have resulted from low level of antiviral protein expression indicated
by the low IHC staining for Mx protein. However the loss of virulence resulting from
passaging the virus several times in cell cultures over time (Karlsen et al., 2006), as
occurs in mammalian Alphaviruses (Weaver et al., 1999; Powers et al., 2001) could be
another reason for the low level of pathology seen in this study
In conclusion, SAV1 infection induces a rapid INF respond in salmon. Pathological
changes were evident in tissues with low INF response or subsequent to the INF
response. This highlights an INF-associated innate immune response which provides the
first line defence in SAV infection, and possible manipulation of this may be useful in
controlling SAV-1 in salmon.
106
Chapter 4
Transcriptomic Analysis of the Host Response in Early
Stage Salmonid Alphavirus Infection in Atlantic
Salmon
4.1 Introduction
The effect of a virus on its host can produce a variety of physiological outcomes,
ranging from mild asymptomatic disease to the death of the host, or by transforming the
host into a life long carrier of the virus. Host response to viral disease involves a
complex interplay of cellular mechanisms, especially involving immune and antiviral
mechanisms (Cummings & Relman, 2000; Miller & Maclean, 2008). Understanding
how this physiological orchestration of the host response alters during a particular
disease helps in the development of effective control measures for the disease (Schena
et al., 1995). The use of functional genomics has improved the understanding of the
molecular and functional mechanisms which are altered during a pathogenic insult at the
genomic level (Goetz & MacKenzie, 2008). Transcriptomics, the analysis of expression
mRNA in the cell, tissue or at the organism level is a commonly used tool for evaluating
the co-opted cellular process in response to a pathogen. Development of a microarray,
which is a composite representation of genomic material of an organism, spotted onto a
solid membrane, provides a versatile platform to study transcriptomics simultaneously
for a large number of genes, even for the whole genome in some instances. This
multiplex, quantitative, biotechnology tool, in its simplicity, offers a comprehensive
high throughput of samples, and is an attractive approach for studying the interaction
between the infectious agent and the associated host (Cummings & Relman, 2000).
107
The format of the microarrays differs depending on the material (probes) and the
platform being used (Cummings & Relman, 2000). Affymetrix gene chip, glass slide
arrays and membrane-based arrays are the main platforms but glass slide microarrays
are considered the most versatile. The cDNA microarrays are designed from probes
derived from PCR products generated from cDNA libraries or clone collections of
genomic DNA (Schena et al., 1995). The spots on cDNA miroarrays range from 100-
300 µm and are printed robotically on pre-determined positions of glass or nylon
membranes, and more than 30000 known cDNA probes can be incorporated onto a
normal microscopic slide (Schulze & Downward, 2001; Gracey & Cossins, 2003).
Oligonucleotide arrays, in contrast, use synthetic single stranded oligonuceotides of 20-
25 mers in size, and are printed on either glass surfaces or on silicone surfaces by a
photolithographic technique (Schena et al., 1995; Goetz & MacKenzie, 2008; Martin et
al., 2008). Oligonucleotide arrays are far more advanced than cDNA arrays and are
commercially available for different species (Schulze & Downward, 2001; Gracey &
Cossins, 2003). The oligonucleotides arrays are designed to represent the most unique
parts of the gene, to allow the discrimination of the most related transcripts, or splice-
variants thus enabling the elimination of non-specific cross-hybridization (Schena et al.,
1995). However, low cost, flexibility and the fact that there is no need for primary
sequence information for the printing of the DNA element, favours the use of cDNA
arrays compared to oligonucleotide arrays (Cummings & Relman, 2000). Developments
in sequencing technology have enabled easier procurement of EST, short sequences that
act as a proxy identification tag for much longer pieces of un-sequenced cDNA, these
are fundamental for the development of cDNA and oligonucleotide microarrays used in
large scale expression analysis (Alne et al., 2004).
108
Good target preparation and experimental design are vital in successful microarray
experiments. In target preparation for microarray, cellular mRNA or amplified RNA
(aRNA) from the particular experiment is specifically labelled with cyanine dyes (Cy3
and Cy5) by affinity purification and reverse transcribed by priming with oligo-dt or
random primers. This is then hybridized against gene-specific probes spotted on the
array slide under high-stringency conditions, which facilitate specific hybridizations.
The average florescence of each replicate hybridized spot (the fluorescence being a
proxy for the amount of probe target bound) is measured providing an estimate of the
level of expression for a given gene or target transcript. Based on the identities of the
probes on the microarray, the level of expression of their respective target genes can be
quantified. New programs interpreting the microarray data into biological information
in relation to the conditions tested requires extensive data analysis and presentation to
obtain meaningful results. Even though microarrays are considered to be sensitive
molecular tools, there is a greater likelihood of the generation of false positive results.
Independent validation tests for post-analysis such as qRT-PCR, protein expression or
northern-blotting are therefore necessary to confirm the results obtained. In addition,
data generated from the microarray itself only provide a picture of the mRNA
expression at a given time under given conditions. The biological function of the gene
ultimately occurs through post-transcriptional modification, protein expression and
associated post-translational modifications, and this is considered as another pitfall of
microarray analysis. However, considering the labour-intensiveness, time and the cost
involved in proteomics, analysis of global gene expression stands as a very useful
method to give relatively rapid information on signalling pathways and disease status
(Schena et al., 1995).
109
Use of DNA microarray technology, first described in 1995 (Schena et al., 1995;
Cummings & Relman, 2000) has provided a platform for investigating the disease status
and the understanding of the mechanisms of disease in humans and other animals
(Cummings & Relman, 2000; Cummings, 2002; Korth & Katze, 2002; Jung & Chae,
2006; Taylor et al., 2008), including fish (Goetz & MacKenzie, 2008; Martin et al.,
2008). Microarrays are not only available for the host itself, but are also available for
the pathogen, enabling exploration of physiology, virulence/resistant factors,
pharmacogenomics and genotyping of the pathogen (Cummings & Relman, 2000). In a
wider sense, microarray technology can contribute to the rational design and evaluation
of vaccines and other therapeutics, and in selection of health management traits, which
could be useful for improving resistance to diseases of commercially farmed animals
(Goetz & MacKenzie, 2008).
In the recent past high density cDNA or oligoarrays have been developed for a number
of different fish species including zebrafish Danio rerio (Christoper et al., 2002),
Atlantic salmon Salmo salar L (Adzhubei et al., 2007), catfish Ictalurus spp. (Liu et al.,
2008), sea bream Sparus aurata and Atlantic halibut Hippoglossus hippoglossus
(Douglas et al., 2007) rainbow trout Oncorhynchus mykiss Walbaum (Govoroun et al.,
2006) and fathead minnow Pimephales promelas Rafinesque (Douglas, 2006; Goetz &
MacKenzie, 2008; Miller & Maclean, 2008). Microarrays have been validated and used
in a range of different aspects of aquaculture research such as ecological, evolutionary
and environmental studies including the variability of gene expression of natural
populations, speciation, ecotype diversity, environmental remediation and host pathogen
interaction (Goetz & MacKenzie, 2008). In addition arrays for salmon and zebrafish
have been successfully employed for cross-hybridisation studies, involving other
110
species which were not targeted in the design of the initial probe set (Goetz &
MacKenzie, 2008).
Due to commercial interest, several microarrays have been developed for salmonid
species and used to examine different aspects for improving production. In relation to
host-pathogen interactions in salmonids, microarrays are being used to examine the
response to stress (MacKenzie, et al., 2004; Krasnov et al., 2005), viral infections such
as infectious salmon anaemia virus (ISAV) (Jorgensen et al., 2008), infectious
haematopoietic necrosis virus (IHNV) (MacKenzie et al., 2006; Miller et al., 2007), and
viral haemorrhagic septicaemia virus (VHSV) (Byon et al., 2005), bacterial diseases
such as furunculosis (Martin et al., 2006) and piscine rickettsial disease (Rise et al.,
2004), and parasitic diseases such as amoebic gill disease (Young et al., 2008) and sea
lice infection (Olsvik et al., 2008) as well as to examine the effects of therapeutic
interventions (Martin et al., 2008).
Disease development and the sequential pathology of salmonid alphavirus infections
have been studied extensively in both naturally infected farmed Atlantic salmon and in
Atlantic salmon, rainbow trout and brown trout (Salmo trutta) subjected to
experimentally induced SAV infections (McLoughlin et al., 1995, 1996, 1998;
McLoughlin & Graham, 2007). In infected Atlantic salmon the disease is characterised
by initial viraemia followed by severe pathology in the pancreas, heart and skeletal
muscle (McLoughlin et al., 1995, 1997; McLoughlin & Graham, 2007; Taksdal et al.,
2007) and in some cases the kidney (Taksdal et al., 2007). In response to infection with
SAV1, the host produces a neutralising antibody response and displays long-lasting
acquired immunity (Graham et al., 2003b; McLoughlin et al., 2006). Desvignes et al.,
111
(2002) studied the pathogenesis and immune mechanisms of SAV in Atlantic salmon
and noted haematogenous spread of the virus, increased phagocytic activity in the head
kidney of infected fish, and increased lysozyme and complement activity in the plasma
of SPDV-infected Atlantic salmon parr. However the molecular mechanisms involved
in SAV pathogenesis and the host antiviral response are still poorly understood.
As stated before, viruses are able to modulate host cellular processes to assist their own
propagation, thus allowing the infection to become established and a disease state to
develop (Korth & Katze, 2002). The altered or co-opted systems can provide key targets
for the development of management strategies or therapeutic interventions for
improving disease control (Miller et al., 2007). With the ability to simultaneously
measure cellular changes and alterations in associated pathways using microarrays, this
technology was employed in the present study to examine early transcriptional events in
the host response to an experimentally-induced SAV1 infection in Atlantic salmon parr.
Emphasis was placed on the identification of genes associated with immune regulation,
antiviral response and mechanisms of cell death during the early stages of infection, as
these have particular relevance in understanding SAV1 pathogenesis. This information
will, in turn, help to improve the management of SAV infection in salmon by
identifying potential targets for control measures and vaccine development.
4.2 Materials and Methods
4. 2. 1 4.2.1 RNA Amplification
Total RNA was extracted from the head kidney of Atlantic salmon parr artificially
infected with SAV1 (n=5) and control fish injected with CHSE-214 cells culture
supernatant (n=5) sampled at 1, 3 and 5 d.p.i as described in Chapter 2.3.1. An Ambion
112
„Amino-Allyl MessageAMPTM
II aRNA Amplification kit‟ (Applied Biosystems) was
used to amplify the extracted RNA (aRNA) in order to obtain sufficient quantities for
downstream applications, nominally resulting in 100-fold amplification of RNA. A
single round of amplification was carried out using 700 ng of total RNA extracted from
head kidney of infected and control fish sampled on 1, 3, and 5 d.p.i according to the
manufacturer‟s instructions. In brief, T7Oligo (dT) primed RNA was reverse transcribed
at 42oC for 2 h to obtain first-strand cDNA. Single-strand cDNA with T7 promoters at
the 5‟ end was then converted into dsDNA at 16oC for 2 h, using DNA polymerase.
This was then filter-purified with the filter supplied with the kit to remove excess
reagents. In addition, extraneous RNA was degraded with RNase present in the second
strand synthesis mix. Amino allyl-modified aRNA was then prepared by transcribing
dsDNA templates in-vitro at 37oC for 14 h. After filter purification to remove
unincorporated dNTPs, salt, enzymes and inorganic phosphates, the aRNA was
quantified using a NanoDrop 1000 spectrophotometer and its quality was assessed by
electrophoresis on 1 % agarose gel. An equal volume of aRNA (20 µl) from each
sample was pooled to make a reference control (RC) and all RNA samples were stored
at -70oC until further use.
4. 2. 2 Dye coupling and purification
Infected and control aRNA samples were labelled with Cy3TM
dye, and the pooled RC
sample was labelled with Cy5TM
dye (GE Healthcare, Product Nos. PA23001 and
PA25001 respectively), according to the manufacturer‟s instructions. Briefly, dye
samples were prepared by suspending them in ultra-pure dimethyl sulphoxide (DMSO)
(Sigma-Aldrich). Nuclease-free water was mixed with aRNA (1.2 µg) to give a final
volume of 4 µL to which, 1 µl of 0.5 M NaHCO3 and 5 µL of dye solution (either Cy3
113
or Cy5) was added. This was incubated at 25°C on a heat-block in the dark for 1 h.
IllustraTM
AutoSeq G-50 (GE Healthcare) dye-terminator spin columns were used to
remove the uncoupled dye. After removing the bottom closure from the columns, they
were centrifuged at 2000 x g for 1 min and subsequently loaded with dye-labelled
aRNA before centrifuging for 1 min at 2000 x g. The success of the dye coupling was
assessed by electrophoresis of 0.5 ml of labelled sample on a 1 % agarose gel stained
with EtBr and visualization using a Typhoon scanner (GE Healthcare). The
concentration of labelled aRNA was determined using a NanoDrop 1000
spectrophotometer. Samples were stored at -70oC prior to use.
4. 2. 3 Microarray hybridization and scanning
The TRAITS Version 2.0 Atlantic salmon cDNA microarray, comprising 16,950
features and developed by the Salmotrip consortium (Taggart et al., 2008) was used for
the study. Altogether, 30 arrays were used for this experiment comprising replicate 5
fish samples collected at three different time points (1, 3 and 5 .d.p.i.) from two states
(infected and control). For each array a Cy3-coupled test sample was hybridized versus
the Cy5-coupled pooled reference control.
Array slides were pre-hybridised to prevent non-specific hybridisation by washing them
with nuclease-free water in an EasyDipTM
slide staining system (Canemco, Canada) (3
rinses, 30 sec each) followed by pre-hybridization in 5 x saline-sodium citrate buffer
(SSC), 0.2 % SDS and 1.5 % bovine serum albumin (BSA) (Sigma-Aldrich) for 2 h at
50oC. Slides were then rinsed as before, dried by centrifugation at 500 x g for 5 min and
loaded into a Lucidia semi-automated hybridization system (GE Healthcare). The
hybridisation master mix consisted of 170 µl of 0.5 x Ultrahyb (1:1 ratio of Ultrahyb
114
and 4x SSC pH 7.0 Ambion), 20 µl Poly A (10 mg ml-1
, Sigma-Aldrich), and 10 µl of
herring sperm DNA (10 mg ml-1
, Sigma-Aldrich) per sample. After dispensing 200 µl
into labelled 1.5 ml tubes, the tubes were warmed to 60°C. Cy3 and Cy5 labelled
samples were placed in 0.2 ml PCR tubes and denatured at 95°C for 3 min before
adding to the warmed master mix. Samples were kept in the dark at 60oC until they
were loaded into hybridisation chambers containing the array slides. Hybridisation
solution (180 µL) was injected into each chamber using a Hamilton syringe which was
thoroughly rinsed with heated MilliQ water (60ºC) after each use. The hybridisation
programme comprised of chamber heating to 70oC for 10 min, hybridisation at 42°C for
17 h with pulse-mixing every 15 min, then washing: Wash-1, 1.0 x SSC, 0.1 % SDS,
800 µl flush at a rate of 8 µl sec-1
; Wash-2, 0.3 x SSC, 0.2 % SDS, flushing 800 µl at a
flow rate of 8 µl sec-1
; and finally reducing the temperature to 40oC before removing the
slides for high stringency washes. Manual high stringency washings were carried out at
45ºC on a Stuart Orbital incubator, with two 3 min washes of 0.2 × SSC, and three 2
washes of 0.1× SSC, followed by a 20 sec dip in 0.1× SSC. Slides were dried by
centrifuging at 500 x g for 5 min in an EasyDip container with a sheet of paper towel at
the bottom to absorb moisture. The hybridised slides were kept in the dark prior to
scanning. Individual slides were scanned using a Perkin Elmer ScanArray Express HT
scanner at 10 µm resolution. Both laser power (80-90 %) and photomultiplier tube gain
(80-90 %) were adjusted to keep spot intensities within the linear portion of the
response.
4. 2. 4 Data processing
The raw scanned intensities were imported into BlueFuse software (BlueGnome,
Cambridge, UK), which employs an advanced statistical algorithm that allows optimal
115
separation of signal and noise, to deliver accurate and reproducible results, enhancing
the quality of weakly expressed genes and the dynamic range of the experiment. All
features were checked for quality, and abnormal or bad spots were identified. The
linear-intensities of the replicate features were fused using a proprietary Bluefuse
algorithm before transferring into Genespring GX version 10.0 (Agilent Technologies,
UK) for analysis of expression. Data imported into Genespring was normalized using a
Lowess correction. Quality parameters generated by Bluefuse (Blue fuse quality ≥ 0.05
in 3 out of 6 and Bluefuse confidence > 0.2 in 3 out of 6) were used to filter data for
high quality. Final quality filtering in Genespring left 10,578 targets appropriate for
statistical analysis. These data were examined using volcano plots to observe the gene
behaviour over time. Differences between infected and control samples were compared
with a Welch‟s t-test (unpaired samples with unequal variance)(p ≤ 0.05) for each time-
point and the effects of infection and the interaction of infection and time point on gene
expression was estimated using a 2-way ANOVA (p ≤ 0.05). False discovery rate
correction was not employed for analysis as this has been found to be over conservative
in former studies carried out in the lab (personal communication Drs. J. Taggart and J.E.
Bron) often removing „fine‟ differential expression of key genes as confirmed by qRT-
PCR. The gene up-down regulations of these interactions (fold change cut off value ±
1.3) were taken into account in interpreting the final outcome, and identified using
GeneSpring GX software. The functional associations of the differentially expressed
genes were studied with prepared gene lists. For this the top 1000 significantly,
differentially expressed genes of the ANOVA lists of infection and infection and time
point interaction were filtered by discarding un-known, un-named, no-hit, or with no
identity to obtain a known identity. The lists results were then subjected for functional
classification. The fold changes obtained from t-tests of those genes at different time
116
points were also combined to the final list. The functional analysis has grouped the top
selected genes and was used to generate the heat maps for visualising up-down
regulation of the genes. Significantly differentially expressed genes, identified for given
states, were used for KEGG pathway analysis in order to assess the impact of infection
on key metabolic and other physiological pathways.
4. 2. 5 Validation of differential expression by RT-PCR
The qRT-PCR was performed on a selected subset of key genes found to be
significantly differentially expressed by microarray analysis. These genes were first
compared to Atlantic salmon ESTs deposited in Genbank. Primer3 software v.0.4.0 was
used to design primers based on the EST sequences for clones included in the TRAITS
v.2 array, and these were selected and optimised prior to use in the experiment.
Information on primers and efficiencies is listed in Table 4.1.
The qRT-PCR was performed by first constructing complementary DNA (cDNA) for 1
µg aRNA using the method described in Chapter 2.2.7.4. Each sample was tested in
duplicate for in the qRT-PCR for each gene in a Quantica® real time PCR machine. The
PCR reaction comprised 5 μL cDNA dilution, 1 μL of each primer (10 µM ml-1
) and 10
μL of Absolute QPCR SYBR Green Mix x2 (ABgene). All reactions were assembled
with minimal light exposure and were subjected to thermal cycling immediately after
assembly. The cycling conditions were: incubation at 95°C for 15 min in order to
activate the Thermo-Start®
DNA polymerase present in the mix followed by 45 PCR
cycles consisting of heating for 15 sec at 95°C for denaturing, 30 sec at the desired
temperature (Table 4.1) for annealing and further a 30 sec at 72°C for extension. The Ct
value, which corresponds to the number of cycles at which the fluorescence emission
117
was monitored in real time was analyzed using REST-348 software. The target genes
were normalized against 3 housekeeping genes (Table 4.1). PCR efficiency (E) was
estimated in each run using a serial dilution of cDNA and efficiencies of 1.8-2.09 were
considered acceptable.
4.3 Results
The host response induced by the SAV-1 infection in experimentally infected Atlantic
salmon was studied by microarray analysis. An unpaired t-test (p ≤ 0.05) comparing
uninfected and infected populations at 1 day post infection (d.p.i) revealed a total of 464
significantly, differentially expressed genes of which 240 were up-regulated and 224
down-regulated, whilst a total of 976 and 892 genes were significantly, differentially
up-regulated at 3 and 5 d.p.i., respectively. The numbers of genes found to be down-
regulated on 3 and 5 d.p.i. were 921 and 691, respectively. The gene behaviour of
exposed versus unexposed fish, analysed by volcano plots, was found to be
considerably different at 1 d.p.i. compared to 3 and 5 d.p.i. (Figure 4.1.a-1.c). The
statistical analysis of the interaction of infection with time, using 2-way ANOVA (p ≤
0.05), showed 2564 genes which were significantly, differentially regulated over time in
terms of the interaction of infection and time, while 3478 genes were differentially
expressed with respect to the infection alone. The top 1000 significantly differentially
expressed genes from ANOVA lists of infection and infection and time point interaction
were checked for identity by discarding un-named, unknown, no-hits and no identity
hits and resulted in 504 and 437 genes respectively from the lists. Gene lists of infection
and infection time-point were then analysed for identity and the possible gene function.
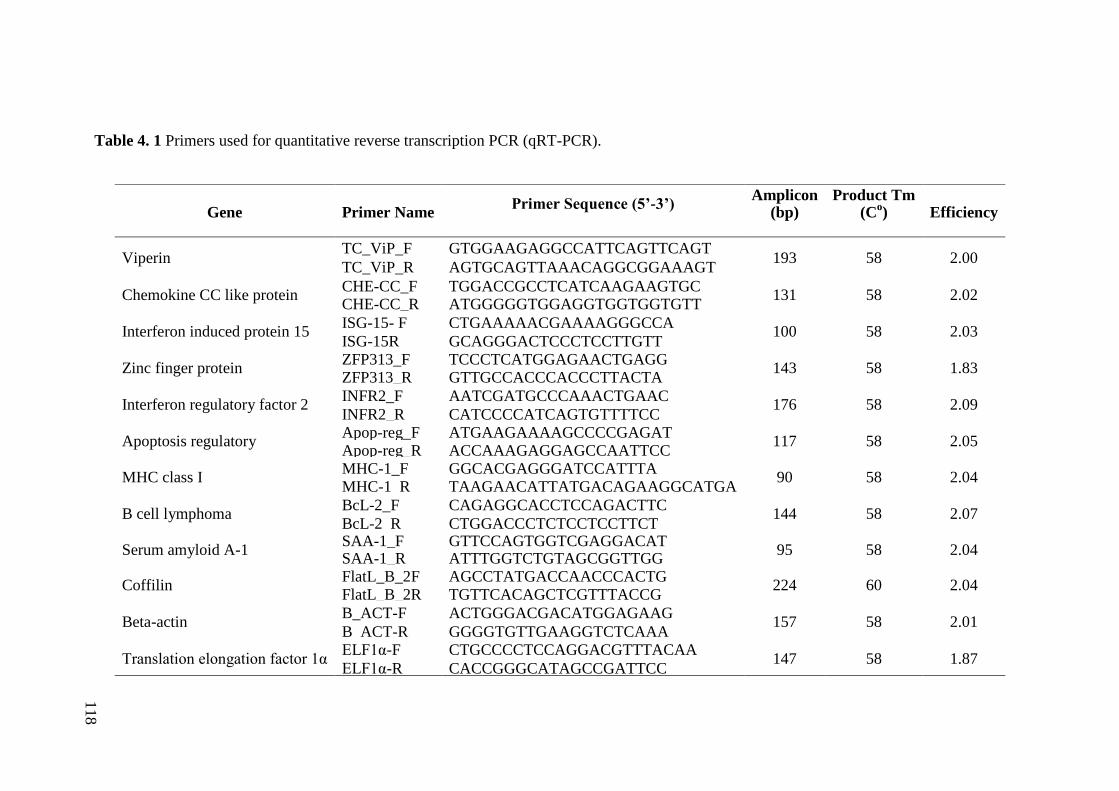
118
Table 4. 1 Primers used for quantitative reverse transcription PCR (qRT-PCR).
Gene Primer Name Primer Sequence (5’-3’)
Amplicon (bp)
Product Tm (C
o)
Efficiency
Viperin TC_ViP_F GTGGAAGAGGCCATTCAGTTCAGT
193 58 2.00 TC_ViP_R AGTGCAGTTAAACAGGCGGAAAGT
Chemokine CC like protein CHE-CC_F TGGACCGCCTCATCAAGAAGTGC
131 58 2.02 CHE-CC_R ATGGGGGTGGAGGTGGTGGTGTT
Interferon induced protein 15 ISG-15- F CTGAAAAACGAAAAGGGCCA
100 58 2.03 ISG-15R GCAGGGACTCCCTCCTTGTT
Zinc finger protein ZFP313_F TCCCTCATGGAGAACTGAGG
143 58 1.83 ZFP313_R GTTGCCACCCACCCTTACTA
Interferon regulatory factor 2 INFR2_F AATCGATGCCCAAACTGAAC
176 58 2.09 INFR2_R CATCCCCATCAGTGTTTTCC
Apoptosis regulatory Apop-reg_F ATGAAGAAAAGCCCCGAGAT
117 58 2.05 Apop-reg_R ACCAAAGAGGAGCCAATTCC
MHC class I MHC-1_F GGCACGAGGGATCCATTTA
90 58 2.04 MHC-1_R TAAGAACATTATGACAGAAGGCATGA
B cell lymphoma BcL-2_F CAGAGGCACCTCCAGACTTC
144 58 2.07 BcL-2_R CTGGACCCTCTCCTCCTTCT
Serum amyloid A-1 SAA-1_F GTTCCAGTGGTCGAGGACAT
95 58 2.04 SAA-1_R ATTTGGTCTGTAGCGGTTGG
Coffilin FlatL_B_2F AGCCTATGACCAACCCACTG
224 60 2.04 FlatL_B_2R TGTTCACAGCTCGTTTACCG
Beta-actin B_ACT-F ACTGGGACGACATGGAGAAG
157 58 2.01 B_ACT-R GGGGTGTTGAAGGTCTCAAA
Translation elongation factor 1α ELF1α-F CTGCCCCTCCAGGACGTTTACAA
147 58 1.87 ELF1α-R CACCGGGCATAGCCGATTCC
118
119
From the two lists, the selected 269 (ANOVA infection p≤ 0.005 and ANOVA infection
time-point p≤ 0.03) genes were used for the final functional classification. The
functional classes of genes found to be differentially expressed during the SAV
infection consisted of genes related to establishing infection, immune-related, virus-
induced and apoptosis-associated genes.
4. 3. 1 Establishing infection and alteration of host metabolism
A large group of genes associated with cellular stress were significantly, differentially
expressed, and the majority of these were up-regulated in the infected fish over time.
The up-regulated genes included heat shock proteins, proteasome-associated genes, and
members of the ATPase family genes (Figure 4.2). Gene expression relating to cellular
transport and vesicular trafficking (collagen a3(I), fibronectin variant 3, ABC
transporter, ABC transporter precursor, metalloproteinase 2) were significantly,
differentially regulated and these were probably involved in virus entry and subsequent
replication (Figure 4.3). Actin-associated genes (adducine 3γ, fibronectin variant 3,
ATP-binding cassette sub-family D member 2), as well as numerous membrane
transport-related genes (solute carrier family protein 10, 20, 25, 31, tetraspanin 1, and
protocadherin-9), were differentially regulated. Early and late endosome-associated
genes (adaptor-related protein complex 3β2, adaptor-related protein complex 3σ1) were
significantly, differentially expressed highlighting possible membrane-dependent virus
replication (Figure 4.4). Translation elongation factors (factor 2α and 1β2) were down
regulated at 3 and 5 d.p.i which could be indicative of virus-mediated protein synthesis
shut down (Figure 4.4). Ubiqutine and ubiqutine associated genes were also
significantly diferentially regulated in infected fish compared to control fish (Figure
4.4). In addition genes associated with cholesterol metabolism (3-hydroxyacyl- CoA
120
dehydrogenase type 2, acetyl-Coenzyme A acetyltransferase 1, low density lipoprotein
receptor-related protein) were up-regulated on both days 3 and 5 (Figure 4.4).
4. 3. 2 Host response
4.3.2.1 Innate immune response
A large proportion of significantly, differentially expressed genes were associated with
the innate and adaptive immune response. Up-regulation of interferon regulatory factors
I and II (IRF I and II), interferon type-Iα2 (INF-Iα2) and INF-1α2 associated gene was
seen from 1 d.p.i. in infected fish, as was the up-regulation of interferon induced
proteins (ISG-15 like protein, INF-inducible Gig-2, INF inducible protein-58 and Mx3
protein) (Figure 4.5). The gene encoding the key responder to external stimuli, nuclear
factor kappa-light-chain-enhancer of activated B-cells (NF-κB), was found to be up-
regulated in infected fish, while down-regulation of NF-κB inhibitor, alpha-like protein
B (INF-κBα), was seen at all three time points (Figure 4.5). Atlantic salmon double
stranded RNA (dsRNA) activated Z-DNA binding protein kinase was also up-regulated.
Further innate immune responsive transcripts, including the cytokines IL-15 and IL-18,
TNFα and acute phase proteins (serum amyloid A, fibrinogen beta chain) were also seen
to be significantly differentially regulated (Figure 4.5).
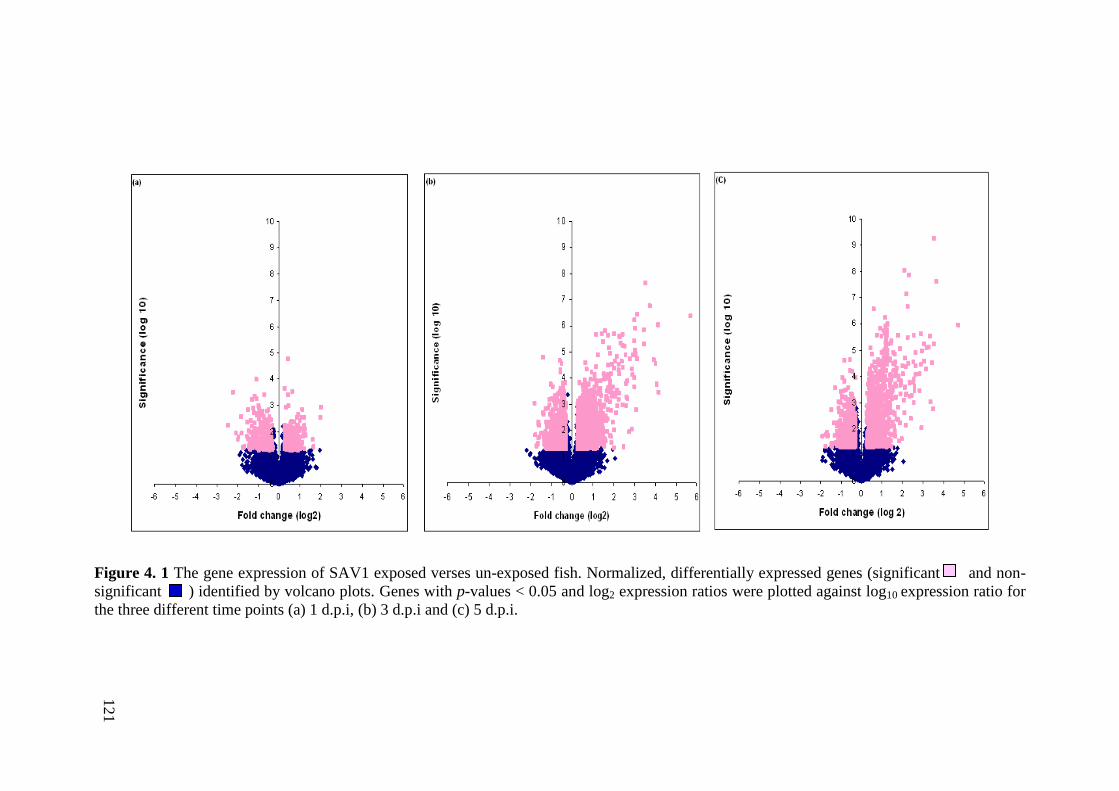
121
Figure 4. 1 The gene expression of SAV1 exposed verses un-exposed fish. Normalized, differentially expressed genes (significant and non-
significant ) identified by volcano plots. Genes with p-values < 0.05 and log2 expression ratios were plotted against log10 expression ratio for
the three different time points (a) 1 d.p.i, (b) 3 d.p.i and (c) 5 d.p.i.
121
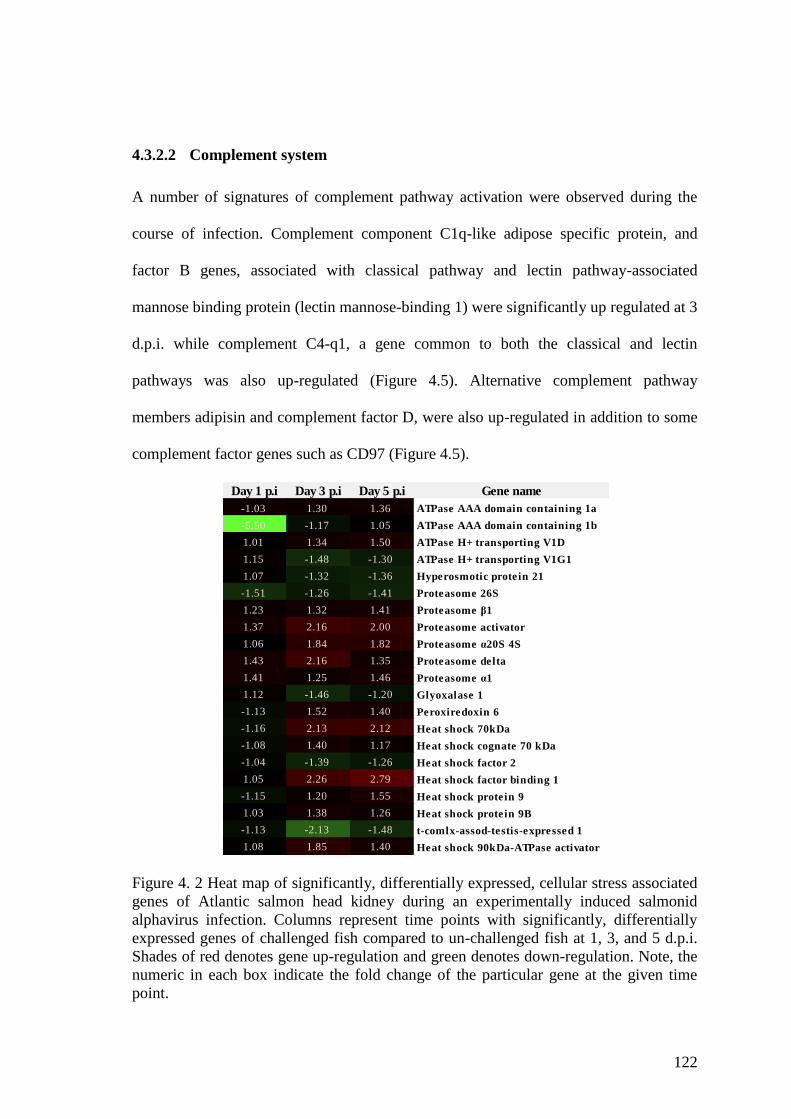
122
4.3.2.2 Complement system
A number of signatures of complement pathway activation were observed during the
course of infection. Complement component C1q-like adipose specific protein, and
factor B genes, associated with classical pathway and lectin pathway-associated
mannose binding protein (lectin mannose-binding 1) were significantly up regulated at 3
d.p.i. while complement C4-q1, a gene common to both the classical and lectin
pathways was also up-regulated (Figure 4.5). Alternative complement pathway
members adipisin and complement factor D, were also up-regulated in addition to some
complement factor genes such as CD97 (Figure 4.5).
Figure 4. 2 Heat map of significantly, differentially expressed, cellular stress associated
genes of Atlantic salmon head kidney during an experimentally induced salmonid
alphavirus infection. Columns represent time points with significantly, differentially
expressed genes of challenged fish compared to un-challenged fish at 1, 3, and 5 d.p.i.
Shades of red denotes gene up-regulation and green denotes down-regulation. Note, the
numeric in each box indicate the fold change of the particular gene at the given time
point.
Day 1 p.i Day 3 p.i Day 5 p.i Gene name
ATPase AAA domain containing 1a
ATPase AAA domain containing 1b
ATPase H+ transporting V1D
ATPase H+ transporting V1G1
Hyperosmotic protein 21
Proteasome 26S
Proteasome β1
Proteasome activator
Proteasome α20S 4S
Proteasome delta
Proteasome α1
Glyoxalase 1
Peroxiredoxin 6
Heat shock 70kDa
Heat shock cognate 70 kDa
Heat shock factor 2
Heat shock factor binding 1
Heat shock protein 9
Heat shock protein 9B
t-comlx-assod-testis-expressed 1
Heat shock 90kDa-ATPase activator
-1.03 1.30 1.36
-5.50 -1.17 1.05
1.01 1.34 1.50
1.15 -1.48 -1.30
1.07 -1.32 -1.36
-1.51 -1.26 -1.41
1.23 1.32 1.41
1.37 2.16 2.00
1.06 1.84 1.82
1.43 2.16 1.35
1.41 1.25 1.46
1.12 -1.46 -1.20
-1.13 1.52 1.40
-1.16 2.13 2.12
-1.08 1.40 1.17
-1.04 -1.39 -1.26
1.05 2.26 2.79
-1.15 1.20 1.55
1.03 1.38 1.26
-1.13 -2.13 -1.48
1.08 1.85 1.40
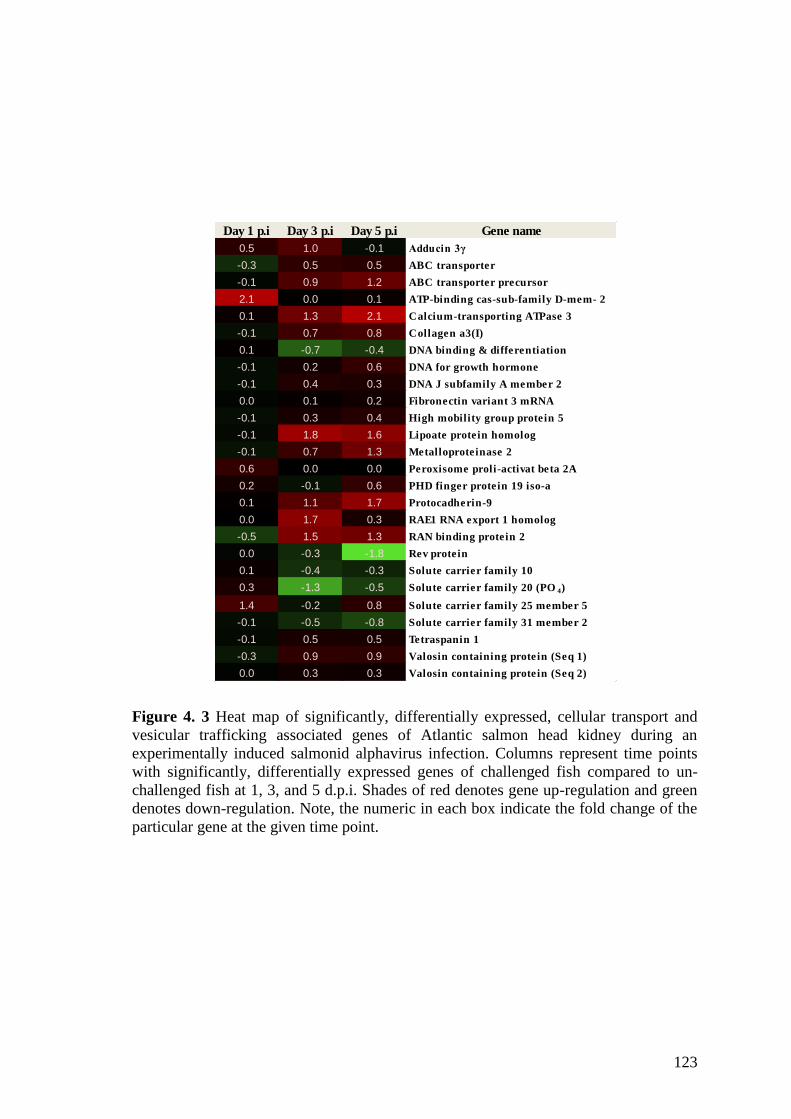
123
Figure 4. 3 Heat map of significantly, differentially expressed, cellular transport and
vesicular trafficking associated genes of Atlantic salmon head kidney during an
experimentally induced salmonid alphavirus infection. Columns represent time points
with significantly, differentially expressed genes of challenged fish compared to un-
challenged fish at 1, 3, and 5 d.p.i. Shades of red denotes gene up-regulation and green
denotes down-regulation. Note, the numeric in each box indicate the fold change of the
particular gene at the given time point.
Day 1 p.i Day 3 p.i Day 5 p.i Gene name
0.5 1.0 -0.1 Adducin 3γ
-0.3 0.5 0.5 ABC transporter
-0.1 0.9 1.2 ABC transporter precursor
2.1 0.0 0.1 ATP-binding cas-sub-family D-mem- 2
0.1 1.3 2.1 Calcium-transporting ATPase 3
-0.1 0.7 0.8 Collagen a3(I)
0.1 -0.7 -0.4 DNA binding & differentiation
-0.1 0.2 0.6 DNA for growth hormone
-0.1 0.4 0.3 DNA J subfamily A member 2
0.0 0.1 0.2 Fibronectin variant 3 mRNA
-0.1 0.3 0.4 High mobility group protein 5
-0.1 1.8 1.6 Lipoate protein homolog
-0.1 0.7 1.3 Metalloproteinase 2
0.6 0.0 0.0 Peroxisome proli-activat beta 2A
0.2 -0.1 0.6 PHD finger protein 19 iso-a
0.1 1.1 1.7 Protocadherin-9
0.0 1.7 0.3 RAE1 RNA export 1 homolog
-0.5 1.5 1.3 RAN binding protein 2
0.0 -0.3 -1.8 Rev protein
0.1 -0.4 -0.3 Solute carrier family 10
0.3 -1.3 -0.5 Solute carrier family 20 (PO 4)
1.4 -0.2 0.8 Solute carrier family 25 member 5
-0.1 -0.5 -0.8 Solute carrier family 31 member 2
-0.1 0.5 0.5 Tetraspanin 1
-0.3 0.9 0.9 Valosin containing protein (Seq 1)
0.0 0.3 0.3 Valosin containing protein (Seq 2)
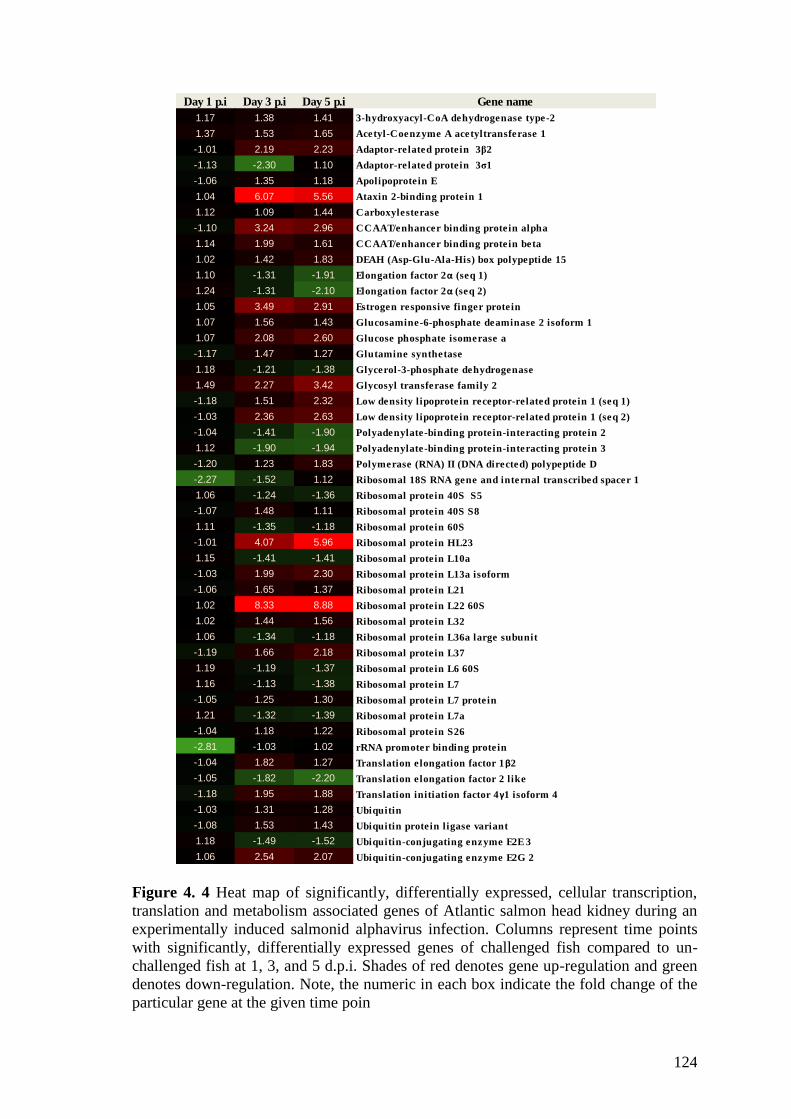
124
Figure 4. 4 Heat map of significantly, differentially expressed, cellular transcription,
translation and metabolism associated genes of Atlantic salmon head kidney during an
experimentally induced salmonid alphavirus infection. Columns represent time points
with significantly, differentially expressed genes of challenged fish compared to un-
challenged fish at 1, 3, and 5 d.p.i. Shades of red denotes gene up-regulation and green
denotes down-regulation. Note, the numeric in each box indicate the fold change of the
particular gene at the given time poin
Day 1 p.i Day 3 p.i Day 5 p.i Gene name
3-hydroxyacyl-CoA dehydrogenase type-2
Acetyl-Coenzyme A acetyltransferase 1
Adaptor-related protein 3β2
Adaptor-related protein 3σ1
Apolipoprotein E
Ataxin 2-binding protein 1
Carboxylesterase
CCAAT/enhancer binding protein alpha
CCAAT/enhancer binding protein beta
DEAH (Asp-Glu-Ala-His) box polypeptide 15
Elongation factor 2α (seq 1)
Elongation factor 2α (seq 2)
Estrogen responsive finger protein
Glucosamine-6-phosphate deaminase 2 isoform 1
Glucose phosphate isomerase a
Glutamine synthetase
Glycerol-3-phosphate dehydrogenase
Glycosyl transferase family 2
Low density lipoprotein receptor-related protein 1 (seq 1)
Low density lipoprotein receptor-related protein 1 (seq 2)
Polyadenylate-binding protein-interacting protein 2
Polyadenylate-binding protein-interacting protein 3
Polymerase (RNA) II (DNA directed) polypeptide D
Ribosomal 18S RNA gene and internal transcribed spacer 1
Ribosomal protein 40S S5
Ribosomal protein 40S S8
Ribosomal protein 60S
Ribosomal protein HL23
Ribosomal protein L10a
Ribosomal protein L13a isoform
Ribosomal protein L21
Ribosomal protein L22 60S
Ribosomal protein L32
Ribosomal protein L36a large subunit
Ribosomal protein L37
Ribosomal protein L6 60S
Ribosomal protein L7
Ribosomal protein L7 protein
Ribosomal protein L7a
Ribosomal protein S26
rRNA promoter binding protein
Translation elongation factor 1β2
Translation elongation factor 2 like
Translation initiation factor 4γ1 isoform 4
Ubiquitin
Ubiquitin protein ligase variant
Ubiquitin-conjugating enzyme E2E 3
Ubiquitin-conjugating enzyme E2G 2
1.17 1.38 1.41
1.37 1.53 1.65
-1.01 2.19 2.23
-1.13 -2.30 1.10
-1.06 1.35 1.18
1.04 6.07 5.56
1.12 1.09 1.44
-1.10 3.24 2.96
1.14 1.99 1.61
1.02 1.42 1.83
1.10 -1.31 -1.91
1.24 -1.31 -2.10
1.05 3.49 2.91
1.07 1.56 1.43
1.07 2.08 2.60
-1.17 1.47 1.27
1.18 -1.21 -1.38
1.49 2.27 3.42
-1.18 1.51 2.32
-1.03 2.36 2.63
-1.04 -1.41 -1.90
1.12 -1.90 -1.94
-1.20 1.23 1.83
-2.27 -1.52 1.12
1.06 -1.24 -1.36
-1.07 1.48 1.11
1.11 -1.35 -1.18
-1.01 4.07 5.96
1.15 -1.41 -1.41
-1.03 1.99 2.30
-1.06 1.65 1.37
1.02 8.33 8.88
1.02 1.44 1.56
1.06 -1.34 -1.18
-1.19 1.66 2.18
1.19 -1.19 -1.37
1.16 -1.13 -1.38
-1.05 1.25 1.30
1.21 -1.32 -1.39
-1.04 1.18 1.22
-2.81 -1.03 1.02
-1.04 1.82 1.27
-1.05 -1.82 -2.20
-1.18 1.95 1.88
-1.03 1.31 1.28
-1.08 1.53 1.43
1.18 -1.49 -1.52
1.06 2.54 2.07
125
4.3.2.3 Adaptive immune response
Both T- and B-cell pathway-associated genes were significantly, differentially
expressed in the infected population compared to control fish. MHC I and associated
genes (MHC-I, MHC-I a and b, MHC-I antigen, beta microglobulin and tapsin) were
up-regulated from 3 d.p.i., while two probes for MHC class II- associated genes showed
up-regulation and two showed down-regulation in infected fish (Figure 4.6).
Chemokines responsible for activation and maturation of adaptive immune responses
were also significantly, differentially expressed with CC-like and CXC-like chemokines
being up-regulated from 3 d.p.i. Conversely, CXC chemokine-receptors were-down
regulated at all three time points.
Genes involved in T-cell activation (T-cell antigen receptor beta, pre-B cell enhancing
factor) and in T-cell mediated adhesion and inflammation (L-selectin ) (Figure 4.6) also
appeared to be activated in infected fish. In addition the gene for defender against death
(DAD-1), a protein involved in T cell proliferation, was up- regulated at 3 and 5 d.p.i. in
infected fish, highlighting an early onset of T-cell activation during SAV-1 infection
(Figure 4.6).
Activation of tumour necrosis factor ligand super-family member 13B (TNF-13B), also
known as B cell proliferation factor (BAPF) was observed in infected fish from 3 d.p.i.
onwards. Immunoglobulin light chain precursor (IgL) and immunoglobulin heavy chain
(two of IgH.A locus and IgH.M heavy chain) were moderately up- regulated from 3
d.p.i. (Figure 4.6).
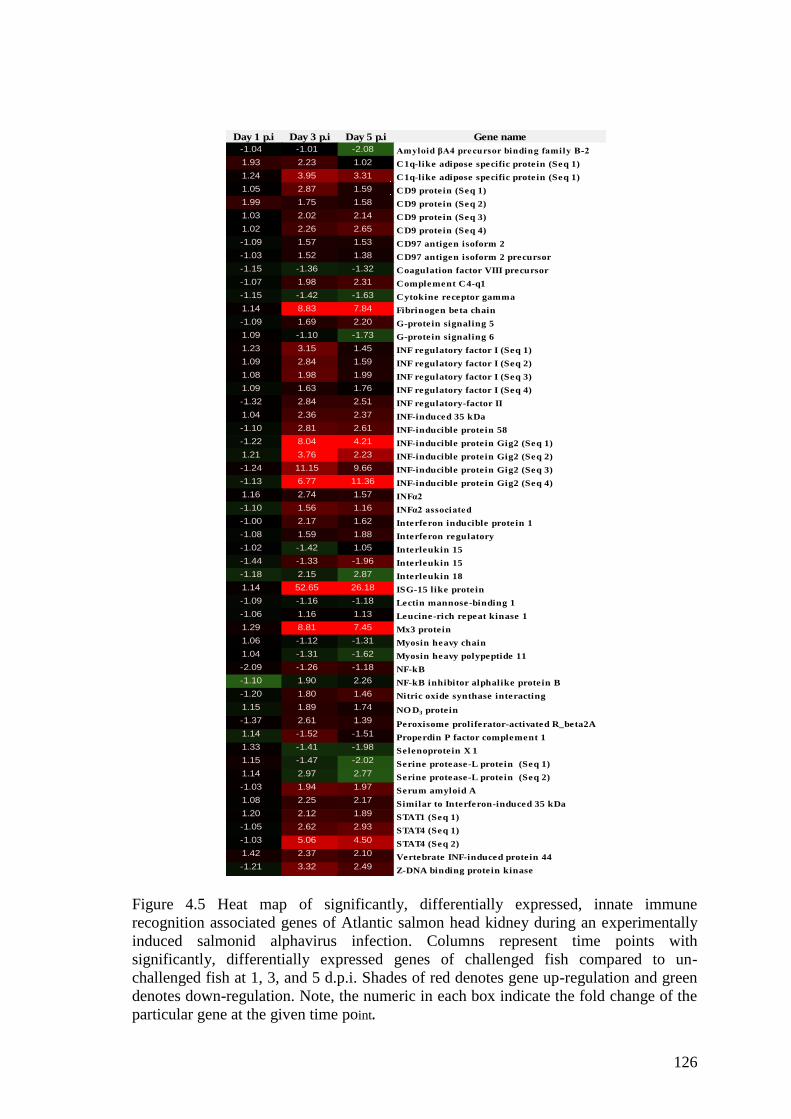
126
Figure 4.5 Heat map of significantly, differentially expressed, innate immune
recognition associated genes of Atlantic salmon head kidney during an experimentally
induced salmonid alphavirus infection. Columns represent time points with
significantly, differentially expressed genes of challenged fish compared to un-
challenged fish at 1, 3, and 5 d.p.i. Shades of red denotes gene up-regulation and green
denotes down-regulation. Note, the numeric in each box indicate the fold change of the
particular gene at the given time point.
Day 1 p.i Day 3 p.i Day 5 p.i Gene name
Amyloid βA4 precursor binding family B-2
C1q-like adipose specific protein (Seq 1)
C1q-like adipose specific protein (Seq 1)
CD9 protein (Seq 1)
CD9 protein (Seq 2)
CD9 protein (Seq 3)
CD9 protein (Seq 4)
CD97 antigen isoform 2
CD97 antigen isoform 2 precursor
Coagulation factor VIII precursor
Complement C4-q1
Cytokine receptor gamma
Fibrinogen beta chain
G-protein signaling 5
G-protein signaling 6
INF regulatory factor I (Seq 1)
INF regulatory factor I (Seq 2)
INF regulatory factor I (Seq 3)
INF regulatory factor I (Seq 4)
INF regulatory-factor II
INF-induced 35 kDa
INF-inducible protein 58
INF-inducible protein Gig2 (Seq 1)
INF-inducible protein Gig2 (Seq 2)
INF-inducible protein Gig2 (Seq 3)
INF-inducible protein Gig2 (Seq 4)
INFα2
INFα2 associated
Interferon inducible protein 1
Interferon regulatory
Interleukin 15
Interleukin 15
Interleukin 18
ISG-15 like protein
Lectin mannose-binding 1
Leucine-rich repeat kinase 1
Mx3 protein
Myosin heavy chain
Myosin heavy polypeptide 11
NF-kB
NF-kB inhibitor alphalike protein B
Nitric oxide synthase interacting
NO D3 protein
Peroxisome proliferator-activated R_beta2A
Properdin P factor complement 1
Selenoprotein X 1
Serine protease-L protein (Seq 1)
Serine protease-L protein (Seq 2)
Serum amyloid A
Similar to Interferon-induced 35 kDa
STAT1 (Seq 1)
STAT4 (Seq 1)
STAT4 (Seq 2)
Vertebrate INF-induced protein 44
Z-DNA binding protein kinase
-1.04 -1.01 -2.08
1.93 2.23 1.02
1.24 3.95 3.31
1.05 2.87 1.59
1.99 1.75 1.58
1.03 2.02 2.14
1.02 2.26 2.65
-1.09 1.57 1.53
-1.03 1.52 1.38
-1.15 -1.36 -1.32
-1.07 1.98 2.31
-1.15 -1.42 -1.63
1.14 8.83 7.84
-1.09 1.69 2.20
1.09 -1.10 -1.73
1.23 3.15 1.45
1.09 2.84 1.59
1.08 1.98 1.99
1.09 1.63 1.76
-1.32 2.84 2.51
1.04 2.36 2.37
-1.10 2.81 2.61
-1.22 8.04 4.21
1.21 3.76 2.23
-1.24 11.15 9.66
-1.13 6.77 11.36
1.16 2.74 1.57
-1.10 1.56 1.16
-1.00 2.17 1.62
-1.08 1.59 1.88
-1.02 -1.42 1.05
-1.44 -1.33 -1.96
-1.18 2.15 2.87
1.14 52.65 26.18
-1.09 -1.16 -1.18
-1.06 1.16 1.13
1.29 8.81 7.45
1.06 -1.12 -1.31
1.04 -1.31 -1.62
-2.09 -1.26 -1.18
-1.10 1.90 2.26
-1.20 1.80 1.46
1.15 1.89 1.74
-1.37 2.61 1.39
1.14 -1.52 -1.51
1.33 -1.41 -1.98
1.15 -1.47 -2.02
1.14 2.97 2.77
-1.03 1.94 1.97
1.08 2.25 2.17
1.20 2.12 1.89
-1.05 2.62 2.93
-1.03 5.06 4.50
1.42 2.37 2.10
-1.21 3.32 2.49
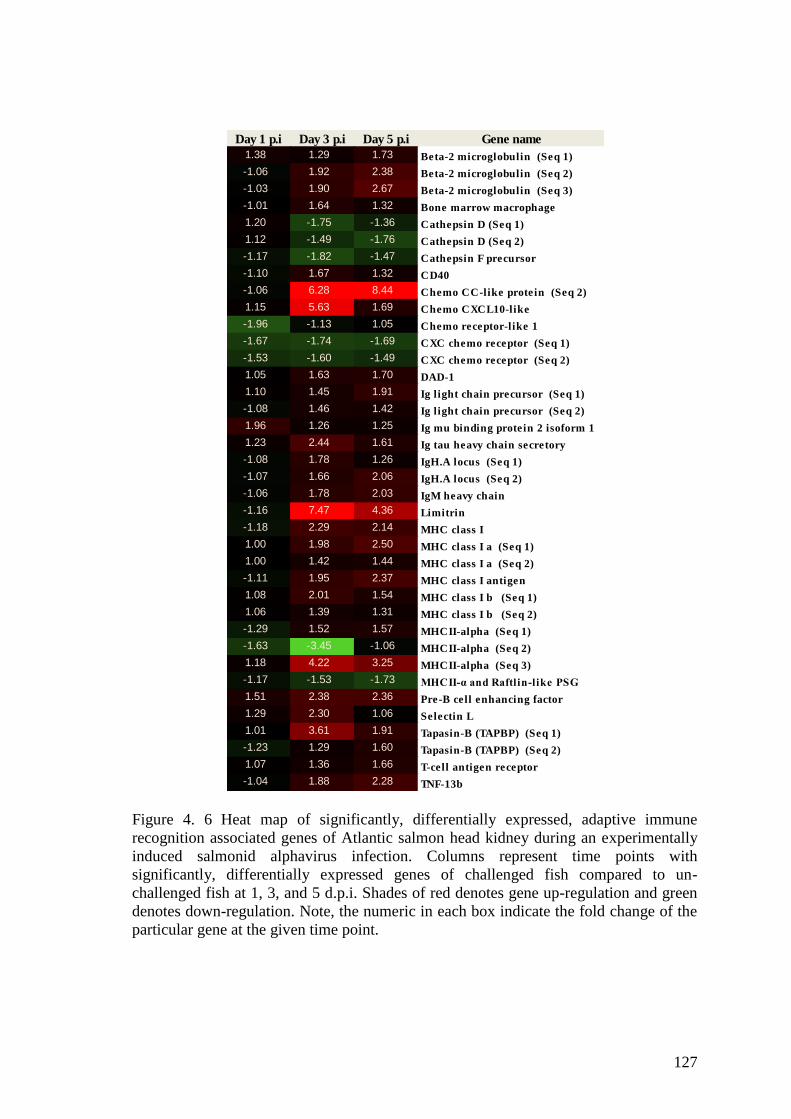
127
Figure 4. 6 Heat map of significantly, differentially expressed, adaptive immune
recognition associated genes of Atlantic salmon head kidney during an experimentally
induced salmonid alphavirus infection. Columns represent time points with
significantly, differentially expressed genes of challenged fish compared to un-
challenged fish at 1, 3, and 5 d.p.i. Shades of red denotes gene up-regulation and green
denotes down-regulation. Note, the numeric in each box indicate the fold change of the
particular gene at the given time point.
Day 1 p.i Day 3 p.i Day 5 p.i Gene name
Beta-2 microglobulin (Seq 1)
Beta-2 microglobulin (Seq 2)
Beta-2 microglobulin (Seq 3)
Bone marrow macrophage
Cathepsin D (Seq 1)
Cathepsin D (Seq 2)
Cathepsin F precursor
CD40
Chemo CC-like protein (Seq 2)
Chemo CXCL10-like
Chemo receptor-like 1
CXC chemo receptor (Seq 1)
CXC chemo receptor (Seq 2)
DAD-1
Ig light chain precursor (Seq 1)
Ig light chain precursor (Seq 2)
Ig mu binding protein 2 isoform 1
Ig tau heavy chain secretory
IgH.A locus (Seq 1)
IgH.A locus (Seq 2)
IgM heavy chain
Limitrin
MHC class I
MHC class I a (Seq 1)
MHC class I a (Seq 2)
MHC class I antigen
MHC class I b (Seq 1)
MHC class I b (Seq 2)
MHCII-alpha (Seq 1)
MHCII-alpha (Seq 2)
MHCII-alpha (Seq 3)
MHCII-α and Raftlin-like PSG
Pre-B cell enhancing factor
Selectin L
Tapasin-B (TAPBP) (Seq 1)
Tapasin-B (TAPBP) (Seq 2)
T-cell antigen receptor
TNF-13b
1.38 1.29 1.73
-1.06 1.92 2.38
-1.03 1.90 2.67
-1.01 1.64 1.32
1.20 -1.75 -1.36
1.12 -1.49 -1.76
-1.17 -1.82 -1.47
-1.10 1.67 1.32
-1.06 6.28 8.44
1.15 5.63 1.69
-1.96 -1.13 1.05
-1.67 -1.74 -1.69
-1.53 -1.60 -1.49
1.05 1.63 1.70
1.10 1.45 1.91
-1.08 1.46 1.42
1.96 1.26 1.25
1.23 2.44 1.61
-1.08 1.78 1.26
-1.07 1.66 2.06
-1.06 1.78 2.03
-1.16 7.47 4.36
-1.18 2.29 2.14
1.00 1.98 2.50
1.00 1.42 1.44
-1.11 1.95 2.37
1.08 2.01 1.54
1.06 1.39 1.31
-1.29 1.52 1.57
-1.63 -3.45 -1.06
1.18 4.22 3.25
-1.17 -1.53 -1.73
1.51 2.38 2.36
1.29 2.30 1.06
1.01 3.61 1.91
-1.23 1.29 1.60
1.07 1.36 1.66
-1.04 1.88 2.28
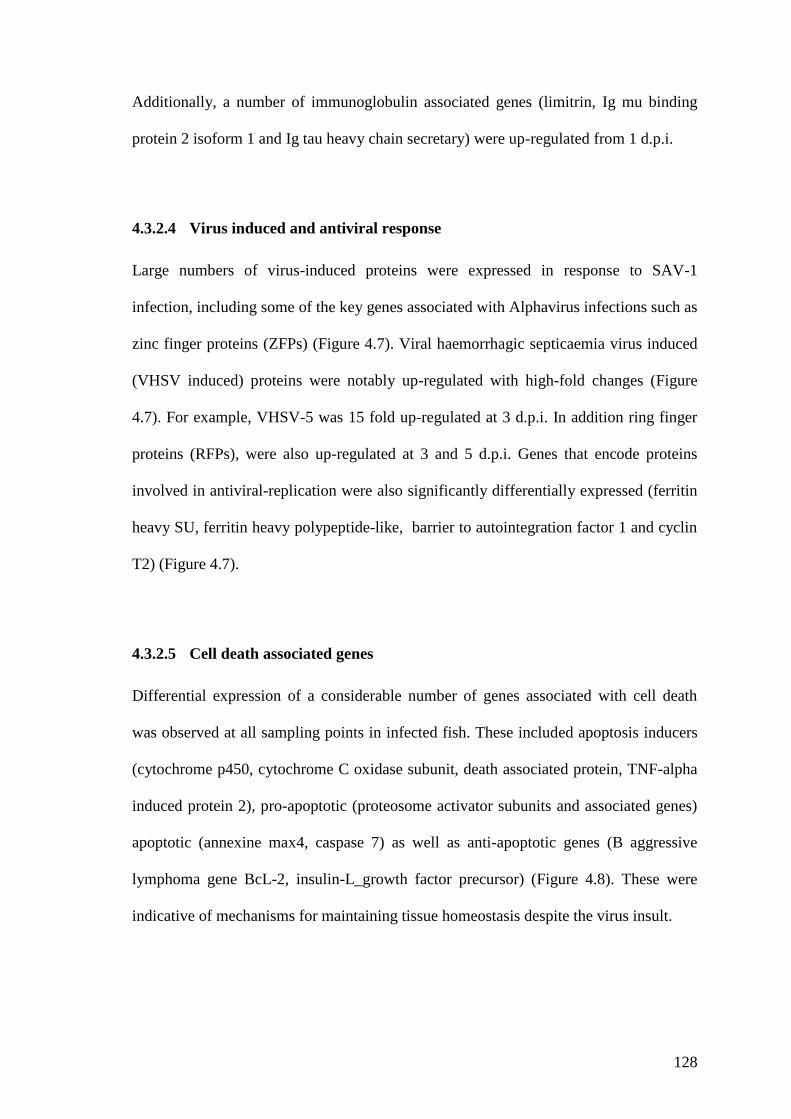
128
Additionally, a number of immunoglobulin associated genes (limitrin, Ig mu binding
protein 2 isoform 1 and Ig tau heavy chain secretary) were up-regulated from 1 d.p.i.
4.3.2.4 Virus induced and antiviral response
Large numbers of virus-induced proteins were expressed in response to SAV-1
infection, including some of the key genes associated with Alphavirus infections such as
zinc finger proteins (ZFPs) (Figure 4.7). Viral haemorrhagic septicaemia virus induced
(VHSV induced) proteins were notably up-regulated with high-fold changes (Figure
4.7). For example, VHSV-5 was 15 fold up-regulated at 3 d.p.i. In addition ring finger
proteins (RFPs), were also up-regulated at 3 and 5 d.p.i. Genes that encode proteins
involved in antiviral-replication were also significantly differentially expressed (ferritin
heavy SU, ferritin heavy polypeptide-like, barrier to autointegration factor 1 and cyclin
T2) (Figure 4.7).
4.3.2.5 Cell death associated genes
Differential expression of a considerable number of genes associated with cell death
was observed at all sampling points in infected fish. These included apoptosis inducers
(cytochrome p450, cytochrome C oxidase subunit, death associated protein, TNF-alpha
induced protein 2), pro-apoptotic (proteosome activator subunits and associated genes)
apoptotic (annexine max4, caspase 7) as well as anti-apoptotic genes (B aggressive
lymphoma gene BcL-2, insulin-L_growth factor precursor) (Figure 4.8). These were
indicative of mechanisms for maintaining tissue homeostasis despite the virus insult.
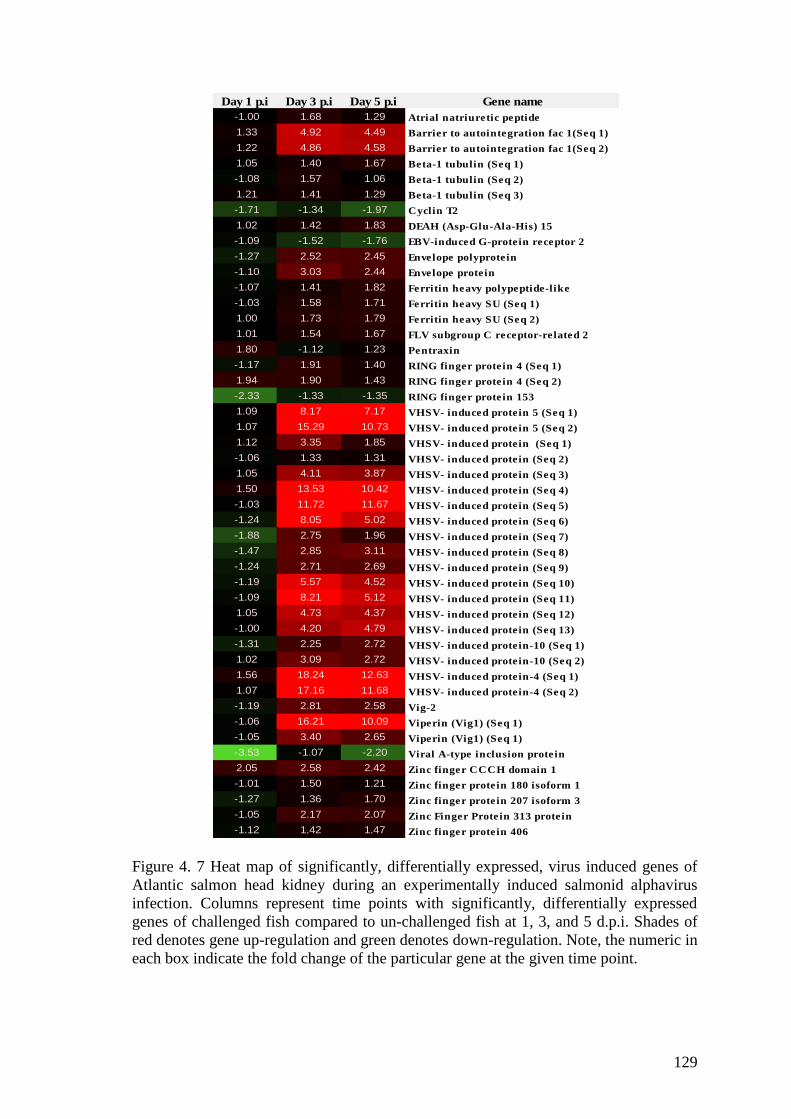
129
Figure 4. 7 Heat map of significantly, differentially expressed, virus induced genes of
Atlantic salmon head kidney during an experimentally induced salmonid alphavirus
infection. Columns represent time points with significantly, differentially expressed
genes of challenged fish compared to un-challenged fish at 1, 3, and 5 d.p.i. Shades of
red denotes gene up-regulation and green denotes down-regulation. Note, the numeric in
each box indicate the fold change of the particular gene at the given time point.
Day 1 p.i Day 3 p.i Day 5 p.i Gene name
Atrial natriuretic peptide
Barrier to autointegration fac 1(Seq 1)
Barrier to autointegration fac 1(Seq 2)
Beta-1 tubulin (Seq 1)
Beta-1 tubulin (Seq 2)
Beta-1 tubulin (Seq 3)
Cyclin T2
DEAH (Asp-Glu-Ala-His) 15
EBV-induced G-protein receptor 2
Envelope polyprotein
Envelope protein
Ferritin heavy polypeptide-like
Ferritin heavy SU (Seq 1)
Ferritin heavy SU (Seq 2)
FLV subgroup C receptor-related 2
Pentraxin
RING finger protein 4 (Seq 1)
RING finger protein 4 (Seq 2)
RING finger protein 153
VHSV- induced protein 5 (Seq 1)
VHSV- induced protein 5 (Seq 2)
VHSV- induced protein (Seq 1)
VHSV- induced protein (Seq 2)
VHSV- induced protein (Seq 3)
VHSV- induced protein (Seq 4)
VHSV- induced protein (Seq 5)
VHSV- induced protein (Seq 6)
VHSV- induced protein (Seq 7)
VHSV- induced protein (Seq 8)
VHSV- induced protein (Seq 9)
VHSV- induced protein (Seq 10)
VHSV- induced protein (Seq 11)
VHSV- induced protein (Seq 12)
VHSV- induced protein (Seq 13)
VHSV- induced protein-10 (Seq 1)
VHSV- induced protein-10 (Seq 2)
VHSV- induced protein-4 (Seq 1)
VHSV- induced protein-4 (Seq 2)
Vig-2
Viperin (Vig1) (Seq 1)
Viperin (Vig1) (Seq 1)
Viral A-type inclusion protein
Zinc finger CCCH domain 1
Zinc finger protein 180 isoform 1
Zinc finger protein 207 isoform 3
Zinc Finger Protein 313 protein
Zinc finger protein 406
-1.00 1.68 1.29
1.33 4.92 4.49
1.22 4.86 4.58
1.05 1.40 1.67
-1.08 1.57 1.06
1.21 1.41 1.29
-1.71 -1.34 -1.97
1.02 1.42 1.83
-1.09 -1.52 -1.76
-1.27 2.52 2.45
-1.10 3.03 2.44
-1.07 1.41 1.82
-1.03 1.58 1.71
1.00 1.73 1.79
1.01 1.54 1.67
1.80 -1.12 1.23
-1.17 1.91 1.40
1.94 1.90 1.43
-2.33 -1.33 -1.35
1.09 8.17 7.17
1.07 15.29 10.73
1.12 3.35 1.85
-1.06 1.33 1.31
1.05 4.11 3.87
1.50 13.53 10.42
-1.03 11.72 11.67
-1.24 8.05 5.02
-1.88 2.75 1.96
-1.47 2.85 3.11
-1.24 2.71 2.69
-1.19 5.57 4.52
-1.09 8.21 5.12
1.05 4.73 4.37
-1.00 4.20 4.79
-1.31 2.25 2.72
1.02 3.09 2.72
1.56 18.24 12.63
1.07 17.16 11.68
-1.19 2.81 2.58
-1.06 16.21 10.09
-1.05 3.40 2.65
-3.53 -1.07 -2.20
2.05 2.58 2.42
-1.01 1.50 1.21
-1.27 1.36 1.70
-1.05 2.17 2.07
-1.12 1.42 1.47
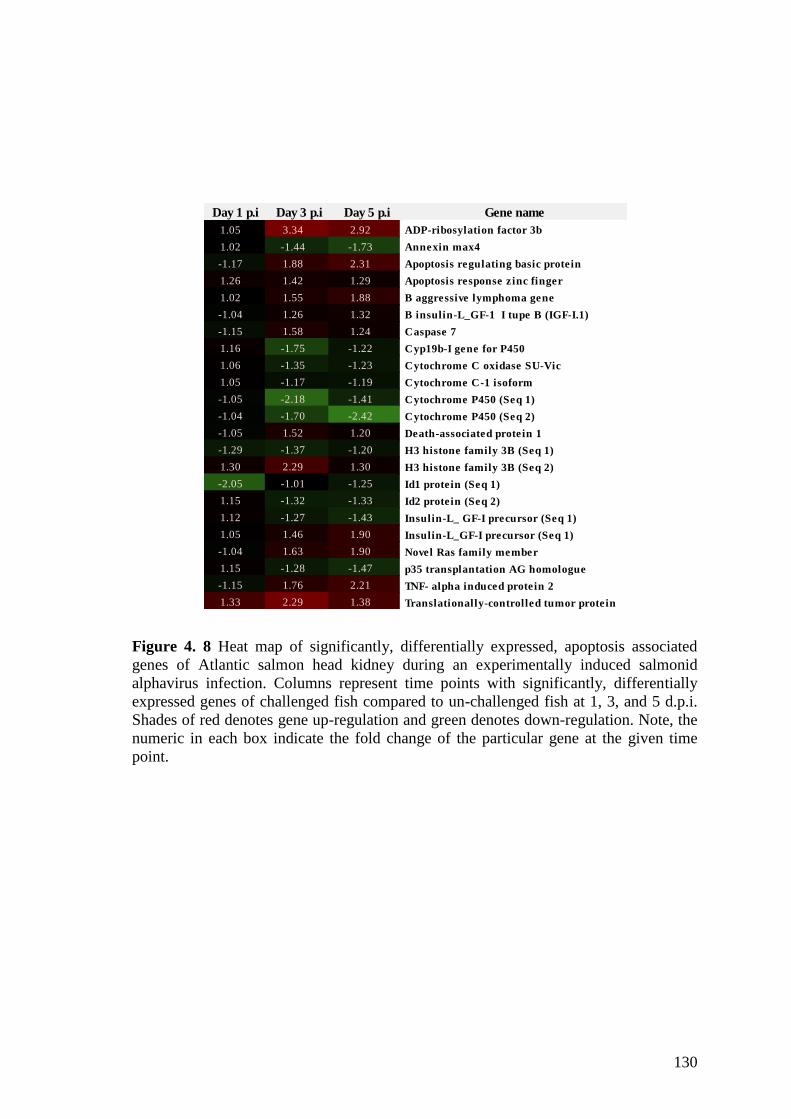
130
Figure 4. 8 Heat map of significantly, differentially expressed, apoptosis associated
genes of Atlantic salmon head kidney during an experimentally induced salmonid
alphavirus infection. Columns represent time points with significantly, differentially
expressed genes of challenged fish compared to un-challenged fish at 1, 3, and 5 d.p.i.
Shades of red denotes gene up-regulation and green denotes down-regulation. Note, the
numeric in each box indicate the fold change of the particular gene at the given time
point.
Day 1 p.i Day 3 p.i Day 5 p.i Gene name
ADP-ribosylation factor 3b
Annexin max4
Apoptosis regulating basic protein
Apoptosis response zinc finger
B aggressive lymphoma gene
B insulin-L_GF-1 I tupe B (IGF-I.1)
Caspase 7
Cyp19b-I gene for P450
Cytochrome C oxidase SU-Vic
Cytochrome C-1 isoform
Cytochrome P450 (Seq 1)
Cytochrome P450 (Seq 2)
Death-associated protein 1
H3 histone family 3B (Seq 1)
H3 histone family 3B (Seq 2)
Id1 protein (Seq 1)
Id2 protein (Seq 2)
Insulin-L_ GF-I precursor (Seq 1)
Insulin-L_GF-I precursor (Seq 1)
Novel Ras family member
p35 transplantation AG homologue
TNF- alpha induced protein 2
Translationally-controlled tumor protein
1.05 3.34 2.92
1.02 -1.44 -1.73
-1.17 1.88 2.31
1.26 1.42 1.29
1.02 1.55 1.88
-1.04 1.26 1.32
-1.15 1.58 1.24
1.16 -1.75 -1.22
1.06 -1.35 -1.23
1.05 -1.17 -1.19
-1.05 -2.18 -1.41
-1.04 -1.70 -2.42
-1.05 1.52 1.20
-1.29 -1.37 -1.20
1.30 2.29 1.30
-2.05 -1.01 -1.25
1.15 -1.32 -1.33
1.12 -1.27 -1.43
1.05 1.46 1.90
-1.04 1.63 1.90
1.15 -1.28 -1.47
-1.15 1.76 2.21
1.33 2.29 1.38
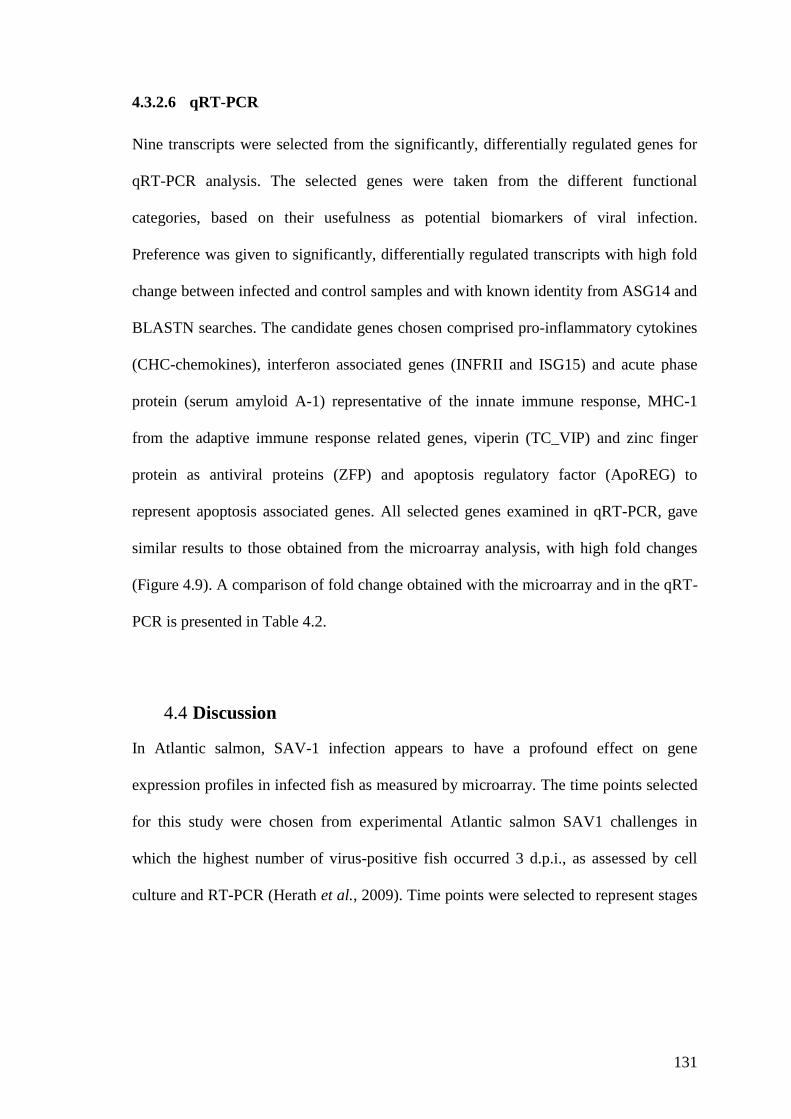
131
4.3.2.6 qRT-PCR
Nine transcripts were selected from the significantly, differentially regulated genes for
qRT-PCR analysis. The selected genes were taken from the different functional
categories, based on their usefulness as potential biomarkers of viral infection.
Preference was given to significantly, differentially regulated transcripts with high fold
change between infected and control samples and with known identity from ASG14 and
BLASTN searches. The candidate genes chosen comprised pro-inflammatory cytokines
(CHC-chemokines), interferon associated genes (INFRII and ISG15) and acute phase
protein (serum amyloid A-1) representative of the innate immune response, MHC-1
from the adaptive immune response related genes, viperin (TC_VIP) and zinc finger
protein as antiviral proteins (ZFP) and apoptosis regulatory factor (ApoREG) to
represent apoptosis associated genes. All selected genes examined in qRT-PCR, gave
similar results to those obtained from the microarray analysis, with high fold changes
(Figure 4.9). A comparison of fold change obtained with the microarray and in the qRT-
PCR is presented in Table 4.2.
4.4 Discussion
In Atlantic salmon, SAV-1 infection appears to have a profound effect on gene
expression profiles in infected fish as measured by microarray. The time points selected
for this study were chosen from experimental Atlantic salmon SAV1 challenges in
which the highest number of virus-positive fish occurred 3 d.p.i., as assessed by cell
culture and RT-PCR (Herath et al., 2009). Time points were selected to represent stages
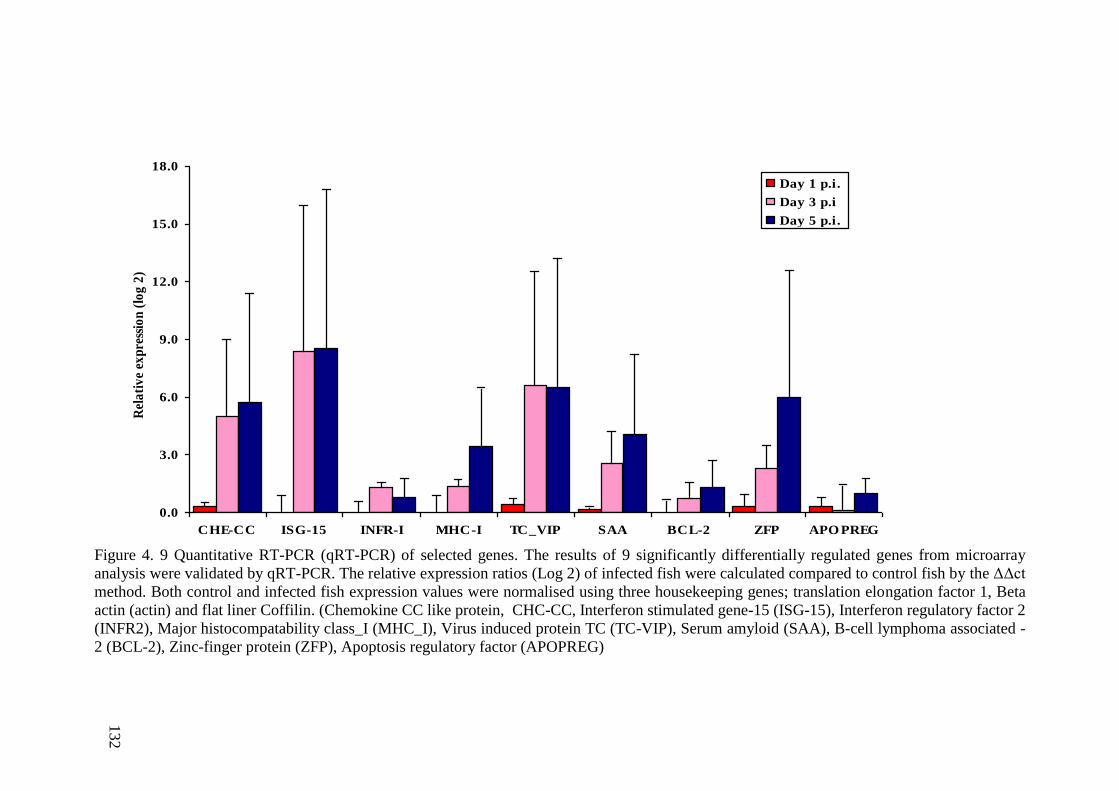
132
Figure 4. 9 Quantitative RT-PCR (qRT-PCR) of selected genes. The results of 9 significantly differentially regulated genes from microarray
analysis were validated by qRT-PCR. The relative expression ratios (Log 2) of infected fish were calculated compared to control fish by the ΔΔct
method. Both control and infected fish expression values were normalised using three housekeeping genes; translation elongation factor 1, Beta
actin (actin) and flat liner Coffilin. (Chemokine CC like protein, CHC-CC, Interferon stimulated gene-15 (ISG-15), Interferon regulatory factor 2
(INFR2), Major histocompatability class_I (MHC_I), Virus induced protein TC (TC-VIP), Serum amyloid (SAA), B-cell lymphoma associated -
2 (BCL-2), Zinc-finger protein (ZFP), Apoptosis regulatory factor (APOPREG)
0.0
3.0
6.0
9.0
12.0
15.0
18.0
CHE-CC ISG-15 INFR-I MHC-I TC_VIP SAA BCL-2 ZFP APO PREG
Rel
ati
ve
exp
ress
ion
(lo
g 2
)
Day 1 p.i.
Day 3 p.i
Day 5 p.i.
132
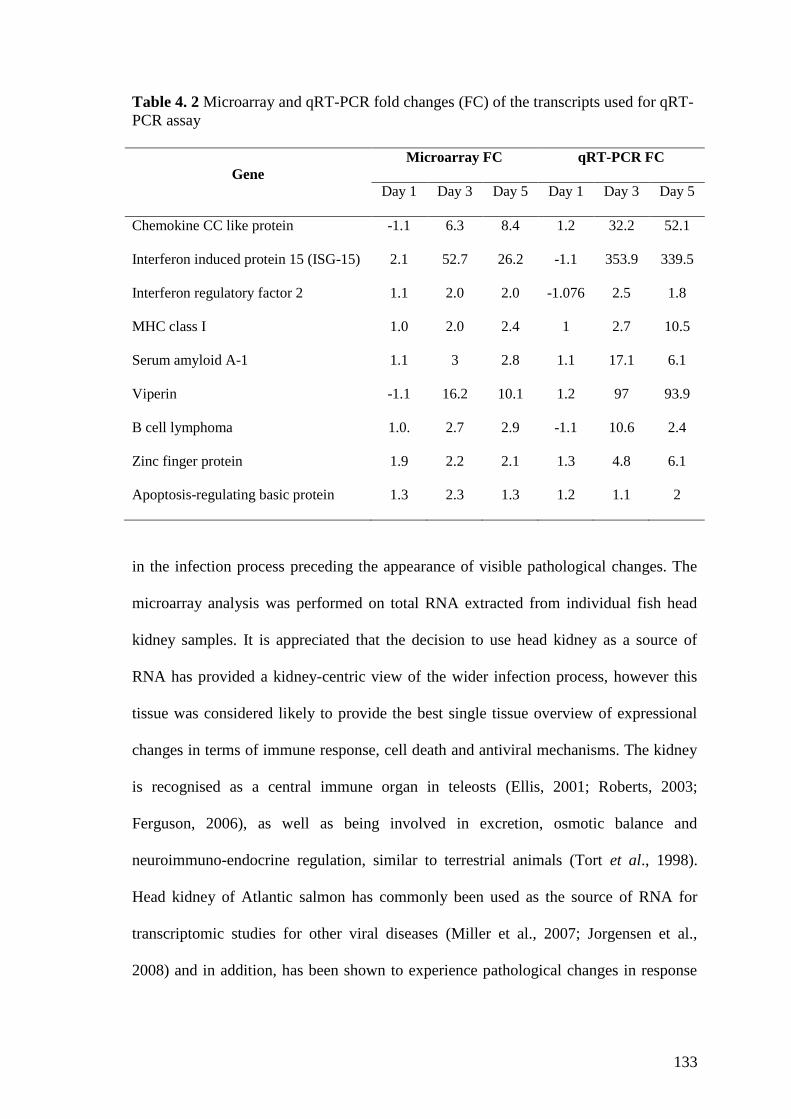
133
Table 4. 2 Microarray and qRT-PCR fold changes (FC) of the transcripts used for qRT-
PCR assay
Gene
Microarray FC qRT-PCR FC
Day 1 Day 3 Day 5 Day 1 Day 3 Day 5
Chemokine CC like protein -1.1 6.3 8.4 1.2 32.2 52.1
Interferon induced protein 15 (ISG-15) 2.1 52.7 26.2 -1.1 353.9 339.5
Interferon regulatory factor 2 1.1 2.0 2.0 -1.076 2.5 1.8
MHC class I 1.0 2.0 2.4 1 2.7 10.5
Serum amyloid A-1 1.1 3 2.8 1.1 17.1 6.1
Viperin -1.1 16.2 10.1 1.2 97 93.9
B cell lymphoma 1.0. 2.7 2.9 -1.1 10.6 2.4
Zinc finger protein 1.9 2.2 2.1 1.3 4.8 6.1
Apoptosis-regulating basic protein 1.3 2.3 1.3 1.2 1.1 2
in the infection process preceding the appearance of visible pathological changes. The
microarray analysis was performed on total RNA extracted from individual fish head
kidney samples. It is appreciated that the decision to use head kidney as a source of
RNA has provided a kidney-centric view of the wider infection process, however this
tissue was considered likely to provide the best single tissue overview of expressional
changes in terms of immune response, cell death and antiviral mechanisms. The kidney
is recognised as a central immune organ in teleosts (Ellis, 2001; Roberts, 2003;
Ferguson, 2006), as well as being involved in excretion, osmotic balance and
neuroimmuno-endocrine regulation, similar to terrestrial animals (Tort et al., 1998).
Head kidney of Atlantic salmon has commonly been used as the source of RNA for
transcriptomic studies for other viral diseases (Miller et al., 2007; Jorgensen et al.,
2008) and in addition, has been shown to experience pathological changes in response
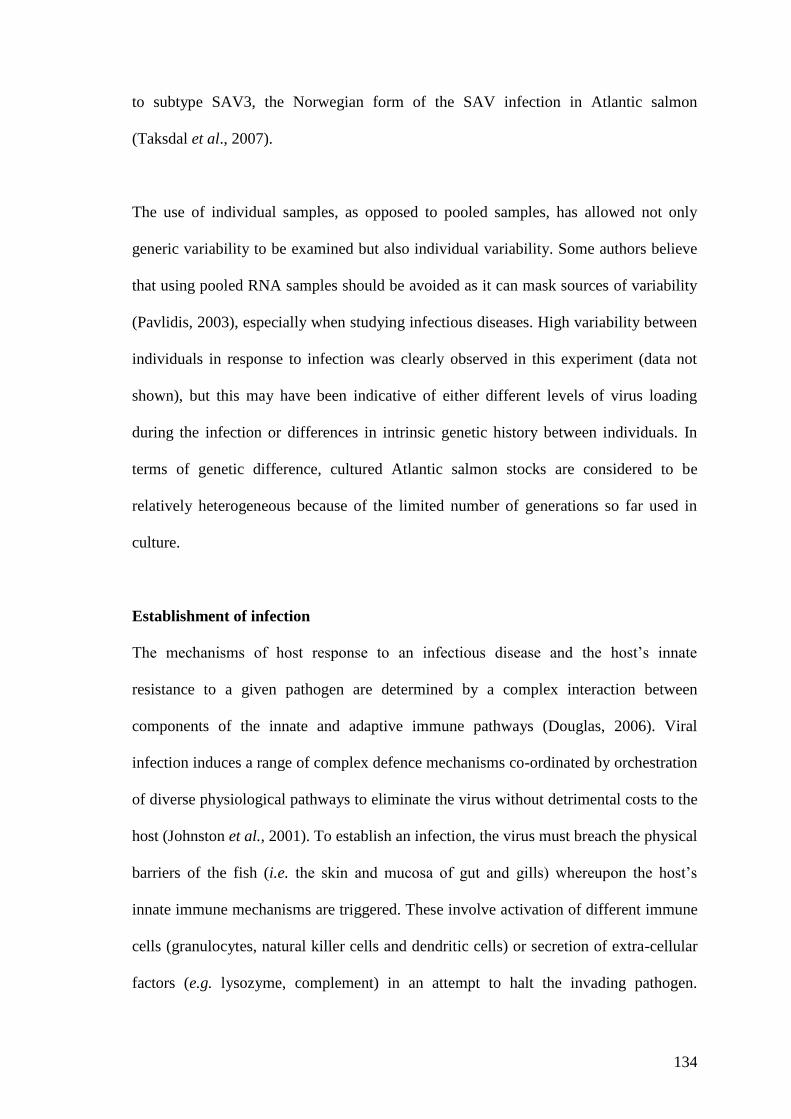
134
to subtype SAV3, the Norwegian form of the SAV infection in Atlantic salmon
(Taksdal et al., 2007).
The use of individual samples, as opposed to pooled samples, has allowed not only
generic variability to be examined but also individual variability. Some authors believe
that using pooled RNA samples should be avoided as it can mask sources of variability
(Pavlidis, 2003), especially when studying infectious diseases. High variability between
individuals in response to infection was clearly observed in this experiment (data not
shown), but this may have been indicative of either different levels of virus loading
during the infection or differences in intrinsic genetic history between individuals. In
terms of genetic difference, cultured Atlantic salmon stocks are considered to be
relatively heterogeneous because of the limited number of generations so far used in
culture.
Establishment of infection
The mechanisms of host response to an infectious disease and the host‟s innate
resistance to a given pathogen are determined by a complex interaction between
components of the innate and adaptive immune pathways (Douglas, 2006). Viral
infection induces a range of complex defence mechanisms co-ordinated by orchestration
of diverse physiological pathways to eliminate the virus without detrimental costs to the
host (Johnston et al., 2001). To establish an infection, the virus must breach the physical
barriers of the fish (i.e. the skin and mucosa of gut and gills) whereupon the host‟s
innate immune mechanisms are triggered. These involve activation of different immune
cells (granulocytes, natural killer cells and dendritic cells) or secretion of extra-cellular
factors (e.g. lysozyme, complement) in an attempt to halt the invading pathogen.
135
Alphaviruses are generally vector-borne pathogens, and mosquitoes, for example ,are
involved in breaching this barrier and introducing virus into the mammalian host
(Strauss & Strauss, 1994; Raymen & Klimstra, 2008). Aquatic alphaviruses, however,
appear to be able to cross the physical barrier without the interaction of a vector and are
therefore classified as atypical alphaviruses (Villoing et al., 2000a), and for this reason
it has been suggested that they be listed in a separate taxonomic group (Fringuelli et al.,
2008). Whilst no vector has yet been identified, increased sea lice (Lepeophtheirus
salmonis Krøyer) numbers have been described as a risk factor for spread and outbreaks
of SAV infections (Rodger & Mitchell, 2007; Petterson et al., 2009) but their role as
vectors has not yet been demonstrated (Petterson et al., 2009).
Enveloped viruses, such as alphaviruses, generally enter the cell using receptor-
mediated endocytosis (Helenius et al., 1988). Although the exact receptor used by the
alphavirus to enter the cell has not been identified (Linn et al., 2005) involvement of
cholesterol and lipid rafts, membrane fusion with endosomes, and formation of
replication complexes in association with intracellular membranes such as endoplasmic
reticulum and golgi complexes have been noted during viral entry (Strauss & Strauss,
1994; Wengler et al., 2003; Susuki & Susuki, 2006; Medigeshi et al., 2008; Ng et al.,
2008). Significant, differential expression of genes involved in cholesterol metabolism
was observed in the present study, and could possibly be involved in establishing viral
infection as seen in mammalian Alphavirus infection by facilitating virus entry (Ng et
al., 2008). The altered lipid metabolism could also be a result of virus infection itself, as
the virus shows tropism to the tissues with high levels of lipid metabolism such as the
pancreas and skeletal muscles (Ferguson, 2006).
136
Innate immune mechanism
Teleostean immune systems share similar functional mechanisms in eliminating
pathogens to those of higher vertebrates. (Plouffe et al., 2005). Many of the genes that
encode defence molecules in the genome of fish are closely similar to the particular
genes in mammals allowing fish to represent a principle evolutionary precursor of
innate and acquired immunity (Plouffe et al., 2005). The emphasis on identifying the
genes that are responsible for eliciting immune mechanisms in viral diseases in
salmonids has increased greatly during the last decade together with the application of
microarray technology to explore global gene expression during viral infections.
Innate immunity plays a crucial role in the early phase of defence against viral infection
and also triggers specific immune mechanisms to protect the host from the pathogen
(Barber, 2001). For viruses in general, host-cell contact is recognised by immune as
well as non-immune cells, through motifs that signal „danger‟ of the presence of a virus
i.e. pathogen-associated molecular patterns (PAMPs) (Raymen & Klimstra, 2008).
Primarily, PAMPs activate toll-like receptors (TLR) allowing the immune system to
recognise a specific pathogen or insult, and to raise a relevant response (Abbas et al.,
2000; Purcell et al., 2006). The KEGG pathway analysis used in this study highlighted
substantial, differential expression of genes related to activation of TLR 2 and 9, which
function to subsequently promote the activation of pro-inflammatory cytokines and
interferons (Purcell et al., 2006). Subsequent activation of TLR-related pathways such
as JAK/STAT, or mitogen activated protein kinase (MAPK) was also observed. TLR 9
is normally expressed on the endosomal membranes, and receptor-mediated endocytosis
and membrane fusion of SAV would probably have activated this receptor and hence
caused activation of the INF-I system also seen in this study. Up-regulation of
137
interferon-regulatory, interferon-induced and INF-α2 and INF-α2 associated genes was
observed. It is not surprising to see weak signals for INF-I, because only a few cells
would be stimulated to produce INF-I in the first instance by direct contact with the
virus, before paracrine signalling to other cells leads to the production of effector
molecules. Phosphorylation of tyrosine kinase 2 (TYK2) and JAK1, by activation of the
JAK/STAT pathway as observed here, transduces signals in the nucleus causing
expression of interferon-inducible genes and subsequently the production of proteins
that possess direct antiviral activity (Zhang et al., 2007).
Interferon can activate double-stranded RNA-activated protein kinase (PKR), which has
potent anti-viral and anti-proliferative activities. Up-regulation of Atlantic salmon
double-stranded RNA (dsRNA) activating Z-DNA binding protein was observed in the
present study, this being a recently characterised gene in salmon considered to be
orthologous to mammalian PKR (Bergan et al., 2008). Mammalian PKR is involved in
the initiation of several signalling pathways such as NF-kB, MAPK, STAT-1, p53,
INFRF-1 and apoptosis, however, the best characterised function of PKR is
phosphorylation of translation elongation factor 2α (eLF2α) (Bergan et al., 2008;
Raymen & Klimstra, 2008), which leads to inhibition in initiation of the host and viral
RNA translation and resulting shutdown of cellular protein synthesis (Raymen &
Klimstra, 2008). Down-regulation of eIF2α was observed at all sampling points,
possibly indicative of cellular protein synthesis shut-down occurring in conjunction
with up-regulation of Z-DNA binding protein. Activation of the NF-kB pathway was
indirectly related to the down-regulation of INF-kB alpha-inhibitor like protein, which
could possibly be a result of post-translational or post-transcriptional modification by
the virus and associated protein shut-off mechanisms (Barry et al., 2009; Frolov &
138
Schlesinger, 1999). However, this would have enhanced the translocation of NF-kB
complexes into the nucleus which in turn bind to specific DNA sequences called DNA
response elements (DNA-RE), forming DNA-RE\NF-kB complexes that can be
responsible for inducing downstream host defence mechanisms. NF-kB is involved in
switching on a diverse array of cellular mechanisms including acute phase response,
inflammation, and immune response and cell cycle changes involving disease
pathogenesis, and it has therefore been suggested that its activity could be used
therapeutically to minimize adverse effects caused by activation of a number of
different pathways (Lee & Burckart, 1998).
A considerable number of interferon-induced genes showed high-fold up-regulation in
infected fish such as ISG-15, Mx protein, viperin and ZFP. ISG-15, an ubiquitine ligase-
like protein that showed the highest fold change in this microarray and the qRT-PCR
study, may have been involved in proteasome triggering and protein degradation
(Rokenes et al., 2007) during the infection. Viperin is an interferon-induced
cytoplasmic protein, involved in destroying enveloped viruses by disrupting lipid raft
formation involved in virus budding (Waheed & Freed, 2007). ZFP is also involved in
virus destruction, particularly in alphavirus infections, and Mx protein is the most
commonly studied antiviral molecule in different salmonid viral disease conditions (Das
et al., 2009). Strong induction of INF-I has been observed in vitro in salmon head
kidney cells (SHK-1) and Atlantic salmon head kidney leukocytes (TO) cells infected
with SAV-1 (Gahlawat et al., 2009). Collectively, these results suggest that INF-I is a
key protein employed by Atlantic salmon to combat SAV-1 infections, similar to the
case for mammalian alphavirus infections (Zhang et al., 2007; Raymen & Klimstra,
2008; Barry et al., 2009). The induction of these pro-inflammatory cytokines produces a
139
state in the cellular system where cytokine mechanisms become destructive to the host
instead of protective. Such a situation can give rise to a systemic inflammatory response
(SIRS) in infected fish, a clinical phenomenon commonly encountered in the
pathogenesis of mammalian alphavirus infections, often responsible for causing
mortality (Raymen & Klimstra, 2008).
Adaptive immune response
The adaptive immune system is involved in antigen recognition and immune memory.
An active shift in adaptive immune-related signatures was demonstrated in infected fish
compared to control fish in this study.
In acquiring T-cell mediated immunity, antigen presentation is the prime pre-requisite
for T-cell activation followed by subsequent cell migration under the control of various
chemokines (Fischer et al., 2006). Up-regulation of genes associated with T-cell
activation like DAD and T-cell antigen receptors was detected as early as 3 d.p.i. in
infected fish, suggesting an early onset of specific immune responses to the viral
infection. Specific T-cell migration is enhanced by chemokines in virus infections, and
in this study CC-like chemokine, which is thought to be involved in the activation of
mononuclear cells i.e. lymphocytes and monocytes, was seen to be up regulated both by
microarray and qRT-PCR. The CXC ligand-10 (CXCL-10), also termed 10 kDa γ-
interferon (INF-γ)-induced protein, was up-regulated and was presumably involved in
chemo-attraction of monocytes, NK cells and dendritic cells as well as T-cell activation
(Schroder et al., 2004). Although the INF-γ gene was not seen amongst the significantly
expressed genes, this experiment has provided indirect evidence of its involvement in
the immune response in SAV1 infection, which has not been described before. The
140
chemokine CXC receptor, thought to be a chemotactic factor for neutrophils (Abbas et
al., 2000), appeared to be down-regulated in this experiment, possibly suggesting that
SAV1 could hamper the cellular inflammatory response during an infection.
Polymorphic MHC I and II are important factors in antigen processing and presenting
T-cells in terms of eliciting appropriate immune responses to infection (Jorgensen et al.,
2006). MHC class I-associated antigen presentation to CD8+ T-cells is involved in
destroying cells infected with intracellular pathogens such as viruses, while MHC class-
II associated antigen presentation to CD4+ cells is involved in activating macrophages to
destroy phagocytosed microbes e.g. bacteria (Abbas et al., 2000). Only one type of
classical MHC-I locus (Sasa UBE) has been identified in Atlantic salmon (Grimholt et
al., 2002; Kjoglum et al., 2006) and is involved in response to a range of different viral
diseases as well as in mediating disease resistance (Jorgenesen et al., 2007). Destruction
of virus-infected cells via MHC-I restricted, cell mediated cytotoxicity (CMC) occurs
through receptors and molecules on both effectors and target cells (Fischer et al., 2006),
and is potent in clearing virus from the host system. Up- regulation of T-cell receptors
and MHC-I molecules was noted in infected fish, suggesting active CMC, although the
elements of CD8+ response were not amongst the significantly differentiated genes.
B-cell responses are believed to be a key feature of the adaptive immune response for
clearing extracellular virus (Levin et al., 1991), and are reported to be activated around
14 d.p.i in fish. Seven immunoglobulin-associated genes and B-cell enhancing factors
were observed to be significantly expressed in infected fish, with up-regulation of B-cell
activity noted 3 d.p.i in virus-infected fish. Although little is known about the
transcriptional regulation of the humoral immune response in fish (Philstrom &
141
Bengten, 1996), SAV1 is associated with a strong neutralising antibody response,
detected in both experimental and natural infections around 10 -16 d.p.i. (Graham et al.,
2006a, 2007a). In this study, transcriptomic changes were observed in Ig-associated
genes comparatively early in the infection, although the functional significance of this
observation is not clear. The up-regulation of immunoglobulin and secreted antibody
seen could represent a dual function of immunoglobulin i.e. receptor function in blood
and body fluids (Philstrom & Bengten, 1996) and a systemic defence against a viraemia.
Although antibody responses are generally considered to occur later in the infection
process in cold-water fish, transcriptomic analysis of a range of different viral diseases
indicates apparent early activation of Ig signatures in infected fish (Cann, 2005;
Jorgensen et al., 2008). Such observations require further research in order to provide a
better understanding of the functional significance of the early activation of these
pathologies. The fold-changes of expression were not particularly high during this time
window of infection and it would therefore be interesting to evaluate the same
transcripts later in the infection process in order to help interpret the significance of this
early activation.
Virus induced proteins and viral clearance
During viral attack, a distinct transcriptional programme is activated in the host via
PAMP recognition systems, leading to activation of appropriate antiviral responses in
order to eliminate the pathogen from the system (Cann, 2005). A large number of genes
considered by other authors to act as antiviral proteins (Miller et al., 2007), but whose
identity and functional significance are largely unknown, were seen to be differentially
regulated in this study. Interestingly, 20 different VHSV-induced proteins were up-
regulated with high fold changes observed. The functional involvement is known for
142
few of these proteins such as Vig-1, which is involved in the synthesis of enzymatic co-
factors of the nitric oxide (NOX) pathway (Boudinot et al., 1999, 2001). Genes
associated with the NOX pathway (nitric oxide synthase interacting protein, NOD3
protein) were significantly up-regulated at 3 and 5 d.p.i. The induction of a large array
of virus-induced proteins indicates a key role for non-specific immune mechanisms in
clearing virus, suggesting such mechanisms could provide a key element for planning
mitigation strategies against the infection.
The ZFP and RFP proteins exhibit broad spectrum anti-viral activity against mammalian
alphavirus infection by blocking the translation of alphavirus nsP, thereby preventing
accumulation of genomic RNA in the cytoplasm (Bick et al., 2003). The apparent up-
regulation of ZFP in both microarray and qRT-PCR in infected fish compared to control
fish provides some evidence for similar antiviral mechanisms to those seen in mammals.
Up-regulation of BAF was also observed. An increase in this factor has been noted in
other salmon RNA virus transcriptomic studies such as those involving IHNV (Miller et
al., 2007) and ISAV (Jorgensen et al., 2008). One suggestion is that it is involved in
facilitating antiviral protein transcription against viruses within host DNA e.g.
retroviruses (Segura-Totten & Wilson, 2004). Down-regulation of cyclin-T protein, a
negative regulator of human immunodeficiency virus type 1 (HIV-1), was also observed
and is another indicator of the fact that a range of non-specific antiviral proteins is
involved in destroying RNA viruses in salmon. Thus, proteins with the ability to bind
diverse motifs can work as co-factors and restrict virus propagation, and were widely in
evidence in this study, although their exact anti-viral activity has yet to be established.
143
Cell death mechanisms
Apoptosis has been identified as the hallmark of cell death in mammalian alphavirus
infections, and is reported to be a major contributor to pathogenesis (Griffin &
Hardwick, 1998; Segura-Totten & Wilson, 2004). Disturbance in the balance between
pro-apoptotic and anti-apoptotic states through a persistent shift towards cell death
induced by apoptosis (Segura-Totten & Wilson, 2004; Taylor et al., 2008) can either act
as a defensive mechanism preventing viral spread to unaffected cells, or can be co-opted
by the virus to disseminate the infection. Apoptosis can be extrinsically activated in
virus-infected cells through the death receptor (CD95/FaS and TNFR1) complexed to
TNF (Barber, 2001), thereby activating caspase, the serine protease involved in down-
stream protein degradation. In the current study, an up-regulation of TNF-α1 and
caspase 7 was observed in infected fish throughout the experimental period, suggesting
active programmed cell death occurring in infected kidney tissue. In addition, a novel
Ras family member gene, annexine max4, was also up-regulated in infected fish, and
this gene is also believed to be involved in apoptosis. Genes responsible for DNA
damage were also up-regulated in infected fish, this being indicative of
endonucleosomal cleavage and DNA fragmentation in cells infected with virus.
Histopathological studies of both natural and experimentally induced SAV infections
have described evidence of apoptosis in pancreas and heart (Barber, 2001; Taksdal et
al., 2007), and this was also observed in the current study in H & E stained sections of
pancreas (see Figure 3.8.b). DNA fragmentation and loss of plasma membrane
symmetry in peripheral blood and head kidney cells were also observed after 5 d.p.i. in
SAV1 infected fish in another study carried out in IoA supporting the results of the
microarray study.
144
Expression of the anti-apoptotic B-cell lymphoma-associated gene 2 (BcL-2) was up-
regulated in both the microarray and qRT-PCR, suggesting the presence of host-
mechanisms to protect cells from apoptosis. It is not unusual to see simultaneous
expression of apoptotic inducers and inhibitors in multi-cellular organisms (Miller et al.,
2007; Taylor et al., 2008), since the host needs to closely control apoptosis to prevent
run-away tissue damage over-riding the benefits accruing from anti-viral activities.
In conclusion, this study has revealed significant, differential gene expression in
Atlantic salmon subjected to the earliest stages of SAV1 infection, involving a broad
range of immune pathways. Alphavirus-induced viral clearance by the host is believed
to be principally mediated via α and β –interferon, and specifically by virus neutralising
antibodies. A strong induction of a large repertoire of INF-I pathway associated genes
and early activation of MHC-I molecules were observed in this study, leading to the
conclusion that all three immune mechanisms; INF-I mediated non-specific clearance,
MHC-I associated viral clearance, possibly mediated via cell killing, and antibody-
mediated virus clearance, collectively play a role in viral clearance in SAV1 infection at
different stages in the progression of the disease.
145
Chapter 5
Ultrastructural Morphogenesis of Salmonid
Alphavirus 1
5.1 Introduction
Viruses are obligate, intracellular parasites that are able to alter the structural
components and the functional mechanisms of their host cells during infection and
propagation. RNA viruses, in particular, are able to undergo spontaneous mutations to
avoid the antiviral mechanisms of their hosts in order to maintain their viability. A
complex interaction exists between the virus and host, and the virus is able to recruit
various cellular organelles from its host to produce virus progeny (Cann, 2005; Novoa
et al., 2005). Generally, the morphology of the virus is important for classification and
actual identification of the viruses and ultrastructural examination of viral propagation
in host cells is often used to help in identifying the virus. This includes describing how
the virus particles are assembled and how cellular damage results from the infection
process (Faquet et al., 2005). Viruses undergo a series of events during the biogenesis
process in host cells. For enveloped viruses, this includes attachment and entry of the
virus into the host cell, un-coating, genome replication, maturation, and virion release.
Any of these steps can potentially be the target of antiviral drugs, and therefore
knowledge of the life cycle of a virus is fundamental for providing effective control
strategies (Pohjala et al., 2008; Qi et al., 2008), and this has become an important area
of modern medical research (Perera et al., 2008).
Alphavirus replication and morphogenesis has been studied intensively over the past 40
146
years using Sindbis virus and Semliki forest virus as virus models (Acheson & Tamm,
1967; Söderlund, 1973; Garoff et al., 1978; Helenius et al., 1980, 1988; Kim et al.,
2004) and more recently using Ross river virus and Chikengunya virus (Garoff et al.,
2004; de Lamballerie et al., 2009). Due to the simplicity of the genome structure,
alphaviruses have become a model for cell and molecular biology research. In addition,
they are widely used in „reverse genetics‟ as vectors for vaccine delivery, large scale
protein production, gene therapy, and protein expression for mammalian molecular
medicine (Schelesinger & Dubenskey, 1999; Lundstrom, 2009).
As +ssRNA viruses, with icosohedral symmetry, alphaviruses replicate in the cytoplasm
of their host cells (Strauss & Strauss, 1994; Kujala et al., 2001) by using various
cellular membranes for viral RNA synthesis. For the initiation of viral infection,
alphaviruses enter their host cell via receptor-mediated endocytosis, and subsequent
conformational changes occur as a result of the low pH in the endocytic vesicles
facilitating the release of the RNA genome into the cytosol (Waarts et al., 2002;
Vonderheit & Helenius, 2005). Morphologically, the formation of replication
complexes in alphavirus infection is characterised by the formation of membrane-bound
structures, and the virus is able to alter the cellular secretory pathways for the assembly
of the replication complexes (Grimley et al., 1968). During the formation of the
replication complexes, genomic RNA is dissociated from the nucleocapsid of the virus
and incorporated into ribosomes to initiate the translation of 5‟ encoded non-structural
poly-proteins (Singh & Helenius, 1992). This is regarded as the initial trigger for
alphavirus replication.
A schematic overview of alphavirus RNA replication is shown in Figure 5.1. The
147
positive-sense genomic RNA of the alphavirus acts directly as the messenger for
generation of viral encoded minus (-) strand RNA (-RNA) and structural and non-
structural proteins of the virus. The nsP are initially translated into a poly-protein
(P1234) and then cleaved into four nsP (nsP1-nsP4) (Figure 5.1) (Strauss & Strauss,
1994; Kujala et al., 2001) which in turn act as the catalysts for subsequent genomic and
sub-genomic RNA production (Figure 5.1). Of the four nsP proteins, nsP1 is believed to
be the initiation factor for -RNA synthesis, and coding of a methyltransferase, while
nsP2 is involved in generating a 26S subgenomic RNA (Peranen & Kaariainen, 1991).
The phosphoprotein nsP3, is also thought to be involved in RNA synthesis although the
exact function of the protein has not yet been characterised, and the nsP4 is considered
to be the elongation factor in the RNA polymerase complex. The full length -RNA
synthesized from the positive strand alphavirus RNA genome, is subsequently involved
in the transcription of new genomic RNA and sub-genomic RNA that encodes for the
structural protein (Strauss & Strauss, 1994).
The structural proteins of alphavirus are synthesised from the 26S sub-genomic RNA
derived from transcribing the 3‟ end of the genome that encodes structural protein as a
poly protein (C-p62-6K-E1). The serine protease activity of the C-protein cleaves itself
from the structural polyprotein and this is incorporated into the 42S subgenomic RNA
to form the nucleocapsid (Strauss & Strauss, 1994; Forsell et al., 2000; Kujala et al.,
2001). The remaining polyprotein p62-6K-E1 is then cleaved into membrane proteins
p62, 6K and E1 during the translocation through the endoplasmic reticulum of the cell
(Figure 5.1). The structural proteins of the virus are then processed and transported via
the secretory pathways of the host cell (Garoff et al., 1978, 1994). The 6K protein
facilitates the transportation of the spike complex consisting of polyprotein p62 and E1
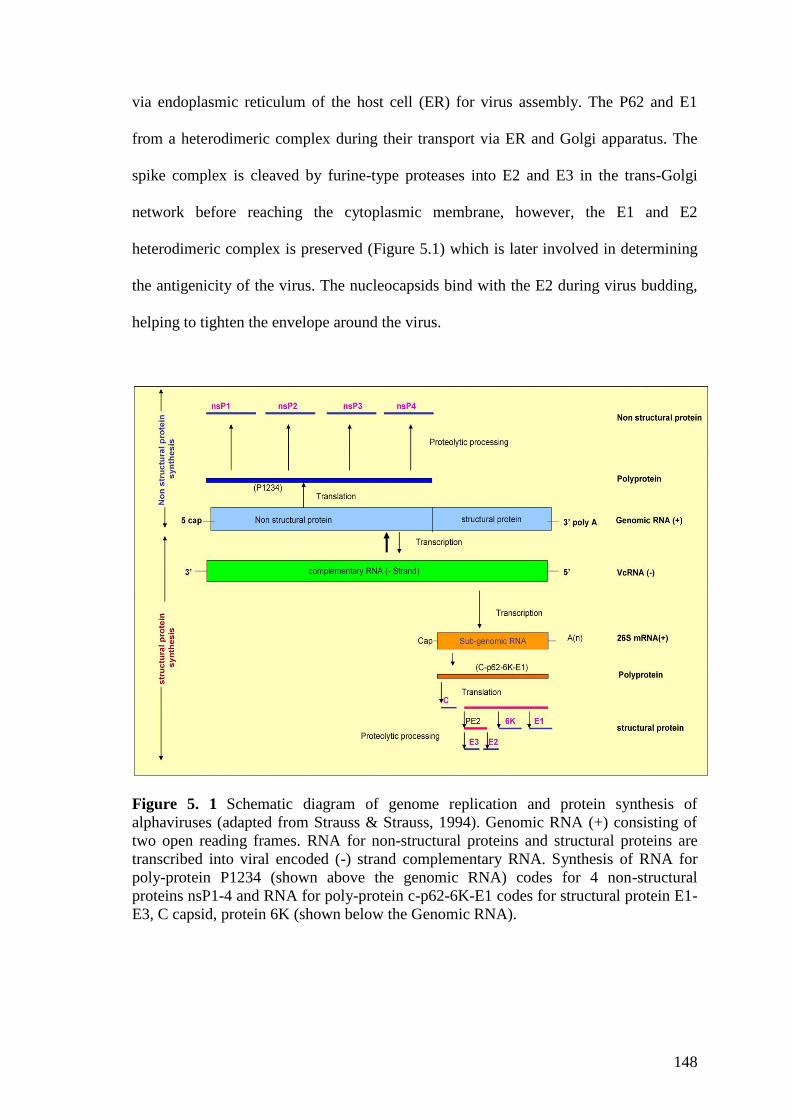
148
via endoplasmic reticulum of the host cell (ER) for virus assembly. The P62 and E1
from a heterodimeric complex during their transport via ER and Golgi apparatus. The
spike complex is cleaved by furine-type proteases into E2 and E3 in the trans-Golgi
network before reaching the cytoplasmic membrane, however, the E1 and E2
heterodimeric complex is preserved (Figure 5.1) which is later involved in determining
the antigenicity of the virus. The nucleocapsids bind with the E2 during virus budding,
helping to tighten the envelope around the virus.
Figure 5. 1 Schematic diagram of genome replication and protein synthesis of
alphaviruses (adapted from Strauss & Strauss, 1994). Genomic RNA (+) consisting of
two open reading frames. RNA for non-structural proteins and structural proteins are
transcribed into viral encoded (-) strand complementary RNA. Synthesis of RNA for
poly-protein P1234 (shown above the genomic RNA) codes for 4 non-structural
proteins nsP1-4 and RNA for poly-protein c-p62-6K-E1 codes for structural protein E1-
E3, C capsid, protein 6K (shown below the Genomic RNA).
149
Salmonid alphaviruses are distinctly different from mammalian alphaviruses and cluster
into a separate group in genotyping, due to the low homogeneity of their genetic
makeup compared to mammalian alphaviruses (Powers et al., 2001; Weston et al.,
2002; Hodneland & Endresen, 2006). The other main biochemical differences of SAV
compared to higher vertebrate alphaviruses is the presence of larger structural and non-
structural proteins, un-glycosylated E3 protein and a shorter non-transcribing 5‟-3‟
region in the genetic codon of the genome. Six closely related SAV subtypes have been
sequenced from salmonids (Fringuelli et al., 2008; Karlsen et al., 2009). These
differences, together with their vector-independent transmission, have led to the
suggestion that SAV should be classified in a separate taxonomic group (McLoughlin &
Graham, 2007; Andersen et al., 2007; Petterson et al., 2009). To date, there has been
little information available on the mode of entry of the virus into their host cell, receptor
type used or information on the actual biogenesis process of SAV, which would assist in
classifying and understanding the molecular mechanisms in the viral pathogenesis
process. As with mammalian alphaviruses, SAVs are also thought to replicate in the
cytoplasm of their host cells (McLoughlin & Graham, 2007) although no sub-cellular
location or the organelles involved in the process have been characterised. Budding of
SAV from the plasma membrane has been seen in-vitro from established cell cultures
(McLoughlin & Graham, 2007) and viral particles with morphology similar to
alphavirus have been seen in transmission electron microscopy (TEM) in negatively
stained cell pellets (Nelson et al., 1995). Furthermore, an increase in the density of the
rough ER and extremely enlarged structures resembling mitochondria had been seen in
exocrine pancreatic cells of PD-infected farmed salmon (McVicar, 1987). In contrast to
mammalian alphavirus, morphogenesis of SAV in-situ has not yet been studied in
detail. Therefore, the present study was conducted to elucidate the replication pathway
150
of SAV in CHSE-214 cells, and to provide information on SAV biogenesis to aid in the
understanding of the cellular pathogenesis which occurs during SAV infections.
5.2 Materials and methods
5. 2. 1 Culture of the virus
The virus was cultured in CHSE-214 cells for this study. Cell culture and propagation
was carried out as described in Chapter 2.2.1 using SAV-1, isolate F93-125. Virus was
taken from -70oC stocks and passaged 4 times on CHSE-214 cells for 7 days in each
passage. A 1:10 dilution of the supernatant was absorbed onto cell monolayers which
had been prepared the day before and cultured overnight at 20oC in 1% CO2. A 5ml
aliquot of the virus supernatant from the final passage was frozen at -20oC for back
titration on CHSE-214 cells to estimate the TCID50 as described in Chapter 2.2.3. All
the passages were carried out in 25 ml Nunc tissue culture flasks except the last passage
(P11) which was performed in 5 x 75ml Nunc tissue culture flasks.
5. 2. 2 Growth curve
A growth curve was performed to determine viral growth and release from the CHSE-
214 cells. For this, 25 ml Nunc tissue culture flasks (n=32) were prepared as above by
adding 1.2 x 10⁶cells/flask. The cell number was determined using Trypan blue
exclusion. In brief, 7 day old CHSE-214 cells grown in 75 ml flasks (n=3) were washed
x2 with DPBS and trypsinised with 1% Trypsin+EDTA. The excess trypsin was
decanted after 5-7 min and cells were detached from the bottom of the flask by tapping
the flask and 9 ml of GM was added into each flask to make a homogenous cell
suspension. The cell suspension was gently but thoroughly mixed before transferring
151
0.3 ml into a Bijoux bottle and mixing with 0.3 ml of 0.5% Trypan blue (Sigma
Aldrich). The number of cells in the suspension was determined using a Neubauer
haemocytometer.
Cells were cultured overnight before absorbing them with stock SAV-1 virus isolate
F93-125. To obtain at a multiplicity of infection (MOI) of virus, a one flask of
overnight grown cells were trypsinised and the cell number was estimated by trypan
blue exclusion method. Then the amount of virus determined by estimating TCDI50 was
adjusted to obtain MOI=1, which represent the ratio of cell to infectious virus particles.
At the same time control cells were absorbed with HBSS supplemented with 2 % FCS,
and both sets of cells were incubated at 4oC for 1 h at 15
oC in1 % CO2. Flasks were then
supplemented with 5 ml GM. Three virus-infected flasks and one control flask were
harvested at 1, 3, 5, 7, 9, 12, 14 and 21 days post-inoculation (d.p.in). Cell culture
supernatant (3 ml) was carefully removed from each flask into sterile centrifuge tubes.
A cell scraper was used to remove the cells that remained attached to the bottom of the
flasks and this was freeze-thawed once at -70oC for 20 min. All supernatants were then
centrifuged at 1000 x g for 10 min and the cell-free supernatants were back-titrated
individually on 96 Nunc tissue culture plates to obtain the extra-cellular and total virus
titre respectively (see Chapter 2.2.3). The cell associated virus titre was extrapolated by
subtracting the virus titre of the supernatant alone from the virus titre of the freeze-
thawed cell suspension.
5. 2. 3 Transmission electron microscopy
Stock SAV1 isolate F93-125, was absorbed onto preformed CHSE-214 cell monolayers
at a MOI of 1, as described above (see Chapter 5.2.2). Samples were collected at 1, 4, 8,
152
24 and 48 hours post-inoculation (h.p.in.).Two virus-infected and one control flask were
harvested into 2.5 ml of 2.5 % (v/v) gluteraldehyde in 100 mM sodium cacodylate
buffer (pH 7.2) using a cell scraper. The cell suspension was centrifuged at 1000 x g for
10 min and the cell pellet was then fixed in 2.5 ml of fresh 2.5 % gluteraldehyde for 4 h
in 4oC before rinsing overnight with 1 M sucrose buffer. For post fixation, the cell pellet
was placed in 1 % buffered Osmium and then dehydrated in an acetone series at 22oC
before embedding it in low viscosity resin. Ultra-thin sections of the pellet were
prepared and placed on 200 mesh Formvar-coated copper grids, which were first stained
with uranyl acetate followed by Reynold's lead citrate. The sections were observed
under an FEI Tecnai Spirit G2 Bio Twin Transverse electron microscope.
5. 2. 4 Negative staining of SAV-1 for electron microscopy
Four 75 ml flasks of CHSE-214 cells were cultured overnight before absorbing them
with a 1:10 dilution of SAV-1 isolate F93-125, for 1 h then incubating them at 15oC in
CO2 after supplementing with GM. In parallel, control cells were absorbed with HBSS
containing 2 % FCS. Virus was cultured until it produced a full CPE in the cells for 9
d.p.in. Virus supernatant was harvested from the flasks and centrifuged at 1000 x g for
10 min. The supernatant was further clarified at 12,000 x g for 13 min in a SW 28 Rotor
Beckman L-80 ultra-centrifuge. The final clarification was carried out at 100,000 x g for
1 h and 35 min. For the ultra-centrifugation 13.5 ml Ultra-Clear tubes (Beckman,
High Wycombe, UK) were used. The supernatant from the ultra-centrifuge was
decanted and the excess fluid removed by inverting the tubes for 2 min. The pellet was
re-suspended in 100 µl of sterile PBS and incubated for 30 min to allow the pellet to
disperse.A drop of virus suspension was then loaded onto a 3 mm Formvar Carbon film
200 mesh copper grids and allowed to absorb for 2 min. The excess fluid was removed
153
from the grid, before staining the grids with methylamine tungstate for 2 min. The grids
were dried for 5 min after blotting off the excess stain. The specimen was observed
under a FEI Tecnai Spirit G2 Bio Twin TEM for the presence of virus particles.
5.3 Results
5. 3. 1 Growth curve
The highest total viral titre (ie. Extra-cellular virus and cell associated virus) was
obtained from the sample harvested at 7 d.p.in (TCID50 1x106.9
/ml), and it then started
to decline from 7 d.p.in until the last sampling point at 21 d.p.in. The titre of cell-
associated virus was higher than virus in the supernatant at 1, 3 and 5 d.p.in. The
maximum cell-associated titre was noted at 3 d.p.in and then declined from 5 d.p.in
onwards (Figure 5.2). The viral content of the supernatant steadily increased until 7
d.p.in and then decreased by 10 fold at 9 d.p.i at which point a full CPE was noted. The
titre of the virus then remained relatively constant over the remainder of the
experimental period (Figure 5.2).
5. 3. 2 Transmission electron microscopy
The early endosomes (EE) were randomly dispersed in the cytoplasm and varied
greatly in size from small to large vesicles (Figure 5.3.a & b). The vesicles became
enlarged and hollow around 8 h.p.in. appearing more amorphous and multiple vesicular
inclusions with a few intact-looking virus particles (Figure 5.3.c).They resembled late
endosomes (LE) and these also varied in size. Both EE and LE were simultaneously
encountered around 8 h.p.in (Figure 5.3.c) and the EE were more electron dense and
amorphous compared to LE (Figure 5.4.a,b).
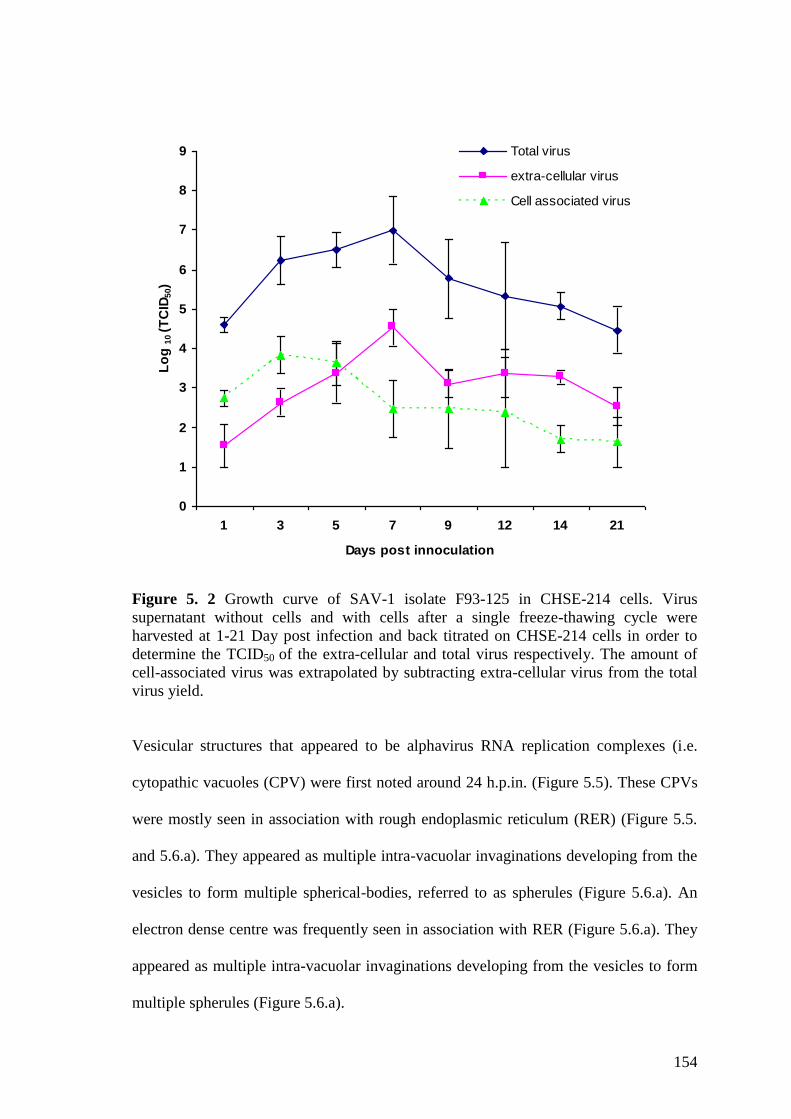
154
Figure 5. 2 Growth curve of SAV-1 isolate F93-125 in CHSE-214 cells. Virus
supernatant without cells and with cells after a single freeze-thawing cycle were
harvested at 1-21 Day post infection and back titrated on CHSE-214 cells in order to
determine the TCID50 of the extra-cellular and total virus respectively. The amount of
cell-associated virus was extrapolated by subtracting extra-cellular virus from the total
virus yield.
Vesicular structures that appeared to be alphavirus RNA replication complexes (i.e.
cytopathic vacuoles (CPV) were first noted around 24 h.p.in. (Figure 5.5). These CPVs
were mostly seen in association with rough endoplasmic reticulum (RER) (Figure 5.5.
and 5.6.a). They appeared as multiple intra-vacuolar invaginations developing from the
vesicles to form multiple spherical-bodies, referred to as spherules (Figure 5.6.a). An
electron dense centre was frequently seen in association with RER (Figure 5.6.a). They
appeared as multiple intra-vacuolar invaginations developing from the vesicles to form
multiple spherules (Figure 5.6.a).
0
1
2
3
4
5
6
7
8
9
1 3 5 7 9 12 14 21
Days post innoculation
Lo
g 1
0 (T
CID
50)
Total virus
extra-cellular virus
Cell associated virus
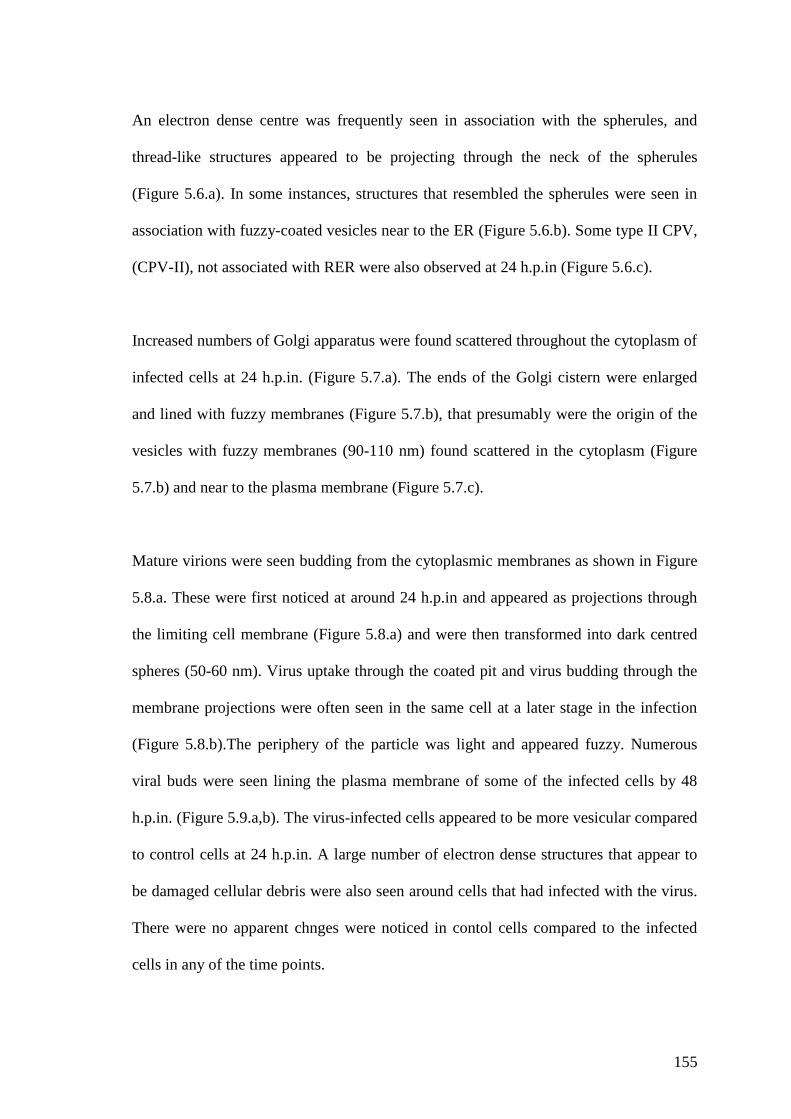
155
An electron dense centre was frequently seen in association with the spherules, and
thread-like structures appeared to be projecting through the neck of the spherules
(Figure 5.6.a). In some instances, structures that resembled the spherules were seen in
association with fuzzy-coated vesicles near to the ER (Figure 5.6.b). Some type II CPV,
(CPV-II), not associated with RER were also observed at 24 h.p.in (Figure 5.6.c).
Increased numbers of Golgi apparatus were found scattered throughout the cytoplasm of
infected cells at 24 h.p.in. (Figure 5.7.a). The ends of the Golgi cistern were enlarged
and lined with fuzzy membranes (Figure 5.7.b), that presumably were the origin of the
vesicles with fuzzy membranes (90-110 nm) found scattered in the cytoplasm (Figure
5.7.b) and near to the plasma membrane (Figure 5.7.c).
Mature virions were seen budding from the cytoplasmic membranes as shown in Figure
5.8.a. These were first noticed at around 24 h.p.in and appeared as projections through
the limiting cell membrane (Figure 5.8.a) and were then transformed into dark centred
spheres (50-60 nm). Virus uptake through the coated pit and virus budding through the
membrane projections were often seen in the same cell at a later stage in the infection
(Figure 5.8.b).The periphery of the particle was light and appeared fuzzy. Numerous
viral buds were seen lining the plasma membrane of some of the infected cells by 48
h.p.in. (Figure 5.9.a,b). The virus-infected cells appeared to be more vesicular compared
to control cells at 24 h.p.in. A large number of electron dense structures that appear to
be damaged cellular debris were also seen around cells that had infected with the virus.
There were no apparent chnges were noticed in contol cells compared to the infected
cells in any of the time points.
EE
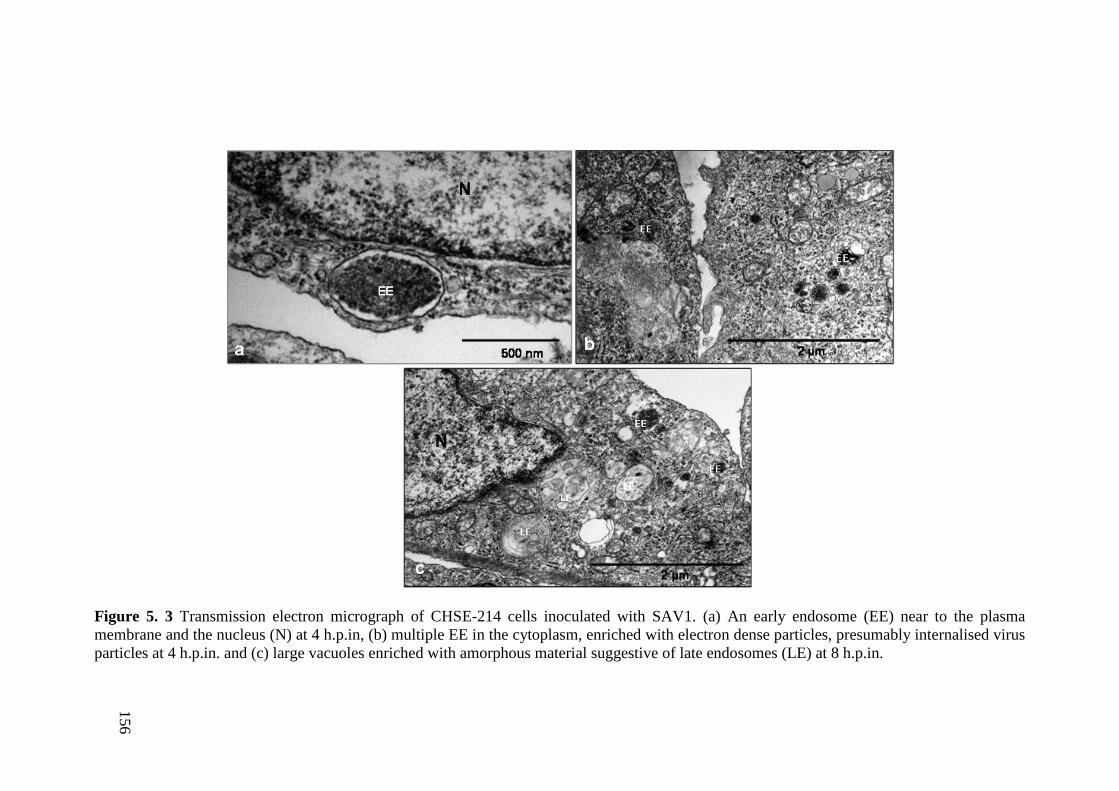
156
Figure 5. 3 Transmission electron micrograph of CHSE-214 cells inoculated with SAV1. (a) An early endosome (EE) near to the plasma
membrane and the nucleus (N) at 4 h.p.in, (b) multiple EE in the cytoplasm, enriched with electron dense particles, presumably internalised virus
particles at 4 h.p.in. and (c) large vacuoles enriched with amorphous material suggestive of late endosomes (LE) at 8 h.p.in.
156
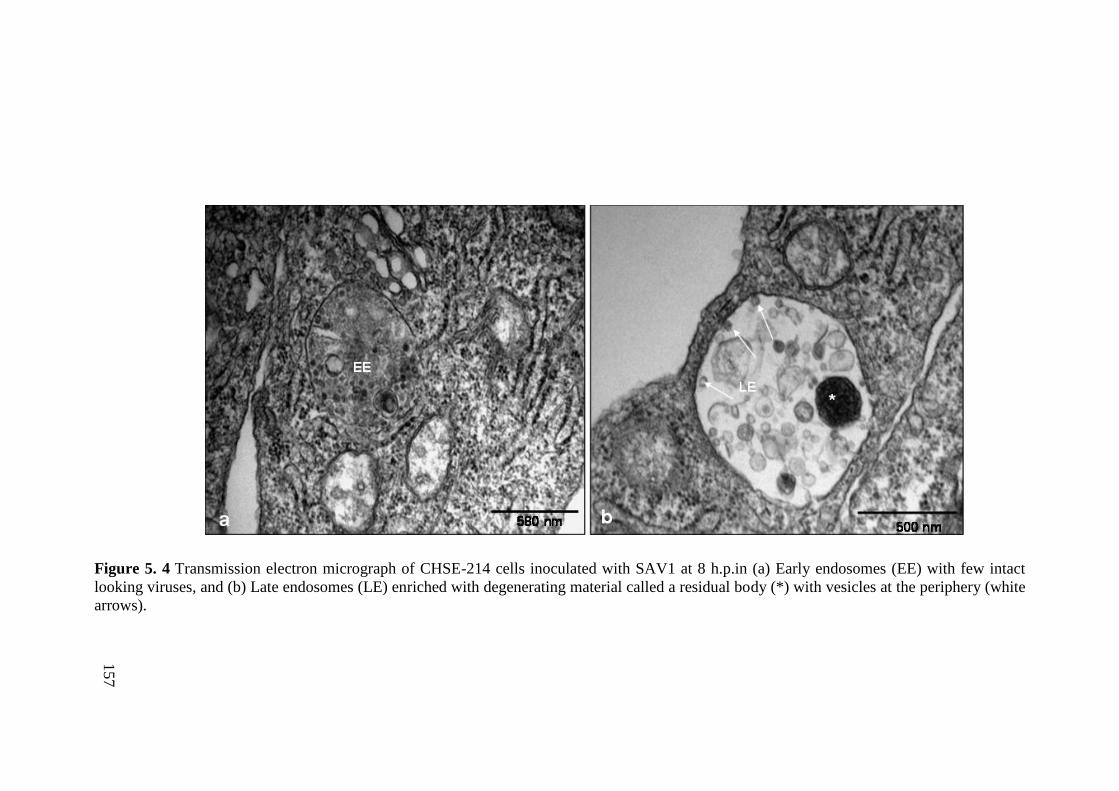
157
Figure 5. 4 Transmission electron micrograph of CHSE-214 cells inoculated with SAV1 at 8 h.p.in (a) Early endosomes (EE) with few intact
looking viruses, and (b) Late endosomes (LE) enriched with degenerating material called a residual body (*) with vesicles at the periphery (white
arrows).
157
158
Figure 5. 5 Ultra-structure of membrane associated replication complexes of SAV1 in CHSE-214 cells at 24 h.p.in (a) a typical alphavirus
replication complex with cytopathic vacuoles (CPV) in association with rough endoplasmic reticulum (RER).
158
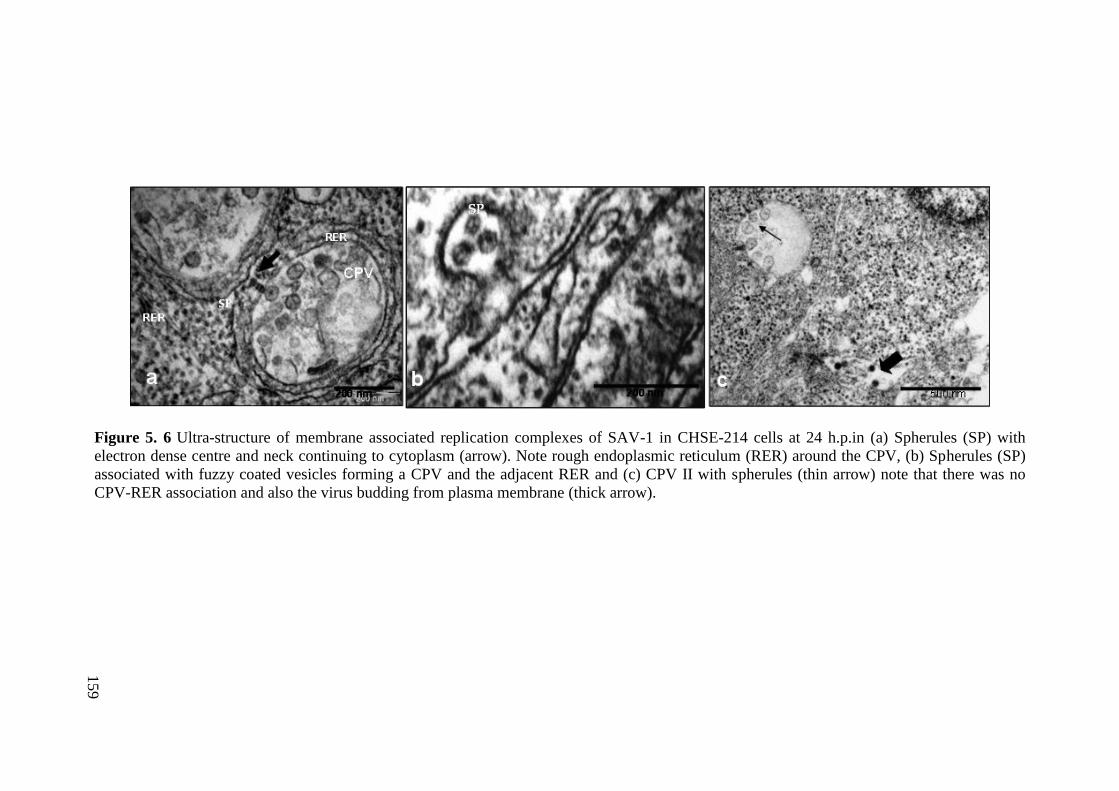
159
Figure 5. 6 Ultra-structure of membrane associated replication complexes of SAV-1 in CHSE-214 cells at 24 h.p.in (a) Spherules (SP) with
electron dense centre and neck continuing to cytoplasm (arrow). Note rough endoplasmic reticulum (RER) around the CPV, (b) Spherules (SP)
associated with fuzzy coated vesicles forming a CPV and the adjacent RER and (c) CPV II with spherules (thin arrow) note that there was no
CPV-RER association and also the virus budding from plasma membrane (thick arrow).
159
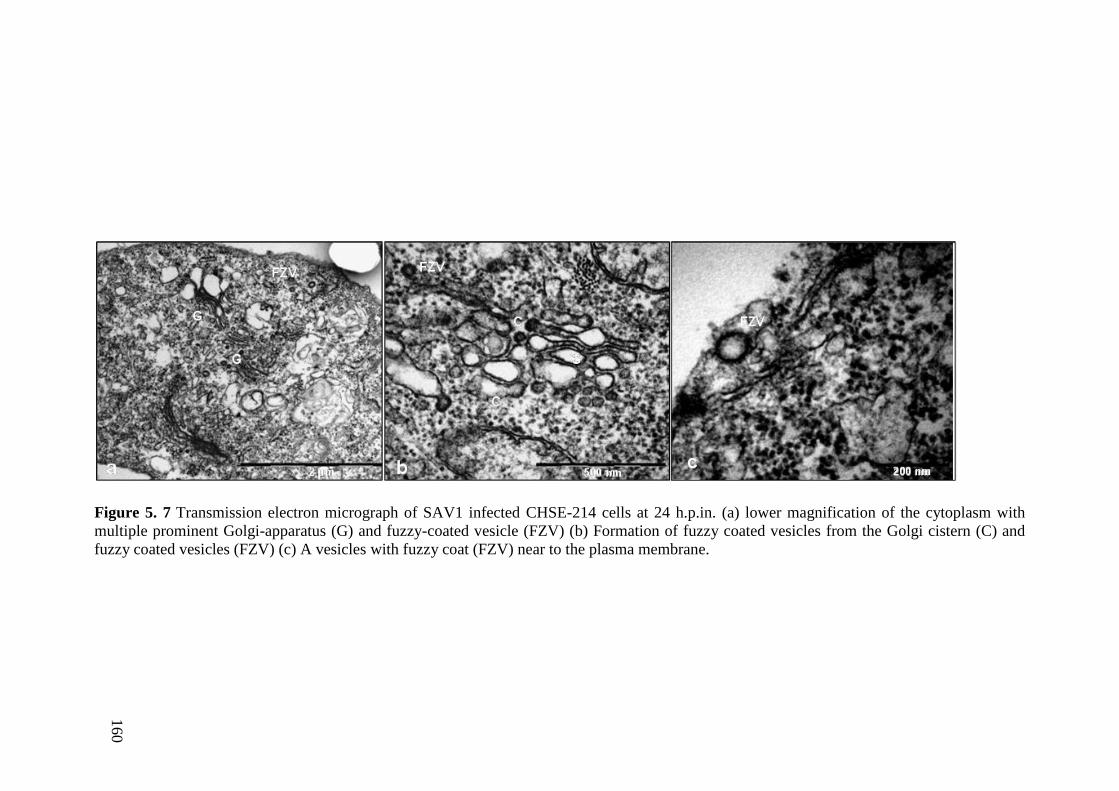
160
Figure 5. 7 Transmission electron micrograph of SAV1 infected CHSE-214 cells at 24 h.p.in. (a) lower magnification of the cytoplasm with
multiple prominent Golgi-apparatus (G) and fuzzy-coated vesicle (FZV) (b) Formation of fuzzy coated vesicles from the Golgi cistern (C) and
fuzzy coated vesicles (FZV) (c) A vesicles with fuzzy coat (FZV) near to the plasma membrane.
160
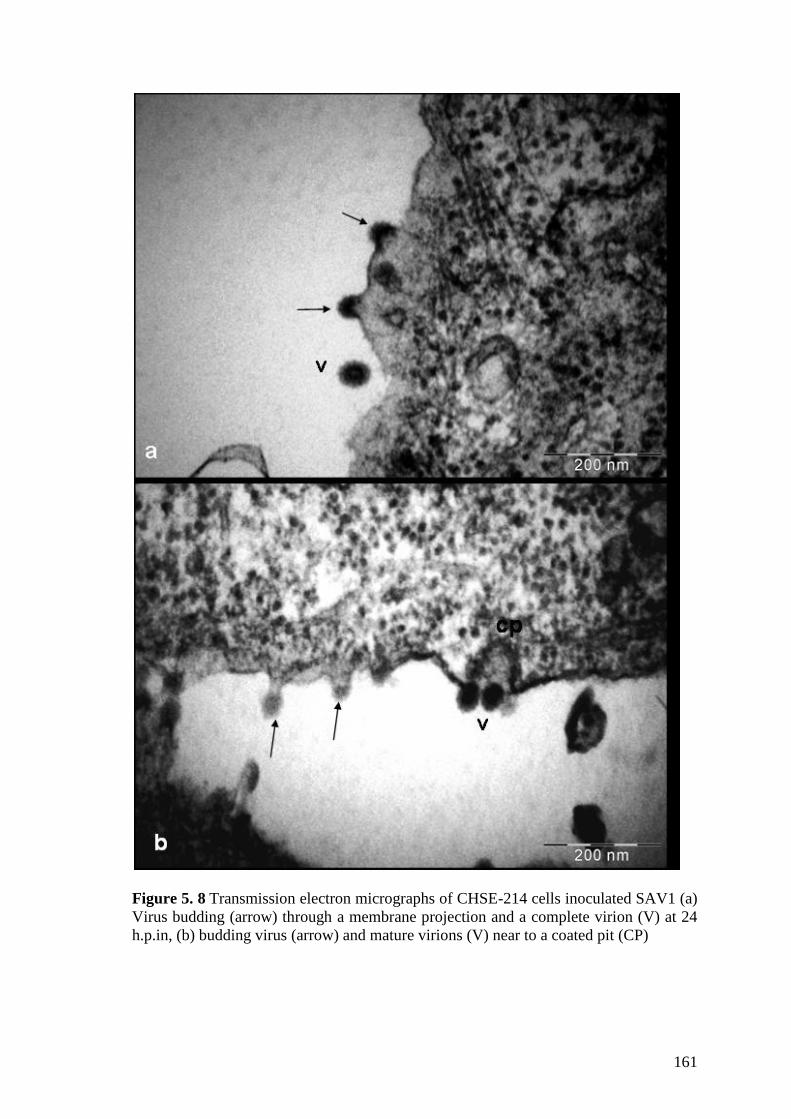
161
Figure 5. 8 Transmission electron micrographs of CHSE-214 cells inoculated SAV1 (a)
Virus budding (arrow) through a membrane projection and a complete virion (V) at 24
h.p.in, (b) budding virus (arrow) and mature virions (V) near to a coated pit (CP)
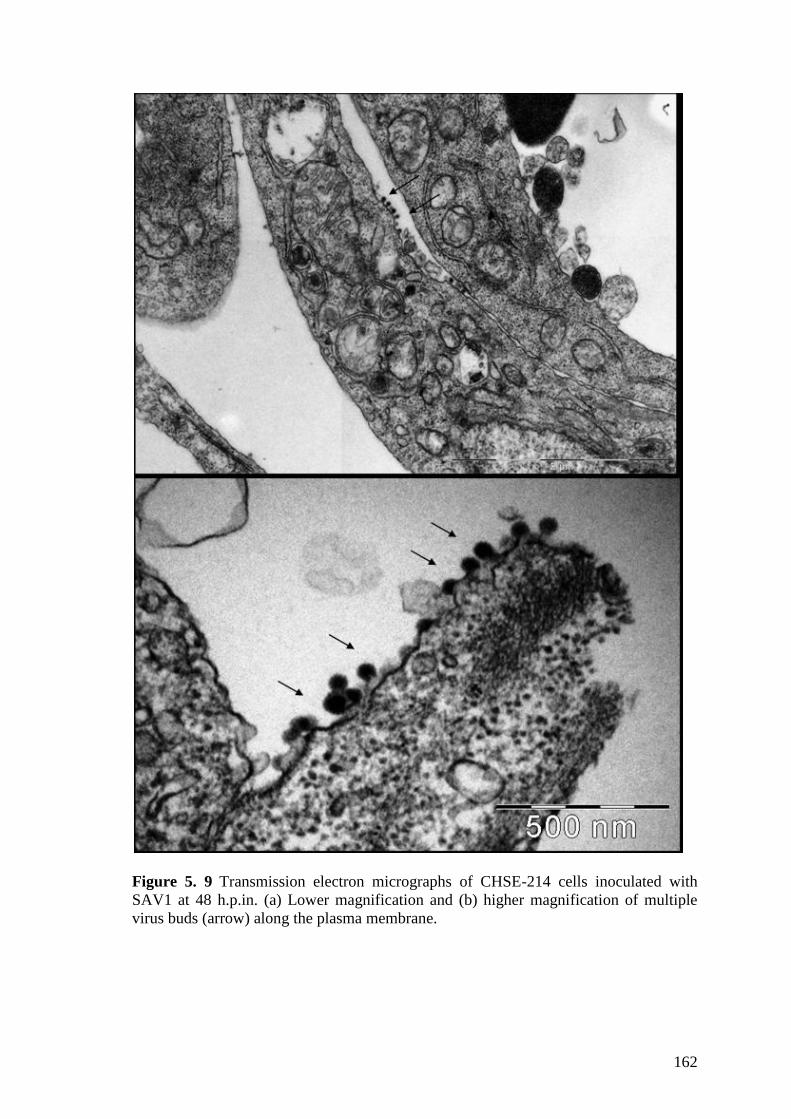
162
Figure 5. 9 Transmission electron micrographs of CHSE-214 cells inoculated with
SAV1 at 48 h.p.in. (a) Lower magnification and (b) higher magnification of multiple
virus buds (arrow) along the plasma membrane.
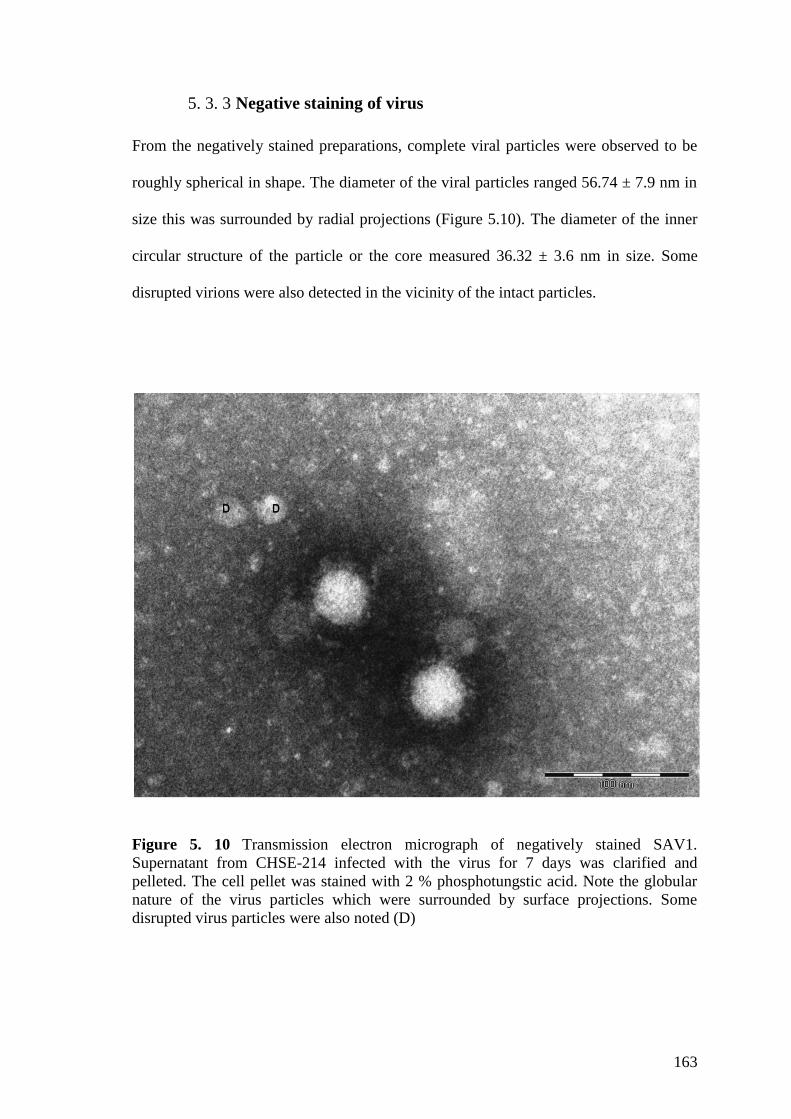
163
5. 3. 3 Negative staining of virus
From the negatively stained preparations, complete viral particles were observed to be
roughly spherical in shape. The diameter of the viral particles ranged 56.74 ± 7.9 nm in
size this was surrounded by radial projections (Figure 5.10). The diameter of the inner
circular structure of the particle or the core measured 36.32 ± 3.6 nm in size. Some
disrupted virions were also detected in the vicinity of the intact particles.
Figure 5. 10 Transmission electron micrograph of negatively stained SAV1.
Supernatant from CHSE-214 infected with the virus for 7 days was clarified and
pelleted. The cell pellet was stained with 2 % phosphotungstic acid. Note the globular
nature of the virus particles which were surrounded by surface projections. Some
disrupted virus particles were also noted (D)
164
5.4 Discussion
Studying the assembly of the virion morphologically is useful for the understanding of
host-virus interactions in detail and is particularly useful in establishing possible
therapeutic targets (Perera et al., 2008). The process of SAV1 biogenesis in cell-cultures
in-vitro was examined in this study. A growth curve was performed to examine the
SAV1 propagation in CHSE-214 cells to establish the best time points to sample in the
morphogenesis study. The highest cell associated virus level was detected at 3 d.p.in
and therefore sampling was carryout before 3 d.p.in. (1- 48 h.p.in) to obtain all stages
of SAV replication cycle. A low MOI was used in the study with the expectation of
infection propagation over an extended period of time. This also has restricted the
number of virus particles present to prevent over-infection of the cells and the build up
of defective infective particles. From the growth curve, the titre of the cell-associated
virus was seen to be decreased from 3 d.p.in, although the titre of total virus measured
increased indicating efficient release of virus into the cell supernatant. A full CPE in the
cell cultures was only observed from 9 d.p.in. onwards. Thereafter, virus production
would have been reduced or prevented due to the low number of viable cells that were
left in the cell culture. However, virus in the supernatant remained infectious even up to
21 d.p.in.
In order for the virus to establish an infection in the cells and for virus propagation, the
incoming infectious virus particles should be present in the cytosol. In general,
enveloped viruses are internalised using receptor-mediated endocytosis (Froshauer et
al., 1988a; Novoa et al., 2005) and this has also been demonstrated for alphaviruses
(Helenius et al., 1980, 1985, 1988; Ng et al., 2008). In this study, a few virus particles
were found outside or on the plasma membrane at 1 h.p.in. However, a large number of
165
internalised, intact-looking virus particles were observed within the membrane-bound
vacuoles, resembling EE at 1 h.p.in suggesting a rapid internalization of SAV which is
similar to the infections seen in the mammalian alphaviruses (Strauss & Strauss, 1994).
However, it was not possible to observe the initial processes used by the virus in the
present study. Internalization of alphavirus is described as a rapid receptor-mediated
endocytosis in mammalian alphavirus infections at high MOI levels (Morgan et al.,
1960; Acheson & Tamm, 1967; Helenius et al., 1980). The receptors used for
alphavirus cellular entry appeared to be host-specific rather than virus-specific due to
the diversity of the hosts, ranging from invertebrates to vertebrates (Strauss & Strauss,
1994; Ng et al., 2008). The use of cholesterol rich membranes in virus entry has been
specifically described for alphavirus infections (Kujala et al., 2001; Ng et al., 2008),
and the target tissues of SAV are also comprised of high lipid metabolizing tissues in
salmon (Ferguson, 2006), although, there is no information available on how SAV virus
enters the cell at the molecular level. Identification of an SAV-entry receptor would be a
landmark in SAV research as it would assist in the development of therapeutic and
control strategies, and further work in this area is required.
It is known that endosomes and lysosomes play a significant role in entry and un-
coating of many enveloped viruses (Helenius et al., 1985, 1988), including alphaviruses
(Magliano et al., 1998). At the initial endocytic event of virus entry, EE are generated,
and these are characterised by membrane bound intra-cytoplasmic structures enriched
with foreign material, such as the endocytosed viruses seen in this study. In general,
formation of the LE in alphavirus infection is a rapid process triggered by a lowering of
the pH in the EE (Helenius et al., 1988). Structures resembling LE appeared as early as
8 h.p.in in this study enriched with amorphous material characteristic of LE. Electron
166
dense amorphous residual bodies were seen inside the LE which could have possibly
resulted from the destruction of some of the engulfed viruses and extra-cellular material
due to lowering of the pH inside the EE (Magliano et al., 1998).
The altered cellular sites involved in viral biogenesis, often referred to as „virus
factories‟ can easily be seen in virus infected cells as they are enriched with viral
structural components or virus associated proteins during the virus replication process
(Novoa et al., 2005). Most of the +ssRNA virus genome replication takes place on intra-
cytoplasmic membranes of the host cell, and the virus is able to modify this membrane
in a manner unique to the particular group of viruses (Schwartz et al., 2004). The
replication process of alphavirus is mediated by virus and host endocyte membrane
fusion, and is facilitated by low pH and the presence of cholesterol and sphingolipid in
the host cell membrane (Waarts et al., 2002; Ng et al., 2008). The fusion of the virus-
host membrane is mediated by viral spike protein E1, which is re-arranged into a
homodimeric form from the heterodimeric E1-E2 complex (Waarts et al., 2002) within
the acidic compartment (Marsh et al., 1986). The structures that result from the
modification of the endosomal membrane in this process are called cytopathic vacuoles
(CPV), and are considered to be the alphavirus replication factories (Schwartz et al.,
2004; Novoa et al., 2005), as they are involved in virus-specific RNA replication
(Kujala et al., 2001). Two types of CPV have been described in association with
mammalian alphavirus infection (Grimley et al., 1968; Peranen & Kaariainen, 1991).
Type I CPV (CPV-I) appears early in the replication process (Grimley et al., 1968),
while type II CPV (CPV II) generally appears late in the virus biogenesis process. The
CPV-I is characterised by multiple membranous intra-vacuolar spherules that line the
periphery of the vacuoles connecting to the cytoplasm with a narrow membranous neck
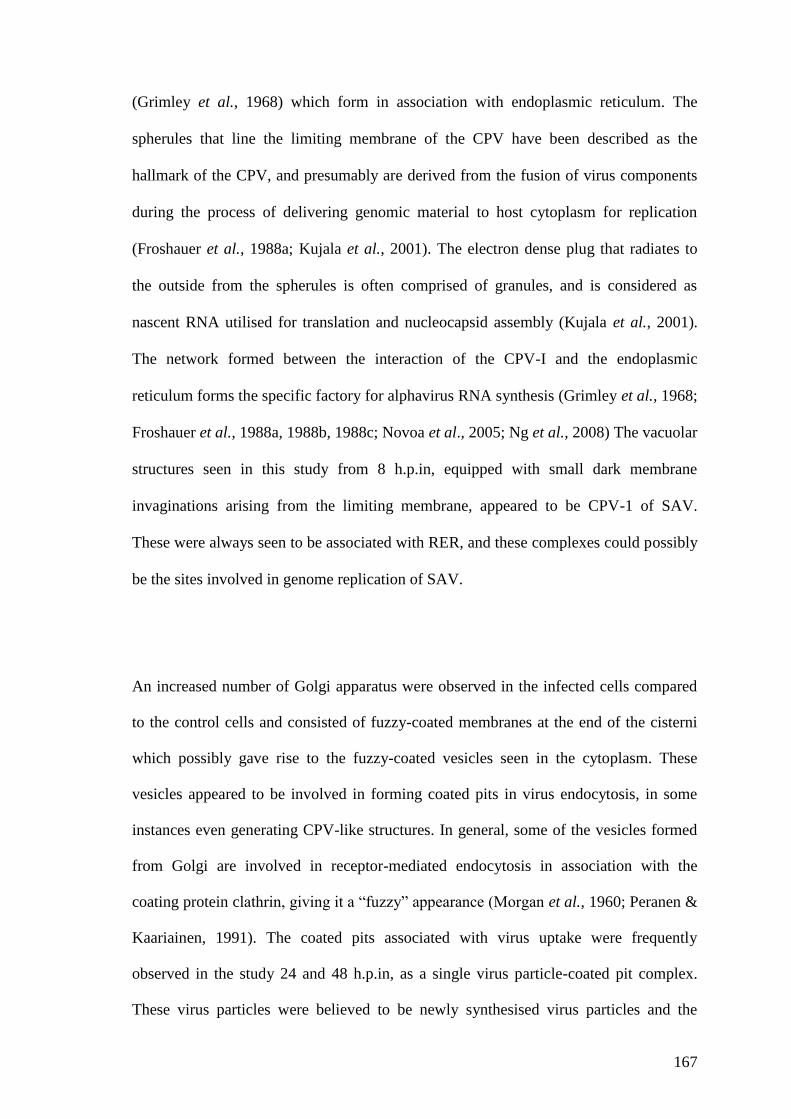
167
(Grimley et al., 1968) which form in association with endoplasmic reticulum. The
spherules that line the limiting membrane of the CPV have been described as the
hallmark of the CPV, and presumably are derived from the fusion of virus components
during the process of delivering genomic material to host cytoplasm for replication
(Froshauer et al., 1988a; Kujala et al., 2001). The electron dense plug that radiates to
the outside from the spherules is often comprised of granules, and is considered as
nascent RNA utilised for translation and nucleocapsid assembly (Kujala et al., 2001).
The network formed between the interaction of the CPV-I and the endoplasmic
reticulum forms the specific factory for alphavirus RNA synthesis (Grimley et al., 1968;
Froshauer et al., 1988a, 1988b, 1988c; Novoa et al., 2005; Ng et al., 2008) The vacuolar
structures seen in this study from 8 h.p.in, equipped with small dark membrane
invaginations arising from the limiting membrane, appeared to be CPV-1 of SAV.
These were always seen to be associated with RER, and these complexes could possibly
be the sites involved in genome replication of SAV.
An increased number of Golgi apparatus were observed in the infected cells compared
to the control cells and consisted of fuzzy-coated membranes at the end of the cisterni
which possibly gave rise to the fuzzy-coated vesicles seen in the cytoplasm. These
vesicles appeared to be involved in forming coated pits in virus endocytosis, in some
instances even generating CPV-like structures. In general, some of the vesicles formed
from Golgi are involved in receptor-mediated endocytosis in association with the
coating protein clathrin, giving it a “fuzzy” appearance (Morgan et al., 1960; Peranen &
Kaariainen, 1991). The coated pits associated with virus uptake were frequently
observed in the study 24 and 48 h.p.in, as a single virus particle-coated pit complex.
These virus particles were believed to be newly synthesised virus particles and the
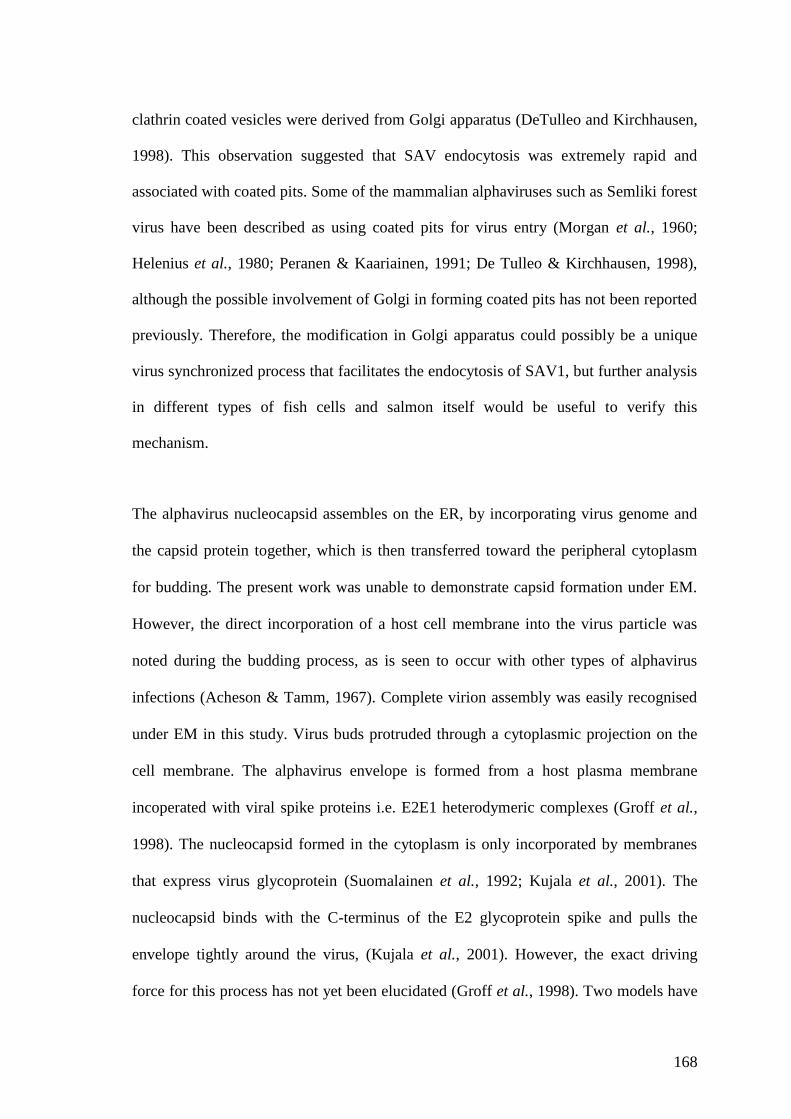
168
clathrin coated vesicles were derived from Golgi apparatus (DeTulleo and Kirchhausen,
1998). This observation suggested that SAV endocytosis was extremely rapid and
associated with coated pits. Some of the mammalian alphaviruses such as Semliki forest
virus have been described as using coated pits for virus entry (Morgan et al., 1960;
Helenius et al., 1980; Peranen & Kaariainen, 1991; De Tulleo & Kirchhausen, 1998),
although the possible involvement of Golgi in forming coated pits has not been reported
previously. Therefore, the modification in Golgi apparatus could possibly be a unique
virus synchronized process that facilitates the endocytosis of SAV1, but further analysis
in different types of fish cells and salmon itself would be useful to verify this
mechanism.
The alphavirus nucleocapsid assembles on the ER, by incorporating virus genome and
the capsid protein together, which is then transferred toward the peripheral cytoplasm
for budding. The present work was unable to demonstrate capsid formation under EM.
However, the direct incorporation of a host cell membrane into the virus particle was
noted during the budding process, as is seen to occur with other types of alphavirus
infections (Acheson & Tamm, 1967). Complete virion assembly was easily recognised
under EM in this study. Virus buds protruded through a cytoplasmic projection on the
cell membrane. The alphavirus envelope is formed from a host plasma membrane
incoperated with viral spike proteins i.e. E2E1 heterodymeric complexes (Groff et al.,
1998). The nucleocapsid formed in the cytoplasm is only incorporated by membranes
that express virus glycoprotein (Suomalainen et al., 1992; Kujala et al., 2001). The
nucleocapsid binds with the C-terminus of the E2 glycoprotein spike and pulls the
envelope tightly around the virus, (Kujala et al., 2001). However, the exact driving
force for this process has not yet been elucidated (Groff et al., 1998). Two models have
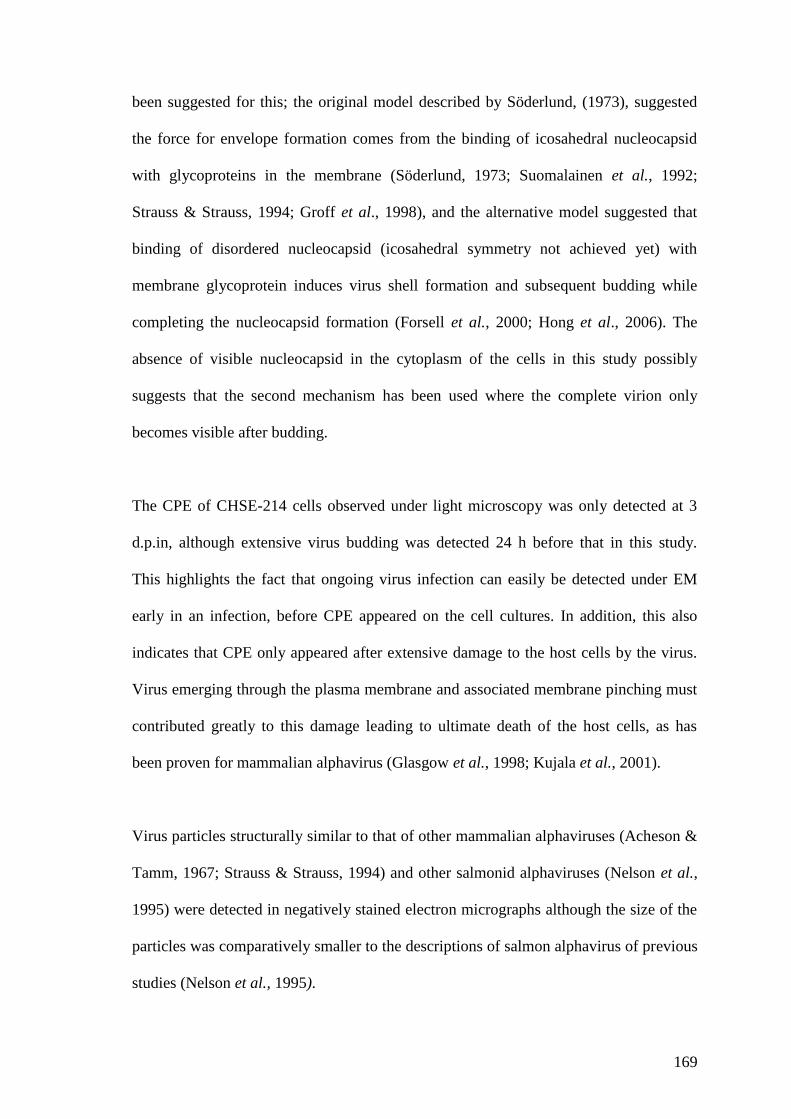
169
been suggested for this; the original model described by Söderlund, (1973), suggested
the force for envelope formation comes from the binding of icosahedral nucleocapsid
with glycoproteins in the membrane (Söderlund, 1973; Suomalainen et al., 1992;
Strauss & Strauss, 1994; Groff et al., 1998), and the alternative model suggested that
binding of disordered nucleocapsid (icosahedral symmetry not achieved yet) with
membrane glycoprotein induces virus shell formation and subsequent budding while
completing the nucleocapsid formation (Forsell et al., 2000; Hong et al., 2006). The
absence of visible nucleocapsid in the cytoplasm of the cells in this study possibly
suggests that the second mechanism has been used where the complete virion only
becomes visible after budding.
The CPE of CHSE-214 cells observed under light microscopy was only detected at 3
d.p.in, although extensive virus budding was detected 24 h before that in this study.
This highlights the fact that ongoing virus infection can easily be detected under EM
early in an infection, before CPE appeared on the cell cultures. In addition, this also
indicates that CPE only appeared after extensive damage to the host cells by the virus.
Virus emerging through the plasma membrane and associated membrane pinching must
contributed greatly to this damage leading to ultimate death of the host cells, as has
been proven for mammalian alphavirus (Glasgow et al., 1998; Kujala et al., 2001).
Virus particles structurally similar to that of other mammalian alphaviruses (Acheson &
Tamm, 1967; Strauss & Strauss, 1994) and other salmonid alphaviruses (Nelson et al.,
1995) were detected in negatively stained electron micrographs although the size of the
particles was comparatively smaller to the descriptions of salmon alphavirus of previous
studies (Nelson et al., 1995).
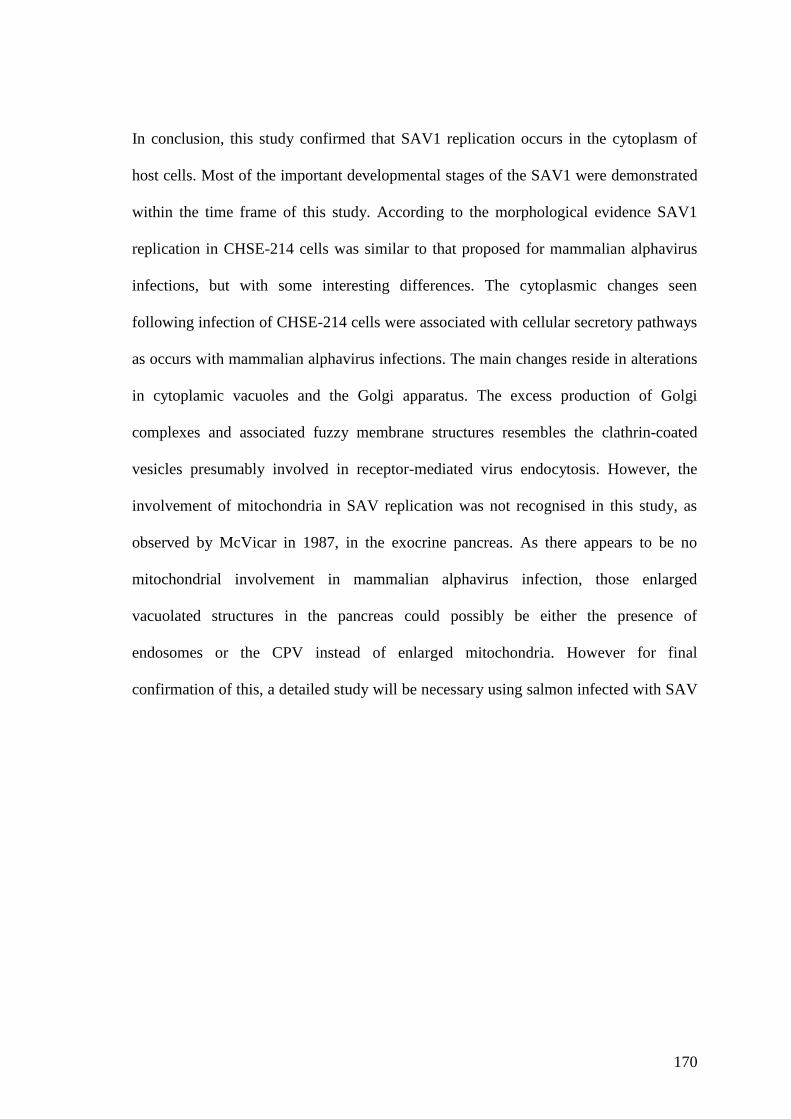
170
In conclusion, this study confirmed that SAV1 replication occurs in the cytoplasm of
host cells. Most of the important developmental stages of the SAV1 were demonstrated
within the time frame of this study. According to the morphological evidence SAV1
replication in CHSE-214 cells was similar to that proposed for mammalian alphavirus
infections, but with some interesting differences. The cytoplasmic changes seen
following infection of CHSE-214 cells were associated with cellular secretory pathways
as occurs with mammalian alphavirus infections. The main changes reside in alterations
in cytoplamic vacuoles and the Golgi apparatus. The excess production of Golgi
complexes and associated fuzzy membrane structures resembles the clathrin-coated
vesicles presumably involved in receptor-mediated virus endocytosis. However, the
involvement of mitochondria in SAV replication was not recognised in this study, as
observed by McVicar in 1987, in the exocrine pancreas. As there appears to be no
mitochondrial involvement in mammalian alphavirus infection, those enlarged
vacuolated structures in the pancreas could possibly be either the presence of
endosomes or the CPV instead of enlarged mitochondria. However for final
confirmation of this, a detailed study will be necessary using salmon infected with SAV
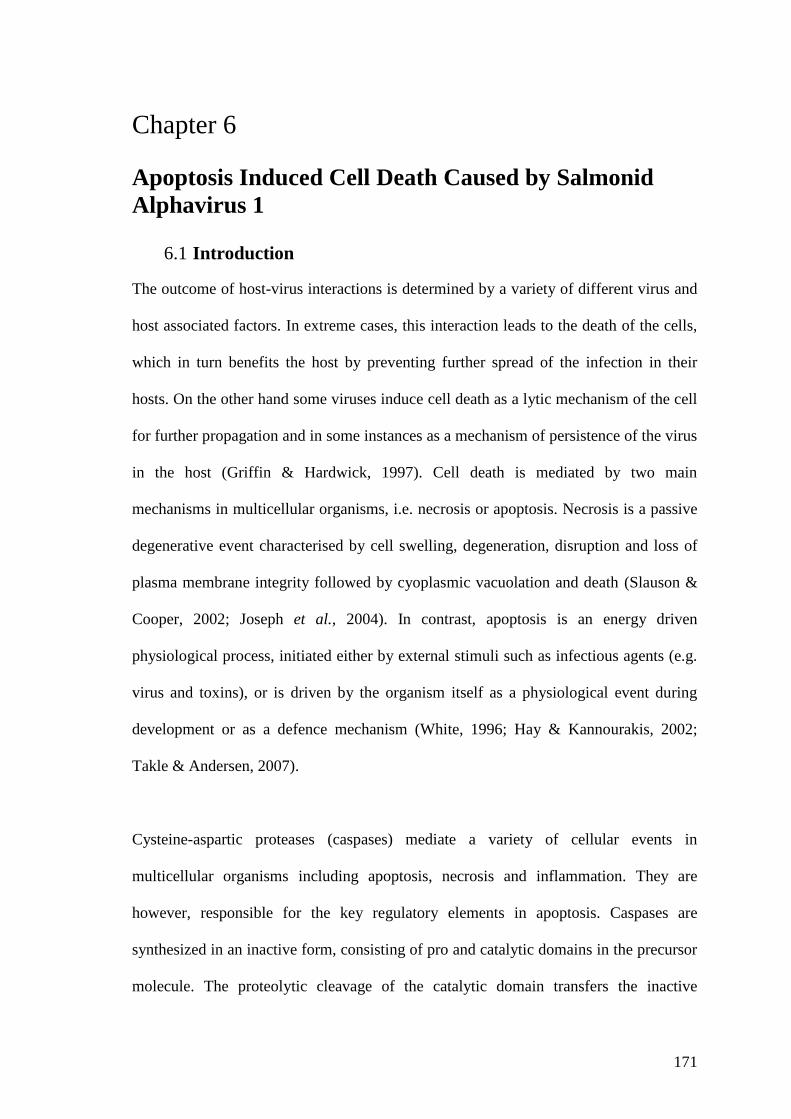
171
Chapter 6
Apoptosis Induced Cell Death Caused by Salmonid
Alphavirus 1
6.1 Introduction
The outcome of host-virus interactions is determined by a variety of different virus and
host associated factors. In extreme cases, this interaction leads to the death of the cells,
which in turn benefits the host by preventing further spread of the infection in their
hosts. On the other hand some viruses induce cell death as a lytic mechanism of the cell
for further propagation and in some instances as a mechanism of persistence of the virus
in the host (Griffin & Hardwick, 1997). Cell death is mediated by two main
mechanisms in multicellular organisms, i.e. necrosis or apoptosis. Necrosis is a passive
degenerative event characterised by cell swelling, degeneration, disruption and loss of
plasma membrane integrity followed by cyoplasmic vacuolation and death (Slauson &
Cooper, 2002; Joseph et al., 2004). In contrast, apoptosis is an energy driven
physiological process, initiated either by external stimuli such as infectious agents (e.g.
virus and toxins), or is driven by the organism itself as a physiological event during
development or as a defence mechanism (White, 1996; Hay & Kannourakis, 2002;
Takle & Andersen, 2007).
Cysteine-aspartic proteases (caspases) mediate a variety of cellular events in
multicellular organisms including apoptosis, necrosis and inflammation. They are
however, responsible for the key regulatory elements in apoptosis. Caspases are
synthesized in an inactive form, consisting of pro and catalytic domains in the precursor
molecule. The proteolytic cleavage of the catalytic domain transfers the inactive
172
proenzyme into an enzymatically-active heterotetrameric complex (Takle & Andersen,
2007). The members of the caspase family are subdivided into two groups; initiators
and effectors. The initiator caspases include caspase-2, -5, -8, -9, -11 and -12 and these
have long pro-catalytic domains, which are activated by autocatalytic cleavage in
response to apoptotic signals. The effector caspases, (caspase-3, -6 and -7) have shorter
pro-domains and need to be activated by an initiator caspase (Takle & Andersen, 2007).
Caspases-3, -6, -7 and -14 have been identified in Atlantic salmon and caspase-3 (-3a
and-3b) and caspase-6 (-6a and -6b) genes appear to be duplicated encoding two
paralogous genes (Takle et al., 2006; Takle & Andersen, 2007).
Apoptosis is mediated by either intrinsic or extrinsic pathways. In the extrinsic pathway,
it is initiated by binding of specific cytokine ligands such as Fas or TNF-related
apoptosis inducing ligands (TRAL) to a transmembrane death domain (DD). Binding of
death receptor and ligand recruit adaptor proteins (FADD) form the death inducing
signalling complex (DISC), which is responsible for activating caspase-8. In contrast,
the intrinsic pathway is activated by factors that cause DNA damage such as UV
irradiation, growth factor withdrawal, heat shock and chemotherapeutic drugs (Barber,
2001; Takle & Andersen, 2007). It causes depolarisation and release of cytochrome c
into the cytoplasm which can activate caspase-9 by binding to apoptotic protease
activating factor 1 (Apaf-1) (Figure 6.1). Caspase 3 is the central effector in
programmed death of the cell and can be activated by both extrinsic and intrinsic
pathways (Figure 6.1). The activation of initiator caspase (caspase- 8 or-9) involves the
cleaving of inactive pro-caspase 3 motifs from its inactive p17 and p12 domains to its
active form, caspase -3 through autocatalytic cleaving (Figure 6.1). The active caspase -
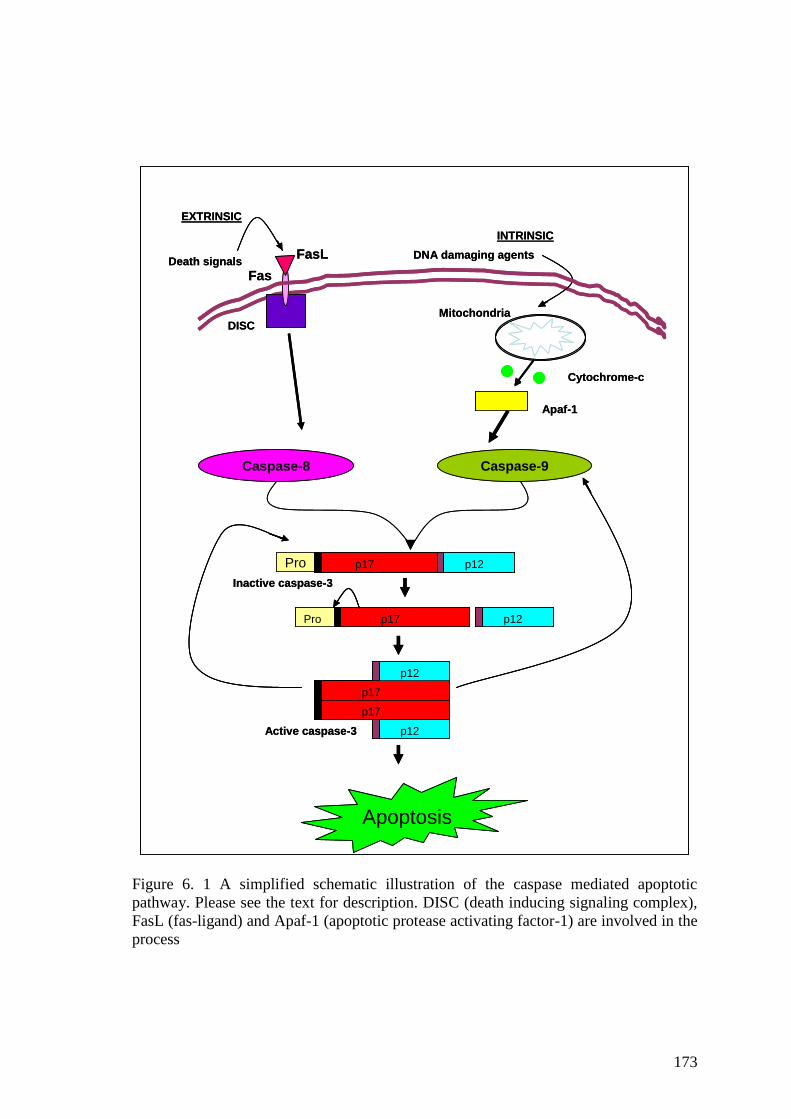
173
Figure 6. 1 A simplified schematic illustration of the caspase mediated apoptotic
pathway. Please see the text for description. DISC (death inducing signaling complex),
FasL (fas-ligand) and Apaf-1 (apoptotic protease activating factor-1) are involved in the
process
Caspase-8 Caspase-9
Pro p17 p12
p17
p17
p12
p12
Apoptosis
p17Pro p12
Inactive caspase-3
Active caspase-3
Death signals
EXTRINSIC
INTRINSIC
DISC
DNA damaging agents
Mitochondria
Cytochrome-c
Apaf-1
FasL
Fas
Caspase-8 Caspase-9
Pro p17 p12Pro p17 p12
p17
p17
p12
p12
p17p17
p17p17
p12p12
p12p12
Apoptosis
p17Pro p12p17p17Pro p12p12
Inactive caspase-3
Active caspase-3
Death signals
EXTRINSIC
INTRINSIC
DISC
DNA damaging agents
Mitochondria
Cytochrome-c
Apaf-1
FasL
Fas
174
3 is responsible for proteolysing a variety of different proteins and mediating the
subsequent events which occur during apoptosis. Cleavage of caspase-3 substrates
causes morphological changes in the affected cell including chromatin condensation,
nuclear fragmentation and membrane blebbings, which ultimately result in the
fragmentation of the cell into membrane bound particles referred to as apoptotic bodies.
The apoptotic bodies have the ability to confine the damaged cellular matter thus
preventing harmful effects to the neighbouring healthy cells, until they have been
cleared by phagocytosis. This also prevents provoking any inflammatory response in
damaged tissues in contrast to necrosis which induces a cellular inflammatory response
(Hay & Kannourakis, 2002).
Apoptosis can be identified by observing cellular morphological, biochemical and
molecular changes which occur in the cell. In routine histology, under light microscopy,
apoptotic cells can be observed as highly eosinophilic cytoplasmic masses with dense
nuclear fragments (Walker & Quirke, 2001).The main morphological changes of
apoptosis at an ultrastructural level include cell shrinkage, nuclear condensation, plasma
membrane blebbing and subsequent formation of membrane bound apoptotic bodies
(Griffin & Hardwick, 1997; Walker & Quirke, 2001; Slauson & Cooper, 2002).
Fluorescent antibody-based immunoassaying is also widely used to evaluate
biochemical changes during apoptosis. In addition, evaluation of DNA damage by
Terminal deoxynucleotidyl transferase end labelling (TUNEL) and agarose gel
electrophoresis is also used to confirm apoptosis related to cell death in response to a
pathogenic insult.
175
During viral infections, apoptosis sometimes acts as an antiviral mechanism driven by
the host to prevent viral spread by limiting the time and the cellular machinery available
for virus replication, (O'Brien, 1998; Barber, 2001). It is also regarded as an integral
part of the cellular innate immune response (Everette & McFadden, 1999). Nevertheless
viruses can also induce apoptosis as a lytic mechanism to disseminate from, or maintain,
persistent infection of the virus in the host cells (Hardwick, 2001). Understanding the
morphological, biochemical and molecular events of cell death during an infection helps
to identify the factors that initiate apoptosis. This in turn could help in developing
methods to combat viral infections. At present, little is known about the molecular
mechanisms that lead to cell death during SAV1 infection. However, in mammals,
alphavirus induced cell death is characterised by apoptosis and is believed to be the
means by which the virus is able to establish persistent infections in some of the
vertebrate hosts (Griffin & Hardwick, 1997, 1998; Griffin, 2005). With respect to SAV
in salmon, several sequential pathology studies have shown apoptosis in the pancreas
and the heart of SAV infected fish (Desvignes et al., 2002; McLoughlin & Graham,
2007; Taksdal et al., 2007). Apoptotic cells were also seen in the pancreas of
experimentally infected salmon with the H&E stain, under light microscopy, performed
earlier in chapter 3. However these observations do not confirm that apoptosis is the
sole means by which cell death occurs during an SAV infection. Studies in-vivo in
Atlantic salmon have demonstrated ongoing apoptosis during the early stages of
experimental infection of SAV1, however, characterization of apoptosis at a tissue level
is difficult (Costa et al., 2007). Therefore, in the present study mechanisms of SAV1-
associated cell death were confirmed by studying morphological changes under EM and
confocal microscopy and quantified by image analysis in two established salmonid cell
lines, CHH-1 and CHSE-214, infected with SAV1 in- vitro.
176
6.2 Materials and Methods
6. 2. 1 Preparation of stock virus
The SAV1 isolate F02-143 passage 5 (P5) and isolate p42P (P14) were kindly provided
by Dr. David Graham, Veterinary Sciences Division, Agri-food and Biosciences
Institute, Stormont, Belfast, UK and Dr. David Smail, Marine Scotland, Aberdeen
respectively. Virus stocks for the study were prepared by growing the two isolates in
CHH-1 cells seeded into 75cm2 Nunc tissue culture flasks for 7 days at 15
oC with 1.4 %
CO2, as described in Chapter 2.2.2. After freeze-thawing once and scraping the cells
from the flasks, cell supernatants were centrifuged at 3500 x g for 10 min in a chilled
5804R Beckman coulter centrifuge. Aliquots of the stock virus supernatants were frozen
at -20oC for further use and ten fold dilutions of the frozen tissue culture extracts were
back-titrated on CHH-1 cells prepared in 96 well plates to determine the TCID50 as
described in Chapter 2.2.4.
6. 2. 2 Infection of cells with virus
The CHH-1 and CHSE-214 cells were prepared either in 25cm2 Nunc flasks or on 13
mm glass cover slips (Fisher Scientific) placed in 24-well tissue culture plates. Cell
numbers were determined by using the Trypan blue®
exclusion method as described in
Chapter 5.2.2, before culturing the cells overnight to obtain a 70 % confluent
monolayer. The seeding densities used were similar for both cell lines, in which, 25cm2
tissue culture flasks were seeded with 1 x 10⁵ flask
-1 or 13 mm cover-slips in 24-well
plates were seeded with 1x10⁴cells well
-1. Stock virus diluted in HBSS supplemented
with 2 % FCS just before absorbing the virus for 1 h onto the overnight grown
177
monolayers (MOI<1). Control cells were absorbed with diluents for 1 h and both groups
of cells were re-supplemented with MM and maintained in 1.4 % carbon dioxide at
15oC.
6. 2. 3 Transmission electron microscopy
Two replicate cultures of virus infected cells and one of non-infected control CHH-1
and CHSE-214 cells, which had been grown in 25 cm2
flasks, were harvested at 1, 2 and
5 d.p.in. Cells were processed for TEM following the method described in Chapter
5.2.3. The sections were observed under an FEI Tecnai Spirit G2 Bio Twin Transverse
electron microscope for cytoplasmic and nuclear changes.
6. 2. 4 Scanning electron microscopy
Two replicates of infected and one of control CHSE-214 cells on cover slips, at 1 and 3
d.p.in, were fixed 2.5 % (v/v) gluteraldehyde in 100 mM sodium cacodylate buffer and
fixed overnight at 4oC. Specimens were rinsed in 100 mM sodium cacodylate buffer for
4 h, post fixed in 1 % (w/v) osmium tetroxide in 100 mM of sodium cacodylate buffer
for 2 h and dehydrated in an ethanol series before critical point drying in a Bal-Tec 030
critical point dryer. Specimens were observed using a Jeol JSM6460LV scanning
electron microscope (SEM) for cell surface changes.
6. 2. 5 DNA extraction and gel electrophoresis
The CHSE-214 and CHH-1 cells were grown in 25 cm2 tissue culture flasks and
infected with virus isolate F02-143. Monolayers of virus infected and control cells were
178
harvested at 4 h, 8 h, 24 h and 1 day, 3 day, and 5 d.p.in. Cells were first washed x 2
with DPBS, and then scraped into fresh DPBS (2.5 ml) and centrifuged at 1000 x g for
10 min to obtain a cell pellet. Genomic DNA was extracted from the cells using a
NucleoSpin®Tissue kit (MACHEREY-NAGEL, Abgene) following the manufacturer‟s
instructions. One microgram of extracted DNA in 10 µl of elution buffer supplied with
the extraction kit was mixed 1:l (v/v) with loading dye (Abgene, UK) and the samples
were electrophoresed on 1.2 % (w/v) agarose gel stained with 0.5 µgml-1
EtBr for 2 h at
40 V. Gels were observed under UV trans-illumination.
6. 2. 6 Determining apoptosis using immunofluorescent confocal
microscopy
A confocal laser scanning microscope was used to evaluate the nuclear and cytoplasmic
changes caused by the SAV 1 infection. The changes caused by different virus isolates
over time were tested in CHH-1 using samples collected at 1, 3, 5, and 7 d.p.in. Cells
were grown on cover slips placed in 24-well plates. Two rows of 24-well plates were
infected with virus either F02-143 or p42P at an MOI<1 as described before. The
remaining two rows in each 24 well plates were used as the test controls. Virus-infected
and control cells were fixed by adding equal volumes of freshly prepared Carnoy‟s
fixative (v/v methanol: glacial acetic acid 3:1) to the existing medum already in the 24-
well plates. After 2 min of initial fixation, medium and fixative were carefully removed
from the wells using a micropipette and further fixations (2 x 5 min) were carried out
with 0.5 ml of fresh fixative.
179
6.2.6.1 Caspase-3 staining
An anti-human/mouse active caspase-3 affinity purified polyclonal antibody (R&D
Systems, Oxfordshire, UK) was used to examine the activation of caspase in the virus
infected cells. Cells grown on cover slips and infected with virus were fixed as
described above and were then permeablised with 0.5% Titron-X in PBS for 30min
before commencing double fluorescent staining for confocal microscopy. The cells were
incubated with caspase-3 affinity purified polyclonal antibody diluted 1:500 (v/v) with
primary antibody diluent (1 % BSA, 0.5 % Titron X-100, in 0.01 M PBS pH=7.2) for 1
h. The cover slips were washed with PBS for 3 x 5 min and incubated with Texas red-
conjugated rabbit-antimouse IgG 1:250 (v/v) (Vector) for 1 h at 22oC. Cover slips were
then washed 3 x 5 min with PBS before performing the nuclear staining described in
section 6.2.6.2.
6.2.6.2 Hoechst 33258 staining
Hoechst 33258 stain (Sigma Aldrich) was used for the nuclear staining. Hoechst 33258
staining solution was freshly made by diluting 50 mg/ml stock solution to 1 µg/ml (v/v)
with PBS containing 1 mg/ml polyvinylpyrrolidone. Cover slips stained with anti-
caspase-3 polyclonal were immersed in Hoechst 33258 working solution for 30 min and
rinsed 1 x 3 min in de-ionised water before mounting on glass microscopic-slides using
Citiflor. The whole staining procedure was performed with minimal exposure to the
light and kept in the dark where ever possible.
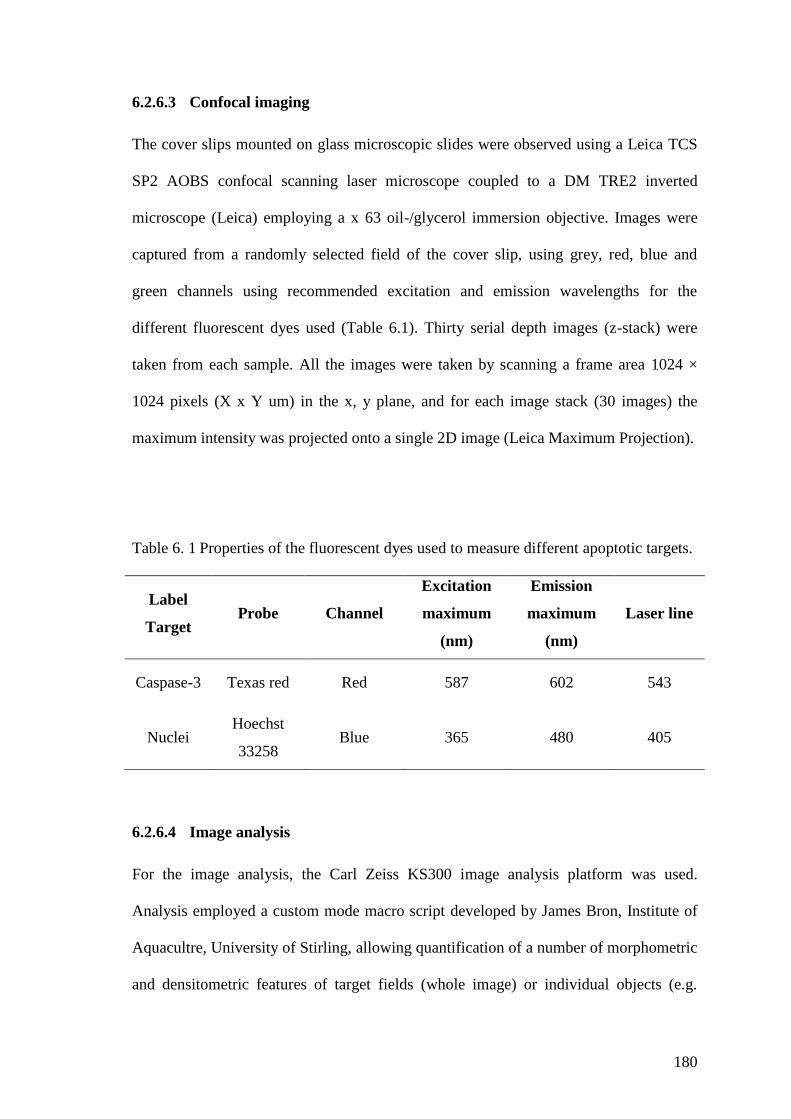
180
6.2.6.3 Confocal imaging
The cover slips mounted on glass microscopic slides were observed using a Leica TCS
SP2 AOBS confocal scanning laser microscope coupled to a DM TRE2 inverted
microscope (Leica) employing a x 63 oil-/glycerol immersion objective. Images were
captured from a randomly selected field of the cover slip, using grey, red, blue and
green channels using recommended excitation and emission wavelengths for the
different fluorescent dyes used (Table 6.1). Thirty serial depth images (z-stack) were
taken from each sample. All the images were taken by scanning a frame area 1024 ×
1024 pixels (X x Y um) in the x, y plane, and for each image stack (30 images) the
maximum intensity was projected onto a single 2D image (Leica Maximum Projection).
Table 6. 1 Properties of the fluorescent dyes used to measure different apoptotic targets.
Label
Target Probe Channel
Excitation
maximum
(nm)
Emission
maximum
(nm)
Laser line
Caspase-3 Texas red Red 587 602 543
Nuclei Hoechst
33258 Blue 365 480 405
6.2.6.4 Image analysis
For the image analysis, the Carl Zeiss KS300 image analysis platform was used.
Analysis employed a custom mode macro script developed by James Bron, Institute of
Aquacultre, University of Stirling, allowing quantification of a number of morphometric
and densitometric features of target fields (whole image) or individual objects (e.g.
181
nuclei). These features included area, mean signal intensity and counts. The script
provides as an output of measurement data for each image and processed images for
subsequent quality control and visual interpretation. The script encoded a fixed series of
operations with no user-interaction in order to ensure consistency between
measurements and remove user bias. Use of digital analysis in this context is much
faster than manual analysis, more accurate and allows improved inter-user repeatability.
For quantification of nuclear changes, nuclei were segmented from the background
using a colour segmentation function. Adjoining segmented nuclei were then separated
from one another using a grain separation function. The nuclei and nuclear fragments
captured were subjected to a size threshold to exclude noise and the final segmented
area was used as a mask for densitometric and morphometric measurements for each
nucleus or nuclear fragment. Measurements used for the present analysis consisted of
individual nuclear areas and mean intensity of signal per nucleus (functioning as a
proxy for DNA damage).
In detection of caspase, the threshold of the caspase was pulled-out from the
background. To obtain the cellular area cells were demarcated by marking the
background or low level of caspase. The mean caspase intensity for the area of a field
covered by cells was then measured.
6.2.5.4 Statistical analysis
Data were assessed for normality (Anderson-Darling Test) and homogeneity of variance
(Levene‟s Test or F-Test). Where data failed assumptions an attempt was made to
transform them using appropriate transformations including Box-Cox. Where
182
assumptions still could not be met, data were subjected to non-parametric analysis.
Where assumptions were met, parametric analyses were employed. Statistical
significance of mean area of the nuclei of infected (F93-124 and F02-143) and control
cells was compared using the Kruskal-Wallis test. The Mann-Whitney U test (≤0.05)
was used as the post-hoc comparison to compare the significance between control and
infection and two different virus infections.
6.3 Results
6. 3. 1 Transmission electron microscopy
The morphological changes seen in the cytoplasm of both CHH-1 and CHSE-214 cells
appeared similar. At the early stages of infection, i.e. 24 h.p.in the cytoplasm of the
infected cells became hollow and vacuolar compared to control cells (Figure 6.2.b).
Chromatin margination, characterised by an accumulation of chromatin in the inner
periphery of the nuclear envelope, was seen in a few cells (10 %) at 24 h.p.in and in a
large number of cells (> 40 %) by 48 h.p.in (Figure 6.2 b, c & d). Chromatin
condensation, characterised by clumping of nuclear chromatin in the centre of the
nuclei, was evident in some cells, from 48 h.p.in (Figure 6. 2 c & d). Cell fragmentation
and formation of apoptotic bodies started to appear in the virus-infected cells (< 10 %)
by 24 h.p.in, and became progressive at 48 h.p.in (40 % of the infected cells) (Figure
6.3). Electron dense micronuclei were noted within most of the fragmented cells (Figure
6.3).
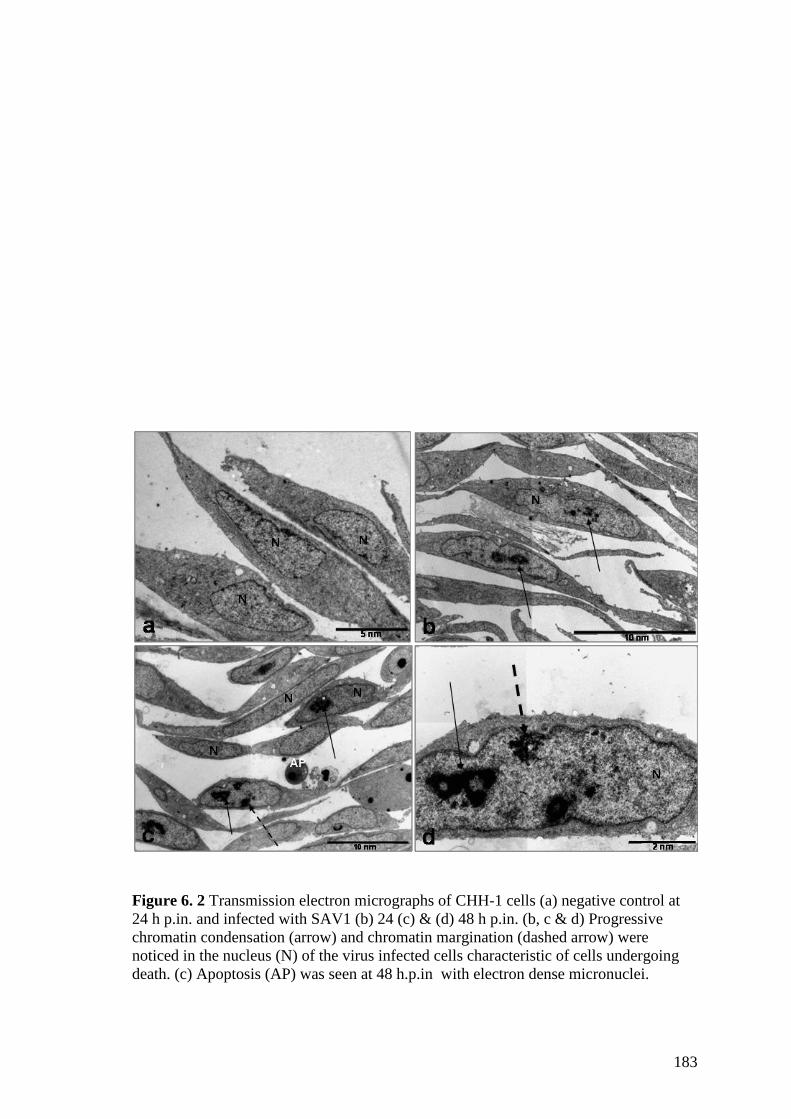
183
Figure 6. 2 Transmission electron micrographs of CHH-1 cells (a) negative control at
24 h p.in. and infected with SAV1 (b) 24 (c) & (d) 48 h p.in. (b, c & d) Progressive
chromatin condensation (arrow) and chromatin margination (dashed arrow) were
noticed in the nucleus (N) of the virus infected cells characteristic of cells undergoing
death. (c) Apoptosis (AP) was seen at 48 h.p.in with electron dense micronuclei.
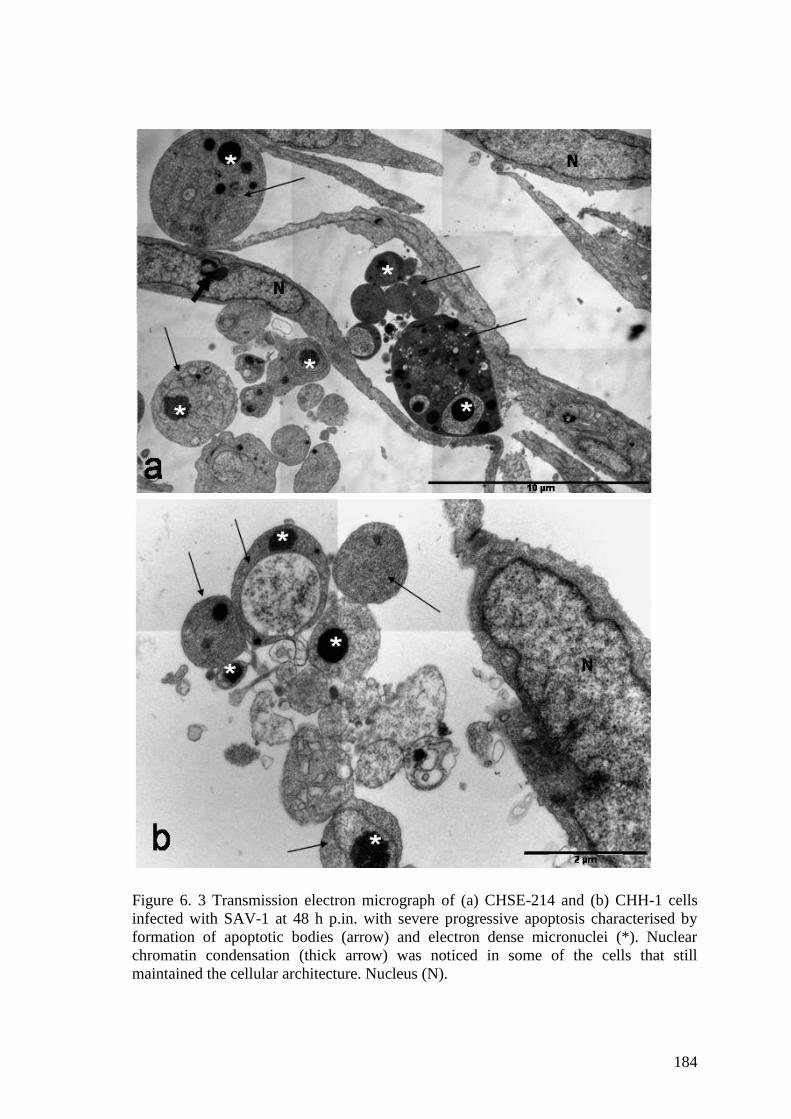
184
Figure 6. 3 Transmission electron micrograph of (a) CHSE-214 and (b) CHH-1 cells
infected with SAV-1 at 48 h p.in. with severe progressive apoptosis characterised by
formation of apoptotic bodies (arrow) and electron dense micronuclei (*). Nuclear
chromatin condensation (thick arrow) was noticed in some of the cells that still
maintained the cellular architecture. Nucleus (N).

185
6. 3. 2 Scanning electron microscopy
SEM of virus control cells showed that cells were uniformly attached to the cover slips,
although cells on the cover slips of infected cells started to detach from 48 h.p.in
(Figure 6.4.a & b). Some of the cells show characteristic membrane blebbing (Figure
6.4.c).
Figure 6. 4 Scanning electron micrographs of CHSE-214 cells at 48 h.p.in. (a) Mock
infected cells, (b & c) SAV1 infected cells with (c) cellular blebbing suggesting
apoptosis.
6. 3. 3 DNA laddering
Examination of genomic DNA run on agarose gels revealed a characteristic intra-
nucleosomal fragmentation of DNA in virus-infected cells from 48 h.p.in. The laddering
pattern of 180 bp oligomers observed on the agarose gel is characteristic of apoptosis.
No signs of nuclear fragmentation were observed in the cells before 48 h.p.in (Figure
6.5).
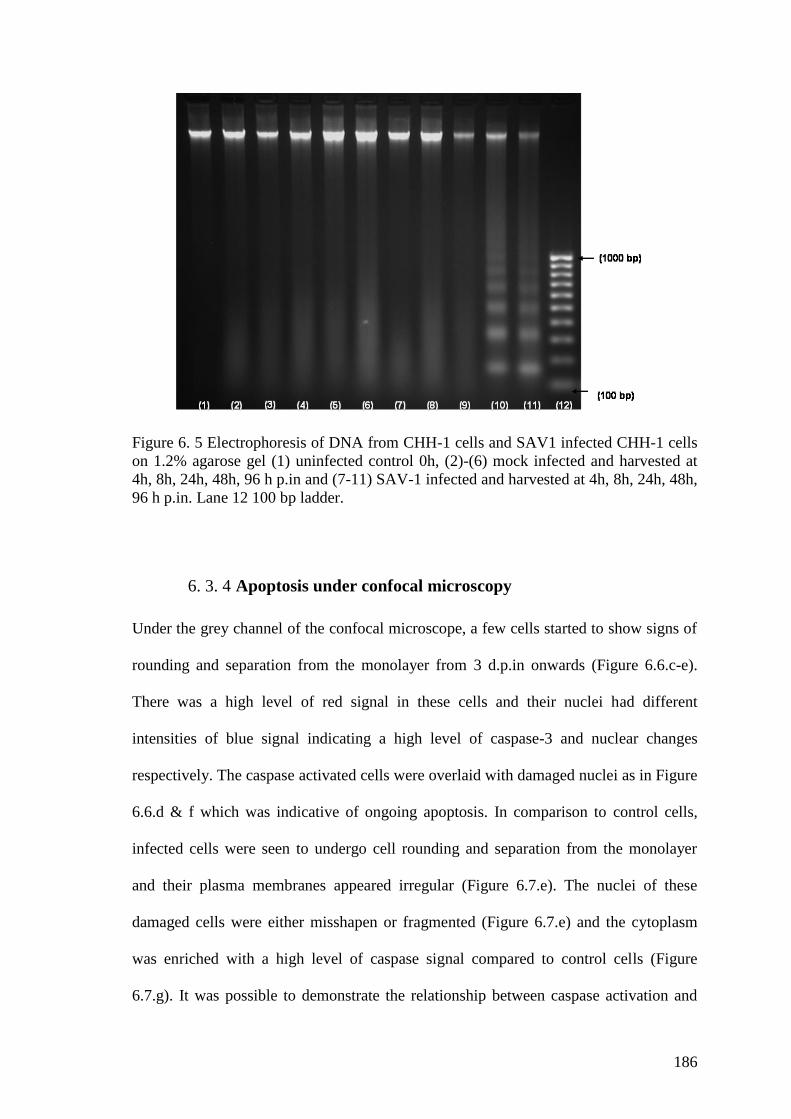
186
Figure 6. 5 Electrophoresis of DNA from CHH-1 cells and SAV1 infected CHH-1 cells
on 1.2% agarose gel (1) uninfected control 0h, (2)-(6) mock infected and harvested at
4h, 8h, 24h, 48h, 96 h p.in and (7-11) SAV-1 infected and harvested at 4h, 8h, 24h, 48h,
96 h p.in. Lane 12 100 bp ladder.
6. 3. 4 Apoptosis under confocal microscopy
Under the grey channel of the confocal microscope, a few cells started to show signs of
rounding and separation from the monolayer from 3 d.p.in onwards (Figure 6.6.c-e).
There was a high level of red signal in these cells and their nuclei had different
intensities of blue signal indicating a high level of caspase-3 and nuclear changes
respectively. The caspase activated cells were overlaid with damaged nuclei as in Figure
6.6.d & f which was indicative of ongoing apoptosis. In comparison to control cells,
infected cells were seen to undergo cell rounding and separation from the monolayer
and their plasma membranes appeared irregular (Figure 6.7.e). The nuclei of these
damaged cells were either misshapen or fragmented (Figure 6.7.e) and the cytoplasm
was enriched with a high level of caspase signal compared to control cells (Figure
6.7.g). It was possible to demonstrate the relationship between caspase activation and
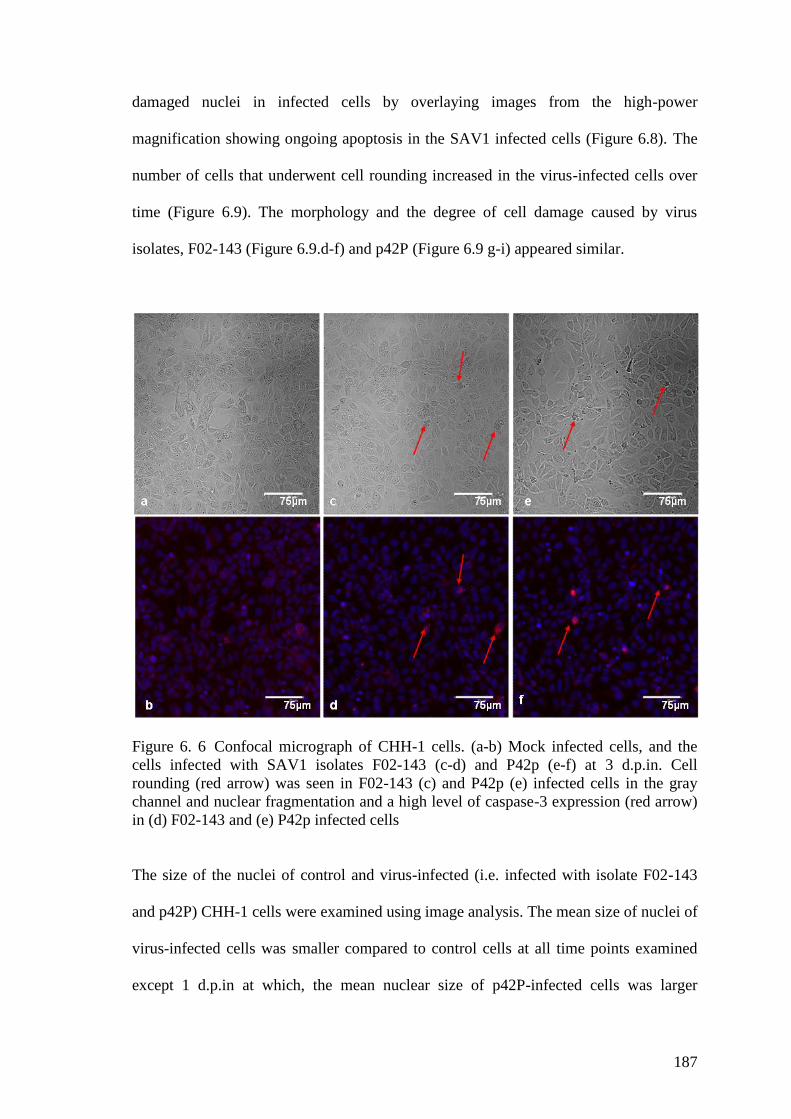
187
damaged nuclei in infected cells by overlaying images from the high-power
magnification showing ongoing apoptosis in the SAV1 infected cells (Figure 6.8). The
number of cells that underwent cell rounding increased in the virus-infected cells over
time (Figure 6.9). The morphology and the degree of cell damage caused by virus
isolates, F02-143 (Figure 6.9.d-f) and p42P (Figure 6.9 g-i) appeared similar.
Figure 6. 6 Confocal micrograph of CHH-1 cells. (a-b) Mock infected cells, and the
cells infected with SAV1 isolates F02-143 (c-d) and P42p (e-f) at 3 d.p.in. Cell
rounding (red arrow) was seen in F02-143 (c) and P42p (e) infected cells in the gray
channel and nuclear fragmentation and a high level of caspase-3 expression (red arrow)
in (d) F02-143 and (e) P42p infected cells
The size of the nuclei of control and virus-infected (i.e. infected with isolate F02-143
and p42P) CHH-1 cells were examined using image analysis. The mean size of nuclei of
virus-infected cells was smaller compared to control cells at all time points examined
except 1 d.p.in at which, the mean nuclear size of p42P-infected cells was larger
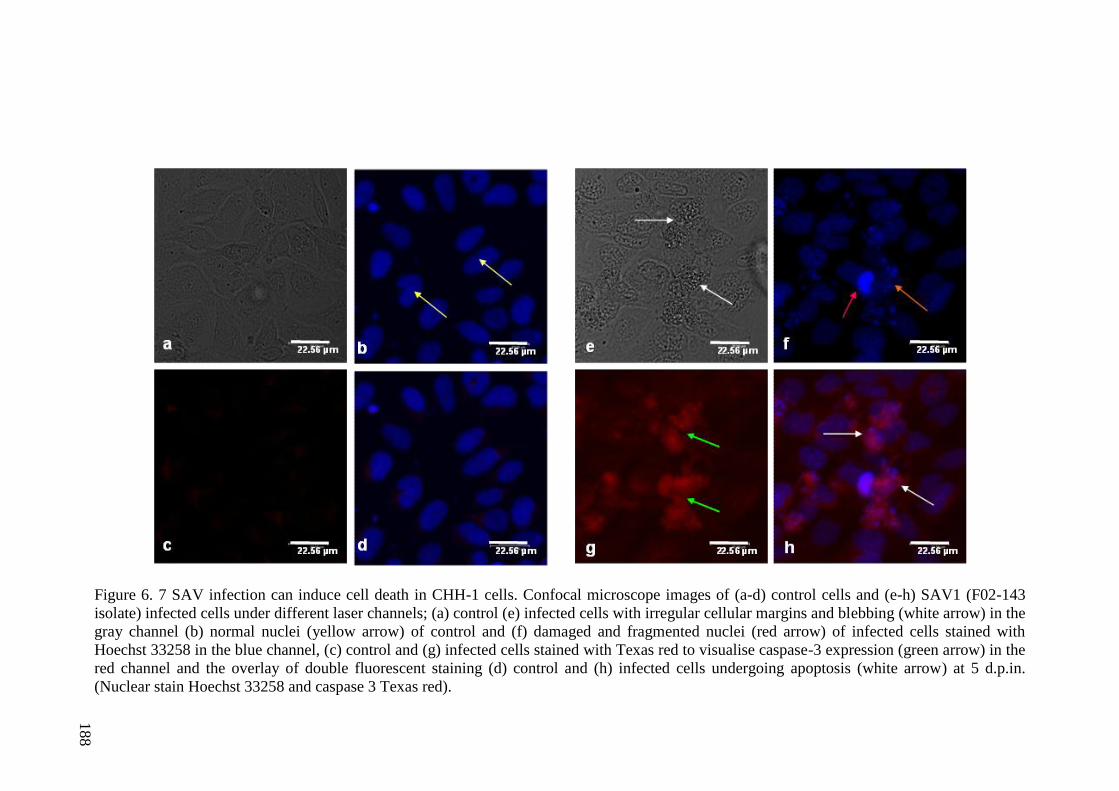
188
Figure 6. 7 SAV infection can induce cell death in CHH-1 cells. Confocal microscope images of (a-d) control cells and (e-h) SAV1 (F02-143
isolate) infected cells under different laser channels; (a) control (e) infected cells with irregular cellular margins and blebbing (white arrow) in the
gray channel (b) normal nuclei (yellow arrow) of control and (f) damaged and fragmented nuclei (red arrow) of infected cells stained with
Hoechst 33258 in the blue channel, (c) control and (g) infected cells stained with Texas red to visualise caspase-3 expression (green arrow) in the
red channel and the overlay of double fluorescent staining (d) control and (h) infected cells undergoing apoptosis (white arrow) at 5 d.p.in.
(Nuclear stain Hoechst 33258 and caspase 3 Texas red).
188
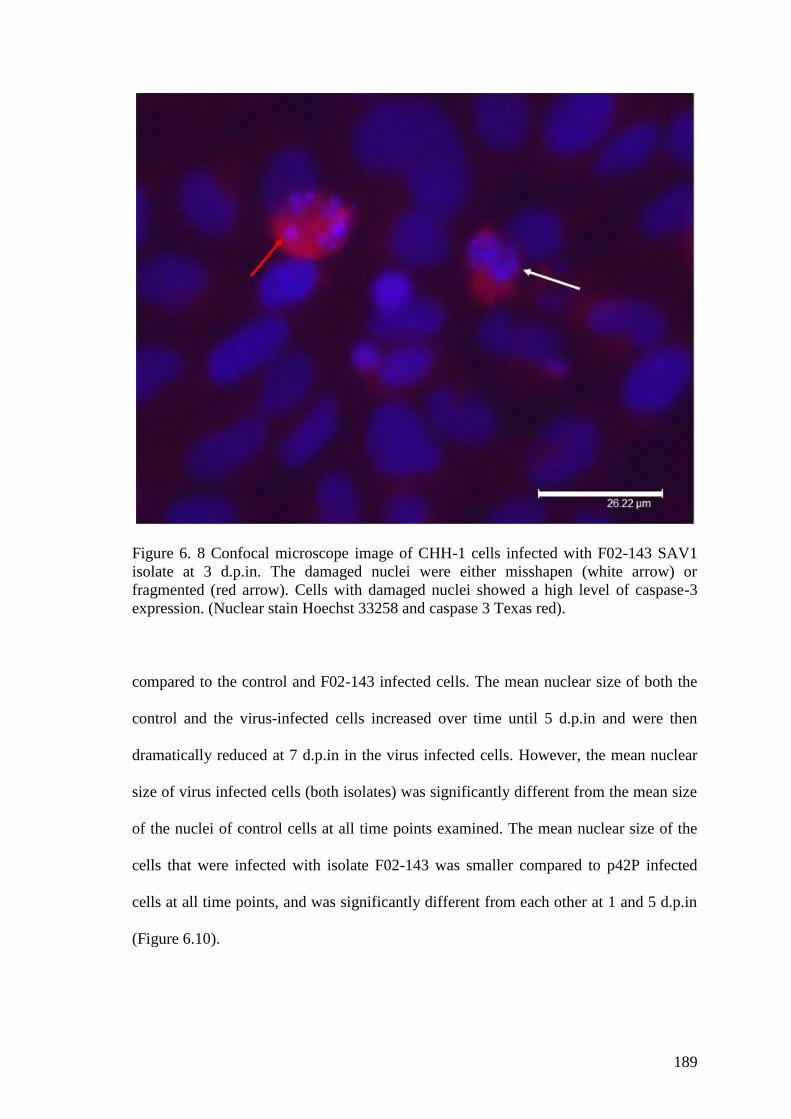
189
Figure 6. 8 Confocal microscope image of CHH-1 cells infected with F02-143 SAV1
isolate at 3 d.p.in. The damaged nuclei were either misshapen (white arrow) or
fragmented (red arrow). Cells with damaged nuclei showed a high level of caspase-3
expression. (Nuclear stain Hoechst 33258 and caspase 3 Texas red).
compared to the control and F02-143 infected cells. The mean nuclear size of both the
control and the virus-infected cells increased over time until 5 d.p.in and were then
dramatically reduced at 7 d.p.in in the virus infected cells. However, the mean nuclear
size of virus infected cells (both isolates) was significantly different from the mean size
of the nuclei of control cells at all time points examined. The mean nuclear size of the
cells that were infected with isolate F02-143 was smaller compared to p42P infected
cells at all time points, and was significantly different from each other at 1 and 5 d.p.in
(Figure 6.10).
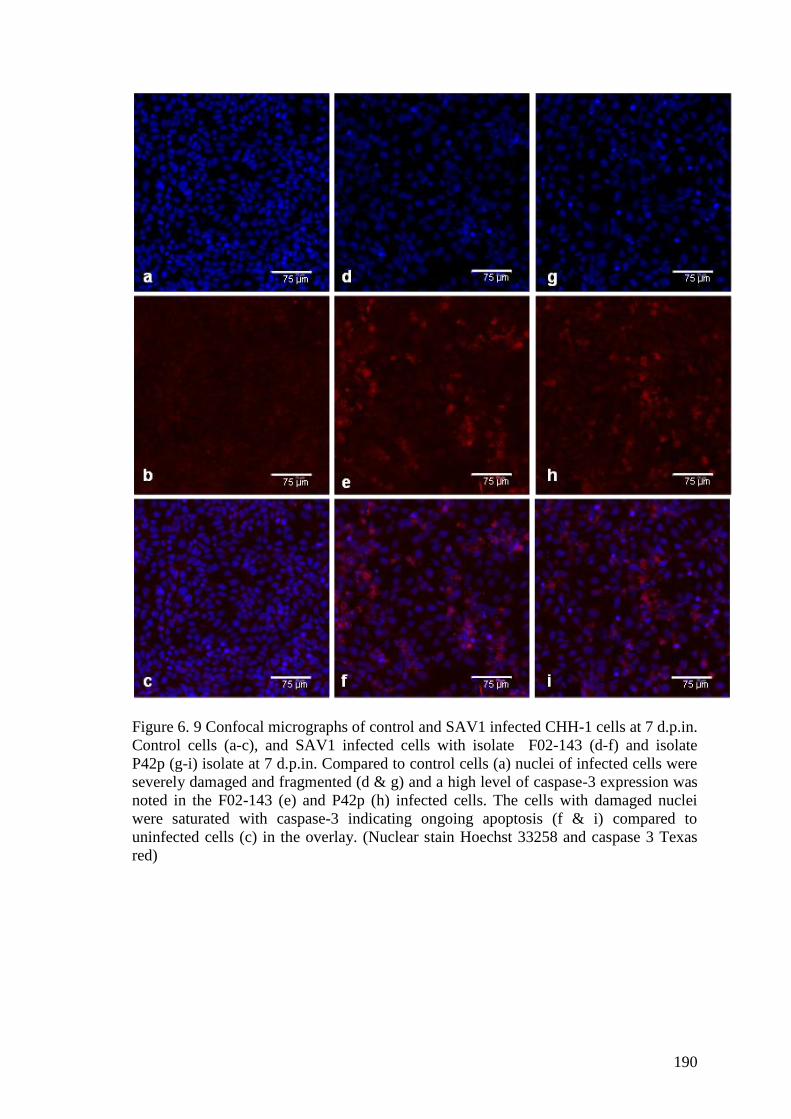
190
Figure 6. 9 Confocal micrographs of control and SAV1 infected CHH-1 cells at 7 d.p.in.
Control cells (a-c), and SAV1 infected cells with isolate F02-143 (d-f) and isolate
P42p (g-i) isolate at 7 d.p.in. Compared to control cells (a) nuclei of infected cells were
severely damaged and fragmented (d & g) and a high level of caspase-3 expression was
noted in the F02-143 (e) and P42p (h) infected cells. The cells with damaged nuclei
were saturated with caspase-3 indicating ongoing apoptosis (f & i) compared to
uninfected cells (c) in the overlay. (Nuclear stain Hoechst 33258 and caspase 3 Texas
red)
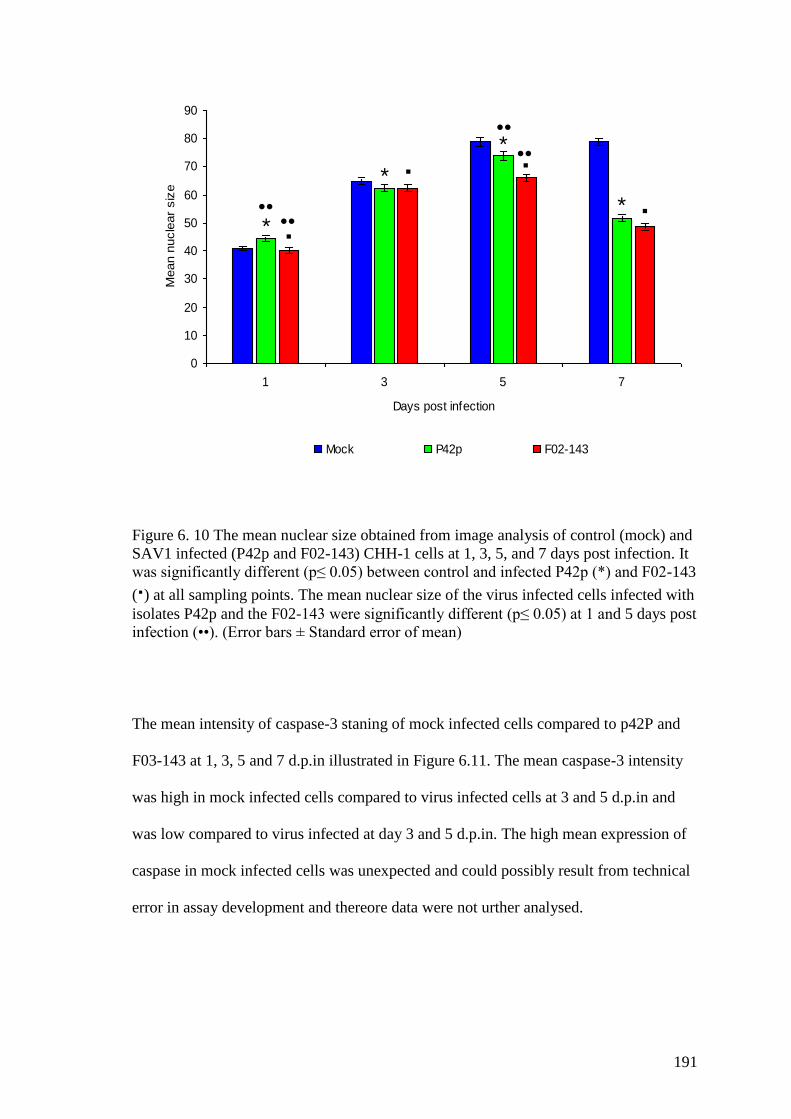
191
Figure 6. 10 The mean nuclear size obtained from image analysis of control (mock) and
SAV1 infected (P42p and F02-143) CHH-1 cells at 1, 3, 5, and 7 days post infection. It
was significantly different (p≤ 0.05) between control and infected P42p (*) and F02-143
() at all sampling points. The mean nuclear size of the virus infected cells infected with
isolates P42p and the F02-143 were significantly different (p≤ 0.05) at 1 and 5 days post
infection (••). (Error bars ± Standard error of mean)
The mean intensity of caspase-3 staning of mock infected cells compared to p42P and
F03-143 at 1, 3, 5 and 7 d.p.in illustrated in Figure 6.11. The mean caspase-3 intensity
was high in mock infected cells compared to virus infected cells at 3 and 5 d.p.in and
was low compared to virus infected at day 3 and 5 d.p.in. The high mean expression of
caspase in mock infected cells was unexpected and could possibly result from technical
error in assay development and thereore data were not urther analysed.
0
10
20
30
40
50
60
70
80
90
1 3 5 7
Days post infection
Mean n
ucle
ar
siz
e
Mock P42p F02-143
*
*
*
*
••••
••
••
0
10
20
30
40
50
60
70
80
90
1 3 5 7
Days post infection
Mean n
ucle
ar
siz
e
Mock P42p F02-143
*
*
*
*
••••
••
••
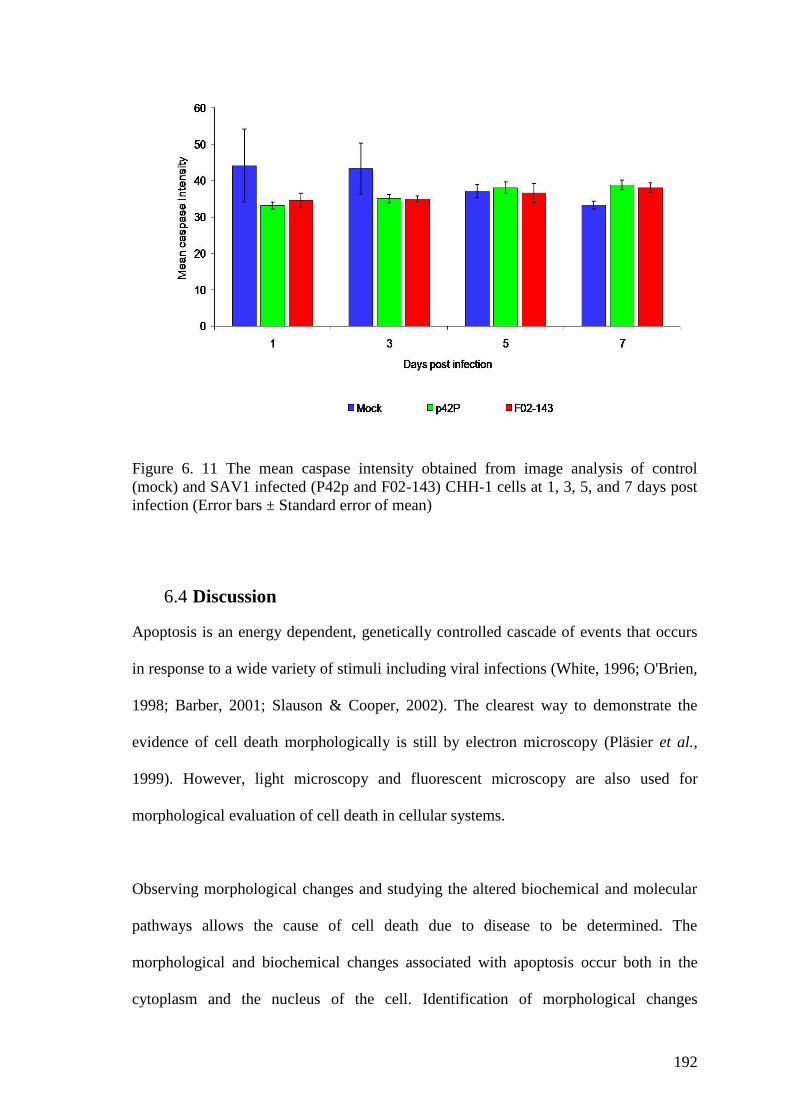
192
Figure 6. 11 The mean caspase intensity obtained from image analysis of control
(mock) and SAV1 infected (P42p and F02-143) CHH-1 cells at 1, 3, 5, and 7 days post
infection (Error bars ± Standard error of mean)
6.4 Discussion
Apoptosis is an energy dependent, genetically controlled cascade of events that occurs
in response to a wide variety of stimuli including viral infections (White, 1996; O'Brien,
1998; Barber, 2001; Slauson & Cooper, 2002). The clearest way to demonstrate the
evidence of cell death morphologically is still by electron microscopy (Pläsier et al.,
1999). However, light microscopy and fluorescent microscopy are also used for
morphological evaluation of cell death in cellular systems.
Observing morphological changes and studying the altered biochemical and molecular
pathways allows the cause of cell death due to disease to be determined. The
morphological and biochemical changes associated with apoptosis occur both in the
cytoplasm and the nucleus of the cell. Identification of morphological changes
193
associated with apoptosis is considered to be the most significant indicator of the
apoptotic process (Frankfurt & Krishan, 2001), and is characterised by cell shrinkage,
fragmentation and ultimate cell death. The main nuclear changes associated with
apoptosis include chromatin condensation and margination during the initial stages of
the process and preced fragmentation of the nuclei during the latter stages. In the
present study, chromatin margination was seen at 8 and 24 h p.in together with the
chromatin condensation at 24 h p.i. under TEM in both CHH-1 and CHSE-214 cells.
Formation of electron dense multiple micronuclei, with loss of cytoplasmic
characteristics were evident in cells from 48 h.p.in. Abnormal chromatin condensation
and apoptotic body formation is indicative of programmed cell death.
The method of nuclear fragmentation varies depending on the apoptotic inducer, giving
rise to a different appearance to the nuclei of the apoptotic cell before it becomes
fragmented (Dini et al., 1996). Nuclear fragmentation of SAV1-infected cells, seen in
the present study, appeared to be initiated by clumping of chromatin in the nucleus
before splitting into fragments. Chromatin clumping may have resulted in multiple
nuclear protrusions with in the cytoplasm giving rise to multiple cell blebbings seen on
the cell surface by SEM in the present study. Cell blebbing is an unspecific sub-cellular
change seen with ongoing apoptosis in cells. It is an actin-dependent process that is
initiated by localised decoupling of the cytoskeleton from the plasma membrane of cells
undergoing apoptosis (Fackler & Grosse, 2008). These protrusions eventually detach
from the cell forming membrane-bound cellular fragments, referred to as apoptotic
bodies (Dini et al., 1996). Formation of multiple cellular protrusions was seen around
24 h- 48 h.p.in. during this study, further supporting the evidence for apoptosis as a
cause of cell death during SAV in salmonid cells.
194
In apoptosis, the genomic DNA of the cell is cleaved into oligonucleosomal fragments
forming a characteristic laddering appearance on agarose gels (Griffin & Hardwick,
1997; Pläsier et al., 1999). DNA extracted from cells after 48 h.p.in and 96 h.p.in gave
laddering of 180 bp DNA fragments on agarose gels. DNA fragmentation during
apoptosis occurs as a result of activation of Ca+ and Mg+-dependent endonucleases,
which selectively cleave at linker DNA forming mono and/or oligonucleosomal DNA
fragments. This endonuclease-mediated nuclear DNA fragmentation is the biochemical
hall mark of nuclear damage in apoptosis. Necrosis also results in DNA damage, but the
fragments are irregular in size and form DNA smearing on agarose gel in contrast to
laddering induced by apoptosis (Dini et al., 1996). Nuclear fragmentation was also
observed under confocal microscopy using the fluorescent dye Hoechst 33258.
Activation of cytoplasmic caspase-3 is also a characteristic of apoptosis, and was seen
in infected cells from 3 d.p.in. The level of caspase-3 activation was high in cells that
had damaged nuclei. Both nuclear fragmentation and caspase-3 activation occurred in
CHH-1 cells infected with SAV.
Image analysis is a method employed for quantifying microscopic observations and has
advanced greatly after starting to use computer-based automated systems, either using a
computer connected to a microscope via a digital camera or using specified computer
programs on captured images (Pläsier et al., 1999). Image analysis is an operator-
independent method with no scope for either inter or intra-observer variation. It
prevents selection of subjective elements which is often the case in manual microscopy-
associated quantifications (Pläsier et al., 1999). Once a reliable method of image
analysis is established it allows consistent results to be rapidly generated and interprets
195
the cellular changes to be quantified. Image analysis is widely used for quantifying and
characterizing micro-organisms in biotechnical applications and cellular imaging in
biomedical sciences. However this method seems very under-used in the field of
aquaculture and aquatic disease diagnosis (DeWitte-Orr et al., 2005; Chen et al., 2010).
In the present study the second method was adapted in which a computer program was
used to analyse pre-captured confocal laser scanning microscopic images to quantify
nuclear changes and caspase-3 activation in established cell culture systems during
SAV1 infection and has demonstrated a significant difference in the size of the nuclei
between infected and control cells over time. Sample preparation and protocol
development are very important for a good image analysis. This can be clearly seen in
the present study when attempting to analyse caspase staining. Activation of caspase
appeared high in damaged cells undergoing apoptosis when viewed under the confocal
microscope, but in image analysis the opposite was seen from the results (data not
shown). This was probably a result of non-specific binding of the anti-caspase-3
polyclonal antibody to cells or background noise generated from improper washing and
staining. As the primary antibody used was prepared against human caspase, non-
specific binding was suspected, but it was shown recently that human anti-caspase-3
does recognize caspase-3 expressed in fish cells (Chen et al., 2010). Therefore, from the
strong staining seen by confocal microscopy we believe that further optimization of the
assay is required to generate a reliable result for caspase-3 activation in these cell
cultures.
Allthough the same stock virus have been used immunostained sample under confocal
microscopy and EM, time line for detection of apoptosis appeared to be delayed in
former. To initiate the infection in those experiments, the cells were grown on two
196
different vessels, in which, cells for immunostaing were grown on coverslips placed on
24 well plates, while cells for the EM were grown on 25 ml cell culture flasks. The
difference in detecting apoptosis in these two cell culture systems is not very clear,
however, differences in the development of CPE in cells grown on 24 well plate and
flasks were noticed during the initial optimization studies of SAV-1 in cell cultures
(personal observations). But, as these assays were carried out in different instances, the
effect of infective virus titer present in the stock virus cannot be ignored and obtaining
viral titer of stock viruses in parallel experiments is thefore recommended.
Apoptosis does not elicit an inflammatory response in tissues, unlike necrosis-induced
cell death. In general, apoptotic cells are cleared by activated macrophages or by
neighbouring cells. Clearance of apoptotic cells by neighbouring cells has been seen
with IPNV infected CHSE-214 cells infect (Hong et al., 1998; Chen et al., 2010), but it
was not possible to observe in the present study. Phagocytosis and clearing of cell
debris is a rapid process in the cellular system and this could possibly explain the reason
why it was not observed. In addition, the rapid clearance of apoptotic cells from the
tissues by phagocytosis increases the difficulty in observing programmed cell death in
tissues and characterising apoptosis in-vivo.
It is known that apoptosis induced by alphavirus in mammals provokes persistent
infection in nervous tissues (Griffin, 2005; Griffin & Hardwick, 1997). Cells sloughed
off from the cell monolayer were seen in the cell culture supernatant and appeared to be
infectious even after 28 d.p.in, during virus optimisation studies for SAV1 in this thesis.
The ultimate fate of these salmonid cells is not clear and it would be interesting to
197
evaluate this further to characterise whether it has any relationship to virus persistence
as seen in mammalian alphaviruses (Griffin & Hardwick, 1997).
In summary, from the evidence obtained with the TEM and SEM, confocal microscopy
and DNA fragmentation, there is a strong indication that cell death in SAV1 infection is
associated with apoptosis. The occurrence of apoptosis in CHH-1 cells appears
interesting, especially because of the cardiac origin of this cell line. The heart is one of
the main target organs of the virus and apoptosis has already been observed in heart
during SAV infections (Taksdal et al., 2007). This therefore, increases the value of this
cell line as a research tool for SAV studies. However, the actual cellular pathway
involved in activating apoptosis during SAV infection is still unclear and the
contribution it makes to the actual pathology observed in- vivo still remains to be
established.
198
Chapter 7
General Discussion
Aquaculture continues to increase globally on an annual basis, and with it viral diseases
have become a huge economic burden to the industry. Pancreas disease caused by
SAV1 was first noted in Scottish farmed Atlantic salmon in the late 70s, and it has since
become a severe problem to the Scottish, Irish and Norwegian salmon industries.
Effective control strategies are needed to combat the disease, but limited knowledge on
the spread of SAV and propagation of the virus in its host, and in the environment, has
hindered the development of such control measures. The reason for the increase in the
incidence of PD is still unclear. Sensitive diagnostic tools that are able to detect and
measure the distribution of the virus in monitoring, screening and surveillance
programmes of the host and the environment are urgently needed to combat the disease.
Also, information on the host‟s response to SAV is limited, and increasing our
understanding of how immune response and antiviral mechanisms help to combat the
disease would assist in our understanding of disease pathogenesis, and in the design of
effective management and control measures.
Virus isolation using cell cultures and observing the development of a CPE was one of
the main methods used for virus characterization, especially before molecular tools
become available. The viral aetiology of PD was confirmed by Nelson et al., (1995)
who isolated the virus on CHSE-214 cells nearly two decades after the disease was first
described in Scotland (Munro et al., 1984; Nelson et al., 1995). This original virus
isolate, F93-125, has been widely used as a reference isolate for many research and
199
phylogeny studies relating to SAV (Fringuelli et al., 2008). During the preliminary
work presented in this thesis, the F93-125 isolate appeared more virulent than isolate
p42P, an isolate obtained from an experimental induction of SAV1 in rainbow trout in
France, both in-vitro and in-vivo, and was therefore chosen for the subsequent
experimental infections (data not shown).
Primary isolation of SAV from cell culture is based on observing a CPE, and this can be
difficult to achieve. The initial development of a CPE from the primary isolation can
take several days and several blind passages before obtaining a positive result. It also
requires an experienced person to interpret the results of the CPE (Graham et al.,
2007a). Only CHSE-214 and RTG-2 cell lines have been widely used to isolate SAV,
however Graham et al., (2008) recently demonstrated that BF-2, TO, FHM, SHK-1, and
EPC cells are also susceptible to infections by SAV. The appearance and severity of the
CPE caused by SAV is widely dependent on the cell line used for the isolation of virus
(Graham et al., 2008). Virus isolation from head kidney tissue of experimentally
infected Atlantic salmon was carried out in the present study using three established
salmonid cell lines, CHH-1, CHSE-214 and SHK-1. Successful viral growth was
obtained on the first attempt at inoculating the infected kidney homogenate on to all
three cell lines, with the fastest CPE development occurring in CHH-1 cells. The
appearance of the CPE in the CHH-1 and CHSE-214 was similar but different to the
CPE in the SHK-1cells (Figure 2.2). The SHK-1 cells are derived from the head kidney
of Atlantic salmon and are reported to have macrophage-like activities. These cell lines
have been used for many different functional studies, such as examining antiviral
activity against different viral diseases of salmonids and in functional genomics studies
(Jensen & Robertsen, 2002; Martin et al., 2007; Gahlawat et al., 2009). The delay in the
200
development of a CPE in SHK-1, as observed in the present study, means that they have
limited use as a diagnostic tool for SAV virus isolation. They are however still useful
for other investigations such as monitoring antiviral mechanisms and virus-host
interactions (Graham et al., 2008; Gahlawat et al., 2009). The ability of SAV to infect
both SHK-1 and TO cells (Graham et al., 2008) may indicate that the virus has tropism
towards leukocytes, supporting the observations made by Houghton, (1995) and
Graham et al., (2003b). One of the experimental infections carried out in parallel to the
present study, showed a progressive apoptosis in the blood and head kidney of Atlantic
salmon around 5 d.p.i. (Costa et al., 2007). Taksdal et al., (2007) have described a
cellular population with eosinophilic granules, present in the kidneys of Atlantic salmon
and rainbow trout derived from field outbreaks caused by SAV3. Similar lesions have
also been reported in SAV1-affected Atlantic salmon from the Shetland Islands,
Scotland (McLoughlin and Graham, 2007). It was possible to isolate virus using SHK-1
again in the present study, supporting the idea of possible tropism of SAV towards the
reticuloendothelial system and blood. This is of particular interest for describing the
pathogenesis and the immune mechanisms of SAV infection.
It was shown in the present study that CHH-1 cells are susceptible to SAV infection
(Herath et al., 2009), and thus these cells are useful for diagnostics and as a research
tool to examine host-virus interactions, as was used in the present study to examine the
cell death mechanism of SAV (Chapter 6). The sensitivity of cell culture isolation of
SAV has been improved by using a rapid immunoperoxidase-based staining method
described by Graham et al., (2003a). This method helps to overcome the problems of
false negative results sometimes obtained in conventional cell cultures used in SAV
diagnosis, because of the problems associated with delayed development of a CPE. It
201
would be interesting to determine the usefulness of CHH-1 cells in combination with
the immunoperoxidase based immuno-staining method using monoclonal antibodies for
virus isolation from different clinical samples derived from field outbreaks, to elucidate
whether it can improve SAV diagnostics further.
The virus load is used as a reliable indicator to establish the extent of active virus
present in a host during infection or in response to a treatment (e.g. vaccines or drugs)
(Niesters, 2001; Mackay et al., 2002). Determining the virus load present in a tissue
during the course of an infection facilitates our understanding of virus replication over
the course of infection, which is useful for interpreting the pathology associated with
the disease. The level of virus present in different tissues and serum of fish infected
with SAV during both experimental and natural infections has been assessed by virus
isolation and end-point titration of the virus in cell cultures (McLoughlin et al., 1995,
1996, 2006). Although the development of the immunoperoxidase based virus
neutralisation test has improved virus isolation and titration compared with
conventional cell culture methods, it was not possible to estimate actual viral genomic
RNA copy numbers present in these samples, therefore molecular tools have been
employed for this purpose. Graham et al., (2006b) were able to detect and quantify the
level of SAV present in the heart of experimentally infected salmon and in the serum of
naturally infected salmon using a qRT-PCR assay. In this particular assay, using a
constant W/V ratio of tissue and SG chemistry it was possible to detect virus for a
considerable period after the infection (90 d.p.i). Using Taqman®
qRT-PCR, relative to
an internal housekeeping gene, ELF1α, Andersen et al., (2007) were able to characterise
the pantropic tissue distribution of SAV in the heart, kidney, gill, gut, pseudobranch,
and the somatic muscle of diseased fish. The experimental samples used for their work
202
were derived from two independent experimental infections, (1) from fish injected I.P
with tissue homogenate derived from salmon clinically infected with SAV3 and (2)
from fish injected with tissue culture grown SAV1 (reference isolate F93-125). They
also demonstrated the presence of viral RNA as late as 190 d.p.i. In the present study,
the same reference isolate F93-125 was used to infect fish I.P. and the peak level of
viral RNA was detected as early as 5 d.p.i., which was 2 days earlier than the peak
levels of SAV detected in the experiment carried out by Andersen et al., (2007) in their
study. The semi-quantitative assay developed by Andersen et al., (2007) used a
housekeeping gene to determine the fold change of viral gene expression. In the present
study has quantified the copy number of the viral RNA present with the help of a
standard curve prepared from RNA synthesized in-vitro. Use of a standard curve
prepared from RNA transcribed in-vitro, using the same transcript as used for testing
the samples in qRT-PCR assay, has minimised the effect of external factors toward to
the final result of the assay (Workenhe et al., 2008)). However, normalization of data
comparative to a standared reference gene is still recommended for the accuracy of the
final results. It is known that use of a host encoded housekeeping gene to quantify viral
RNA expression could affect the final result of the test as the expression pattern of
housekeeping gene could change across different tissues and during pathogen
challenges (Mackay et al., 2002). Spiking extracted RNA with in-vitro transcribed
cRNA without homology to the total RNA is been used as a alternative approach for
assay normalization in in realtime qRT-PCR to minimise the inherent variability of
RNA extraction, storage, cDNA synthesis, data acquisition, analysis of qRT-PCR
assays (Gilsbach et al., 2006) and variation of house keeping gene. Therefore use of
„universal RNA reference‟ would be useful to improve the results of the present study.
203
From the infection kinetics examined using both cell culture and molecular techniques
revealed that the highest level of SAV was present in the early stage of the experimental
infection, before either clinical or pathological signs become evident. Furthermore, it
was only possible to detect SAV-positive fish up to 42 d.p.i. Other studies reported in
the literature, have detected SAV relatively late in the infection; in one study, SAV was
present in the heart of the infected fish at 90 d.p.i (Graham et al., 2006b) while
Andersen et al., (2007) detected SAV as late as 190 d.p.i. The viral RNA, detected late
in these experimental infections, could be from complete intracellular virions,
free/unpacked virus particles inside the cells, replication intermediates, defective virus
particles, or free intracellular viral RNA from defective cells. Therefore, detection of
SAV late in the infection may not directly reflective of active replicating virus but
persistent or residual RNA in the tissue (McLoughlin & Graham, 2007). The absence of
viral RNA detected later in the infection in the present study could be related to early
clearance of the virus from the host mediated via potent interferon mediated immune
defence and the broad range of antiviral mechanisms that have been observed during
this experimental infection (see Chapter 3 and 4).
Similar to the present study, most published results on the experimental infections using
SAV were carried out using cell culture-adapted viruses (Boucher et al., 1995;
McLoughlin et al., 1995, 1996, 1997, 2006; Christie et al., 1998, 2007; Desvignes et al.,
2002; Graham et al., 2006b). It is known that continuous passaging of alphavirus in cell
culture tends to attenuate the infectivity of the virus to its natural host, while adapting to
the cell line used to culture virus in vitro (Karlsen et al., 2006). The level of SAV
present and the time taken to induce the infection between fish experimentally infected
I.P with cell culture adapted virus and fish injected with homogenised clinical material
204
I.P appeared to be different. In the experiment conducted by Andersen et al., (2007) it
was found that viral RNA expression in the kidney of fish injected with clinical samples
was 20,000 fold higher than in the fish injected with the virus grown in cell cultures. In
addition, the experimental infection induced by injecting F93-125 isolate I.P. gave a
peak level of viral RNA around 1 week post-infection compared to the peak level of
viral RNA detected at 3 weeks post-infection with kidney homogenates from SAV3
infected fish. This difference could possibly be attributed to changes in the virus, as a
result of mutations that takes place during cell culture adaptation. On the other hand, the
difference in viral kinetics could be related to a difference between subtypes SAV1 and
SAV3 themselves (Karlsen et al., 2006). To understand this better, the infection kinetics
and the clinical outcomes of different SAV subtypes need to be studied further, also
comparing clinical material and cell culture grown virus to infect fish.
Field outbreaks of SAV are generally associated with mortalities ranging from 5 to 50
% of the affected population (Rodger & Mitchell, 2007). However, mortalities are
difficult to reproduce in SAV infections under experimental conditions (McLoughlin et
al., 1996; Desvignes et al., 2002; Graham et al., 2006a), or it may be that the mortalities
seen in clinical diseases are associated with secondary complications rather than as an
outcome of the infection itself (Christie et al., 2007). Reports of gross pathological
lesions tend to be mild or absent in experimental infections, similar to that was seen in
the present study. Ascites and a yellow, enlarged liver have been observed in the
experimental infections carried out using homogenised clinical materials from SAV3-
infected fish indicating that clinical samples possibly give rise to more severe
pathologies than cell culture-derived virus (Andersen et al., 2007). In the present study,
fish started to show mild clinical signs early in the infection but no mortalities were
detected. Both the absence of mortalities and minimal or absence of gross pathological
205
changes could also have resulted from attenuation of the virus by repeated passaging in
vitro.
Sequential pathology described for SAV, based on field and experimental infections
have been used to help describe the pathogenesis of SAV (McLoughlin & Graham,
2007). A comprehensive description of the pathology in different target tissues
indicating distribution of the lesions in tissues and the severity of the lesion at different
stages of both natural and experimental infections is available for both PD and SD
(McVicar, 1987; McLoughlin et al., 1995, 1996; Graham et al., 2007a). A comparative
study between Atlantic salmon, rainbow trout and brown trout identified differences in
the severity, the extent of tissue damage, and the distribution of the lesions (Boucher et
al., 1995). There were also reports of differences in the susceptibility to SAV1 by
different strains of Atlantic salmon from experimental infection data, suggesting that
there could be a variation in genetic susceptibility of fish to SAV1 infection
(McLoughlin et al., 2006).
Heart, pancreas and skeletal muscle are the main targets of virus infection. In the
present study, severe pathology was observed in the pancreas and mild to moderate
pathology in the heart of infected fish, but no pathology was seen in the skeletal muscle
of any of the infected fish throughout the 90 day experimental period. Both red and
white skeletal muscle necrosis occurs under natural conditions, and this occurs late in
the infection after pancreatic and heart pathology can be seen. Most of the experimental
infections of SAV have been unable to reproduce or cause only mild skeletal muscle
lesions with degenerative changes occurring in the myofibrils compared to field
outbreaks of SAV (McLoughlin et al., 1996). The low incidence of muscular lesions
was suspected to be result of lower virulence of the cell culture adapted virus used to
206
induce the infection, and also the less intense physical activity of the experimentally
infected fish compared to conditions experienced by farmed fish. McLoughlin et al,
(1996) reported a high number of deaths in populations with severe skeletal muscle
lesions in natural outbreaks indicating the significance of the skeletal myopathy for
causing death in SAV infected fish. In general, skeletal muscle pathology occurs 3-4
weeks post-infection. The absence of skeletal muscle lesions in the present study could
also possibly be a result of viral clearance by an early immune response.
Infection of the virus has been transmitted to healthy individuals through co-habitation
of the fish with SAV-infected fish. This is a characteristic feature of SAV, since other
alphaviruses require an arthropod vector for transmission (Strauss & Strauss, 1994). The
mucosal membranes may act as the portal of entry of SAV into the fish but there is no
information on this as yet. The present study showed increased production of Mx
protein in the mucous membranes of virus-infected fish, with the highest level detected
in gills, compared to the skin and gut. Further, a high Mx protein expression was also
detected in cardiac muscle of infected fish, early in the infection before pathological
lesions become evident in heart. The high levels of Mx expression in the gill of SAV-
infected fish are interesting. Previously Andersen et al., (2007) also found that a higher
level of viral RNA was present in the gill of fish compared to other tissues in a qRT-
PCR study of experimentally induced SAV in salmon. Many fish viruses use gill as a
portal of entry, and there could be a relationship to gill in SAV infection, thus, a
detailed investigation would be useful for elucidating the role of the gill in SAV
pathogenesis. However, the lack of sensitive tools to visualise the spread of the virus in
the tissues is a major drawback for such studies, and sensitive methods such as in situ
hybridization and immunohistochemistry need to be developed to be able to study this.
207
Availability of such tools will also facilitate the understanding of tissue tropism of the
virus.
In general, sequential pathology helps in describing pathogenesis of diseases, however,
this is not very useful for understanding the functional mechanisms of the disease.
Understanding the relationship between the pathogen kinetics and the altered host
physiological and structural mechanisms is useful for describing the pathogenic
outcomes of the disease (Slauson & Cooper, 2002). Microarray analysis was performed
to examine the co-opted molecular mechanisms in the initial stages of SAV1 infection
in Atlantic salmon experimentally infected with the virus. A large number of cellular
transcription and translation associated genes were shown to be differentially expressed
and these were associated with the possible shutdown of cellular metabolic functions, as
seen with mammalian alphavirus infections. Changes were seen in the genes associated
with the establishment of infection and cell death using the microarray. In general, fish
largely depend on their innate immune system to defend them from pathogens. The
innate immune response of fish includes a large array of mechanisms for responding to
viral diseases (Ellis, 2001; Magnadóttir, 2006; Whyte, 2007). In SAV infections, the
role of the innate immune response is largely unknown, but the microarray used in the
present study indicated that a large number of innate immune signatures responded at an
early stage in the infection. For example, the INF-1 pathway was seen to be highly
activated using the microarray, and this was confirmed using immunohistochemistry for
the Mx protein, an INF-I induced antiviral protein, detected in a variety of different
tissues. A higher degree of Mx expression was seen in the heart and the mucous
membranes of SAV infected fish. Again with the microarray, an early induction of
adaptive immune associated genes, such as MHC-I and Ig associated genes was
observed, highlighting the involvement of the adaptive immune system in SAV
208
infection. Understanding the antiviral mechanisms of the host also helps to describe the
pathogenesis of viral diseases. In the present study, expression of some of the unique
antiviral associated genes such as zinc finger protein were observed in common with
mammalian alphaviruses suggesting possibilities of similar antiviral mechanisms
between fish and higher vertebrates.
Evaluation of the effects of different treatments (i.e. vaccines, feed, immunostimulants)
and host response to different subtypes of SAV using microarray will hopefully give a
better insight into the disease mechanisms of the virus and help in designing effective
control measures against SAV infections. The presence of a poly-A tail at 3‟ of the viral
genome allows a possible incorporation of the SAV genome into the microarray
platform, and such a tool would be useful as an indicator of the host infectious status,
along with global expression studies of the infection.
The life cycle of a virus is a complex interaction between virus and host cells.
Understanding the viral biogenesis process helps to describe the ultra-structural damage
and the cellular pathogenesis during the replication process. Electron microscopy based
ultra-structural imaging is popular as a tool for characterising virus types in fish viral
diseases and on a few occasions EM was also used to describe the ultra-structural
morphogenesis and replication cycle in established cell lines (Granzow et al., 1995;
Workenhe et al., 2008b; Miwa & Sanao, 2007). In the present study electron
microscopy was used to describe ultra-structural morphology of SAV and it was seen to
closely resemble that of mammalian alphaviruses (Nelson et al., 1995). In Chapter 5,
virus particles 45-55 nm in size were clearly observed under negative-stained electron
microscopy. It also possible to observe typical alphavirus replication in CHSE-214 cells
209
infected with SAV1, although a few unique characteristics were observed with the
virus. Membrane budding, a unique feature of enveloped viruses (Groff et al., 1998,
Garoff et al., 2004), has been clearly demonstrated for SAV (McLoughlin & Graham,
2007), and in the present study virus budding was observed through surface projections
acquiring envelope from the CHSE-214 cells. Virus budding in SAV1 infection appears
to be detrimental to host cells. From the TEM and virology studies it was shown that
CPE developed subsequent to extensive virus budding from CHSE-214 cells. Pinching
of cell membrane to form a virus envelope may induce cell death characterised by the
rounding and detachment from the monolayers observed under the light microscope,
and cellular and nuclear fragmentation detected under TEM. Virus endocytosis was
difficult to demonstrate at the level of infection in vitro, but was frequently observed
later in the infection process during this study and was mediated by the formation of
coated pits. The vesicles with fuzzy-looking membrane derived from Golgi apparatus
appeared to be responsible for generating the coated pits involved in virus uptake.
Components of the secretory pathway of the cell, for example, endosomes, lysozomes,
RER and Golgi apparatus, were extensively involved in the SAV replication process.
Changes in the expression of genes involved in the cellular secretory pathway were seen
in SAV infected fish in vivo using the microarray and this may be reflective of the
morphological changes associated with secretory pathway seen under TEM.
The process of viral biogenesis described in the present study was based on the
comparative morphology of mammalian alphavirus. Combinations of specific
antibodies and electron dense markers, specific for different cell organelles, have been
used to confirm the structures involved in virus assembly by mammalian alphavirus
(Kujala et al., 2001) ,and this would be useful too for SAV. Fluorescent tagged
210
infectious-RNA prepared by reverse-genetics, would be useful for imaging various
events in the virus biogenesis process (Müller et al., 2004). Studies on the structural
assembly of virus are currently being pursued to identify the different events of the
virus biogenesis process in order to develop different molecules that counteract
particular events (Perera et al., 2008). This is also helpful in the development of
effective vaccines and antiviral drugs. Use of advanced cryo-electron microscopy and
atomic resolution has provided an important insight in to the structures of enveloped
viruses (Mukhopadhyay et al., 2005). Use of these tools has allowed examination of
different intermediates involved in the virus cellular entry that have helped to
understand virus replication at molecular level. Following on from this, studies of
structural conformational changes using pseudo-atomic structures of virion and atomic
resolution structures of viral proteins have proved promising targets to develop
structure-based antivirals for flaviviruses (family Flaviviridae). Although such
applications would be useful in clinical infections, the practicality of developing such
products is not probably economically feasible for aquaculture.
The alphavirus +ssRNA genome, itself, is infectious to the host cells (Strauss & Strauss,
1994; Kujala et al., 2001). This feature has been exploited in the generation of
alphavirus expression vectors and has been used in many different molecular
applications, such as vectors for vaccine delivery for different viral and tumour
conditions, and recombinant protein expression (Schelesinger & Dubenskey, 1999;
Riezebos-Brilman et al., 2005). In the „Reverse Genetic‟ process, the alphavirus RNA
genome is converted into an intermediate cDNA in which the desired genetic
manipulation is performed by inserting or deleting genetic components and re-
recovering RNA as recombinant RNA (rRNA) either in-vitro or in–vivo. For SAV2, an
211
infectious full length cDNA clone was generated by inserting the RNA genome into a
plasmid and transfecting this into BF-2 cell cultures to produce a recombinant SAV2
virus (rSPDV2) (Moriette et al., 2006). The rSDV2 has been used in trials in-vivo in
which it has been found to be infectious, but non-pathogenic to rainbow trout at
temperatures other than 14oC. This virus was able to elicit a protective response for 5
months to subsequent wild type virus challenges (Moriette et al., 2006), suggesting a
potential use of rSAV2 as a recombinant vaccine for SAV (McLoughlin & Graham,
2007). Some additional sequences have been transfected into the rSAV2 and
successfully expressed, highlighting the possible use of SAV as an expression vector for
other applications such as delivering other viral vaccines to salmonids. However this
technology has yet not been exploited for this purpose.
Alphaviruses are known inducers of apoptosis in different tissues in mammals (Griffin
et al., 1994; Griffin & Hardwick, 1997, 1998). SAV induced apoptosis was seen in the
pancreas and heart of diseased fish under H&E staining (Taksdal et al., 2007).
Progressive apoptosis in blood and head kidney leucocytes was recently seen in an in-
vivo study performed in our laboratory. In addition, the present study was able to
characterise apoptosis-mediated cell death in two established cell lines (CHH-1 and
CHSE-214), supporting earlier results. The apoptosis observed in CHH-1 appeared
particularly interesting because of the cardiac origin of these cells, and suggests that
SAV infection is able to induce active killing in the cells of the heart mediated via
apoptosis. However, pro-apoptotic, apoptotic and anti-apoptotic events were
encountered in the microarray experiment performed using samples derived from
experimental infection induced in Atlantic salmon. This highlights the complexity of
cell death in the host itself compared to the cell culture system in which the anti-viral or
212
anti-apoptotic mechanisms are minimal. It would be interesting to investigate the
apoptosis events further to clarify whether it is a consequence of virus replication in the
cell or as a result of host immune response.
This thesis has examined the different aspects of host responses during SAV1 infection
in Atlantic salmon and in cell cultures of salmonid origin, highlighting some key
features of cellular and molecular pathogenesis of SAV infection. In summary, the
induction of SAV infection by injecting cell culture adapted SAV I.P. established an
infection rapidly, and also elicited a potent immune response at a very early stage
during the infection in Atlantic salmon. Interferon appeared to be a key antiviral factor
in response to the SAV infection, and signatures of INF-1 expression were seen in
different tissues of the host during the infection using microarray. Characterisation of
INF-1 mediated antiviral response associated with SAV in this study suggested that
mild pathology observed in the heart and absence of any pathology in skeletal muscle is
possibly a result of clearance of virus at the early stages of infection. The ultrastructural
morphogenesis of SAV appeared to be similar to mammalian alphavirus replication in
cells, and the death of cells in SAV infections appeared to be mediated via apoptosis
during the infection. These results have given an interesting insight into SAV
pathogenesis emphasising the importance of the innate immune response during the
infection. Thus, it would be interesting to explore the innate immune mechanisms
further for the development of effective vaccines and evaluating vaccination and
immunostimulation regimes against SAV1 infections in order to maintain the health
status of the susceptible stocks.
213
References
Abbas, A. K., Lichtman, A. H., & Pober, J. S., (2000). Cellular and molecular
immunology. 4th
edition , W. B. Saunders Company USA..
Acheson, N. & Tamm, I., (1967). Replication of Semliki forest virus: an electron
microscopic study. Virology 32 (128-148).
Acosta, F., Petrie, A., Lockhart, K., Lorenzen, N., & Ellis, A. E., (2005). Kinetics of Mx
expression in rainbow trout (Oncorhynchus mykiss) and Atlantic salmon (Salmo salar
L.) parr in response to VHS-DNA vaccination. Fish & Shellfish Immunology 18 (81-
89).
Adams, A. & Thompson, K. D., (2006). Biotechnology offers revolution to fish health
management. Trends in Biotechnology 24 (201-205).
Adzhubei, A. A., Vlasova, A. V., Hagen-Larsen, H., Ruden, T. A., Laerdahl, J. K., &
Hoyheim, B., (2007). Annotated Expressed Sequence Tags (ESTs) from pre-smolt
Atlantic salmon (Salmo salar) in a searchable data resource. BMC Genomics 8 (209)
Aldrin, M., Storvik, B., Frigessi, A., Vilijugrein, H., & Jansen, P., (2010). A stochastic
model for the assessment of the transmission pathways of heart and skeleton muscle
inflammation, pancreas disease and infectious salmon anaemia in marine fish farms in
Norway. Preventive Veterinary Medicine 93 (51-61).
Alne, H., Chen, Y., Mckillen, D. J., Wu, S., Jenny, M. J., Chapan, R., Gross, P. S.,
Warr, G. W., & Almeida, J. S., (2004). Optimal cDNA microarray design using
expressed sequence tags for organisms with limited genomic information. BMC
Bioinformatics 5 (191).
Alvarez-Pellitero, P., (2008). Fish immunity and parasite infections: from innate
immunity to immunoprophylactic prospects. Veterinary Immunology and
Immunopathology 126 (171-198).
Andersen, L., Bratland, A., Hodneland, K., & Nylund, A., (2007). Tissue tropism of
salmonid alphaviruses (subtypes SAV1 and SAV3) in experimentally challenged
Atlantic salmon (Salmo salar L.). Archives of Virology 152 (1871-1883).
Anonymous, (2003). Manual of diagnostic tests for aquatic animals. 4th
edition, Office
International des Epizooties, Paris, France.
Barber, G. N., (2001). Host defense, virus and apoptosis. Cell Death and Differentiation
8 (113-126).
Barry, G., Breakwell, L., Fragkoudis, R., Attarzadeh-Yazdi, G., Rodriguez-Andres, J.,
Kohl, A., & Fazakerley, J. K., (2009). PKR act early in infection to suppress Semliki
forest virus production and strongly enhances the type I interferon response. Journal of
General Virology 90 (1382-1391).
214
Bell, J. G., Mcvicar, A. H., & Cowey, C. B., (1987). Pyruvate-kinase isozymes in
farmed Atlantic salmon (Salmo salar) - pyruvate-kinase and antioxidant parameters in
pancreas disease. Aquaculture 66 (33-41).
Bergan, V., Jagus, R., Lauksund, S., Kileng, O., & Robertsen, B., (2008). The Atlantic
salmon Z-DNA binding protein kinase phosphorylates translation initiation factor 2
alpha and constitutes a unique orthologue to the mammalian dsRNA-activated protein
kinase R. FEBS Journal 275 (184-97).
Berger, A., Preiser, W., & Doerr, H. W., (2001). The role of viral load determination for
the management of human immunodeficiency virus, hepatitis B virus and hepatitis C
virus infection. Journal of Clinical Virology 20 (23-30).
Bergmann, S. M., Fichtner, D., Riebe, R., & Castric, J., (2008). First isolation and
identification of sleeping disease virus (SDV) in Germany. Bulletin of the European
Association of Fish Pathologists 28 (148-156).
Bick, M. J., Carroll, J. W. N., Gao, G. X., Goff, S. P., Rice, C. M., & MacDonald, M.
R., (2003). Expression of the zinc-finger antiviral protein inhibits alphavirus replication.
Journal of Virology 77 (11555-11562).
Boscher, S. K., McLoughlin, M., Le Ven, A., Cabon, J., Baud, M., & Castric, J., (2006).
Experimental transmission of sleeping disease in one-year-old rainbow trout,
Oncorhynchus mykiss (Walbaum), induced by sleeping disease virus. Journal of Fish
Diseases 29 (263-273).
Boshra, H., Li, J., & Sunyer, J. O., (2006). Recent advances on the complement system
of teleost fish. Fish & Shellfish Immunology 20 (239-262).
Boucher, P., (1995). Sleeping diseases (SD) of salmonids. European Association of Fish
Pathologists 14 (180).
Boucher, P., Raynard, R. S., Houghton, G., & Laurencin, F. B., (1995). Comparative
experimental transmission of pancreas disease in Atlantic salmon, rainbow trout and
brown trout. Diseases of Aquatic Organisms 22 (19-24).
Boucher, P. & Laurencin, F. B., (1996). Sleeping disease and pancreas disease:
Comparative histopathology and acquired cross-protection. Journal of Fish Diseases 19
(303-310).
Boudinot, P., Massin, P., Blanco, M., Riffault, S., & Benmansour, A., (1999). Vig-1, a
new fish gene induced by the rhabdovirus glycoprotein, has a virus-induced homologue
in humans and shares conserved motifs with the MoaA family. Journal of Virology 73
(1846-1852).
Boudinot, P., Salhi, S., Blanco, M., & Benmansour, A., (2001). Viral haemorrhagic
septicaemia virus induces Vig-2, a new interferon responsive gene in rainbow trout.
Fish & Shellfish Immunology 11 (383-397).
Branson, E. J., (2002). Sleeping disease in trout. Veterinary Record 150 (759-760).
215
Bruno, D. W. & Noguera, P. A., (2009). Comparative experimental transmission of
cardiomyopathy syndrome (CMS) in Atlantic salmon Salmo salar. Diseases of Aquatic
Organisms 87 (235-242).
Buckley, C. D., Pilling, D., Lord, J. M., Akbar, A. N., Scheel-Toellner, D., &
Salmon.M., (2001). Fibroblasts regulate the switch from acute resolving to chronic
persistent inflammation. Trends in Immunology 22 (199-204).
Burleson, F. G., Chamber, T. M., & Wiedbrauk, A. (1992). Virology: A laboratory
manual. London: Acedemic Press
Bustin, S. A., (2000). Absolute quantification of mRNA using real-time reverse
transcription polymerase chain reaction assays. Journal of Molecular Endocrinology 25
(169-193).
Bustin, S. A., (2002). Quantification of mRNA using real-time reverse transcription
PCR (RT-PCR): trends and problems. Journal of Molecular Endocrinology 29 (586).
Bustin, S. A., (2005). Real-time, fluorescence-based quantitative PCR: a snapshot of
current procedures and preferences. Expert Review of Molecular Diagnostics 5 (493-
498).
Bustin, S. A. & Mueller, R., (2005). Real-time reverse transcription PCR (qRT-PCR)
and its potential use in clinical diagnosis. Clinical Science 109 (365-379).
Bustin, S. A., Benes, V., Nolan, T., & Pfaffl, M. W., (2005). Quantitative real-time RT-
PCR - a perspective. Journal of Molecular Endocrinology 34 (597-601).
Bustin, S. A., Benes, V., Garson, J. A., Hellemans, J., Huggett, J., Kubista, M., Mueller,
R., Nolan, T., Pfaffl, M. W., Shipley, G. L., Vandesompele, J., & Wittwer, C. T.,
(2009). The MIQE Guidelines: Minimum Information for Publication of Quantitative
Real-Time PCR Experiments. Clinical Chemistry 55 (611-622).
Byon, J. Y., Ohira, T., Hirono, I., & Aoki, T., (2005). Use of a cDNA microarray to
study immunity against viral hemorrhagic septicemia (VHS) in Japanese flounder
(Paralichthys olivaceus) following DNA vaccination. Fish & Shellfish Immunology 18
(135-147).
Cann, A. J., (2005). Principles in molecular virology. 4th
edition , Elsevier London, UK.
Castric, J., Baudin Laurencin, F., Bermont, M., Jeffroy, J., Le Ven, A., & Bearzotti, M.,
(1997). Isolation of the virus reponsible for sleeping disease in experimentally infected
rainbow trout Oncorhynchus mykiss. Bulletin of the European Association of Fish
Pathologists 17 (27-30).
Castro, R., Martin, S. A. M., Bird, S., Lamas, J., & Secombes, C. J., (2008).
Characterisation of gamma-interferon responsive promoters in fish. Molecular
Immunology 45 (3454-3462).
Chen, P., Wu, J., Her, G. H., & Hong, J., (2010). Aquatic birnavirus induces necrotic
cell death via the mitochondria-mediated caspase pathway. Fish & Shellfish
Immunology 28 (344-353).
216
Christie, K. E., Fyrand, K., Holtet, L., & Rowley, H. M., (1998). Isolation of pancreas
disease virus from farmed Atlantic salmon, Salmo salar L., in Norway. Journal of Fish
Diseases 21 (391-394).
Christie, K. E., Graham, D. A., McLoughlin, M. F., Villoing, S., Todd, D., &
Knappskog, D., (2007). Experimental infection of Atlantic salmon Salmo salar pre-
smolts by i.p. injection with new Irish and Norwegian salmonid alphavirus (SAV)
isolates: a comparative study. Diseases of Aquatic Organisms 75 (13-22).
Christoper, T., Dimitri, S., Victor, D., & Choong-Chin, L., (2002). Construction of a
zebrafish cDNA microarray: gene expression profiling of the zebrafish during
development. Biochemical and Biophysical Research Communications 296 (1134-
1142).
Costa, J. Z., Bron, J. E., Thompson, J. Z., Adams, A., Bricknell, I. R., & Ferguson, H.
(2007) Apoptosis detection during a salmon alphavirus (SAV) in-vivo study. 13th
International Conference of European Association of Fish Pathologists, A book of
abstracts, pp76.
Cummings, C. A. & Relman, D. A., (2000). Using DNA microarrays to study host-
microbe interactions. Emerging Infectious Diseases 6 (513-525).
Cunningham, C. O., (2002). Molecular diagnosis of fish and shellfish diseases: present
status and potential use in disease control. Aquaculture 206 (19-55).
Dalmo, R. A., Ingebrigtsen, K., & Bogwald, J., (1997). Non-specific defense
mechanisms in fish, with particular reference to the reticuloendothelial system (RES).
Journal of Fish Diseases 20 (241-273).
Dannevig, B. H., Brudeseth, B., Gjoen, T., Rode, M., Wergeland, H. I., Evensen, O., &
Press, C. M., (1997). Characterization of a long-term cell line (SHK-1) developed from
the head kidney of Atlantic salmon (Salmo salar L.). Fish and Shellfish Immunology 7
(226).
Das, B. K., Nayak, K. K., Fourrier, M., Collet, B., Snow, M., & Ellis, A. E., (2007).
Expression of Mx protein in tissues of Atlantic salmon post-smolts - An
immunohistochemical study. Fish & Shellfish Immunology 23 (1209-1217).
Das, B. K., Urquhart, K., Ellis, A. E., & Collet, B., (2008). Induction of Mx protein in
Atlantic cod with poly I:C : Immunocross reactive studies of antibodies to Atlantic
salmon Mx with Atlantic cod. Fish & Shellfish Immunology 25 (321-324).
Das, B. K., Ellis, A. E., & Collet, B., (2009). Induction and persistence of Mx protein in
tissues, blood and plasma of Atlantic salmon parr, Salmo salar, injected with poly I:C.
Fish & Shellfish Immunology 26 (40-48).
de Lamballerie, X., Ninove, L., & Charrel, R. N., (2009). Antiviral Treatment of
Chikungunya Virus Infection. Infectious Disorders - Drug Targets 9 (101-104).
Desvignes, L., Quentel, C., Lamour, F., & Le Ven, A., (2002). Pathogenesis and
immune response in Atlantic salmon (Salmo salar L.) parr experimentally infected with
salmon pancreas disease virus (SPDV). Fish & Shellfish Immunology 12 (77-95).
217
DeTulleo, L. & Kirchhausen, T., (1998). The clathrin endocytic pathway in viral
infection. The EMBO Journal 17 (4585-4593).
DeWitte-Orr, S. J., Sutton, L. P., & Bols, N. C., (2005). Preferential induction of
apoptosis in the rainbow trout macrophage cell line, RTS11, by actinomycin D,
cyclohexamide and double stranded RNA. Fish & Shellfish Immunology 18 (279-295).
Dini, L., Coppola, S., Ruzittu, M. T., & Ghibelli, L., (1996). Multiple pathways for
apoptotic nuclear fragmentation. Experimental Cell Research 233 (340-347).
Douglas, S. E., (2006). Microarray studies of gene expression in fish. OMICS-A Journal
of Integrative Biology 10 (474-489).
Douglas, S. E., Knickle, L. C., Kimball, J., & Reith, M. E., (2007). Comprehensive EST
analysis of Atlantic halibut (Hippoglossus hippoglossus), a commercially relevant
aquaculture species. BMC Genomics 8 (144.).
Ellis, A. E., (2001). Innate host defense mechanisms of fish against viruses and bacteria.
Developmental and Comparative Immunology 25 (827-839).
Everette, H. & McFadden, G., (1999). Apoptosis: an innate immune response to virus
infection. Trends in Microbiology 7 (160-165).
Fackler, O. T. & Grosse, R., (2008). Cell motility through plasma membrane blebbing.
Journal of Cell Biology 181 (879-884).
FAO. (2008). The state of the world fisheries and aquaculture. Fisheries and
Aquaculture Department, Food and Agriculture Organization of the United Nations.
Rome, Italy.
Faquet, C. M., Mayo, M. A., Maniloff, J., Desselberger, U., & Ball.L.A., (2005). Virus
Taxonomy: VIIIth
Report of the International committee on taxonomy of viruses.
Elsevier, London , UK.
Ferguson, H. W., Rice, D. A., & Lynas, J. K., (1986a). Clinical pathology of
myodegeneration (pancreas disease) in Atlantic salmon (Salmo salar). Veterinary
Record 119 (297-299).
Ferguson, H. W., Roberts, R. J., Richards, R. H., Collins, R. O., & Rice, D. A., (1986b).
Severe degenerative cardiomyopathy associated with pancreas disease in Atlantic
salmon, Salmo salar L. Journal of Fish Diseases 9 (95-98).
Ferguson, H. W., Poppe, T., & Speare, D. J., (1990). Cardiyomayopathy in farmed
Norwegian salmon. Diseases of Aquatic Organisms 8 (225-231).
Ferguson, H. W., Kongtorp, R. T., Taksdal, T., Graham, D., & Falk, K., (2005). An
outbreak of disease resembling heart and skeletal muscle inflammation in Scottish
farmed salmon, Salmo salar L., with observations on myocardial regeneration. Journal
of Fish Diseases 28 (119-123).
218
Ferguson, H. W. (2006). Systemic pathology of fish; a text and atlas of normal tissue in
teleosts and their response in disease. 2nd
edition, Scotian press, Windsor Avenue,
London.
Firth, A. E., Chung, B. Y., Fleeton, M. N. & Atkins, J. F. (2008) Discovery of
frameshifting in Alphavirus 6K resolves a 20-year enigma. Virology Journal 5 (108)
Fischer, U., Utke, K., Somamoto, T., Kollner, B., Ototake, M., & Nakanishi, T., (2006).
Cytotoxic activities of fish leucocytes. Fish & Shellfish Immunology 20 (209-226).
Forsell, K., Xian, L., Kozlovaska, T., Cheng, H., & Garoff, H., (2000). Membrane
proteins organize a symmetrical virus. EMBO Journal 19 (5071-5081).
Frankfurt, O. & Krishan, A., (2001). Identification of Apoptotic Cells by Formamide-
induced DNA Denaturation in Condensed Chromatin. Journal of Histochemistry and
Cytochemistry 49 (369-378).
Fringuelli, E., Rowley, H. M., Wilson, J. C., Hunter, R., Rodger, H., & Graham, D. A.,
(2008). Phylogenetic analyses and molecular epidemiology of European salmonid
alphaviruses (SAV) based on partial E2 and nsP3 gene nucleotide sequences. Journal of
Fish Diseases 31 (811-823).
Fritsvold, C., Alarcon, M., Johansen, R., Rode, M., Nilsen, P., Jørgensen, J. B.,
Kongtorp, R. T., Breck, O., Taksdal, T., Heum, M., & Poppe, T. T., (2009)
Cardiomyopathy syndrome (CMS) in Atlantic salmon (Salmo salar L.) challenge
models and pathogenesis studies. 14th
International Conference of European Association
of Fish Pathologists, A book of abstracts, pp329.
Frolov, I. & Schlesinger, S., (2009). Comparison of the effect of Sindibis virus and
Sindibis virus replicons on host cell protein synthesis and cytopathogenicity in BHK
cells. Journal of Virology 68 (1721-1727).
Fronhoffs, S., Totzke, G., Stier, S., Wernert, N., Rothe, M., Bruning, T., Koch, B.,
Sachinidis, A., Vetter, H., & Ko, Y., (2002). A method for the rapid construction of
cRNA standard curves in quantitative real-time reverse transcription polymerase chain
reaction. Molecular and Cellular Probes 16 (99-110).
Froshauer, S., Davidson, S., Hoover-Litty, H., & Helenius, A., (1988a). The cell biology
of early cytoplasmic events of alphavirus RNA replication. Journal of Cell Biology 107
(134).
Froshauer, S., Kartenbeck, J., & Helenius, A., (1988b). Alphavirus RNA replicase is
located on the cytoplasmic surface of endosomes and lysosomes. Journal of Cell
Biology 107 (2075-2086).
Froshauer, S., Kartenbeck, J., Stukenbrok, H., Bolzau, E., & Helenius, A., (1988c). The
lysosomal membrane is the site of alphavirus replication. Journal of Cellular
Biochemistry Supplement pp33.
Fryer, R. J. & Lannan, C. N., (1994). Three decades of fish cell culture: A current
listing of cell lines derived from fish. Journal of Tissue Culture Methods 16 (87-94).
219
Gahlawat, S. K., Ellis, A. E., & Collet, B., (2009). Expression of interferon and
interferon - Induced genes in Atlantic salmon Salmo salar cell lines SHK-1 and TO
following infection with salmon alphavirus SAV. Fish & Shellfish Immunology 26
(672-675).
Garoff, H., Simons, K., & Renkonen, O., (1978). Assembly of the Semliki forest virus
membrane glycoprotein in the membrane of the endoplasmic reticulum. Journal of
Molecular Biology 124 (587-600).
Garoff, H., Wilschut, J., Liljestrom, P., Wahlberg, J. M., Bron, R., Suomalainen, M.,
Smyth, J., Salminen, A., Barth, B. U., & Zhao, H., (1994). Assembly and entry
mechanisms of Semliki Forest virus. Archives of Virology Supplement 9 (329-338).
Garoff, H., Sjoberg, M., & Cheng, R. H., (2004). Budding of alphaviruses. Virus
Research 106 (103-116).
Gilsbach, R., Kouta, M., Bönisch, H., & Brüss, M., (2006). Comparison of in vitro and
in vivo reence genes for internal standardization of real time PCR data. BioTechniques
40 (173-177).
Glasgow, G. M., Mcgee, M. M., Tarbatt, C. J., Mooney, D. A., Sheahan, B. J., &
Atkins, G. J., (1998). The Semliki Forest virus vector induces p53-independent
apoptosis. Journal of General Virology 79 (2405-2410).
Goetz, F. W. & MacKenzie, S., (2008). Functional genomics with microarrays in fish
biology and fisheries. Fish and Fisheries 9 (378-395).
Govoroun, M., Le Gac, F., & Guiguen, Y., (2006). Generation of a large scale repertoire
of Expressed Sequence Tags (ESTs) from normalised rainbow trout cDNA libraries.
BMC Genomics 7 (196).
Gozlan, R. E., Peeler, E. J., Longshaw, M., St-Hilaire, S., & Feisr, S. W., (2006). Effect
of microbial pathogens on the diversity of aquatic populations, notably in Europe.
Microbes and Infection 8 (1358-1364).
Gracey, A. Y. & Cossins, A. R., (2003). Application of microarray technology in
environmental and comparative physiology. Annual Review of Physiology 65 (231-259).
Graham, D. A., Jewhurst, V. A., Rowley, H. M., McLoughlin, M. F., & Todd, D.,
(2003a). A rapid immunoperoxidase-based virus neutralization assay for salmonid
alphavirus used for a serological survey in Northern Ireland. Journal of Fish Diseases
26 (407-413).
Graham, D. A., Rowley, H. M., Walker, I. W., Weston, J. H., Branson, E. J., & Todd,
D., (2003b). First isolation of sleeping disease virus from rainbow trout, Oncorhynchus
mykiss (Walbaum), in the United Kingdom. Journal of Fish Diseases 26 (691-694).
Graham, D. A., Jewhurst, V. A., Rowley, H. M., McLoughlin, M. F., Rodger, H., &
Todd, D., (2005). Longitudinal serological surveys of Atlantic salmon, Salmo salar L.,
using a rapid immunoperoxidase-based neutralization assay for salmonid alphavirus.
Journal of Fish Diseases 28 (373-379).
220
Graham, D. A., Jewhurst, H., McLoughlin, M. F., Sourd, P., Rowley, H. M., Taylor, C.,
& Todd, D., (2006a). Sub-clinical infection of farmed Atlantic salmon Salmo salar with
salmonid alphavirus - a prospective longitudinal study. Diseases of Aquatic Organisms
72 (193-199).
Graham, D. A., Taylor, C., Rodgers, D., Weston, J., Khalili, M., Ball, N., Christie, K.
E., & Todd, D., (2006b). Development and evaluation of a one-step real-time reverse
transcription polymerase chain reaction assay for the detection of salmonid alphaviruses
in serum and tissues. Diseases of Aquatic Organisms 70 (47-54).
Graham, D. A., Jewhurst, H. L., McLoughlin, M. F., Branson, E. J., McKenzie, K.,
Rowley, H. M., & Todd, D., (2007a). Serological, virological and histopathological
study of an outbreak of sleeping disease in farmed rainbow trout Oncorhynchus mykiss.
Diseases of Aquatic Organisms 74 (191-197).
Graham, D. A., Rowley, H. M., Fringuelli, E., Bovo, G., Manfrin, A., McLoughlin, M.
F., Zarza, C., Khalili, M., & Todd, D., (2007b). First laboratory confirmation of
salmonid alphavirus infection in Italy and Spain. Journal of Fish Diseases 30 (569-
572).
Graham, D. A., Wilson, C., Jewhurst, H., & Rowley, H., (2008). Cultural characteristics
of salmonid alphaviruses - influence of cell line and temperature. Journal of Fish
Diseases 31 (859-868).
Graham, D. A., Fringuelli, E., Rowley, H., Brown, A. G., & Cockerill, D., (2009).
Sequence analysis of SAV strains in Scottish Atlantic salmon marine production. 14th
International Conference of European Association of Fish Pathologists, A book of
abstracts, pp198.
Graham, D., Fringuelli, E., Wilson, C., Rowley, H., Brown, A. G., Rodger, H.,
McLoughlin, M., McManus, C., Casey, E., McCathy, L. J., & Ruane, N. M., (2010).
Prospective longitudinal studies of salmonid alphavirus infections on two Atlantic
salmon farms in Ireland; evidence for viral persistence. Journal of Fish Diseases 33
(123-135).
Graham, S. & Secombes, C. J., (1988). The production of a macrophage-activating
factor from rainbow trout Salmo gairdneri leukocytes. Immunology 65 (293-297).
Grant, A. N., Brown, A. G., & Laidler, L. A., (1994). Plasma lipase concentration as an
aid to the early detection of pancreas disease in farmed Atlantic Salmon (Salmo salar).
Veterinary Record 135 (107-108).
Granzow, H., Weiland, F., Fichtner, D., & Enzmann. P.J., (1995). Studies of the
ultrastructure and morphogenesis of fish pathogenic viruses grown in cell culture.
Journal of Fish Diseases 20 (1-10).
Griffin, D. E., (2005). Neuronal cell death in alphavirus encephalomyelitis. Role of
Apoptosis in Infection 289 (57-77).
Griffin, D. E., Levine, B., Ubol, S., & Hardwick, J. M., (1994). The Effects of
Alphavirus Infection on Neurons. Annals of Neurology 35 (S23-S27).
221
Griffin, D. E. & Hardwick, J. M., (1997). Regulators of apoptosis on the road to
persistent alphavirus infection. Annual Review of Microbiology 51 (565-592).
Griffin, D. E. & Hardwick, J. M., (1998). Apoptosis in alphavirus encephalitis.
Seminars in Virology 8 (481-489).
Grimholt, U., Drablos, F., Jorgensen, S. M., Hoyheim, B., & Stet, R. J. M., (2002). The
major histocompatibility class I locus in Atlantic salmon (Salmo salar L.):
polymorphism, linkage analysis and protein modelling. Immunogenetics 54 (570-581).
Grimley, P. M., Berezesky, I. K., & Friedman, R. M., (1968). Cytoplasmic structures
associated with an arbovirus infection:Loci of viral ribonucleic acid synthesis. Journal
of Virology 2 (326-338).
Groff, H., Hewson, R., & Opstelten, D., (1998). Virus maturation by budding.
Microbiology and Molecular Biology Reviews 62 (1171-1190).
Haller, O., Stertz, S., & Kochs, G., (2007a). The Mx GTPase family of interferon-
induced antiviral proteins. Microbes and Infection 9 (1636-1643).
Haller, O., Staeheli P., & Kochs, G., (2007b). Interferon-induced Mx proteins in
antiviral host defense. Biochimie 89 (812-818).
Hardwick, J. M., (2001). Apoptosis in viral pathogenesis. Cell Death and
Differentiation 8 (109-110).
Hay, S. & Kannourakis, G., (2002). A time to kill: viral manipulation of the cell death
program. Journal of General Virology 83 (1547-1564).
Helenius, A., (1995). Alphavirus and flavivirus glycoproteins - structures and functions.
Cell 81 (651-653).
Helenius, A., Kartenbeck, J., Simons, K., & Fries, E., (1980). On the entry of Simliki
forest virus into BHK-1 cells. Journal of Cell Biology 84 (404-420).
Helenius, A., Kielian, M., Wellsteed, J., Mellman, I., & Rudnick, G., (1985). Effects of
monovalent cations on Semiliki forest virus entry into BHK-21 cells. The Journal of
Biological Chemistry 260 (5691-5697).
Helenius, A., Kielian, M., Mellman, I., & Schmid, S., (1988). In Entry of enveloped
viruses into their host cells. in.Helenius A. R. W. andOldstone M. B. A., ed. Symposia on
Molecular and Cellular Biology New Series University of California-Los Angele, .Cell
Biology of Virus Entry, Replication, and Pathogenesis; Taos, New Mexico, USA
(pp145-162).
Herath, T., Costa, J., Thompson, K., Adams, A., & Richards, R., (2009). Alternative cell
lines for the isolation of salmonid alphavirus-1. Icelandic Agricultural Sciences 22 (19-
27).
Hierholzer, J., Killngton, R. A., & Stockes, A., (1996). Virus Isolation and
quantification. Academic Press Limited, London, UK.
222
Hodneland, K., Bratland, A., Christie, K. E., Endresen, C., & Nylund, A., (2005). New
subtype of salmonid alphavirus (SAV), Togaviridae, from Atlantic salmon Salmo salar
and rainbow trout Oncorhynchus mykiss in Norway. Diseases of Aquatic Organisms 66
(113-120).
Hodneland, K. & Endresen, C., (2006). Sensitive and specific detection of Salmonid
alphavirus using real-time PCR (TaqMan®
). Journal of Virological Methods 131 (184-
192).
Hogstad, I. M., (1993). Diseases in Atlantic salmon during the first six months in sea
water: field observations 1985-1992. Norsk Veterinaertidsskrift 105 (1199-1205).
Hong, J., Lin, T., Hus, Y., & Wu, J., (1998). Apoptosis precedes necrosis of fish cell
lines with infectious pancreatic necrosis virus infection. Virology 250 (76-84).
Hong, E. M., Perera, R., & Kuhn, R., (2006). Alphavirus capsid protein helix I controls
a checkpoint in nucleocapsid core assembly. Journal of Virology 80 (8848-8855).
Houghton, G., (1994). Acquired protection in Atlantic salmon Salmo salar parr and
post-smolts against pancreas disease. Diseases of Aquatic Organisms 18 (109-118).
Houghton, G., (1995). Kinetics of infection of plasma, blood leukocytes and lymphoid-
tissue from Atlantic salmon Salmo salar experimentally infected with pancreas disease
84. Diseases of Aquatic Organisms 22 (193-198).
Houghton, G. & Ellis, A. E., (1996). Pancreas disease in Atlantic salmon: serum
neutralisation and passive immunisation. Fish & Shellfish Immunology 6 (465-472).
Huggett, J., Dheda, K., Bustin, S. A., & Zumala., (2005). Real-time RT-PCR
normalization: statergies and consideration. Genes and Immunity 1-6).
Jensen, I. & Robertsen, B., (2000). The effect of interferon and Mx protein on infection
of Atlantic salmon cells by infectious salmon anaemia virus (ISAV). Developmental
and Comparative Immunology 24 (S3-S4).
Jensen, I., Albuqueque, A., Sommer, A. I., & Robertsen, B., (2002). Effect of poly I:C
on the expression of Mx proteins and resistance against infection by infectious salmon
anaemia virus in Atlantic salmon. Fish & Shellfish Immunology 13 (311-326).
Jensen, I. & Robertsen, B., (2002). Effect of double-stranded RNA and interferon on the
antiviral activity of Atlantic salmon cells against infectious salmon anemia virus and
infectious pancreatic necrosis virus. Fish & Shellfish Immunology 13 (221-241).
Jewhurst, V. A., Todd, D., Rowley, H. M., Walker, I. W., Weston, J. H., McLoughlin,
M. F., & Graham, D. A., (2004). Detection and antigenic characterization of salmonid
alphavirus isolates from sera obtained from farmed Atlantic salmon, Salmo salar L., and
farmed rainbow trout, Oncorhynchus mykiss Walbaum. Journal of Fish Diseases 27
(143-149).
Johnston, C., Jiang, W. X., Chu, T., & Levine, B., (2001). Identification of genes
involved in the host response to neurovirulent alphavirus infection. Journal of Virology
75 (10431-10445).
223
Jorgensen, S. M., Lyng-Syvertsen, B., Lukacs, M., Grimholt, U., & Gjoen, T., (2006).
Expression of MHC class I pathway genes in response to infectious salmon anaemia
virus in Atlantic salmon (Salmo salar L.) cells. Fish & Shellfish Immunology 21 (548-
560).
Jorgensen, S. M., Hetland, D. L., Press, C. M., Grimholt, U., & Gjoen, T., (2007).
Effect of early infectious salmon anaemia virus (ISAV) infection on expression of MHC
pathway genes and type I and II interferon in Atlantic salmon (Salmo salar L.) tissues.
Fish & Shellfish Immunology 23 (576-588).
Jorgensen, S. M., Afanasyev, S., & Krasnov, A., (2008). Gene expression analyses in
Atlantic salmon challenged with infectious salmon anemia virus reveal differences
between individuals with early, intermediate and late mortality. BMC Genomics 9 (179).
Joseph, T., Cepica, A., Brown, L., Ikede, B., & Kibenge, F. S. B., (2004). Mechanism of
cell death during infectious salmon anemia virus infection is cell type-specific. Journal
of General Virology 85 (3027-3036).
Jung, K. & Chae, C., (2006). Expression of Mx protein and interferon-alpha in pigs
experimentally infected with swine influenza virus. Veterinary Pathology 43 (161-167).
Kaattari, S. L., (1994). Development of a piscine paradigm of immunological memory.
Fish & Shellfish Immunology 4 (447-457).
Karlsen, M., Hodneland, K., Endresen, C., & Nylund, A., (2006). Genetic stability
within the Norwegian subtype of salmonid alphavirus (family Togaviridae). Archives of
Virology 151 (861-874).
Karlsen, M., Villoing, S., Rimstad, E., & Nylund, A., (2009). Characterization of
untranslated region of the salmonid alphavirus 3 (SAV3) genome and construction of a
SAV3 based replicon. Virology Journal 6 (173).
Kent, M. L. & Elston, R. A., (1987). Pancreas disease in pen-reared Atlantic salmon in
North America. Bulletin of the European Association of Fish Pathologists 7 (29-31).
Kibenge, F. S. B., Whyte, S. K., Hammell, K. L., Rainnie, D., Kibenge, M. T., &
Martin, C. K., (2000). A dual infection of infectious salmon anaemia (ISA) virus and a
togavirus-like virus in ISA of Atlantic salmon Salmo salar in New Brunswick, Canada
Diseases of Aquatic Organisms 42 (11-15).
Kileng, O., Brundtland, M. I., & Robertsen, B., (2007). Infectious salmon anemia virus
is a powerful inducer of key genes of the type I interferon system of Atlantic salmon,
but is not inhibited by interferon. Fish & Shellfish Immunology 23 (378-389).
Kim, K. H., Rumenapf, T., Strauss, E. G., & Strauss, J. H., (2004). Regulation of
Semliki Forest virus RNA replication: a model for the control of alphavirus
pathogenesis in invertebrate hosts. Virology 323 (153-163).
Kjoglum, S., Larsen, S., Bakke, H. G., & Grimholt, U., (2006). How specific MHC
class I and class II combinations affect disease resistance against infectious salmon
anaemia in Atlantic salmon (Salmo salar). Fish & Shellfish Immunology 21 (431-441).
224
Klimstra, W. B. & Ryman, K. D., (2009).Togaviruses, in Brasier, A. R., García-Sastre,
A., and Lemon, S. M. (ed) Cellular signaling and innate immune responses to RNA
virus infection. A.M.S press, Washington D.C. USA (353-372).
Kongtorp, R. T., Kjerstad, A., Taksdal, T., Guttvik, A., & Falk, K., (2004a). Heart and
skeletal muscle inflammation in Atlantic salmon, Salmo salar L.: A new infectious
disease. Journal of Fish Diseases 27 (351-358).
Kongtorp, R. T., Taksdal, T., & Lyngoy, A., (2004b). Pathology of heart and skeletal
muscle inflammation (HSMI) in farmed Atlantic salmon Salmo salar. Diseases of
Aquatic Organisms 59 (217-224).
Kongtorp, R. T. & Taksdal, T., (2009). Studies with experimental transmission of heart
and skeletal muscle inflammation in Atlantic salmon, Salmo salar L. Journal of Fish
Diseases 32 (253-262).
Korth, M. J. & Katze, M. G., (2002). Unlocking the mysteries of virus-host interactions
- Does functional genomics hold the key? Immune Responses and Vaccines 975 (160-
168).
Krasnov, A., Koskinen, H., Afanasyev, S., & Molsa, H., (2005). Transcribed Tcl-like
transposons in salmonid fish. BMC Genomics 6 (107).
Kujala, P., Ikaheimonen, A., Ehsani, N., Vihinen, H., Auvinen, P., & Kaariainen, L.,
(2001). Biogenesis of the Semliki Forest virus RNA replication complex. Journal of
Virology 75 (3873-3884).
Landis, H., Simon-Jodicke, A., Kloti, A., Di Paolo, C., Schnorr, J., Schneider-Schaulies,
S., Hefti, P., & Pavlovic, J., (1998). Human MxA protein confers resistance to Simliki
forest virus and inhibits the amplification of a Simliki forest virus-based replication in
the absence of viral structural protein. Journal of Virology 72 (1516-1522).
Lannan, C. N., Winton, J. R., & Fryer, R. J., (1984). Fish cell lines: establishment and
characterization of nine cell lines from salmonids. In Vitro 20 (671).
Lee J. & Burckart, G. J., (1998). Nuclear factor kappa B: important transcription factor
and theraputic target. Theraputic Review 38 (993).
Lee, S. & Vidal, S. M., (2002). Funtional diversity of Mx proteins: variations on a
theme of host resistance to infection. Genome Research (527-530).
Leong, J. C., Torbridge, G. D., Kim, C. H., Johnson, M., & Simon, B., (1998).
Interferon-inducible Mx proteins in fish. Immunological Reviews 166 (346-363).
Levin, B., Hardwick, JM., Trapp, B. D., Crawford, T., Bollinger, R. C., & Griffin, D.
E., (1991). Antibody-mediated clearance of alphavirus infection from neurons. Science
254 (856-860).
Linn, M. L., Gardner, J., Warrilow, D., Darnell, G. A., McMahon, C. R., Field, I., Hyatt,
A. D., Slade, R. W., & Suhrbier, A., (2001). Arbovirus of marine mammals: a new
alphavirus isolated from the elephant seal louse, Lepidophthirus macrorhini. Journal of
Virology 75 (4103-4109).
225
Linn, M. L., Eble, J. A., Lubken, C., Slade, R. W., Heino, J., Davies, J., & Suhrbier, A.,
(2005). An arthritogenic alphavirus uses the α1β1 integrin collagen receptor. Virology
336 (229-239).
Liu, Y. & Sumalia, U. R., (2007). Can farmed salmon production keep growing?
Marine Policy 32 (497-501).
Liu, Z., Li, R. W., & Waldbieser, G. C., (2008). Utilization of microarray technology
for functional genomics in ictalurid catfish. Journal of Fish Biology 72 (2377-2390).
Lundstrom, K., (2009). Alpha virus gene therapy. Viruses 1 (25).
Mackay, I. M., Arden, K. E., & Nitsche, A., (2002). Real-time PCR in virology. Nucleic
Acids Research 30 (1292-1305).
MacKenzie, S., Bardolet, T. L., & Balasch, J. C. (2004). Fish health challenge after
stress. Indicators of immunocompetence. Contributions to Science 2 (443-454).
MacKenzie, S., Stertz, S., Reichelt, M., Krijnse-Locker, J., MacKenzie, J. C., Simpson,
O., Haller, O., & Kochs, G., (2006). Interferon-induced, antiviral human MxA protein
localizes to a distinct sub-compartment of the smooth endoplasmic reticulum. Journal
of Interferon and Cytokine Research 25 (650-660).
Magliano, D., Marshall, J. A., Bowden, D. S., Vardaxis, N., Meanger, J., & Lee, J. Y.,
(1998). Rubella virus replication complexes are virus-modified lysosomes. Virology 240
(57-63).
Magnadóttir, B., (2006). Innate immunity of fish. Fish & Shellfish Immunology 20 (137-
151).
Marsh, M., Griffiths, G., Dean, G., Mellman, I., & Helenius, A., (1986). Three-
dimensional structure of endosomes in BHK-21 cells. Cell Biology 83 (2899-2903).
Martin, S. A. M., Blaney, S. C., Houlihan, D. F., & Secombes, C. J., (2006).
Transcriptome response following administration of a live bacterial vaccine in Atlantic
salmon (Salmo salar). Molecular Immunology 43 (1900-1911).
Martin, S. A. M., Taggart, J. B., Seear, P., Bron, J. E., Talbot, R., Teale, A. J., Sweeney,
G. E., Hoyheim, B., Houlihan, D. F., Tocher, D. R., Zou, J., & Secombes, C. J., (2007).
Interferon type I and type II responses in an Atlantic salmon (Salmo salar) SHK-1 cell
line by the salmon TRAITS/SGP microarray. Physiological Genomics 32 (33-44).
Martin, S. A. M., Collet, B., MacKenzie, S., Evensen, O., & Secombes, C. J., (2008).
Genomic tools for examining immune gene function in salmonid fish. Reviews in
Fisheries Science 16 (112-118).
McBeath A. J. A., Snow, M., Secombes, C. J., Ellis, A. T., & Collet, B., (2007).
Expression kinetics of interferon and interferon-induced genes in Atlantic salmon
(Salmo salar) following infection with infectious pancreatic necrosis virus and
infectious salmon anaemia virus. Fish & Shellfish Immunology 22 (241-247).
226
McLauchlan, P. E., Collet, B., Ingerslev, E., Secombes, C., Lorenzen, N., & Ellis, A. E.,
(2003). DNA vaccination against viral haemorrhagic septicaemia (VHS) in rainbow
trout: size, dose, route of injection and duration of protection-early protection correlates
with Mx expression. Fish & Shellfish Immunology 15 (39-50).
McLoughlin, M., Nelson, R., McCormick, J., I, & Rowley, H., (1995). Pathology of
experimental pancreas disease in freshwater Atlantic salmon parr. Journal of Aquatic
Animal Health 7 (104-110).
McLoughlin, M. F., Nelson, R. T., Rowley, H. M., Cox, D. I., & Grant, A. N., (1996).
Experimental pancreas disease in Atlantic salmon Salmo salar post-smolts induced by
salmon pancreas disease virus (SPDV). Diseases of Aquatic Organisms 26 (117-124).
McLoughlin, M. F., Nelson, R. T., Rowley, H. M., Cox, D. I., & Grant, A. N., (1997).
The development of an experimental model of pancreas disease in Atlantic salmon
(Salmo salar) post-smolts. Fish Vaccinology 90 (467).
McLoughlin, M. F., Rowley, H. M., & Doherty, C. E., (1998). A serological survey of
salmon pancreas disease virus (SPDV) antibodies in farmed Atlantic salmon, Salmo
salar L. Journal of Fish Diseases 21 (305-307).
McLoughlin, M., Nelson, R., McCormick, J., I, Rowley, H., & Bryson, D. G., (2002).
Clinical and histopathological features of naturally occurring pancreas diseases in
farmed Atlantic salmon (Salmo salar L). Journal of Fish Diseases 25 (33-43).
McLoughlin, M., Graham, D. A., Norris, A., Matthews, D., Foyle, L., Rowley, H.,
Jewhurst, H., MacPhee, J., & Todd, D., (2006). Virological, serological and
histopathological evaluation of fish strain susceptibility to experimental infection with
salmonid alphavirus. Diseases of Aquatic Organisms 72 (125-133).
McLoughlin, M. F. & Graham, D. A., (2007). Alphavirus infections in salmonids - a
review. Journal of Fish Diseases 30 (511-531).
McVicar, A. H., (1987). Pancreas disease of farmed Atlantic salmon, Salmo salar, in
Scotland - epidemiology and early pathology. Aquaculture 67 (71-78).
McVicar, A. H., (1990). Infection as a primary cause of pancrease disease in farmed
Atlantic salmon. European Association of Fish Pathologists 10 (84-87).
Medigeshi, G. R., Hirsch, A. J., Streblow, D. N., Nikolich-Zugich, J., & Nelson, J. A.,
(2008). West nile virus entry requires cholesterol-rich membrane microdomains and is
independent of alpha v beta 3 integrin. Journal of Virology 82 (5212-5219).
Miller K.M. & Maclean., (2008). Teleost microarrays: development in a broad
phylogenetic range reflecting diverse application. Journal of Fish Biology 72 (2039-
2050).
Miller, K., Traxler, G., Kaukinen, K., Li, S., Richard, J., & Ginther, N., (2007).
Salmonid host response to infectious hematopoietic necrosis (IHN) virus: cellular
receptors, viral control, and novel pathways of defense. Aquaculture 272 (S217-S237).
227
Miwa, S. & Sanao, M., (2007). Morphogensis of koi herpesvirus observed by electron
microscopy. Journal of Fish Diseases 30 (715-722).
Moody, C. E., Serreze, D. V., & Reno, P. W., (1985). Non-specific cytotoxic activity of
teleost leukocytes. Developmental and Comparative Immunology 9 (51-64).
Morgan, V. W., Howe, C., & Rose, H., (1960). Structure and development of viruses as
observed in the electron microscope. The journal of experimental medicine 113 (234).
Moriette, C., LeBerre, M., Lamoureux, A., Lai, T. L., & Bremont, M., (2006). Recovery
of a recombinant Salmonid alphavirus fully attenuated and protective for rainbow trout.
Journal of Virology 80 (4088-4098).
Mukhopadhyay, S., Kuhn, R. J., & Rossmann, M. G., (2005). A structural perspective
of the Flavivirus life cycle. Nature Reviews Microbiology 3 (13-22).
Mukhopadhyay, S., Chipman, P. R., Eunmee, M., Kuhn, R., & Rossmann, G., (2010).
In vitro assembled alphavirus core-like particles maintain a structure similar to that of
nucleocapsid cores in mature virus. Journal of Virology 76 (11128-11132).
Munir, K. & Kibenge, F. S. B., (2004). Detection of infectious salmon anaemia virus by
real-time RT-PCR. Journal of Virological Methods 117 (37-47).
Munro, A. L. S., Ellis, A. E., Mcvicar, A. H., Mclay, H. A., & Needham, E. A., (1984).
An exocrine pancreas disease of farmed Atlantic salmon in Scotland. Helgolander
Meeresuntersuchungen 37 (571-586).
Murphy, T. M., Rodger, H. D., Drinan, E. M., Gannon, F., Kruse, P., & Korting, W.,
(1992). The sequential pathology of pancreas disease in Atlantic salmon farms in
Ireland. Journal of Fish Diseases 15 (401-408).
Murphy, T., Drinan, E., & Gannon, F., (1995). Studies with an experimental model for
pancreas disease of Atlantic salmon Salmo salar L. Aquaculture Research 26 (861-864).
Murray, A. & Peeler, E. J., (2004). A framework for understanding the potential for
emerging diseases in aquaculture. Preventive Veterinary Medicine 67 (223-235).
Murray, A. & Kilburn, R., (2009). Update on pancreas disease in Scotland. Presented at
9th Tri-Nation Pancreas Disease Seminar, University of Stirling, UK.
Müller, B. D. J., Fackler, O. T., Dittmat, M. T., Zenrgraf, H., & Kräusslich, H., (2004).
Construction and characterization of a fluorescently labeled infectious human
immunodeficiency virus type 1 derivative. Journal of Virology 78 (10803-10813).
Nelson, R. T., McLoughlin, M. F., Rowley, H. M., Platten, M. A., & Mccormick, J. I.,
(1995). Isolation of a Toga-like virus from farmed Atlantic salmon Salmo salar with
pancreas disease. Diseases of Aquatic Organisms 22 (25-32).
Ng, S. H. S., Artieri, C. G., Bosdet, I. E., Chiu, R., Danzmann, R. G., Davidson, W. S.,
Ferguson, M. M., Fjell, C. D., Hoyheim, B., Jones, S. J. M., de Jong, P. J., Koop, B. F.,
Krzywinski, M. I., Lubieniecki, K., Marra, M. A., Mitchell, L. A., Mathewson, C.,
Osoegawa, K., Parisotto, S. E., Phillips, R. B., Rise, M. L., von Schalburg, K. R.,
228
Schein, J. E., Shin, H. S., Siddiqui, A., Thorsen, J., Wye, N., Yang, G., & Zhu, B. L.,
(2005). A physical map of the genome of Atlantic salmon, Salmo salar. Genomics 86
(396-404)
Ng, C. G., Coppens, I., Govindarajan, D., Pisciotta, J., Shulaev, V., & Griffin, D. E.,
(2008). Effect of host cell lipid metabolism on alphavirus replication, virion
morphogenesis, and infectivity. Proceedings of the National Academy of Sciences of the
USA 105 (16326-16331).
.
Nicola, A. V., Chen, W., & Helenius, A., (1999). Co-translational folding of an
alphavirus capsid protein in the cytosol of living cells. Nature Cell Biology 1 (341-345).
Niesters, H. G. M., (2001). Quantification of viral load using real-time amplification
techniques. Methods 25 (419-429).
Novoa, R. R., Calderita, G., Arranz, R., Fontana, J., Granzow, H., & Risco, C., (2005).
Virus factories: association of cell organelles for viral replication and morphogenesis.
Biology of Cell 97 (147-172).
O'Brien., (1998). Viruses and apoptosis. Journal of General Virology 79 (1833-1845).
Pavlidis, P., (2003). Using ANOVA for gene selection from microarray studies of the
nervous system. Methods 31 (282-289).
Peranen, J. & Kaariainen, L., (1991). Biogenesis of type I cytopathic vacuoles in
Semliki forest virus-infected BHK cells. Journal of Virology 65 (1623-1627).
Perera, R., Khaliq, M., & Kuhn, R. J., (2008). Closing the door on flaviviruses: entry as
a target for antiviral drug design. Antiviral Research 80 (11-22).
Petterson, E., Sandberg, M., & Santi, N., (2009). Salmonid alphavirus associated with
Lepeophtheirus salmonis (Copepoda: Caligidae) from Atlantic salmon, Salmo salar L.
Journal of Fish Diseases 32 (477-479).
Pfaffl, M. W., (2001). A new mathematical model for relative quantification in real-time
RT-PCR. Nucleic Acids Research 29 (e45).
Pfaffl, M. W., (2006). Relative quantification, in Dorak, T. (ed) Real Time PCR, BIOS
Advanced Methods. pp63-82.
Pfaffl, M. W. & Hageleit, M., (2001). Validities of mRNA quantification using
recombinant RNA and recombinant DNA external calibration curves in real-time RT-
PCR. Biotechnology Letters 23 (275-282).
Pfaffl, M. W., Horgan, G. W., & Dempfle, L., (2002). Relative expression software tool
(REST©
) for group-wise comparison and statistical analysis of relative expression
results in real-time PCR. Nucleic Acids Research 30 (e36).
Pfaffl, M. W., Tichopad, A., Prgomet, C., & Neuvians, T. P., (2004). Determination of
stable housekeeping genes, differentially regulated target genes and sample integrity:
229
BestKeeper - Excel-based tool using pair-wise correlations. Biotechnology Letters 26
(509-515).
Philstrom, L. & Bengten, E., (1996). Immunoglobulin in fish-genes, expression and
structure. Fish & Shellfish Immunology 6 (243-262).
Pläsier, B., Lloyd, D. R., Paul, G. C., THomas, C. R., & Al-Rubeai, M., (1999).
Automatic image analysis for quantification of apoptosis in animal cell culture by
annexine-V affinity assay. Journal of Immunological Methods 229 (81-95).
Plouffe, D. A., Hanington, P. C., Walsh, J. G., Wilson, E. C., & Belosevic, M., (2005).
Comparison of select innate immune mechanisms of fish and mammals.
Xenotransplantation 12 (266-277).
Pohjala, L., Barni, V., Azhayev, A., Lapinjoki, S., & Ahola, T., (2008). A luciferase-
based screening method for inhibitors of alphavirus replication applied to nucleoside
analog. Antiviral Research 78 (215-222).
Poppe, T., Rimstad, E., & Hyllseth, B., (1989). Pancreas disease of Atlantic salmon
(salmo salar L.) post-smolt infected with infectious pancreatic necrosis virus (IPNV).
Bulletin of the European Association of Fish Pathologists 9 (83).
Powers, A. M., Brault, A. C., Shirako, Y., Strauss, E. G., Kang, W. L., Strauss, J. H., &
Weaver, S. C., (2001). Evolutionary relationships and systematics of the alphaviruses.
Journal of Virology 75 (10118-10131).
Preiser, W., Elzinger, B., & Brink, N. C., (2000). Quantitative molecular virology in
patient management. Journal of Clinical Pathology 53 (83).
Press, C. M. & Evensen, Ø., (1999). The morphology of immune system in teleost fish.
Fish & Shellfish Immunology 9 (309-318).
Pringle, G. M., Houlihan, D. F., Callanan, K. R., Mitchell, A. I., Raynard, R. S., &
Houghton, G. H., (1992). Digestive enzyme levels and histopathology of pancreas
disease in farmed Atlantic salmon (Salmo salar). Comparative Biochemistry and
Physiology A-Physiology 102 (759-768).
Purcell, M. K., Smith, K. D., Hood, L., Winton, J., & Roach, J. C., (2006). Conservation
of Toll-like receptor signaling pathways in teleost fish. Comparative Biochemistry and
Physiology part D Genomics proteomics 1 (77-88).
Purcell, M. K., Laing, K. J., Woodson, J. C., Thorgassrd, G. H., & Hansen, J. D.,
(2009). Characterization of the interferon genes in homozygous rainbow trout reveals
two novel genes, alternate splicing and differential regulation of duplicated genes. Fish
& Shellfish Immunology 26 (293-304).
Qi, R., Zang, L., & Chi, C., (2008). Biological characteristics of dengue virus and
potential targets for drug design. Acta Biochimica Biophysica Sinica 40 (91-101).
Randelli, E., Buonocore, F., & Scapigliati, G., (2008). Cell markers and determinants in
fish immunology. Fish & Shellfish Immunology 25 (326-340).
230
Raymen, K. D. & Klimstra, W. B., (2008). Host response to alphavirus infection.
Immunological Reviews 225 (27-45).
Raynard, R. S., Mcvicar, A. H., Bell, J. G., Youngson, A., Knox, D., & Fraser, C. O.,
(1991). Nutritional aspects of pancreas disease of Atlantic salmon - the effects of dietary
Vitamin-E and polyunsaturated fatty-Acids. Comparative Biochemistry and Physiology
A-Physiology 98 (125-131).
Raynard, R. S. & Houghton, G., (1993). Development towards an experimental protocol
for the transmission of pancreas disease of Atlantic salmon Salmo salar. Diseases of
Aquatic Organisms 15 (123-128).
Reite, O. B. & Evensen, Ø., (2006). Inflammatory cells of teleostean fish: A review
focusing on mast cells/eosinophilic granule cells and rodlet cells. Fish & Shellfish
Immunology 20 (192-208).
Riezebos-Brilman, A., Mare, A., Bungener, L., Huckriede, A., Wilschut, J., & Daemen,
T., (2005). Recombinant alphaviruses as vectors for anti-tumour and anti-microbial
immunotherapy. Journal of Clinical Virology 35 (233-243).
Rise, M. L., Jones, S. R. M., Brown, G. D., von Schalburg, K. R., Davidson, W. S., &
Koop, B. F., (2004). Microarray analyses identify molecular biomarkers of Atlantic
salmon macrophage and hematopoietic kidney response to Piscirickettsia salmonis
infection. Physiological Genomics 20 (21-35).
Rise, M. L., von Schalburg, K. R., Brown, G. D., Mawer, M. A., Devlin, R. H., Kuipers,
N., Busby, M., Beetz-Sargent, M., Alberto, R., Gibbs, A. R., Hunt, P., Shukin, R.,
Zeznik, J. A., Nelson, C., Jones, S. R. M., Smailus, D. E., Jones, S. J. M., Schein, J. E.,
Marra, M. A., Butterfield, Y. S. N., Stott, J. M., Ng, S. H. S., Davidson, W. S., & Koop,
B. F., (2006). Development and application of a salmonid EST database and cDNA
microarray: Data mining and interspecific hybridization characteristics. Genome
research 14 (478-490).
Roberts, R. J., (2003). Fish Pathology. 3rd
edition , WB. Saunders, USA.
Roberts, R. J. & Pearson, M. D., (2005). Infectious pancreatic necrosis in Atlantic
salmon, Salmo salar L. Journal of Fish Diseases 28 (383-390).
Robertsen, B., (2006). The interferon system of teleost fish. Fish & Shellfish
Immunology 20 (172-191).
Robertsen, B., (2008). Expression of interferon and interferon-induced genes in
salmonids in response to virus infection, interferon-inducing compounds and
vaccination. Fish & Shellfish Immunology 25 (351-357).
Robertsen, B., Bergan, V., Rokenes, T., Larsen, R., & Albuquerque, A., (2003). Atlantic
salmon interferon genes: Cloning, sequence analysis, expression, and biological activity
161. Journal of Interferon and Cytokine Research 23 (601-612).
Rodger, H. D., (1991). Summer lesion syndrome in salmon - A retrospective study.
Veterinary Record 129 (237-239).
231
Rodger, H. D., Murphy, T. M., Drinan, E. M., & Rice, D. A., (1991). Acute skeletal
myopathy in farmed Atlantic salmon Salmo Salar. Diseases of Aquatic Organisms 12
(17-23).
Rodger, H. D., Turnbull, T., & Richards, R. H., (1994). Myopathy and pancreas disease
in salmon - A retrospective study in Scotland. Veterinary Record 135 (234-235).
Rodger, H. D., Murphy, K., Drinan, E. M., & Kennedy, G., (1995). Apparent lack of
response of salmon affected by pancreas disease to pancreatic-enzyme replacement
therapy. Veterinary Record 136 (489-491).
Rodger, H. & Turnbull, T., (2000). Cardiomyopathy syndrome in farmed Scottish
salmon. Veterinary Record 146 (500-501).
Rodger, H. & Mitchell, S., (2007). Epidemiological observations of pancreas disease of
farmed Atlantic salmon, Salmo salar L., in Ireland. Journal of Fish Diseases 30 (157-
167).
Rokenes, T. P., Larsen, R., & Robertsen, B., (2007). Atlantic salmon ISG15: Expression
and conjugation to cellular proteins in response to interferon, double-stranded RNA and
virus infections. Molecular Immunology 44 (950-959).
Ryman, K. D. & Klimstra, W. B., (2008). Host responses to alphavirus infection.
Immunological Reviews 225 (27-45).
Schelesinger, A. & Dubenskey, T. W., (1999). Alphavirus vector for gene expression
and vaccine. Current Opinion in Biotechnology 10 (434-439).
Schena, M., Shalon, D., Davis, R. W., & Brown, P. O., (1995). Quantitative monitoring
of gene expression pattern with complementary DNA microarray. Science 270 (467-
470).
Schroder, K., Hertzog, P. J., Ravasi, T., & Hume, D., (2004). Interferon -gamma: an
overview of signals, mechanisms, and functions. Journal of Leukocyte Biology 75 (163-
189).
Schulze, A. & Downward, J., (2001). Navigating gene expression using microarray- a
technology review. Nature Cell Biology 3 (E190-E195).
Schwartz, M., Chen, J., Lee, W., Janda, M., & Ahiquist, P., (2004). Alternate, virus-
induced membrane re-arrangements support positive-strand RNA virus genome
replication. PNAS 101 (11263-11268).
Secombes, C. J. & Fletcher, T. C., (1992). The role of phagocytes in the protective
mechanisms of fish. Annual Review of Fih Diseases 2 (53-71).
Secombes, C. & Zou, J., (2005). Adaptive immunity in teleosts: cellular immunity.
Developmental Biologicals 121 (25-32).
Segura-Totten, M. & Wilson, K. L., (2004). BAF: roles in chromatin, nuclear structure
and retrovirus integration. Trends in Cell Biology 14 (261-266).
232
Sen, G. C., (2001). Viruses and interferons. Annual Review of Microbiology 55 (255-
281).
Singh, I. & Helenius, A., (1992). Role of ribosomes in similiki forest virus nucleocapsid
uncoating. Journal of Virology 66 (7049-7058).
Slauson, D. O. & Cooper, B. J. (2002). Mechanisms of diseases, a text book of
comparative general pathology. 3rd
edition , Mosby Inc, Missouri, USA..
Solem, S. T. & Stenvik, J., (2006). Antibody repertoire development in teleosts-a
review with emphasis on salmonids and Gadus moruha L. Developmental and
Comparative Immunology 30 (57-76).
Söderlund, H., (1973). Kinetics of formation of the Semliki forest virus nucleocapsid.
Intervirology 1 (354-361).
Starkey, W. G., Smail, D. A., Bleie, H., Muir, K. F., Ireland, J. H., & Richards, R. H.,
(2006). Detection of infectious salmon anaemia virus by real-time nucleic acid sequence
based amplification. Diseases of Aquatic Organisms 72 (107-113).
Strauss, J. H. & Strauss, E. G., (1994). The alphaviruses - gene-expression, replication,
and evolution. Microbiological Reviews 58 (491-562).
Sunyer, J. O., Boshra, H., Lorenzo, G., Parra, D., Freedman, B., & Bosch, N., (2003).
Evolution of complement as an effector system in innate and adaptive immunity.
Immunologic Research 27 (549-564).
Sunyer, O., Zang, Y., Parr, D., & LaPatra, S., (2009). Is IgT the evolutionary equivalent
of IgA? Insights into its structure and function. The Journal of Immunology 181 (81.21).
Suomalainen, M., Liljestrom, P., & Garoff, H., (1992). Spike protein-nucleocapsid
interaction drive the budding of alpahavirus. Journal of Virology 66 (4737-4747).
Susuki, T. & Susuki, Y., (2006). Virus infection and lipid raft. Biological &
Pharmaceutical Bulletin 29 (1538-1541).
Taggart, J. B., Bron, J. E., Martin, S. A. M., Seear, P. J., Hoyheim, B., Talbot, R.,
Carmichael, S. N., Villeneuve, L. A. N., Sweeney, G. E., Houlihan, D. F., Secombes, C.
J., Tocher, D. R., & Teale, A. J., (2008). A description of the origins, design and
performance of the TRAITS-SGP Atlantic salmon Salmo salar L. cDNA microarray.
Journal of Fish Biology 72 (2071-2094).
Takle, H., McLeod, A., & Andersen, Ø., (2006). Cloning and characterization of of the
executioner caspase 3, 6, 7 and Hsp70 in hyperthermic Atlantic salmon (Salmo salar)
embryos. Comparative Biochemical Physiology B144 (188-198).
Takle, H. & Andersen, Ø., (2007). Caspase and apoptosis in fish: Review paper.
Journal of Fish Biology 71 (326-349).
Taksdal, T., Olsen, A. B., Bjerkas, I., Hjortaas, M. J., Dannevig, B. H., Graham, D. A.,
& McLoughlin, M. F., (2007). Pancreas disease in farmed Atlantic salmon, Salmo salar
233
L., and rainbow trout, Oncorhynchus mykiss (Walbaum), in Norway. Journal of Fish
Diseases 30 (545-558).
Taylor, L. A., Carthy, C. M., Yang, D. C., Saad, K., Wong, D., Schreiner, G., Stanton,
L. W., & McManus, B. M., (2008). Host gene regulation during coxsackievirus B3
infection in mice - Assessment by microarrays. Circulation Research 87 (328-334).
Todd, D., Jewhurst, V. A., Welsh, M. D., Borghmans, B. J., Weston, J. H., Rowley, H.
M., Mackie, D. P., & McLoughlin, M. F., (2001). Production and characterisation of
monoclonal antibodies to salmon pancreas disease virus. Diseases of Aquatic
Organisms 46 (101-108).
Tort, L., Padros, F., Rotllant, J., & Crespo, S., (1998). Winter syndrome in the gilthead
sea bream Sparus aurata. Immunological and histopathological features. Fish &
Shellfish Immunology 8 (37-47).
Trot, L., Balasch, S., & MacKenzie, S., (2003). Fish immune system. A crossroads
between innate and adaptive responses. Revisión 22 (277-286).
Valasek, M. & Repa, J., (2005). The power of real-time PCR. Advances in
Physiological Eduation 29 (151-159).
Viljugrein, H., Staalstrøm, A., Molvær, J., Urke, H. A., & Jansen, P. A., (2009).
Integration of hydrodynamics into a statistical model on the spread of pancreas disease
(PD) in salmon farming. Diseases of Aquatic Organisms 88 (35-44).
Villoing, S., Bearzotti, M., Chilmonczyk, S., Castric, J., & Bremont, M., (2000a).
Rainbow trout sleeping disease virus is an atypical alphavirus. Journal of Virology 74
(173-183).
Villoing, S., Castric, J., Jeffroy, J., Le Ven, A., Thiery, R., & Bremont, M., (2000b). An
RT-PCR-based method for the diagnosis of the sleeping disease virus in experimentally
and naturally infected salmonids. Diseases of Aquatic Organisms 40 (19-27).
von Schalburg, K. R., Rise, M. L., Cooper, G. A., Brown, G. D., Gibbs, A. R., Nelson,
C. C., Davidson, W. S., & Koop, B. F., (2005). Fish and chips: Various methodologies
demonstrate utility of a 16,006-gene salmonid microarray. BMC Genomics 6 (126).
Vonderheit, A. & Helenius, A., (2005). Rab7 associates with early endosomes to
mediate sorting and transport of Semiliki forst virus to late endosome. PLoS Biology 3
(1225-1233).
Waarts, B., Bittman, R., & Wilschut, J., (2002). Sphingolipid and cholesterol
dependence of alphavirus membrane fusion; lack of correlation with lipid raft formation
in target liposomes. The Journal of Biological Chemistry 277 (38141-38147).
Waheed, A. D. & Freed, E. O., (2007). Influenza virus not cRAFTy enough to dodge
viperin. Cell Host and Microbe 2 (71-72).
Walker, J. A. & Quirke, P., (2001). Viewing apoptosis through 'TUNEL'. Journal of
Pathology 195 (275-276).
234
Watts, M., Munday, B. L., & Burke, C. M., (2001). Immune responses of teleost fish.
Australian Veterinary Journal 79 (570-574).
Weaver, S. C., Brault, A. C., Kang, W., & Holland, J. J., (1999). Genetic and fitness
changes accompanying adaptation of an arbovirus to vertebrate and invertebrate cells.
Journal of Virology 73 (4316-4326).
Welsh, M., Weston, J., Borghmans, B. J., Mackie, D., Rowley, H., Nelson, R.,
McLoughlin, M., & Todd, D., (2000). Biochemical characterization of salmon pancreas
disease virus. Journal of General Virology 81 (813-820).
Wengler, G., Koschinski, A., Wengler, G., & Dreyer, F., (2003). Entry of alphaviruses
at the plasma membrane converts the viral surface proteins into an ion-permeable pore
that can be detected by electrophysiological analyses of whole-cell membrane currents.
Journal of General Virology 84 (173-181).
Weston, J. H., Welsh, M. D., McLoughlin, M. F., & Todd, D., (1999). Salmon pancreas
disease virus, an alphavirus infecting farmed Atlantic salmon, Salmo salar L. Virology
256 (188-195).
Weston, J., Villoing, S., Bremont, M., Castric, J., Pfeffer, M., Jewhurst, V.,
McLoughlin, M., Rodseth, O., Christie, K. E., Koumans, J., & Todd, D., (2002).
Comparison of two aquatic alphaviruses, salmon pancreas disease virus and sleeping
disease virus, by using genome sequence analysis, monoclonal reactivity, and cross-
infection. Journal of Virology 76 (6155-6163).
Wheatley, S. B., Goodall, E. A., Menzies, F. D., & McLoughlin, M. F., (1994). An
epidemiologic investigation of diseases of farmed Atlantic salmon - preliminary
findings. Society for Veterinary Epidemiology and Preventive Medicine: Proceedings
pp85.
White, E., (1996). Life, death, and pursuit of apoptosis. Gene and development 10 (1-
15).
Whyte, S. K., (2007). The innate immune response of finfish – a review of current
knowledge. Fish & Shellfish Immunology 23 (1127-1151).
Wolf, K. (1988). Fish Viruses and fish viral diseases. Cornell University Press Cornell,
USA.
Workenhe, S. T., Wadowska, D. W., Wright, G. M., Kibenge, M. J. T., & Kibenge, F.
S. B., (2007). Demonstration of infectious salmon anaemia virus (ISAV) endocytosis in
erythrocytes of Atlantic salmon. Virology Journal 4 (13).
Workenhe, S. T., Kibenge, M. J. T., Iwamoto, T., & Kibenge, F. S. B., (2008a).
Absolute quantitation of infectious salmon anaemia virus using different real-time
reverse transcription PCR chemistries. Journal of Virological Methods 154 (128-134).
Workenhe, S. T., Kibenge, M. J. T., Wright, G. M., Wadowska, D. W., Groman, D. B.,
& Kibenge, F. S. B., (2008b). Infectious salmon anaemia virus replication and induction
of alpha interferon in Atlantic salmon erythrocytes. Virology Journal 5 (36).
235
Workenhe, S. T., Hori, T. S., Rise, M. L., Kibenge, M. J. T., & Kibenge, F. S. B.,
(2009). Infectious salmon anaemia virus (ISAV) isolates induce distinct gene expression
responses in the Atlantic salmon (Salmo salar) macrophage/dendritic-like cell line TO,
assessed using genomic techniques. Moecular immunology Immunol 46 (2955-2974).
Yano, T. The non-specific immune system:humoral defense (1996), in Iwama, G and
Nakanishi, T., (The fish immune system, organism, pathogen and environment,
Academic press, London.
Young, N. D., Cooper, G. A., Nowak, B. F., Koop, B. F., & Morrison, R. N., (2008).
Coordinated down-regulation of the antigen processing machinery in the gills of
amoebic gill disease-affected Atlantic salmon (Salmo salar L.). Molecular Immunology
45 (2581-2597).
Zhang, Y. G., Burke, C. W., Rayman, K. D., & Klimstra, W. B., (2007). Identification
and characterization of interferon-induced proteins that inhibit alphavirus replication.
Journal of Virology 81 (11246-11255).
Zou, J., Carrington, A., Collet, B., Dijkstra, J. M., Yoshiura, Y., Bols, N., & Secombes,
C., (2005). Identification and bioactivities of IFN-gamma in rainbow trout
Oncorhynchus mykiss: The first Th1-type cytokine characterized functionally in fish.
Journal of Immunology 175 (2484-2494).
236
Appendix
General Buffers
Phosphate buffered saline, pH 7.4 (PBS) NaH2PO4 (VWR) 0.438g
Na2HPO4 (VWR) 1.28g
Sodium chloride 4.385g
Dissolve in 400ml distilled water, pH to 7.4 make up to 500ml and autoclave.
Tris buffered saline (TBS), pH 7.6 Trisma base 1.21g
Sodium chloride 14.62g
Dissolve in 400ml distilled water, pH to 7.2-7.6 and make up to 500ml.
Stains
Mayer’s Haematoxylin Haematoxylin 2g
Sodium iodate 0.4g
Potassium alum 100g
Citric acid 2g
Chloral hydrate 100g
Distilled water 2L
Allow haematoxylin, potassium alum and sodium iodate to dissolve in distilled water
overnight. Add chloral hydrate and citric acid and boil for 5 min.
Eosin 1% Eosin 40ml
Putt‟s Eosin 80ml
Eosin yellowish 20g
Pre-dissolve in 600ml distilled water and then make up to 2L.
Putt’s Eosin Eosin yellowish 4g
Potassium dichromate 2g
Saturated aqueous picric acid 40ml
Absolute alcohol 40ml
Distilled water 320ml
Dissolve eosin and potassium dichromate in the ethanol, add the water and then the
picric acid.
Scott’s tap water substitute Sodium bicarbonate 3.5g
Magnesium sulphate 20g
Tap water 1L
Dissolve by heating if necessary and add a few thymol crystals to preserve.
237
Hoechst 33342 dye and staining
Hochest 33342( Fluka, Biochemia cat 14933) 100mg
Stock 1: Dilute 100 mg of Hoechst 33342 (Sigma B2261) in 2 ml of distilled water. The
concentration of this solution is 50 mg/ml. Store at 4 C.
Stock 2: On the day of use, dilute 2 µl of Stock 1 solution in 10 ml of PBS containing 1
mg/ml polyvinylpyrrolidone. The concentration is 10 µg/ml.
Working Solution: Dilute 100 µl of the Stock 2 solution in 900 µl of PBS-PVP for a
final concentration of 1 µg/ml. (all solutions are made in light-proof tubes - wrapping in
aluminium foil is sufficient)
Fixatives
10% Neutral buffered saline (10% NBF) Sodium dihydrogen phosphate (monohydrate; VWR) 4g
Disodium hydrogen phosphate (anhydrous; VWR) 6.5g
Formaldehyde (Sigma) 100ml
distilled water make up to 1 litre
Carnoy’s fixative for cells Methanol 30 ml
Glacial acetic acid 90 ml
Add fixative direct onto the existing media of the cells ( 0.5 ml/ 1.5ml tissue culture
media)and remove caerefully with the media after 2 min and follow another 2 x 5 min
fixations with fresh Carnoy media (0.5 ml).
Molecular Biology
TAE buffer (x50) Tris base 242g
Glacial acetic acid 57.1 ml
Na2EDTA.H2O 81.61 g
Adjust the final volume to 1000 ml and pH 8.5
Agarose gel
Agarose 1g
TAE 100ml
Dissolve in the microwave. Add 50 l ethidium bromide (1 mg/l) when the gel
temperature < 60C.
Related Documents