CDM-SSC-PDD (version 02) CDM – Executive Board page 1 CLEAN DEVELOPMENT MECHANISM SIMPLIFIED PROJECT DESIGN DOCUMENT FOR SMALL-SCALE PROJECT ACTIVITIES (SSC-CDM-PDD) Version 02 CONTENTS A. General description of the small-scale project activity B. Baseline methodology C. Duration of the project activity / Crediting period D. Monitoring methodology and plan E. Calculation of GHG emission reductions by sources F. Environmental impacts G. Stakeholders comments Annexes Annex 1: Information on participants in the project activity Annex 2: Information regarding public funding Annex 3: Baseline information Annex 4: Abbreviations Annex 5: Minutes of Stakeholders meeting

Welcome message from author
This document is posted to help you gain knowledge. Please leave a comment to let me know what you think about it! Share it to your friends and learn new things together.
Transcript
CDM-SSC-PDD (version 02) CDM ndash Executive Board page 1
CLEAN DEVELOPMENT MECHANISM
SIMPLIFIED PROJECT DESIGN DOCUMENT FOR SMALL-SCALE PROJECT ACTIVITIES (SSC-CDM-PDD)
Version 02
CONTENTS
A General description of the small-scale project activity B Baseline methodology C Duration of the project activity Crediting period D Monitoring methodology and plan E Calculation of GHG emission reductions by sources F Environmental impacts G Stakeholders comments Annexes Annex 1 Information on participants in the project activity Annex 2 Information regarding public funding Annex 3 Baseline information
Annex 4 Abbreviations
Annex 5 Minutes of Stakeholders meeting
CDM-SSC-PDD (version 02) CDM ndash Executive Board page 2
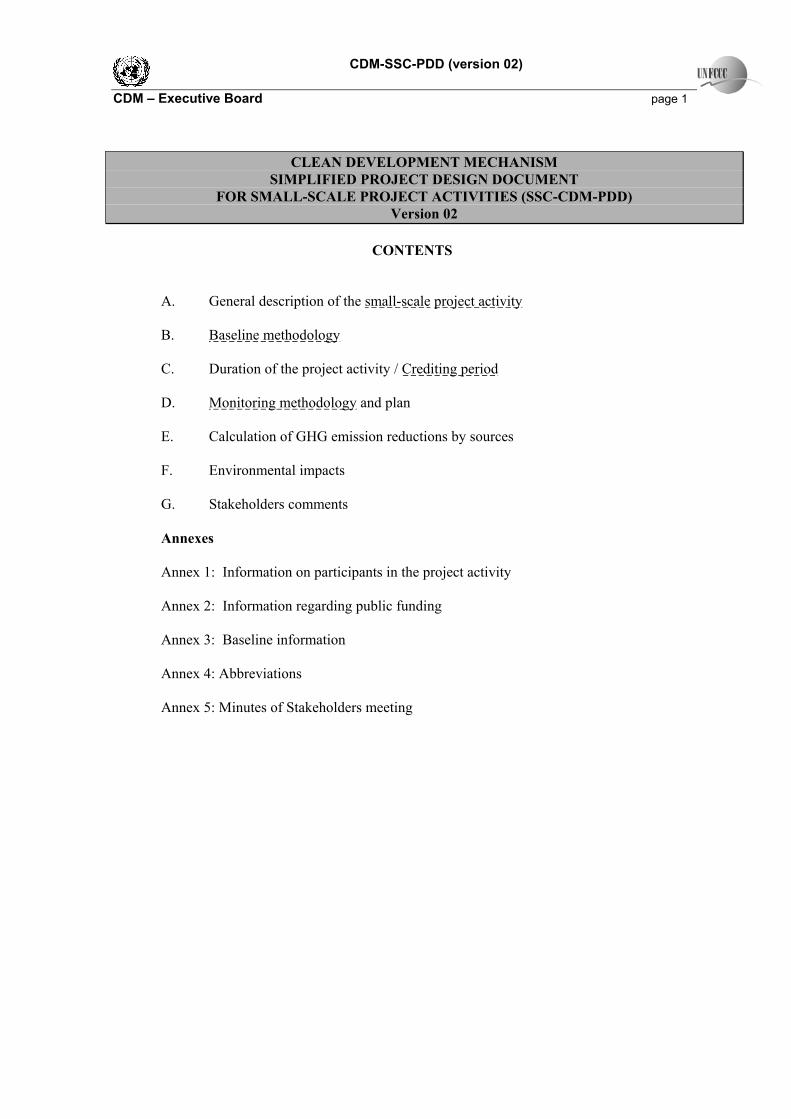
Revision history of this document
Version Number
Date Description and reason of revision
01 21 January 2003
Initial adoption
02 8 July 2005 bull The Board agreed to revise the CDM SSC PDD to reflect guidance and clarifications provided by the Board since version 01 of this document
bull As a consequence the guidelines for completing CDM SSC PDD have been revised accordingly to version 2 The latest version can be found at lthttpcdmunfcccintReferenceDocumentsgt
CDM-SSC-PDD (version 02) CDM ndash Executive Board page 3 SECTION A General description of the small-scale project activity A1 Title of the small-scale project activity gtgt 10 MW biomass based Renewable energy generation for the grid in Parbhani District of Maharashtra India A2 Description of the small-scale project activity gtgt The proposed small scale project activity will utilise surplus biomass residues ie crop residues available locally to generate electricity for a grid system owned by the state owned power utility Maharashtra State Electricity Board (MSEB) looking after electricity generation transmission and distribution The location of the project was selected after due consideration of availability of biomass availability of water power evacuation facilities etc Parbhani District has abundance availability of biomass (crop residues) resources which were not being properly managed due to poor understanding of their energy value and importance for development of the rural economy Hence the project proponents decided to tap the potential for power generation and contribute to the rural development as well as climate change mitigation The proposed project activity will generate power through sustainable means without causing any negative impact on the environment and export the generated electricity to the 3311 kV Pangari substation owned by MSEB which is at a distance of 5 km from the project site The whole process supports in climate change mitigation as it leads to emission reduction of 425247 tonnes of CO2 eq over the crediting period of 10 years The implementation of the project activity would bring in the following local benefits
bull Economic utilization of surplus biomass bull Generation of additional income to the rural farmers due to purchase of surplus crop residues
from them bull Climate change mitigation through renewable energy generation and reducing the demand for
fossil fuel based power bull Contributing to the national electricity capacity through additional power generation bull Creation of indirect employment for rural youth for collection and transportation of biomass for
the project bull Contribution to the availability of stable power in the local area
View of project participant about the project activityrsquos contribution to Sustainable Development Ministry of Environment and Forests (MoEF) Government of India has stipulated the following indicators for sustainable development in the interim approval guidelines for CDM projects
1 Social well-being 2 Economic-well being 3 Environmental well being and 4 Technological-well being
CDM-SSC-PDD (version 02) CDM ndash Executive Board page 4 The project activity contributes to the above indicators in the following manner
Social well being The proposed 10 MW biomass based power project caters jobs for number of persons in the rural area in various sectors like construction of the plant biomass collection processing biomass transportation of biomass as well as in the operation of the power plant Apart from the direct employment generation proposed project also encourages indirect employment by setting up other agro industries due to sufficient power supply from the proposed project Commercial value to agricultural residues will encourage the farmers to collect biomass from fields and effectively utilize the barren and uncultivable lands for energy plantations which will improve the income levels of the farmers The proposed project will engage both genders in construction of the project biomass collection biomass processing etc during operation lifetime of the project and this will lead to increase in Gender Equity and prevents social disparities Economic well being The proposed project will bring in additional capital investment and indirectly supports creation of local infrastructure like roads schools and other basic civic amenities The project acts as a nucleus for other economic activities such as setting up of cottage industries shops hotels etc around the area contributing to the economic development around the project area The proposed biomass plant will help local farmers in earning extra money by selling crop residues there by helping them to improve their economic standards The proposed biomass based power generating plant facilitates the availability of continuous and sustained power to the local industries and agricultural farmers located in remote areas there by avoiding the load shedding and low frequency of power Environmental well being The proposed project activity utilises biomass potential available for power generation which otherwise is dominated by fossil fuels such as coal lignite and gas the project will not result in increase of GHG emissions and cause no negative impact on the environment The project generates real measurable and long-term emissions reductions The project utilizes surplus biomass residues and thereby reduces fossil fuels The project conserves local resources reduce pressure on the local environment to a great extent provide improved health and other environmental benefits Technological well being The CDM project activity should leads to increase in utilization of biomass resources for power generation and contributes to the energy security in the country The above benefits due to the project activity ensure that the project would contribute to the sustainable development of the region
CDM-SSC-PDD (version 02) CDM ndash Executive Board page 5 A3 Project participants gtgt
Name of the party involved ((Host) indicates a host party)
Private andor public entity (ies) project participants
Whether party involved wishes to be considered as project
participant
India (Host)
Private Entity MSM Energy Limited
Hyderabad
No
A4 Technical description of the small-scale project activity gtgt A41 Location of the small-scale project activity gtgt A411 Host Party(ies) gtgt India A412 RegionStateProvince etc gtgt Maharashtra A413 CityTownCommunity etc gtgt District Parbhani Taluk Parbhani Village Borawand A414 Detail of physical location including information allowing the unique identification of this small-scale project activity(ies) gtgt The proposed project is located in Borawand Village Parbhani Taluk amp District of Maharashtra The site premise which is accessible only by road is located at a distance of 15 kms from Parbhani the district head quarters The nearest railway station is at Parbhani and the nearest seaport is at Mumbai The location address of the project is furnished below Ms MSM Energy Limited 10 MW Biomass based Power Project (Parbhani) Gut No 128 129 Borawand Village Parbhani Tehsil Parbhani District Maharashtra State India Physical location of the project is marked in the maps below
CDM-SSC-PDD (version 02) CDM ndash Executive Board page 6
Map Location of Maharashtra state (Marked in yellow) in India
Map Location of Parbhani district in Maharashtra state
Location of Parbhani district
CDM-SSC-PDD (version 02) CDM ndash Executive Board page 7
Map location of 10 MW Biomass project in Parbhani district
A42 Type and category(ies) and technology of the small-scale project activity gtgt According to the Appendix B to the simplified modalities and procedures for small-scale CDM project activities the proposed project activity fall under the following type and category Project type Type I - Renewable Energy project Category ID - Renewable Electricity Generation for a grid (version 9 dated 28 July 06) Since the capacity of the proposed CDM project is only 10 MW which is well below the qualifying capacity of 15 MW the project activity can be regarded as a small scale CDM project activity and UNFCCC indicative simplified modalities and procedures can be applied Since the maximum electricity generating capacity is limited by its design and construction there is no possibility of exceeding the limits of small-scale CDM project activities during the crediting period and the project activity will remain as a small scale project activity Technology The project is designed to generate electricity for grid system using multi-fuels The basic technology is Rankine cycle route where direct combustion of biomass materials takes place through the multi-fuel fired boiler to generate high pressure and high temperature steam which drives an impulse turbine generator set
Location of 10 MW Biomass project
CDM-SSC-PDD (version 02) CDM ndash Executive Board page 8 The plant and machinery of the project consists of one number traveling grate boiler one number steam turbine generator set power evacuation system and fuel handling system etc Other plant equipment include fuel conveyors ash handling system water treatment plant compressed air plant etc The capacity of the turbo generator is 10 MW which generates electricity at 3311 kV level It is anticipated that the plant can operate at about 70 in the first year and 80 plant load factor (PLF) from second year onwards Average annual estimate of power export to the grid system is 5519 GWh for first year and 6307 GWh for the subsequent years Table 1 Technical details of Biomass power plant Boiler Type Travelling Grate Bi-drum Boiler capacity (100 load) Steam Flow rate 50 tons hour Steam pressure at super heater outlet 66 ata Steam temperature at super heater outlet 490oC Water requirement 67 m3 hour Turbo Generator Type Double bleed cum condensing Steam pressure at the TG inlet 64 ata Steam temperature at the TG inlet 480oC Generator Voltage 11 kV Frequency 50 Hz Power factor 08 RPM 1500 Condenser type Surface condenser Water cooled Power evacuation Grid Voltage 33 kV MSEB Sub station Pangari 3311 kV Energy production Gross power 10 MW Auxiliary consumption (10) 10 MW Net power for export 90 MW Auxiliaries Fuel handling Series of belt conveyors Demineralization plant capacity 25 m3 hour Bottom ash handling Belt conveyors Fly ash handling Pneumatic conveying system Cooling tower RCC counter flow 2750 m3 hour No technology transfer is envisaged for the proposed CDM project activity A43 Brief explanation of how the anthropogenic emissions of anthropogenic greenhouse gas (GHGs) by sources are to be reduced by the proposed small-scale project activity including why the emission reductions would not occur in the absence of the proposed small-scale project activity taking into account national andor sectoral policies and circumstances gtgt Project activity and baseline scenario
CDM-SSC-PDD (version 02) CDM ndash Executive Board page 9 The project activity is setting up a 10 MW biomass based power plant The project activity will supply its power to the western grid of India leading to the displacement of Carbon intensive electricity by generation of electricity from a renewable energy source Implementation of the project activity is scheduled for completion by December 2007 The project activity will start generating emission reductions from January 2008 The baseline scenario in the absence of project activity continues to be highly carbon intensive and emission reductions generated by the project activity are additional The associated emission reductions are calculated based on the net amount of electricity fed into the grid and the weighted average emission factor for the grid Additionality The project activity is not the baseline scenario and the emission reductions would therefore not occur in the absence of the project activity The project activity is not required by law and the national and state policies in place are not sufficient to make the project commercially viable on its own The project faces barriers which in the absence of CDM would be prohibitive These barriers include
- Prevailing practice In the State of Maharashtra against an estimated potential of 781 MW only one biomass plant of 8 MW is established based on biomass resources
- Price fluctuations of biomass leading to uncertainty of profitability
- Difficulties in collection and handling of biomass
- Lack of policy support
Table 2Potential for Non-Conventional Energy Sources in Maharashtra and in All India 1
As observed from the table above though the potential for power generation from biomass in the state of Maharashtra is 781 MW only one plant has been established so far Whereas the proposed CDM project activity generates electricity using surplus biomass which otherwise would have been left for decay or it would have burnt causing environmental nuisance consumption of renewable biomass for generating
1 Future Energy Maharashtra Energy Development Agency (MEDA) Vol3 No1 Jan-Mar 2005
S No Source Potential in Country (MW)
Potential in Maharashtra (MW)
Achievement (MW)
1 Wind 45000 3650 456775 2 Small Hydro 15000 600 207080 3 Biomass 16000 781 8 4 Bagasse
Co-generation 3500 1250 735
5 Urban and Industrial waste
1700 450 6126
Total 81200 6731 749481
CDM-SSC-PDD (version 02) CDM ndash Executive Board page 10 electricity does not give rise to release of GHGs and in fact it is referred to as carbon neutral Hence electricity generation by the proposed project activity is less GHG intensive than the current grid electricity mix and results in reduced anthropogenic GHG emissions CDM will help to make the proposed project activity viable The CDM revenues will help to deal with various risks associated with the project as described above For details on baseline additionality and national and Sectoral policies please refer to Section B2 and B3 A431 Estimated amount of emission reductions over the chosen crediting period gtgt Emission reductions due to the project activity depend on the energy fed to the Western regional grid and the content of fossil fuel based generation in the Western grid system Hence power fed to the regional grid and the generation mix in the baseline region becomes the basis for estimating emissions reductions The chosen crediting period for the project activity is 10 years It is estimated that the project activity would generate 425247 certified emission reductions (CER) during the crediting period of 10 years Annual estimates of emission reductions by the project activity during the above crediting period are furnished below
CDM-SSC-PDD (version 02) CDM ndash Executive Board page 11
S No Year Annual estimation of emission reductions in
tonnes of CO2 eq 1 2008 37680 2 2009 43063 3 2010 43063 4 2011 43063 5 2012 43063 6 2013 43063 7 2014 43063 8 2015 43063 9 2016 43063 10 2017 43063 Total emission reductions (tonnes of CO2 eq)
425247
Total number of crediting years
10
Annual average over the crediting period of estimated reductions (tonnes of CO2 eq)
42524
In the above table the year 2008 corresponds to 010108 to 311208 Similar interpretation shall be applied for the remaining years A44 Public funding of the small-scale project activity gtgt No public funding from Annex I Party is involved in this project activity A45 Confirmation that the small-scale project activity is not a debundled component of a larger project activity gtgt The project proponents hereby confirm that the proposed project activity is not a debundled component of another larger project activity The project proponents further confirm that they have not registered any small scale CDM activity or applied to register another small scale CDM project activity within 1 km of the proposed project boundary in the same project category and technologymeasure in the previous 2 years
CDM-SSC-PDD (version 02) CDM ndash Executive Board page 12 SECTION B Application of a baseline methodology B1 Title and reference of the approved baseline methodology applied to the small-scale project activity gtgt Project Category Title Type I Renewable Energy project Reference ID- Renewable Electricity Generation for grid Version 09 (28 July 2006)
B2 Project category applicable to the small-scale project activity gtgt With a proposed installed capacity of 10 MW the project activity qualifies as small scale and therefore is eligible to use approved methodology AMS ID The application of the methodology is described below a) Selection and justification of calculation approach The baseline emissions are calculated based on net energy exported to the grid (in GWh year) and an emission factor for the displaced grid electricity (in tCO2GWh) As per paragraph 9 of AMS ID it requires that baseline emission factor will be calculated in a transparent and conservative manner based on either a) Combined margin (CM) consisting of the combination of operating margin (OM) and build margin (BM) according to the procedures prescribed in the approved methodology ACM 0002
OR
b) The weighted average emissions (in kg CO2equkWh) of the current generation mix The project proponent has opted for approach lsquobrsquo as the proposed project is a small scale project activity and the resultant emission factor will be lower and hence more conservative than the combined margin emission factor for the following reasons Table 3 Data sources for Baseline calculations Key Parameter Value Data Source Website Power generation
Power generated by all sources including hydro nuclear and RES
All related authentic sources like CEA Ex-post deacutetermination
wwwceanicin wwwmnesnicin
CEF for fuel Carbon Emission factor for each fuel type
Indiarsquos Initial National Communication to UNFCCC and IPCC default values Ex-ante determination
wwwipccch wwwunfcccint
Fuel Type Type of Fuel used for individual plant
MNES and CEA Ex post determination
wwwmnesnicin
Oxidation factor Oxidation factor for each fuel type
IPCC default values Ex-ante determination
wwwipccch
Net Heat Rate Net heat rate of individual power plants
CEA and MNES Ex-post determination
wwwceanicin wwwmnesnicin
CDM-SSC-PDD (version 02) CDM ndash Executive Board page 13 EFy Baseline emission factor for
the project grid Calculated for power plants in the Western regional grid Ex-post determination
-----
EGy Power export to the grid per annum
From Plant and MSEB Records Ex-post determination
------
The total energy demand in Maharashtra state and also in the whole western region is increasing rapidly To meet the growing energy demand various private and public sector utilities have envisaged many new projects that are expected to become operational in near future
Table 4Fuel wise breakup of Installed Capacity in the Western Regional grid2
As per the latest records of power generating capacity of western region as on 30st April 20063 furnished in the above table the share of thermal power is around 74 whereas the non-conventional sources like hydro (19) renewable energy sources (31) are minimal Table 5 Actual power supply position Western Regional Grid during April 2005 ndash March 2006 4
Surplus (+) Deficit (-) S No States in Western Region Requirement (MU)
Availability (MU) MU ()
1 Chhattisgarh 12999 12528 -471 -362 Gujarat 57129 52428 -4701 -823 Madhya Pradesh 36851 31623 -5228 -1424 Maharashtra 102780 84132 -18648 -1815 Daman amp Diu 1346 1323 -23 -176 Dadar Nagar Haveli 2540 2532 -8 -037 Goa 2338 2338 0 0 Western Region 215983 186904 -28079 -135
2 Page no27 Power Scenario at a Glance - 2006 Central Electricity Authority 3 Page no 27 power scenario at a Glance - 2006 Central Electricity Authority 4 Page no 27-42 Power Scenario at a Glance - 2006 Central Electricity Authority
CDM-SSC-PDD (version 02) CDM ndash Executive Board page 14
Table 6 Peak Demand Peak Met Western Regional Grid during April 2005 ndash March 20065 Surplus (+) Deficit (-)
S No States in Western Region Peak Demand
(MW) Peak Met
(MW) MW () 1 Chhattisgarh 2133 1857 -276 -1292 Gujarat 9783 7610 -2173 -222 3 Madhya Pradesh 6558 5136 -1422 -2174 Maharashtra 16069 12360 -3709 -231 5 Daman amp Diu 324 324 0 06 Dadar Nagar Haveli 387 387 0 07 Goa 368 368 0 0 Western Region 31772 25257 -6515 -205 As seen from the above tables the Energy requirement of Western region during 2005-06 is deficit by 28079 MU or135 The peak energy demand is deficit by 6515 MW or 205 during the year 2005-06 Further as per the 16th Electric Power Survey by Central Electricity Authority the growth in the energy requirement is around 62 until 2017 Based on the information available on western regional grid capacity additions during 11th plan it is observed that grid system in future will be carbon intensive due to major share of power coming from coal gas and diesel based thermal power plants
Table 7 Installed Capacity in Maharashtra6
bull Renewable Energy Sources (RES) includes Small Hydro Project (SHP) Biomass Gas (BG) Biomass Power (BP) Urban amp Industrial Waste (U amp I) Wind Energy
As seen in the table above the power generating capacity of Maharashtra as on 30 April 2006 share of thermal power is around 72 whereas the non-conventional sources like hydro and renewable energy sources contributes only 24 As per the data published in CEA website6 the Energy requirement in the state of Maharashtra during
5 Page no 27-42 Power Scenario at a Glance - 2006 Central Electricity Authority 6 Page no 35-36 Power Scenario at a Glance - 2006 Central Electricity Authority
CDM-SSC-PDD (version 02) CDM ndash Executive Board page 15 2005-06 is 102780 MU and the energy availability is 84132 MU with energy deficit of 181 The peak demand for Maharashtra for the same period is 16069 MW and peak met is only 12360 MW with a peak deficit of 231 To meet the present energy demand and growth in the energy requirement in the state of Maharashtra it would be required to add additional capacities for power generation Based on the proposed conventional power projects in the state of Maharashtra it appears that the dependence will be more on conventional power projects
Table 8 Proposed conventional power projects in Maharashtra
S No Project Name Proposed Fuel
Capacity Year of Commissioning
1 New Parli TPS Unit -1 Coal 250 MW July 2006 2 New Parli TPS Unit -2 Coal 250 MW 2007-08 3 Paras TPS Coal 250 MW November 2006 4 Paras TPS Extn Unit-2 Coal 250 MW 2007-08 5 Khaperkheda TPS Extn Coal 500 MW 2009-10 6 Bhusawal TPS Extn Coal 2 X 500 MW 2008-09 7 Koradi TPS Extn Coal 2 X 500 MW During 11th Plan
period (2007 ndash 2012) 8 Chandrapur TPS Extn Coal 500 MW During 11th Plan
period (2007 ndash 2012) 9 Coal based Coastal project Coal 2 X 800 MW During 11th Plan
period (2007 ndash 2012) 10 Wani TPS Coal 1000 MW 2008-09 11 Umred TPS Coal 500 MW 2008-09 12 Dabhol ndash II Coal 1444 MW During 11th Plan
period (2007 ndash 2012) 12 Uran Gas Turbine Extn Gas 1040 MW During 11th Plan
period (2007 ndash 2012) 13 Talegaon Combined Cycle Project Gas 1400 MW During 11th Plan
period (2007 ndash 2012) 14 Ghatghar PSS Hydro 250 MW During 11th Plan
period (2007 ndash 2012) (Source 1 Future Projects Maharashtra Generation Company (MAHAGENCO) wwwmahagencoin 2 Projects under implementation Maharashtra Generation Company (MAHAGENCO) wwwmahagencoin 3 10th Plan under Execution Ministry of Power Govt of India wwwpowerminnicin 4 Capacity Addition Programme in Western Region during 11th plan period wwwpowerminnicin ) As could be seen from the above and the same situation prevailing in other states of the region western region grid will become more carbon intensive in future Hence the resultant Emission factor (combined margin) will be higher than the weighted average emission factor
CDM-SSC-PDD (version 02) CDM ndash Executive Board page 16 Hence the above scenario justifies the conservative estimation of Emission factor based on weighted average of current generation mix The details of the weighted average emission factor calculations are provided in Annex 3 The project is located in the state of Maharashtra which falls under the Western part of India Hence The baseline emission factor is calculated for the western grid of India The baseline emission factor for projection of Emission reductions is based on the latest available data for the fiscal year 200506 Actual emission reductions will be calculated ex post b) Calculation of the baseline emission factor As explained earlier the baseline for the project activity is kWh exported to the grid by the biomass project multiplied by an emission coefficient calculated in a transparent and conservative manner as the weighted average emissions (in kgCO2kWh) of the current generation mix of the western region For this purpose the generation data published by Central Electricity Authority (CEA) for the western region was used Baseline emissions were estimated as explained below
i Estimation of emissions from each power generating unit in the baseline Emissions from each fossil fuel source are estimated using the following formula
Baseline Emissions
tCO2
= Net Generation
GWh
x Carbon Emission Factor tCTJ
x Net Station Heat Rate
TJGWh
x Conversion Factor (4412)
x Oxidation Factor
For estimation of emissions from each power generating unit in the grid actual generation data and station heat rates monitored and published by CEA is used IPCC default emission factors as well as local values (Indiarsquos Initial National communication) for carbon emission factor (CEF) and IPCC oxidation factors of each fuel type are used The CEA published data on Net heat rates of Thermal power plants (Performance Review of Thermal power stations) and CEA norms on station heat rates published in MNES Baselines report is considered to calculate the baseline emission factor Using the above formula emissions from each power generating source are estimated For non-fossil fuel sources such as hydro nuclear and renewable energy sources GHG emissions are not applicable ii Total grid emissions Total emissions from all stations in the grid are estimated by summation of emissions from all baseline power generating units iii Estimation of baseline emission coefficient The baseline emission coefficient for the grid is estimated as the weighted average of all existing generation sources using the following formula
Baseline Emission Factor
= Baseline Emissions
Total Net Generation
CDM-SSC-PDD (version 02) CDM ndash Executive Board page 17
tCO2GWh tCO2 GWh Using the above formula and data for the year 2005-2006 the baseline emission coefficient is estimated as 870 t CO2 GWh The detailed data underlying this calculation is furnished in Annex 3 For the purpose of projecting Emission reductions Emission Factor of the year 2005-06 is considered However the Baseline Emission factor will be updated ex-post every year during the crediting period B3 Description of how the anthropogenic emissions of GHG by sources are reduced below those that would have occurred in the absence of the registered small-scale CDM project activity gtgt a) Justification for application of simplified methodology to the project activity
The capacity of the proposed project is 10MW and the project activity is generation of electricity for a grid system using renewable biomass potential Hence the type and category of the project activity meets the criteria specified under AMSID in Appendix B of the indicative simplified baseline and monitoring methodologies for small scale CDM project activities as well as those related to demonstration of additionality for small-scale activities (Attachment A to Appendix B) b) National Policies and Circumstances
National policy on Coal Lignite Oil and Natural Gas The Ministry of Power (MoP) Government of India has set an agenda of providing power for all by the year 2012 To meet the present national deficit of 1637 and to achieve the above target about 100000 MW of new capacity needs to be added by the end of 2012 to the existing installed capacity of 1243028 MW In line with the Five Year Plan system being followed by the Planning Commission of India the MoP decided to add about 46000 MW during the period 2002-2007 and about 61000 MW during the period 2008-2012 Emphasis has been laid on setting up large pithead stations to avoid high costs associated with transporting high ash bearing Indian coal and over-straining the already stretched rail network To push forward the power sector reforms further the Government of India has opened up the coal sector for private participation Captive coal mining is allowed by the Ministry of Coal to facilitate coal mining by power generating units for their fuel needs In addition coal imports are allowed for power projects This has significantly strengthened the preference of the private sector for coal-based mega power projects over other energy sources The Government of India has also opened oil and natural gas exploration for private sector participation In the oil and natural gas sector both central and private sector organisations are involved and already exploring the potential available in India The discovery of new reserves is not significant enough to meet the increasing demand for natural gas As yet the natural gas consumption is limited to a small extent and significant investments are required for natural gas infrastructure Biomass power policy in India and Maharashtra
7 wwwceanicin
8 Page no 3 power scenario at a Glance ndash 2006 wwwceanicin
CDM-SSC-PDD (version 02) CDM ndash Executive Board page 18 The grid electricity in India today is clearly dominated by thermal generation predominantly coal The overall nationwide mix of thermal to hydro-electric power stands currently at around 8317 (Source wwwceanicin as on March 2006) The Ministry of Non-Conventional Energy Sources (MNES) is engaged in development of renewable energy sources in India including biomass MNES has estimated the potential for biomass projects in India to an extent of 16000 MW Against this the country has so far achieved establishment of biomass projects to an extent of only 8679 MW indicating exploitation of only about 54 of the potential In spite of Ministryrsquos resolve to encourage setting up of these projects by providing incentives such as interest subsidy tax holiday etc these projects could not be established in a large scale due to various barriers prevailing in the sector In spite of all the propagation by MNES the focus of power generation is on thermal projects primarily based on coal As indicated earlier the share of installed thermal power generation capacity in Maharashtra is over 74 and the same is expected to continue based on the planned projects in Maharashtra UNFCCC simplified modalities seek to establish additionality of the project activity as per Attachment A to Appendix B which listed various barriers out of which at least one barrier shall be identified due to which the project would not have occurred any way c) Additionality
Project participants have undertaken the following barrier analysis in support of additionality Prevailing practice In the Indian power sector the common practice is investing in only medium or large scale fossil fuel fired power projects which is evident from a host of planned projects that comprises mostly large-scale fossil fuel based power generation projects This is mainly due to the assured return on investment economies of scale and easy availability of finances The same applicable to the western region as well as Maharashtra state The various projects under planning in the state of Maharashtra (refer Table 8) and Western region during 11th plan are furnished in the following table
9 Annual report 2005-06 Ministry of Non-conventional Energy sources (MNES)
CDM-SSC-PDD (version 02) CDM ndash Executive Board page 19
Table 9Capacity additions during 11th plan period
(source Power sector profiles ndash Western region Ministry of powerhttpwwwpowerminnicinJSP_SERVLETSinternaljsp )
CDM-SSC-PDD (version 02) CDM ndash Executive Board page 20 As could be seen from the above the total likely capacity additions in western region during the 11th plan is 18602 MW Out of which the share of thermal power is 17342 MW which is about 93 of the total capacity addition planned in western Region In the private sector participation of western region capacity addition during 11th plan is entirely dominated by thermal power plants The total private sector participation in western region during 11th plan is 6502 MW out of which the thermal power plants contributes to 6102MW (94) This is obvious from the above that the investors in both public and private sector are interested to invest in thermal energy projects only Hence investing for a biomass based power plant is not a common practice in the region The share of electricity from small biomass electric projects in Indiarsquos total installed capacity is negligibly small According to the latest statistics published by the Ministry of Non-Conventional Energy Sources (MNES)10 the total installed capacity of small biomass projects is only 867 MW where as the Indiarsquos total installed capacity is around 124287 MW11 which accounts for less than 1 In the state of Maharashtra against an estimated potential of 781 MW only one biomass based power plant with capacity of 8 MW is established The existing Maharashtra state grid mix comprises of 7246 Thermal 2007 hydro 439 renewable energy 307 Nuclear (Calculated from Table 7 above) This clearly illustrates that establishing a biomass based power plant is not a common practice in the state of Maharashtra Financial barrier The following barriers prevent investment in a biomass-based power plant with out additional revenue from CDM Fluctuations in price of biomass The success of biomass based power plant depends on the price of biomass material required for power generation Price of biomass depends on the following on which the project proponent has no control
bull Biomass prices unlike fossil fuel are not regulated by any agency The farmers at times sell the residues by taking their own decision on fixing price At present the average cost of biomass is around Rs1000-1100 per tonne as against Rs 760 per tonne at the time project was envisaged The price of biomass fluctuating continuously due to creation of commercial value for the product which has no market value early to establishment of Power plant making the cost of generation unstable
bull It has been experienced in other states where the biomass plants are established that price
variation is substantial ranging from 25 and even up to 50 Evidence is also found from some of the registered biomass projects under CDM the fluctuation in price of biomass after the plants commence operations
Due to this lack of price stability the cost of power generation is unpredictable
10 Ministry of Non Conventional Energy Sources (MNES) Govt of India Annual Report 2005-06 11 All India Total Installed Capacity (as on 3rd April 2006) Ministry of Power Govt of India wwwpowerminnicin
CDM-SSC-PDD (version 02) CDM ndash Executive Board page 21 Lack of policy related support Ministry of Non-conventional Energy Sources Govt of India has announced a policy for development of renewable energy projects in India in 1993 and closely on the lines of MNES policy Government of Maharashtra came with its policy for the renewable energy projects including biomass in May 1998 The salient features of both MNES and the Maharashtra Govt policy for renewable energy are as follows
Table 10Salient features of MNES Policy and Govt of Maharashtra Policy S No Subject MNES Govt of India
policy Govt of Maharashtra (GoM) policy
1 Year announced 1993 1998 2 Power purchase rate Rs225 kWh Rs225 kWh 3 Base year 1994-95 1994-95 4 Escalation every year 5 5 5 Wheeling Charges 2 2 6 Banking Charges 2 2 7 Period for banking 1 year 1 year 8 Transmission line losses 0 0
From project to SEB substation
To be borne by developer
To be borne by developer
9 Power evacuation facility EHV HV substation
including augmentation strengthening of evacuation system
To be borne by utility To be borne by utility
10 Power purchase by -------------- MSEB 11 Third party sale ------------- Allowed 12 Capital subsidy ------------ 30 subject to a max
of Rs20 lakhs 13 Others 1 Income Tax holiday
2 Accelerated depreciation
3 Concessional custom duty duty free import
4 Interest subsidy
1 Pass through of conventional fuel cost 2 Protection to foreign exchange fluctuation risk 3 Sales tax benefits up to 50 4Refund of entry tax octroi
(Source 1 Ministry of Non-Conventional Energy Sources (MNES) Govt of India wwwmnesnicinguidehtm 2 Maharashtra state tariff policy adopted httpwwwmnesnicinannualreport2001_2002_Englishch5_pg13htm ) Attracted by the above policy of GoM number of developers proposed biomass based power plants in the state of Maharashtra and obtained a clearance to set up the power projects Subsequently GoM scrapped its policy in the year 2001 By that time the promoters have taken several steps for implementation of the project and have to stop all their efforts Due to delay in formulation of the policy the developers have formed an association under the name Maharashtra Biomass Energy Developers Association (MBEDA) and filed a petition before the
CDM-SSC-PDD (version 02) CDM ndash Executive Board page 22 Maharashtra Electricity Regulatory Commission (MERC) for a tariff policy MBEDA has also worked out fair tariff for their projects with supporting arguments After prolonged process MERC came out with its tariff order dated 8th August 2005 on setting up of biomass-based power plants Copy of the tariff order made by MERC will be made available to the validator during the course of validation Thus the entire process took almost five years and then only a final policy was formulated for these biomass power plants This is one of the reasons why only one plant is established in Maharashtra based on biomass This is against an estimated potential of 781 MW (Refer Table 2 above) projected by Maharashtra Energy Development Agency MERC has come out with its ruling on tariff payable to the biomass based power plants and the salient features of the same are produced below
Table 11 MERCrsquos tariff structure
Subject MERCrsquos Ruling Tariff Rs318 kwh Annual Escalation upto 13 years from base year
5
Base year 2004-2005 Third party sale Permitted Energy purchase agreement between MSEB and Biomass project developer
Approved
Wheeling Charges in case of third party sale irrespective of the distance
2
Charge for transmission line losses 5 Use of fossil fuels when there is no sufficient biomass available
Upto 25 of annual fuel requirement
Penalty for shortfall in supply of energy Rs025 RkVAh (reactive power)
Review of tariff rate and structure After 5 Years Capital cost Rs 4 crore MW Capacity MEDA has to ensure that there
is no overlap MEDA has to give opinion on fuel availability for each project before entering into EPA
Plant Load Factor (PLF) 70 (1st year) 80 (From 2nd year onwards)
Auxiliary consumption 10 Station heat rate 114 kgkwh O and M charges 4 of capital cost Stocking of biomass 2 months Return on equity 16 Depreciation 528 Means of Finance 7030 Rate of Interest on Loan 1075 per annum
CDM-SSC-PDD (version 02) CDM ndash Executive Board page 23
Repayment of debt 85 years with 1 year moratorium
An IRR analysis has been prepared for the project activity based on tariff order issued by MERC However adjustments have been made with respect to capital cost as per the norms of lending institutions The IRR has worked out to 1209 without GHG income While working out the base line profitability the incentives available for this type of project activity such as Interest subsidy Excise concession Tax holiday etc have been considered as furnished in the below table
Table 12IRR assumptions
Parameter Value Cost of Project 449 millions Means of finance
rArr Share capital rArr Term loan
1497 millions 2992 millions
Plant capacity 10 MW Working days per annum 365 Plant Load factor (optimum year) 80 Gross energy 7008 (optimum) Auxiliary consumption 10 708 Net saleable energy 6307 (optimum) Sale price of energy (per kWh) Rs318 Escalation considered on price of biomass
5
Operation amp maintenance charges with 5 yearly escalation
4
Rate of interest on term loan 1075 Depreciation 528 Tax holiday 10 years Minimum alternative Tax 1122 No of CERs 425247 (10 years) Rate per CER 6 Euros
A sensitivity analysis has also been made for the project activity considering the below mentioned scenarios including the positive probabilities (though chances of accurance of these are remote) and the resultant IRR is as under
Table 13Sensitivity Analysis
Sensitivity parameters IRR
With out GHG () Normal 1209 10 increase in project cost 941 10 decrease in project cost 1524 10 decrease in PLF 914 10 increase in PLF 1495 10 increase in Fuel cost 938 10 decrease in Fuel cost 1466
CDM-SSC-PDD (version 02) CDM ndash Executive Board page 24 As could be seen from the above the IRR is quite low and only after considering income from sale of emission reductions the IRR is improves to 1564 which is found to be reasonable and almost reaches the bench mark return of 1515 This indicates that the CDM revenue is very significant for the project activity Technological Barriers The most important equipment that has bearing on the smooth operation of the power plant is the boiler The boiler is a travelling grate type capable of using various fuels unlike the more efficient fluidized bed boiler A travelling grate boiler normally is subject to mechanical troubles due to usage of varieties of fuels The performance of the boiler depends on the uniform material used as fuel In respect of a biomass plant the fuel used depends on type of biomass available whose characteristics are not uniform As the project is located in a rural area where power is supplied to agricultural purposes generally by rotation the plant may face frequent fluctuations in grid voltage due to which the power evacuation equipment would be affected and some times leading to tripping of the plant Other barriers Handling and storage of biomass The problems and difficulties associated with procurement handling and storage of biomass in respect of project activity are as follows
1 The biomass is available in small quantities over a large area As the material has low bulk density collection and transportation of the same to the project site is a constraint
2 The cost of collection and transportation also tend to increase due to the increasing cost of labour
and cost of diesel used for transportation of biomass
3 Biomass cannot be Stored for longer period The characteristics of biomass change quickly with in short period Calorific value of biomass decreases due to loss of volatiles and deterioration of biomass and this may also affect the performance of the plant
4 The collection of biomass is a manual job and number of people has to be engaged continuously
for storage of biomass Any problem on availability of labour particularly during harvesting operations may hinder collection of the biomass fuel
In the view of above the proposed project is additional and not the same as the baseline scenario and would not occur without the CDM benefits B4 Description of how the definition of the project boundary related to the baseline methodology selected is applied to the small-scale project activity gtgt As per the guidelines mentioned in Type ID of Annex B of the simplified modalities and procedures for small-scale CDM project activities project boundary encompasses the physical and geographical site of the renewable generation source Hence the project boundary covers the point of fuel supply to the point of power export to the grid where the project proponent has a full control Hence project boundary is
CDM-SSC-PDD (version 02) CDM ndash Executive Board page 25 considered within these terminal points Thus boundary covers fuel storage and processing boiler Steam Turbine generator and all other power generating equipments and auxiliary consumption units B5 Details of the baseline and its development gtgt The baseline for the project activity is constructed according to the 9b ie weighted average emissions of the current generation mix (in kg CO2eqkwh) applicable for Type ID CDM project activities as contained in the Appendix B of the simplified modalities and procedures for small scale CDM project activities Date of completion of the baseline 300906 Name of the person entity determining the baseline Zenith Energy Services (P) Limited Hyderabad Contact information of the above entity furnished below
Organization Zenith Energy Services (P) Limited StreetPO Box Building 10-5-6B My Home Plaza Masabtank City Hyderabad StateRegion Andhra Pradesh PostfixZIP 500028 Country India Telephone +91- 40- 2337 6630 2337 6631 FAX +91- 40- 2332 2517 E-Mail zenithzenithenergycom URL wwwzenithenergycom Represented by Title Director Salutation Mr Last Name Reddy Middle Name Mohan First Name Attipalli Mobile +91- 9849408485 Direct Fax +91- 40- 2332 2517 Direct Telephone +91- 40- 23325803 Personal Email mohanzenithenergycom
The above entity is not a project participant SECTION C Duration of the project activity Crediting period C1 Duration of the small-scale project activity gtgt C11 Starting date of the small-scale project activity gtgt 010905 C12 Expected operational lifetime of the small-scale project activity
CDM-SSC-PDD (version 02) CDM ndash Executive Board page 26 gtgt 30 years C2 Choice of crediting period and related information gtgt Fixed crediting period C21 Renewable crediting period gtgt Not chosen C211 Starting date of the first crediting period gtgt Not applicable C212 Length of the first crediting period gtgt Not applicable C22 Fixed crediting period gtgt C221 Starting date gtgt010108 C222 Length gtgt10 years SECTION D Application of a monitoring methodology and plan gtgt D1 Name and reference of approved monitoring methodology applied to the small-scale project activity gtgt The name of the methodology applied for the project activity is ldquoMetering the Electricity Generatedrdquo This is in accordance with Appendix B of simplified modalities and procedures for small-scale CDM project activities The reference to the proposed monitoring methodology is para 13 of AMS ID of Appendix B of simplified modalities and procedures for small-scale CDM project activities D2 Justification of the choice of the methodology and why it is applicable to the small-scale project activity gtgt The project activity meets the eligibility criteria to use simplified modalities and procedure for small-scale CDM project activities as set out in paragraph 6 (c) of decision 17CP7 As the power plant is of 10 MW capacity reference has been taken from indicative simplified baseline and monitoring methodologies for selected small scale (CDM projects less than 15 MW) project activity categories The project activity is generation of electricity using biomass potential and exporting the same to the grid system which is also fed by other fuel sources such as fossil and non-fossil types Emission reductions due to the project activity are considered to be equivalent to the emissions avoided in the baseline
CDM-SSC-PDD (version 02) CDM ndash Executive Board page 27 scenario by displacing the grid electricity Emission reductions are related to the electricity exported by the project and the actual generation mix in the grid system Ex-post approach is selected for the baseline calculation as the capacity of the biomass project is 10 MW The baseline emission factor is estimated based on the weighted average emissions of the current generation mix and will be updated during the crediting period The data to be monitored to ascertain emission reductions out of the project activity is to measure the amount of electricity generated through energy meters With this information a reliable estimate of the amount of emission reduction can be made
CDM-SSC-PDD (version 02) CDM ndash Executive Board page 28 D3 Data to be monitored gtgt ID number
Data type Data variable Data unit
Measured (m) calculated (c) or estimated (e)
Recording Frequency
Proportion of data to be monitored
How will the data be archived (electronic paper)
For how long is archived data to be kept
Comment
D31 Power Gross Generation kWh m Continuous 100 Electronic and Paper Crediting period plus 2 years Meter is Calibrated and Regularly inspected by MSEB
D32 Power Auxiliary Consumption
kWh m Continuous 100 Electronic and Paper Crediting period plus 2 years Meter is Calibrated and Regularly inspected by MSEB
D33 Power Power Import kWh m Continuous 100 Electronic and Paper Crediting period plus 2 years The import is when project is under maintenance or temporary shutdown and Meter is Calibrated and Regularly inspected by MSEB
D34 Power Power Export kWh m Continuous 100 Electronic and Paper Crediting period plus 2 years Meter is Calibrated and Regularly inspected by MSEB
D35 Fuel Biomass used ( For each type of biomass separately)
MT m Daily 100 Electronic and Paper Crediting period plus 2 years Biomass deliveries are weighted using calibrated weigh bridges and build upon receipt at the plants Recorded per type of biomass
D36 Fuel Fossil fuels (coal) used
MT m Daily 100 Electronic and Paper Crediting period plus 2 years Fossil fuel deliveries are weighted and build upon receipt at the plants
D37 Calorific Values
NCV of coal used in the plant
kcalkg m batch-wise for coal
100 Electronic and Paper Crediting period plus 2 years The coal will be sampled and taken for analysis of calorific value at reputed laboratories
D38 Calorific Values
NCV of biomass used in the plant (for each type)
kcalkg m batch-wise 100 Electronic and Paper Crediting period plus 2 years The biomass fuels will be sampled and taken for analysis of calorific value at reputed laboratories
CDM-SSC-PDD (version 02) CDM ndash Executive Board page 29
D39 Fuel (renewable biomass)
Surplus biomass availability (for estimation of leakage)
MT E Yearly 100 Electronic and Paper Crediting period plus 2 years The data item is used to estimate the leakage affect due to the implementation of the project activity in the project region The data item is a calculated value derived from either any public survey documentation or the biomass assessment study carried out for project by an independent party during each year of the crediting period
D310 Emission factor
Emission factor of the most carbon intensive fuel used
tCO2TJ m yearly 100 Electronic and Paper Crediting period plus 2 years The emission factor values will be taken from the officially published data for Indian system
D311 Emission Factor
Grid Emission Factor (EF) Weighted average
tCO2GWh
c Yearly 100 Electronic and Paper Crediting period plus 2 years This data item is required for estimating the baseline emissions and emission reductions Data sourced from official CEA web site
CDM-SSC-PDD (version 02) CDM ndash Executive Board page 30 D4 Qualitative explanation of how quality control (QC) and quality assurance (QA) procedures are undertaken gtgt Data Uncertainty level of data
(HighMediumLow) Explain QAQC procedures planned for these data or why such procedures are not necessary
D31 amp D32
Low This data item will be recorded at the project site which is under the control of project proponent The energy generated and consumed is measured using calibrated meters and recorded by project proponent Records of measurements will be used for calculating net export to grid
D33 Low This data will be recorded at the project site and the energy imported is measured using MSEB calibrated meter Records of measurements will be used for calculating net export to grid Sales billsreceipts may be compared as an alternative proof of the power imported from MSEB grid
D34 Low This data item will be recorded at the grid substation which is under the control of MSEB The energy measured using calibrated meters and recorded at MSEB substation will be monitored Records of measurements will be used for verification of emissions reductions Sales bills receipts may be compared as an alternative proof of the power exported to the grid
D35 and D36
Low This data item will be recorded at the inlet of the plant premises Fuel purchase records can be used for verification of fuel purchases in each category of biomass and fossil fuels Payments made to fuel suppliers can be used to cross check the fuel purchase records
D37 amp D38
Low Fuel samples will be analysed at reputed laboratories if available for coal will be obtained from the suppliers No QAQC procedures are applicable since the parameter is not under the control of project proponent
D39 Low Either publicly available survey data is used or in the absence of publicly available data biomass assessment study will be carried out by an independent agency based on the official statistics scientific approaches and standard practices Hence it can be ensured that the compliance with QAQC and quality of data will be high Since the data item is not under the control of project proponent no QAQC procedures are applicable here
D310 Low The parameter will be taken from the officially published documentations of the Indiarsquos DNA such as Indiarsquos initial national communication to UNFCCC andor IPCC 2006 default values which ever is applicable Since the data item is not under the control of project proponent no QAQC procedures are provided here
D311 Low Based on official data from CEA Project participants has no influence on quality control procedures
D5 Please describe briefly the operational and management structure that the project participant(s) will implement in order to monitor emission reductions and any leakage effects generated by the project activity gtgt
CDM-SSC-PDD (version 02) CDM ndash Executive Board page 31 The management structure proposed for monitoring of emission reductions due to the project activity mainly comprises a GHG audit team committee which will be established immediately after commissioning of the plant The committee performs various functions such as measuring recording storage of measured data and reporting to the project participants The outcome of the committee in the form of GHG audit reports are being monitored monthly and annually The committee comprised representatives of the project participant and other experts as decided from time to time It was proposed that whenever required external independent GHG auditors would be deputed for the monitoring activities Project Management The authority and responsibility for registration monitoring measurement reporting and reviewing of the data rests with the Board of Directors The Board may delegate the same to a competent person identified for the purpose The identified person will be the in charge of GHG monitoring activities and necessary reports will be submitted to the management or its Committee for review Monitoring Requirements The monitoring plan includes monitoring of parameters ie the energy fed to the MSEB grid system Biomass and fossil fuel consumption auxiliary consumptions and Imports Emission reductions resulted from the project activity will be calculated using the energy fed in accordance with the calculations illustrated in Section E of the PDD Emission reductions generated by the project shall be monitored at regular intervals The crediting period chosen for the project activity is 10 years Monitoring equipment comprises of energy meters and weigh bridge meter at Project entrance The export meters will monitor the energy fed by the plant to MSEB grid system by the project In accordance with the procedures laid down in EPA project proponents have to install two energy meters one is main meter and the other is check meter Project proponent will have to calibrate both the meters according to the procedures of EPA The meters will be tested once in a year generally In case the variation in meter reading between main and check meters is more than 05 both meters will be tested and calibrated immediately by MSEDCL (Maharashtra State Electricity Distribution Company Limited) as corrective action The import meter will record the energy taken by the project activity from Grid system This meter will be checked calibrated and may be replaced with a new one by MSEB based on meter condition This will be under the control of MSEB project proponent have no authorization to deal with import energy meter The gross auxiliary energy meters and weigh bridge meter will be periodically checked and calibrated by project proponent as per Indian standards for calibration of equipment Methodology adopted for determining base line emission factor is the weighted average emissions of the generating mix in the Western grid system which will represent the intensity of carbon emissions of the grid system The baseline emission factor is calculated ex-post for all the years of the crediting period using the official data published by the Central Electricity Authority for the Western grid and therefore included in the monitoring procedures Leakage Monitoring The 10 MW Parbani project is renewable energy type and it utilizes Biomass fuel for power generation Since no energy generating equipment is transferred from another activity nor existing equipment is transferred to another activity leakage needs not to be monitored or considered However parameter to asses the leakage due to competing uses of biomass (surplus biomass in the region) has been included in the monitoring (section D3) which will be assessed during each year of the crediting period
CDM-SSC-PDD (version 02) CDM ndash Executive Board page 32 Data Recording and Storage The net energy fed to the grid system by the project activity will be recorded by project proponents using either of the two meters (main meter and check meter) in the presence of the representative of MSEB Representatives of both the project proponent and MSEB will sign the document which will contain all details such as the equipment data calibration status previous reading current reading export import net billable units date and time of recording etc This document will be used as a basic document for monitoring and verification of the net energy exported to the grid MSEB will pay to project proponents based on this document Biomass and coal (if any) consumption are recorded on daily as well as monthly basis and the same can be verified from invoice data This document will be used as a basic document for monitoring and verification of the fuel consumption for power generation The above document will be preserved for verification of emission reductions from the project in safe storage Supporting documents such as receipts of payments released by MSEB will also be preserved in safe storage for later verification by an independent third party The period of storage will be 2 years after the end of crediting period D6 Name of personentity determining the monitoring methodology gtgt The contact information for the entity that has determined the monitoring methodology is given below The entity is a project participant
Organization Zenith Energy Services (P) Limited StreetPO Box Building 10-5-6B My Home Plaza Masabtank City Hyderabad StateRegion Andhra Pradesh PostfixZIP 500028 Country India Telephone +91- 40- 2337 6630 2337 6631 FAX +91- 40- 2332 2517 E-Mail zenithzenithenergycom URL wwwzenithenergycom Represented by Title Director Salutation Mr Last Name Reddy Middle Name Mohan First Name Attipalli Mobile +91- 9849408485 Direct Fax +91- 40- 2332 2517 Direct Telephone +91- 40- 2337 6630 2337 6631 Personal Email mohanzenithenergycom
SECTION E Estimation of GHG emissions by sources
CDM-SSC-PDD (version 02) CDM ndash Executive Board page 33 E1 Formulae used gtgt E11 Selected formulae as provided in appendix B gtgt Appendix B of the simplified modalities and procedures for small-scale CDM project activities does not provide specific formulae for the baseline for project Category ID Calculation of the project GHG emissions reductions applies a weighted average emissions factor for all thermal plants that are operational on the Western grid of India as of March 2006 E12 Description of formulae when not provided in appendix B gtgt E121 Describe the formulae used to estimate anthropogenic emissions by sources of GHGs due to the project activity within the project boundary gtgt The proposed project activity generates power using renewable biomass which is considered CO2 neutral However since use of fossil fuels is permitted in exigencies to a maximum of 25 of the total annual fuel requirement for biomass based power projects the project may use fossil fuels such as coal in future in case of exigencies GHG emissions occurring within the project boundary will be calculated using the following formula
sum sdotsdotsdot= iiCOiyiy OXIDEFNCVFFPE 2 Where PEy are the emissions from the project activity during the year y in tonnes of CO2 FFiy is the quantity of fossil fuel type i combusted to supplement the biomass residues in the project activity during the year y in energy or mass units NCVi is the net calorific value of the fossil fuel type i in TJ per mass unit obtained from local fuel supplier or from the country specific IPCC default factors EFCO2i is the CO2 emission factor per unit of energy or mass of the fuel type i in tons of CO2
obtained from the country specific IPCC default factors OXIDi is the oxidation factor of the fuel (as per table 129 in the 1996 revised IPCC guidelines
for default values)
For the purpose of estimating the anticipated project emissions due to the project activity it has been assumed that coal to an extent of 10 of the annual fuel requirement may be used as supplementary fuel Accordingly the estimate of project emissions is provided below These emissions will be updated ex post depending on the actual quantity of coal consumed
CDM-SSC-PDD (version 02) CDM ndash Executive Board page 34 Project Emissions (tCO2)
Biomass consumed
Coal Consumption
Total fuel consumption
of coal consumption NCV of Coal
Emission factor coal (EFCO2y)
Oxidation factor
(OXIDi)Project
emissionstons tons tons kcalkWh tCO2TJ tCO2
Indias Initial National
communication
1996 revised IPCC
guidelines1 2008 62363 6929 69292 10 3800 9581 098 103342 2009 71271 7919 79190 10 3800 9581 098 118103 2010 71271 7919 79190 10 3800 9581 098 118104 2011 71271 7919 79190 10 3800 9581 098 118105 2012 71271 7919 79190 10 3800 9581 098 118106 2013 71271 7919 79190 10 3800 9581 098 118107 2014 71271 7919 79190 10 3800 9581 098 118108 2015 71271 7919 79190 10 3800 9581 098 118109 2016 71271 7919 79190 10 3800 9581 098 1181010 2017 71271 7919 79190 10 3800 9581 098 11810
116628Total Project Emissions
No Year
Reference
E122 Describe the formulae used to estimate leakage due to the project activity where required for the applicable project category in appendix B of the simplified modalities and procedures for small-scale CDM project activities gtgt No leakage is anticipated due to the project activity as the generating equipment is not transferred from another activity Although a small amount of emissions occur outside the project boundary due to transportation of biomass the same are not considered as being negligible and occur in the baseline scenario
Parameter Unit Valuea Total biomass required for the project tonnes 80000b Average Return trip Distance (AVD) from collection centres km 100c Total Ash Generation (anticipated) tonnes 8000d Average Return trip distrance for Ash utilization or disposal km 30e Average load per truck tonnes 10f Total Distance travelled km 824000g Consumption of Diesel by truck kmLitre 5h Total Diesel consumption for transportation Litres 164800i Density of Diesel kgLitre 082j Total Diesel consumption kg 135136k Energy value of Diesel (IPCC) TJ103 tonnes 4333l Total Energy from Diesel TJ 586m Emission factor of Diesel t CO2TJ 741n Total Transport Emissions t CO2 434
AVD considered is the maximum possible distance from plant site (Radious 50 50+50 = 100 km) Ash Generation is considered at 10 of total biomass consumption per year for projection
The project activity is generating electricity using Biomass residues hence according to the Attachment C to Appendix B of simplified modalities and procedures the leakage source applicable is lsquoCompeting use of biomassrsquo The project proponents conducted a Biomass Assessment Survey in the project region to ensure that the biomass available in the region is surplus which is not utilized so far According to the Biomass Assessment Report the total generation of biomass residues with in the 50 km radius from plant location is 111 million tonnes (mt) where as the consumption of the region is 077 mt The surplus biomass available is 034 mt The leakage calculation is demonstrated in the below table
CDM-SSC-PDD (version 02) CDM ndash Executive Board page 35
Leakage - competing use of biomassParameter Unit Value
a Total biomass available in the region tonnes 1115023b Total conumption of the reigon tonnes 770169c Biomass consumption of the 10 MW project activity tonnes 80000d Total biomass consumption of the region including project activity (b+c) tonnes 850169e Total surplus in the region after accounting for all types of consumption (a-d) tonnes 264854f Percentage of surplus available biomass in the reigon (ed) 31
The total quantity of surplus biomass in the region is 31 larger than the total biomass consumption in the region Hence the leakage emissions due to competing use of biomass is neglected The main biomass residues ie crop residues used for this project which can be regarded to be renewable since their use does not lead to a decrease of carbon pools as defined in Annex 18 of the report of EB 23 meeting The quantity of available biomass in the region is 25 larger than the quantity of biomass that is utilized including the project activity Hence according to Attachment C to Appendix B Indicative simplified modalities and procedures Leakage due to competing uses for the biomass is neglected However as required by Attachment C to Appendix B leakage effect will be monitored (section D3) during each year of the crediting period to ensure that the implementation of project activity does not lead to any increase in GHG emission from fossil fuel combustion or other sources due to the diversion of biomass residues from the other uses to the project as a result of the project activity If the quantity of surplus biomass in the region found below the 25 of the total consumption of the project region during any year of the crediting period the corresponding percentage of biomass quantity would be considered to estimate the leakage emissions due to the competing uses of biomass as described below Leakage emissions ndash Competing uses for the biomass A fuel availability survey will be carried out during each year of the crediting period to assess the surplus availability of biomass in the project region If it is found that the surplus in the region is less than 25 of the total region consumption the emissions due to leakage will be estimated and deducted from the emission reductions by applying the following equation
yavgLCOydy NCVEFBFL 2 sdotsdot= Ly = Leakage emissions during the year y (tCO2y) BFdy = The quantity of biomass ie in deficit during the year y (tonnes) (In the above parameter the quantity of biomass in deficit refers to the corresponding quantity of biomass in deficit from 25 surplus of the total consumption of the biomass in the project region including the project activity) EFCO2L = CO2 emission factor of the most carbon intensive fuel used in the country (t CO2TJ) NCVavgy = Average net calorific value of the biomass residues combusted in the project activity during the year y (TJtonne)
CDM-SSC-PDD (version 02) CDM ndash Executive Board page 36 E123 The sum of E121 and E122 represents the small-scale project activity emissions gtgt The sum of emissions estimated in E121 and E122 is provided in the below table
Year (FY) 2008 2009 2010 2011 2012 2013 2014 2015 2016 2017 Project emissions E121 tCO2
10334 11810 11810 11810 11810 11810 11810 11810 11810 11810
Leakage E122 tCO2
0 0 0 0 0 0 0 0 0 0
Total E121 + E122 tCO2
10334 11810 11810 11810 11810 11810 11810 11810 11810 11810
E124 Describe the formulae used to estimate the anthropogenic emissions by sources of GHGs in the baseline using the baseline methodology for the applicable project category in appendix B of the simplified modalities and procedures for small-scale CDM project activities gtgt As per AMS ID
iv Estimation of baseline emissions Baseline emissions or emissions avoided by the project activity are estimated using the following formula
Baseline Emissions
tCO2
= Grid Emission Factor
tCO2GWh
x Net Power Generation
GWh The power export from the project for the optimum year is anticipated at 6307 GWh per year based on which the baseline emissions are estimated and tabulated
Baseline Emissions (tCO2)
Sno
year Gross
energy
Net enrgy
export
(GWh)
Emission
Factor (t
CO2Gwh)
Baseline
Emissions (t
CO2)1 2008 6132 5519 870 480142 2009 7008 6307 870 548733 2010 7008 6307 870 548734 2011 7008 6307 870 548735 2012 7008 6307 870 548736 2013 7008 6307 870 548737 2014 7008 6307 870 548738 2015 7008 6307 870 548739 2016 7008 6307 870 54873
10 2017 7008 6307 870 54873541871Total Baseline Emissions
CDM-SSC-PDD (version 02) CDM ndash Executive Board page 37 E125 Difference between E124 and E123 represents the emission reductions due to the project activity during a given period gtgt
E2 Table providing values obtained when applying formulae above gtgt
S No Year Annual estimation of emission reductions in tonnes of CO2 eq
1 2008 37680 2 2009 43063 3 2010 43063 4 2011 43063 5 2012 43063 6 2013 43063 7 2014 43063 8 2015 43063 9 2016 43063
10 2017 43063 Total emission reductions (tonnes of CO2 eq)
425247
Total number of crediting years 10 Annual average over the crediting period of estimated reductions (tonnes of CO2 eq)
42524
SECTION F Environmental impacts F1 If required by the host Party documentation on the analysis of the environmental impacts of the project activity gtgt
As per the prevailing regulations of the Host Party ie India (represented by the Ministry of Environment and Forests (MoEF) Govt of India and also the line ministry for environmental issues in India) Environmental Impact Assessment (EIA) studies need not to be done for the projects less than Rs1000 millions Since the total cost of the proposed project is only Rs449 millions and also comes under the small scale category of CDM projects as per UNFCCC guidelines doesnrsquot call for EIA study However prior to implementation the project shall notify to the Maharashtra State Pollution Control Board (MSPCB) for necessary evaluation and approval As required for implementation of the project activity project participants had studied the possibility of environmental impacts and concluded that no negative impacts are possible due to the project activity Hence no documentation or summary is provided here
Year 2008 2009 2010 2011 2012 2013 2014 2015 2016 2017 Baseline emissions E124 tCO2
48014 54873 54873 54873 54873 54873 54873 54873 54873 54873
Project emissions E123 tCO2
10334 11810 11810 11810 11810 11810 11810 11810 11810 11810
Emissions Reductions E124 ndash E123 tCO2
37680 43063 43063 43063 43063 43063 43063 43063 43063 43063
CDM-SSC-PDD (version 02) CDM ndash Executive Board page 38 The project does not fall under the purview of the Environmental Impact Assessment (EIA) notification of the Ministry of Environment and Forest Government of India However the design philosophy of this biomass based project activity is driven by the concept of providing the renewable energy with negligible impact on the environment hence the environment and safety aspects of the project activity are discussed here The possible type of pollutants emanating from a normal biomass plant are Air Pollution Water Pollution Thermal pollution Noise Pollution etc which are also common to the proposed plant but it is negligible The project proponent has planned various preventive and precautionary steps to control all forms of pollutants so as to safeguard the environment Air Pollution Control The main air pollutants in the biomass based plant are Dust and particulate matter in the Flue gas Fly ash from the hoppers Furnace bottom ash etc and the steps to be taken are Electrostatic Precipitator The proposed biomass plant will have an Electrostatic Precipitator (ESP) which will separate the dust from the flue gas and has an efficiency of 992 The dust concentration in the flue gas leaving the ESP will be within the permissible limit of statutory norms Waste as Wealth The ash from the silo will be disposed off to the farmers who can use the ash as manure for the crops and to local industries who will utilize the ash for manufacture of bricks and for road building materials Water Pollution Control The main forms of water pollutants in the plant are effluents from water treatment plant Boiler blow down Sewage from the power plant buildings Water Treatment Plant The water utilized for the operation of the plant is treated before letting off so as to maintain it in neutral pH Sewage through trenches The Sewage from the various power plant buildings will be taken to a common septic tank through trenches The sewage from the septic tank will be disposed off through concrete trenches so as to prevent the soil from getting contaminated Thermal Pollution Cooling Tower The water used in the surface condenser to condense the steam will be cooled in a cooling tower of either induced or forced draft type The water let out from the cooling tower will have a temperature very close to the ambient Cooling Pond The boiler blow down water which will be at temperature of 100oC is taken to effluent pond so as to get cooled naturally Noise Pollution Control
CDM-SSC-PDD (version 02) CDM ndash Executive Board page 39 The major source of noise pollution in the biomass power plant is from rotating equipments like ID FD SA fans Feed pumps Boiler and super heater safety valves Start up vent Steam turbine DG sets etc and steps to be taken to control all these are Silencers The start up vent safety valve outlets and the DG sets will be provided with silencers to reduce the noise level to the acceptable limits Equipment Design The rotating equipments are designed in such a way so that the sound level will be between 85 to 90 dBA as per the OSHA standards Land Environment Selected tree species will be planted in the area after considering attenuation factors for air and noise pollution Green Belt Development The project proposed to develop Green Belt with in the project premises which is the one of the major component of Environmental Management Plan (EMP) Green Belt will enhance environmental quality through mitigation of fugitive emissions attenuation of noise levels balancing eco-environment consumption of treated effluents prevention of soil erosion creation of aesthetic environment Socio Economic Environment The project will provides an opportunity for local people to get employed directly or indirectly in upliftment of socioeconomic status of the area It is also proposed to do awareness and welfare programmes upliftment of social health basic needs of drinking water supply and provision of educational facilities Hence the project is not likely to have any significant adverse negative socio-economic environmental effects during execution or after commissioning during or during the operational lifetime SECTION G Stakeholdersrsquo comments G1 Brief description of how comments by local stakeholders have been invited and compiled gtgt Requirement of Stakeholder comments No specific public consultation participation requirements are specified in Indian statutes for setting up of small-scale industries However there are certain procedural requirements which every project investor needs to follow before implementing any project Before implementing any project project investors developers need to identify the stakeholders prepare necessary documents approach the identified stakeholders directly and obtain required clearances approvals The stakeholders after review of documents and investment profile will accord approvals licences or send comments in writing to project investors for further clarifications corrections In case they are not satisfied with the project design or they feel that the project impacts any of the local environment social economical environments they will not issue clearances approvals and stop the implementation of the project
CDM-SSC-PDD (version 02) CDM ndash Executive Board page 40 Identification of Stakeholders The project participants as required for setting up the project have identified the following stakeholders Local populace Local populace represented by the Borawand (BK) Gram Panchayat the elected administrative body of the village Borawand where the project is getting implemented will issue No-Objection Certificate (NOC) for setting up of the project under the jurisdiction of the village Maharashtra Energy Development Agency (MEDA) Maharashtra Energy Development Agency (MEDA) the state nodal agency under the umbrella of the Ministry of Non Conventional Energy Sources (MNES) Govt of India to undertake development techno-economic viability of renewable energy and facilitates energy conservation in the state of Maharashtra (wwwmahaurjacom) Maharashtra Sate Electricity Board (MSEB) Maharashtra State Electricity Board (MSEB) a state utility company looks after power generation transmission and distribution through out the state of Maharashtra (wwwmsebindiacom) Maharashtra Electricity Regulatory Commission (MERC) Maharashtra Electricity Regulatory Commission (MERC) has the role of tariff fixation licensing grievance redressing regulating power purchase and procurement processes of the transmission and distribution utilities throughout the state of Maharashtra (wwwmercindiaorgin) Maharashtra Pollution Control Board (MPCB) Maharashtra Pollution Control Board (MPCB) a regulatory body to monitor environmental impacts and environmental management of industries accords clearances for setting up of industries in the state after ensuring adherence to the statutory regulations Also gives Consent for Establishment (CFE) and Consent for Operation (CFO) for the project if it satisfies with the environmental management and pollution control measures (wwwmpcbmahnicin) Ministry of Non-conventional Energy Sources Govt of India (MNES) The Ministry of Non-Conventional Energy Sources (MNES) Govt of India a nodal ministry for all matters relating to new and renewable energy like Bio-energy Wind hydro Solar Geothermal Tidal etc (wwwmnesnicin) Apart from the above there are other stakeholders such as Inspector of Factories Inspector of Boilers Chief Electrical Inspectorate General etc but the role of these stakeholders is limited to examination of certain issues such as plant layout equipment designs etc These stakeholders are to be approached during the project implementation stage however will in no way obstruct the implementation of the project as long as the designs are according to the stipulated regulations The project participants prepared necessary documentation before implementation of the project activity and approached the above stakeholders individually No negative comments have been received by the project participants which is evident from the following clearances and approvals
CDM-SSC-PDD (version 02) CDM ndash Executive Board page 41 Village Panchayat Local populace represented by the Borawand (BK) Gram Panchayat the elected administrative body of the village Borawand where the project is getting implemented issued NOC (No-Objection Certificate) for the project on 16th July 2005 Maharashtra Energy Development Agency (MEDA) Maharashtra Energy Development Agency (MEDA) has issued lsquoIn Principle Clearancersquo for setting up of project vide BPP-06104-052321 dated 26th May 2004 Maharashtra State Electricity Regulatory Commission (MERC) MERC has framed tariff policy for the project through out the state of Maharashtra which is applicable to the proposed project activity also Ministry of Non-Conventional Energy Sources (MNES) MNES has recognised the project activity under Non-Conventional Energy sources Maharashtra State Pollution Control Board (MPCB) Maharashtra State Pollution Control Board (MPCB) issued Consent for Establishment (CFE) with vide letter no BOPCI-IIROADEIC NoAD-0314-05ECC-36 and Consent for Operation (CFO) will be obtained after completion of the construction of the project and before commissioning of the project G2 Summary of the comments received gtgt No negative comments are received on the project activity which is evident from the licences approvals clearances accorded to the project activity by the stakeholders G3 Report on how due account was taken of any comments received gtgt No comments received hence no report is applicable
CDM-SSC-PDD (version 02) CDM ndash Executive Board page 42
Annex 1 CONTACT INFORMATION ON PARTICIPANTS IN THE PROJECT ACTIVITY
Organization Ms M S M Energy Limited StreetPO Box Building Plot No 1115 Road No 54 Jubilee Hills City Hyderabad StateRegion Andhra Pradesh PostfixZIP 500 033 Country India Telephone +91- 40- 2355 0597 2355 0598 FAX +91- 40- 2354 1339 E-Mail msmenergyrediffmailcom URL Represented by Title Managing Director Salutation Dr Last Name S M Middle Name First Name Manepalli Mobile Direct Fax +91- 40- 2354 1339 Direct Telephone +91- 40- 2355 0597 2355 0598 Personal Email
CDM-SSC-PDD (version 02) CDM ndash Executive Board page 43
Annex 2
INFORMATION REGARDING PUBLIC FUNDING No public funding from the parties included in Annex ndash I is involved in the project activity
- - - -
CDM-SSC-PDD (version 02) CDM ndash Executive Board page 44
Annex 3 Baseline Information
Baseline Information for Western Region
Station heat rate
IPCC Local emission
factor
Emissions
tCO2kcalkWh tCTJ 2006
1 1 2 1 2 3 3
Dhuvaran GEB 534 Coal 4F 145963 2717 2613 098 1066 1556487Ukai GEB 850 Coal 4F 536309 2746 2613 098 1078 5780013Gandhi Nagar GEB 660 Coal 4F 37036 2568 2613 098 1008 3732779Wanakbori GEB 1260 Coal 4F 847206 2561 2613 098 1005 8515532Sikka REP GEB 240 Coal 4F 14047 2926 2613 098 1148 1613136Torr Pow Sab AECO 330 Coal 270314 2717 2613 098 1066 2882514Torr Power AEC AECO 60 Coal 485 2717 2613 098 1066 517183GSECL (G5) GSECL 210 Coal 4F 174346 2717 2613 098 1066 1859152GSECL (W7) GSECL 210 Coal 4F 170931 2717 2613 098 1066 1822736Utran GT GSECL 144 Gas HBJ 107744 2061 153 0995 481 518124Dhuvaran CCPP GSECL 1066 Gas HBJ 70733 2061 153 0995 481 340144Hazira CCCP GSEGL 1561 Gas HBJ 118221 2061 153 0995 481 568506GTE CORP GTE 655 Gas HBJ 475599 2061 153 0995 481 2287079Kawas GT NTPC 644 Gas HBJ 28842 2061 153 0995 481 1386965Gandhar GT NTPC 648 Gas HBJ 44782 2061 153 0995 481 2153494Torr PowVatGT AECO 100 Gas HBJ 71817 2061 153 0995 481 345356Essar GT IMP Essar 515 Gas HBJ 180094 2061 153 0995 481 866043GIPCL GT GIPCL 154 Gas HBJ 232114 2061 153 0995 481 1116199Surat LIG GIPCL 250 Lignite 187415 2742 2895 098 1192 2234571Akrimota GMDCL 250 Lignite 16829 2717 2895 098 1181 198825Kutch LIG GEB 215 Lignite 66962 3368 2895 098 1465 980670UKai GEB 305 Hydro 58049 0 0Kadana GEB 240 Hydro 20917 0 0SSarovar RBPH SSVNL 1000 Hydro 175286 0 0SSarovar CHPH SSVNL 250 Hydro 20865 0 0Kakrapara NPC 440 Nuclear 236694 0 0
MADHYA PRADESHSatpura MPGPCL 11425 Coal 4F 758125 3288 2613 098 1290 9783310Amar Kantak MPGPCL 60 Coal 4F 15026 2717 2613 098 1066 160231Amar Kantak Ext MPGPCL 240 Coal 4F 95257 3918 2613 098 1538 1464787Sanjay Gandhi MPGPCL 840 Coal 4F 485634 2829 2613 098 1110 5392066Vindh_Chal STPSNTPC 2260 Coal 3E 183046 2717 2613 098 1066 19519248Gandhi Sagar MPGPCL 115 Hydro 14801 0 0Bargi MPGPCL 90 Hydro 56535 0 0Pench MPGPCL 160 Hydro 42213 0 0Madhikhera MPGPCL 0 Hydro 0 0 0Rajghat (MP) MPGPCL 45 Hydro 13568 0 0Bansagar (I) MPGPCL 315 Hydro 99657 0 0Bansagar (II) MPGPCL 30 Hydro 15612 0 0Bansagar (III) MPGPCL 60 Hydro 8919 0 0Bansagar(IV) MPGPCL 0 Hydro 0 0 0Binsinghpur MPGPCL 20 Hydro 5569 0 0Tawa HEGL 135 Hydro 2388 0 0Indira Sagar NHDC 1000 Hydro 257297 0 0
Oxidation factor (IPCC)
Net Generation GWh 2006
Emission factor
tCO2GWh
GUJARAT
Power Stations OwnerInstalled capacity
MWFuel
CDM-SSC-PDD (version 02) CDM ndash Executive Board page 45
CHATTISGARHKorba-II CSEB 200 Coal 4F 161063 2946 2613 098 1156 1862266Korba-III CSEB 240 Coal 4F 15871 2946 2613 098 1156 1835060Korba-West CSEB 840 Coal 4F 574638 2653 2613 098 1041 5983355Korba-STPS NTPC 2100 Coal 4F 160013 2717 2613 098 1066 17063107Hasdeobango CSEB 120 Hydro 35828 0 0Gangrel CSEB 5 Hydro 872 0 0
MAHARASTRANasik MSEB 910 Coal 4F 575317 2651 2613 098 1040 5985909Koradi MSEB 1100 Coal 4F 646034 2981 2613 098 1170 7558412K_Kheda II MSEB 840 Coal 4F 570399 2600 2613 098 1020 5820567Paras MSEB 625 Coal 4F 47972 3198 2613 098 1255 602115Bhusawal MSEB 4825 Coal 4F 338168 2635 2613 098 1034 3497247Parli MSEB 690 Coal 4F 51612 2665 2613 098 1046 5398351Chandrapur MSEB 2340 Coal 4F 1398727 2611 2613 098 1025 14333526Dhanu BSES 500 Coal 2W 432311 2298 2613 098 902 3899056Trombay TATA MAH1150 Coal 3E 785436 2717 2613 098 1066 8375556Uran GT MSEB 672 Gas HBJ 243023 2061 153 0995 481 1168658Uran WHP MSEB 240 Gas HBJ 131835 2061 153 0995 481 633973Trombay GT TATA MAH180 Gas HBJ 133075 2061 153 0995 481 639936Dhaboi GT ENRON 740 Gas HBJ 0 2061 153 0995 481 0Koyna MSEB 1960 Hydro 446306 0 0Vaitarna MSEB 615 Hydro 17087 0 0Tillari MSEB 60 Hydro 18295 0 0Bhira Tail Race MSEB 80 Hydro 9876 0 0Eldari MSEB 225 Hydro 163 0 0Veer MSEB 9 Hydro 4636 0 0Bhatgarh MSEB 16 Hydro 5776 0 0Paithon MSEB 12 Hydro 2492 0 0Bhandardhara MSEB 44 Hydro 4489 0 0Pawana MSEB 10 Hydro 1351 0 0Radhanagri MSEB 48 Hydro 897 0 0Kvasla (Panshet) MSEB 8 Hydro 5824 0 0K_Vasla (Varsa) MSEB 8 Hydro 215 0 0Bhatsa MSEB 15 Hydro 8514 0 0Kanher MSEB 4 Hydro 147 0 0Ujjaini MSEB 12 Hydro 4404 0 0Surya MSEB 6 Hydro 2262 0 0Manikhod MSEB 6 Hydro 805 0 0Dhom MSEB 2 Hydro 105 0 0Dimbe MSEB 5 Hydro 1058 0 0Warna MSEB 16 Hydro 609 0 0Dudh Ganga MSEB 24 Hydro 5902 0 0Bhira TATA MAH150 Hydro 47979 0 0Bhira PSS TATA MAH150 Hydro 70146 0 0Bhivpuri TATA MAH72 Hydro 42783 0 0Khopoli TATA MAH72 Hydro 41447 0 0Tarapur NPC 860 Nuclear 371463 0 0
GOAReliance Energy REL 48 Coal 30275 2717 2613 098 1066 322840Total 18687154 162575084
CDM-SSC-PDD (version 02) CDM ndash Executive Board page 46
Summary Year - 200506
GWh Emissions Hydro 15831 0 8Coal 137242 147136542 73Gas 25005 12024477 13Lignite 2712 3414066 1Nuclear 6082 0 3Total 186872 162575084 100
Avg sumEFBaseline 870
References BASE LINE DATA The methodology adopted for the calculation of the baseline is lsquoSimple weighted average of the current generation mixrdquo Year 2005-06 is considered as the base year for prediction of future capacity additions during the crediting period Western Grid generation data as tabulated in Enclosure-II is used for consideration of installed Western grid capacity and energy availability during the period 2005-06 In order to arrive at the detailed break up of power generation mix in Western Region various documents and various web sites were refereed The websites refereed for estimating the generation mix in Western regional grid are 1 httpmnesnicin 2 httpceanicin 3 Revised 1996 IPCC Guidelines for National Greenhouse Gas Inventories Reference Manual 4 Indiarsquos Initial National communication to United Nations Framework convention on climate change (UNFCCC) As per the availability actual generation figures as against the sector wise installed capacity were used Wherever the break up of generation was not available proportionate calculated figures were used so as to match the total energy availability References for completing PDD
1 Website of United Nations Framework Convention on Climate Change (UNFCCC)
httpunfcccint 2 UNFCCC document Clean Development Mechanism Simplified Project Design Document
For Small Scale Project Activities (SSC-PDD) Version 02 3 UNFCCC document Simplified modalities and procedures for smallndashscale clean
development mechanism project activities 4 UNFCCC document Indicative simplified baseline and monitoring methodologies for
selected small-scale CDM project activity categories Version 09 28th July 2006 5 Detailed project reports of project
CDM-SSC-PDD (version 02) CDM ndash Executive Board page 47
Annex ndash 4
Abbreviations
CEA Central Electricity Authority CO2 Carbon dioxide
EIA Environment Impact Assessment GHG Greenhouse gas GWh Giga watt hour IPCC Inter Governmental Panel On Climate Change kWh Kilo watt hour MEDA Maharashtra Energy Development Agency MERC Maharashtra Electricity Regulatory Commission MPCB Maharashtra Pollution Control Board MSEB Maharashtra State Electricity Board MW Mega watt MNES Ministry of Non Conventional Energy Sources PDD Project design document UNFCCC United Nations Framework Convention on Climate Change
Annex-5
CDM-SSC-PDD (version 02) CDM ndash Executive Board page 48 MINUTES OF THE STAKEHODLERS MEETING WITH RESPECT TO 10MW BIOMASS BASED POWER PROJECT OF MSM ENERGY LTD HELD AT BORDWAND VILLAGE PARBHANI TAHSIL PARBHANI DISTRICT MAHARASHTRA STATE MSM Energy Ltd the project proponent of 10 MW Biomass based power project have conducted a public meeting with the farmers and the village Panchayat members of Bordwand village on 29th June 2006 at IST 1130 AM to ascertain the views of the stakeholders with respect to setting up of the biomass based power project In response to the notice from the project proponent panchayath members and number of farmers have participated in the public meeting and expressed their views on the project Proceedings of the meeting are summarized below The following members have attended the meeting Panchayat Members
1 Gopal Kulkurni ndash Gram Panchayat Sarpanch 2 Subhash Hingane ndash Up-sarpanch 3 Gangadhar Bigde 4 Sheshrao Gangade 5 Namdev Kavle 6 Ganpath Kamble 7 Raghunath Raut 8 Baghwan Kavle
Farmers 1 Balasaheb Kavle 2 Basel Kavle 3 Ramkishan Kavle 4 Saheb Kavle 5 Baghwan Hingane 6 Datta Gangode 7 Balu Gore 8 Dashrath Binde 9 Vidul Kavle 10 Bansidhar Kavle 11 Namdev Kavle 12 Nilkanth Kulkurni 13 Dashrath Levde 14 Atul Kulkurni 15 SIsmail 16 Ashok Kamble 17 Munjabhalu Kamble 18 Anantha Thambre 19 Kachruba Binde 20 Suresh Binde 21 Maghid Binde 22 Ganesh Ramjhau Larne 23 Ramkishan Hingane 24 Rambhalu Harkal 25 Pandit Rusthumrao Hingane 26 Baburao Vamrao Langde 27 Baghwan Narhari
CDM-SSC-PDD (version 02) CDM ndash Executive Board page 49
28 Rojkau Panduraganpath raut 29 Namdev Shesrao Langde 30 Shek Shaeed 31 Shyam Kavle 32 Farukh S Ismail
Representatives of Project proponent
Mr Ravi Venkat and Mr Nitin Pandit Rao Wagh Consultants
K Ram Babu Sarpanch of Bordwand gram panchyath SriGopal Kulkurni initiated the meeting expressing his deep regret for arranging the meeting at plant site in open space as the panchayath office is under renovation Sarpanch also gave thanks to Mr Ravi Venkat for conducting the meeting which will clear off doubts of the villagers Mr Ravi Venkat addressed himself and the consultant to the villagers and explained briefly about the power generating unit and employment opportunities The members expressed happiness after hearing from Mr Ravi Venkat about employment opportunities and requested the company to recruit the local people Mr Ravi Venkat assured the members that priority would be given to local people for employment One of the member inquired about total cost of the project and is it feasible for the company to establish one textile unit which will benefit local farmers to sell their agriculture produce Mr Ravi Venkat explained the members that total investment for setting up the power generating unit has been estimated around Rupees 45 crores and also assured the members that he will put forward the proposal for setting up a textile unit before the management On inquiring about source of water for operation of the plant Mr Ravi Venkat explained to the members that water will drawn from the canal which is at a distance of 15 Kms from the plant site and also through bore wells The members expressed dissatisfaction on meeting water requirement by means of bore wells as this may lead to water problem in the local area Mr Ravi Venkat explained that bore wells will be utilized as emergency source and substantial quantity of water will be drawn from the canal and mentioned the progress of the official proceedings for drawing of water from the canal All the members were satisfied and requested the company to use water judiciously The members also requested Mr Ravi Venkat to put the matter in front of the management and suggested to construct a reservoir for captive purpose if possible near the plant site The members inquired about the landed cost of crop residues and whether sugar cane trash amp tops can be used as raw material Mr Ravi Venkat felt sorry for not having information about using sugar cane residues as raw material but assured the members to inquire about the same from the corporate office Regarding landed cost of residues MrRavi Venkat mentioned that cost of raw materials would be around Rs 350 to 450 per tonne The members expressed their willingness to supply raw materials and requested the company management to increase the cost of raw materials The members also assured that the company can procure substantial quantity of raw materials provided the cost of raw material is increased The members also informed Mr Ravi Venkat that Parbhani and adjoining districts such as Hingoli are one of important cotton producing districts in the state of Maharashtra and presently 60 of the cotton stalks is being burnt in the fields hence the company can procure sufficient quantity of raw material for operation of the plant On questioning about the project commissioning period Mr Ravi Venkat informed the members that construction of the unit will start within a period of two months and the unit will be commissioned by June 2008 The meeting was terminated at 130 PM (IST) with Gram Panchayath Sarpanch giving vote of thanks on behalf of the
Panchayath
CDM-SSC-PDD (version 02) CDM ndash Executive Board page 50 members to all the participants of the meeting and wished the company to commission the project at the earliest The Sarpanch requested the company management to contribute some monetary help for the renovation of the village temple Mr Ravi Venkat assured the sarpanch that he will discuss the issue with the Managing Director personally
CDM-SSC-PDD (version 02) CDM ndash Executive Board page 51
- a) Justification for application of simplified methodology to the project activity
- b) National Policies and Circumstances
- c) Additionality
- Technological Barriers
-
- Annex 1
-
CDM-SSC-PDD (version 02) CDM ndash Executive Board page 2
Revision history of this document
Version Number
Date Description and reason of revision
01 21 January 2003
Initial adoption
02 8 July 2005 bull The Board agreed to revise the CDM SSC PDD to reflect guidance and clarifications provided by the Board since version 01 of this document
bull As a consequence the guidelines for completing CDM SSC PDD have been revised accordingly to version 2 The latest version can be found at lthttpcdmunfcccintReferenceDocumentsgt
CDM-SSC-PDD (version 02) CDM ndash Executive Board page 3 SECTION A General description of the small-scale project activity A1 Title of the small-scale project activity gtgt 10 MW biomass based Renewable energy generation for the grid in Parbhani District of Maharashtra India A2 Description of the small-scale project activity gtgt The proposed small scale project activity will utilise surplus biomass residues ie crop residues available locally to generate electricity for a grid system owned by the state owned power utility Maharashtra State Electricity Board (MSEB) looking after electricity generation transmission and distribution The location of the project was selected after due consideration of availability of biomass availability of water power evacuation facilities etc Parbhani District has abundance availability of biomass (crop residues) resources which were not being properly managed due to poor understanding of their energy value and importance for development of the rural economy Hence the project proponents decided to tap the potential for power generation and contribute to the rural development as well as climate change mitigation The proposed project activity will generate power through sustainable means without causing any negative impact on the environment and export the generated electricity to the 3311 kV Pangari substation owned by MSEB which is at a distance of 5 km from the project site The whole process supports in climate change mitigation as it leads to emission reduction of 425247 tonnes of CO2 eq over the crediting period of 10 years The implementation of the project activity would bring in the following local benefits
bull Economic utilization of surplus biomass bull Generation of additional income to the rural farmers due to purchase of surplus crop residues
from them bull Climate change mitigation through renewable energy generation and reducing the demand for
fossil fuel based power bull Contributing to the national electricity capacity through additional power generation bull Creation of indirect employment for rural youth for collection and transportation of biomass for
the project bull Contribution to the availability of stable power in the local area
View of project participant about the project activityrsquos contribution to Sustainable Development Ministry of Environment and Forests (MoEF) Government of India has stipulated the following indicators for sustainable development in the interim approval guidelines for CDM projects
1 Social well-being 2 Economic-well being 3 Environmental well being and 4 Technological-well being
CDM-SSC-PDD (version 02) CDM ndash Executive Board page 4 The project activity contributes to the above indicators in the following manner
Social well being The proposed 10 MW biomass based power project caters jobs for number of persons in the rural area in various sectors like construction of the plant biomass collection processing biomass transportation of biomass as well as in the operation of the power plant Apart from the direct employment generation proposed project also encourages indirect employment by setting up other agro industries due to sufficient power supply from the proposed project Commercial value to agricultural residues will encourage the farmers to collect biomass from fields and effectively utilize the barren and uncultivable lands for energy plantations which will improve the income levels of the farmers The proposed project will engage both genders in construction of the project biomass collection biomass processing etc during operation lifetime of the project and this will lead to increase in Gender Equity and prevents social disparities Economic well being The proposed project will bring in additional capital investment and indirectly supports creation of local infrastructure like roads schools and other basic civic amenities The project acts as a nucleus for other economic activities such as setting up of cottage industries shops hotels etc around the area contributing to the economic development around the project area The proposed biomass plant will help local farmers in earning extra money by selling crop residues there by helping them to improve their economic standards The proposed biomass based power generating plant facilitates the availability of continuous and sustained power to the local industries and agricultural farmers located in remote areas there by avoiding the load shedding and low frequency of power Environmental well being The proposed project activity utilises biomass potential available for power generation which otherwise is dominated by fossil fuels such as coal lignite and gas the project will not result in increase of GHG emissions and cause no negative impact on the environment The project generates real measurable and long-term emissions reductions The project utilizes surplus biomass residues and thereby reduces fossil fuels The project conserves local resources reduce pressure on the local environment to a great extent provide improved health and other environmental benefits Technological well being The CDM project activity should leads to increase in utilization of biomass resources for power generation and contributes to the energy security in the country The above benefits due to the project activity ensure that the project would contribute to the sustainable development of the region
CDM-SSC-PDD (version 02) CDM ndash Executive Board page 5 A3 Project participants gtgt
Name of the party involved ((Host) indicates a host party)
Private andor public entity (ies) project participants
Whether party involved wishes to be considered as project
participant
India (Host)
Private Entity MSM Energy Limited
Hyderabad
No
A4 Technical description of the small-scale project activity gtgt A41 Location of the small-scale project activity gtgt A411 Host Party(ies) gtgt India A412 RegionStateProvince etc gtgt Maharashtra A413 CityTownCommunity etc gtgt District Parbhani Taluk Parbhani Village Borawand A414 Detail of physical location including information allowing the unique identification of this small-scale project activity(ies) gtgt The proposed project is located in Borawand Village Parbhani Taluk amp District of Maharashtra The site premise which is accessible only by road is located at a distance of 15 kms from Parbhani the district head quarters The nearest railway station is at Parbhani and the nearest seaport is at Mumbai The location address of the project is furnished below Ms MSM Energy Limited 10 MW Biomass based Power Project (Parbhani) Gut No 128 129 Borawand Village Parbhani Tehsil Parbhani District Maharashtra State India Physical location of the project is marked in the maps below
CDM-SSC-PDD (version 02) CDM ndash Executive Board page 6
Map Location of Maharashtra state (Marked in yellow) in India
Map Location of Parbhani district in Maharashtra state
Location of Parbhani district
CDM-SSC-PDD (version 02) CDM ndash Executive Board page 7
Map location of 10 MW Biomass project in Parbhani district
A42 Type and category(ies) and technology of the small-scale project activity gtgt According to the Appendix B to the simplified modalities and procedures for small-scale CDM project activities the proposed project activity fall under the following type and category Project type Type I - Renewable Energy project Category ID - Renewable Electricity Generation for a grid (version 9 dated 28 July 06) Since the capacity of the proposed CDM project is only 10 MW which is well below the qualifying capacity of 15 MW the project activity can be regarded as a small scale CDM project activity and UNFCCC indicative simplified modalities and procedures can be applied Since the maximum electricity generating capacity is limited by its design and construction there is no possibility of exceeding the limits of small-scale CDM project activities during the crediting period and the project activity will remain as a small scale project activity Technology The project is designed to generate electricity for grid system using multi-fuels The basic technology is Rankine cycle route where direct combustion of biomass materials takes place through the multi-fuel fired boiler to generate high pressure and high temperature steam which drives an impulse turbine generator set
Location of 10 MW Biomass project
CDM-SSC-PDD (version 02) CDM ndash Executive Board page 8 The plant and machinery of the project consists of one number traveling grate boiler one number steam turbine generator set power evacuation system and fuel handling system etc Other plant equipment include fuel conveyors ash handling system water treatment plant compressed air plant etc The capacity of the turbo generator is 10 MW which generates electricity at 3311 kV level It is anticipated that the plant can operate at about 70 in the first year and 80 plant load factor (PLF) from second year onwards Average annual estimate of power export to the grid system is 5519 GWh for first year and 6307 GWh for the subsequent years Table 1 Technical details of Biomass power plant Boiler Type Travelling Grate Bi-drum Boiler capacity (100 load) Steam Flow rate 50 tons hour Steam pressure at super heater outlet 66 ata Steam temperature at super heater outlet 490oC Water requirement 67 m3 hour Turbo Generator Type Double bleed cum condensing Steam pressure at the TG inlet 64 ata Steam temperature at the TG inlet 480oC Generator Voltage 11 kV Frequency 50 Hz Power factor 08 RPM 1500 Condenser type Surface condenser Water cooled Power evacuation Grid Voltage 33 kV MSEB Sub station Pangari 3311 kV Energy production Gross power 10 MW Auxiliary consumption (10) 10 MW Net power for export 90 MW Auxiliaries Fuel handling Series of belt conveyors Demineralization plant capacity 25 m3 hour Bottom ash handling Belt conveyors Fly ash handling Pneumatic conveying system Cooling tower RCC counter flow 2750 m3 hour No technology transfer is envisaged for the proposed CDM project activity A43 Brief explanation of how the anthropogenic emissions of anthropogenic greenhouse gas (GHGs) by sources are to be reduced by the proposed small-scale project activity including why the emission reductions would not occur in the absence of the proposed small-scale project activity taking into account national andor sectoral policies and circumstances gtgt Project activity and baseline scenario
CDM-SSC-PDD (version 02) CDM ndash Executive Board page 9 The project activity is setting up a 10 MW biomass based power plant The project activity will supply its power to the western grid of India leading to the displacement of Carbon intensive electricity by generation of electricity from a renewable energy source Implementation of the project activity is scheduled for completion by December 2007 The project activity will start generating emission reductions from January 2008 The baseline scenario in the absence of project activity continues to be highly carbon intensive and emission reductions generated by the project activity are additional The associated emission reductions are calculated based on the net amount of electricity fed into the grid and the weighted average emission factor for the grid Additionality The project activity is not the baseline scenario and the emission reductions would therefore not occur in the absence of the project activity The project activity is not required by law and the national and state policies in place are not sufficient to make the project commercially viable on its own The project faces barriers which in the absence of CDM would be prohibitive These barriers include
- Prevailing practice In the State of Maharashtra against an estimated potential of 781 MW only one biomass plant of 8 MW is established based on biomass resources
- Price fluctuations of biomass leading to uncertainty of profitability
- Difficulties in collection and handling of biomass
- Lack of policy support
Table 2Potential for Non-Conventional Energy Sources in Maharashtra and in All India 1
As observed from the table above though the potential for power generation from biomass in the state of Maharashtra is 781 MW only one plant has been established so far Whereas the proposed CDM project activity generates electricity using surplus biomass which otherwise would have been left for decay or it would have burnt causing environmental nuisance consumption of renewable biomass for generating
1 Future Energy Maharashtra Energy Development Agency (MEDA) Vol3 No1 Jan-Mar 2005
S No Source Potential in Country (MW)
Potential in Maharashtra (MW)
Achievement (MW)
1 Wind 45000 3650 456775 2 Small Hydro 15000 600 207080 3 Biomass 16000 781 8 4 Bagasse
Co-generation 3500 1250 735
5 Urban and Industrial waste
1700 450 6126
Total 81200 6731 749481
CDM-SSC-PDD (version 02) CDM ndash Executive Board page 10 electricity does not give rise to release of GHGs and in fact it is referred to as carbon neutral Hence electricity generation by the proposed project activity is less GHG intensive than the current grid electricity mix and results in reduced anthropogenic GHG emissions CDM will help to make the proposed project activity viable The CDM revenues will help to deal with various risks associated with the project as described above For details on baseline additionality and national and Sectoral policies please refer to Section B2 and B3 A431 Estimated amount of emission reductions over the chosen crediting period gtgt Emission reductions due to the project activity depend on the energy fed to the Western regional grid and the content of fossil fuel based generation in the Western grid system Hence power fed to the regional grid and the generation mix in the baseline region becomes the basis for estimating emissions reductions The chosen crediting period for the project activity is 10 years It is estimated that the project activity would generate 425247 certified emission reductions (CER) during the crediting period of 10 years Annual estimates of emission reductions by the project activity during the above crediting period are furnished below
CDM-SSC-PDD (version 02) CDM ndash Executive Board page 11
S No Year Annual estimation of emission reductions in
tonnes of CO2 eq 1 2008 37680 2 2009 43063 3 2010 43063 4 2011 43063 5 2012 43063 6 2013 43063 7 2014 43063 8 2015 43063 9 2016 43063 10 2017 43063 Total emission reductions (tonnes of CO2 eq)
425247
Total number of crediting years
10
Annual average over the crediting period of estimated reductions (tonnes of CO2 eq)
42524
In the above table the year 2008 corresponds to 010108 to 311208 Similar interpretation shall be applied for the remaining years A44 Public funding of the small-scale project activity gtgt No public funding from Annex I Party is involved in this project activity A45 Confirmation that the small-scale project activity is not a debundled component of a larger project activity gtgt The project proponents hereby confirm that the proposed project activity is not a debundled component of another larger project activity The project proponents further confirm that they have not registered any small scale CDM activity or applied to register another small scale CDM project activity within 1 km of the proposed project boundary in the same project category and technologymeasure in the previous 2 years
CDM-SSC-PDD (version 02) CDM ndash Executive Board page 12 SECTION B Application of a baseline methodology B1 Title and reference of the approved baseline methodology applied to the small-scale project activity gtgt Project Category Title Type I Renewable Energy project Reference ID- Renewable Electricity Generation for grid Version 09 (28 July 2006)
B2 Project category applicable to the small-scale project activity gtgt With a proposed installed capacity of 10 MW the project activity qualifies as small scale and therefore is eligible to use approved methodology AMS ID The application of the methodology is described below a) Selection and justification of calculation approach The baseline emissions are calculated based on net energy exported to the grid (in GWh year) and an emission factor for the displaced grid electricity (in tCO2GWh) As per paragraph 9 of AMS ID it requires that baseline emission factor will be calculated in a transparent and conservative manner based on either a) Combined margin (CM) consisting of the combination of operating margin (OM) and build margin (BM) according to the procedures prescribed in the approved methodology ACM 0002
OR
b) The weighted average emissions (in kg CO2equkWh) of the current generation mix The project proponent has opted for approach lsquobrsquo as the proposed project is a small scale project activity and the resultant emission factor will be lower and hence more conservative than the combined margin emission factor for the following reasons Table 3 Data sources for Baseline calculations Key Parameter Value Data Source Website Power generation
Power generated by all sources including hydro nuclear and RES
All related authentic sources like CEA Ex-post deacutetermination
wwwceanicin wwwmnesnicin
CEF for fuel Carbon Emission factor for each fuel type
Indiarsquos Initial National Communication to UNFCCC and IPCC default values Ex-ante determination
wwwipccch wwwunfcccint
Fuel Type Type of Fuel used for individual plant
MNES and CEA Ex post determination
wwwmnesnicin
Oxidation factor Oxidation factor for each fuel type
IPCC default values Ex-ante determination
wwwipccch
Net Heat Rate Net heat rate of individual power plants
CEA and MNES Ex-post determination
wwwceanicin wwwmnesnicin
CDM-SSC-PDD (version 02) CDM ndash Executive Board page 13 EFy Baseline emission factor for
the project grid Calculated for power plants in the Western regional grid Ex-post determination
-----
EGy Power export to the grid per annum
From Plant and MSEB Records Ex-post determination
------
The total energy demand in Maharashtra state and also in the whole western region is increasing rapidly To meet the growing energy demand various private and public sector utilities have envisaged many new projects that are expected to become operational in near future
Table 4Fuel wise breakup of Installed Capacity in the Western Regional grid2
As per the latest records of power generating capacity of western region as on 30st April 20063 furnished in the above table the share of thermal power is around 74 whereas the non-conventional sources like hydro (19) renewable energy sources (31) are minimal Table 5 Actual power supply position Western Regional Grid during April 2005 ndash March 2006 4
Surplus (+) Deficit (-) S No States in Western Region Requirement (MU)
Availability (MU) MU ()
1 Chhattisgarh 12999 12528 -471 -362 Gujarat 57129 52428 -4701 -823 Madhya Pradesh 36851 31623 -5228 -1424 Maharashtra 102780 84132 -18648 -1815 Daman amp Diu 1346 1323 -23 -176 Dadar Nagar Haveli 2540 2532 -8 -037 Goa 2338 2338 0 0 Western Region 215983 186904 -28079 -135
2 Page no27 Power Scenario at a Glance - 2006 Central Electricity Authority 3 Page no 27 power scenario at a Glance - 2006 Central Electricity Authority 4 Page no 27-42 Power Scenario at a Glance - 2006 Central Electricity Authority
CDM-SSC-PDD (version 02) CDM ndash Executive Board page 14
Table 6 Peak Demand Peak Met Western Regional Grid during April 2005 ndash March 20065 Surplus (+) Deficit (-)
S No States in Western Region Peak Demand
(MW) Peak Met
(MW) MW () 1 Chhattisgarh 2133 1857 -276 -1292 Gujarat 9783 7610 -2173 -222 3 Madhya Pradesh 6558 5136 -1422 -2174 Maharashtra 16069 12360 -3709 -231 5 Daman amp Diu 324 324 0 06 Dadar Nagar Haveli 387 387 0 07 Goa 368 368 0 0 Western Region 31772 25257 -6515 -205 As seen from the above tables the Energy requirement of Western region during 2005-06 is deficit by 28079 MU or135 The peak energy demand is deficit by 6515 MW or 205 during the year 2005-06 Further as per the 16th Electric Power Survey by Central Electricity Authority the growth in the energy requirement is around 62 until 2017 Based on the information available on western regional grid capacity additions during 11th plan it is observed that grid system in future will be carbon intensive due to major share of power coming from coal gas and diesel based thermal power plants
Table 7 Installed Capacity in Maharashtra6
bull Renewable Energy Sources (RES) includes Small Hydro Project (SHP) Biomass Gas (BG) Biomass Power (BP) Urban amp Industrial Waste (U amp I) Wind Energy
As seen in the table above the power generating capacity of Maharashtra as on 30 April 2006 share of thermal power is around 72 whereas the non-conventional sources like hydro and renewable energy sources contributes only 24 As per the data published in CEA website6 the Energy requirement in the state of Maharashtra during
5 Page no 27-42 Power Scenario at a Glance - 2006 Central Electricity Authority 6 Page no 35-36 Power Scenario at a Glance - 2006 Central Electricity Authority
CDM-SSC-PDD (version 02) CDM ndash Executive Board page 15 2005-06 is 102780 MU and the energy availability is 84132 MU with energy deficit of 181 The peak demand for Maharashtra for the same period is 16069 MW and peak met is only 12360 MW with a peak deficit of 231 To meet the present energy demand and growth in the energy requirement in the state of Maharashtra it would be required to add additional capacities for power generation Based on the proposed conventional power projects in the state of Maharashtra it appears that the dependence will be more on conventional power projects
Table 8 Proposed conventional power projects in Maharashtra
S No Project Name Proposed Fuel
Capacity Year of Commissioning
1 New Parli TPS Unit -1 Coal 250 MW July 2006 2 New Parli TPS Unit -2 Coal 250 MW 2007-08 3 Paras TPS Coal 250 MW November 2006 4 Paras TPS Extn Unit-2 Coal 250 MW 2007-08 5 Khaperkheda TPS Extn Coal 500 MW 2009-10 6 Bhusawal TPS Extn Coal 2 X 500 MW 2008-09 7 Koradi TPS Extn Coal 2 X 500 MW During 11th Plan
period (2007 ndash 2012) 8 Chandrapur TPS Extn Coal 500 MW During 11th Plan
period (2007 ndash 2012) 9 Coal based Coastal project Coal 2 X 800 MW During 11th Plan
period (2007 ndash 2012) 10 Wani TPS Coal 1000 MW 2008-09 11 Umred TPS Coal 500 MW 2008-09 12 Dabhol ndash II Coal 1444 MW During 11th Plan
period (2007 ndash 2012) 12 Uran Gas Turbine Extn Gas 1040 MW During 11th Plan
period (2007 ndash 2012) 13 Talegaon Combined Cycle Project Gas 1400 MW During 11th Plan
period (2007 ndash 2012) 14 Ghatghar PSS Hydro 250 MW During 11th Plan
period (2007 ndash 2012) (Source 1 Future Projects Maharashtra Generation Company (MAHAGENCO) wwwmahagencoin 2 Projects under implementation Maharashtra Generation Company (MAHAGENCO) wwwmahagencoin 3 10th Plan under Execution Ministry of Power Govt of India wwwpowerminnicin 4 Capacity Addition Programme in Western Region during 11th plan period wwwpowerminnicin ) As could be seen from the above and the same situation prevailing in other states of the region western region grid will become more carbon intensive in future Hence the resultant Emission factor (combined margin) will be higher than the weighted average emission factor
CDM-SSC-PDD (version 02) CDM ndash Executive Board page 16 Hence the above scenario justifies the conservative estimation of Emission factor based on weighted average of current generation mix The details of the weighted average emission factor calculations are provided in Annex 3 The project is located in the state of Maharashtra which falls under the Western part of India Hence The baseline emission factor is calculated for the western grid of India The baseline emission factor for projection of Emission reductions is based on the latest available data for the fiscal year 200506 Actual emission reductions will be calculated ex post b) Calculation of the baseline emission factor As explained earlier the baseline for the project activity is kWh exported to the grid by the biomass project multiplied by an emission coefficient calculated in a transparent and conservative manner as the weighted average emissions (in kgCO2kWh) of the current generation mix of the western region For this purpose the generation data published by Central Electricity Authority (CEA) for the western region was used Baseline emissions were estimated as explained below
i Estimation of emissions from each power generating unit in the baseline Emissions from each fossil fuel source are estimated using the following formula
Baseline Emissions
tCO2
= Net Generation
GWh
x Carbon Emission Factor tCTJ
x Net Station Heat Rate
TJGWh
x Conversion Factor (4412)
x Oxidation Factor
For estimation of emissions from each power generating unit in the grid actual generation data and station heat rates monitored and published by CEA is used IPCC default emission factors as well as local values (Indiarsquos Initial National communication) for carbon emission factor (CEF) and IPCC oxidation factors of each fuel type are used The CEA published data on Net heat rates of Thermal power plants (Performance Review of Thermal power stations) and CEA norms on station heat rates published in MNES Baselines report is considered to calculate the baseline emission factor Using the above formula emissions from each power generating source are estimated For non-fossil fuel sources such as hydro nuclear and renewable energy sources GHG emissions are not applicable ii Total grid emissions Total emissions from all stations in the grid are estimated by summation of emissions from all baseline power generating units iii Estimation of baseline emission coefficient The baseline emission coefficient for the grid is estimated as the weighted average of all existing generation sources using the following formula
Baseline Emission Factor
= Baseline Emissions
Total Net Generation
CDM-SSC-PDD (version 02) CDM ndash Executive Board page 17
tCO2GWh tCO2 GWh Using the above formula and data for the year 2005-2006 the baseline emission coefficient is estimated as 870 t CO2 GWh The detailed data underlying this calculation is furnished in Annex 3 For the purpose of projecting Emission reductions Emission Factor of the year 2005-06 is considered However the Baseline Emission factor will be updated ex-post every year during the crediting period B3 Description of how the anthropogenic emissions of GHG by sources are reduced below those that would have occurred in the absence of the registered small-scale CDM project activity gtgt a) Justification for application of simplified methodology to the project activity
The capacity of the proposed project is 10MW and the project activity is generation of electricity for a grid system using renewable biomass potential Hence the type and category of the project activity meets the criteria specified under AMSID in Appendix B of the indicative simplified baseline and monitoring methodologies for small scale CDM project activities as well as those related to demonstration of additionality for small-scale activities (Attachment A to Appendix B) b) National Policies and Circumstances
National policy on Coal Lignite Oil and Natural Gas The Ministry of Power (MoP) Government of India has set an agenda of providing power for all by the year 2012 To meet the present national deficit of 1637 and to achieve the above target about 100000 MW of new capacity needs to be added by the end of 2012 to the existing installed capacity of 1243028 MW In line with the Five Year Plan system being followed by the Planning Commission of India the MoP decided to add about 46000 MW during the period 2002-2007 and about 61000 MW during the period 2008-2012 Emphasis has been laid on setting up large pithead stations to avoid high costs associated with transporting high ash bearing Indian coal and over-straining the already stretched rail network To push forward the power sector reforms further the Government of India has opened up the coal sector for private participation Captive coal mining is allowed by the Ministry of Coal to facilitate coal mining by power generating units for their fuel needs In addition coal imports are allowed for power projects This has significantly strengthened the preference of the private sector for coal-based mega power projects over other energy sources The Government of India has also opened oil and natural gas exploration for private sector participation In the oil and natural gas sector both central and private sector organisations are involved and already exploring the potential available in India The discovery of new reserves is not significant enough to meet the increasing demand for natural gas As yet the natural gas consumption is limited to a small extent and significant investments are required for natural gas infrastructure Biomass power policy in India and Maharashtra
7 wwwceanicin
8 Page no 3 power scenario at a Glance ndash 2006 wwwceanicin
CDM-SSC-PDD (version 02) CDM ndash Executive Board page 18 The grid electricity in India today is clearly dominated by thermal generation predominantly coal The overall nationwide mix of thermal to hydro-electric power stands currently at around 8317 (Source wwwceanicin as on March 2006) The Ministry of Non-Conventional Energy Sources (MNES) is engaged in development of renewable energy sources in India including biomass MNES has estimated the potential for biomass projects in India to an extent of 16000 MW Against this the country has so far achieved establishment of biomass projects to an extent of only 8679 MW indicating exploitation of only about 54 of the potential In spite of Ministryrsquos resolve to encourage setting up of these projects by providing incentives such as interest subsidy tax holiday etc these projects could not be established in a large scale due to various barriers prevailing in the sector In spite of all the propagation by MNES the focus of power generation is on thermal projects primarily based on coal As indicated earlier the share of installed thermal power generation capacity in Maharashtra is over 74 and the same is expected to continue based on the planned projects in Maharashtra UNFCCC simplified modalities seek to establish additionality of the project activity as per Attachment A to Appendix B which listed various barriers out of which at least one barrier shall be identified due to which the project would not have occurred any way c) Additionality
Project participants have undertaken the following barrier analysis in support of additionality Prevailing practice In the Indian power sector the common practice is investing in only medium or large scale fossil fuel fired power projects which is evident from a host of planned projects that comprises mostly large-scale fossil fuel based power generation projects This is mainly due to the assured return on investment economies of scale and easy availability of finances The same applicable to the western region as well as Maharashtra state The various projects under planning in the state of Maharashtra (refer Table 8) and Western region during 11th plan are furnished in the following table
9 Annual report 2005-06 Ministry of Non-conventional Energy sources (MNES)
CDM-SSC-PDD (version 02) CDM ndash Executive Board page 19
Table 9Capacity additions during 11th plan period
(source Power sector profiles ndash Western region Ministry of powerhttpwwwpowerminnicinJSP_SERVLETSinternaljsp )
CDM-SSC-PDD (version 02) CDM ndash Executive Board page 20 As could be seen from the above the total likely capacity additions in western region during the 11th plan is 18602 MW Out of which the share of thermal power is 17342 MW which is about 93 of the total capacity addition planned in western Region In the private sector participation of western region capacity addition during 11th plan is entirely dominated by thermal power plants The total private sector participation in western region during 11th plan is 6502 MW out of which the thermal power plants contributes to 6102MW (94) This is obvious from the above that the investors in both public and private sector are interested to invest in thermal energy projects only Hence investing for a biomass based power plant is not a common practice in the region The share of electricity from small biomass electric projects in Indiarsquos total installed capacity is negligibly small According to the latest statistics published by the Ministry of Non-Conventional Energy Sources (MNES)10 the total installed capacity of small biomass projects is only 867 MW where as the Indiarsquos total installed capacity is around 124287 MW11 which accounts for less than 1 In the state of Maharashtra against an estimated potential of 781 MW only one biomass based power plant with capacity of 8 MW is established The existing Maharashtra state grid mix comprises of 7246 Thermal 2007 hydro 439 renewable energy 307 Nuclear (Calculated from Table 7 above) This clearly illustrates that establishing a biomass based power plant is not a common practice in the state of Maharashtra Financial barrier The following barriers prevent investment in a biomass-based power plant with out additional revenue from CDM Fluctuations in price of biomass The success of biomass based power plant depends on the price of biomass material required for power generation Price of biomass depends on the following on which the project proponent has no control
bull Biomass prices unlike fossil fuel are not regulated by any agency The farmers at times sell the residues by taking their own decision on fixing price At present the average cost of biomass is around Rs1000-1100 per tonne as against Rs 760 per tonne at the time project was envisaged The price of biomass fluctuating continuously due to creation of commercial value for the product which has no market value early to establishment of Power plant making the cost of generation unstable
bull It has been experienced in other states where the biomass plants are established that price
variation is substantial ranging from 25 and even up to 50 Evidence is also found from some of the registered biomass projects under CDM the fluctuation in price of biomass after the plants commence operations
Due to this lack of price stability the cost of power generation is unpredictable
10 Ministry of Non Conventional Energy Sources (MNES) Govt of India Annual Report 2005-06 11 All India Total Installed Capacity (as on 3rd April 2006) Ministry of Power Govt of India wwwpowerminnicin
CDM-SSC-PDD (version 02) CDM ndash Executive Board page 21 Lack of policy related support Ministry of Non-conventional Energy Sources Govt of India has announced a policy for development of renewable energy projects in India in 1993 and closely on the lines of MNES policy Government of Maharashtra came with its policy for the renewable energy projects including biomass in May 1998 The salient features of both MNES and the Maharashtra Govt policy for renewable energy are as follows
Table 10Salient features of MNES Policy and Govt of Maharashtra Policy S No Subject MNES Govt of India
policy Govt of Maharashtra (GoM) policy
1 Year announced 1993 1998 2 Power purchase rate Rs225 kWh Rs225 kWh 3 Base year 1994-95 1994-95 4 Escalation every year 5 5 5 Wheeling Charges 2 2 6 Banking Charges 2 2 7 Period for banking 1 year 1 year 8 Transmission line losses 0 0
From project to SEB substation
To be borne by developer
To be borne by developer
9 Power evacuation facility EHV HV substation
including augmentation strengthening of evacuation system
To be borne by utility To be borne by utility
10 Power purchase by -------------- MSEB 11 Third party sale ------------- Allowed 12 Capital subsidy ------------ 30 subject to a max
of Rs20 lakhs 13 Others 1 Income Tax holiday
2 Accelerated depreciation
3 Concessional custom duty duty free import
4 Interest subsidy
1 Pass through of conventional fuel cost 2 Protection to foreign exchange fluctuation risk 3 Sales tax benefits up to 50 4Refund of entry tax octroi
(Source 1 Ministry of Non-Conventional Energy Sources (MNES) Govt of India wwwmnesnicinguidehtm 2 Maharashtra state tariff policy adopted httpwwwmnesnicinannualreport2001_2002_Englishch5_pg13htm ) Attracted by the above policy of GoM number of developers proposed biomass based power plants in the state of Maharashtra and obtained a clearance to set up the power projects Subsequently GoM scrapped its policy in the year 2001 By that time the promoters have taken several steps for implementation of the project and have to stop all their efforts Due to delay in formulation of the policy the developers have formed an association under the name Maharashtra Biomass Energy Developers Association (MBEDA) and filed a petition before the
CDM-SSC-PDD (version 02) CDM ndash Executive Board page 22 Maharashtra Electricity Regulatory Commission (MERC) for a tariff policy MBEDA has also worked out fair tariff for their projects with supporting arguments After prolonged process MERC came out with its tariff order dated 8th August 2005 on setting up of biomass-based power plants Copy of the tariff order made by MERC will be made available to the validator during the course of validation Thus the entire process took almost five years and then only a final policy was formulated for these biomass power plants This is one of the reasons why only one plant is established in Maharashtra based on biomass This is against an estimated potential of 781 MW (Refer Table 2 above) projected by Maharashtra Energy Development Agency MERC has come out with its ruling on tariff payable to the biomass based power plants and the salient features of the same are produced below
Table 11 MERCrsquos tariff structure
Subject MERCrsquos Ruling Tariff Rs318 kwh Annual Escalation upto 13 years from base year
5
Base year 2004-2005 Third party sale Permitted Energy purchase agreement between MSEB and Biomass project developer
Approved
Wheeling Charges in case of third party sale irrespective of the distance
2
Charge for transmission line losses 5 Use of fossil fuels when there is no sufficient biomass available
Upto 25 of annual fuel requirement
Penalty for shortfall in supply of energy Rs025 RkVAh (reactive power)
Review of tariff rate and structure After 5 Years Capital cost Rs 4 crore MW Capacity MEDA has to ensure that there
is no overlap MEDA has to give opinion on fuel availability for each project before entering into EPA
Plant Load Factor (PLF) 70 (1st year) 80 (From 2nd year onwards)
Auxiliary consumption 10 Station heat rate 114 kgkwh O and M charges 4 of capital cost Stocking of biomass 2 months Return on equity 16 Depreciation 528 Means of Finance 7030 Rate of Interest on Loan 1075 per annum
CDM-SSC-PDD (version 02) CDM ndash Executive Board page 23
Repayment of debt 85 years with 1 year moratorium
An IRR analysis has been prepared for the project activity based on tariff order issued by MERC However adjustments have been made with respect to capital cost as per the norms of lending institutions The IRR has worked out to 1209 without GHG income While working out the base line profitability the incentives available for this type of project activity such as Interest subsidy Excise concession Tax holiday etc have been considered as furnished in the below table
Table 12IRR assumptions
Parameter Value Cost of Project 449 millions Means of finance
rArr Share capital rArr Term loan
1497 millions 2992 millions
Plant capacity 10 MW Working days per annum 365 Plant Load factor (optimum year) 80 Gross energy 7008 (optimum) Auxiliary consumption 10 708 Net saleable energy 6307 (optimum) Sale price of energy (per kWh) Rs318 Escalation considered on price of biomass
5
Operation amp maintenance charges with 5 yearly escalation
4
Rate of interest on term loan 1075 Depreciation 528 Tax holiday 10 years Minimum alternative Tax 1122 No of CERs 425247 (10 years) Rate per CER 6 Euros
A sensitivity analysis has also been made for the project activity considering the below mentioned scenarios including the positive probabilities (though chances of accurance of these are remote) and the resultant IRR is as under
Table 13Sensitivity Analysis
Sensitivity parameters IRR
With out GHG () Normal 1209 10 increase in project cost 941 10 decrease in project cost 1524 10 decrease in PLF 914 10 increase in PLF 1495 10 increase in Fuel cost 938 10 decrease in Fuel cost 1466
CDM-SSC-PDD (version 02) CDM ndash Executive Board page 24 As could be seen from the above the IRR is quite low and only after considering income from sale of emission reductions the IRR is improves to 1564 which is found to be reasonable and almost reaches the bench mark return of 1515 This indicates that the CDM revenue is very significant for the project activity Technological Barriers The most important equipment that has bearing on the smooth operation of the power plant is the boiler The boiler is a travelling grate type capable of using various fuels unlike the more efficient fluidized bed boiler A travelling grate boiler normally is subject to mechanical troubles due to usage of varieties of fuels The performance of the boiler depends on the uniform material used as fuel In respect of a biomass plant the fuel used depends on type of biomass available whose characteristics are not uniform As the project is located in a rural area where power is supplied to agricultural purposes generally by rotation the plant may face frequent fluctuations in grid voltage due to which the power evacuation equipment would be affected and some times leading to tripping of the plant Other barriers Handling and storage of biomass The problems and difficulties associated with procurement handling and storage of biomass in respect of project activity are as follows
1 The biomass is available in small quantities over a large area As the material has low bulk density collection and transportation of the same to the project site is a constraint
2 The cost of collection and transportation also tend to increase due to the increasing cost of labour
and cost of diesel used for transportation of biomass
3 Biomass cannot be Stored for longer period The characteristics of biomass change quickly with in short period Calorific value of biomass decreases due to loss of volatiles and deterioration of biomass and this may also affect the performance of the plant
4 The collection of biomass is a manual job and number of people has to be engaged continuously
for storage of biomass Any problem on availability of labour particularly during harvesting operations may hinder collection of the biomass fuel
In the view of above the proposed project is additional and not the same as the baseline scenario and would not occur without the CDM benefits B4 Description of how the definition of the project boundary related to the baseline methodology selected is applied to the small-scale project activity gtgt As per the guidelines mentioned in Type ID of Annex B of the simplified modalities and procedures for small-scale CDM project activities project boundary encompasses the physical and geographical site of the renewable generation source Hence the project boundary covers the point of fuel supply to the point of power export to the grid where the project proponent has a full control Hence project boundary is
CDM-SSC-PDD (version 02) CDM ndash Executive Board page 25 considered within these terminal points Thus boundary covers fuel storage and processing boiler Steam Turbine generator and all other power generating equipments and auxiliary consumption units B5 Details of the baseline and its development gtgt The baseline for the project activity is constructed according to the 9b ie weighted average emissions of the current generation mix (in kg CO2eqkwh) applicable for Type ID CDM project activities as contained in the Appendix B of the simplified modalities and procedures for small scale CDM project activities Date of completion of the baseline 300906 Name of the person entity determining the baseline Zenith Energy Services (P) Limited Hyderabad Contact information of the above entity furnished below
Organization Zenith Energy Services (P) Limited StreetPO Box Building 10-5-6B My Home Plaza Masabtank City Hyderabad StateRegion Andhra Pradesh PostfixZIP 500028 Country India Telephone +91- 40- 2337 6630 2337 6631 FAX +91- 40- 2332 2517 E-Mail zenithzenithenergycom URL wwwzenithenergycom Represented by Title Director Salutation Mr Last Name Reddy Middle Name Mohan First Name Attipalli Mobile +91- 9849408485 Direct Fax +91- 40- 2332 2517 Direct Telephone +91- 40- 23325803 Personal Email mohanzenithenergycom
The above entity is not a project participant SECTION C Duration of the project activity Crediting period C1 Duration of the small-scale project activity gtgt C11 Starting date of the small-scale project activity gtgt 010905 C12 Expected operational lifetime of the small-scale project activity
CDM-SSC-PDD (version 02) CDM ndash Executive Board page 26 gtgt 30 years C2 Choice of crediting period and related information gtgt Fixed crediting period C21 Renewable crediting period gtgt Not chosen C211 Starting date of the first crediting period gtgt Not applicable C212 Length of the first crediting period gtgt Not applicable C22 Fixed crediting period gtgt C221 Starting date gtgt010108 C222 Length gtgt10 years SECTION D Application of a monitoring methodology and plan gtgt D1 Name and reference of approved monitoring methodology applied to the small-scale project activity gtgt The name of the methodology applied for the project activity is ldquoMetering the Electricity Generatedrdquo This is in accordance with Appendix B of simplified modalities and procedures for small-scale CDM project activities The reference to the proposed monitoring methodology is para 13 of AMS ID of Appendix B of simplified modalities and procedures for small-scale CDM project activities D2 Justification of the choice of the methodology and why it is applicable to the small-scale project activity gtgt The project activity meets the eligibility criteria to use simplified modalities and procedure for small-scale CDM project activities as set out in paragraph 6 (c) of decision 17CP7 As the power plant is of 10 MW capacity reference has been taken from indicative simplified baseline and monitoring methodologies for selected small scale (CDM projects less than 15 MW) project activity categories The project activity is generation of electricity using biomass potential and exporting the same to the grid system which is also fed by other fuel sources such as fossil and non-fossil types Emission reductions due to the project activity are considered to be equivalent to the emissions avoided in the baseline
CDM-SSC-PDD (version 02) CDM ndash Executive Board page 27 scenario by displacing the grid electricity Emission reductions are related to the electricity exported by the project and the actual generation mix in the grid system Ex-post approach is selected for the baseline calculation as the capacity of the biomass project is 10 MW The baseline emission factor is estimated based on the weighted average emissions of the current generation mix and will be updated during the crediting period The data to be monitored to ascertain emission reductions out of the project activity is to measure the amount of electricity generated through energy meters With this information a reliable estimate of the amount of emission reduction can be made
CDM-SSC-PDD (version 02) CDM ndash Executive Board page 28 D3 Data to be monitored gtgt ID number
Data type Data variable Data unit
Measured (m) calculated (c) or estimated (e)
Recording Frequency
Proportion of data to be monitored
How will the data be archived (electronic paper)
For how long is archived data to be kept
Comment
D31 Power Gross Generation kWh m Continuous 100 Electronic and Paper Crediting period plus 2 years Meter is Calibrated and Regularly inspected by MSEB
D32 Power Auxiliary Consumption
kWh m Continuous 100 Electronic and Paper Crediting period plus 2 years Meter is Calibrated and Regularly inspected by MSEB
D33 Power Power Import kWh m Continuous 100 Electronic and Paper Crediting period plus 2 years The import is when project is under maintenance or temporary shutdown and Meter is Calibrated and Regularly inspected by MSEB
D34 Power Power Export kWh m Continuous 100 Electronic and Paper Crediting period plus 2 years Meter is Calibrated and Regularly inspected by MSEB
D35 Fuel Biomass used ( For each type of biomass separately)
MT m Daily 100 Electronic and Paper Crediting period plus 2 years Biomass deliveries are weighted using calibrated weigh bridges and build upon receipt at the plants Recorded per type of biomass
D36 Fuel Fossil fuels (coal) used
MT m Daily 100 Electronic and Paper Crediting period plus 2 years Fossil fuel deliveries are weighted and build upon receipt at the plants
D37 Calorific Values
NCV of coal used in the plant
kcalkg m batch-wise for coal
100 Electronic and Paper Crediting period plus 2 years The coal will be sampled and taken for analysis of calorific value at reputed laboratories
D38 Calorific Values
NCV of biomass used in the plant (for each type)
kcalkg m batch-wise 100 Electronic and Paper Crediting period plus 2 years The biomass fuels will be sampled and taken for analysis of calorific value at reputed laboratories
CDM-SSC-PDD (version 02) CDM ndash Executive Board page 29
D39 Fuel (renewable biomass)
Surplus biomass availability (for estimation of leakage)
MT E Yearly 100 Electronic and Paper Crediting period plus 2 years The data item is used to estimate the leakage affect due to the implementation of the project activity in the project region The data item is a calculated value derived from either any public survey documentation or the biomass assessment study carried out for project by an independent party during each year of the crediting period
D310 Emission factor
Emission factor of the most carbon intensive fuel used
tCO2TJ m yearly 100 Electronic and Paper Crediting period plus 2 years The emission factor values will be taken from the officially published data for Indian system
D311 Emission Factor
Grid Emission Factor (EF) Weighted average
tCO2GWh
c Yearly 100 Electronic and Paper Crediting period plus 2 years This data item is required for estimating the baseline emissions and emission reductions Data sourced from official CEA web site
CDM-SSC-PDD (version 02) CDM ndash Executive Board page 30 D4 Qualitative explanation of how quality control (QC) and quality assurance (QA) procedures are undertaken gtgt Data Uncertainty level of data
(HighMediumLow) Explain QAQC procedures planned for these data or why such procedures are not necessary
D31 amp D32
Low This data item will be recorded at the project site which is under the control of project proponent The energy generated and consumed is measured using calibrated meters and recorded by project proponent Records of measurements will be used for calculating net export to grid
D33 Low This data will be recorded at the project site and the energy imported is measured using MSEB calibrated meter Records of measurements will be used for calculating net export to grid Sales billsreceipts may be compared as an alternative proof of the power imported from MSEB grid
D34 Low This data item will be recorded at the grid substation which is under the control of MSEB The energy measured using calibrated meters and recorded at MSEB substation will be monitored Records of measurements will be used for verification of emissions reductions Sales bills receipts may be compared as an alternative proof of the power exported to the grid
D35 and D36
Low This data item will be recorded at the inlet of the plant premises Fuel purchase records can be used for verification of fuel purchases in each category of biomass and fossil fuels Payments made to fuel suppliers can be used to cross check the fuel purchase records
D37 amp D38
Low Fuel samples will be analysed at reputed laboratories if available for coal will be obtained from the suppliers No QAQC procedures are applicable since the parameter is not under the control of project proponent
D39 Low Either publicly available survey data is used or in the absence of publicly available data biomass assessment study will be carried out by an independent agency based on the official statistics scientific approaches and standard practices Hence it can be ensured that the compliance with QAQC and quality of data will be high Since the data item is not under the control of project proponent no QAQC procedures are applicable here
D310 Low The parameter will be taken from the officially published documentations of the Indiarsquos DNA such as Indiarsquos initial national communication to UNFCCC andor IPCC 2006 default values which ever is applicable Since the data item is not under the control of project proponent no QAQC procedures are provided here
D311 Low Based on official data from CEA Project participants has no influence on quality control procedures
D5 Please describe briefly the operational and management structure that the project participant(s) will implement in order to monitor emission reductions and any leakage effects generated by the project activity gtgt
CDM-SSC-PDD (version 02) CDM ndash Executive Board page 31 The management structure proposed for monitoring of emission reductions due to the project activity mainly comprises a GHG audit team committee which will be established immediately after commissioning of the plant The committee performs various functions such as measuring recording storage of measured data and reporting to the project participants The outcome of the committee in the form of GHG audit reports are being monitored monthly and annually The committee comprised representatives of the project participant and other experts as decided from time to time It was proposed that whenever required external independent GHG auditors would be deputed for the monitoring activities Project Management The authority and responsibility for registration monitoring measurement reporting and reviewing of the data rests with the Board of Directors The Board may delegate the same to a competent person identified for the purpose The identified person will be the in charge of GHG monitoring activities and necessary reports will be submitted to the management or its Committee for review Monitoring Requirements The monitoring plan includes monitoring of parameters ie the energy fed to the MSEB grid system Biomass and fossil fuel consumption auxiliary consumptions and Imports Emission reductions resulted from the project activity will be calculated using the energy fed in accordance with the calculations illustrated in Section E of the PDD Emission reductions generated by the project shall be monitored at regular intervals The crediting period chosen for the project activity is 10 years Monitoring equipment comprises of energy meters and weigh bridge meter at Project entrance The export meters will monitor the energy fed by the plant to MSEB grid system by the project In accordance with the procedures laid down in EPA project proponents have to install two energy meters one is main meter and the other is check meter Project proponent will have to calibrate both the meters according to the procedures of EPA The meters will be tested once in a year generally In case the variation in meter reading between main and check meters is more than 05 both meters will be tested and calibrated immediately by MSEDCL (Maharashtra State Electricity Distribution Company Limited) as corrective action The import meter will record the energy taken by the project activity from Grid system This meter will be checked calibrated and may be replaced with a new one by MSEB based on meter condition This will be under the control of MSEB project proponent have no authorization to deal with import energy meter The gross auxiliary energy meters and weigh bridge meter will be periodically checked and calibrated by project proponent as per Indian standards for calibration of equipment Methodology adopted for determining base line emission factor is the weighted average emissions of the generating mix in the Western grid system which will represent the intensity of carbon emissions of the grid system The baseline emission factor is calculated ex-post for all the years of the crediting period using the official data published by the Central Electricity Authority for the Western grid and therefore included in the monitoring procedures Leakage Monitoring The 10 MW Parbani project is renewable energy type and it utilizes Biomass fuel for power generation Since no energy generating equipment is transferred from another activity nor existing equipment is transferred to another activity leakage needs not to be monitored or considered However parameter to asses the leakage due to competing uses of biomass (surplus biomass in the region) has been included in the monitoring (section D3) which will be assessed during each year of the crediting period
CDM-SSC-PDD (version 02) CDM ndash Executive Board page 32 Data Recording and Storage The net energy fed to the grid system by the project activity will be recorded by project proponents using either of the two meters (main meter and check meter) in the presence of the representative of MSEB Representatives of both the project proponent and MSEB will sign the document which will contain all details such as the equipment data calibration status previous reading current reading export import net billable units date and time of recording etc This document will be used as a basic document for monitoring and verification of the net energy exported to the grid MSEB will pay to project proponents based on this document Biomass and coal (if any) consumption are recorded on daily as well as monthly basis and the same can be verified from invoice data This document will be used as a basic document for monitoring and verification of the fuel consumption for power generation The above document will be preserved for verification of emission reductions from the project in safe storage Supporting documents such as receipts of payments released by MSEB will also be preserved in safe storage for later verification by an independent third party The period of storage will be 2 years after the end of crediting period D6 Name of personentity determining the monitoring methodology gtgt The contact information for the entity that has determined the monitoring methodology is given below The entity is a project participant
Organization Zenith Energy Services (P) Limited StreetPO Box Building 10-5-6B My Home Plaza Masabtank City Hyderabad StateRegion Andhra Pradesh PostfixZIP 500028 Country India Telephone +91- 40- 2337 6630 2337 6631 FAX +91- 40- 2332 2517 E-Mail zenithzenithenergycom URL wwwzenithenergycom Represented by Title Director Salutation Mr Last Name Reddy Middle Name Mohan First Name Attipalli Mobile +91- 9849408485 Direct Fax +91- 40- 2332 2517 Direct Telephone +91- 40- 2337 6630 2337 6631 Personal Email mohanzenithenergycom
SECTION E Estimation of GHG emissions by sources
CDM-SSC-PDD (version 02) CDM ndash Executive Board page 33 E1 Formulae used gtgt E11 Selected formulae as provided in appendix B gtgt Appendix B of the simplified modalities and procedures for small-scale CDM project activities does not provide specific formulae for the baseline for project Category ID Calculation of the project GHG emissions reductions applies a weighted average emissions factor for all thermal plants that are operational on the Western grid of India as of March 2006 E12 Description of formulae when not provided in appendix B gtgt E121 Describe the formulae used to estimate anthropogenic emissions by sources of GHGs due to the project activity within the project boundary gtgt The proposed project activity generates power using renewable biomass which is considered CO2 neutral However since use of fossil fuels is permitted in exigencies to a maximum of 25 of the total annual fuel requirement for biomass based power projects the project may use fossil fuels such as coal in future in case of exigencies GHG emissions occurring within the project boundary will be calculated using the following formula
sum sdotsdotsdot= iiCOiyiy OXIDEFNCVFFPE 2 Where PEy are the emissions from the project activity during the year y in tonnes of CO2 FFiy is the quantity of fossil fuel type i combusted to supplement the biomass residues in the project activity during the year y in energy or mass units NCVi is the net calorific value of the fossil fuel type i in TJ per mass unit obtained from local fuel supplier or from the country specific IPCC default factors EFCO2i is the CO2 emission factor per unit of energy or mass of the fuel type i in tons of CO2
obtained from the country specific IPCC default factors OXIDi is the oxidation factor of the fuel (as per table 129 in the 1996 revised IPCC guidelines
for default values)
For the purpose of estimating the anticipated project emissions due to the project activity it has been assumed that coal to an extent of 10 of the annual fuel requirement may be used as supplementary fuel Accordingly the estimate of project emissions is provided below These emissions will be updated ex post depending on the actual quantity of coal consumed
CDM-SSC-PDD (version 02) CDM ndash Executive Board page 34 Project Emissions (tCO2)
Biomass consumed
Coal Consumption
Total fuel consumption
of coal consumption NCV of Coal
Emission factor coal (EFCO2y)
Oxidation factor
(OXIDi)Project
emissionstons tons tons kcalkWh tCO2TJ tCO2
Indias Initial National
communication
1996 revised IPCC
guidelines1 2008 62363 6929 69292 10 3800 9581 098 103342 2009 71271 7919 79190 10 3800 9581 098 118103 2010 71271 7919 79190 10 3800 9581 098 118104 2011 71271 7919 79190 10 3800 9581 098 118105 2012 71271 7919 79190 10 3800 9581 098 118106 2013 71271 7919 79190 10 3800 9581 098 118107 2014 71271 7919 79190 10 3800 9581 098 118108 2015 71271 7919 79190 10 3800 9581 098 118109 2016 71271 7919 79190 10 3800 9581 098 1181010 2017 71271 7919 79190 10 3800 9581 098 11810
116628Total Project Emissions
No Year
Reference
E122 Describe the formulae used to estimate leakage due to the project activity where required for the applicable project category in appendix B of the simplified modalities and procedures for small-scale CDM project activities gtgt No leakage is anticipated due to the project activity as the generating equipment is not transferred from another activity Although a small amount of emissions occur outside the project boundary due to transportation of biomass the same are not considered as being negligible and occur in the baseline scenario
Parameter Unit Valuea Total biomass required for the project tonnes 80000b Average Return trip Distance (AVD) from collection centres km 100c Total Ash Generation (anticipated) tonnes 8000d Average Return trip distrance for Ash utilization or disposal km 30e Average load per truck tonnes 10f Total Distance travelled km 824000g Consumption of Diesel by truck kmLitre 5h Total Diesel consumption for transportation Litres 164800i Density of Diesel kgLitre 082j Total Diesel consumption kg 135136k Energy value of Diesel (IPCC) TJ103 tonnes 4333l Total Energy from Diesel TJ 586m Emission factor of Diesel t CO2TJ 741n Total Transport Emissions t CO2 434
AVD considered is the maximum possible distance from plant site (Radious 50 50+50 = 100 km) Ash Generation is considered at 10 of total biomass consumption per year for projection
The project activity is generating electricity using Biomass residues hence according to the Attachment C to Appendix B of simplified modalities and procedures the leakage source applicable is lsquoCompeting use of biomassrsquo The project proponents conducted a Biomass Assessment Survey in the project region to ensure that the biomass available in the region is surplus which is not utilized so far According to the Biomass Assessment Report the total generation of biomass residues with in the 50 km radius from plant location is 111 million tonnes (mt) where as the consumption of the region is 077 mt The surplus biomass available is 034 mt The leakage calculation is demonstrated in the below table
CDM-SSC-PDD (version 02) CDM ndash Executive Board page 35
Leakage - competing use of biomassParameter Unit Value
a Total biomass available in the region tonnes 1115023b Total conumption of the reigon tonnes 770169c Biomass consumption of the 10 MW project activity tonnes 80000d Total biomass consumption of the region including project activity (b+c) tonnes 850169e Total surplus in the region after accounting for all types of consumption (a-d) tonnes 264854f Percentage of surplus available biomass in the reigon (ed) 31
The total quantity of surplus biomass in the region is 31 larger than the total biomass consumption in the region Hence the leakage emissions due to competing use of biomass is neglected The main biomass residues ie crop residues used for this project which can be regarded to be renewable since their use does not lead to a decrease of carbon pools as defined in Annex 18 of the report of EB 23 meeting The quantity of available biomass in the region is 25 larger than the quantity of biomass that is utilized including the project activity Hence according to Attachment C to Appendix B Indicative simplified modalities and procedures Leakage due to competing uses for the biomass is neglected However as required by Attachment C to Appendix B leakage effect will be monitored (section D3) during each year of the crediting period to ensure that the implementation of project activity does not lead to any increase in GHG emission from fossil fuel combustion or other sources due to the diversion of biomass residues from the other uses to the project as a result of the project activity If the quantity of surplus biomass in the region found below the 25 of the total consumption of the project region during any year of the crediting period the corresponding percentage of biomass quantity would be considered to estimate the leakage emissions due to the competing uses of biomass as described below Leakage emissions ndash Competing uses for the biomass A fuel availability survey will be carried out during each year of the crediting period to assess the surplus availability of biomass in the project region If it is found that the surplus in the region is less than 25 of the total region consumption the emissions due to leakage will be estimated and deducted from the emission reductions by applying the following equation
yavgLCOydy NCVEFBFL 2 sdotsdot= Ly = Leakage emissions during the year y (tCO2y) BFdy = The quantity of biomass ie in deficit during the year y (tonnes) (In the above parameter the quantity of biomass in deficit refers to the corresponding quantity of biomass in deficit from 25 surplus of the total consumption of the biomass in the project region including the project activity) EFCO2L = CO2 emission factor of the most carbon intensive fuel used in the country (t CO2TJ) NCVavgy = Average net calorific value of the biomass residues combusted in the project activity during the year y (TJtonne)
CDM-SSC-PDD (version 02) CDM ndash Executive Board page 36 E123 The sum of E121 and E122 represents the small-scale project activity emissions gtgt The sum of emissions estimated in E121 and E122 is provided in the below table
Year (FY) 2008 2009 2010 2011 2012 2013 2014 2015 2016 2017 Project emissions E121 tCO2
10334 11810 11810 11810 11810 11810 11810 11810 11810 11810
Leakage E122 tCO2
0 0 0 0 0 0 0 0 0 0
Total E121 + E122 tCO2
10334 11810 11810 11810 11810 11810 11810 11810 11810 11810
E124 Describe the formulae used to estimate the anthropogenic emissions by sources of GHGs in the baseline using the baseline methodology for the applicable project category in appendix B of the simplified modalities and procedures for small-scale CDM project activities gtgt As per AMS ID
iv Estimation of baseline emissions Baseline emissions or emissions avoided by the project activity are estimated using the following formula
Baseline Emissions
tCO2
= Grid Emission Factor
tCO2GWh
x Net Power Generation
GWh The power export from the project for the optimum year is anticipated at 6307 GWh per year based on which the baseline emissions are estimated and tabulated
Baseline Emissions (tCO2)
Sno
year Gross
energy
Net enrgy
export
(GWh)
Emission
Factor (t
CO2Gwh)
Baseline
Emissions (t
CO2)1 2008 6132 5519 870 480142 2009 7008 6307 870 548733 2010 7008 6307 870 548734 2011 7008 6307 870 548735 2012 7008 6307 870 548736 2013 7008 6307 870 548737 2014 7008 6307 870 548738 2015 7008 6307 870 548739 2016 7008 6307 870 54873
10 2017 7008 6307 870 54873541871Total Baseline Emissions
CDM-SSC-PDD (version 02) CDM ndash Executive Board page 37 E125 Difference between E124 and E123 represents the emission reductions due to the project activity during a given period gtgt
E2 Table providing values obtained when applying formulae above gtgt
S No Year Annual estimation of emission reductions in tonnes of CO2 eq
1 2008 37680 2 2009 43063 3 2010 43063 4 2011 43063 5 2012 43063 6 2013 43063 7 2014 43063 8 2015 43063 9 2016 43063
10 2017 43063 Total emission reductions (tonnes of CO2 eq)
425247
Total number of crediting years 10 Annual average over the crediting period of estimated reductions (tonnes of CO2 eq)
42524
SECTION F Environmental impacts F1 If required by the host Party documentation on the analysis of the environmental impacts of the project activity gtgt
As per the prevailing regulations of the Host Party ie India (represented by the Ministry of Environment and Forests (MoEF) Govt of India and also the line ministry for environmental issues in India) Environmental Impact Assessment (EIA) studies need not to be done for the projects less than Rs1000 millions Since the total cost of the proposed project is only Rs449 millions and also comes under the small scale category of CDM projects as per UNFCCC guidelines doesnrsquot call for EIA study However prior to implementation the project shall notify to the Maharashtra State Pollution Control Board (MSPCB) for necessary evaluation and approval As required for implementation of the project activity project participants had studied the possibility of environmental impacts and concluded that no negative impacts are possible due to the project activity Hence no documentation or summary is provided here
Year 2008 2009 2010 2011 2012 2013 2014 2015 2016 2017 Baseline emissions E124 tCO2
48014 54873 54873 54873 54873 54873 54873 54873 54873 54873
Project emissions E123 tCO2
10334 11810 11810 11810 11810 11810 11810 11810 11810 11810
Emissions Reductions E124 ndash E123 tCO2
37680 43063 43063 43063 43063 43063 43063 43063 43063 43063
CDM-SSC-PDD (version 02) CDM ndash Executive Board page 38 The project does not fall under the purview of the Environmental Impact Assessment (EIA) notification of the Ministry of Environment and Forest Government of India However the design philosophy of this biomass based project activity is driven by the concept of providing the renewable energy with negligible impact on the environment hence the environment and safety aspects of the project activity are discussed here The possible type of pollutants emanating from a normal biomass plant are Air Pollution Water Pollution Thermal pollution Noise Pollution etc which are also common to the proposed plant but it is negligible The project proponent has planned various preventive and precautionary steps to control all forms of pollutants so as to safeguard the environment Air Pollution Control The main air pollutants in the biomass based plant are Dust and particulate matter in the Flue gas Fly ash from the hoppers Furnace bottom ash etc and the steps to be taken are Electrostatic Precipitator The proposed biomass plant will have an Electrostatic Precipitator (ESP) which will separate the dust from the flue gas and has an efficiency of 992 The dust concentration in the flue gas leaving the ESP will be within the permissible limit of statutory norms Waste as Wealth The ash from the silo will be disposed off to the farmers who can use the ash as manure for the crops and to local industries who will utilize the ash for manufacture of bricks and for road building materials Water Pollution Control The main forms of water pollutants in the plant are effluents from water treatment plant Boiler blow down Sewage from the power plant buildings Water Treatment Plant The water utilized for the operation of the plant is treated before letting off so as to maintain it in neutral pH Sewage through trenches The Sewage from the various power plant buildings will be taken to a common septic tank through trenches The sewage from the septic tank will be disposed off through concrete trenches so as to prevent the soil from getting contaminated Thermal Pollution Cooling Tower The water used in the surface condenser to condense the steam will be cooled in a cooling tower of either induced or forced draft type The water let out from the cooling tower will have a temperature very close to the ambient Cooling Pond The boiler blow down water which will be at temperature of 100oC is taken to effluent pond so as to get cooled naturally Noise Pollution Control
CDM-SSC-PDD (version 02) CDM ndash Executive Board page 39 The major source of noise pollution in the biomass power plant is from rotating equipments like ID FD SA fans Feed pumps Boiler and super heater safety valves Start up vent Steam turbine DG sets etc and steps to be taken to control all these are Silencers The start up vent safety valve outlets and the DG sets will be provided with silencers to reduce the noise level to the acceptable limits Equipment Design The rotating equipments are designed in such a way so that the sound level will be between 85 to 90 dBA as per the OSHA standards Land Environment Selected tree species will be planted in the area after considering attenuation factors for air and noise pollution Green Belt Development The project proposed to develop Green Belt with in the project premises which is the one of the major component of Environmental Management Plan (EMP) Green Belt will enhance environmental quality through mitigation of fugitive emissions attenuation of noise levels balancing eco-environment consumption of treated effluents prevention of soil erosion creation of aesthetic environment Socio Economic Environment The project will provides an opportunity for local people to get employed directly or indirectly in upliftment of socioeconomic status of the area It is also proposed to do awareness and welfare programmes upliftment of social health basic needs of drinking water supply and provision of educational facilities Hence the project is not likely to have any significant adverse negative socio-economic environmental effects during execution or after commissioning during or during the operational lifetime SECTION G Stakeholdersrsquo comments G1 Brief description of how comments by local stakeholders have been invited and compiled gtgt Requirement of Stakeholder comments No specific public consultation participation requirements are specified in Indian statutes for setting up of small-scale industries However there are certain procedural requirements which every project investor needs to follow before implementing any project Before implementing any project project investors developers need to identify the stakeholders prepare necessary documents approach the identified stakeholders directly and obtain required clearances approvals The stakeholders after review of documents and investment profile will accord approvals licences or send comments in writing to project investors for further clarifications corrections In case they are not satisfied with the project design or they feel that the project impacts any of the local environment social economical environments they will not issue clearances approvals and stop the implementation of the project
CDM-SSC-PDD (version 02) CDM ndash Executive Board page 40 Identification of Stakeholders The project participants as required for setting up the project have identified the following stakeholders Local populace Local populace represented by the Borawand (BK) Gram Panchayat the elected administrative body of the village Borawand where the project is getting implemented will issue No-Objection Certificate (NOC) for setting up of the project under the jurisdiction of the village Maharashtra Energy Development Agency (MEDA) Maharashtra Energy Development Agency (MEDA) the state nodal agency under the umbrella of the Ministry of Non Conventional Energy Sources (MNES) Govt of India to undertake development techno-economic viability of renewable energy and facilitates energy conservation in the state of Maharashtra (wwwmahaurjacom) Maharashtra Sate Electricity Board (MSEB) Maharashtra State Electricity Board (MSEB) a state utility company looks after power generation transmission and distribution through out the state of Maharashtra (wwwmsebindiacom) Maharashtra Electricity Regulatory Commission (MERC) Maharashtra Electricity Regulatory Commission (MERC) has the role of tariff fixation licensing grievance redressing regulating power purchase and procurement processes of the transmission and distribution utilities throughout the state of Maharashtra (wwwmercindiaorgin) Maharashtra Pollution Control Board (MPCB) Maharashtra Pollution Control Board (MPCB) a regulatory body to monitor environmental impacts and environmental management of industries accords clearances for setting up of industries in the state after ensuring adherence to the statutory regulations Also gives Consent for Establishment (CFE) and Consent for Operation (CFO) for the project if it satisfies with the environmental management and pollution control measures (wwwmpcbmahnicin) Ministry of Non-conventional Energy Sources Govt of India (MNES) The Ministry of Non-Conventional Energy Sources (MNES) Govt of India a nodal ministry for all matters relating to new and renewable energy like Bio-energy Wind hydro Solar Geothermal Tidal etc (wwwmnesnicin) Apart from the above there are other stakeholders such as Inspector of Factories Inspector of Boilers Chief Electrical Inspectorate General etc but the role of these stakeholders is limited to examination of certain issues such as plant layout equipment designs etc These stakeholders are to be approached during the project implementation stage however will in no way obstruct the implementation of the project as long as the designs are according to the stipulated regulations The project participants prepared necessary documentation before implementation of the project activity and approached the above stakeholders individually No negative comments have been received by the project participants which is evident from the following clearances and approvals
CDM-SSC-PDD (version 02) CDM ndash Executive Board page 41 Village Panchayat Local populace represented by the Borawand (BK) Gram Panchayat the elected administrative body of the village Borawand where the project is getting implemented issued NOC (No-Objection Certificate) for the project on 16th July 2005 Maharashtra Energy Development Agency (MEDA) Maharashtra Energy Development Agency (MEDA) has issued lsquoIn Principle Clearancersquo for setting up of project vide BPP-06104-052321 dated 26th May 2004 Maharashtra State Electricity Regulatory Commission (MERC) MERC has framed tariff policy for the project through out the state of Maharashtra which is applicable to the proposed project activity also Ministry of Non-Conventional Energy Sources (MNES) MNES has recognised the project activity under Non-Conventional Energy sources Maharashtra State Pollution Control Board (MPCB) Maharashtra State Pollution Control Board (MPCB) issued Consent for Establishment (CFE) with vide letter no BOPCI-IIROADEIC NoAD-0314-05ECC-36 and Consent for Operation (CFO) will be obtained after completion of the construction of the project and before commissioning of the project G2 Summary of the comments received gtgt No negative comments are received on the project activity which is evident from the licences approvals clearances accorded to the project activity by the stakeholders G3 Report on how due account was taken of any comments received gtgt No comments received hence no report is applicable
CDM-SSC-PDD (version 02) CDM ndash Executive Board page 42
Annex 1 CONTACT INFORMATION ON PARTICIPANTS IN THE PROJECT ACTIVITY
Organization Ms M S M Energy Limited StreetPO Box Building Plot No 1115 Road No 54 Jubilee Hills City Hyderabad StateRegion Andhra Pradesh PostfixZIP 500 033 Country India Telephone +91- 40- 2355 0597 2355 0598 FAX +91- 40- 2354 1339 E-Mail msmenergyrediffmailcom URL Represented by Title Managing Director Salutation Dr Last Name S M Middle Name First Name Manepalli Mobile Direct Fax +91- 40- 2354 1339 Direct Telephone +91- 40- 2355 0597 2355 0598 Personal Email
CDM-SSC-PDD (version 02) CDM ndash Executive Board page 43
Annex 2
INFORMATION REGARDING PUBLIC FUNDING No public funding from the parties included in Annex ndash I is involved in the project activity
- - - -
CDM-SSC-PDD (version 02) CDM ndash Executive Board page 44
Annex 3 Baseline Information
Baseline Information for Western Region
Station heat rate
IPCC Local emission
factor
Emissions
tCO2kcalkWh tCTJ 2006
1 1 2 1 2 3 3
Dhuvaran GEB 534 Coal 4F 145963 2717 2613 098 1066 1556487Ukai GEB 850 Coal 4F 536309 2746 2613 098 1078 5780013Gandhi Nagar GEB 660 Coal 4F 37036 2568 2613 098 1008 3732779Wanakbori GEB 1260 Coal 4F 847206 2561 2613 098 1005 8515532Sikka REP GEB 240 Coal 4F 14047 2926 2613 098 1148 1613136Torr Pow Sab AECO 330 Coal 270314 2717 2613 098 1066 2882514Torr Power AEC AECO 60 Coal 485 2717 2613 098 1066 517183GSECL (G5) GSECL 210 Coal 4F 174346 2717 2613 098 1066 1859152GSECL (W7) GSECL 210 Coal 4F 170931 2717 2613 098 1066 1822736Utran GT GSECL 144 Gas HBJ 107744 2061 153 0995 481 518124Dhuvaran CCPP GSECL 1066 Gas HBJ 70733 2061 153 0995 481 340144Hazira CCCP GSEGL 1561 Gas HBJ 118221 2061 153 0995 481 568506GTE CORP GTE 655 Gas HBJ 475599 2061 153 0995 481 2287079Kawas GT NTPC 644 Gas HBJ 28842 2061 153 0995 481 1386965Gandhar GT NTPC 648 Gas HBJ 44782 2061 153 0995 481 2153494Torr PowVatGT AECO 100 Gas HBJ 71817 2061 153 0995 481 345356Essar GT IMP Essar 515 Gas HBJ 180094 2061 153 0995 481 866043GIPCL GT GIPCL 154 Gas HBJ 232114 2061 153 0995 481 1116199Surat LIG GIPCL 250 Lignite 187415 2742 2895 098 1192 2234571Akrimota GMDCL 250 Lignite 16829 2717 2895 098 1181 198825Kutch LIG GEB 215 Lignite 66962 3368 2895 098 1465 980670UKai GEB 305 Hydro 58049 0 0Kadana GEB 240 Hydro 20917 0 0SSarovar RBPH SSVNL 1000 Hydro 175286 0 0SSarovar CHPH SSVNL 250 Hydro 20865 0 0Kakrapara NPC 440 Nuclear 236694 0 0
MADHYA PRADESHSatpura MPGPCL 11425 Coal 4F 758125 3288 2613 098 1290 9783310Amar Kantak MPGPCL 60 Coal 4F 15026 2717 2613 098 1066 160231Amar Kantak Ext MPGPCL 240 Coal 4F 95257 3918 2613 098 1538 1464787Sanjay Gandhi MPGPCL 840 Coal 4F 485634 2829 2613 098 1110 5392066Vindh_Chal STPSNTPC 2260 Coal 3E 183046 2717 2613 098 1066 19519248Gandhi Sagar MPGPCL 115 Hydro 14801 0 0Bargi MPGPCL 90 Hydro 56535 0 0Pench MPGPCL 160 Hydro 42213 0 0Madhikhera MPGPCL 0 Hydro 0 0 0Rajghat (MP) MPGPCL 45 Hydro 13568 0 0Bansagar (I) MPGPCL 315 Hydro 99657 0 0Bansagar (II) MPGPCL 30 Hydro 15612 0 0Bansagar (III) MPGPCL 60 Hydro 8919 0 0Bansagar(IV) MPGPCL 0 Hydro 0 0 0Binsinghpur MPGPCL 20 Hydro 5569 0 0Tawa HEGL 135 Hydro 2388 0 0Indira Sagar NHDC 1000 Hydro 257297 0 0
Oxidation factor (IPCC)
Net Generation GWh 2006
Emission factor
tCO2GWh
GUJARAT
Power Stations OwnerInstalled capacity
MWFuel
CDM-SSC-PDD (version 02) CDM ndash Executive Board page 45
CHATTISGARHKorba-II CSEB 200 Coal 4F 161063 2946 2613 098 1156 1862266Korba-III CSEB 240 Coal 4F 15871 2946 2613 098 1156 1835060Korba-West CSEB 840 Coal 4F 574638 2653 2613 098 1041 5983355Korba-STPS NTPC 2100 Coal 4F 160013 2717 2613 098 1066 17063107Hasdeobango CSEB 120 Hydro 35828 0 0Gangrel CSEB 5 Hydro 872 0 0
MAHARASTRANasik MSEB 910 Coal 4F 575317 2651 2613 098 1040 5985909Koradi MSEB 1100 Coal 4F 646034 2981 2613 098 1170 7558412K_Kheda II MSEB 840 Coal 4F 570399 2600 2613 098 1020 5820567Paras MSEB 625 Coal 4F 47972 3198 2613 098 1255 602115Bhusawal MSEB 4825 Coal 4F 338168 2635 2613 098 1034 3497247Parli MSEB 690 Coal 4F 51612 2665 2613 098 1046 5398351Chandrapur MSEB 2340 Coal 4F 1398727 2611 2613 098 1025 14333526Dhanu BSES 500 Coal 2W 432311 2298 2613 098 902 3899056Trombay TATA MAH1150 Coal 3E 785436 2717 2613 098 1066 8375556Uran GT MSEB 672 Gas HBJ 243023 2061 153 0995 481 1168658Uran WHP MSEB 240 Gas HBJ 131835 2061 153 0995 481 633973Trombay GT TATA MAH180 Gas HBJ 133075 2061 153 0995 481 639936Dhaboi GT ENRON 740 Gas HBJ 0 2061 153 0995 481 0Koyna MSEB 1960 Hydro 446306 0 0Vaitarna MSEB 615 Hydro 17087 0 0Tillari MSEB 60 Hydro 18295 0 0Bhira Tail Race MSEB 80 Hydro 9876 0 0Eldari MSEB 225 Hydro 163 0 0Veer MSEB 9 Hydro 4636 0 0Bhatgarh MSEB 16 Hydro 5776 0 0Paithon MSEB 12 Hydro 2492 0 0Bhandardhara MSEB 44 Hydro 4489 0 0Pawana MSEB 10 Hydro 1351 0 0Radhanagri MSEB 48 Hydro 897 0 0Kvasla (Panshet) MSEB 8 Hydro 5824 0 0K_Vasla (Varsa) MSEB 8 Hydro 215 0 0Bhatsa MSEB 15 Hydro 8514 0 0Kanher MSEB 4 Hydro 147 0 0Ujjaini MSEB 12 Hydro 4404 0 0Surya MSEB 6 Hydro 2262 0 0Manikhod MSEB 6 Hydro 805 0 0Dhom MSEB 2 Hydro 105 0 0Dimbe MSEB 5 Hydro 1058 0 0Warna MSEB 16 Hydro 609 0 0Dudh Ganga MSEB 24 Hydro 5902 0 0Bhira TATA MAH150 Hydro 47979 0 0Bhira PSS TATA MAH150 Hydro 70146 0 0Bhivpuri TATA MAH72 Hydro 42783 0 0Khopoli TATA MAH72 Hydro 41447 0 0Tarapur NPC 860 Nuclear 371463 0 0
GOAReliance Energy REL 48 Coal 30275 2717 2613 098 1066 322840Total 18687154 162575084
CDM-SSC-PDD (version 02) CDM ndash Executive Board page 46
Summary Year - 200506
GWh Emissions Hydro 15831 0 8Coal 137242 147136542 73Gas 25005 12024477 13Lignite 2712 3414066 1Nuclear 6082 0 3Total 186872 162575084 100
Avg sumEFBaseline 870
References BASE LINE DATA The methodology adopted for the calculation of the baseline is lsquoSimple weighted average of the current generation mixrdquo Year 2005-06 is considered as the base year for prediction of future capacity additions during the crediting period Western Grid generation data as tabulated in Enclosure-II is used for consideration of installed Western grid capacity and energy availability during the period 2005-06 In order to arrive at the detailed break up of power generation mix in Western Region various documents and various web sites were refereed The websites refereed for estimating the generation mix in Western regional grid are 1 httpmnesnicin 2 httpceanicin 3 Revised 1996 IPCC Guidelines for National Greenhouse Gas Inventories Reference Manual 4 Indiarsquos Initial National communication to United Nations Framework convention on climate change (UNFCCC) As per the availability actual generation figures as against the sector wise installed capacity were used Wherever the break up of generation was not available proportionate calculated figures were used so as to match the total energy availability References for completing PDD
1 Website of United Nations Framework Convention on Climate Change (UNFCCC)
httpunfcccint 2 UNFCCC document Clean Development Mechanism Simplified Project Design Document
For Small Scale Project Activities (SSC-PDD) Version 02 3 UNFCCC document Simplified modalities and procedures for smallndashscale clean
development mechanism project activities 4 UNFCCC document Indicative simplified baseline and monitoring methodologies for
selected small-scale CDM project activity categories Version 09 28th July 2006 5 Detailed project reports of project
CDM-SSC-PDD (version 02) CDM ndash Executive Board page 47
Annex ndash 4
Abbreviations
CEA Central Electricity Authority CO2 Carbon dioxide
EIA Environment Impact Assessment GHG Greenhouse gas GWh Giga watt hour IPCC Inter Governmental Panel On Climate Change kWh Kilo watt hour MEDA Maharashtra Energy Development Agency MERC Maharashtra Electricity Regulatory Commission MPCB Maharashtra Pollution Control Board MSEB Maharashtra State Electricity Board MW Mega watt MNES Ministry of Non Conventional Energy Sources PDD Project design document UNFCCC United Nations Framework Convention on Climate Change
Annex-5
CDM-SSC-PDD (version 02) CDM ndash Executive Board page 48 MINUTES OF THE STAKEHODLERS MEETING WITH RESPECT TO 10MW BIOMASS BASED POWER PROJECT OF MSM ENERGY LTD HELD AT BORDWAND VILLAGE PARBHANI TAHSIL PARBHANI DISTRICT MAHARASHTRA STATE MSM Energy Ltd the project proponent of 10 MW Biomass based power project have conducted a public meeting with the farmers and the village Panchayat members of Bordwand village on 29th June 2006 at IST 1130 AM to ascertain the views of the stakeholders with respect to setting up of the biomass based power project In response to the notice from the project proponent panchayath members and number of farmers have participated in the public meeting and expressed their views on the project Proceedings of the meeting are summarized below The following members have attended the meeting Panchayat Members
1 Gopal Kulkurni ndash Gram Panchayat Sarpanch 2 Subhash Hingane ndash Up-sarpanch 3 Gangadhar Bigde 4 Sheshrao Gangade 5 Namdev Kavle 6 Ganpath Kamble 7 Raghunath Raut 8 Baghwan Kavle
Farmers 1 Balasaheb Kavle 2 Basel Kavle 3 Ramkishan Kavle 4 Saheb Kavle 5 Baghwan Hingane 6 Datta Gangode 7 Balu Gore 8 Dashrath Binde 9 Vidul Kavle 10 Bansidhar Kavle 11 Namdev Kavle 12 Nilkanth Kulkurni 13 Dashrath Levde 14 Atul Kulkurni 15 SIsmail 16 Ashok Kamble 17 Munjabhalu Kamble 18 Anantha Thambre 19 Kachruba Binde 20 Suresh Binde 21 Maghid Binde 22 Ganesh Ramjhau Larne 23 Ramkishan Hingane 24 Rambhalu Harkal 25 Pandit Rusthumrao Hingane 26 Baburao Vamrao Langde 27 Baghwan Narhari
CDM-SSC-PDD (version 02) CDM ndash Executive Board page 49
28 Rojkau Panduraganpath raut 29 Namdev Shesrao Langde 30 Shek Shaeed 31 Shyam Kavle 32 Farukh S Ismail
Representatives of Project proponent
Mr Ravi Venkat and Mr Nitin Pandit Rao Wagh Consultants
K Ram Babu Sarpanch of Bordwand gram panchyath SriGopal Kulkurni initiated the meeting expressing his deep regret for arranging the meeting at plant site in open space as the panchayath office is under renovation Sarpanch also gave thanks to Mr Ravi Venkat for conducting the meeting which will clear off doubts of the villagers Mr Ravi Venkat addressed himself and the consultant to the villagers and explained briefly about the power generating unit and employment opportunities The members expressed happiness after hearing from Mr Ravi Venkat about employment opportunities and requested the company to recruit the local people Mr Ravi Venkat assured the members that priority would be given to local people for employment One of the member inquired about total cost of the project and is it feasible for the company to establish one textile unit which will benefit local farmers to sell their agriculture produce Mr Ravi Venkat explained the members that total investment for setting up the power generating unit has been estimated around Rupees 45 crores and also assured the members that he will put forward the proposal for setting up a textile unit before the management On inquiring about source of water for operation of the plant Mr Ravi Venkat explained to the members that water will drawn from the canal which is at a distance of 15 Kms from the plant site and also through bore wells The members expressed dissatisfaction on meeting water requirement by means of bore wells as this may lead to water problem in the local area Mr Ravi Venkat explained that bore wells will be utilized as emergency source and substantial quantity of water will be drawn from the canal and mentioned the progress of the official proceedings for drawing of water from the canal All the members were satisfied and requested the company to use water judiciously The members also requested Mr Ravi Venkat to put the matter in front of the management and suggested to construct a reservoir for captive purpose if possible near the plant site The members inquired about the landed cost of crop residues and whether sugar cane trash amp tops can be used as raw material Mr Ravi Venkat felt sorry for not having information about using sugar cane residues as raw material but assured the members to inquire about the same from the corporate office Regarding landed cost of residues MrRavi Venkat mentioned that cost of raw materials would be around Rs 350 to 450 per tonne The members expressed their willingness to supply raw materials and requested the company management to increase the cost of raw materials The members also assured that the company can procure substantial quantity of raw materials provided the cost of raw material is increased The members also informed Mr Ravi Venkat that Parbhani and adjoining districts such as Hingoli are one of important cotton producing districts in the state of Maharashtra and presently 60 of the cotton stalks is being burnt in the fields hence the company can procure sufficient quantity of raw material for operation of the plant On questioning about the project commissioning period Mr Ravi Venkat informed the members that construction of the unit will start within a period of two months and the unit will be commissioned by June 2008 The meeting was terminated at 130 PM (IST) with Gram Panchayath Sarpanch giving vote of thanks on behalf of the
Panchayath
CDM-SSC-PDD (version 02) CDM ndash Executive Board page 50 members to all the participants of the meeting and wished the company to commission the project at the earliest The Sarpanch requested the company management to contribute some monetary help for the renovation of the village temple Mr Ravi Venkat assured the sarpanch that he will discuss the issue with the Managing Director personally
CDM-SSC-PDD (version 02) CDM ndash Executive Board page 51
- a) Justification for application of simplified methodology to the project activity
- b) National Policies and Circumstances
- c) Additionality
- Technological Barriers
-
- Annex 1
-
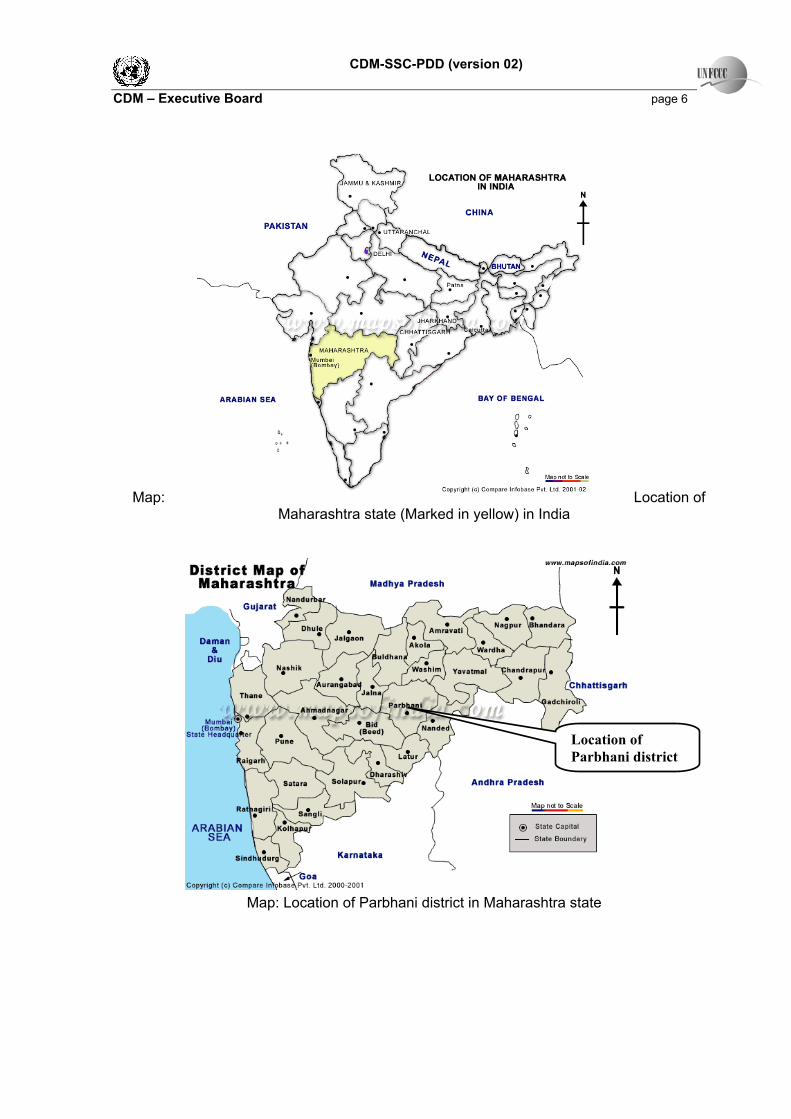
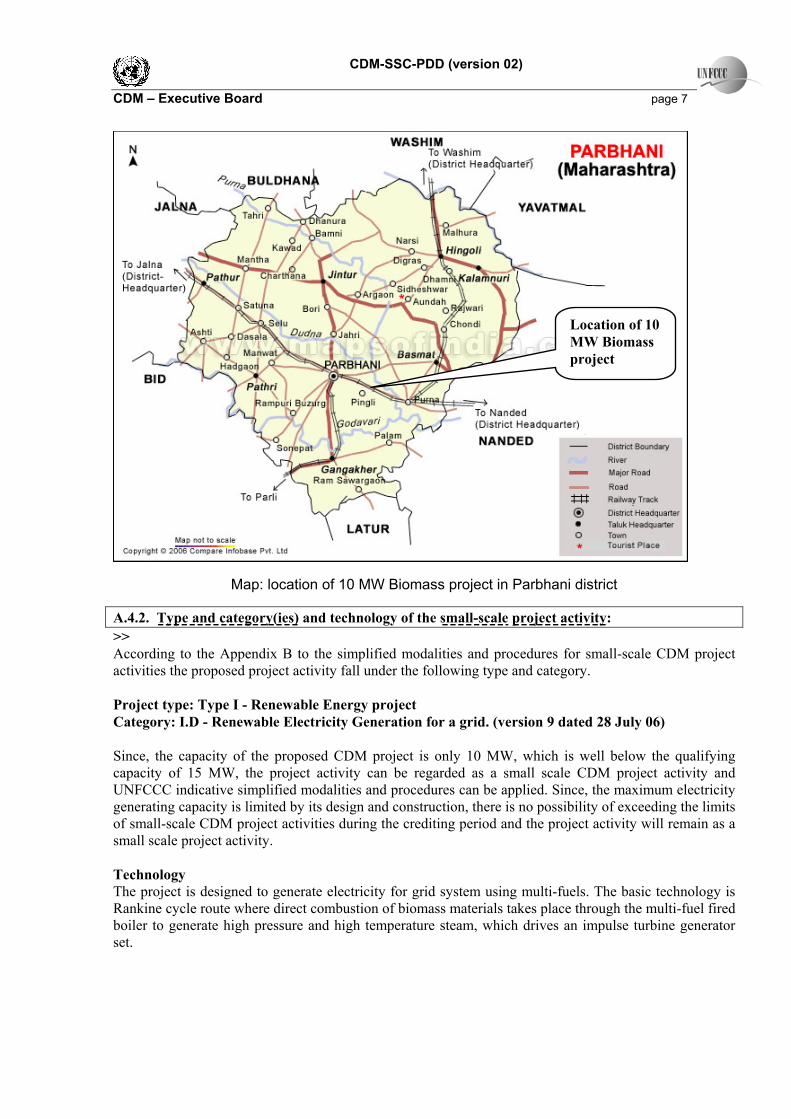
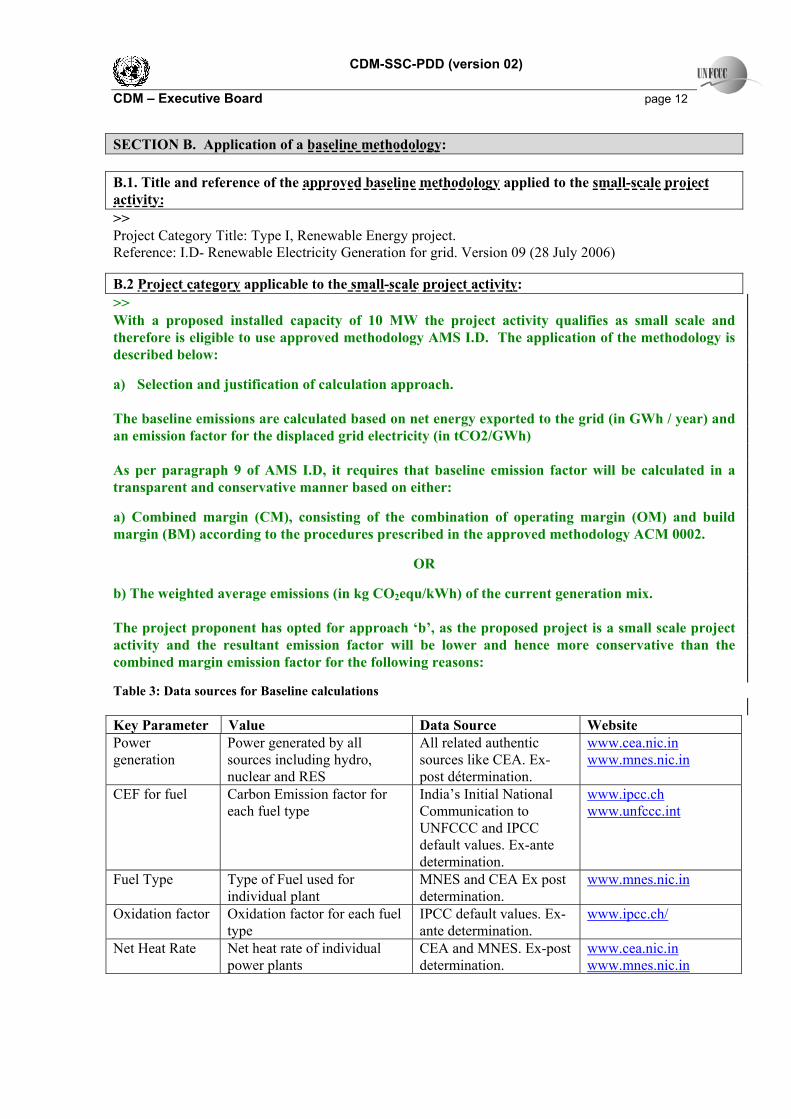
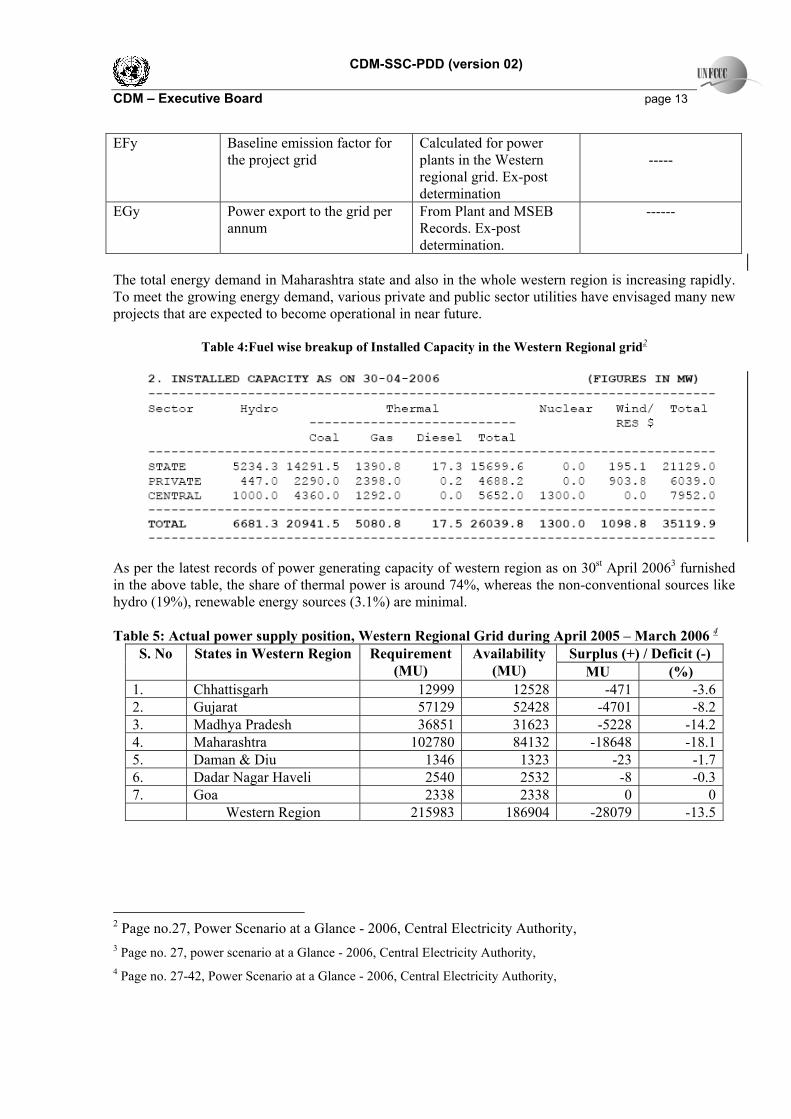
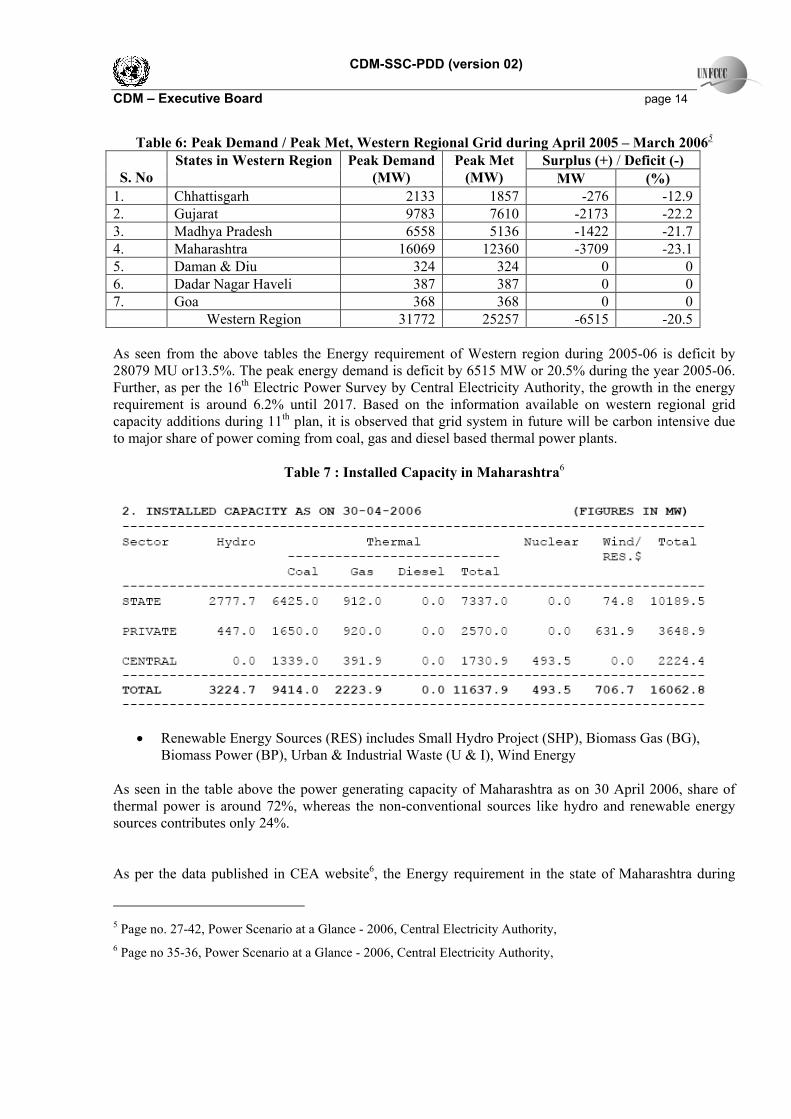
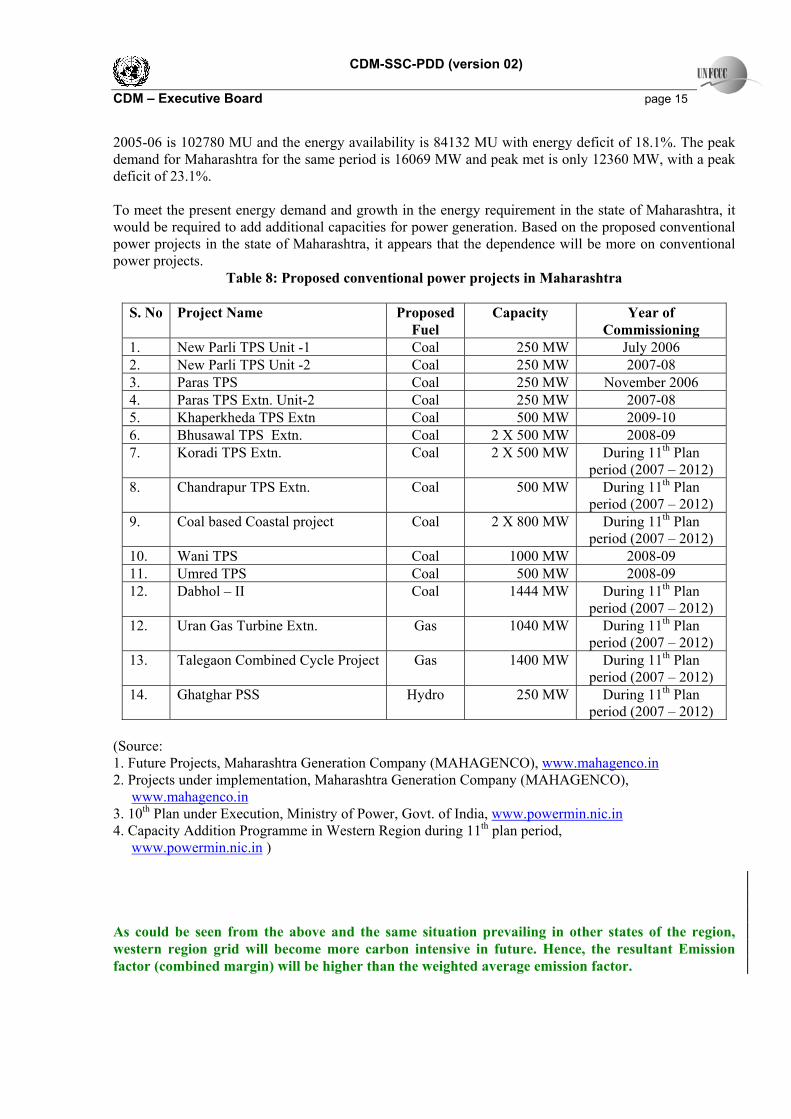
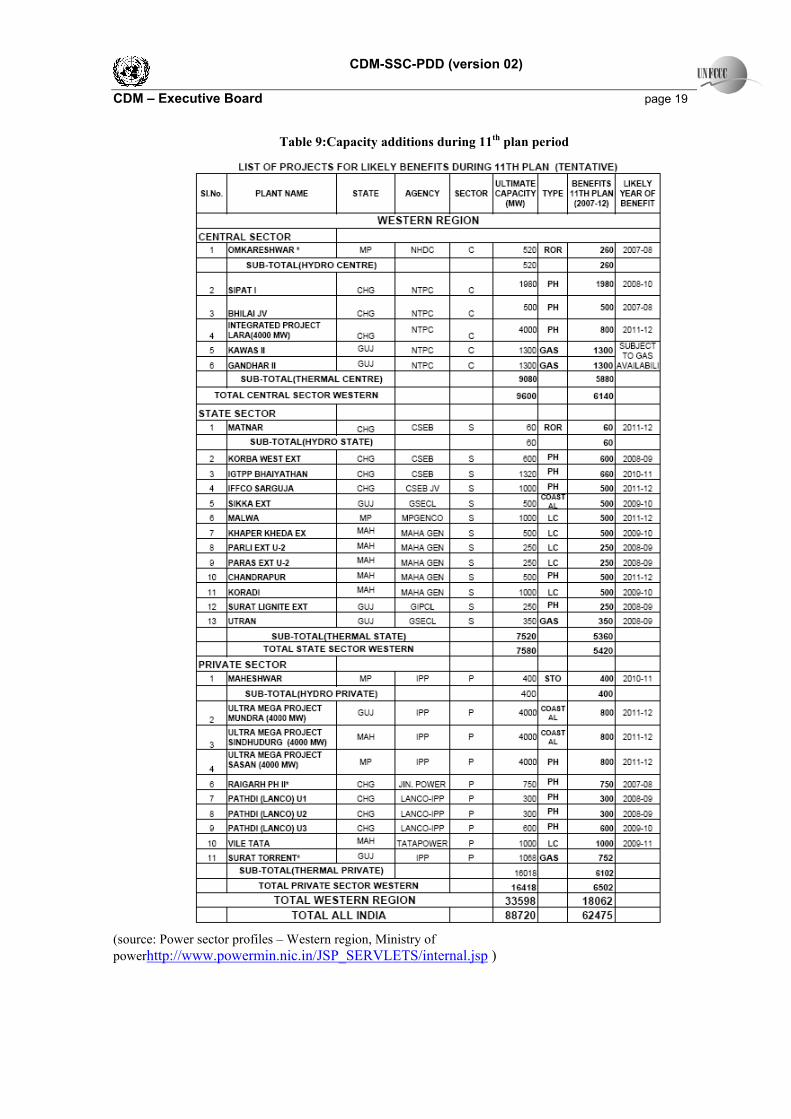
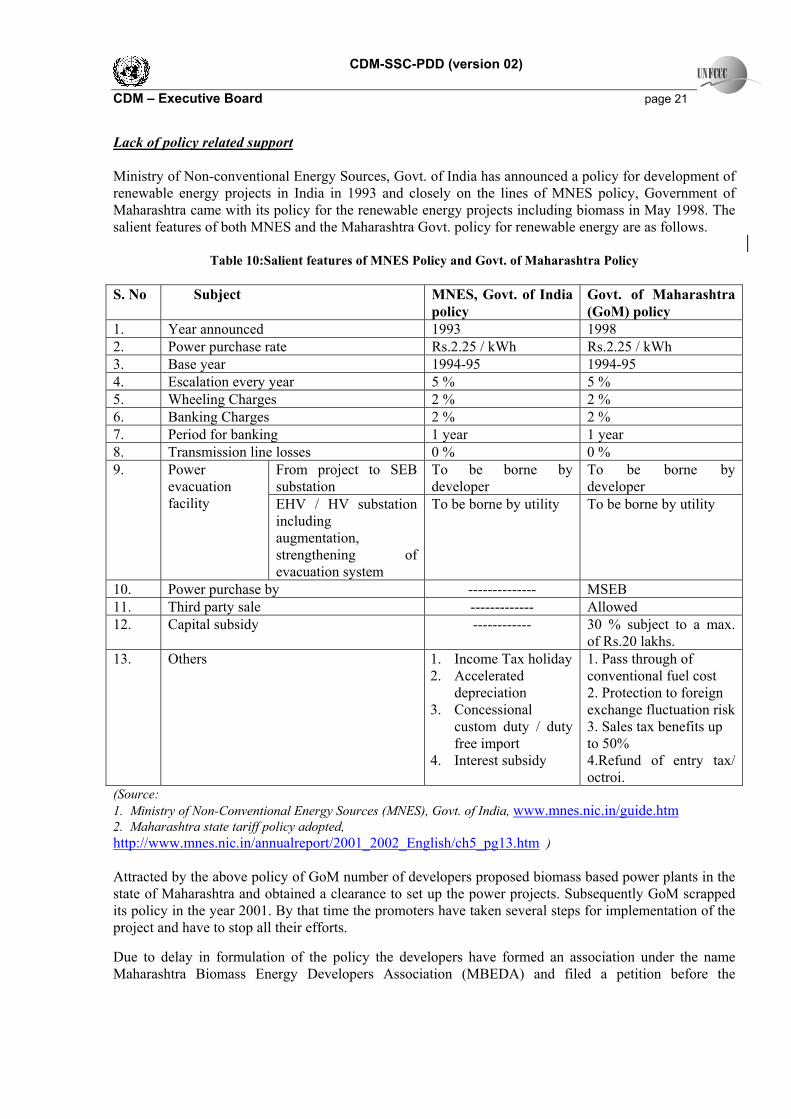
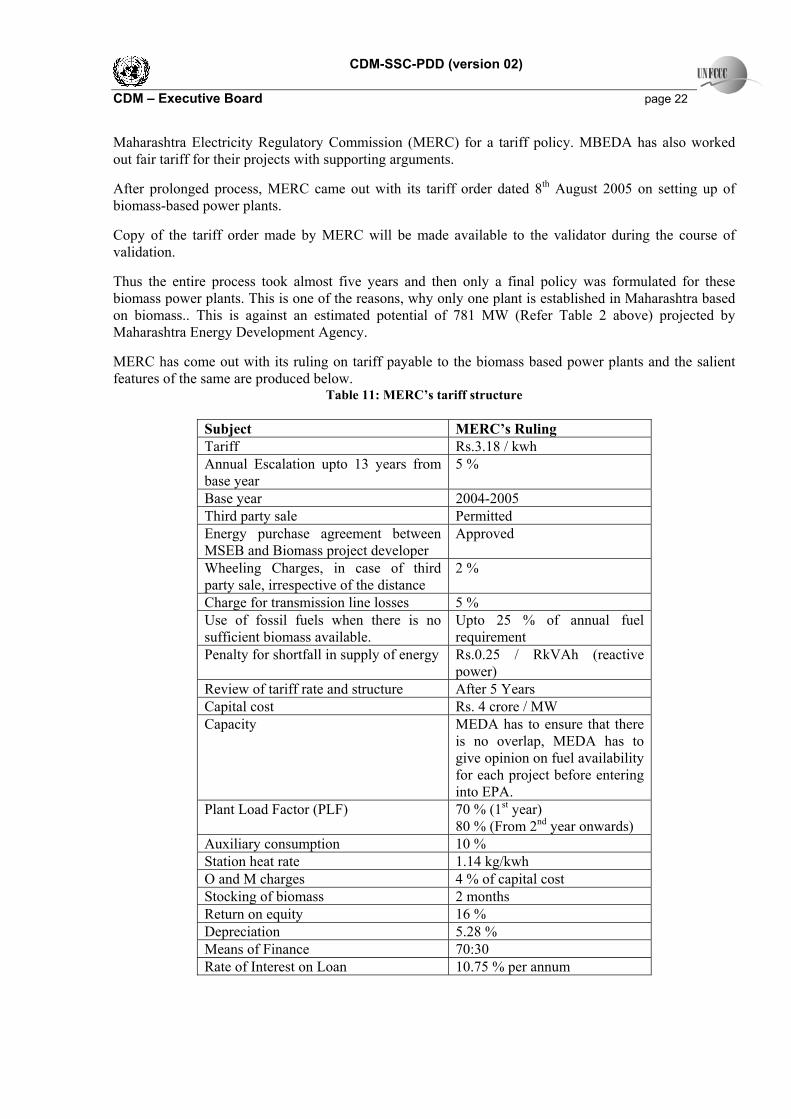
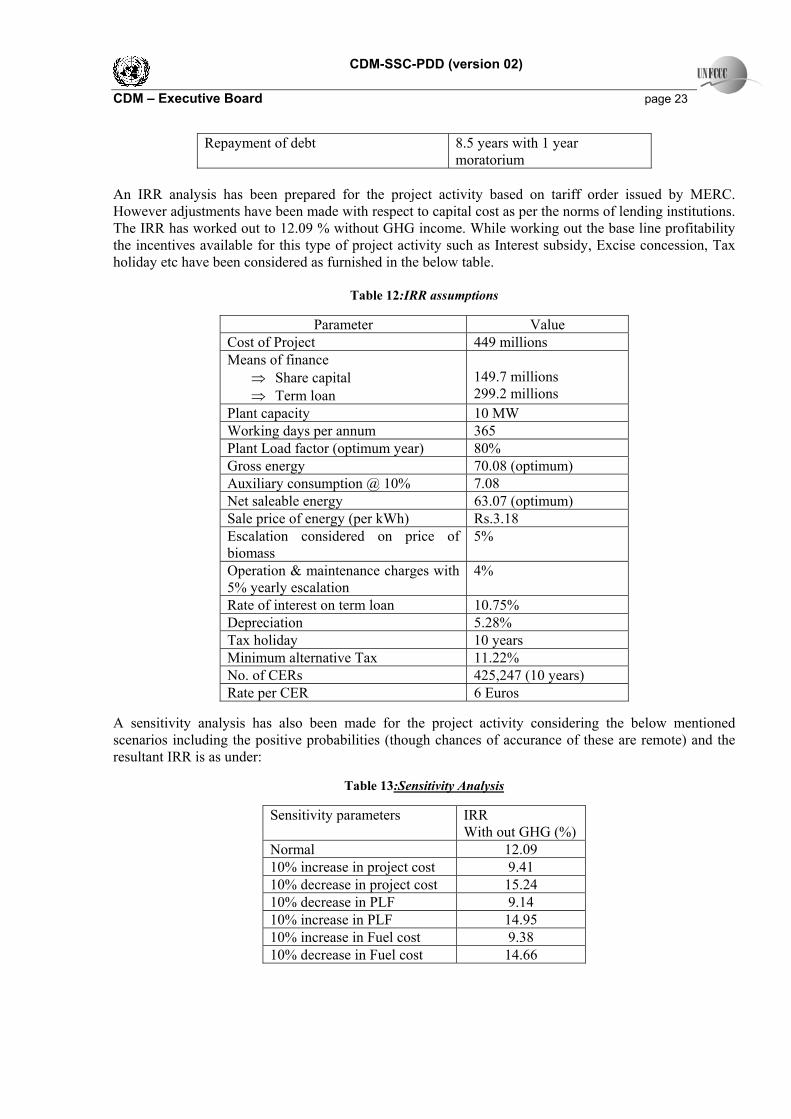
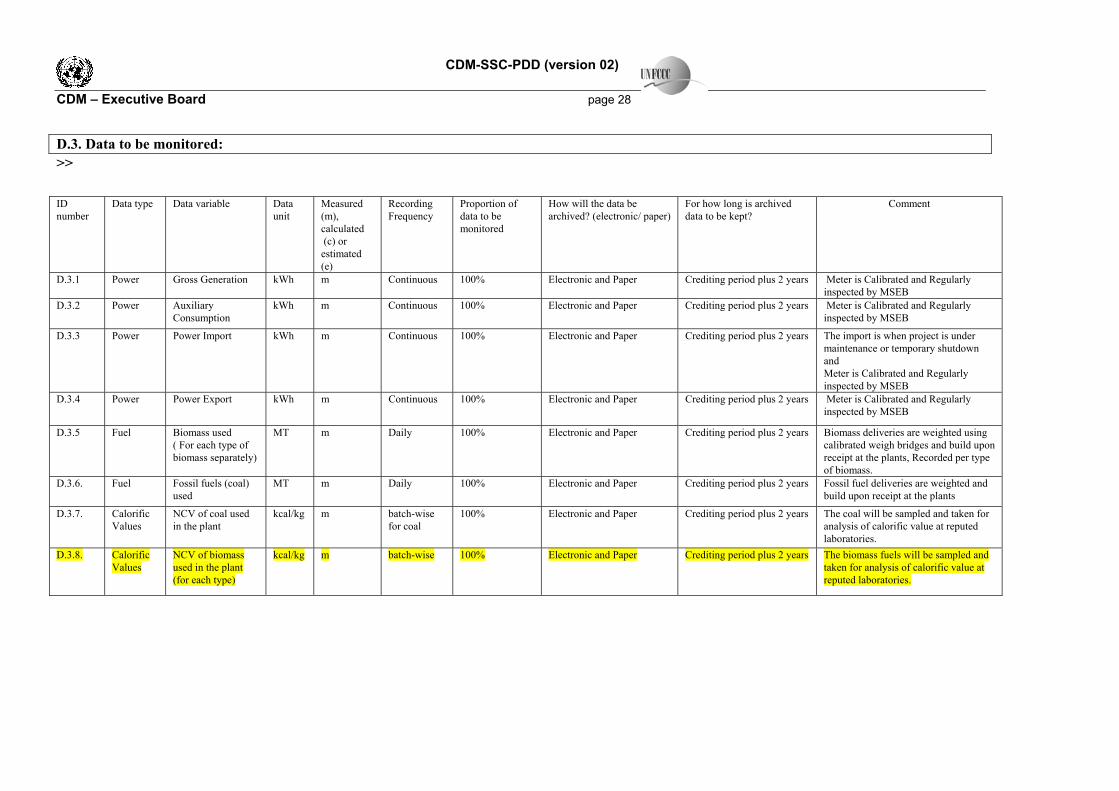
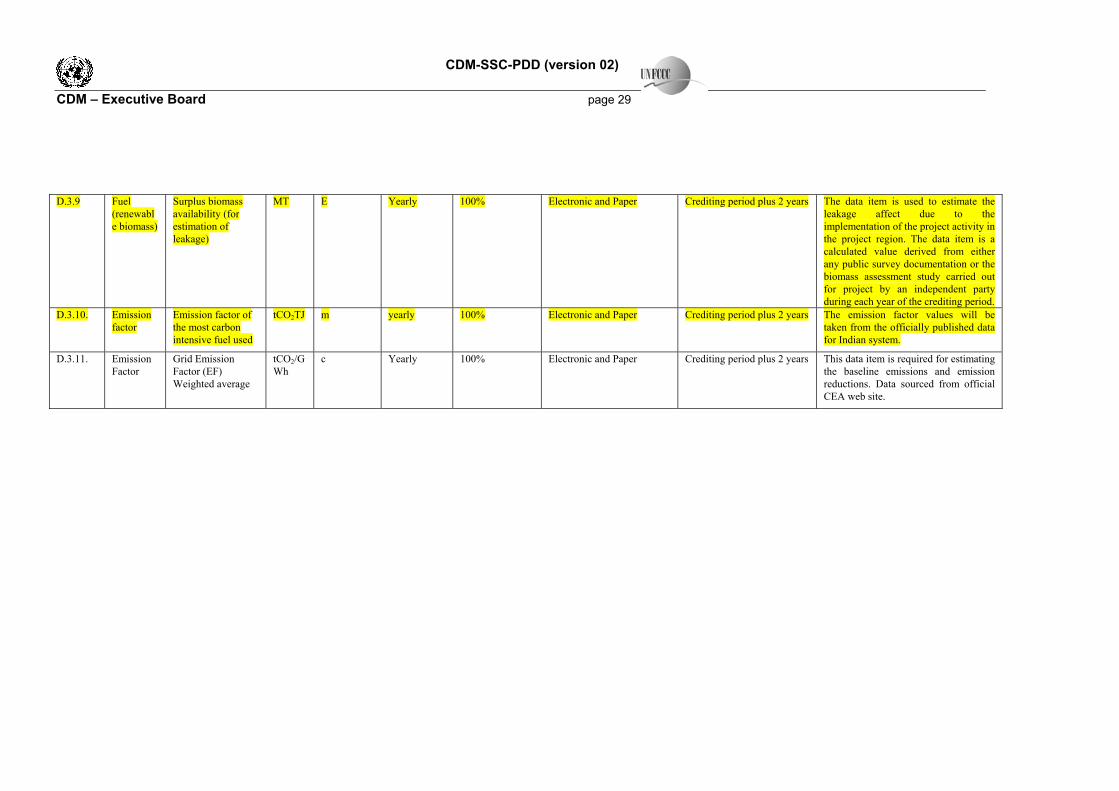
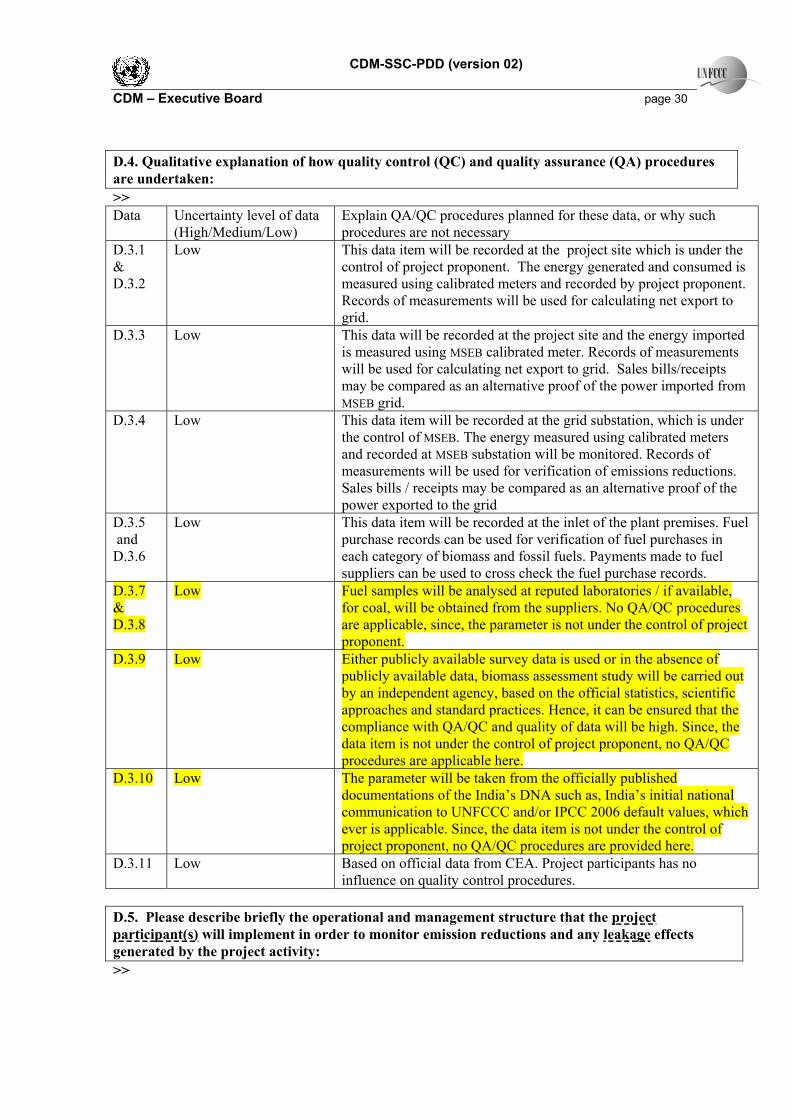
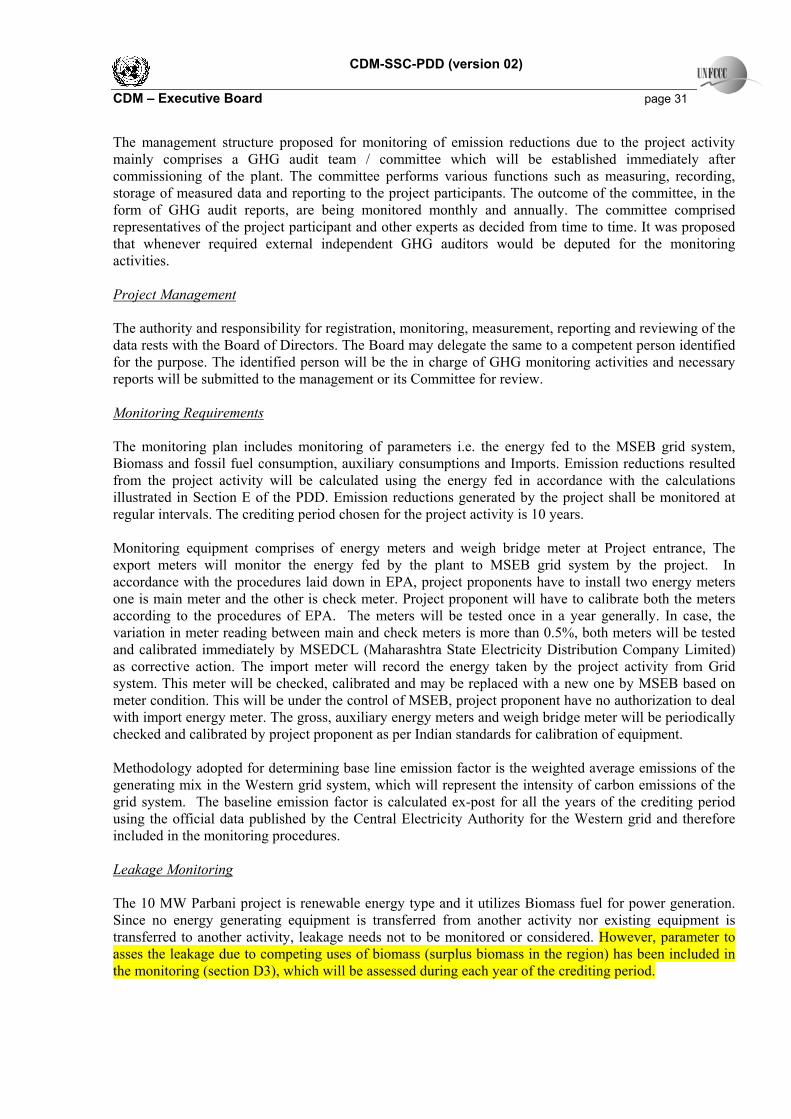
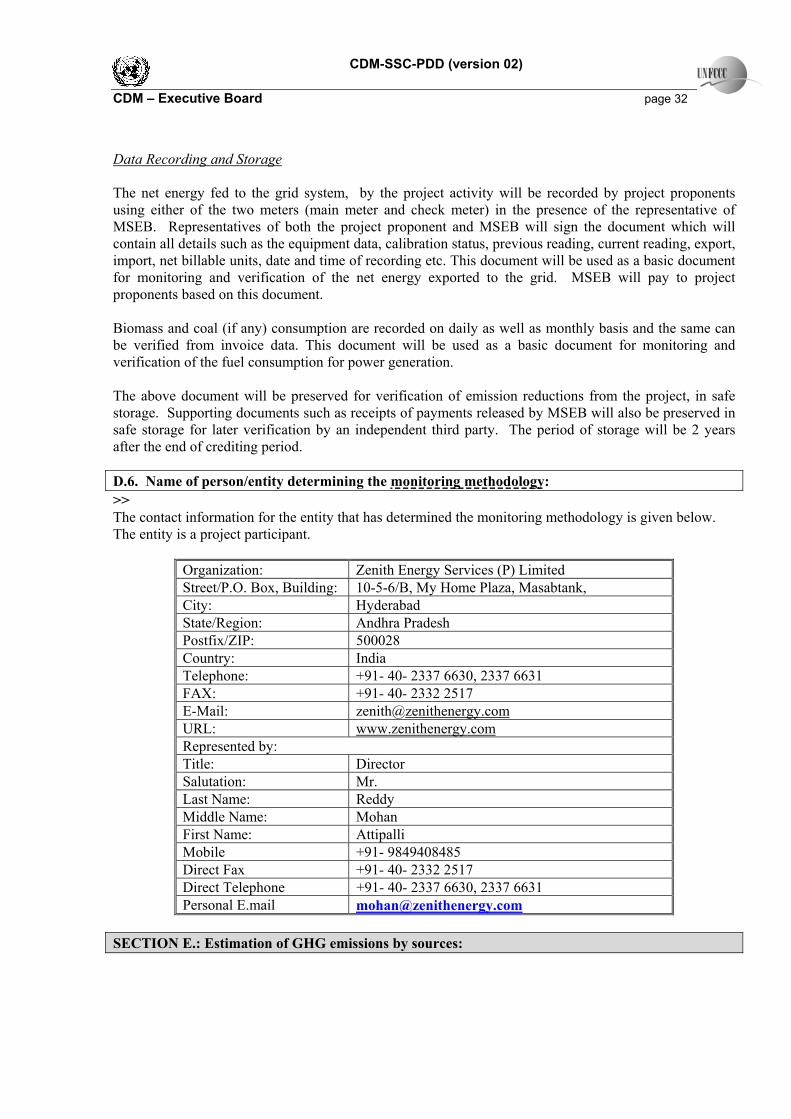
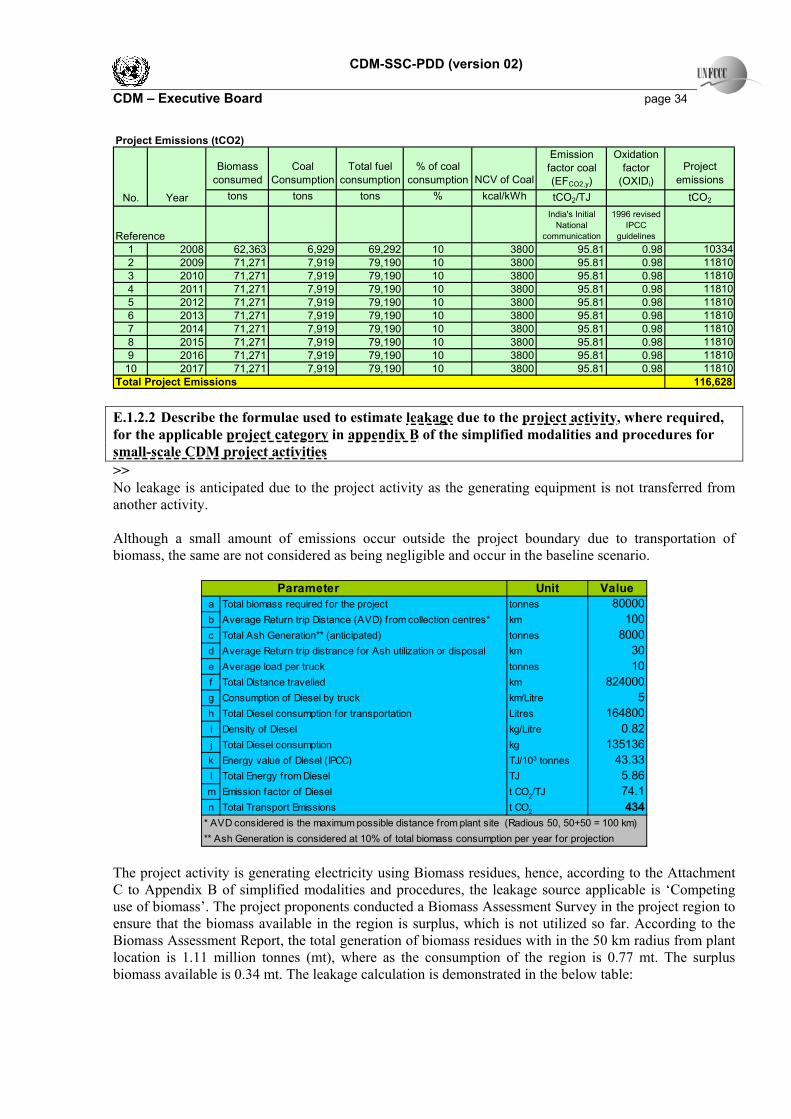
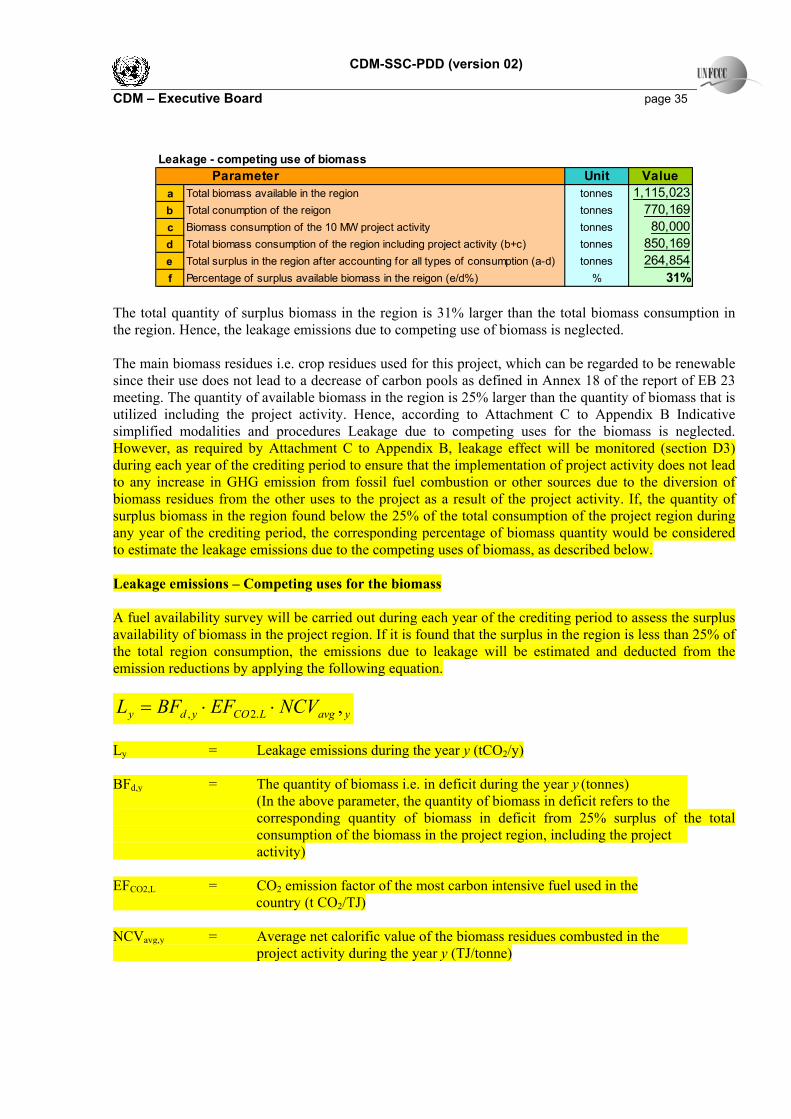
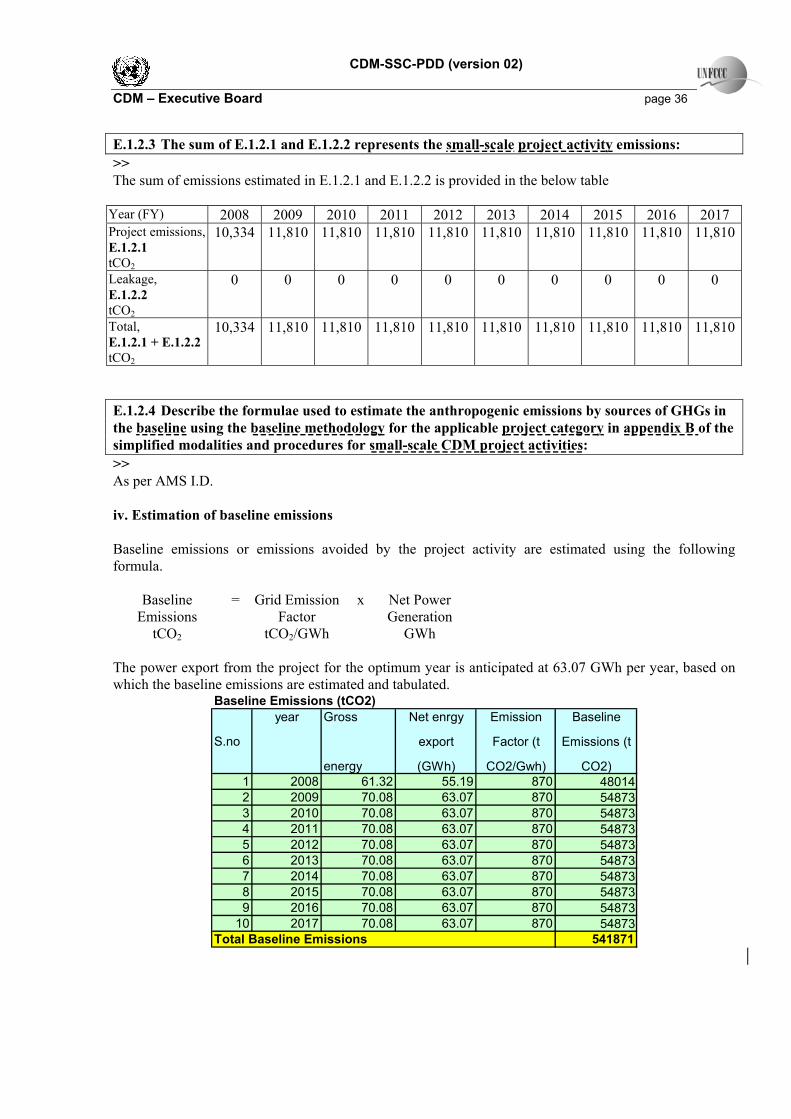
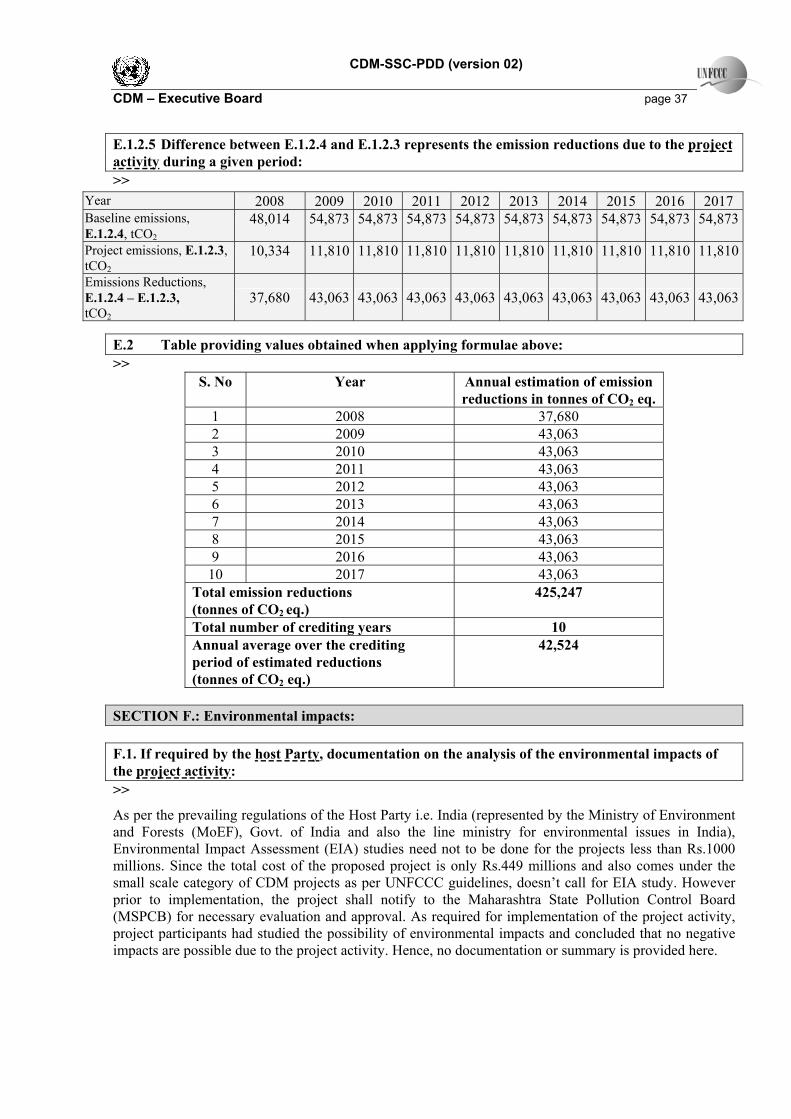
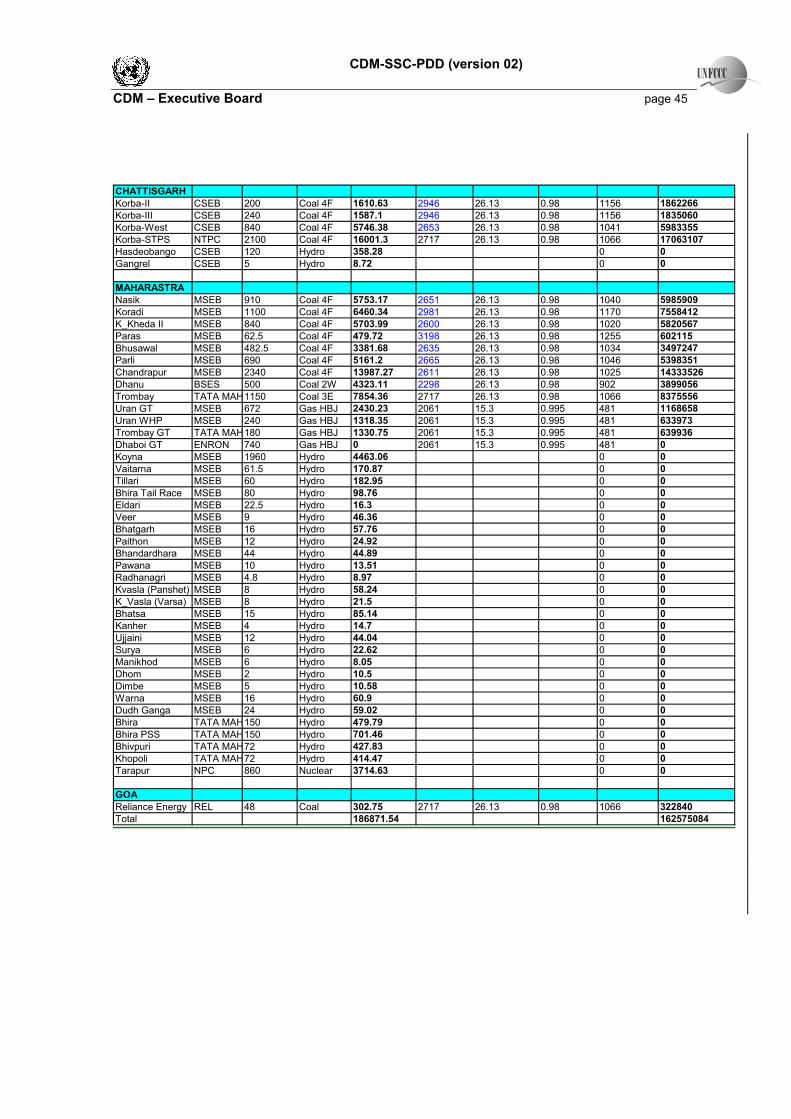
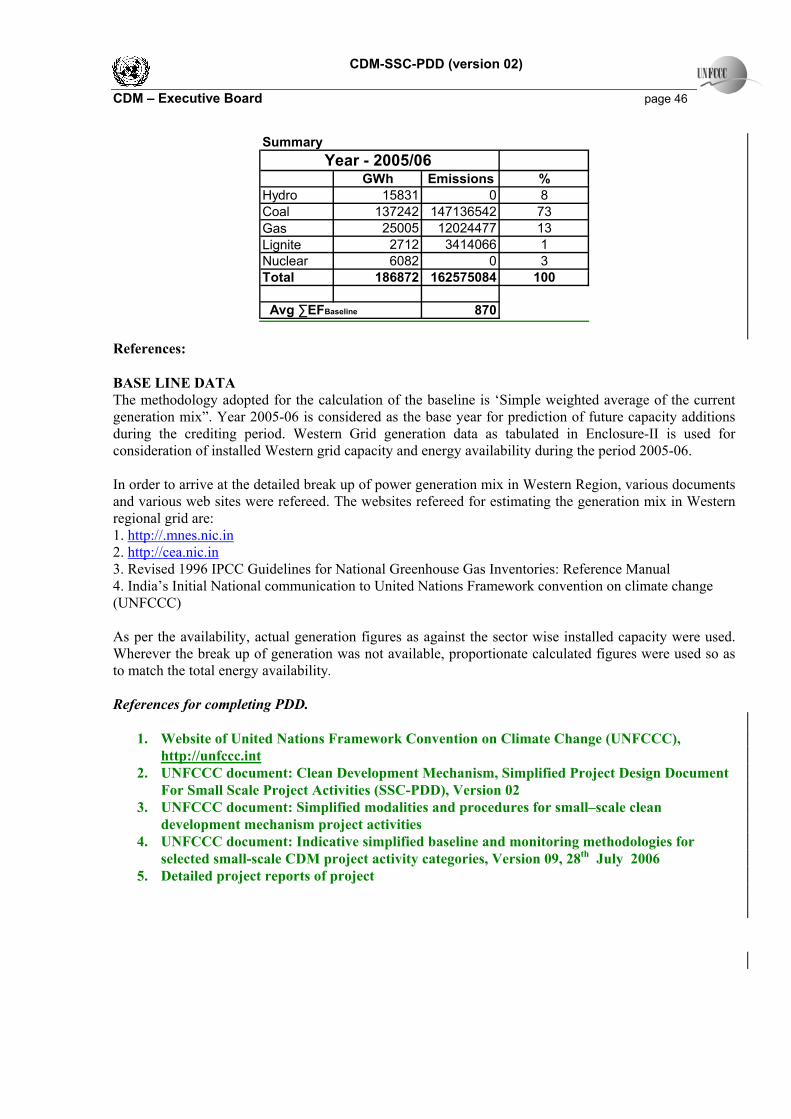
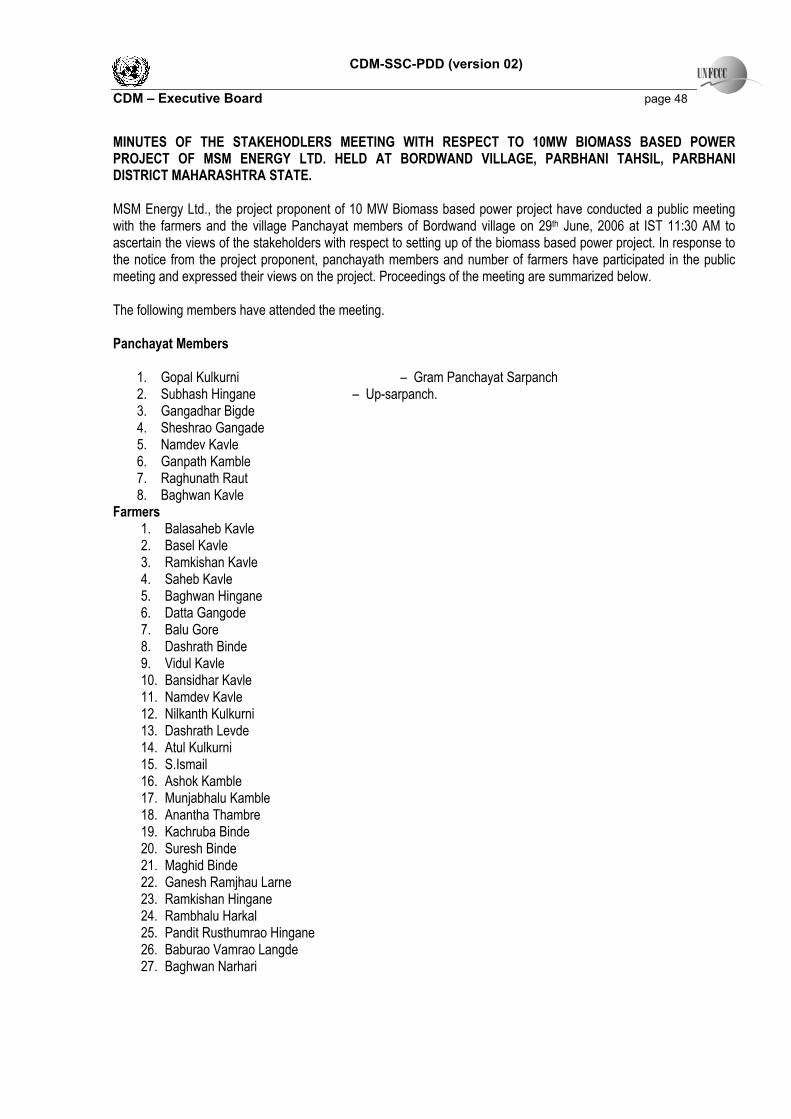
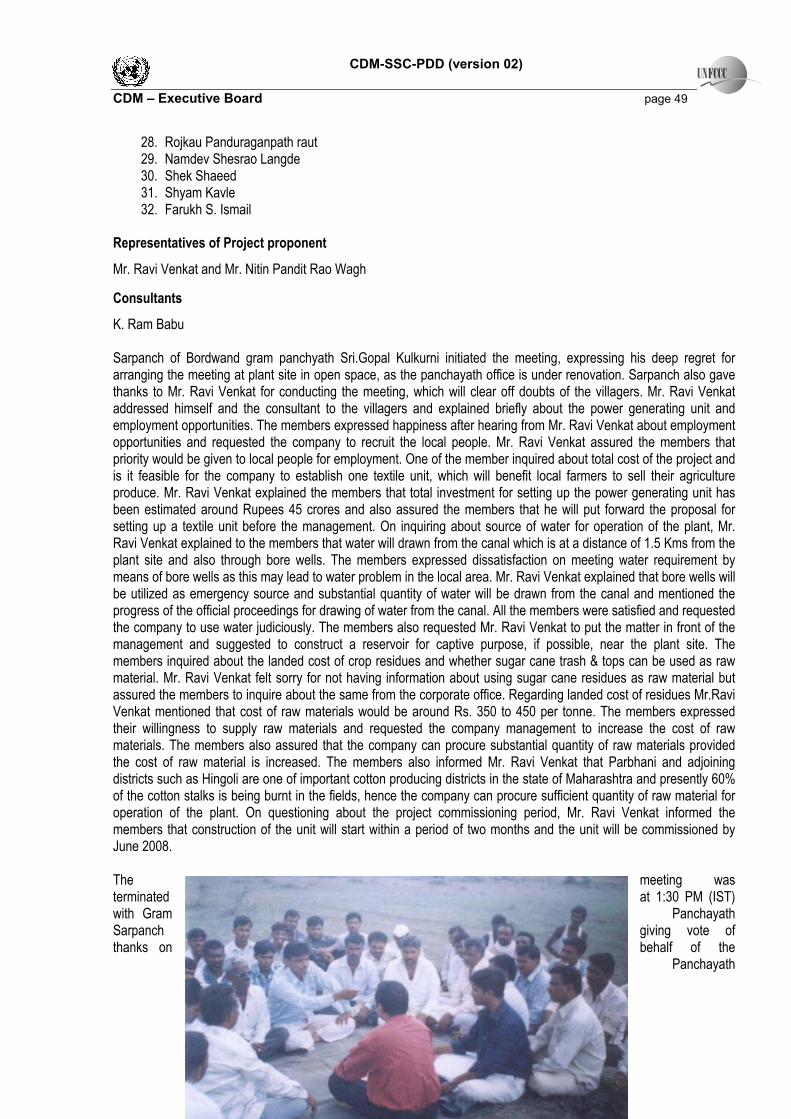
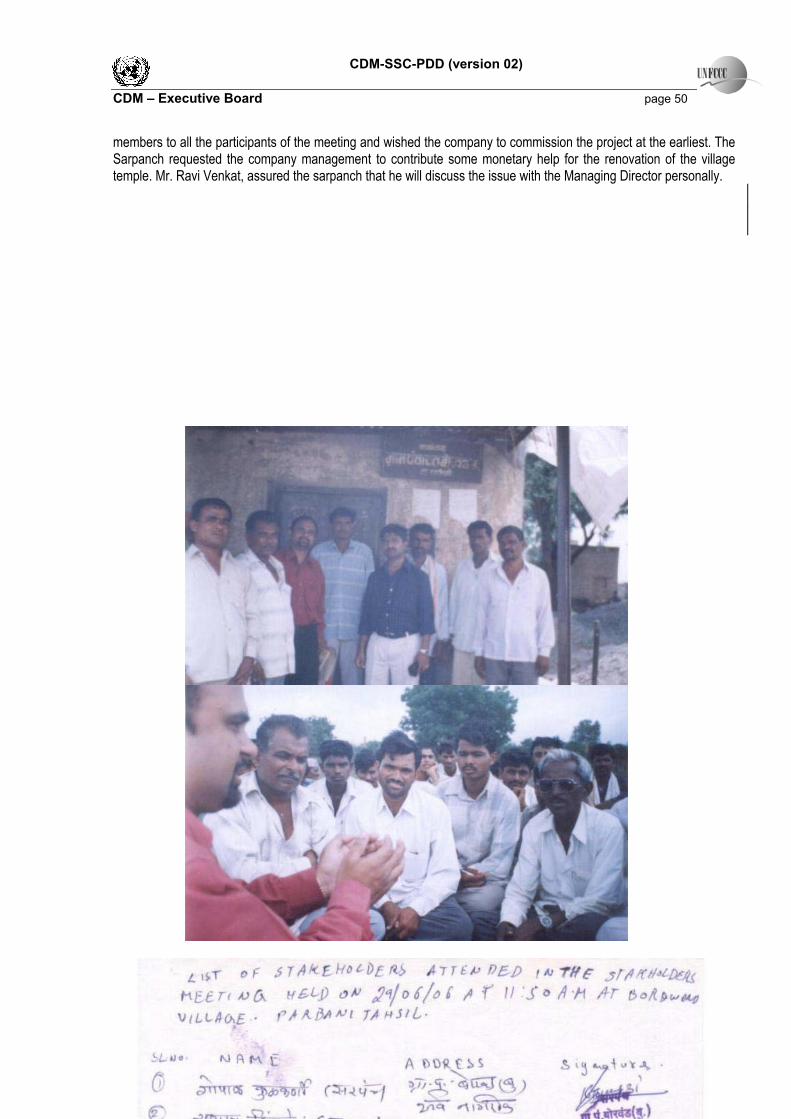
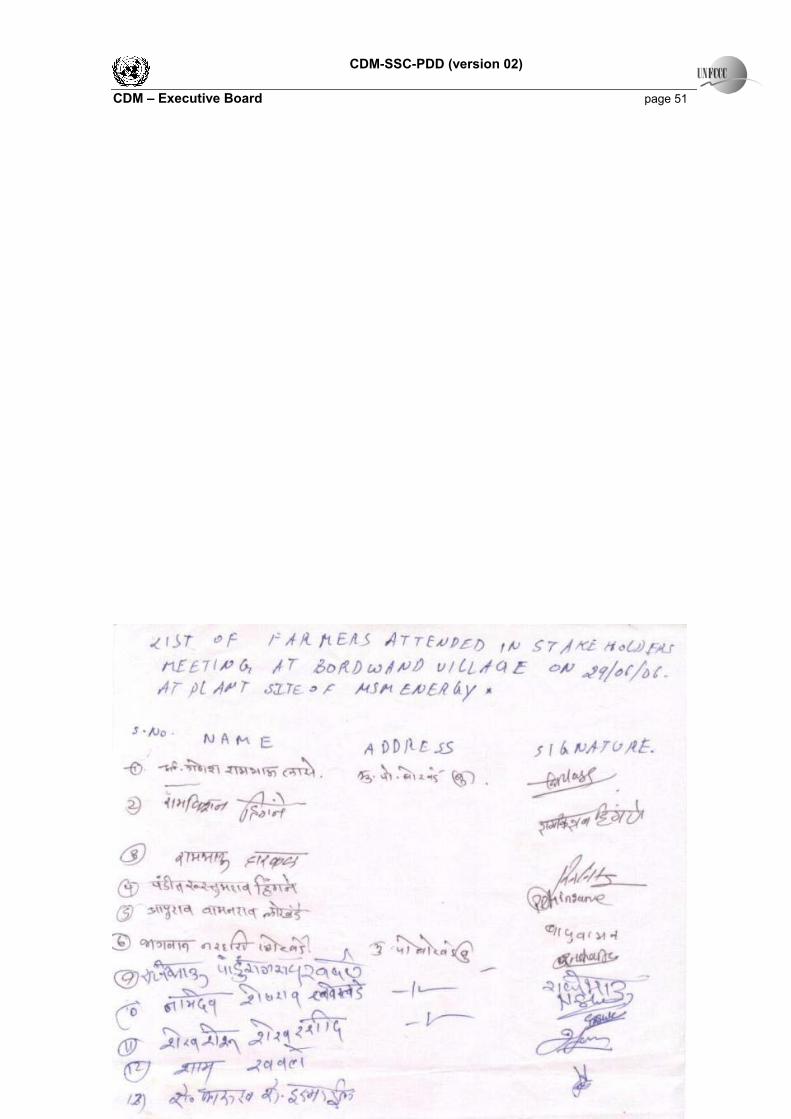
CDM-SSC-PDD (version 02) CDM ndash Executive Board page 51
- a) Justification for application of simplified methodology to the project activity
- b) National Policies and Circumstances
- c) Additionality
- Technological Barriers
-
- Annex 1
-
Related Documents