BSM’s structured approach to Capacity Planning addresses and consistently alleviates this mismatch, ensuring efficient and productive management of laboratory resources. Capacity Planning In laboratories a significant cost is often incurred due to a mismatch between workload demand and actual capacity. MANAGEMENT BRIEFING

Welcome message from author
This document is posted to help you gain knowledge. Please leave a comment to let me know what you think about it! Share it to your friends and learn new things together.
Transcript

BSM’s structured approach to Capacity Planning addresses and consistently
alleviates this mismatch, ensuring efficient and productive management
of laboratory resources.
CapacityPlanning
In laboratories a significant cost is often incurred due to amismatch between workload demand and actual capacity.
MANAGEMENT BRIEFING
Pharmaceutical production is inherently volatile, with respect to volume of batches produced, the mix of products and the associated testing. Quality Control laboratories are frequently expected to increase productivity to meet demand, whilst being tasked with improving quality and reducing lead times. Therefore, a laboratory’s ability to prioritize, work efficiently and react to changes is imperative to its success.
CapacityPlanning
Using a custom built BSM Capacity Planning Tool (CPT),advance notice of ‘pain points’ (capacity shortfalls) can be identified, allowing sufficient time to take remedialaction. Similarly, upcoming opportunities (unused capacity) can also be flagged and leveraged.
This briefing will describe BSM’s approach to designing a lab-specific CPT, from gathering comprehensive inputs to valuable insightful outputs.
Through the implementation of ‘Real Lean’ techniques, specifically workload
leveling, flow and standard work, a lab may recoup up to 30% of its capacity
from existing staff and equipment (see blog titled ‘Use Real Lean As Your
First Step To Release Capacity’ at https://bsm.ie/blog). However, best practice
Lean solutions will still be subject to ongoing volatility if/when future production
changes significantly. A genuinely Lean Lab must have a defined process for
analyzing forecasted demand and translating it into capacity requirements.

What we oftenfind in labs The cost incurred by having a poor understanding of your demand/capacity relationship.Most QC labs receive samples with a high degree of variability and complexity.This can make accurately calculating capacity a difficult task. Labs often havevarying degrees of understanding of lab capacity but rarely a process in place thatperiodically analyzes upcoming demand and the resulting impact on the lab.
The incoming workload of QC labs is innately volatile with
significant peaks and dips in volume (see Figure 1). Little can
be done to ease this as pharmaceutical manufacturing is
driven by factors such as market fluctuations, pandemic
spikes and campaigning. In addition, the mix of products will
inevitably change as new drugs are developed/ discontinued.
The testing requirements and test ‘hands on time’ of the
samples are also subject to change as testing methods and
regulatory requirements evolve. This volatility is unavoidable
and can result in poor productivity (during dips) and poor
lead time performance (during peaks). Analyzing capacity as
a ‘snapshot’ in time quickly becomes outdated and unusable.
Creating a dynamic capacity planning tool, linked to the
genuine upcoming demands of the business is the most
effective way to capture the resource requirements of a lab.
There is often a disconnection between supply chain
planning and QC labs resulting in the lab having little visibility
into upcoming demand. Significant changes in production
volume will directly impact a lab and if demand exceeds
capacity, the lab will fall behind. Often, this crisis is only
identified when KPI’s (Key Performance Indicators) begin to
decline, at which point the recovery actions will prove
arduous and costly. The fire-fighting that ensues is expensive
as the lab scrambles to add extra shifts, hire part-time
analysts or, even worse, deliver late. The alternative scenario,
demand far below the labs capacity, is equally as costly. A
lull in production will result in poor productivity and missed
opportunities to initiate training, projects or return
outsourced testing (see Figure 1).
2. Little visibility of upcoming production demands
Where forecasts are accessible, the full impact of
fluctuations in production volume and mix, on the lab, is
often poorly understood. For example, a 10% increase in
production volume is not necessarily equivalent to a 10%
increase in lab workload. Despite having visibility on
demand, the lab may not have the information e.g. reliable
standard work, optimally modeled test run sizes etc., nor the
tools required to convert batches into the various elements
of lab capacity.
3. Little understanding of how production outputs translate into lab capacity requirements
1. Unavoidable volatility
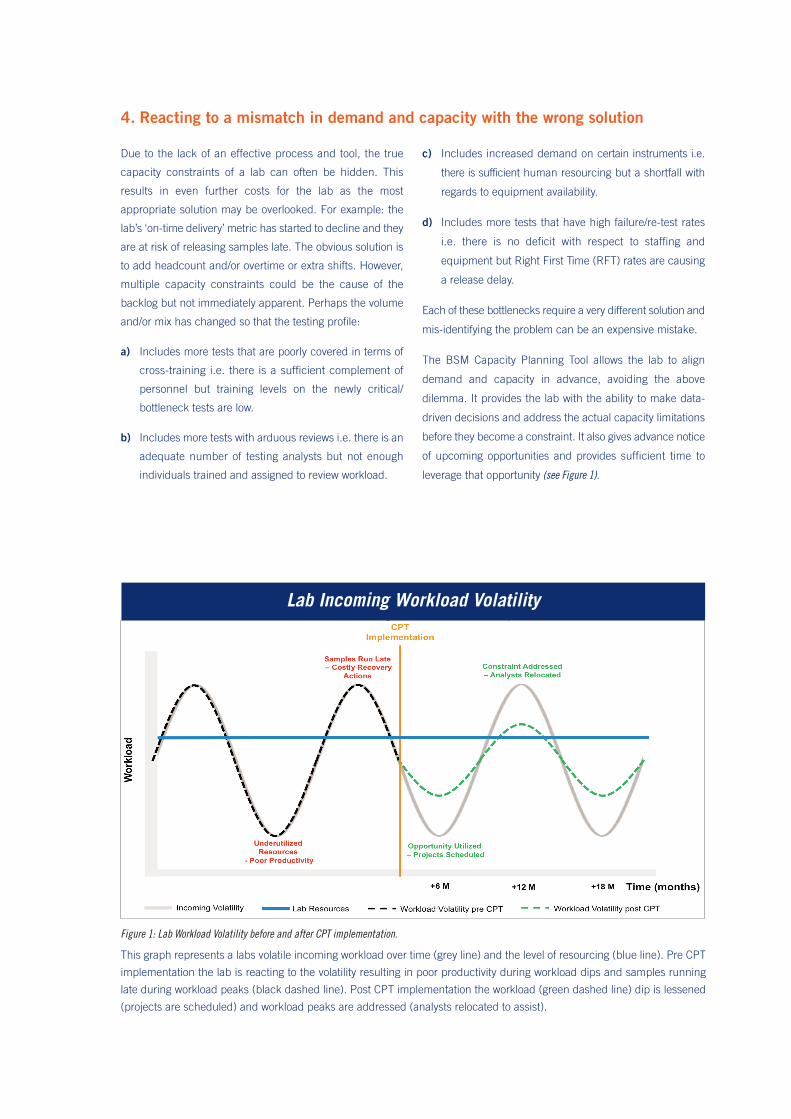
Due to the lack of an effective process and tool, the true
capacity constraints of a lab can often be hidden. This
results in even further costs for the lab as the most
appropriate solution may be overlooked. For example: the
lab’s ‘on-time delivery’ metric has started to decline and they
are at risk of releasing samples late. The obvious solution is
to add headcount and/or overtime or extra shifts. However,
multiple capacity constraints could be the cause of the
backlog but not immediately apparent. Perhaps the volume
and/or mix has changed so that the testing profile:
a) Includes more tests that are poorly covered in terms of
cross-training i.e. there is a sufficient complement of
personnel but training levels on the newly critical/
bottleneck tests are low.
b) Includes more tests with arduous reviews i.e. there is an
adequate number of testing analysts but not enough
individuals trained and assigned to review workload.
c) Includes increased demand on certain instruments i.e.
there is sufficient human resourcing but a shortfall with
regards to equipment availability.
d) Includes more tests that have high failure/re-test rates
i.e. there is no deficit with respect to staffing and
equipment but Right First Time (RFT) rates are causing
a release delay.
Each of these bottlenecks require a very different solution and
mis-identifying the problem can be an expensive mistake.
The BSM Capacity Planning Tool allows the lab to align
demand and capacity in advance, avoiding the above
dilemma. It provides the lab with the ability to make data-
driven decisions and address the actual capacity limitations
before they become a constraint. It also gives advance notice
of upcoming opportunities and provides sufficient time to
leverage that opportunity (see Figure 1).
4. Reacting to a mismatch in demand and capacity with the wrong solution
Figure 1: Lab Workload Volatility before and after CPT implementation.
This graph represents a labs volatile incoming workload over time (grey line) and the level of resourcing (blue line). Pre CPT
implementation the lab is reacting to the volatility resulting in poor productivity during workload dips and samples running
late during workload peaks (black dashed line). Post CPT implementation the workload (green dashed line) dip is lessened
(projects are scheduled) and workload peaks are addressed (analysts relocated to assist).
Lab Incoming Workload Volatility

Figure 2a: Capacity Tool Calculations – Available Capacity.
Capacity Planning Tool – InputsEvery lab is different with a unique combination of tests, equipment, resources, sample types, lead-timerequirements, workload volume and volatility. BSM gathers comprehensive CPT inputs, based on the keyprinciples of Lean and creates outputs tailored to the specific needs of the lab. The general principles aredetailed below.
Frequent management of lab resourcing levels is required to
ensure the unit is sufficiently staffed for periods of peak
demand. Staff must also be adequately trained to cover all
necessary testing, ensuring a flexibility of workforce and
enabling a swift exchange of resources if required. In short,
to determine overall available capacity, management would
ideally track and have a detailed knowledge of (see Figure 2a):
Availability: How many available FTE’s does the lab
have? Factors such as training, meetings, holidays,
extended leave etc. should all be accounted for.
Role: How many FTE’s are involved in testing
vs support functions?
Competence: What is the cross-training coverage on all of
the most critical tests and where do key vulnerabilities lie?
Often, little thought is given to cross-training and resources
can be dedicated to particular tests or sample types. If the
volume of samples for their designated test is volatile, this
will be directly imported into their daily workload, resulting
in a productivity loss. Considering the group as a whole,
individual analysts may be overloaded whilst others are
underutilized, resulting in overall poor group productivity (see
blog titled ‘The Trouble with Dedicated Resources: Leveling the Workload’
https://bsm.ie/blog). BSM design and implement aggressive
cross-training plans based on appropriate coverage for all
critical testing avoiding these productivity pitfalls.
1. People
Availability and Competences
NET AVAIL FTE’S AVAIL HOURS PER MONTH AVAIL CAPACITY (AVAIL FTE HOURS)x =
Gathering timing information is notoriously difficult in labs
and requires a sensitive and systematic approach. Standard
work is a key Lean principle which aims to define the ideal
work sequence in order to decrease variability in task
performance, reduce errors and ultimately establish the ideal
testing times. BSM have developed a method of collecting
standard work that is accurate and easily adaptable should
batch sizes change. The method involves mapping the
combination and sequencing of tasks based on analysts that
are good time task managers, thereby creating the ‘standard’
for each test method. For further details, see blog titled ‘Time
Studies, Work Measurements and Standards – How Not to Alienate You
Team’ https://bsm.ie/blog,
Standard Work
Labs perform a variety of tests for multiple demand channels.
The Product-Test Table acts as the ‘engine’ of the CPT and
is the master list of all testing required for each product and
sample type. In order to translate the forecasted demand into
workload one also needs to determine the following:
Test method standard work
Optimum test session sizes
Instrument capabilities and utilization
The accuracy of the CPT outputs and a lab’s ability to
effectively execute future workloads is dependent on the
accuracy of these key Lean inputs (see Figure 2b).
2. Testing and Efficiency
Product-Test Table
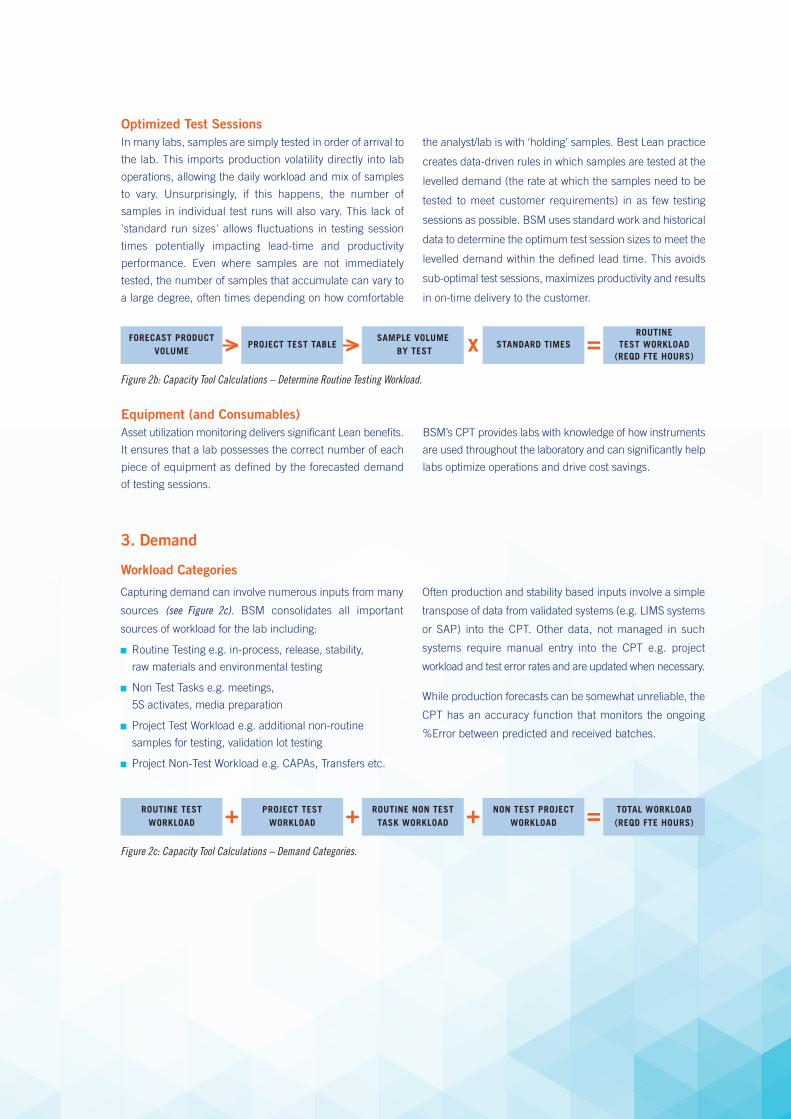
Capturing demand can involve numerous inputs from many
sources (see Figure 2c). BSM consolidates all important
sources of workload for the lab including:
Routine Testing e.g. in-process, release, stability,
raw materials and environmental testing
Non Test Tasks e.g. meetings,
5S activates, media preparation
Project Test Workload e.g. additional non-routine
samples for testing, validation lot testing
Project Non-Test Workload e.g. CAPAs, Transfers etc.
Often production and stability based inputs involve a simple
transpose of data from validated systems (e.g. LIMS systems
or SAP) into the CPT. Other data, not managed in such
systems require manual entry into the CPT e.g. project
workload and test error rates and are updated when necessary.
While production forecasts can be somewhat unreliable, the
CPT has an accuracy function that monitors the ongoing
%Error between predicted and received batches.
3. Demand
Workload Categories
In many labs, samples are simply tested in order of arrival to
the lab. This imports production volatility directly into lab
operations, allowing the daily workload and mix of samples
to vary. Unsurprisingly, if this happens, the number of
samples in individual test runs will also vary. This lack of
'standard run sizes' allows fluctuations in testing session
times potentially impacting lead-time and productivity
performance. Even where samples are not immediately
tested, the number of samples that accumulate can vary to
a large degree, often times depending on how comfortable
the analyst/lab is with ‘holding’ samples. Best Lean practice
creates data-driven rules in which samples are tested at the
levelled demand (the rate at which the samples need to be
tested to meet customer requirements) in as few testing
sessions as possible. BSM uses standard work and historical
data to determine the optimum test session sizes to meet the
levelled demand within the defined lead time. This avoids
sub-optimal test sessions, maximizes productivity and results
in on-time delivery to the customer.
Optimized Test Sessions
Asset utilization monitoring delivers significant Lean benefits.
It ensures that a lab possesses the correct number of each
piece of equipment as defined by the forecasted demand
of testing sessions.
BSM’s CPT provides labs with knowledge of how instruments
are used throughout the laboratory and can significantly help
labs optimize operations and drive cost savings.
Equipment (and Consumables)
Figure 2c: Capacity Tool Calculations – Demand Categories.
ROUTINE TESTWORKLOAD
PROJECT TESTWORKLOAD+ + ROUTINE NON TEST
TASK WORKLOADNON TEST PROJECT
WORKLOAD+ = TOTAL WORKLOAD(REQD FTE HOURS)
Figure 2b: Capacity Tool Calculations – Determine Routine Testing Workload.
FORECAST PRODUCTVOLUME
PROJECT TEST TABLE> > SAMPLE VOLUMEBY TEST
STANDARD TIMESx =ROUTINE
TEST WORKLOAD (REQD FTE HOURS)
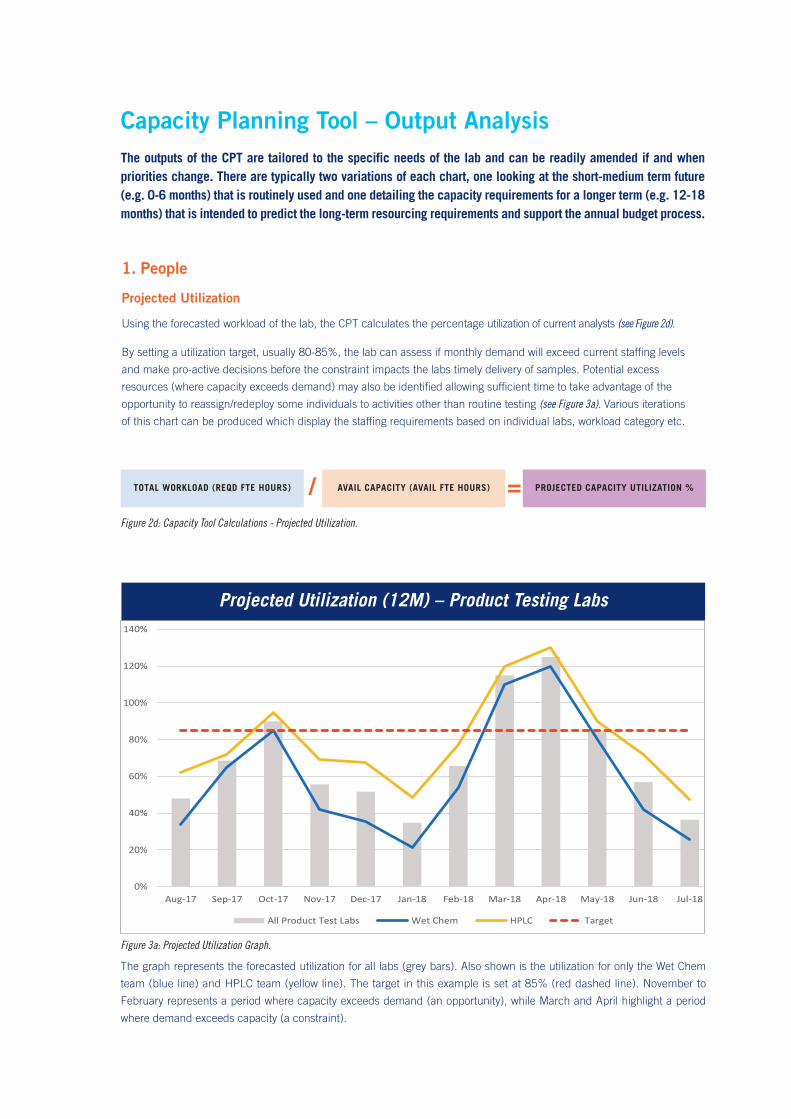
Figure 2d: Capacity Tool Calculations - Projected Utilization.
Figure 3a: Projected Utilization Graph.
The graph represents the forecasted utilization for all labs (grey bars). Also shown is the utilization for only the Wet Chem
team (blue line) and HPLC team (yellow line). The target in this example is set at 85% (red dashed line). November to
February represents a period where capacity exceeds demand (an opportunity), while March and April highlight a period
where demand exceeds capacity (a constraint).
Capacity Planning Tool – Output AnalysisThe outputs of the CPT are tailored to the specific needs of the lab and can be readily amended if and whenpriorities change. There are typically two variations of each chart, one looking at the short-medium term future(e.g. 0-6 months) that is routinely used and one detailing the capacity requirements for a longer term (e.g. 12-18months) that is intended to predict the long-term resourcing requirements and support the annual budget process.
1. People
Projected Utilization
Using the forecasted workload of the lab, the CPT calculates the percentage utilization of current analysts (see Figure 2d).
By setting a utilization target, usually 80-85%, the lab can assess if monthly demand will exceed current staffing levels
and make pro-active decisions before the constraint impacts the labs timely delivery of samples. Potential excess
resources (where capacity exceeds demand) may also be identified allowing sufficient time to take advantage of the
opportunity to reassign/redeploy some individuals to activities other than routine testing (see Figure 3a). Various iterations
of this chart can be produced which display the staffing requirements based on individual labs, workload category etc.
TOTAL WORKLOAD (REQD FTE HOURS) AVAIL CAPACITY (AVAIL FTE HOURS) PROJECTED CAPACITY UTILIZATION %/ =
0%
20%
40%
60%
80%
100%
120%
140%
Aug-17 Sep-17 Oct-17 Nov-17 Dec-17 Jan-18 Feb-18 Mar-18 Apr-18 May-18 Jun-18 Jul-18
All Product Test Labs Wet Chem HPLC Target
Projected Utilization (12M) – Product Testing Labs
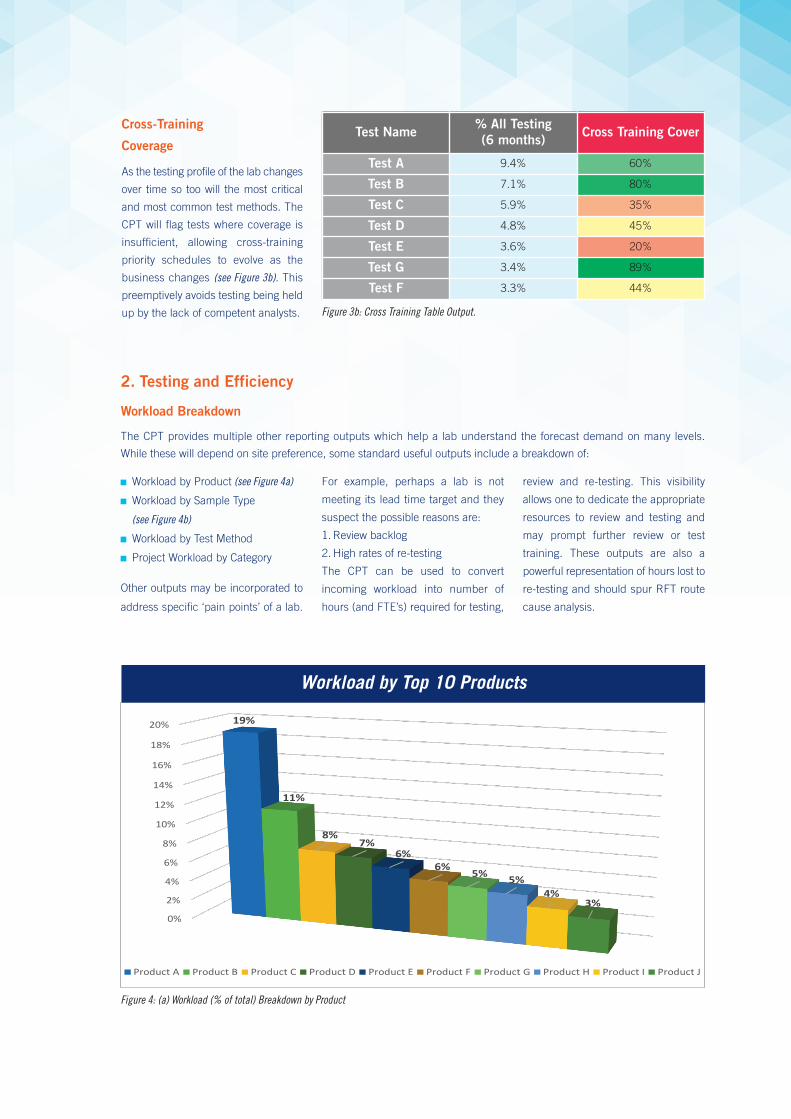
The CPT provides multiple other reporting outputs which help a lab understand the forecast demand on many levels.
While these will depend on site preference, some standard useful outputs include a breakdown of:
Workload by Product (see Figure 4a)
Workload by Sample Type
(see Figure 4b)
Workload by Test Method
Project Workload by Category
Other outputs may be incorporated to
address specific ‘pain points’ of a lab.
For example, perhaps a lab is not
meeting its lead time target and they
suspect the possible reasons are:
1. Review backlog
2.High rates of re-testing
The CPT can be used to convert
incoming workload into number of
hours (and FTE’s) required for testing,
review and re-testing. This visibility
allows one to dedicate the appropriate
resources to review and testing and
may prompt further review or test
training. These outputs are also a
powerful representation of hours lost to
re-testing and should spur RFT route
cause analysis.
2. Testing and Efficiency
Workload Breakdown
Figure 3b: Cross Training Table Output.
Test Name % All Testing (6 months) Cross Training Cover
Test A 9.4% 60%
Test B 7.1% 80%
Test C 5.9% 35%
Test D 4.8% 45%
Test E 3.6% 20%
Test G 3.4% 89%
Test F 3.3% 44%
Figure 4: (a) Workload (% of total) Breakdown by Product
0%
2%
4%
6%
8%
10%
12%
14%
16%
18%
20% 19%
11%
8%7%
6%6% 5% 5%
4%3%
Product A Product B Product C Product D Product E Product F Product G Product H Product I Product J
Workload by Top 10 Products
Cross-Training
Coverage
As the testing profile of the lab changes
over time so too will the most critical
and most common test methods. The
CPT will flag tests where coverage is
insufficient, allowing cross-training
priority schedules to evolve as the
business changes (see Figure 3b). This
preemptively avoids testing being held
up by the lack of competent analysts.
Figure 4: (b) Workload (FTEs required) Breakdown by Sample Type
0.0
5.0
10.0
15.0
20.0
25.0
Aug-17 Sep-17 Oct-17 Nov-17 Dec-17 Jan-18 Feb-18 Mar-18 Apr-18 May-18 Jun-18 Jul-18
FTEs
Routine Test Project Test Project Non-Test Non Test Tasks Support
Staffing Requirement (12M)
Testing Efficiencies
Another function of the CPT is the ability to monitor how efficiently samples are
being tested. Following best Lean practice, historical data is used to determine
the ‘standard run sizes’ of test sessions to ensure maximum productivity.
As volume/mix changes, so too will optimum run sizes. The CPT will automatically
calculate the number of runs of each test method that will be completed by the
lab. By comparing future levelled demand to historical levelled demand, one can
flag tests where run sizes may need be to be amended. For example, if the volume
of samples for Test A is projected to be 180% of current and historical volumes
the lab will be prompted to reconsider test session sizes for this method and if
possible increase the session size so as to minimize the number of required test
sessions (see Figure 5). Figure 5: Testing Efficiencies Table.
Test Name
Projected vs Historic Volume
Test A 150%
Test B 81%
Test C 91%
Test D 80%
Test E 110%
Test G 60%
Test F 50%
Equipment Utilization
Based on the predicted number of test runs, the CPT will calculate a projected utilization of each instrument. Equipment
that may become a constraint will be flagged allowing for redeployment of equipment from areas of low utilization or the
need to purchase additional equipment. If on the other hand, the long-term view predicts an excess of equipment, the lab
may consider decommissioning some older equipment and thus avoid costly preventative maintenance and calibrations etc.
This output enables labs to make strategic decisions to optimize return on current investments and eliminate unnecessary
future capital expenditures.
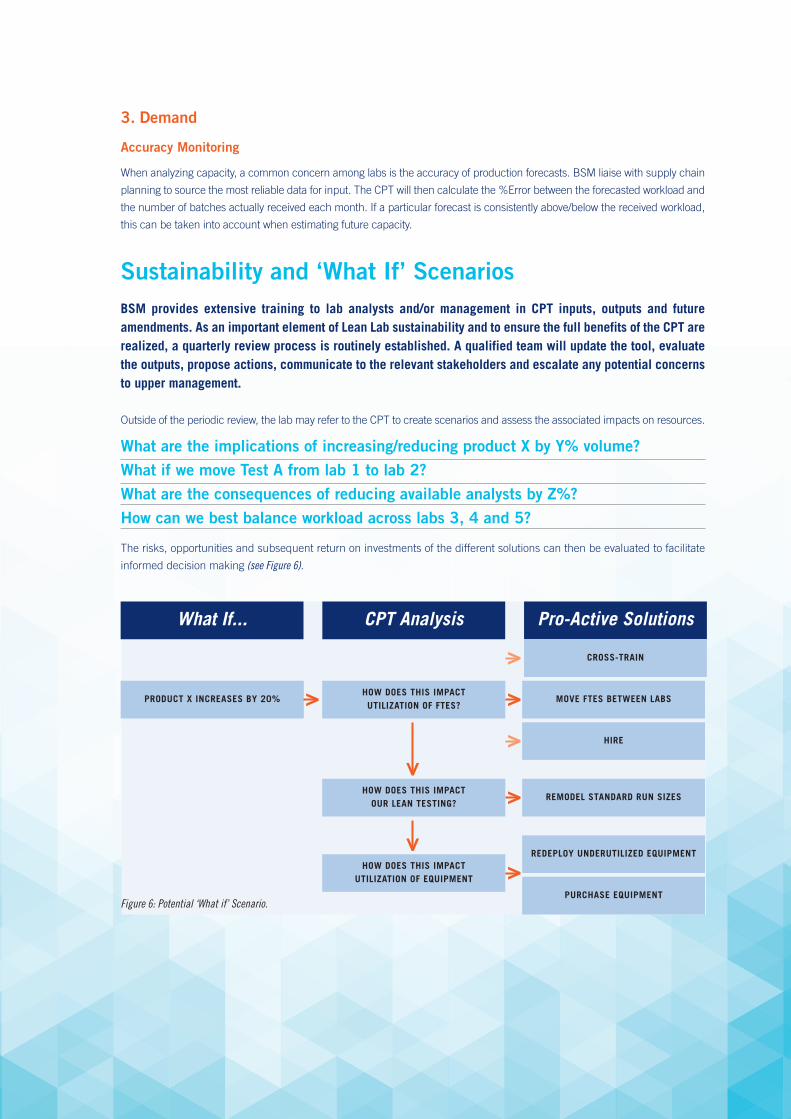
What If... CPT Analysis Pro-Active Solutions
Sustainability and ‘What If’ ScenariosBSM provides extensive training to lab analysts and/or management in CPT inputs, outputs and futureamendments. As an important element of Lean Lab sustainability and to ensure the full benefits of the CPT arerealized, a quarterly review process is routinely established. A qualified team will update the tool, evaluatethe outputs, propose actions, communicate to the relevant stakeholders and escalate any potential concernsto upper management.
Outside of the periodic review, the lab may refer to the CPT to create scenarios and assess the associated impacts on resources.
What are the implications of increasing/reducing product X by Y% volume? What if we move Test A from lab 1 to lab 2?What are the consequences of reducing available analysts by Z%? How can we best balance workload across labs 3, 4 and 5?
The risks, opportunities and subsequent return on investments of the different solutions can then be evaluated to facilitate
informed decision making (see Figure 6).
CROSS-TRAIN
PRODUCT X INCREASES BY 20%HOW DOES THIS IMPACT UTILIZATION OF FTES?
MOVE FTES BETWEEN LABS>
>>
>
>
>
HIRE
HOW DOES THIS IMPACTOUR LEAN TESTING?
REMODEL STANDARD RUN SIZES>
HOW DOES THIS IMPACT UTILIZATION OF EQUIPMENT
REDEPLOY UNDERUTILIZED EQUIPMENT
>PURCHASE EQUIPMENT
Figure 6: Potential ‘What if’ Scenario.
3. Demand
Accuracy Monitoring
When analyzing capacity, a common concern among labs is the accuracy of production forecasts. BSM liaise with supply chain
planning to source the most reliable data for input. The CPT will then calculate the %Error between the forecasted workload and
the number of batches actually received each month. If a particular forecast is consistently above/below the received workload,
this can be taken into account when estimating future capacity.

BSM IrelandParkmore Business Park West, Galway, IrelandT: +353 (0) 91 746900 E: [email protected] W: bsm.ie
BSM USA Inc.,c/o EFESO Consulting, World Financial District, 60 Broad Street Suite 3502, New York, NY 10004, USAT: +1 443 478 3903 E: [email protected] W: bsm-usa.com
BSM India Pvt. Ltd. 909, Chiranjiv Tower, 43, Nehru Place, New Delhi-110019, IndiaT: +91-11-6635 1476 E: [email protected] W: bsm-asia.com
BSM is the global leader in the provision of Real Lean transformation services to lifescience companies. We support companies to deliver significant measureableimprovement within their QC, QA, R&D and Regulatory Affairs processes.
We develop innovative solutions via the application of best practice lean, re-engineeringand change management techniques, and we have an extensive track record ofsuccessful implementations.
Copyright 2018, BSM and EFESO Consulting, all rights reserved. No unauthorized reproduction without the Author’s written consent.
All references to this publication must cite BSM as the author and include a link to BSM’s website. BSM is not liable for any errors contained within this Briefing.
To discuss any aspect of this briefing or how BSM can benefit your organisation please contact:
Kelly Kane – Senior Consultant E: [email protected]
The process steps outlined here give an overview of
Capacity Planning as part of a Lean Lab project and
highlights the numerous benefits a greater understanding
of capacity and resource utilization can provide.
By uncovering the true capacity capabilities of a lab andfuture capacity requirements an organization can move
away from the costly chaotic responses to changes in
demand. As global leaders in Real Lean transformations,
BSM is uniquely qualified to deliver a comprehensive
Capacity Planning process that will encourage a culture
of pro-active performance management and continuous
improvement.
Conclusion
Related Documents