Welcome message from author
This document is posted to help you gain knowledge. Please leave a comment to let me know what you think about it! Share it to your friends and learn new things together.
Transcript
WHOI-84-31
Cable Failures off Oahu, Hawaii Caused by Hurricane Iwa
by
Charles D. Hollister
Woods Hole Oceanographic Institution Woods Hole, Massachusetts 02543
August 1984
Technical Report
Funding was provided by the International Cable Engineering Division of A T & T Communications under contract number 47-5697.
Reproduction in whole or in part is permitted for any purpose of the United States Government. This report should be cited as:
Woods Hole Oceanog. Inst. Tech. Rept. WHOI8431
Approved for publication; distribution unlimited
Approved for Distribution:
a~ L fl. /ULf, Charles D Hollister
TABLE OF CONTENTS
ABSTRACT •••••• . . . . . . . . . . . . . . . . . . . . . . . . . . . . . . . . . . . . . . . . . . . . . . . . . . . . . . . . BACKGROUND ••••••••••••••••••••••••••••••••••••••••••••••••••••••••••
AVAILABLE DATA
The Stonn ......................................................... Current Meter Data ................................................
1
1
2
3
Cabl e Damage ••••••••••••••••••••••••••••••••• e._................... 4
Visual Observati ons ............................................... 4
Microphysiography from Side-Scan Sonar •••••••••••••••••••••••••••• 5
Temperature Data from Current Meter Moorings ...................... INTERPRETATION AND DISCUSSION ......................................... CONCLUSIONS ••••••••••• . . . . . . . . . . . . . . . . . . . . . . . . . . . . . . . . . . . . . . . . . . . . . . . . RECOr.t1ENDATIONS .......................................................
...................................................... ACKNOWLEDGEMENTS
BIBLIOGRAP HY .......................................................... TABLES ................................................................
7
8
10
11
12
13
14
FIGURE CAPTIONS AND FIGURES............................................ 16
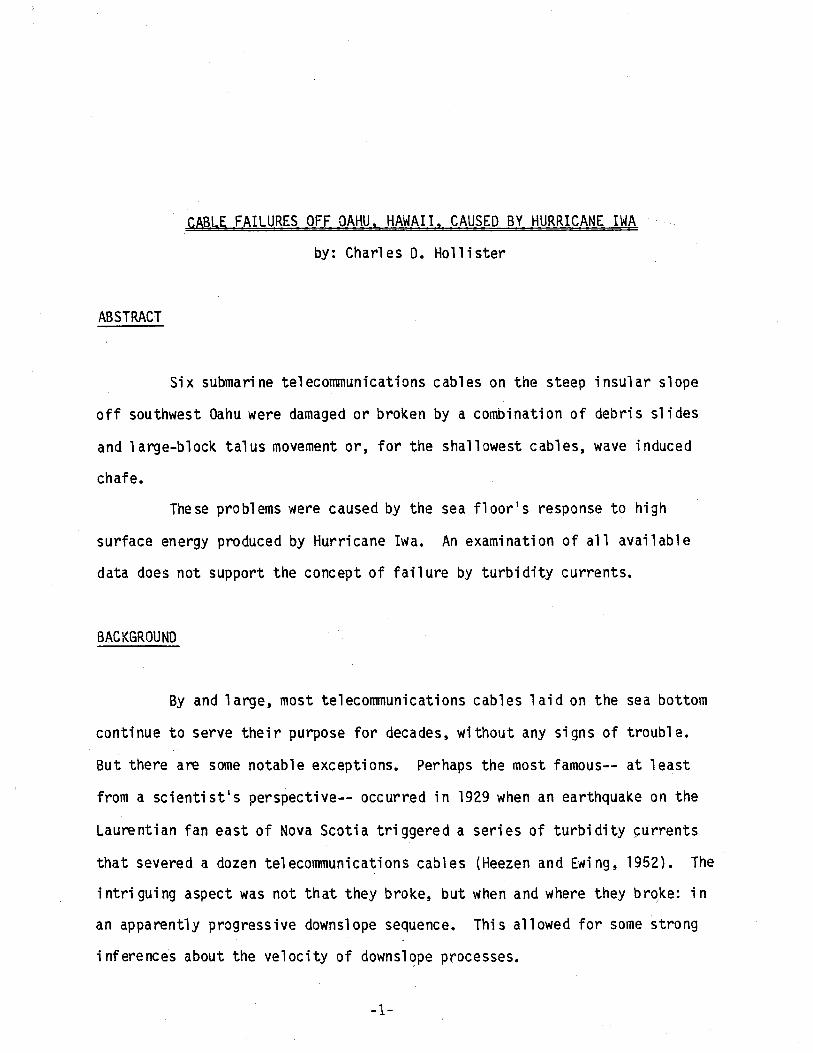
ABSTRACT
CABLE FAILURES OFF OAHU, HAWAII, CAUSED BY HURRICANE IWA
by: Charles D. Hollister
Six submarine telecommunications cables on the steep insular slope
off southwest Oahu were damaged or broken by a combination of debris slides
and large-block talus movement or, for the shallowest cables, wave induced
chafe.
These problems were caused by the sea floor1s response to high
surface energy produced by Hurricane Iwa. An examination of all available
data does not support the concept of failure by turbidity currents.
BACKGROUND
By and large, most telecommunications cables laid on the sea bottom
continue to serve their purpose for decades, without any signs of trouble.
But there are some notable exceptions. Perhaps the most famous-- at least
from a scientist1s perspective-- occurred in 1929 when an earthquake on the
Laurentian fan east of Nova Scotia triggered a series of turbidity Gurrents
that severed a dozen telecommunications cables (Heezen and Ewing, 1952). The
i ntri gui ng aspect was not that they broke, but when and where they broke: in
an apparently progressive downslope sequence. This allowed for some strong
inferences about the velocity of downsl~pe processes.
-1-
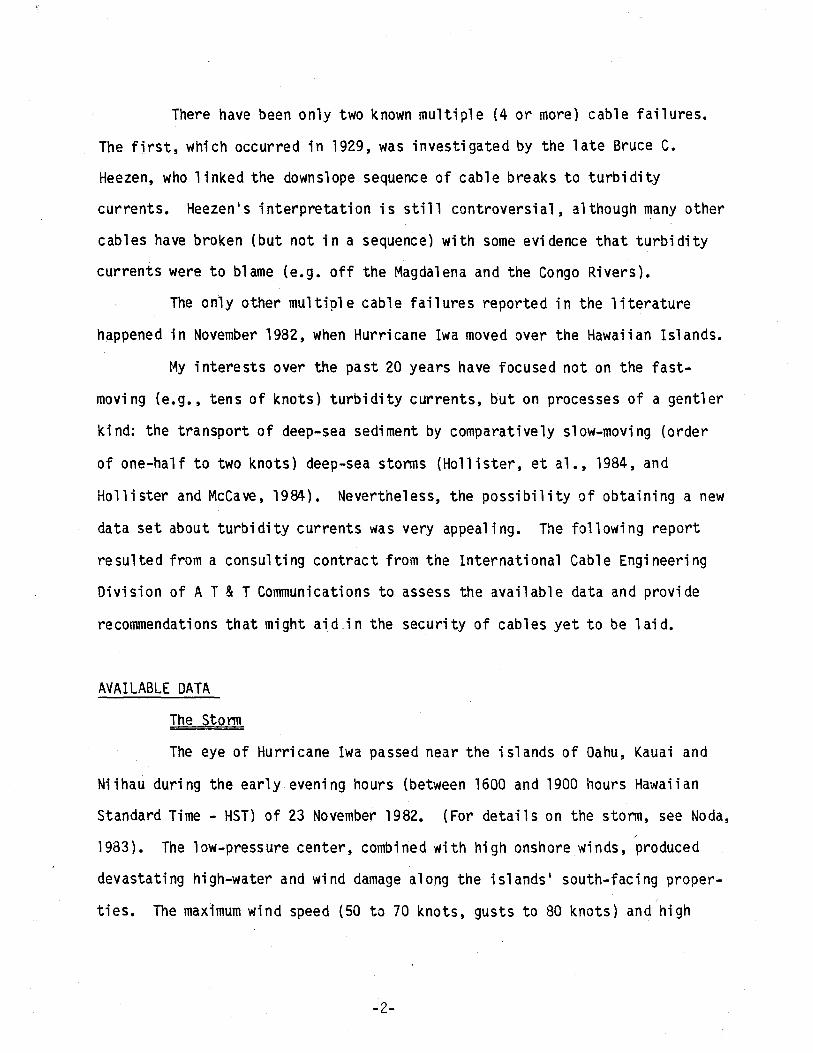
There have been only two known multiple (4 or more) cable failures.
The first, which occurred in 1929, was investigated by the late Bruce C.
Heezen, who linked the downslope sequence of cable breaks to turbidity
currents. Heezen's interpretation is still controversial, although many other
cables have broken (but not in a sequence) with some evidence that turbidity
currents were to blame (e.g. off the Magdalena and the Congo Rivers).
The only other multiple cable failures reported in the literature
happened in November 1982, when Hurricane Iwa moved over the Hawaiian Islands.
t~y interests over the past 20 years have focused not on the fast
moving (e.g., tens of knots) turbidity currents, but on processes of a gentler
kind: the transport of deep-sea sediment by comparatively slow-moving (order
of one-half to two knots) deep-sea storms (Hollister, et a1., 1984, and
Hollister and McCave, 1984). Nevertheless, the possibility of obtaining a new
data set about turbidity currents was very appealing. The following report
resulted from a consulting contract from the International Cable Engineering
Oivision of A T & T Communications to assess the available data and provide
recommendations that might aid in the security of cables yet to be laid.
AVAILABLE DATA
The Storm
The eye of Hurricane Iwa passed near the islands of Oahu, Kauai and
Niihau during the early evening hours (between 1600 and 1900 hours Hawaiian
Standard Time - HST) of 23 November 1982. (For details on the storm, see Noda, c'
1983). The low-press ure center, combi ned wi th hi gh onshore 't'li nds, produced
devastating high-water and wind damage along the islands' south-facing proper
ties. The maximum wind speed (50 to 70 knots, gusts to 80 knots) and high
-2-
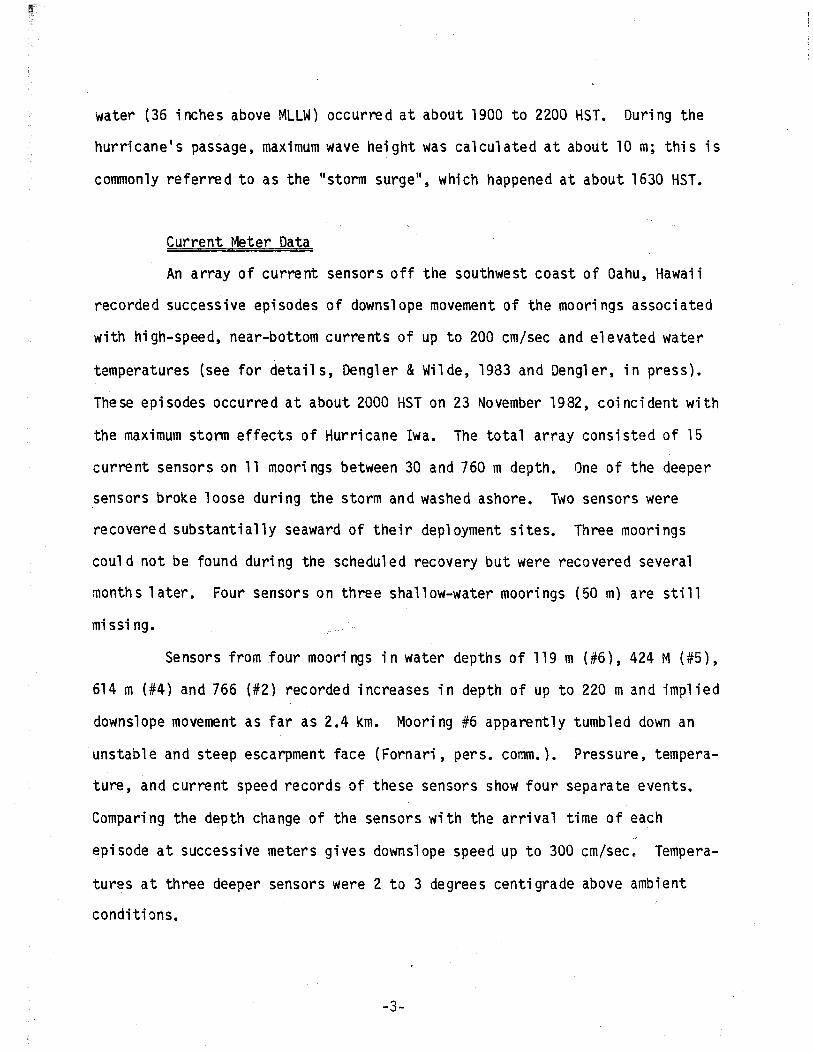
water (36 inches above MLLW) occurred at about 1900 to 2200 HST. During the
hurricane's passage, maximum wave height was calculated at about 10 m; this is
commonly referred to as the "storm surge", which happened at about 1630 HST.
Current Meter Data
An array of current sensors off the southwest coast of Oahu, Hawaii
recorded successive episodes of downslope movement of the moorings associated
with high-speed, near-bottom currents of up to 200 em/sec and elevated water
temperatures (see for details, Dengler & Wilde, 1983 and Dengler, in press).
These episodes occurred at about 2000 HST on 23 November 1982, coincident with
the maximum storm effects of Hurricane Iwa. The total array consisted of 15
current sensors on 11 moorings between 30 and 760 m depth. One of the deeper
sensors broke loose during the storm and washed ashore. Two sensors were
recovered substantially seaward of their deployment sites. Three moorings
could not be found during the scheduled recovery but were recovered several
months later. Four sensors on three shallow-water moorings (50 m) are still
mi ssi ng.
Sensors from four moorings in water depths of 119 m (#6), 424 M (#5),
614 m (#4) and 766 (#2) recorded increases in depth of up to 220 m and implied
downslope movement as far as 2.4 km. Mooring #6 apparently tumbled down an
. unstabl e and steep escarpment face (Fornari, pers. comm.). Pressure, tempera
ture, and current speed records of these sensors show four separate events.
Comparing the depth change of the sensors with the arrival time of each c·
episode at successive meters gives downslope speed up to 300 em/sec. Tempera-
tures at three deeper sensors were 2 to 3 degrees centigrade above ambient
conditi ons.
-3-
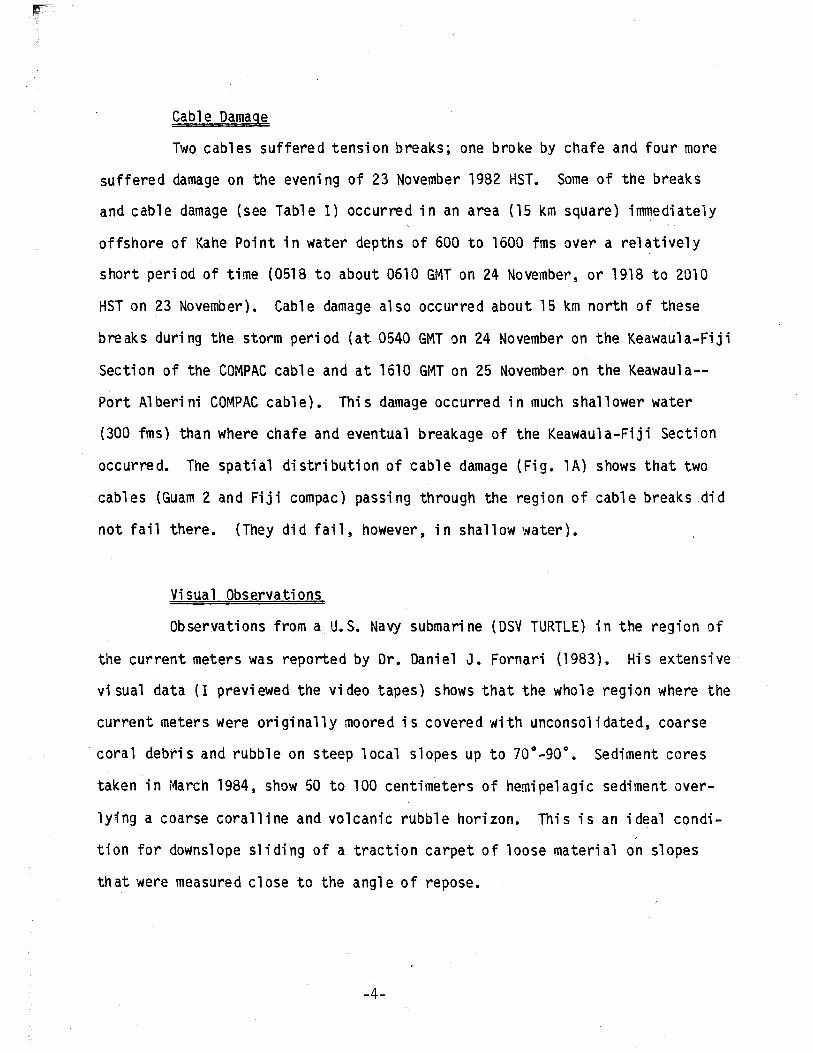
Cable Damage
Two cab1 es suffered tensi on breaks; one broke by chafe and four more
suffered damage on the evening of 23 November 1982 HST. Some of the breaks
and cable damage (see Table I) occurred in an area (15 km square) immediately
offshore of Kahe Point in water depths of 600 to 1600 fms over a relatively
short period of time (0518 to about 0610 GMT on 24 November, or 1918 to 2010
HST on 23 November). Cable damage also occurred about 15 km north of these
breaks during the storm period (at 0540 GMT ~n 24 November on the Keawau1a-Fiji
Section of the COMPAC cable and at 1610 Gr>1T on 25 November" on the Keawau1a-
Port A1 beri ni COMPAC cab1 e). Thi s damage occurred in much shall ower water
(300 fms) than where chafe and eventual breakage of the Keawau1a-Fiji Section
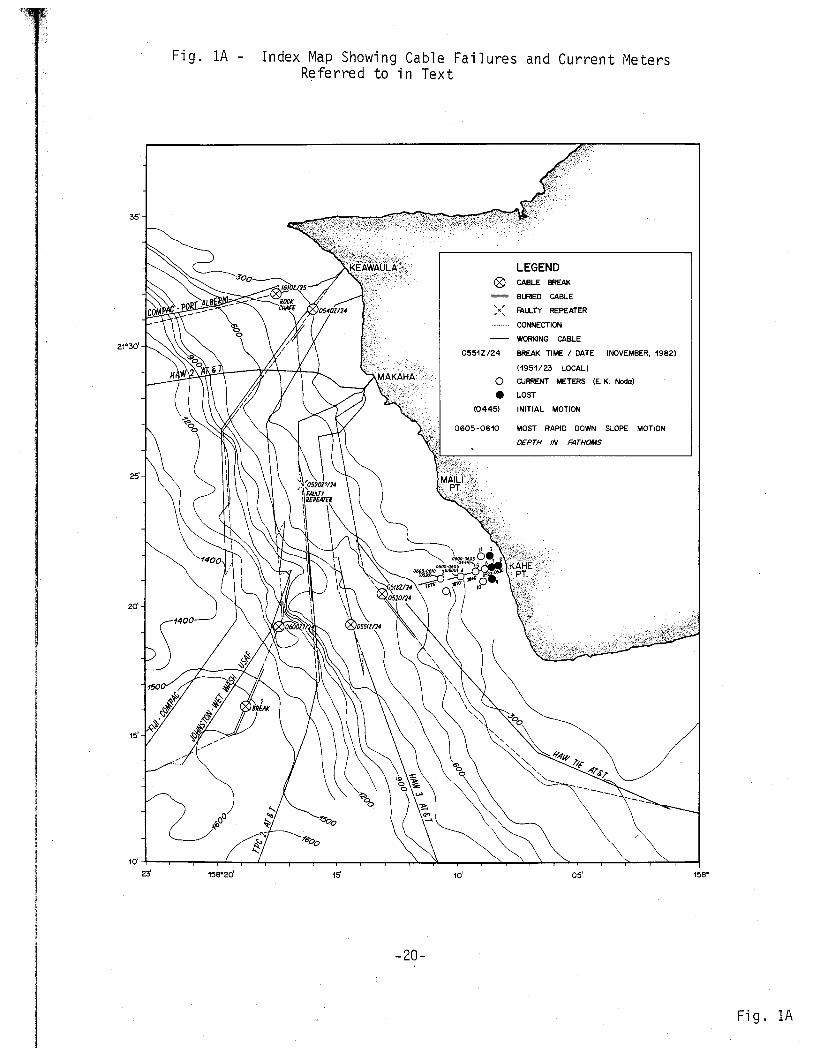
occurred. The spatial distribution of cable damage (Fig. 1A) shows that two
cables (Guam 2 and Fiji compac) passing through the region of cable breaks did
not fail there. (They did fail, however, in shallow water).
Visual Observations
Observations from a U.S. Navy submarine (DSV TURTLE) in the region of
the current meters was reported by Or. Daniel J. Fornari (1983). His extensive
vi sual data (I previewed the video tapes) shows that the whole region where the
current meters were originally moored is covered with unconsolidated, coarse
"coral debris and rUbble on steep local slopes up to 70°_90°. Sediment cores
taken in March 1984, show 50 to 100 centimeters of hemipelagic sediment over
lying a coarse coralline and volcanic rubble horizon. This is an ideal condi-."
tion for downslope sliding of a traction carpet of loose material on slopes
th at were measured close to the angl e of repose.
-4-
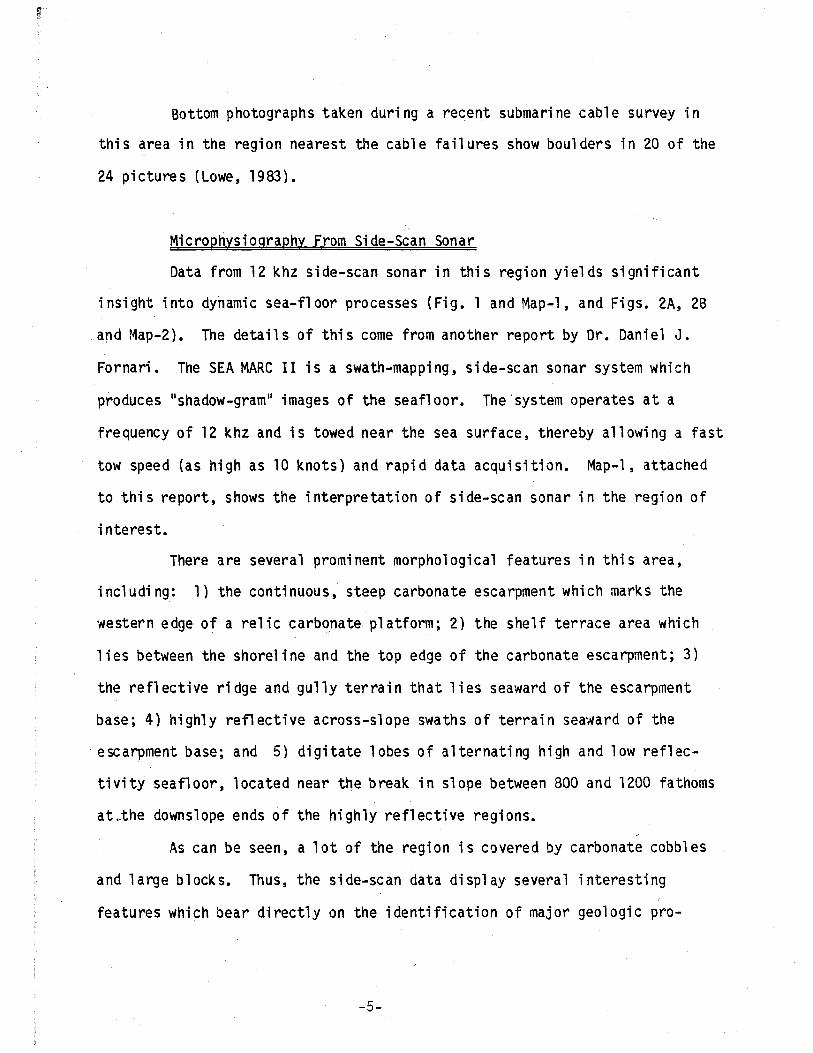
Bottom photographs taken during a recent submarine cable survey in
this area in the region nearest the cable failures show boulders in 20 of the
24 pictures (Lowe, 1983).
Microphysiography From Side-Scan Sonar
Data from 12 khz side-scan sonar in this region yields significant
insight into dynamic sea-floor processes (Fig. 1 and Map-l, and Figs. 2A, 2B
and Map-2). The details of this come from another report by Dr. Daniel J.
Fornari. The SEA MARC II is a swath-mapping, side-scan sonar system which
produces "shadow-gram" images of the seafloor. The system operates at a
frequency of 12 khz and is towed near the sea surface, thereby allowing a fast
tow speed (as high as 10 knots) and rapid data acquisition. Map-l, attached
to this report, shows the interpretation of side-scan sonar in the region of
interest.
There are several prominent morphological features in this area,
including: 1) the continuous, steep carbonate escarpment which marks the
western edge of a relic carbonate platform; 2) the shelf terrace area which
lies between the shoreline and the top edge of the carbonate escarpment; 3)
the reflective ridge and gully terrain that lies seaward of the escarpment
base; 4) highly reflective across-slope swaths of terrain seaward of the
. escarpment base; and 5) digitate lobes of alternating high and low reflec
tivity seafloor, located near the break in slope between 800 and 1200 fathoms
at~the downslope ends of the highly reflective regions.
As can be seen, a lot of the region is covered by carbonate cobbles
and large blocks. Thus, the side-scan data display several interesting ,
features which bear directly on the identification of major geologic pro-
-5-
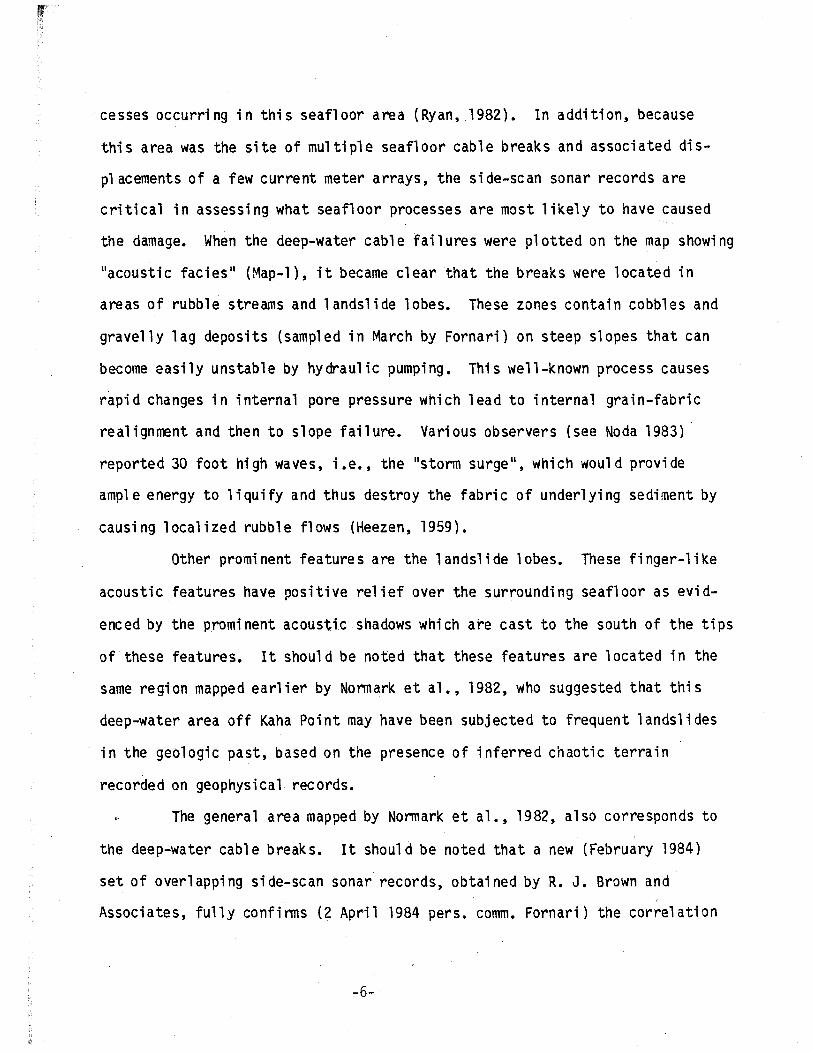
cesses occurring in this seafloor area (Ryan, 1982). In addition, because
this area was the site of multiple seafloor cable breaks and associated dis
placements of a few current meter arrays, the side-scan sonar records are
critical in assessing what seafloor processes are most likely to have caused
the damage. When the deep-water cable failures were plotted on the map showing
"acoustic facies" (Map-1), it became clear that the breaks were located in
areas of rubble streams and landslide lobes. These zones contain cobbles and
gravelly lag deposits (sampled in March by Fornari) on steep slopes that can
become easily unstable by hydraulic pumping. This well-known process causes
rapid changes in internal pore pressure which lead to internal grain-fabric
real i gnment and then to slope fai 1 ure. Vari ous observers (see Noda 1983) .
reported 30 foot high waves, i.e., the "storm surge", which would provide
ample energy to liquify and thus destroy the fabric of underlying sediment by
causing localized rubble flows (Heezen, 1959).
Other prominent features are the landslide lobes. These finger-like
acoustic features have positive relief over the surrounding seafloor as evid-
enced by the prominent acoustic shadows which are cast to the south of the tips
of these features. It should be noted that these features are located in the
same region mapped earlier by Normark et al., 1982, who suggested that this
deep-water area off Kaha Point may have been subjected to frequent landslides
in the geologic past, based on the presence of inferred chaotic terrain
recorded on geophysical records.
The general area mapped by Normark et a1., 1982, also corresponds to c·
the deep-water cable breaks. It should be noted that a new (February 1984)
set of overlapping side-scan sonar records, obtained by R. J. Brown and ,
Associates, fully confirms (2 April 1984 pers. camm. Fornari) the correlation
-6-
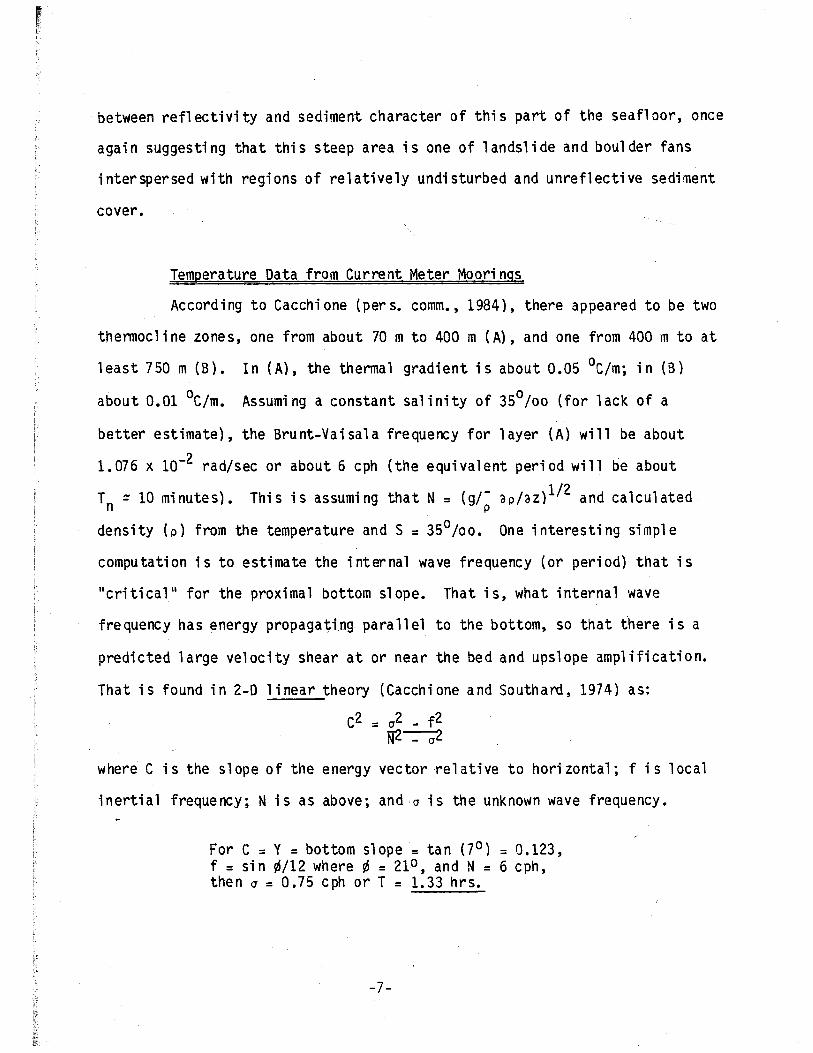
between reflectivity and sediment character of this part of the seafloor, once
again suggesting that this steep area is one of landslide and boulder fans
interspersed with regions of relatively undisturbed and unreflective sediment
cover.
Temperature Data from Current Meter Moorings
Accord i ng to Cacchi one (per s. comm., 1984), there appeared to be two
thermocline zones, one from about 70 m to 400 m (A), and one from 400 m to at
least 750 m (B). In (A), the thermal gradient is about 0.05 °C/m; in (B)
about 0.01 °C/m. Assuming a constant salinity of 350/00 (for lack of a
better estimate), the Brunt-Vaisala frequency for layer (A) will be about
1.076 x 10⁻² rad/sec or about 6 cph (the equivalent period will be about
Tn = 10 minutes). This is assuming that N = (g/~ ap/az)1/2 and calculated
density (p) from the temperature and S = 350 /00. One interesting simple
computation is to estimate the internal wave frequency (or period) that is
II critical ll for the proximal bottom slope. That is, what internal wave
fre quency has energy propagating para 11 el to the bottom, so that there is a
predicted large velocity shear at or near the bed and upslope amplification.
That is found in 2-D linear theory (Cacchione and Southard, 1974) as:
C2 = 0 2 _ f2 N2~
where C is the slope of the energy vector relative to horizontal; f is local
inertial frequency; N is as above; and 0 is the unknown wave frequency.
For C = Y = bottom slope = tan (7 0 ) = 0.123, f = sin ~/12 where ~ = 210 , and N = 6 cph, then 0 = 0.75 cph or T = 1.33 hrs.
-7-
Based on this, internal waves with that periodicity, if generated by
the storm, would produce large shears near the sea floor. In fact, ••• lithe
current episodes observed at mooring 5 is a periodicity on the order of 1
hour II (Deng1 er, et a 1, in press, 1984.), whi ch is very close to the 1.33 hours
pre di cted by Cacchi one.
INTERPRETATION AND DISCUSSION
Clearly the excitment, at least within the scientific community, over
the cable failures arose from the real expectation that another turbidity
current like the one off the Grand Banks had occurred and that the cable
failures could provide a confirmatory record of the velocities inferred by
those cable break sequences. An uncritica"l conclusion that turbidity currents
were caused by the hurricane has already been made by some investigators who
did not take into account all available data like the cyclic nature of the
current meter data, the bottom morphology and cable failure sequences
(Dengler, etal, in press, 1984.)
Unfortunately, the Hawai i an cabl e breaks and damage cannot be of much
help to us. But the cable failures and current meter displacements were
obviously related to the hurricane. The real question is: how is the bottom
activity related to the storm? Without before-and-after, precisely navigated
" near-bottom observations, one will never really know. In this case, however, ,-
certain zero-order facts have to be reckoned with in any explanations that are
offered:
1) Some cables clearly within the only probable path of a turbidity
current were not broken.
-8-
2) The moored current meters were not swept completely out to sea,
entangled in the cables or incorporated into a massive turbulent avalanche
like other structures that have been transported by turbidity currents, e.g.,
grass and twigs (see Heezen and Hollister, 1971). Having muddy water in
flotation spheres, (see Dengler et a1., 1983) is a common occurrence in high
energy field experiments.
3) No retrograde failure of the escarpment face was observed or is
p1ausable given the massive nature of the carbonate rock. It is unlikely that
large carbonate blocks falling down the escarpment would generate turbidity
currents.
4) Each shallow mooring had a concrete clump with about 270 lbs.
net weight; the deeper moorings had chain anchors with only 83 lbs. negative
weight. The downslope drag on the buoyant packages and current sensors at a
1 knot current with these low weights will induce down-slope sliding. In
addition, any turbulent lift provided by near-bottom eddies would aid the r
downslope sliding.
5) There was no clear, documented evidence for any subsequent
change in the bottom morphology although there were some reports of "bottom
changes". Even very slight (l%) deviations in navigation on such steep slopes
result in much apparent change in subsequent trips across the same region •
. The surface ship observations are simply not precise enough for this level of
discrimination. Computerized comparisons of before and after bathymetric data
do not reveal any significant change (Noda, 1983). ~
6) Three current meter moorings upslope of the cable damage area
slid in a sporadic fashion over 2 km downslope while experiencing temperature
fluctuations of unexpectedly warm water.
-9-
, 7) Cables did break and the current meters were translated across
the bottom during the storm; the current meters moving after the cables were
broken.
In my judgment, all of these events were the result of the storm but
in very different ways.
CONCLUSIONS
1. The substrate beneath the current meter moorings consisted of
loosely packed coral debris of sand and gravel size, resting on a slope
approachi ng the angle of repose of thi s type of incohesive material. The
storm surge and resulting very high waves occurred at the height of the storm
when maxima in variations of interstitial pore pressure would be expected.
These pore pressure variations have long been known to initiate slope failure
and thus the most probable explanation for the current meter movement is a
combination of the sliding of a traction carpet of loose debris downslope,
much like the classic sand flows in the California canyons reported on by
Francis Shepard over the past 20 years, combined with large downslope shear
produced by shoal i ng and, perhaps, breaki ng internal waves.
2. The cyclic nature of the warm water measured by the sensors on
the three deepest current meter moorings probably reflects the activity of
C shoaling and breaking internal waves that are often observed propagating along
sharp density contrasts in any layered fluid. Internal waves produce high
shear when they encounter steep slopes. The seasonal thermocline thus pro-C
C
duces a sharp density gradient in this area at about the same depth and
temperature as the meters were when they measured the fluctuation (Cacchione,
O.A. and Southard, J.B., 1974 and Cacchione and Wunsch, 1974).
-10-
3. The deep water cabl es were broken, buri ed or damaged by debri s
slides, rubble and talus streams triggered by rapid fluctuations in pore
pressure in the unconsolidated sediment lying beneath the more massive debris.
The side-scan sonar data shows that the cables were laid across steep, scarp
like, regions exhibiting a myriad of channels, rubble piles and talus aprons
of large boulders. The cables that suffered least damage were fortuitously
1 ai d atop relatively fl at sediment-covered benches.
4. The shallow-water cable breaks were caused by chafe on sharp
coraline outcrops. Strong surface, wave-induced, oscillatory bottom currents
were the cause of these breaks/damage.
5. There is little or no evidence, in my opinion, that any of the
cable failures or current meter dislocations was due to a turbidity current.
This conclusion is obviously in direct conflict with the consensus of a number
of workers who have already published reports stating categorically (and to me
uncritically) that turbidity currents caused all of the above mentioned bottom
activity (see all references to Dengle, Normark,Wilde, Noda referred to
above) •
RECOMMENDATIONS
After a disaster, hindsight often allows for bold statements, and
. mi ne follow:
1. Never lay cables parallel to contours on steep slopes.
2. Never lay cables across active channels or debris-covered steep
slopes that exhibit rubble aprons and talus-covered slopes.
-11-
3. Use state-of-the-art bathymetric techniques (e.g. multi-channel
SEA BEAM) for entire route survey, and use state-of-the-art side-scan sonar
systems (now SEA MARC) to survey the continental margin, seamount, ridge-crest
and other steeper portions of proposed cable routes.
4. Don1t be surprised if hurricanes, earthquakes and other acts of
God foul up the best laid cables.
ACKNOWLEDGEMENTS
The authors wish to thank the many people who helped during the
study, including:
At Hawaiian Telephone Co. (Makaha Terminus), especially Joan Diamond
of Cable Repair, L. Toole, R. Enjlebart, R. Schoen and L. Bruno; at A T & T
Communications, Wayne Larkin; at Teleglobe Canada (Keawaula Terminus) Gerald
Foley and Howard Hirata; at U.S. Air Force (Makua Terminus) Bill Taylor, J.
Watahabe, F. Norton and W. Kunihiro; and very special thanks are due Leo
Overhiser and Jim Barrett of A T & T Communications for their infinite
patience and continued good humor throughout this study.
-12-
BIBLIOGRAPHY
Cacchione, D. A. and Southard, J. B., 1974. "Incident Sediment I~ovement by
Shoaling Internal Gravity Waves, J. Geophy. Research, Vol. 79, No. 15, pp
2237-2242)
Cacchi one, D.A. and Wunsch, C., 1974. "Experimental Study of Internal Waves
Over A Slope", J. Fluid Mechanics, v. 66, p. 223-239.
Fornari, D. J., 1983. DSV Turtle Dives off Kaha Point, Oahu, Ha·waii ll, October
31,1983,60 pages.
Fornari, D.J., 1984. "SEA MARC II Si de-Scan Sonar Image of the Seafloor off
Kahe Point, Oahu, Hawaii"
Heezen, B.C., 1959. "A Review of Natural Processes Contributing to the
Mechanical Failure of Deep-Sea Cables, Geophys. Journal, v. 2, p. 142-163).
Heezen, B.C. and Ewing, M., 1952. "Turbidity Currents and submarine Slumps
and the Grand Banks Earthquake II , Am. J. Sc;', v.250.
Lowe, F.E., 1983. "Anzcan Sutxnari ne Cable System, Report of the Survey Off
Keawau1a Landing, Hawaii, Following the Incidence of Hurricane Iwa."
Report of Cable and Wireless PLC, London, 6 pages with photographs and
tab1 es).
No da, 1983. Speci a1 [unpub1 i shed] Report: "Effects of Hurri cane Iwa, 23
November 1982 Offshore of Kaha Point, Qahu"
Ryan, W.B.F., 1982. "Imaging of Submarine Landslides with Wide Swath Sonar;"
from: Mari ne Sl i des and Other Mass t"ovements; eds., Saxov and
Nieuwenhuis, Plenum Press, p. 175-187.
-13-
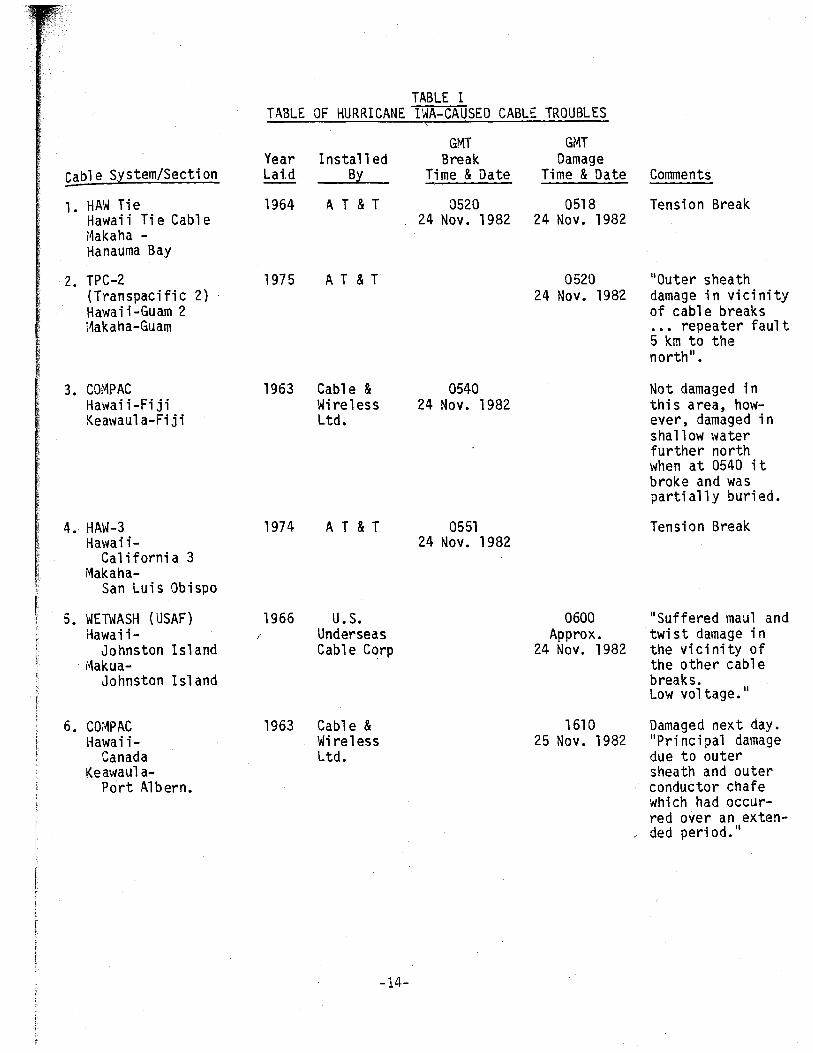
TABLE I TABLE OF HURRICANE IWA-CAUSED CABLE TROUBLES
\
GMT GMT Year Installed Break Damage
Cable system/Section Lai.d Bl Time & Date Time & Date Comments
1- HAW Tie 1964 A T & T 0520 0518 Tension Break Hawaii Tie Cable 24 Nov. 1982 24 Nov. 1982 i4akaha -Hanauma Bay
2. TPC-2 1975 A T & T 0520 1I0uter sheath (Transpacifi c 2) 24 Nov. 1982 damage in vicinity Hawaii-Guam 2 of cab1 e breaks r~akaha-Guam ••• repeater fault
5 km to the north ll
•
3. COMPAC 1963 Cable & 0540 Not damaged in Hawaii-Fiji Wireless 24 Nov. 1982 thi s area, how-Kea\'1au1 a-Fi j i Ltd. ever, damaged in
sha 11 ow \'Iater further north \'Ihen at 0540 it broke and was partially buried.
4. HAW-3 1974 A T & T 0551 Tension Break Hawaii- 24 Nov. 1982
California 3 r~akaha-
San Luis Obispo
5. WETWASH (USAF) 1966 U. S. 0600 IISuffered maul and Hawaii- ,- Underseas Approx. twist damage in
Johnston Island Cab1 e Corp 24 Nov. 1982 the vicinity of i4akua- the other cabl e
Johnston Island breaks. Low voltage. 1I
6. CO;4PAC 1963 Cable & 1610 Damaged next day. !:1awaii- Wireless 25 Nov. 1982 IIPrincipa1 damage
Canada Ltd. due to outer Keawau1 a- sheath and outer
Port Albern. conductor chafe whi ch had occur-red over an exten-ded period. 1I
-14-
I l
I
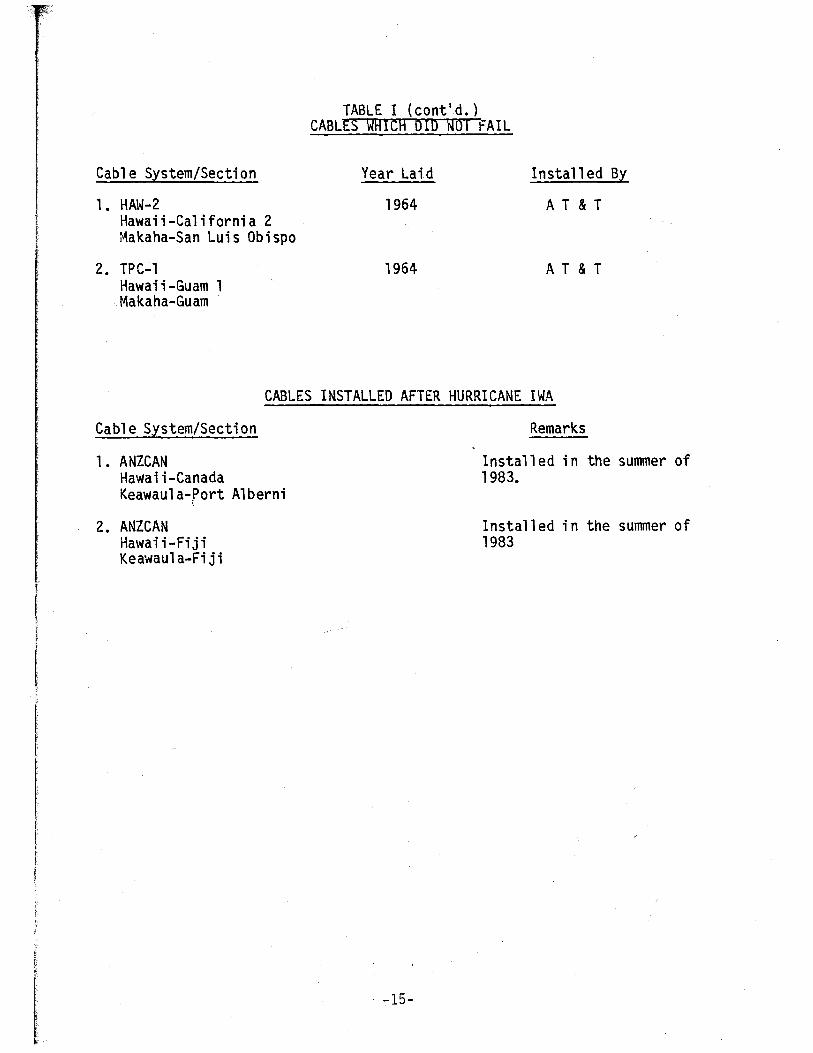
Cable System/Section
1. HAW-2 Hawaii-California 2 Makaha-San Luis Obispo
2. TPC-1 Hawaii-Guam 1 Makaha-Guam
TABLE I (cont'd.) CABLES WAICA DID NoT FAIL
Year Laid
1964
1964
Installed By
A T & T
A T & T
CABLES INSTALLED AFTER HURRICANE IWA
Cable System/Section
1. ANZCAN Hawaii-Canada Keawau1a-Port A1berni
i
2. ANZCAN Hawaii-Fiji Keawaula-Fiji
-15-
Remarks
Installed in the summer of 1983.
Installed in the summer of 1983
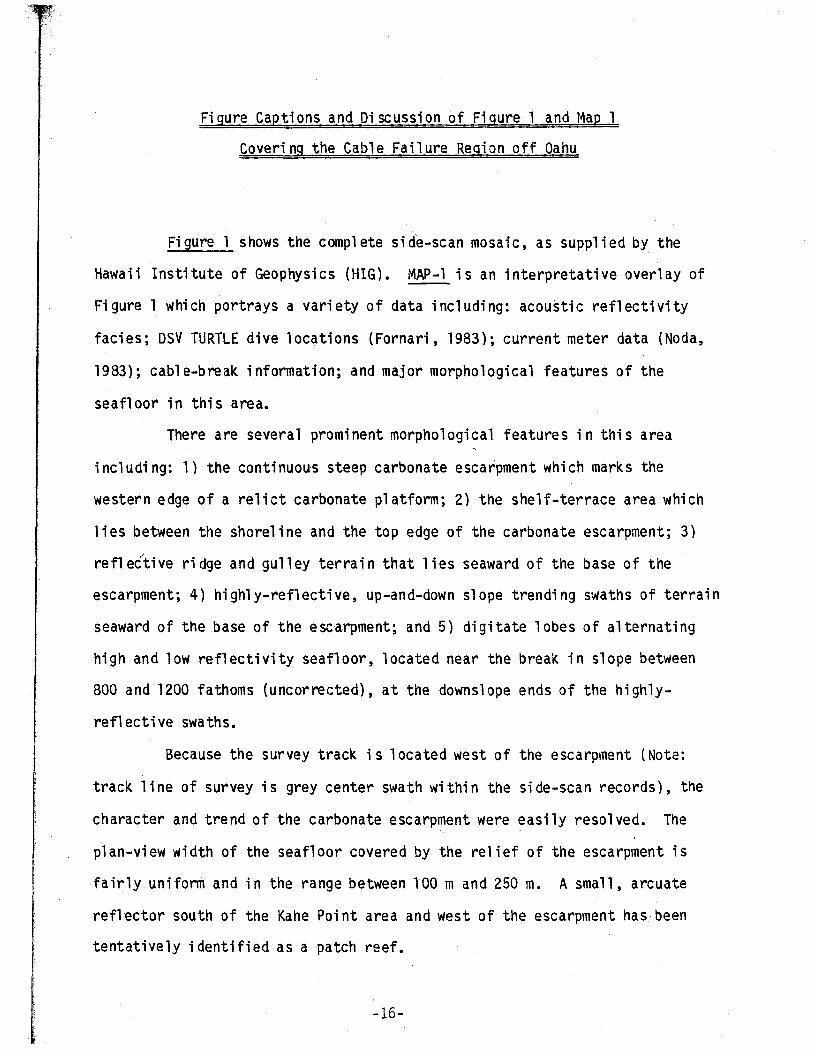
Figure Captions and Discussion of Figure 1 and Map 1
Covering the Cable Failure Region off Oahu
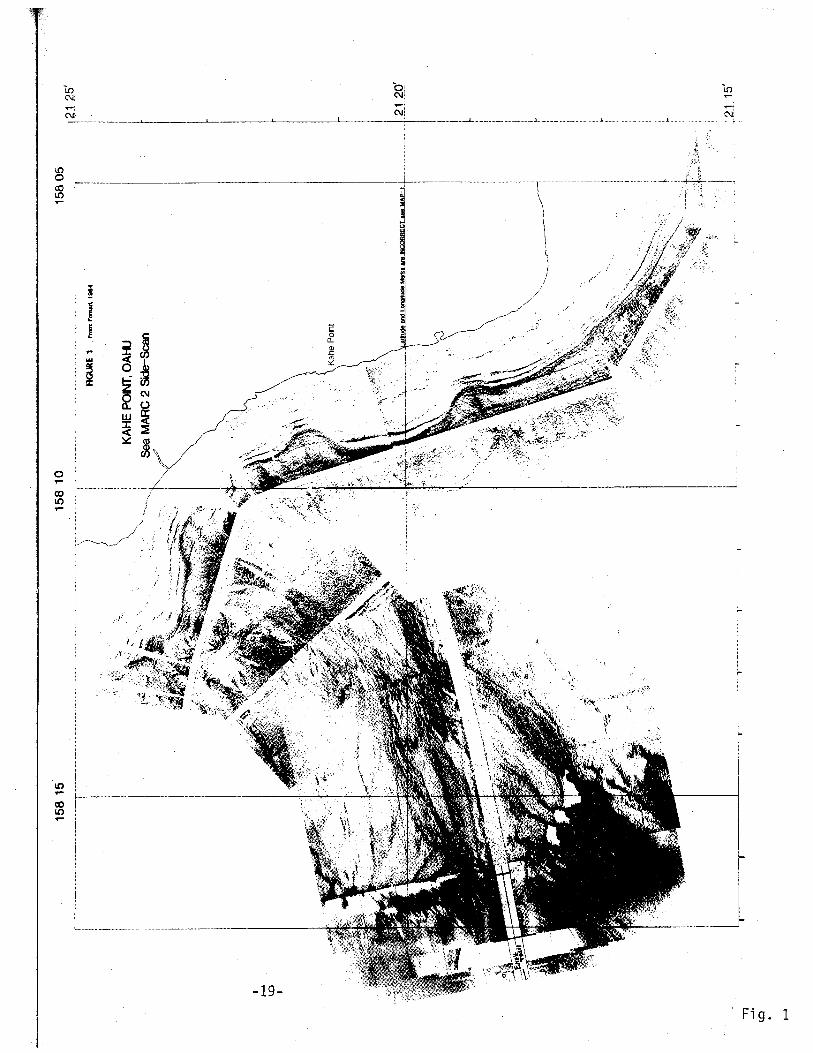
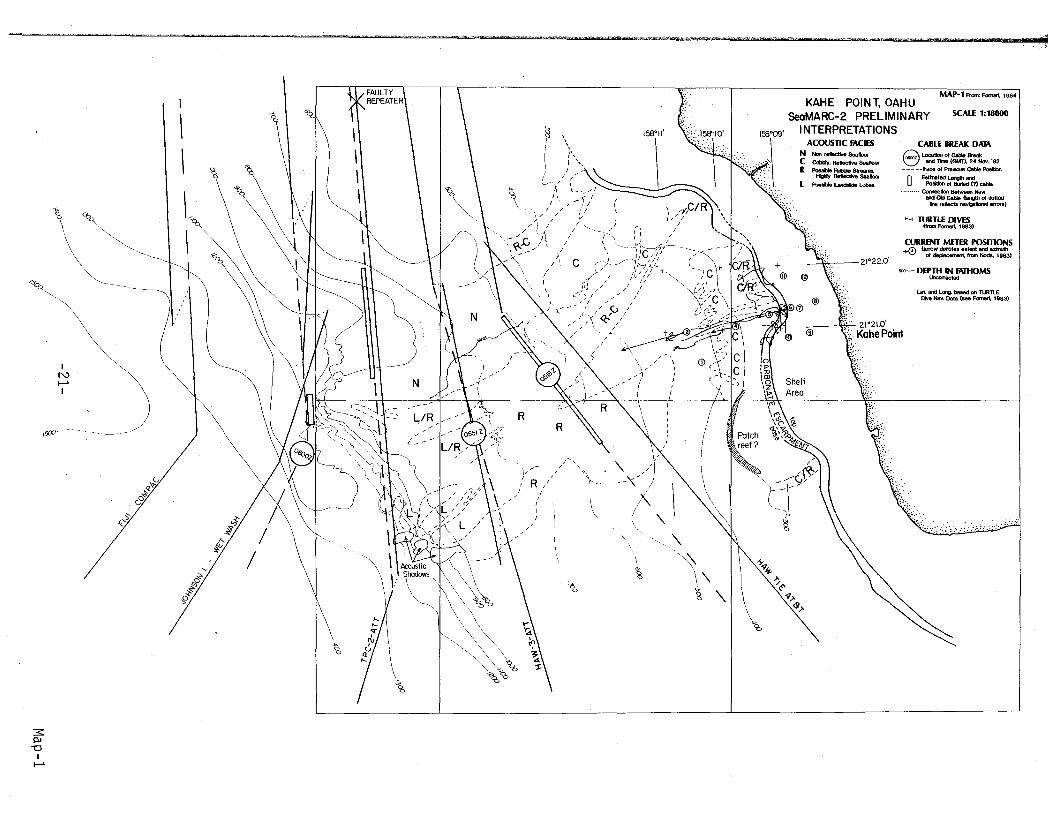
Figure 1 shows the complete side-scan mosaic, as supplied by the
Hawaii Institute of Geophysics (HIG). MAP-1 is an interpretative overlay of
Figure 1 which portrays a variety of data including: acoustic reflectivity
facies; DSV TURTLE dive locations (Fornari, 1983); current meter data (Noda,
1983); cable-break information; and major morphological features of the
seafloor in this area.
There are several prominent morphological features in this area
including: 1) the continuous steep carbonate escarpment which marks the
western edge of a relict carbonate platform; 2) the shelf-terrace area which
lies between the shoreline and the top edge of the carbonate escarpment; 3)
reflective ridge and gulley terrain that lies seaward of the base of the
escarpment; 4) highly-reflective, up-and-down slope trending swaths of terrain
seaward of the base of the escarpment; and 5) digitate lobes of alternating
high and low reflectivity seafloor, located near the break in slope between
800 and 1200 fathoms (uncorrected), at the downslope ends of the highly
reflective swaths.
Because the survey track is located west of the escarpment (Note:
track line of survey is grey center swath within the side-scan records), the
character and trend of the carbonate escarpment were easily resolved. The
plan-view width of the seafloor covered by the relief of the escarpment is
fairly uniform and in the range between 100 m and 250 m. A small, arcuate
reflector south of the Kahe Point area and west of the escarpment has been
tentatively identified as a patch reef.
-16-
Seaward of the base of the escarpment, there are numerous zones of
slightly higher reflectivity which form crudely, fan-shaped swaths that are
interpreted to be more cobbly seafloor within the ridge and gulley terrain
identified on TURTLE dives (see Fornari, 1982). These swaths of seafloor
generally exhibit linear patterns on the side-scan records which trend into
the axes of the bathymetric re-entrants which are prominent along this south
western coast of Oahu. Seaward of these acoustic reflectivity zones there are
swaths of terrain with much higher reflectivity that are likely to be associ
ated with areas of sea bottom that are either gravelly or hard.
Near the southwestern edge of the side-scan mosaic in Figure 1, there
are several finger-like zones of seafloor which are characterized by narrow,
alternating swaths of high and low reflectivity which create prominent acoustic
shadows.
MAP-l
MAP-l contains all cable break data available for the outages which
occurred during the Iwa off southwestern Oahu. A sequential, time progression
for the breaks in these cables is apparent as one moves offshore. However,
the Guam-2 A.T.& T. cable, which is the third cable out from shore (see
MAP-l), was not broken.
As di scussed in thi s report, the movement of the current meter arrays
was sporadic and occurred over a large time interval between 0500Z and 0610Z,
with the major displacement taking place between 0600Z and 06l0Z. This time
interval is much later than the times when the Oahu Tie and California-3 cables
(ones closest to shore and the current meter positions, see MAP-l) parted. In
addition, the break times for these two cables is very well constrained based
-17-
on the drum recorder records and is well within a few minutes of the times
shown on MAP-l. Consequently, it is difficult to conceive of these two events
being related by a single event.
When one overlays MAP-l on Figure 1, it is clear that the cable
breaks are located in areas of high-reflectivity, especially the Oahu Tie and
California-3 cable breaks which occur in high-reflectivity zones. Highly
reflective echo returns are typical of localized rubble/debris flows which
were probably generated in the 400 fathom to 500 fathom area; this material
was probably responsible for abrading and breaking the cables.
The most prominent feature in the deeper water area along the western
edge of Figure 1 is the zone of landslide lobes. These finger-like acoustic
features have positive relief over the surrounding seafloor as evidenced by
the prominent acoustic shadows which are cast to the south of the tips of
these features (MAP-l). In addition, it should be noted that these features
are located at the break in slope between approximately 800 fathoms and 1200
fathoms where Normark et al (1982) suggests that this deep-water sea off Kahe
Point may have been subjected to landslides in the geologic past, based on the
presence of inferred chaotic terrain recorded on geophysical records.
The patterns of high-reflectivity seafloor as mapped on MAP-l appear
to coalesce and bifurcate principally in an up-and-down slope direction and
. the deeper water high-reflectivity zones seem generally continuous with
narrower zones of highly-reflective seafloor in shallower depths. While the
contrast between the right and left-hand sides of each side-scan record is
influenced by whether the instrument is insonifying an upslope or downslope
area of seafloor, it is clear that the most highly-reflective zones occur in
water deeper than approximately 500 fathoms (uncorrected).
-18-
i.O o CO i.O
o ,.... CXl It)
i.O ,.... co It) ,....
",""", Ni
. ___ ..L.. _____ L-__ ... ___ : ___ .. _ .. _ .... ....J.. ..... __ ....... _ ...... _ ...... _ ... 1. .1
Fi g. 1
Fi g. lA -
35'
21 0 30'
25'
20'
15'
00 ~IO
10'
23' 15S02d
Index Map Showing Cable Failures and Current Meters Referred to in Text
LEGEND 0 CABLE BREAK
BLRED CABLE , /
FAULTY REPEATER x / ,
CONNECTION
WORKING CABLE
0551Z124 BREAK Tlr.£ 1 DATE (NOVEMBER, 1982)
(1951/23 LOCAL)
0 CURRENT METERS (E. K. Noda)
• LOST
(0445) INITIAL MOTION
0605-0610 MOST RAPID DOWN SLOPE MOTION
DEPTH IN FATHOMS
>:!bo
1'6"0 0
15' 10' 05'
-20-
1580
Fi g. lA
~ <0
\~
"<0 ""
\ " •••.....•
I N t-> I
/5CXJ'
3: PI -0
I t->
---
4.'.;y
'{'?''':
O~ G'
I
\
\
L "'"
\
&' ~
0"" 'S
~
~
~
I '.;\ I " J -'
/ / /' L,,/
~ \, I
A
" \
\\\ \\ U)o~
\\~
~ ~'bce:,
R
'/ , l' '
I R/
/ I J
J I
~
"t'il.11I!61{WW*\tiW"T &vtd.: e ao . kW' 'Vhsnw rtroZ tf
'\ /' I _\_ -- ;<
( '.
\ %
'\
\'. g '\
. MAP-l From: Fomari, 1984
KAHE POINT. OAHU SeoMARC-2 PRELIMINARY
INTERPRETATIONS
SCALE 1:18000
ACOUSTIC Ii\CIES N_Sea_ C CobOIy, Reftocth!e Sea_ R Poaatia A.tiJIe Streams,
~eSealo()r
L PodI:lIe landaIde lobes
';'.." 21'22.0'
CABLE BREAK DATA
8 locallon 0' cable Break 0600Z and nne (GMT). 24 Nov. '82
- - - - -It"ace of Prevtoua Cable Po8ItIon
o Ea=~~)cabIe ••••••••• CorrlectIon Between New
and Old Gable (length of doHed Ine rel\ect8 navlgaUonal 8ITors)
TURTLE DIVES (from Fomart. 1983)
CURRENT METER POSITIONS ~ (arrow denotes extent and aUruIh
of dapBcement. from Nelda. 1983)
""- DEPTH IN WHOMS Lhoorrocted
Lat. and long. bs8ed on l\.RTLE DIve Nay. Data (868 Fomart. 1983)
\\., ~
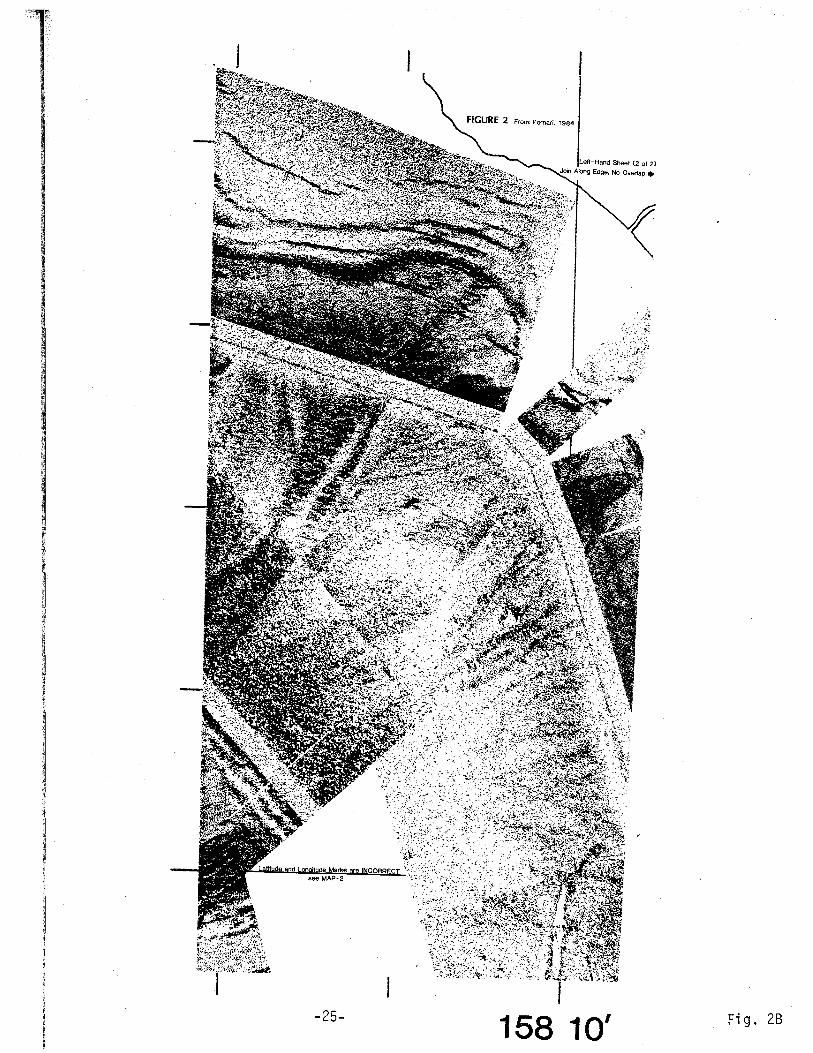
Figure Captions and Discussion of Figure 2 and Map 2
Coveri ng Area just west of Kahe Poi nt
Figure 2 is an enlarged section of the side-scan mosaic that covers
the seafloor west of Kahe Point and is of primary interest with regards to the
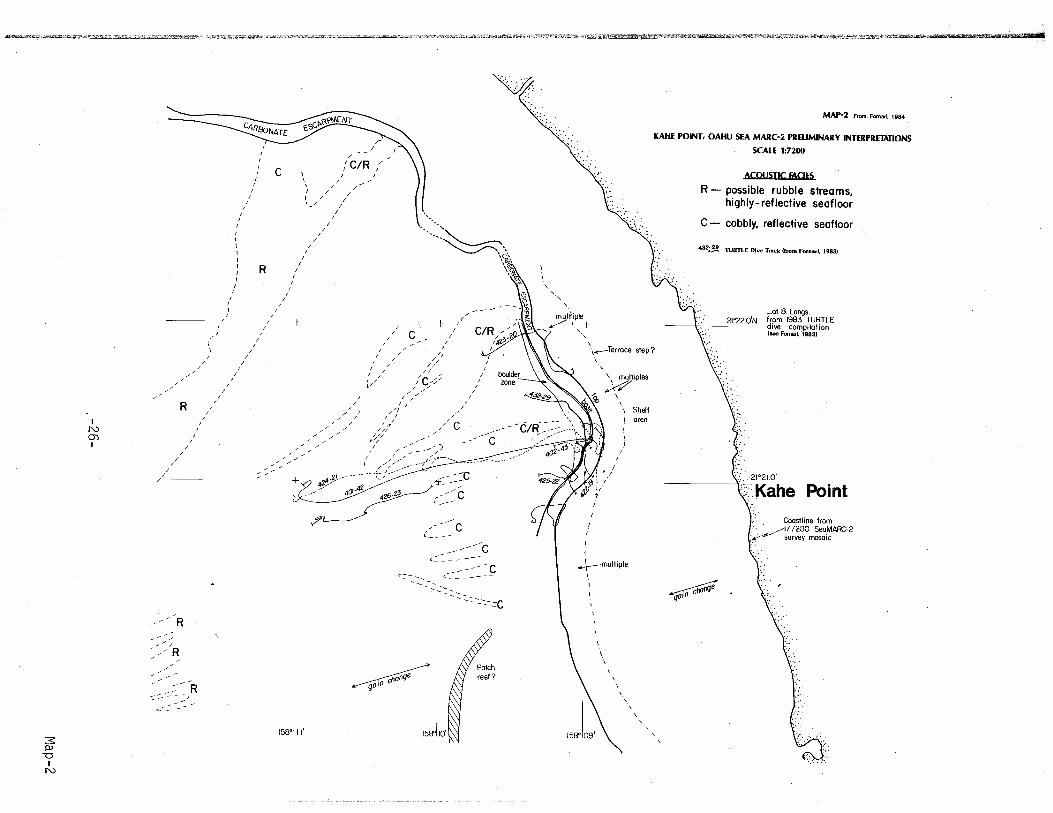
deployment of an OTEC cold-water pipeline. MAP 2 is the corresponding inter
pretative map for this record section. The pattern of the fan-shaped reflec
tivity zones shows a general funneling into the axis of the Kahe Point re
entrant.
The seafloor observed there (TURTLE, Fornari, 1983) is largely
sediment-covered with only minor rippled bedforms and no indications of large
cobbles or other seabed features that would render the terrain highly
reflective. In the northern part of Figure 2, there is another swath of
terrain that appears to follow the axis of the bathymetricre-entrant. The
location and character of these more reflective zones could indicate that the
axes of the re-entrants act to channel tidal swashing thereby winnowing fine
sediments and leaving behind a gravelly lag deposit that is more reflective.
The trend and character of the carbonate escarpment is easily seen on
Figure 2. The width of the escarpment terrain (plan-view map area) is rela-
. tively constant. At the southern end of the re-entrant, the width is about
150 m, in the middle it is approximately 200 m, and at the northern end it is
only 100 m wide. The base and top of the escarpment are marked by abrupt
changes in acoustic reflectivity. The trend of the escarpment top and base on
Figure 2 are in excellent agreement with the discrete portions of the escarp
ment top and base which were mapped with TURTLE (Fornari, 1983).
-22-
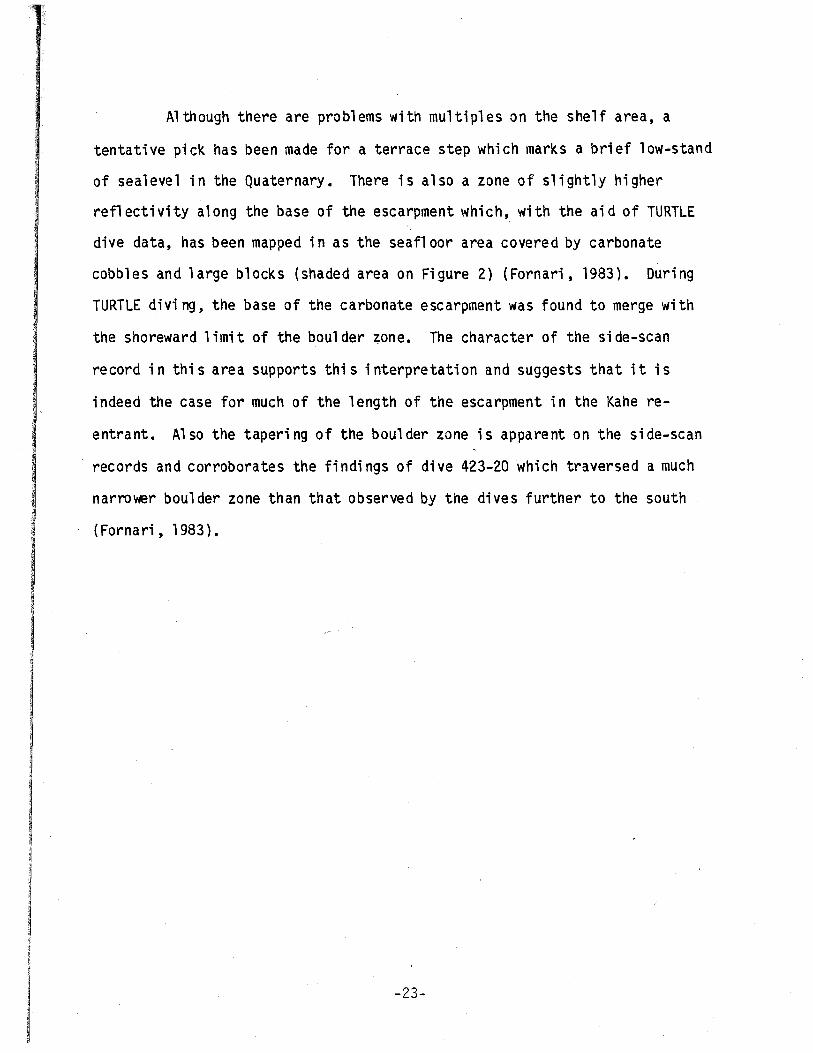
Although there are problems with multiples on the shelf area, a
tentative pick has been made for a terrace step which marks a brief low-stand
of sealevel in the Quaternary. There is also a zone of slightly higher
refiectivity along the base of the escarpment which, with the aid of TURTLE
dive data, has been mapped in as the seafloor area covered by carbonate
cobbles and large blocks (shaded area on Figure 2) (Fornari, 1983). During
TURTLE diving, the base of the carbonate escarpment was found to merge with
the shoreward limit of the boulder ~one. The character of the side-scan
record in this area supports this interpretation and suggests that it is
indeed the case for much of the length of the escarpment in the Kahe re
entrant. Also the tapering of the boulder zone is apparent on the side-scan
records and corroborates the findings of dive 423-20 which traversed a much
narrower boulder zone than that observed by the dives further to the south
(Fornari, 1983).
-23-
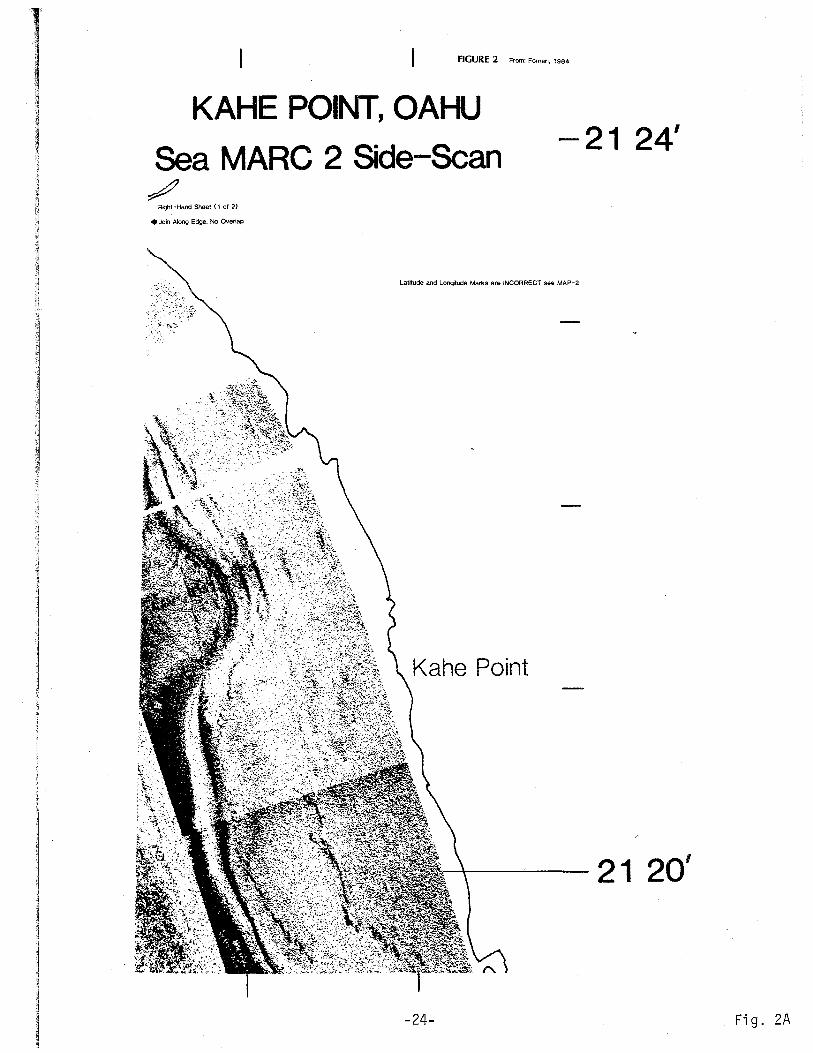
FIGURE 2 From: Fornar;, 1984
KAHE POINT, OAHU
Sea MARC 2 Side-Scan /
Right-Hand Sheet (1 of 2)
• Join Along Edge, No Overlap
-21 24'
Latitude and Longitude Marks are INCORRECT see MAP-2
--+--~- 21 20'
-24- Fig. 2A
-25- 158 10' Fig. 2B
3: PJ -0
I N
I N en I
/
R
/ /
/R ,
"R /
::::-::.-
I I
/
R
.:.." ~ -:.-
/ /
I
/ , /J
\ I
, ( ( ,
, , (
(
(
/ /
I I
I
I
, / ,
I /
, ,
, / ,
R
, I
I
"
C
, I
I
I I
/ /
+
, , , , , , I , , ,
/ /
/
" /C/R " I
/ /
I I
/ J
I
I
/
, /
" I I
, , , I
"
I /
/
/ + C _
I
1/ //
/ I
/I ,
/c .... ;:/ , "
/ , / I
'/ '/ /,
I I
I" 11/
,,/,,;/ ..--..--'" /J
1('
/ /
I
C
--
, I ,
,,{, ... 0-V/{::
, -(
/
,(,l:>:;;'~;:! + z~:'?···· __ ' C _-~-}--40
1..42 426 -
23 '---' .-
/---C l __ _
<~__ ,I------C
... -=-: - ... - -~~~-.:::C
"C~ ~ha~Y· reef?
15JII' 158.10'
.'
, ".
.. '1',·
'::::"':'.:
\
MAP-2 From: Fmwt. 198-4
KAHE POINT, OAHU SEA MARC-2 PRELIMINARY INTERPRETATIONS
SCALE 1:7200
ACOUSTIC rACiES
R - possible rubble streams, highly- reflective seafloor
C - cobbly, reflective seafloor
432~ TURTLE Dive Track ((rom Fornart. 1983)
Lat. B Longs. \., 21°22.0'N from 1983 TURTLE .' dive compllotion
(888 Fomart. 1983)
"xc-Terrace step?
\ ~tiPles
\
" Shelf ! area
I ..-;--mulliple
\
' .
___ --+.v~ .. 21°21.0'
\:: Kahe Point
. Cooslline from ,.- .. //,117200 SeaMARC-2 .~ survey mosOIC
~
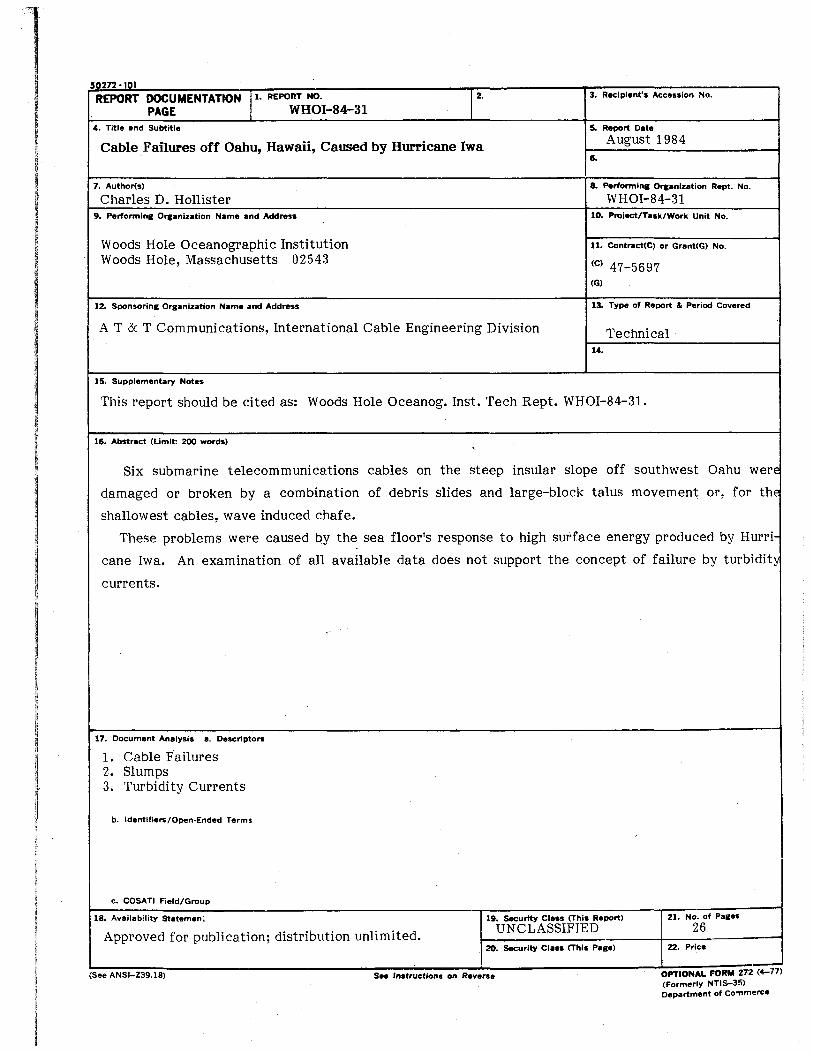
50272-101 REPORT DOCUMENTATION 11. REPORT NO.
12
• 3. Recipient's Accession No.
PAGE WHOI-84-31 4. Title and Subtitle 5. Report Date
Cable Failures off Oahu, Hawaii, Caused by Hurricane Iwa August 1984 6.
7. Author(s) 8. Parformln. O .. anlzation Rept. No.
Charles D. Hollister WHOI-84-31 9. Performl". O ... nization Name and Address 10. Project/Task/Work Unit No.
Woods Hole Oceanographic Institution 11. Contrect(C) or Grant(G) No.
Woods Hole, Massachusetts 02543 (C) 47-5697 (G)
12. Sponsorin. Orlanization Name and Address 13. Type of Report & Period Covered
A T & T Communications, International Cable Engineering Division Technical 14.
15. Supplementary Notes
This report should be cited as: Woods Hole Oceanog. Inst. Tech Rept. WHOI-84-31.
16. Abstract (Limit: 200 words) ".
Six submarine telecommunications cables on the steep insular slope off southwest Oahu werE
damaged or broken by a combination of debris slides and large-block talus movement or, for thE
shallowest cables, wave induced chafe.
These problems were caused by the sea floor'S response to high surface energy produced by Hurri
cane Iwa. An examination of all available data does not support the concept of failure by turbidit'i
currents.
17. Document Analysis a. Descriptors
1. Cable Failures 2. Slumps 3. Turbidity Currents
b. Identifiers/Open-Ended Terms
c. COSATI Field/Group
18. Availability Statemen: 19. Security Class (This Report)
Approved for publication; distribution unlimited. UNCLASSIFIED
20. Security Cia •• (This Pale)
(See ANSI-Z39.lS) S ... In.tructlons on Reverse
21. No. of Pales
26 22. Price
OPTIONAL FORM 272 (4-77) (Formerly NTIS-35) Department of Commerce
DOCUMENT LIBRARY
August 3, 1984
DISTRIBUTION LIST FOR TECHNICAL REPORT EXCHANGE
Institute of Marine Sciences Library University of Alaska O'N eill Building 905 Koyukuk Ave. North Fairbanks, AK
Attn: Stella Sanchez-Wade Documents Section Scripps Institution of Oceanography Library, Mail Code C-075C La Jolla, CA 92093
Hancock Library of Biology & Oceanography Alan Hancock Laboratory University of Southern California Los Angeles, CA 90007
Gifts & Exchanges Library Bedford Institute of Oceanography P.O. Box 1006 Dartmouth, NS, B2Y 4A2, CANADA
Office of the International Ice Patrol
c/o Coast Guard R&D Center Avery Point Groton, CT 06340
Library Physical Oceanographic Laboratory Nova University 8000 N. Ocean Drive Dania, FL 33304
NOAA/EDIS Miami Library Center 4301 Rickenbacker Causeway Miami, FL 33149
Library Skidaway Institute of Oceanography P.O. Box 13687 Savannah, GA 31406
Institute of Geophysics University of Hawaii Library Room 252 2525 Correa Road Honolulu, HI 96822
Library Chesapeake Bay Institute 4800 Atwell Road Shady Side, MD 20876
MIT Libraries Serial Journal Room 14E-210 Cambridge, MA 02139
Director, Ralph M. Parsons Laboratory Room 48-311 MIT Cambridge, MA 02139
Marine Resources Information Center Bldg. E38-320 MIT Cambridge, MA 02139
Library ,Lamont-Doherty Geological Observatory Colombia University Palisades, NY 10964
Library Serials Department Oregon State University Corvallis, OR 97331
Pell Marine Science Library University of Rhode Island Narragansett Bay Campus Narragansett, RI 02882
Workiflg Collection Texas A&M University Dept. of Oceanography College Station, TX 77843
Library Virginia Institute of Marine Science Gloucester Point, VA 23062
Fisheries-Oceanography Library 151 Oceanography Teaching Bldg. University of Washingfon Seattle, WA 98195
Library R.S.M.A.S. University of Miami 4600 Rickenbacker Causeway Miami, FL 33149
Related Documents