BUSINE CONDITIONS NK A REVIEW BY THE FEDERAL RESERVE BANK OF CHICAGO^ 3 m Q 05 Number 5 19 4 1 JUNE 1 Volume 24 V '*>-■ ■■ Fuel for Seventh District Industries Digitized for FRASER http://fraser.stlouisfed.org/ Federal Reserve Bank of St. Louis

Welcome message from author
This document is posted to help you gain knowledge. Please leave a comment to let me know what you think about it! Share it to your friends and learn new things together.
Transcript
BUSINE CONDITIONS NK
A REVIEW BY THE FEDERAL RESERVE BANK OF CHICAGO^ 3 m Q05
Number 519 4 1JUNE 1Volume 24
V '*>-■
■■
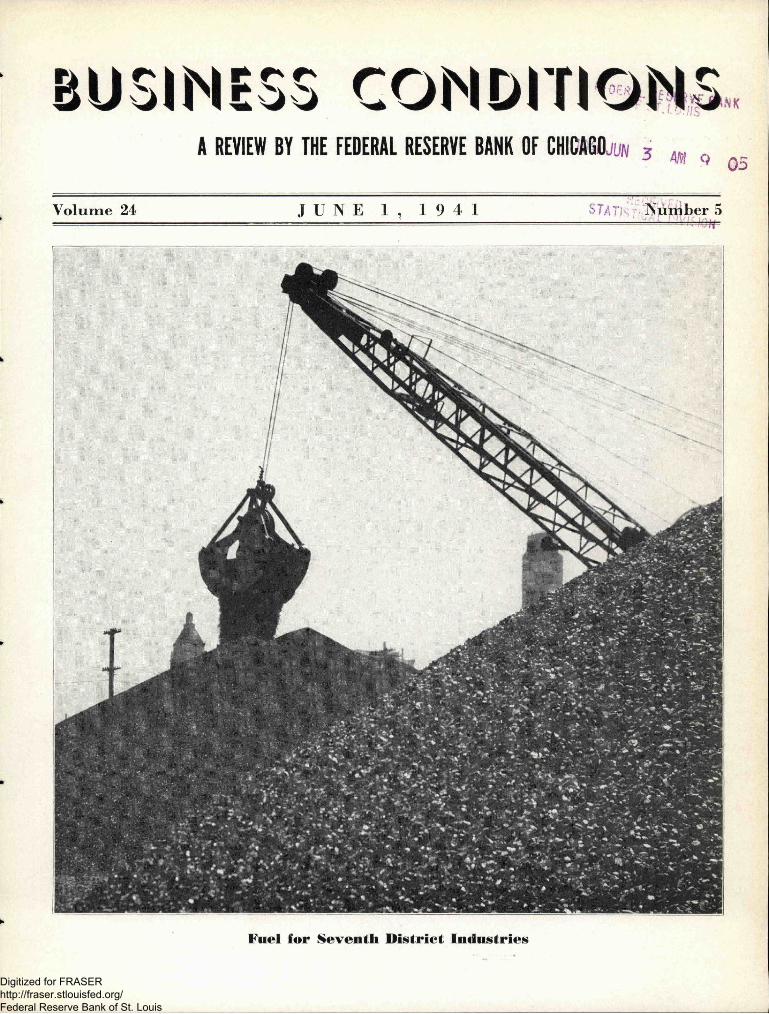
Fuel for Seventh District Industries
Digitized for FRASER http://fraser.stlouisfed.org/ Federal Reserve Bank of St. Louis
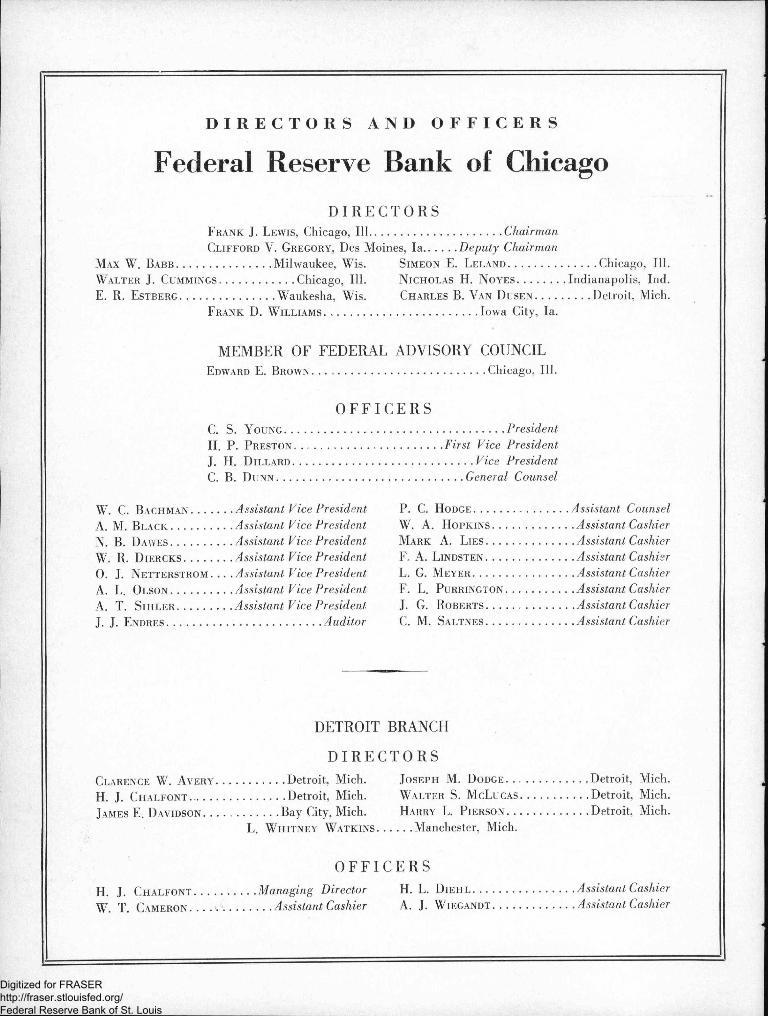
DIRECTORS AND OFFICERS
Federal Reserve Bank of ChicagoDIRECTORS
Frank J. Lewis, Chicago, 111..Clifford V. Gregory, Des Moines, la............Deputy Chairman
Max W. Babb .... Simeon E. Leland.................... ..........Chicago, 111.Walter J. Cummings........................... Chicago. III. Nicholas H. Noyes............... .Indianapolis. Ind.E. R. Estberg.... ......................... Waukesha, Wis. Charles B. Van Dusen. . .. .... Detroit, Mich.
Frank D. Williams....................
MEMBER OF FEDERAL ADVISORY COUNCIL
Edward E. Brown.........................
OFFICERS
C. S. Young...................................H. P. Preston.................................J. H. Dillard.................................C. B. Dunn........................................
W. C. Bachman.. P. C. Hodge................................. .Assistant Counsel
A. M. Black.......... W. A. Hopkins......................... . .Assistant Cashier
N. B. Dawes.......... ..........Assistant, Vice President Mark A. Lies........................... . .Assistant CashierW. R. Diercks. .. ..........Assistant Vice President F. A. Lindsten............................ . .Assistant Cashier0. J. Netterstrom. .. .Assistant Vice President L. G. Meyer................................ . .Assistant CashierA. L. Olson.......... F. L. PURRINGTON.................... . .Assistant CashierA. T. SlHLER.... .1. G. Roberts.......... ............. . .Assistant CashierJ. J. Endres............. C. M. Saltnes............................ . .Assistant Cashier
DETROIT BRANCH
DIRECTORS
Clarence W. Avery......................... Detroit, Mich. Joseph M. Dodge....................
H. j. Chalfont... ..............................Detroit, Mich. Walter S. McLucas...............
James E. Davidson ............................Bay City, Mich. Harry L. Pierson.................... .... Detroit, Mich.L. Whitney Watkins. ... .Manchester, Mich.
OFFICERS
H. J. Chalfont. ..................Managing Director H. L. Diehl................................. . .Assistant Cashier
W. T. Cameron .. .........................Assistant Cashier A. J. Wiegandt......................... . .Assistant, Cashier
Digitized for FRASER http://fraser.stlouisfed.org/ Federal Reserve Bank of St. Louis
District Summary of Business Conditions
NDU ST RIAL activity in the Seventh district continues to show marked expansion, with the several major indus
tries which had been hampered by labor disputes during April recovering rapidly in May. Further gains have been made in primary and subcontracting of national defense items in the district. Retail and wholesale trade continues at high levels, and income of farmers is being augmented by the substantially increased level of farm commodity prices.
Industry—Operations in the iron and steel industry in the Seventh district made a quick recovery during the early part of May, after their operations had been reduced to 96 per cent of rated capacity April 26 because of the coal shortage. Mills were able to bring production up to the 102 per cent level by the week ended May 17. An inventory control plan, covering sixteen metals, was announced May 1 by the Priorities Division of the 0PM. Under this plan, supplies of these metals will be withheld from customers whose stocks exceed requirements for efficient operation. Maximum pride schedules issued in April were revised May 7 to eliminatelinequalities that were considered detrimental to marketing.Tncreased purchasing power and the fear that there might be delays in delivery have caused retail sales of automobiles to exceed usual seasonal expectations. Notwithstanding the fact that the production of passenger cars and trucks during the first twenty-one weeks of 1941 exceeded any period in the past eleven years, dealers’ stocks of new cars are now estimated to be below those of a year ago.
The trend in both employment and payrolls was upward during the month of April and, with the exception of coal mining, every reporting industry showed some increase in the number of workers employed. Wage increases would have raised payrolls more rapidly than employment had it not been for labor disputes during April in the coal mining and automobile industries. Both the durable and nondurable goods showed a wide margin of gain over the 1940 level in employment and payrolls.
Manufacturing industries as a whole showed a marked year-to-year increase, with employment up 24 per cent and payrolls up 34 per cent.
There have been substantial gains in the building materials industries, notwithstanding the fact that construction contracts awarded in April returned to a more normal volume, following the March peak caused by letting of large contracts for the defense program. Construction of one- family dwellings continued in good volume, contributing largely to increases over 1940 contract volumes.
Agriculture—Conditions in the Seventh Federal Reserve district have been generally favorable to agriculture, with plantings throughout the corn belt making good progress. Development of wheat, oats, and other grain crops has been satisfactory. With the exception of lambs and cattle, prices of most farm products advanced sharply in May, influenced by legislation raising loan rates, sustained consumer de
mand, and heavy Government buying of certain commodities. Production of dairy products has continued exceptionally heavy.
Trade—Continued increase in consumer purchasing power is evidenced by the gain in retail trade throughout the district. While it was expected that the April volume would be higher than that of a year ago, due to the fact that Easter sales were included in the April figures, there has also been a substantial gain throughout the first four months of the year. The largest increase was recorded in the Indianapolis trading area. Milwaukee and Detroit sales were also substantially larger. All lines of wholesale trade reporting to the Bureau of the Census recorded increases over April a year ago. Most of the gains were substantial, and the increase for the district as a whole was 27 per cent.
Credit and Finance—There has been a sustained demand for commercial loans throughout the district, reflecting the increase in industrial activity. Deposits of weekly reporting member banks followed the pattern throughout the country and showed an increase of $126,000,000 from April' 16 to May 14. A substantial increase in member bank reserves was accounted for principally by a gain through commercial transactions with other districts.
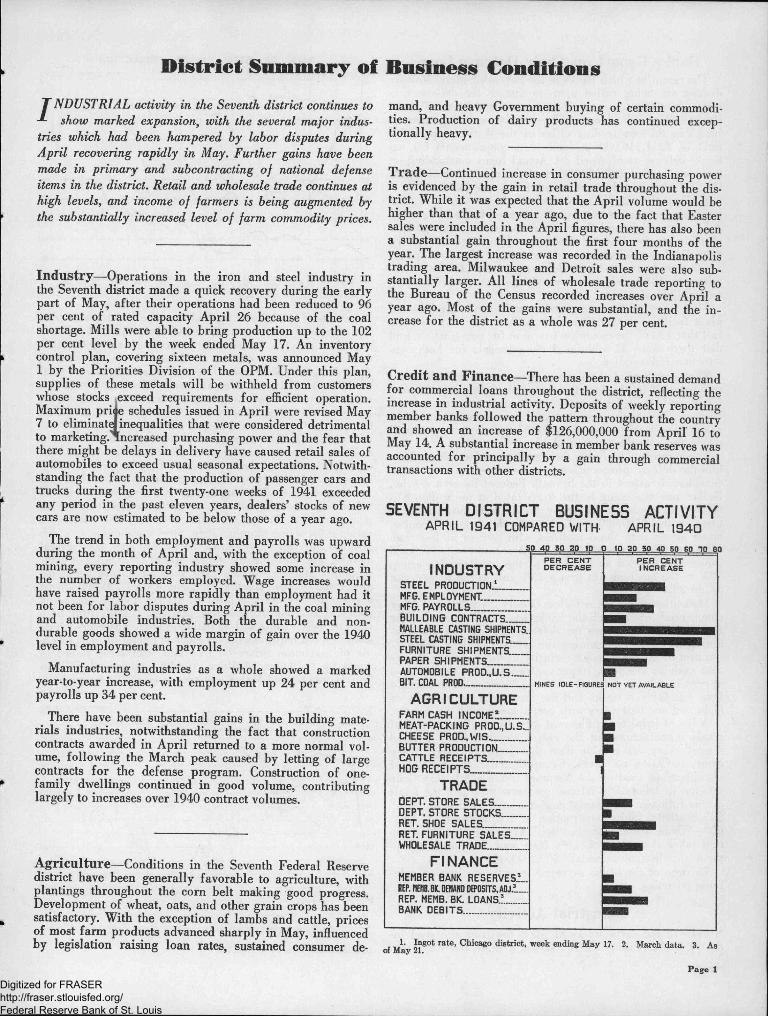
SEVENTH DISTRICT BUSINESS ACTIVITYAPRIL 1941 COMPARED WITH APRIL 1940
SO 40 30 20 to 10 20 50 40 50 BO TO BOPER CENT PER CENT
INDUSTRY DECREASE INCREASE
STEEL PRODUCTION.'MFG. EMPLOYMENT._ _ _ _ _ _ _ _MFG. PAYROLLSBUILDING CONTRACTS._ _ _ _MALLEABLE CASTING SHIPMENTSSTEEL CASTING SHIPMENTS.__FURNITURE SHIPMENTSPAPER SHIPMENTS____AUTOMOBILE PR0D..U.S.BIT. COAL PROD..................... . MINES IDLE-FIGURES NOT YET AVAILABLE
AGRICULTUREFARM CASH INCOME?........... BMEAT-PACKING PR0D.,U.S...CHEESE PR0D..WIS ■BUTTER PRODUCTION.... ■CATTLE RECEIPTS._ _ _ _ ■HOG RECEIPTS.........
TRADEDEPT. STORE SALESDEPT. STORE STOCKS........... ■RET. SHOE SALES.___RET. FURNITURE SALESWHOLESALE TRADE...
FINANCEMEMBER BANK RESERVES!..REP. MEMB. BK. DEMAND DEPOSITS, AOJ.i....REP. MEMB. BK. LOANS.?....BANK DEBITS....................
, *?got rate> Chicago district, week ending May 17. 2. March data. 3. As of May 21.
Page 1
Digitized for FRASER http://fraser.stlouisfed.org/ Federal Reserve Bank of St. Louis
Banks Report on Their Defense LoansThe extent to which banks in the Seventh Federal Reserve
district are being called upon to finance the defense program is indicated in a study just completed by the Federal Reserve Bank of Chicago. The weekly reporting member banks in thirteen leading cities of the district reported a total of $211,146,000 in loans and commitments for national defense as of April 30. Actual loans outstanding on that date totaled $83,109,000, and the remainder of $128,037,000 represented commitments for future loans.
While the banks did not know exactly how many of their borrowing customers are actually engaged in manufacturing defense materials and therefore do not know what portion of their regular lines of credit are going into this effort, they did have definite records covering 617 commitments which were known to be for defense purposes. Of these commitments, 483 had been converted into loans, and 134 were unused lines of credit.
That many of the borrowers were in need of additional plant facilities to complete their contracts is shown by the fact that 128 of the commitments were for construction, and that there were 22 additional commitments for both construction and supplies.
The spreading of the defense program to subcontractors was revealed by the fact that loans and commitments were fairly well divided between prime contractors and subcontractors. The banks reported 342 commitments to prime contractors, 197 to subcontractors, 65 to firms acting as both prime and subcontractors, and 13 unclassified.
The campaign to bring the small manufacturing plants into the defense program seems to have been carried out to considerable extent in the Seventh Federal Reserve district. Dollar amounts going to the firms rated at more than $1,000,000 in assets are naturally larger than those going to firms in the $100,000 to $1,000,000 class and, of course, much larger than those to firms with ratings of less than $100,000. The number of loans and commitments for each group was divided as follows: to the smallest size group 127, to the medium size group 238, and to the largest size group 252.
Maturities of the loans follow closely the pattern of other commercial loans which the banks have on their books. The fact that the loans were for defense has not been the governing factor in determining the repayment date. Some 27 per cent of the loans had a maturity of three months, 23 per cent were for one year, 10 per cent were for six months, and approximately 5 per cent were on demand. The shortest loan was for two weeks and the longest had a maturity of eight and one half years with prepayments each six months.
A list of items being financed would read like a census of goods manufactured in the entire country. They covered almost every conceivable item that could be used by the army, navy, or air corps. Grouped under the five major classifications used by the National Defense Advisory Commission in tabulating defense contracts awarded, the totals are as follows: “Airplanes, engines, parts, and equipment” $35,299,000; “Ship construction and equipment” $7,543,000; “Ordnance and ammunition” $74,050,000; “Construction other than ship” $24,993,000; and “All other equipment, supplies and material” $69,261,000.
Thirteen of the banks surveyed reported no loans for defense purposes.
Industrial ActivitySteel—In the early weeks of May, the iron and steel industry in the Seventh district staged a rapid recovery fromPage 3
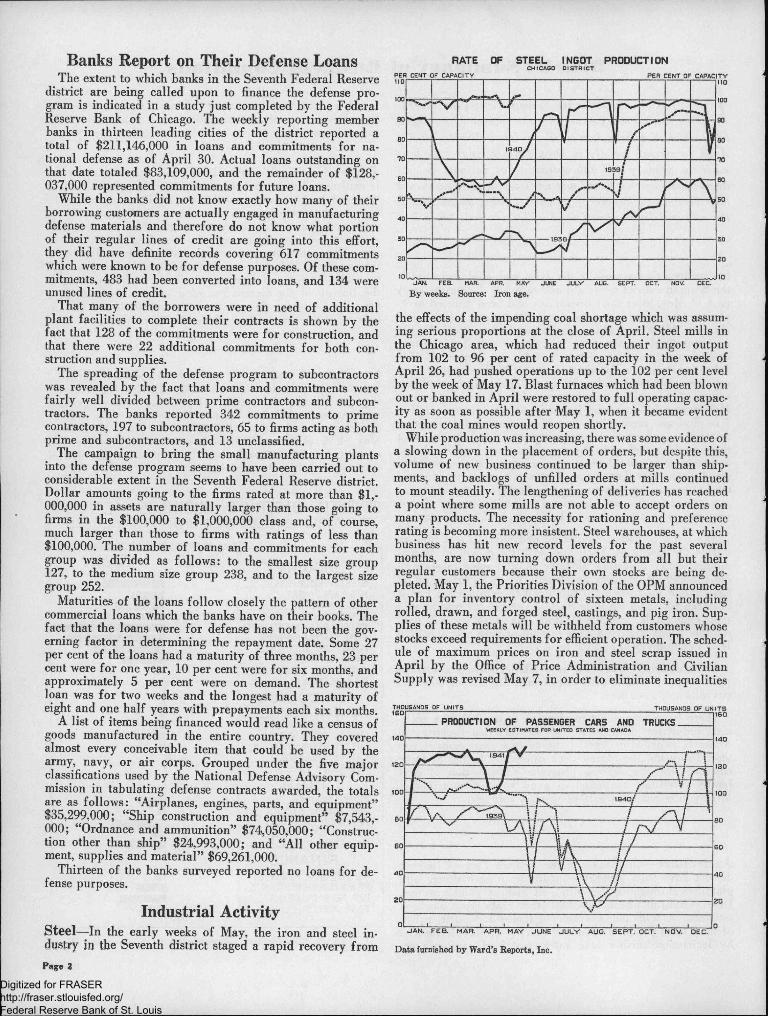
RATE OF STEEL INGOT PRODUCTIONCHICAGO DISTRICT
PER CENT OF CAPACITY PER CENT OF CAPACITY
By weeks. Source: Iron age.
the effects of the impending coal shortage which was assuming serious proportions at the close of April. Steel mills in the Chicago area, which had reduced their ingot output from 102 to 96 per cent of rated capacity in the week of April 26, had pushed operations up to the 102 per cent level by the week of May 17. Blast furnaces which had been blown out or banked in April were restored to full operating capacity as soon as possible after May 1, when it became evident that the coal mines would reopen shortly.
While production was increasing, there was some evidence of a slowing down in the placement of orders, but despite this, volume of new business continued to be larger than shipments, and backlogs of unfilled orders at mills continued to mount steadily. The lengthening of deliveries has reached a point where some mills are not able to accept orders on many products. The necessity for rationing and preference rating is becoming more insistent. Steel warehouses, at which business has hit new record levels for the past several months, are now turning down orders from all but their regular customers because their own stocks are being depleted. May 1, the Priorities Division of the OPM announced a plan for inventory control of sixteen metals, including rolled, drawn, and forged steel, castings, and pig iron. Supplies of these metals will be withheld from customers whose stocks exceed requirements for efficient operation. The schedule of maximum prices on iron and steel scrap issued in April by the Office of Price Administration and Civilian Supply was revised May 7, in order to eliminate inequalities
THOUSANDS OF UNITS
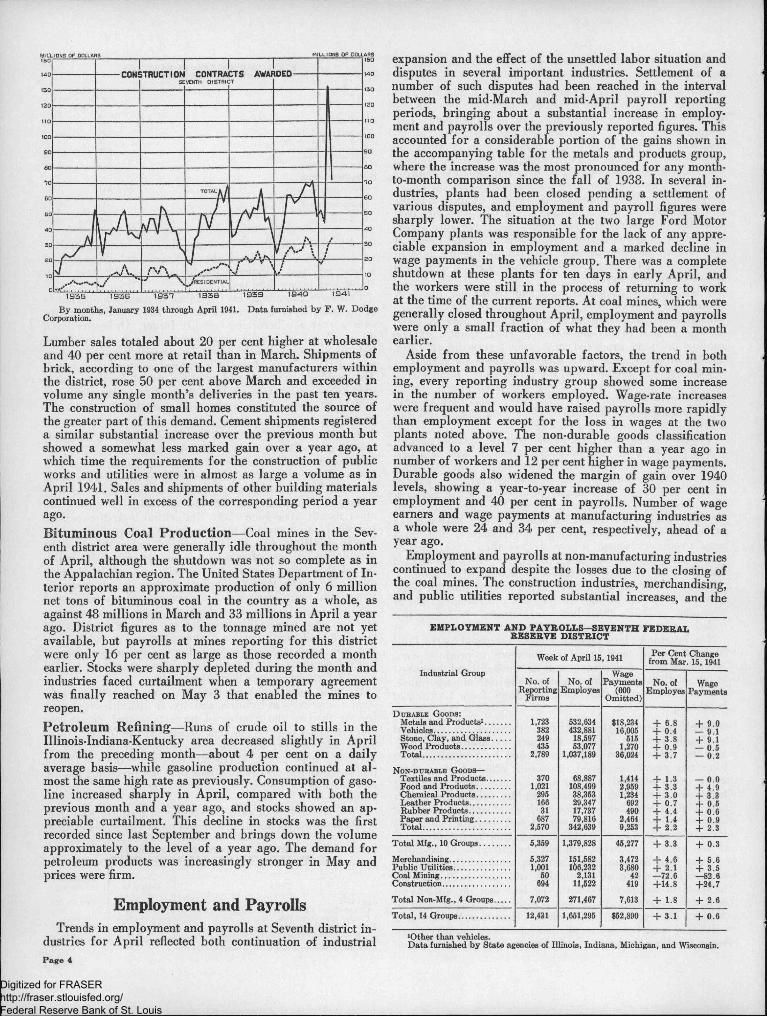
PRODUCTION OF PASSENGER CARS AND TRUCKS
1939*
JAN. FEB. MAR. APR. MAY JUNE JULY AUG. SEPT. OCT. NOV. DEC.
Data furnished by Ward’s Reports, Inc.
Digitized for FRASER http://fraser.stlouisfed.org/ Federal Reserve Bank of St. Louis

that were considered detrimental to the marketing of this material.Automobile Industry—Retail sales of automobiles continued to mount during April and perhaps exceeded the record established in April 1929. Due to the industry’s participation in defense activities and the possibility of increased prices and taxes in the future, dealers continued to warn customers of delayed deliveries and have been booking sales now that would usually be deferred until the showing of the 1942 models. Increased purchasing power, due to employment in defense industries, is also contributing to heavy new and used-car sales. Manufacturers will probably continue the production of 1941 models well into July before considering a shutdown for changeover. Dealers’ stocks of new cars are now estimated to have dropped below those of a year ago for the first time this year, as a result of current trends in the industry.
Production of passenger cars and trucks for the week ending May 24 was 134,000, about 6,000 more than the previous week, and the highest on record since May 15,1937. During the first twenty-one weeks of 1941, about 2,500,000 automobiles were produced, this amount exceeding the production of any similar period in the past eleven years.
Passenger car assemblies in the United States totaled 374,979 in April, a decrease of 9 per cent from March, but an increase of 4 per cent over April 1940; 87,278 trucks were produced, showing a decrease of 11 per cent from March and a gain of 24 per cent over a year ago.
Present estimates of 1942 model year production, according to the Office of Production Management, will be a percentage of 1941 model actual output. Major producers such as Chrysler, Ford, and General Motors will turn out 78.5 per cent of their total 1941 model production, while medium- size passenger car manufacturers or “independents” will produce 85 per cent, and truck producers will have a quota of 90 and 95 per cent according to the volume of their business. Producers whose volume is less than 2,000 cars or trucks per year will not be curtailed. The OPM has warned that these quotas may be subject to downward revision.
The OPM further has asked that the greatest possible economy be exercised in the use of such critical materials as neoprene, nickel, chromium, magnesium, ferrotungsten, nickel steel, zinc, copper, and aluminum.
The bombing plane factory being constructed by the Ford Motor Company near Ypsilanti, Michigan, to produce parts, sub-assemblies, and complete B-24 Consolidated bombers, is one of the most recent armament projects of importance! Production estimates for this plant range from 100 to 270 bombers per month.
Miscellaneous Manufactures—Demand for steel and malleable castings showed continued expansion in April, and the volume of new orders booked by Seventh district foundries greatly exceeded shipments, although these shipments were stepped up appreciably and were especially heavy compared with the corresponding volumes of a year ago. Output was held in line with shipments and showed approximately the same upward trend. Defense work and increased railroad car building programs have contributed to the greatly increased demand for all types of castings.
Stove and furnace manufacturers reported little further change in the rate of production and only a 10 per cent increase in shipments, despite the fact that the volume of accepted orders in April was 35 per cent larger than in March. The increase in this latter item was limited to a relatively small number of the reporting manufacturers, some of whose bookings of new business are practically con-
STEEL AND MALLEABLE CASTINGS _________SEVENTH DISTRICT
Steel Castings:Orders booked (tons)__Orders booked (dollars).Shipments (tons).............Shipments (dollars).........Production (tons).............
Malleable Castings:Orders booked (tons)__Orders booked (dollars).Shipments (tons).............Shipments (dollars).........Production (tons).............
April 1941 Per Cent Change
fromMarch April
1941 1940. +23 +386. +16 +401. +10 + 69. + r + 90. +9 + 80
+14 +168+14 +173+14 + 78+15 + 80+20 +103
fined to a few months of the year. Molding-room operations were maintained at a level almost 30 per cent above that of a year ago and shipments for the year to date have been 40 per cent larger than last year.
Furniture manufacturers continued to maintain operations at the same level as in recent months, but with the increases over a year ago becoming steadily larger. Orders received during April were still somewhat heavier than shipments, but this was practically offset by cancellations of orders, so that the volume of unfilled orders remained unchanged. The backlog of unfilled orders at the end of April was more than twice as large as in 1940. Operations were at 85 per cent of capacity, 8 points above the rate reported last year.Building—-Construction contracts awarded in the Seventh district during April returned to a more normal volume, following the peak reported in March when construction incidental to the defense program raised that month’s total to a level about as high as that prevailing in the active months of 1929. The April volume, while little more than one half as large as in March, was still unusually high, exceeding any other month since June 1930. Residential awards expanded seasonally, with most of the gain in the construction of one- family dwellings for direct ownership rather than for the speculative purpose of rent or sale. While awards for building of this latter type showed a relatively minor increase during the month, the actual volume of such awards continues important, constituting about 40 per cent of all residential building. Non-residential awards declined by the greatest amount, as it was in this field that the defense projects had constituted the main portion of the contracts a month earlier. Publicly-financed heavy engineering projects also registered a sharp decline in April from the previous month but totaled about 10 per cent larger than April 1940.
Building permits issued during the month reflected substantial increases in building activity. In 102 cities reporting for the district, the number of projects totaled 59 per cent and estimated cost 13 per cent higher than in March. Compared with a year ago, the gains amounted to 19 and 28 per cent, respectively. Michigan cities alone did not follow the rising trend in estimated cost over the preceding month, and Iowa cities showed no increase over last year’s permit volume.
Further substantial gains in volume of business were generally reported by building material industries in the district.
BUILDING CONTRACTS AWARDED SEVENTH FEDERAL RESERVE DISTRICT
PeriodTotal
ContractsResidentialContracts
April 1941.............................................................Change from March 1941....................Change from April 1940...........................................
First four months of 1941..............................................Change from same period of 1940............................
$71,266,000 -46% +17%
*298,399,000 +85%
$33,658,000+15%+31%
*100,464,000+49%
Data furnished by the F. W. Dodge Corporation.
Page 3
Digitized for FRASER http://fraser.stlouisfed.org/ Federal Reserve Bank of St. Louis
tylLLIOMS of dollars
CONSTRUCTION CONTRACTS AWARDED
By months, January 1934 through April 1941. Data furnished by F. W. Dodge Corporation.
Lumber sales totaled about 20 per cent higher at wholesale and 40 per cent more at retail than in March. Shipments of brick, according to one of the largest manufacturers within the district, rose 50 per cent above March and exceeded in volume any single month’s deliveries in the past ten years. The construction of small homes constituted the source of the greater part of this demand. Cement shipments registered a similar substantial increase over the previous month but showed a somewhat less marked gain over a year ago, at which time the requirements for the construction of public works and utilities were in almost as large a volume as in April 1941. Sales and shipments of other building materials continued well in excess of the corresponding period a year ago.Bituminous Coal Production—Coal mines in the Seventh district area were generally idle throughout the month of April, although the shutdown was not so complete as in the Appalachian region. The United States Department of Interior reports an approximate production of only 6 million net tons of bituminous coal in the country as a whole, as against 48 millions in March and 33 millions in April a year ago. District figures as to the tonnage mined are not yet available, but payrolls at mines reporting for this district were only 16 per cent as large as those recorded a month earlier. Stocks were sharply depleted during the month and industries faced curtailment when a temporary agreement was finally reached on May 3 that enabled the mines to reopen.Petroleum Refining—Runs of crude oil to stills in the Ulinois-Indiana-Kentucky area decreased slightly in April from the preceding month—about 4 per cent on a daily average basis—while gasoline production continued at almost the same high rate as previously. Consumption of gasoline increased sharply in April, compared with both the previous month and a year ago, and stocks showed an appreciable curtailment. This decline in stocks was the first recorded since last September and brings down the volume approximately to the level of a year ago. The demand for petroleum products was increasingly stronger in May and prices were firm.
Employment and PayrollsTrends in employment and payrolls at Seventh district in
dustries for April reflected both continuation of industrial
expansion and the effect of the unsettled labor situation and disputes in several important industries. Settlement of a number of such disputes had been reached in the interval between the mid-March and mid-April payroll reporting periods, bringing about a substantial increase in employment and payrolls over the previously reported figures. This accounted for a considerable portion of the gains shown in the accompanying table for the metals and products group, where the increase was the most pronounced for any month- to-month comparison since the fall of 1938. In several industries, plants had been closed pending a settlement of various disputes, and employment and payroll figures were sharply lower. The situation at the two large Ford Motor Company plants was responsible for the lack of any appreciable expansion in employment and a marked decline in wage payments in the vehicle group. There was a complete shutdown at these plants for ten days in early April, and the workers were still in the process of returning to work at the time of the current reports. At coal mines, which were generally closed throughout April, employment and payrolls were only a small fraction of what they had been a month earlier.
Aside from these unfavorable factors, the trend in both employment and payrolls was upward. Except for coal mining, every reporting industry group showed some increase in the number of workers employed. Wage-rate increases were frequent and would have raised payrolls more rapidly than employment except for the loss in wages at the two plants noted above. The non-durable goods classification advanced to a level 7 per cent higher than a year ago in number of workers and 12 per cent higher in wage payments. Durable goods also widened the margin of gain over 1940 levels, showing a year-to-year increase of 30 per cent in employment and 40 per cent in payrolls. Number of wage earners and wage payments at manufacturing industries as a whole were 24 and 34 per cent, respectively, ahead of a year ago.
Employment and payrolls at non-manufacturing industries continued to expand despite the losses due to the closing of the coal mines. The construction industries, merchandising, and public utilities reported substantial increases, and the
EMPLOYMENT AND PAYROLLS—SEVENTH FEDERAL RESERVE DISTRICT
Week of April 15, 1941 Per Cent Change from Mar. 15,1941
Industrial GroupNo. of
Reporting Firms
No. of Employes
WagePayments
(000Omitted)
No. of Employes
WagePayments
Durable Goods:Metals and Products1............Vehicles...................................Stone, Clay, and Glass........Wood Products......................Total.........................................
1,723382249435
2,789
532,634432,881
18,59753,077
1,037,189
$18,23416,005
5151,270
36,024
+ 6.8 + 0.4 -f 3.8 + 0.9 + 3.7
+ 9.0— 9.1 + 9.1— 0.5— 0.2
Non-durable Goods—Textiles and Products...........Food and Products...............Chemical Products...............Leather Products..................Rubber Products...................Paper and Printing................Total........................................
3701,021
295166
31687
2,570
68,887108,49938,35329,34717,73779,816
342,639
1,4142,9591,234
692490
2,4649,253
+ 13 + 3.3 + 3.0 + 0.7 + 4.4 + 1.4 + 2.2
— 0.0 + 4.9 + 3.3 + 0.5 + 0.6 + 0.9 + 2.3
Total Mfg., 10 Groups.............. 5,359 1,379,828 45,277 + 3.3 + 0.3
Merchandising............................Public Utilities..........................Coal Mining................................Construction...............................
5,3271,001
50694
151,582106,232
2,13111,522
3,4723,680
42419
+ 4.6 + 2.1 —72.6 +14.8
+ 5.6 + 3.5 —82.6 +24.7
Total Non-Mfg., 4 Groups....... 7,072 271,467 7,613 + 1.8 + 2.6
Total, 14 Groups....................... 12,431 1,651,295 $52,890 + 3.1 + 0.6
1Other than vehicles.Data furnished by State agencies of Illinois, Indiana, Michigan, and Wisconsin.
Page 4
Digitized for FRASER http://fraser.stlouisfed.org/ Federal Reserve Bank of St. Louis
aggregate rise over March for the non-manufacturing classification amounted to slightly more than usual at this season. SALES OF INDEPENDENT RETAIL STORES
(As compiled by the Bureau of the Census)
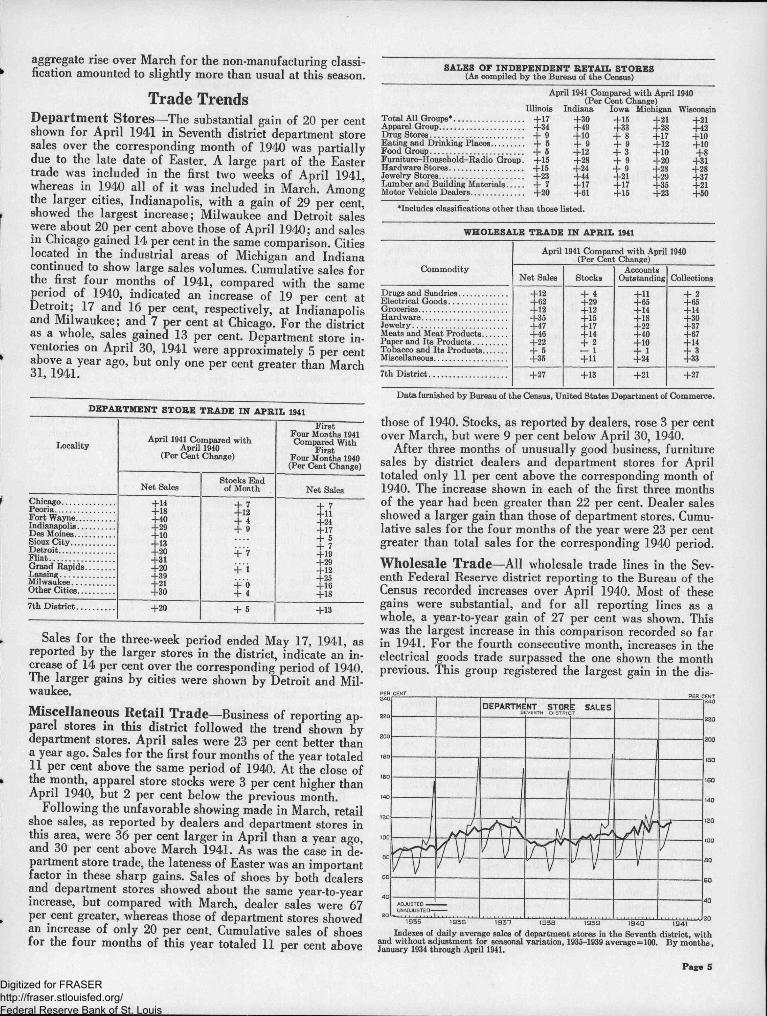
Trade TrendsDepartment Stores—The substantial gain of 20 per cent shown for April 1941 in Seventh district department store sales over the corresponding month of 1940 was partially due to the late date of Easter. A large part of the Easter trade was included in the first two weeks of April 1941, whereas in 1940 all of it was included in March. Among the larger cities, Indianapolis, with a gain of 29 per cent, showed the largest increase; Milwaukee and Detroit sales were about 20 per cent above those of April 1940; and sales in Chicago gained 14 per cent in the same comparison. Cities located in the industrial areas of Michigan and Indiana continued to show large sales volumes. Cumulative sales for the first four months of 1941, compared with the same period of 1940, indicated an increase of 19 per cent at Detroit; 17 and 16 per cent, respectively, at Indianapolis and Milwaukee; and 7 per cent at Chicago. For the district as a whole, sales, gained 13 per cent. Department store inventories on April 30, 1941 were approximately 5 per cent above a year ago, but only one per cent greater than March
DEPARTMENT STORE TRADE IN APRIL 1941
First
LocalityApril 1941 Compared with
April 1940Four Months 1941 Compared With
(Per Cent Change) Four Months 1940(Per Cent Change)
Net SalesStocks End
of Month Net SalesChicago........................ +14
+18+40+29+10+13+20+31+20+39+21+30
+ 7 +12 + 4 + 9
+ 7 +11 +24 +17 + 5 + 7 +19 +29 +12 +25 +16 +18
Fort Wayne..................
Des Moines..................
+ 7Grand Rapids............. + iMilwaukee.................... +'6
+ 4Other Cities.................
+20 +13
Sales for the three-week period ended May 17, 1941, as reported by the larger stores in the district, indicate an increase of 14 per cent over the corresponding period of 1940. The larger gains by cities were shown by Detroit and Milwaukee.Miscellaneous Retail Trade—Business of reporting apparel stores in this district followed the trend shown by department stores. April sales were 23 per cent better than a year ago. Sales for the first four months of the year totaled 11 per cent above the same period of 1940. At the close of the month, apparel store stocks were 3 per cent higher than April 1940, but 2 per cent below the previous month.
Following the unfavorable showing made in March, retail shoe sales, as reported by dealers and department stores in this area, were 36 per cent larger in April than a year ago, and 30 per cent above March 1941. As was the case in department store trade, the lateness of Easter was an important factor in these sharp gains. Sales of shoes by both dealers and department stores showed about the same year-to-year increase, but compared with March, dealer sales were 67 per cent greater, whereas those of department stores showed an increase of only 20 per cent. Cumulative sales of shoes for the four months of this year totaled 11 per cent above
April 1941 Compared with April 1940 (Per Cent Change)
Illinois Indiana Iowa Michigan WisconsinTotal All Groups*................................. +17Apparel Group....................................... +34Drug Stores........................................... +9Eating and Drinking Places............... +5Food Group........................................... + 5Furniture-Household-Radio Group. +15Hardware Stores.................................. +15Jewelry Stores........................................ +23Lumber and Building Materials........ + 7Motor Vehicle Dealers........................ +20
+30 +15 +21 +21+49 +33 +28 +42+10 + 8 +17 +10+ 9 + 9 +12 +10+12 + 3 +10 +8+28 + 9 +20 +31+24 + 9 +28 +28+44 +21 +29 +37+17 +17 +35 +21+61 +15 +23 +50
•Includes classifications other than those listed.
WHOLESALE TRADE IN APRIL 1941
April 1941 Compared with April 1940 ________ (Per Cent Change)________
CommodityNet Sales Stocks
AccountsOutstanding Collections
Drugs and Sundries...................... +12 + 4 +n + 2Electrical Goods........................... +62 +29 +65 +65Groceries......................................... +12 +12 +14 +14Hardware...................................... +35 +15 +18 +30Jewelry............................................ +47 +17 +22 +37Meats and Meat Products......... +46 +14 +40 +67Paper and Its Products............... +22 + 2 +10 +14Tobacco and Its Products........... + 5 — 1 + 1 + 3Miscellaneous.................................. +35 +11 +24 +33
7th District.................................... +27 +13 +21 +27
Data furnished by Bureau of the Census, United States Department of Commerce.
those of 1940. Stocks, as reported by dealers, rose 3 per cent over March, but were 9 per cent below April 30, 1940.
After three months of unusually good business, furniture sales by district dealers and department stores for April totaled only 11 per cent above the corresponding month of 1940. The increase shown in each of the first three months of the year had been greater than 22 per cent. Dealer sales showed a larger gain than those of department stores. Cumulative sales for the four months of the year were 23 per cent greater than total sales for the corresponding 1940 period.Wholesale Trade—All wholesale trade lines in the Seventh Federal Reserve district reporting to the Bureau of the Census recorded increases over April 1940. Most of these gains were substantial, and for all reporting lines as a whole, a year-to-year gain of 27 per cent was shown. This was the largest increase in this comparison recorded so far in 1941. For the fourth consecutive month, increases in the electrical goods trade surpassed the one shown the month previous. This group registered the largest gain in the dis-
DEPARTMENT STORE SALES
1935 1936 193"7 1938 1939 1940 1941
Indexes of daily average sales of department stores in the Seventh district, with and without adjustment for seasonal variation, 1935-1939 average=100. By months, January 1934 through April 1941.
Page 5
Digitized for FRASER http://fraser.stlouisfed.org/ Federal Reserve Bank of St. Louis
trict, as April sales were 62 per cent over those of April 1940. Meat and its products, hardware, and jewelry groups also continued to show substantial gains. With the exception of tobacco and its products, all important groups carried inventories above the corresponding month a year ago. The aggregate for all groups showed an increase of 13 per cent. Compared with March 1941, however, a slight decline was recorded.
The Agricultural SituationBy the middle of May, most Seventh district crops were
progressing rapidly. In the Southern sections, corn planting by May 18 was practically completed, while in the Northern areas, seeding of corn was getting well under way. Condition of the growing corn varied from fair to unusually good. Progress of winter wheat, oats, and other grain crops was generally good.Grain Marketing—Following numerous wide swings but little net change in April, domestic wheat prices advanced sharply in the first half of May, until by mid-month prices were at about the highest level in a year. The early May advance of close to 10 cents per bushel was largely associated with progress and passage by Congress of legislation providing for mandatory loans at 85 per cent of parity on wheat, corn, cotton, tobacco, and rice. As of mid-April, parity prices for wheat were $1.14 and about 83 cents for corn; these levels would call for loan prices of approximately 97 cents per bushel for wheat and 70 cents for corn.
MOVEMENT OF GRAIN AT INTERIOR PRIMARY MARKETS IN THE UNITED STATES(In thousands of bushels)
AprilApril March April 1931-401941 1941 1940 Avg.
Wheat*Receipts.............................................. 17,100 12,903 29,424 13,772Shipments........................................... 11,685 9,376 8,890 11,034
Com:Receipts.............................................. 16,930 18,811 11,058 14,210Shipments........................................... 14,229 9,269 10,019 10,569
Oats:Receipts.............................................. 4,381 4,661 4,257 4,857Shipments.......................................... 3,264 3,825 4,430 6,377
There was considerable buying of futures by mills to cover heavy purchases of flour by bakers and distributors, but volume of open contracts was reduced slightly over the first half of May. The referendum to be held May 31, at which time wheat farmers will be called to vote on the question of whether marketing quotas shall be set for the 1941 crop, was a further complicating factor.
Corn prices generally followed the action of wheat, and fluctuation was largely motivated by the same factors. By mid-May, prices were the highest since 1937. Planting throughout the corn belt made generally good progress, though interrupted by general rains in mid-May. So far this season, rainfall in the Western part of the belt has been excessive, in the Eastern part deficient. As prices of corn advanced, sales by the Commodity Credit Corporation increased, and the offering basis was reduced. The amount of corn redeemed or placed under loan has been small, and marketings by farm holders were restricted by farm activity.
The 1941 winter wheat crop was estimated by the Department of Agriculture at 653 million bushels on the basis of May 1 condition. This is 37 million bushels higher than the month-earlier indication, and the trade news suggests that the outlook improved after May 1. If the spring wheat yield should be about average on the basis of indicated acreage, the total 1941 wheat crop would approximate 850 million bushels. This would compare with a crop of 817 million bushels last year, and with an anticipated July 1 carryoverPage 6
CROP PRODUCTIONEstimated by the United States Department of Agriculture on May 1 Condition
(In thousands of bushels)Five States Including
Seventh District United StatesForecast Final Average Forecast Final Average
1941 1940 1930-39 1941 1940 1930-39Winter Wheat.................. 82,349 95,667 90,957 653,105 589,151 569,417Rye................................... 5,970 7,120 8,464 45,623 40,601 38,472
of about 400 million bushels; total supplies would be about 1,250 million bushels. The total supply in the 1940-41 crop year was 1,099 million bushels.
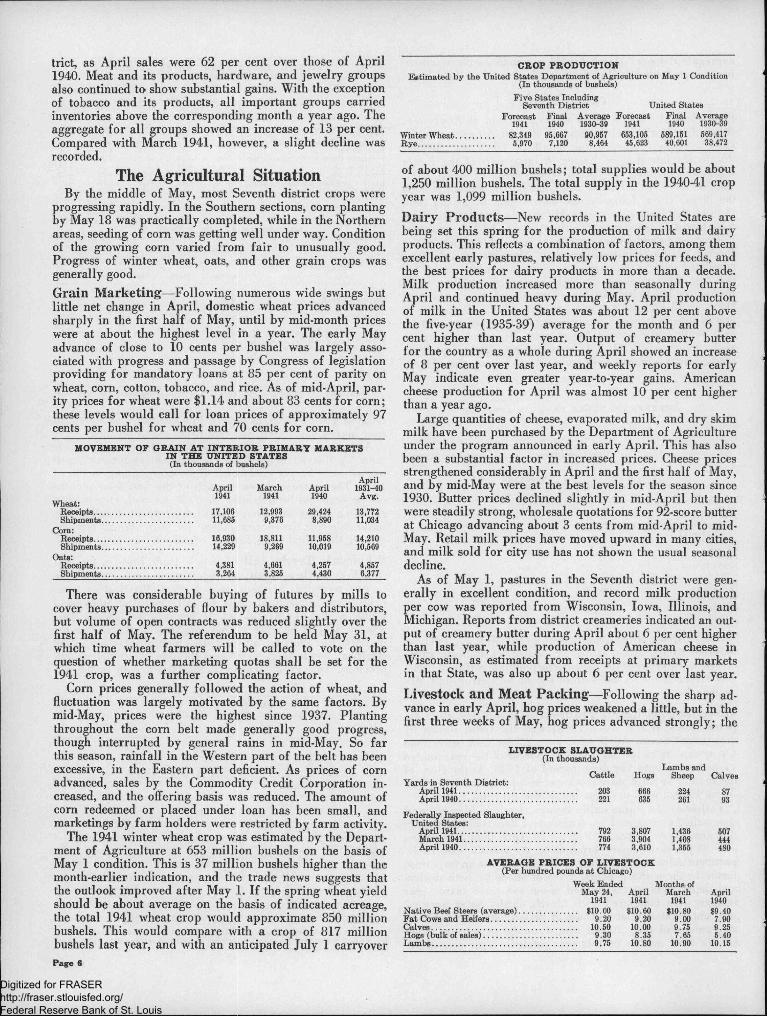
Dairy Products—New records in the United States are being set this spring for the production of milk and dairy products. This reflects a combination of factors, among them excellent early pastures, relatively low prices for feeds, and the best prices for dairy products in more than a decade. Milk production increased more than seasonally during April and continued heavy during May. April production of milk in the United States was about 12 per cent above the five-year (1935-39) average for the month and 6 per cent higher than last year. Output of creamery butter for the country as a whole during April showed an increase of 8 per cent over last year, and weekly reports for early May indicate even greater year-to-year gains. American cheese production for April was almost 10 per cent higher than a year ago.
Large quantities of cheese, evaporated milk, and dry skim milk have been purchased by the Department of Agriculture under the program announced in early April. This has also been a substantial factor in increased prices. Cheese prices strengthened considerably in April and the first half of May, and by mid-May were at the best levels for the season since 1930. Butter prices declined slightly in mid-April but then were steadily strong, wholesale quotations for 92-score butter at Chicago advancing about 3 cents from mid-April to midMay. Retail milk prices have moved upward in many cities, and milk sold for city use has not shown the usual seasonal decline.
As of May 1, pastures in the Seventh district were generally in excellent condition, and record milk production per cow was reported from Wisconsin, Iowa, Illinois, and Michigan. Reports from district creameries indicated an output of creamery butter during April about 6 per cent higher than last year, while production of American cheese in Wisconsin, as estimated from receipts at primary markets in that State, was also up about 6 per cent over last year.
Livestock and Meat Packing—Following the sharp advance in early April, hog prices weakened a little, but in the first three weeks of May, hog prices advanced strongly; the
LIVESTOCK SLAUGHTER(In thousands)
Lambs andCattle Hogs Sheep
Yards in Seventh District:April 1941............................................. ....... 203 666 224 87April 1940............................................. ......... 221 635 261 93
Federally Inspected Slaughter,United States:
April 1941.............................................. ......... 792 3,807 1,436 507March 1041........................................... ........ 766 3,904 1,408 444April 1940............................................. ........ 774 3,610 1,355 480
AVERAGE PRICES OF LIVESTOCK(Per hundred pounds at Chicago)
Week Ended Months ofMay 24, April March April
1941 1941 1941 1940Native Beef Steers (average)........................... $10.00 $10.60 $10.80 $9.40Fat Cows and Heifers........................................ 9.20 9.20 9.00 7.90Calves.................................................................... 10.50 10.00 9.75 9.25Hogs (bulk of sales)............................ ............... 9.30 8.35 7.65 5.40Lambs.................................................... ............... 9.75 10.80 10.90 10.15
Digitized for FRASER http://fraser.stlouisfed.org/ Federal Reserve Bank of St. Louis
average for the week ended May 24 was $9.30 per hundredweight, and on several days the average reached $9.40. This was about $3.75 higher than the average for May of last year. Heavy purchases of pork and lard by the Department of Agriculture, as well as continued strong consumer demand, have been chief factors supporting hog prices in the past two months. Prices of slaughter cattle, particularly of the better grades, have been weak, while calves and feeder cattle have strengthened considerably. Hog marketings decreased slightly in April, while those of cattle and calves increased seasonally.
Production of packing-house commodities in the United States showed little change from March to April, while the tonnage sold declined slightly. Reflecting continued higher prices, dollar sales by major packing concerns increased slightly in April, and were as much as 43 per cent higher than last year. Foreign trade in meat products continued greatly reduced, although a substantial portion of the Government purchases may go to England. Latin American trade in April was generally quiet, although sales to Cuban buyers expanded considerably.
MEAT PACKING—UNITED STATESPer Cent Change in April 1941
fromApril
March April 1931-401941 1940 Avg.
Tonnage produced............................................................... —0.3 +7.0 +20.6Tonnage sold........................................................................ —3.4 +3.8 +16.8Dollar sales.......................................................................... +1.8 +24.6 +43.5Inventories, end of month................................................. +0.8 +25.3 +43.4
of the Government’s expenditures by taxation and one third by borrowing has been well received in investment circles. Moreover, the decision to do as much as possible of this borrowing by placing defense savings bonds with the public rather than with the commercial banks has been encouraging to bond holders.
Governments which had risen sharply during the second and third weeks of April have declined through the middle of May, marking time in anticipation of an offering of Government securities. The new 2y2 per cent Treasury bonds of 1952-54 series, brought out at par March 18 of this year, sold at a high of 104.6, May 14. The income from this series is subject to all Federal taxes.
After a four-week rise, railroad bonds in the more speculative group turned weak and sold at their levels prevailing in mid-April. The utility bond market has shown little activity and price changes have been small.
Treasury Financing—May 22, the Treasury announced for cash subscription at par the offering of $600,000,000 of 2y2 per cent bonds due 1956-58. The Treasury also offered holders of $834,000,000 of 3% per cent Treasury bonds due August 1 the privilege of exchanging them for additional amounts of the bonds now being offered for cash subscription, or for an additional issue of the % per cent Treasury notes of Series D 1943, dated March 15, 1941, and maturing March 15, 1943. The cash subscription books were closed the same day they opened, with a heavy over-subscription.
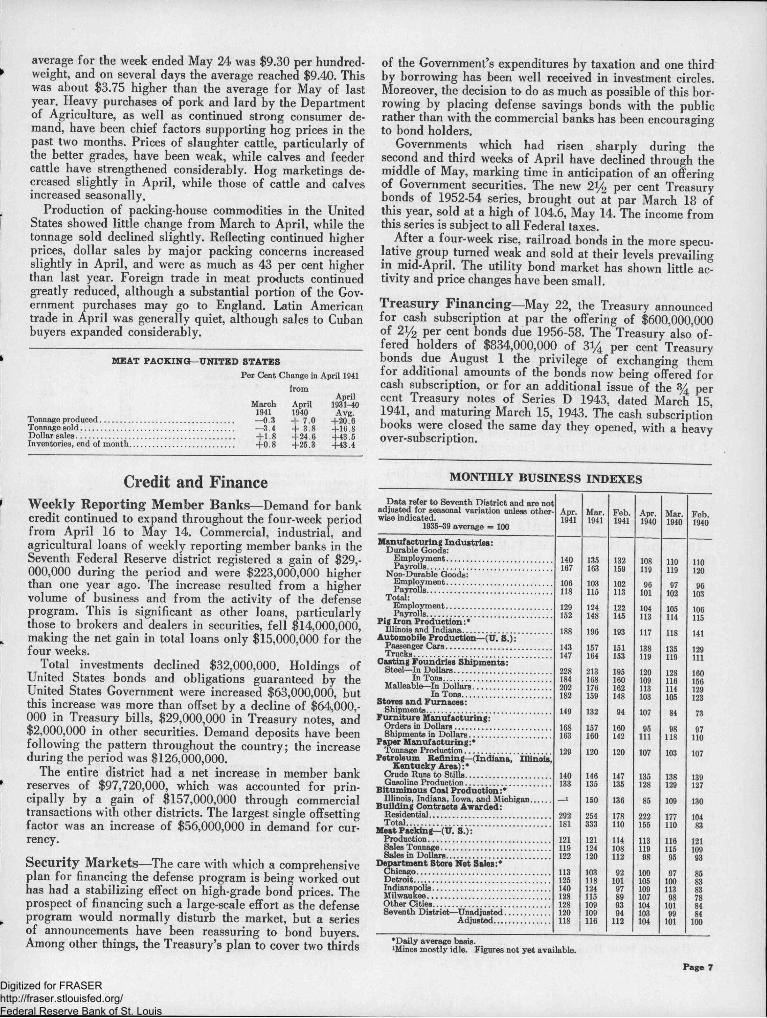
Credit and FinanceWeekly Reporting Member Banks—Demand for bank credit continued to expand throughout the four-week period from April 16 to May 14. Commercial, industrial, and agricultural loans of weekly reporting member banks in the Seventh Federal Reserve district registered a gain of $29,000,000 during the period and were $223,000,000 higher than one year ago. The increase resulted from a higher volume of business and from the activity of the defense program. This is significant as other loans, particularly those to brokers and dealers in securities, fell $14,000,000, making the net gain in total loans only $15,000,000 for the four weeks.
Total investments declined $32,000,000. Holdings of United States bonds and obligations guaranteed by the United States Government were increased $63,000,000, but this increase was more than offset by a decline of $64,000,000 in Treasury bills, $29,000,000 in Treasury notes, and $2,000,000 in other securities. Demand deposits have been following the pattern throughout the country; the increase during the period was $126,000,000.
The entire district had a net increase in member bank reserves of $97,720,000, which was accounted for principally by a gain of $157,000,000 through commercial transactions with other districts. The largest single offsetting factor was an increase of $56,000,000 in demand for currency.Security Markets—The care with which a comprehensive plan for financing the defense program is being worked out has had a stabilizing effect on high-grade bond prices. The prospect of financing such a large-scale effort as the defense program would normally disturb the market, but a series of announcements have been reassuring to bond buyers. Among other things, the Treasury’s plan to cover two thirds
MONTHLY BUSINESS INDEXES
Data refer to Seventh District and are not adjusted for seasonal variation unless otherwise indicated.
1935-39 average = 100
Manufacturing Industries:Durable Goode:
Employment.................................................Payrolls................................................... ’
Non-Durable Goods:Employment.................................................Payrolls.................................................... ’. ’
Total:Employment.................................................Payrolls...............................................
Pig Iron Production:*Illinois and Indiana.........................................
Automobile Production—(U. S.):Passenger Cars.................................................Trucks................................................................
Casting Foundries Shipments:Steel—In Dollars.............................................
In Tons..................................................Malleable—In Dollars....................................
In Tons..................................Stoves and Furnaces:
Shipments..........................................................Furniture Manufacturing:
Orders in Dollars.............................................Shipments in Dollars......................................
Paper Manufacturing:*Tonnage Production........................................
Petroleum Refining—(Indiana, Illinois, Kentucky Area): *
Crude Runs to Stills........................................Gasoline Production......................................
Bituminous Coal Production:*Dlinois, Indiana, Iowa, and Michigan.........
Building Contracts Awarded:Residential........................................................Total...................................................................
Meat Packing— (U. S.):Production.........................................................Sales Tonnage...................................................Sales in Dollars................................................
Department Store Net Sales:*Chicago..............................................................Detroit...............................................................Indianapolis.......................................................Milwaukee.........................................................Other Cities......................................................Seventh District—Unadjusted.....................
Adjusted..........................
Apr.1941
Mar.1941
Feb.1941
140 135 132167 163 159
106 103 102118 115 113
129 124 122152 148 145
188 196 193
143 157 151147 164 153
228 213 195184 168 160202 176 162182 159 148
149 132 94
168 157 160163 160 142
129 120 120
140 146 147133 135 135
_i 150 136
292 254 178181 333 110
121 121 114119 124 108122 120 112
113 103 92125 118 101140 124 97128 115 89128 109 93120 109 94118 116 112
Apr.1940
Mar.1940
Feb.1940
108 110 110119 119 12096 97 96
101 102 103
104 105 106113 114 115
117 118 141
138 135 129119 119 111
120 128 160109 116 156113 114 129103 105 123
107 84 73
95 98 97111 118 110
107 103 107
135 138 139128 129 127
85 109 130
222 177 104155 110 83
113 116 121119 115 10998 95 93
100 97 85105 100 83109 113 83107 98 78104 101 84103 99 84104 101 100
•Daily average basis.lMines mostly idle. Figures not yet available.
Page 7
Digitized for FRASER http://fraser.stlouisfed.org/ Federal Reserve Bank of St. Louis
Savings Bonds—A total of $257,646,000 from the first seventeen days’ sale of savings bonds has been turned into the Treasury by post offices and banks. These sales, covering the period from the opening of the defense savings program, May 1, to the close of business May 17, are made up of the following items: Series E bonds $61,658,000; Series F bonds $28,221,000; and Series G bonds $167,767,000.
Current EventsCharles B. Dunn, General Counsel to the Federal Reserve
Bank of Chicago, spoke before the American Corn Millers’ Federation at the Chicago Towers Club, May 14, on the subject, “The Federal Reserve System and the Present Monetary Situation.” Mr. Dunn also spoke before the Michigan Bankers Association, Group 9, at Ann Arbor, Michigan, May 19.
A. L. Olson, Assistant Vice President of the Bank, was invited to speak before the Chicago Association of Commerce, May 14, on the subject, “Defense Loans,” and before the Chamber of Commerce of Kalamazoo, Michigan, May 13, on the subject, “Defense Contracts.”
A. T. Sihler, Assistant Vice President in charge of the Fiscal Agency Department of the Federal Reserve Bank of Chicago, spoke on “The Savings Bond Program” before Group 8 of the Michigan Bankers Association at St. Joseph, Michigan, May 9, and before the bankers of the Southeastern section of Chicago at the Saddle and Sirloin Club, May 12. He also spoke on “Defense Financing” at a meeting of the Chamber of Commerce of Kalamazoo, Michigan, May 13.
Edward J. Pentis, Supervisor of the Registered Bond Division, spoke before the Czechoslovak Building and Loan League on the subject, “The Savings Bond Program.”
Official Appointments During MayThe Board of Directors of the Federal Reserve Bank of
Chicago, at its meeting May 22, approved the following changes in official titles and appointments to the official staff at the Federal Reserve Bank of Chicago, effective May 23:
Neil B. Dawes, Assistant Cashier, was appointed Assistant Vice President.Mark A. Lies, Chief of Service Departments, was appointed Assistant Cashier.W. R. Diercks, Chief Examiner, was given the additional title of Assistant Vice President.
New appointments at the Detroit Branch were:W. T. Cameron, Supervisor of Audits, was appointed Assistant Cashier.A. J. Wiegandt, Chief, Check Department, was appointed Assistant Cashier.
New Member BanksFive State banks in the Seventh Federal Reserve district
were admitted to the System in the period from April 15 to May 15, 1941. One primary organization, the Northwest National Bank of Chicago, was authorized, making a total of six new members. The entire number of Seventh district members is 879. Those recently admitted are:
Northwest National Bank of Chicago, Chicago, Illinois The State Bank of Andrews, Andrews, Indiana The Garrett State Bank, Garrett, Indiana The Hope State Bank, Hope, Indiana Commonwealth Bank, Detroit, Michigan Denmark State Bank, Denmark, Wisconsin
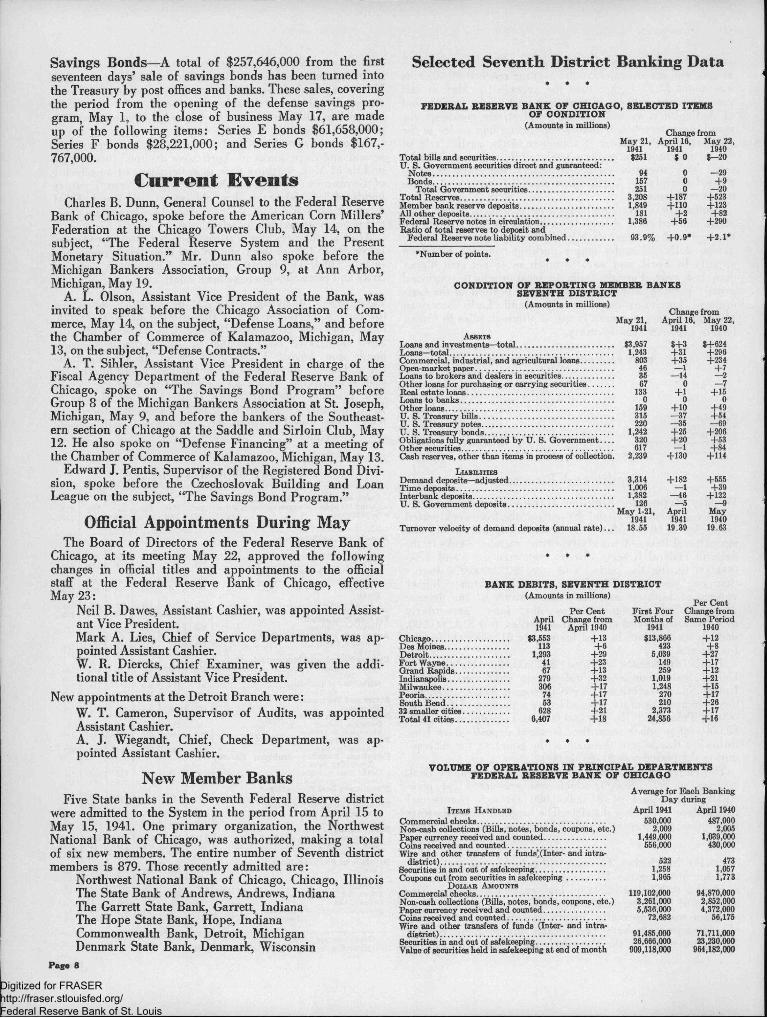
Selected Seventh District Banking Data* • •
FEDERAL RESERVE BANE OF CHICAGO, SELECTED ITEMS OF CONDITION
(Amounts in millions)
Total bills and securities.................................................U. S. Government securities direct and guaranteed:
Notes...............................................................................Bonds...............................................................................
Total Government securities..................................Total Reserves..................................................................Member bank reserve deposits......................................All other deposits.............................................................Federal Reserve notes in circulation............................Ratio of total reserves to deposit and
Federal Reserve note liability combined...............
Change fromfay 21, April 16, May 22,1941 1941 1940
$251 $ 0 $—20
94 0 —29157 0 +9251 0 —20
3,208 +187 +5231,849 +110 +123
181 +2 +821,386 +56 +290
93.9% +0.9* +2.1*
♦Number of points.
CONDITION OF REPORTING MEMBER BANES SEVENTH DISTRICT
(Amounts in millions)
Assets
Loans—total..........................................................................Commercial, industrial, and agricultural loans.............Open-market paper..............................................................Loans to brokers and dealers in securities......................Other loans for purchasing or carrying securities..........Real estate loans..................................................................Loans to banks.....................................................................Other loans............................................................................IT. S. Treasury bills.............................................................U. S. Treasury notes...........................................................U. S. Treasury bonds................................................ ........Obligations fully guaranteed by U. S. Government... Other securities.....................................................................
Liabilities
U. S. Government deposits.
Change fromMay 21, April 16, May 22,
1941 1941 1940
. $3,957 $+3 $+624. 1,243 +31 +296. 803 +35 +234. 46 —1 +7. 35 —14 —2. 67 0 —7. 133 +1 +15. 0 0 0. 159 +10 +49. 315 —37 +54. 220 —35 —69. 1,242 +25 +206. 320 +20 +53. 617 —1 +84. 2,239 +130 +114
. 3,314 +182 +555
. 1,006 —1 +39
. 1,382 —46 +122. 126 -5 —9May 1-21, April May
1941 1941 1940. 18.55 19.39 19.63
BANE DEBITS, SEVENTH DISTRICT(Amounts in millions)
Per Cent Change fromPer Cent First Four
April Change from Months of Same Period1941 April 1940 1941 1940
Chicago............................ .... $3,553 +13 $13,866 +12Dos Moines...................... .... 113 +8 423 +8Detroit............................. .... 1,293 +29 5,039 +27Fort Wayne..................... .... 41 +23 149 +17Grand Rapids................. .... 67 +13 259 +12Indianapolis..................... .... 279 +32 1,019 +21Milwaukee....................... ....... 306 +17 1,248 +15Peoria............................... .... 74 +17 270 +17South Bend..................... ....... 63 +17 210 +2632 smaller cities.............. .... 628 +21 2,373 +17Total 41 cities................. .... 8,407
*
+18
• *
24,858 +16
VOLUME OF OPERATIONS IN PRINCIPAL DEPARTMENTS FEDERAL RESERVE BANE OF CHICAGO
Average for Each Banking Day during
Items Handled April 1941 April 1940Commercial checks............................................. 530,000 487,000Non-cash collections (Bills, notes, bonds, coupons, etc.) 2,009 2,005Paper currency received and counted............. 1,449,000 1,039,000Coins received and counted............... 556,000 430,000Wire and other transfers of funds*(Inter- and intra
district) ....................................... 522 473Securities in and out of safekeeping.................. 1,258 1,057Coupons cut from securities in safekeeping... 1,965 1,773
Dollar Amounts
Commercial checks............................................. 119,102,000 94,870,000Non-cash collections (Bills, notes, bonds, coupons, etc.) 3,261,000 2,852,000Paper currency received and counted.............. 5,536,000 4,372,000Coins received and counted............................... 72,682 56,175Wire and other transfers of funds (Inter- and intra
district).............................................................. 91,485,000 71,711,000Securities in and out of safekeeping................. 26,666,000 23,230,000Value of securities held in safekeeping at end of month 909,118,000 964,182,000
Page 8
Digitized for FRASER http://fraser.stlouisfed.org/ Federal Reserve Bank of St. Louis
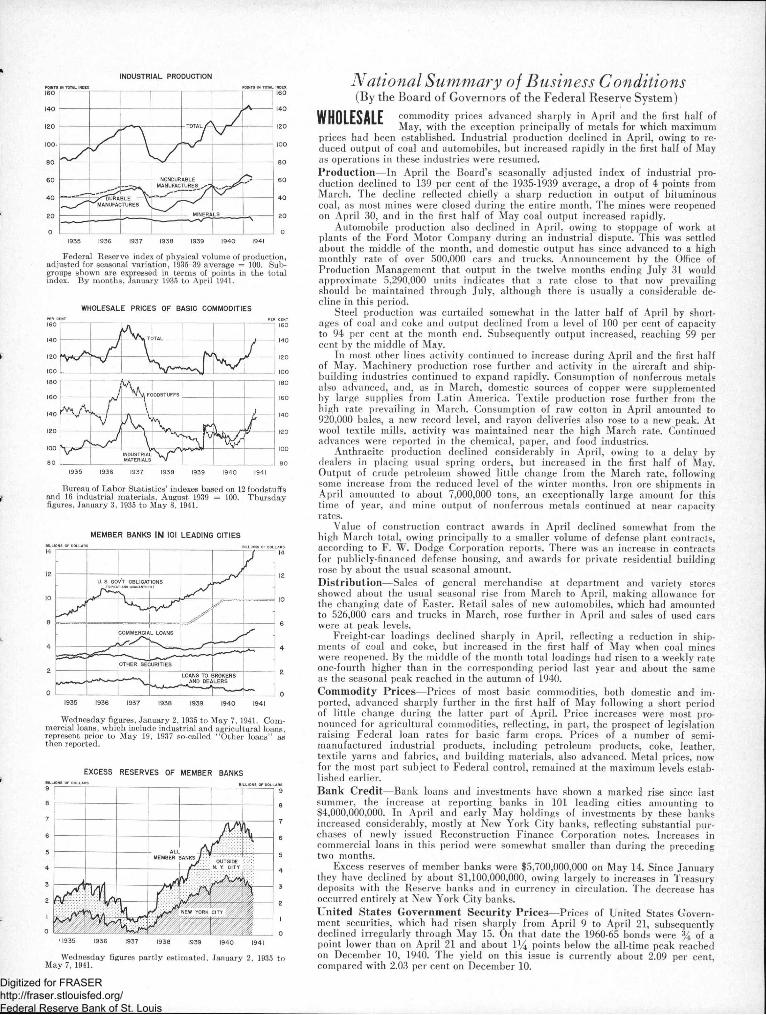
INDUSTRIAL PRODUCTION
TOTAL
NONDURABLEMANUFACTURES
.✓"DURABLE - MANUFACTURES
MINERALS
Federal Reserve index of physical volume of production, adjusted for seasonal variation, 1935-39 average = 100. Subgroups shown are expressed in terms of points in the total index. By months, January 1935 to April 1941.
WHOLESALE PRICES OF BASIC COMMODITIES
Bureau of Labor Statistics’ indexes based on 12 foodstuffs and 16 industrial materials, August 1939 = 100. Thursday figures, January 3, 1935 to May 8, 1941.
MEMBER BANKS IN 101 LEADING CITIES
J 0
Wednesday figures, January 2, 1935 to May 7, 1941. Commercial loans, which include industrial and agricultural loans, represent prior to May 19, 1937 so-called “Other loans” as then reported.
EXCESS RESERVES OF MEMBER BANKS
NEW YORK CITY
Wednesday figures partly estimated, January 2, 1935 to May 7, 1941.
National Summary of Business Conditions(By the Board of Governors of the Federal Reserve System)
WHOLESALE commodity prices advanced sharply in April and the first half ofMay, with the exception principally of metals for which maximum prices had been established. Industrial production declined in April, owing to reduced output of coal and automobiles, but increased rapidly in the first half of May as operations in these industries were resumed.Production—In April the Board’s seasonally adjusted index of industrial production declined to 139 per cent of the 1935-1939 average, a drop of 4 points from March. The decline reflected chiefly a sharp reduction in output of bituminous coal, as most mines were closed during the entire month. The mines were reopened on April 30, and in the first half of May coal output increased rapidly.
Automobile production also declined in April, owing to stoppage of work at plants of the Ford Motor Company during an industrial dispute. This was settled about the middle of the month, and domestic output has since advanced to a high monthly rate of over 500,000 cars and trucks. Announcement by the Office of Production Management that output in the twelve months ending July 31 would approximate 5,290,000 units indicates that a rate close to that now prevailing should be maintained through July, although there is usually a considerable decline in this period.
Steel production was curtailed somewhat in the latter half of April by shortages of coal and coke and output declined from a level of 100 per cent of capacity to 94 per cent at the month end. Subsequently output increased, reaching S9 per cent by the middle of May.
In most other lines activity continued to increase during April and the first half of May. Machinery production rose further and activity in the aircraft and shipbuilding industries continued to expand rapidly. Consumption of nonferrous metals also advanced, and, as in March, domestic sources of copper were supplemented by large supplies from Latin America. Textile production rose further from the high rate prevailing in March. Consumption of raw cotton in April amounted to 920,000 bales, a new record level, and rayon deliveries also rose to a new peak. At wool textile mills, activity was maintained near the high March rate. Continued advances were reported in the chemical, paper, and food industries.
Anthracite production declined considerably in April, owing to a delay by dealers in placing usual spring orders, but increased in the first half of May. Output of crude petroleum showed little change from the March rate, following some increase from the reduced level of the winter months. Iron ore shipments in April amounted to about 7,000,000 tons, an exceptionally large amount for this time of year, and mine output of nonferrous metals continued at near capacity rates.
Value of construction contract awards in April declined somewhat from the high March total, owing principally to a smaller volume of defense plant contracts, according to F. W. Dodge Corporation reports. There was an increase in contracts for publicly-financed defense housing, and awards for private residential building rose by about the usual seasonal amount.Distribution—Sales of general merchandise at department and variety stores showed about the usual seasonal rise from March to April, making allowance for the changing date of Easter. Retail sales of new automobiles, which had amounted to 526,000 cars and trucks in March, rose further in April and sales of used cars were at peak levels.
Freight-car loadings declined sharply in April, reflecting a reduction in shipments of coal and coke, but increased in the first half of May when coal mines were reopened. By the middle of the month total loadings had risen to a weekly rate one-fourth higher than in the corresponding period last year and about the same as the seasonal peak reached in the autumn of 1940.Commodity Prices—Prices of most basic commodities, both domestic and imported, advanced sharply further in the first half of May following a short period of little change during the latter part of April. Price increases were most pronounced for agricultural commodities, reflecting, in part, the prospect of legislation raising Federal loan rates for basic farm crops. Prices of a number of semimanufactured industrial products, including petroleum products, coke, leather, textile yams and fabrics, and building materials, also advanced. Metal prices, now for the most part subject to Federal control, remained at the maximum levels established earlier.Bank Credit—Bank loans and investments have shown a marked rise since last summer, the increase at reporting banks in 101 leading cities amounting to $4,000,000,000. In April and early May holdings of investments by these banks increased considerably, mostly at New York City banks, reflecting substantial purchases of newly issued Reconstruction Finance Corporation notes. Increases in commercial loans in this period were somewhat smaller than during the preceding two months.
Excess reserves of member banks were $5,700,000,000 on May 14. Since January they have declined by about $1,100,000,000, owing largely to increases in Treasury deposits with the Reserve banks and in currency in circulation. The decrease has occurred entirely at New York City banks.United States Government Security Prices—Prices of United States Government securities, which had risen sharply from April 9 to April 21, subsequently declined irregularly through May 15. On that date the 1960-65 bonds were % of a point lower than on April 21 and about 1 % points below the all-time peak reached on December 10, 1940. The yield on this issue is currently about 2.09 per cent, compared with 2.03 per cent on December 10.
Digitized for FRASER http://fraser.stlouisfed.org/ Federal Reserve Bank of St. Louis
SEVENTH FEDERAL
IDWA
ILL • IND
RESERVE DISTRICT
Digitized for FRASER http://fraser.stlouisfed.org/ Federal Reserve Bank of St. Louis
Related Documents