Bulk f low strength of forsterite–enstatite composites as a function of forsterite content Shaocheng Ji a, * , Zichao Wang a , Richard Wirth b a De ´partement des Ge ´nies Civil, Ge ´ologique et des Mines, E ´ cole Polytechnique de Montre ´al, C.P. 6709, Succursale Centre-Ville, Montre ´al, Que ´bec, Canada H3C 1J4 b GFZ-Potsdam, Telegrafenberg, D-14473, Potsdam, Germany Received 20 January 2000; accepted 28 August 2001 Abstract Creep experiments have been conducted to investigate the effect of varying forsterite content (V Fo ) on the bulk flow strength of dry forsterite – enstatite (Fo – En) aggregates in order to evaluate the applicability of existing theoretical models to two-phase rocks, as well as to understand the rheology of polyphase systems in general. The experiments were performed at temperatures of 1423 – 1593 K, stresses of 18 – 100 MPa, oxygen fugacities of 10 14 –10 2.5 MPa and 0.1 MPa total pressure. The fine-grained (Fo: 10–17 mm; En: 14–31 mm) composites of various Fo volume fractions (V Fo = 0, 0.2, 0.4, 0.5, 0.6, 0.8 and 1) were synthesized by isostatically hot-pressing in a gas-medium apparatus at 1523 and 350 MPa. Our experiments show that flow strength contrasts between Fo and En are in the range of 3 – 8 at the given experimental conditions, with Fo as the stronger phase. The measured stress exponent (n) and activation energy ( Q) values of the Fo – En composites fall between those of the end- members. The n values show a nearly linear increase from 1.3 to 2.0, while the Q values display a non-linear increase from 472 to 584 kJ/mol with En volume fraction from 0 to 1.0. There is no clear dependence of creep rates on oxygen fugacity for the Fo – En composites. The mechanical data and TEM microstructural observations suggest no change in deformation mechanism of each phase when in the composites, compared to when in a single-phase aggregate, the En deformed mainly by dislocation creep while the Fo deformed by dislocation-accommodated diffusion creep for our grain sizes and experimental conditions. Comparisons between the measured composite strengths and various theoretical models indicate that none of the existing theoretical models can give a precise predication over the entire V Fo range from 0 to 1. However, the theoretical models based on weak-phase supported structures (WPS) yield a good prediction for the flow strengths of the composites with V Fo < 0.4, while those based on strong-phase supported structures (SPS) are better for the composites with V Fo >0.6. No model gives a good prediction for the bulk strength of two-phase composites in the transitional regime (V Fo = 0.4 – 0.6). Applications of the WPS- and SPS-based models in the transitional regime result in under- and over-estimations for the composite flow strength, respectively. Thus, the effect of rock microstructure should be taken into consideration in modeling the bulk flow strengths of the crust and upper mantle using laboratory-determined flow laws of single-phase aggregates. D 2001 Elsevier Science B.V. All rights reserved. Keywords: Forsterite – enstatite composites; Flow strength; Plasticity; Rheology; Upper mantle 0040-1951/01/$ - see front matter D 2001 Elsevier Science B.V. All rights reserved. PII:S0040-1951(01)00191-3 * Corresponding author. Fax: +1-514-3403970. E-mail address: [email protected] (S. Ji). www.elsevier.com/locate/tecto Tectonophysics 341 (2001) 69 – 93

Welcome message from author
This document is posted to help you gain knowledge. Please leave a comment to let me know what you think about it! Share it to your friends and learn new things together.
Transcript
Bulk f low strength of forsterite–enstatite composites as a
function of forsterite content
Shaocheng Ji a,*, Zichao Wang a, Richard Wirth b
aDepartement des Genies Civil, Geologique et des Mines, Ecole Polytechnique de Montreal, C.P. 6709, Succursale Centre-Ville,
Montreal, Quebec, Canada H3C 1J4bGFZ-Potsdam, Telegrafenberg, D-14473, Potsdam, Germany
Received 20 January 2000; accepted 28 August 2001
Abstract
Creep experiments have been conducted to investigate the effect of varying forsterite content (VFo) on the bulk flow strength
of dry forsterite–enstatite (Fo–En) aggregates in order to evaluate the applicability of existing theoretical models to two-phase
rocks, as well as to understand the rheology of polyphase systems in general. The experiments were performed at temperatures of
1423–1593 K, stresses of 18–100 MPa, oxygen fugacities of 10� 14–10� 2.5 MPa and 0.1 MPa total pressure. The fine-grained
(Fo: 10–17 mm; En: 14–31 mm) composites of various Fo volume fractions (VFo = 0, 0.2, 0.4, 0.5, 0.6, 0.8 and 1) were
synthesized by isostatically hot-pressing in a gas-medium apparatus at 1523 and 350 MPa. Our experiments show that flow
strength contrasts between Fo and En are in the range of 3–8 at the given experimental conditions, with Fo as the stronger phase.
The measured stress exponent (n) and activation energy (Q) values of the Fo–En composites fall between those of the end-
members. The n values show a nearly linear increase from 1.3 to 2.0, while the Q values display a non-linear increase from 472 to
584 kJ/mol with En volume fraction from 0 to 1.0. There is no clear dependence of creep rates on oxygen fugacity for the Fo–En
composites. The mechanical data and TEM microstructural observations suggest no change in deformation mechanism of each
phase when in the composites, compared to when in a single-phase aggregate, the En deformed mainly by dislocation creep while
the Fo deformed by dislocation-accommodated diffusion creep for our grain sizes and experimental conditions. Comparisons
between the measured composite strengths and various theoretical models indicate that none of the existing theoretical models
can give a precise predication over the entire VFo range from 0 to 1. However, the theoretical models based on weak-phase
supported structures (WPS) yield a good prediction for the flow strengths of the composites with VFo < 0.4, while those based on
strong-phase supported structures (SPS) are better for the composites with VFo >0.6. No model gives a good prediction for the
bulk strength of two-phase composites in the transitional regime (VFo = 0.4–0.6). Applications of the WPS- and SPS-based
models in the transitional regime result in under- and over-estimations for the composite flow strength, respectively. Thus, the
effect of rock microstructure should be taken into consideration in modeling the bulk flow strengths of the crust and upper mantle
using laboratory-determined flow laws of single-phase aggregates. D 2001 Elsevier Science B.V. All rights reserved.
Keywords: Forsterite–enstatite composites; Flow strength; Plasticity; Rheology; Upper mantle
0040-1951/01/$ - see front matter D 2001 Elsevier Science B.V. All rights reserved.
PII: S0040-1951 (01 )00191 -3
* Corresponding author. Fax: +1-514-3403970.
E-mail address: [email protected] (S. Ji).
www.elsevier.com/locate/tecto
Tectonophysics 341 (2001) 69–93
1. Introduction
The continuity and interconnectivity of constitutive
minerals play an important role in the rheological
behavior of rocks (Burg and Wilson, 1987; Jordan,
1988; Handy, 1994). The drastic decrease in bulk flow
strength with a transition from strong-phase supported
structure (SPS) to weak-phase supported structure
(WPS) is considered to be critical phenomenon in the
rheology of two-phase rocks (Arzi, 1978; Gilotti,
1992; Rutter and Neumann, 1995). What is the critical
weak-phase fraction at which such a transition takes
place in a solid two-phase composite? To what extent
does the flow strength drop after the critical weak-
phase fraction has reached? Does deformation mech-
anism of each phase change when in the composite as
compared to when it is in a single-phase aggregate? If
there is no change in deformation mechanism of each
phase due to the phase mixing, how precisely can we
predict variations of the flow properties of two-phase
composites as a function of the volume fractions,
phase continuities and flow laws of the end-members
using existent theoretical models? In this study, high-
temperature creep experiments were performed on
forsterite–enstatite (Fo–En) composites and the ex-
perimental results were carefully compared with the
theoretical models, in an attempt to answer the above
questions.
Three main factors lead us to choose the olivine–
orthopyroxene system as a model composite. First,
olivine and orthopyroxene are two major mineral
phases stable in the Earth’s upper mantle above the
transition zone. To a first approximation, the rheology
of the upper mantle can be represented by that of
olivine–orthopyroxene composites. The knowledge
of the rheological properties of the upper mantle is
important for understanding a wide range of tectonic
processes, such as convection of the upper mantle and
subduction of lithospheric slabs. Second, the high
temperature plasticity of both olivine and orthopyr-
oxene have been extensively studied by many
researchers (see Darot and Gueguen, 1981; Relan-
deau, 1981; Karato et al., 1986; Bai et al., 1991;
Kohlstedt et al., 1995 for a review). Accurate knowl-
edge of the plasticity of the end-members is necessary
for testing the relevance of the mixture rules used for
the prediction of composite flow strength. Third,
Hitchings et al. (1989) reported that olivine–ortho-
pyroxene aggregates are weaker than the end-mem-
bers, although Daines and Kohlstedt (1996) and
McDonnell et al. (2000) found that no significant
difference in flow strength between olivine–orthopyr-
oxene aggregates with orthopyroxene contents up to
20 vol.%. Bruhn et al. (1999) documented a signifi-
cant rheological weakening for calcite–anhydrite
(50:50) composites compared to end-member flow
strengths. Such a rheological weakening for a two-
phase mixture violates most of the mixing rules in the
literature of material sciences assuming no change in
deformation mechanism of each phase when in the
composites as compared to when a single-phase
aggregate. Bruhn et al. (1999) attributed the observed
weakening to operation of deformation mechanisms
in the mixture that are not operative in the end-mem-
ber aggregates (e.g., more rapid diffusion along phase
boundaries than along grain boundaries). A sys-
tematic investigation is thus needed to verify if such
behavior occurs in composites other than calcite–
anhydrite one.
2. Experimental technique and procedure
2.1. Forsterite–enstatite composite samples
Forsterite (Mg2SiO4) is stable up to its melting
temperature (Tm =� 2173 K) at 0.1 MPa pressure.
Enstatite (MgSiO3) may undergo several structural
phase transformations with temperature (T ) and pres-
sure (P). At P= 0.1 MPa, the enstatite has a protoen-
statite structure at high T (>1273 K) and an ortho-
enstatite structure at low T (923–1273 K) (Anastasiou
and Seifert, 1972). The orthoenstatite may revert to
clinoenstatite upon quenching to ambient conditions.
The Fo–En composite samples used in this study were
prepared through a two-stage sintering–hot pressing
technique. No water was added into the samples during
either stage of the hot pressing. We first synthesized Fo
and En separately in a box furnace at temperatures
close to 0.8–0.9Tm of the En (Tm =� 1813 K) and Fo,
respectively, using chemical compounds MgO and
SiO2 as starting materials. Sintered products were
examined by using X-ray powder diffraction. The Fo
was identified by well-established diffraction peaks,
but the diffraction pattern of En was complicated with
peaks for both clinoenstatite and protoenstatite. The
S. Ji et al. / Tectonophysics 341 (2001) 69–9370
clinoenstatite may have formed during cooling. We
assume that the protoenstatite is the dominant phase
during high temperature deformation based on the
phase diagram of Presnall (1995).
Synthetic Fo and En powders were crushed, ground
in an agate mill, and sieved to produce fine-grained
powders with grain sizes smaller than 60 mm. Fine-
grained ( < 10 mm) powders, which were used as start-
ing material for producing Fo–En composites, were
obtained by settling in distilled water. The Fo and En
powders were then mixed mechanically, with forsterite
volume fractions (VFo) of 0 (Fo0), 0.2 (Fo20), 0.4
(Fo40), 0.5 (Fo50), 0.6 (Fo60), 0.8 (Fo80), and 1.0
(Fo100, first in ethanol for 24–30 h and then in a
motor-driven agate mill for about 48 h. The mixed two-
phase powder was dried for at least 72 h at 423 K before
being cold-pressed into Ni cans (25 mm in length, 15
mm in diameter). The cold-pressed samples were
finally isostatic ally hot-pressed at 1523 K and 350
MPa for 5 h in an internally heated gas-medium
apparatus using argon as the confining medium
(GFZ-Potsdam, Germany). During the hot-pressing,
the oxygen was buffered at Ni–NiO by oxidation of
the Ni can.
After hot-pressing, the composite samples were
examined with optical microscopy, scanning electron
microscopy (SEM), transmission electron microscopy
(TEM) and powder X-ray diffraction. The synthetic
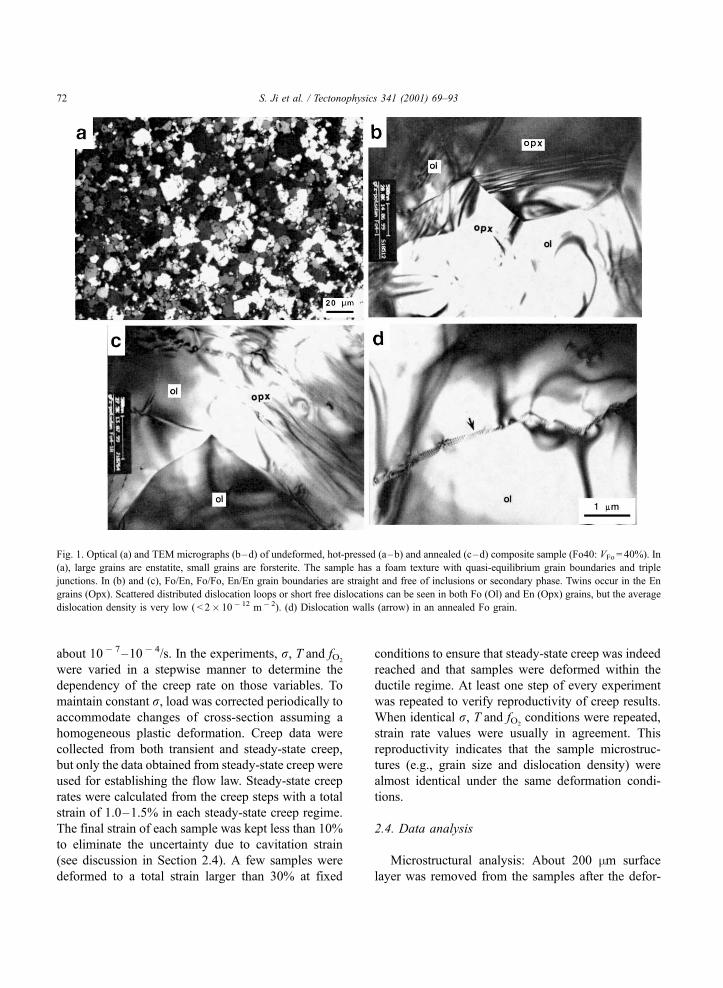
composite samples, in general, showed a granular
texture with quasi-equilibrium grain boundaries (Fig.
1a–b). Both Fo and En phases are homogeneously
distributed. We did not observe clusters of either En or
Fo phase at optical scale. TEM observations showed
neither melt pockets in triple junctions nor melt films
along the Fo/En, Fo/Fo or En/En grain boundaries. The
boundaries are straight and clean (Fig. 1b). Most of the
Fo/Fo and En/En grain boundaries are coherent and
high-angle, suggesting that the synthesis and compac-
tion of samples were well done. The En grains often
contain growth twins (Fig. 1b), which are believed to
form during the quenching. Scattered distributed dis-
location loops or short free dislocations can be seen in
both Fo and En grains (Fig. 1b), but the average
dislocation density is very low ( < 2� 1012 m � 2).
Sample densities were measured using Archimedes’
method. The densities of both Fo and En were con-
sistent to within 1% of the theoretical densities. The
theoretical densities of composites were calculated
from the densities of single crystal Fo and En and their
volume fractions according to the following equation:
qc ¼ VFoqFo þ ð1� VFoÞqEn ð1Þ
where V and q are the volume fraction and density,
respectively; the subscript c denotes the composite;
qFo = 3221 kg/m3 and qEn = 3198 kg/m3 (Bass, 1995).
The initial porosities of samples were estimated to lie
within the range of 0.5–1.2%.
Samples, for creep tests, were cut from the bulk hot-
pressed samples and were rectangular in shape with
typical dimensions of 3� 3� 6 mm3. Two end faces
of the specimen, polished with 1 mm diamond paste,
were optically reflective and parallel within 2 mm.
2.2. Experimental apparatus
The apparatus used is a high resolution 0.1-MPa
creep rig, newly setup in the Laboratory of Tectono-
physics, Ecole Polytechnique de Montreal. Stress was
applied via two silicon carbide (SiC) pistons, for
which plastic deformation was negligible under the
conditions of this study. Sample shortening was
monitored using two linear variable differential trans-
formers (LVDTs) attached to the pistons. The LVDT
has a nominal full range of ± 3.0 mm with a resolution
of 0.2 mm. Temperature was monitored by two R-type
(Pt/Pt–13% Rh) thermocouples located within 5 mm
of the sample and could be controlled to ± 0.5 K.
Thermal profiling indicated that temperature gradients
were less than 0.5 K /mm along vertical and horizontal
directions. The oxygen fugacity ( fO2) was varied by
flowing a CO/CO2 mixture with different ratios and
monitored with a solid electrolyte, zirconia-based
sensor. From the uncertainties in measuring displace-
ment, load, sample dimensions, and temperature, the
uncertainties in measuring stress and strain are esti-
mated within ± 0.1 MPa and ± 0.01%, respectively,
by applying the error propagating theory.
2.3. Experimental procedure
Deformation experiments were performed in a
constant load mode (creep test) under the conditions
of T= 1423–1593 K (0.78–0.88Tm for En and 0.65–
0.73Tm for Fo), P= 0.1 MPa and fO2= 10� 14–10� 2.5
MPa. Applied compressive stresses (r) were varied in
the range of 18–100 MPa, yielding strain rates ( _e) of
S. Ji et al. / Tectonophysics 341 (2001) 69–93 71
about 10� 7–10� 4/s. In the experiments, r, T and fO2
were varied in a stepwise manner to determine the
dependency of the creep rate on those variables. To
maintain constant r, load was corrected periodically toaccommodate changes of cross-section assuming a
homogeneous plastic deformation. Creep data were
collected from both transient and steady-state creep,
but only the data obtained from steady-state creep were
used for establishing the flow law. Steady-state creep
rates were calculated from the creep steps with a total
strain of 1.0–1.5% in each steady-state creep regime.
The final strain of each sample was kept less than 10%
to eliminate the uncertainty due to cavitation strain
(see discussion in Section 2.4). A few samples were
deformed to a total strain larger than 30% at fixed
conditions to ensure that steady-state creep was indeed
reached and that samples were deformed within the
ductile regime. At least one step of every experiment
was repeated to verify reproductivity of creep results.
When identical r, T and fO2conditions were repeated,
strain rate values were usually in agreement. This
reproductivity indicates that the sample microstruc-
tures (e.g., grain size and dislocation density) were
almost identical under the same deformation condi-
tions.
2.4. Data analysis
Microstructural analysis: About 200 mm surface
layer was removed from the samples after the defor-
Fig. 1. Optical (a) and TEM micrographs (b–d) of undeformed, hot-pressed (a–b) and annealed (c–d) composite sample (Fo40: VFo = 40%). In
(a), large grains are enstatite, small grains are forsterite. The sample has a foam texture with quasi-equilibrium grain boundaries and triple
junctions. In (b) and (c), Fo/En, Fo/Fo, En/En grain boundaries are straight and free of inclusions or secondary phase. Twins occur in the En
grains (Opx). Scattered distributed dislocation loops or short free dislocations can be seen in both Fo (Ol) and En (Opx) grains, but the average
dislocation density is very low ( < 2� 10� 12 m� 2). (d) Dislocation walls (arrow) in an annealed Fo grain.
S. Ji et al. / Tectonophysics 341 (2001) 69–9372
mation. The new surface was polished to 1 mm with
diamond lapping film. To reveal grain boundaries,
deformed samples were first chemically etched in acid
(HF:H2O= 1:2) at room temperature, then thermally
etched at 1173–1273 K for 10–30 h. Optical micro-
scopy and SEM were used to characterize grain size
and texture of samples.
Mechanical data analysis: Previous studies of syn-
thetic polycrystalline aggregates deformed in a similar
0.1 MPa rig indicated that cavitation strain becomes
significant at creep strains larger than about 10% (Li et
al., 1996; Kohlstedt et al., 2000). In this study, we also
observed a decrease in density by 1–2% for samples
deformed to total strain of � 10%, which we attributed
to the cavitation. To remove cavitation effects from the
creep data, we corrected all the data based on the theory
and procedure proposed by Raj (1982):
ecreep ¼ emeasured � ecavitation ð2Þ
where ecavitation = 1/3 (Dq/q0), and Dq is the differ-
ence in density (Dq = q0� q). Here the bulk densities
before (q0) and after deformation (q) can be measured
precisely so that the strain rate can be corrected
accordingly.
After correcting for the cavitation strain, the data of
steady-state creep were analyzed using a flow law of
the form:
_e ¼ Arnd�pfqO2exp � Q
RT
� �ð3Þ
where Q is the activation energy, A is a material
parameter, and n, p and q are the stress, grain size (d )
and oxygen fugacity exponents, respectively. In this
study, the creep parameters such as n, Q and q were
determined using multiple variable linear regression.
The error in the best fit is given by the standard
deviation.
3. Experimental results
3.1. Grain growth and microstructures of hot-pressed
samples
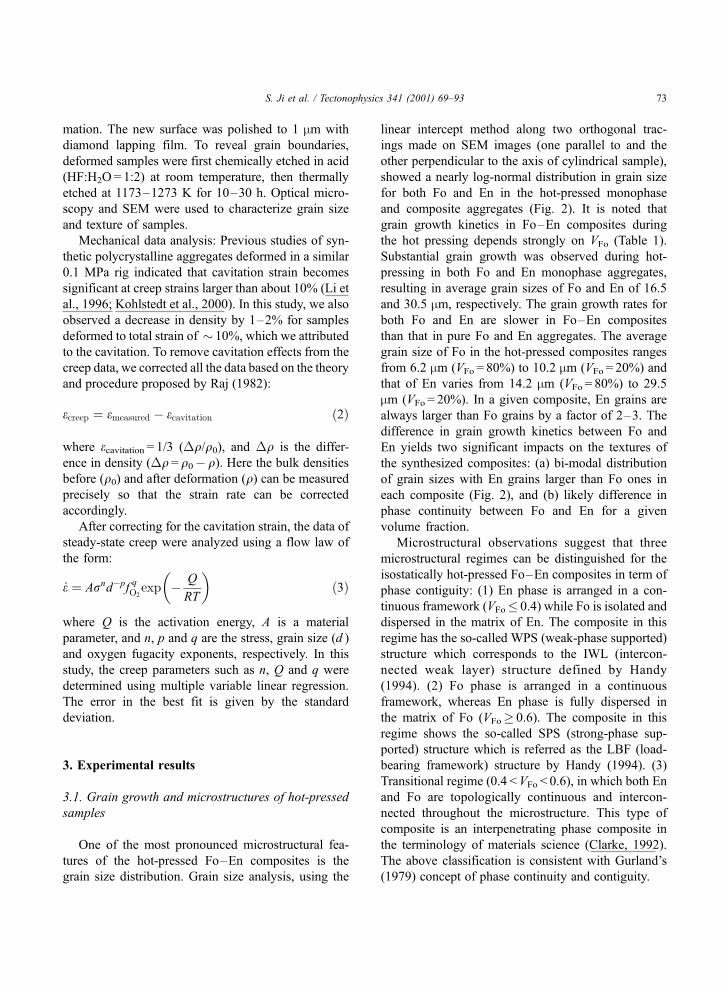
One of the most pronounced microstructural fea-
tures of the hot-pressed Fo–En composites is the
grain size distribution. Grain size analysis, using the
linear intercept method along two orthogonal trac-
ings made on SEM images (one parallel to and the
other perpendicular to the axis of cylindrical sample),
showed a nearly log-normal distribution in grain size
for both Fo and En in the hot-pressed monophase
and composite aggregates (Fig. 2). It is noted that
grain growth kinetics in Fo–En composites during
the hot pressing depends strongly on VFo (Table 1).
Substantial grain growth was observed during hot-
pressing in both Fo and En monophase aggregates,
resulting in average grain sizes of Fo and En of 16.5
and 30.5 mm, respectively. The grain growth rates for
both Fo and En are slower in Fo–En composites
than that in pure Fo and En aggregates. The average
grain size of Fo in the hot-pressed composites ranges
from 6.2 mm (VFo = 80%) to 10.2 mm (VFo = 20%) and
that of En varies from 14.2 mm (VFo = 80%) to 29.5
mm (VFo = 20%). In a given composite, En grains are
always larger than Fo grains by a factor of 2–3. The
difference in grain growth kinetics between Fo and
En yields two significant impacts on the textures of
the synthesized composites: (a) bi-modal distribution
of grain sizes with En grains larger than Fo ones in
each composite (Fig. 2), and (b) likely difference in
phase continuity between Fo and En for a given
volume fraction.
Microstructural observations suggest that three
microstructural regimes can be distinguished for the
isostatically hot-pressed Fo–En composites in term of
phase contiguity: (1) En phase is arranged in a con-
tinuous framework (VFo� 0.4) while Fo is isolated and
dispersed in the matrix of En. The composite in this
regime has the so-called WPS (weak-phase supported)
structure which corresponds to the IWL (intercon-
nected weak layer) structure defined by Handy
(1994). (2) Fo phase is arranged in a continuous
framework, whereas En phase is fully dispersed in
the matrix of Fo (VFo 0.6). The composite in this
regime shows the so-called SPS (strong-phase sup-
ported) structure which is referred as the LBF (load-
bearing framework) structure by Handy (1994). (3)
Transitional regime (0.4 <VFo < 0.6), in which both En
and Fo are topologically continuous and intercon-
nected throughout the microstructure. This type of
composite is an interpenetrating phase composite in
the terminology of materials science (Clarke, 1992).
The above classification is consistent with Gurland’s
(1979) concept of phase continuity and contiguity.
S. Ji et al. / Tectonophysics 341 (2001) 69–93 73
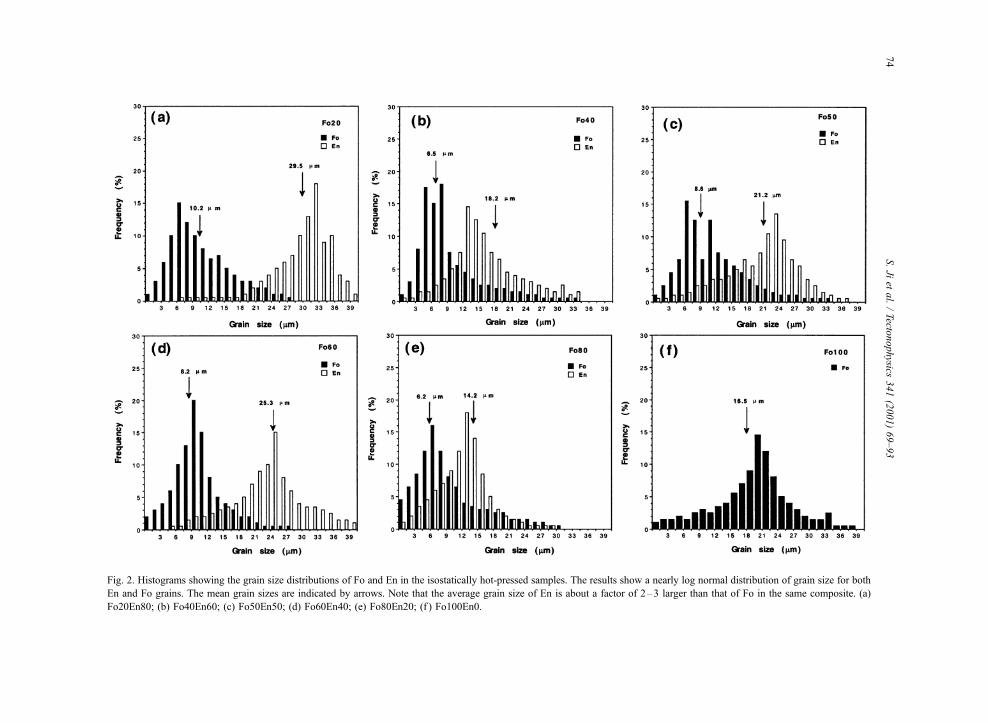
Fig. 2. Histograms showing the grain size distributions of Fo and En in the isostatically hot-pressed samples. The results show a nearly log normal distribution of grain size for both
En and Fo grains. The mean grain sizes are indicated by arrows. Note that the average grain size of En is about a factor of 2–3 larger than that of Fo in the same composite. (a)
Fo20En80; (b) Fo40En60; (c) Fo50En50; (d) Fo60En40; (e) Fo80En20; (f ) Fo100En0.
S.Ji
etal./Tecto
nophysics
341(2001)69–93
74
3.2. Mechanical data
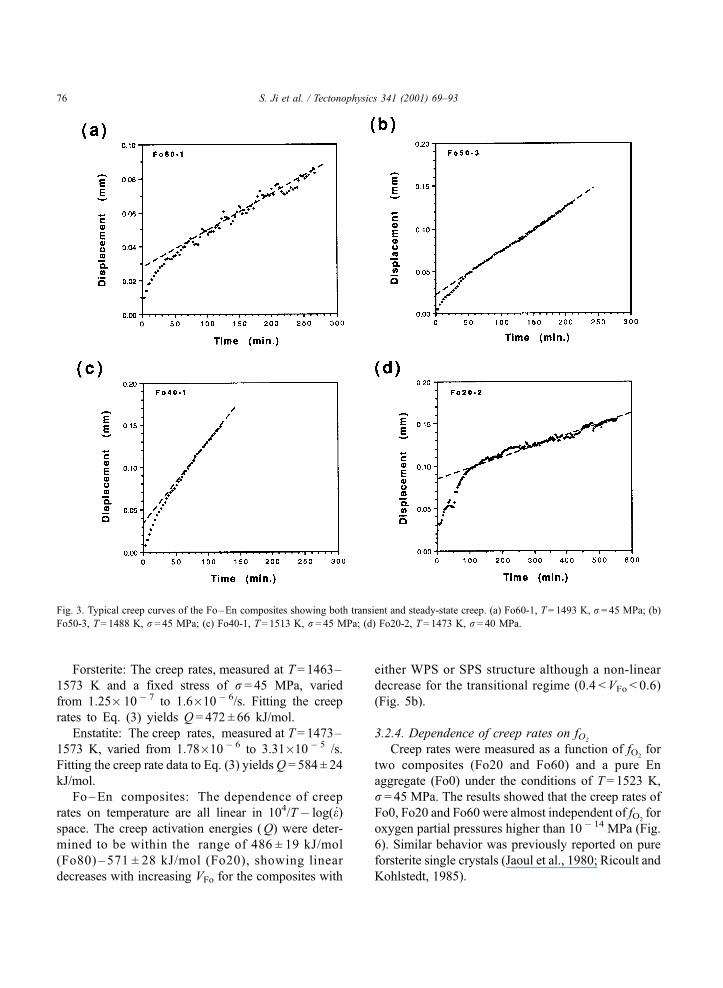
3.2.1. Creep curves
Two-stage creep (i.e., transient and steady-state
creep) was generally observed for the Fo–En com-
posites. The composites with VFo < 80% showed a
markedly transient creep regime during which the
strain rate decreases with time (Fig. 3). Steady-state
creep was reached only after a certain amount of
transient strain (� 0.1–1.1%). Under the conditions
of our experiments, most of the Fo–En composites
showed completely ductile behavior and no creep
acceleration was observed even at total creep strain
as high as 30%.
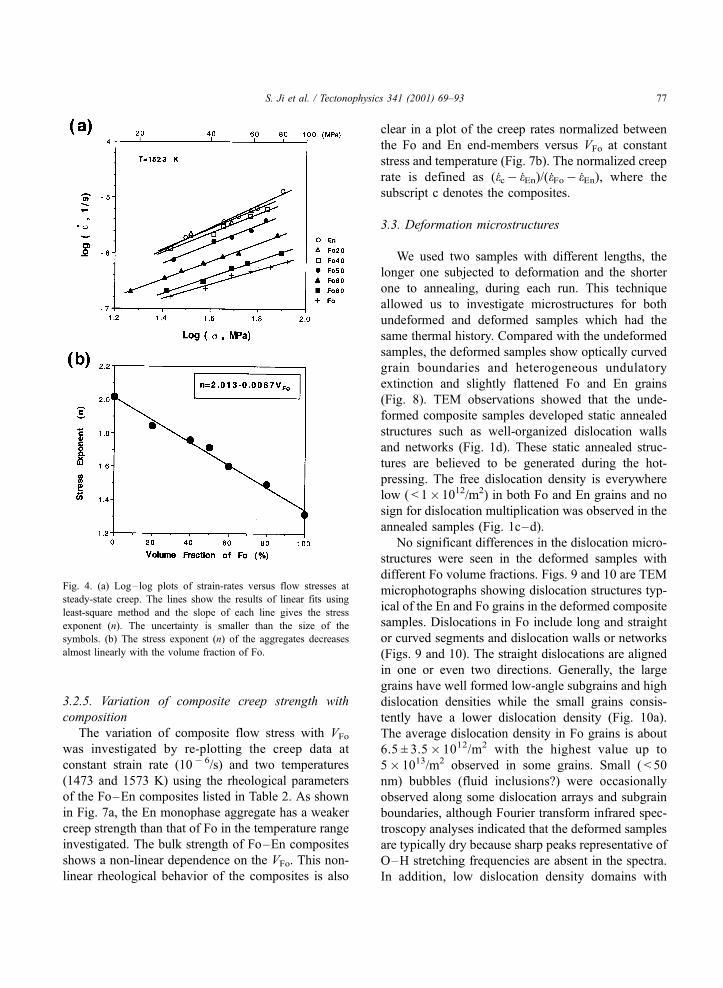
3.2.2. Effect of stress on creep rate
Fig. 4 shows the steady-state creep rates as a
function of the applied stress for the Fo–En compo-
sites deformed at 1523 K and in air. For each
individual sample, measured creep rates show a
linear dependence on stress in logr� log_e space,
suggesting the operation of a single creep mechanism
(Poirier, 1985). However, the slopes of fitting lines
which give the stress exponent (n), decrease quasi-
linearly with VFo from n = 2.0 (Fo0) to n = 1.3
(Fo100) (Fig. 4b). This trend indicates an increase
in the contribution of diffusion creep to the bulk
plastic deformationof the Fo–En composites with
VFo (also see Table 2).
Forsterite: The creep rates, measured at r = 15.0–
85.0 MPa, varied from 1.67�10�7 to 4.84�10�7/s
with n of 1.3±0.3.
Enstatite: The creep rates, measured at r = 20–
90 MPa, varied from 1.89�10�6 to 1.32�10�5/s,
with n=2.0±0.2.
Fo–En composites: The creep rates, measured as a
function of stress over the range of r = 18.5–80.0MPa,
varied from 2.11�10�7 to 1.03�10�6/s. The n values
were determined to be in the range of 1.5 ± 0.1(Fo80)–
1.8 ± 0.2(Fo20), and increased almost linearly with
decreasing in VFo (Fig. 4b).
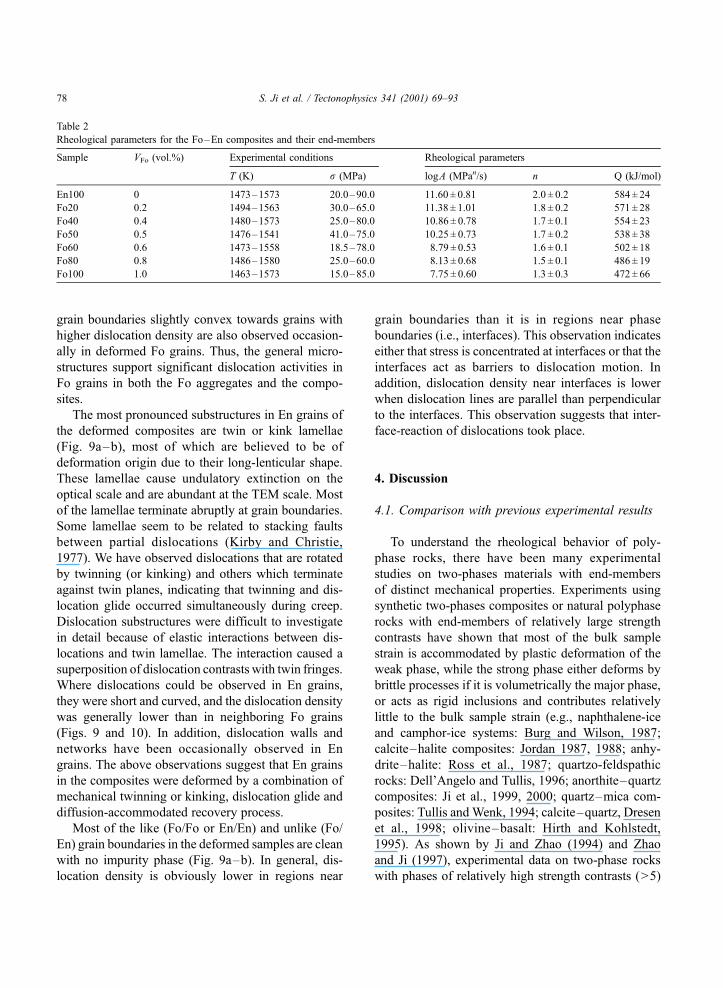
3.2.3. Effect of temperature on creep rate
As shown in Fig. 5a, the creep rates of Fo–En
composites are plotted as a function of temperature in
104/T� log(_e) space to determine creep activation
energy (Q). The plots are linear for the entire series
of Fo–En composites.
Table 1
Fo–En composite samples and deformation conditions
Sample VFo Experimental conditions Grain size (mm)a
T (K) r (MPa) log( fO2) (MPa) Fo En
Fo100-1 1.0 1523 25–100 � 2.5 16.5 ± 2.5
Fo100-2 1.0 1463–1580 50 � 2.5
Fo80-1 0.8 1473–1593 26–79 � 2.5 6.2 ± 1.5 14.2 ± 2.5
Fo80-2 0.8 1505–1551 32–74 � 2.5
F080-3 0.8 1503 45 � 14.0 to� 2.5
Fo60-1 0.6 1523 33.1–59 � 2.5 8.2 ± 3.5 25.3 ± 3.5
Fo60-2 0.6 1486–1580 33.5–45 � 14.0 to� 2.5
Fo60-3 0.6 1503 18–75 � 2.5
Fo50-2 0.5 1423–1541 41–73.5 � 2.5 8.6 ± 2.5 21.2 ± 4.5
Fo50-3 0.5 1486–1616 35–69 � 2.5
Fo50-3 0.5 1503 45 � 14.0 to� 2.5
Fo40-1 0.4 1488–1573 28–68 � 2.5
Fo40-2 0.4 1497–1573 33–41 � 2.5 6.5 ± 1.5 18.2 ± 3.0
Fo20-1 0.2 1523 18.5–76.1 � 2.5
Fo20-2 0.2 1498–1558 47 � 14.0 to� 2.5 10.2 ± 1.5 29.5 ± 3.5
Fo20-3 0.2 1503 26.6–59 � 2.5
En100-1 0.0 1483–1555 45 � 2.5 30.5 ± 4.5
En100-2 0.0 1503 31.3–80 � 2.5
En100-3 0.0 1503 45 � 14.0 to� 2.5
a Grain size after isostatic hot press.
S. Ji et al. / Tectonophysics 341 (2001) 69–93 75
Forsterite: The creep rates, measured at T= 1463–
1573 K and a fixed stress of r = 45 MPa, varied
from 1.25� 10� 7 to 1.6�10� 6/s. Fitting the creep
rates to Eq. (3) yields Q = 472 ± 66 kJ/mol.
Enstatite: The creep rates, measured at T= 1473–
1573 K, varied from 1.78�10� 6 to 3.31�10� 5 /s.
Fitting the creep rate data to Eq. (3) yieldsQ = 584 ± 24
kJ/mol.
Fo–En composites: The dependence of creep
rates on temperature are all linear in 104/T� log(e)space. The creep activation energies (Q) were deter-
mined to be within the range of 486 ± 19 kJ/mol
(Fo80) – 571 ± 28 kJ/mol (Fo20), showing linear
decreases with increasing VFo for the composites with
either WPS or SPS structure although a non-linear
decrease for the transitional regime (0.4 < VFo < 0.6)
(Fig. 5b).
3.2.4. Dependence of creep rates on fO2
Creep rates were measured as a function of fO2for
two composites (Fo20 and Fo60) and a pure En
aggregate (Fo0) under the conditions of T= 1523 K,
r = 45 MPa. The results showed that the creep rates of
Fo0, Fo20 and Fo60 were almost independent of fO2for
oxygen partial pressures higher than 10� 14 MPa (Fig.
6). Similar behavior was previously reported on pure
forsterite single crystals (Jaoul et al., 1980; Ricoult and
Kohlstedt, 1985).
Fig. 3. Typical creep curves of the Fo–En composites showing both transient and steady-state creep. (a) Fo60-1, T= 1493 K, r= 45 MPa; (b)
Fo50-3, T= 1488 K, r = 45 MPa; (c) Fo40-1, T= 1513 K, r= 45 MPa; (d) Fo20-2, T= 1473 K, r= 40 MPa.
S. Ji et al. / Tectonophysics 341 (2001) 69–9376
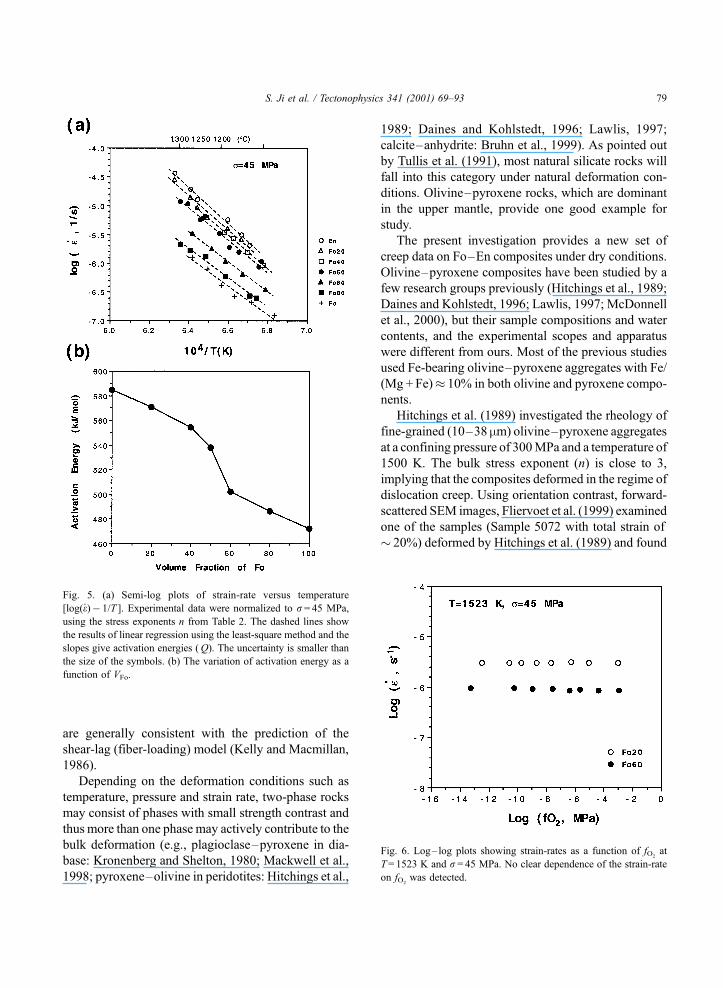
3.2.5. Variation of composite creep strength with
composition
The variation of composite flow stress with VFo
was investigated by re-plotting the creep data at
constant strain rate (10� 6/s) and two temperatures
(1473 and 1573 K) using the rheological parameters
of the Fo–En composites listed in Table 2. As shown
in Fig. 7a, the En monophase aggregate has a weaker
creep strength than that of Fo in the temperature range
investigated. The bulk strength of Fo–En composites
shows a non-linear dependence on the VFo. This non-
linear rheological behavior of the composites is also
clear in a plot of the creep rates normalized between
the Fo and En end-members versus VFo at constant
stress and temperature (Fig. 7b). The normalized creep
rate is defined as (e:c� e:En)/(e:Fo� e:En), where the
subscript c denotes the composites.
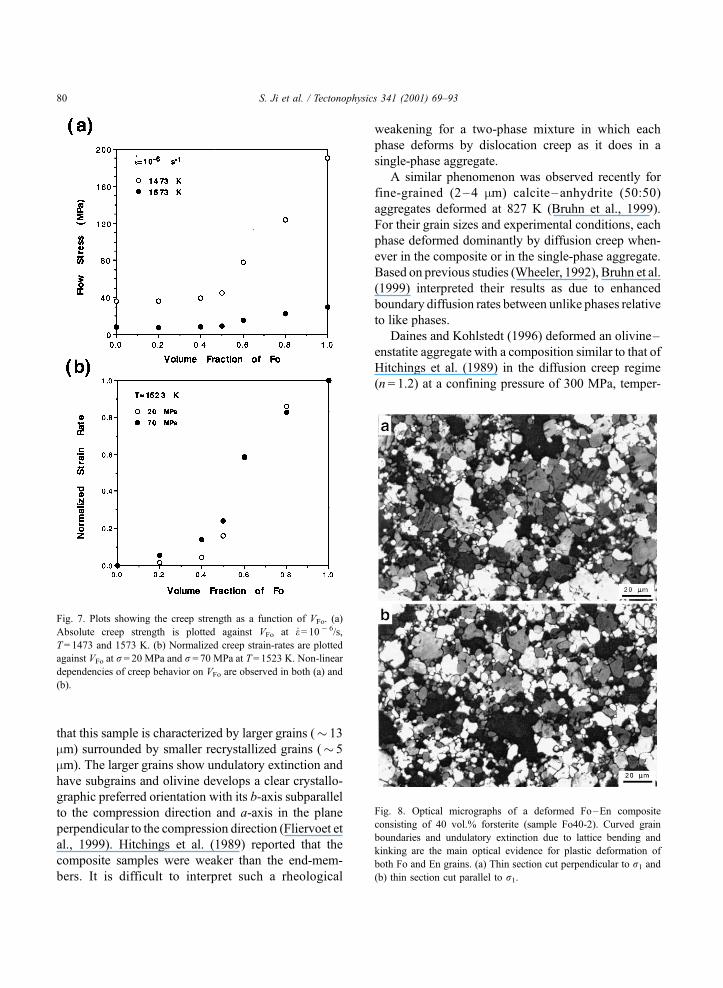
3.3. Deformation microstructures
We used two samples with different lengths, the
longer one subjected to deformation and the shorter
one to annealing, during each run. This technique
allowed us to investigate microstructures for both
undeformed and deformed samples which had the
same thermal history. Compared with the undeformed
samples, the deformed samples show optically curved
grain boundaries and heterogeneous undulatory
extinction and slightly flattened Fo and En grains
(Fig. 8). TEM observations showed that the unde-
formed composite samples developed static annealed
structures such as well-organized dislocation walls
and networks (Fig. 1d). These static annealed struc-
tures are believed to be generated during the hot-
pressing. The free dislocation density is everywhere
low ( < 1�1012/m2) in both Fo and En grains and no
sign for dislocation multiplication was observed in the
annealed samples (Fig. 1c–d).
No significant differences in the dislocation micro-
structures were seen in the deformed samples with
different Fo volume fractions. Figs. 9 and 10 are TEM
microphotographs showing dislocation structures typ-
ical of the En and Fo grains in the deformed composite
samples. Dislocations in Fo include long and straight
or curved segments and dislocation walls or networks
(Figs. 9 and 10). The straight dislocations are aligned
in one or even two directions. Generally, the large
grains have well formed low-angle subgrains and high
dislocation densities while the small grains consis-
tently have a lower dislocation density (Fig. 10a).
The average dislocation density in Fo grains is about
6.5 ± 3.5� 1012/m2 with the highest value up to
5� 1013/m2 observed in some grains. Small ( < 50
nm) bubbles (fluid inclusions?) were occasionally
observed along some dislocation arrays and subgrain
boundaries, although Fourier transform infrared spec-
troscopy analyses indicated that the deformed samples
are typically dry because sharp peaks representative of
O–H stretching frequencies are absent in the spectra.
In addition, low dislocation density domains with
Fig. 4. (a) Log– log plots of strain-rates versus flow stresses at
steady-state creep. The lines show the results of linear fits using
least-square method and the slope of each line gives the stress
exponent (n). The uncertainty is smaller than the size of the
symbols. (b) The stress exponent (n) of the aggregates decreases
almost linearly with the volume fraction of Fo.
S. Ji et al. / Tectonophysics 341 (2001) 69–93 77
grain boundaries slightly convex towards grains with
higher dislocation density are also observed occasion-
ally in deformed Fo grains. Thus, the general micro-
structures support significant dislocation activities in
Fo grains in both the Fo aggregates and the compo-
sites.
The most pronounced substructures in En grains of
the deformed composites are twin or kink lamellae
(Fig. 9a–b), most of which are believed to be of
deformation origin due to their long-lenticular shape.
These lamellae cause undulatory extinction on the
optical scale and are abundant at the TEM scale. Most
of the lamellae terminate abruptly at grain boundaries.
Some lamellae seem to be related to stacking faults
between partial dislocations (Kirby and Christie,
1977). We have observed dislocations that are rotated
by twinning (or kinking) and others which terminate
against twin planes, indicating that twinning and dis-
location glide occurred simultaneously during creep.
Dislocation substructures were difficult to investigate
in detail because of elastic interactions between dis-
locations and twin lamellae. The interaction caused a
superposition of dislocation contrasts with twin fringes.
Where dislocations could be observed in En grains,
they were short and curved, and the dislocation density
was generally lower than in neighboring Fo grains
(Figs. 9 and 10). In addition, dislocation walls and
networks have been occasionally observed in En
grains. The above observations suggest that En grains
in the composites were deformed by a combination of
mechanical twinning or kinking, dislocation glide and
diffusion-accommodated recovery process.
Most of the like (Fo/Fo or En/En) and unlike (Fo/
En) grain boundaries in the deformed samples are clean
with no impurity phase (Fig. 9a–b). In general, dis-
location density is obviously lower in regions near
grain boundaries than it is in regions near phase
boundaries (i.e., interfaces). This observation indicates
either that stress is concentrated at interfaces or that the
interfaces act as barriers to dislocation motion. In
addition, dislocation density near interfaces is lower
when dislocation lines are parallel than perpendicular
to the interfaces. This observation suggests that inter-
face-reaction of dislocations took place.
4. Discussion
4.1. Comparison with previous experimental results
To understand the rheological behavior of poly-
phase rocks, there have been many experimental
studies on two-phases materials with end-members
of distinct mechanical properties. Experiments using
synthetic two-phases composites or natural polyphase
rocks with end-members of relatively large strength
contrasts have shown that most of the bulk sample
strain is accommodated by plastic deformation of the
weak phase, while the strong phase either deforms by
brittle processes if it is volumetrically the major phase,
or acts as rigid inclusions and contributes relatively
little to the bulk sample strain (e.g., naphthalene-ice
and camphor-ice systems: Burg and Wilson, 1987;
calcite–halite composites: Jordan 1987, 1988; anhy-
drite–halite: Ross et al., 1987; quartzo-feldspathic
rocks: Dell’Angelo and Tullis, 1996; anorthite–quartz
composites: Ji et al., 1999, 2000; quartz–mica com-
posites: Tullis andWenk, 1994; calcite–quartz, Dresen
et al., 1998; olivine–basalt: Hirth and Kohlstedt,
1995). As shown by Ji and Zhao (1994) and Zhao
and Ji (1997), experimental data on two-phase rocks
with phases of relatively high strength contrasts (>5)
Table 2
Rheological parameters for the Fo–En composites and their end-members
Sample VFo (vol.%) Experimental conditions Rheological parameters
T (K) r (MPa) logA (MPan/s) n Q (kJ/mol)
En100 0 1473–1573 20.0–90.0 11.60 ± 0.81 2.0 ± 0.2 584 ± 24
Fo20 0.2 1494–1563 30.0–65.0 11.38 ± 1.01 1.8 ± 0.2 571 ± 28
Fo40 0.4 1480–1573 25.0–80.0 10.86 ± 0.78 1.7 ± 0.1 554 ± 23
Fo50 0.5 1476–1541 41.0–75.0 10.25 ± 0.73 1.7 ± 0.2 538 ± 38
Fo60 0.6 1473–1558 18.5–78.0 8.79 ± 0.53 1.6 ± 0.1 502 ± 18
Fo80 0.8 1486–1580 25.0–60.0 8.13 ± 0.68 1.5 ± 0.1 486 ± 19
Fo100 1.0 1463–1573 15.0–85.0 7.75 ± 0.60 1.3 ± 0.3 472 ± 66
S. Ji et al. / Tectonophysics 341 (2001) 69–9378
are generally consistent with the prediction of the
shear-lag (fiber-loading) model (Kelly and Macmillan,
1986).
Depending on the deformation conditions such as
temperature, pressure and strain rate, two-phase rocks
may consist of phases with small strength contrast and
thus more than one phase may actively contribute to the
bulk deformation (e.g., plagioclase–pyroxene in dia-
base: Kronenberg and Shelton, 1980; Mackwell et al.,
1998; pyroxene–olivine in peridotites: Hitchings et al.,
1989; Daines and Kohlstedt, 1996; Lawlis, 1997;
calcite–anhydrite: Bruhn et al., 1999). As pointed out
by Tullis et al. (1991), most natural silicate rocks will
fall into this category under natural deformation con-
ditions. Olivine–pyroxene rocks, which are dominant
in the upper mantle, provide one good example for
study.
The present investigation provides a new set of
creep data on Fo–En composites under dry conditions.
Olivine–pyroxene composites have been studied by a
few research groups previously (Hitchings et al., 1989;
Daines and Kohlstedt, 1996; Lawlis, 1997; McDonnell
et al., 2000), but their sample compositions and water
contents, and the experimental scopes and apparatus
were different from ours. Most of the previous studies
used Fe-bearing olivine–pyroxene aggregates with Fe/
(Mg + Fe) 10% in both olivine and pyroxene compo-
nents.
Hitchings et al. (1989) investigated the rheology of
fine-grained (10–38 mm) olivine–pyroxene aggregates
at a confining pressure of 300MPa and a temperature of
1500 K. The bulk stress exponent (n) is close to 3,
implying that the composites deformed in the regime of
dislocation creep. Using orientation contrast, forward-
scattered SEM images, Fliervoet et al. (1999) examined
one of the samples (Sample 5072 with total strain of
� 20%) deformed by Hitchings et al. (1989) and found
Fig. 5. (a) Semi-log plots of strain-rate versus temperature
[log(e)� 1/T ]. Experimental data were normalized to r= 45 MPa,
using the stress exponents n from Table 2. The dashed lines show
the results of linear regression using the least-square method and the
slopes give activation energies (Q). The uncertainty is smaller than
the size of the symbols. (b) The variation of activation energy as a
function of VFo.
Fig. 6. Log– log plots showing strain-rates as a function of fO2at
T= 1523 K and r= 45 MPa. No clear dependence of the strain-rate
on fO2was detected.
S. Ji et al. / Tectonophysics 341 (2001) 69–93 79
that this sample is characterized by larger grains (� 13
mm) surrounded by smaller recrystallized grains (� 5
mm). The larger grains show undulatory extinction and
have subgrains and olivine develops a clear crystallo-
graphic preferred orientation with its b-axis subparallel
to the compression direction and a-axis in the plane
perpendicular to the compression direction (Fliervoet et
al., 1999). Hitchings et al. (1989) reported that the
composite samples were weaker than the end-mem-
bers. It is difficult to interpret such a rheological
weakening for a two-phase mixture in which each
phase deforms by dislocation creep as it does in a
single-phase aggregate.
A similar phenomenon was observed recently for
fine-grained (2–4 mm) calcite – anhydrite (50:50)
aggregates deformed at 827 K (Bruhn et al., 1999).
For their grain sizes and experimental conditions, each
phase deformed dominantly by diffusion creep when-
ever in the composite or in the single-phase aggregate.
Based on previous studies (Wheeler, 1992), Bruhn et al.
(1999) interpreted their results as due to enhanced
boundary diffusion rates between unlike phases relative
to like phases.
Daines and Kohlstedt (1996) deformed an olivine–
enstatite aggregate with a composition similar to that of
Hitchings et al. (1989) in the diffusion creep regime
(n = 1.2) at a confining pressure of 300 MPa, temper-
Fig. 7. Plots showing the creep strength as a function of VFo. (a)
Absolute creep strength is plotted against VFo at e:= 10 � 6/s,
T= 1473 and 1573 K. (b) Normalized creep strain-rates are plotted
against VFo at r= 20 MPa and r = 70 MPa at T= 1523 K. Non-linear
dependencies of creep behavior on VFo are observed in both (a) and
(b).
Fig. 8. Optical micrographs of a deformed Fo–En composite
consisting of 40 vol.% forsterite (sample Fo40-2). Curved grain
boundaries and undulatory extinction due to lattice bending and
kinking are the main optical evidence for plastic deformation of
both Fo and En grains. (a) Thin section cut perpendicular to r1 and(b) thin section cut parallel to r1.
S. Ji et al. / Tectonophysics 341 (2001) 69–9380
atures between 1423 and 1528 K and strain rates be-
tween 10� 7 and 10� 5/s. They observed little change
in flow stress for composites containing 5%, 50% and
95% enstatite. Their experimental results disagree with
the earlier suggestion of Hitchings et al. (1989). Lawlis
(1997) recently performed a systematic study on the
rheological behavior of olivine–pyroxene aggregates
at P= 300 and 450MPa and T= 1423–1573 K.Most of
his experimentswere conducted in the dislocation creep
regime with n = 3–3.5 and Q = 540–720 kJ/mol. His
results, also in contrast with those of Hitchings et al.
(1989), showed a linear dependence of log e:, n andQ on
VEn.
McDonnell et al. (2000) experimentally deformed
wet (0.5 wt.% water) Fo–En composites with En
contents of 0%, 1%, 2%, 2.5%, 15% and 20% and
extremely small grain sizes (1–2 mm) using a gas-
medium deformation apparatus at temperatures of
1173–1273 K, strain rates between 10� 7 and 10� 5/s
and a confining pressure of 600 MPa. They observed a
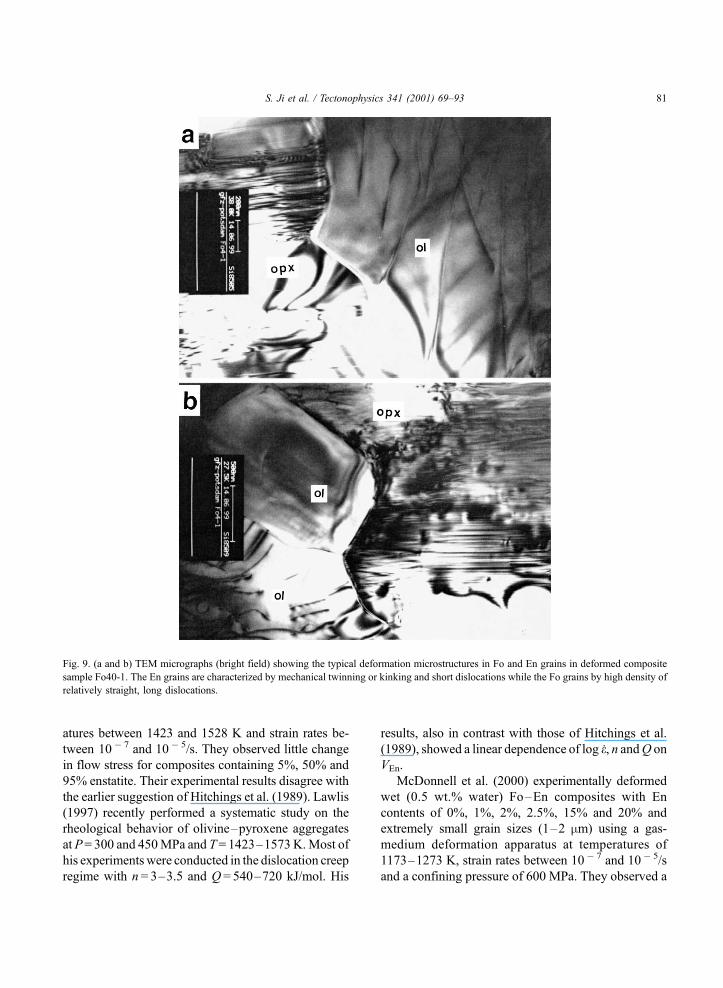
Fig. 9. (a and b) TEM micrographs (bright field) showing the typical deformation microstructures in Fo and En grains in deformed composite
sample Fo40-1. The En grains are characterized by mechanical twinning or kinking and short dislocations while the Fo grains by high density of
relatively straight, long dislocations.
S. Ji et al. / Tectonophysics 341 (2001) 69–93 81
sharp drop in composite flow strength with increasing
En content from 0 to 2.5% and little further change at
higher En contents up to 20 vol.%. Based on the
observed stress exponent n value of � 1.7, grain size
exponent p value of � 3 and microstructures, McDon-
nell et al. (2000) suggest that the deformation mecha-
nism of their composite samples was grain boundary
sliding accommodated by grain boundary diffusion
and/or dislocation activity. Their mechanical data are
inconsistent with the expectation for enhanced diffu-
sion along unlike phase interfaces of the type proposed
byWheeler (1992) and Bruhn et al. (1999). McDonnell
et al. (2000) suggested that the observed drop in Fo–En
composite flow strength resulted from a decrease in
grain size due to inhibition of grain growth by the
presence of the second phase. However, the p value was
poorly constrained byMcDonnell et al. (2000) owing to
the fact that the mean grain size of their samples varied
over an extremely narrow range (from 1 to 2 mm).
Furthermore, the concept of grain size exponent ( p)
was established initially for monophase aggregates
(Poirier, 1985) and probably cannot be directly appli-
cable to polyphase systems. In our view, the physical
meaning of p has not been clear for polyphase aggre-
gates.
Our experiments were performed on Fe-free Fo–En
composites in a 0.1-MPa creep rig to minimize the
effect of chemical composition and water content on
composite deformation, and to maximize the resolution
of mechanical data. Such experiments provide several
advantages over experiments performed on Fe-bearing
composites at higher confining pressure: (1) Avoid the
complication in creep behavior due to the addition of Fe
because Fe plays an important role in governing point
defect chemistry and thus solid state diffusion and
kinetic properties. (2) With the high resolution of stress
( ± 0.1 MPa), strain measurement ( ± 0.01%) and tem-
perature ( ± 0.5 K), creep experiments can be performed
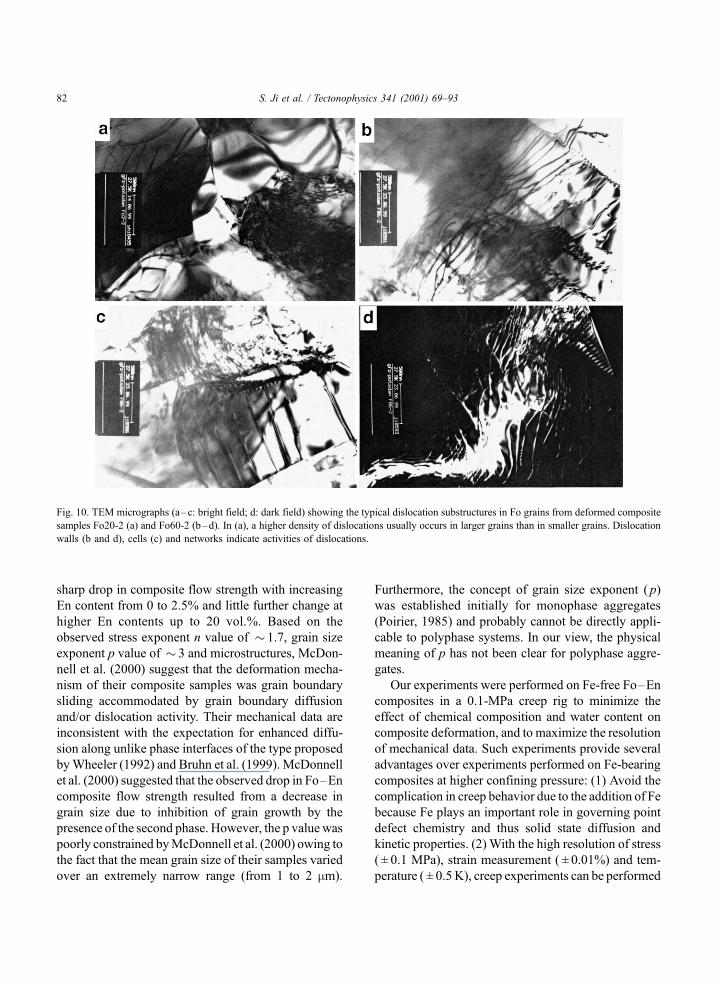
Fig. 10. TEM micrographs (a–c: bright field; d: dark field) showing the typical dislocation substructures in Fo grains from deformed composite
samples Fo20-2 (a) and Fo60-2 (b–d). In (a), a higher density of dislocations usually occurs in larger grains than in smaller grains. Dislocation
walls (b and d), cells (c) and networks indicate activities of dislocations.
S. Ji et al. / Tectonophysics 341 (2001) 69–9382
at a low stresses similar in magnitude to those produc-
ing flow in the upper mantle. (3) Experiments can be
performed over a relatively wide temperature range,
which is necessary for the precise determination of Q
value corresponding to a given deformation mecha-
nism (Fig. 5a). (4) A dry environment can be easily
provided, a situation difficult to attain in experiments
carried out in a high-pressure vessel. (5) The oxygen
fugacity dependence of creep rate can be easily meas-
ured in detail.
However, three factors may affect the quality of the
data obtained with the 0.1-MPa rig. First, without
confining pressure, cavities develop in polycrystalline
samples due to local tensile stresses that arise due to
grain boundary sliding (Lange et al., 1980; Tsai and
Raj, 1982). Second, without confining pressure, micro-
fractures can form in these materials deformed to large
strain in dislocation regime or in those deformed by
grain boundary sliding. To minimize these effects, the
total strain was limited to less than 10%, and the
mechanical data were corrected for cavitation strain
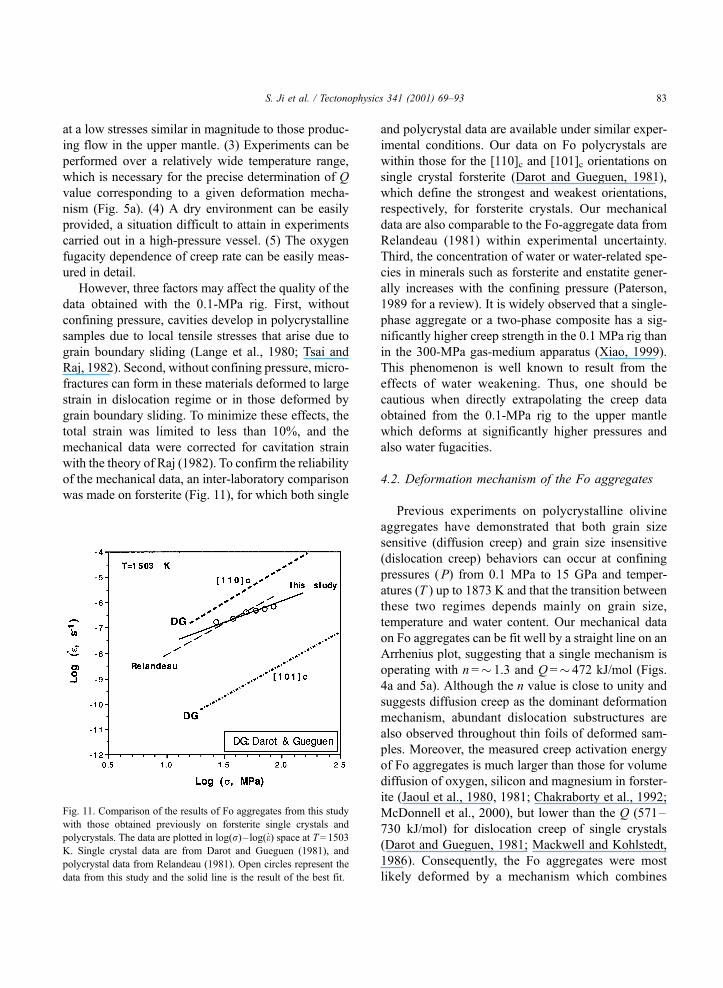
with the theory of Raj (1982). To confirm the reliability
of the mechanical data, an inter-laboratory comparison
was made on forsterite (Fig. 11), for which both single
and polycrystal data are available under similar exper-
imental conditions. Our data on Fo polycrystals are
within those for the [110]c and [101]c orientations on
single crystal forsterite (Darot and Gueguen, 1981),
which define the strongest and weakest orientations,
respectively, for forsterite crystals. Our mechanical
data are also comparable to the Fo-aggregate data from
Relandeau (1981) within experimental uncertainty.
Third, the concentration of water or water-related spe-
cies in minerals such as forsterite and enstatite gener-
ally increases with the confining pressure (Paterson,
1989 for a review). It is widely observed that a single-
phase aggregate or a two-phase composite has a sig-
nificantly higher creep strength in the 0.1 MPa rig than
in the 300-MPa gas-medium apparatus (Xiao, 1999).
This phenomenon is well known to result from the
effects of water weakening. Thus, one should be
cautious when directly extrapolating the creep data
obtained from the 0.1-MPa rig to the upper mantle
which deforms at significantly higher pressures and
also water fugacities.
4.2. Deformation mechanism of the Fo aggregates
Previous experiments on polycrystalline olivine
aggregates have demonstrated that both grain size
sensitive (diffusion creep) and grain size insensitive
(dislocation creep) behaviors can occur at confining
pressures (P) from 0.1 MPa to 15 GPa and temper-
atures (T ) up to 1873 K and that the transition between
these two regimes depends mainly on grain size,
temperature and water content. Our mechanical data
on Fo aggregates can be fit well by a straight line on an
Arrhenius plot, suggesting that a single mechanism is
operating with n =� 1.3 and Q =� 472 kJ/mol (Figs.
4a and 5a). Although the n value is close to unity and
suggests diffusion creep as the dominant deformation
mechanism, abundant dislocation substructures are
also observed throughout thin foils of deformed sam-
ples. Moreover, the measured creep activation energy
of Fo aggregates is much larger than those for volume
diffusion of oxygen, silicon and magnesium in forster-
ite (Jaoul et al., 1980, 1981; Chakraborty et al., 1992;
McDonnell et al., 2000), but lower than the Q (571–
730 kJ/mol) for dislocation creep of single crystals
(Darot and Gueguen, 1981; Mackwell and Kohlstedt,
1986). Consequently, the Fo aggregates were most
likely deformed by a mechanism which combines
Fig. 11. Comparison of the results of Fo aggregates from this study
with those obtained previously on forsterite single crystals and
polycrystals. The data are plotted in log(r) – log(e) space at T= 1503K. Single crystal data are from Darot and Gueguen (1981), and
polycrystal data from Relandeau (1981). Open circles represent the
data from this study and the solid line is the result of the best fit.
S. Ji et al. / Tectonophysics 341 (2001) 69–93 83
volume diffusion of the slowest moving atomic species
with formation and ionization of kinks or jogs on
dislocation lines (Poirier, 1985). This mechanism can
be referred as dislocation-accommodated diffusion
creep.
The olivine aggregates and olivine–pyroxene com-
posites hot-pressed and/or deformed with added water,
which were previously reported to be deformed by a
single mechanism of grain boundary diffusion creep
(e.g., Chopra, 1986; Karato et al., 1986), probably
contain melt which occurs in three- and four-grain
junctions and wets at least parts of the two-phase
boundaries (Wirth, 1996; Drury and Fitz Gerald,
1996). Using an internally heated gas-medium appa-
ratus, Hirth and Kohlstedt (1995) successfully pro-
duced grain boundary diffusion creep in partially
molten ( < 12 wt.%) olivine–enstatite composites (oli-
vine: Fo91, 8.2–12.3 mm; enstatite: 3–5 wt.%, < 40
mm). On the basis of the above discussion, we spec-
ulate that volume diffusion creep accommodated by
dislocation activity could be the dominant deformation
mechanism in the melt-free Fo aggregates deformed
under dry conditions. We do not intend to enter into
any detailed discussion about interaction between
volume diffusion creep and dislocation activity, as
our main objective in this paper is to quantify the
variations of the composite flow strength with the
volume fraction of each constituent phase. The full
determination of the dominant deformation mecha-
nism in the deformed samples will be the topic for a
separate research paper in the future.
4.3. Deformation mechanism of the En aggregates
Two pioneering studies examined the high temper-
ature creep of natural enstatite-bearing rocks using a
Griggs-type solid-medium apparatus at P= 1.0 and 1.5
GPa and T= 1273–1673 K (Raleigh et al., 1971; Ross
and Nielsen, 1978). They both observed dislocation
creep with n =� 2.4–2.8, and Q =� 270–290 kJ/mol.
However, the sample assemblies used in their experi-
ments during those earlier days did not allow stresses
to be determined precisely. Recently, Lawlis (1997)
studied synthetic, melt-free, fine-grained (1 to 20 mm)
En-aggregates at P= 300 and 450 MPa, and T= 1423–
1573 K. His samples were deformed in the dislocation
creep regime with n =� 2.9–3.0 and Q =� 600–720
kJ/mol. We deformed pure En-aggregates in a similar
range of temperature to that of Lawlis, and found that
the rheological behavior can be described by a power-
law creep with n =� 2.0 and Q =� 584 kJ/mol. Opti-
cal examination of the large En grains following
deformation revealed undulatory extinction. TEM
observations exclusively showed the dominance of
mechanical twinning or kinking, dislocation glide
and recovery. These observations suggest that the En
grains deformed by a combination of mechanical
twining or kinking, dislocation glide and diffusion-
related recovery process.
4.4. Deformation mechanism of the Fo–En compo-
sites
Previous authors (e.g., McDonnell et al., 2000)
suggested that the primary role of a secondary phase
is to inhibit grain growth in a composite material,
resulting in a relatively fine-grain size compared to
end-member aggregates, promoting the transition
from grain-size insensitive dislocation creep to grain-
size sensitive diffusion creep. We also observed a
significant reduction in grain size for both Fo and
En in our composite samples (Table 1). For example,
the mean grain size of Fo is 16.5 mm in the Fo
aggregate as against 6.5 mm in the Fo40 composite.
The mean grain size of En is 30.5 mm in the En
aggregate as against 18.2 mm in the Fo40 composite.
However, our TEM observations showed that the
dislocation microstructures, including dislocation den-
sities in either En or Fo individual grains, do not show
significant variations with VFo, and are similar to those
observed in pure Fo and En aggregates. This obser-
vation does suggest no change in deformation mech-
anism of each phase when in the composites,
compared to when in a single-phase aggregate, for
our grain sizes and experimental conditions. Whether
in the composites or in the single-phase aggregate, the
smaller grain-size Fo (6.2–16.5 mm) and the larger
grain-size En (14.2–30.5 mm) crystals deform mainly
by dislocation-accommodated diffusion creep and
dislocation creep, respectively. Previous mixture rules
(Tullis et al., 1991; Ji and Zhao, 1993), assuming that
the mixing of two-phase phases does not change
deformation mechanism of each phase, can account
for fairly well the continuous decrease in n from 2.0 to
1.3 with increasing VFo from 0 to 1.0 (Fig. 4b). This
interpretation is supported by the observed decrease in
S. Ji et al. / Tectonophysics 341 (2001) 69–9384
Q from 584 to 472 kJ/mol with increasing VFo (Fig.
5b). The variation in Q, shown in Fig. 5b, may also
suggest a continuous transition of the overall creep
behavior of the composites from Fo-controlled rheol-
ogy to En-controlled rheology. This transition may
indicate that diffusion creep progressively gains dom-
inance over dislocation creep in the composites with
increasing VFo.
4.5. Comparisons with theoretical models
Modeling of the bulk strength of a polyphase
composite material from the behavior of each end-
member is an important and very active domain in
modern materials science. During last three decades,
many theoretical models have been developed and
successfully applied to quantify the bulk strength of
polyphase composites with various chemical compo-
sitions, microstructures and grain sizes. In this section,
we will compare our creep results of Fo–En compo-
sites with theoretical models. Only analytical models
have been selected for the comparison, complex
numerical techniques such as finite element or finite
difference modeling (e.g., Tullis et al., 1991; Bao et
al., 1991) are not included. These latter techniques
have advantages for comprehensively analyzing the
effects of shape, concentration and spatial distribution
of each phase and the influence of phase interface
characteristics on the overall mechanical properties of
two-phase composites, but they are too complicated to
deal with when we have insufficient information
about the detailed texture of the composites.
In order to facilitate the comparison between
experimental data and theoretical models, we define
a parameter K as normalized strength: K=(rc� rEn)/
(rFo� rEn), where rEn and rFo are the flow strengths
of the composite, Fo and En polycrystals, respec-
tively.
4.5.1. Voigt, Reuss and Handy bounds
The simplest approach to composite bulk rheology
is based on an assumption that the constituent phases
of a composite undergo deformation characterized by
either uniform strain rate (i.e., Voigt model) or uni-
form stress (i.e., Reuss model). The Voigt and Reuss
models are generally thought to place upper and lower
bounds on the overall flow strength for homogeneous
and isotropic composites, respectively. Based on a
notion that the rate of viscous strain energy dissipation
in a polyphase rock is equal to the sum of the effective
rates of strain energy dissipation in the constituent
phases of that rock, Handy (1994) (corrected form)
derived the following two bounds for composites with
the LBF (load-bearing frame, SPS in our terminology)
and IWL (interconnected weak layer, WPS in our
terminology) microstructures:
Upper bound : rc ¼ rsVs þ rwð1� VsÞ ð4Þ
Lower bound : rc ¼rwð1� VsÞ1�x
þ rs½1� ð1� VsÞ1�x� ð5Þ
where x = (1� rw/rs), the subscripts c, s, and w stand
for the composite, strong phase and weak phase,
respectively. Handy’s upper bound corresponds
exactly to the Voigt bound while Handy’s lower bound
given by Eq. (5) is nearly the same as Reuss bound. As
shown in Fig. 12a, these upper and lower bounds are
separated widely and all the measured Fo–En
composite strengths plot between these bounds.
However, the measured data are close to the lower
bound at VFo� 0.20 and to the upper bound at
VFo 0.80. At moderate VFo (0.40–0.60), neither
upper nor lower bounds can fit the experimental data.
4.5.2. Takeda model
Recently, Takeda (1998) applied multiphase con-
tinuum mechanics to the flow properties of two-phase
rocks. The analysis was based on assumed additive
relationships for the linear momentum, stresses and
entropy production rates. The low strength of Fo–
En composites as a function of VEn or VFo can be
calculated from Takeda’s Eqs. (33) and (34) which
correspond to his mode 1 and mode 2, respectively.
His mode 1, which gives a linear relationship between
the bulk composite strength and the volume fraction
of the constituent phases, yields exactly the same
composite strength as the Voigt bound. His mode 2
predicts a non-linear variation of the composite flow
strength with the volume fractions, density contrast or
rheological contrast between the two constituent
phases. The density contrast and rheological contrast
between Fo and En are about 1 (Ji and Wang, 1999),
and 4.7 at T= 1503 K and strain rate of 10� 6/s. As
S. Ji et al. / Tectonophysics 341 (2001) 69–93 85
shown in Fig. 12a, Takeda’s mode 2 successfully
predicts the flow strength of Fo–En composites with
WPS structure at VFo� 0.40.
4.5.3. Shear-lag model
The shear-lag model (SLM) was originally pro-
posed by Cox (1952) and subsequently refined by
many others (Kelly and Macmillan, 1986; Zhao and
Ji, 1997). The SLM has been widely used to predict
elastic moduli (e.g., Ji and Wang, 1999) and yield
strength (e.g., Kelly and Street, 1972; Nardone and
Prewo, 1986) of composites. According to the modi-
fied SLM (Ji and Zhao, 1994; Hull and Clyne, 1996),
the composite flow strength can be assessed by the
following equation:
rc ¼ ð1� VsÞrw
þ Vsrs 1þ rw
rs� 1
� �tanh u
u
� �ð6Þ
where
u ¼ s�3rw
rsð1þ twÞln Vs
� �1=2
ð7Þ
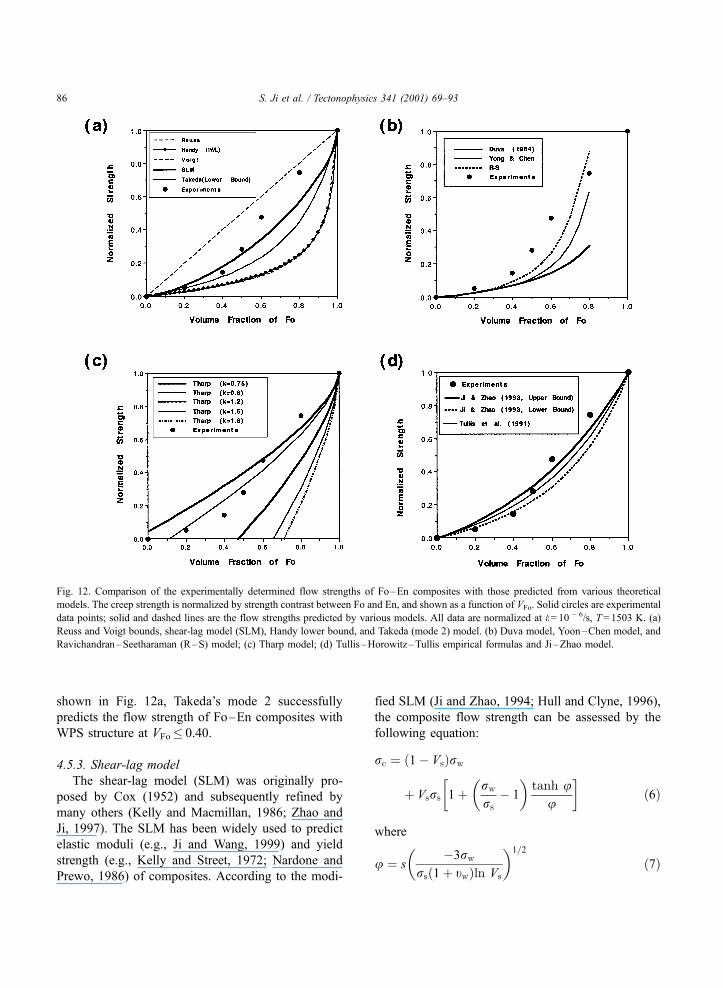
Fig. 12. Comparison of the experimentally determined flow strengths of Fo–En composites with those predicted from various theoretical
models. The creep strength is normalized by strength contrast between Fo and En, and shown as a function of VFo. Solid circles are experimental
data points; solid and dashed lines are the flow strengths predicted by various models. All data are normalized at e: = 10� 6/s, T= 1503 K. (a)
Reuss and Voigt bounds, shear-lag model (SLM), Handy lower bound, and Takeda (mode 2) model. (b) Duva model, Yoon–Chen model, and
Ravichandran–Seetharaman (R–S) model; (c) Tharp model; (d) Tullis–Horowitz–Tullis empirical formulas and Ji–Zhao model.
S. Ji et al. / Tectonophysics 341 (2001) 69–9386
where s is the average aspect-ratio of the strong phase
(s=� 1.5 for Fo), and tw is the Poisson’s ratio of the
weak phase (tw = 0.208 for En, measured by Ji and
Wang, 1999). The flow strengths of the Fo–En
composites calculated from the SLM are shown in
Fig. 12a. The SLM prediction gives a fairly good
approximation to the measured strength of composites
with VFo� 0.5, however, a significant discrepancy
between the theoretically predicted and experimen-
tally measured values occurs at VFo > 0.50.
4.5.4. Duva model
Using a differential self-consistent analysis, Duva
(1984) developed an approximate constitutive relation
for a power-law viscous matrix material stiffened by
rigid spherical inclusions:
rc ¼ rwð1� VsÞ�0:48 ð8Þ
where rc is the overall flow stress of the composite in
pure-shear, rw is the flow stress for the weak matrix
without rigid inclusions, and Vs is the volume
fraction of the rigid particles. Fig. 12b shows that
the Fo–En composite strengths calculated from the
Duva model match approximately with our exper-
imental data only at VFo < 0.3. This result is not
surprising because the Duva model does not take into
consideration effects of particle clustering and is thus
valid only for a composite material with a dilute
distribution (Vs < 0.3).
4.5.5. Yoon–Chen model
Using a self-consistent approach, Yoon and Chen
(1990) established a power-law relation between
steady-state strain rate and stress for two-phase com-
posites consisting of a soft creeping matrix reinforced
by rigid inclusions. According to them:
_ec ¼ Awrnwc ð1� VsÞqexp � Qw
RT
� �ð9Þ
where e:c and rc are the overall strain-rate and flow
stress of the composite, respectively; Aw, nw, and Qw
are the rheological parameters for the weak phase, Vs is
the volume fraction of the rigid particles, and q is a
parameter which describes the stress concentration due
to the presence of the rigid particles and depends on nw
and the inclusion shape. For equiaxed inclusions, q is
given by:
q ¼ 2þ nw=2 ð10Þ
(Yoon and Chen, 1990). This model predicts that the
flow stress increase resulting from a given volume
fraction of rigid inclusions is more drastic in a non-
Newtonian creeping material than in a Newtonian
material. Similar to the Duva model, the Yoon–Chen
model gives a good prediction only when VFo < 0.30
(Fig. 12b). At higher VFo, both the Duva and Yoon–
Chen models underestimate significantly the flow
strength for Fo–En composites.
4.5.6. Ravichandran–Seetharaman model
Ravichandran and Seetharaman (1993) developed
a simple continuum-mechanical model to predict the
steady-state flow strength of two-phase composites
containing coarse, rigid particles in plastically deform-
ing matrix. The model was derived on the basis of a
unit cell, representative of the composite microstruc-
ture, which is idealized to a pattern of periodic, cubic
particles distributed uniformly in a continuous ductile
matrix. The model accounted specifically for the
constraints of rigid particles on plastic flow of the
adjacent weak matrix (Unksov, 1961). According to
the Ravichandran and Seetharaman model, we ob-
tained the following flow law for our Fo–En compo-
sites:
_ec ¼ AEnexp � QEn
RT
� �
� ð1þ cÞ2rc
1þ 0:3c
� �1þ 1
c
� �1=nEnþð1þ cÞ2 � 1
" #nEn
ð11Þ
where
c ¼ ð1� VEnÞ�1=3 � 1: ð12Þ
As shown in Fig. 12b, this model tends to under-
estimate the flow strength for the Fo–En composites
with moderate VFo = 0.30–0.70. For the Fo–En
composites, the Ravichandran–Seetharaman model
is better than the Duva model, the Yoon–Chen model,
the Reuss bound or the Handy model.
S. Ji et al. / Tectonophysics 341 (2001) 69–93 87
4.5.7. Tharp model
Instead of emphasizing the role of the weak phase,
Tharp (1983) suggested that composites with a strong
phase forming a SPS structure and a much weaker
dispersed phase could be modeled as porous powder
metals. According to him:
rc ¼ rsð1� kV 2=3w Þ ð13Þ
where k is a geometrical coefficient which depends
on a number of factors such as the shape and
configuration of the weak phase and the strength
contrast (rs/rw), and ranges from 0.98 to 3.8 (Gri-
ffiths et al., 1979). Tharp (1983) found that k = 1.8
represents a good fit to empirical tensile strengths of
various sintered porous metals, whereas Jordan
(1987) found that k = 1.1–1.5 for the compressional
strengths of calcite–halite and anhydrite–halite. As
demonstrated in Fig. 12c, the experimental data at
VFo 0.60 can be described by the Tharp model with
k =� 0.75, which is lower than the values typically
used by previous authors for other materials. As
pointed out by Ji and Zhao (1994), the Tharp model
cannot be applied to composites containing low to
moderate volume fractions of strong phase (e.g.,
Vs < 0.60) because they generally cannot form a SPS
structure.
4.5.8. Tullis–Horowitz–Tullis empirical formulas and
Ji–Zhao bounds
One important consequence of the Voigt or
Reuss (arithmetic) averaging is that the resultant
composite creep data cannot be represented by a
simple power law although the relation between
flow stress and strain rate for each phase follows
a power law. Given this restriction, Ji and Zhao
(1993) proposed that the upper and lower bounds
for the strength of multiphase composites can be
obtained from a volume-weighted geometric average
of the end-members under isostrain and isostress
conditions, respectively. There are two advantages
to this approach: (1) all the rheological parameters
(n, A and Q) for the composite can be easily
calculated (see Eqs. (4 to 6) and (9 to 11) in Ji
and Zhao, 1993); and (2) the gap between the upper
and lower bounds (Fig. 12d) is much smaller than
that between the Voigt and Reuss bounds (Fig. 12a).
Using a coefficient F which describes the state of
strain rate or stress distribution among the constitu-
ent phases in the composite (F = 0 for the uniform
strain distribution and F = 1 for uniform stress dis-
tribution), one can easily obtain a power law and its
parameters for the multiphase composite through an
iterative process (Ji and Zhao, 1993). As a particular
case where a composite consists of only two phases
and has F = 0.5, the geometric averaging leads one to
obtain the following equations:
nc ¼ 10ðVslognsþVwlognw Þ ð14Þ
Qc ¼Qwðnc � nsÞ � Qsðnc � nwÞ
nw � nsð15Þ
Ac ¼ 10½logAwðnc�nsÞ�logAsðnc�nwÞ�=ðnw�nsÞ: ð16Þ
These three equations were proposed as empirical
formulas by Tullis et al. (1991) who are the
forerunners for studying the rheology of two-phase
rocks. They found that the flow strength of diabase
containing 36 vol.% plagioclase and 64 vol.%
clinopyroxene, predicted from Eqs. (14)– (16),
agrees well with their results from finite element
modeling. As shown in Fig. 12d, the Ji–Zhao lower
and upper bounds seem to be a good approximation
for the flow strengths of Fo–En composites with
VFo� 0.4 and VFo 0.6, respectively. At VFo = 0.5,
the Tullis–Horowitz–Tullis empirical formulas or
the Ji–Zhao iteration with F = 0.5 both predict
composite flow strengths consistent with the exper-
imental data.
4.5.9. Zhao–Ji model
Ravichandran and Seetharaman (1993) considered
that the rheological behavior of a two-phase compo-
site can be represented by the behavior of a basic unit
cell containing one inclusion and the surrounding
matrix. Stimulated by this idea, Zhao and Ji (1994)
obtained the flow strength (rc) of the composite at a
given strain rate (ec), in which both the inclusion and
matrix materials display power-law rheological
S. Ji et al. / Tectonophysics 341 (2001) 69–9388
behaviors, by numerically solving the following two
equations:
rc ¼ ð1� V2=3i Þ _ec
Amexp�Qm
RT
� � !1=nm
þV2=3i re2
ð17Þ
_ec ¼ ð1� V1=3i ÞAmrnm
e2 exp�Qm
RT
� �
þ V1=3i Air
nie2exp
�Qi
RT
� �ð18Þ
where the subscripts i and m stand for the inclusion
and the matrix, respectively, and is the average stress
of element 2 defined in Zhao and Ji (1994). The re2
value in Eq. (17) can be obtained from Eq. (18). A
computer program for solving Eqs. (17) and (18) is
available upon request from the first author. By
alternatively taking i in Eqs. (17) and (18) to be Fo
or En, we obtained the flow strengths of composites
with WPS or SPS structures. In the WPS structure,
Fo acts as inclusions in a matrix of En. In the SPS
structure, however, En acts as inclusions in a matrix
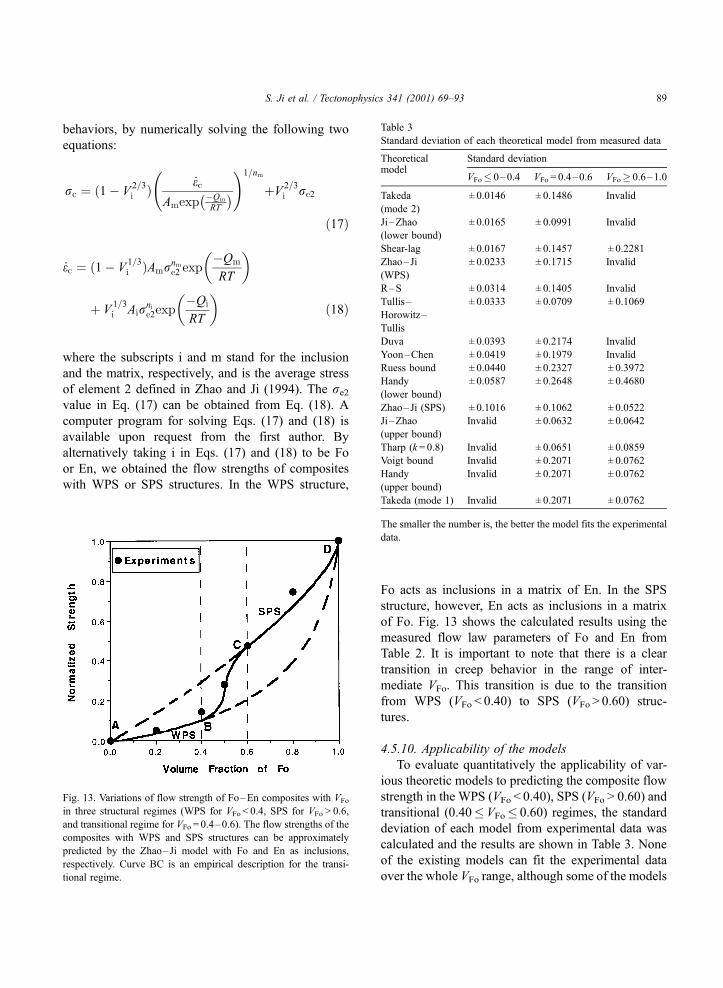
of Fo. Fig. 13 shows the calculated results using the
measured flow law parameters of Fo and En from
Table 2. It is important to note that there is a clear
transition in creep behavior in the range of inter-
mediate VFo. This transition is due to the transition
from WPS (VFo < 0.40) to SPS (VFo > 0.60) struc-
tures.
4.5.10. Applicability of the models
To evaluate quantitatively the applicability of var-
ious theoretic models to predicting the composite flow
strength in the WPS (VFo < 0.40), SPS (VFo > 0.60) and
transitional (0.40�VFo� 0.60) regimes, the standard
deviation of each model from experimental data was
calculated and the results are shown in Table 3. None
of the existing models can fit the experimental data
over the whole VFo range, although some of the models
Fig. 13. Variations of flow strength of Fo–En composites with VFo
in three structural regimes (WPS for VFo < 0.4, SPS for VFo > 0.6,
and transitional regime for VFo = 0.4–0.6). The flow strengths of the
composites with WPS and SPS structures can be approximately
predicted by the Zhao–Ji model with Fo and En as inclusions,
respectively. Curve BC is an empirical description for the transi-
tional regime.
Table 3
Standard deviation of each theoretical model from measured data
Theoretical Standard deviationmodel
VFo� 0–0.4 VFo = 0.4–0.6 VFo 0.6–1.0
Takeda
(mode 2)
± 0.0146 ± 0.1486 Invalid
Ji –Zhao
(lower bound)
± 0.0165 ± 0.0991 Invalid
Shear-lag ± 0.0167 ± 0.1457 ± 0.2281
Zhao–Ji
(WPS)
± 0.0233 ± 0.1715 Invalid
R–S ± 0.0314 ± 0.1405 Invalid
Tullis–
Horowitz–
Tullis
± 0.0333 ± 0.0709 ± 0.1069
Duva ± 0.0393 ± 0.2174 Invalid
Yoon–Chen ± 0.0419 ± 0.1979 Invalid
Ruess bound ± 0.0440 ± 0.2327 ± 0.3972
Handy
(lower bound)
± 0.0587 ± 0.2648 ± 0.4680
Zhao–Ji (SPS) ± 0.1016 ± 0.1062 ± 0.0522
Ji–Zhao
(upper bound)
Invalid ± 0.0632 ± 0.0642
Tharp (k= 0.8) Invalid ± 0.0651 ± 0.0859
Voigt bound Invalid ± 0.2071 ± 0.0762
Handy
(upper bound)
Invalid ± 0.2071 ± 0.0762
Takeda (mode 1) Invalid ± 0.2071 ± 0.0762
The smaller the number is, the better the model fits the experimental
data.
S. Ji et al. / Tectonophysics 341 (2001) 69–93 89
match the experimental data well over a limited VFo
range. In the WPS regime (VFo < 0.40), Takeda (1998)
mode 2, Ji and Zhao (1993) lower bound, the shear-lag
model, Zhao–Ji WPS model, and Yoon–Chen model
provide relatively good assessments for the composite
flow strength with the standard deviations < 3%. In
contrast, the Reuss bound, Handy lower bound, Duva
model and Ravichandran–Seetharaman model tend to
underestimate the composite flow strength. In the SPS
regime (VFo > 0.60), only Zhao–Ji SPS model and Ji–
Zhao upper bound can predict approximately the
composite flow strength with the standard devia-
tions < 7%. These results are consistent with the
assumptions and limitations of these theoretical mo-
dels.
All the analytical models used to compare with our
experimental data were based on an assumption that
the overall mechanical behavior of the polyphase
material can be adequately described by continuum
constitutive equations governing balance of energy,
compatibility of strain and stress, and balance of
momentum. Actually, none of the models have taken
into consideration changes in deformation mechanism
of each phase due to mixing of the phases. As shown in
Fig. 12, the general trends and even quantitative
assessments of the bulk flow strength for the Fo–En
composites with the WPS (VFo < 0.40) and SPS
(VFo > 0.60) structures are successfully predicted by
most of the theoretical models. Hence, the agreement
between the theoretical models and our experimental
results provides additional evidence supporting no
change in deformation mechanism of each phase in
the composite compared to in a single-phase aggre-
gate. If there were such changes in deformation mech-
anism, none of the models could give good predictions
for the composite flow strength over any range of Fo
volume fraction.
The remaining problem is for composites in the
transitional regime, for which practically no models
have been developed. Using models based on either
the WPS or SPS structure cannot yield a correct
prediction for the composite strength in the transi-
tional regime. The Fo–En composite is not a unique
case; similar situations have been reported for a
number of two-phase aggregates such as copper–
WC alloy (Gurland, 1979) and calcite–halite aggre-
gates (Bloomfield and Covey-Crump, 1993; Bruhn et
al., 1999).
Rheology of composites in the transitional regime
(Vf = 0.4–0.6) is complex and so far poorly under-
stood. Many polyphase rocks in the Earth’s crust (e.g.,
amphibolite, gabbro, diabase, mafic granulite) can be
represented approximately by two-phase composites
in which each phase is present in the 40–60 vol.%
range. For example, gabbro, diabase, or mafic gran-
ulite often consists of plagioclase and pyroxene at
nearly equal volume fractions. Knowledge of the
creep properties of these rocks is important for under-
standing a wide range of tectonic processes in the
ductile lower crust. Thus, there is a strong need to
carefully characterize the microstructural evolution of
polyphase rocks with progressive strain and to
develop mechanical models with accurate descriptions
of rheological behavior in the transitional regime. The
mechanical modeling should take into account the
following factors which are expected to affect the
rheological behavior of polyphase rocks: (1) The
nature of interfaces (boundaries between strong and
weak phases) may affect the ease of interface slip (Ji
et al., 1998), stress transfer between phases (Zhao and
Ji, 1997) and chemical diffusion along grain bounda-
ries (Wheeler, 1992; Bruhn et al., 1999). (2) Phase
continuity may change with progressive strain (Gur-
land, 1979; Bloomfield and Covey-Crump, 1993;
Dell’Angelo and Tullis, 1996). (3) Change of the
dominant deformation mechanism and reversal of
rheological contrast between phases with deformation
conditions (Tullis et al., 1991; Dell’Angelo and Tullis,
1996; Bruhn et al., 1999).
5. Summary
(1) We have obtained high precision creep data for
melt-free, dry Fo–En composites. The creep behavior
of the Fo–En composites can be described by a
power-law flow law with n = 1.3–2.0 and Q = 472–
584 kJ/mol. The measured n and Q values increase
with decreasing VFo. The mechanical data and TEM
microstructural observations suggest that the En
deformed mainly by dislocation creep while the Fo
deformed by dislocation-accommodated diffusion
creep under the experimental conditions. No change
has been observed in deformation mechanism of each
phase when in the composites, compared to when it is
in a single-phase aggregate.
S. Ji et al. / Tectonophysics 341 (2001) 69–9390
(2) The pure Fo aggregate is stronger than the pure
En aggregate, and the flow strength contrast between
these phases is about 3–8, depending on the experi-
mental conditions. The bulk strength of the Fo–En
composites increases non-linearly with VFo and a dra-
matic increase in the flow strength occurs at VFo = 0.4–
0.6, which is interpreted as resulting from the transition
from a weak-phase supported (WPS, VFo < 0.4) to a
strong-phase supported (SPS, VFo > 0.6) structures.
(3) The Fo–En composite rheological data have
been compared with various theoretical models to
evaluate their applicability. The comparisons indicate
that none of the existing models can give a precise
predication if the model is applied to the entire VFo
range from 0 to 1. WPS-based models such as Takeda
(1998) mode 2, Ji and Zhao (1993) lower bound, the
shear-lag model, Zhao–Ji WPS model, and Yoon–
Chen model yield a good prediction for the flow
strength of En–Fo composites within the range of
VFo < 0.4. SPS-based models such as Zhao–Ji SPS
model, Ji–Zhao upper bound, and Tharp model are
good for composites with VFo > 0.60. In the transi-
tional regime (VFo = 0.40–0.60), however, none of
these models have taken into consideration the
phase-interpenetrating structure of the composites
and thus none give a good estimate for the composite
flow strength. Applications of the WPS- and SPS-
based models into the transitional regime result in
under- and over-estimations for the composite flow
strength, respectively. There is thus a need to develop
theoretical models suitable for the transitional regime;
these models are important for modeling the rheolog-
ical behavior and tectonic deformation of the Earth’s
crust and upper mantle which are polyphase compo-
sites.
Acknowledgements
We thank the NSERC of Canada for research
grants. Ji would like to thank the Alexandre von
Homboldt Stiftung for a visiting fellowship. This
fellowship allowed him to pass his sabbatical year in
Prof. Georg Dresen’s laboratory (GFZ-Potsdam,
Germany). We are grateful to J. Tullis, K.V. Hodges
and an anonymous reviewer for their thoughtful
reviews of the manuscript. This is LITHOPROBE
contribution No. 1222.
References
Anastasiou, P., Seifert, F., 1972. Solid solubility of Al2O3 in ensta-
tite at high temperatures and 1-5 kb water pressure. Contrib.
Mineral. Petrol. 34, 272–287.
Arzi, A.A., 1978. Critical phenomena in the rheology of partially
melted rocks. Tectonophysics 44, 173–184.
Bai, Q., Mackwell, S.J., Kohlstedt, D.L., 1991. High-temperature
creep of olivine single crystals: 1. Mechanical results for buf-
fered samples. J. Geophys. Res. 96, 2441–2463.
Bao, G., Hutchinson, J.W., McMeeking, R.M., 1991. Particle rein-
forcement of ductile matrices against plastic flow and creep.
Acta Metall. Mater. 39, 1871–1882.
Bass, J.D., 1995. Elasticity of minerals, glasses, and melts. In:
Ahrens, T.J. (Ed.), Mineral Physics and Crystallography: A
Handbook of Physical Constants. American Geophysical Union,
Washington, DC, pp. 45–63.
Bloomfield, J.P., Covey-Crump, J., 1993. Correlating mechanical
data with microstructural observations in deformation experi-
ments on synthetic two-phase aggregates. J. Struct. Geol. 15,
1007–1019.
Bruhn, D.F., Olgaard, D.L., Dell’Angelo, L.N., 1999. Evidence for
enhanced deformation in two-phase rocks: experiments on the
rheology of calcite–anhydrite aggregates. J. Geophys. Res. 104,
707–724.
Burg, J.P., Wilson, C.J.L., 1987. Deformation of two phase systems
with contrasting rheology. Tectonophysics 135, 199–205.
Chakraborty, S., Farver, J.R., Yund, R.A., Rubie, D.C., 1992. Mg
tracer diffusion in forsterite and San Carlos olivine. EOS Trans.
AGU 73, 373.
Chopra, P.N., 1986. The plasticity of some fine-grained aggregates of
olivine at high pressure and temperature. In: Hobbs, B.E., Heard,
H.C. (Eds.), Mineral and Rock Deformation: Laboratory Studies.
American Geophysical Union, Washington, DC, pp. 25–34.
Clarke, D.R., 1992. Interpenetrating phase composites. J. Am. Ce-
ram. Soc. 75, 739–759.
Cox, H.L., 1952. The elasticity and strength of paper and other
fibrous materials. Br. J. Appl. Phys. 3, 72–79.
Daines, M.J., Kohlstedt, D.L., 1996. Rheology of olivine–pyroxene
aggregate. EOS Trans. AGU 77, 711.
Darot, M., Gueguen, Y., 1981. High-temperature creep of forsterite
single crystals. J. Geophys. Res. 86, 6219–6234.
Dell’Angelo, L.N., Tullis, J., 1996. Textural and mechanical evolu-
tion with progressive strain in experimentally deformed aplite.
Tectonophysics 256, 57–82.
Dresen, G., Evans, B., Olgaard, D.L., 1998. Effect of quartz inclu-
sions on plastic flow in marble. J. Geophys. Lett. 25, 1245–
1248.
Drury, M.R., Fitz Gerald, J.D., 1996. Grain boundary melt films in
an experimentally deformed olivine–orthopyroxene rocks: im-
plications for melt distribution in upper mantle rocks. Geophys.
Res. Lett. 23, 701–704.
Duva, J.M., 1984. A self-consistent analysis of the stiffening effect
of rigid inclusions on a power-law material. J. Eng. Mater.
Technol. 106, 317–321.
Fliervoet, T.F., Drury, M.R., Chopra, P.N., 1999. Crystallographic
preferred orientations and misorientations in some olivine rocks
S. Ji et al. / Tectonophysics 341 (2001) 69–93 91
deformed by diffusion or dislocation creep. Tectonophysics 303,
1–27.
Gilotti, J.A., 1992. The rheological critical matrix in arkosic mylon-
ites along the Sarv Thrust, Swedish Caledonides. In: Mitra, S.,
Fisher, G.W. (Eds.), Structural Geology of Fold and Thrust
Belts. Johns Hopkins Univ. Press, Baltimore, pp. 145–160.
Griffiths, T.J., Davies, R., Bassett, M.B., 1979. Analytical study of
effects of pore geometry on tensile strength of porous materials.
Power Metall. 22, 119–123.
Gurland, J., 1979. A structural approach to the yield strength of two-
phase alloys with coarse microstructures. Mater. Sci. Eng. 40,
59–71.
Handy, M.R., 1994. Flow laws for rocks containing two non-linear
viscous phases: a phenomenological approach. J. Struct. Geol. 16,
287–301 (also see his Correction, J. Struct. Geol. 16, 1727,
1994).
Hirth, G., Kohlstedt, D.L., 1995. Experimental constraints on the
dynamics of the partially molten upper mantle: deformation in
diffusion creep regime. J. Geophys. Res. 100, 1981–2001.
Hitchings, R.S., Paterson, M.S., Bitmead, J., 1989. Effect of iron
and magnetite additions in olivine–pyroxene rheology. Phys.
Earth Planet. Inter. 55, 277–291.
Hull, D., Clyne, T.W., 1996. An introduction to Composite Materi-
als. Cambridge University Press, New York.
Jaoul, O., Froidevaux, C., Durham, W.B., Michaut, M., 1980. Oxy-
gen self-diffusion in forsterite: implications for the high-temper-
ature creep mechanism. Earth Planet. Sci. Lett. 47, 391–397.
Jaoul, O., Poumellec, M., Froidevaux, C., Havette, C., 1981. Silicon
diffusion in forsterite: a new constraint for understanding mantle
deformation. In: Stacey, F.D., Paterson, M.S., Nicolas, A. (Eds.),
Anelasticity in the Earth. Am. Geophys. Union, Washington,
DC, pp. 95–100.
Ji, S., Wang, Z.C., 1999. Elastic properties of forsterite–enstatite
composites up to 3.0 GPa. J. Geodyn. 28, 147–174.
Ji, S., Zhao, P., 1993. Flow laws of multiphase rocks calculated
from experimental data on the constituent phases. Earth Planet.
Sci. Lett. 117, 181–187.
Ji, S., Zhao, P., 1994. Strength of two-phase rocks: a model based
on fiber-loading theory. J. Struct. Geol. 16, 253–262.
Ji, S., Zhu, Z.M., Wang, Z.C., 1998. Relationship between joint
spacing and bed thickness in sedimentary rocks in the Saint-
Jean-Port-Joli area of Quebec Appalachians: effects of interbed
slip. Geol. Mag. 135, 637–655.
Ji, S., Jiang, Z., Wirth, R., 1999. Crystallographic preferred orien-
tation (CPO) of experimentally sheared plagioclase aggregates:
implications for crustal heterogeneity (abstract). EOS Trans.
AGU 80, 916.
Ji, S., Wirth, R., Rybacki, E., Jiang, Z., 2000. High-temperature
plastic deformation of quartz-plagioclase multilayers by layer-
normal compression. J. Geophys. Res. 105, 16651–16664.
Jordan, P., 1987. The deformational behavior of bimineralic lime-
stone–halite aggregates. Tectonophysics 135, 185–197.
Jordan, P., 1988. The rheology of polymineralic rocks—an ap-
proach. Geol. Rundsch. 77, 285–294.
Karato, S., Paterson, M.S., Fitz Gerald, J.D., 1986. Rheology of
synthetic olivine aggregates: influence of grain size and water.
J. Geophys. Res. 91, 8151–8176.
Kelly, A., Macmillan, N.H., 1986. Strong Solids Oxford Science
Publications, Oxford.
Kelly, A., Street, K.N., 1972. Creep of discontinuous fiber compo-
sites: II. Theory for the steady-state. Proc. R. Soc. London, Ser.
A 328, 283–293.
Kirby, S.H., Christie, J.M., 1977. Mechanical twinning in diopside
Ca(Mg,Fe)Si2O6: structural mechanism and associated crystal
defects. Phys. Chem. Miner. 1, 137–163.
Kohlstedt, D.L., Evans, B., Mackwell, S.J., 1995. Strength of the
lithosphere: constraints imposed by laboratory experiments. J.
Geophys. Res. 100, 17587–17602.
Kohlstedt, D.L., Bai, Q., Wang, Z.C., Mei, S., 2000. Rheology
of partially molten rocks. In: Bagdassarov, N., LaPorte, D.,
Thompson, A.B. (Eds.), Physics and Chemistry of Partially
Molten Rocks, Kluwer Academic Publishing, Boston, pp.
3–28.
Kronenberg, A.K., Shelton, G.L., 1980. Deformation microstruc-
tures in experimentally deformed Maryland diabase. J. Struct.
Geol. 2, 341–353.
Lange, F.F., Davis, B.I., Clarke, D.R., 1980. Compressive creep of
Si3N4/MgO alloys: Part 1. Effect of composition. J. Mater. Sci.
15, 601–610.
Lawlis, J., 1997. Experimental deformation of olivine–enstatite
aggregates. Unpublished PhD thesis, Pennsylvania State Uni-
versity.
Li, P., Wang, Z.C., Karato, S., 1996. High-temperature creep in
fined-grained polycrystalline CaTiO3, an analogue material
of (Mg,Fe)SiO3 perovskite. Phys. Earth Planet. Inter. 95,
19–36.
Mackwell, S., Kohlstedt, D.L., 1986. High-temperature deformation
of forsterite single crystals doped with vanadium. Phys. Chem.
Miner. 13, 351–356.
Mackwell, S.J., Zimmerman, M.E., Kohlstedt, D.L., 1998. High-
temperature deformation of dry diabase with application to tec-
tonics on Venus. J. Geophys. Res. 103, 975–984.
McDonnell, R.D., Peach, C.J., van Roermund, H.L.M., Spiers, C.J.,
2000. Effect of varying enstatite content on the deformation
behavior of fine-grained synthetic peridotite under wet condi-
tions. J. Geophys. Res. 105, 13535–13553.
Nardone, V.C., Prewo, K.M., 1986. On the strength of discontinu-
ous silicon carbide reinforced aluminum composites. Scr. Met-
all. 20, 43–48.
Paterson, M.S., 1989. The interaction of water with quartz and its
influence in dislocation flow—an overview. In: Karato, S., To-
rium, M. (Eds.), Rheology of Solids and of the Earth. Oxford
Science Publications, New York, pp. 107–142.
Poirier, J.P., 1985. Creep of Crystals. Cambridge Univ. Press, New
York.
Presnall, D.C., 1995. Phase diagrams of Earth-forming minerals. In:
Ahrens, T.J. (Ed.), Mineral Physics and Crystallography, A
Handbook of Physical Constants. America Geophysical Union,
Washington, pp. 248–267.
Raj, R., 1982. Separation of cavitation-strain and creep strain during
deformation. J. Am. Ceram. Soc. 65, 46–48.
Raleigh, C.B., Kirby, S.H., Carter, N.L., Ave Lallemant, H.G., 1971.
Slip and the clinoenstatite transformation as competing pro-
cesses in enstatite. J. Geophys. Res. 76, 4011–4022.
S. Ji et al. / Tectonophysics 341 (2001) 69–9392
Ravichandran, K.S., Seetharaman, V., 1993. Prediction of steady
state creep behavior of two-phase composites. Acta Metall. Ma-
ter. 41, 3351–3361.
Relandeau, C., 1981. High temperature creep of forsterite polycrys-
talline aggregates. Geophys. Res. Lett. 8, 733–736.
Ricoult, D.L., Kohlstedt, D.L., 1985. Experimental evidence for
the effect of chemical environment upon the creep rate of
olivine. In: Shock, R.N. (Ed.), Point Defects in Minerals.
Geophys. Monogr. Ser., vol. 31. AGU, Washington, DC,
pp. 171–184.
Ross, J.V., Nielsen, K.C., 1978. High-temperature flow of wet poly-
crystalline enstatite. Tectonophysics 44, 233–261.
Ross, J.V., Bauer, S.J., Hansen, F.D., 1987. Texture evolution of
synthetic anhydrite – halite mylonite. Tectonophysics 140,
307–326.
Rutter, E.H., Neumann, D.H.K., 1995. Experimental deformation of
partially molten Westerly granite under fluid-absent conditions,
with implications for the extraction of granitic magma. J. Geo-
phy. Res. 100, 15697–15715.
Takeda, Y.T., 1998. Flow in rocks modeled as multiphase con-
tinua: application to polymineralic rocks. J. Struct. Geol. 20,
1569–1578.
Tharp, T.M., 1983. Analogies between the high-temperature defor-
mation of polyphase rocks and the mechanical behavior of po-
rous powder metal. Tectonophysics 96, T1–T11.
Tsai, R.L., Raj, R., 1982. Overview 18: creep fracture in ceramics
containing small amount of a liquid phase. Acta Metall. 30,
1043–1058.
Tullis, J., Wenk, H.R., 1994. Effect of muscovite on the strength and
lattice preferred orientations of experimentally deformed quartz
aggregates. Mater. Sci. Eng. A 175, 209–220.
Tullis, T.E., Horowitz, F.G., Tullis, J., 1991. Flow law of polyphase
aggregates from end-member flow laws. J. Geophys. Res. 96,
8081–8096.
Unskov, E.P., 1961. An Engineering Theory of Plasticity. Butter-
worths, London.
Wheeler, J., 1992. Importance of pressure solution and Coble creep
in the deformation of polymineralic rocks. J. Geophys. Res. 97,
4586–4597.
Wirth, R., 1996. Thin amorphous films (1–2 nm) at olivine grain
boundaries in mantle xenoliths from San Carlos, Arizona. Con-
trib. Mineral. Petrol. 124, 44–54.
Xiao, X., 1999. Experimental Study of the Rheology of Synthetic
Anorthite-Quartz Aggregates. GeoForschungsZentrum Pots-
dam, Germany, Scientific Technical Report STR99/14, 125 pp.
Yoon, C.K., Chen, I.W., 1990. Superplastic flow of two-phase ce-
ramics containing rigid inclusions-zirconia/mullite composites.
J. Am. Ceram. Soc. 73, 1555–1565.
Zhao, P., Ji, S., 1994. Creep analysis of two-phase rocks. Canadian
Lithoprobe Abitibi-Grenville Project Report 41, pp. 159–164.
Zhao, P., Ji, S., 1997. Refinements of shear-lag model and its ap-
plications. Tectonophysics 279, 37–53.
S. Ji et al. / Tectonophysics 341 (2001) 69–93 93
Related Documents