Bromley Briefings Prison Factfile Autumn 2017 These ‘Bromley Briefings’ are produced in memory of Keith Bromley, a valued friend of the Prison Reform Trust and allied groups concerned with prisons and human rights. His support for refugees from oppression, victims of torture and the falsely imprisoned made a difference to many people’s lives. The Prison Reform Trust is grateful to the Bromley Trust for supporting the production of this briefing.

Welcome message from author
This document is posted to help you gain knowledge. Please leave a comment to let me know what you think about it! Share it to your friends and learn new things together.
Transcript
Bromley Briefings Prison FactfileAutumn 2017
These ‘Bromley Briefings’ are produced in memory of Keith Bromley, a valued friend of the Prison Reform Trust and allied groups concerned with prisons and human rights. His support for refugees from oppression, victims of torture and the falsely imprisoned made a difference to many people’s lives. The Prison Reform Trust is grateful to the Bromley Trust for supporting the production of this briefing.

Acknowledgements
The briefing was researched and written by Alex Hewson with assistance, additional research and fact checking by Isobel Roberts. We thank the Bromley Trust for their continued support which allows us to produce these briefings.
We are grateful to everyone who has provided updated information and statistics during the production of this edition.
Cover image by AndyAitchison.uk
Contents
Introduction . . . . . . . . . . . . . . . . . . . . . . . 5
The state of our prisonsThe long view . . . . . . . . . . . . . . . . . . . . . . . 8Sentencing and the use of custody . . . . . . . . . . . . . . . 12Safety in prisons . . . . . . . . . . . . . . . . . . . . . . 14Treatment and conditions . . . . . . . . . . . . . . . . . . . 16Overcrowding and changes to the prison estate . . . . . . . . . . . 18Prison service resources and staffing . . . . . . . . . . . . . . 19Private prisons . . . . . . . . . . . . . . . . . . . . . . 20
People in prisonSocial characteristics of adult prisoners . . . . . . . . . . . . . . 22People on remand . . . . . . . . . . . . . . . . . . . . . 23Black, Asian and minority ethnic people in prison . . . . . . . . . . 24Older people in prison . . . . . . . . . . . . . . . . . . . . 26Life and indeterminate sentences . . . . . . . . . . . . . . . . 28People with learning disabilities and difficulties . . . . . . . . . . . 30Foreign nationals in prison . . . . . . . . . . . . . . . . . . 32Women in prison . . . . . . . . . . . . . . . . . . . . . . 34Children in prison . . . . . . . . . . . . . . . . . . . . . 37Young adults in prison . . . . . . . . . . . . . . . . . . . . 40
Health in prisonDrugs and alcohol . . . . . . . . . . . . . . . . . . . . . 42Mental health . . . . . . . . . . . . . . . . . . . . . . . 44Disability and health . . . . . . . . . . . . . . . . . . . . 45
Rehabilitation and resettlementReoffending . . . . . . . . . . . . . . . . . . . . . . . 48Purposeful activity . . . . . . . . . . . . . . . . . . . . . 49Resettlement . . . . . . . . . . . . . . . . . . . . . . . 53Family . . . . . . . . . . . . . . . . . . . . . . . . . 54
Other UK prison systemsScotland . . . . . . . . . . . . . . . . . . . . . . . . 56Northern Ireland . . . . . . . . . . . . . . . . . . . . . . 59


Introduction
This year’s Bromley Briefings open with a brand new section which we have called “The long view”. The Prison Reform Trust has built its reputation over more than three decades on presenting accurate evidence about prisons and the people in them. In a world where ministers feel compelled to respond to issues with ever greater immediacy, “The long view” offers an antidote to the latest Twitter storm or early morning grilling in the media.
We have chosen to concentrate in this briefing on the issue of overcrowding. What the evidence shows is that the core of the current government’s approach—to spend more building more prison spaces—is identical to the actions of all its predecessors since the early 1990s.
There is every possible indication that it will meet the same fate. So PRT has commissioned two pieces of expert independent analysis relevant to any serious strategic policy to solve the problem of overcrowding.
First, we asked a former Director of Finance for the prison service, Julian Le Vay, to analyse the published data on the Ministry of Justice’s spending review settlement with the Treasury and its plans for future investment in new prisons. He concluded that the capital cost of a policy based on building more prisons since 1980 has been £3.7bn, and generated an additional annual running cost of £1.5bn—enough to have built 25,000 new homes, and to be employing 50,000 more nurses or teachers. But he also concludes that the ministry’s current ambitions are inadequately funded to the tune of £162m in 2018/19, rising to £463m in 2022/23. On current population projections, there is no prospect of any impact on overcrowding before 2022, and a further new programme of building will be needed from 2026.
Secondly, we asked Dr Savas Hadjipavlou, of Justice Episteme, to run a scenario on the sophisticated model he has created. This uses what we know about the typical life histories of people who end up in the criminal justice system, together with what we know about how that system operates, to assess the impact of demographic or other changes on key criminal justice outcomes—including the likely size of the prison population. The scenario removed the statutory changes that have inflated sentencing since 2003, and suggests that we would now have a prison population of 70,000 had those changes not been made—in other words, a population several thousand below the system’s current uncrowded capacity.
In 1990, the then Director General of the prison service said:
“The removal of overcrowding is, in my view, an indispensable pre-condition of sustained and universal improvement in prison conditions…for improvement to be solid and service-wide, the canker of overcrowding must be rooted out.”
Few with any close knowledge of the system would take a different view now. Given this briefing’s depressing catalogue of failure to improve conditions in our prisons over the last 12 months, it is essential that the current justice secretary—a historian himself—learns the lessons of the past. He can no more build his way to a decent prison service than any of his predecessors. There is an affordable and practical route to reform, but it requires a fundamental rethink of who goes to prison, and for how long. A wise secretary of state should choose no other foundation on which to build.
5

6
THE STATE OF OUR PRISONS
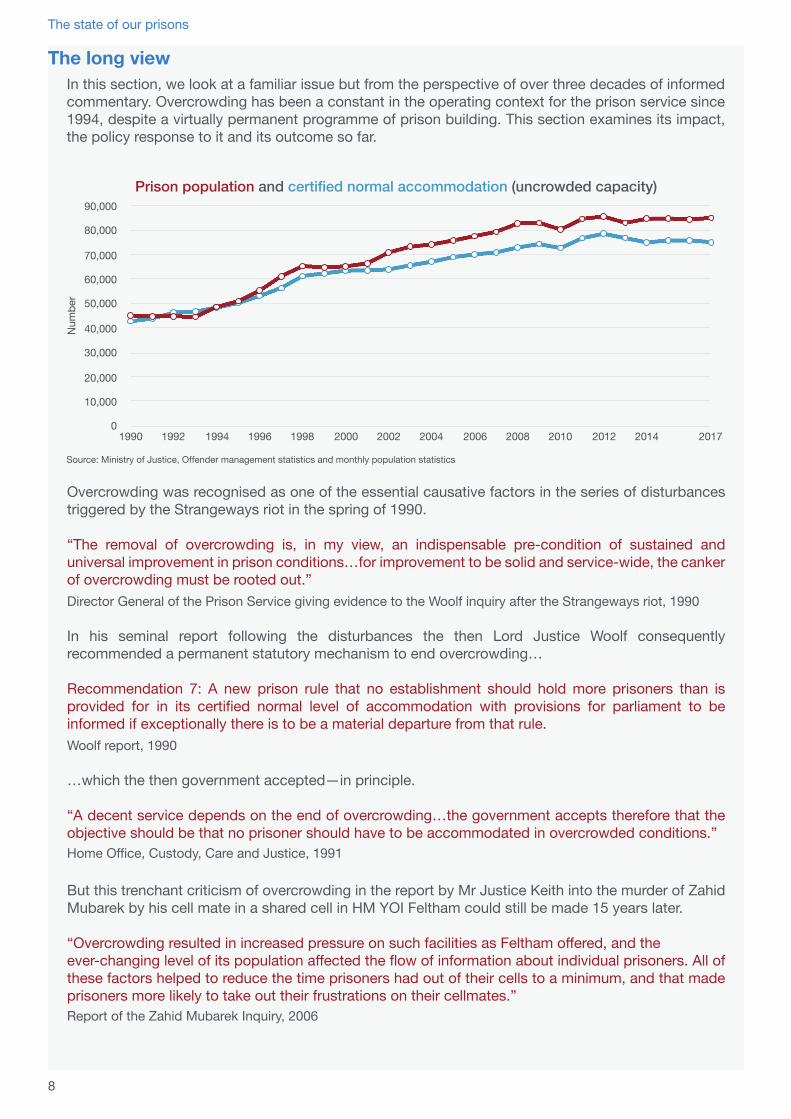
In this section, we look at a familiar issue but from the perspective of over three decades of informed commentary. Overcrowding has been a constant in the operating context for the prison service since 1994, despite a virtually permanent programme of prison building. This section examines its impact, the policy response to it and its outcome so far.
Source: Ministry of Justice, Offender management statistics and monthly population statistics
Num
ber
0
10,000
20,000
30,000
40,000
50,000
60,000
70,000
80,000
90,000
1990 1992 1994 1996 1998 2000 2002 2004 2006 2008 2010 2012 2014 2017
Prison population and certified normal accommodation (uncrowded capacity)
Overcrowding was recognised as one of the essential causative factors in the series of disturbances triggered by the Strangeways riot in the spring of 1990.
“The removal of overcrowding is, in my view, an indispensable pre-condition of sustained and universal improvement in prison conditions…for improvement to be solid and service-wide, the canker of overcrowding must be rooted out.”Director General of the Prison Service giving evidence to the Woolf inquiry after the Strangeways riot, 1990
In his seminal report following the disturbances the then Lord Justice Woolf consequently recommended a permanent statutory mechanism to end overcrowding…
Recommendation 7: A new prison rule that no establishment should hold more prisoners than is provided for in its certified normal level of accommodation with provisions for parliament to be informed if exceptionally there is to be a material departure from that rule.Woolf report, 1990
…which the then government accepted—in principle.
“A decent service depends on the end of overcrowding…the government accepts therefore that the objective should be that no prisoner should have to be accommodated in overcrowded conditions.”Home Office, Custody, Care and Justice, 1991
But this trenchant criticism of overcrowding in the report by Mr Justice Keith into the murder of Zahid Mubarek by his cell mate in a shared cell in HM YOI Feltham could still be made 15 years later.
“Overcrowding resulted in increased pressure on such facilities as Feltham offered, and theever-changing level of its population affected the flow of information about individual prisoners. All of these factors helped to reduce the time prisoners had out of their cells to a minimum, and that made prisoners more likely to take out their frustrations on their cellmates.”Report of the Zahid Mubarek Inquiry, 2006
The long view
8
The state of our prisons
Overcrowding cripples the prison system’s ability to provide a decent and constructive public service. This is not just because 21,000 people still share cells, for up to 23 hours a day, designed for fewer occupants, often eating their meals in the same space as the toilet they share. It is also because every day people are bussed around the country to extraordinarily remote locations just to make sure that every last bed space is filled.
Inspectors regularly find a third or more people unoccupied during the working day because a prison holds more people than it should. People progressing well with their sentence are suddenly told they must move on, regardless of any courses they may be undertaking, or their family ties to an area.
The effects of overcrowding have been spelt out in successive reports by inspectors and Independent Monitoring Boards for more than three decades.
“To relieve overcrowding, [HMP Brixton] is constantly having to select batches of prisoners to send to other establishments. Indeed, because of this overcrowding, a number of prisoners must be kept frequently in police custody overnight instead of being received into the prison.”HM Inspectorate of Prisons, HMP Brixton 1983
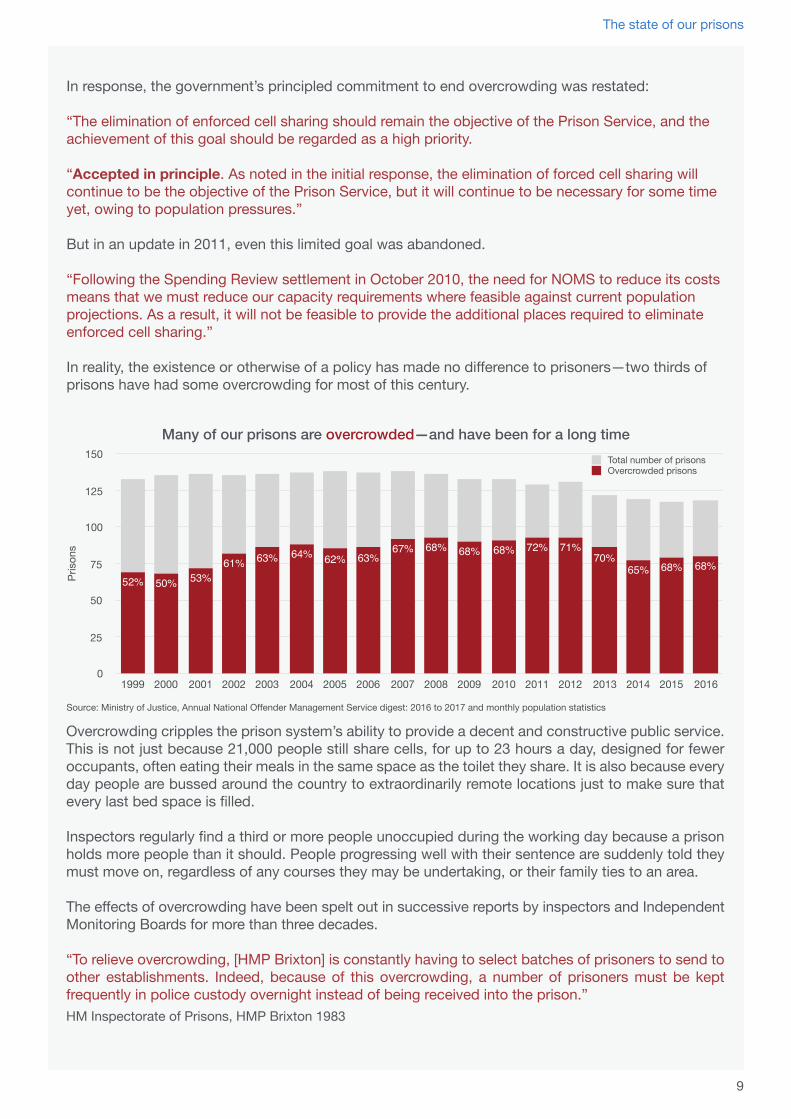
Many of our prisons are overcrowded—and have been for a long time
Source: Ministry of Justice, Annual National Offender Management Service digest: 2016 to 2017 and monthly population statistics
Pris
ons
0
25
50
75
100
125
150
1999 2000 2001 2002 2003 2004 2005 2006 2007 2008 2009 2010 2011 2012 2013 2014 2015 2016
68%68%65%70%
71%72%68%68%68%67%63%62%64%63%61%
53%50%52%
Overcrowded prisonsTotal number of prisons
In response, the government’s principled commitment to end overcrowding was restated:
“The elimination of enforced cell sharing should remain the objective of the Prison Service, and the achievement of this goal should be regarded as a high priority.
“Accepted in principle. As noted in the initial response, the elimination of forced cell sharing will continue to be the objective of the Prison Service, but it will continue to be necessary for some time yet, owing to population pressures.”
But in an update in 2011, even this limited goal was abandoned.
“Following the Spending Review settlement in October 2010, the need for NOMS to reduce its costs means that we must reduce our capacity requirements where feasible against current population projections. As a result, it will not be feasible to provide the additional places required to eliminate enforced cell sharing.”
In reality, the existence or otherwise of a policy has made no difference to prisoners—two thirds of prisons have had some overcrowding for most of this century.
9
The state of our prisons
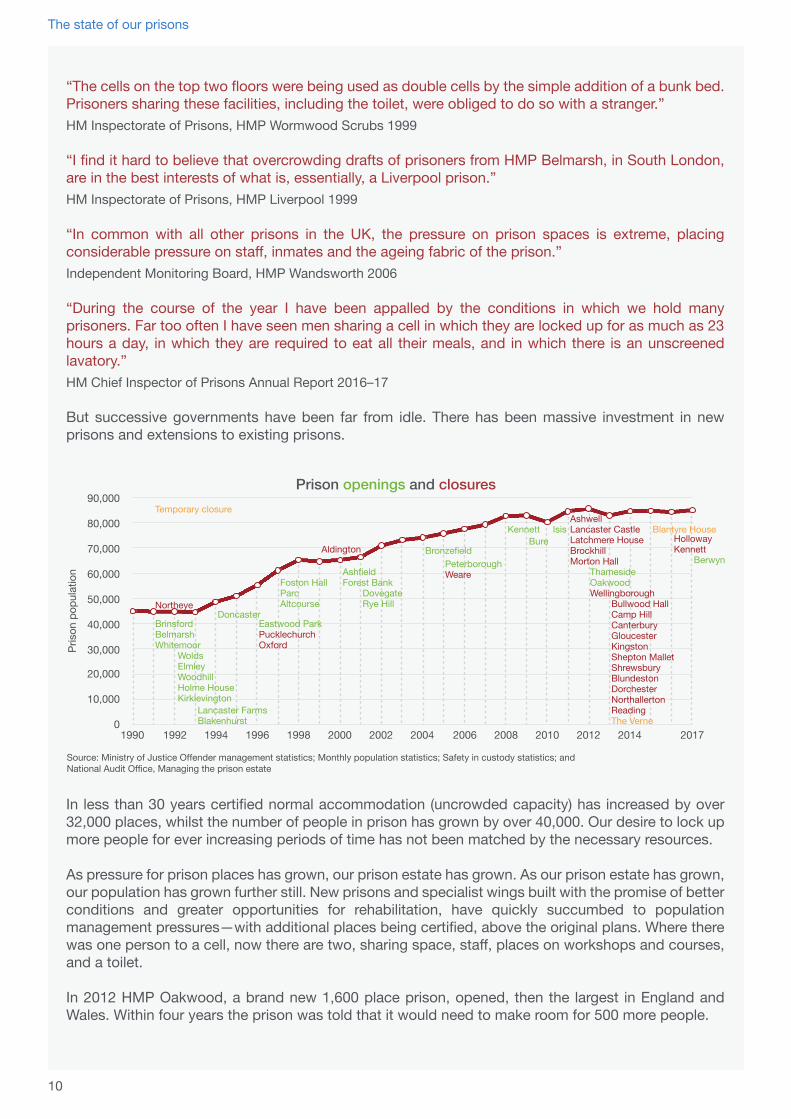
In less than 30 years certified normal accommodation (uncrowded capacity) has increased by over 32,000 places, whilst the number of people in prison has grown by over 40,000. Our desire to lock up more people for ever increasing periods of time has not been matched by the necessary resources.
As pressure for prison places has grown, our prison estate has grown. As our prison estate has grown, our population has grown further still. New prisons and specialist wings built with the promise of better conditions and greater opportunities for rehabilitation, have quickly succumbed to population management pressures—with additional places being certified, above the original plans. Where there was one person to a cell, now there are two, sharing space, staff, places on workshops and courses, and a toilet.
In 2012 HMP Oakwood, a brand new 1,600 place prison, opened, then the largest in England and Wales. Within four years the prison was told that it would need to make room for 500 more people.
Pris
on p
opul
atio
n
0
10,000
20,000
30,000
40,000
50,000
60,000
70,000
80,000
90,000
1990 1992 1994 1996 1998 2000 2002 2004 2006 2008 2010 2012 2014 2017
BrinsfordBelmarshWhitemoor
WoldsElmleyWoodhillHolme HouseKirklevington
Lancaster FarmsBlakenhurst
Doncaster
Berwyn
Foston HallParcAltcourse
Eastwood ParkPucklechurchOxford
Forest BankDovegateRye Hill
BrPeterboroughWeare
KennettBure
Isis
ThamesideOakwoodWellingborough
Northeye
Aldington
AshwellLancaster CastleLatchmere HouseBrockhillMorton Hall
Bullwood HallCamp HillCanterbury GloucesterKingstonShepton MalletShrewsburyBlundestonDorchesterNorthallertonReadingThe Verne
HollowayKennett
Temporary closure
Blantyre House
Source: Ministry of Justice Offender management statistics; Monthly population statistics; Safety in custody statistics; and National Audit Office, Managing the prison estate
Prison openings and closures
“The cells on the top two floors were being used as double cells by the simple addition of a bunk bed. Prisoners sharing these facilities, including the toilet, were obliged to do so with a stranger.”HM Inspectorate of Prisons, HMP Wormwood Scrubs 1999
“I find it hard to believe that overcrowding drafts of prisoners from HMP Belmarsh, in South London, are in the best interests of what is, essentially, a Liverpool prison.”HM Inspectorate of Prisons, HMP Liverpool 1999
“In common with all other prisons in the UK, the pressure on prison spaces is extreme, placing considerable pressure on staff, inmates and the ageing fabric of the prison.” Independent Monitoring Board, HMP Wandsworth 2006
“During the course of the year I have been appalled by the conditions in which we hold many prisoners. Far too often I have seen men sharing a cell in which they are locked up for as much as 23 hours a day, in which they are required to eat all their meals, and in which there is an unscreened lavatory.”HM Chief Inspector of Prisons Annual Report 2016–17
But successive governments have been far from idle. There has been massive investment in new prisons and extensions to existing prisons.
10
The state of our prisons

While there has been intense focus and investment in building new capacity, there has been little or no attention given to reducing demand. As our section on sentencing and the use of custody (page 12) shows, it is the growth in sentence lengths for the most serious offences which keeps our imprisonment rate for men the highest in western Europe. Whilst for women, disproportionately sent to prison for non- violent crime and on short sentences, the answer lies largely in diverting people from custody altogether.
Whilst sentences are passed by the courts, in most cases they operate within guidelines devised by the independent Sentencing Council, who in turn are guided by the statutory framework debated and established by parliament. Politicians determine the maximum sentences available for the most serious crimes, from which all other sentencing guidelines flow. For three decades, there has been a constant stream of policy change, most of which has driven up the use of prison. The one sustained attempt to reduce the use of prison immediately following the Woolf Report in 1990 produced the only years in this period when capacity matched demand.
Source: Home Office, Prison statistics 1999; Ministry of Justice, Prison population projections 2008–2015; Ministry of Justice, Story of the Prison Population: 1993–2016 and previous edition
Pris
on p
opul
atio
n
0
10,000
20,000
30,000
40,000
50,000
60,000
70,000
80,000
90,000
1990 1992 1994 1996 1998 2000 2002 2004 2006 2008 2010 2012 2014 2017
Criminal Justice Act 1991
Criminal Justice Act 1993
O ensive Weapons Act 1996
Crime (Sentences)Act 1997
Crime and DisorderAct 1998
Narey measures1999
Criminal Justice Act 2003
IPP sentenceenacted 2005
Tackling Knives Action Plan 2008Criminal Justice and Immigration Act 2008
Coroners and Justice Act 2009
Knife/weapon murders 25 year minimum term 2010
England riots 2011
LASPOAct 2012
Offender RehabilitationAct 2014
Criminal Justice &Courts Act 2015Serious CrimeAct 2015
Key legislation and policy changes
The government has now announced £1.3bn to invest in reforming and modernising the prison estate, committing to build nine new prisons—five of these by 2020. In part, this is designed to deliver a modest revival of a policy intention to reduce—not eliminate—overcrowding. However, prison population projections, published in September 2017, revealed that the population is expected to grow by around 1,600 above previous predictions by 2022. These raise serious doubts about the sustainability of the capacity programme. Without the option of closing older prisons, as now appears inevitable under the current population projections, no funds are released to run the new prisons planned—still less to finance the building and running of new prisons that will be required over and above those committed by the previous government. The doubts are reflected in apparently conflicting public statements:
“I anticipate that we won’t close any prisons this parliament”Michael Spurr, Prison Governor’s Association Annual Conference, 11 October 2017
“Our first priority is to ensure public protection and provide accommodation for all those sentenced by the courts, but that commitment [to close old Victorian prisons] very much remains.”Sam Gyimah MP, speaking in parliament, 12 October 2017
“[T]he surge that we have seen in the prison population over this summer, when it went up slightly above 86,000, against our previous best forecasts, meant that we have had to keep Rochester and Hindley open when we hoped to have closed them as part of the new-for-old policy.”David Lidington MP, Evidence to the House of Commons Justice Committee, 25 October 2017
If the long view teaches anything, it is surely that the scourge of overcrowding will not be ended by building more prisons.
11
The state of our prisons
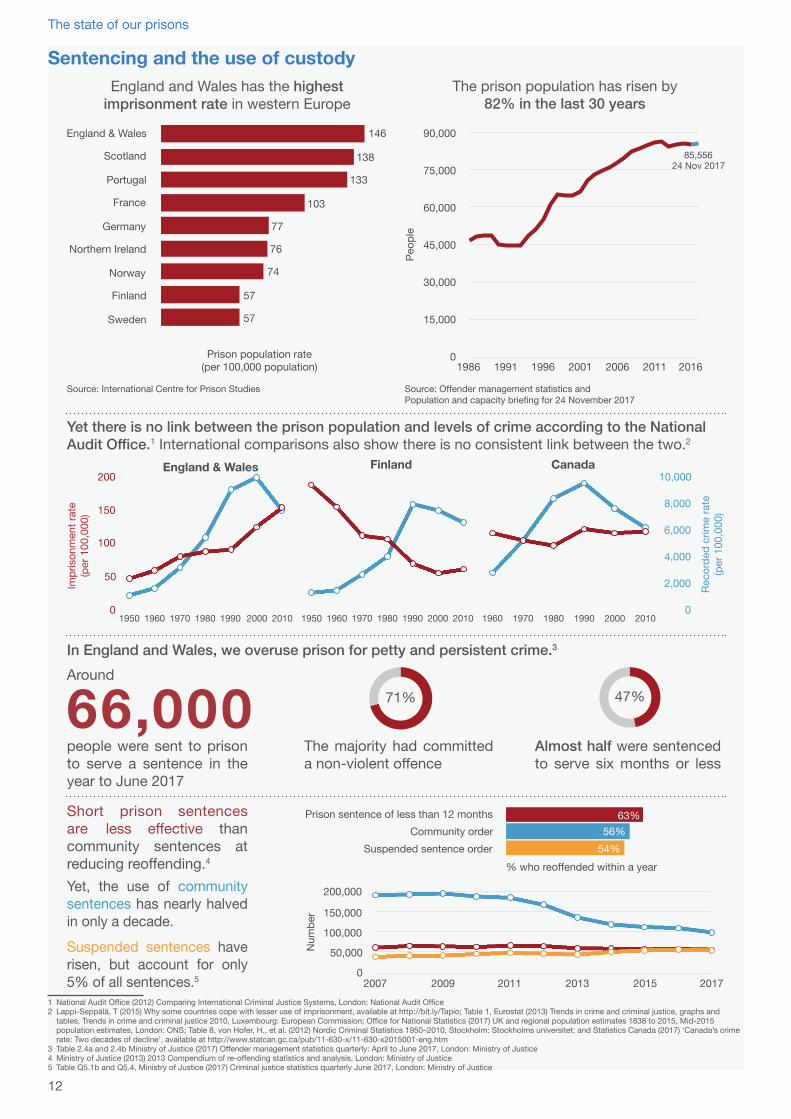
England and Wales has the highestimprisonment rate in western Europe
The prison population has risen by 82% in the last 30 years
66,000people were sent to prison to serve a sentence in the year to June 2017
Around
Yet there is no link between the prison population and levels of crime according to the National Audit Office.1 International comparisons also show there is no consistent link between the two.2
In England and Wales, we overuse prison for petty and persistent crime.3
47%
Almost half were sentenced to serve six months or less
71%
The majority had committed a non-violent offence
Short prison sentences are less effective than community sentences at reducing reoffending.4
Yet, the use of community sentences has nearly halved in only a decade. Suspended sentences have risen, but account for only 5% of all sentences.5
Prison sentence of less than 12 monthsCommunity order
Suspended sentence order% who reoffended within a year
54%56%
63%
Num
ber
0
50,000
100,000
150,000
200,000
2007 2009 2011 2013 2015 2017
Impr
ison
men
t rat
e (p
er 1
00,0
00)
0
50
100
150
200
1950 1960 1970 1980 1990 2000 2010
England & Wales
1950 1960 1970 1980 1990 2000 2010
Finland
Reco
rded
crim
e ra
te(p
er 1
00,0
00)
2,000
4,000
6,000
8,000
10,000
1960 1970 1980 1990 2000 2010
Canada
0
Source: International Centre for Prison Studies
England & Wales
Scotland
Portugal
France
Germany
Northern Ireland
Norway
Finland
Sweden
Prison population rate(per 100,000 population)
57
57
74
76
77
103
133
138
146
Source: Offender management statistics and
Peop
le
Sentencing and the use of custody
1 National Audit Office (2012) Comparing International Criminal Justice Systems, London: National Audit Office2 Lappi-Seppälä, T (2015) Why some countries cope with lesser use of imprisonment, available at http://bit.ly/Tapio; Table 1, Eurostat (2013) Trends in crime and criminal justice, graphs and
tables, Trends in crime and criminal justice 2010, Luxembourg: European Commission; Office for National Statistics (2017) UK and regional population estimates 1838 to 2015, Mid-2015 population estimates, London: ONS; Table 8, von Hofer, H., et al. (2012) Nordic Criminal Statistics 1950–2010, Stockholm: Stockholms universitet; and Statistics Canada (2017) ‘Canada’s crime rate: Two decades of decline’, available at http://www.statcan.gc.ca/pub/11-630-x/11-630-x2015001-eng.htm
3 Table 2.4a and 2.4b Ministry of Justice (2017) Offender management statistics quarterly: April to June 2017, London: Ministry of Justice4 Ministry of Justice (2013) 2013 Compendium of re-offending statistics and analysis, London: Ministry of Justice5 Table Q5.1b and Q5.4, Ministry of Justice (2017) Criminal justice statistics quarterly June 2017, London: Ministry of Justice
12
The state of our prisons
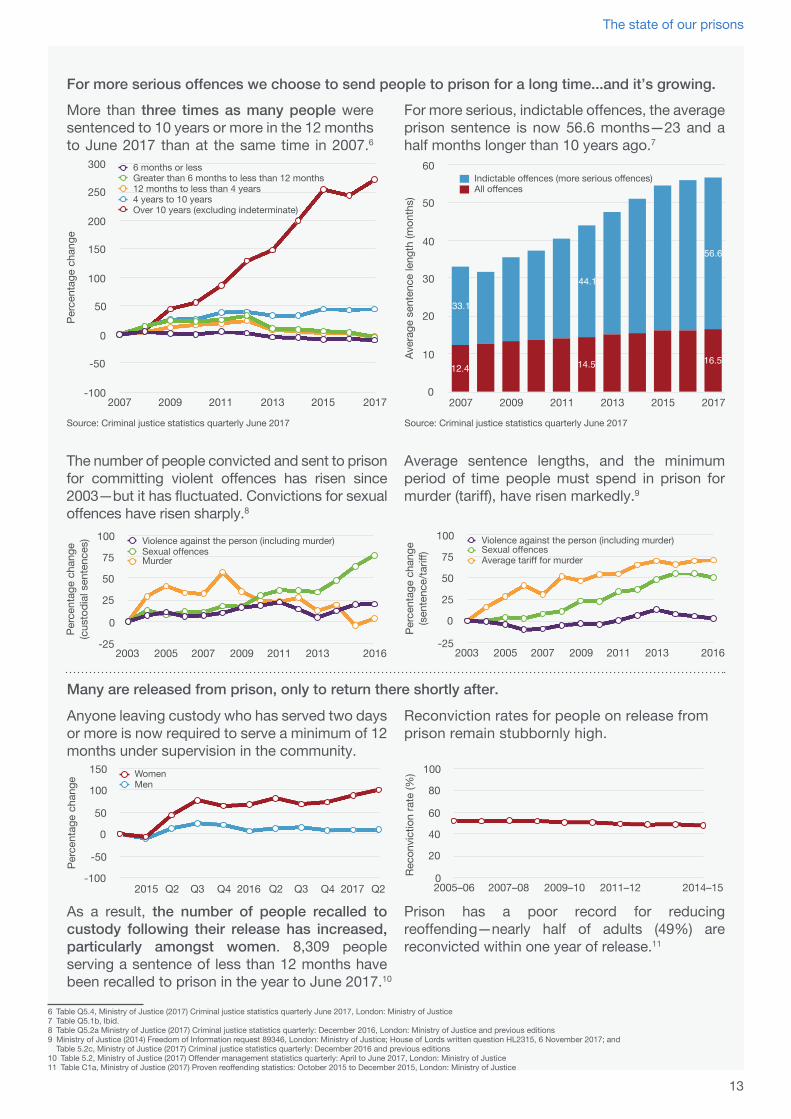
More than three times as many people were sentenced to 10 years or more in the 12 months to June 2017 than at the same time in 2007.6
For more serious, indictable offences, the average prison sentence is now 56.6 months—23 and a half months longer than 10 years ago.7
Many are released from prison, only to return there shortly after.
As a result, the number of people recalled to custody following their release has increased, particularly amongst women. 8,309 people serving a sentence of less than 12 months have been recalled to prison in the year to June 2017.10
For more serious offences we choose to send people to prison for a long time...and it’s growing.
Anyone leaving custody who has served two days or more is now required to serve a minimum of 12 months under supervision in the community.
Reconviction rates for people on release from prison remain stubbornly high.
Prison has a poor record for reducing reoffending—nearly half of adults (49%) are reconvicted within one year of release.11
Average sentence lengths, and the minimum period of time people must spend in prison for murder (tariff), have risen markedly.9
Source: Criminal justice statistics quarterly June 2017Av
erag
e se
nten
ce le
ngth
(mon
ths)
0
10
20
30
40
50
60
2007 2009 2011 2013 2015 2017
All o encesIndictable o ences (more serious o ences)
Source: Criminal justice statistics quarterly June 2017
Perc
enta
ge c
hang
e
-100
-50
0
50
100
150
200
250
300
2007 2009 2011 2013 2015 2017
6 months or lessGreater than 6 months to less than 12 months12 months to less than 4 years4 years to 10 yearsOver 10 years (excluding indeterminate)
The number of people convicted and sent to prison for committing violent offences has risen since 2003—but it has fluctuated. Convictions for sexual offences have risen sharply.8
Perc
enta
ge c
hang
e (c
usto
dial
sen
tenc
es)
-25
0
25
50
75
100
2003 2005 2007 2009 2011 2013 2016
Violence against the person (including murder)Sexual offencesMurder
Perc
enta
ge c
hang
e (s
ente
nce/
tari
)
-25
0
25
50
75
100
2003 2005 2007 2009 2011 2013 2016
Violence against the person (including murder)Sexual offencesAverage tariff for murder
Perc
enta
ge c
hang
e
-100
-50
0
50
100
150
2015 Q2 Q3 Q4 2016 Q2 Q3 Q4 2017 Q2
WomenMen
Reco
nvic
tion
rate
(%)
0
20
40
60
80
100
2005–06 2007–08 2009–10 2011–12 2014–15
6 Table Q5.4, Ministry of Justice (2017) Criminal justice statistics quarterly June 2017, London: Ministry of Justice7 Table Q5.1b, Ibid.8 Table Q5.2a Ministry of Justice (2017) Criminal justice statistics quarterly: December 2016, London: Ministry of Justice and previous editions9 Ministry of Justice (2014) Freedom of Information request 89346, London: Ministry of Justice; House of Lords written question HL2315, 6 November 2017; and
Table 5.2c, Ministry of Justice (2017) Criminal justice statistics quarterly: December 2016 and previous editions10 Table 5.2, Ministry of Justice (2017) Offender management statistics quarterly: April to June 2017, London: Ministry of Justice11 Table C1a, Ministry of Justice (2017) Proven reoffending statistics: October 2015 to December 2015, London: Ministry of Justice
13
The state of our prisons
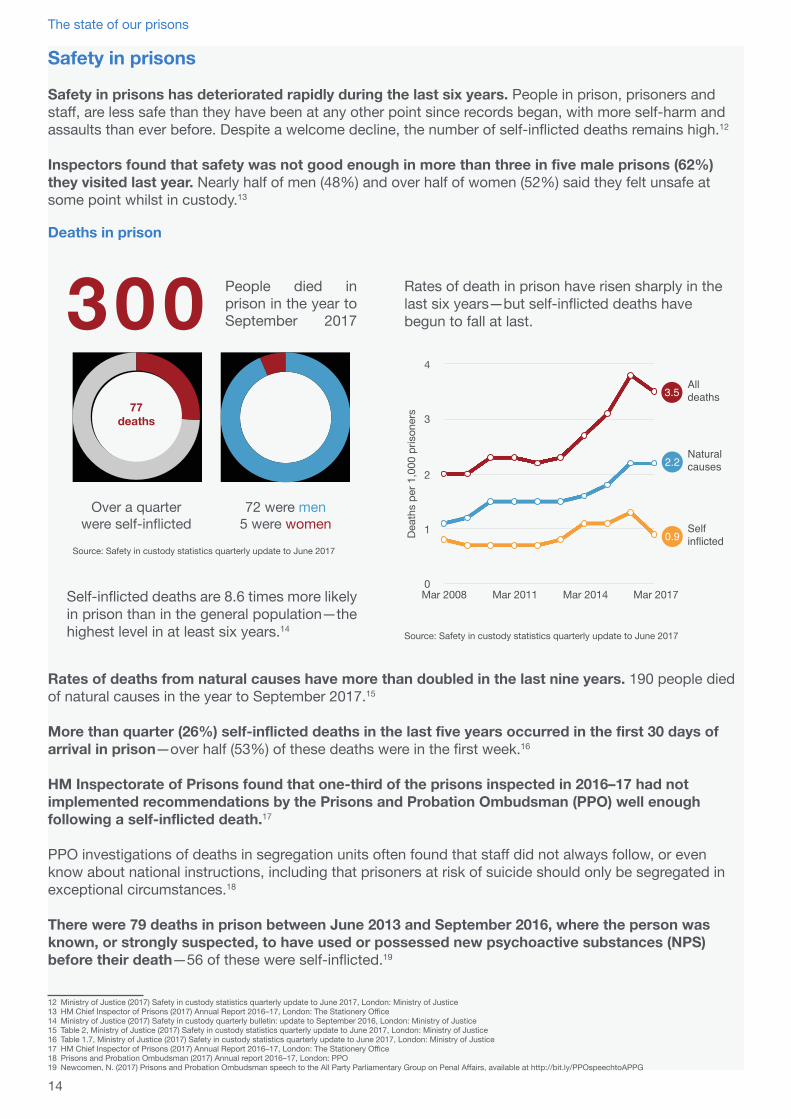
300 People died in prison in the year to September 2017
Self-inflicted deaths are 8.6 times more likely in prison than in the general population—the highest level in at least six years.14
Rates of death in prison have risen sharply in the last six years—but self-inflicted deaths have begun to fall at last.
Source: Safety in custody statistics quarterly update to June 2017
Deat
hs p
er 1
,000
pris
oner
s
0
1
2
3
4
Mar 2008 Mar 2011 Mar 2014 Mar 2017
Alldeaths
Naturalcauses
Self
77deaths
Over a quarter were self-inflicted
72 were men5 were women
Source: Safety in custody statistics quarterly update to June 2017
Safety in prisons
Safety in prisons has deteriorated rapidly during the last six years. People in prison, prisoners and staff, are less safe than they have been at any other point since records began, with more self-harm and assaults than ever before. Despite a welcome decline, the number of self-inflicted deaths remains high.12
Inspectors found that safety was not good enough in more than three in five male prisons (62%) they visited last year. Nearly half of men (48%) and over half of women (52%) said they felt unsafe at some point whilst in custody.13
Deaths in prison
Rates of deaths from natural causes have more than doubled in the last nine years. 190 people died of natural causes in the year to September 2017.15
More than quarter (26%) self-inflicted deaths in the last five years occurred in the first 30 days of arrival in prison—over half (53%) of these deaths were in the first week.16
HM Inspectorate of Prisons found that one-third of the prisons inspected in 2016–17 had not implemented recommendations by the Prisons and Probation Ombudsman (PPO) well enough following a self-inflicted death.17
PPO investigations of deaths in segregation units often found that staff did not always follow, or even know about national instructions, including that prisoners at risk of suicide should only be segregated in exceptional circumstances.18
There were 79 deaths in prison between June 2013 and September 2016, where the person was known, or strongly suspected, to have used or possessed new psychoactive substances (NPS) before their death—56 of these were self-inflicted.19
12 Ministry of Justice (2017) Safety in custody statistics quarterly update to June 2017, London: Ministry of Justice13 HM Chief Inspector of Prisons (2017) Annual Report 2016–17, London: The Stationery Office14 Ministry of Justice (2017) Safety in custody quarterly bulletin: update to September 2016, London: Ministry of Justice15 Table 2, Ministry of Justice (2017) Safety in custody statistics quarterly update to June 2017, London: Ministry of Justice16 Table 1.7, Ministry of Justice (2017) Safety in custody statistics quarterly update to June 2017, London: Ministry of Justice17 HM Chief Inspector of Prisons (2017) Annual Report 2016–17, London: The Stationery Office18 Prisons and Probation Ombudsman (2017) Annual report 2016–17, London: PPO19 Newcomen, N. (2017) Prisons and Probation Ombudsman speech to the All Party Parliamentary Group on Penal Affairs, available at http://bit.ly/PPOspeechtoAPPG
14
The state of our prisons
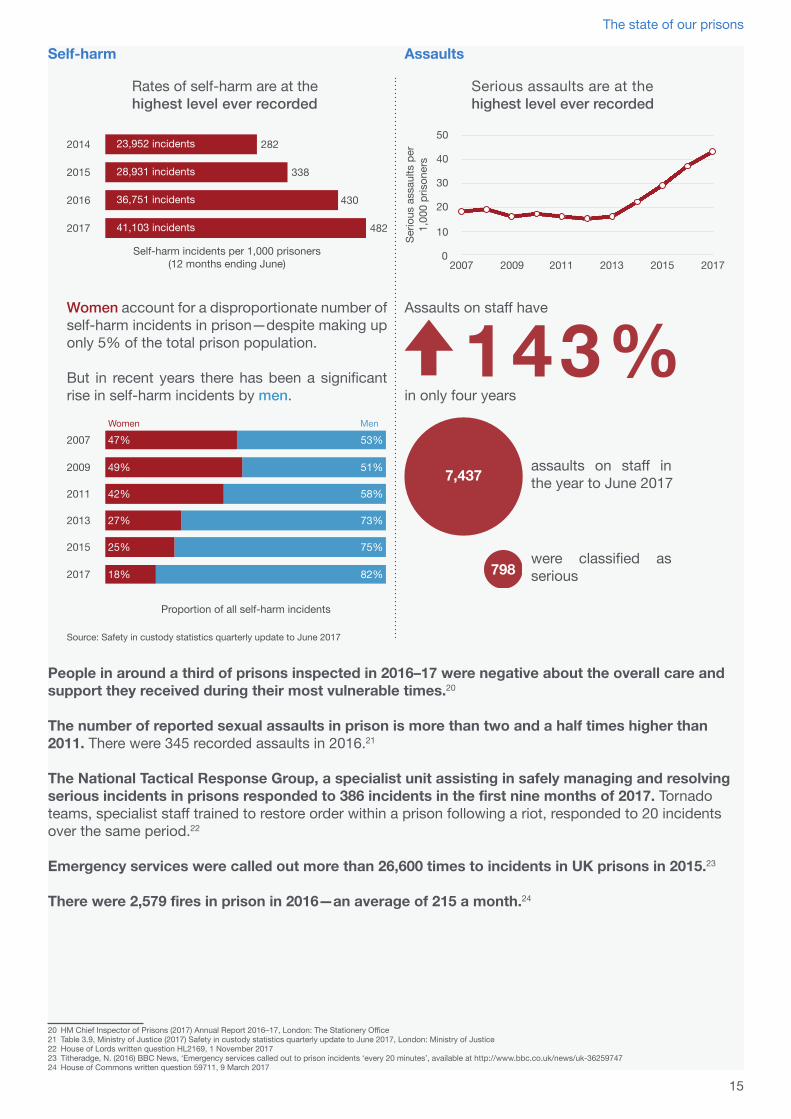
Serious assaults are at the highest level ever recorded
Rates of self-harm are at the highest level ever recorded
Self-harm incidents per 1,000 prisoners(12 months ending June)
Women account for a disproportionate number of self-harm incidents in prison—despite making up only 5% of the total prison population.
But in recent years there has been a significant rise in self-harm incidents by men.
Proportion of all self-harm incidents
Serio
us a
ssau
lts p
er
1,00
0 pr
ison
ers
0
10
20
30
40
50
2007 2009 2011 2013 2015 2017
Assaults on staff have
in only four years
Source: Safety in custody statistics quarterly update to June 2017
assaults on staff in the year to June 2017
were classified as serious
Self-harm Assaults
People in around a third of prisons inspected in 2016–17 were negative about the overall care and support they received during their most vulnerable times.20
The number of reported sexual assaults in prison is more than two and a half times higher than 2011. There were 345 recorded assaults in 2016.21
The National Tactical Response Group, a specialist unit assisting in safely managing and resolving serious incidents in prisons responded to 386 incidents in the first nine months of 2017. Tornado teams, specialist staff trained to restore order within a prison following a riot, responded to 20 incidents over the same period.22
Emergency services were called out more than 26,600 times to incidents in UK prisons in 2015.23
There were 2,579 fires in prison in 2016—an average of 215 a month.24
20 HM Chief Inspector of Prisons (2017) Annual Report 2016–17, London: The Stationery Office21 Table 3.9, Ministry of Justice (2017) Safety in custody statistics quarterly update to June 2017, London: Ministry of Justice22 House of Lords written question HL2169, 1 November 201723 Titheradge, N. (2016) BBC News, ‘Emergency services called out to prison incidents ‘every 20 minutes’, available at http://www.bbc.co.uk/news/uk-3625974724 House of Commons written question 59711, 9 March 2017
15
The state of our prisons
Treatment and conditions
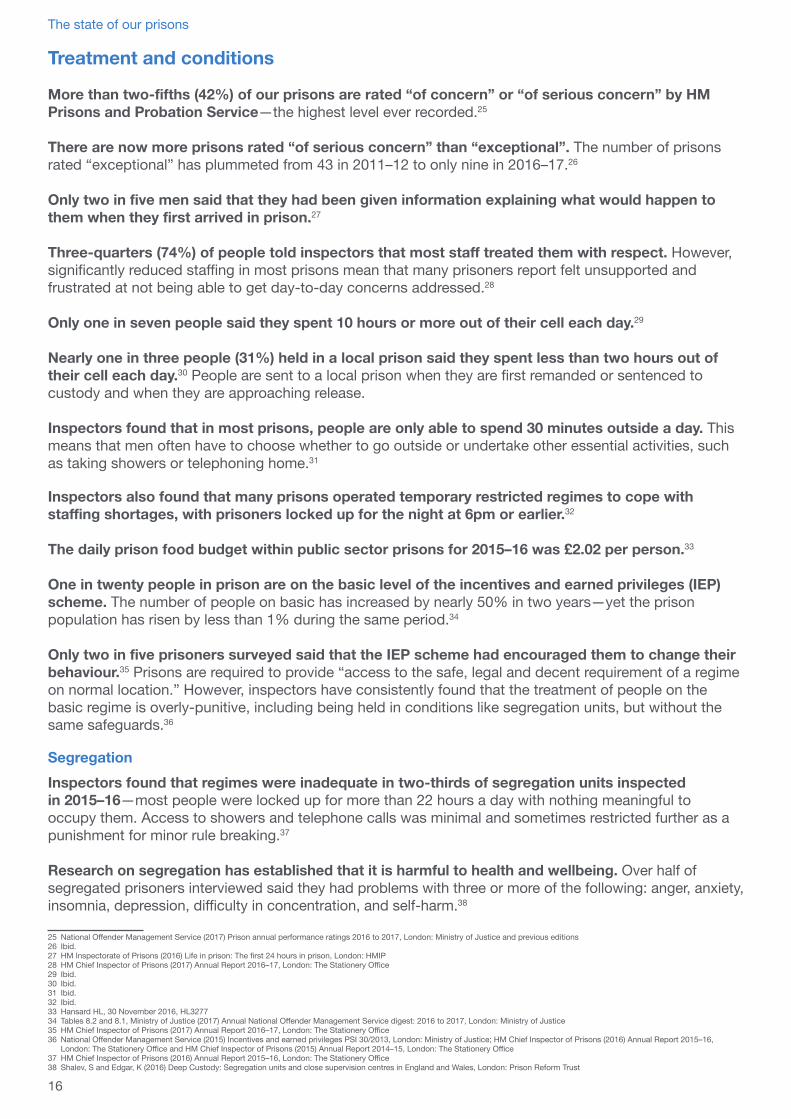
More than two-fifths (42%) of our prisons are rated “of concern” or “of serious concern” by HM Prisons and Probation Service—the highest level ever recorded.25
There are now more prisons rated “of serious concern” than “exceptional”. The number of prisons rated “exceptional” has plummeted from 43 in 2011–12 to only nine in 2016–17.26
Only two in five men said that they had been given information explaining what would happen to them when they first arrived in prison.27
Three-quarters (74%) of people told inspectors that most staff treated them with respect. However, significantly reduced staffing in most prisons mean that many prisoners report felt unsupported and frustrated at not being able to get day-to-day concerns addressed.28
Only one in seven people said they spent 10 hours or more out of their cell each day.29
Nearly one in three people (31%) held in a local prison said they spent less than two hours out of their cell each day.30 People are sent to a local prison when they are first remanded or sentenced to custody and when they are approaching release.
Inspectors found that in most prisons, people are only able to spend 30 minutes outside a day. This means that men often have to choose whether to go outside or undertake other essential activities, such as taking showers or telephoning home.31
Inspectors also found that many prisons operated temporary restricted regimes to cope with staffing shortages, with prisoners locked up for the night at 6pm or earlier.32
The daily prison food budget within public sector prisons for 2015–16 was £2.02 per person.33
One in twenty people in prison are on the basic level of the incentives and earned privileges (IEP) scheme. The number of people on basic has increased by nearly 50% in two years—yet the prison population has risen by less than 1% during the same period.34
Only two in five prisoners surveyed said that the IEP scheme had encouraged them to change their behaviour.35 Prisons are required to provide “access to the safe, legal and decent requirement of a regime on normal location.” However, inspectors have consistently found that the treatment of people on the basic regime is overly-punitive, including being held in conditions like segregation units, but without the same safeguards.36
SegregationInspectors found that regimes were inadequate in two-thirds of segregation units inspected in 2015–16—most people were locked up for more than 22 hours a day with nothing meaningful to occupy them. Access to showers and telephone calls was minimal and sometimes restricted further as a punishment for minor rule breaking.37
Research on segregation has established that it is harmful to health and wellbeing. Over half of segregated prisoners interviewed said they had problems with three or more of the following: anger, anxiety, insomnia, depression, difficulty in concentration, and self-harm.38
25 National Offender Management Service (2017) Prison annual performance ratings 2016 to 2017, London: Ministry of Justice and previous editions26 Ibid.27 HM Inspectorate of Prisons (2016) Life in prison: The first 24 hours in prison, London: HMIP28 HM Chief Inspector of Prisons (2017) Annual Report 2016–17, London: The Stationery Office29 Ibid.30 Ibid.31 Ibid.32 Ibid.33 Hansard HL, 30 November 2016, HL327734 Tables 8.2 and 8.1, Ministry of Justice (2017) Annual National Offender Management Service digest: 2016 to 2017, London: Ministry of Justice35 HM Chief Inspector of Prisons (2017) Annual Report 2016–17, London: The Stationery Office36 National Offender Management Service (2015) Incentives and earned privileges PSI 30/2013, London: Ministry of Justice; HM Chief Inspector of Prisons (2016) Annual Report 2015–16,
London: The Stationery Office and HM Chief Inspector of Prisons (2015) Annual Report 2014–15, London: The Stationery Office37 HM Chief Inspector of Prisons (2016) Annual Report 2015–16, London: The Stationery Office38 Shalev, S and Edgar, K (2016) Deep Custody: Segregation units and close supervision centres in England and Wales, London: Prison Reform Trust
16
The state of our prisons
During the first three months of 2014 almost one in ten people in segregation units had spent longer than 84 days there. One in five had spent between 14 and 42 days; and 71% had been segregated for less than 14 days.39
Nearly two-fifths, 19 out of a total of 50 people, had deliberately engineered a move to the segregation unit. Reasons included trying to transfer to a different prison, evading a debt, or getting away from drugs or violence on the wings.40
If a person has a request or concern they can raise it through the application process. It is a means of dealing with routine issues before they escalate into formal complaints. However, inspectors found that the applications process continued to be poor—only half (52%) of prisoners felt that their applications were dealt with fairly.41
Resolving disputesIf a person is not happy with the outcome of their application they can make an internal complaint. However, just over half (54%) said that it was easy to make a complaint and only 28% felt their complaints were dealt with fairly.42
The Prisons and Probation Ombudsman provides the last means of redress in the formal complaints process.
The number of complaints upheld by the Prisons and Probation Ombudsman has been rising. Less than a quarter (23%) of complaints were upheld in 2011–12, compared to nearly two in five (39%) last year.43
The Ombudsman reported that this “reflects prison staff making more mistakes, not learning lessons from...previous investigations and...not resolving issues at a local level”.44
Complaints from high security prisons accounted for 29% of completed investigations, despite high security prisoners making up only 7% of the male prison population.45
Only one in 100 prisoners who made an allegation of discrimination against prison staff had their case upheld by the prison. By contrast, three in four staff (76%) reports of alleged discrimination by a prisoner were upheld.46
39 Ibid.40 Ibid.41 HM Chief Inspector of Prisons (2016) Annual Report 2015–16, London: The Stationery Office42 HM Chief Inspector of Prisons (2017) Annual Report 2016–17, London: The Stationery Office43 Prisons and Probation Ombudsman (2017) Annual report 2016–17, London: PPO44 Ibid.45 Ibid.46 Edgar, K. and Tsintsadze, K. (2017) Takling discrimination in prisons: still not a fair response, London: Prison Reform Trust
Prop
ortio
n of
pris
ons
0%
25%
50%
75%
100%
2011–12 2014–15 2016–17
The performance of more than two-fifths of prisonsis now of concern or serious concern
Sources: Prison annual performance ratings 2016 to 2017 and previous editions
% o
f pris
ons
rate
d go
od o
r rea
sona
bly
good
0%
25%
50%
75%
100%
2007–08 2010–11 2013–14 2016-17
Inspectors find declines in nearly all areas—particularly safety and respect
Source: HM Chief Inspector of Prisons, Annual report 2016–17and previous editions
Prison standards—the new normal?
17
The state of our prisons
Overcrowding and changes to the prison estate
Prison overcrowding is defined by the prison service as a prison containing more prisoners than the establishment’s Certified Normal Accommodation (CNA). CNA represents “the good, decent standard of accommodation that the [prison] service aspires to provide all prisoners.”47
The prison system as a whole has been overcrowded in every year since 1994.48 Overcrowding affects whether activities, staff and other resources are available to reduce risk of reoffending, as well as distance from families and other support networks.49
In 2016–17, two-thirds of prisons in England and Wales were overcrowded (79 of the 119 prisons). Nearly 21,000 people were held in overcrowded accommodation—almost a quarter of the prison population. The majority were doubling up in cells designed for one.50
This level of overcrowding has remained broadly unchanged for the last 14 years.51
Overcrowding remains a significant issue in most prisons according to inspectors.52 Particularly in local and category C training prisons, where most people are held.53
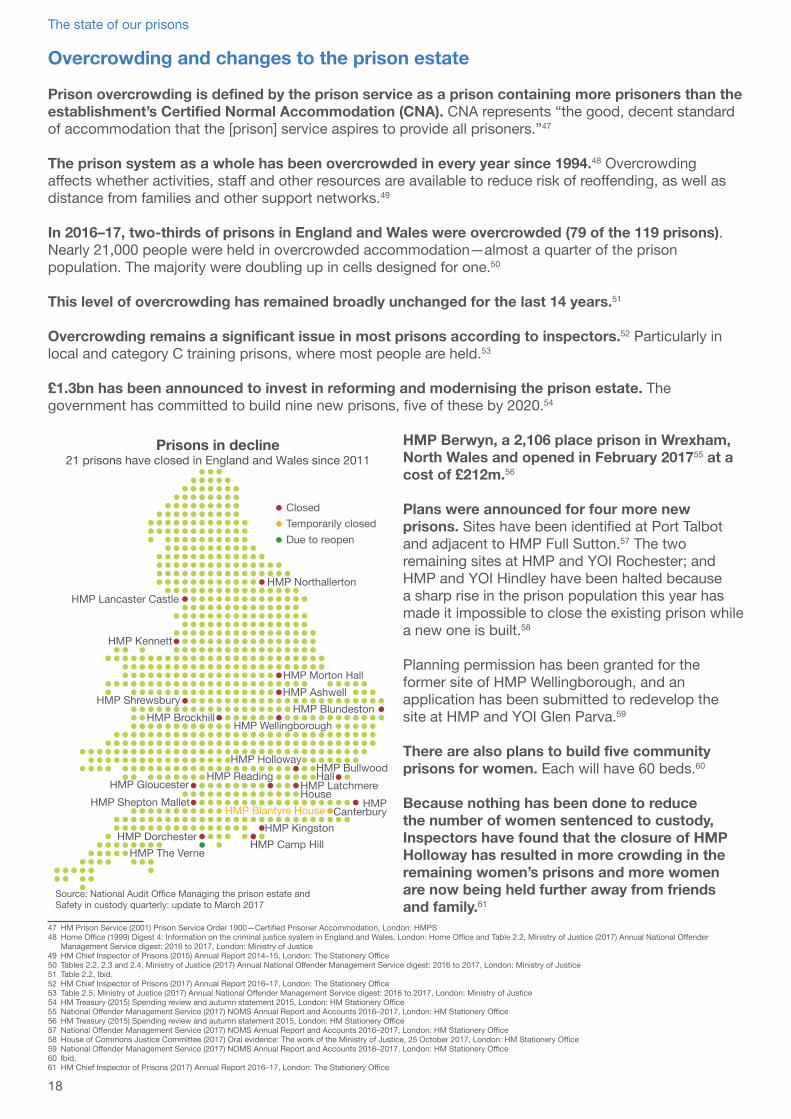
£1.3bn has been announced to invest in reforming and modernising the prison estate. The government has committed to build nine new prisons, five of these by 2020.54
HMP Berwyn, a 2,106 place prison in Wrexham, North Wales and opened in February 201755 at a cost of £212m.56
Plans were announced for four more new prisons. Sites have been identified at Port Talbot and adjacent to HMP Full Sutton.57 The two remaining sites at HMP and YOI Rochester; and HMP and YOI Hindley have been halted because a sharp rise in the prison population this year has made it impossible to close the existing prison while a new one is built.58
Planning permission has been granted for the former site of HMP Wellingborough, and an application has been submitted to redevelop the site at HMP and YOI Glen Parva.59
There are also plans to build five community prisons for women. Each will have 60 beds.60
Because nothing has been done to reduce the number of women sentenced to custody, Inspectors have found that the closure of HMP Holloway has resulted in more crowding in the remaining women’s prisons and more women are now being held further away from friends and family.61
47 HM Prison Service (2001) Prison Service Order 1900—Certified Prisoner Accommodation, London: HMPS48 Home Office (1999) Digest 4: Information on the criminal justice system in England and Wales, London: Home Office and Table 2.2, Ministry of Justice (2017) Annual National Offender
Management Service digest: 2016 to 2017, London: Ministry of Justice49 HM Chief Inspector of Prisons (2015) Annual Report 2014–15, London: The Stationery Office50 Tables 2.2, 2.3 and 2.4, Ministry of Justice (2017) Annual National Offender Management Service digest: 2016 to 2017, London: Ministry of Justice51 Table 2.2, Ibid.52 HM Chief Inspector of Prisons (2017) Annual Report 2016–17, London: The Stationery Office53 Table 2.5, Ministry of Justice (2017) Annual National Offender Management Service digest: 2016 to 2017, London: Ministry of Justice54 HM Treasury (2015) Spending review and autumn statement 2015, London: HM Stationery Office55 National Offender Management Service (2017) NOMS Annual Report and Accounts 2016–2017, London: HM Stationery Office56 HM Treasury (2015) Spending review and autumn statement 2015, London: HM Stationery Office57 National Offender Management Service (2017) NOMS Annual Report and Accounts 2016–2017, London: HM Stationery Office58 House of Commons Justice Committee (2017) Oral evidence: The work of the Ministry of Justice, 25 October 2017, London: HM Stationery Office59 National Offender Management Service (2017) NOMS Annual Report and Accounts 2016–2017, London: HM Stationery Office60 Ibid.61 HM Chief Inspector of Prisons (2017) Annual Report 2016–17, London: The Stationery Office
HMP Blundeston
HMP Gloucester
HMP Camp Hill
HMP Northallerton
HMP Ashwell
HMP Brockhill
HMP Lancaster Castle
HMP Latchmere House
HMP Morton Hall
HMP Bullwood Hall
HMP Canterbury
HMP DorchesterHMP Kingston
HMP Reading
HMP Shepton Mallet
HMP Shrewsbury
HMP Holloway
HMP Blantyre House
HMP Kennett
HMP The Verne
HMP Wellingborough
Temporarily closedDue to reopen
Closed
Source: National Audit Office Managing the prison estate and Safety in custody quarterly: update to March 2017
Prisons in decline21 prisons have closed in England and Wales since 2011
18
The state of our prisons
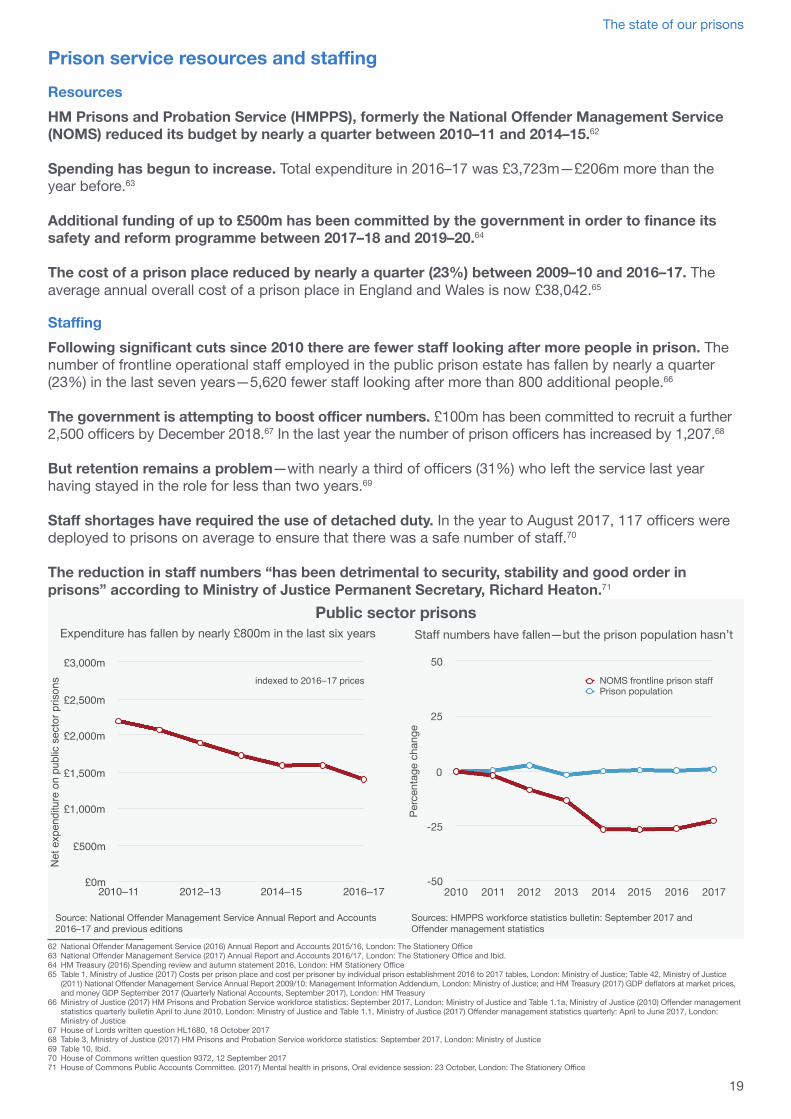
Prison service resources and staffingResourcesHM Prisons and Probation Service (HMPPS), formerly the National Offender Management Service (NOMS) reduced its budget by nearly a quarter between 2010–11 and 2014–15.62
Spending has begun to increase. Total expenditure in 2016–17 was £3,723m—£206m more than the year before.63
Additional funding of up to £500m has been committed by the government in order to finance its safety and reform programme between 2017–18 and 2019–20.64
The cost of a prison place reduced by nearly a quarter (23%) between 2009–10 and 2016–17. The average annual overall cost of a prison place in England and Wales is now £38,042.65
StaffingFollowing significant cuts since 2010 there are fewer staff looking after more people in prison. The number of frontline operational staff employed in the public prison estate has fallen by nearly a quarter (23%) in the last seven years—5,620 fewer staff looking after more than 800 additional people.66
The government is attempting to boost officer numbers. £100m has been committed to recruit a further 2,500 officers by December 2018.67 In the last year the number of prison officers has increased by 1,207.68
But retention remains a problem—with nearly a third of officers (31%) who left the service last year having stayed in the role for less than two years.69
Staff shortages have required the use of detached duty. In the year to August 2017, 117 officers were deployed to prisons on average to ensure that there was a safe number of staff.70
The reduction in staff numbers “has been detrimental to security, stability and good order in prisons” according to Ministry of Justice Permanent Secretary, Richard Heaton.71
62 National Offender Management Service (2016) Annual Report and Accounts 2015/16, London: The Stationery Office63 National Offender Management Service (2017) Annual Report and Accounts 2016/17, London: The Stationery Office and Ibid.64 HM Treasury (2016) Spending review and autumn statement 2016, London: HM Stationery Office65 Table 1, Ministry of Justice (2017) Costs per prison place and cost per prisoner by individual prison establishment 2016 to 2017 tables, London: Ministry of Justice; Table 42, Ministry of Justice
(2011) National Offender Management Service Annual Report 2009/10: Management Information Addendum, London: Ministry of Justice; and HM Treasury (2017) GDP deflators at market prices, and money GDP September 2017 (Quarterly National Accounts, September 2017), London: HM Treasury
66 Ministry of Justice (2017) HM Prisons and Probation Service workforce statistics: September 2017, London: Ministry of Justice and Table 1.1a, Ministry of Justice (2010) Offender management statistics quarterly bulletin April to June 2010, London: Ministry of Justice and Table 1.1, Ministry of Justice (2017) Offender management statistics quarterly: April to June 2017, London: Ministry of Justice
67 House of Lords written question HL1680, 18 October 201768 Table 3, Ministry of Justice (2017) HM Prisons and Probation Service workforce statistics: September 2017, London: Ministry of Justice69 Table 10, Ibid.70 House of Commons written question 9372, 12 September 201771 House of Commons Public Accounts Committee. (2017) Mental health in prisons, Oral evidence session: 23 October, London: The Stationery Office
Net
exp
endi
ture
on
publ
ic s
ecto
r pris
ons
£0m
£500m
£1,000m
£1,500m
£2,000m
£2,500m
£3,000m
2010–11 2012–13 2014–15 2016–17
Source: National Offender Management Service Annual Report and Accounts2016–17 and previous editions
Expenditure has fallen by nearly £800m in the last six years
indexed to 2016–17 prices
Perc
enta
ge c
hang
e
-50
-25
0
25
50
2010 2011 2012 2013 2014 2015 2016 2017
NOMS frontline prison staffPrison population
Staff numbers have fallen—but the prison population hasn’t
Sources: HMPPS workforce statistics bulletin: September 2017 andOffender management statistics
Public sector prisons
19
The state of our prisons
Private prisons
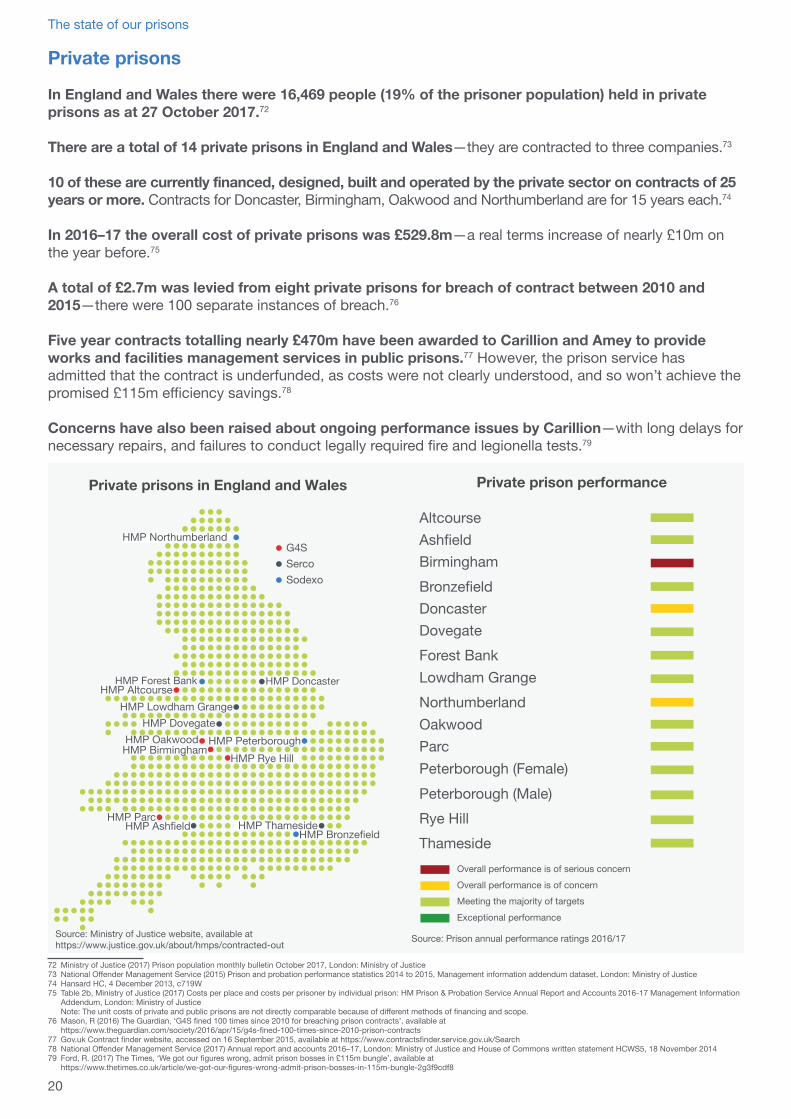
In England and Wales there were 16,469 people (19% of the prisoner population) held in private prisons as at 27 October 2017.72
There are a total of 14 private prisons in England and Wales—they are contracted to three companies.73
10 of these are currently financed, designed, built and operated by the private sector on contracts of 25 years or more. Contracts for Doncaster, Birmingham, Oakwood and Northumberland are for 15 years each.74
In 2016–17 the overall cost of private prisons was £529.8m—a real terms increase of nearly £10m on the year before.75
A total of £2.7m was levied from eight private prisons for breach of contract between 2010 and 2015—there were 100 separate instances of breach.76
Five year contracts totalling nearly £470m have been awarded to Carillion and Amey to provide works and facilities management services in public prisons.77 However, the prison service has admitted that the contract is underfunded, as costs were not clearly understood, and so won’t achieve the promised £115m efficiency savings.78
Concerns have also been raised about ongoing performance issues by Carillion—with long delays for necessary repairs, and failures to conduct legally required fire and legionella tests.79
72 Ministry of Justice (2017) Prison population monthly bulletin October 2017, London: Ministry of Justice73 National Offender Management Service (2015) Prison and probation performance statistics 2014 to 2015, Management information addendum dataset, London: Ministry of Justice74 Hansard HC, 4 December 2013, c719W75 Table 2b, Ministry of Justice (2017) Costs per place and costs per prisoner by individual prison: HM Prison & Probation Service Annual Report and Accounts 2016-17 Management Information
Addendum, London: Ministry of Justice Note: The unit costs of private and public prisons are not directly comparable because of different methods of financing and scope.
76 Mason, R (2016) The Guardian, ‘G4S fined 100 times since 2010 for breaching prison contracts’, available at https://www.theguardian.com/society/2016/apr/15/g4s-fined-100-times-since-2010-prison-contracts
77 Gov.uk Contract finder website, accessed on 16 September 2015, available at https://www.contractsfinder.service.gov.uk/Search78 National Offender Management Service (2017) Annual report and accounts 2016–17, London: Ministry of Justice and House of Commons written statement HCWS5, 18 November 201479 Ford, R. (2017) The Times, ‘We got our figures wrong, admit prison bosses in £115m bungle’, available at
https://www.thetimes.co.uk/article/we-got-our-figures-wrong-admit-prison-bosses-in-115m-bungle-2g3f9cdf8
HMP BirminghamHMP Oakwood
HMP Parc
HMP Rye Hill
HMP Altcourse
HMP Ashfield
HMP Doncaster
HMP DovegateHMP Lowdham Grange
HMP ThamesideHMP Bronzefield
HMP Forest Bank
HMP Northumberland
HMP Peterborough
Source: Ministry of Justice website, available at https://www.justice.gov.uk/about/hmps/contracted-out
G4SSercoSodexo
Private prisons in England and Wales Private prison performance
Source: Prison annual performance ratings 2016/17
20
The state of our prisons

PEOPLE IN PRISON
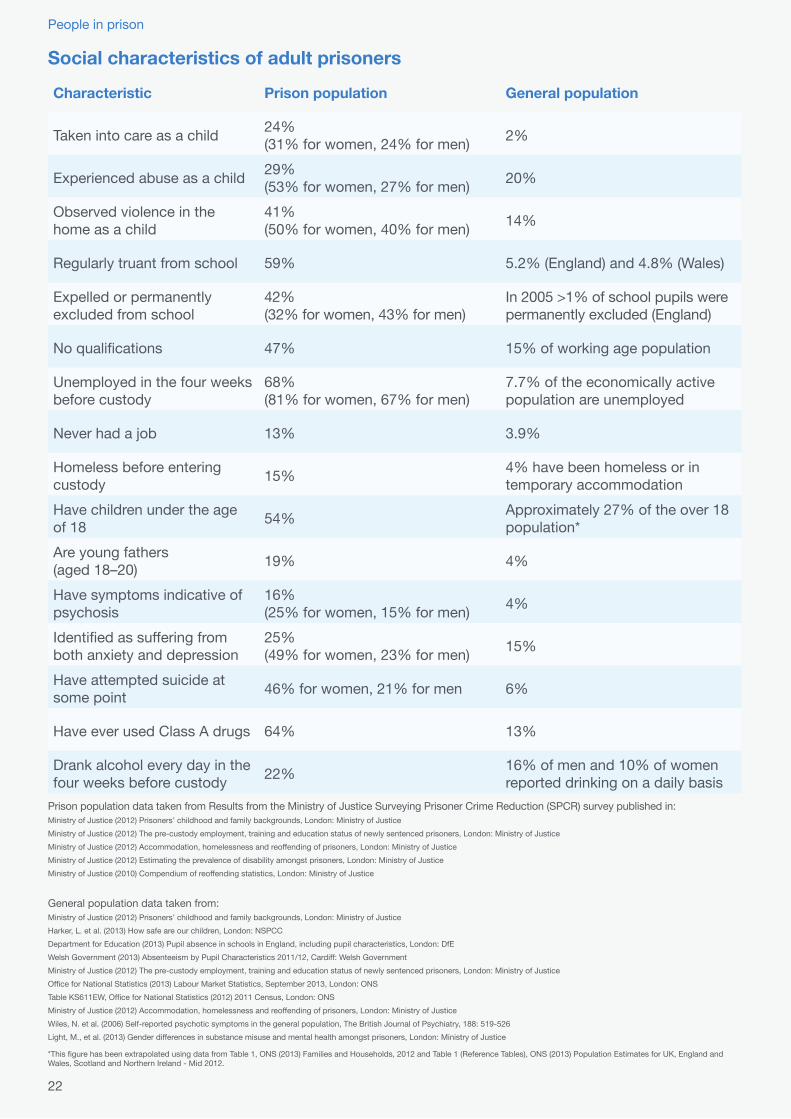
Social characteristics of adult prisoners
Characteristic Prison population General population
Taken into care as a child 24% (31% for women, 24% for men) 2%
Experienced abuse as a child 29% (53% for women, 27% for men) 20%
Observed violence in the home as a child
41% (50% for women, 40% for men) 14%
Regularly truant from school 59% 5.2% (England) and 4.8% (Wales)
Expelled or permanently excluded from school
42% (32% for women, 43% for men)
In 2005 >1% of school pupils were permanently excluded (England)
No qualifications 47% 15% of working age population
Unemployed in the four weeks before custody
68% (81% for women, 67% for men)
7.7% of the economically active population are unemployed
Never had a job 13% 3.9%
Homeless before entering custody 15% 4% have been homeless or in
temporary accommodationHave children under the age of 18 54% Approximately 27% of the over 18
population*Are young fathers (aged 18–20) 19% 4%
Have symptoms indicative of psychosis
16% (25% for women, 15% for men) 4%
Identified as suffering from both anxiety and depression
25% (49% for women, 23% for men) 15%
Have attempted suicide at some point 46% for women, 21% for men 6%
Have ever used Class A drugs 64% 13%
Drank alcohol every day in the four weeks before custody 22% 16% of men and 10% of women
reported drinking on a daily basisPrison population data taken from Results from the Ministry of Justice Surveying Prisoner Crime Reduction (SPCR) survey published in:Ministry of Justice (2012) Prisoners’ childhood and family backgrounds, London: Ministry of JusticeMinistry of Justice (2012) The pre-custody employment, training and education status of newly sentenced prisoners, London: Ministry of JusticeMinistry of Justice (2012) Accommodation, homelessness and reoffending of prisoners, London: Ministry of JusticeMinistry of Justice (2012) Estimating the prevalence of disability amongst prisoners, London: Ministry of JusticeMinistry of Justice (2010) Compendium of reoffending statistics, London: Ministry of Justice
General population data taken from:Ministry of Justice (2012) Prisoners’ childhood and family backgrounds, London: Ministry of JusticeHarker, L. et al. (2013) How safe are our children, London: NSPCCDepartment for Education (2013) Pupil absence in schools in England, including pupil characteristics, London: DfEWelsh Government (2013) Absenteeism by Pupil Characteristics 2011/12, Cardiff: Welsh GovernmentMinistry of Justice (2012) The pre-custody employment, training and education status of newly sentenced prisoners, London: Ministry of JusticeOffice for National Statistics (2013) Labour Market Statistics, September 2013, London: ONSTable KS611EW, Office for National Statistics (2012) 2011 Census, London: ONSMinistry of Justice (2012) Accommodation, homelessness and reoffending of prisoners, London: Ministry of JusticeWiles, N. et al. (2006) Self-reported psychotic symptoms in the general population, The British Journal of Psychiatry, 188: 519-526Light, M., et al. (2013) Gender differences in substance misuse and mental health amongst prisoners, London: Ministry of Justice
*This figure has been extrapolated using data from Table 1, ONS (2013) Families and Households, 2012 and Table 1 (Reference Tables), ONS (2013) Population Estimates for UK, England and Wales, Scotland and Northern Ireland - Mid 2012.
22
People in prison
People on remand
For many people, their first experience of prison is on remand. This might be ahead of their trial, or whilst they are awaiting sentencing having been found guilty.
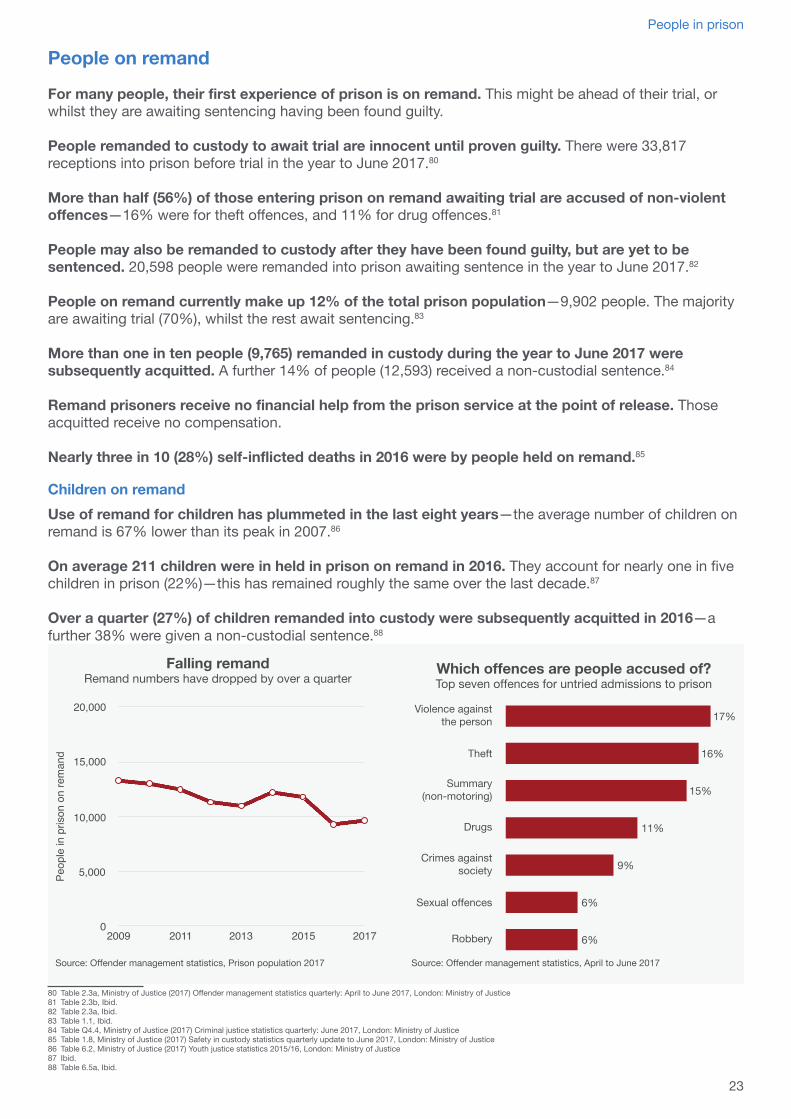
People remanded to custody to await trial are innocent until proven guilty. There were 33,817 receptions into prison before trial in the year to June 2017.80
More than half (56%) of those entering prison on remand awaiting trial are accused of non-violent offences—16% were for theft offences, and 11% for drug offences.81
People may also be remanded to custody after they have been found guilty, but are yet to be sentenced. 20,598 people were remanded into prison awaiting sentence in the year to June 2017.82
People on remand currently make up 12% of the total prison population—9,902 people. The majority are awaiting trial (70%), whilst the rest await sentencing.83
More than one in ten people (9,765) remanded in custody during the year to June 2017 were subsequently acquitted. A further 14% of people (12,593) received a non-custodial sentence.84
Remand prisoners receive no financial help from the prison service at the point of release. Those acquitted receive no compensation.
Nearly three in 10 (28%) self-inflicted deaths in 2016 were by people held on remand.85
Children on remandUse of remand for children has plummeted in the last eight years—the average number of children on remand is 67% lower than its peak in 2007.86
On average 211 children were in held in prison on remand in 2016. They account for nearly one in five children in prison (22%)—this has remained roughly the same over the last decade.87
Over a quarter (27%) of children remanded into custody were subsequently acquitted in 2016—a further 38% were given a non-custodial sentence.88
80 Table 2.3a, Ministry of Justice (2017) Offender management statistics quarterly: April to June 2017, London: Ministry of Justice81 Table 2.3b, Ibid.82 Table 2.3a, Ibid.83 Table 1.1, Ibid.84 Table Q4.4, Ministry of Justice (2017) Criminal justice statistics quarterly: June 2017, London: Ministry of Justice85 Table 1.8, Ministry of Justice (2017) Safety in custody statistics quarterly update to June 2017, London: Ministry of Justice86 Table 6.2, Ministry of Justice (2017) Youth justice statistics 2015/16, London: Ministry of Justice87 Ibid.88 Table 6.5a, Ibid.
Peop
le in
pris
on o
n re
man
d
0
5,000
10,000
15,000
20,000
2009 2011 2013 2015 2017
Source: Offender management statistics, Prison population 2017
Falling remandRemand numbers have dropped by over a quarter
6%
6%
9%
11%
15%
16%
17%
Which offences are people accused of?Top seven offences for untried admissions to prison
Source: Offender management statistics, April to June 2017
23
People in prison
Black, Asian and minority ethnic people in prison
26% of the prison population, 22,683 people, are from a minority ethnic group.89
If our prison population reflected the make-up of England and Wales, we would have over 9,000 fewer people in prison—the equivalent of 12 average-sized prisons.90
The economic cost of black, Asian and minority ethnic (BAME) overrepresentation in our prison system is estimated to be £234 million a year.91
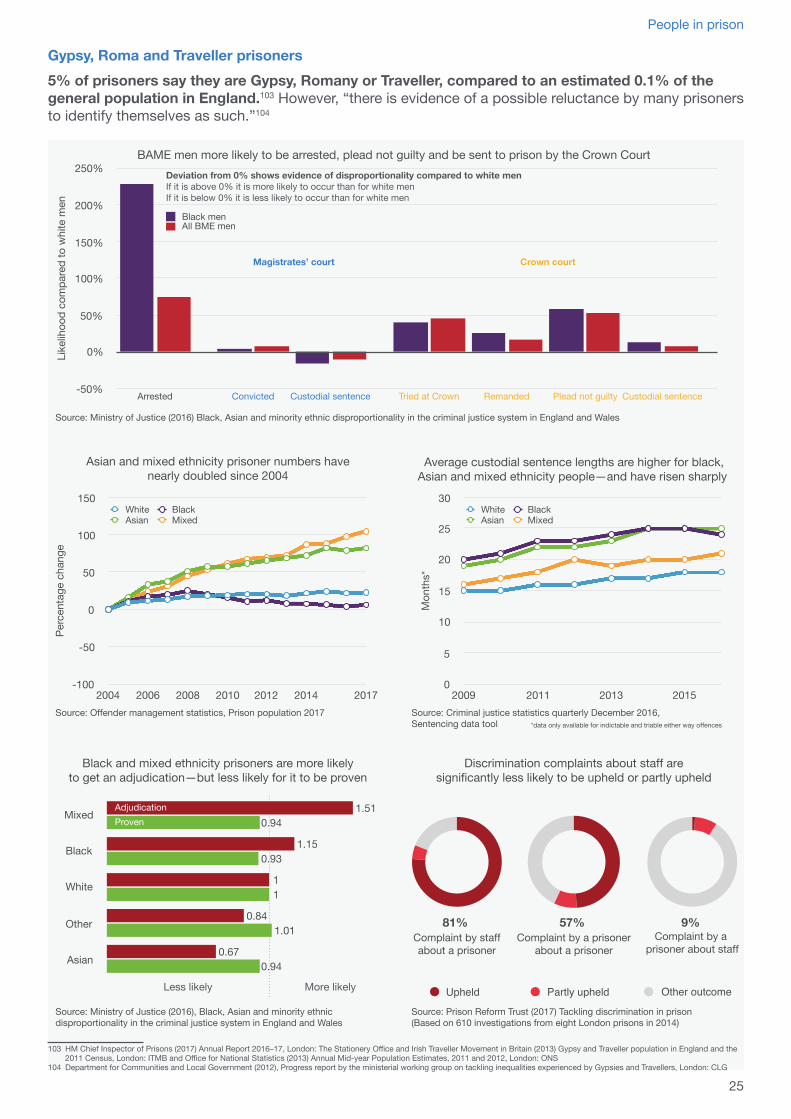
Analysis conducted for the Lammy Review found a clear direct association between ethnic group and the odds of receiving a custodial sentence. With black people 53%, Asian 55%, and other ethnic groups 81% more likely to be sent to prison for an indictable offence at the Crown Court, even when factoring in higher not-guilty plea rates.92
Black men are 26% more likely than white men to be remanded in custody. They are also nearly 60% more likely to plead not guilty.93
Muslim prisonersThe number of Muslim prisoners has more than doubled over the past 15 years. In 2002 there were 5,502 Muslims in prison, by 2017 this had risen to 13,185.94 They now account for 15% of the prison population but just 5% of the general population.95
Muslims in prison are far from being a homogeneous group. Some were born into Muslim families, and others have converted. 40% are Asian, 29% are black, 16% are white and 9% are mixed.96
Only one per cent of Muslims in prison are currently there for terrorism related offences.97
Despite this they make up half of all people held in close supervision centres (CSCs)—25 of 50 people. CSCs are designed to manage highly disruptive and high risk prisoners who have demonstrated violent and/or highly disruptive behaviour.98
Treatment and conditionsBAME people in prison often report more negatively about their experience in prison and relationships with staff. Fewer said they felt safe at the time of the inspectorate’s survey; fewer had a member of staff they could turn to for help, fewer said staff treated them with respect, and more said they had been victimised by staff. Responses by Muslim prisoners in these areas were even worse. 99
They also report reduced access to opportunities and interventions that support rehabilitation. Fewer said they had a prison job, were taking part in offender behaviour programmes or spending ten hours outside of their cell on weekdays.100
A disproportionate number of black people in prison are held in segregation, and held there for long periods. Between January to March 2014 they accounted for 15.5% of people in segregation and 18.5% of those segregated for longer than 85 days, but only 12.6% of the prison population.101
BAME men are more likely to be placed in high security prisons than white men who have committed similar types of offences. The discrepancy was highest for public order offences, with black men just over 4 times more likely and Asian men more than 6 times more likely than white men to be held in a high security prison.102
89 Table 1.4, Ministry of Justice (2017) Offender management statistics quarterly: April to June 2017, London: Ministry of Justice90 Table 11, Kneen, H. (2017) An exploratory estimate of the economic cost of Black, Asian and Minority Ethnic net overrepresentation in the Criminal Justice System in 2015, London: Ministry of
Justice and Lammy, D. (2017) The Lammy Review, London: Ministry of Justice91 Kneen, H. (2017) An exploratory estimate of the economic cost of Black, Asian and Minority Ethnic net overrepresentation in the Criminal Justice System in 2015, London: Ministry of Justice92 Hopkins, K., et al. (2016) Associations between ethnic background and being sentenced to prison in the Crown Court in England and Wales in 2015, London: Ministry of Justice93 Table 5.3, Uhrig, N. (2016) Black, Asian and minority ethnic disproportionality in the criminal justice system in England and Wales, London: Ministry of Justice94 Table A1.10, Ministry of Justice (2017) Offender management statistics prison population 2017, London: Ministry of Justice95 Lammy, D. (2017) The Lammy Review, London: Ministry of Justice96 House of Lords written question HL3275, 5 January 201797 Table P.04, Home Office (2017) Operation of police powers under the Terrorism Act 2000: quarterly update to June 2017, London: Home Office and Table A1.10, Ministry of Justice (2017)
Offender management statistics prison population 2017, London: Ministry of Justice98 Shalev, S. and Edgar, K. (2015) Deep custody: Segregation units and close supervision centres in England and Wales, London: Prison Reform Trust99 HM Chief Inspector of Prisons (2017) Annual Report 2016–17, London: The Stationery Office100 Ibid.101 Shalev, S. and Edgar, K. (2015) Deep custody: Segregation units and close supervision centres in England and Wales, London: Prison Reform Trust and data provided by NOMS102 Table 5.4, Uhrig, N (2016) Black, Asian and minority ethnic disproportionality in the criminal justice system in England and Wales, London: Ministry of Justice
24
People in prison
Gypsy, Roma and Traveller prisoners5% of prisoners say they are Gypsy, Romany or Traveller, compared to an estimated 0.1% of the general population in England.103 However, “there is evidence of a possible reluctance by many prisoners to identify themselves as such.”104
103 HM Chief Inspector of Prisons (2017) Annual Report 2016–17, London: The Stationery Office and Irish Traveller Movement in Britain (2013) Gypsy and Traveller population in England and the 2011 Census, London: ITMB and Office for National Statistics (2013) Annual Mid-year Population Estimates, 2011 and 2012, London: ONS
104 Department for Communities and Local Government (2012), Progress report by the ministerial working group on tackling inequalities experienced by Gypsies and Travellers, London: CLG
Source: Offender management statistics, Prison population 2017
Asian and mixed ethnicity prisoner numbers havenearly doubled since 2004
Perc
enta
ge c
hang
e
-100
-50
0
50
100
150
2004 2006 2008 2010 2012 2014 2017
White BlackAsian Mixed
BAME men more likely to be arrested, plead not guilty and be sent to prison by the Crown Court
Source: Ministry of Justice (2016) Black, Asian and minority ethnic disproportionality in the criminal justice system in England and Wales
Like
lihoo
d co
mpa
red
to w
hite
men
-50%
0%
50%
100%
150%
200%
250%
Arrested Convicted Custodial sentence Tried at Crown Remanded Plead not guilty Custodial sentence
Black menAll BME men
Magistrates’ court Crown court
Deviation from 0% shows evidence of disproportionality compared to white menIf it is above 0% it is more likely to occur than for white menIf it is below 0% it is less likely to occur than for white men
Mixed
Black
White
Other
Asian
More likely
0.94
1.01
1
0.93
0.94
0.67
0.84
1
1.15
1.51
Source: Ministry of Justice (2016), Black, Asian and minority ethnicdisproportionality in the criminal justice system in England and Wales
Black and mixed ethnicity prisoners are more likelyto get an adjudication—but less likely for it to be proven
AdjudicationProven
Less likely
Discrimination complaints about staff aresignificantly less likely to be upheld or partly upheld
Source: Prison Reform Trust (2017) Tackling discrimination in prison(Based on 610 investigations from eight London prisons in 2014)
57% Complaint by a prisoner
about a prisoner
81% Complaint by staffabout a prisoner
9% Complaint by a
prisoner about staff
Source: Criminal justice statistics quarterly December 2016, Sentencing data tool
Average custodial sentence lengths are higher for black,Asian and mixed ethnicity people—and have risen sharply
Mon
ths*
0
5
10
15
20
25
30
2009 2011 2013 2015
White BlackAsian Mixed
*data only available for indictable and triable either way offences
25
People in prison
Older people in prison
With prison sentences getting longer, people are growing old behind bars. People aged 60 and over are the fastest growing age group in the prison estate. There are now more than triple the number there were 15 years ago.107
16% of the prison population are aged 50 or over—13,601 people. Of these 3,251 are in their 60s and a further 1,601 people are 70 or older.108
The number of over 50s in prison is projected to rise to 14,800 by 2021—an increase of 11%. The most significant change is anticipated in the over 70s, projected to rise by 31%.109
45% of men in prison aged over 50 have been convicted of sex offences. The next highest offence category is violence against the person (23%) followed by drug offences (9%).110
234 people in prison were aged 80 or over as of 31 December 2016. 219 were in their 80s, 14 were in their 90s, and 1 was over 100 years old—87% were in prison for sexual offences.111
The majority of 80 year olds in prison (92%) were aged 70 or older when sentenced to custody.112
Three in 10 people serving an indeterminate sentence are aged 50 or over. 2,326 people were serving life sentences and a further 803 were serving an Indeterminate Sentence for Public Protection (IPP).113
105 Prison Reform Trust and Restore Support Network (2016) Social care or systematic neglect: Older people on release from prison, London: Prison Reform Trust and Prisons and Probation Ombudsman (2017) Learning lessons from PPO investigations: Older prisoners, London: Prisons and Probation Ombudsman
106 House of Commons Justice Committee (2013) Older Prisoners, London: HM Stationery Office.107 Table A1.7, Ministry of Justice (2017) Offender management statistics prison population 2017, London: Ministry of Justice108 Table 1.3, Ministry of Justice (2017) Offender management statistics quarterly: April to June 2017, London: Ministry of Justice109 Table 4.1, Ministry of Justice (2017) Prison population projections 2017 to 2022, London: Ministry of Justice110 House of Lords written question HL3278, 5 January 2017111 Table 1, Ministry of Justice (2017) Further breakdown of the prison population by age and offence group as at 31 December 2016, London: Ministry of Justice112 House of Lords written question HL2097, 27 October 2017113 Table A1.16, Ministry of Justice (2017) Offender management statistics prison population 2017, London: Ministry of Justice
Older prisoners can be split into four main profiles, each with different needs: Repeat prisoners. People in and out of prison for less serious offences and have returned to prison at an older age. Grown old in prison. People sentenced for a long sentence prior to the age of 50 and have grown old in prison. Short-term, first-time prisoners. People sentenced to prison for the first time for a short sentence. Long-term, first-time prisoners. People sentenced to prison for the first time for a long sentence, possibly for historic sexual or violent offences.Many experience chronic health problems prior to or during imprisonment as a result of poverty, poor diet, inadequate access to healthcare, alcoholism, smoking and other substance abuse. The psychological strains of prison life can further accelerate the ageing process.
The Prison Reform Trust, along with HM Chief Inspector of Prisons, the Prisons and Probation Ombudsman, Age UK and other organisations has called for a national strategy for work with older people in prison105, something the Justice Committee agreed with and has stated: “It is inconsistent for the Ministry of Justice to recognise both the growth in the older prisoner population and the severity of their needs and not to articulate a strategy to properly account for this.”106
The Care Act means that local authorities now have a duty to assess and give care and support to people who meet the threshold for care and are in prisons and probation hostels in their area.
26
People in prison
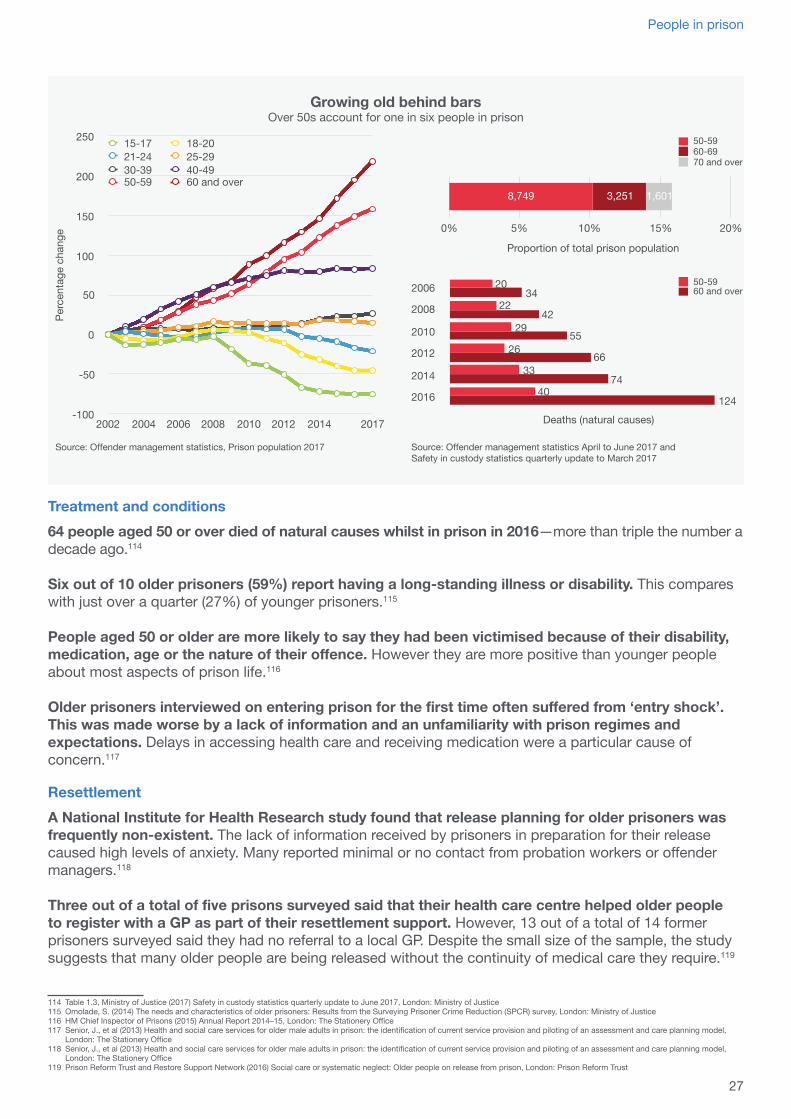
Treatment and conditions64 people aged 50 or over died of natural causes whilst in prison in 2016—more than triple the number a decade ago.114
Six out of 10 older prisoners (59%) report having a long-standing illness or disability. This compares with just over a quarter (27%) of younger prisoners.115
People aged 50 or older are more likely to say they had been victimised because of their disability, medication, age or the nature of their offence. However they are more positive than younger people about most aspects of prison life.116
Older prisoners interviewed on entering prison for the first time often suffered from ‘entry shock’. This was made worse by a lack of information and an unfamiliarity with prison regimes and expectations. Delays in accessing health care and receiving medication were a particular cause of concern.117
ResettlementA National Institute for Health Research study found that release planning for older prisoners was frequently non-existent. The lack of information received by prisoners in preparation for their release caused high levels of anxiety. Many reported minimal or no contact from probation workers or offender managers.118
Three out of a total of five prisons surveyed said that their health care centre helped older people to register with a GP as part of their resettlement support. However, 13 out of a total of 14 former prisoners surveyed said they had no referral to a local GP. Despite the small size of the sample, the study suggests that many older people are being released without the continuity of medical care they require.119
114 Table 1.3, Ministry of Justice (2017) Safety in custody statistics quarterly update to June 2017, London: Ministry of Justice115 Omolade, S. (2014) The needs and characteristics of older prisoners: Results from the Surveying Prisoner Crime Reduction (SPCR) survey, London: Ministry of Justice116 HM Chief Inspector of Prisons (2015) Annual Report 2014–15, London: The Stationery Office117 Senior, J., et al (2013) Health and social care services for older male adults in prison: the identification of current service provision and piloting of an assessment and care planning model,
London: The Stationery Office118 Senior, J., et al (2013) Health and social care services for older male adults in prison: the identification of current service provision and piloting of an assessment and care planning model,
London: The Stationery Office119 Prison Reform Trust and Restore Support Network (2016) Social care or systematic neglect: Older people on release from prison, London: Prison Reform Trust
Growing old behind barsOver 50s account for one in six people in prison
Source: Offender management statistics April to June 2017 andSafety in custody statistics quarterly update to March 2017
2006
2008
2010
2012
2014
2016
Deaths (natural causes)124
74
66
55
42
34
40
33
26
29
22
20 50-5960 and over
Proportion of total prison population
0% 5% 10% 15% 20%
50-5960-6970 and over
Perc
enta
ge c
hang
e
-100
-50
0
50
100
150
200
250
2002 2004 2006 2008 2010 2012 2014 2017
15-17 18-2021-24 25-2930-39 40-4950-59 60 and over
Source: Offender management statistics, Prison population 2017
27
People in prison
Life and indeterminate sentences
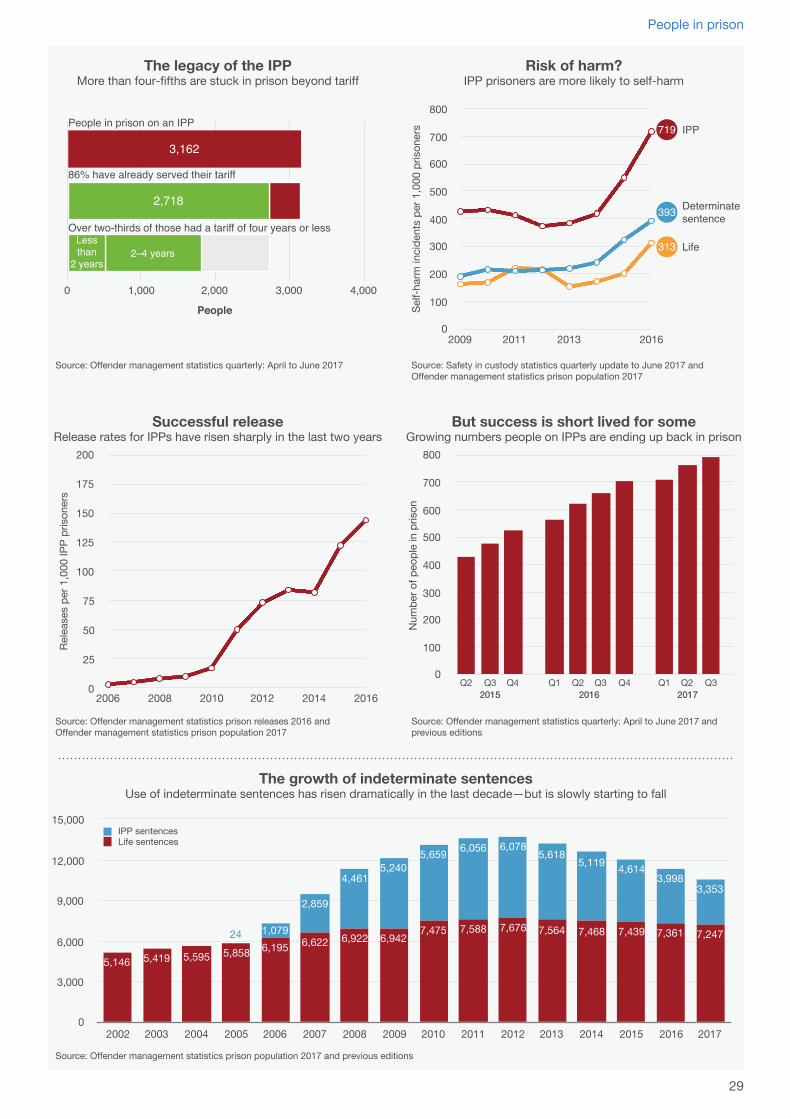
Many people in prison don’t know if, or when, they might be released. 10,378 people are currently in prison serving an indeterminate sentence—accounting for 14% of the sentenced prison population, up from 9% in 1993.120
England and Wales have more than twice as many people serving indeterminate sentences than France, Germany and Italy combined—the highest in Europe by a significant margin.121
They must serve a minimum period in prison, set by the courts, before they can be considered for release by the Parole Board. They are subject to monitoring and restrictions on release, and continue to serve their sentence for the rest of their lives. They can be returned to custody if they break these terms.
Indeterminate Sentence for Public Protection (IPP)Despite its abolition in 2012, over four-fifths (86%) of people in prison currently serving an IPP sentence are still there despite having passed their tariff expiry date—the minimum period they must spend in custody and considered necessary to serve as punishment for the offence.122
16% of people currently serving an IPP have a tariff of less than two years, and 41% have a tariff of between two and four years.123
513 people are still in prison despite being given a tariff of less than two years—over half of these (277 people) have served eight years or more beyond their original tariff.124
The Parole Board predicts that, without legislation, there will still be 1,500 people in prison serving an IPP by 2020.125
Last year the Parole Board ordered the release of 905 people on IPPs, including the re-release of 249 people recalled back to custody. However, in the same period 481 people on IPPs were recalled.126
Around 60% of those reviewed by the Parole Board at an oral hearing following a recall were re-released.127
Life sentences7,216 people are currently in prison serving a life sentence. Over half (52%) had a tariff of 10–20 years, nearly a quarter (23%) had over 20 years and a similar proportion (22%) had 10 years or less.128
Around three in 10 people (29%) currently in prison on a life sentence have already served their minimum tariff.129
People serving mandatory life sentences are spending more of their sentence in prison. On average they spend 16 years in custody, up from 13 years in 2001.130
Judges are also imposing longer tariff periods.131 The average minimum term imposed for murder rose from 12.5 years in 2003 to 21.3 years in 2016.132
There are currently 59 people serving a whole life sentence—they are unlikely to ever be released.133
The vast majority of life sentenced prisoners are successfully integrated back into the community on release. 4.3% of those sentenced to a mandatory life sentence were reconvicted of any criminal offence within a year, compared to 48.3% of the overall prison population.134 120 Table 1.1, Ministry of Justice (2017) Offender management statistics quarterly: April to June 2017, London: Ministry of Justice and Ministry of Justice (2013) Story of the prison population:
1993–2012 England and Wales, London: Ministry of Justice121 Table 7, Aebi, M., et al. (2017) Council of Europe Annual Penal Statistics, Survey 2015, Strasbourg: Council of Europe and Council of Europe Annual Penal Statistics, Survey 2014122 Table 1.9a, Ministry of Justice (2017) Offender management statistics quarterly: April to June 2017, London: Ministry of Justice123 Ibid.124 Table 1.9b, Ibid.125 Jones, M. (2016) Written advice to Nick Hardwick, London: Parole Board. Available at http://bit.ly/IPPadvice126 Jones, M. (2017) ‘IPPs, recalls and the future of parole’ available at http://www.russellwebster.com/martin-jones2/127 Ibid.128 Table 1.9a, Ministry of Justice (2017) Offender management statistics quarterly: April to June 2017, London: Ministry of Justice129 Ibid.130 Table A3.3, Ministry of Justice (2017) Offender management statistics prison releases 2016, London: Ministry of Justice and Table A3.5, Ministry of Justice (2011) Offender management
statistics annual tables 2010, London: Ministry of Justice131 Criminal Justice Joint Inspection (2013) A joint inspection of life sentenced prisoners, London: HM Inspectorate of Probation132 Ministry of Justice (2014) Freedom of Information request 89346, London: Ministry of Justice and House of Lords written question HL2315, 6 November 2017133 Table 1.9a, Ministry of Justice (2017) Offender management statistics quarterly: April to June 2017, London: Ministry of Justice134 Table C2a, Ministry of Justice (2017) Proven reoffending statistics: October 2015 to December 2015, London: Ministry of Justice
28
People in prison
0
3,000
6,000
9,000
12,000
15,000
2002 2003 2004 2005 2006 2007 2008 2009 2010 2011 2012 2013 2014 2015 2016 2017
3,3533,998
4,6145,1195,618
6,0786,0565,6595,240
4,461
2,859
1,07924 7,2477,3617,4397,4687,5647,6767,5887,4756,9426,9226,6226,1955,8585,5955,4195,146
Life sentencesIPP sentences
The growth of indeterminate sentencesUse of indeterminate sentences has risen dramatically in the last decade—but is slowly starting to fall
Source: Offender management statistics prison population 2017 and previous editions
Source: Offender management statistics quarterly: April to June 2017 andprevious editions
Num
ber o
f peo
ple
in p
rison
0
100
200
300
400
500
600
700
800
But success is short lived for someGrowing numbers people on IPPs are ending up back in prison
Q2 Q3 Q42015
Q1 Q2 Q3 Q42016
Q1 Q2 Q32017
People
0 1,000 2,000 3,000 4,000
2,718
3,162
The legacy of the IPPMore than four-fifths are stuck in prison beyond tariff
Source: Offender management statistics quarterly: April to June 2017
People in prison on an IPP
86% have already served their tariff
Over two-thirds of those had a tariff of four years or lessLessthan
2 years2–4 years
Rele
ases
per
1,0
00 IP
P pr
ison
ers
0
25
50
75
100
125
150
175
200
2006 2008 2010 2012 2014 2016
Successful releaseRelease rates for IPPs have risen sharply in the last two years
Source: Offender management statistics prison releases 2016 andOffender management statistics prison population 2017
Self-
harm
inci
dent
s pe
r 1,0
00 p
rison
ers
0
100
200
300
400
500
600
700
800
2009 2011 2013 2016
Risk of harm?IPP prisoners are more likely to self-harm
Source: Safety in custody statistics quarterly update to June 2017 andOffender management statistics prison population 2017
29
People in prison
People with learning disabilities and difficulties
Nearly three in 10 people (29%) were identified as having a learning disability or difficulty following assessment on entry to prison in 2015–16.137
7% of people in contact with the criminal justice system have a learning disability—this compares with around 2% of the general population.138
Despite isolated good practice, for example at HMPs Parc and Littlehey, inspectors found that there has been a lack of focus and leadership from central government which has meant that little discernible progress has been made in improving the lives of this vulnerable group of offenders.139
Inspectors have found that “little thought was given to the need to adapt regimes to meet the needs of prisoners with learning disabilities who may find understanding and following prison routines very difficult.”140
However, more than half of prisons inspected this year were actively identifying and supporting prisoners with learning disabilities—a marked improvement on previous years.141
Prisoners with learning disabilities or difficulties are more likely than other prisoners to have broken a prison rule; they are five times as likely to have been subject to control and restraint, and around three times as likely to report having spent time in segregation.142
Prisoners with learning disabilities or difficulties were almost three times as likely as other prisoners to have clinically significant anxiety or depression—many were both anxious and depressed.143
Over half of prison staff believe that prisoners with learning disabilities or difficulties are more likely to be victimised and bullied than other prisoners.144 Over half of such prisoners say they had been scared while in prison and almost half say they have been bullied or that people have been nasty to them.145
135 Talbot, J. (2008) Prisoners’ Voices: Experiences of the criminal justice system by prisoners with learning disabilities and difficulties, London: Prison Reform Trust136 HM Chief Inspector of Prisons (2017) Annual Report 2016–17, London: The Stationery Office137 Skills Funding Agency (2017) OLASS English and maths assessments by ethnicity and learners with learning difficulties or disabilities: participation 2014/15 to 2015/16, London: SFA138 NHS England (2016) Strategic direction for health services in the justice system: 2016–2020, London: NHS England139 Criminal Justice Joint Inspection (2015) A joint inspection of the treatment of offenders with learning disabilities within the criminal justice system—phase two in custody and the community,
London: HM Inspectorate of Prisons140 Ibid.141 HM Chief Inspector of Prisons (2017) Annual Report 2016–17, London: The Stationery Office142 Talbot, J. (2008) Prisoners’ Voices: Experiences of the criminal justice system by prisoners with learning disabilities and difficulties, London: Prison Reform Trust143 Ibid.144 Talbot, J, (2007) No One Knows: Identifying and supporting prisoners with learning difficulties and learning disabilities: the views of prison staff, London: Prison Reform Trust145 Talbot, J. (2008) Prisoners’ Voices: Experiences of the criminal justice system by prisoners with learning disabilities and difficulties, London: Prison Reform Trust
People with learning disabilities or difficulties are discriminated against personally, systemically and routinely as they enter and travel through the criminal justice system. They are frequently excluded from elements of the prison regime including opportunities to address their offending behaviour.135
Following a review by Lord Bradley of people with mental health and learning disabilities in the criminal justice system, and his subsequent report (The Bradley Report, 2009), the government invested in liaison and diversion services in police custody suites and the criminal courts. Liaison and diversion services help to identify people with mental health and learning disabilities, autism and other needs as early as possible as they enter the criminal justice system. Information from liaison and diversion services helps to inform criminal justice decision making and referrals into local services, as appropriate, including diversion away from the criminal justice system.
A joint inspection of the treatment of offenders with learning disabilities, published in 2015, found that improvements to services for this group have been limited and slow to implement; there was evidence that many prisons and probation trusts were either unaware of or unwilling to implement National Offender Management Service instructions and the Equality Act 2010, with probation and prison leaders often unclear of their statutory duty to make reasonable adjustments to services for people with a disability.
The Care Act 2014 places a duty on local authorities to assess the social care needs of prisoners and people living in probation hostels and, where eligible needs are identified, to ensure the necessary care and support is provided. Inspectors found that most prisons worked effectively with their local authorities and care providers to deliver social care.136
30
People in prison
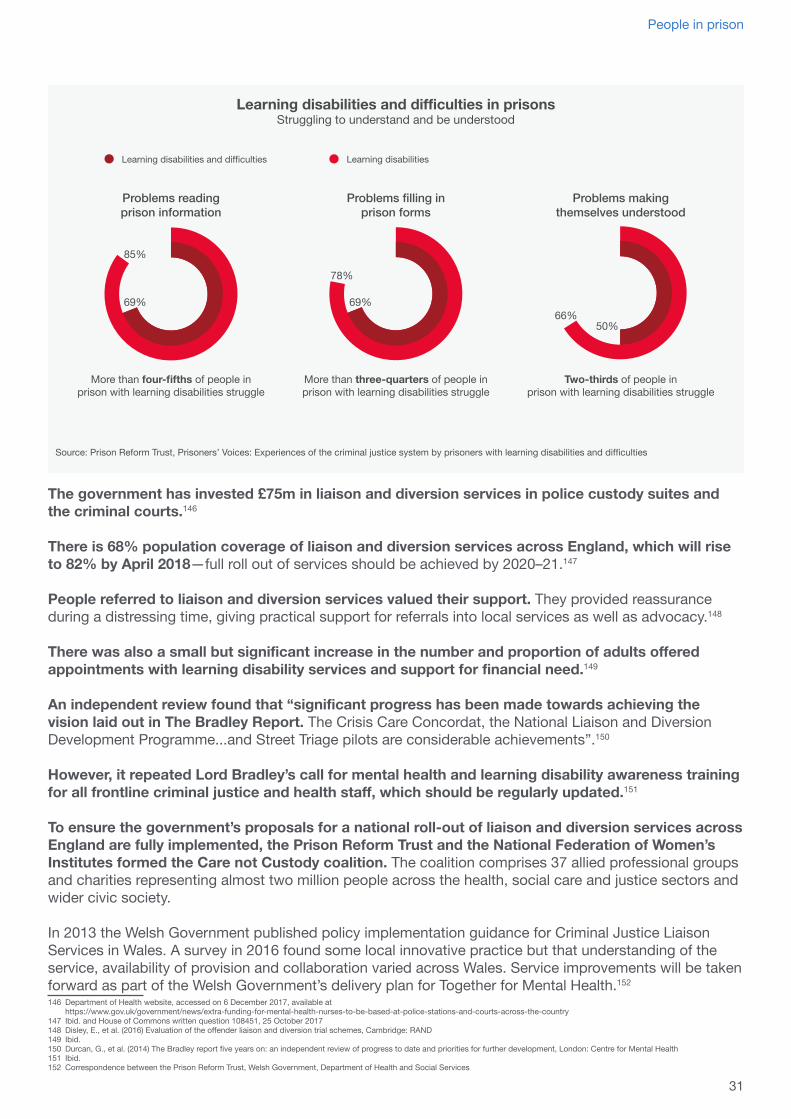
The government has invested £75m in liaison and diversion services in police custody suites and the criminal courts.146
There is 68% population coverage of liaison and diversion services across England, which will rise to 82% by April 2018—full roll out of services should be achieved by 2020–21.147
People referred to liaison and diversion services valued their support. They provided reassurance during a distressing time, giving practical support for referrals into local services as well as advocacy.148
There was also a small but significant increase in the number and proportion of adults offered appointments with learning disability services and support for financial need.149
An independent review found that “significant progress has been made towards achieving the vision laid out in The Bradley Report. The Crisis Care Concordat, the National Liaison and Diversion Development Programme...and Street Triage pilots are considerable achievements”.150
However, it repeated Lord Bradley’s call for mental health and learning disability awareness training for all frontline criminal justice and health staff, which should be regularly updated.151
To ensure the government’s proposals for a national roll-out of liaison and diversion services across England are fully implemented, the Prison Reform Trust and the National Federation of Women’s Institutes formed the Care not Custody coalition. The coalition comprises 37 allied professional groups and charities representing almost two million people across the health, social care and justice sectors and wider civic society.
In 2013 the Welsh Government published policy implementation guidance for Criminal Justice Liaison Services in Wales. A survey in 2016 found some local innovative practice but that understanding of the service, availability of provision and collaboration varied across Wales. Service improvements will be taken forward as part of the Welsh Government’s delivery plan for Together for Mental Health.152 146 Department of Health website, accessed on 6 December 2017, available at
https://www.gov.uk/government/news/extra-funding-for-mental-health-nurses-to-be-based-at-police-stations-and-courts-across-the-country147 Ibid. and House of Commons written question 108451, 25 October 2017148 Disley, E., et al. (2016) Evaluation of the offender liaison and diversion trial schemes, Cambridge: RAND149 Ibid.150 Durcan, G., et al. (2014) The Bradley report five years on: an independent review of progress to date and priorities for further development, London: Centre for Mental Health 151 Ibid.152 Correspondence between the Prison Reform Trust, Welsh Government, Department of Health and Social Services
Learning disabilities and difficulties in prisonsStruggling to understand and be understood
Source: Prison Reform Trust, Prisoners’ Voices: Experiences of the criminal justice system by prisoners with learning disabilities and difficulties
More than four-fifths of people inprison with learning disabilities struggle
Problems readingprison information
69%
85%
Problems filling inprison forms
More than three-quarters of people inprison with learning disabilities struggle
69%
78%
Problems makingthemselves understood
Two-thirds of people inprison with learning disabilities struggle
50%66%
31
People in prison
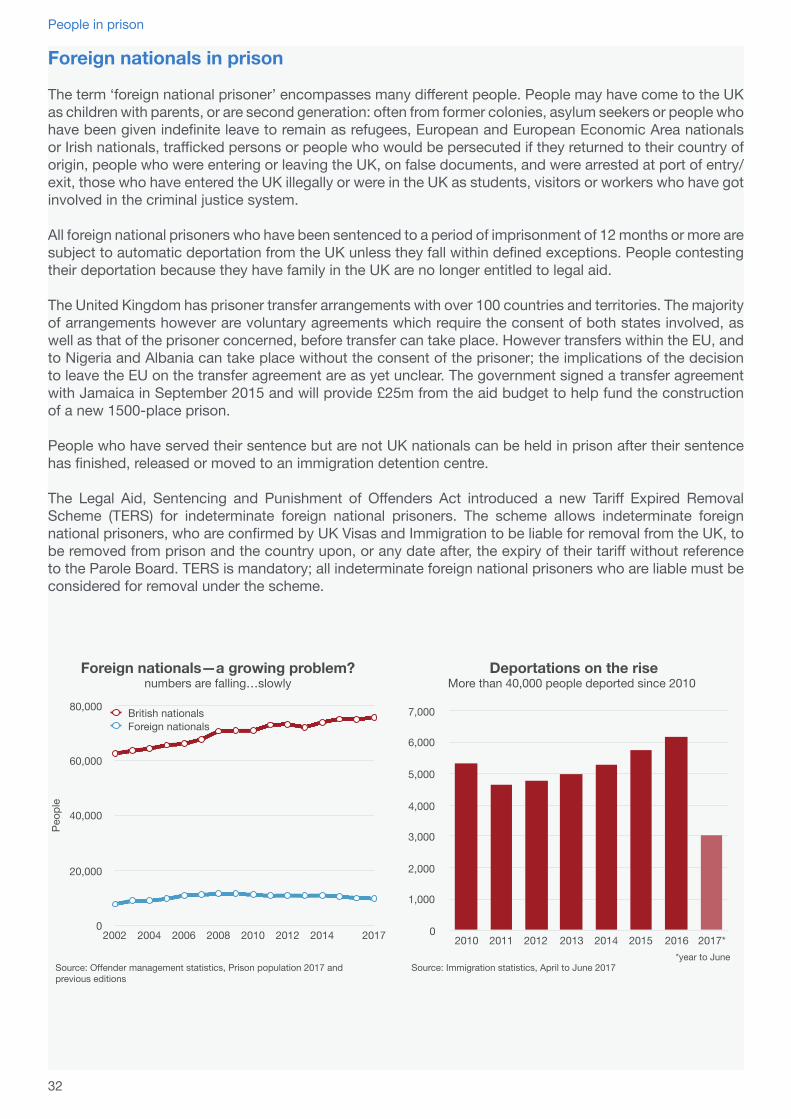
Foreign nationals in prison
The term ‘foreign national prisoner’ encompasses many different people. People may have come to the UK as children with parents, or are second generation: often from former colonies, asylum seekers or people who have been given indefinite leave to remain as refugees, European and European Economic Area nationals or Irish nationals, trafficked persons or people who would be persecuted if they returned to their country of origin, people who were entering or leaving the UK, on false documents, and were arrested at port of entry/exit, those who have entered the UK illegally or were in the UK as students, visitors or workers who have got involved in the criminal justice system.
All foreign national prisoners who have been sentenced to a period of imprisonment of 12 months or more are subject to automatic deportation from the UK unless they fall within defined exceptions. People contesting their deportation because they have family in the UK are no longer entitled to legal aid.
The United Kingdom has prisoner transfer arrangements with over 100 countries and territories. The majority of arrangements however are voluntary agreements which require the consent of both states involved, as well as that of the prisoner concerned, before transfer can take place. However transfers within the EU, and to Nigeria and Albania can take place without the consent of the prisoner; the implications of the decision to leave the EU on the transfer agreement are as yet unclear. The government signed a transfer agreement with Jamaica in September 2015 and will provide £25m from the aid budget to help fund the construction of a new 1500-place prison.
People who have served their sentence but are not UK nationals can be held in prison after their sentence has finished, released or moved to an immigration detention centre.
The Legal Aid, Sentencing and Punishment of Offenders Act introduced a new Tariff Expired Removal Scheme (TERS) for indeterminate foreign national prisoners. The scheme allows indeterminate foreign national prisoners, who are confirmed by UK Visas and Immigration to be liable for removal from the UK, to be removed from prison and the country upon, or any date after, the expiry of their tariff without reference to the Parole Board. TERS is mandatory; all indeterminate foreign national prisoners who are liable must be considered for removal under the scheme.
Peop
le
0
20,000
40,000
60,000
80,000
2002 2004 2006 2008 2010 2012 2014 2017
British nationalsForeign nationals
Source: Offender management statistics, Prison population 2017 andprevious editions
Foreign nationals—a growing problem?numbers are falling…slowly
Source: Immigration statistics, April to June 2017
0
1,000
2,000
3,000
4,000
5,000
6,000
7,000
2010 2011 2012 2013 2014 2015 2016 2017**year to June
Deportations on the riseMore than 40,000 people deported since 2010
32
People in prison
Foreign nationals (non-UK passport holders) currently make up 12% of the prison population in England and Wales. On 30 September 2017 there were 9,946 foreign nationals in prison.153
Foreign national prisoners come from 166 countries—but over half are from nine countries (Poland, Ireland, Albania, Romania, Jamaica, Pakistan, Lithuania, India and Somalia).154
There was a rapid increase in foreign national prisoners between 2002–09. Numbers rose by nearly 50%, compared with a 13% increase in British nationals. Since then, numbers have very steadily fallen.155
10% of women in prison are foreign nationals.156 Some are known to have been coerced or trafficked into offending.157
Three-quarters of foreign nationals entering prison to serve a sentence in 2015 were sent there for non-violent offences.158
Foreign nationals accounted for nearly 20% of self-inflicted deaths investigated by the Prisons and Probation Ombudsman in 2015–16.159
Inspectors found that provision for foreign nationals was mixed. There were rarely dedicated officers to assist these prisoners, and it was difficult for many foreign nationals to access immigration-specific legal advice.160
Removal and deportationThe average number of days taken to remove a foreign national offender is currently 100 days—however many people are detained for considerably longer.161
78 people are still in detention after a year or more, awaiting deportation.162
Immigration detainees360 people were still held in prison at the end of June 2017 under immigration powers, despite having completed their custodial sentence.163
Inspectors found men at HMPs Nottingham and Cardiff who had been detained for six months—one man had been held for nine months in HMP Exeter.164
Unlike those held in prisons, people held in Immigration Removal Centres are entitled access to mobile phones, the internet, legal advice and additional safeguards.165
The European Committee for the Prevention of Torture and Inhuman or Degrading Treatment or Punishment, has stated that holding immigration detainees in prison is “fundamentally flawed”.166 A 2013 inspection of HMP Pentonville found that it was not a suitable environment to hold immigration detainees.167
Over £18m was awarded in compensation for the unlawful detention of foreign nationals between 2011 and 2015.168
153 Table 1.7, Ministry of Justice (2017) Offender management statistics quarterly: April to June 2017, London: Ministry of Justice154 Ibid.155 Table A1.9, Ministry of Justice (2017) Offender management statistics, Prison population 2017, London: Ministry of Justice.156 Table 1.7, Ministry of Justice (2017) Offender management statistics quarterly: April to June 2017, London: Ministry of Justice157 Hales, L. and Gelsthorpe, L. (2012) The criminalisation of migrant women, Cambridge: University of Cambridge158 House of Commons written question 36554, 11 May 2016159 Prisons and Probation Ombudsman (2016) Annual report 2015–16, London: PPO160 HM Chief Inspector of Prisons (2017) Annual Report 2016–17, London: The Stationery Office161 Table FNO_10, Home Office (2017) Immigration Enforcement data: August 2017, London: Home Office162 Table FNO_6, Ibid.163 Home Office, Immigration statistics, April to June 2017, available at
https://www.gov.uk/government/publications/immigration-statistics-april-to-june-2017/summary-of-latest-statistics#how-many-people-are-detained-or-returned164 HM Chief Inspector of Prisons (2017) Annual Report 2016–17, London: The Stationery Office165 HM Chief Inspector of Prisons (2015) Annual Report 2014-15, London: The Stationery Office166 European Committee for the Prevention of Torture and Inhuman or Degrading Treatment or Punishment (2013) CPT Standards, Strasbourg: Council of Europe167 HM Inspectorate of Prisons (2013) Report on a full unannounced inspection of HMP Pentonville, London: HMIP168 House of Commons Home Affairs Committee (2016) The work of the immigration directorates (Q4 2015), London: The Stationery Office
33
People in prison
Women in prison
Use of custodyThe number of women in prison has more than doubled since 1993. There are now around 2,400 more women in prison today than there were in 1993.169
On 24 November 2017 there were 4,048 women in prison in England and Wales.170 There were 8,583 receptions of women into prison in the year to June 2017, either on remand or to serve a sentence.171
Yet most women entering prison under sentence (83%) have committed a non-violent offence.172
More women were sent to prison in the year to June 2017 to serve a sentence for theft than for violence against the person, robbery, sexual offences, fraud, drugs, and motoring offences combined.173
Mental healthNearly two-thirds of women (65%) reported that they had mental health issues compared with over two-fifths of men (42%).174
Too many women requiring assessment or treatment in hospital mental health units waited too long to be transferred according to inspectors—up to 12 weeks at HMPs Foston Hall and Bronzefield.175
Rehabilitation and resettlement48% of women are reconvicted within one year of leaving prison. This rises to 61% for sentences of less than 12 months and to 78% for women who have served more than 11 previous custodial sentences.176
The number of women recalled to custody whilst under supervision after their release has doubled since the end of 2014—just before mandatory supervision was introduced for people serving sentences of 12 months or less on release. 1,458 women were recalled in the year to June 2017.177
Women released from prison are more likely to reoffend, and reoffend sooner, than those serving community sentences.178
Women are generally more positive than men about opportunities for purposeful activity in prison. They are more likely to report that they have a prison job, are undertaking training or are in education.179
169 Table A1.2, Ministry of Justice (2017) Offender management statistics prison population 2017, London: Ministry of Justice and Table 1.1, Ministry of Justice (2017) Offender management statistics quarterly: April to June 2017, London: Ministry of Justice
170 Ministry of Justice (2017) Population and capacity briefing for Friday 24 November 2017, London: Ministry of Justice171 Table 2.1, Ministry of Justice (2017) Offender management statistics quarterly: April to June 2017, London: Ministry of Justice172 Table 2.4b, Ibid.173 Ibid.174 HM Chief Inspector of Prisons (2017) Annual Report 2016–17, London: The Stationery Office175 Ibid.176 Table 6.07, 6.09 and 6.10, Ministry of Justice (2016) Women and the criminal Justice system 2015, London: Ministry of Justice177 Table 5.2, Ministry of Justice (2017) Offender management statistics quarterly: April to June 2017, London: Ministry of Justice and earlier editions178 Hedderman, C. and Jolliffe, D. (2015) The Impact of Prison for Women on the Edge: Paying the Price for Wrong Decisions, Victims & Offenders: An International Journal of Evidence-based
Research, Policy, and Practice. 10 (2), 152–178179 HM Chief Inspector of Prisons (2017) Annual Report 2016–17, London: The Stationery Office
Women are a minority within the criminal justice system, accounting for around 15% of the probation caseload and less than 5% of the prison population. The drivers to their offending differ significantly from men’s and they often have more complex needs.
A series of inquiries and reports in recent decades have all concluded that prison is rarely a necessary, appropriate or proportionate response to women who get caught up in the criminal justice system. It is now ten years since the influential Corston Report on women in contact with the criminal justice system.
The House of Commons Justice Committee, following its inquiry into women offenders, concluded that “prison is an expensive and ineffective way of dealing with many women offenders who do not pose a significant risk of harm to public safety” and called for “a significant increase in residential alternatives to custody as well as the maintenance of the network of women’s centres” seen as “more effective, and cheaper…than short custodial sentences”.
Ministers in England, Wales and Scotland have all recently committed to reducing women’s imprisonment. For data on women in Scotland and Northern Ireland please see pages 56 and 59.
34
People in prison
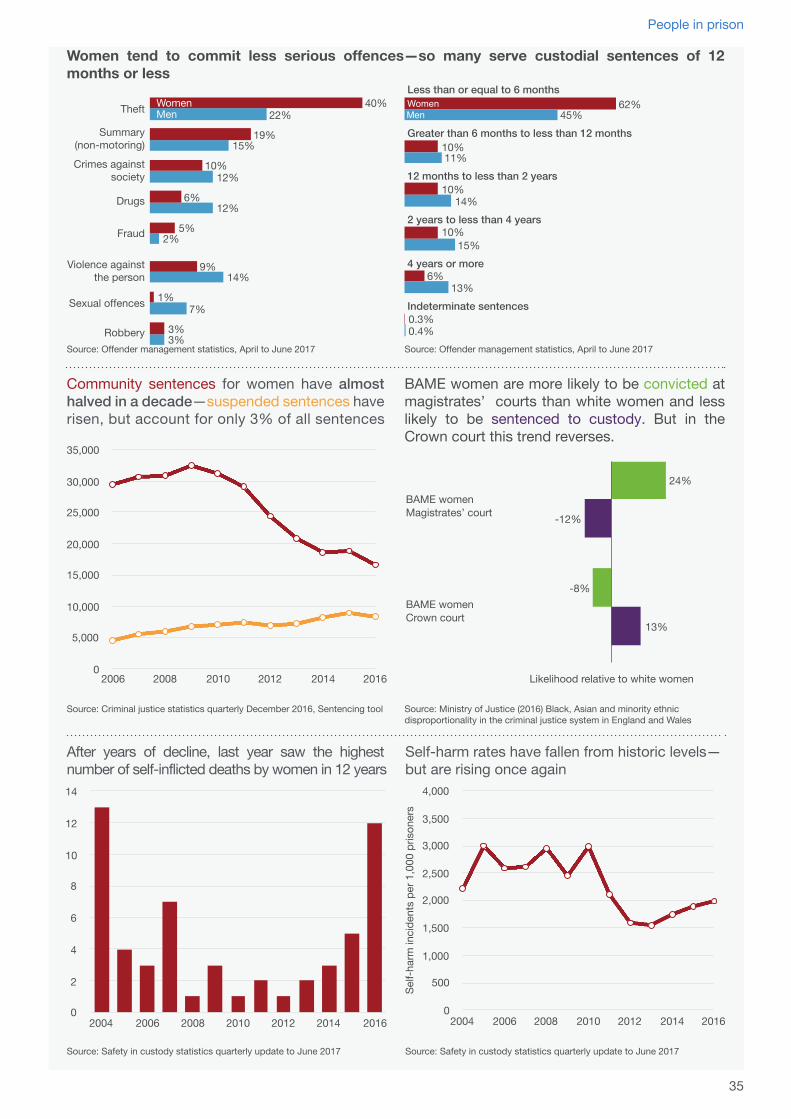
BAME women are more likely to be convicted at magistrates’ courts than white women and less likely to be sentenced to custody. But in the Crown court this trend reverses.
Source: Criminal justice statistics quarterly December 2016, Sentencing tool
0
5,000
10,000
15,000
20,000
25,000
30,000
35,000
2006 2008 2010 2012 2014 2016
Community sentences for women have almost halved in a decade—suspended sentences have risen, but account for only 3% of all sentences
3%
7%
14%
2%
12%
12%
15%
22%
3%
1%
9%
5%
6%
10%
19%
40%
Source: Offender management statistics, April to June 2017 Source: Offender management statistics, April to June 2017
62%45%
Less than or equal to 6 months
11%10%
Greater than 6 months to less than 12 months
14%10%
12 months to less than 2 years
15%10%
2 years to less than 4 years
13%6%
4 years or more
0.3%0.4%
Indeterminate sentences
Women tend to commit less serious offences—so many serve custodial sentences of 12 months or less
Source: Ministry of Justice (2016) Black, Asian and minority ethnic disproportionality in the criminal justice system in England and Wales
Likelihood relative to white women
13%
-12%
-8%
24%BAME women Magistrates’ court
BAME women Crown court
Source: Safety in custody statistics quarterly update to June 2017
0
2
4
6
8
10
12
14
2004 2006 2008 2010 2012 2014 2016
After years of decline, last year saw the highest number of self-inflicted deaths by women in 12 years
Source: Safety in custody statistics quarterly update to June 2017
Self-
harm
inci
dent
s pe
r 1,0
00 p
rison
ers
0
500
1,000
1,500
2,000
2,500
3,000
3,500
4,000
2004 2006 2008 2010 2012 2014 2016
Self-harm rates have fallen from historic levels—but are rising once again
35
People in prison
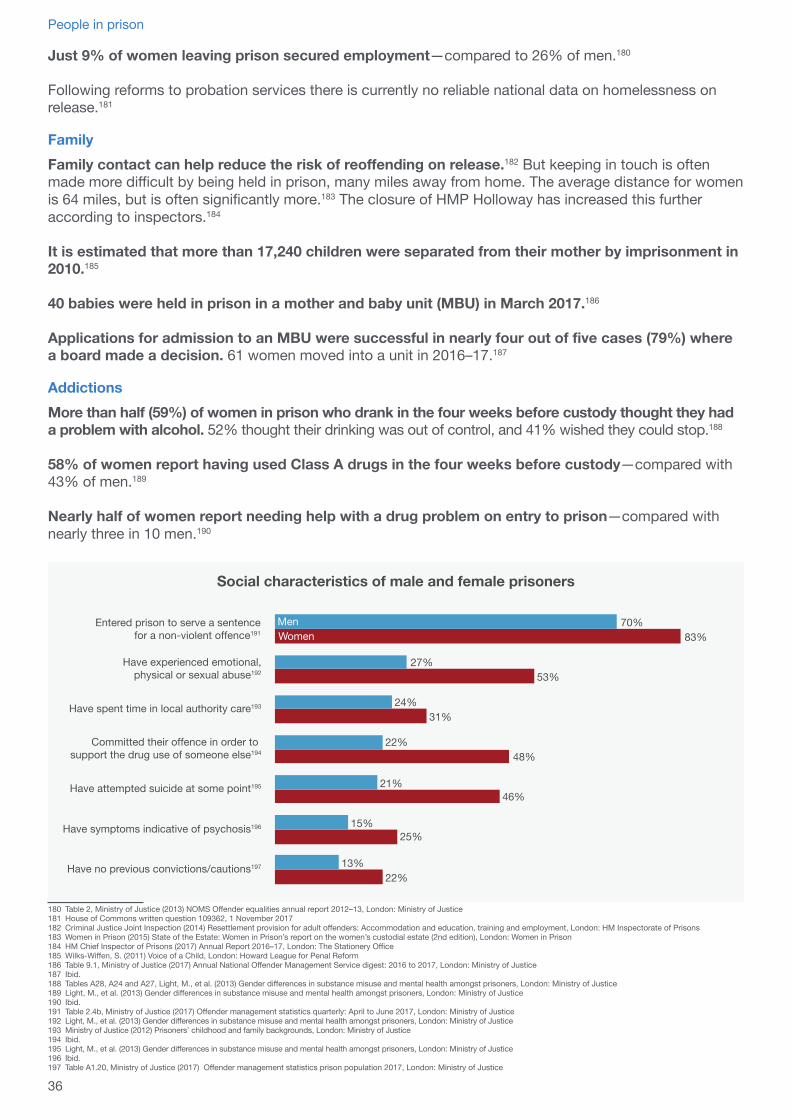
Just 9% of women leaving prison secured employment—compared to 26% of men.180
Following reforms to probation services there is currently no reliable national data on homelessness on release.181
FamilyFamily contact can help reduce the risk of reoffending on release.182 But keeping in touch is often made more difficult by being held in prison, many miles away from home. The average distance for women is 64 miles, but is often significantly more.183 The closure of HMP Holloway has increased this further according to inspectors.184
It is estimated that more than 17,240 children were separated from their mother by imprisonment in 2010.185
40 babies were held in prison in a mother and baby unit (MBU) in March 2017.186
Applications for admission to an MBU were successful in nearly four out of five cases (79%) where a board made a decision. 61 women moved into a unit in 2016–17.187
AddictionsMore than half (59%) of women in prison who drank in the four weeks before custody thought they had a problem with alcohol. 52% thought their drinking was out of control, and 41% wished they could stop.188
58% of women report having used Class A drugs in the four weeks before custody—compared with 43% of men.189
Nearly half of women report needing help with a drug problem on entry to prison—compared with nearly three in 10 men.190
180 Table 2, Ministry of Justice (2013) NOMS Offender equalities annual report 2012–13, London: Ministry of Justice181 House of Commons written question 109362, 1 November 2017 182 Criminal Justice Joint Inspection (2014) Resettlement provision for adult offenders: Accommodation and education, training and employment, London: HM Inspectorate of Prisons183 Women in Prison (2015) State of the Estate: Women in Prison’s report on the women’s custodial estate (2nd edition), London: Women in Prison184 HM Chief Inspector of Prisons (2017) Annual Report 2016–17, London: The Stationery Office185 Wilks-Wiffen, S. (2011) Voice of a Child, London: Howard League for Penal Reform186 Table 9.1, Ministry of Justice (2017) Annual National Offender Management Service digest: 2016 to 2017, London: Ministry of Justice187 Ibid.188 Tables A28, A24 and A27, Light, M., et al. (2013) Gender differences in substance misuse and mental health amongst prisoners, London: Ministry of Justice189 Light, M., et al. (2013) Gender differences in substance misuse and mental health amongst prisoners, London: Ministry of Justice190 Ibid.191 Table 2.4b, Ministry of Justice (2017) Offender management statistics quarterly: April to June 2017, London: Ministry of Justice192 Light, M., et al. (2013) Gender differences in substance misuse and mental health amongst prisoners, London: Ministry of Justice193 Ministry of Justice (2012) Prisoners’ childhood and family backgrounds, London: Ministry of Justice194 Ibid.195 Light, M., et al. (2013) Gender differences in substance misuse and mental health amongst prisoners, London: Ministry of Justice196 Ibid.197 Table A1.20, Ministry of Justice (2017) Offender management statistics prison population 2017, London: Ministry of Justice
25%
46%
48%
31%
53%
15%
21%
22%
24%
27%
Social characteristics of male and female prisoners
83%70%
22%13%197
192
193
194
195
196
191
36
People in prison
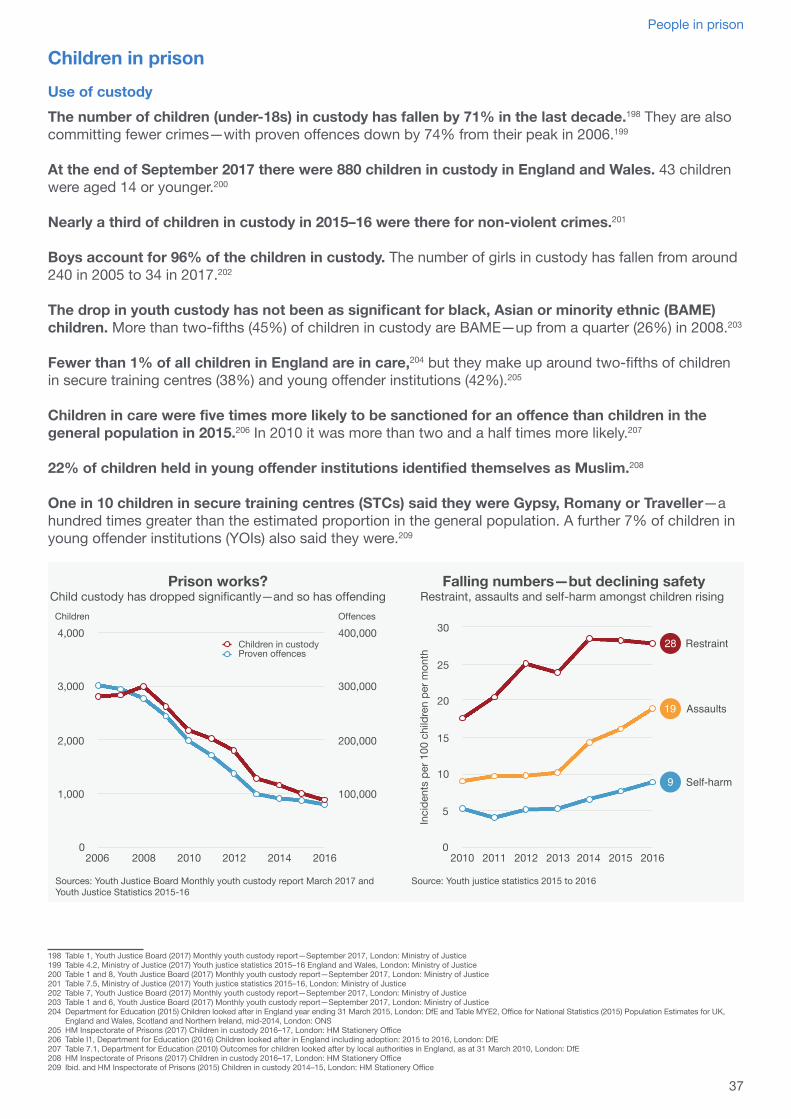
Children in prisonUse of custodyThe number of children (under-18s) in custody has fallen by 71% in the last decade.198 They are also committing fewer crimes—with proven offences down by 74% from their peak in 2006.199
At the end of September 2017 there were 880 children in custody in England and Wales. 43 children were aged 14 or younger.200
Nearly a third of children in custody in 2015–16 were there for non-violent crimes.201
Boys account for 96% of the children in custody. The number of girls in custody has fallen from around 240 in 2005 to 34 in 2017.202
The drop in youth custody has not been as significant for black, Asian or minority ethnic (BAME) children. More than two-fifths (45%) of children in custody are BAME—up from a quarter (26%) in 2008.203
Fewer than 1% of all children in England are in care,204 but they make up around two-fifths of children in secure training centres (38%) and young offender institutions (42%).205
Children in care were five times more likely to be sanctioned for an offence than children in the general population in 2015.206 In 2010 it was more than two and a half times more likely.207
22% of children held in young offender institutions identified themselves as Muslim.208
One in 10 children in secure training centres (STCs) said they were Gypsy, Romany or Traveller—a hundred times greater than the estimated proportion in the general population. A further 7% of children in young offender institutions (YOIs) also said they were.209
198 Table 1, Youth Justice Board (2017) Monthly youth custody report—September 2017, London: Ministry of Justice199 Table 4.2, Ministry of Justice (2017) Youth justice statistics 2015–16 England and Wales, London: Ministry of Justice200 Table 1 and 8, Youth Justice Board (2017) Monthly youth custody report—September 2017, London: Ministry of Justice201 Table 7.5, Ministry of Justice (2017) Youth justice statistics 2015–16, London: Ministry of Justice202 Table 7, Youth Justice Board (2017) Monthly youth custody report—September 2017, London: Ministry of Justice203 Table 1 and 6, Youth Justice Board (2017) Monthly youth custody report—September 2017, London: Ministry of Justice204 Department for Education (2015) Children looked after in England year ending 31 March 2015, London: DfE and Table MYE2, Office for National Statistics (2015) Population Estimates for UK,
England and Wales, Scotland and Northern Ireland, mid-2014, London: ONS205 HM Inspectorate of Prisons (2017) Children in custody 2016–17, London: HM Stationery Office206 Table I1, Department for Education (2016) Children looked after in England including adoption: 2015 to 2016, London: DfE207 Table 7.1, Department for Education (2010) Outcomes for children looked after by local authorities in England, as at 31 March 2010, London: DfE208 HM Inspectorate of Prisons (2017) Children in custody 2016–17, London: HM Stationery Office209 Ibid. and HM Inspectorate of Prisons (2015) Children in custody 2014–15, London: HM Stationery Office
100,000
200,000
300,000
400,000
0
1,000
2,000
3,000
4,000
2006 2008 2010 2012 2014 2016
Children in custodyProven offences
Prison works?Child custody has dropped significantly—and so has offending
Sources: Youth Justice Board Monthly youth custody report March 2017 andYouth Justice Statistics 2015-16
Children Offences
Falling numbers—but declining safetyRestraint, assaults and self-harm amongst children rising
Source: Youth justice statistics 2015 to 2016
Inci
dent
s pe
r 100
chi
ldre
n pe
r mon
th
0
5
10
15
20
25
30
2010 2011 2012 2013 2014 2015 2016
37
People in prison
Over a quarter (27%) of children remanded in custody were subsequently acquitted in the year to March 2016. Nearly one in five (38%) went on to be given a non-custodial sentence.210
Safety in custodyOnly two out of the seven children’s establishments inspected in 2016–17 were rated as ‘reasonably good’ for safety and none were rated ‘good’—a sharp decline from 2013–14 when nine out of 12 establishments received these ratings.211
Nearly two in five children (39%) in YOIs said they had felt unsafe at some point.212
Rates of self-harm continue to rise. There were 8.9 incidents of self-harm per 100 children in the year to March 2016, a rise of 70% since 2013. On average there were 116 incidents of self-harm per month.213
Assault rates amongst children in custody continue to rise, with an average of 245 assaults a month. There were 19 assaults per 100 children in custody in the year to March 2016, up from nine in 2010.214
Measures to address increasing violence have reduced time out of cell. Inspectors found many boys spent most of their sentence locked up.215
Restraint of children in custody remains high, with an average of 360 incidents a month. In the year to March 2016, there were 28 incidents of restraint per 100 children in custody, up from 18 in 2010.216
BAME children are more likely to be restrained. For every 100 children in custody there were 32 incidents of restraint on BAME children a month, compared with 25 incidents on white children.217
Drugs and alcoholNearly half of children entering custody (45%) were assessed as having a substance misuse concerns.218
More than one in five children (22%) said it was easy to get illegal drugs in their YOI.219
8% of boys said they had an alcohol problem on arrival into custody—5% said they had received help.220
FamilyFewer than three in five children (58%) in STCs and only one in three children (34%) in YOIs said that they had visits at least once a week from family, carers or friends.221
One in 10 boys held in YOIs reported having children themselves.222
Education and skillsThe educational background of children in custody is poor—nine out of 10 children (90%) in YOIs said they had been excluded from school.223
Over two-fifths (42%) said that they were aged 14 or younger when they were last at school.224
73% of children in YOIs said they were taking part in education. However only 21% said they were in offending behaviour programmes, 12% had a job, and 8% were in vocational or skills training.225
210 Table 6.5, Ministry of Justice (2017) Youth justice statistics 2015 to 2016, London: Ministry of Justice211 HM Chief Inspector of Prisons (2017) Annual report 2016–17, London: The Stationery Office212 HM Inspectorate of Prisons (2016) Children in custody 2015–16, London: HM Stationery Office213 Table 8.3, Ministry of Justice (2017) Youth justice statistics 2015–16, London: Ministry of Justice214 Ibid. and Youth justice statistics 2014 to 2015215 HM Chief Inspector of Prisons (2017) Annual report 2016–17, London: The Stationery Office216 Table 8.3, Ministry of Justice (2017) Youth justice statistics 2015–16, London: Ministry of Justice and Youth justice statistics 2014 to 2015217 Table 8.6, Ibid.218 Youth Justice Board (2017) Key characteristics of admissions to youth custody April 2014 to March 2016, London: Ministry of Justice219 Appendix B3, HM Inspectorate of Prisons (2017) Children in custody 2016–17, London: HM Stationery Office220 Ibid.221 HM Inspectorate of Prisons (2017) Children in custody 2016–17, London: HM Stationery Office222 Ibid.223 Appendix B3, Ibid.224 Ibid.225 HM Inspectorate of Prisons (2017) Children in custody 2016–17, London: HM Stationery Office
38
People in prison

Oth
er a
ppro
ache
s to
chi
ldre
n’s
crim
inal
resp
onsi
bilit
ySw
eden
No
sanc
tion
can
be im
pose
d fo
r a
crim
e co
mm
itted
bef
ore
the
age
of 1
5.
Impr
ison
men
t may
onl
y be
impo
sed
on
unde
r 18s
if th
ere
are
extra
ordi
nary
re
ason
s fo
r it.
Alge
riaBe
fore
the
age
of 1
8, c
hild
ren
have
th
eir c
ases
dea
lt w
ith b
y th
e C
ourt
for
Min
ors.
It c
anno
t im
pose
crim
inal
sa
nctio
ns o
n ch
ildre
n un
der 1
3 bu
t can
im
pose
mea
sure
s of
pro
tect
ion
or
re-e
duca
tion.
Crim
inal
san
ctio
ns a
re
avai
labl
e fo
r chi
ldre
n ag
ed 1
3-18
, but
ar
e at
a re
duce
d le
vel t
o ad
ults
.
Fran
ceW
hils
t 13
is th
e yo
unge
st a
ge
som
eone
can
be
subj
ect t
o cr
imin
al
sanc
tions
, Fra
nce
has
a gr
adua
ted
syst
em o
f pen
altie
s. T
his
incl
udes
ed
ucat
ive
sanc
tions
for c
hild
ren
aged
10
-13.
Crim
inal
san
ctio
ns fo
r 13-
15
year
old
s ar
e ha
lf th
at o
f adu
lts, w
ith
full
crim
inal
san
ctio
ns a
vaila
ble
from
ag
e 16
.
Chi
na (e
xc. H
ong
Kong
& M
acau
)14
is th
e ag
e of
crim
inal
resp
onsi
bilit
y fo
r ser
ious
offe
nces
suc
h as
hom
icid
e,
rape
, rob
bery
and
dru
g tra
ffick
ing.
H
owev
er, f
or o
ther
less
ser
ious
of
fenc
es c
rimin
al re
spon
sibi
lity
begi
ns
at 1
6. L
ess
seve
re p
unis
hmen
ts a
re
give
n to
thos
e un
der 1
8.
The
UN
Com
mitt
ee o
n th
e Ri
ghts
of t
he C
hild
has
sta
ted
that
an
age
of c
rimin
al re
spon
sibi
lity
belo
w 1
2 is
‘not
acc
epta
ble’
(200
8)So
urce
: Pris
on R
efor
m T
rust
rese
arch
Scot
land
12
Engl
and,
Wal
es
and
N. I
rela
nd10Irela
nd10
Swed
en15
Fran
ce13
Italy
14
Ger
man
y14
Sout
h Af
rica
10
Aust
ralia
10
Indi
a7
Iran
9 fo
r girl
s15
for b
oysRu
ssia
14
Chi
na14
Ethi
opia
9
Braz
il18
Arge
ntin
a16
Peru
15
Can
ada
12
Spai
n14
Alge
ria13
Youn
gest
age
at w
hich
a p
erso
n m
ay b
e pr
osec
uted
in a
crim
inal
tria
l
Whilst the National Offender Management Service classify young adults as aged 18–20, evidence from the Transition to Adulthood Alliance suggests that the process of brain development and maturity takes place up to the age of 25. Therefore, where available we have included information for 18–24 year olds. It is clearly stated when we are referring to this age group.
Both the House of Commons Justice Committee and Lord Harris’ review into self-inflicted deaths in custody of young adult men aged 18 to 24 called for a “legal recognition of the concept of ‘maturity’. As well as chronological age, maturity should be a primary consideration in making decisions relating to diversion, sentencing and, where a custodial sentence must be given, how and where a young adult (18–24) should be accommodated.”
Young adults in prison
14,963 young adults (aged 18–24) are currently in prison in England and Wales—they account for 17% of the total prison population.226
There are now 32% fewer young adults (aged 18–24) in prison in England and Wales than in 2011.227
Despite this welcome reduction, the prisons inspectorate has cautioned that those who remain in custody are “some of the most vulnerable, troubled young adults”.228
Young adults (aged 18-24) have the highest level of black, Asian and minority ethnic (BAME) overrepresentation in the adult prison estate of all age groups. If our prison population reflected the make-up of England and Wales, we would have 2,850 fewer BAME young adults in prison.229
Two-fifths (40%) of young adults are in prison for violence against the person or robbery—more than a quarter (28%) are there for a theft or drug offence.230
Safety in custodyPeople aged 18–24 accounted for nearly a third (31%) of all self-harm incidents in 2016.231
In over a third of all assaults (34%) in 2016 the victim was aged 18–24.232
Treatment and conditionsInspectors found that most prisons made little distinction in the treatment of young adults233—despite the evidence on brain development and maturity.234
People in young adults prisons have the least time out of cell. 37% said that they had less than two hours out of their cell on a weekday, and only 4% said they had over 10 hours.235
Purposeful activity, such as education and training opportunities, for young adults requires improvement. Both of the young adult prisons inspected this year were rated as poor.236
Drugs and alcoholOver half of young adults (18–24) in prison were assessed as having a drug problem.237 Nearly a third (31%) said it was easy or very easy to get drugs in their prison.238
24% of young adults (18–24) in prison were assessed as having an alcohol problem.239
226 Table A1.7, Ministry of Justice (2017) Offender management statistics prison population 2017, London: Ministry of Justice227 Ibid.228 HM Chief Inspector of Prisons (2016) Annual Report 2015–16, London: The Stationery Office229 Table 11, Kneen, H. (2017) An exploratory estimate of the economic cost of Black, Asian and Minority Ethnic net overrepresentation in the Criminal Justice System in 2015, London: Ministry of
Justice230 Table A1.3i, Ministry of Justice (2017) Offender management statistics prison population 2017, London: Ministry of Justice231 Table 2.3, Ministry of Justice (2017) Safety in custody statistics quarterly update to June 2017, London: Ministry of Justice232 Table 3.3, Ibid.233 HM Chief Inspector of Prisons (2017) Annual Report 2016–17, London: The Stationery Office234 Prior, D. et al. (2011) Maturity, young adults and criminal justice: A literature review, Birmingham: University of Birmingham235 HM Chief Inspector of Prisons (2017) Annual Report 2016–17, London: The Stationery Office236 Ibid.237 Table 1.3, Ministry of Justice (2016) Characteristics and needs of young adults in prison custody, England and Wales, Offender management statistics quarterly: April to June 2016, London:
Ministry of Justice238 HM Chief Inspector of Prisons (2016) Annual Report 2015–16, London: The Stationery Office239 Table 1.3, Ministry of Justice (2016) Characteristics and needs of young adults in prison custody, England and Wales, Offender management statistics quarterly: April to June 2016, London:
Ministry of Justice
40
People in prison

HEALTH IN PRISON
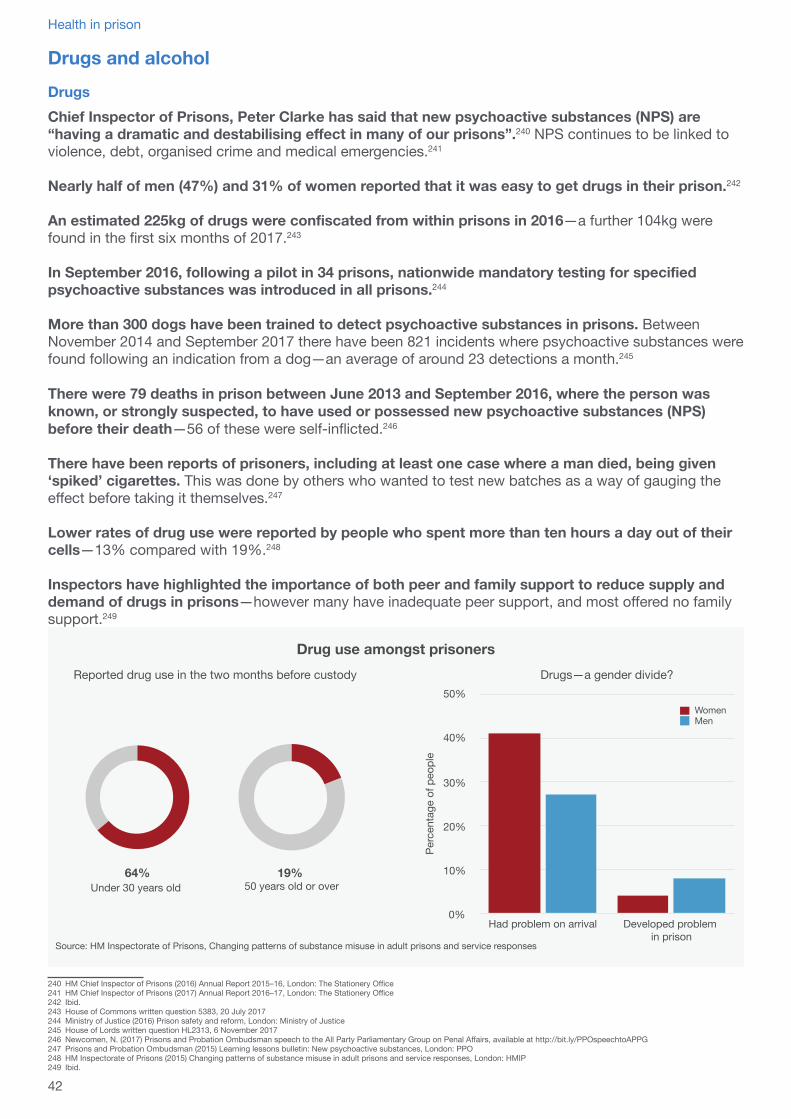
Drugs and alcoholDrugsChief Inspector of Prisons, Peter Clarke has said that new psychoactive substances (NPS) are “having a dramatic and destabilising effect in many of our prisons”.240 NPS continues to be linked to violence, debt, organised crime and medical emergencies.241
Nearly half of men (47%) and 31% of women reported that it was easy to get drugs in their prison.242
An estimated 225kg of drugs were confiscated from within prisons in 2016—a further 104kg were found in the first six months of 2017.243
In September 2016, following a pilot in 34 prisons, nationwide mandatory testing for specified psychoactive substances was introduced in all prisons.244
More than 300 dogs have been trained to detect psychoactive substances in prisons. Between November 2014 and September 2017 there have been 821 incidents where psychoactive substances were found following an indication from a dog—an average of around 23 detections a month.245
There were 79 deaths in prison between June 2013 and September 2016, where the person was known, or strongly suspected, to have used or possessed new psychoactive substances (NPS) before their death—56 of these were self-inflicted.246
There have been reports of prisoners, including at least one case where a man died, being given ‘spiked’ cigarettes. This was done by others who wanted to test new batches as a way of gauging the effect before taking it themselves.247
Lower rates of drug use were reported by people who spent more than ten hours a day out of their cells—13% compared with 19%.248
Inspectors have highlighted the importance of both peer and family support to reduce supply and demand of drugs in prisons—however many have inadequate peer support, and most offered no family support.249
240 HM Chief Inspector of Prisons (2016) Annual Report 2015–16, London: The Stationery Office241 HM Chief Inspector of Prisons (2017) Annual Report 2016–17, London: The Stationery Office242 Ibid.243 House of Commons written question 5383, 20 July 2017244 Ministry of Justice (2016) Prison safety and reform, London: Ministry of Justice245 House of Lords written question HL2313, 6 November 2017246 Newcomen, N. (2017) Prisons and Probation Ombudsman speech to the All Party Parliamentary Group on Penal Affairs, available at http://bit.ly/PPOspeechtoAPPG247 Prisons and Probation Ombudsman (2015) Learning lessons bulletin: New psychoactive substances, London: PPO248 HM Inspectorate of Prisons (2015) Changing patterns of substance misuse in adult prisons and service responses, London: HMIP249 Ibid.
Drug use amongst prisoners
Source: HM Inspectorate of Prisons, Changing patterns of substance misuse in adult prisons and service responses
19% 50 years old or over
64%Under 30 years old
Reported drug use in the two months before custody Drugs—a gender divide?
Perc
enta
ge o
f peo
ple
0%
10%
20%
30%
40%
50%
Had problem on arrival Developed problem in prison
WomenMen
42
Health in prison
Nearly one in ten people (9%) reported that they had been pressured to give away their prescribed medication whilst in prison.250
10% of women and 6% of men in prison reported that they had developed a problem with using prescription medication meant for other people whilst in prison.251
Cannabis is the most commonly reported drug used before going into prison, followed by cocaine. Of those who reported taking drugs before prison 38% had taken cannabis and 29% had taken cocaine.252
NPS use before going into prison was low relative to other substances with 6% reporting they had taken Spice/Black Mamba and 5% for other legal highs. Prisoners who said that they had used NPS in the community before going into prison had generally used it with other drugs or with illicit medication.253
15% of men and 13% of women in prison are serving sentences for drug offences.254
66% of women and 38% of men in prison report committing offences to get money to buy drugs.255
Nearly half of women in prison report having committed offences to support someone else’s drug use.256
NHS England estimates that it spends approximately 20% of all prison healthcare spending on substance misuse services—some £81m in 2016–17.257
Half of people in prison receiving substance misuse treatment in 2015–16 were there for opiate addiction—28,500 people.258
Less than a third of adults in prison (30%) in need of substance misuse treatment following release in 2015–16 were successfully engaged in community-based treatment within 21 days.259
AlcoholIn two-fifths (40%) of violent crimes the victim believed the offender or offenders to be under the influence of alcohol.260
70% said they had been drinking when they committed the offence for which they were in prison. 38% of people surveyed in prison believed that their drinking was a big problem.261
Women are nearly twice as likely to say they have a problem with alcohol on arrival to prison than men (30% against 16%).262
Nearly a quarter of men (23%) said that it was easy to get alcohol in their prison—more than three times the level amongst women in prison (7%).263
58% of people surveyed said they had been offered support for their alcohol problems inside prison. However, only 22% found this support ‘very helpful’.264
Only 40% of people surveyed were informed of help available for their drinking problems on release.265
250 Ibid.251 HM Chief Inspector of Prisons (2016) Annual Report 2015–16, London: The Stationery Office252 HM Inspectorate of Prisons (2015) Changing patterns of substance misuse in adult prisons and service responses, London: HMIP253 Ibid.254 Table 1.2b, Ministry of Justice (2017) Offender management statistics quarterly: April to June 2017, London: Ministry of Justice255 Light, M. et al. (2013) Gender differences in substance misuse and mental health amongst prisoners, London: Ministry of Justice256 Ibid.257 House of Commons written question 8136, 12 September 2017258 Table 4, Cooper, A., et al. (2017) Secure setting statistics from the National Drug Treatment Monitoring System (NDTMS) 1 April 2015 to 31 March 2016, London: Public Health England259 Cooper, A., et al. (2017) Secure setting statistics from the National Drug Treatment Monitoring System (NDTMS) 1 April 2015 to 31 March 2016, London: Public Health England260 Table 3.10, Office for National Statistics (2017) Focus on violent crime and sexual offences, England and Wales: year ending March 2016, London: Office for National Statistics261 Alcohol and Crime Commission (2014) The Alcohol and Crime Commission Report, London: Addaction262 HM Chief Inspector of Prisons (2016) Annual Report 2015–16, London: The Stationery Office263 HM Chief Inspector of Prisons (2017) Annual Report 2016–17, London: The Stationery Office264 Alcohol and Crime Commission (2014) The Alcohol and Crime Commission Report, London: Addaction265 Ibid.
43
Health in prison
Mental health
26% of women and 16% of men said they had received treatment for a mental health problem in the year before custody.267
25% of women and 15% of men in prison reported symptoms indicative of psychosis.268 The rate among the general public is about 4%.269
Self-inflicted deaths are 8.6 times more likely in prison than in the general population.270
70% of people who died from self-inflicted means whilst in prison had already been identified as having mental health needs. However, the Prisons and Probation Ombudsman (PPO) found that concerns about mental health problems had only been flagged on entry to the prison for just over half of these people.271
The PPO’s investigation found that nearly one in five of those diagnosed with a mental health problem received no care from a mental health professional in prison.272
The PPO also found that no mental health referral was made when it should have been in 29% of self-inflicted deaths where mental health needs had already been identified.273
40% of prisons inspected in 2016–17 had inadequate or no training for prison officers to know when to refer a person for mental health support.274
980 people were transferred from prison to a secure hospital in 2016.275 Nearly a third of these transfers (32%) took more than 14 days, the Department of Health’s expectation.276
In nearly three-quarters of prisons inspected in 2016–17, people waited too long to be transferred to mental health care, due to NHS shortages. Many were left untreated and their condition sometimes deteriorating—often for several months, according to inspectors.277
9,093 people have been referred for mental health treatment since the start of liaison and diversion services in England. 13% were detained under the Mental Health Act and 3% were admitted to a mental health hospital.278266 Department of Health website, accessed on 6 December 2017, available at
https://www.gov.uk/government/news/extra-funding-for-mental-health-nurses-to-be-based-at-police-stations-and-courts-across-the-country267 Ministry of Justice (2013) Gender differences in substance misuse and mental health amongst prisoners, London: Ministry of Justice268 Ibid.269 Wiles, N., et al. (2006) Self-reported psychotic symptoms in the general population, The British Journal of Psychiatry, 188: 519-526270 Ministry of Justice (2017) Safety in Custody quarterly bulletin: update to September 2016, London: Ministry of Justice271 Prisons and Probation Ombudsman (2016) Prisoner mental health, London: PPO272 Ibid.273 Ibid.274 HM Chief Inspector of Prisons (2017) Annual Report 2016–17, London: The Stationery Office275 Table 7, Ministry of Justice (2017) Offender Management Statistics quarterly: October to December 2016, Restricted patients 2016, London: Ministry of Justice276 House of Lords written question HL2096, 27 October 2017277 HM Chief Inspector of Prisons (2017) Annual Report 2016–17, London: The Stationery Office278 House of Commons written question 27917, 26 February 2016
There is currently insufficient data to identify how many people are remanded in custody pending a psychiatric report, how many are assessed as having a mental health problem, and how many are so unwell that they require transferring out of custody for treatment.
An independent review, conducted by the former Home Office minister, Lord Bradley (The Bradley Report, 2009) called for adequate community alternatives to prison for vulnerable people. Lord Bradley’s review heard evidence that 2,000 prison places per year could be saved if a proportion of eligible, short-term prisoners who committed offences while experiencing mental health problems were given appropriate community sentences.
Lord Bradley further called for all police custody suites and criminal courts to have access to liaison and diversion services. The government committed to invest in these services to identify and, where appropriate, divert people with mental health problems, learning disabilities and other support needs away from the criminal justice system and into treatment and care.
There is now 68% population coverage of liaison and diversion services across England, which will rise to 82% by April 2018.266
44
Health in prison
Disability and healthDisability36% of people in prison are estimated to have a physical or mental disability. This compares with 19% of the general population.279
11% have a physical disability, 18% have a mental disability and 7% have both.280
Over a third of people in prison with a disability (37%) reported feeling depressed or suicidal when they first arrived in prison—more than double that amongst people without a disability (16%).281
People in prison with disabilities report more negatively about many key aspects of prison life.282
Three in five people in prison with a disability (61%) reported feeling unsafe—with 44% saying they’d been victimised by other prisoners.283
One in 10 people in prison with a disability (11%) said they had been victimised by staff because of their disability—one in five (20%) said they were threatened or intimidated by staff.284
Nearly one in six people in prison with a disability (15%) said they had been restrained by staff in the last six months—compared with one in 10 people without a disability.285
Three-quarters of people in prison with a disability (74%) reported having an emotional or mental health problem—compared with a three in 10 people without a disability.286
Inspectors found that physical provision for those with the most severe disabilities was generally poor, with few adapted cells and little wheelchair access.287
Nearly one in five children (19%) held in young offender institutions said they had a disability.288
Boys with disabilities were more likely to say they’d been victimised by other boys and staff, and felt unsafe at some time.289
HealthThe majority of prisons deliver a reasonably good standard of health care most of the time according to inspectors.290
However, inspectors found that too few operational staff had access to defibrillators and/or were first aid trained in over half the male adult prisons they inspected in 2016–17—this is particularly concerning given the high number of health emergencies in prisons.291
Health services in prisons are being impeded by prison officer shortages and restrictive regimes. Inspectors reported that this led to ‘serious detrimental effects’ in over half the services they inspected in 2016–17.292
Problems included people not being able to get to or from their internal or external healthcare appointments due to a lack of prison staff to escort them there; inpatients being kept in their cells rather than taking part in therapeutic activities to aid their recovery; and night time medication being given as early as 4:30pm.293
279 Ministry of Justice (2012) Estimating the prevalence of disability amongst prisoners: results from the Surveying Prisoner Crime Reduction (SPCR) survey, London: Ministry of Justice280 Ibid.281 HM Chief Inspector of Prisons (2017) Annual Report 2016–17, London: The Stationery Office282 Ibid.283 Ibid.284 Ibid.285 Ibid.286 Ibid.287 Ibid.288 HM Inspectorate of Prisons (2017) Children in Custody 2016–17, London: HM Stationery Office289 Ibid.290 HM Chief Inspector of Prisons (2017) Annual Report 2016–17, London: The Stationery Office291 Ibid.292 Ibid.293 Ibid.
45
Health in prison
Problems with the recruitment of appropriate clinical staff affected the management of lifelong health conditions, such as diabetes and epilepsy, in more than a quarter of adult male prisons in 2016–17.294
Under a quarter of men (23%) and less than one in five women (19%) said it was easy to see a doctor.295
Three-quarters women (76%) report currently taking medication, compared with just over half (53%) of men.296
Approximately four times as many people in prisons smoke as in the general population.297
Smoking was banned in all prisons in Wales in January 2016. A smoking ban is being gradually rolled out across the prison estate in England, with 66 prisons currently smoke-free.298 The roll out of the ban is intended to continue until 2018 where all prisons will be smoke-free.299
The rate of infection for blood-bourne viruses, such as Hepatitis B and C and HIV, is four times higher in prisons than in the general population.300
The prevalence rate of TB amongst people in prison in England is nearly five times higher than in the general population.301
Just over a quarter (27%) of people in prison said they went to the gym three or more times a week. Inspectors routinely found that access was restricted because of staff shortages.302
The Prisons and Probation Ombudsman found that healthcare staff in many cases treated people who had died from natural causes, in a caring and compassionate manner—judged to be equivalent to the treatment they could have expected to receive in the community.303
However, the ombudsman also found that in too many investigations healthcare staff failed to make urgent referrals when they had concerns a person might have cancer.304
People can apply for compassionate release if they have a life expectancy of less than three months, are bedridden or severely incapacitated.305
The number of people granted compassionate release for health reasons is low—between 2012 and 2016, only 56 people were released. A further 5 people have been released to date in 2017.306
Compassionate release was only considered in 36% of 314 cases examined by the Prisons and Probation Ombudsman. However, in 43% of these cases, an application was still under consideration at the time of death.307
The ombudsman found that frequently, risk assessments conducted for compassionate or temporary release were judged based on the risk a person would have posed when healthy—not the actual risk they pose based on their current health condition.308
294 Ibid.295 Ibid.296 Ibid.297 Public Health England (2015) Health & justice report 2014, London: PHE298 House of Lords written question HL2171, 1 November 2017299 National Offender Management Service (2017) Annual Report and Accounts 2016-2017, London: Ministry of Justice300 Public Health England (2017) Health and justice annual review 2016/17301 Ibid.302 HM Chief Inspector of Prisons (2017) Annual report 2016–17, London: The Stationery Office303 Prisons and Probation Ombudsman (2017) Annual report 2016–17, London: PPO304 Ibid.305 HM Prison Service (2012) Prison Service Order 6000: Parole release and recall, London: Ministry of Justice and HM Prisons Service (2010) Prison Service Order 4700: Indeterminate sentence
manual, London: Ministry of Justice306 House of Lords written question HL2099, 1 November 2017307 Prisons and Probation Ombudsman (2017) Learning lessons from PPO investigations: Older prisoners, London: Prisons and Probation Ombudsman308 Ibid.
46
Health in prison

REHABILITATION AND RESETTLEMENT
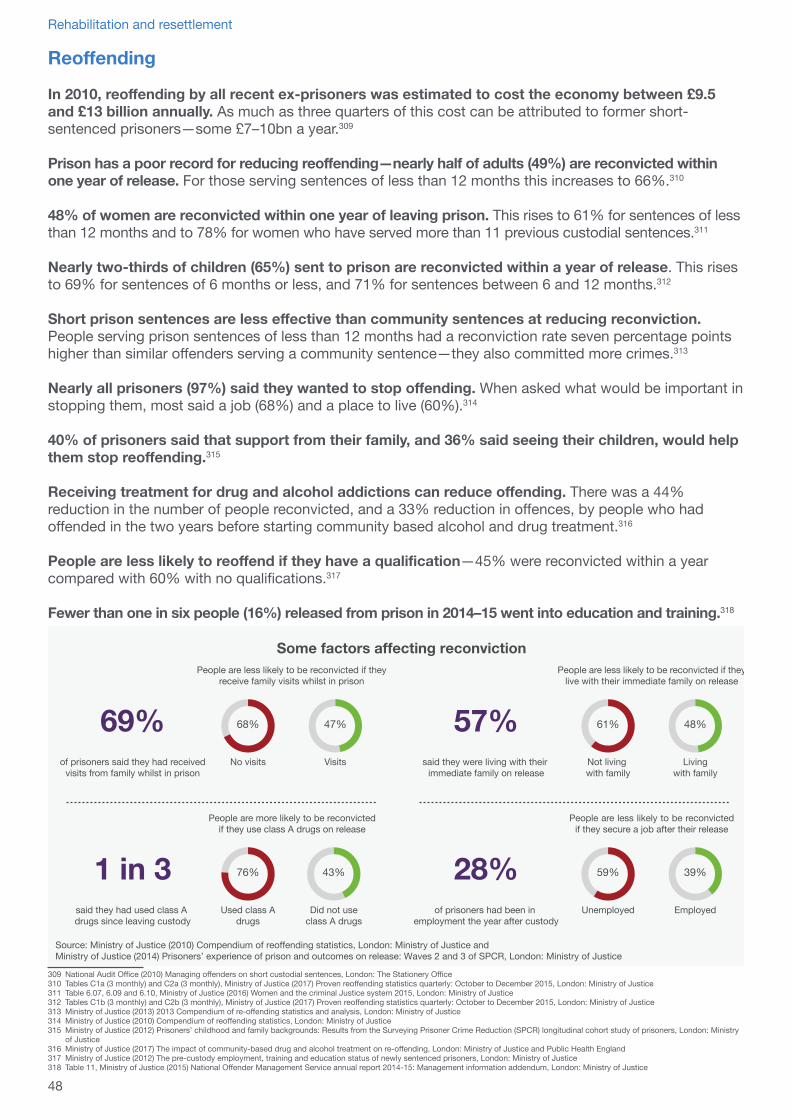
Reoffending
In 2010, reoffending by all recent ex-prisoners was estimated to cost the economy between £9.5 and £13 billion annually. As much as three quarters of this cost can be attributed to former short-sentenced prisoners—some £7–10bn a year.309
Prison has a poor record for reducing reoffending —nearly half of adults (49%) are reconvicted within one year of release. For those serving sentences of less than 12 months this increases to 66%.310
48% of women are reconvicted within one year of leaving prison. This rises to 61% for sentences of less than 12 months and to 78% for women who have served more than 11 previous custodial sentences.311
Nearly two-thirds of children (65%) sent to prison are reconvicted within a year of release. This rises to 69% for sentences of 6 months or less, and 71% for sentences between 6 and 12 months.312
Short prison sentences are less effective than community sentences at reducing reconviction. People serving prison sentences of less than 12 months had a reconviction rate seven percentage points higher than similar offenders serving a community sentence—they also committed more crimes.313
Nearly all prisoners (97%) said they wanted to stop offending. When asked what would be important in stopping them, most said a job (68%) and a place to live (60%).314
40% of prisoners said that support from their family, and 36% said seeing their children, would help them stop reoffending.315
Receiving treatment for drug and alcohol addictions can reduce offending. There was a 44% reduction in the number of people reconvicted, and a 33% reduction in offences, by people who had offended in the two years before starting community based alcohol and drug treatment.316
People are less likely to reoffend if they have a qualification—45% were reconvicted within a year compared with 60% with no qualifications.317
Fewer than one in six people (16%) released from prison in 2014–15 went into education and training.318
309 National Audit Office (2010) Managing offenders on short custodial sentences, London: The Stationery Office310 Tables C1a (3 monthly) and C2a (3 monthly), Ministry of Justice (2017) Proven reoffending statistics quarterly: October to December 2015, London: Ministry of Justice311 Table 6.07, 6.09 and 6.10, Ministry of Justice (2016) Women and the criminal Justice system 2015, London: Ministry of Justice312 Tables C1b (3 monthly) and C2b (3 monthly), Ministry of Justice (2017) Proven reoffending statistics quarterly: October to December 2015, London: Ministry of Justice313 Ministry of Justice (2013) 2013 Compendium of re-offending statistics and analysis, London: Ministry of Justice314 Ministry of Justice (2010) Compendium of reoffending statistics, London: Ministry of Justice315 Ministry of Justice (2012) Prisoners’ childhood and family backgrounds: Results from the Surveying Prisoner Crime Reduction (SPCR) longitudinal cohort study of prisoners, London: Ministry
of Justice316 Ministry of Justice (2017) The impact of community-based drug and alcohol treatment on re-offending, London: Ministry of Justice and Public Health England317 Ministry of Justice (2012) The pre-custody employment, training and education status of newly sentenced prisoners, London: Ministry of Justice318 Table 11, Ministry of Justice (2015) National Offender Management Service annual report 2014-15: Management information addendum, London: Ministry of Justice
Some factors affecting reconviction
Source: Ministry of Justice (2010) Compendium of reoffending statistics, London: Ministry of Justice andMinistry of Justice (2014) Prisoners’ experience of prison and outcomes on release: Waves 2 and 3 of SPCR, London: Ministry of Justice
of prisoners had been in employment the year after custody
People are less likely to be reconvicted if they secure a job after their release
28%Unemployed
59%
Employed
39%
of prisoners said they had receivedvisits from family whilst in prison
People are less likely to be reconvicted if they receive family visits whilst in prison
69%said they were living with their
immediate family on release
People are less likely to be reconvicted if they live with their immediate family on release
57%No visits
68%
Visits
47%
Not living with family
61%
Livingwith family
48%
said they had used class A drugs since leaving custody
People are more likely to be reconvicted if they use class A drugs on release
1 in 3Used class A
drugs
76%
Did not useclass A drugs
43%
48
Rehabilitation and resettlement
Purposeful activity
Purposeful activity includes education, work and other activities to aid rehabilitation whilst in prison.
Only half of prisons (51%) received a positive rating from inspectors in 2016–17 for purposeful activity work.319
Time out of cell is very limited in local prisons and young adult prisons. Three in 10 people in local prisons (31%) and nearly four in 10 people in young adult prisons (37%) said they spent less than two hours a day out of their cells.320
Inspectors regularly found more than a quarter of people in prison locked up during the working day. Even in training prisons, where the situation was better, between 11% and 16% of prisoners said they were locked up for more than 22 hours a day.321
In 14 of the 35 adult male prisons inspected in 2016–17, there were not enough places for all prisoners to take part in education or vocational training throughout the week. Around half of prisons inspected failed to use all their activity places—leaving prisoners without work, education or training.322
Almost half of prisons were rated as ‘requiring improvement’ or ‘inadequate’ in their overall effectiveness for learning and skills and work—whilst further progress is needed, this is a considerable reduction from just under two-thirds in 2015–16.323
EducationOver half (57%) of people entering prison were assessed as having literacy skills expected of an 11 year old324—more than three times higher than in the general adult population (15%).325
73,500 adults in the prison system participated in education in the first three quarters of the 2016–17 academic year—a decrease of nearly eight per cent on the same period in 2015–16.326
The overall quality of teaching and learning in prisons has improved and was rated as ‘good’ or better in over 60% of the prisons inspected.327
However, the number of English and maths qualifications achieved at level 1 or 2 (GCSE equivalent) has plummeted—numbers fell by 38% in English and 35% in maths between the 2011–12 and 2015–16 academic years.328
Despite this, 11,300 people achieved a full level 2 qualification, the equivalent to 5 GCSEs, in the 2015–16 academic year via mainstream prison learning—more than five times as many as in 2011–12.329
People in prison are now required to take out, and then repay, loans if they want to take part in Higher and Further Education courses.330
Only 300 people achieved a level 3 qualification (AS and A Level equivalent) in the 2015–16 academic year via mainstream prison learning—a quarter of the number in 2011–12.331
Since the new funding regime was introduced there has been a 42% fall in prisoners studying Open University degrees.332
319 HM Chief Inspector of Prisons (2017) Annual Report 2016–17, London: The Stationery Office320 Ibid.321 Ibid.322 Ibid.323 Ibid.324 Skills Funding Agency (2016) OLASS English and maths assessments: participation 2015/16, London: SFA325 Figure 1.1, Department for Business Innovation and Skills (2012) The 2011 Skills for Life Survey: A Survey of Literacy, Numeracy and ICT Levels in England, London: BIS326 Skills Funding Agency (2017) Further education and skills: July 2017, London: SFA327 HM Chief Inspector of Prisons (2017) Annual Report 2016–17, London: The Stationery Office328 Skills Funding Agency (2016) FE data library—OLASS: participation and achievement by equality and diversity & English and maths level: 2010/11 to 2015/16, London: SFA329 Table 10.2, Skills Funding Agency (2017) Further education and skills: March 2017, London: SFA330 Department for Business, Innovation and Skills (2015) Freedom of Information request: Prisoner education, 24 February 2015, London: BIS331 Table 10.2, Skills Funding Agency (2017) Further education and skills: March 2017, London: SFA332 Provided by Open University
49
Rehabilitation and resettlement
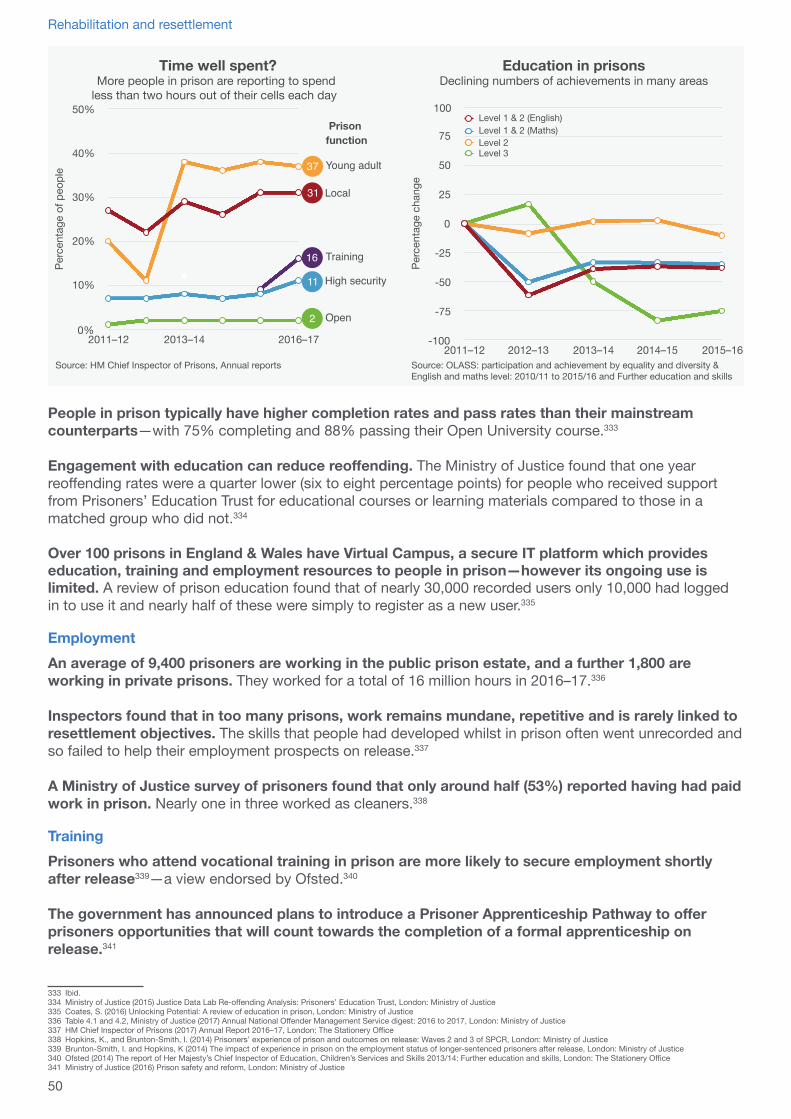
People in prison typically have higher completion rates and pass rates than their mainstream counterparts—with 75% completing and 88% passing their Open University course.333
Engagement with education can reduce reoffending. The Ministry of Justice found that one year reoffending rates were a quarter lower (six to eight percentage points) for people who received support from Prisoners’ Education Trust for educational courses or learning materials compared to those in a matched group who did not.334
Over 100 prisons in England & Wales have Virtual Campus, a secure IT platform which provides education, training and employment resources to people in prison—however its ongoing use is limited. A review of prison education found that of nearly 30,000 recorded users only 10,000 had logged in to use it and nearly half of these were simply to register as a new user.335
EmploymentAn average of 9,400 prisoners are working in the public prison estate, and a further 1,800 are working in private prisons. They worked for a total of 16 million hours in 2016–17.336
Inspectors found that in too many prisons, work remains mundane, repetitive and is rarely linked to resettlement objectives. The skills that people had developed whilst in prison often went unrecorded and so failed to help their employment prospects on release.337
A Ministry of Justice survey of prisoners found that only around half (53%) reported having had paid work in prison. Nearly one in three worked as cleaners.338
TrainingPrisoners who attend vocational training in prison are more likely to secure employment shortly after release339—a view endorsed by Ofsted.340
The government has announced plans to introduce a Prisoner Apprenticeship Pathway to offer prisoners opportunities that will count towards the completion of a formal apprenticeship on release.341
333 Ibid.334 Ministry of Justice (2015) Justice Data Lab Re‐offending Analysis: Prisoners’ Education Trust, London: Ministry of Justice335 Coates, S. (2016) Unlocking Potential: A review of education in prison, London: Ministry of Justice336 Table 4.1 and 4.2, Ministry of Justice (2017) Annual National Offender Management Service digest: 2016 to 2017, London: Ministry of Justice337 HM Chief Inspector of Prisons (2017) Annual Report 2016–17, London: The Stationery Office338 Hopkins, K., and Brunton-Smith, I. (2014) Prisoners’ experience of prison and outcomes on release: Waves 2 and 3 of SPCR, London: Ministry of Justice339 Brunton-Smith, I. and Hopkins, K (2014) The impact of experience in prison on the employment status of longer-sentenced prisoners after release, London: Ministry of Justice340 Ofsted (2014) The report of Her Majesty’s Chief Inspector of Education, Children’s Services and Skills 2013/14: Further education and skills, London: The Stationery Office341 Ministry of Justice (2016) Prison safety and reform, London: Ministry of Justice
Perc
enta
ge o
f peo
ple
0%
10%
20%
30%
40%
50%
2011–12 2013–14 2016–17
Time well spent?More people in prison are reporting to spend
less than two hours out of their cells each day
Source: HM Chief Inspector of Prisons, Annual reports Source: OLASS: participation and achievement by equality and diversity & English and maths level: 2010/11 to 2015/16 and Further education and skills
Education in prisonsDeclining numbers of achievements in many areas
Perc
enta
ge c
hang
e
-100
-75
-50
-25
0
25
50
75
100
2011–12 2012–13 2013–14 2014–15 2015–16
50
Rehabilitation and resettlement
The Young Offender Programme works with people who are in the final six months of their sentence and are considered suitable for Release on Temporary Licence (ROTL) to connect them with employers. It operates throughout the UK with the involvement of over 80 companies, including National Grid, Cadent, Morrison Utility Services, Skanska and Balfour Beatty. The employee retention rate is reported to be 10% higher than for those who are recruited through traditional routes.342
Timpson actively recruit ex-offenders to work for them. It has a total of six prison training academies, including at HMPs Downview, New Hall and Blantyre House. In addition at HMP Thorn Cross there are three workshops where shoe repairs and specialist photo production takes place. Thorn Cross also releases people on ROTL who work in the day in other parts of the business and return to prison each evening.343
The Clink Charity operates restaurants, which are open to the public, at HMPs High Down, Cardiff, Brixton, and the women’s prison HMP Styal, in partnership with the prison service. It offers prisoners the chance to gain experience and qualifications in the food and hospitality industry, with mentoring and guidance to find full-time employment, and provide resettlement support upon release. Research by the Ministry of Justice showed a 41% reduction in the likelihood of re-offending and a lower frequency of reoffences.344
Lendlease, through their charitable trust Be Onsite, work with London prisons to provide training and employment opportunities in the construction industry. Be Onsite works with people whilst on ROTL and after completing their prison sentence. People are employed directly by Be Onsite in order to help overcome the difficulty that many construction workers are self employed.
Halfords, in response to the increasing popularity of cycling has opened a bike repair workshop at HMP Onley. The workshop provides training to prisoners before they can progress to ROTL with the aim of full time employment on release. This has proved sufficiently successful that there are plans to open a second workshop at HMP Drake Hall.
Peer-supportIn many prisons people provide support to their peers. Roles include providing practical and emotional support; acting as representatives to highlight issues and concerns amongst their peers to staff; de-escalating tensions between prisoners to prevent violence or bullying; and coaching or guiding those learning a new skill or preparing for release.
Inspectors have noted “Prisoners often prefer support from their peers to other formal or professional sources of support, and peers are often easier to access, making them a more readily available source of support.”345
St Giles Trust offers training and a recognised Level 3 qualification in advice and guidance under its Peer Advisor Programme to prisoners and ex-offenders in prisons across England and Wales. 13,227 people were helped in prison through the Peer Advisor Programme in 2016–17.346
The Reading Plan run by the Shannon Trust enables prisoners to act as peer mentors to support other prisoners who are learning to read. Nine out of 10 learners surveyed felt their reading skills were improving.347
The Samaritans’ Listener Scheme is active in almost every prison across the UK. In 2016 there were 1,673 active Listeners in place—with 1,447 Listeners trained during 2016. Listeners play an invaluable role in making prisons safer by being there for other prisoners who might be struggling to cope; helping them to talk about their worries and try to find a positive way forward. Listeners were contacted more than 87,367 times during 2016.348
342 Provided by Cadent343 Provided by Timpson. James Timpson, Chief Executive of Timpson, is Chair of the Prison Reform Trust344 Ministry of Justice (2016) Justice Data Lab analysis: Re-offending behaviour after participation in the Clink Restaurant training programme, London: Ministry of Justice345 HM Chief Inspector of Prisons (2015) Annual Report 2014-15, London: The Stationery Office346 Provided by St Giles Trust347 Shannon Trust website, accessed on 9 October 2017, available at http://www.shannontrust.org.uk/our-work/our-achievements/348 Statistics provided by Samaritans
51
Rehabilitation and resettlement
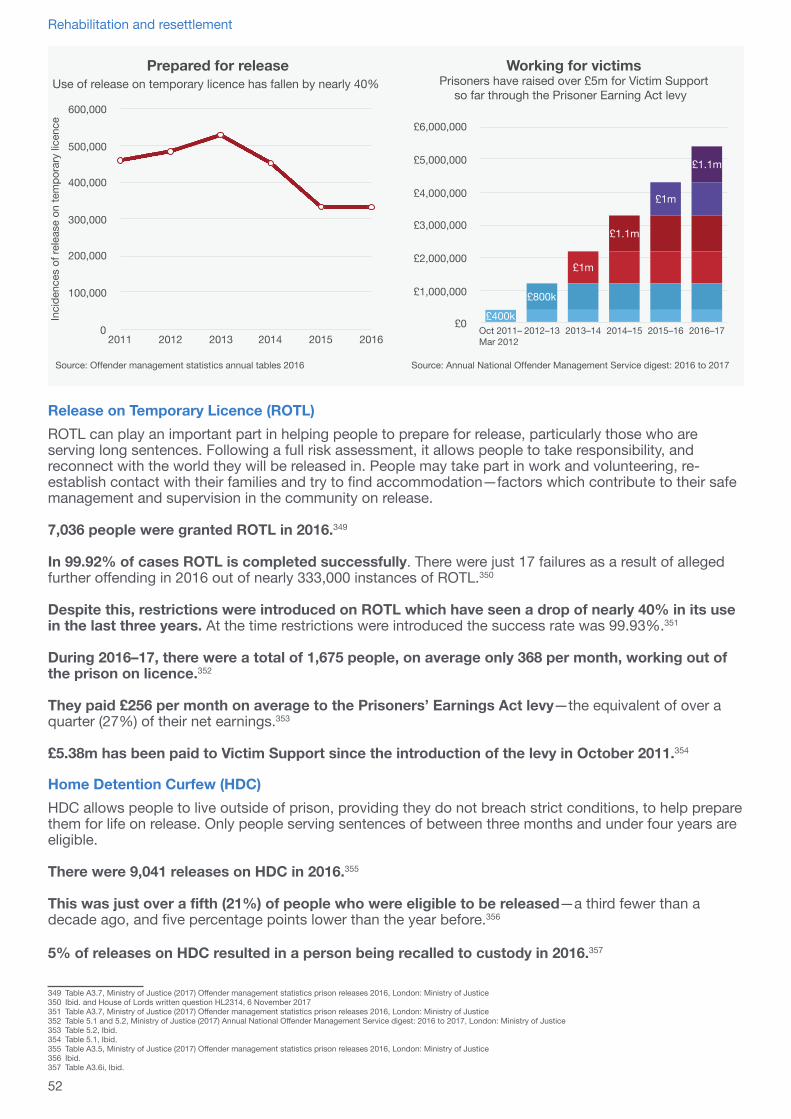
Release on Temporary Licence (ROTL)ROTL can play an important part in helping people to prepare for release, particularly those who are serving long sentences. Following a full risk assessment, it allows people to take responsibility, and reconnect with the world they will be released in. People may take part in work and volunteering, re-establish contact with their families and try to find accommodation—factors which contribute to their safe management and supervision in the community on release.
7,036 people were granted ROTL in 2016.349
In 99.92% of cases ROTL is completed successfully. There were just 17 failures as a result of alleged further offending in 2016 out of nearly 333,000 instances of ROTL.350
Despite this, restrictions were introduced on ROTL which have seen a drop of nearly 40% in its use in the last three years. At the time restrictions were introduced the success rate was 99.93%.351
During 2016–17, there were a total of 1,675 people, on average only 368 per month, working out of the prison on licence.352
They paid £256 per month on average to the Prisoners’ Earnings Act levy—the equivalent of over a quarter (27%) of their net earnings.353
£5.38m has been paid to Victim Support since the introduction of the levy in October 2011.354
Home Detention Curfew (HDC)HDC allows people to live outside of prison, providing they do not breach strict conditions, to help prepare them for life on release. Only people serving sentences of between three months and under four years are eligible.
There were 9,041 releases on HDC in 2016.355
This was just over a fifth (21%) of people who were eligible to be released—a third fewer than a decade ago, and five percentage points lower than the year before.356
5% of releases on HDC resulted in a person being recalled to custody in 2016.357
349 Table A3.7, Ministry of Justice (2017) Offender management statistics prison releases 2016, London: Ministry of Justice350 Ibid. and House of Lords written question HL2314, 6 November 2017351 Table A3.7, Ministry of Justice (2017) Offender management statistics prison releases 2016, London: Ministry of Justice352 Table 5.1 and 5.2, Ministry of Justice (2017) Annual National Offender Management Service digest: 2016 to 2017, London: Ministry of Justice353 Table 5.2, Ibid.354 Table 5.1, Ibid.355 Table A3.5, Ministry of Justice (2017) Offender management statistics prison releases 2016, London: Ministry of Justice356 Ibid.357 Table A3.6i, Ibid.
£0
£1,000,000
£2,000,000
£3,000,000
£4,000,000
£5,000,000
£6,000,000
Source: Annual National Offender Management Service digest: 2016 to 2017
Working for victimsPrisoners have raised over £5m for Victim Support
so far through the Prisoner Earning Act levy
Inci
denc
es o
f rel
ease
on
tem
pora
ry li
cenc
e
0
100,000
200,000
300,000
400,000
500,000
600,000
2011 2012 2013 2014 2015 2016
Prepared for releaseUse of release on temporary licence has fallen by nearly 40%
Source: Offender management statistics annual tables 2016
52
Rehabilitation and resettlement
Resettlement
Nearly everyone in prison will be released at some point. 72,395 people were released in the year to June 2017.358
Some people are entitled to receive a discharge grant to help them on release—however this has remained fixed at £46 since 1997. Thousands more prisoners are ineligible, including those released from remand, fine defaulters and people serving less than 15 days.359
At most prisons, there is little or no reliable recording of outcome data, such as the number of people released to sustainable accommodation or entering employment, training or education according to inspectors.360
EmploymentFor many, having a criminal conviction is a barrier to leading a law-abiding life on release. The Rehabilitation of Offenders Act 1974 gives people with spent convictions and cautions the legal right not to disclose them when applying for most jobs.
However, only one in four (27%) people released from prison in 2014–15 had a job to go to.361
Half of respondents to a 2016 YouGov survey said that they would not consider employing an offender or ex-offender.362
Just one in five people (21%) leaving prison and referred to the Work Programme have found a job which they have held for six months or more.363 Of these, two in five (40%) have subsequently gone back to Jobcentre Plus.364
But, 87 employers so far, including the entire Civil Service, have signed up to Ban the Box—removing the need to disclose convictions at the initial job application stage as a first step towards creating fairer employment opportunities for ex-offenders.365
AccommodationEntitlement to housing benefit stops for all sentenced prisoners expected to be in prison for more than 13 weeks. This means that many prisoners have very little chance of keeping their tenancy open until the end of their sentence and lose their housing.
One in 10 people (11%) released from custody in 2014–15 had no settled accommodation.366 Inspectors have said that the figures are “misleading” as “they do not take into account the suitability or sustainability of the accommodation.”367
The Homelessness Reduction Act 2017 means that prisons and probation providers will be subject to the new duty to refer people who might be at risk of becoming homeless to the local housing authority.368
Financial exclusionMany people in prison are released with debts which have built up during their sentence —adding to the problems they face on release. These include outstanding fines, rent or mobile phone contracts. Inspectors found that in many cases no action was taken before release, despite problems being apparent at the start of a sentence.369
More than four in five former prisoners surveyed said their conviction made it harder to get insurance and four-fifths said that when they did get insurance, they were charged more. The inability to obtain insurance can prevent access to many forms of employment or self-employment.370
358 Table 3.1, Ministry of Justice (2017) Offender management statistics quarterly, April to June 2017, London: Ministry of Justice359 Prison Service Instruction 72/2011 Discharge, Annex B360 HM Chief Inspector of Prisons (2017) Annual Report 2016–17, London: The Stationery Office361 Table 8, Ministry of Justice (2015) National Offender Management Service annual report 2014/15: Management Information Addendum, London: Ministry of Justice362 YouGov and Department for Work and Pensions (2016) Survey Results, Fieldwork 26 June—14 December, London: YouGov, available at http://bit.ly/YouGovDWP363 Table 2.8, Department for Work and Pensions (2017) Work programme official statistics to June 2017, London: DWP364 Department for Work and Pensions, Stat-Xplore website, accessed on 17 October 2016, available at https://stat-xplore.dwp.gov.uk/365 Business in the Community website, accessed on 16 May 2017, available at http://www.bitc.org.uk/programmes/ban-box/who-has-banned-box-0366 Table 10, Ministry of Justice (2015) NOMS Annual Report 2014/15: Management Information Addendum, London: Ministry of Justice367 Criminal Justice Joint Inspection (2014) Resettlement provision for adult offenders: Accommodation and education, training and employment, London: HMIP368 House of Commons written question 7749, 12 September 2017369 Criminal Justice Joint Inspection (2017) An inspection of through the gate resettlement services for prisoners serving 12 months or more, London: HMIP370 Bath, C., and Edgar, K. (2010) Time is Money: Financial responsibility after prison, London: Prison Reform Trust
53
Rehabilitation and resettlement
Family
Family and friends are the most important factor in enabling successful resettlement on release. Despite this, inspectors found no evidence that families were involved in sentence planning, even when a person said they were relying on them for support after release.371
Furthermore, no-one routinely monitors the parental status of prisoners in the UK or systematically identifies children of prisoners, where they live or which services they are accessing.
Prisons do not regularly record whether people have children under the age of 18, however, 54% of women and 49% of men surveyed by inspectors in 2016–17 reported that they did.372
Nearly one in five (19%) young adults (18–20 years old) surveyed said they had children. This compares to 4% of the general population who are young fathers.373
One in 10 boys in young offender institutions told inspectors that they had children themselves.374
Women are often held further away from their families, making visiting difficult and expensive. The average distance is 64 miles, but many are held considerably further away.375 The government has committed to build and open five new community prisons for women to help to address this—however the recent closure of HMP Holloway has resulted in more women being held further away from friends and family according to inspectors.376
Reoffending rates are 21 percentage points higher for people who said they had not received family visits whilst in prison compared to those who had.377
Only around a third of prisoners said they had been helped by staff to maintain family ties. Inspectors found that “support for rebuilding and maintaining family ties remained inconsistent and in many cases limited to visits, letters and telephone calls”.378
Arrangements to help prisoners maintain and strengthen family ties are too variable across prisons, and are not given sufficient priority or resources according to an independent government commissioned review and prisons inspectors.379
Most people were in contact with their family while in custody—either by letter (91%), telephone (88%) or through visits (70%).380
However, nearly half (44%) of people said they had problems sending or receiving mail—and over a quarter (26%) had problems accessing telephones.381
The cost of making a telephone call from prison is expensive. A 30 minute call during the working week to a landline costs £2.75 and for mobiles is £6.12.382
Secure in-cell telephones, with reduced call costs, have been introduced at HMP Wayland to make keeping in touch more easier and more affordable. Early evidence has shown an increase in calls and improved behaviour, and inspectors found that it was helping people to stay in touch with their families.383
Only three in ten prisoners reported that it was easy or very easy for family to visit them at their current prison—16% said they did not receive visits.384
371 Criminal Justice Joint Inspection (2014) Resettlement provision for adult offenders: Accommodation and education, training and employment, London: HM Inspectorate of Prisons372 HM Chief Inspector of Prisons (2017) Annual Report 2016–17, London: The Stationery Office373 Ministry of Justice (2012) Prisoners’ childhood and family backgrounds, London: Ministry of Justice374 HM Inspectorate of Prisons (2016) Children in Custody 2015–16, London: HM Stationery Office375 Women in Prison (2015) State of the estate—Women in Prison’s report on the women’s custodial estate (2nd edition), London: Women in Prison376 Ministry of Justice (2016) Prison safety and reform, London: Ministry of Justice and HM Chief Inspector of Prisons (2017) Annual Report 2016–17, London: The Stationery Office377 Brunton-Smith, I. and Hopkins, K. (2014) Prisoners’ experience of prison and outcomes on release: Waves 2 and 3 of SPCR, London: Ministry of Justice378 HM Chief Inspector of Prisons (2015) Annual Report 2014–15, London: The Stationery Office379 Farmer, M. (2017) The importance of strengthening prisoners’ family ties to prevent reoffending and reduce Intergenerational Crime, London: Ministry of Justice and
HM Inspectorate of Prisons (2016) Life in prison: contact with families and friends, London: HMIP380 Brunton-Smith, I. and Hopkins, K. (2014) Prisoners’ experience of prison and outcomes on release: Waves 2 and 3 of SPCR, London: Ministry of Justice381 HM Inspectorate of Prisons (2016) Life in prison: contact with families and friends, London: HMIP382 HM Inspectorate of Prisons (2016) Life in prison: Earning and spending money, London: HMIP383 Prison and Courts Bill Committee (2017) Committee stage (fourth sitting), Hansard HC, 29 March 2017, c18, available at http://bit.ly/WaylandPhones and HM Inspectorate of Prisons (2017)
Report on an unannounced inspection of HMP Wayland 19–30 June 2017, London: HMIP384 HM Inspectorate of Prisons (2016) Life in prison: Earning and spending money, London: HMIP
54
Rehabilitation and resettlement

OTHER UK PRISON SYSTEMS
Scotland385
Use of custodyOn 17 November 2017 the total number of people in custody in Scotland stood at 7,482.386
Scotland has one of the highest imprisonment rates in western Europe—138 people in prison per 100,000 of the population. England and Wales have an imprisonment rate of 146 per 100,000, France 103 per 100,000 and Germany 77 per 100,000.387
Over one-third of the adult male general population, and nearly one-tenth of adult women is likely to have at least one criminal conviction.388
However, the prison population in Scotland is continuing to fall. An average of 7,552 people were in custody during 2016–17, 123 fewer people than the year before.389
14% of people sentenced by the courts were given a custodial sentence in 2015–16.390
Prison sentences are getting longer. The average length of a custodial sentence in 2015–16 was over nine months (292 days)—over two months (63 days) longer than a decade ago.391
There is a statutory presumption against prison sentences of less than three months—unless a court considers that no other method of dealing with the person is appropriate.392 However, they still accounted for three in 10 custodial sentences given in 2015–16.393
The number of people on remand remains high—accounting for nearly one in five people in prison (18%) compared with 12% in England and Wales. An average of 1,370 people were in prison on remand in 2016–17, down from 1,494 the year before.394
The cost of imprisonment continues to rise. It costs an average of £35,325 per prison place—an increase of nearly £3,400 in the last four years.395
Whilst convictions have fallen in the last decade, the number of people given a community sentence has risen by 18% during the same period.396
385 This section has been updated as extensively as possible with the available information. Long-standing technical issues continue to affect the publication of up to date statistics on prisons in Scotland, with no clear timetable for when they will be resolved. According to the Scottish Government, data for 2014-15 have been affected by an unrelated critical incident and release will be further delayed pending resolution.
386 Scottish Prison Service website, accessed on 5 December 2017, available at http://www.sps.gov.uk/Corporate/Information/SPSPopulation.aspx387 International Centre for Prison Studies website, accessed on 25 November 2017, available at
http://www.prisonstudies.org/highest-to-lowest/prison_population_rate?field_region_taxonomy_tid=14388 The Scottish Government (2013) Discussion Paper on the Rehabilitation of Offenders Act 1974, Edinburgh: The Scottish Government389 Scottish Prison Service (2017) Annual report and accounts 2016–17, Edinburgh: SPS and Scottish Prison Service (2016) Annual report and accounts 2015–16, Edinburgh: SPS390 Table 9, The Scottish Government (2017) Criminal proceedings in Scotland 2015–16, Edinburgh: The Scottish Government391 Table 10(c), Ibid. and Criminal proceedings in Scotland 2014–15392 The Criminal Justice and Licensing (Scotland) Act 2010393 Table 10(a), The Scottish Government (2017) Criminal proceedings in Scotland 2015–16, Edinburgh: The Scottish Government394 Appendix 3, Scottish Prison Service (2017) Annual report and accounts 2016–17, Edinburgh: SPS and Annual report and accounts 2015–16; and
Table 1.1, Ministry of Justice (2017) Offender management statistics quarterly: April to June 2017, London: Ministry of Justice395 Appendix 8a, Scottish Prison Service (2017) Annual report and accounts 2016–17, Edinburgh: SPS and Scottish Prison Service (2013) Annual report and accounts 2012–13, Edinburgh: SPS396 Table 7(a), The Scottish Government (2017) Criminal proceedings in Scotland 2015–16, Edinburgh: The Scottish Government
The Scottish Government is taking forward an ambitious prison reform programme which includes increasing the use of community sentences; reducing the use of short term custodial sentences and remand; and improving the reintegration of individuals from custody to community.
Following the introduction of legislation against the presumption of custodial sentences of less than three months in 2010, the Scottish Government has announced it will extend this to sentences of less than 12 months “with the aim of using prison primarily for those individuals who have committed serious offences and those cases involving issues of public safety.”
A new model for community justice was launched in April 2017, and there are plans to introduce legislation to extend the use of electronic monitoring in the community.
The Scottish Government has committed to reducing the number of women in prison and has set a target of 230 women across the new women’s estate. A new national 80-place unit for women will be built at HMP Cornton Vale along with five community custodial units, holding 20 women each, across Scotland to allow them to be closer to their communities and families. The new national prison for women and the first two community custody units will open in 2020.
56
Other UK prison systems
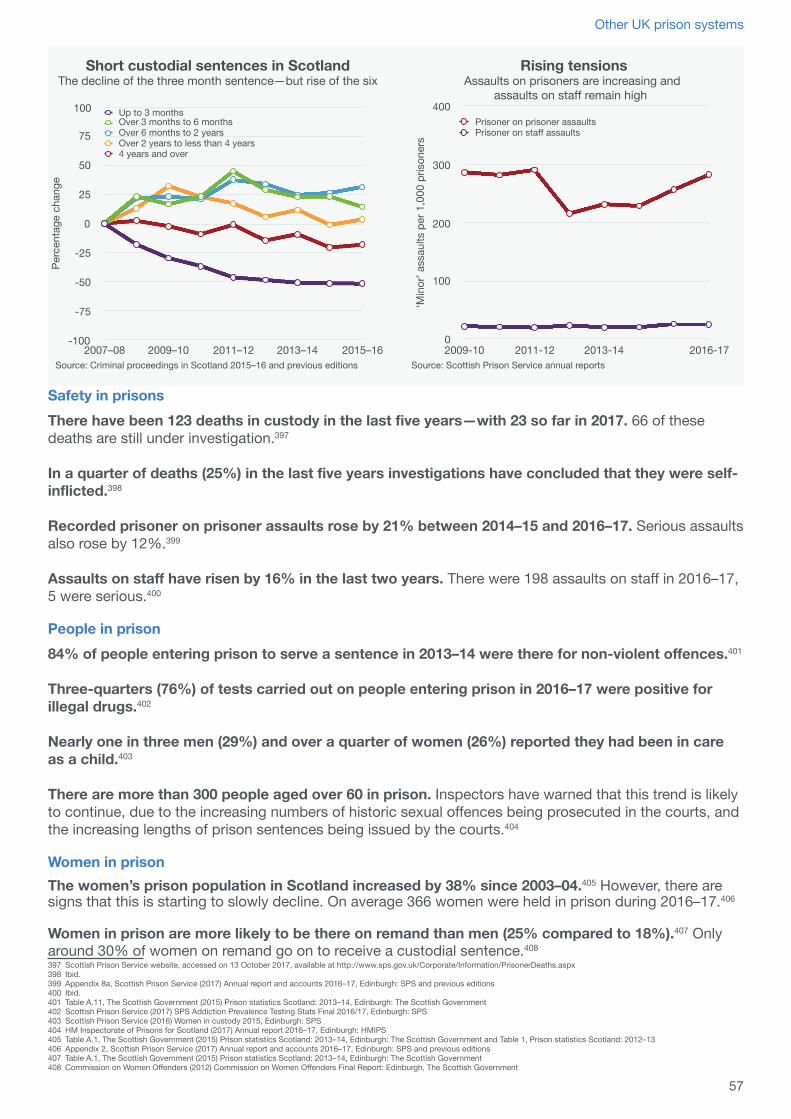
Safety in prisonsThere have been 123 deaths in custody in the last five years—with 23 so far in 2017. 66 of these deaths are still under investigation.397
In a quarter of deaths (25%) in the last five years investigations have concluded that they were self-inflicted.398
Recorded prisoner on prisoner assaults rose by 21% between 2014–15 and 2016–17. Serious assaults also rose by 12%.399
Assaults on staff have risen by 16% in the last two years. There were 198 assaults on staff in 2016–17, 5 were serious.400
People in prison84% of people entering prison to serve a sentence in 2013–14 were there for non-violent offences.401
Three-quarters (76%) of tests carried out on people entering prison in 2016–17 were positive for illegal drugs.402
Nearly one in three men (29%) and over a quarter of women (26%) reported they had been in care as a child.403
There are more than 300 people aged over 60 in prison. Inspectors have warned that this trend is likely to continue, due to the increasing numbers of historic sexual offences being prosecuted in the courts, and the increasing lengths of prison sentences being issued by the courts.404
Women in prisonThe women’s prison population in Scotland increased by 38% since 2003–04.405 However, there are signs that this is starting to slowly decline. On average 366 women were held in prison during 2016–17.406
Women in prison are more likely to be there on remand than men (25% compared to 18%).407 Only around 30% of women on remand go on to receive a custodial sentence.408
397 Scottish Prison Service website, accessed on 13 October 2017, available at http://www.sps.gov.uk/Corporate/Information/PrisonerDeaths.aspx398 Ibid.399 Appendix 8a, Scottish Prison Service (2017) Annual report and accounts 2016–17, Edinburgh: SPS and previous editions400 Ibid.401 Table A.11, The Scottish Government (2015) Prison statistics Scotland: 2013–14, Edinburgh: The Scottish Government402 Scottish Prison Service (2017) SPS Addiction Prevalence Testing Stats Final 2016/17, Edinburgh: SPS403 Scottish Prison Service (2016) Women in custody 2015, Edinburgh: SPS404 HM Inspectorate of Prisons for Scotland (2017) Annual report 2016–17, Edinburgh: HMIPS405 Table A.1, The Scottish Government (2015) Prison statistics Scotland: 2013–14, Edinburgh: The Scottish Government and Table 1, Prison statistics Scotland: 2012–13406 Appendix 2, Scottish Prison Service (2017) Annual report and accounts 2016–17, Edinburgh: SPS and previous editions407 Table A.1, The Scottish Government (2015) Prison statistics Scotland: 2013–14, Edinburgh: The Scottish Government408 Commission on Women Offenders (2012) Commission on Women Offenders Final Report: Edinburgh, The Scottish Government
Source: Criminal proceedings in Scotland 2015–16 and previous editions
Short custodial sentences in ScotlandThe decline of the three month sentence—but rise of the six
Perc
enta
ge c
hang
e
-100
-75
-50
-25
0
25
50
75
100
2007–08 2009–10 2011–12 2013–14 2015–16
Up to 3 monthsOver 3 months to 6 monthsOver 6 months to 2 yearsOver 2 years to less than 4 years4 years and over
‘Min
or’ a
ssau
lts p
er 1
,000
pris
oner
s
0
100
200
300
400
2009-10 2011-12 2013-14 2016-17
Prisoner on prisoner assaultsPrisoner on staff assaults
Rising tensionsAssaults on prisoners are increasing and
assaults on staff remain high
Source: Scottish Prison Service annual reports
57
Other UK prison systems
Remand accounts for nearly two-thirds (64%) of all receptions of women into prison. There were 1,805 receptions on remand by women in 2013–14.409
A third of women (34%) reported being drunk at the time of their offence—a quarter reported that it affected their ability to hold down a job.410
A higher proportion of women commit ‘crimes of dishonesty’ than men—15% of proven offences by women were for acquisitive crimes compared with 11% of men’s.411
10% of women reported having served more than ten sentences in prison.412
128 pregnant women have been held in prison in Scotland since 2012—during this time 37 children have been born whilst in prison.413
Children and young adultsThere were 334 young people (under 21) in prison as of 17 November 2017—41 of these were under 18.414 The number of young people sent to prison has fallen by 60% in the last nine years.415
Over half (55%) of young people were under the influence of drugs at the time of their offence (compared to 39% adults). One-in-five (19%) committed their offence to get money to buy drugs.416
Six in 10 young people reported being drunk at the time of their offence (compared to 41% adults).417
A third of young people reported being in care as a child.418
A quarter of boys said they had no qualifications. Over half (56%) said that they were ‘often’ excluded from school and four in 10 (37%) said that they had ‘often’ attended a Children’s Panel.419
Rehabilitation and resettlement43% of people released from custody are reconvicted within a year—rising to 58% for men and 63% for women with more than 10 previous convictions.420
Only three in 10 prisoners had accessed services while in prison to help them prepare for release. Of those who accessed services, 68% had sought advice about housing and 46% about employment.421
Three in 10 (29%) of prisoners surveyed said they didn’t know where they would be living on release.422
Fewer than a quarter (24%) of prisoners surveyed said that they had received help with their drug addiction during their sentence.423
693 people on average were held in prison in 2013–14 following recall from supervision or licence—nearly double the number in 2004–05.424
However, an evaluation of the SPS Throughcare Service, which provides people serving short sentences with support to prepare for and on release from prison, found improved engagement with support services including benefits; housing; substance misuse treatment, education and employment, factors which are known to aid desistance from crime and reduce reoffending.425
409 Table A.8, The Scottish Government (2015) Prison statistics Scotland: 2013–14, Edinburgh: The Scottish Government410 Scottish Prison Service (2016) Women in custody 2015, Edinburgh: SPS411 Tables 6(a) and 6(b), The Scottish Government (2017) Criminal proceedings in Scotland 2015–16, Edinburgh: The Scottish Government412 Scottish Prison Service (2016) Women in custody 2015, Edinburgh: SPS413 Scottish Prison Service (2017) Freedom of Information request, HQ 17079 available at http://www.sps.gov.uk/FreedomofInformation/FOI-5209.aspx414 Scottish Prison Service website, accessed on 5 December 2017, available at http://www.sps.gov.uk/Corporate/Information/SPSPopulation.aspx415 Table 11, The Scottish Government (2017) Criminal proceedings in Scotland 2015–16, Edinburgh: The Scottish Government416 Scottish Prison Service (2016) Young people in custody 2015, Edinburgh: SPS417 Ibid.418 Ibid.419 Scottish Prison Service (2013) Prisoner Survey 2013: Male young offenders, Edinburgh: SPS420 Table 8 and 10, The Scottish Government (2017) Reconviction rates in Scotland: 2014–15 offender cohort, Edinburgh: The Scottish Government421 Scottish Prison Service (2015) Prisoner survey 2015, Edinburgh: SPS422 Ibid.423 Ibid.424 Table A1, The Scottish Government (2015) Prison statistics Scotland: 2013–14, Edinburgh: The Scottish Government425 Reid-Howie Associates Ltd. (2017) Evaluation of the SPS Throughcare Support Service, Edinburgh: SPS
58
Other UK prison systems
Northern Ireland
Use of custodyThe number of people in prison in Northern Ireland continues to fall. On 17 November 2017 the total population stood at 1,438—93 fewer people than the previous year.426
However, the number of people entering prison increased by 9% last year—the first time it has done so since 2012. There were 5,199 receptions into prison during 2016.427
The number of people entering prison for fine default continues to rise. Numbers fell significantly in 2013 following a Judicial Review, but numbers have risen during the last two years. 627 people went to prison in 2016 for failure to pay a fine—up from 139 in 2014.428
The imprisonment rate for Northern Ireland is 76 per 100,000 of the population. England and Wales have an imprisonment rate of 146 per 100,000, France 103 per 100,000 and Germany 77 per 100,000.429
The proportion of sentences resulting in custody is increasing. In 2010, 9% of people convicted were sentenced to custody, by 2016 this had risen to 13%. The proportion receiving suspended sentences has also risen from 11% to 17%.430
Northern Ireland continues to hold a high proportion of people in prison on remand compared with other countries. It currently holds over a quarter (26%) on remand compared with 12% in England and Wales, and 18% in Scotland.431
Remand accounted for more than half (55%) of all receptions into prison in 2016, with 2,843 receptions in total, the first increase since 2011. 387 people on average were held in prison on remand.432
The average cost per prisoner place continues to fall from historically high levels—costing £53,408 per year in 2016–17, down from £73,732 in 2010.433
426 Figure 1, Crone, E. (2017) The Northern Ireland Prison Population 2016 and 2016/17, Belfast: Department of Justice and Northern Ireland Prison Service, situation report for 17 November 2017, accessed on 5 December 2017, available at https://www.justice-ni.gov.uk/articles/weekly-situation-reports-october-2015
427 Table 7 and Figure 7, Crone, E. (2017) The Northern Ireland Prison Population 2016 and 2016/17, Belfast: Department of Justice428 Figure 8, Ibid.429 International Centre for Prison Studies website, accessed on 25 November 2017, available at
http://www.prisonstudies.org/highest-to-lowest/prison_population_rate?field_region_taxonomy_tid=14430 Table 6c, Department of Justice (2017) Court Prosecutions, Conviction and Out of Court Disposals Statistics for Northern Ireland 2016, Belfast: Department of Justice and Table 6c,
Department of Justice (2014) Northern Ireland Conviction and Sentencing Statistics 2010–2012, Belfast: Department of Justice431 Table 1, Crone, E. (2017) The Northern Ireland Prison Population 2016 and 2016/17, Belfast: Department of Justice; Table 1.1, Ministry of Justice (2016) Offender management statistics
quarterly: April to June 2016, London: Ministry of Justice ; and Appendix 3, Scottish Prison Service (2016) Annual report and accounts 2015–16, Edinburgh: SPS; Annual report and accounts 2014–15, Edinburgh: SPS
432 Table 1 and 7 and Figure 8, Crone, E. (2017) The Northern Ireland Prison Population 2016 and 2016/17, Belfast: Department of Justice; Appendix 3, Scottish Prison Service (2017) Annual report and accounts 2016–17, Edinburgh: SPS; and Table 1.1, Ministry of Justice (2017) Offender management statistics quarterly: April to June 2017, London: Ministry of Justice
433 Northern Ireland Prison Service (2017) Northern Ireland Prison Service annual report and accounts 2016–17, Belfast: Department of Justice and Committee for Justice (2014) Prison Service Reform and Management of Drugs Misuse: Northern Ireland Prison Service, Belfast: Northern Ireland Assembly
March 2016 saw the end of the formal prison reform programme, with 36 of the 40 recommendations made by the Prison Review Team completed. But, the process of reform continues, with the Northern Ireland Prison Service committing to a reform programme lasting 10 years or more—focusing on effective leadership; purposeful activity opportunities; equality of outcomes for prisoners, with a more diverse workforce; improving accommodation; and a strong relationship with healthcare.
However, the breakdown of power-sharing this year means that Northern Ireland is currently without a justice minister or a functioning Northern Ireland Executive and Assembly.
At HMP Maghaberry, a new 360 cell block is scheduled to open in May 2019. A separate high security facility is also planned on the same site but is awaiting business case approval.
The £150m redevelopment at HMP Magilligan is awaiting business case approval and expected to take nine years to deliver.
Plans to build a new women’s prison on the site of HMP Magilligan are unlikely to happen for the foreseeable future.
59
Other UK prison systems
Safety in custodyDuring 2016–17 there were five deaths in custody—four at Maghaberry prison and one at Magilligan. Three of these appeared to be self-inflicted.434 There have been two further deaths announced so far this year.435 A review of vulnerable people in custody was announced last year but has yet to report.436
The Chief Inspector has said that he is concerned that despite critical reports into deaths in custody and serious self-harm, “some important lessons have not been learnt”.437
Ambulances were called out 1,100 times to prisons between 2013–15—the equivalent of once a day. Over 80% of the calls were made from HMP Maghaberry.438
Half of prisoners reported feeling unsafe at some time during their time in custody. 42% reported they had been bullied and of those that had, 19% reported the incident, 23% did not.439
Inspectors have raised concerns about the availability of drugs within prisons. “They have been responsible for a number of deaths in custody and other serious incidents, and are a cause of a significant proportion of the bullying which takes place. This is true both for illicit and prescription drugs”.440
Almost one in 10 people (8%) reported they had developed a drug problem since entering prison.441
One in five people at Maghaberry prison (19%) tested positive for drugs—significantly higher than the prison service’s target of 12%. A further 9% refused to take a mandatory test.442
Treatment and conditionsOngoing staff shortages at Maghaberry prison remain a problem. Despite improvements in the stability and predictability of the prison regime, significant numbers of people were locked in their cells during the day and there is still an over-reliance on agency staff.443
Catholics are more negative about their experience in prison than Protestants. Maghaberry prison has begun to conduct analysis after repeated calls by inspectors.444
At least ten people were held in solitary confinement in Maghaberry prison for over 100 days each in 2015—four were held for over a year and in one case a prisoner was held for five years.445
People in prisonAlmost 40% of people reported that they had a problem with drugs when they came into prison—31% with prescription drugs.446
44% of people reported having a problem with alcohol when they came into prison.447
A total of 67% of all people in prison are on prescribed medication—80% at Maghaberry, 58% at Magilligan and 38% at Hydebank Wood Young Offender’s Centre. The levels of prescribing reflect the fact that prisoners tend to have poorer physical and mental health than the general population.448
34% of people entering prison have a literacy ability, and 51% have a numeracy ability, at a level broadly equated to that expected of a nine year old.449
434 The Prisoner Ombudsman for Northern Ireland (2017) Annual report 2016–17, Belfast: The Prisoner Ombudsman for Northern Ireland435 Department of Justice website, accessed on 12 October 2017, available at
https://www.justice-ni.gov.uk/news/prisoner-death-magilligan and https://www.justice-ni.gov.uk/news/death-custody436 Kearney, V. (2017) BBC News, ‘Maghaberry Prison: Concern for vulnerable inmates’, available at
http://www.bbc.com/news/uk-northern-ireland-41005688437 Criminal Justice Inspection Northern Ireland (2017) Report on an unannounced visit to Maghaberry Prison, 3–4 April 2017, Belfast: CJINI438 McCracken, N., (2016) The Detail, ‘Over a thousand ambulance call outs to Northern Ireland’s prisons’, available at
http://www.thedetail.tv/articles/an-ambulance-a-day-at-northern-ireland-s-prisons439 Criminal Justice Inspection Northern Ireland (2014) The safety of prisoners held by the Northern Ireland Prison Service, Belfast: CJINI440 Ibid.441 Ibid.442 Fagan, M. (2017) The Detail, ‘Maghaberry prison most afflicted by drug misuse’, available at
https://www.thedetail.tv/articles/maghaberry-prison-most-afflicted-by-drug-misuse443 Criminal Justice Inspection Northern Ireland (2017) Report on an unannounced visit to Maghaberry Prison, 3–4 April 2017, Belfast: CJINI444 Ibid. and Criminal Justice Inspection Northern Ireland (2015) Report on an unannounced inspection of Magilligan Prison, Belfast: CJINI445 McCracken, N., (2016) The Detail, ‘Major concerns over long-term solitary confinement in Northern Ireland prisons’, available at
http://www.thedetail.tv/articles/a-prison-within-a-prison-northern-ireland-inmates-held-for-years-in-solitary-confinement446 Criminal Justice Inspection Northern Ireland (2014) The safety of prisoners held by the Northern Ireland Prison Service, Belfast: CJINI447 Ibid.448 Ibid.449 Northern Ireland Prison Service (2014) Building for the future—Northern Ireland Prison Service estate strategy, Belfast: Department of Justice
60
Other UK prison systems
9% of the prison population are foreign nationals—nearly two-thirds (64%) are on remand.450
Women in prisonOn 17 November 2017 there were 60 women in prison in Northern Ireland.451
Women accounted for 8% of receptions into prison in 2016.452
Receptions to prison increased by 30% for women between 2014 and 2016—whilst men’s rose by 4%. Much of the increase has been due to women defaulting on fines (up from 7 in 2014 to 71 in 2016).453
Three-quarters of women entering prison to serve a sentence are there for non-violent offences. The majority are for theft or criminal damage.454
More than half of women surveyed at Ash House, Northern Ireland’s only women’s prison, said they had felt unsafe at some time. Inspectors said that this was likely to have been because of the complex mix of the population, which includes young men on the same site, and the availability of drugs.455
Six in 10 women in prison surveyed said they had children under the age of 18. A third said it was difficult or very difficult for family and friends to visit, a further quarter (24%) said they didn’t receive visits.456
Children and young adults139 children (aged 10–17) entered custody in 2016–17, the lowest number for at least eight years. 23 children were held in custody on average.457
The vast majority (89%) were boys—only 15 girls entered custody in 2016–17.458
Most children in custody are there on remand—accounting for two-thirds (65%) of the population.459
Nearly four in 10 children in custody (39%) were in care—they accounted for nearly half of all receptions into custody in 2016–17.460
Inspectors have raised concerns that children are being inappropriately placed in custody at times of crisis when no alternative accommodation is available—at a cost of around £9.3m per year.461
159 young adults (aged 18–20) entered custody in 2016 to serve a sentence.462
Six in 10 (61%) said they had felt unsafe at some time—over a quarter (27%) told inspectors they currently felt unsafe.463
Rehabilitation and resettlement37% of adults released from custody went on to be reconvicted within a year. More than half (55%) of those who reoffended had done so within the first three months of release; over three-quarters (79%) had within six months.464
Over a third of people released from prison (36%) had no confirmed accommodation to go to on release.465
Of the 39 children released from custody, 28 committed a proven reoffence—20 reoffended within the first three months.466450 Northern Ireland Prison Service (2017) Analysis of NIPS Prison Population from 01/07/2016 to 30/09/2017, Belfast: Department of Justice451 Northern Ireland Prison Service, situation report for 17 November 2017, accessed on 5 December 2017, available at https://www.justice-ni.gov.uk/articles/weekly-situation-reports-october-2015452 Table 7, Crone, E. (2017) The Northern Ireland Prison Population 2016 and 2016/17, Belfast: Department of Justice453 Ibid.454 Table 11, Ibid.455 National Preventive Mechanism (2016) Report on an unannounced inspection of Ash House, Hydebank Wood women’s prison, Belfast: Criminal Justice Inspection Northern Ireland456 Ibid.457 Table 1 and Figure 1 data, Spain, A. and McCaughey, J. (2017) Youth Justice Agency annual workload statistics 2016/17, Belfast: Youth Justice Agency458 Table 9, Ibid.459 Table 1, Ibid.460 Table 12 and 6, Ibid.461 Criminal Justice Inspection Northern Ireland (2015) An announced inspection of Woodlands Juvenile Justice Centre, Belfast: CJINI462 Table 8, Crone, E. (2017) The Northern Ireland Prison Population 2016 and 2016/17, Belfast: Department of Justice463 Criminal Justice Inspection Northern Ireland (2016) Report on an unannounced inspection of Hydebank Wood secure college, Belfast: Criminal Justice Inspection Northern Ireland464 Table 8 and 2b, Duncan, L. and Damkat, I. (2017) Adult and youth reoffending in Northern Ireland (2014/15 cohort), Belfast: Department of Justice465 Northern Ireland Prison Service (2017) Prisons 2020, Belfast: Department of Justice466 Table 8 and 2c, Duncan, L. and Damkat, I. (2017) Adult and youth reoffending in Northern Ireland (2014/15 cohort), Belfast: Department of Justice.
61
Other UK prison systems


Your detailsName
Address
Postcode
Telephone
SUPPORT OUR WORK: BECOME A FRIENDThe Prison Reform Trust needs and values support from people who share our aims of achieving a just, humane and eff ective prison system in the UK. We do not accept government funding and rely entirely on voluntary donations. To become a Friend of the Prison Reform Trust and pledge an annual gift, please fi ll in this form and return it to:Prison Reform Trust, Freepost ND6125, London EC1B 1PN.N.B. Serving prisoners can receive copies of our publications for free on request.
Annual gift to the Prison Reform TrustPlease select one of the following methods of payment for your annual gift. Tick here if you are a UK taxpayer and you would like PRT to reclaim Gift Aid on your gifts.I am a UK taxpayer and understand that if I pay less Income Tax and/or Capital Gains Tax than the amount of Gift Aid claimed on all my donations in that tax year it is my responsibility to pay any diff erence.
Cheque made payable to “Prison Reform Trust” is enclosed (amount: £10 / £25 / £50 / £100 / £250 / other: £ ).
Credit/debit card. Please charge £10 / £25 / £50 / £100 / £250 / other: £ to this card:
Standing order
Card no. Security code
Start date
Signature Date
Expiry date
Tick here to receive our electronic newsletter with updates on developments in prison reform
Issue no.
Standing Order FormBank: Lloyds Bank, 34 Moorgate, London, EC2R 6PLSort code: 30–95–74 Account no: 38661068 Name: Prison Reform Trust (Reg. charity 1035525)
Please return to PRT DO NOT SEND TO YOUR BANKTo: The Manager, Bank/Building SocietyFull address of branchPostcodePlease pay Prison Reform Trust £ monthly / quarterly / annually,starting on (day) / (month) / (year) until further notice.
My account number is: Sort code is:
Signed Date
Prison Reform Trust publications and briefingsTime Well Spent: A practical guide to active citizenship and volunteering in prison 2011Reforming Women’s Justice: report of the Women’s Justice Taskforce 2011Last Resort? Exploring the reduction in child imprisonment 2008–11 2011Care—a stepping stone to custody? 2011
No Way Out? A briefing paper on foreign national women in prison in England and Wales 2012Old Enough to Know Better? A briefing on young adults in the criminal justice system 2012Fair Access to Justice?: Support for vulnerable defendants in the criminal courts 2012Out for Good: Taking responsibility for resettlement 2012Prisoner Rehabilitation: the work of the All Party Parliamentary Penal Affairs Group 2012Fatally Flawed: has the state learned from the deaths of children and young people in prison? 2012Turning young lives around: How health and justice services can respond to children with mental health problems and learning disabilities who offend
2012
Making the Difference: the role of adult social care services in supporting vulnerable offenders 2013Reducing women’s imprisonment action pack 2013Talking Justice: Where do you stand? and Talking Justice: What can I do? 2013Through the Gateway: How computers can transform rehabilitation 2013Mental health and learning disabilities in the criminal courts: Information for magistrates, district judges and court staff 2013
Brighter Futures: Working together to reduce women’s offending 2014Punishment without purpose 2014
Working it Out: Employment for women offenders 2015Inside Out: Release on temporary licence and its role in promoting effective resettlement and rehabilitation 2015Strangeways 25 years on: Achieving fairness and justice in our prisons 2015Transforming Lives: Reducing women’s imprisonment 2015Sentencing of Mothers: Improving the sentencing process and outcomes for women with dependent children 2015Deep Custody: Segregation units and close supervision centres in England and Wales 2015Relative Justice: the experiences and views of family members of people with particular needs in contact with criminal justice and liaison and diversion services
2015
Joint Enterprise: Righting a wrong turn? 2016Social care or systematic neglect? Older people on release from prison 2016Home truths: housing for women in the criminal justice system 2016Connections: A review of learning from the Winston Churchill Memorial Trust prison reform fellowships 2016Leading change: the role of local authorities in supporting women with multiple needs 2016Inside Out: The role of the voluntary and private sector in providing opportunities for rehabilitation for people on temporary release
2016
In Care, Out of Trouble: How the life chances of children in care can be transformed by protecting them from unnecessary involvement in the criminal justice system—An independent review chaired by Lord Laming
2016
Fair Cop? Improving outcomes for women at the point of arrest 2017Tackling discrimination in prison: Still not a fair response 2017Out for Good: Lessons for the future 2017Counted Out: Black, Asian and minority ethnic women in the criminal justice system 2017Triage and diversion: Getting it right 24/7 2017A Different Lens—Report on a pilot programme of active citizen forums in prison 2017There’s a reason we’re in trouble—Domestic abuse as a driver to women’s offending 2017
For more information about the Bromley Briefings Prison Factfile contact Alex Hewson: [email protected]
Registered in England, Charity No 1035525. Company Limited by Guarantee No 2906362
Prison Reform Trust15 Northburgh StreetLondon EC1V 0JR020 7251 [email protected]
Related Documents