Vol. 140: 187-197, 1996 MARINE ECOLOGY PROGRESS SERIES Mar Ecol Prog Ser I Published September 12 Substantial open-ocean phytoplankton blooms to the north of South Georgia, South Atlantic, during summer 1994 M. J. Whitehouse*, J. Priddle, P. N. Trathan, M. A. Brandon British Antarctic Survey, NERC, High Cross, Madingley Road, Cambridge CB3 OET, United Kingdom ABSTRACT Substantial open-ocean phytoplankton blooms in the Antarctic Zone to the northwest of South Georgia, South Atlantic are described. Chlorophyll a, nutrient and physical oceanography data, collected between 2 and 5 January 1994 and again 1 mo later between 2 and 4 February along a 450 km transect comprising 14 stations, are presented. The transect crossed the Subantarct~c and the Polar Front During the January transect survey, in 2 locations to the south of the Polar Front, average surface mixed-layer chlorophyll a concentrations were >8 and >l3 mg m-.', and were associated wlth silicate, nitrate and phosphate depletions (<2.0, <l 1.0 and 1.0 mm01 m-"respectively), and nitrite and ammo- nium enhancement (>0.3 and >1.4 mm01 m-3 respectively). One of the phytoplankton blooms was asso- ciated wlth the nearby Polar Front, but the origin of a bloom further south, well w~thln the Antarctic Zone, was not clear. Phytoplankton production predicted by nutrient drawdown was far greater than the observed biomass on both surveys. If a common Antarctic Zone origin is accepted for the southern bloom, a dechne in biomass of -2.7 m01 C m-2 occurred in the upper 50 m of the water column between the 2 surveys, which cannot be accounted for by zooplankton grazlng. If the bloom had originated in Subantarctic water advected to the south of the Polar Front, in~tial nutrient concentrat~ons would have been lower and consequently predicted production was closer to the observed biomass values. Never- theless, the area may be one of intense but local carbon export. KEY WORDS: Phytoplankton blooms - Nutnents . Antarctic Zone Polar Front. South Atlantic Car- bon export INTRODUCTION The open oceans of the Antarctic are generally regarded as areas of low phytoplankton productivity. Although several sites in the Scotia Sea have been identified as exceptions to this, overall chlorophyll a (chl a) levels in this region remain relatively low at <2.5 mg m-3 (Ronner et al. 1983, Jacques 1989, Tre- guer & Jacques 1992).In some areas of the Antarctic a variety of features offer stable conditions in which ele- vated phytoplankton growth can occur. Receding pack ice may provide stable near-surface conditions, with low salinity melt water overlaying denser water, where chl a concentrations greater than 7 mg m-3 have been measured (Smith & Nelson 1985, Nelson et al. 1987, 1989, Jacques 1989, Cota et al. 1992). Similar concen- trations have also been recorded in frontal zones that receive inputs of warmer water or nutrients, or that are seeded from upstream (Lutjeharms et al. 1985, Jacques & Panouse 1991, Perissinotto et al. 1992, Boyd et al. 1995, Bury et al. 1995, Savidge et al. 1995, Whitehouse et al. 1995). However, by far the highest chlorophyll concentrations (up to 30 mg 1r3) have been measured in neritic areas, associated with a variety of island- mass effects including water column stability and nutrient enrichment derived from island runoff (Hey- wood & Priddle 1987, Boden 1988, Jacques 1989, Holm-Hansen & Mitchell 1991, Perissinotto et al. 1992, Whitehouse et al. in press). The isolated island of South Georgia lies in hydro- graphically complex and productive waters that sup- port large populations of higher predators. It is situated on the North Scotia Ridge that runs from Burdwood 0 lnter-Research 1996 Resale of full artlcle not permitted

Welcome message from author
This document is posted to help you gain knowledge. Please leave a comment to let me know what you think about it! Share it to your friends and learn new things together.
Transcript
Vol. 140: 187-197, 1996 MARINE ECOLOGY PROGRESS SERIES
Mar Ecol Prog Ser I
Published September 12
Substantial open-ocean phytoplankton blooms to the north of South Georgia, South Atlantic,
during summer 1994
M. J. Whitehouse*, J. Priddle, P. N. Trathan, M. A. Brandon
British Antarctic Survey, NERC, High Cross, Madingley Road, Cambridge CB3 OET, United Kingdom
ABSTRACT Substantial open-ocean phytoplankton blooms in the Antarctic Zone to the northwest of South Georgia, South Atlantic are described. Chlorophyll a , nutrient and physical oceanography data, collected between 2 and 5 January 1994 and again 1 mo later between 2 and 4 February along a 450 km transect comprising 14 stations, are presented. The transect crossed the Subantarct~c and the Polar Front During the January transect survey, in 2 locations to the south of the Polar Front, average surface mixed-layer chlorophyll a concentrations were >8 and > l3 mg m-.', and were associated wlth silicate, nitrate and phosphate depletions (<2.0, < l 1.0 and 1.0 mm01 m-"respectively), and nitrite and ammo- nium enhancement (>0.3 and >1.4 mm01 m-3 respectively). One of the phytoplankton blooms was asso- ciated wlth the nearby Polar Front, but the origin of a bloom further south, well w ~ t h l n the Antarctic Zone, was not clear. Phytoplankton production predicted by nutrient drawdown was far greater than the observed biomass on both surveys. If a common Antarctic Zone origin is accepted for the southern bloom, a dechne in biomass of -2.7 m01 C m-2 occurred in the upper 50 m of the water column between the 2 surveys, which cannot be accounted for by zooplankton grazlng. If the bloom had originated in Subantarctic water advected to the south of the Polar Front, in~tial nutrient concentrat~ons would have been lower and consequently predicted production was closer to the observed biomass values. Never- theless, the area may be one of intense but local carbon export.
KEY WORDS: Phytoplankton blooms - Nutnents . Antarctic Zone Polar Front. South Atlantic Car- bon export
INTRODUCTION
The open oceans of the Antarctic are generally regarded as areas of low phytoplankton productivity. Although several sites in the Scotia Sea have been identified as exceptions to this, overall chlorophyll a (chl a) levels in this region remain relatively low at <2 .5 mg m-3 (Ronner et al. 1983, Jacques 1989, Tre- guer & Jacques 1992). In some areas of the Antarctic a variety of features offer stable conditions in which ele- vated phytoplankton growth can occur. Receding pack ice may provide stable near-surface conditions, with low salinity melt water overlaying denser water, where chl a concentrations greater than 7 mg m-3 have been measured (Smith & Nelson 1985, Nelson et al. 1987,
1989, Jacques 1989, Cota et al. 1992). Similar concen- trations have also been recorded in frontal zones that receive inputs of warmer water or nutrients, or that are seeded from upstream (Lutjeharms e t al. 1985, Jacques & Panouse 1991, Perissinotto et al. 1992, Boyd et al. 1995, Bury et al. 1995, Savidge e t al. 1995, Whitehouse et al. 1995). However, by far the highest chlorophyll concentrations (up to 30 mg 1 r 3 ) have been measured in neritic areas, associated with a variety of island- mass effects including water column stability and nutrient enrichment derived from island runoff (Hey- wood & Priddle 1987, Boden 1988, Jacques 1989, Holm-Hansen & Mitchell 1991, Perissinotto et al. 1992, Whitehouse et al. in press).
The isolated island of South Georgia lies in hydro- graphically complex and productive waters that sup- port large populations of higher predators. It is situated on the North Scotia Ridge that runs from Burdwood
0 lnter-Research 1996
Resale of full artlcle not permitted
Mar Ecol Prog Ser 140: 187-197, 1996
Bank south of the Falkland Islands, east to the South Sandwich Islands. The Antarctic Circumpolar Current (ACC) in the vicinity of South Georgia comprises 3 lati- tudinal zones separated by 2 major fronts: from north to south the Subantarctic Zone (SAZ), the Subantarctic Front (SAF), the Polar Frontal Zone (PFZ), the Polar Front (PF) and the Antarctic Zone (AAZ). The ACC flows in a generally easterly direction, and the Scotia Arc forms a variable-height barrier to its progress as it flows out of the Scotia Sea, deflecting the main path of the current to the north across the North Scotia Ridge. Over the North Scotia Ridge the PF lies about equidis- tant between Burdwood Bank and South Georgia over Shag Rocks Passage, the only fracture greater than 3000 m in this section of the North Scotia Ridge. North of the North Scotia Ridge the ACC resumes an easterly course towards the Georgia Basin, to the north of South Georgia (Sievers & Nowlin 1988, Peterson & Whit- worth 1989, Orsi et al. 1995).
Elevated phytoplankton concentrations >20 mg m-3 have been measured in the seas around South Geor- gia, where they are usually recorded in relatively small-scale patches and have been attributed to inter- actions between different watermasses or to shelf- break upwellings or accumulations [Hardy & Gunther 1935, Hardy 1967, Whitehouse e t al. 1993, in press, British Antarctic Survey (BAS) data]. During January 1994 elevated chl a concentrations (14.3 mg m-3 maxi- mum) were recorded along parts of a 450 km transect to the northwest of South Georgia. Such high concen- trations have rarely been reported in open ocean Antarctic waters. The chlorophyll distribut~on, which appeared to be associated with a region of nutrient depletion, suggested that 2 distinct blooms were present, both in deep water, south of the PF. In this paper, we document the chl a concentrations and the associated physico-chemical environment and we speculate on the mechanisms that may have facilitated the presence of such phytoplankton levels.
METHODS
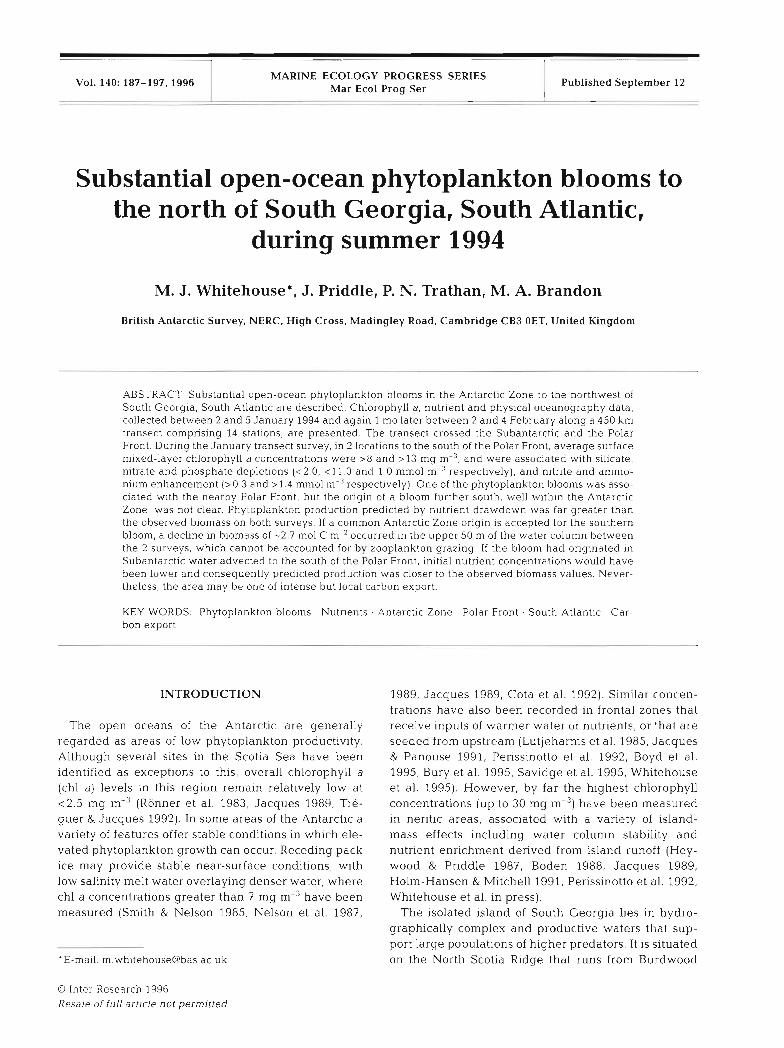
During cruise JR06 of the RRS 'James Clark Ross', a 450 km transect, comprising 14 CTD stations sited -35 km apart, was surveyed between 2 and 5 January and again between 2 and 4 February 1994 (Fig. 1). The first survey along the transect (T02) ran northwest- southeast, and the second (T74) southeast-northwest, between 50" 00' S, 42" 00' W above the Maurice Ewing Bank (MEB) and 53" 36' S, 38" 54' W some 80 km from the northwest tip of South Georgia.
At each station a Neil Brown Mk I11 CTD equipped with twelve 10 1 water bottles on a sampling rosette was used to measure hydrographic structure. The
Feb) TQ2 4 + T74 PP (Jan) --->&-- PF (Feb)
7 + 8 +
9 + l0 +
Longitude eW) Flg 1. Station positions along transects TO2 and T74 ~ncluding the positions of the Polar Front (PF) and Suhantarctlr Front (SAF) to the northwest of South Georgia, and the locations of
Shag Rocks and the 250 and 1000 m isobaths
depth of the CTD casts varied according to bathy- metry, but all were to at least 1000 m with intermittent casts to near bottom. Water bottle samples were collected at 10, 20, 40, 60, 100 and 200 m, as well as at 6 additional depths between 200 m and the bottom of the cast. Density properties from each CTD cast were used to determine the surface mixed-layer depth to the nearest 5 m.
Sub-samples from the water bottle samples collected between 10 and 200 m were filtered through a glass fibre filter (Whatman GF/F, pore size 0.7 pm), and the retained particulate material was analysed for chloro- phyll and phaeopigments (Parsons et al. 1984). Filters were extracted in 90 O/u acetone and the fluorescence of the extract was measured before and after acidification using a Sequoia Turner 112 fluorometer, calibrated with commercially prepared chl a (Sigma Chemical Company, St. Louis, MO. USA). Further sub-samples from all water bottles were filtered through a mixed ester membrane (Whatman WME, pore size 0.45 pm), and the filtrate was analysed colorimetrically for dis- solved nutrients using a Technicon segmented flow analyser. All water bottle samples were analysed for nitrate (N03+N02-N), nitrite (NO2-N), ammonium (NH4-N) and silicate [Si(OH),-Si], and in addition the transect T74 water samples were analysed for phos- phate (PO4-P) (Whitehouse & Woodley 1987).
During the cruise, remotely sensed AVHRR images of sea surface temperature data were obtained (via the BAS receiving station at Rothera, Adelaide Island, Antarctic Peninsula) from NOAA polar orbiting satel- lites uslng infrared sensors operating at 11 pm. Images were obtained that included information from cloud- free areas of the PFZ to the north and west of South
Whitehouse et al.: Open-ocean phytoplankton blooms in the South Atlantic
Georgia, and transformed to a standard polar stereo- graphic projection in order to aid interpretation.
The SYSTAT statistics package (Wilkinson et al. 1992) was used to measure significant variation (l-way ANOVA) and simple Pearson correlations between average chl a concentrations and physical and nutrient values in the surface mixed-layer (SML), and to extract descriptive summary statistics.
RESULTS
Physical oceanography
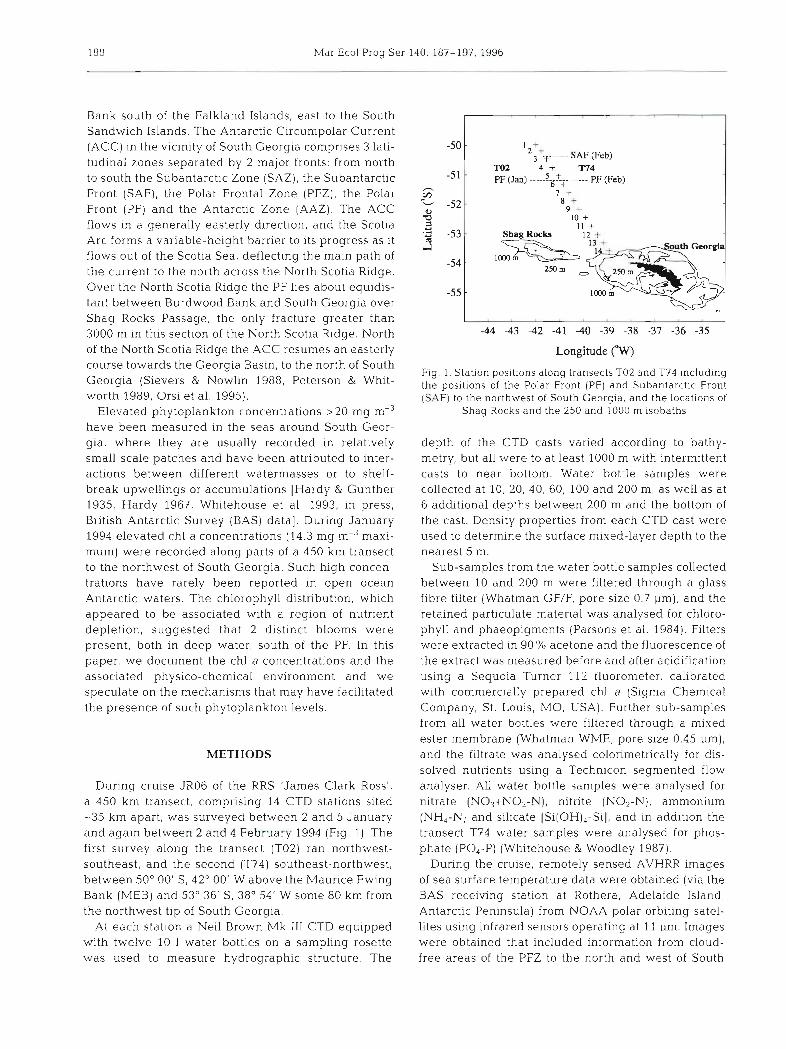
A well defined PF was evident along both transects (Fig. 2). The 5 northernmost stations of transect TO2 were situated in the PFZ, whereas the remaining 9 stations were located south of the PF in AAZ waters (P. N. Trathan, M. A. Brandon & E. J . Murphy unpubl.). Be- tween the 2 surveys of the transect the position of the SAF shifted southwards so that the 2 northernmost stations of transect T74 were located in the SAZ. The location of the PF moved little in the intervening period (-0.5" of latitude south), so that Stns 3 to 5 remained in PFZ water and the 9 southernmost stations in the AAZ.
Overall the surface water temperature had increased by -l.O°C between transects TO2 and T74 (Table 1). Surface waters were well mixed to a depth of -50 m during both transects, with shallower SML at Stns 1 and 5 during transect T02, and deeper mixing evident at Stn 13 during transect TO2 and Stn 12 during tran- sect T74 (Table 1).
The CTD profiles provided no evidence of mesoscale features such as core rings or meanders at the major
fronts along either of the transect surveys (Trathan et al. unpubl.). However, calculated geostrophic flows at 200 m referenced to ZOO0 m revealed a well-defined frontal jet of 16 cm S-' between Stns 5 and 6. Between the PF and South Georgia, Trathan et al. (unpubl.) identified 2 separate surface water regimes based on the temperature/salinity (T/S) structure at the near- surface temperature minima. They suggested that one regime represented the easterly flowing ACC, and the other a colder and more saline water, flowing west along the coast of South Georgia. They also showed spatial and temporal variability in the position of the boundary between the 2 regimes.
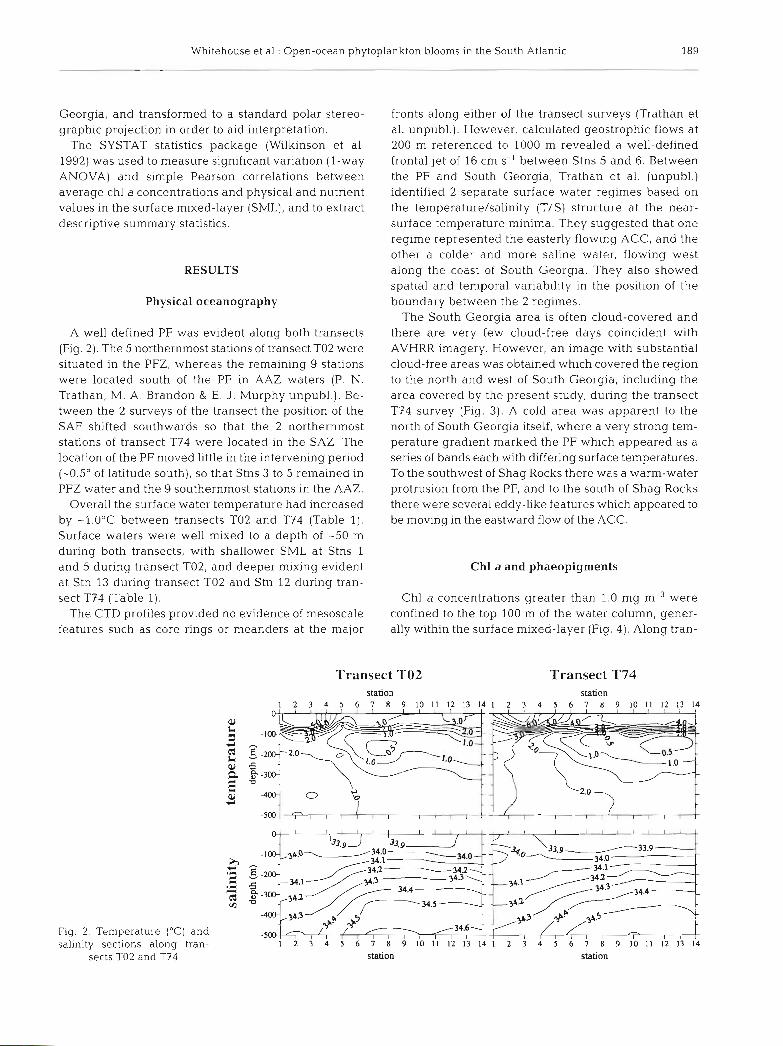
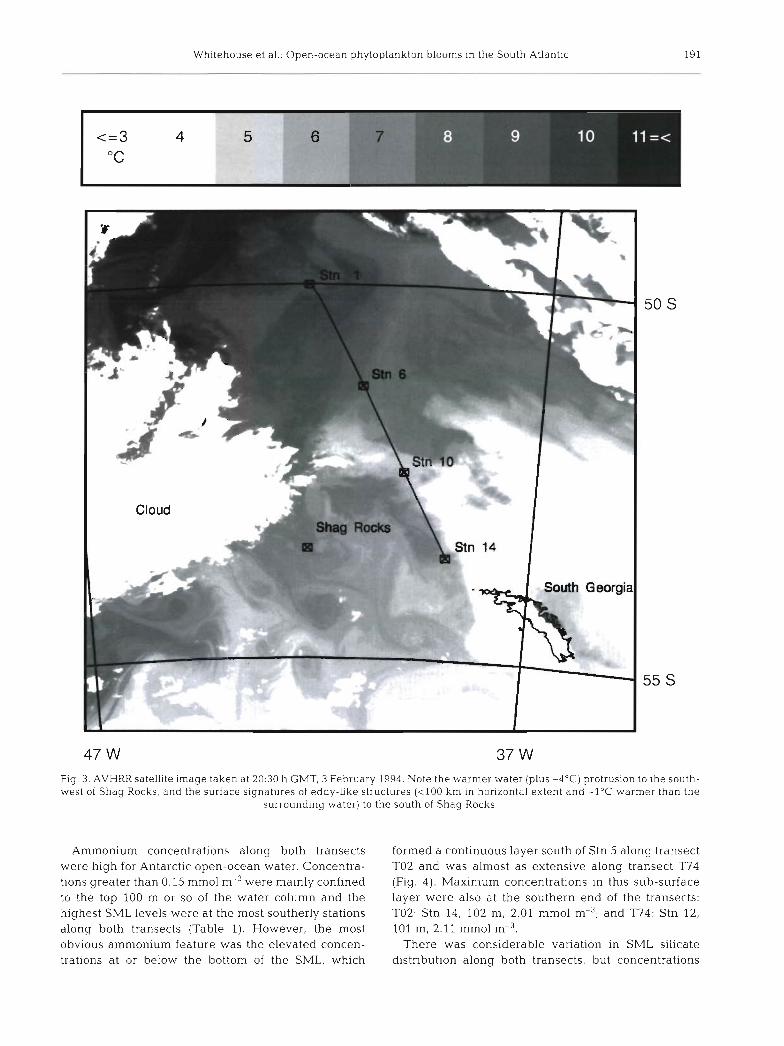
The South Georgia area is often cloud-covered and there are very few cloud-free days coincident with AVHRR imagery. However, an image with substantial cloud-free areas was obtained which covered the region to the north and west of South Georgia, including the area covered by the present study, during the transect T74 survey (Fig. 3). A cold area was apparent to the north of South Georgia itself, where a very strong tem- perature gradient marked the PF which appeared as a series of bands each with differing surface temperatures. To the southwest of Shag Rocks there was a warm-water protrusion from the PF, and to the south of Shag Rocks there were several eddy-like features which appeared to be moving in the eastward flow of the ACC.
Chl a and phaeopigments
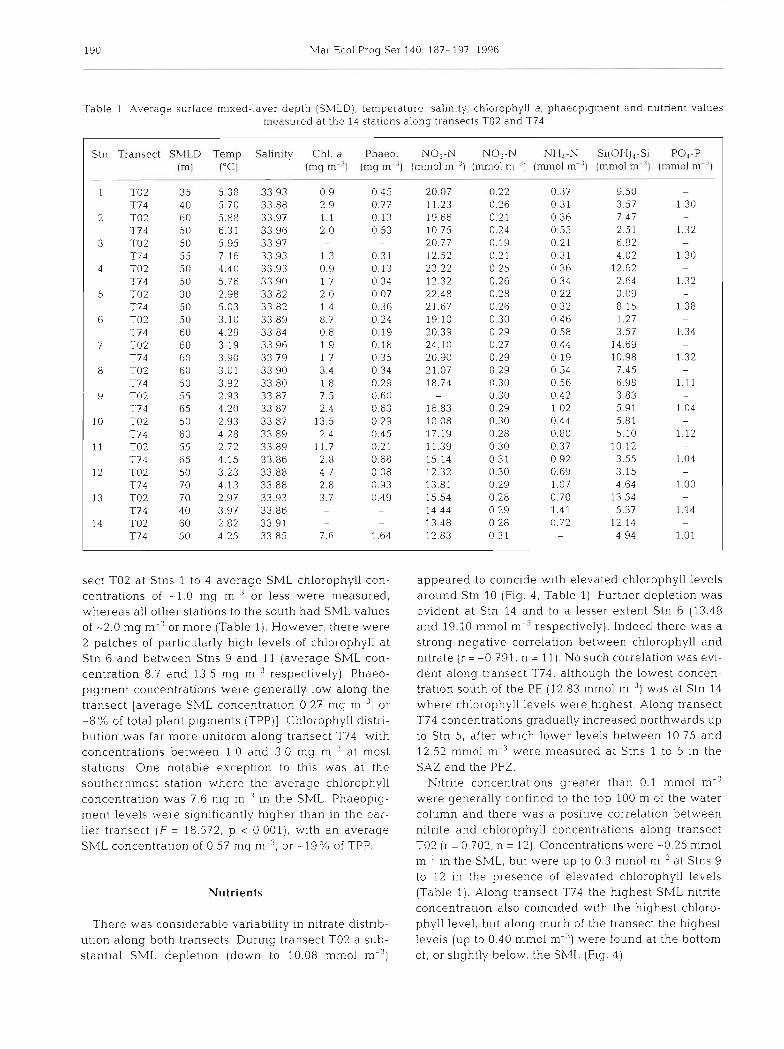
Chl a concentrations greater than 1.0 mg m-3 were confined to the top 100 m of the water column, gener- ally within the surface mixed-layer (Fig. 4). Along tran-
Transect TO2 Transect T74 station station
1 2 3 4 5 6 7 8 9 1 0 1 1 1 2 1 3 1 4 1 2 3 4 5 6 7 8 9 1 0 1 1 1 2 1 3 1 4
Fig. 2. Temperature ("C) and salinity sections along tran-
sects TO2 and T74 station station
Mar Ecol Prog Ser 140 187- 197, 1996
Table 1 Average surface mixed-layer depth (SMLD), temperature, salin~ty, chlorophyll a , phaeopigment and nutnent values n ~ e ~ ~ s u r e d at the 14 statlons along trdnwrts TO2 and T74
Stn Transect SLILD Temp ln1) I°Cl
1 l-02 35 S 38 T74 40 5 70
2 TO2 60 5 88 T74 50 6 3 1
3 TO2 50 5 95 T7 4 55 7 1 6
4 TO2 50 4 40 T7 4 50 5 76
5 TO2 30 2 98 T74 50 5 03
6 TO2 50 3 1 0 T74 60 4 29
7 TO2 60 3 1 9 T74 60 3 90
8 TO2 60 3 0 1 T74 50 3 92
Y TO2 55 2 93 T74 65 4 20
10 TO2 50 2 93 T74 60 4 28
11 TO2 55 2 72 T74 65 4 1 5
12 TO2 50 3 23 T74 70 4 13
13 TO2 70 2 97 T74 40 3 97
14 TO2 60 2 82 T74 50 4 25
Chl d
Imq m '1 Phdco NO3-N NO2-N NH,-N
(mq m I lmmol m 3 l (mmol m '1 imrnol m-'l
sect TO2 at Stns 1 to 4 average SML chlorophyll con- centrat~ons of -1 0 mg m ' or less were measured, whereas all other stations to the south had SML values of -2 0 mg m or more (Table 1) However, there were 2 patches of particularly high levels of chlorophyll at Stn 6 and between Stns 9 and 1 l (average SML con- centratlon 8 7 and 13 5 mg m respect~vely) Phaeo- pigment concentratlons wele genelally low along the transect [average SML concentrat~on 0 27 mg m 3 , or -8% of total plant p~gmen t s (TPP)] Chlorophyll distri- butlon was far more uniform along transect T74 with concentrations between 1 0 and 3 0 mg m at most statlons One notable except~on to t h ~ s was at the southernmost station where the average chlorophyll concentration was 7 6 mg m ' In the SML Phaeoplg- ment levels wele significantly higher than in the ear- her transect (F = 18 572, p < 0 001) w ~ t h an average SML concentration of 0 57 mg m-3, or -19% of TPP
Nutrients
There was considerable variab~llty in nitrate distrib- ution along both transects. Durlng transect TO2 a sub- stantial SML depletion (down to 10.08 mm01 m-')
appeared to coincide wlth elevated chloiophyll levels around Stn 10 (Flg 4, Table 1) Furthel depletion was evident at Stn 14 and to a lesser extent Stn 6 (13 48 and 19 l0 mm01 m respectlvely) Indeed there was a strong negative correlation between chlorophyll and nitrate (r = -0 791, n = 11) No such correlation was evl- dent along transect T74, although the lowest concen- tration south of the PF (12 83 mm01 m 3, was at Stn 14 where chlorophyll levels were hlghest Along transect T74 concentrations gradually Increased northwards up to Stn 5, after which lower levels betxveen 10 75 and 12 52 mm01 m ' were measured at Stns 1 to 5 In the SAZ and the PFZ
Nitrite concentratlons greater than 0 1 mm01 m were generally confined to the top 100 m of the water column and there was a p o s ~ t ~ v e correlation between nitiite and chlorophyll concentratlons along transect TO2 (r = 0 702, n = 12) Concentrattons were -0 25 mm01 m in the SML, but were up to 0 3 mm01 m at Stns 9 to 12 In the presence of elevated chlorophyll levels (Table 1) Along transect T74 the h ~ g h e s t SML nitnte concentration also coinc~ded with the highest chloro- phyll level, but along much of the transect the hlyhest levels (up to 0 40 mm01 m 3 , were found at the bottom of, or slightly below, the SML (Fig 4)
Whitehouse et al.: Open-ocean phytoplankton blooms in the South Atlantic
Cloud
Fig. 3. AVHRR satellite image taken at 20:30 h GMT, 3 February 1994. Note the warmer water (plus -4°C) protrusion to the south- west of Shag Rocks, and the surface signatures of eddy-like structures (< l00 km In horizontal extent and -1°C warmer than the
surrounding water) to the south of Shag Rocks
Ammonium concentrations along both transects were high for Antarctic open-ocean water. Concentra- tions greater than 0.15 mm01 m-3 were mainly confined to the top 100 m or so of the water column and the highest SML levels were at the most southerly stations along both transects (Table 1). However, the most obvious ammonium feature was the elevated concen- trations at or below the bottom of the SML, which
formed a continuous layer south of Stn 5 along transect TO2 and was almost as extensive along transect T74 (Fig. 4). Maximum concentrations in this sub-surface layer were also at the southern end of the transects: T02: Stn 14, 102 m, 2.01 mm01 m-3; and T74: Stn 12, 101 m, 2.11 mm01 m-3.
There was considerable variation in SML silicate distribution along both transects, but concentrations
192 Mar Ecol Prog Ser 140: 187-197, 1996
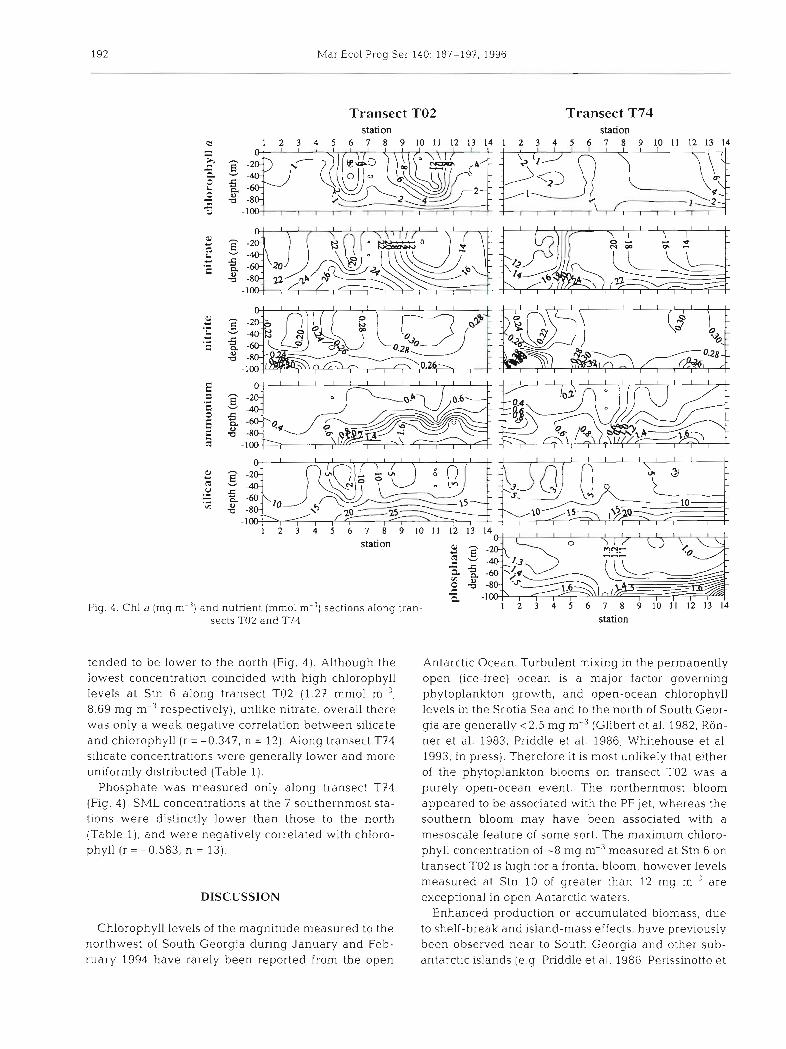
Fig. 4 . Chl a (mg m
Transect TO2 Transect T74 station station
U 1 2 3 4 5 6 7 8 9 1 0 1 1 1 2 1 3 1 4 1 2 3 4 5 6 7 8 9 1 0 1 1 1 2 1 3 1 4
-") a n d S €
1 2 3 4 5 6 7 8 9 1 0 1 1 1 2 1 3 1
station
nutnent (mm01 m-'l sectlons alona tran- 1 2 3 4 5 6 7 8 9 1 0 1 1 1 2 1 3 1 4
tended to be lower to the north (Fig. 4) . Although the lowest concentration coincided with high chlorophyll levels a t Stn 6 along transect 702 (1.27 mm01 m-3, 8.69 mg m-3 respectively), unlike nitrate, overall there was only a weak negative correlation between silica.te and chlorophyll (r = -0.347, n = 12). Along transect T74 silicate concentrations were generally lower and more uniformly distributed (Table 1 ) .
Phosphate was measured only along transect T74 (Fig. 4) . SML concentrations at the 7 southernmost sta- tions were distinctly lower than those to the north (Table l ) , and were negatively correlated with chloro- phyll ( r = -0.583, n = 13).
DISCUSSION
Chlorophyll levels of the magnitude measured to the northwest of South Georgia during January and Feb- ruary 1994 have rarely been reported from the open
station
Antarctic Ocean. Turbulent mixing in the permanently open (ice-free) ocean is a major factor governing phytoplankton growth, and open-ocean chlorophyll levels in the Scotia Sea and to the north of South Geor- gia, are generally <2 .5 mg m-3 (Glibert et al. 1982, Ron- ner et al. 1983, Priddle et al. 1986, Whitehouse et al. 1993, in press). Therefore it is most unlikely that either of the phytoplankton blooms on transect TO2 was a purely open-ocean event. The northernmost bloom appeared to be associated with the PF jet, whereas the southern bloom may have been associated with a mesoscale feature of some sort. The maximum chloro- phyll concentration of -8 mg m-:' measured at Stn 6 on transect TO2 is high for a frontal bloom, however levels measured at Stn 10 of greater than 12 mg m-"re exceptional in open Antarctic waters.
Enhanced production or accumulated biomass, due to shelf-break and island-mass effects, have previously been observed near to South Georgia and other sub- antarctic islands (e.g Priddle et al. 1986, Perissinotto et
Whitehouse e t al.: Open-ocean phytoplankton blooms in the South Atlantic 193
al. 1992, Whitehouse et al. 1993, in press). However, these mechanisms are unlikely to be responsible for generating the phytoplankton blooms in the present study as they occurred in the deep ocean (>3000 m), 150 km or more to the northwest of South Georgia. During the 'Islas Orcadas' cruise 17 in 1978, El-Sayed & Weber (1982) recorded chlorophyll concentrations of between l 1 and 13 mg m-3 at their deep ocean Stn 34, -65 km northeast of Stn 9 in the present study. However, they were unsure what factors contributed to the enhanced phytoplankton biomass. Fryxell et al. (1979) also described phytoplankton observations made along a transect of 4 stations from the same 'Islas Orcadas' cruise, including Stn 34. They speculated that the phytoplankton at this station represented a gradually aging populat~on, perhaps seeded from South Georgia and carried in a large semi-circular path or possibly entrapped in some sort of gyre. Here we consider the generation of the transect TO2 blooms and the absence of such blooms 1 mo later during tran- sect T74.
been the iron source, and found that iron concen- trations decreased eastwards as biogenic particles settled out of the surface waters.
Several factors are pertinent to the bloom's genera- tion and subsequent demise. The geostrophic flows and T/S measurements reported by Trathan et al. (unpubl.) indicated that 3 water regimes met in the vicinity of the bloom around Stn 6 during transect T02, which presents the site with several possible import mechanisms. Firstly, the area could be seeded from South Georgia as speculated by Fryxell et al. (1979). Secondly, the North Scotia Ridge -400 km to the west of the position of the present study's Stn 6 could be a potential iron source to the PF jet in the ACC. Thirdly, there may have been a link between the PF and the larger southern bloom observed on transect T02.
Although nitrate concentrations were noticeably lower at Stn 6 during transect T02, overall nitrate and phosphate levels were high. However, silicate concen- trations were particularly low at the PF during transect TO2 and may have been a controlling factor for diatom dominated phytoplankton growth.
The Polar Front bloom The southern bloom
Increased phytoplankton biomass at fronts may be due to physical accumulation of particulate matter in areas of convergence (e.g. Franks 1992). or to en- hanced productivity due to more favourable conditions associated with the front (Allanson et al. 1981, Laub- scher e t al. 1986, 1993). We are unable to determine which mechanisnl was responsible for the PF bloom as production rates were not measured during the pre- sent study. However, the low phaeopigment concen- trations (0.24 mg m-3, 1 3 % of the TPP), and the co- incidence of high chl a concentrations with distinctly depleted nutrient levels, suggest active growth.
Laubscher et al. (1993) reported a close association between chlorophyll and silicate concentrations in the vicinity of the PF, and that the main controlling factor of phytoplankton growth appeared to be the spatial covariance between silicate levels and water column stability. They commented that of all the macro- nutrients only silicate may be present at limiting con- centrations north of the PF, and that productivity may be favoured at the southern edge of the PF where higher concentrations are available. De Baar et al. (1995) measured chlorophyll and iron concentrations along a transect which crossed the PF a t -6' W, some 2500 km to the east of the JR06 transects. They reported a sharp delineation between plankton- and iron-rich PF waters and adjacent plankton- and iron- poor ACC waters. They proposed that sediments from the Northeastern Georgia Ridge (which the ACC passes over 1900 km west of their transect) may have
Along transect T02, elevated chlorophyll concen- trations were generally coincident with depleted nitrate and silicate levels. During transect T74, chloro- phyll distribution was more uniform and, apart from the most southerly station, concentrations were lower and more typical of the open ocean (cf. Treguer &
Jacques 1992). Yet, although the nutrient distribution was also more uniform, concentrations remained siml- lar to the earlier transect. Here, we speculate on the dynamics of the bloom observed on transect TO2 and on its possible fate. Since we only have 2 observations of the area, separated by 1 mo, we have no concrete evldence for the time course of phytoplankton dynam- ics in the region. In particular, we cannot assume continuity of water type between the corresponding portions of the 2 transects. However, we can perform simple budget calculations based on different possible water mass origins, and their associated nutrient signa- tures, and use these calculations to assess a range of phytoplankton bloom sizes and fates.
Although we have information on chlorophyll stand- ing stocks for the 2 transects and the corresponding nutrient fields, we lack definitive data on the starting concentrations (i.e. winter values) for the nutrients. Therefore, we will concentrate on 2 plausible scenar- ios, and their implications for phytoplankton dynamics in the 2 transect surveys. The first possibility, and the one which requires the least assumptions about the physical system, is that the southern bloom developed
194 Mar Ecol Prog Ser 140: 187-197, 1996
in Antarctic Zone (AAZ) water. This would suggest significant loss of phytoplankton not only between the first and second observations of the transect, but also prior to the first observation (transect T02) because AAZ winter nutrient concentrations are higher than those observed. The second possibility we examine here is the advection across the Polar Front of water with lower nutrient loading. To model this, we have taken winter concentrations calculated by using a nutrient budget calculated from transect TO2 observa- tions, and applied this to transect T74.
A bloom in AAZ surface water
We have calculated nutrient and chlorophyll budgets for the upper 50 m of the water column. Starting condi- tions have been assumed to be typical winter AAZ con- centrations for the vicinity of South Georgia. We have taken 2 approaches, which yield very similar results (Table 2). In the first, we have used the 100 m concen- trations from the current study's stations as indications of winter mixed-layer concentrations. Water at t h s depth is within the mixed layer in winter, but beneath the sum- mer pycnocline as is indicated by the presence of a tem- perature minimum (T,,,; see Fig. 2). As a second, and independent, predictor of winter AAZ concentrations, we have taken averaged winter values from 11 stations sampled during winter in the same region as the present transect (see Whitehouse et al. 1993, in press).
In this scenario we have assumed a common origin for the water at Stns 9 to 12 in the 2 transect surveys,
and have calculated nutrient and chlorophyll budgets based on average AAZ properties. This does not sug- gest that there was physical continuity between the two, but simply that they shared the same starting con- ditions.
The silicate deficits were consistent for both calcu- lation methods. For transect TO2 the silicate deficit implied an average chlorophyll production of 1092 mg m-' which is much higher than the observed biomass of 415 mg m-' in the bloom. Similarly for transect T74, the silicate deficit implied a chlorophyll production of 1105 mg m-2 as opposed to the observed value of 130 mg m-2.
The nitrate and phosphate calculations were more variable. Nitrate deficits were considerably lower than those of silicate and phosphate implying that nitrate was not the sole source of nitrogen (f-ratio 1.0) for phytoplankton growth. For transect TO2 an f-ratio of 0.69 (0.59 to 0.78) and for transect T74 a lower f -ratio of 0.55 (0.46 to 0.63) would produce a similar deficit to that of silicate. Because of the uncertainty of the contri- bution of alternative nitrogen sources to phytoplank- ton growth and the unknown degree of remineralisa- tion of both nitrate and phosphate, silicate-implied production was considered the most reliable.
The growth of a phytoplankton population giving rise to a bloom can be modelled by:
where B, and B,, are the biomass at time f and at the start of the bloom respectively (the latter calculated from the average chlorophyll value measured in this
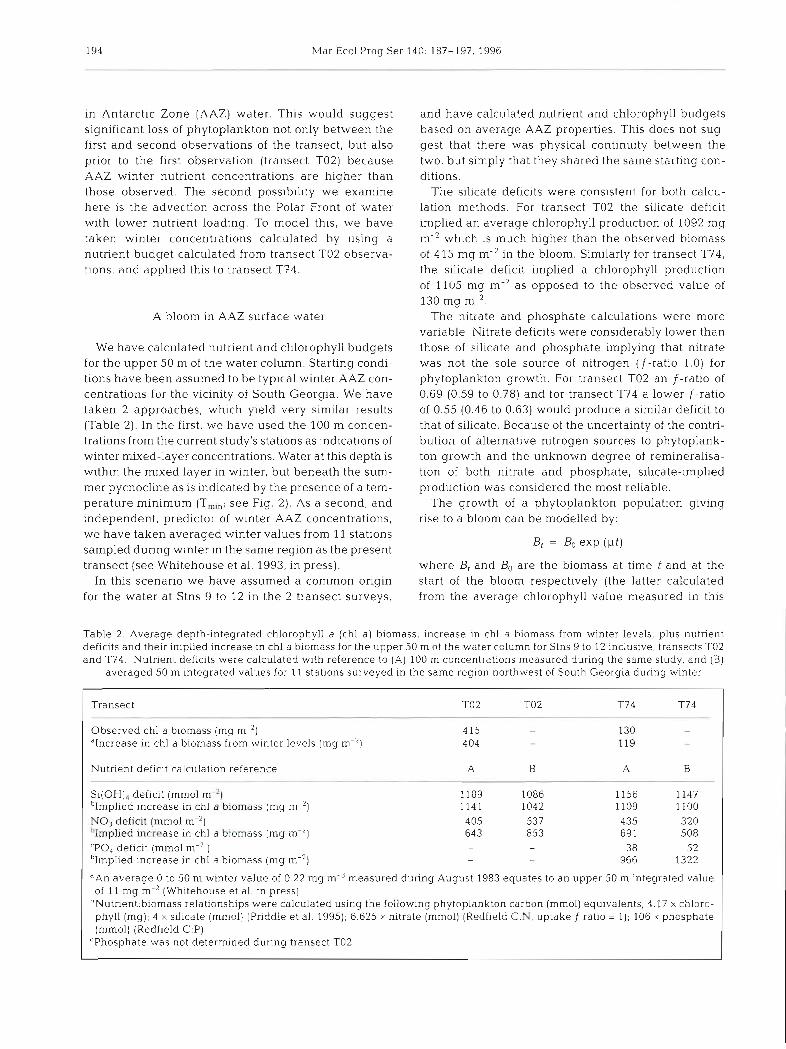
Table 2. Average depth-integrated chlorophyll a (chl a ) biomass, increase in chl a biomass from winter levels, plus nutrient def~cits and their implied increase in chl a biomass for the upper 50 m of the water column for Stns 9 to 12 ~nclusive, transects TO2 and T74. Nutrient deficits were calculated with reference to (A) 100 m concentrations measured during the same study, and (B)
averaged 50 m integratecl values for 11 stat~ons surveyed In the same region northwest of South Georgia dur~ng winter
Transect TO2 TO2 T74 T74
Observed chl a blomass (mg m-') 4 15 - 130 -
"Increase in chl a biomass from winter levels (mg m-') 404 - 119 -
Nutrient deficit calculation reference A B A B
Si(OH), deficit (mm01 m-') 1189 1086 1156 1147 'Implied increase in chl a biomass (mg m-') 1141 1042 1109 1100 NO3 deficit (mm01 m-2) 405 537 435 320 hlmplied increase in chl a biomass (mg m-2) 643 853 69 1 508 'PO, deficit (mm01 m-2 ) - - 38 52 'Implied increase in chl a biomass (mg m-2) - - 966 1322
"An average 0 to 50 m winter value of 0.22 mg m-3 measured during August 1983 equates to an upper 50 m integrated value of 11 mg m-' (Whitehouse et al. in press)
"Nutrient:biomass relationships were calculated using the following phytoplankton carbon (mmoI) equivalents; 4.17 X chloro- phyll (mg); 4 X silicate (mmol) (Priddle et al. 1995); 6.625 X nitrate (mmol) (Redfield C:N, uptake f ratio = 1); 106 X phosphate (mmol) (Redfield C:P)
'Phosphate was not determined during transect TO2
Whitehouse et a1 . Open-ocean phytoplankton blooms in the South Atlantic
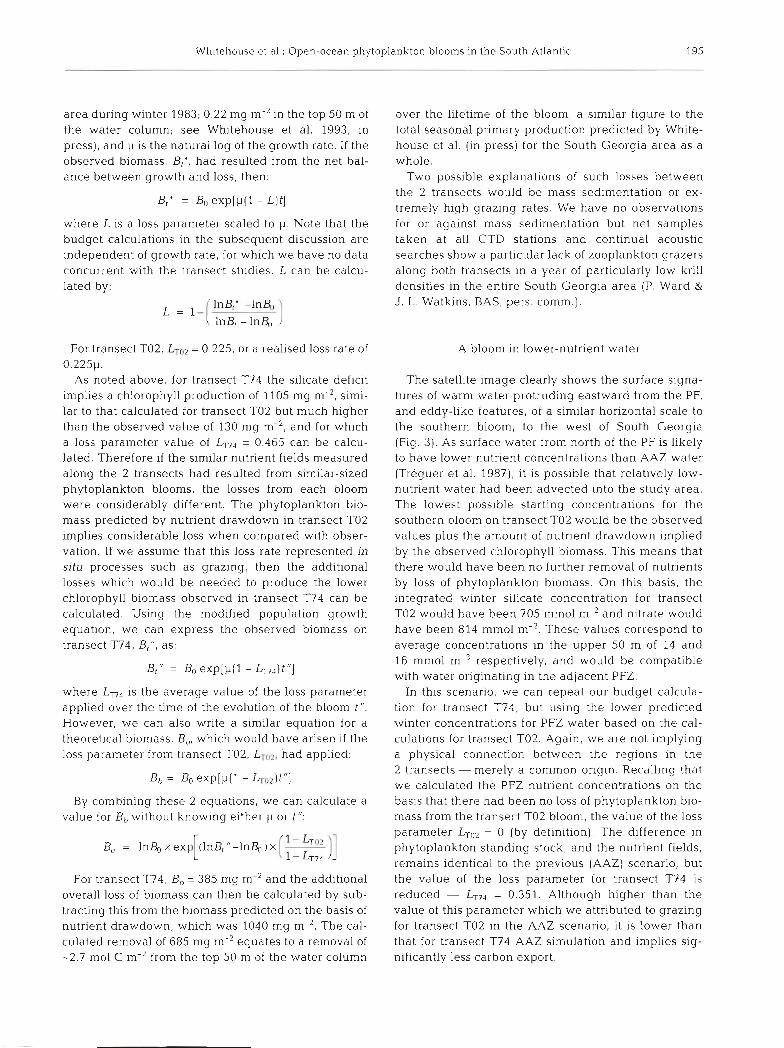
area during winter 1983; 0.22 mg m-' in the top 50 m of the water column; see Whitehouse et al. 1993, in press), and p is the natural log of the growth rate. If the observed biomass, B,', had resulted from the net bal- ance between growth and loss, then:
B,' = B. exp[p( l - L)t]
where L is a loss parameter scaled to p. Note that the budget calculations in the subsequent discussion are independent of growth rate, for which we have no data concurrent with the transect studies. L can be calcu- lated by:
For transect T02, LTo2 = 0.225, or a realised loss rate of 0 . 2 2 5 ~ .
As noted above, for transect T74 the silicate deficit implies a chlorophyll production of 1105 mg m-', simi- lar to that calculated for transect TO2 but much higher than the observed value of 130 mg m-', and for which a loss parameter value of Ln4 = 0.465 can be calcu- lated. Therefore if the similar nutrient fields measured along the 2 transects had resulted from similar-sized phytoplankton blooms, the losses from each bloom were considerably different. The phytoplankton bio- mass predicted by nutrient drawdown in transect TO2 implies considerable loss when compared with obser- vation. If we assume that this loss rate represented in situ processes such as grazing, then the additional losses which would be needed to produce the lower chlorophyll biomass observed in transect T74 can be calculated. Using the modified population growth equation, we can express the observed biomass on transect T74, B,", as:
R," = B. exp[p( l - L,,,)t"]
where Ln4 is the average value of the loss parameter applied over the time of the evolution of the bloom t ". However, we can also write a similar equation for a theoretical biomass, B,,, which would have arisen if the loss parameter from transect T02, had applied:
By combining these 2 equations, we can calculate a value for Bb without knowing either p or t":
For transect T74, B, = 385 mg mA2 and the additional overall loss of biomass can then be calculated by sub- tracting this from the biomass predicted on the basis of nutrient drawdown, which was 1040 mg m-2. The cal- culated removal of 685 mg m-2 equates to a removal of -2.7 m01 C m-' from the top 50 m of the water column
over the lifetime of the bloom, a similar figure to the total seasonal primary production predicted by White- house et al. (in press) for the South Georgia area as a whole.
Two possible explanations of such losses between the 2 transects would be mass sedimentation or ex- tremely high grazing rates. We have no observations for or against mass sedimentation but net samples taken at all CTD stations and continual acoustic searches show a particular lack of zooplankton grazers along both transects in a year of particularly low krill densities in the entire South Georgia area (P. Ward & J. L. Watkins, BAS, pers. comm.).
A bloom in lower-nutrient w a t e ~
The satellite image clearly shows the surface signa- tures of warm water protruding eastward from the PF, and eddy-like features, of a similar horizontal scale to the southern bloom, to the west of South Georgia (Fig. 3). As surface water from north of the PF is likely to have lower nutrient concentrations than AAZ water (Treguer et al. 1987), it is possible that relatively low- nutrient water had been advected into the study area. The lowest possible starting concentrations for the southern bloom on transect TO2 would be the observed values plus the amount of nutrient drawdown implied by the observed chlorophyll biomass. This means that there would have been no further removal of nutrients by loss of phytoplankton biomass. O n this basis, the integrated winter silicate concentration for transect TO2 would have been 705 mm01 m-2 and nitrate would have been 814 mm01 m-'. These values correspond to average concentrations in the upper 50 m of 14 and 16 mm01 m-"espectively, and would be compatible with water originating in the adjacent PFZ.
In this scenario, w e can repeat our budget calcula- tion for transect T74, but using the lower predicted winter concentrations for PFZ water based on the cal- culations for transect T02. Again, we are not implying a physical connection between the regions in the 2 transects - merely a common origin. Recalling that we calculated the PFZ nutrient concentrations on the basis that there had been no loss of phytoplankton bio- mass from the transect TO2 bloom, the value of the loss parameter LTO2 = 0 (by definition). The difference in phytoplankton standing stock, and the nutrient fields, remains identical to the previous (AAZ) scenario, but the value of the loss parameter for transect T74 is reduced - = 0.351. Although higher than the value of this parameter which we attributed to grazing for transect TO2 in the AAZ scenario, it is lower than that for transect T74 AAZ simulation and implies sig- nificantly less carbon export.
196 Mar Ecol Prog Ser 140: 187-197, 1996
CONCLUSION
We have described nutrient and chlorophyll fields for 2 surveys of the same oceanographic transect, sep- arated by 1 mo. In the case of the first run, transect T02, there was a phytoplankton bloom associated with the Polar Front and an even stronger and more extensive
bloom further to the south. Associated with each were deficits in the surface water nutrient fields which appeared to be linked to drawdown arising from phytoplankton growth. On the second run along the transect (T74), nutrient fields were simildr to those encountered 1 mo earlier, but chlorophyll biomass was lower. In discussing these data, we have examined the implications for the fate of phytoplankton carbon. We have concentrated on the southern bloom because it was a larger and more coherent feature and one for which we could supply more background data.
In carrying out simulations of the dynamics ot the southern bloom, we have put forward 2 interpretations for the observations of nutrient and chlorophyll fields. At one extreme, and the one which requires the least assumptions about the physical system, we have the possibility that the southern bloom observed on tran- sect TO2 occurred within the AAZ, and that contlnulty with the same region on transect T74 implies a signifi- cant removal of phytoplankton carbon which cannot be explained by the likely grazing pressure. Alter- natively, eddy-shedding by the ACC is a common fea- ture where it crosses prominent bottom topography (Gordon et al. 1977, Lutjeharms & Baker 1980, Bryden 1983, Nowlin & Klinck 1986), and the advection of lower-nutrient water into the study area might imply lower or negligible carbon export.
Possible physical mechanisms exist for all scenarios, but the data available to us from the 2 hydrographic sections and from scarce contemporary satellite imagery do not allow us to identify the mechanisms responsible for generating and maintaining the blooms. However, it seems that our observations of high biomass and evidence for actlve growth (rather than simply of biomass accumulat~on) imply that such blooms may be Important features of the region between South Georgia and the PF. Furthermore, they may be significant, albeit local, regions of carbon export.
Acknowledgements. We thank scientists, officers and crew aboard the RRS 'James Clark Ross' dunng cruise JR06 for their assistance with data collection. Pete Ward and Jon Watkins for providing zooplankton data, Tom Lachlan-Cope. Russell Ladkin and Richard Siddans for help with preparing the AVHRR image, and Francis Daunt for his assistance with the compilation of Fig. 1. We are also grateful to Eugene Mur- phy and 4 anonymous referees for their constructive com- ments on the manuscript.
LITERATURE CITED
Allanson BR, Hart RC, Lutjeharms JRE (1981) Observations on the nutrients, chlorophyll and primary production of the Southern Ocean south of Africa. S Afr J Ant Res 10/11 3-13
Boden BP (1988) Observations of the Island Mass Effect In the Pnnce Edward Archipelago. Polar Biol 9 61-68
Boyd PW, Robinson C , Savidge G. Williams PJ leB (1995) Water column and sea-ice primary production during aus- tral spring in the Bellingshausen Sea. Deep Sea Res 11 33: 1177-1200
Bryden HL (1983) The Southern Ocean. In: Robinson AR ( ~ d ) Eddes in marine science. Springer-Verlag, Berlin, p 265-277
Bury SJ, Owens NJP, Preston T (1995) '" and uptake by phytoplankton in the marginal ice zone of the Belllngs- hausen Sea. Deep Sea Res 11 33:1225-1252
Cota GT, Smith WO Jr, Nelson DM, Muench RO, Gordon L1 (1992) Nutrient and biogenic particulate distributions, pri- mary productivity and nitrogen uptake in the Weddell- Scotia Sea marginal ice zone during winter J Mar Res 50. 155-181
De Baar HJW, De Jong JTM, Bakker DCE, Loscher BM, Veth C, Bathmann U, Smetacek V (1995) Importance of iron for plankton blooms and carbon dioxide drawdown in the Southern Ocean. Nature 373:412-415
El-Sayed SZ, Weber LH (1982) Spatial and temporal varia- tions in phytoplankton biomass and primary production in the southwest Atlantic and Scotia Seas. Polar Biol 1:83-90
Franks PJS (1992) Sink or swim: accumulation of biomass at fronts. Mar Ecol Prog Ser 82:l-12
Fryxell GA, Villareal TA. Hoban MA (1979) Thalassiosira sco- tia, sp. nov.: observations on a phytoplankton increase in early austral spring north of the Scotia Ridge. J Plankton Res 1.355-370
Glibert PM, Biggs DC, h4cCarthy JJ (1982) Utilization of ammonlum and nitrate during the austral summer in the Scotia Sea. Deep Sea Res 29:837-850
Gordon AL. Georgi DT, Taylor HW (1977) Antarctic polar front zone in the western Scotia Sea, summer 1975. J Phys Oceanogr 7:309-328
Hardy AC (1967) Great waters. Collins, London Hardy ,\C, Gunther ER (1935) The plankton of the South
Georgia whaling grounds and adjacent waters, 1926- 1927. Discovery Rep 11:l-456
Heywood RB, Priddle J (1987) Retention of phytoplankton by an eddy. Cont Shelf Res 7:937-955
Holm-Hansen 0, Mitchell BG (1991) Spatial and temporal distribution of phytoplankton and primary production in the western Bransfield Strait region. Deep Sea Res 38: 961-980
Jacques G (1989) Primary production in the open Antarctic Ocean during the austral summer A review. Vie Milieu 39:l-17
Jacques G, Panouse M (1991) Biomass and composition of size fractionated phytoplankton In the Weddell-Scotia Conflu- ence area. Polar Biol 11 315-328
Laubscher JRE, Allanson BR, Parker L (1986) Frontal zones, chlorophyll and primary production patterns in the sur- face waters of the Southern Ocean south of Cape Town. In: Nihoul JCJ (ed) Marine interfaces ecohydrodynamics. Elsevier Oceanography Series, Amsterdam, p 105-117
Laubscher RK, Perissinotto R, McQuaid CD (1993) Phyto- plankton production and biomass at frontal zones in the Atlant~c sector of the Southern Ocean. Polar Biol 13: 471-481
Whitehouse e t al.: Open-ocean phytoplankton blooms in the South Atlantic 197
Lutjeharms JRE, Baker D J r (1980) A statistical analysis of the meso-scale dynamics of the Southern Ocean. Deep Sea Res 2?:145-159
Lutjeharms JRE, Walters NM, Allanson BR (1985) Oceanic frontal systems and biological enhancement. In: Siegfried WR, Condy PR, Laws RM (eds) Antarctic nutrient cycles and food webs. Springer-Verlag, Berlin, p 11-21
Nelson DM, Smith WO Jr, Gordon LI, Huber BA (1987) Spring distributions of density, nutrients, and phytoplankton bio- mass in the ice edge zone of the Weddell-Scotia Sea. J Geophys Res 92:718l-7190
Nelson DM, Smith WO Jr, Muench RD, Gordon LI, Sullivan CW, Husby DM (1989) Particulate matter and nutrient dis- tributions in the ice-edge zone of the Weddell Sea: rela- tionship to hydrography during late summer. Deep Sea Res 36:191-209
Nowlin WD Jr, Klinck J M (1986) The physics of the Antarctic Circumpolar Current. Rev Geophys 24:469-491
Orsi AH, Whitworth T 111, Nowhn WD Jr (1995) On the merid- ional extent and fronts of the Antarctic Circumpolar Cur- rent. Deep Sea Res 42:641-673
Parsons TR, Maita Y , Lalli CM (1984) A manual of chemical and biological methods for seawater analysis. Pergamon Press, Oxford
Perissinotto R, Laubscher RK, McQuaid CD (1992) Marine productivity enhancement around Bouvet and the South Sandwich Islands (Southern Ocean). Mar Ecol Prog Ser 88 41-53
Peterson RG, Whitworth T 111 (1989) The Subantarctic and Polar Fronts in relation to deep water masses through the southwestern Atlantic. J Geophys Res 95:10817-10838
Priddle J , Heywood RB, Thenot E (1986) Some environmental factors influencing phytoplankton in the Southern Ocean around South Georgia. Polar Biol5:65-79
Priddle J , Leaky R, Symon C , Whitehouse M, Robins D, Cripps G , Murphy E, Owens N (1995) Nutrient cycling by Antarctic marine microbial plankton. Mar Ecol Prog Ser 116:181-198
Ronner U, Sorensson F, Holm-Hansen 0 (1983) Nitrogen assimilation by phytoplankton in the Scotia Sea. Polar Biol 2:137-147
This article was submitted to the editor
Savidge G, Harbour D, Gilpin LC, Boyd PW (1995) Phyto- plankton distribution and production in the Bellings- hausen Sea, austral spring 1992. Deep Sea Res 11 33: 1201-1224
Sievers HA, Nowlin WD Jr (1988) Upper ocean characteristics in Drake Passage and adjoining areas of the Southern Ocean, 3g0W-95'W. In: Sahrhage D (ed) Antarctic Ocean and resources variability. Springer-Verlag, Berlin, p 57-80
Smith WO, Nelson DM (1985) Phytoplankton bloom produced by a receding ice-edge in the Ross Sea: spatial coherence with the density field. Science 227.163-166
Treguer P, Appriou P, Bordin G, Cuet P, Le Jehan S, Souchu P (1987) Caracteristiques physiques e t chimiques des masses d'eaux du secteur indien de l'ocean austral au sud du Front Polaire (Mer d'Amery) (Campagne Apsara I1 - Antiprod 111, 1984). In: Fontugne IM, Fiala M (eds) Car- acteristiques biologiques, chirniques e t sedimentolo- giques du secteur indien de l'ocean austral (Plateau de Kerguelen). Rapport du Campagne de la Mer, TAAF 84-01, Torres Australes et Antarctiques Franqaise, Paris, p 54-74
Treguer P, Jacques G (1992) Dynamics of nutrients and phyto- plankton, and fluxes of carbon nitrogen and silicon in the Antarctic Ocean. Polar Biol 12:149-162
Whitehouse MJ, Priddle J , Syrnon C (in press) Seasonal and annual change in seawater temperature, salinity, nutrient and chlorophyll a distribution around South Georgia, South Atlantic. Deep Sea Res
Whitehouse MJ, Priddle J , Woodward EMS (1995) Spatial variability of inorganic nutrients in the marginal ice zone of the Bellingshausen Sea during the austral spring Deep Sea Res I1 33:1047-1058
Whitehouse MJ, Syrnon C , Priddle J (1993) Variations in the distribution of chlorophyll a and inorganic nutrients around South Georgia, South Atlantic. Antarct Sci 5: 367-376
Whitehouse MJ, Woodley VR (1987) Automated seawater nutrient analysis. British Antarctic Survey, Cambridge
Wilkinson L, Hdl MA, Welna JP, Birkenbeuel GK (1992) SYSTAT for Windows: Version 5 edn. SYSTAT, Inc., Evanston, IL
Manuscript first received: January 3, 1996 Revised version accepted: May 17, 1996
Related Documents