BOTSWANA ENVIRONMENT STATISTICS WATER & CLIMATE DIGEST 2015

Welcome message from author
This document is posted to help you gain knowledge. Please leave a comment to let me know what you think about it! Share it to your friends and learn new things together.
Transcript
Copyrights C Statistics Botswana 2015
Statistics Botswana. Private Bag 0024 BotswanaTel: (267) 367 1300. Fax: (267) 395 2201. Email: [email protected] Website: www.cso.gov.bw
Statistics Botswana. Private Bag 0024 BotswanaTel: (267) 367 1300. Fax: (267) 395 2201. Email: [email protected] Website: www.cso.gov.bw
BOTSWANA ENVIRONMENT STATISTICSWATER & CLIMATE DIGEST 2015
BOTSWANA ENVIRONMENT STATISTICS: WATER & CLIMATE DIGEST 2015
Published by
Statistics BotswanaPrivate Bag 0024, Gaborone
Phone: 3671300Email: [email protected]
Contact Unit: Environment Statistics Unit
Phone: 3671395
Copyright Reserved © 2015
Extracts may be published ifSources are duly acknowledged
ISBN: 978-99968-464-2-7
4 BOTSWANA ENVIRONMENT STATISTICS: WATER & CLIMATE DIGEST 2015 Statistics Botswana Statistics Botswana BOTSWANA ENVIRONMENT STATISTICS: WATER & CLIMATE DIGEST 2015 5
PREFACE
This is the first bi-annual edition of the Botswana Environment Statistics: Water and Climate Digest. The purpose of the Digest is to provide data for use by decision-makers in water management as well as for monitoring trends related to climate.
The indicators in this report cover data on dam levels, dam abstractions, water production, rainfall and temperature. The dam abstraction is a newly introduced indicator. Indicators will continue to be gradually expanded in subsequent editions as more data become available.
In compiling this report, international standards and guidelines were followed, particularly the United Nations Framework for the Development of Environment Statistics (UNFDES) and the United Nations International Recommendations for Water Statistics. Eventually, the data collected through these methodologies will feed into the UN System of Environmental Economic Accounting (SEEA) for water and hence facilitate an informed management of water resources. The sustained production of the Water and Climate Digest would depend on the cooperation of relevant data providers to provide the necessary data. I therefore would like to extend my gratitude and appreciation to all stakeholders who assisted in the production of this digest, in particular the Water Utilities Corporation, the Department of Water Affairs and the Department of Meteorological Services for availing the water and climate data as required.
For more information and further enquiries, contact the Directorate of Stakeholder Relations at 3671300. All Statistics Botswana outputs/publications are available on the website at www.cso.gov.bw and at the Statistics Botswana Library (Head-Office, Gaborone).
-------------------------------- Dabilani ButhaliActing Statistician GeneralDecember 2015
Contents
1. WATER.....................................................................................................................................................................................71.1. Dam Levels............................................................................................................................................................................71.2. Abstractions............................................................................................................................................................................91.3. Water production.................................................................................................................................................................10 1.3.1. Water production by settlements.................................................................................................................................11 1.3.2. Water production by Management Centers (MCs)..................................................................................................13
2. CLIMATE................................................................................................................................................................................162.1. Rainfall..................................................................................................................................................................................162.2. Temperature.........................................................................................................................................................................202.2.1 Mean monthly Minimum temperatures............................................................................................................................212.2.2 Mean monthly maximum temperatures..........................................................................................................................21
REFERENCES......................................................................................................................................................................................22
List of Tables
Table 1.1: Dam Capacities..................................................................................................................................................................7Table 1.2: Percentage dam levels in 2014-15.........................................................................................................................................7Table 1.3: Monthly abstractions from selected dams (kilolitres)...............................................................................................................9Table 1:4: List of water management centres (MCs).....................................................................................................................10Table 1:5: Six months water production for selected settlements (2014).............................................................................................11Table 1.6: Southern water production by management centres (kilolitres)...............................................................................13Table 1.7: Northern water production by management centres (kilolitres)................................................................................14Table 1.8: Total production (kilolitres)...................................................................................................................................,,..........15Table 2:1: List of synoptic stations used...........................................................................................................................................16Table 2:2: List of rainfall stations used...............................................................................................................................................16Table 2.3: Monthly total rainfall (millimetres)...................................................................................................................................17Table 2.4: Total annual rainfall (mm) by rainfall stations 2012/13 to 2014/15..............................................................................19Table 2.5: Mean monthly minimum temperatures (oC) October to March 2014/15)...................................................................20Table 2.6: 2013/14 and 2014/15 October to March mean monthly minimum temperatures averaged ...............................20Table 2.7: Mean monthly maximum temperatures (oC) October to March 2014/15)...................................................................21Table 2.8: 2013/14 and 2014/15 October to March mean monthly maximum temperatures averaged ...............................21
List of Figures
Figure 1.1: Percentage change in dam capacities (October 2014 to April 2015)......................................................................8Figure 1.4: Six months average water production by settlements (April to September 2014....................................................11Figure 1.5: Water production for cities and towns (2013 and 2014).................................................................................................12
6 BOTSWANA ENVIRONMENT STATISTICS: WATER & CLIMATE DIGEST 2015 Statistics Botswana Statistics Botswana BOTSWANA ENVIRONMENT STATISTICS: WATER & CLIMATE DIGEST 2015 7
EXECUTIVE SUMMARY
Botswana is a semi-arid country with erratic rainfall and limited surface water resources. “The country’s proximity to the subtropical high-pressure belt of the southern hemisphere accounts for its largely arid or semi-arid climatic regime.” (Sta-tistics Botswana: 2005). The aridity of the country and the scarcity of water resources necessitate prudent management of the resource. This in turn necessitates conscientious monitoring of water resource availability and use.
This report looks at water and climate statistics, based on the indicators of dam levels, water abstraction and production, rainfall, and temperatures. Dam Levels
Botswana has nine dams from which surface water is sourced. Over the period reviewed, October 2014 to March 2015, three of the dams gained in levels, while six (6) had falling levels. All dams generally had lower levels in 2014/15 than in the previous year, 2013/14.
Water Abstraction
Water abstraction is the removal of water from any source for treatment to produce drinking water, however water may also be removed for direct use (eg irrigation) without any treatment. In this report discussion is on removal of water from dams.
Water abstraction was highest from Gaborone, Shashe and Bokaa dams. Gaborone dam’s water abstraction fell gradu-ally over the months, as the dam level also fell. The October 2014 to March 2015 water abstraction from Gaborone dam was close to half the abstraction for the same period in 2013/14. Bokaa dam had varied abstraction, while Shashe dam had a generally more stable abstraction trend. Lotsane dam abstractions are increasing.
Water Production
Water production constitutes treatment of water to produce drinking water for distribution to users. The densely populated Gaborone management centre (MC) continues to have the highest water production. Southern MCs have higher water production than the northern MCs. Southern MCs used less water between April and September in 2014 than in 2013, while northern MCs used more.
Rainfall
There are various rainfall stations around the country. Twenty-seven (27) stations are examined in this report, with only those with full monthly data for 2014/15 used for total annual rainfall. They are Francistown, Gaborone, Mahalapye, Shak-awe, Rakops, Pandamatenga, Sowa Town, Lephephe, Goodhope, Lerala, Oliphant’s Drift and Tshane meteorological stations, Ghanzi, Maun and Tsabong, and Sir Seretse Khama airports, and Mochudi, Molepolole, and police stations.
More total rainfall was recorded in 2013/14 than in 2014/15. The highest total rainfall recorded between October 2014 and March 2015 is that of Francistown, at 360.1 mm.
Temperatures
Data used for temperature in this report is of 8 stations across the country. The lowest mean monthly minimum temperature recorded between October 2014 and March 2015 was 11.9 oC recorded at Tsabong in October 2014, while the highest mean monthly maximum temperature for the same period was 36.1 oC recorded at Shakawe in October 2014. Looking at the period reviewed it shows that 2014/15 had cooler minimum temperatures than 2013/14 in most of the stations. All the stations recorded warmer maximum temperatures in 2014/15 than in the previous year 2013/14, between October 2014 and March 2015.
1. WATER
1.1. Dam Levels
Botswana has nine dams from which surface water is sourced. They are the Gaborone, Nnywane, Bokaa, Letsibogo, Shashe, Ntimbale, Thune, Lotsane and the Dikgatlhong dams. Botswana also imports water from Molatedi dam in the Republic of South Africa
Table 1.1: Dam CapacitiesDam Capacity (Mm3)
Gaborone Dam 141.4
Bokaa Dam 18.5
Letsibogo 100
Nnywane 2.3
Shashe 85
Ntimbale 26.6
Lotsane 40
Thune 90
Dikgatlhong 400
Molatedi (Republic of South Africa) 201
Source: Statistics BotswanaNote: Molatedi dam is in South Africa and provides imported water to Botswana
The dam capacities are indicated above in Table 1.1. Dikgatlhong dam is the country’s largest dam by capacity at 400 million cubic metres (Mm3) while Nnywane is the smallest at 2.3 million cubic meters.
Dam levels are determined by rainfall in the catchment areas as well as inflows and outflows of water into and out of the dams. Evaporation rates are also a determinant of the dam levels.
The wet season is from October to March in Botswana. This report looks at dam level trends between October 2014 and June 2015.
Table 1.2: Percentage dam levels in 2014-15
Dam Gaborone Nnywane Bokaa Letsibogo Shashe Ntimbale Thune Lotsane Dikgatlhong Molatedi
2014 17th February 13.2 74.7 38.5 100.9 98.3 100 41.6 99.1 101 20.2
14th March 16 - 57 103.7 103.4 102 55.5 108.3 106.5 26
14th April 15.1 73 56.2 97.7 97.3 98.4 55.7 96.4 98.9 35.3
16th May 13.7 67.6 50.2 93.6 94.3 97.5 58.7 94.2 98.3 34.6
15th July 11.3 54.6 41.8 86.6 87.9 94.1 58.7 84.5 95.6 31
29th August 9.8 54.1 36.3 77.5 83.4 90.5 52 82.9 95.4 28.4
23rd September 8.5 51.1 30.5 78.7 80.6 88.7 51.2 80.7 92.3 26.8
8th October 7.5 47.0 27.3 75.9 78.9 87.3 49.9 77.5 91.2 24.7
14th November 6.1 40.2 22.0 72.3 75.1 84.1 48.1 75.2 88.2 21.7
15th December 5.2 92.1 19.7 70.7 71.5 84.1 48.1 71.7 87.1 20.8
2015 *January 4.7 93.2 20.5 69.9 83.7 89.6 47.7 73.4 88.0 18.0
17th February 4.2 94.2 21.2 69 95.8 95 47.2 75 88.8 15.2
9th March 3.4 88.4 18.4 65.2 93.9 92 46.8 72.2 87.4 15.2
15th April 2.7 85.6 15.5 58.3 92.6 97.9 45.5 70.0 85.6 13.4
15th June 1.7 73.3 8.2 53.1 95.1 93.9 43.1 64.8 82.5 11.5
Dash (-) = no data*January data interpolated using average of two nearest neighboursSource: Water Utilities Corporation publications
8 BOTSWANA ENVIRONMENT STATISTICS: WATER & CLIMATE DIGEST 2015 Statistics Botswana Statistics Botswana BOTSWANA ENVIRONMENT STATISTICS: WATER & CLIMATE DIGEST 2015 9
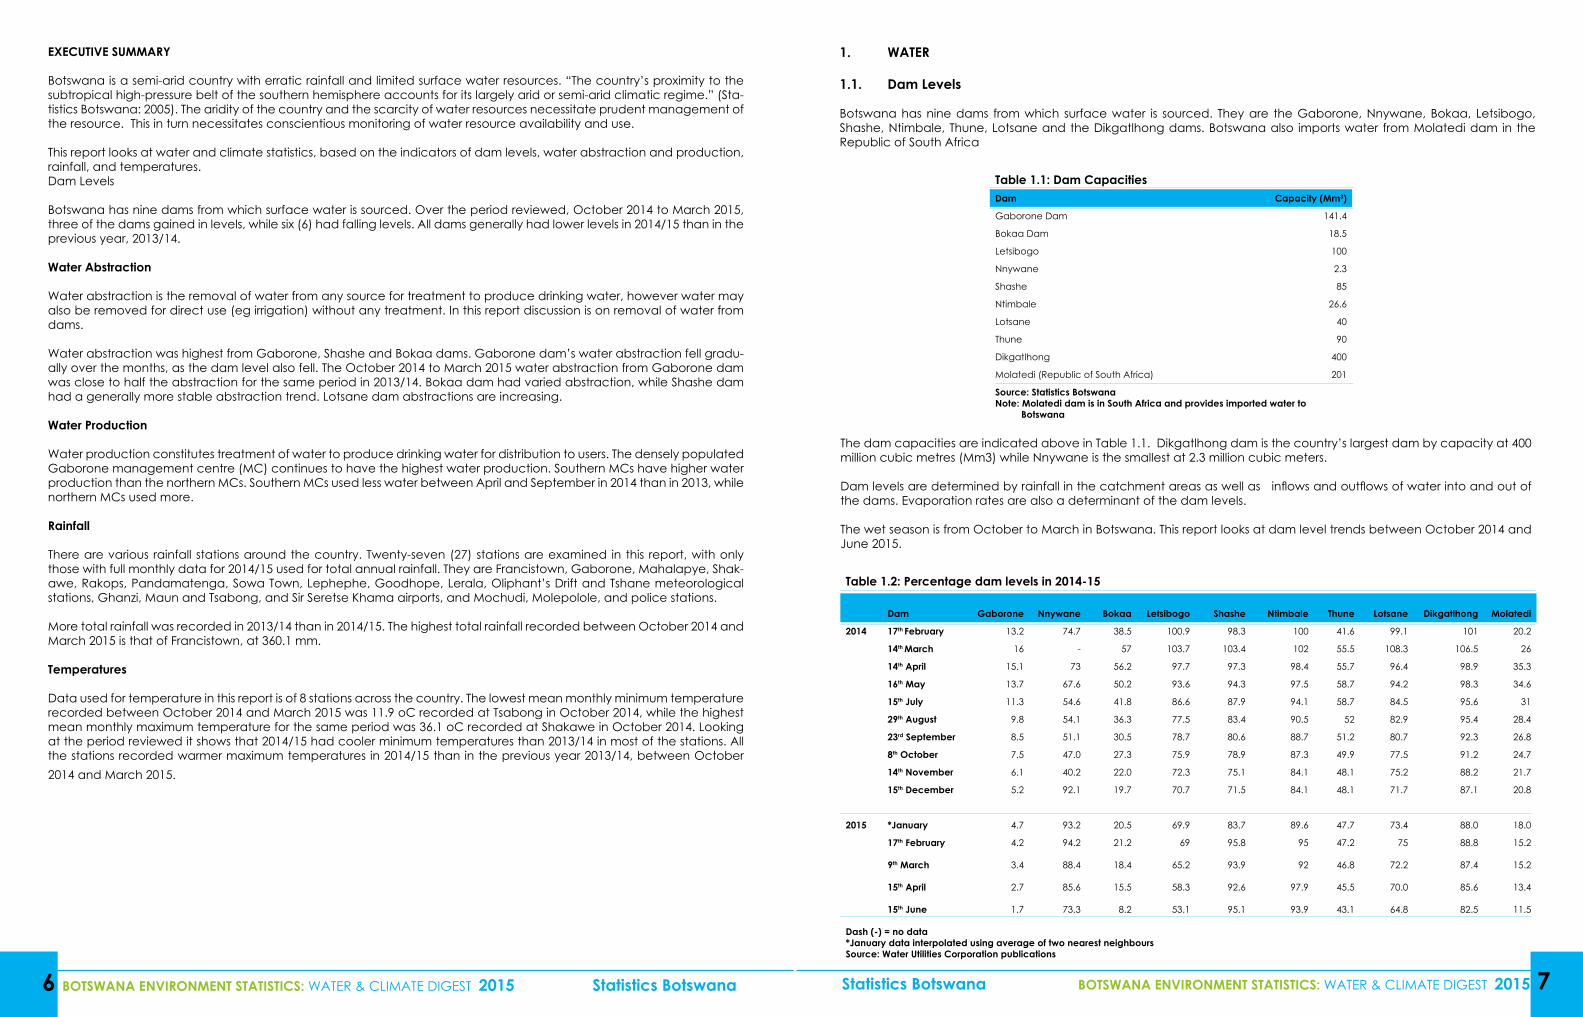
Over the period October 2014 to March 2015, Nnywane dam had 88 percent increase in its level, followed by Shashe dam at 19 percent and Ntimbale dam had 5 percent increase in its level. Gaborone dam had the highest percentage decrease, its level dropping by 54 percent, followed by Molatedi at 38 percent and Bokaa at 33 percent.
While there are slight rises in some of the dams as a result of rains and inflows, the general trend shows decline for most of the dams. Dikgatlhong dam has since commenced abstraction, hence the decline. Nnywane dam’s gains were mostly during the month of November 2014, while Shashe, Ntimbale and Lotsane dams made gains between December 2014 and February 2015. Nnywane dam’s relatively small capacity means it fills up faster and with less rainfall or inflows during the wet seasons, hence its steep percentage gains over a short period of time. Only Shashe and Ntimbale recorded a slight rise in levels after April 2015.
Table 1.2 above shows the percentage levels of dams from February 2014 to June 2015. Gaborone, Bokaa and Molatedi dam (South Africa) had continuously falling levels. Gaborone dam reached the failed status at 1.7 percent in June 2015.
Seven (7) out of the ten (10) dams display a falling trend in their levels during the wet season. Only three (3) of the dams, Nnywane, Shashe and Ntimbale had higher levels in March 2015 than in October 2014.
Figure 1.1 below shows the percentage change in the dam level between October 2014 and March 2015 for each of the dams.
Figure 1.1: Percentage change in dam levels (October 2014 to March 2015)
1.2. Abstractions
Table 1.3: Monthly abstractions from selected dams (kilolitres)
Year Month Lotsane Gaborone Ntimbale Nnywane Shashe Bokaa
2013/14
April - 2,596,227 252,278 - 1,218,720 289,546
May - 2,826,661 242,584 - 1,248,208 238,956
June - 2,568,316 239,466 - 767,341 247,985
July - 2,174,694 214,469 - 1,398,654 14,788
August - 2,378,188 193,170 - 1,083,368 184,866
September - 2,554,855 226,840 - 1,127,816 -
Total - 15,098,941 1,368,807 - 6,844,107 -
October 28,162 2,442,599 228,684 - 1,080,087 -
November 51,668 2,294,301 203,624 - 1,043,973 -
December 51,367 2,055,383 238,196 - 1,031,396 345,191
January 53,897 1,991,606 233,473 28,532 1,050,359 128,055
February 44,837 2,332,800 202,450 28,271 1,063,121 144,848
March 43,078 1,927,449 142,199 69,951 1,178,520 -
Total 273,009 13,044,138 1,248,626 - 6,447,456 -
2014/15
April 59,079 1,994,433 194,954 79,699 1,183,268 522,538
May 54,963 2,243,195 232,990 49,972 1,147,394 768,738
June 55,711 1,729,362 192,557 24,711 1,148,065 248,897
July 69,510 1,508,016 184,251 57,528 1,177,841 409,465
August 69,418 1,617,353 246,740 57,835 1,121,600 555,595
September 73,015 1,391,683 182,467 47,495 1,162,194 672,369
Total 381,696 10,484,042 1,233,959 317,240 6,940,362 3,177,602
October 85,167 1,454,040 176,043 67,699 1,245,337 526,914
November 78,144 1,357,362 246,666 48,312 1,205,012 95,994
December 70,673 904,981 202,126 30,117 1,146,691 55,745
January 72,010 1,521,468 254,048 65,451 1,259,308 245,935
February 67,030 870,051 224,640 68,143 1,173,501 -
March 83,492 657,612 226,620 78,607 1,257,803 -
Total 456,516 6,765,514 1,330,143 358,329 7,287,652 -
Table 1.3 shows monthly abstractions of water from selected dams. Gaborone dam had the highest abstractions during the 2013/14 and 2014/15 financial years, to satisfy demand of the high population concentrated in the Greater Gaborone area. However, Gaborone dam experienced declining abstraction due to lower availability of water in the dam, as supplementary water was sourced from the northern parts of the country through the North-South Carrier pipeline.
The Gaborone management centre also supplies the town of Lobatse. Bokaa dam had incremental abstraction between April and September 2014, probably to supplement supply to Gaborone management centre as Gaborone dam abstractions fell. Bokaa dam’s abstractions however later fell between September 2014 and January 2015, as the dam’s levels fell. Nnywane dam serves some of Gaborone management centre and has a low capacity compared to the rest, and thus has a varying abstraction.
Comparison of the six months total abstractions shows decreasing abstraction for Gaborone, where the October to March 2014/15 period shows abstraction that is close to half for the same period in 2013/14. Lotsane abstractions have increased considerably while Ntimbale and Shashe dam abstractions were more stable.
Factors that contribute to abstraction levels are dam levels or water availability, and the water needs of various management centres. Some reservoirs may have increased abstractions in order to supplement other management centres that may have had supply challenges.
10 BOTSWANA ENVIRONMENT STATISTICS: WATER & CLIMATE DIGEST 2015 Statistics Botswana Statistics Botswana BOTSWANA ENVIRONMENT STATISTICS: WATER & CLIMATE DIGEST 2015 11
1.3.1. Water production by settlements1.3. Water production
Potable water production is carried out through sixteen (16) management centres throughout the country by Water Utilities Corporation (WUC). The management centres treat and provide water sourced from both surface and groundwater.
Table 1.4: List of water management centres (MCs)Region Management Centre
Southern region 1 Gaborone
2 Molepolole
3 Lobatse
4 Mochudi
5 Kanye
6 Tsabong
7 Ghanzi
Northern region 8 Selibe Phikwe
9 Palapye
10 Serowe
11 Letlhakane
12 Mahalapye
13 Kasane
14 Masunga
15 Francistown
16 MaunThe WUC management centres in the country are shown in Table1.4 above.
Table 1.5: Six months water production for selected settlements (2014)April May June July August September Average
Gaborone 1,046,296 1,884,506 1,359,261 1,431,729 1,426,843 1,602,529 1,458,527
Francistown 905,940 954,071 859,154 878,874 890,118 919,174 901,222
Phikwe 449,957 541,375 372,026 413,654 477,532 462,568 452,852
Lobatse 345,512 380,177 359,168 392,007 428,493 384,796 381,692
Molepolole 277,045 291,983 321,182 353,632 354,124 347,826 324,299
Tlokweng 481,017 296,817 324,490 323,482 281,953 215,703 320,577
Kanye 282,165 240,530 318,360 315,150 321,412 306,399 297,336
Serowe 128,791 198,767 233,869 181,594 197,131 282,755 203,818
Mogoditshane 193,090 197,660 180,950 172,680 192,310 180,500 186,198
Jwaneng 173,030 194,639 153,696 167,795 189,194 220,061 183,069
Palapye 158,797 124,549 154,932 100,001 88,150 110,692 122,854
Sowa 29,080 24,400 25,500 21,042 23,000 19,940 23,827
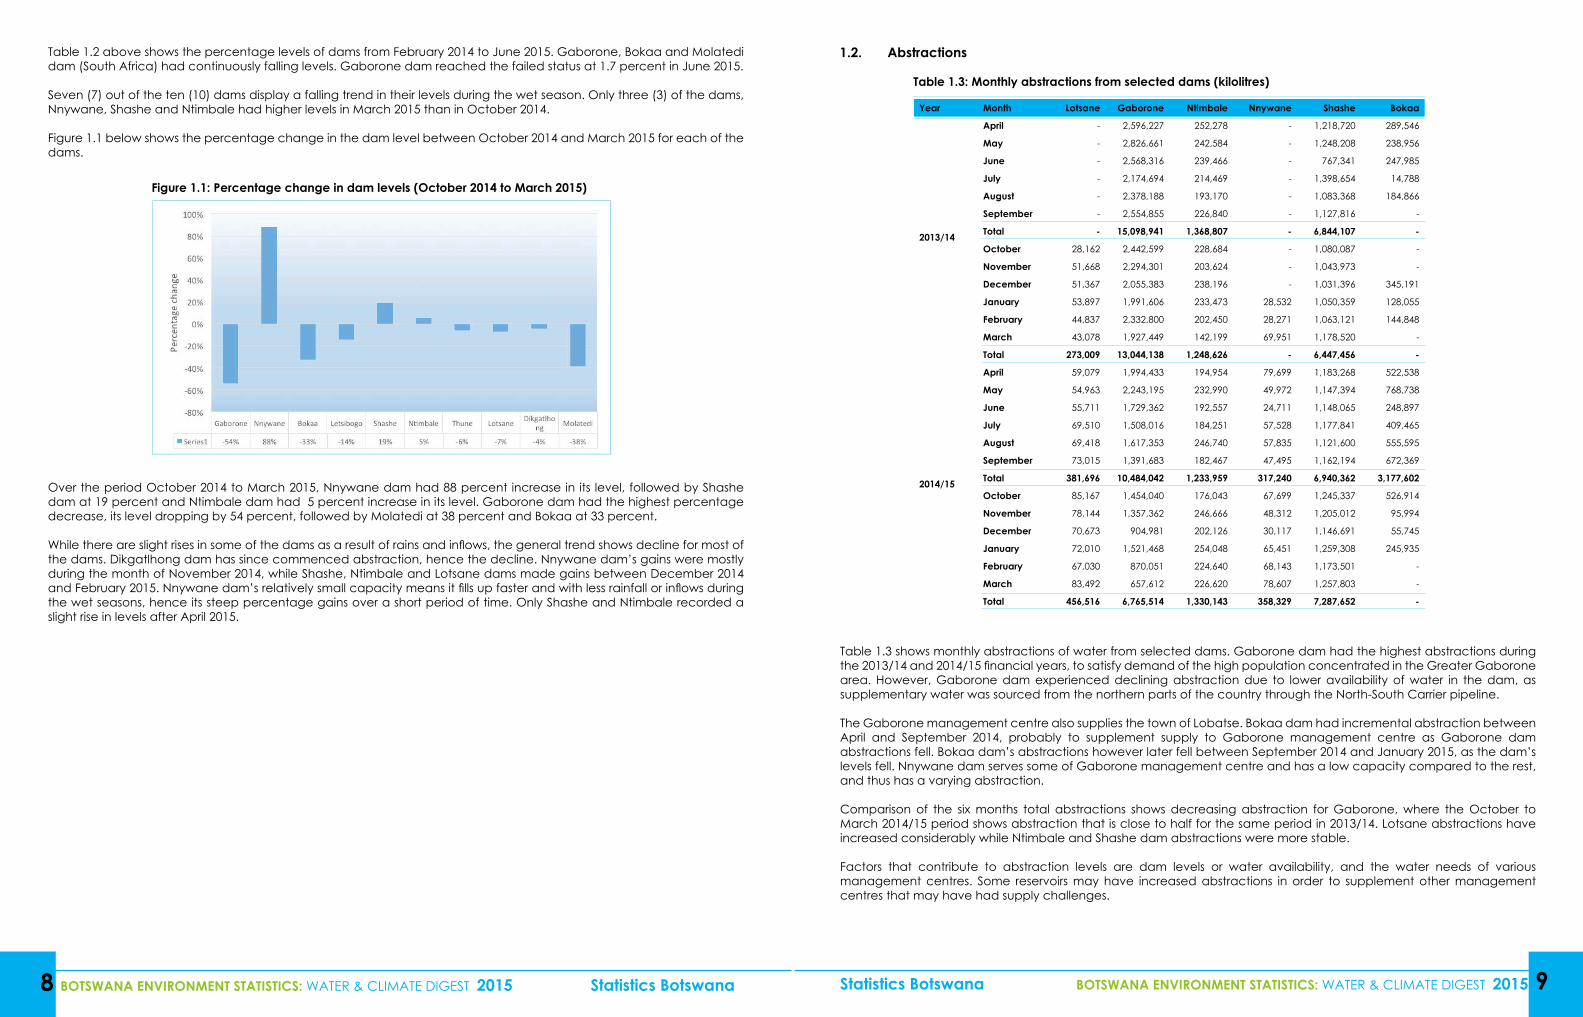
Table 1.5 shows the six month (April to September 2014) trend in water production quantities for selected settlements. Gaborone and Francistown have high quantities of water supplied to them, compared to the other settlements, due to their population sizes and higher levels of industrial and economic activity.
Figure 1.4: Six months average water production by settlements (April to September 2014)
Figure 1.4 shows the average monthly water production for the selected settlements over the six month period of April to September 2014. Gaborone and Francistown typically have the highest amount of water needs.
12 BOTSWANA ENVIRONMENT STATISTICS: WATER & CLIMATE DIGEST 2015 Statistics Botswana Statistics Botswana BOTSWANA ENVIRONMENT STATISTICS: WATER & CLIMATE DIGEST 2015 13
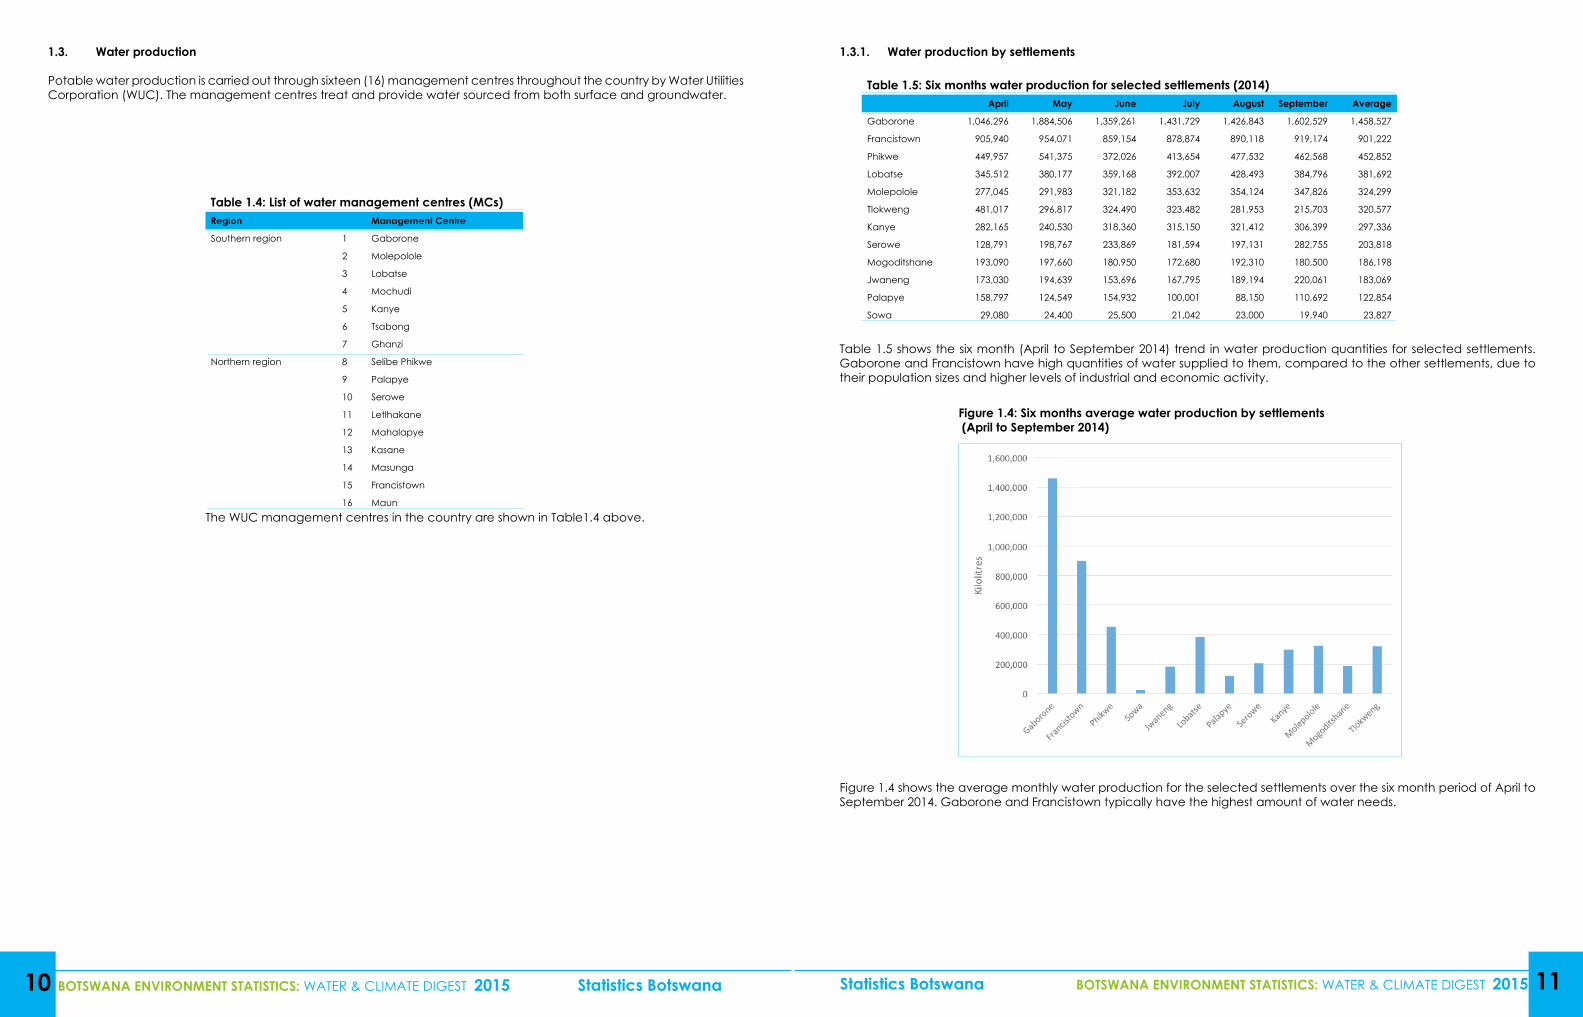
Figure 1.5: Water production for cities and towns (2013 and 2014)
Figure 1.5 juxtaposes some selected urban settlements’ (cities and towns) water production patterns for the six month period (April to September) for the two successive years 2013 and 2014. Indications are that Gaborone used less water for the same period in 2014 than in 2013. This is likely due to water shortages and conservation measures as Gaborone, Bokaa and Molatedi dams continued their downward trend in dam levels. Sowa, Jwaneng and Selibe Phikwe also have used slightly less water for the same period. Lobatse shows a slight increase in its water production for 2014, compared with that of 2013, over the same period.
1.3.2. Water production by Management Centers (MCs)
The sixteen (16) WUC management centres (MCs) are distributed between the northern MCs and the southern MCs. There are nine (9) MCs in the north and seven (7) in the south. The southern MCs serve a higher population, which is concentrated in the south-eastern parts of the country, where the capital city Gaborone is situated. Most of the county’s surface water resources are located in the northern parts of the country.
Table 1.6: Southern water production by management centres (kilolitres)
Year Month Gaborone Molepolole Lobatse Mochudi Kanye Tsabong Ghanzi
Total Southern
Region
2013 Jan 2,458,374.0 380,825.0 826,833.0 314,696.0 524,711.0 26,145.0 128,724.0 4,660,308.0
Feb 2,445,300.0 358,022.0 645,293.0 314,086.0 497,319.0 25,135.0 121,731.0 4,406,886.0
Mar 2,897,066.0 370,169.0 686,330.0 280,390.0 636,285.0 29,490.0 131,864.0 5,031,594.0
Apr 2,941,956.0 347,989.0 687,568.0 287,045.0 590,007.0 107,384.0 125,772.0 5,087,721.0
May 2,580,440.0 326,156.0 757,968.0 299,738.0 624,734.0 117,946.0 119,539.0 4,826,521.0
Jun 2,691,511.0 375,533.0 645,399.0 265,141.0 567,436.0 110,917.0 126,416.0 4,782,353.0
Jul 2,590,229.0 347,075.0 578,556.0 224,238.0 515,836.0 125,554.0 112,046.0 4,493,534.0
Aug 2,555,954.0 358,510.0 738,497.0 267,384.0 572,396.0 131,696.0 115,160.0 4,739,597.0
Sep 2,443,516.0 330,456.0 776,988.0 305,670.0 497,060.0 103,323.0 120,948.0 4,577,961.0
Oct 2,487,473.0 373,110.0 701,207.0 250,369.0 583,448.0 129,310.0 114,761.0 4,639,678.0
Nov 2,497,082.0 381,658.0 593,363.0 300,643.0 557,212.0 138,095.0 112,607.0 4,580,660.0
Dec 2,059,495.0 367,424.0 609,847.0 269,572.0 501,727.0 113,611.0 102,341.0 4,024,017.0
2014 Jan 2,635,700.0 444,326.0 653,449.0 301,593.0 504,174.0 135,035.0 110,765.0 4,785,042.0
Feb 2,456,118.0 399,541.0 - 298,779.0 526,849.0 109,174.0 120,090.0 3,910,551.0
Mar 2,513,053.0 347,610.0 - 248,796.0 481,199.0 115,432.0 104,557.0 3,810,647.0
Apr 1,872,926.0 520,390.0 637,049.0 270,971.0 576,852.0 117,301.4 103,905.8 4,099,395.2
May 2,533,323.0 516,621.0 820,395.0 314,514.0 551,130.0 118,405.8 102,633.3 4,957,022.1
Jun 2,010,539.0 538,903.0 734,340.0 290,799.0 591,414.0 117,551.7 105,887.0 4,389,433.7
Jul 2,073,870.0 554,028.0 800,895.0 264,400.0 612,539.0 116,718.6 105,672.0 4,528,122.6
Aug 2,064,052.0 569,198.0 890,600.0 281,435.0 654,453.0 117,689.7 107,759.0 4,685,186.7
Sep 2,156,692.0 593,401.0 705,828.0 285,322.0 670,303.0 112,275.6 108,648.0 4,632,469.6
Dash (-) = no dataSource: Water Utilities Corporation
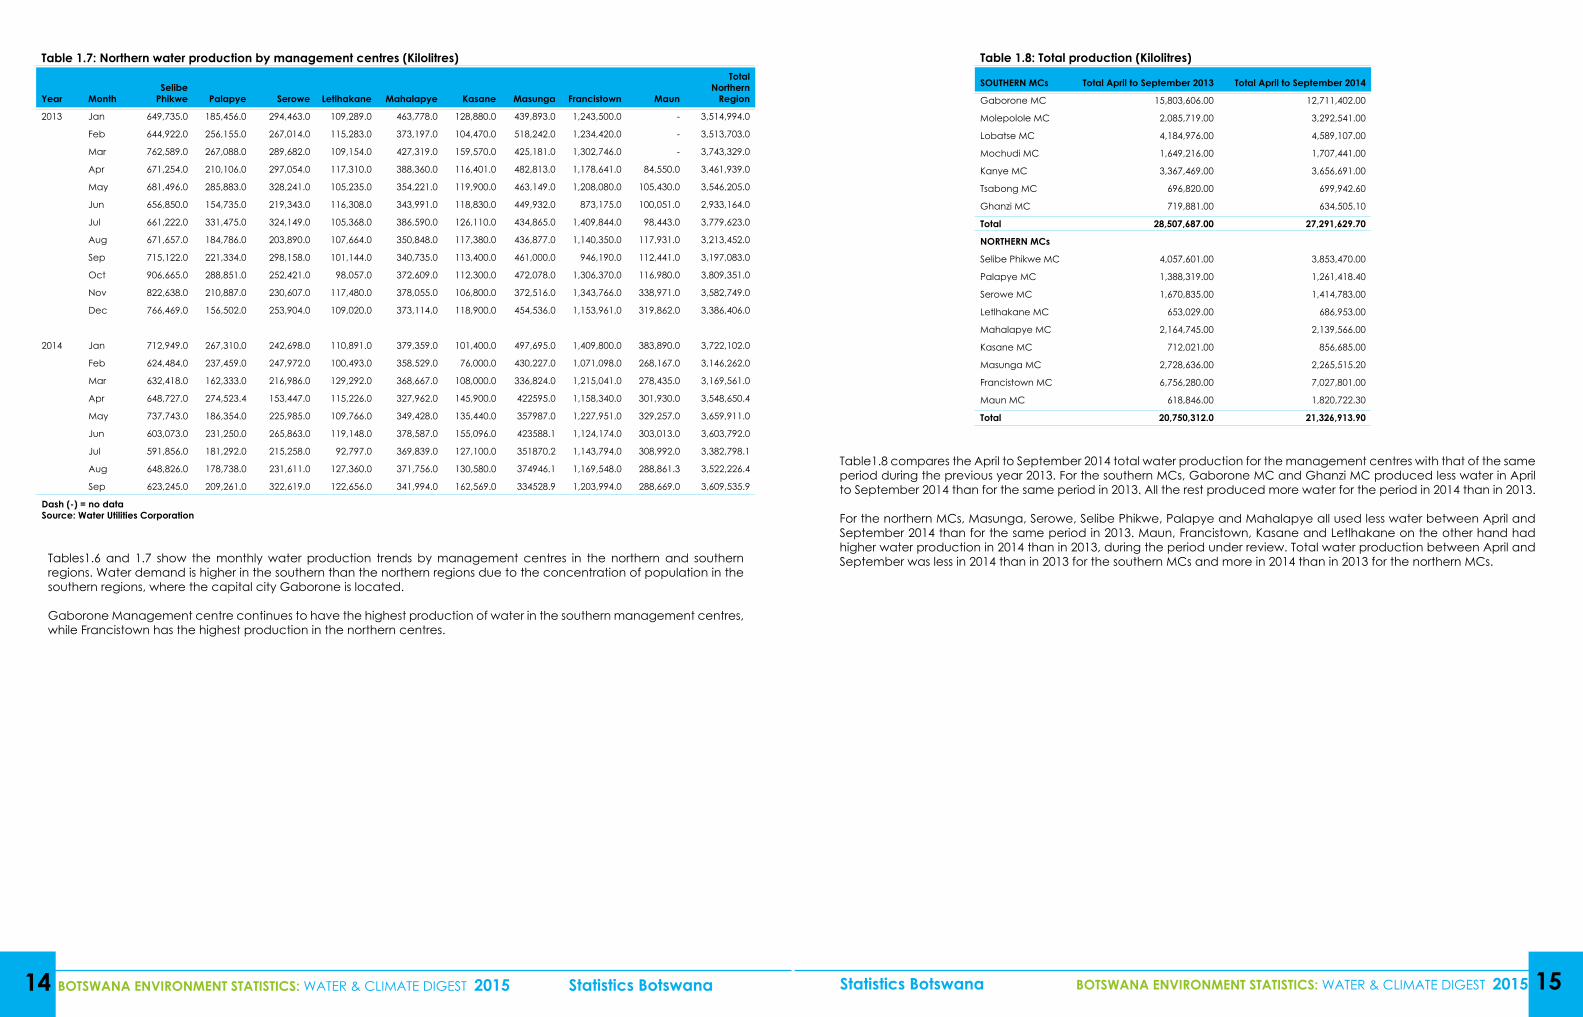
Table 1.8: Total production (Kilolitres)
SOUTHERN MCs Total April to September 2013 Total April to September 2014
Gaborone MC 15,803,606.00 12,711,402.00
Molepolole MC 2,085,719.00 3,292,541.00
Lobatse MC 4,184,976.00 4,589,107.00
Mochudi MC 1,649,216.00 1,707,441.00
Kanye MC 3,367,469.00 3,656,691.00
Tsabong MC 696,820.00 699,942.60
Ghanzi MC 719,881.00 634,505.10
Total 28,507,687.00 27,291,629.70
NORTHERN MCs
Selibe Phikwe MC 4,057,601.00 3,853,470.00
Palapye MC 1,388,319.00 1,261,418.40
Serowe MC 1,670,835.00 1,414,783.00
Letlhakane MC 653,029.00 686,953.00
Mahalapye MC 2,164,745.00 2,139,566.00
Kasane MC 712,021.00 856,685.00
Masunga MC 2,728,636.00 2,265,515.20
Francistown MC 6,756,280.00 7,027,801.00
Maun MC 618,846.00 1,820,722.30
Total 20,750,312.0 21,326,913.90
14 BOTSWANA ENVIRONMENT STATISTICS: WATER & CLIMATE DIGEST 2015 Statistics Botswana Statistics Botswana BOTSWANA ENVIRONMENT STATISTICS: WATER & CLIMATE DIGEST 2015 15
Table 1.7: Northern water production by management centres (Kilolitres)
Year Month Selibe
Phikwe Palapye Serowe Letlhakane Mahalapye Kasane Masunga Francistown Maun
Total Northern
Region
2013 Jan 649,735.0 185,456.0 294,463.0 109,289.0 463,778.0 128,880.0 439,893.0 1,243,500.0 - 3,514,994.0
Feb 644,922.0 256,155.0 267,014.0 115,283.0 373,197.0 104,470.0 518,242.0 1,234,420.0 - 3,513,703.0
Mar 762,589.0 267,088.0 289,682.0 109,154.0 427,319.0 159,570.0 425,181.0 1,302,746.0 - 3,743,329.0
Apr 671,254.0 210,106.0 297,054.0 117,310.0 388,360.0 116,401.0 482,813.0 1,178,641.0 84,550.0 3,461,939.0
May 681,496.0 285,883.0 328,241.0 105,235.0 354,221.0 119,900.0 463,149.0 1,208,080.0 105,430.0 3,546,205.0
Jun 656,850.0 154,735.0 219,343.0 116,308.0 343,991.0 118,830.0 449,932.0 873,175.0 100,051.0 2,933,164.0
Jul 661,222.0 331,475.0 324,149.0 105,368.0 386,590.0 126,110.0 434,865.0 1,409,844.0 98,443.0 3,779,623.0
Aug 671,657.0 184,786.0 203,890.0 107,664.0 350,848.0 117,380.0 436,877.0 1,140,350.0 117,931.0 3,213,452.0
Sep 715,122.0 221,334.0 298,158.0 101,144.0 340,735.0 113,400.0 461,000.0 946,190.0 112,441.0 3,197,083.0
Oct 906,665.0 288,851.0 252,421.0 98,057.0 372,609.0 112,300.0 472,078.0 1,306,370.0 116,980.0 3,809,351.0
Nov 822,638.0 210,887.0 230,607.0 117,480.0 378,055.0 106,800.0 372,516.0 1,343,766.0 338,971.0 3,582,749.0
Dec 766,469.0 156,502.0 253,904.0 109,020.0 373,114.0 118,900.0 454,536.0 1,153,961.0 319,862.0 3,386,406.0
2014 Jan 712,949.0 267,310.0 242,698.0 110,891.0 379,359.0 101,400.0 497,695.0 1,409,800.0 383,890.0 3,722,102.0
Feb 624,484.0 237,459.0 247,972.0 100,493.0 358,529.0 76,000.0 430,227.0 1,071,098.0 268,167.0 3,146,262.0
Mar 632,418.0 162,333.0 216,986.0 129,292.0 368,667.0 108,000.0 336,824.0 1,215,041.0 278,435.0 3,169,561.0
Apr 648,727.0 274,523.4 153,447.0 115,226.0 327,962.0 145,900.0 422595.0 1,158,340.0 301,930.0 3,548,650.4
May 737,743.0 186,354.0 225,985.0 109,766.0 349,428.0 135,440.0 357987.0 1,227,951.0 329,257.0 3,659,911.0
Jun 603,073.0 231,250.0 265,863.0 119,148.0 378,587.0 155,096.0 423588.1 1,124,174.0 303,013.0 3,603,792.0
Jul 591,856.0 181,292.0 215,258.0 92,797.0 369,839.0 127,100.0 351870.2 1,143,794.0 308,992.0 3,382,798.1
Aug 648,826.0 178,738.0 231,611.0 127,360.0 371,756.0 130,580.0 374946.1 1,169,548.0 288,861.3 3,522,226.4
Sep 623,245.0 209,261.0 322,619.0 122,656.0 341,994.0 162,569.0 334528.9 1,203,994.0 288,669.0 3,609,535.9
Dash (-) = no dataSource: Water Utilities Corporation
Tables1.6 and 1.7 show the monthly water production trends by management centres in the northern and southern regions. Water demand is higher in the southern than the northern regions due to the concentration of population in the southern regions, where the capital city Gaborone is located.
Gaborone Management centre continues to have the highest production of water in the southern management centres, while Francistown has the highest production in the northern centres.
Table1.8 compares the April to September 2014 total water production for the management centres with that of the same period during the previous year 2013. For the southern MCs, Gaborone MC and Ghanzi MC produced less water in April to September 2014 than for the same period in 2013. All the rest produced more water for the period in 2014 than in 2013.
For the northern MCs, Masunga, Serowe, Selibe Phikwe, Palapye and Mahalapye all used less water between April and September 2014 than for the same period in 2013. Maun, Francistown, Kasane and Letlhakane on the other hand had higher water production in 2014 than in 2013, during the period under review. Total water production between April and September was less in 2014 than in 2013 for the southern MCs and more in 2014 than in 2013 for the northern MCs.
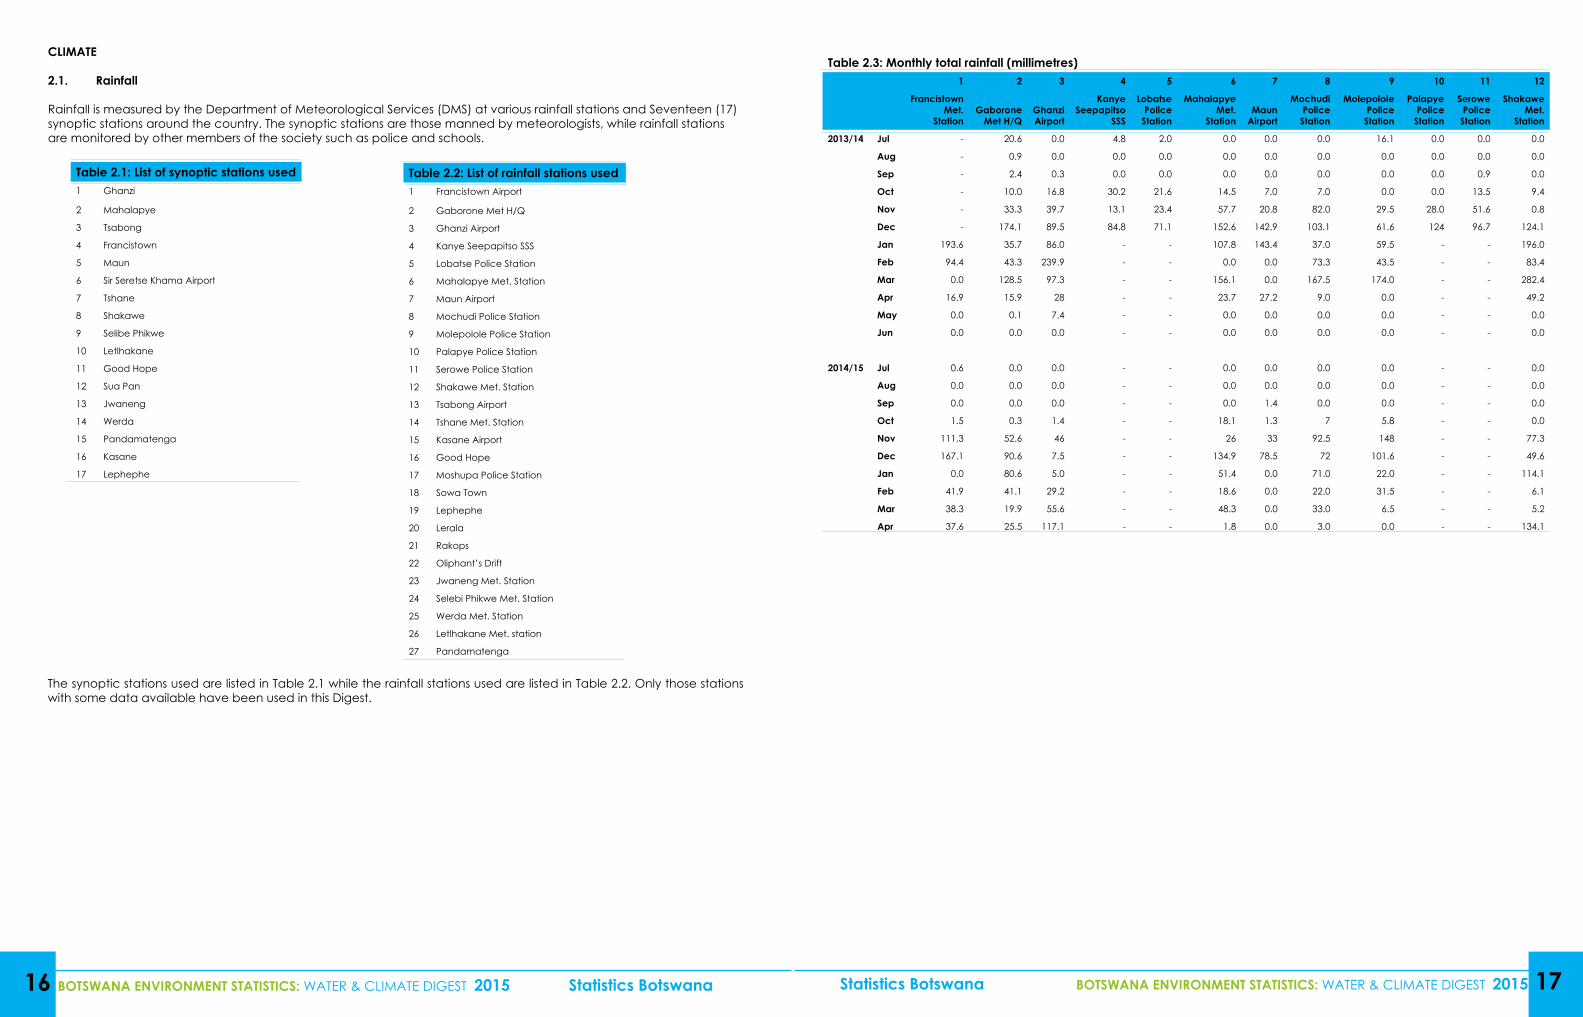
Table 2.1: List of synoptic stations used1 Ghanzi
2 Mahalapye
3 Tsabong
4 Francistown
5 Maun
6 Sir Seretse Khama Airport
7 Tshane
8 Shakawe
9 Selibe Phikwe
10 Letlhakane
11 Good Hope
12 Sua Pan
13 Jwaneng
14 Werda
15 Pandamatenga
16 Kasane
17 Lephephe
16 BOTSWANA ENVIRONMENT STATISTICS: WATER & CLIMATE DIGEST 2015 Statistics Botswana Statistics Botswana BOTSWANA ENVIRONMENT STATISTICS: WATER & CLIMATE DIGEST 2015 17
CLIMATE
2.1. Rainfall
Rainfall is measured by the Department of Meteorological Services (DMS) at various rainfall stations and Seventeen (17) synoptic stations around the country. The synoptic stations are those manned by meteorologists, while rainfall stations are monitored by other members of the society such as police and schools.
The synoptic stations used are listed in Table 2.1 while the rainfall stations used are listed in Table 2.2. Only those stations with some data available have been used in this Digest.
Table 2.2: List of rainfall stations used1 Francistown Airport
2 Gaborone Met H/Q
3 Ghanzi Airport
4 Kanye Seepapitso SSS
5 Lobatse Police Station
6 Mahalapye Met. Station
7 Maun Airport
8 Mochudi Police Station
9 Molepolole Police Station
10 Palapye Police Station
11 Serowe Police Station
12 Shakawe Met. Station
13 Tsabong Airport
14 Tshane Met. Station
15 Kasane Airport
16 Good Hope
17 Moshupa Police Station
18 Sowa Town
19 Lephephe
20 Lerala
21 Rakops
22 Oliphant’s Drift
23 Jwaneng Met. Station
24 Selebi Phikwe Met. Station
25 Werda Met. Station
26 Letlhakane Met. station
27 Pandamatenga
Table 2.3: Monthly total rainfall (millimetres)1 2 3 4 5 6 7 8 9 10 11 12
Francistown Met.
StationGaborone
Met H/QGhanzi Airport
Kanye Seepapitso
SSS
LobatsePolice
Station
Mahalapye Met.
StationMaun
Airport
Mochudi Police
Station
Molepolole Police
Station
Palapye Police
Station
Serowe Police
Station
Shakawe Met.
Station
2013/14 Jul - 20.6 0.0 4.8 2.0 0.0 0.0 0.0 16.1 0.0 0.0 0.0
Aug - 0.9 0.0 0.0 0.0 0.0 0.0 0.0 0.0 0.0 0.0 0.0
Sep - 2.4 0.3 0.0 0.0 0.0 0.0 0.0 0.0 0.0 0.9 0.0
Oct - 10.0 16.8 30.2 21.6 14.5 7.0 7.0 0.0 0.0 13.5 9.4
Nov - 33.3 39.7 13.1 23.4 57.7 20.8 82.0 29.5 28.0 51.6 0.8
Dec - 174.1 89.5 84.8 71.1 152.6 142.9 103.1 61.6 124 96.7 124.1
Jan 193.6 35.7 86.0 - - 107.8 143.4 37.0 59.5 - - 196.0
Feb 94.4 43.3 239.9 - - 0.0 0.0 73.3 43.5 - - 83.4
Mar 0.0 128.5 97.3 - - 156.1 0.0 167.5 174.0 - - 282.4
Apr 16.9 15.9 28 - - 23.7 27.2 9.0 0.0 - - 49.2
May 0.0 0.1 7.4 - - 0.0 0.0 0.0 0.0 - - 0.0
Jun 0.0 0.0 0.0 - - 0.0 0.0 0.0 0.0 - - 0.0
2014/15 Jul 0.6 0.0 0.0 - - 0.0 0.0 0.0 0.0 - - 0.0
Aug 0.0 0.0 0.0 - - 0.0 0.0 0.0 0.0 - - 0.0
Sep 0.0 0.0 0.0 - - 0.0 1.4 0.0 0.0 - - 0.0
Oct 1.5 0.3 1.4 - - 18.1 1.3 7 5.8 - - 0.0
Nov 111.3 52.6 46 - - 26 33 92.5 148 - - 77.3
Dec 167.1 90.6 7.5 - - 134.9 78.5 72 101.6 - - 49.6
Jan 0.0 80.6 5.0 - - 51.4 0.0 71.0 22.0 - - 114.1
Feb 41.9 41.1 29.2 - - 18.6 0.0 22.0 31.5 - - 6.1
Mar 38.3 19.9 55.6 - - 48.3 0.0 33.0 6.5 - - 5.2
Apr 37.6 25.5 117.1 - - 1.8 0.0 3.0 0.0 - - 134.1
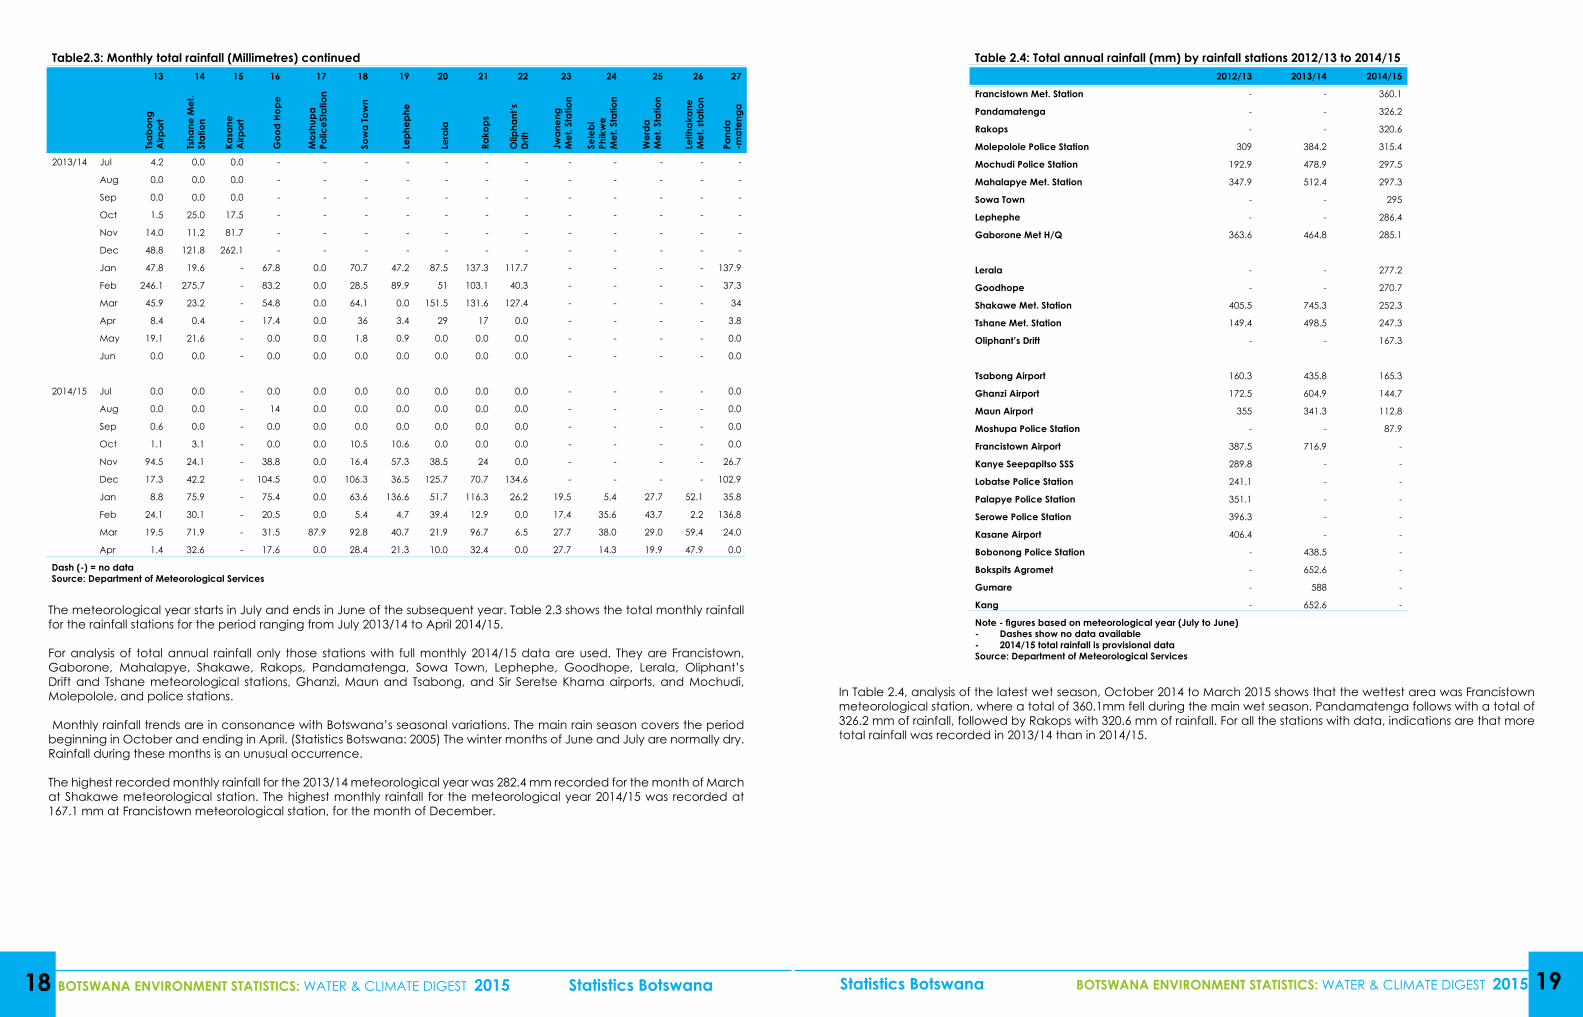
Table2.3: Monthly total rainfall (Millimetres) continued13 14 15 16 17 18 19 20 21 22 23 24 25 26 27
Tsab
ong
Airp
ort
Tsha
ne M
et.
Stat
ion
Kasa
ne
Airp
ort
Goo
d Ho
pe
Mos
hupa
Po
liceS
tatio
n
Sow
a To
wn
Leph
ephe
Lera
la
Rako
ps
Olip
hant
’s
Drift
Jwan
eng
Met
. Sta
tion
Sele
bi
Phik
we
Met
. Sta
tion
Wer
da
Met
. Sta
tion
Letlh
akan
e M
et. s
tatio
n
Pand
a-m
aten
ga
2013/14 Jul 4.2 0.0 0.0 - - - - - - - - - - - -
Aug 0.0 0.0 0.0 - - - - - - - - - - - -
Sep 0.0 0.0 0.0 - - - - - - - - - - - -
Oct 1.5 25.0 17.5 - - - - - - - - - - - -
Nov 14.0 11.2 81.7 - - - - - - - - - - - -
Dec 48.8 121.8 262.1 - - - - - - - - - - - -
Jan 47.8 19.6 - 67.8 0.0 70.7 47.2 87.5 137.3 117.7 - - - - 137.9
Feb 246.1 275.7 - 83.2 0.0 28.5 89.9 51 103.1 40.3 - - - - 37.3
Mar 45.9 23.2 - 54.8 0.0 64.1 0.0 151.5 131.6 127.4 - - - - 34
Apr 8.4 0.4 - 17.4 0.0 36 3.4 29 17 0.0 - - - - 3.8
May 19.1 21.6 - 0.0 0.0 1.8 0.9 0.0 0.0 0.0 - - - - 0.0
Jun 0.0 0.0 - 0.0 0.0 0.0 0.0 0.0 0.0 0.0 - - - - 0.0
2014/15 Jul 0.0 0.0 - 0.0 0.0 0.0 0.0 0.0 0.0 0.0 - - - - 0.0
Aug 0.0 0.0 - 14 0.0 0.0 0.0 0.0 0.0 0.0 - - - - 0.0
Sep 0.6 0.0 - 0.0 0.0 0.0 0.0 0.0 0.0 0.0 - - - - 0.0
Oct 1.1 3.1 - 0.0 0.0 10.5 10.6 0.0 0.0 0.0 - - - - 0.0
Nov 94.5 24.1 - 38.8 0.0 16.4 57.3 38.5 24 0.0 - - - - 26.7
Dec 17.3 42.2 - 104.5 0.0 106.3 36.5 125.7 70.7 134.6 - - - - 102.9
Jan 8.8 75.9 - 75.4 0.0 63.6 136.6 51.7 116.3 26.2 19.5 5.4 27.7 52.1 35.8
Feb 24.1 30.1 - 20.5 0.0 5.4 4.7 39.4 12.9 0.0 17.4 35.6 43.7 2.2 136.8
Mar 19.5 71.9 - 31.5 87.9 92.8 40.7 21.9 96.7 6.5 27.7 38.0 29.0 59.4 24.0
Apr 1.4 32.6 - 17.6 0.0 28.4 21.3 10.0 32.4 0.0 27.7 14.3 19.9 47.9 0.0
Dash (-) = no data Source: Department of Meteorological Services
Table 2.4: Total annual rainfall (mm) by rainfall stations 2012/13 to 2014/152012/13 2013/14 2014/15
Francistown Met. Station - - 360.1
Pandamatenga - - 326.2
Rakops - - 320.6
Molepolole Police Station 309 384.2 315.4
Mochudi Police Station 192.9 478.9 297.5
Mahalapye Met. Station 347.9 512.4 297.3
Sowa Town - - 295
Lephephe - - 286.4
Gaborone Met H/Q 363.6 464.8 285.1
Lerala - - 277.2
Goodhope - - 270.7
Shakawe Met. Station 405.5 745.3 252.3
Tshane Met. Station 149.4 498.5 247.3
Oliphant’s Drift - - 167.3
Tsabong Airport 160.3 435.8 165.3
Ghanzi Airport 172.5 604.9 144.7
Maun Airport 355 341.3 112.8
Moshupa Police Station - - 87.9
Francistown Airport 387.5 716.9 -
Kanye Seepapitso SSS 289.8 - -
Lobatse Police Station 241.1 - -
Palapye Police Station 351.1 - -
Serowe Police Station 396.3 - -
Kasane Airport 406.4 - -
Bobonong Police Station - 438.5 -
Bokspits Agromet - 652.6 -
Gumare - 588 -
Kang - 652.6 -
Note - figures based on meteorological year (July to June)- Dashes show no data available- 2014/15 total rainfall is provisional data Source: Department of Meteorological Services
18 BOTSWANA ENVIRONMENT STATISTICS: WATER & CLIMATE DIGEST 2015 Statistics Botswana Statistics Botswana BOTSWANA ENVIRONMENT STATISTICS: WATER & CLIMATE DIGEST 2015 19
The meteorological year starts in July and ends in June of the subsequent year. Table 2.3 shows the total monthly rainfall for the rainfall stations for the period ranging from July 2013/14 to April 2014/15.
For analysis of total annual rainfall only those stations with full monthly 2014/15 data are used. They are Francistown, Gaborone, Mahalapye, Shakawe, Rakops, Pandamatenga, Sowa Town, Lephephe, Goodhope, Lerala, Oliphant’s Drift and Tshane meteorological stations, Ghanzi, Maun and Tsabong, and Sir Seretse Khama airports, and Mochudi, Molepolole, and police stations.
Monthly rainfall trends are in consonance with Botswana’s seasonal variations. The main rain season covers the period beginning in October and ending in April. (Statistics Botswana: 2005) The winter months of June and July are normally dry. Rainfall during these months is an unusual occurrence.
The highest recorded monthly rainfall for the 2013/14 meteorological year was 282.4 mm recorded for the month of March at Shakawe meteorological station. The highest monthly rainfall for the meteorological year 2014/15 was recorded at 167.1 mm at Francistown meteorological station, for the month of December.
In Table 2.4, analysis of the latest wet season, October 2014 to March 2015 shows that the wettest area was Francistown meteorological station, where a total of 360.1mm fell during the main wet season. Pandamatenga follows with a total of 326.2 mm of rainfall, followed by Rakops with 320.6 mm of rainfall. For all the stations with data, indications are that more total rainfall was recorded in 2013/14 than in 2014/15.
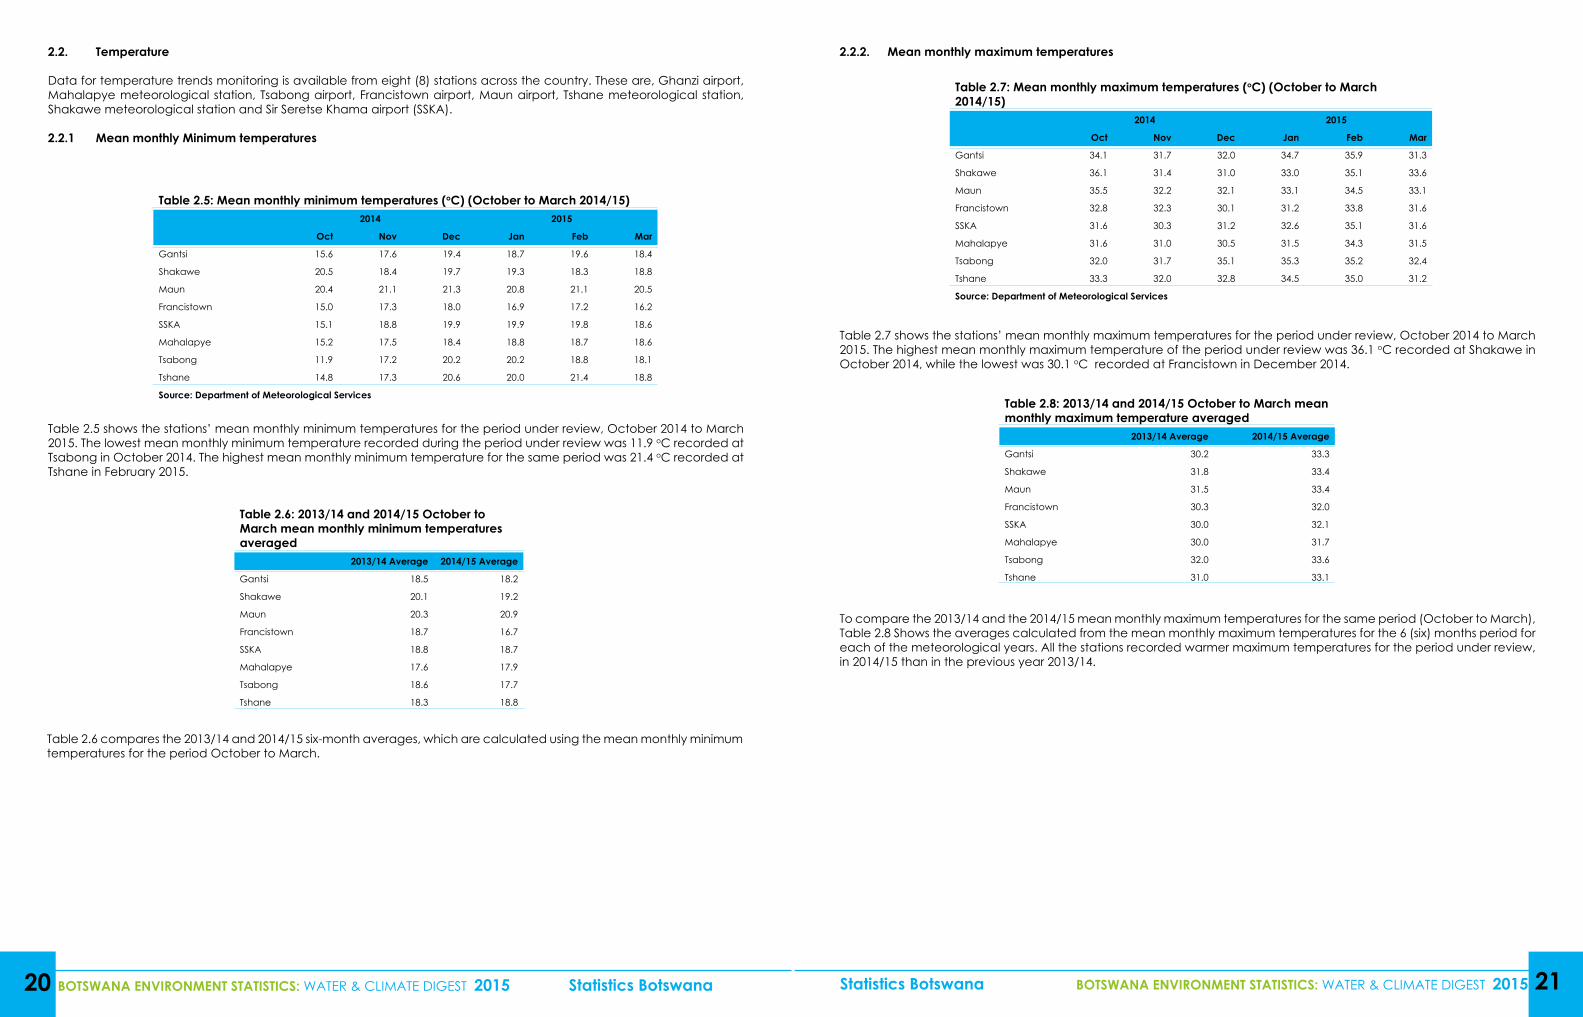
Table 2.8: 2013/14 and 2014/15 October to March mean monthly maximum temperature averaged
2013/14 Average 2014/15 Average
Gantsi 30.2 33.3
Shakawe 31.8 33.4
Maun 31.5 33.4
Francistown 30.3 32.0
SSKA 30.0 32.1
Mahalapye 30.0 31.7
Tsabong 32.0 33.6
Tshane 31.0 33.1
Table 2.7: Mean monthly maximum temperatures (oC) (October to March 2014/15)
2014 2015
Oct Nov Dec Jan Feb Mar
Gantsi 34.1 31.7 32.0 34.7 35.9 31.3
Shakawe 36.1 31.4 31.0 33.0 35.1 33.6
Maun 35.5 32.2 32.1 33.1 34.5 33.1
Francistown 32.8 32.3 30.1 31.2 33.8 31.6
SSKA 31.6 30.3 31.2 32.6 35.1 31.6
Mahalapye 31.6 31.0 30.5 31.5 34.3 31.5
Tsabong 32.0 31.7 35.1 35.3 35.2 32.4
Tshane 33.3 32.0 32.8 34.5 35.0 31.2
Source: Department of Meteorological Services
Table 2.6: 2013/14 and 2014/15 October to March mean monthly minimum temperatures averaged
2013/14 Average 2014/15 Average
Gantsi 18.5 18.2
Shakawe 20.1 19.2
Maun 20.3 20.9
Francistown 18.7 16.7
SSKA 18.8 18.7
Mahalapye 17.6 17.9
Tsabong 18.6 17.7
Tshane 18.3 18.8
Table 2.5: Mean monthly minimum temperatures (oC) (October to March 2014/15)2014 2015
Oct Nov Dec Jan Feb Mar
Gantsi 15.6 17.6 19.4 18.7 19.6 18.4
Shakawe 20.5 18.4 19.7 19.3 18.3 18.8
Maun 20.4 21.1 21.3 20.8 21.1 20.5
Francistown 15.0 17.3 18.0 16.9 17.2 16.2
SSKA 15.1 18.8 19.9 19.9 19.8 18.6
Mahalapye 15.2 17.5 18.4 18.8 18.7 18.6
Tsabong 11.9 17.2 20.2 20.2 18.8 18.1
Tshane 14.8 17.3 20.6 20.0 21.4 18.8
Source: Department of Meteorological Services
20 BOTSWANA ENVIRONMENT STATISTICS: WATER & CLIMATE DIGEST 2015 Statistics Botswana Statistics Botswana BOTSWANA ENVIRONMENT STATISTICS: WATER & CLIMATE DIGEST 2015 21
2.2. Temperature
Data for temperature trends monitoring is available from eight (8) stations across the country. These are, Ghanzi airport, Mahalapye meteorological station, Tsabong airport, Francistown airport, Maun airport, Tshane meteorological station, Shakawe meteorological station and Sir Seretse Khama airport (SSKA).
2.2.1 Mean monthly Minimum temperatures
Table 2.5 shows the stations’ mean monthly minimum temperatures for the period under review, October 2014 to March 2015. The lowest mean monthly minimum temperature recorded during the period under review was 11.9 oC recorded at Tsabong in October 2014. The highest mean monthly minimum temperature for the same period was 21.4 oC recorded at Tshane in February 2015.
Table 2.6 compares the 2013/14 and 2014/15 six-month averages, which are calculated using the mean monthly minimum temperatures for the period October to March.
2.2.2. Mean monthly maximum temperatures
Table 2.7 shows the stations’ mean monthly maximum temperatures for the period under review, October 2014 to March 2015. The highest mean monthly maximum temperature of the period under review was 36.1 oC recorded at Shakawe in October 2014, while the lowest was 30.1 oC recorded at Francistown in December 2014.
To compare the 2013/14 and the 2014/15 mean monthly maximum temperatures for the same period (October to March), Table 2.8 Shows the averages calculated from the mean monthly maximum temperatures for the 6 (six) months period for each of the meteorological years. All the stations recorded warmer maximum temperatures for the period under review, in 2014/15 than in the previous year 2013/14.
22 BOTSWANA ENVIRONMENT STATISTICS: WATER & CLIMATE DIGEST 2015 Statistics Botswana Statistics Botswana BOTSWANA ENVIRONMENT STATISTICS: WATER & CLIMATE DIGEST 2015 23
REFERENCES
Central Statistics Office, 2005, ‘2001 Population Census Atlas: Botswana’ Government of Botswana, Gaborone.
Central Statistics Office, 2006, ‘Environment Statistics’ Department of Printing and Publishing Services, Gaborone.
Statistics Botswana 2013, ‘Botswana Environment statistics 2012,’ Statistics Botswana, Gaborone.
Statistics Botswana 2014, ‘Botswana Environment Statistics: Human Settlements Report 2013’, Statistics Botswana, Gabo-rone.
United Nations Statistics Division, 2012, ‘International Recommendations for Water Statistics: Series M No. 91,’ Department of Economic and Social affairs, United Nations, New York.
United Nations Statistics Division, 2013, ‘Framework for the Development of Environment Statistics 2013 final draft,’ De-partment of Economic and Social affairs, United Nations, New York.
United Nations Statistics Division, 2014, ‘System of Environmental-Economic accounting 2012’, United Nations, New York.
Water Utilities Corporation, 2014, online: www.wuc.bw
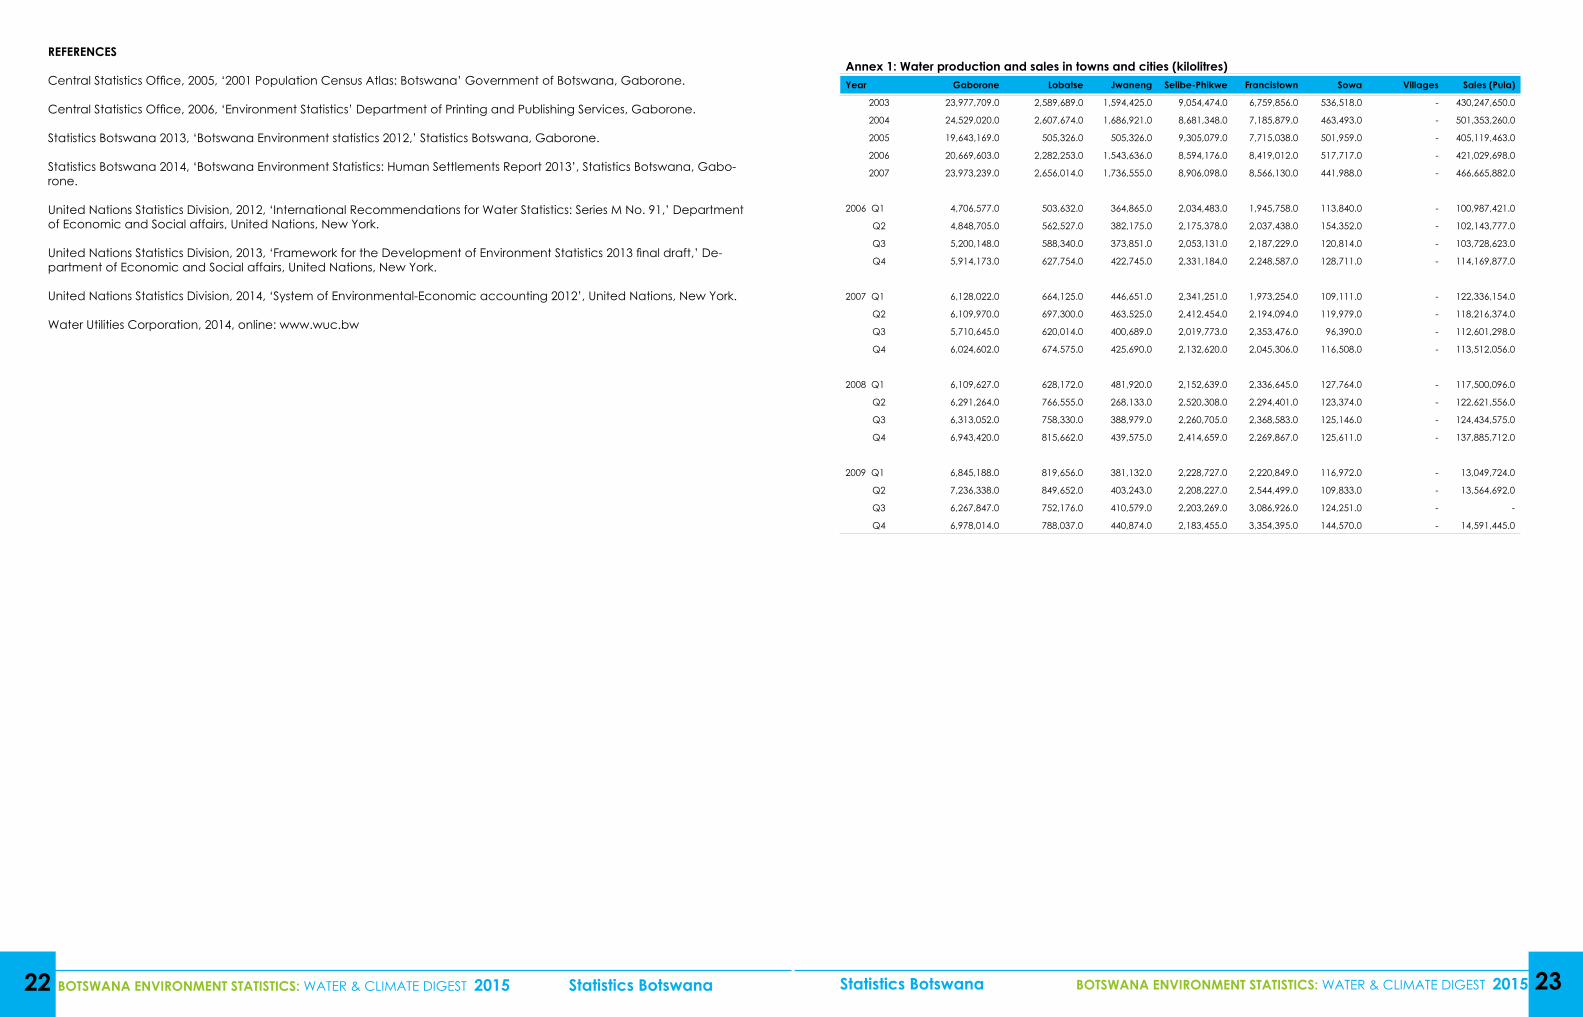
Annex 1: Water production and sales in towns and cities (kilolitres)Year Gaborone Lobatse Jwaneng Selibe-Phikwe Francistown Sowa Villages Sales (Pula)
2003 23,977,709.0 2,589,689.0 1,594,425.0 9,054,474.0 6,759,856.0 536,518.0 - 430,247,650.0
2004 24,529,020.0 2,607,674.0 1,686,921.0 8,681,348.0 7,185,879.0 463,493.0 - 501,353,260.0
2005 19,643,169.0 505,326.0 505,326.0 9,305,079.0 7,715,038.0 501,959.0 - 405,119,463.0
2006 20,669,603.0 2,282,253.0 1,543,636.0 8,594,176.0 8,419,012.0 517,717.0 - 421,029,698.0
2007 23,973,239.0 2,656,014.0 1,736,555.0 8,906,098.0 8,566,130.0 441,988.0 - 466,665,882.0
2006 Q1 4,706,577.0 503,632.0 364,865.0 2,034,483.0 1,945,758.0 113,840.0 - 100,987,421.0
Q2 4,848,705.0 562,527.0 382,175.0 2,175,378.0 2,037,438.0 154,352.0 - 102,143,777.0
Q3 5,200,148.0 588,340.0 373,851.0 2,053,131.0 2,187,229.0 120,814.0 - 103,728,623.0
Q4 5,914,173.0 627,754.0 422,745.0 2,331,184.0 2,248,587.0 128,711.0 - 114,169,877.0
2007 Q1 6,128,022.0 664,125.0 446,651.0 2,341,251.0 1,973,254.0 109,111.0 - 122,336,154.0
Q2 6,109,970.0 697,300.0 463,525.0 2,412,454.0 2,194,094.0 119,979.0 - 118,216,374.0
Q3 5,710,645.0 620,014.0 400,689.0 2,019,773.0 2,353,476.0 96,390.0 - 112,601,298.0
Q4 6,024,602.0 674,575.0 425,690.0 2,132,620.0 2,045,306.0 116,508.0 - 113,512,056.0
2008 Q1 6,109,627.0 628,172.0 481,920.0 2,152,639.0 2,336,645.0 127,764.0 - 117,500,096.0
Q2 6,291,264.0 766,555.0 268,133.0 2,520,308.0 2,294,401.0 123,374.0 - 122,621,556.0
Q3 6,313,052.0 758,330.0 388,979.0 2,260,705.0 2,368,583.0 125,146.0 - 124,434,575.0
Q4 6,943,420.0 815,662.0 439,575.0 2,414,659.0 2,269,867.0 125,611.0 - 137,885,712.0
2009 Q1 6,845,188.0 819,656.0 381,132.0 2,228,727.0 2,220,849.0 116,972.0 - 13,049,724.0
Q2 7,236,338.0 849,652.0 403,243.0 2,208,227.0 2,544,499.0 109,833.0 - 13,564,692.0
Q3 6,267,847.0 752,176.0 410,579.0 2,203,269.0 3,086,926.0 124,251.0 - -
Q4 6,978,014.0 788,037.0 440,874.0 2,183,455.0 3,354,395.0 144,570.0 - 14,591,445.0
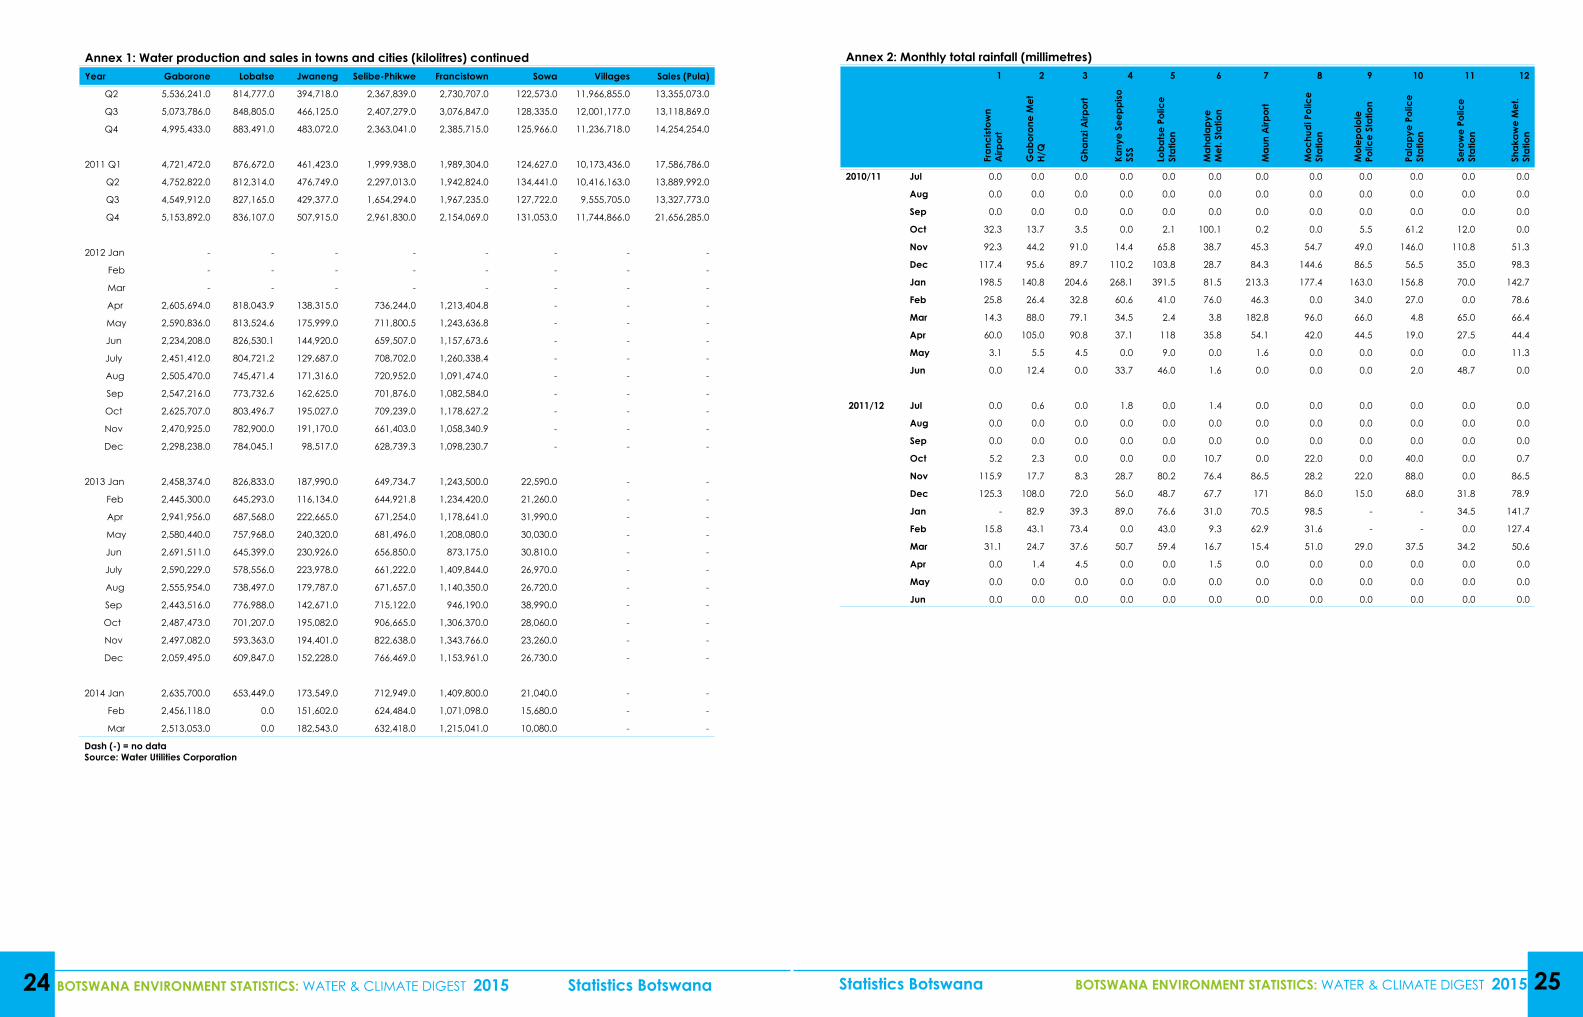
Annex 2: Monthly total rainfall (millimetres)1 2 3 4 5 6 7 8 9 10 11 12
Fran
cist
own
Airp
ort
Gab
oron
e M
et
H/Q
Gha
nzi A
irpor
t
Kany
e Se
eppi
so
SSS
Loba
tse
Polic
e St
atio
n
Mah
alap
ye
Met
. Sta
tion
Mau
n A
irpor
t
Moc
hudi
Pol
ice
Stat
ion
Mol
epol
ole
Polic
e St
atio
n
Pala
pye
Polic
e St
atio
n
Sero
we
Polic
e St
atio
n
Shak
awe
Met
. St
atio
n
2010/11 Jul 0.0 0.0 0.0 0.0 0.0 0.0 0.0 0.0 0.0 0.0 0.0 0.0
Aug 0.0 0.0 0.0 0.0 0.0 0.0 0.0 0.0 0.0 0.0 0.0 0.0
Sep 0.0 0.0 0.0 0.0 0.0 0.0 0.0 0.0 0.0 0.0 0.0 0.0
Oct 32.3 13.7 3.5 0.0 2.1 100.1 0.2 0.0 5.5 61.2 12.0 0.0
Nov 92.3 44.2 91.0 14.4 65.8 38.7 45.3 54.7 49.0 146.0 110.8 51.3
Dec 117.4 95.6 89.7 110.2 103.8 28.7 84.3 144.6 86.5 56.5 35.0 98.3
Jan 198.5 140.8 204.6 268.1 391.5 81.5 213.3 177.4 163.0 156.8 70.0 142.7
Feb 25.8 26.4 32.8 60.6 41.0 76.0 46.3 0.0 34.0 27.0 0.0 78.6
Mar 14.3 88.0 79.1 34.5 2.4 3.8 182.8 96.0 66.0 4.8 65.0 66.4
Apr 60.0 105.0 90.8 37.1 118 35.8 54.1 42.0 44.5 19.0 27.5 44.4
May 3.1 5.5 4.5 0.0 9.0 0.0 1.6 0.0 0.0 0.0 0.0 11.3
Jun 0.0 12.4 0.0 33.7 46.0 1.6 0.0 0.0 0.0 2.0 48.7 0.0
2011/12 Jul 0.0 0.6 0.0 1.8 0.0 1.4 0.0 0.0 0.0 0.0 0.0 0.0
Aug 0.0 0.0 0.0 0.0 0.0 0.0 0.0 0.0 0.0 0.0 0.0 0.0
Sep 0.0 0.0 0.0 0.0 0.0 0.0 0.0 0.0 0.0 0.0 0.0 0.0
Oct 5.2 2.3 0.0 0.0 0.0 10.7 0.0 22.0 0.0 40.0 0.0 0.7
Nov 115.9 17.7 8.3 28.7 80.2 76.4 86.5 28.2 22.0 88.0 0.0 86.5
Dec 125.3 108.0 72.0 56.0 48.7 67.7 171 86.0 15.0 68.0 31.8 78.9
Jan - 82.9 39.3 89.0 76.6 31.0 70.5 98.5 - - 34.5 141.7
Feb 15.8 43.1 73.4 0.0 43.0 9.3 62.9 31.6 - - 0.0 127.4
Mar 31.1 24.7 37.6 50.7 59.4 16.7 15.4 51.0 29.0 37.5 34.2 50.6
Apr 0.0 1.4 4.5 0.0 0.0 1.5 0.0 0.0 0.0 0.0 0.0 0.0
May 0.0 0.0 0.0 0.0 0.0 0.0 0.0 0.0 0.0 0.0 0.0 0.0
Jun 0.0 0.0 0.0 0.0 0.0 0.0 0.0 0.0 0.0 0.0 0.0 0.0
24 BOTSWANA ENVIRONMENT STATISTICS: WATER & CLIMATE DIGEST 2015 Statistics Botswana Statistics Botswana BOTSWANA ENVIRONMENT STATISTICS: WATER & CLIMATE DIGEST 2015 25
Annex 1: Water production and sales in towns and cities (kilolitres) continuedYear Gaborone Lobatse Jwaneng Selibe-Phikwe Francistown Sowa Villages Sales (Pula)
Q2 5,536,241.0 814,777.0 394,718.0 2,367,839.0 2,730,707.0 122,573.0 11,966,855.0 13,355,073.0
Q3 5,073,786.0 848,805.0 466,125.0 2,407,279.0 3,076,847.0 128,335.0 12,001,177.0 13,118,869.0
Q4 4,995,433.0 883,491.0 483,072.0 2,363,041.0 2,385,715.0 125,966.0 11,236,718.0 14,254,254.0
2011 Q1 4,721,472.0 876,672.0 461,423.0 1,999,938.0 1,989,304.0 124,627.0 10,173,436.0 17,586,786.0
Q2 4,752,822.0 812,314.0 476,749.0 2,297,013.0 1,942,824.0 134,441.0 10,416,163.0 13,889,992.0
Q3 4,549,912.0 827,165.0 429,377.0 1,654,294.0 1,967,235.0 127,722.0 9,555,705.0 13,327,773.0
Q4 5,153,892.0 836,107.0 507,915.0 2,961,830.0 2,154,069.0 131,053.0 11,744,866.0 21,656,285.0
2012 Jan - - - - - - - -
Feb - - - - - - - -
Mar - - - - - - - -
Apr 2,605,694.0 818,043.9 138,315.0 736,244.0 1,213,404.8 - - -
May 2,590,836.0 813,524.6 175,999.0 711,800.5 1,243,636.8 - - -
Jun 2,234,208.0 826,530.1 144,920.0 659,507.0 1,157,673.6 - - -
July 2,451,412.0 804,721.2 129,687.0 708,702.0 1,260,338.4 - - -
Aug 2,505,470.0 745,471.4 171,316.0 720,952.0 1,091,474.0 - - -
Sep 2,547,216.0 773,732.6 162,625.0 701,876.0 1,082,584.0 - - -
Oct 2,625,707.0 803,496.7 195,027.0 709,239.0 1,178,627.2 - - -
Nov 2,470,925.0 782,900.0 191,170.0 661,403.0 1,058,340.9 - - -
Dec 2,298,238.0 784,045.1 98,517.0 628,739.3 1,098,230.7 - - -
2013 Jan 2,458,374.0 826,833.0 187,990.0 649,734.7 1,243,500.0 22,590.0 - -
Feb 2,445,300.0 645,293.0 116,134.0 644,921.8 1,234,420.0 21,260.0 - -
Apr 2,941,956.0 687,568.0 222,665.0 671,254.0 1,178,641.0 31,990.0 - -
May 2,580,440.0 757,968.0 240,320.0 681,496.0 1,208,080.0 30,030.0 - -
Jun 2,691,511.0 645,399.0 230,926.0 656,850.0 873,175.0 30,810.0 - -
July 2,590,229.0 578,556.0 223,978.0 661,222.0 1,409,844.0 26,970.0 - -
Aug 2,555,954.0 738,497.0 179,787.0 671,657.0 1,140,350.0 26,720.0 - -
Sep 2,443,516.0 776,988.0 142,671.0 715,122.0 946,190.0 38,990.0 - -
Oct 2,487,473.0 701,207.0 195,082.0 906,665.0 1,306,370.0 28,060.0 - -
Nov 2,497,082.0 593,363.0 194,401.0 822,638.0 1,343,766.0 23,260.0 - -
Dec 2,059,495.0 609,847.0 152,228.0 766,469.0 1,153,961.0 26,730.0 - -
2014 Jan 2,635,700.0 653,449.0 173,549.0 712,949.0 1,409,800.0 21,040.0 - -
Feb 2,456,118.0 0.0 151,602.0 624,484.0 1,071,098.0 15,680.0 - -
Mar 2,513,053.0 0.0 182,543.0 632,418.0 1,215,041.0 10,080.0 - -
Dash (-) = no dataSource: Water Utilities Corporation
26 BOTSWANA ENVIRONMENT STATISTICS: WATER & CLIMATE DIGEST 2015 Statistics Botswana Statistics Botswana BOTSWANA ENVIRONMENT STATISTICS: WATER & CLIMATE DIGEST 2014 27
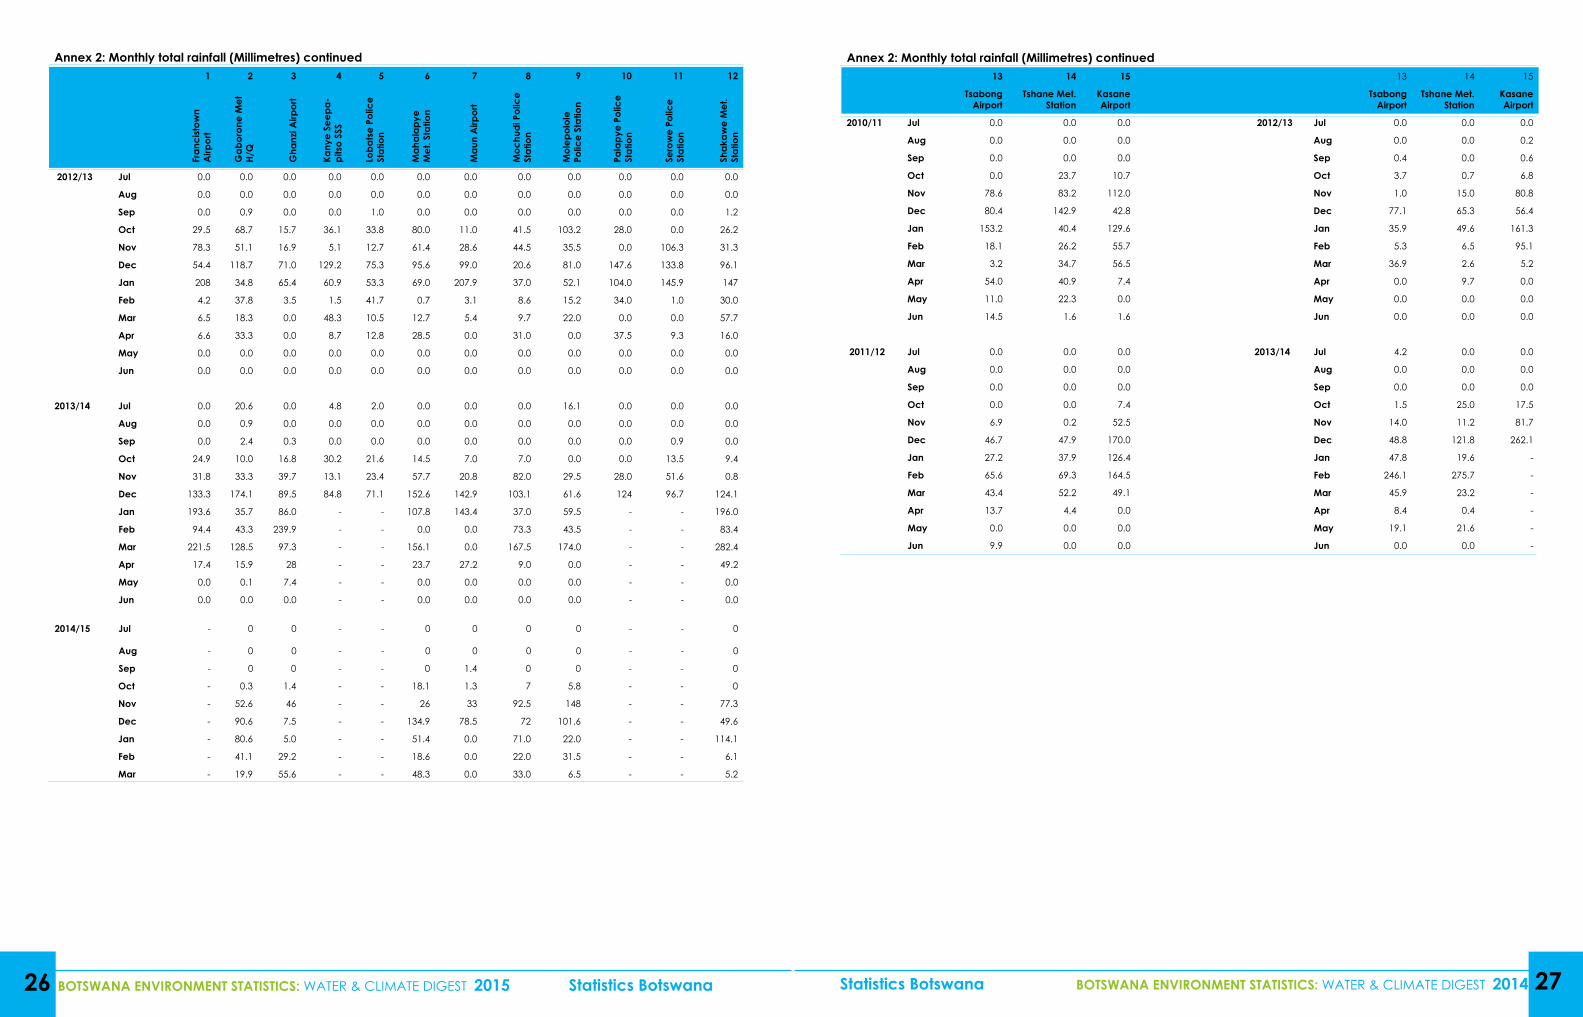
Annex 2: Monthly total rainfall (Millimetres) continued1 2 3 4 5 6 7 8 9 10 11 12
Fran
cist
own
Airp
ort
Gab
oron
e M
et
H/Q
Gha
nzi A
irpor
t
Kany
e Se
epa-
pits
o SS
S
Loba
tse
Polic
e St
atio
n
Mah
alap
ye
Met
. Sta
tion
Mau
n A
irpor
t
Moc
hudi
Pol
ice
Stat
ion
Mol
epol
ole
Polic
e St
atio
n
Pala
pye
Polic
e St
atio
n
Sero
we
Polic
e St
atio
n
Shak
awe
Met
. St
atio
n
2012/13 Jul 0.0 0.0 0.0 0.0 0.0 0.0 0.0 0.0 0.0 0.0 0.0 0.0
Aug 0.0 0.0 0.0 0.0 0.0 0.0 0.0 0.0 0.0 0.0 0.0 0.0
Sep 0.0 0.9 0.0 0.0 1.0 0.0 0.0 0.0 0.0 0.0 0.0 1.2
Oct 29.5 68.7 15.7 36.1 33.8 80.0 11.0 41.5 103.2 28.0 0.0 26.2
Nov 78.3 51.1 16.9 5.1 12.7 61.4 28.6 44.5 35.5 0.0 106.3 31.3
Dec 54.4 118.7 71.0 129.2 75.3 95.6 99.0 20.6 81.0 147.6 133.8 96.1
Jan 208 34.8 65.4 60.9 53.3 69.0 207.9 37.0 52.1 104.0 145.9 147
Feb 4.2 37.8 3.5 1.5 41.7 0.7 3.1 8.6 15.2 34.0 1.0 30.0
Mar 6.5 18.3 0.0 48.3 10.5 12.7 5.4 9.7 22.0 0.0 0.0 57.7
Apr 6.6 33.3 0.0 8.7 12.8 28.5 0.0 31.0 0.0 37.5 9.3 16.0
May 0.0 0.0 0.0 0.0 0.0 0.0 0.0 0.0 0.0 0.0 0.0 0.0
Jun 0.0 0.0 0.0 0.0 0.0 0.0 0.0 0.0 0.0 0.0 0.0 0.0
2013/14 Jul 0.0 20.6 0.0 4.8 2.0 0.0 0.0 0.0 16.1 0.0 0.0 0.0
Aug 0.0 0.9 0.0 0.0 0.0 0.0 0.0 0.0 0.0 0.0 0.0 0.0
Sep 0.0 2.4 0.3 0.0 0.0 0.0 0.0 0.0 0.0 0.0 0.9 0.0
Oct 24.9 10.0 16.8 30.2 21.6 14.5 7.0 7.0 0.0 0.0 13.5 9.4
Nov 31.8 33.3 39.7 13.1 23.4 57.7 20.8 82.0 29.5 28.0 51.6 0.8
Dec 133.3 174.1 89.5 84.8 71.1 152.6 142.9 103.1 61.6 124 96.7 124.1
Jan 193.6 35.7 86.0 - - 107.8 143.4 37.0 59.5 - - 196.0
Feb 94.4 43.3 239.9 - - 0.0 0.0 73.3 43.5 - - 83.4
Mar 221.5 128.5 97.3 - - 156.1 0.0 167.5 174.0 - - 282.4
Apr 17.4 15.9 28 - - 23.7 27.2 9.0 0.0 - - 49.2
May 0.0 0.1 7.4 - - 0.0 0.0 0.0 0.0 - - 0.0
Jun 0.0 0.0 0.0 - - 0.0 0.0 0.0 0.0 - - 0.0
2014/15 Jul - 0 0 - - 0 0 0 0 - - 0
Aug - 0 0 - - 0 0 0 0 - - 0
Sep - 0 0 - - 0 1.4 0 0 - - 0
Oct - 0.3 1.4 - - 18.1 1.3 7 5.8 - - 0
Nov - 52.6 46 - - 26 33 92.5 148 - - 77.3
Dec - 90.6 7.5 - - 134.9 78.5 72 101.6 - - 49.6
Jan - 80.6 5.0 - - 51.4 0.0 71.0 22.0 - - 114.1
Feb - 41.1 29.2 - - 18.6 0.0 22.0 31.5 - - 6.1
Mar - 19.9 55.6 - - 48.3 0.0 33.0 6.5 - - 5.2
Annex 2: Monthly total rainfall (Millimetres) continued13 14 15 13 14 15
Tsabong Airport
Tshane Met. Station
Kasane Airport
Tsabong Airport
Tshane Met. Station
Kasane Airport
2010/11 Jul 0.0 0.0 0.0 2012/13 Jul 0.0 0.0 0.0
Aug 0.0 0.0 0.0 Aug 0.0 0.0 0.2
Sep 0.0 0.0 0.0 Sep 0.4 0.0 0.6
Oct 0.0 23.7 10.7 Oct 3.7 0.7 6.8
Nov 78.6 83.2 112.0 Nov 1.0 15.0 80.8
Dec 80.4 142.9 42.8 Dec 77.1 65.3 56.4
Jan 153.2 40.4 129.6 Jan 35.9 49.6 161.3
Feb 18.1 26.2 55.7 Feb 5.3 6.5 95.1
Mar 3.2 34.7 56.5 Mar 36.9 2.6 5.2
Apr 54.0 40.9 7.4 Apr 0.0 9.7 0.0
May 11.0 22.3 0.0 May 0.0 0.0 0.0
Jun 14.5 1.6 1.6 Jun 0.0 0.0 0.0
2011/12 Jul 0.0 0.0 0.0 2013/14 Jul 4.2 0.0 0.0
Aug 0.0 0.0 0.0 Aug 0.0 0.0 0.0
Sep 0.0 0.0 0.0 Sep 0.0 0.0 0.0
Oct 0.0 0.0 7.4 Oct 1.5 25.0 17.5
Nov 6.9 0.2 52.5 Nov 14.0 11.2 81.7
Dec 46.7 47.9 170.0 Dec 48.8 121.8 262.1
Jan 27.2 37.9 126.4 Jan 47.8 19.6 -
Feb 65.6 69.3 164.5 Feb 246.1 275.7 -
Mar 43.4 52.2 49.1 Mar 45.9 23.2 -
Apr 13.7 4.4 0.0 Apr 8.4 0.4 -
May 0.0 0.0 0.0 May 19.1 21.6 -
Jun 9.9 0.0 0.0 Jun 0.0 0.0 -
28 BOTSWANA ENVIRONMENT STATISTICS: WATER & CLIMATE DIGEST 2015 Statistics Botswana Statistics Botswana BOTSWANA ENVIRONMENT STATISTICS: WATER & CLIMATE DIGEST 2015 29
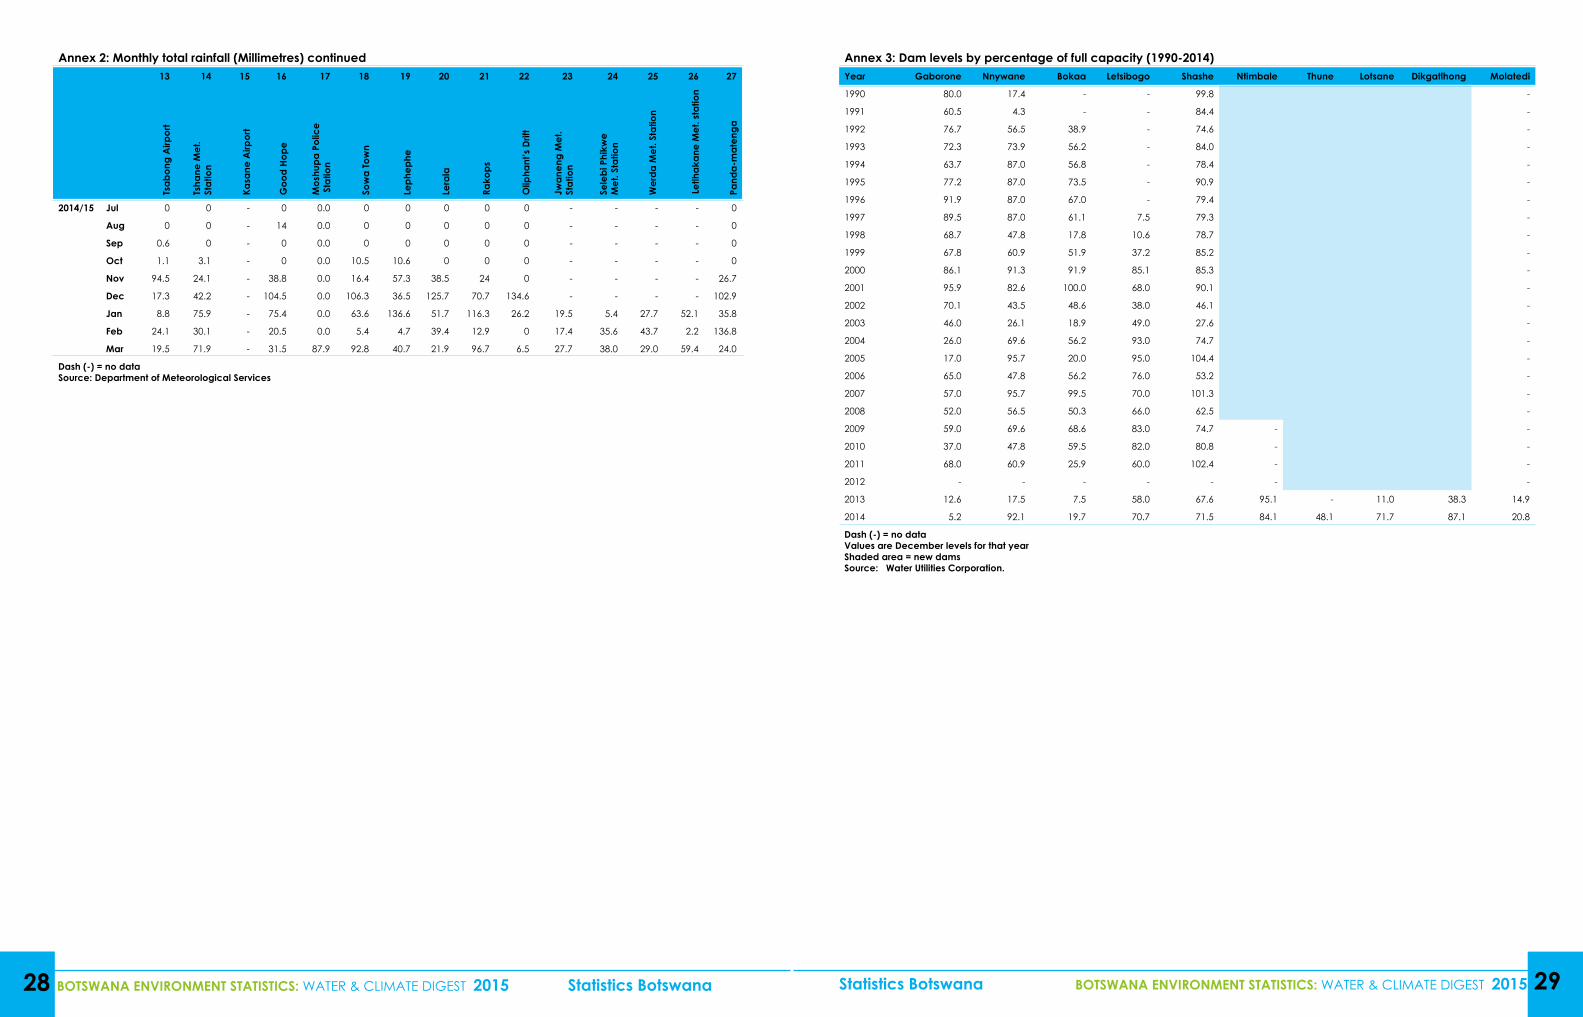
Annex 2: Monthly total rainfall (Millimetres) continued13 14 15 16 17 18 19 20 21 22 23 24 25 26 27
Tsab
ong
Airp
ort
Tsha
ne M
et.
Stat
ion
Kasa
ne A
irpor
t
Goo
d Ho
pe
Mos
hupa
Pol
ice
Sta
tion
Sow
a To
wn
Leph
ephe
Lera
la
Rako
ps
Olip
hant
’s D
rift
Jwan
eng
Met
. St
atio
n
Sele
bi P
hikw
eM
et. S
tatio
n
Wer
da M
et. S
tatio
n
Letlh
akan
e M
et. s
tatio
n
Pand
a-m
aten
ga
2014/15 Jul 0 0 - 0 0.0 0 0 0 0 0 - - - - 0
Aug 0 0 - 14 0.0 0 0 0 0 0 - - - - 0
Sep 0.6 0 - 0 0.0 0 0 0 0 0 - - - - 0
Oct 1.1 3.1 - 0 0.0 10.5 10.6 0 0 0 - - - - 0
Nov 94.5 24.1 - 38.8 0.0 16.4 57.3 38.5 24 0 - - - - 26.7
Dec 17.3 42.2 - 104.5 0.0 106.3 36.5 125.7 70.7 134.6 - - - - 102.9
Jan 8.8 75.9 - 75.4 0.0 63.6 136.6 51.7 116.3 26.2 19.5 5.4 27.7 52.1 35.8
Feb 24.1 30.1 - 20.5 0.0 5.4 4.7 39.4 12.9 0 17.4 35.6 43.7 2.2 136.8
Mar 19.5 71.9 - 31.5 87.9 92.8 40.7 21.9 96.7 6.5 27.7 38.0 29.0 59.4 24.0
Dash (-) = no data Source: Department of Meteorological Services
Annex 3: Dam levels by percentage of full capacity (1990-2014)Year Gaborone Nnywane Bokaa Letsibogo Shashe Ntimbale Thune Lotsane Dikgatlhong Molatedi
1990 80.0 17.4 - - 99.8 -
1991 60.5 4.3 - - 84.4 -
1992 76.7 56.5 38.9 - 74.6 -
1993 72.3 73.9 56.2 - 84.0 -
1994 63.7 87.0 56.8 - 78.4 -
1995 77.2 87.0 73.5 - 90.9 -
1996 91.9 87.0 67.0 - 79.4 -
1997 89.5 87.0 61.1 7.5 79.3 -
1998 68.7 47.8 17.8 10.6 78.7 -
1999 67.8 60.9 51.9 37.2 85.2 -
2000 86.1 91.3 91.9 85.1 85.3 -
2001 95.9 82.6 100.0 68.0 90.1 -
2002 70.1 43.5 48.6 38.0 46.1 -
2003 46.0 26.1 18.9 49.0 27.6 -
2004 26.0 69.6 56.2 93.0 74.7 -
2005 17.0 95.7 20.0 95.0 104.4 -
2006 65.0 47.8 56.2 76.0 53.2 -
2007 57.0 95.7 99.5 70.0 101.3 -
2008 52.0 56.5 50.3 66.0 62.5 -
2009 59.0 69.6 68.6 83.0 74.7 - -
2010 37.0 47.8 59.5 82.0 80.8 - -
2011 68.0 60.9 25.9 60.0 102.4 - -
2012 - - - - - - -
2013 12.6 17.5 7.5 58.0 67.6 95.1 - 11.0 38.3 14.9
2014 5.2 92.1 19.7 70.7 71.5 84.1 48.1 71.7 87.1 20.8
Dash (-) = no dataValues are December levels for that yearShaded area = new damsSource: Water Utilities Corporation.
30 BOTSWANA ENVIRONMENT STATISTICS: WATER & CLIMATE DIGEST 2015 Statistics Botswana Statistics Botswana BOTSWANA ENVIRONMENT STATISTICS: WATER & CLIMATE DIGEST 2014 31
Related Documents