Welcome message from author
This document is posted to help you gain knowledge. Please leave a comment to let me know what you think about it! Share it to your friends and learn new things together.
Transcript


Xavier Brusset (SKEMA Business School Paris, France)
Christoph Teller (Johannes Kepler University, Linz, Austria)
J�U JOHANNES KEPLER
UNIVERSITY LINZ
CERR ADVISORV BOARD
Herbert Kotzab (University of Bremen, Bremen, Germany)
� Universitat Bremen
Marta Frasquet (University of Valencia, Valencia, Spain)
6


DETAILED PROGRAMME CERR 2020
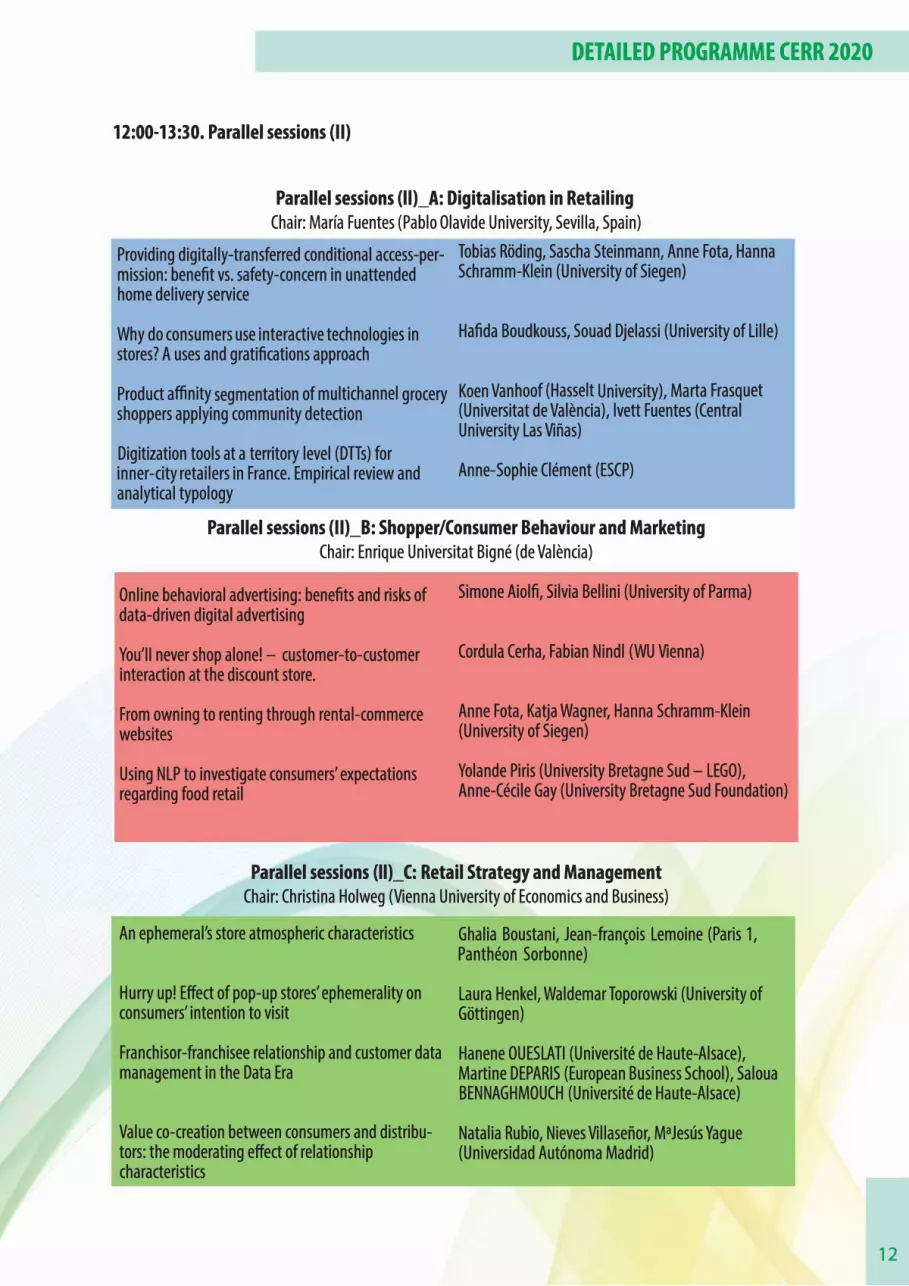
12:00-13:30. Parallel sessions (11)
Parallel sessions (ll)_A: Digitalisation in Retailing Chair: María Fuentes (Pablo Olavide University, Sevilla, Spain)
Providing digitally-transferred conditional access-per- Tobias Roding, Sascha Steinmann, Anne Fota, Hanna mission: benefit vs. safety-concern in unattended Schramm-Klein (University of Siegen) home delivery service
Why do consumers use interactive technologies in stores? A uses and gratifications approach
Hafida Boudkouss, Souad Djelassi {University of Lille)
Product affinity segmentation of multichannel grocery Koen Vanhoof {Hasselt University), Marta Frasquet shoppers applying community detection (Universitat de Valencia), lvett Fuentes (Central
University Las Viñas) Digitization tools at a territory level (DTTs) for inner-city retailers in France. Empirical review and analytical typology
Anne-Sophie Clément (ESCP)
Parallel sessions (11)_8: Shopper/Consumer Behaviour and Marketing Chair: Enrique Universitat Bigné (de Valencia)
Online behavioral advertising: benefits and risks of data-driven digital advertising
You'II never shop alone! - customer-to-customer interaction at the discount store.
From owning to renting through rental-commerce websites
Using NLP to investigate consumers' expectations regarding food retail
Simone Aiolfi, Silvia Bellini (University of Parma)
Cordula Cerha, Fabian Nindl (WU Vienna)
Anne Fota, Katja Wagner, Hanna Schramm-Klein {University of Siegen)
Yolande Piris (University Bretagne Sud - LEGO), Anne-Cécile Gay (University Bretagne Sud Foundation)
Parallel sessions (ll)_C: Retail Strategy and Management Chair: Christina Holweg {Vienna University of Economics and Business)
An ephemeral's store atmospheric characteristics
Hurry up! Effect of pop-up stores' ephemerality on consumers' intention to visit
Ghalia Boustani, Jean-fran�ois Lemoine (París 1, Panthéon Sorbonne)
Laura Henkel, Waldemar Toporowski (University of Gottingen)
Franchisor-franchisee relationship and customer data Hanene OUESLATI (Université de Haute-Alsace), management in the Data Era Martine DEPARIS (European Business School), Saloua
BENNAGHMOUCH (Université de Haute-Alsace)
Value co-creation between consumers and distributors: the moderating effect of relationship characteristics
Natalia Rubio, Nieves Villaseñor, MªJesús Vague (Universidad Autónoma Madrid)
12


18
ADOPTION OF OMNI-CHANNEL RETAILING AMONGST CONSUMERS: THE CASE OF THE GERMAN BRAND AND COIN COLLECTORS SEGMENT
Mrutzek, Bastian*; Koch, Lennart*; Kotzab, Herbert*; Leitschuh, Daniela*; Varelmann, Michael*; Yumurtacı Hüseyinoğlu, Işık Özge+
*) University of Bremen, Chair in Logistics Management
+) Izmir University of Economics, Faculty of Business, Logistics Management Purpose: In this study, we examined the acceptance of omni-channel approaches amongst German consumers and wanted to gain insight into the specific factors, which drive the consumer acceptance of omni-channel retailing. There is limited literature on segmenting customers in omni-channel acceptance. Hence, the research aims to provide the factors of omni-channel acceptance of a special customer segment, namely collectors. The motivation comes from the behavioural characteristics of collectors and limited studies on customer segmentation in omni-channel research (Valentini et al., 2020). The collectors are interested in networking, sharing, consulting and researching and have brand attachment (Kessous et al., 2014; Spaid, 2018). Today, omni-channel customers have similar characteristics. Therefore, our study focuses on the acceptance of omni-channel retailing within the community of stamp and coin collectors in Germany by testing an extended technology acceptance model that incorporates innovation diffusion theory. Design/methodology/approach: Omni-channel retailing focuses on seamless customer experience by using the channels and touchpoints in an integrated manner (Verhoef et al., 2015; Galipoğlu et al., 2018). We follow the notions of Wu and Wang (2005) as well as Costa e Silva et al. (2018) by understanding omni-channel retailing as a kind of technology driven strategy (Brynjolfsson et al., 2013; Piotrowicz and Cuthberston, 2014; Verhoef et al., 2015; Sramek et al., 2020) and consequently applied the technology acceptance model (TAM) as developed by Venkathesh & Davis (2000) and used in omni-channel research (e.g.Park and Kim, 2020) in order to be able to measure particularities of our special consumer segment. The questionnaire was distributed amongst various online collector communities (e.g. on Facebook) as well was circulated in printed version in numismatic and philately specialty stores. Finally, we received a sample of 335 respondents out which 228 questionnaires were usable. For the measurement model, confirmatory factor analysis with maximum likelihood was performed with AMOS. The overall fit statistics (𝜒𝜒𝜒𝜒2/df= 3.174, GFI= 0.843, CFI= 0.949, NNFI= 0.928, RMSEA= 0,098 and SRMR= 0,0563) indicated that the model had an acceptable fit. Structural equation modeling was used to test the research hypotheses. Reliability and validity are verified. The composite reliability of each construct exceeded the recommended level of 0.70. Convergent validity was obtained with average variance extracted (AVE) value of each construct which was above 0.5. Also, discriminant validity was examined while the correlation coefficient of the two dimensions was less than the square root of the AVE.
19
Findings: Our findings provide empirical evidence for the developed conceptual model on omni-channel retailing acceptance by consumers. In particular, our data shows that the intention to use omni-channel approaches has a significant positive effect on the actual use (b=0.70, p<0.01). Likewise, we were able to identify that the usefulness of omni-channel approaches significantly affects the perceived use too (b=0.67, p<0.01). In addition to these, compatibility which shows whether or not omni-channel approaches are perceived as consistent with existing values, lifestyles or past experiences of the users significantly affects the perceived usefulness of omni-channel approaches (b= 0.59, p<0.01). Contrary to this, compatibility does not have a significant effect on intention to use (b= 0.07, p > 0.01). This can be explained with fast and frequent advances in technology used for omni-channel approach. Therefore, from consumers’ perspective compatibility is not a factor to be concerned for intention to use. When it comes to the risk of using omni-channel approaches, we identified a negative significant influence on the perceived use (b= -0.19, p<0.01). Though when it comes to costs of using omni-channel approaches and their perceived usefulness, we obtained interesting results. Contrary to other studies in the field, we were not able to show a significant influence of costs on the intention to use omni-channel approaches (b= -0.09, p>0.01). This may be due to the high level of mobile technology diffusion (e.g. tablets, laptop computers or smartphones) amongst these consumers and their high usage affinity. Consequently, the costs of using these technologies are low as well as the barriers to use omni-channel approaches. Furthermore, perceived ease of use of omni-channel approaches does not have a significant positive effect on the perceived usefulness of omni-channel approaches (b= 0.03, p>0.01). This may be due to the consumers’ high involvement in technology and awareness on perceived usefulness of omni-channel approaches. Lastly, perceived ease of use does not have a positive impact on intention to use (b= -0.09, p>0.01). It can be inferred that consumers are convinced to use omni-channel approach when they are perceived with its usefulness. Originality/value: The retailers seek ways of enhancing their knowledge on the actual use of omni-channel retailing. To our knowledge, our study is one of the first studies on the acceptance of omni-channel approaches within a particular consumer segment, namely the stamp and coin collectors branch. This study continues the research in the area of mobile commerce technology acceptance and confirms partly the existing theory saying that certain factors drive the intention to use a technology which then affects the actual use of it. Therefore, this research contributes to omni-channel literature and sheds light on the factors of a specific consumer segment. Contrary to existing knowledge, our findings show differences when it comes to the risk of technology use and its influence on the intention to use omni-channel approaches. This may be explained by the characteristics of the specific consumer group. Omni-channel acceptance is not same among the consumers. The findings provide some practical implications. The retailers should focus on special consumer segments and develop related solutions accordingly. This will increase the actual use of omni-channel retailing and consequently revenue of retailers. The features of touchpoints (e.g. mobile application, web site, social media platforms) need to enhance customer engagement and increase awareness on the intention to use and consequently usage behaviour. The features should be updated frequently in accordance with consumer dynamics.
20
References: Brynjolfsson, E., Hu, Y. J., & Rahman, M. S. (2013): Competing in the age of omnichannel retailing (pp. 1-7). Cambridge: MIT. Davis-Sramek, B., Ishfaq, R., Gibson, B. J., & Defee, C. (2020): Examining retail business model transformation: a longitudinal study of the transition to omnichannel order fulfillment. International Journal of Physical Distribution & Logistics Management. DOI 10.1108/IJPDLM-02-2019-0055 Galipoglu, E., Kotzab, H., Teller, C., Hüseyinoglu, I. Ö. Y., & Pöppelbuß, J. (2018). Omni-channel retailing research–state of the art and intellectual foundation. International Journal of Physical Distribution & Logistics Management. Kessous, A., Roux, E., & Chandon, J. L. (2015): Consumer–brand relationships: A contrast of nostalgic and non‐nostalgic brands. Psychology & Marketing, 32(2), 187-202. Park, J., & Kim, R. B. (2020): The effect of app quality and compatibility on consumers’ omnichannel (OC) app adoption and loyalty: comparison of US and Korean consumers. In Advances in Digital Marketing and eCommerce (pp. 163-178). Springer, Cham. Piotrowicz, W., & Cuthbertson, R. (2014): Introduction to the special issue information technology in retail: Toward omnichannel retailing. International Journal of Electronic Commerce, 18(4), 5-16. Spaid, B. (2018): Exploring consumer collecting behavior: a conceptual model and research agenda, Journal of Consumer Marketing, 35, 6, 653–662 Valentini, S., Neslin, S. A., & Montaguti, E. (2020): Identifying omnichannel deal prone segments, their antecedents, and their consequences. Journal of Retailing https://doi.org/10.1016/j.jretai.2020.01.003 Verhoef, P. C., Kannan, P. K., & Inman, J. J. (2015): From multi-channel retailing to omni-channel retailing: introduction to the special issue on multi-channel retailing. Journal of retailing, 91(2), 174-181. Wu, J.-H.; Wang, S.-C. (2005): What drives mobile commerce?: An empirical evaluation of the revised technology acceptance model, Information & Management, 42, 5, 719-729 Costa e Silva, S.; Martin, C.; de Almeida Martins, J. (2018): Omnichannel: factors affecting consumer acceptance, Journal of Marketing Channels, 25, 1-2, 73-84 Venkatesh, V.; Davis, F. (2000): A theoretical extension of the technology acceptance model: four longitudinal studies, Management Science, 46, 2, 186-204 Keywords: Technology acceptance model, omni-channel retailing, consumer acceptance
21
1
ANALYSING COMPETITIVE SHOWROOMING BEHAVIOURS
Marta FRASQUET Department of Marketing
University of Valencia, Valencia, Spain
Maria-Jose MIQUEL-ROMERO
Department of Marketing
University of Valencia, Valencia, Spain
Introduction Digital technologies have impacted the way consumers interact with retailers. Showrooming behaviour, i.e., using the offline channel to gather information and the online channel to purchase, is an increasingly popular practice. The increasing use of smartphones fuels the practice of showrooming, as consumers research in-store using the mobile device (Sit et al., 2018). Retailers feel threatened by showrooming, as most often the purchase is made at a competing online retailer (Gensler et al., 2017). Competitive showrooming is believed to be driven by the search for price benefits; however, Gensler et al. (2017) found that, together with price, other variables such as better quality products, lower search costs, and availability of salesperson also play a role.
The literature analysing showrooming is sparse, and has focused on explaining showrooming attitude or showrooming intentions based on variables related to individual traits, such as price sensitivity, social interaction, convenience or perceived control (Arora and Sahney, 2018; Flavián et al., 2020; Kang, 2018; Rejón-Guardia and Luna-Nevarez, 2017). There is little research on the influence of situational factors related to specific shopping experience at the store, except for the qualitative study of Sit et al. (2018), or the segmentation study of Schneider and Zielke (2020). Furthermore, the role that relational variables such as retailer loyalty can play in deterring competitive showrooming has only been explored by Schneider and Zielke (2020). Thus, there is a lack of understanding of the reasons why showroomers purchase online at a competing retailer instead of at the physical retailer visited for gathering information. By analysing not only individual traits, but also the role of situational and relational variables in competitive showrooming, we provide actionable variables for multichannel retailers to try to reduce the likelihood of customer buying online at a competing retailer.
Purpose This paper aims to explain the practice of competitive showrooming as a result of the individual’s search for value for money, situational variables affecting the in-store experience, and variables characterising the consumer-retailer relationship. Based on the main tenets of the methodology performed (fuzzy-set Qualitative Comparative Analysis - fsQCA), the aim of this research is to identify patterns of competitive showroomers as different combinations of the mentioned characteristics.
22
2
Conceptual framework Our conceptual framework is based mainly on the literature that has attempted to explain showrooming going beyond individual characteristics, and particularly looking at variables other than the search for lower prices online (Gensler et al., 2017; Schneider and Zielke, 2020; Sit et al., 2018). We suggest that showroomers would purchase online at a competing retailer (i.e. would undertake competitive showrooming instead of loyal showrooming) when conditions such as searching for the best value for money, not having a good shopping experience at the store, or individuals with weak relational bonds with the retailer, are present.
Value consciousness is a consumer personality trait defined as “a concern for paying low prices, subject to some quality constraint” (Lichtenstein et al., 1993, p. 235). Value-conscious individuals try to be smart shoppers, sensitive not just to price but also to quality (Cho et al., 2006). They regularly carry out in-depth information processing because their main goal is to get the product of the highest quality at the lowest price (Delgado-Ballester et al., 2014). That concern results in higher shopping hesitation, delay of the purchase, and weaker loyalty intentions (Demirgünes, 2018; Zheng et al., 2017), which could result in a higher probability of competitive showrooming.
The situational variables related to the in-store experience that could most influence the decision to leave the store and purchase online at a competing retailer are perceived crowding and perceived quality of salesperson (Gensler et al., 2017). According to the theory of overstimulation (Oldham and Fried, 1987), the cognitive overload derived from a crowded environment lowers the focus, increases distraction, and hinders cognitive processing. Perceived crowding will result in cognitive, affective, and behavioural outcomes that will precipitate an earlier departure from the store (O’Guinn et al., 2015) and could lead to showrooming. However, findings are equivocal (Jones et al., 2010), and Metha et al. (2013) suggest the consideration of an inverted U-shaped relationship between perceived crowding and patronage intention; in other words, an optimal crowding level exists, which is mediated by individual as well as situational variables. On the other hand, there is plenty of literature supporting the relevance of in-store salesperson’s friendliness, interpersonal sensitivity, competence and, in general, customer service quality. Salespersons can help to reduce shopping risks, increase customer’s satisfaction, and improve return rates (Ertekin et al., 2019; Puccinelli et al., 2013; Croning et al., 2000), which could prevent competitive showrooming behavior.
Regarding relational variables, trust, satisfaction and loyalty, are considered in the literature three fundamental variables to build a strong customer-retailer relationship. Trust plays a pivotal role in building lasting exchange relationships (Morgan and Hunt, 1994). Based on the conceptualization of trust of Moorman et al. (1992), we define retailer trust as the willingness to rely on the ability of the retailer to perform its role. Trust has been correlated with loyalty in the retail context (e.g. Sirdeshmukh et al., 2002). In uncertain environments, where consumers feel vulnerable, trust would help consumers make decisions (Chaudhuri and Holbrook, 2001). Customer satisfaction represents the consumer fulfillment response to the shopping experience (Oliver, 1980). In the retail sector, satisfaction is defined as a “post-consumption evaluation of how well a store or product meets or exceeds customer expectations” (Levy and Weitz, 2009, p.111). It has been related to personal interaction quality, and loyalty (Vesel and Zabkar, 2009). Customer loyalty is a critical relational outcome in business-to-consumer relationships. Loyalty captures the strength of the relationship and is reflected in attitudinal and behavioural responses (Dick and Basu, 1994). Loyal customers tend to revisit the retailer, repurchase products, and recommend it (Zeithaml et al., 1996). Thus, it could be expected that loyal customers would be less likely to purchase online at a competing retailer.
23
2
Conceptual framework Our conceptual framework is based mainly on the literature that has attempted to explain showrooming going beyond individual characteristics, and particularly looking at variables other than the search for lower prices online (Gensler et al., 2017; Schneider and Zielke, 2020; Sit et al., 2018). We suggest that showroomers would purchase online at a competing retailer (i.e. would undertake competitive showrooming instead of loyal showrooming) when conditions such as searching for the best value for money, not having a good shopping experience at the store, or individuals with weak relational bonds with the retailer, are present.
Value consciousness is a consumer personality trait defined as “a concern for paying low prices, subject to some quality constraint” (Lichtenstein et al., 1993, p. 235). Value-conscious individuals try to be smart shoppers, sensitive not just to price but also to quality (Cho et al., 2006). They regularly carry out in-depth information processing because their main goal is to get the product of the highest quality at the lowest price (Delgado-Ballester et al., 2014). That concern results in higher shopping hesitation, delay of the purchase, and weaker loyalty intentions (Demirgünes, 2018; Zheng et al., 2017), which could result in a higher probability of competitive showrooming.
The situational variables related to the in-store experience that could most influence the decision to leave the store and purchase online at a competing retailer are perceived crowding and perceived quality of salesperson (Gensler et al., 2017). According to the theory of overstimulation (Oldham and Fried, 1987), the cognitive overload derived from a crowded environment lowers the focus, increases distraction, and hinders cognitive processing. Perceived crowding will result in cognitive, affective, and behavioural outcomes that will precipitate an earlier departure from the store (O’Guinn et al., 2015) and could lead to showrooming. However, findings are equivocal (Jones et al., 2010), and Metha et al. (2013) suggest the consideration of an inverted U-shaped relationship between perceived crowding and patronage intention; in other words, an optimal crowding level exists, which is mediated by individual as well as situational variables. On the other hand, there is plenty of literature supporting the relevance of in-store salesperson’s friendliness, interpersonal sensitivity, competence and, in general, customer service quality. Salespersons can help to reduce shopping risks, increase customer’s satisfaction, and improve return rates (Ertekin et al., 2019; Puccinelli et al., 2013; Croning et al., 2000), which could prevent competitive showrooming behavior.
Regarding relational variables, trust, satisfaction and loyalty, are considered in the literature three fundamental variables to build a strong customer-retailer relationship. Trust plays a pivotal role in building lasting exchange relationships (Morgan and Hunt, 1994). Based on the conceptualization of trust of Moorman et al. (1992), we define retailer trust as the willingness to rely on the ability of the retailer to perform its role. Trust has been correlated with loyalty in the retail context (e.g. Sirdeshmukh et al., 2002). In uncertain environments, where consumers feel vulnerable, trust would help consumers make decisions (Chaudhuri and Holbrook, 2001). Customer satisfaction represents the consumer fulfillment response to the shopping experience (Oliver, 1980). In the retail sector, satisfaction is defined as a “post-consumption evaluation of how well a store or product meets or exceeds customer expectations” (Levy and Weitz, 2009, p.111). It has been related to personal interaction quality, and loyalty (Vesel and Zabkar, 2009). Customer loyalty is a critical relational outcome in business-to-consumer relationships. Loyalty captures the strength of the relationship and is reflected in attitudinal and behavioural responses (Dick and Basu, 1994). Loyal customers tend to revisit the retailer, repurchase products, and recommend it (Zeithaml et al., 1996). Thus, it could be expected that loyal customers would be less likely to purchase online at a competing retailer.
3
Design/methodology/approach We collected data via an online survey to a Spanish panel. The population were individuals who had done mobile showrooming in the last six months in the apparel or electronics category, and had interacted with a store’s salesperson. After applying these criteria, we reached a valid sample of 401 showroomers. The outcome variable was operationalised as purchasing online at a retailer other than the one visited physically. 81% of the sample undertook this behaviour.
The measures of the relevant variables for our research were collected in the questionnaire through 7-point multi-item Likert scales taken from previous literature: value consciousness (Delgado-Ballester et al., 2014), perceived crowding (Mattila and Wirtz, 2008), quality of in-store salesperson (Gensler et al., 2017), and retailer trust, satisfaction and loyalty (Lee et al., 2007). We checked the psychometric properties of the scales via a confirmatory factor analysis with EQS 6.1 using the robust estimation method. All values of the relevant indicators confirmed the reliability and validity of the measures.
FsQCA was utilised to explore the data and reach our research goal. This technique analyses how causal conditions lead to a particular outcome. Two relevant characteristics of this technique are equifinality (there can be more than one path or solution to the same outcome) and causal complexity (not all the variables considered in the analysis have to be relevant jointly) (Woodside, 2016).
In order to work with fsQCA, we calculated the average of multi-item scales, and recoded the outcome variable. Additionally, we calibrated the measures to translate them into fuzzy set membership scores. We took the median value of each construct as the cross-over point for all the possible causal conditions, and considered the 10% percentile for the full non-membership, and the 90% percentile for the full-membership.
Findings Four different causal configurations resulted as sufficient conditions for the outcome to occur. In other words, individuals can be grouped into four solutions that explain participation in competitive mobile showrooming. Together, they explained 66.5% of the competitive mobile showrooming behaviours, with an overall solution consistency of 84%, reaching the minimum thresholds required (Ragin, 2000).
According to the results:
Solution 1. Shoppers that do not trust, are not satisfied with the retailer and are not loyal to it. In this solution, no other variable is needed for competitive showrooming to occur (Consistency=0.85). Solution 2. Consumers that are satisfied with the retailer, are loyal to it, and in the shopping situation, although they perceived high in-store salesperson quality, they also perceived high crowding (Consistency=0.78).
Solution 3. Shoppers that did not perceived high crowding in the shopping situation at the store, and perceived high in-store salesperson quality, but they are not loyal to the retailer (Consistency=0.80)
Solution 4. Individuals that are satisfied with the retailer, but they are value-conscious and did not perceive high quality of in-store salesperson when they visited the store (Consistency=0.78).
Contributions
24
4
The contribution of this paper to multichannel literature is, first, to focus on competitive showrooming, as most papers have not specifically assessed whether online purchase takes place at the visited retailer for information gathering (loyal showrooming) or at a different retailer (competitive showrooming). Second, to investigate showrooming behaviour as a function of variables related to the retailer, both referring to the in-store shopping experience and to the relational bonds with the customer. Existing literature mainly focuses on individual variables that are not under the control of the retailer, such as price consciousness. Third, by applying the fsQCA methodology, we provide results that are not based on causal relationships but suggest different patterns based on combinations of variables that lead to competitive showrooming. This may be an appropriate way to analyse complex and yet little known behaviours such as showrooming.
Practical implications To reduce the likelihood of competitive showrooming, retailers should develop actions to build customer loyalty, trust and satisfaction. If those relational variables are not present (solutions 1 & 3), the individual will do competing mobile showrooming. Loyalty programmes, newsletters, direct and fluent communication through mass and social media, among others, could foster those relational measures. But that is not enough. Even in the situation in which some of those relational variables occur, our results revealed that the specific experience at the time of the visit to the retailer in a physical store could also be crucial for potential competitive showrooming. Perceived store crowding (solution 2) or a low quality salesperson service (solutions 4) are also related to competitive showrooming. Thus, retailers should train their salespeople to provide high quality customer service and to be able to identify customer’s needs, as it will help them to better assist value conscious customers (solution 4); for those loyal customers, service quality and value will be the key factors to avoid competing showrooming. On the other hand, retailers should identify the peak hours at the physical store, in order to reduce crowding. A perception of crowding or poor attention of the salesperson will provoke competitive showrooming, even in loyal and/or satisfied customers.
Research limitations and outlook Future research should consider additional product categories in order to generalize results, or even consider how the specific product category could condition the obtained results. Moreover, other measures that could influence competitive showrooming should be taken into consideration, such as the existence of a retailer app or the individual’s dependence to the mobile device. Our research design included the situational variables of perceived crowding and quality in-store salesperson, as they are believed to be, respectively, the main deterrent and main benefit of shopping in physical stores. However, situational variables could also include promotional offers that take place at the store or at competing online retailers.
References Arora, S. and Sahney, S. (2018), “Antecedents to consumers’ showrooming behaviour: an integrated TAM-TPB framework”, Journal of Consumer Marketing, Vol. 35 No. 4, pp. 438-450.
Chaudhuri, A. and Holbrook, M.B. (2001), “The chain of effects from brand trust and brand affect to brand performance: the role of brand loyalty”, Journal of Marketing, Vol. 65 No. 2, pp. 81-93.
Cho, C. H., Kang, J. and Cheon, H. J. (2006), “Online Shopping Hesitation”, CyberPsychology & Behavior. Vol. 9 No. 3, pp. 261-274.
25
4
The contribution of this paper to multichannel literature is, first, to focus on competitive showrooming, as most papers have not specifically assessed whether online purchase takes place at the visited retailer for information gathering (loyal showrooming) or at a different retailer (competitive showrooming). Second, to investigate showrooming behaviour as a function of variables related to the retailer, both referring to the in-store shopping experience and to the relational bonds with the customer. Existing literature mainly focuses on individual variables that are not under the control of the retailer, such as price consciousness. Third, by applying the fsQCA methodology, we provide results that are not based on causal relationships but suggest different patterns based on combinations of variables that lead to competitive showrooming. This may be an appropriate way to analyse complex and yet little known behaviours such as showrooming.
Practical implications To reduce the likelihood of competitive showrooming, retailers should develop actions to build customer loyalty, trust and satisfaction. If those relational variables are not present (solutions 1 & 3), the individual will do competing mobile showrooming. Loyalty programmes, newsletters, direct and fluent communication through mass and social media, among others, could foster those relational measures. But that is not enough. Even in the situation in which some of those relational variables occur, our results revealed that the specific experience at the time of the visit to the retailer in a physical store could also be crucial for potential competitive showrooming. Perceived store crowding (solution 2) or a low quality salesperson service (solutions 4) are also related to competitive showrooming. Thus, retailers should train their salespeople to provide high quality customer service and to be able to identify customer’s needs, as it will help them to better assist value conscious customers (solution 4); for those loyal customers, service quality and value will be the key factors to avoid competing showrooming. On the other hand, retailers should identify the peak hours at the physical store, in order to reduce crowding. A perception of crowding or poor attention of the salesperson will provoke competitive showrooming, even in loyal and/or satisfied customers.
Research limitations and outlook Future research should consider additional product categories in order to generalize results, or even consider how the specific product category could condition the obtained results. Moreover, other measures that could influence competitive showrooming should be taken into consideration, such as the existence of a retailer app or the individual’s dependence to the mobile device. Our research design included the situational variables of perceived crowding and quality in-store salesperson, as they are believed to be, respectively, the main deterrent and main benefit of shopping in physical stores. However, situational variables could also include promotional offers that take place at the store or at competing online retailers.
References Arora, S. and Sahney, S. (2018), “Antecedents to consumers’ showrooming behaviour: an integrated TAM-TPB framework”, Journal of Consumer Marketing, Vol. 35 No. 4, pp. 438-450.
Chaudhuri, A. and Holbrook, M.B. (2001), “The chain of effects from brand trust and brand affect to brand performance: the role of brand loyalty”, Journal of Marketing, Vol. 65 No. 2, pp. 81-93.
Cho, C. H., Kang, J. and Cheon, H. J. (2006), “Online Shopping Hesitation”, CyberPsychology & Behavior. Vol. 9 No. 3, pp. 261-274.
5
Croning, J.J., Brady, M. and Hult, T. (2000), “Assessing the effects of quality, value, and customer satisfaction on consumer behavioral intentions in service environments”, Journal of Retailing, Vol. 76 No. 2, pp. 93–218.
Delgado-Ballester, E., Hernández-Espallardo, M. and Rodríguez-Orejuela, A. (2014), “Store image influences in consumers’ perceptions of store brands: the moderating role of value consciousness”, European Journal of Marketing, Vol. 48 No. 9, pp. 15-16.
pping hesitation”, METU Studies in Development, Vol. 1 No. 1, pp. 25-57.
Dick, A.S. and Basu, K. (1994), “Customer loyalty: toward an integrated conceptual framework”, Journal of the Academy of Marketing Science, Vol. 22 No. 2, pp. 99-113.
Ertekin, N., Ketzenberg, M. E. and Heim, G. R. (2019), “Assessing impacts of store and salesperson dimensions of retail service quality on consumer returns”, Production and Operations Management, https://doi.org/10.1111/j.1937-5956.2019.13077.x.
Flavián, C., Gurrea, R. and Orús, C. (2020), “Combining channels to make smart purchases: The role of webrooming and showrooming”, Journal of Retailing and Consumer Services, Vol. 52, 101923.
Gensler, S., Neslin, S. A. and Verhoef, P. C. (2017), “The showrooming phenomenon: it's more than just about price”, Journal of Interactive Marketing, Vol. 38, pp. 29-43.
Jones, M. Y., Vilches-Montero, S., Spence, M. T., Eroglu, S. A. and Machleit, K. A. (2010), “Do Australian and American consumers differ in their perceived shopping experiences?: A bi-cultural analysis”, International Journal of Retail & Distribution Management, Vol. 38 No. 8, pp. 578-596.
Kang, J. Y. M. (2018), “Showrooming, webrooming, and user-generated content creation in the omnichannel era”, Journal of Internet Commerce, Vol. 17 No. 2, pp. 145-169.
Lee, K. Y., Huang, H. L. and Hsu, Y. C. (2007), “Trust, satisfaction and commitment-on loyalty to international retail service brands”, Asia Pacific Management Review, Vol. 12 No. 3, pp. 161-169.
Levy, M. and Weitz, A.B. (2009), Retailing Management, 7th edition, McGraw-Hill/Irwin, New York.
Lichtenstein, D.R., Ridgway, N.M. and Netemeyer, R.G. (1993), “Price perceptions and consumer shopping behavior: a field study”, Journal of Marketing Research, Vol. 30 No. 2, pp. 234-245.
Mattila, A. S. and Wirtz, J. (2008), “The role of store environmental stimulation and social factors on impulse purchasing”, Journal of Services Marketing, Vol. 22 No. 7, pp. 562-567. Mehta, R., Sharma, N. K. and Swami, S. (2013), “The impact of perceived crowding on consumers' store patronage intentions: Role of optimal stimulation level and shopping motivation”, Journal of Marketing Management, Vol. 29 No. 7-8, pp. 812-835.
Moorman, C., Zaltman, G. and Deshpande, R. (1992), “Relationships between providers and users of market research: The dynamics of trust within and between organizations”, Journal of Marketing Research, Vol. 29 No. 3, pp. 314-328 Morgan, R. M. and Hunt, S. D. (1994), “The commitment-trust theory of relationship marketing”, Journal of Marketing, Vol. 58 No. 3, pp. 20-38
26
6
O’Guinn, T. C., Tanner, R.J. and Maeng, A. (2015), “Turning to space: Social density, social class, and the value of things in stores”, Journal of Consumer Research, Vol. 42 No. 2, pp. 196–213.
Oldham, G.R. and Fried, Y. (1987), “Employee reactions to workspace characteristics”, Journal of Applied Psychology, Vol. 72 No. 1, pp. 75–80.
Oliver, R. L. (1980), “A cognitive model of the antecedents and consequences of satisfaction decisions”, Journal of Marketing Research, Vol. 17 No. 4, pp. 460-469
Puccinelli, N.M, Andrzejewski, S.A., Markos, E., Noga, T. and Motyka, S. (2013), “The value of knowing what customers really want: The impact of salesperson ability to read non-verbal cues of affect on service quality”, Journal of Marketing Management, Vol. 29 No.3-4, pp. 356-373.
Ragin, C. C. (2000), Fuzzy-set Social Science, The University of Chicago Press, Chicago, IL.
Rejón-Guardia, F. and Luna-Nevarez, C. (2017), “Showrooming in consumer electronics retailing: an empirical study”, Journal of Internet Commerce, Vol. 16 No. 2, pp. 174-201. Schneider, P. J. and Zielke, S. (2020), “Searching offline and buying online–An analysis of showrooming forms and segments”, Journal of Retailing and Consumer Services, Vol. 52, 101919.
Sirdeshmukh, D., Singh, J. and Sabol, B. (2002), “Consumer trust, value, and loyalty in relational exchanges”, Journal of Marketing, Vol. 66 No. 1, pp. 15-37.
Sit, J. K., Hoang, A. and Inversini, A. (2018), “Showrooming and retail opportunities: A qualitative investigation via a consumer-experience lens”, Journal of Retailing and Consumer Services, Vol. 40, pp. 163-174.
Vesel, P. and Zabkar, V. (2009). Managing customer loyalty through the mediating role of satisfaction in the DIY retail loyalty program. Journal of Retailing and Consumer Services, Vol. 16 No.5, pp. 396-406
Woodside, A.G. (2016), “The good practices manifesto: Overcoming bad practices pervasive in current research in business”, Journal of Business Research, Vol. 69 No. 2, pp. 365–381.
Zeithaml, V.A., Berry, L.L. and Parasuraman, A. (1996), “The behavioral consequences of service quality”, Journal of Marketing, Vol. 60 No. 2, pp. 31-46.
Zheng, X., Lee, M. and Cheung, C. M. (2017), “Examining e-loyalty towards online shopping platforms”, Internet Research, Vol. 27 No. 3, pp. 709-726.
Keywords* Competitive showrooming, Mobile, Loyalty, Value consciousness, fsQCA
Acknowledgement This work was financed by the Spanish Ministry of Science, Innovation and Universities, Spanish State Research Agency (Research Grant ECO 2017-83051-R).
27
6
O’Guinn, T. C., Tanner, R.J. and Maeng, A. (2015), “Turning to space: Social density, social class, and the value of things in stores”, Journal of Consumer Research, Vol. 42 No. 2, pp. 196–213.
Oldham, G.R. and Fried, Y. (1987), “Employee reactions to workspace characteristics”, Journal of Applied Psychology, Vol. 72 No. 1, pp. 75–80.
Oliver, R. L. (1980), “A cognitive model of the antecedents and consequences of satisfaction decisions”, Journal of Marketing Research, Vol. 17 No. 4, pp. 460-469
Puccinelli, N.M, Andrzejewski, S.A., Markos, E., Noga, T. and Motyka, S. (2013), “The value of knowing what customers really want: The impact of salesperson ability to read non-verbal cues of affect on service quality”, Journal of Marketing Management, Vol. 29 No.3-4, pp. 356-373.
Ragin, C. C. (2000), Fuzzy-set Social Science, The University of Chicago Press, Chicago, IL.
Rejón-Guardia, F. and Luna-Nevarez, C. (2017), “Showrooming in consumer electronics retailing: an empirical study”, Journal of Internet Commerce, Vol. 16 No. 2, pp. 174-201. Schneider, P. J. and Zielke, S. (2020), “Searching offline and buying online–An analysis of showrooming forms and segments”, Journal of Retailing and Consumer Services, Vol. 52, 101919.
Sirdeshmukh, D., Singh, J. and Sabol, B. (2002), “Consumer trust, value, and loyalty in relational exchanges”, Journal of Marketing, Vol. 66 No. 1, pp. 15-37.
Sit, J. K., Hoang, A. and Inversini, A. (2018), “Showrooming and retail opportunities: A qualitative investigation via a consumer-experience lens”, Journal of Retailing and Consumer Services, Vol. 40, pp. 163-174.
Vesel, P. and Zabkar, V. (2009). Managing customer loyalty through the mediating role of satisfaction in the DIY retail loyalty program. Journal of Retailing and Consumer Services, Vol. 16 No.5, pp. 396-406
Woodside, A.G. (2016), “The good practices manifesto: Overcoming bad practices pervasive in current research in business”, Journal of Business Research, Vol. 69 No. 2, pp. 365–381.
Zeithaml, V.A., Berry, L.L. and Parasuraman, A. (1996), “The behavioral consequences of service quality”, Journal of Marketing, Vol. 60 No. 2, pp. 31-46.
Zheng, X., Lee, M. and Cheung, C. M. (2017), “Examining e-loyalty towards online shopping platforms”, Internet Research, Vol. 27 No. 3, pp. 709-726.
Keywords* Competitive showrooming, Mobile, Loyalty, Value consciousness, fsQCA
Acknowledgement This work was financed by the Spanish Ministry of Science, Innovation and Universities, Spanish State Research Agency (Research Grant ECO 2017-83051-R).
INDIVIDUALISING HOME DELIVERY OF GROCERIES IN A SUSTAINABLE WAY – DEVELOPING A METHODOLOGICAL APPROACH Luttermann, Sandra*; Trapp, Markus+, Freitag, Michael+ Kotzab, Herbert*; +) University of Bremen, Faculty of Production Engineering, Research Group of Planning and Control of Production and Logistics Systems *) University of Bremen, Faculty of Business Studies and Economics, Chair in Logistics Management Purpose: E-commerce is not a specialty any longer, it is vital part of today’s retailing world. In certain branches such as cloths, consumer electronics and books, internet retailing has taken serious market shares from traditional retailers, whereas within the food segment, online retailing is still small, but attractive. Besides the increasing attractivity of e-commerce we observe also an increasing sustainability concern at consumers’ level, where consumers would like to select a more sustainable delivery of their ordered goods. Our project focuses on the trade-off between the need for more sustainability and the increasing demand and requirements for home deliveries caused by e-commerce. Thus, the primary goal of our study is to develop an interdisciplinary tool which is used to design and evaluate consumer-driven sustainable home delivery options. Thereby consumers are allowed to select distinct last mile logistics options based on different set of preference options. The selected last mile solution is then evaluated with a simulation approach, which shows the sustainable consequences of the chosen option and is reported back to the consumer. With this feedback on the sustainable footprint, consumers are allowed to rethink their preferences and may change their option to a more sustainable solution. This paper includes the presentation of the main goal of this interdisciplinary exploration project as well as first findings on the state of the art of existing home delivery solutions and their sustainability options. Furthermore, it shows how research has so far tackled the issue of sustainability and individualisation of last mile logistics systems in the field of grocery retailing as well as presenting an overview to the various sustainability parameters as well as methods to measure the sustainability footprint. Design/methodology/approach: The overall schedule of the study is carried out in three steps: a) systematic literature review, b) discrete choice experiments, and c) discrete-event simulation. Currently we execute step a) in order to present a current state of research in this area. The results will identify relevant literature which relates those areas that deal with home deliveries of groceries and individualisation such as green logistics, sustainable city logistics, packaging, food logistics, consumer logistics as well as omni-channel retailing. The further procedure includes a methodological combination of discrete choice experiments and discrete-event simulation. By this we merge socio-scientific with engineering methods in an interdisciplinary manner. While the discrete-choice experiments allow consumers an optimal selection of home-delivery parameters, discrete-event simulation allows the quantification of the chosen option and offers a feedback by the provision of simulation results. Findings:
28
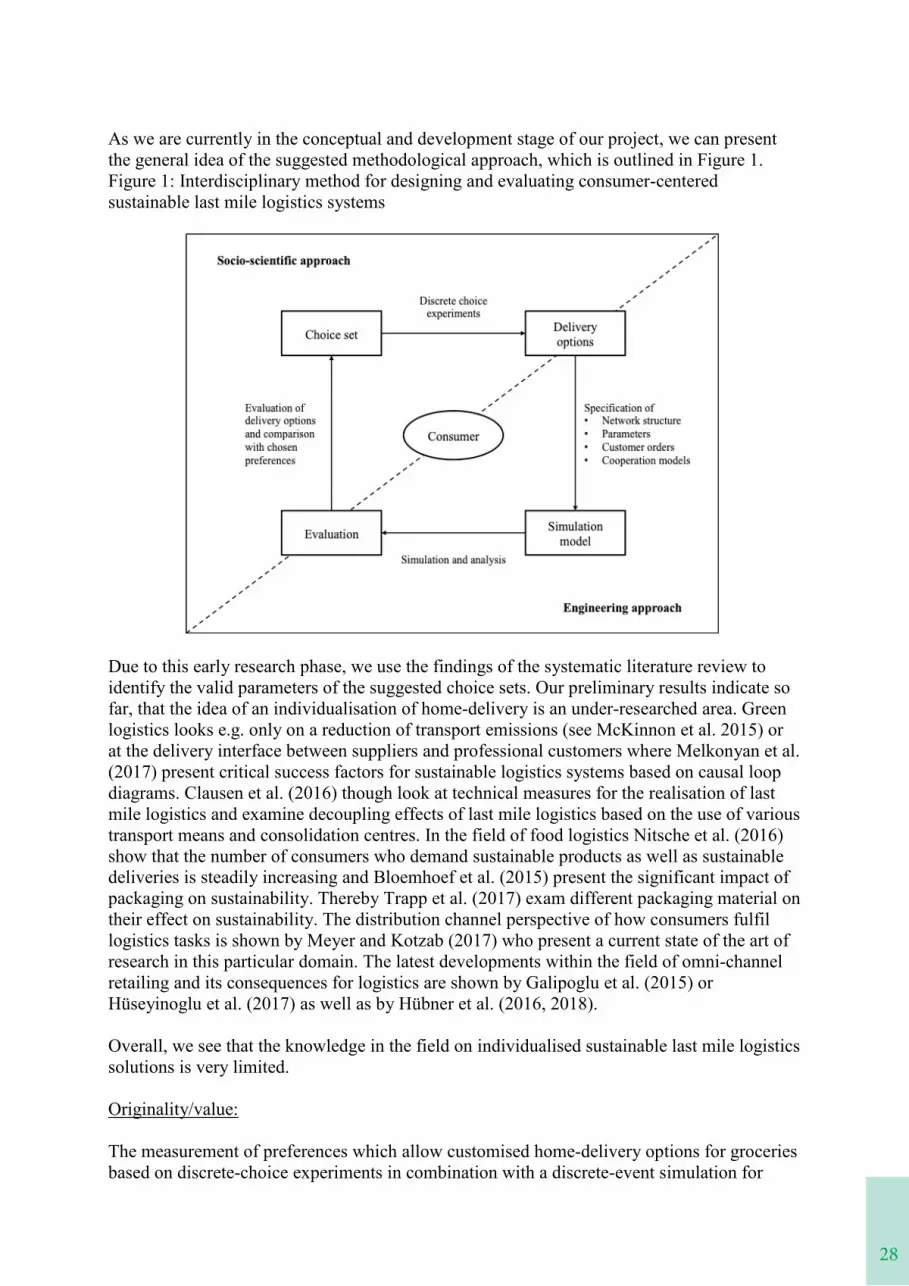
As we are currently in the conceptual and development stage of our project, we can present the general idea of the suggested methodological approach, which is outlined in Figure 1. Figure 1: Interdisciplinary method for designing and evaluating consumer-centered sustainable last mile logistics systems
Due to this early research phase, we use the findings of the systematic literature review to identify the valid parameters of the suggested choice sets. Our preliminary results indicate so far, that the idea of an individualisation of home-delivery is an under-researched area. Green logistics looks e.g. only on a reduction of transport emissions (see McKinnon et al. 2015) or at the delivery interface between suppliers and professional customers where Melkonyan et al. (2017) present critical success factors for sustainable logistics systems based on causal loop diagrams. Clausen et al. (2016) though look at technical measures for the realisation of last mile logistics and examine decoupling effects of last mile logistics based on the use of various transport means and consolidation centres. In the field of food logistics Nitsche et al. (2016) show that the number of consumers who demand sustainable products as well as sustainable deliveries is steadily increasing and Bloemhoef et al. (2015) present the significant impact of packaging on sustainability. Thereby Trapp et al. (2017) exam different packaging material on their effect on sustainability. The distribution channel perspective of how consumers fulfil logistics tasks is shown by Meyer and Kotzab (2017) who present a current state of the art of research in this particular domain. The latest developments within the field of omni-channel retailing and its consequences for logistics are shown by Galipoglu et al. (2015) or Hüseyinoglu et al. (2017) as well as by Hübner et al. (2016, 2018). Overall, we see that the knowledge in the field on individualised sustainable last mile logistics solutions is very limited. Originality/value: The measurement of preferences which allow customised home-delivery options for groceries based on discrete-choice experiments in combination with a discrete-event simulation for
29
feed-back and adaptation possibilities is an innovative approach. Thereby we are able to allow the enclosure of real consumer preferences and a critical reflection and adaptation towards more sustainable individual e-commerce home delivery solutions. References:
1. Bloemhof, J.M., van der Vorst, J.G.A.J., Bastl, M., Allaoui, H.: Sustainability assessment of food chain logistics. International Journal of Logistics Research and Applications 18(2), 101-117 (2015).
2. Clausen, U., Geiger, C., Pöting, M.: Hands-on Testing of Last Mile Concepts. Transportation Research Procedia 14, 1533–1542 (2016).
3. Galipoglu, E., Kotzab, H., Pöppelbuß, J.: Multi-Channel-Systeme im Wandel. WiSt 44(8), 434-441 (2015). 4. Hübner, A. H., Kuhn, H., Wollenburg, J., Towers, N., & Kotzab, H. (2016). Last mile fulfilment and distribution in omni-
channel grocery retailing: a strategic planning framework. International Journal of Retail & Distribution Management. 5. Hübner, A., Kuhn, H., Wollenburg, J., & Trautrims, A. (2018). From bricks-and-mortar to bricks-and-clicks–logistics
networks in omni-channel grocery retailing. Empirical Studies in Multi-Channel and Omni-Channel Retail Operations and Logistics, 102.
6. Hü n omni-channel retailing: insights from Germany and Turkey. International Journal of Retail & Distribution Management 45(7/8), 711-729 (2017).
7. McKinnon, A., Browne, M., Piecyk, M., Whiteing, A.: Green Logistics. Improving the environmental sustainability of Logistics. 3rd edn. Kogan Page, London (2015).
8. Melkonyan, A., Krumme, K., Gruchmann, T., De La Torre, G.: Sustainability assessment and climate change resilience in food production and supply. Energy Procedia 123, 131-138 (2017).
9. Meyer, J., Kotzab, H.: Consumer Logistics and Consumer Value (-Co-) Creation. In: Large, R., Kramer, N., Radig, A.-K., Schäfer, M., Sulzbach, A. (eds.) Logistikmanagement, Beiträge zur LM 2017 (LM 2017), pp. 313-322. Eigenverlag Lehrstuhl für Allg. BWL, Logistik- und Beschaffungsmanagement, Stuttgart (2017).
10. Nitsche, B., Figiel, A., Straube, F.: Zukunftstrends in der Lebensmittellogistik Herausforderungen und Losungsimpulse. Universitätsverlag der TU Berlin, Berlin (2016).
11. Trapp, M., Lütjen, M., Castellanos, J.D.A., Jelsch, O., Freitag, M.: Life cycle assessment for frozen food distribution schemes. In: Jahn, C., Kersten, W., Ringle, C.M. (eds.) Proceedings of the Hamburg International Conference of Logistics (HICL), pp. 267-284. epubli Verlag, Hamburg (2017).
Keywords: Sustainability, e-commerce, simulation, discrete choice experiments, food logistics, consumer logistics, human centred logistics, home delivery, last mile logistics.
30
1
OMNI-CHANNEL INTENSITY AND SHOPPING VALUE AS KEY DRIVERS TO CUSTOMER SATISFACTION AND LOYALTY
Haydee Calderón University of Valencia
Teresa Fayos
University of Valencia
Mitxel Cotarelo University of Valencia
Introduction Omnichannel focuses on a holistic approach throughout the distribution process, providing a continuous and uninterrupted response to the customer experience through all available purchase channels (Wilding, 2013; Saghiri et al, 2017). Likewise, omnichannel intensity (OI) is a costumer perspective that includes the level of perceived consistency and seamless in omnichannel shopping. In the literature, omnichannel is defined as the complete alignment of different channels and touch points resulting in an optimal customer experience with the brand (Lemon and Verhoef, 2016; Ailawadi and Farris, 2017). According to Ailawadi and Farris (2017) the concept of omnichannel is focused on the integration of activities within the various channels used by the company to correspond to how consumers buy. Huré et al. (2017) conclude that it is necessary to deepen the relationships generated between intensity and shopping value (SV) in omnichannel retail distribution. All that customers are really concerned about is finding an answer to their current needs or desires in a way that is convenient, enjoyable and offers them good value (Cook, 2014). His summarized literature demonstrates that much is known about Shopping Value (Huré et al., 2017). However, the SV research does not appropriately capture omnichannel; most research so far has considered value in a single-channel context and therefore has neglected the interaction effects arising when consumers shop in multiple touch points (Melero et al., 2016). In the omnichannel environment, satisfaction and loyalty have been analysed from different perspectives (Murfiel et al., 2017; Xu and Jackson, 2019) but the aspects that influence both need to be further explored (Hiraishi et al., 2016; Haile and Björk, 2019).
Purpose* Integration is a company retail orientation perspective, but it is necessary to be aware that the customer does not always perceive its omnichannel experience as consistent or continuous (Huré et al, 2017). In addition, although the concept of value -in particular, shopping value (SV)- has been broadly studied in previous research (Kumar and Reinartz, 2016; Leroi-Werelds et al., 2014, Huré et al., 2017), the focus so far has been almost exclusively on traditional single-retail environments, not on integrated multi-channel settings; therefore, existing SV research does not precisely capture omnichannel SV.
The purpose of this paper is to investigate the impact of omnichannel intensity (OI) and shopping value (SV) on customer satisfaction and loyalty in the omnichannel retail purchase scenario of Click and Collect.
Conceptual framework
31
1
OMNI-CHANNEL INTENSITY AND SHOPPING VALUE AS KEY DRIVERS TO CUSTOMER SATISFACTION AND LOYALTY
Haydee Calderón University of Valencia
Teresa Fayos
University of Valencia
Mitxel Cotarelo University of Valencia
Introduction Omnichannel focuses on a holistic approach throughout the distribution process, providing a continuous and uninterrupted response to the customer experience through all available purchase channels (Wilding, 2013; Saghiri et al, 2017). Likewise, omnichannel intensity (OI) is a costumer perspective that includes the level of perceived consistency and seamless in omnichannel shopping. In the literature, omnichannel is defined as the complete alignment of different channels and touch points resulting in an optimal customer experience with the brand (Lemon and Verhoef, 2016; Ailawadi and Farris, 2017). According to Ailawadi and Farris (2017) the concept of omnichannel is focused on the integration of activities within the various channels used by the company to correspond to how consumers buy. Huré et al. (2017) conclude that it is necessary to deepen the relationships generated between intensity and shopping value (SV) in omnichannel retail distribution. All that customers are really concerned about is finding an answer to their current needs or desires in a way that is convenient, enjoyable and offers them good value (Cook, 2014). His summarized literature demonstrates that much is known about Shopping Value (Huré et al., 2017). However, the SV research does not appropriately capture omnichannel; most research so far has considered value in a single-channel context and therefore has neglected the interaction effects arising when consumers shop in multiple touch points (Melero et al., 2016). In the omnichannel environment, satisfaction and loyalty have been analysed from different perspectives (Murfiel et al., 2017; Xu and Jackson, 2019) but the aspects that influence both need to be further explored (Hiraishi et al., 2016; Haile and Björk, 2019).
Purpose* Integration is a company retail orientation perspective, but it is necessary to be aware that the customer does not always perceive its omnichannel experience as consistent or continuous (Huré et al, 2017). In addition, although the concept of value -in particular, shopping value (SV)- has been broadly studied in previous research (Kumar and Reinartz, 2016; Leroi-Werelds et al., 2014, Huré et al., 2017), the focus so far has been almost exclusively on traditional single-retail environments, not on integrated multi-channel settings; therefore, existing SV research does not precisely capture omnichannel SV.
The purpose of this paper is to investigate the impact of omnichannel intensity (OI) and shopping value (SV) on customer satisfaction and loyalty in the omnichannel retail purchase scenario of Click and Collect.
Conceptual framework
2
According to the literature it will be argued that omnichannel intensity, composed of perceived consistency and seamlessness, is postulated as a variable that can positively influence customer satisfaction and customer loyalty.
Larke et al. (2018), claim that consumer satisfaction in an omnichannel system can be affected by aspects that are part of the seamless experience, while Tyrväinen and Karjaluoto (2019) claim, with respect to consistency, that online and offline store images should be integrated smoothly to provide positive experiences that generate satisfaction. Swaid and Wigand (2012) conclude that in an omnichannel system consumer loyalty is influenced by the seamless experience manifested in product delivery, while Lee et al. (2019) demonstrate that consistency of content has a positive influence on customer engagement, which in turn leads to positive word-of-mouth and repurchase intention.
Therefore, omnichannel intensity, composed of perceived consistency and seamlessness is postulated as a variable that can positively influence consumer satisfaction and customer loyalty. Therefore, we posit:
H1: Omnichannel intensity is positively related to customer satisfaction.
H2: Omnichannel intensity is positively related to customer loyalty.
Consumer expectations of integrated use of offline and online shopping channels allow retailers to create an innovative offering that enhances consumer value. This requires the synchronisation of bricks & clicks, combining both physical and digital touch points in a consistent way (Verhoef et al., 2015; Picot-Coupey et al., 2016). Therefore:
H3: Omnichannel intensity is positively related to the omnichannel purchase value.
It is commonly accepted that purchase value has two components, one utilitarian and one hedonic. These values have a positive influence on consumer satisfaction and loyalty in a retail shopping environment (Carpenter, 2008). Kim et al. (2012) established the relationship between certain utilitarian components of purchase value in an online shopping environment that positively affect consumer satisfaction, while pek et al. (2016) demonstrated that purchase value dimensions have a positive effect on consumer retention and store loyalty. Thus, given the relationship between purchase value, satisfaction, and customer loyalty, it is desirable that these relationships are also tested in an omnichannel shopping environment:
H4: Omnichannel purchase value is positively related to customer satisfaction.
H5: Omnichannel purchase value is positively related to customer loyalty.
Finally, consumer satisfaction as a predictor of loyalty has been confirmed by different researchers in the multichannel and omnichannel field (e.g. Kibbeling et al., 2013; Murfield et al. 2017), so we propose:
H6: Satisfaction is positively related to loyalty.
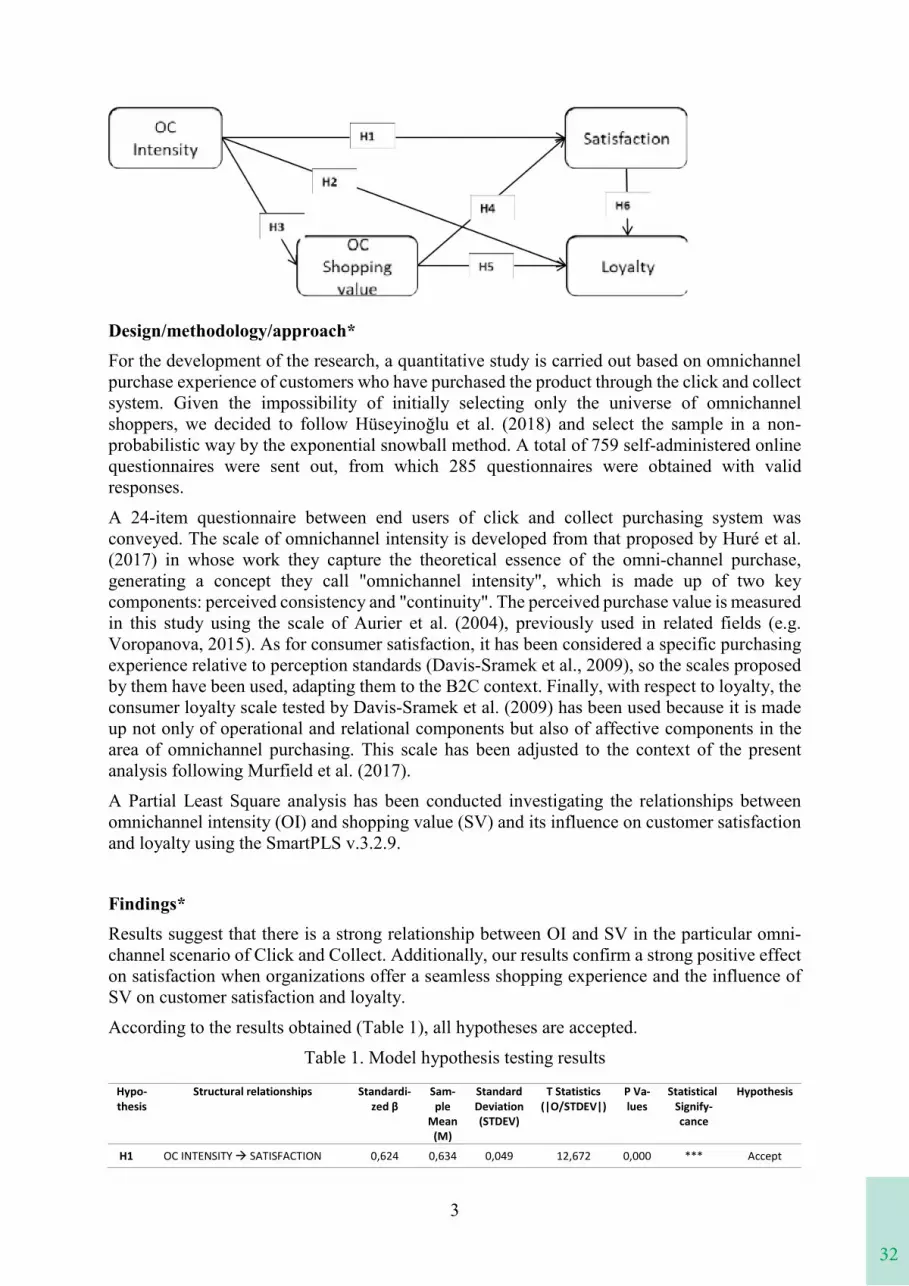
Figure 1 shows the model proposed to be tested according to the hypotheses raised.
Figure 1. Model
32
3
Design/methodology/approach* For the development of the research, a quantitative study is carried out based on omnichannel purchase experience of customers who have purchased the product through the click and collect system. Given the impossibility of initially selecting only the universe of omnichannel
-probabilistic way by the exponential snowball method. A total of 759 self-administered online questionnaires were sent out, from which 285 questionnaires were obtained with valid responses.
A 24-item questionnaire between end users of click and collect purchasing system was conveyed. The scale of omnichannel intensity is developed from that proposed by Huré et al. (2017) in whose work they capture the theoretical essence of the omni-channel purchase, generating a concept they call "omnichannel intensity", which is made up of two key components: perceived consistency and "continuity". The perceived purchase value is measured in this study using the scale of Aurier et al. (2004), previously used in related fields (e.g. Voropanova, 2015). As for consumer satisfaction, it has been considered a specific purchasing experience relative to perception standards (Davis-Sramek et al., 2009), so the scales proposed by them have been used, adapting them to the B2C context. Finally, with respect to loyalty, the consumer loyalty scale tested by Davis-Sramek et al. (2009) has been used because it is made up not only of operational and relational components but also of affective components in the area of omnichannel purchasing. This scale has been adjusted to the context of the present analysis following Murfield et al. (2017).
A Partial Least Square analysis has been conducted investigating the relationships between omnichannel intensity (OI) and shopping value (SV) and its influence on customer satisfaction and loyalty using the SmartPLS v.3.2.9.
Findings* Results suggest that there is a strong relationship between OI and SV in the particular omni-channel scenario of Click and Collect. Additionally, our results confirm a strong positive effect on satisfaction when organizations offer a seamless shopping experience and the influence of SV on customer satisfaction and loyalty.
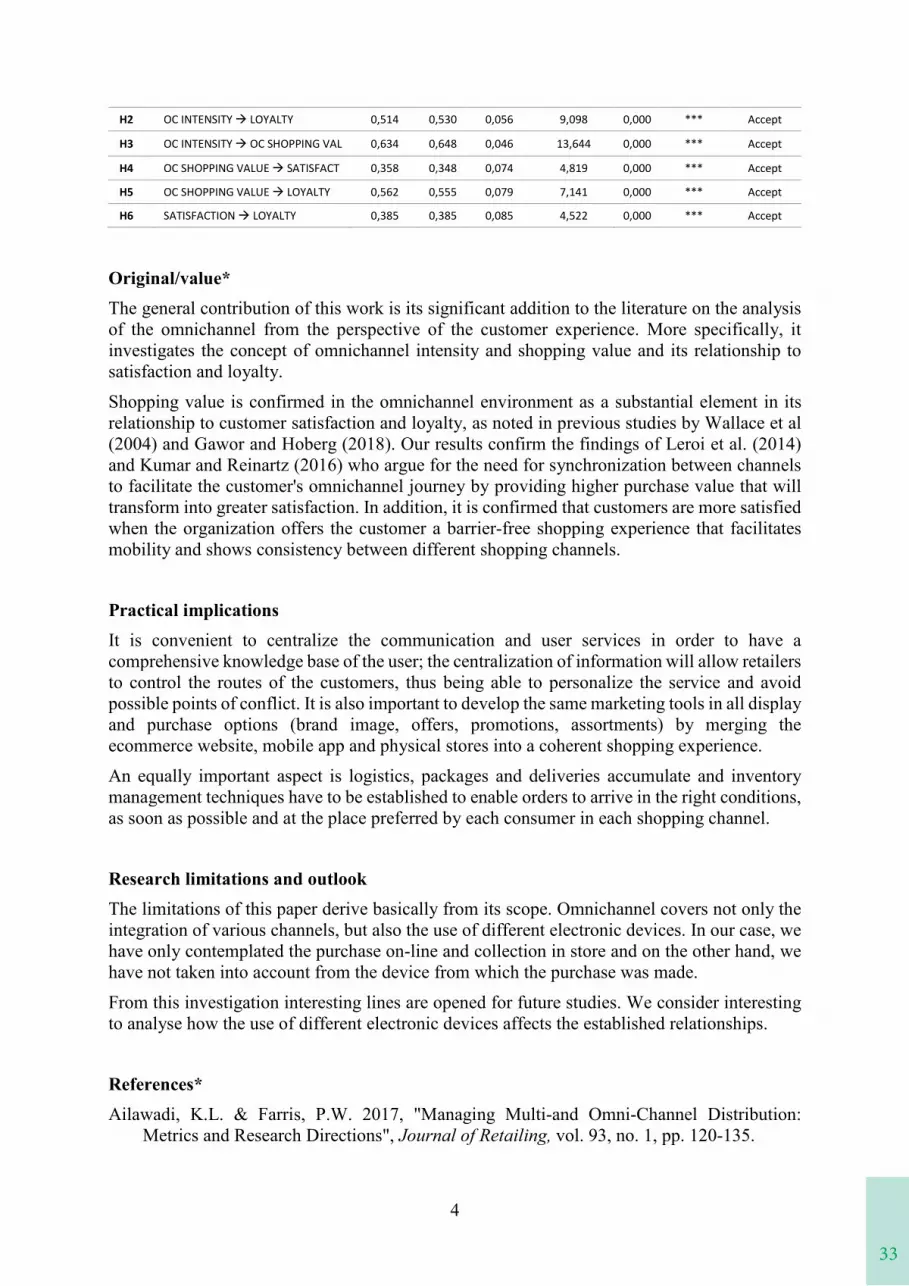
According to the results obtained (Table 1), all hypotheses are accepted.
Table 1. Model hypothesis testing results
Hypo- thesis
Structural relationships Standardi-zed β
Sam-ple
Mean (M)
Standard Deviation (STDEV)
T Statistics (|O/STDEV|)
P Va-lues
Statistical Signify-cance
Hypothesis
H1 OC INTENSITY SATISFACTION 0,624 0,634 0,049 12,672 0,000 *** Accept
33
3
Design/methodology/approach* For the development of the research, a quantitative study is carried out based on omnichannel purchase experience of customers who have purchased the product through the click and collect system. Given the impossibility of initially selecting only the universe of omnichannel
-probabilistic way by the exponential snowball method. A total of 759 self-administered online questionnaires were sent out, from which 285 questionnaires were obtained with valid responses.
A 24-item questionnaire between end users of click and collect purchasing system was conveyed. The scale of omnichannel intensity is developed from that proposed by Huré et al. (2017) in whose work they capture the theoretical essence of the omni-channel purchase, generating a concept they call "omnichannel intensity", which is made up of two key components: perceived consistency and "continuity". The perceived purchase value is measured in this study using the scale of Aurier et al. (2004), previously used in related fields (e.g. Voropanova, 2015). As for consumer satisfaction, it has been considered a specific purchasing experience relative to perception standards (Davis-Sramek et al., 2009), so the scales proposed by them have been used, adapting them to the B2C context. Finally, with respect to loyalty, the consumer loyalty scale tested by Davis-Sramek et al. (2009) has been used because it is made up not only of operational and relational components but also of affective components in the area of omnichannel purchasing. This scale has been adjusted to the context of the present analysis following Murfield et al. (2017).
A Partial Least Square analysis has been conducted investigating the relationships between omnichannel intensity (OI) and shopping value (SV) and its influence on customer satisfaction and loyalty using the SmartPLS v.3.2.9.
Findings* Results suggest that there is a strong relationship between OI and SV in the particular omni-channel scenario of Click and Collect. Additionally, our results confirm a strong positive effect on satisfaction when organizations offer a seamless shopping experience and the influence of SV on customer satisfaction and loyalty.
According to the results obtained (Table 1), all hypotheses are accepted.
Table 1. Model hypothesis testing results
Hypo- thesis
Structural relationships Standardi-zed β
Sam-ple
Mean (M)
Standard Deviation (STDEV)
T Statistics (|O/STDEV|)
P Va-lues
Statistical Signify-cance
Hypothesis
H1 OC INTENSITY SATISFACTION 0,624 0,634 0,049 12,672 0,000 *** Accept
4
H2 OC INTENSITY LOYALTY 0,514 0,530 0,056 9,098 0,000 *** Accept
H3 OC INTENSITY OC SHOPPING VAL 0,634 0,648 0,046 13,644 0,000 *** Accept
H4 OC SHOPPING VALUE SATISFACT 0,358 0,348 0,074 4,819 0,000 *** Accept
H5 OC SHOPPING VALUE LOYALTY 0,562 0,555 0,079 7,141 0,000 *** Accept
H6 SATISFACTION LOYALTY 0,385 0,385 0,085 4,522 0,000 *** Accept
Original/value* The general contribution of this work is its significant addition to the literature on the analysis of the omnichannel from the perspective of the customer experience. More specifically, it investigates the concept of omnichannel intensity and shopping value and its relationship to satisfaction and loyalty.
Shopping value is confirmed in the omnichannel environment as a substantial element in its relationship to customer satisfaction and loyalty, as noted in previous studies by Wallace et al (2004) and Gawor and Hoberg (2018). Our results confirm the findings of Leroi et al. (2014) and Kumar and Reinartz (2016) who argue for the need for synchronization between channels to facilitate the customer's omnichannel journey by providing higher purchase value that will transform into greater satisfaction. In addition, it is confirmed that customers are more satisfied when the organization offers the customer a barrier-free shopping experience that facilitates mobility and shows consistency between different shopping channels.
Practical implications It is convenient to centralize the communication and user services in order to have a comprehensive knowledge base of the user; the centralization of information will allow retailers to control the routes of the customers, thus being able to personalize the service and avoid possible points of conflict. It is also important to develop the same marketing tools in all display and purchase options (brand image, offers, promotions, assortments) by merging the ecommerce website, mobile app and physical stores into a coherent shopping experience.
An equally important aspect is logistics, packages and deliveries accumulate and inventory management techniques have to be established to enable orders to arrive in the right conditions, as soon as possible and at the place preferred by each consumer in each shopping channel.
Research limitations and outlook The limitations of this paper derive basically from its scope. Omnichannel covers not only the integration of various channels, but also the use of different electronic devices. In our case, we have only contemplated the purchase on-line and collection in store and on the other hand, we have not taken into account from the device from which the purchase was made.
From this investigation interesting lines are opened for future studies. We consider interesting to analyse how the use of different electronic devices affects the established relationships.
References* Ailawadi, K.L. & Farris, P.W. 2017, "Managing Multi-and Omni-Channel Distribution:
Metrics and Research Directions", Journal of Retailing, vol. 93, no. 1, pp. 120-135.
34
5
Aurier, P. Evrard, Y. & N'Goala, G. 2004, “Comprendre et mesurer la valeur du point de vue du consommateur”, Recherche Et Applications En Marketing (French Edition), vol. 19, no. 3, pp. 1-20.
Carpenter, J.M. 2008, “Consumer shopping value, satisfaction and loyalty in discount retailing”, Journal of retailing and consumer services, vol. 15, no. 5, pp. 358-363.
Cook, G. 2014, "Customer experience in the omni-channel world and the challenges and opportunities this presents", Journal of Direct, Data and Digital Marketing Practice, vol. 15, no. 4, pp. 262-266.
Davis-Sramek, B., Droge, C., Mentzer, J.T. & Myers, M.B. 2009, “Creating commitment and loyalty behavior among retailers: What are the roles of service quality and satisfaction?”, Journal of the Academy of Marketing Science, vol. 37, no. 4, pp. 440.
Gawor, T. & Hoberg, K. 2019, "Customers’ valuation of time and convenience in e-fulfillment", International Journal of Physical Distribution & Logistics Management.
Haile, E. & Björk, M. 2019, "Integrate… then they might be all yours: A research on how Omnichannel retailing could affect customers Brand Loyalty.", .
Hiraishi, K., Ito, H., Inoue, Y., Eto, K., Katashio, N., Koike, S., Go, Y., Park, C.D., Hayashi, H. & Yoneyama, R. 2016, "The Effect of Omni channel Retailer’s Strategy on Store Loyalty", 2016 SMA Proceedings, , pp. 443.
Huré, E., Picot-Coupey, K. & Ackermann, C. 2017, "Understanding omni-channel shopping value: A mixed-method study", Journal of Retailing and Consumer Services, vol. 39, pp. 314-330.
. “Revealing the impact of operational logistics service quality on omni-channel capability”, Asia Pacific Journal of Marketing and Logistics.
, “Private label usage and store loyalty: The moderating impact of shopping value”, Journal of Retailing and Consumer Services, vol. 31, pp. 72-7
Kibbeling, M., der Bij, H. & Weele, A. (2013. “Market orientation and innovativeness in supply chains: Supplier's impact on customer satisfaction”, Journal of Product Innovation Management, vol. 30, no. 3, pp. 500-515.
Kim, C., Galliers, R.D., Shin, N., Ryoo, J. & Kim, J. 2012. “Factors influencing internet shopping value and customer repurchase intention”, Electronic Commerce Research and Applications, vol. 11, no. 4, pp. 374-387.
Kumar, V. & Reinartz, W. 2016, "Creating enduring customer value", Journal of Marketing, vol. 80, no. 6, pp. 36-68.
Larke, R., Kilgour, M., & O’Connor, H. 2018. “Build touchpoints and they will come: Transitioning to omnichannel retailing”, International Journal of Physical Distribution & Logistics Management, vol. 48, no. 4, pp. 465-483.
Lee, Z.W., Chan, T.K., Chong, A.Y.L., & Thadani, D.R. 2019. “Customer engagement through omnichannel retailing: The effects of channel integration quality”, Industrial Marketing Management, no. 77, pp. 90-101.
Lemon, K.N. & Verhoef, P.C. 2016, "Understanding customer experience throughout the customer journey", American Marketing Association.
Leroi-Werelds, S., Streukens, S., Brady, M.K. & Swinnen, G. 2014, "Assessing the value of commonly used methods for measuring customer value: a multi-setting empirical study", Journal of the academy of marketing science, vol. 42, no. 4, pp. 430-451.
Melero, I., Sese, F.J. & Verhoef, P.C. 2016, "Recasting the Customer Experience in Today's Omni-channel Environment 1/Redefiniendo la experiencia del cliente en el entorno omnicanal", Universia Business Review, no. 50, pp. 18.
Murfield, M., Murfield, M., Boone, C.A., Boone, C.A., Rutner, P., Rutner, P., Thomas, R. & Thomas, R. 2017, "Investigating logistics service quality in omni-channel
35
5
Aurier, P. Evrard, Y. & N'Goala, G. 2004, “Comprendre et mesurer la valeur du point de vue du consommateur”, Recherche Et Applications En Marketing (French Edition), vol. 19, no. 3, pp. 1-20.
Carpenter, J.M. 2008, “Consumer shopping value, satisfaction and loyalty in discount retailing”, Journal of retailing and consumer services, vol. 15, no. 5, pp. 358-363.
Cook, G. 2014, "Customer experience in the omni-channel world and the challenges and opportunities this presents", Journal of Direct, Data and Digital Marketing Practice, vol. 15, no. 4, pp. 262-266.
Davis-Sramek, B., Droge, C., Mentzer, J.T. & Myers, M.B. 2009, “Creating commitment and loyalty behavior among retailers: What are the roles of service quality and satisfaction?”, Journal of the Academy of Marketing Science, vol. 37, no. 4, pp. 440.
Gawor, T. & Hoberg, K. 2019, "Customers’ valuation of time and convenience in e-fulfillment", International Journal of Physical Distribution & Logistics Management.
Haile, E. & Björk, M. 2019, "Integrate… then they might be all yours: A research on how Omnichannel retailing could affect customers Brand Loyalty.", .
Hiraishi, K., Ito, H., Inoue, Y., Eto, K., Katashio, N., Koike, S., Go, Y., Park, C.D., Hayashi, H. & Yoneyama, R. 2016, "The Effect of Omni channel Retailer’s Strategy on Store Loyalty", 2016 SMA Proceedings, , pp. 443.
Huré, E., Picot-Coupey, K. & Ackermann, C. 2017, "Understanding omni-channel shopping value: A mixed-method study", Journal of Retailing and Consumer Services, vol. 39, pp. 314-330.
. “Revealing the impact of operational logistics service quality on omni-channel capability”, Asia Pacific Journal of Marketing and Logistics.
, “Private label usage and store loyalty: The moderating impact of shopping value”, Journal of Retailing and Consumer Services, vol. 31, pp. 72-7
Kibbeling, M., der Bij, H. & Weele, A. (2013. “Market orientation and innovativeness in supply chains: Supplier's impact on customer satisfaction”, Journal of Product Innovation Management, vol. 30, no. 3, pp. 500-515.
Kim, C., Galliers, R.D., Shin, N., Ryoo, J. & Kim, J. 2012. “Factors influencing internet shopping value and customer repurchase intention”, Electronic Commerce Research and Applications, vol. 11, no. 4, pp. 374-387.
Kumar, V. & Reinartz, W. 2016, "Creating enduring customer value", Journal of Marketing, vol. 80, no. 6, pp. 36-68.
Larke, R., Kilgour, M., & O’Connor, H. 2018. “Build touchpoints and they will come: Transitioning to omnichannel retailing”, International Journal of Physical Distribution & Logistics Management, vol. 48, no. 4, pp. 465-483.
Lee, Z.W., Chan, T.K., Chong, A.Y.L., & Thadani, D.R. 2019. “Customer engagement through omnichannel retailing: The effects of channel integration quality”, Industrial Marketing Management, no. 77, pp. 90-101.
Lemon, K.N. & Verhoef, P.C. 2016, "Understanding customer experience throughout the customer journey", American Marketing Association.
Leroi-Werelds, S., Streukens, S., Brady, M.K. & Swinnen, G. 2014, "Assessing the value of commonly used methods for measuring customer value: a multi-setting empirical study", Journal of the academy of marketing science, vol. 42, no. 4, pp. 430-451.
Melero, I., Sese, F.J. & Verhoef, P.C. 2016, "Recasting the Customer Experience in Today's Omni-channel Environment 1/Redefiniendo la experiencia del cliente en el entorno omnicanal", Universia Business Review, no. 50, pp. 18.
Murfield, M., Murfield, M., Boone, C.A., Boone, C.A., Rutner, P., Rutner, P., Thomas, R. & Thomas, R. 2017, "Investigating logistics service quality in omni-channel
6
retailing", International Journal of Physical Distribution & Logistics Management, vol. 47, no. 4, pp. 263-296.
Picot-Coupey, K., Huré, E. & Piveteau, L. 2016. “Channel design to enrich customers’ shopping experiences: Synchronizing clicks with bricks in an omni-channel perspective–the direct optic case”, International Journal of Retail & Distribution Management, vol. 44, no. 3, pp. 336-368.
Saghiri, S., Wilding, R., Mena, C. & Bourlakis, M. 2017, "Toward a three-dimensional framework for omni-channel", Journal of Business Research, vol. 77, pp. 53-67.
Swaid, S. I., & Wigand, R. T. (2012. “The effect of perceived site-to-store service quality on perceived value and loyalty intentions in multichannel retailing”, International Journal of Management, vol. 29, no. 3, pp. 301.
Tyrväinen, O., & Karjaluoto, H. 2019. “Omnichannel experience: Towards successful channel integration in retail”, Journal of Customer Behaviour, vol. 18, no. 1, pp. 17-34
Verhoef, P.C., Kannan, P.K. & Inman, J.J. 2015. “From multi-channel retailing to omni-channel retailing: Introduction to the special issue on multi-channel retailing”, Journal of Retailing, vol. 91, no. 2, pp. 174-181.
Voropanova, E. 2015. “Conceptualizing smart shopping with a smartphone: Implications of the use of mobile devices for shopping productivity and value”, The International Review of Retail, Distribution and Consumer Research, vol. 25, no. 5, pp. 529-550.
Wilding, R. 2013, "Multichannel or omni-channel", Logistics and Transport Focus, vol. 15, no. 10, pp. 44.
Xu, X. & Jackson, J.E. 2019, "Investigating the influential factors of return channel loyalty in omni-channel retailing", International Journal of Production Economics, no. 216, pp. 118-132.
Appendix Keywords* Ommichannel, shopping value, omnichannel intensity, customer satisfaction, customer loyalty.
36
“LOGISTICS SERVICE QUALITY FROM FRENCH CONSUMERS PERSPECTIVE: SOME INSIGHTS ON CONCEPTUALIZING AND MEASURING IN E‐RETAILING”
Hoang Phuong Linh Nguyen, Odile Chanut(Jean Monnet University, University of Lyon, France)
Purpose – Our research aims to develop a scale for the measurement of logistics service quality in online retailing (OLSQ), specifically in the French context.
Design/methodology/approach – This paper presents three studies. The first one was a qualitative study deriving scale items from the literature by content analysis of 18 semi-structured interviews. A survey-based approach was then used to collect quantitative data. Study 2 extracted items from a quantitative data set of 741 e-consumers by exploratory factor and reliability analyses. Study 3 applied psychometric testing and confirmatory components analysis based on PLS approach to data from an online survey of 1038 e-consumers in France.
Findings – The results confirm a 26-item scale to measure six dimensions (product availability, communication, delivery rapidity, delivery reliability, condition, and return/exchange service). Several dimensions derived from French data are found to be in line with those identified in previous studies, and some others are developed from this research.
Research limitations/implications – This research studies OLSQ in non-food products. Further testing of the scales with food products is necessary for validity enhancement and generalization.
Practical implications – We attempt to shed some light on the underlying aspects of OLSQ. This will help e-retailers to improve it. The final goal is to make OLSQ as an advantage to gain market share in e-retailing.
Originality/value – The paper bridges the gap in the empirical works of OLSQ in e-retailing by studying the underlying dimensions in the evaluation of this concept.
Keywords logistics service quality, e-retailing, consumer perspective, measurement scale, France
Paper type Research paper
37
“LOGISTICS SERVICE QUALITY FROM FRENCH CONSUMERS PERSPECTIVE: SOME INSIGHTS ONCONCEPTUALIZING AND MEASURING IN E‐RETAILING”
Purpose – Our research aims to develop a scale for the measurement of logistics service qualityin online retailing (OLSQ), specifically in the French context.
Design/methodology/approach – This paper presents three studies. The first one was aqualitative study deriving scale items from the literature by content analysis of 18 semi-structured interviews. A survey-based approach was then used to collect quantitative data.Study 2 extracted items from a quantitative data set of 741 e-consumers by exploratory factorand reliability analyses. Study 3 applied psychometric testing and confirmatory componentsanalysis based on PLS approach to data from an online survey of 1038 e-consumers in France.
Findings – The results confirm a 26-item scale to measure six dimensions (product availability,communication, delivery rapidity, delivery reliability, condition, and return/exchange service).Several dimensions derived from French data are found to be in line with those identified inprevious studies, and some others are developed from this research.
Research limitations/implications – This research studies OLSQ in non-food products. Furthertesting of the scales with food products is necessary for validity enhancement andgeneralization.
Practical implications – We attempt to shed some light on the underlying aspects of OLSQ. Thiswill help e-retailers to improve it. The final goal is to make OLSQ as an advantage to gain marketshare in e-retailing.
Originality/value – The paper bridges the gap in the empirical works of OLSQ in e-retailing bystudying the underlying dimensions in the evaluation of this concept.
Keywords logistics service quality, e-retailing, consumer perspective, measurement scale,France
Paper type Research paper
“A CROSS‐NATIONAL COMPARISON OF CONSUMERS’ CROSS‐BORDER ONLINE‐SHOPPING INTENTION”
Anne Fota, Gerhard Wagner, Hanna Schramm-Klein(University of Siegen)
Cross-border online shopping describes the phenomenon of consumers conducting online purchases in foreign countries, instead of buying online in their home country market. While market data indicates globally increasing numbers of cross-border online purchases, little is known about the benefits that drive or the risks that impede consumers’ intention for cross-border online shopping. Besides, it is unclear if the drivers and barriers are the same for consumers in different country markets, especially in advanced versus emerging markets. We develop and empirically test a cross-border online shopping model to investigate cross-border online shopping behavior in two European country markets – Germany and Romania. In total, we obtained data of N=409 consumers (228 from Germany and 181 from Romania). For testing our hypotheses, we rely on partial least squares (PLS) structural equation modeling and perform a multigroup analysis. Our results show that consumers’ cross-border online purchasing intentions are affected by perceived benefits and risks of cross-border online shopping as well as by cosmopolitanism. A negative effect of consumer ethnocentrism on the intention to make cross-border online purchases was found only in one country market. The insights from this study entail implications relevant for marketing theory and retail management. In particular, findings help to understand the perceived benefits and risks of cross-border online shopping and constitute a helpful instrument for future research in the area of international online shopping as well as a foundation for retail managers to understand what kind of trade-off consumers face when considering making cross-border online purchases.
38
“ARCHETYPES OF DRIVER CONFIGURATIONS LEADING TO FOREIGN MARKET EXIT – AN INVESTIGATION INTO EUROPEAN GROCERY RETAILING”
David Schmid, Finn de Thomas Wagner, Dirk Morschett(University of Fribourg)
Research into the drivers of foreign retail divestment is characterized by studies that uncover different individual drivers that lead multinational retailers to divest from certain countries within their international portfolio. However, even though scholars regularly mentioned that such drivers are likely to exert their effects not in isolation but in combination with each other, configurations of drivers that affect exit decisions simultaneously are under-researched. We qualitatively investigate the drivers that lead to all 32 country exits of grocery retailers in Europe between 2014 and 2018. By doing so, we demonstrate that in most exit cases, configurations of multiple interrelated drivers at the subsidiary, the host-country and the parent-company level jointly influence retailers to take exit decisions. By classifying configurations based on their underlying rationale, we identify five archetypes of exit driver configurations, which suffice to explain all exit cases. Furthermore, we show that exits, even though related to strategic refocus decisions, are often the result of troubles at different levels. In terms of future research avenues, we propose extending our typology by applying our qualitative approach to different contexts, and to use quantitative research based on the qualitative findings to generate more generalizable and robust results.
39
“ARCHETYPES OF DRIVER CONFIGURATIONS LEADING TO FOREIGN MARKET EXIT – AN INVESTIGATION INTO EUROPEAN GROCERY RETAILING”
Research into the drivers of foreign retail divestment is characterized by studies that uncover different individual drivers that lead multinational retailers to divest from certain countries within their international portfolio. However, even though scholars regularly mentioned that such drivers are likely to exert their effects not in isolation but in combination with each other, configurations of drivers that affect exit decisions simultaneously are under-researched. We qualitatively investigate the drivers that lead to all 32 country exits of grocery retailers in Europe between 2014 and 2018. By doing so, we demonstrate that in most exit cases, configurations of multiple interrelated drivers at the subsidiary, the host-country and the parent-company level jointly influence retailers to take exit decisions. By classifying configurations based on their underlying rationale, we identify five archetypes of exit driver configurations, which suffice to explain all exit cases. Furthermore, we show that exits, even though related to strategic refocus decisions, are often the result of troubles at different levels. In terms of future research avenues, we propose extending our typology by applying our qualitative approach to different contexts, and to use quantitative research based on the qualitative findings to generate more generalizable and robust results.
1 of 6
‘TESTING THE WATER’ – ALDI SÜD AND COSTCO’S CHINESE (PRIOR-ONLINE) MARKET ENTRY
Sina HardakerDepartment of Economic GeographyJulius-Maximilians-UniversityWürzburg, [email protected]
Ling ZhangDepartment of GeographyUniversity of Central ArkansasArkansas, [email protected]
Introduction
The issue of market entry strategy continues to be of great interest to international business
academics and practitioners (Dunning, 1993; Doherty, 1999; Wang, 2003; Huang and
Sternquist, 2007; Park and Sternquist, 2014; Swoboda et al., 2015; Coe and Wrigley, 2018).
Particularly, the challenge of market entry into China has become an increasingly important
one of Western companies of all shapes and sizes. The Chinese market holds as one of the most
attractive expansion targets for retail companies worldwide (AT Kearney, 2019). Yet, with
rapid changes occurring in the market, it also represents one of the most competitive retail
environments (Hardaker, 2017; 2018b) and is continuing to strengthen its role as the global
leader in e-commerce (Bu et al., 2019). Recently, several high-profile international retailers
have divested from the Chinese market due to a variety of both general and sector specific
reasons, such as inadequate localization of product assortment and management personnel as
well as fierce competition from local retailers and e-commerce (Burt et al., 2019; Zhang &
Hardaker, 2020). Being forced to participate in the irreversible digitalization of commerce in
China, many international retailers operating store networks are not able to compete with the
IT infrastructure or and the logistics network of local retailers. Moreover, the recently
introduced “New Retail” pose additional challenges to new market entries, as the concept
obliges all-in-one channel integration between online and offline retail businesses. Lately,
however, retailers new to the market entered China via online shop, as the examples of Aldi
Süd and Costco reveal. So far, the German discounter has relied heavily on its standardized
concept developed in its domestic market and is pursuing a global internationalization strategy
with the rapid establishment of a (stationary) branch and distribution network (Colla, 2003). In
China, however, where Aldi’s discount format is unlikely to be successful (Hardaker, 2018a),
the German retailer is reinventing itself as a premium retailer, totally renouncing the discount
format it operates globally and entering the market with a digital shop before having opened its
first branches in Shanghai in 2019. Similarly, American warehouse operator Costco opened its
40
2 of 6
first store in the suburb of Shanghai in August 2019, two years after entering the market via an
online shop. This method of market entry represents a new strategy amongst grocery retailers.
Nevertheless, while online market entry seems beneficial in several ways, it also faces
substantial risk factors, as retailers have to overcome market challenges within the constraints
of digital environments (Watson et al., 2018). This includes the low status of territorial
embeddedness, which is widely recognized as an essential factor for a retailer’s
internationalization process to be successful (Hess, 2004; Tacconelli and Wrigley, 2009; Burt
et al., 2017; Wood et al., 2019). A research gap regarding a broader conceptualisation of the
prior digital market entry and the recognition of the underlying circumstances and dynamics
has been identified. Although, digitalisation is not a new phenomenon in retailing (Hagberg et
al., 2016), there is a paucity of studies that analyse the transformations of expansion strategies
due to digitalisation and the long-term, macro implications of the latter.
Purpose
The purpose of this paper is to investigate the internationalization strategy of the two retailers
Aldi Süd and Costco in China. The paper addresses the lack of studies that analyze the
potentially far-reaching effects that digitalization might have on the market entry strategies of
retailers. Consequently, the purpose of this paper is to fill this research gab by examining how
market entry strategy is transformed by digitalization. More specifically, the paper aims to
examine why Aldi Süd and Costco for the first time deviate from their usual expansion strategy
in regard to their market entry method (online shop first) as well as if and how the prior-online
market entry reflects a strategic response to organisational challenges faced by retailers in the
Chinese market. Additionally, this paper seeks to partially follow on from the research by Wood
et al. (2019), who study the embeddedness processes within the internationalization of online
fashion retailers. They question whether the extensively acknowledged requirement for retailers
to obtain territorial embeddedness within host markets is considered relevant in online
international retail expansion. However, in contrast to the fashion sector, this paper intends to
contribute to the conceptual debate in regard to grocery retailers in China and to the prior-online
market entry approach.
Design/methodology/approach
The paper is based on expert interviews with senior executives of the two international retailers,
but also with retail specialists and consultants in order to receive a more balanced observation
of the Chinese market. Twelve interviews were conducted in 2015, most of them gaining new
41
2 of 6
first store in the suburb of Shanghai in August 2019, two years after entering the market via an
online shop. This method of market entry represents a new strategy amongst grocery retailers.
Nevertheless, while online market entry seems beneficial in several ways, it also faces
substantial risk factors, as retailers have to overcome market challenges within the constraints
of digital environments (Watson et al., 2018). This includes the low status of territorial
embeddedness, which is widely recognized as an essential factor for a retailer’s
internationalization process to be successful (Hess, 2004; Tacconelli and Wrigley, 2009; Burt
et al., 2017; Wood et al., 2019). A research gap regarding a broader conceptualisation of the
prior digital market entry and the recognition of the underlying circumstances and dynamics
has been identified. Although, digitalisation is not a new phenomenon in retailing (Hagberg et
al., 2016), there is a paucity of studies that analyse the transformations of expansion strategies
due to digitalisation and the long-term, macro implications of the latter.
Purpose
The purpose of this paper is to investigate the internationalization strategy of the two retailers
Aldi Süd and Costco in China. The paper addresses the lack of studies that analyze the
potentially far-reaching effects that digitalization might have on the market entry strategies of
retailers. Consequently, the purpose of this paper is to fill this research gab by examining how
market entry strategy is transformed by digitalization. More specifically, the paper aims to
examine why Aldi Süd and Costco for the first time deviate from their usual expansion strategy
in regard to their market entry method (online shop first) as well as if and how the prior-online
market entry reflects a strategic response to organisational challenges faced by retailers in the
Chinese market. Additionally, this paper seeks to partially follow on from the research by Wood
et al. (2019), who study the embeddedness processes within the internationalization of online
fashion retailers. They question whether the extensively acknowledged requirement for retailers
to obtain territorial embeddedness within host markets is considered relevant in online
international retail expansion. However, in contrast to the fashion sector, this paper intends to
contribute to the conceptual debate in regard to grocery retailers in China and to the prior-online
market entry approach.
Design/methodology/approach
The paper is based on expert interviews with senior executives of the two international retailers,
but also with retail specialists and consultants in order to receive a more balanced observation
of the Chinese market. Twelve interviews were conducted in 2015, most of them gaining new
3 of 6
relevance considering the recent divestment activity and Aldi Süd’s market entry as realized in
the meantime. Three additional interviews were conducted in March 2020, including one
written interview with the Head of Communication at Aldi Süd China. Anonymity has been
assured to the two interviewed retail experts from each of the two examined retailers Aldi Süd
and Costco. All oral interviews lasted 45 to 110 minutes and were partly recorded, transcribed
and analysed. Interview questions asked to Aldi Süd and Costco covered four main topics,
namely (1) challenges in the Chinese market (e. g. What are the main challenges in regard to
the Chinese market?), (2) changing strategy in the Chinese market (e. g. What are the key
advantages/disadvantages of the online-first entry? How does the online shop influence the
store network and vice versa?); (3) competitors (e.g. Specific problems that Tesco and Dia had
to face in the Chinese market: What are Aldi and Costco doing differently?; and (4) localization
and embeddedness (e. g. Is localization a key target? To which scope can it be achieved within
the online market entry? How do Aldi and Costco adopt to the Chinese market?). The
interviewees were mainly senior managers who were typically in charge of their firms’
operations in China in the spheres of sales, store-development strategy and expansion.
However, especially for interviews with the senior managers, in few cases, recording or
verbatim note-taking was strongly discouraged, wherefore both off-site and on-site note taking
methods were used. A clear limitation of this paper lies in the limited number of expert
interviews as well as the risk that respondents might be subjective in their assessments of their
own company’s skills relative to those of competitors. However, the explorative nature of the
study allows the suggestions of initial conceptualizations as well as the derivation of several
implications, which are of high value for further studies in this field. Initially, after reviewing
the literature on market entry strategies, a conceptual framework consisting of major challenges
which have to be faced by retailers in China in regard to embeddedness is developed. The
following chapter analyses and exemplifies if and how digital market entry replies to or
transforms each of the elements included in the framework. Finally, a brief research agenda for
work on digital market entries is outlined in chapter four in order to further delineate the
transformation of market entry and retailing expansion respectively.
Findings
The prior-online market entry by international retailers Aldi Süd and Costco represents a
strategic response to organizational challenges and opportunities that have to be faced in the
highly competitive and fast-evolving Chinese market. For both retailers, prior-online market
entry offers the opportunity to ‘test the water’, since it allows a higher degree of flexibility at
42
4 of 6
reduced costs and the staggered build-up of embeddedness in order to facilitate the
establishment of a store network. Interestingly, also differences between the two retailers in
why to adopt the prior-online entry prevail. While Aldi Süd is said to gain experience of the
Chinese market and absorb the unique e-commerce knowledge, which the retailer lacks in its
other markets, Costco is using the prior-online entry mainly for the establishment of sourcing
processes as well as the creation of relationships with suppliers. While Costco is using a
standardized approach for its physical store network in China as in other international markets,
Aldi Süd is reinventing itself with a completely new strategy, thereby studying and evaluating
differing cultural tastes and regulations via its online store for the operation of its physical store
network. Consequently, in contrast to Costco, the inherent paradox of localization and
standardization (Zhang and Wei, 2015) is strongly influencing the strategy of Aldi Süd in China.
Research limitations/implications
As the phenomenon of transnational grocery retailers using prior-online market entry is still
very new, this study is limited to the discussion of two retailers’ entry and expansion strategies
within the Chinese market. Moreover, the number of expert interviews is limited, and non-
replicable one-off interviews are inherent with the risk that interviewees might be subjective in
their assessments of their own company’s skills relative to those of their competitors’. However,
the explorative nature of the study allows the suggestions of initial conceptualizations as well
as the derivation of several implications, which are of high value for further studies in this field.
Practical implications
The online/digital market entry can be used as a means of establishing crucial relationships
(with suppliers and local authorities), as well as absorbing knowledge regarding the way of
doing business and learning about Chinese customers, allowing expansion with relatively low
levels of resource and reduced costs. Yet, it represents one part of the overall strategy and it
remains uncertain as to what degree prior-online market entry supports a following brick and
mortar expansion.
Originality/value
Prior-online market entry strategy by grocery retailers entering the Chinese market has not yet
been the focus of academic research. In regard to grocery discount retailers, it has so far been
argued that food discounters are prepared to accept a lower expansion speed in order to expand
at minimum risk and cost (Turban and Wolf, 2006). In addition, countries were selected which
43
4 of 6
reduced costs and the staggered build-up of embeddedness in order to facilitate the
establishment of a store network. Interestingly, also differences between the two retailers in
why to adopt the prior-online entry prevail. While Aldi Süd is said to gain experience of the
Chinese market and absorb the unique e-commerce knowledge, which the retailer lacks in its
other markets, Costco is using the prior-online entry mainly for the establishment of sourcing
processes as well as the creation of relationships with suppliers. While Costco is using a
standardized approach for its physical store network in China as in other international markets,
Aldi Süd is reinventing itself with a completely new strategy, thereby studying and evaluating
differing cultural tastes and regulations via its online store for the operation of its physical store
network. Consequently, in contrast to Costco, the inherent paradox of localization and
standardization (Zhang and Wei, 2015) is strongly influencing the strategy of Aldi Süd in China.
Research limitations/implications
As the phenomenon of transnational grocery retailers using prior-online market entry is still
very new, this study is limited to the discussion of two retailers’ entry and expansion strategies
within the Chinese market. Moreover, the number of expert interviews is limited, and non-
replicable one-off interviews are inherent with the risk that interviewees might be subjective in
their assessments of their own company’s skills relative to those of their competitors’. However,
the explorative nature of the study allows the suggestions of initial conceptualizations as well
as the derivation of several implications, which are of high value for further studies in this field.
Practical implications
The online/digital market entry can be used as a means of establishing crucial relationships
(with suppliers and local authorities), as well as absorbing knowledge regarding the way of
doing business and learning about Chinese customers, allowing expansion with relatively low
levels of resource and reduced costs. Yet, it represents one part of the overall strategy and it
remains uncertain as to what degree prior-online market entry supports a following brick and
mortar expansion.
Originality/value
Prior-online market entry strategy by grocery retailers entering the Chinese market has not yet
been the focus of academic research. In regard to grocery discount retailers, it has so far been
argued that food discounters are prepared to accept a lower expansion speed in order to expand
at minimum risk and cost (Turban and Wolf, 2006). In addition, countries were selected which 5 of 6
already have a certain market maturity (Colla, 2003). The Chinese market entry makes it clear
that in times of digitalisation, a prior-online market entry can expedite the expansion of physcial
stores in a more cost-effective way. By minimising risks and optimising offers, prior-digital
market entry opens up the possibility of experimenting and building up relationships in the
market in advance to the establishment of a physical store network. Yet, in comparing Aldi Süd
and Costco, it becomes apparent, that the prior-online market entry plays different roles in their
overall strategy in the Chinese market.
Keywords: Retailing, Internationalization, Digital Market Entry, China, Aldi, Costco
Article Classification: Research Paper
Literature
A.T. Kearney (2019), “The 2018 Global Retail Development Index.” https://www.atkearney.com/global-retail-development-index
Bu, L., Wang, J., Wei Wang, K., Zipser, D. (2019), “China digital consumer trends 2019”. McKinsey & Company.
Burt S., Coe N.M. and Davies, K. (2019), „A tactical retreat? Conceptualizing the dynamics of European grocery retail divestment from East Asia“. International Business Review 28(1): 177-189.
Burt, S., Johansson, U. and Dawson, J. (2017), “Dissecting embeddedness in international retailing”. Journal of Economic Geography 17(3): 685 – 707.
Coe N. M. and Wrigley, N. (2018), “Towards new economic geographies of retail globalization”, in G.L. Clark, M.P. Feldman, M.S. Gertler and D. Wójcik (eds.) The New Oxford Handbook of Economic Geography. Oxford University Press, Oxford: 427-447.
Colla, E. (2003), “International Expansion and Strategies of Discount Grocery Retailers: The Winning Models”. International Journal of Retail and Distribution Management, 31(1): 55 - 66.
Doherty, A. M. and Quinn, B. (1999), “International Retail Franchising: An Agency Theory Perspective”. International Journal of Retail & Distribution Management 27(6): 224-237.
Dunning, J. (1988), “The Eclectic Paradigm of International Production: A Restatement and Some Possible Extensions”. Journal of International Business Studies 19(1): 1-31.
44
6 of 6
Hagberg, J., Sundström, M. & Egels-Zandén, N. (2016), “The digitalization of retailing: an exploratory framework”. International Journal of Retail & Distribution Management 44(7): 694 – 712
Hardaker, S. (2017), “The changing role of international grocery retailers in China over time, 1978 – 2016”. In: History of Retailing and Consumption 3(1): 53-69.
Hardaker, S. (2018a), “Retail format competition: The case of grocery discount stores and why they haven’t conquered the Chinese market (yet)”. Moravian Geographical Reports 26(3): 20-227.
Hardaker, S. (2018b), “Retail Revolution in China’ - Transformation Processes in the World’s Largest Grocery Retailing Market”. Die Erde 149(1): 14-24.
Hess, M. (2004): ‘Spatial' relationships? Towards a reconceptualization of embeddedness. Progress in Human Geography, 28(2): 165-186.
Huang, Y. and Sternquist, B. (2007), “Retailers´ Foreign Market Entry Decisions: An Institutional Perspective”. International Business Review 16(5): 613-629.
Park, Y., and Sternquist, B. (2008), “The global retailer's strategic proposition and choice of entry mode”. International Journal of Retail & Distribution Management 36(4): 281-299.
Swoboda, B., Elsner, S., and Olejnik, E. (2015), “How do past mode choices influence subsequent entry? A study on the boundary conditions of preferred entry modes of retail firms”. International Business Review 24(3): 506-517.
Tacconelli, W. & Wrigley, N. (2009), “Organizational Challenges and Strategic Responses of Retail TNCs in Post - WTO - Entry China”. Economic Geography 85(1): 49 - 73.
Wang, S. (2003), “Internationalization of retailing in China”. In: Dawnson, J., M. Mukoyama, S. C. Choi and R. Larke (Eds.) The Internationalisation of Retailing in Asia. London: Routledge-Curzon: 114-135.
Watson, G. F., Weaven. S., Perkins, H., Sardana, D. and Palmatier, R. W. (2018), “International Market Entry Strategies: Relational, Digital, and Hybrid Approaches” Journal of International Marketing 26(1), 30 – 60.
Wood S., Coe, N. M., Watson, I. and Teller, C. (2019), “Dynamic Processes of Territorial Embeddedness in International Online Fashion Retailing”, Economic Geography, DOI: 10.1080/00130095.2019.1592672
Zhang, L. and Wei, Y.H.D. (2015), “Foreign hypermarket retailers in China: spatial penetration, local embeddedness and structural paradox.” Geographic Review 105(4): 528-550.

45
6 of 6
Hagberg, J., Sundström, M. & Egels-Zandén, N. (2016), “The digitalization of retailing: an exploratory framework”. International Journal of Retail & Distribution Management 44(7): 694 – 712
Hardaker, S. (2017), “The changing role of international grocery retailers in China over time, 1978 – 2016”. In: History of Retailing and Consumption 3(1): 53-69.
Hardaker, S. (2018a), “Retail format competition: The case of grocery discount stores and why they haven’t conquered the Chinese market (yet)”. Moravian Geographical Reports 26(3): 20-227.
Hardaker, S. (2018b), “Retail Revolution in China’ - Transformation Processes in the World’s Largest Grocery Retailing Market”. Die Erde 149(1): 14-24.
Hess, M. (2004): ‘Spatial' relationships? Towards a reconceptualization of embeddedness. Progress in Human Geography, 28(2): 165-186.
Huang, Y. and Sternquist, B. (2007), “Retailers´ Foreign Market Entry Decisions: An Institutional Perspective”. International Business Review 16(5): 613-629.
Park, Y., and Sternquist, B. (2008), “The global retailer's strategic proposition and choice of entry mode”. International Journal of Retail & Distribution Management 36(4): 281-299.
Swoboda, B., Elsner, S., and Olejnik, E. (2015), “How do past mode choices influence subsequent entry? A study on the boundary conditions of preferred entry modes of retail firms”. International Business Review 24(3): 506-517.
Tacconelli, W. & Wrigley, N. (2009), “Organizational Challenges and Strategic Responses of Retail TNCs in Post - WTO - Entry China”. Economic Geography 85(1): 49 - 73.
Wang, S. (2003), “Internationalization of retailing in China”. In: Dawnson, J., M. Mukoyama, S. C. Choi and R. Larke (Eds.) The Internationalisation of Retailing in Asia. London: Routledge-Curzon: 114-135.
Watson, G. F., Weaven. S., Perkins, H., Sardana, D. and Palmatier, R. W. (2018), “International Market Entry Strategies: Relational, Digital, and Hybrid Approaches” Journal of International Marketing 26(1), 30 – 60.
Wood S., Coe, N. M., Watson, I. and Teller, C. (2019), “Dynamic Processes of Territorial Embeddedness in International Online Fashion Retailing”, Economic Geography, DOI: 10.1080/00130095.2019.1592672
Zhang, L. and Wei, Y.H.D. (2015), “Foreign hypermarket retailers in China: spatial penetration, local embeddedness and structural paradox.” Geographic Review 105(4): 528-550.
7 of 6
Zhang, L. and Hardaker, S. (in review), “Divestment of European retailers in China.”
46
BRAND CHOICE PHASES IN A VIRTUAL SUPERMARKET: AN EYE-TRACKING BASED ANALYSIS
CARMEN TORRECILLA MORENO
ENRIQUE BIGNÉ ALCAÑIZ
JAIME GUIXERES PROVINCIALE
MARIANO ALCAÑIZ RAYA
[email protected], [email protected], [email protected], [email protected]
Universitat Politècnica de València, Universitat de València (Spain)
Introduction
Having knowledge of the consumer’s brand choice process at the point of sale allows retailers to optimize their brand assortment. This choice process can be analysed by observation-based methods. An analysis of consumers’ gaze behaviour through eye-tracking can effectivelydelimit the phases of this choice process.
The previous literature has indicated that brand choice at the point of sale is a multi-phased process (Shankar et al., 2011), although there is no consensus on the number or type of phases. Russo and Leclerc (1994) made one of the main contributions to the theoretical framework of the study of this topic. They saw the choice process as a series of evaluations, comparisons, and eliminations of different options, ending with the selection of a single choice from those that formed the choice set.
The recent application of virtual reality to marketing (Alcañiz, Bigne, and Guixeres, 2019) has opened up new opportunities for researching consumer behaviour in virtual environments. The development of virtual spaces that resemble real stores calls for new research. This work aims to analyse the phases of the brand choice process in a virtual supermarket.
PurposeThe objective of this study is to demonstrate, in a virtual environment, whether brand choice at the point of sale follows the three-stage sequential process identified by Russo and Leclerc (1994): (i) Orientation; (ii) Evaluation; and (iii) Verification. The literature accepts that the choice process is multi-phased, although the analysis methods used prior to the advent of eye-tracking significantly hindered the specification of the phases. The present study usesfixations, refixations and saccadic movements. The study is based on the representation of avirtual supermarket aisle and beer purchases. It was shown that brand choice is a three-phased sequential process that moves, first, from the location of products/brands, and second,through an evaluation stage where the choice set is formed, and, third, ends with brand selection. It was shown that the three choice process phases were present in 85% of purchases studied.
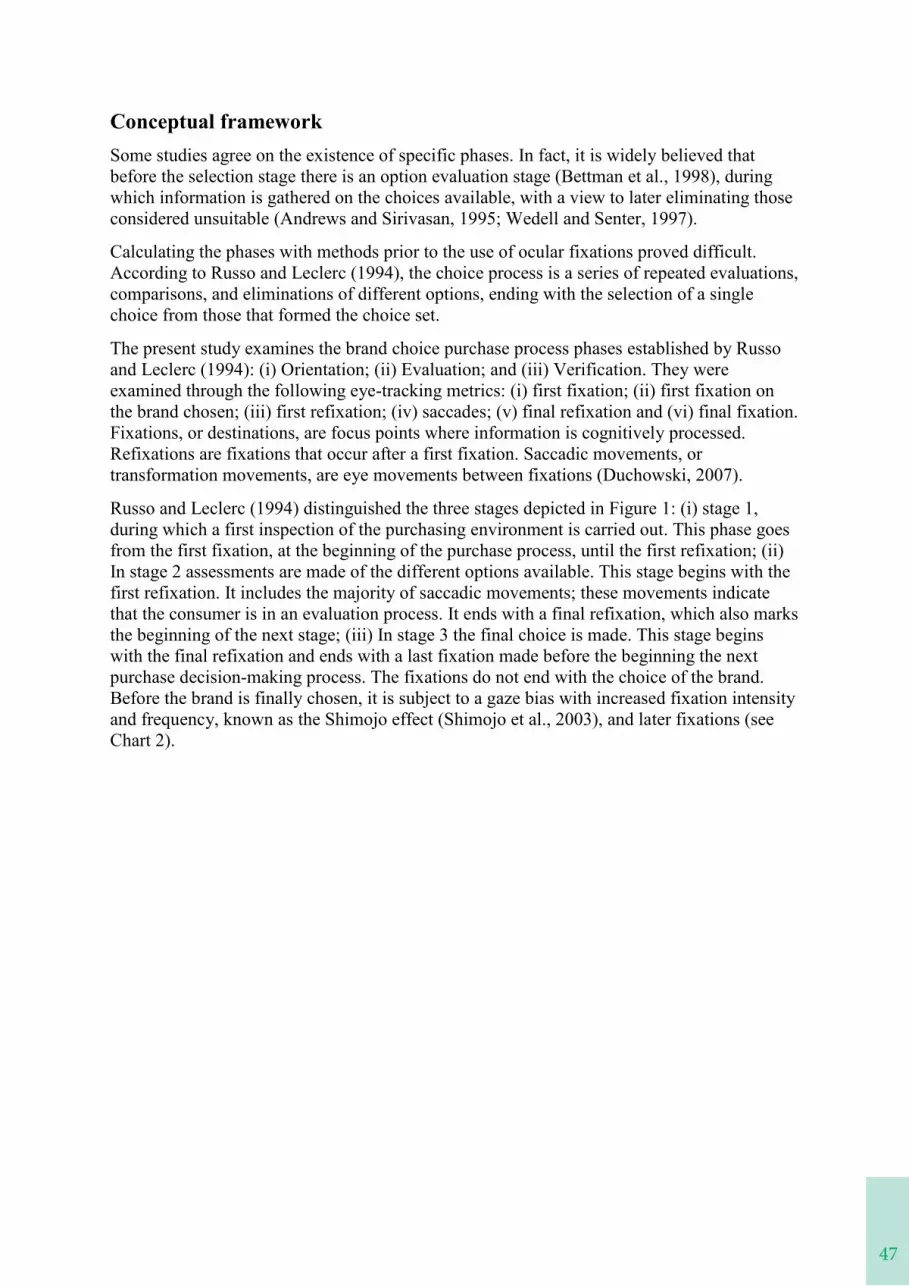
47
BRAND CHOICE PHASES IN A VIRTUAL SUPERMARKET: AN EYE-TRACKING BASED ANALYSIS
CARMEN TORRECILLA MORENO
ENRIQUE BIGNÉ ALCAÑIZ
JAIME GUIXERES PROVINCIALE
MARIANO ALCAÑIZ RAYA
[email protected], [email protected], [email protected], [email protected]
Universitat Politècnica de València, Universitat de València (Spain)
Introduction
Having knowledge of the consumer’s brand choice process at the point of sale allows retailers to optimize their brand assortment. This choice process can be analysed by observation-based methods. An analysis of consumers’ gaze behaviour through eye-tracking can effectivelydelimit the phases of this choice process.
The previous literature has indicated that brand choice at the point of sale is a multi-phased process (Shankar et al., 2011), although there is no consensus on the number or type of phases. Russo and Leclerc (1994) made one of the main contributions to the theoretical framework of the study of this topic. They saw the choice process as a series of evaluations, comparisons, and eliminations of different options, ending with the selection of a single choice from those that formed the choice set.
The recent application of virtual reality to marketing (Alcañiz, Bigne, and Guixeres, 2019) has opened up new opportunities for researching consumer behaviour in virtual environments. The development of virtual spaces that resemble real stores calls for new research. This work aims to analyse the phases of the brand choice process in a virtual supermarket.
PurposeThe objective of this study is to demonstrate, in a virtual environment, whether brand choice at the point of sale follows the three-stage sequential process identified by Russo and Leclerc (1994): (i) Orientation; (ii) Evaluation; and (iii) Verification. The literature accepts that the choice process is multi-phased, although the analysis methods used prior to the advent of eye-tracking significantly hindered the specification of the phases. The present study usesfixations, refixations and saccadic movements. The study is based on the representation of avirtual supermarket aisle and beer purchases. It was shown that brand choice is a three-phased sequential process that moves, first, from the location of products/brands, and second,through an evaluation stage where the choice set is formed, and, third, ends with brand selection. It was shown that the three choice process phases were present in 85% of purchases studied.
Conceptual frameworkSome studies agree on the existence of specific phases. In fact, it is widely believed that before the selection stage there is an option evaluation stage (Bettman et al., 1998), duringwhich information is gathered on the choices available, with a view to later eliminating those considered unsuitable (Andrews and Sirivasan, 1995; Wedell and Senter, 1997).
Calculating the phases with methods prior to the use of ocular fixations proved difficult. According to Russo and Leclerc (1994), the choice process is a series of repeated evaluations, comparisons, and eliminations of different options, ending with the selection of a single choice from those that formed the choice set.
The present study examines the brand choice purchase process phases established by Russo and Leclerc (1994): (i) Orientation; (ii) Evaluation; and (iii) Verification. They were examined through the following eye-tracking metrics: (i) first fixation; (ii) first fixation onthe brand chosen; (iii) first refixation; (iv) saccades; (v) final refixation and (vi) final fixation. Fixations, or destinations, are focus points where information is cognitively processed. Refixations are fixations that occur after a first fixation. Saccadic movements, or transformation movements, are eye movements between fixations (Duchowski, 2007).
Russo and Leclerc (1994) distinguished the three stages depicted in Figure 1: (i) stage 1, during which a first inspection of the purchasing environment is carried out. This phase goes from the first fixation, at the beginning of the purchase process, until the first refixation; (ii) In stage 2 assessments are made of the different options available. This stage begins with the first refixation. It includes the majority of saccadic movements; these movements indicate that the consumer is in an evaluation process. It ends with a final refixation, which also marks the beginning of the next stage; (iii) In stage 3 the final choice is made. This stage begins with the final refixation and ends with a last fixation made before the beginning the next purchase decision-making process. The fixations do not end with the choice of the brand. Before the brand is finally chosen, it is subject to a gaze bias with increased fixation intensity and frequency, known as the Shimojo effect (Shimojo et al., 2003), and later fixations (seeChart 2).
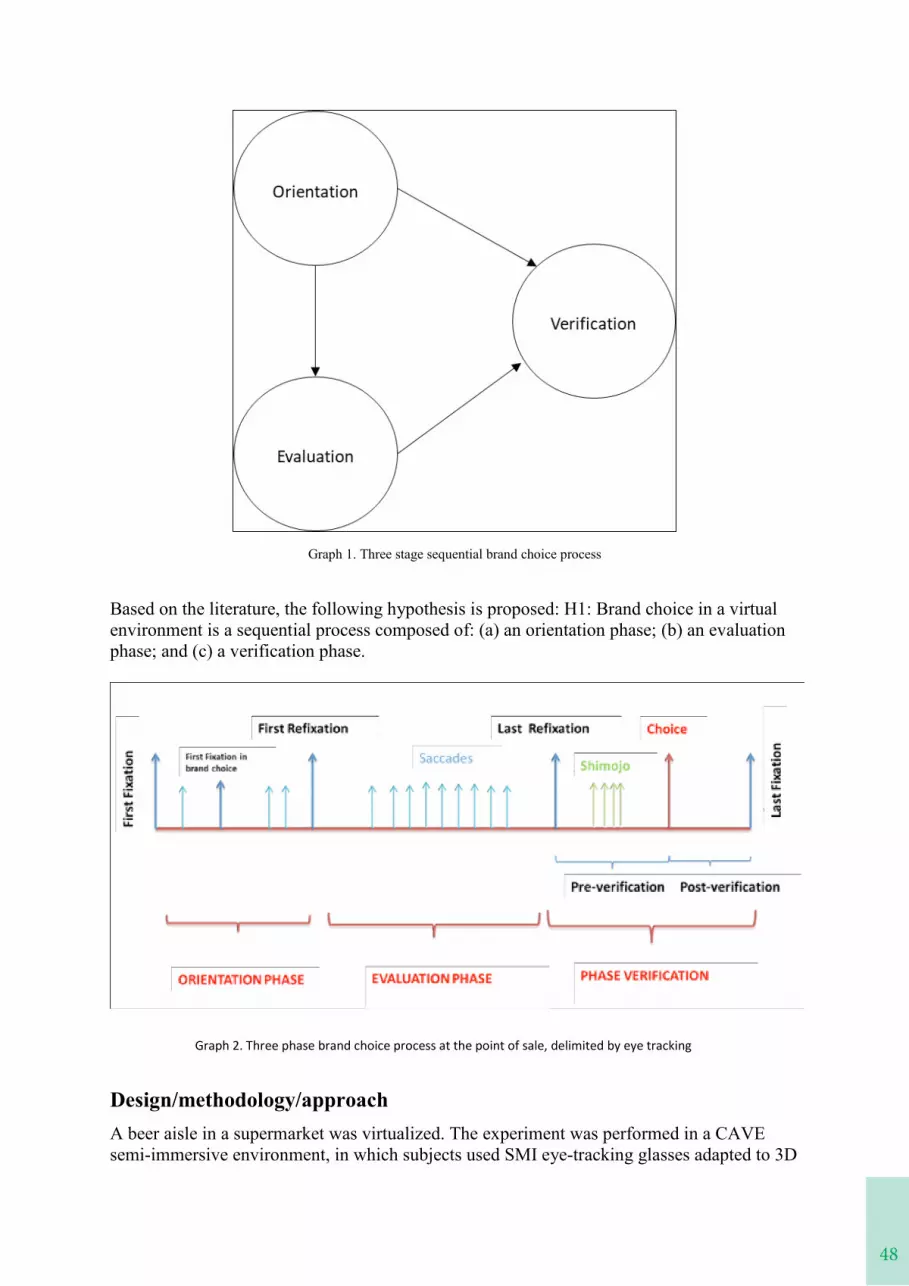
48
Graph 1. Three stage sequential brand choice process
Based on the literature, the following hypothesis is proposed: H1: Brand choice in a virtual environment is a sequential process composed of: (a) an orientation phase; (b) an evaluation phase; and (c) a verification phase.
Design/methodology/approachA beer aisle in a supermarket was virtualized. The experiment was performed in a CAVE semi-immersive environment, in which subjects used SMI eye-tracking glasses adapted to 3D
Graph 2. Three phase brand choice process at the point of sale, delimited by eye tracking
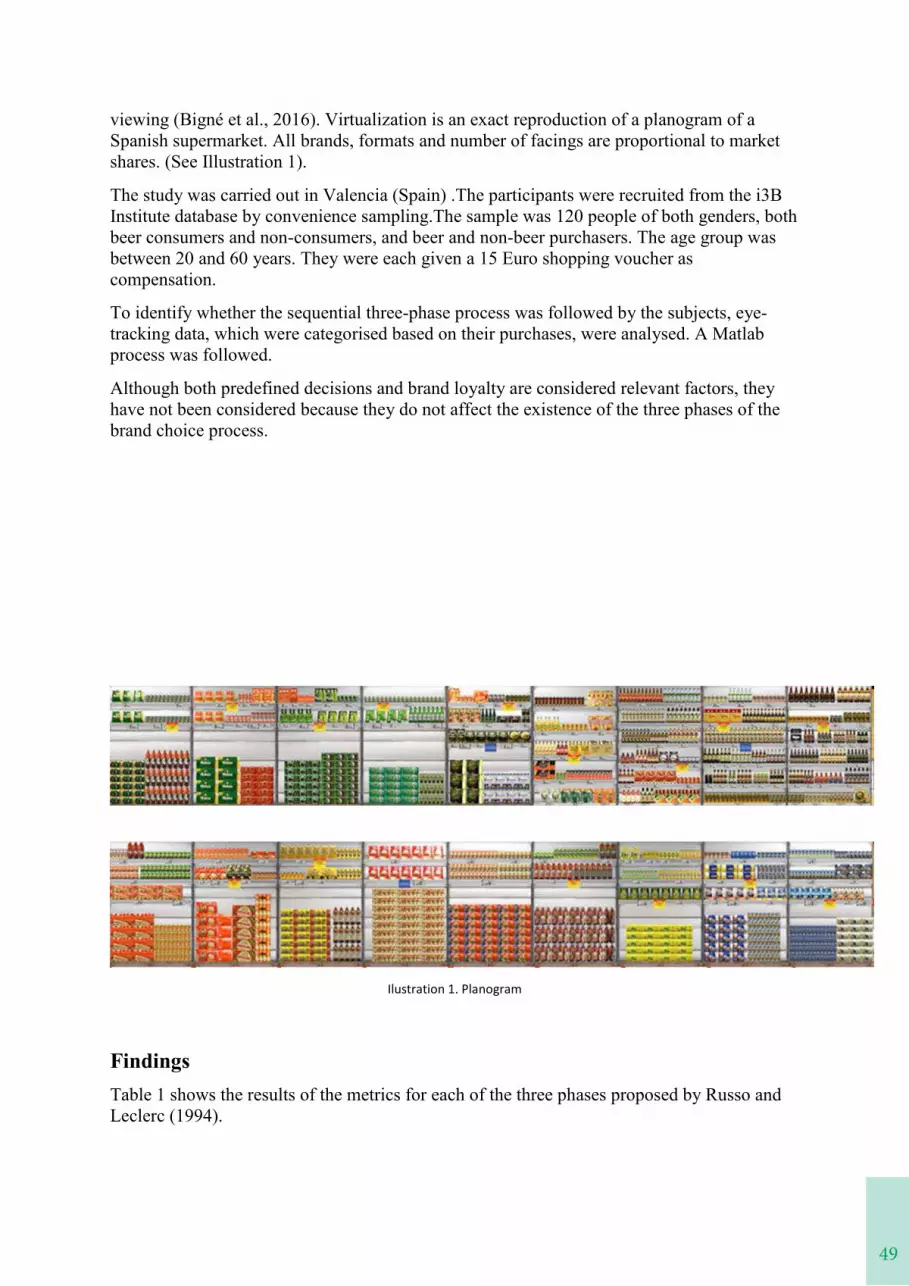
49
Graph 1. Three stage sequential brand choice process
Based on the literature, the following hypothesis is proposed: H1: Brand choice in a virtual environment is a sequential process composed of: (a) an orientation phase; (b) an evaluation phase; and (c) a verification phase.
Design/methodology/approachA beer aisle in a supermarket was virtualized. The experiment was performed in a CAVE semi-immersive environment, in which subjects used SMI eye-tracking glasses adapted to 3D
Graph 2. Three phase brand choice process at the point of sale, delimited by eye tracking
viewing (Bigné et al., 2016). Virtualization is an exact reproduction of a planogram of a Spanish supermarket. All brands, formats and number of facings are proportional to market shares. (See Illustration 1).
The study was carried out in Valencia (Spain) .The participants were recruited from the i3B Institute database by convenience sampling.The sample was 120 people of both genders, both beer consumers and non-consumers, and beer and non-beer purchasers. The age group was between 20 and 60 years. They were each given a 15 Euro shopping voucher ascompensation.
To identify whether the sequential three-phase process was followed by the subjects, eye-tracking data, which were categorised based on their purchases, were analysed. A Matlab process was followed.
Although both predefined decisions and brand loyalty are considered relevant factors, they have not been considered because they do not affect the existence of the three phases of the brand choice process.
Ilustration 1. Planogram
FindingsTable 1 shows the results of the metrics for each of the three phases proposed by Russo and Leclerc (1994).
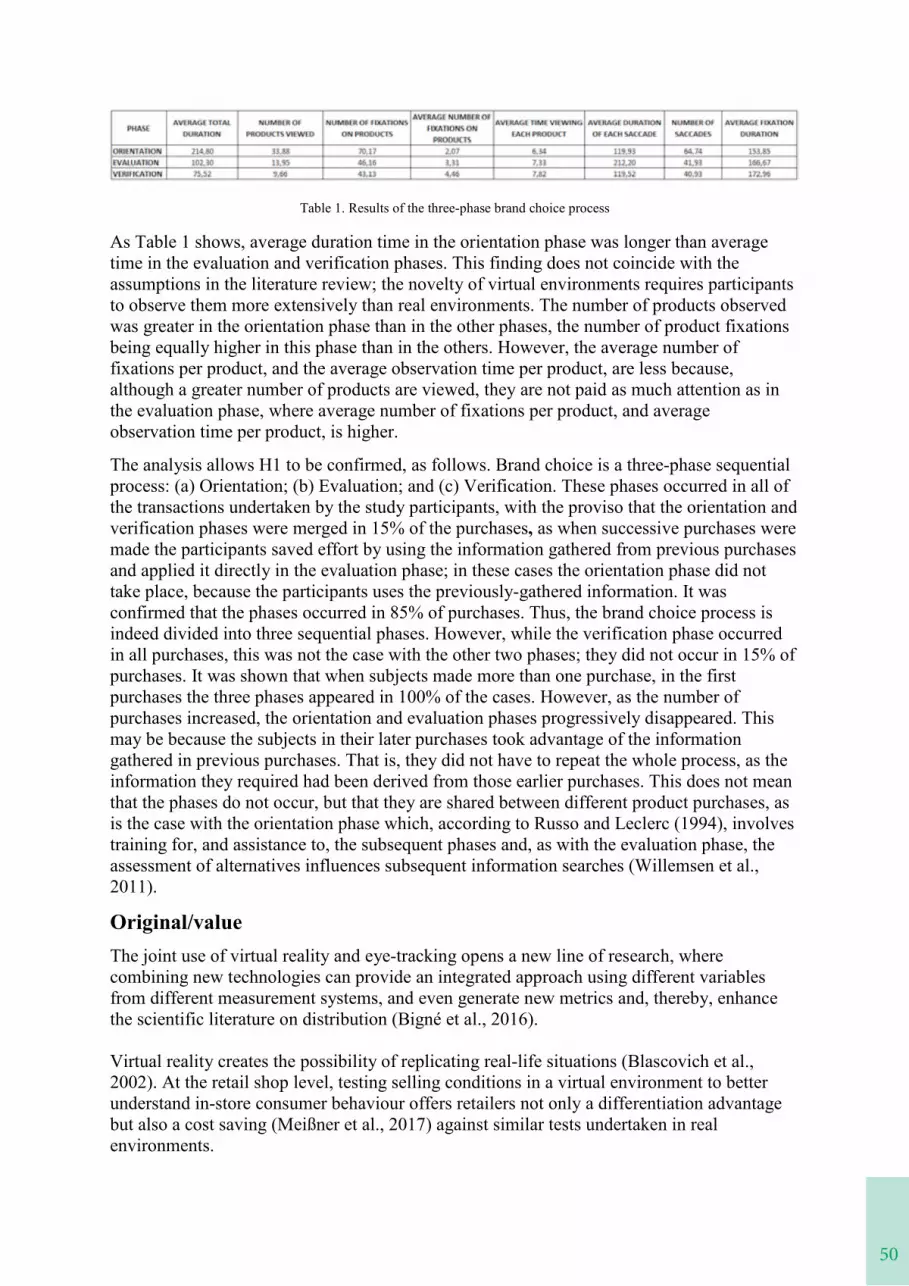
50
Table 1. Results of the three-phase brand choice process
As Table 1 shows, average duration time in the orientation phase was longer than average time in the evaluation and verification phases. This finding does not coincide with the assumptions in the literature review; the novelty of virtual environments requires participants to observe them more extensively than real environments. The number of products observed was greater in the orientation phase than in the other phases, the number of product fixations being equally higher in this phase than in the others. However, the average number of fixations per product, and the average observation time per product, are less because,although a greater number of products are viewed, they are not paid as much attention as in the evaluation phase, where average number of fixations per product, and average observation time per product, is higher.
The analysis allows H1 to be confirmed, as follows. Brand choice is a three-phase sequential process: (a) Orientation; (b) Evaluation; and (c) Verification. These phases occurred in all of the transactions undertaken by the study participants, with the proviso that the orientation and verification phases were merged in 15% of the purchases, as when successive purchases were made the participants saved effort by using the information gathered from previous purchases and applied it directly in the evaluation phase; in these cases the orientation phase did not take place, because the participants uses the previously-gathered information. It wasconfirmed that the phases occurred in 85% of purchases. Thus, the brand choice process is indeed divided into three sequential phases. However, while the verification phase occurredin all purchases, this was not the case with the other two phases; they did not occur in 15% of purchases. It was shown that when subjects made more than one purchase, in the first purchases the three phases appeared in 100% of the cases. However, as the number of purchases increased, the orientation and evaluation phases progressively disappeared. This may be because the subjects in their later purchases took advantage of the information gathered in previous purchases. That is, they did not have to repeat the whole process, as the information they required had been derived from those earlier purchases. This does not mean that the phases do not occur, but that they are shared between different product purchases, as is the case with the orientation phase which, according to Russo and Leclerc (1994), involves training for, and assistance to, the subsequent phases and, as with the evaluation phase, the assessment of alternatives influences subsequent information searches (Willemsen et al., 2011).
Original/valueThe joint use of virtual reality and eye-tracking opens a new line of research, where combining new technologies can provide an integrated approach using different variables from different measurement systems, and even generate new metrics and, thereby, enhancethe scientific literature on distribution (Bigné et al., 2016).
Virtual reality creates the possibility of replicating real-life situations (Blascovich et al., 2002). At the retail shop level, testing selling conditions in a virtual environment to better understand in-store consumer behaviour offers retailers not only a differentiation advantage but also a cost saving (Meißner et al., 2017) against similar tests undertaken in real environments.
51
Table 1. Results of the three-phase brand choice process
As Table 1 shows, average duration time in the orientation phase was longer than average time in the evaluation and verification phases. This finding does not coincide with the assumptions in the literature review; the novelty of virtual environments requires participants to observe them more extensively than real environments. The number of products observed was greater in the orientation phase than in the other phases, the number of product fixations being equally higher in this phase than in the others. However, the average number of fixations per product, and the average observation time per product, are less because,although a greater number of products are viewed, they are not paid as much attention as in the evaluation phase, where average number of fixations per product, and average observation time per product, is higher.
The analysis allows H1 to be confirmed, as follows. Brand choice is a three-phase sequential process: (a) Orientation; (b) Evaluation; and (c) Verification. These phases occurred in all of the transactions undertaken by the study participants, with the proviso that the orientation and verification phases were merged in 15% of the purchases, as when successive purchases were made the participants saved effort by using the information gathered from previous purchases and applied it directly in the evaluation phase; in these cases the orientation phase did not take place, because the participants uses the previously-gathered information. It wasconfirmed that the phases occurred in 85% of purchases. Thus, the brand choice process is indeed divided into three sequential phases. However, while the verification phase occurredin all purchases, this was not the case with the other two phases; they did not occur in 15% of purchases. It was shown that when subjects made more than one purchase, in the first purchases the three phases appeared in 100% of the cases. However, as the number of purchases increased, the orientation and evaluation phases progressively disappeared. This may be because the subjects in their later purchases took advantage of the information gathered in previous purchases. That is, they did not have to repeat the whole process, as the information they required had been derived from those earlier purchases. This does not mean that the phases do not occur, but that they are shared between different product purchases, as is the case with the orientation phase which, according to Russo and Leclerc (1994), involves training for, and assistance to, the subsequent phases and, as with the evaluation phase, the assessment of alternatives influences subsequent information searches (Willemsen et al., 2011).
Original/valueThe joint use of virtual reality and eye-tracking opens a new line of research, where combining new technologies can provide an integrated approach using different variables from different measurement systems, and even generate new metrics and, thereby, enhancethe scientific literature on distribution (Bigné et al., 2016).
Virtual reality creates the possibility of replicating real-life situations (Blascovich et al., 2002). At the retail shop level, testing selling conditions in a virtual environment to better understand in-store consumer behaviour offers retailers not only a differentiation advantage but also a cost saving (Meißner et al., 2017) against similar tests undertaken in real environments.
Facilitate the work of those responsible for trade marketing and make in-store decisions based on scientific evidence. In this way, the shopper's decision set can be known by studying the fixations and saccadic movements during the evaluation phase and in this way knowing what other brands the shopper has implicitly evaluated as possible purchase options.
Research limitations and outlook
The present study has not been replicated in real or in other virtual environments. Given the lack of research in this area, it would be interesting to replicate the study in an actual sales environment (Clement et al., 2013), and to relate its results to purchase data from real sales environments, as proposed by Larson, Bradlow and Fader ( 2005), and to include other product categories and, even, to use other neurophysiological measures, such as EEG, GSR, and HRV (Léger et al., 2014).
KeywordsEye-tracking, brand choice phases, neuromarketing, virtual reality, supermarket
References
Alcañiz, M., E. Bigné, and J. Guixeres (2019). Virtual reality in marketing: a framework, review and research agenda. Frontiers in Psychology, 10, 1530.
Andrews, R. L. and Srinivasan, T. C. (1995). “Studying consideration effects in empirical choice models using scanner panel data”. Journal of Marketing Research, Pag.30-41.
Bettman, J. R., Luce, M. F. and Payne, J. W. (1998). “Constructive consumer choiceprocesses”. Journal of Consumer Research, Vol.25(3), Pag.187-217.
Bigné, E., Llinares, M.C. and Torrecilla, C. (2016). “Elapsed time on first buying triggers brand choices within a category: A virtual reality-based study”. Journal of Business Research, Vol.69(4), Pag.1423-1427.
Blascovich, J., Loomis, J., Beall, A. C., Swinth, K. R., Hoyt, C. L. and Bailenson, J. N. (2002). “Immersive virtual environment technology as a methodological tool for social psychology”. Psychological Inquiry, Vol. 13(2), Pag. 103-124.
52
Clement, J., Kristensen, T. and Grønhaug, K. (2013). “Understanding consumers' in-store visual perception: The influence of package design features on visual attention”. Journal of Retailing and Consumer Services, Vol. 20(2), Pag. 234-239.
Duchowski, A. (2007), “Eye tracking methodology: Theory and practice” (Vol. 373). Springer Science & Business Media.
Larson, J. S., Bradlow, E. T. and Fader, P. S. (2005). “An exploratory look at supermarket shopping paths”. International Journal of Research in Marketing, Vol.22(4), Pag.395-414.
Léger, P. M., Sénecal, S., Courtemanche, F., Ortiz de Guinea, A., Titah, R., Fredette, M. andLabonte-LeMoyne, E. (2014). “Precision is in the eye of the beholder: application of eye fixation-related potentials to information systems research”. Journal of the Association for Information Systems, Vol. 15(10), Pag. 3.
Meißner, M., Pfeiffer, J., Pfeiffer, T and Oppewal, H. (2017). “Combining virtual reality and mobile eye tracking to provide a naturalistic experimental environment for shopper research”.Journal of Business Research, Vol. 100 (July), Pag. 445-458.
Russo and Leclerc. (1994). “An eye-fixation analysis of choice processes for consumer nondurables”. Journal of Consumer Research, Pag.274-290.
Shankar, V., Inman, J. J., Mantrala, M., Kelley, E. and Rizley, R. (2011). “Innovations in shopper marketing: current insights and future research issues”. Journal of Retailing,Vol.(29-49), Pag.87.
Shimojo, S., Simion, C., Shimojo, E. and Scheier, C. (2003). “Gaze bias both reflects and influences preference”. Nature Neuroscience, Vol.6(12), Pag.1317.

53
Clement, J., Kristensen, T. and Grønhaug, K. (2013). “Understanding consumers' in-store visual perception: The influence of package design features on visual attention”. Journal of Retailing and Consumer Services, Vol. 20(2), Pag. 234-239.
Duchowski, A. (2007), “Eye tracking methodology: Theory and practice” (Vol. 373). Springer Science & Business Media.
Larson, J. S., Bradlow, E. T. and Fader, P. S. (2005). “An exploratory look at supermarket shopping paths”. International Journal of Research in Marketing, Vol.22(4), Pag.395-414.
Léger, P. M., Sénecal, S., Courtemanche, F., Ortiz de Guinea, A., Titah, R., Fredette, M. andLabonte-LeMoyne, E. (2014). “Precision is in the eye of the beholder: application of eye fixation-related potentials to information systems research”. Journal of the Association for Information Systems, Vol. 15(10), Pag. 3.
Meißner, M., Pfeiffer, J., Pfeiffer, T and Oppewal, H. (2017). “Combining virtual reality and mobile eye tracking to provide a naturalistic experimental environment for shopper research”.Journal of Business Research, Vol. 100 (July), Pag. 445-458.
Russo and Leclerc. (1994). “An eye-fixation analysis of choice processes for consumer nondurables”. Journal of Consumer Research, Pag.274-290.
Shankar, V., Inman, J. J., Mantrala, M., Kelley, E. and Rizley, R. (2011). “Innovations in shopper marketing: current insights and future research issues”. Journal of Retailing,Vol.(29-49), Pag.87.
Shimojo, S., Simion, C., Shimojo, E. and Scheier, C. (2003). “Gaze bias both reflects and influences preference”. Nature Neuroscience, Vol.6(12), Pag.1317.
IMPULSE BUYING AND E-GROCERY: A CONCEPTUAL MODEL
Benedetta Grandi
Department of Economics
University of Parma, Italy
Via Kennedy 6, 43123 Parma (Italy)
E-mail: [email protected]
Tel: +39 0521 902479
Maria Grazia Cardinali
Department of Economics
University of Parma, Italy
E-mail: [email protected]
Tel: +39 0521 032439
Introduction
The growing penetration of digital technologies and mobile devices is transforming individuals’ life in every aspect, from the way people communicate to the design of the shopping cycle they face, from the information seeking to the purchase itself. The boundaries between online and offline environment are just crossed.
The phenomenon of e-commerce in the Italian context is expected to show a growth rate of 7,3% in the period 2020-2024. The market's largest segment is Electronics & Media, while Food and Personal Care sector represents the 12% of the market value in 2020 (Statista).
With the growing acceptance of the Internet among the population and the rapid growth of multi-channel sales, consumers are constantly exposed to marketing stimuli that seek to stimulate impulse buying. For example, the web is an alternative channel to stimulate impulse purchases and allows the consumer to buy during his free time, offering shopping opportunities 24 hours a day and seven days a week, anywhere (Phau & Lo, 2004).
Consumers often act impulsively when making online decisions. In fact, the 40 percent of online purchases can be defined on impulse. This is triggered by easy access to products, ease of purchase (just a click to order) and absence of social pressures and efforts (Jeffrey & Hodge, 2007).
So what about e-grocery? How consumers behave when they buy food products online? Is the phenomenon of impulse buying still present online? If yes, to what extent? In the literature, many studies have identified the variables affecting impulse buying during the physical grocery shopping trip (Beatty & Elizabeth Ferrell, 1998; Bhakat & Muruganantham, 2013; Hultén & Vanyushyn, 2011). Prior research on impulse buying in grocery sector found its antecedents in three main categories which include both endogenous and exogenous variables: individual characteristics (Weun, 1998); product category variables and type of food consumed (Inman et al., 2009; Jones et al., 2003; Mishra et al., 2012) and situational factors (Beatty & Elizabeth Ferrell, 1998; Belk, 1975).
54
Other studies have focused their attention on developing models in order to understand the impulse buying behaviour also online, but mainly in sectors other than the grocery one, like fashion or electronics and media (Jeffrey & Hodge, 2007). Thus, the present work, by combining the theory of offline impulse buying in the grocery sector and online impulse buying, intends to measure the phenomenon of impulse buying in the e-grocery context.
Conceptual framework
Online shopping frees consumers from the restrictions that occur in offline shopping, increasing the chances of the adoption of impulsive behaviours (Chan et al., 2017). Thus, it is reasonable to think that this can also occur while people look for food products. Many researchers have identify two main types of variables: endogenous and exogenous. The endogenous ones focus directly on the individual, examining the personal characteristics that push him to implement impulsive purchasing behaviour. These factors concern the personality of consumers, their inner tendency to behave impulsively, emotional states and socio-demographic factors (Kacen & Lee, 2002).
On the other hand, the exogenous variables refer to marketing stimuli that aim to influence urge to buy impulsively and then consumer’s actual purchasing behaviour (Dawson & Kim, 2009). In particular, different authors have found in website design, assortment, price, website usability,money and time spent online as antecedents of impulse buying.
Specifically, Jeffrey and Hodge (Jeffrey & Hodge, 2007) studied the influence of the amount of money spent by consumers on the likelihood that consumers would purchase a product impulsively. The results of a logistic regression analysis have shown a significant effect: the higher the amount spent, the higher the amount of purchases made on impulse. Similarly, the more time spent browsing on the website looking for food products, the more purchases are made impulsively. This because the possibility to see more products could increase the probability to buy something not planned before (Buttle, 1984).
Furthermore, also the products offered, the prices and how the website is design could influence the way customers browse the web and consequently the urge to buy impulsively and then the impulsive behaviour. Researches speak of level of attractiveness of the assortment, in terms of perception of the assortment size, adequacy of the value for money of the products offered, the average level of price, presence of price-cut, consistency with consumer's interest (Newman, 2015).The amount of purchases made impulsively increases when customers have a positive perception and attitude towards assortment and price.
In the same way, also perceived ease experienced while visiting the online store has an impact on shopping behaviour. Specifically, is has been found that a positive evaluation of the site's usability, including ease of use, and the design of the website, arouse positive emotions and this leads to a positive impact on impulse buying behaviour (Éthier et al., 2006).
Finally, a great importance must be given to the device through which customers make their shopping. Many studies have, in fact, found that the touch interfaces can change consumer behaviour (Brasel & Gips, 2014). However, according to the authors’ knowledge, no clear evidences are given about the effect on impulse buying behaviour in the grocery setting.
Purpose
Given all the above considerations, the present work wants to measure the phenomenon of impulse buying in the e-grocery sector. In doing so, we have combined the models already tested in the literature. In particular we took into consideration the impulse buying models in the grocery sector(offline purchases) and the models in the online environment (not specifically tested for food products). Furthermore, we wanted to test the impact of the device (mobile vs computer) on shoppers impulsivity.

55
Other studies have focused their attention on developing models in order to understand the impulse buying behaviour also online, but mainly in sectors other than the grocery one, like fashion or electronics and media (Jeffrey & Hodge, 2007). Thus, the present work, by combining the theory of offline impulse buying in the grocery sector and online impulse buying, intends to measure the phenomenon of impulse buying in the e-grocery context.
Conceptual framework
Online shopping frees consumers from the restrictions that occur in offline shopping, increasing the chances of the adoption of impulsive behaviours (Chan et al., 2017). Thus, it is reasonable to think that this can also occur while people look for food products. Many researchers have identify two main types of variables: endogenous and exogenous. The endogenous ones focus directly on the individual, examining the personal characteristics that push him to implement impulsive purchasing behaviour. These factors concern the personality of consumers, their inner tendency to behave impulsively, emotional states and socio-demographic factors (Kacen & Lee, 2002).
On the other hand, the exogenous variables refer to marketing stimuli that aim to influence urge to buy impulsively and then consumer’s actual purchasing behaviour (Dawson & Kim, 2009). In particular, different authors have found in website design, assortment, price, website usability,money and time spent online as antecedents of impulse buying.
Specifically, Jeffrey and Hodge (Jeffrey & Hodge, 2007) studied the influence of the amount of money spent by consumers on the likelihood that consumers would purchase a product impulsively. The results of a logistic regression analysis have shown a significant effect: the higher the amount spent, the higher the amount of purchases made on impulse. Similarly, the more time spent browsing on the website looking for food products, the more purchases are made impulsively. This because the possibility to see more products could increase the probability to buy something not planned before (Buttle, 1984).
Furthermore, also the products offered, the prices and how the website is design could influence the way customers browse the web and consequently the urge to buy impulsively and then the impulsive behaviour. Researches speak of level of attractiveness of the assortment, in terms of perception of the assortment size, adequacy of the value for money of the products offered, the average level of price, presence of price-cut, consistency with consumer's interest (Newman, 2015).The amount of purchases made impulsively increases when customers have a positive perception and attitude towards assortment and price.
In the same way, also perceived ease experienced while visiting the online store has an impact on shopping behaviour. Specifically, is has been found that a positive evaluation of the site's usability, including ease of use, and the design of the website, arouse positive emotions and this leads to a positive impact on impulse buying behaviour (Éthier et al., 2006).
Finally, a great importance must be given to the device through which customers make their shopping. Many studies have, in fact, found that the touch interfaces can change consumer behaviour (Brasel & Gips, 2014). However, according to the authors’ knowledge, no clear evidences are given about the effect on impulse buying behaviour in the grocery setting.
Purpose
Given all the above considerations, the present work wants to measure the phenomenon of impulse buying in the e-grocery sector. In doing so, we have combined the models already tested in the literature. In particular we took into consideration the impulse buying models in the grocery sector(offline purchases) and the models in the online environment (not specifically tested for food products). Furthermore, we wanted to test the impact of the device (mobile vs computer) on shoppers impulsivity.
Design/methodology/approach
In order to meet our goal, we conducted an experiment in a laboratory setting. We divided a sample of 122 participants (80% female, 25 average age) into two homogeneous groups for each of the devices considered (mobile and computer). Then, we asked them to fill in a brief questionnaire about their shopping habits, socio-demographic characteristics and their diet and to draw up a shopping list imagining to recreate a real shopping experience. Then, they were invited to browse the online shopping page of a leading Italian chain using the mobile app or the website. After the online grocery shopping they were asked to express an opinion about their experience and their perception about the assortment, the price, the site design and the site usability and the urge felt by participant to buy impulsively during the shopping. Then, we took note of the total amount and the time spent for the purchases. Finally, we measured the impulse buying comparing the basket of each participant with the shopping list drafted at the beginning of the experiment. All the data has been analyzed using SmartPLS package and a model has been proposed.
Findings
Looking at the results of the of the structural equation model we found that the site design influences the way customers browse the web and have a positive impact on impulsive purchases. On the contrary, we found a negative relationship between site usability and browsing. We found no relationship between assortment and price perception on browsing and impulse buying. Furthermore, we found a positive impact of money spent on impulse buying, while we found no effect of the time spent for the shopping. Finally, concerning the device, we found that participants experienced more impulsive purchases when the shop using a computer rather than using the mobile app.
Originality/value
The present work is the first attempt to analyze and measure the phenomenon of impulse buying behaviour in the e-grocery sector and the role of the device on the shopping experience.
Managerial implications
These results could help retailers to better understand how consumers behave when they shop online and to develop different marketing strategies based on the device used.
Research limitations
The limitations of the present work are connected with the sample size, not really representative of a larger population since we considered the website/app of a single Italian retailer. Finally, we conducted our measures in a laboratory setting and not considering real situations.
References
Beatty, S. E., & Elizabeth Ferrell, M. (1998). Impulse buying: Modeling its precursors. Journal of Retailing, 74(2), 161–167. https://doi.org/10.1016/S0022-4359(98)90009-4
Belk, R. W. (1975). Situational Variables and Consumer Behavior. Journal of Consumer Research,2(3), 157. https://doi.org/10.1086/208627
Bhakat, R. S., & Muruganantham, G. (2013). A Review of Impulse Buying Behavior. International Journal of Marketing Studies, 5(3). https://doi.org/10.5539/ijms.v5n3p149
Brasel, S. A., & Gips, J. (2014). Tablets, touchscreens, and touchpads: How varying touch interfaces trigger psychological ownership and endowment. Journal of Consumer Psychology, 24(2), 226–233. https://doi.org/10.1016/j.jcps.2013.10.003
Buttle, F. (1984). Merchandising. European Journal of Marketing, 18(6/7), 104–123.https://doi.org/10.1108/EUM0000000004795
56
Chan, T. K. H., Cheung, C. M. K., & Lee, Z. W. Y. (2017). The state of online impulse-buying research: A literature analysis. Information & Management, 54(2), 204–217. https://doi.org/10.1016/j.im.2016.06.001
Dawson, S., & Kim, M. (2009). External and internal trigger cues of impulse buying online. Direct Marketing: An International Journal, 3(1), 20–34. https://doi.org/10.1108/17505930910945714
Éthier, J., Hadaya, P., Talbot, J., & Cadieux, J. (2006). B2C web site quality and emotions during online shopping episodes: An empirical study. Information & Management, 43(5), 627–639.https://doi.org/10.1016/j.im.2006.03.004
Hultén, P., & Vanyushyn, V. (2011). Impulse purchases of groceries in France and Sweden. Journal of Consumer Marketing, 28(5), 376–384. https://doi.org/10.1108/07363761111150026
Inman, J. J., Winer, R. S., & Ferraro, R. (2009). The Interplay Among Category Characteristics, Customer Characteristics, and Customer Activities on In-Store Decision Making. Journal of Marketing, 73(5), 19–29. https://doi.org/10.1509/jmkg.73.5.19
Jeffrey, S. A., & Hodge, R. (2007). Factors influencing impulse buying during an online purchase. Electronic Commerce Research, 7(3–4), 367–379. https://doi.org/10.1007/s10660-007-9011-8
Jones, M. A., Reynolds, K. E., Weun, S., & Beatty, S. E. (2003). The product-specific nature of impulse buying tendency. Journal of Business Research, 56(7), 505–511.https://doi.org/10.1016/S0148-2963(01)00250-8
Kacen, J. J., & Lee, J. A. (2002). The Influence of Culture on Consumer Impulsive Buying Behavior. Journal of Consumer Psychology, 12(2), 163–176.https://doi.org/10.1207/S15327663JCP1202_08
Mishra, A., Mishra, H., & Masters, T. M. (2012). The Influence of Bite Size on Quantity of Food Consumed: A Field Study: Figure 1. Journal of Consumer Research, 38(5), 791–795.https://doi.org/10.1086/660838
Newman, A. (2015). Impulse Purchasing. In C. L. Cooper (Ed.), Wiley Encyclopedia of Management (pp. 1–1). John Wiley & Sons, Ltd. https://doi.org/10.1002/9781118785317.weom090472
Phau, I., & Lo, C. (2004). Profiling fashion innovators: A study of self‐concept, impulse buying and Internet purchase intent. Journal of Fashion Marketing and Management: An International Journal, 8(4), 399–411. https://doi.org/10.1108/13612020410559993
Weun, S. (1998). DEVELOPMENT AND VALIDATION OF THE IMPULSE BUYING TENDENCY SCALE. Psychological Reports, 82(3), 1123. https://doi.org/10.2466/PR0.82.3.1123-1133
57
Chan, T. K. H., Cheung, C. M. K., & Lee, Z. W. Y. (2017). The state of online impulse-buying research: A literature analysis. Information & Management, 54(2), 204–217. https://doi.org/10.1016/j.im.2016.06.001
Dawson, S., & Kim, M. (2009). External and internal trigger cues of impulse buying online. Direct Marketing: An International Journal, 3(1), 20–34. https://doi.org/10.1108/17505930910945714
Éthier, J., Hadaya, P., Talbot, J., & Cadieux, J. (2006). B2C web site quality and emotions during online shopping episodes: An empirical study. Information & Management, 43(5), 627–639.https://doi.org/10.1016/j.im.2006.03.004
Hultén, P., & Vanyushyn, V. (2011). Impulse purchases of groceries in France and Sweden. Journal of Consumer Marketing, 28(5), 376–384. https://doi.org/10.1108/07363761111150026
Inman, J. J., Winer, R. S., & Ferraro, R. (2009). The Interplay Among Category Characteristics, Customer Characteristics, and Customer Activities on In-Store Decision Making. Journal of Marketing, 73(5), 19–29. https://doi.org/10.1509/jmkg.73.5.19
Jeffrey, S. A., & Hodge, R. (2007). Factors influencing impulse buying during an online purchase. Electronic Commerce Research, 7(3–4), 367–379. https://doi.org/10.1007/s10660-007-9011-8
Jones, M. A., Reynolds, K. E., Weun, S., & Beatty, S. E. (2003). The product-specific nature of impulse buying tendency. Journal of Business Research, 56(7), 505–511.https://doi.org/10.1016/S0148-2963(01)00250-8
Kacen, J. J., & Lee, J. A. (2002). The Influence of Culture on Consumer Impulsive Buying Behavior. Journal of Consumer Psychology, 12(2), 163–176.https://doi.org/10.1207/S15327663JCP1202_08
Mishra, A., Mishra, H., & Masters, T. M. (2012). The Influence of Bite Size on Quantity of Food Consumed: A Field Study: Figure 1. Journal of Consumer Research, 38(5), 791–795.https://doi.org/10.1086/660838
Newman, A. (2015). Impulse Purchasing. In C. L. Cooper (Ed.), Wiley Encyclopedia of Management (pp. 1–1). John Wiley & Sons, Ltd. https://doi.org/10.1002/9781118785317.weom090472
Phau, I., & Lo, C. (2004). Profiling fashion innovators: A study of self‐concept, impulse buying and Internet purchase intent. Journal of Fashion Marketing and Management: An International Journal, 8(4), 399–411. https://doi.org/10.1108/13612020410559993
Weun, S. (1998). DEVELOPMENT AND VALIDATION OF THE IMPULSE BUYING TENDENCY SCALE. Psychological Reports, 82(3), 1123. https://doi.org/10.2466/PR0.82.3.1123-1133
1
PRICING AND CONSUMER DECISION MAKING FOR PREMIUM PRIVATE LABELS IN GROCERY RETAILING
Sascha Steinmann, Department of Management, Aarhus BSS, Aarhus, Denmark; [email protected]
Katharina Maria Fonferek, Marketing Department, FU Berlin, Berlin, Germany
Hanna Schramm-Klein, Marketing and Retailing, University of Siegen, Siegen, Germany; [email protected]
Gerhard Wagner, Marketing and Retailing, University of Siegen, Siegen, Germany; [email protected]
IntroductionHighly intense competition, strong concentration tendencies, and a low return on sales in growing sales areas characterized the grocery retailing for a long time. To deal with these issues as well as to differentiate themselves from competitors many retailers have introduced private labelled products in their assortment (Kumar and Steenkamp 2007; Koschate et al. 2014). The associated products are commonly positioned in lower price segments and quality levels are often not far below those of national brands (De Wulf et al. 2005; Pauwels and Srinivasan 2004). Furthermore, premium positioned private labels are characterized by their capacity for innovation and superior quality, which gives the consumer a high-added value and hence, might positively influence a retailer’s brand image (Ailawadi et al. 2008). Introducing premium private labelled brands in the assortment will increase the customers choice set in several product categories. From the perspective of the retailer it is therefore of crucial relevance to be aware of how the introduction of a new (premium) private label will be reflected in choice probabilities and market shares (Geyskens et al. 2010).
PurposeHuber et al. (1982) and Doyle et al. (1999) have shown that adding a new product to a choice set can result in a shift of preference to one specific product in the expanded set of alternatives. This effect is called the asymmetrically dominance effect (ADE) or attraction effect. Hence, from a retail perspective it is of relevance to position the introduced premium private label in a way that it will dominate the premium brand in a specific product category and not the traditional private label of the retailer. With regard to the positioning and the consumers’ perception of the introduced premium private labelled brand, pricing is of crucial importance. Food retailers with their own premium private labels might focus on enhancing the quality aspect, but at the same time they might be interested in attracting price-conscious customers. An inappropriate pricing could have a negative impact on the consumers’ perceptions of the quality of premium private labels, which will negatively influence the preference for the premium private labelled brand (Geyskens et al. 2010).
The purpose of the paper is to investigate the impact of pricing decisions on consumer choice and product evaluations in the context of premium private labels and to answer the question what other product attributes are relevant to a purchase decision of a premium private label product in an experimental study. Within this study, a premium private labeled product was added to a choice set of two products in the product category fruit spreads (traditional private label and premium brand). In three different experimental conditions, we manipulated the
58
2
price of the premium private labelled product and the caused effects on the evaluation of the premium private label compared to a traditional private label and a premium brand were analysed.
Conceptual and theoretical frameworkPrevious research has discovered compromise, attraction and similarity effects which show that the previous mentioned assumptions of the classical economic standard theory often will not hold due to an influence of several contextual factors (Doyle et al. 1999, Huber et al. 1982, Simonson 1989). Basically, making a decision implies the existence of a choice of more than one option. This means that a decision for Option A is initially a decision against Option B. This decision is justified on the basis of individual preferences and interests of the decision maker. By convention, A is clearly preferred to B. By adding a third option in a choice set of two existing options, without a dominant option, individuals might chose a compromise in the decision-relevant determinants (Simonson 1989). Accordingly, under specific contextual conditions there might be a balance of properties; the added option could represent the compromise, in a trade-off between the existing options (Simonson 1989). For our study, we mainly focus on the impact of the pricing of the added option – the premium private labeled product – to the alternatives under consideration. If the price of the premium private labeled product is closer to the premium brand in the choice set, the new option – the premium private labeled product - should as well be evaluated as more similar to the premium brand. Hence, the choice probability of the premium brand should be influenced due to the introduction of the premium private labeled product. If the price of the new option is closer to the traditional private label, this should mainly have an effect on the choice probability of the traditional private label, while the choice probability of the premium product should remain stable (Simonson and Tversky 1992).
However, the findings of Sinhaa and Batrab (1999) show that price consciousness as well as value consciousness are as well of relevance in the context of consumer decision-making for private labels in different product categories. According to Burton et al. (1998) consumers may view private label products positively because of the relatively low prices (i.e., price consciousness), or because of a strong desire to maximize the ratio of quality received to the price paid (i.e., value consciousness), or view them negatively because they use the price as an indicator of product quality (e.g., price-quality associations). The findings of various studies (Lichtenstein et al. 1993; Petroshius and Monroe 1987) have shown that the price for a product has an impact on its evaluation. Plassmann et al. (2008) have shown that the evaluation of product attributes and emotions changed by manipulating the price of the product. Because of the fact that the perception of quality is indistinct precise, customers use product attributes that signal quality in the context of product evaluation. The fact that customers associate the quality of a product with the price suggests that the product-attributes evaluation of the premium private label should be more positive when the price for the premium private label is close to the premium brand.
Experimental Study: Method and ProcedureWe used three different brands from the product category „fruit spreads (strawberry)“ as product stimuli in our experimental study (private label, premium private label, and premium brand). We used the official retail price of the premium brand (2.19 Euro) as well as the official retail price of the traditional private label (1.19 Euro) at the time of our study as price information for the participants in all experimental conditions. To manipulate the participants’ perception of the relation between price and quality of the premium private labeled brand, we used a higher price (price adjustment towards the premium brand) and in a further experimental condition, a lower price (price adjustment towards the private label) was
59
2
price of the premium private labelled product and the caused effects on the evaluation of the premium private label compared to a traditional private label and a premium brand were analysed.
Conceptual and theoretical frameworkPrevious research has discovered compromise, attraction and similarity effects which show that the previous mentioned assumptions of the classical economic standard theory often will not hold due to an influence of several contextual factors (Doyle et al. 1999, Huber et al. 1982, Simonson 1989). Basically, making a decision implies the existence of a choice of more than one option. This means that a decision for Option A is initially a decision against Option B. This decision is justified on the basis of individual preferences and interests of the decision maker. By convention, A is clearly preferred to B. By adding a third option in a choice set of two existing options, without a dominant option, individuals might chose a compromise in the decision-relevant determinants (Simonson 1989). Accordingly, under specific contextual conditions there might be a balance of properties; the added option could represent the compromise, in a trade-off between the existing options (Simonson 1989). For our study, we mainly focus on the impact of the pricing of the added option – the premium private labeled product – to the alternatives under consideration. If the price of the premium private labeled product is closer to the premium brand in the choice set, the new option – the premium private labeled product - should as well be evaluated as more similar to the premium brand. Hence, the choice probability of the premium brand should be influenced due to the introduction of the premium private labeled product. If the price of the new option is closer to the traditional private label, this should mainly have an effect on the choice probability of the traditional private label, while the choice probability of the premium product should remain stable (Simonson and Tversky 1992).
However, the findings of Sinhaa and Batrab (1999) show that price consciousness as well as value consciousness are as well of relevance in the context of consumer decision-making for private labels in different product categories. According to Burton et al. (1998) consumers may view private label products positively because of the relatively low prices (i.e., price consciousness), or because of a strong desire to maximize the ratio of quality received to the price paid (i.e., value consciousness), or view them negatively because they use the price as an indicator of product quality (e.g., price-quality associations). The findings of various studies (Lichtenstein et al. 1993; Petroshius and Monroe 1987) have shown that the price for a product has an impact on its evaluation. Plassmann et al. (2008) have shown that the evaluation of product attributes and emotions changed by manipulating the price of the product. Because of the fact that the perception of quality is indistinct precise, customers use product attributes that signal quality in the context of product evaluation. The fact that customers associate the quality of a product with the price suggests that the product-attributes evaluation of the premium private label should be more positive when the price for the premium private label is close to the premium brand.
Experimental Study: Method and ProcedureWe used three different brands from the product category „fruit spreads (strawberry)“ as product stimuli in our experimental study (private label, premium private label, and premium brand). We used the official retail price of the premium brand (2.19 Euro) as well as the official retail price of the traditional private label (1.19 Euro) at the time of our study as price information for the participants in all experimental conditions. To manipulate the participants’ perception of the relation between price and quality of the premium private labeled brand, we used a higher price (price adjustment towards the premium brand) and in a further experimental condition, a lower price (price adjustment towards the private label) was
3
determined in an experimental condition. The prices used for the price adjustments were determined in a preliminary study. Accordingly, for the price adjustment of the premium private label towards the private label a price of 1.49 Euro was chosen. For the price adjustment towards the premium brand, a price of 1.69 Euro was determined. Furthermore, in a third experimental condition we used the official retail price of the premium private labeled product at the time of our study (1.59 Euro). We also considered a control group, where the participants had to evaluate and make their choice only between the premium brand and the traditional private label. The findings of the control group were used to determine expectation values for brand choice for the premium brand and traditional private label.
At the outset of the experiment, participants could inspect the product details (price, packaging design, quantity, nutritional information, etc.) of the fruit spreads of the consideredbrands. Furthermore, they were able to taste the fruit spreads, so that the flavor of the fruit spreads could be considered by the subjects to assess the brands. Following this first step, the participants were surveyed with a standardized questionnaire. In this case, they were asked to evaluate the different brands based on individual product characteristics and attributes (e.g. package design, quantity, taste) and establish a ranking of their preference for the fruit spreads. All of the items used for the measurement of the different constructs were measured on a five-point rating scale (e.g., 1 = I totally disagree - 5 = I totally agree). Finally, the participants had to answer questions regarding their satisfaction with the different brands.
Overall, n = 120 consumers participated in the experiment and were randomly assigned to one of the three experimental groups or the control group (age: M = 24.48 (2.9) years, 40% female). The brands used in the experiment were mostly well known by the participants. Thus, nearly 95% of the participants were familiar with the fruit spread of the premium brand. Almost 70% of the subjects knew the traditional private label and 46.7% of them stated that they have already bought this at least once.
FindingsTo study the effects of the experimental conditions, it was necessary to determine the choice probabilities for the traditional private label as well as for the premium brand based on the preference judgments of the participants in the control group (CG). The findings of the control group show a strong preference for the traditional private label (67.9%) in relation to the premium brand (32.1%). Using these choice probabilities, we were able to analyze how these choice probabilities will be influenced by the introduction and the price manipulation of the premium private labeled brand in the participants choice set. Overall, our results show significant difference regarding the choice probability of the traditional private label in each of the three experimental conditions compared to the CG. In each experimental condition, the preference for the traditional private label decreased significantly due to the introduction of the premium private label. Interestingly and contrary to our expectations, in the experimental group with the price adjustment of the premium private label close to the premium brand, the difference between the choice probabilities was highest. In this situation, the choice probability of the traditional private label was reduced by more than 45%.
Equally surprising are the results in the experimental group with the price adjustment of the premium private label towards the traditional private label. We obtain substantial changes regarding the choice probability of the traditional private label and the premium brand compared to the control group. Basically, it was not surprising that in this experimental situation, the premium private label has the highest choice probability in comparison to the other situations. Moreover, in this experimental condition, we obtained the highest choice probability of the traditional private label (50%), although this again deviates from the value
60
4
from the control group (almost -17%). 25% of the participants had a strong preference for the premium private label as well as for the premium brand.
The findings in the experimental condition, in which the official retail price is specified for the premium private label, show a change in the choice probabilities of the traditional private and for the premium brand as well. In this condition, the highest choice probability is determined for the premium private label. The traditional private label suffers in this situation a loss of about 34% compared to the control group and is chosen with a share of 33.3% of the participants. Interestingly, in this situation the premium brand loses the largest proportion compared to the other experimental groups and was chosen by 16.7% of the participants.
Moreover, the findings of several ANOVAs show significant differences regarding, e.g., the participants’ assessment of value for money, the price level, the quality, packaging design, as well as the taste of the different fruit spreads between the experimental conditions. For example, adjusting the price of the premium private label towards the premium brand in the choice set had a strong negative impact on the evaluation of the different attributes of the traditional private label, e.g., on the evaluation of packaging design (F = 2.808, p < .05, η2 =.067). Furthermore, in this experimental condition, the participants perceived the traditional private label as less imaginative (F = 3.324, p < .05, η2 = .083) and less innovative (F = 3.212, p < .05, η2 = .079) compared to the conditions with a lower price for the premium private labeled brand. These findings indicate that the higher the price of the premium private label, the worse the traditional private label is evaluated.
Original/valueThe findings indicate that pricing is a sensitive component of a successful brand management of premium private labels, as it has a significant effect on consumer perceptions and evaluations of the related products. This concerns not only the decision to purchase or not purchase a premium private label, but also the evaluation of the product as well as of further alternatives in the choice set. At the same time, the pricing for the premium private label has a significant influence on the perception of other brands in the same product category. Moreover, the results of our study indicate that under specific contextual conditions the assumptions of the classical economic standard theory do not hold if a new option – the premium private labelled product - is added to a choice set of two existing product alternatives (traditional private label and premium brand).
Implications, limitations and outlookAs we only considered one premium private labelled product and two well-known brands in one specific product category, it is questionable whether our results can be transferred to other product categories or unknown brands. Because of this limited external validity, future research is needed to study the identified effects with different brands, including unknown and/or fictive brands, in different product categories to deepen the understanding of the underlying processes with regard to the effects on consumer-related outcome variables under study. It should also be of interest to investigate the potential role of the retail format in the context of consumer decision-making for (premium) private labels, e.g., in hard discount consumers might expressly seek for private labels, while in other formats (e.g., retailers with a broad assortment) consumers might be more likely to prefer recognized brands as the first option.
In our experimental study, we only considered a choice set consisting out of three alternative products. In a real retail setting the variety of product alternatives in a single product category is usually much more complex compared to our experimental setting, meaning that consumers might base their decision on a comparison between more product alternatives. Furthermore, in
61
4
from the control group (almost -17%). 25% of the participants had a strong preference for the premium private label as well as for the premium brand.
The findings in the experimental condition, in which the official retail price is specified for the premium private label, show a change in the choice probabilities of the traditional private and for the premium brand as well. In this condition, the highest choice probability is determined for the premium private label. The traditional private label suffers in this situation a loss of about 34% compared to the control group and is chosen with a share of 33.3% of the participants. Interestingly, in this situation the premium brand loses the largest proportion compared to the other experimental groups and was chosen by 16.7% of the participants.
Moreover, the findings of several ANOVAs show significant differences regarding, e.g., the participants’ assessment of value for money, the price level, the quality, packaging design, as well as the taste of the different fruit spreads between the experimental conditions. For example, adjusting the price of the premium private label towards the premium brand in the choice set had a strong negative impact on the evaluation of the different attributes of the traditional private label, e.g., on the evaluation of packaging design (F = 2.808, p < .05, η2 =.067). Furthermore, in this experimental condition, the participants perceived the traditional private label as less imaginative (F = 3.324, p < .05, η2 = .083) and less innovative (F = 3.212, p < .05, η2 = .079) compared to the conditions with a lower price for the premium private labeled brand. These findings indicate that the higher the price of the premium private label, the worse the traditional private label is evaluated.
Original/valueThe findings indicate that pricing is a sensitive component of a successful brand management of premium private labels, as it has a significant effect on consumer perceptions and evaluations of the related products. This concerns not only the decision to purchase or not purchase a premium private label, but also the evaluation of the product as well as of further alternatives in the choice set. At the same time, the pricing for the premium private label has a significant influence on the perception of other brands in the same product category. Moreover, the results of our study indicate that under specific contextual conditions the assumptions of the classical economic standard theory do not hold if a new option – the premium private labelled product - is added to a choice set of two existing product alternatives (traditional private label and premium brand).
Implications, limitations and outlookAs we only considered one premium private labelled product and two well-known brands in one specific product category, it is questionable whether our results can be transferred to other product categories or unknown brands. Because of this limited external validity, future research is needed to study the identified effects with different brands, including unknown and/or fictive brands, in different product categories to deepen the understanding of the underlying processes with regard to the effects on consumer-related outcome variables under study. It should also be of interest to investigate the potential role of the retail format in the context of consumer decision-making for (premium) private labels, e.g., in hard discount consumers might expressly seek for private labels, while in other formats (e.g., retailers with a broad assortment) consumers might be more likely to prefer recognized brands as the first option.
In our experimental study, we only considered a choice set consisting out of three alternative products. In a real retail setting the variety of product alternatives in a single product category is usually much more complex compared to our experimental setting, meaning that consumers might base their decision on a comparison between more product alternatives. Furthermore, in
5
a retail store further contextual factors should also influence decision-making, e.g. background music, or advertising at the point of sale. Besides, there might be several other aspects that potentially will influence consumer decision-making for (premium) private labels, e.g., the image of the retailer or consumer price consciousness. One might conclude that the image of the retailer should act as a moderator between the pricing and consumer choice. In follow-up research, these and the previously mentioned issues should be addressed.
ReferencesAaker, J. L. (1997). ‘Dimensions of Brand Personality’, Journal of Marketing Research, Vol.
34 (3), 347-356.Ailawadi, K. L., S. A. Neslin, and K. Gedenk (2001). ‘Pursuing the Value-Conscious
Consumers: Store Brands versus National Brand Promotions’, Journal of Marketing, Vol. 65 (1), 71- 89.
Ailawadi, K. L., K. Pauwels, and J.-B. E. M. Steenkamp (2008). ‘Private-Label Use and Store Loyalty’, Journal of Marketing, Vol. 72 (6), 19-30.
Burton, S., D. R. Lichtenstein, R. G. Netemeyer, and J. A. Garretson (1998). ’A Scale for Measuring Attitude Toward Private Label Products and an Examination of Its Psychological and Behavioral Correlates’, Journal of the Academy of Marketing Science,Vol. 26 (4), 293-306.
De Wulf, K., G. Odekerken-Schröder, F. Goedertier, and G. Van Ossel (2005). ‘Consumer perceptions of store brands versus national brands’, Journal of Consumer Marketing, Vol. 22 (4), 223-232.
Doyle, J. R., D. J. O’Connor, G. M. Reynolds, and P. A. Bottomley (1999). ‘The robustness of the asymmetrically dominated effect: Buying frames, phantom alternatives, and in-store purchases’, Psychology & Marketing, 16 (3), 225-243.
Geyskens, I., K. Gielens, and E. Gijsbrechts (2010). ‘Proliferating private-label portfolios: How introducing economy and premium private labels influences brand choice’, Journal of Marketing Research, Vol. 47 (5), 791-807.
Huber, J., J. W. Payne, and C. Puto (1982). ‘Adding asymmetrically dominated alternatives: Violations of Regularity and the similarity hypothesis’, Journal of Consumer Research,Vol. 9 (1), 90-98.
Koschate-Fischer, N., J. Cramer, and W. D. Hoyer (2014). ‘Moderating effects of the relationship between private label share and store loyalty’, Journal of Marketing, Vol. 78 (2): 69-82.
Kumar, N. and J.-B. E.M. Steenkamp (2007). Private Label Strategy: How to Meet the Store Brand Challange. Boston: Harvard Business School Press.
Lichtenstein, D. R., N. M. Ridgway, and R. G. Netemeyer (1993). ‘Price Perception and Consumer Shopping Behavior: A field Study’, Journal of Marketing, Vol. 30 (2), 234-245.
Paramesh, R. (1973). ‘Independence of Irrelevant Alternatives’, Econometrica,, Vol. 41 (5), 987-991.
Pauwels, K. and S. Srinivasan (2004). ‘Who Benefits from Store Brand Entry?’, Marketing Science, Vol. 23 (3), 364–90.
Petroshius, S. M. and K. B. Monroe (1987). ‘Effect of product-line pricing characteristics on product evaluations’, Journal of Consumer Research, Vol. 13 (4), 511-519.
Plassmann, H., J. O. Doherty, B. Shiv, and A. Rangel (2008). ‘Marketing actions can modulate neural representations of experienced pleasantness’, Proceedings of the National Academy of Science of the United Stated of America, Vol. 105 (3), 1050-1054.
Sinha, I. and R. Batra, (1999). ‘The effect of consumer price consciousness on private label purchase’, International Journal of Research in Marketing, Vol. 16 (3), 237-251.

62
6
Simonson, I. (1989). ‘Choice Based on Reasons: The Case of Attraction and Compromise Effects’, Journal of Consumer Research, Vol. 16 (2), 158-174.
Simonson, I. and A. Tversky (1992). ‘Choice in Context: Tradeoff Contrast and Extrem Aversion’, Journal of Marketing Research, Vol. 29 (3), 281-295.
KeywordsPricing, Premium Private Label, Product Evaluation, Consumer Decision-Making, Experimental Study
63
6
Simonson, I. (1989). ‘Choice Based on Reasons: The Case of Attraction and Compromise Effects’, Journal of Consumer Research, Vol. 16 (2), 158-174.
Simonson, I. and A. Tversky (1992). ‘Choice in Context: Tradeoff Contrast and Extrem Aversion’, Journal of Marketing Research, Vol. 29 (3), 281-295.
KeywordsPricing, Premium Private Label, Product Evaluation, Consumer Decision-Making, Experimental Study
1
“THEY CAN’T FOOL ME!” IMPOVERISHED CONSUMER’S SHOPPING BEHAVIOUR FOR GROCERY PRODUCTS
Christina HolwegDepartment of Marketing
WU-Vienna University of Economics and Business, Vienna, Austria
Verena GruberDepartment of Marketing
HEC Montréal, Montréal, Canada
IntroductionIn 2017, more than a fifth (22.4%) of the EU-28 population lived in households at risk of poverty or social exclusion (Eurostat 2017). The importance to cater to this part of society is also reflected in the retail landscape, where discount stores, 1-dollar shops, or even special outlets such as social supermarkets (Holweg & Lienbacher 2016), have strongly developedprimarily targeting low-income consumers (Passport Euromonitor 2020). In the marketing literature, the reality of this portion of the population has been largely neglected in favour of more financially lucrative consumer segments. Against this background, several researchers have called for a better understanding of the consumption behaviour of people who face severe financial constraints (e.g. Kotler & Lee 2009; Hill 2001; Piacentini et al. 2001).
PurposeThe main objective of this research is to gain an in-depth understanding of the lived reality of consumers at the threshold of poverty. The findings contribute to extant work on consumer vulnerability and, more broadly, complement the burgeoning stream of transformative consumer research concerned about the wellbeing of consumers (Mick et al., 2012).
Design/methodology/approachThe research design is informed by contemporary consumer culture studies (Arnould & Thompson, 2005) and privileges an ethnographic approach (Atkinson et al., 2011). The immersion into the lives of a select number of cases allowed us to leverage the advantages of ethnography, which “exploits the capacity that any social actor possesses for learning new cultures” (Hammersley & Atkinson, 2007). Social supermarkets, a retail format specifically created to support people at the threshold of poverty, facilitated our entry to the group of consumers at-risk-of-poverty, who are hard to discern as such. Over several years we have been involved with consumers at the threshold of poverty, and complemented rigorous observations with in-depth interviews and photography. The research design is ongoing and evolves with the insights generated: after initial informal exchanges and encounters, we set up
64
2
formal long interviews (McCracken, 1988), accompanied shopping tours and in-home visits.Our approach was inspired by Hill (2016) demanding to “take the time to meet with and listen to the poor in their living environments and see their worlds through their eyes”. We furtherconducted rounds of follow-up interviews to reflect on the insights, with both our focal cases and people in their close environment (e.g. social workers, children, or store managers), in order to enrich our understanding of their lives and to triangulate emergent themes.
Our sampling approach was strongly influenced by Fournier’s (1998) seminal work on brand relationships, and her in-depth longitudinal work with two households and their members. In the selection of our cases, we assured structural variation to access different life situations, contexts, and perspectives. Laura is a retired Viennese who still leaves in close proximity to the house she grew up in. After an eclectic professional life of 47 years, she now structures her life around the nine animals she lives with, and her two daughters. Her pension amounts to figure that puts her at the very threshold of many social supermarkets and social services – sometimes she is slightly above the income limit, sometimes she is below the threshold. Michael, in turn, retired after only nine years of work, due to his inborn disability, which exacerbated over the years because of neurological problems that occurred at a later stage. He is supported by social workers who help in the household but also when he shops for groceries. Lisa is a housewife who has emmigrated to Austria 25 years ago, where she gave birth to and raised her two children, who are still living in the family household. While highly educated in her home country, Lisa never worked because she was not eligible to work in the area of her studies and not emotionally equipped to work as a caretaker or housekeeper.Prolonged encounters, observations, and interactions with each of our cases allowed us to understand their lived reality and comprehend their perspectives on their precarious situation.
FindingsWe find that consumers have developed sets of practices and strategies to manage therestrictions they face in everyday life. Four themes in particular have emerged across the various cases of the research:
(1) Thresholds within the social system have a strong influence on behaviours.Interviewees undertake strong efforts to gain a better understanding of the multiple thresholds of the social system that directly impact their income (e.g., minimum benefit level, exemptions from broadcasting or public transport fees, gaining access to food donations, etc.). They navigate the thresholds by deploying different strategies (e.g. creating goodwill through connections) and practices (e.g. extremely meticulous energy saving in the household).
(2) Resourcefulness goes with unconventional shopping, storage, and consumption behaviour. Grocery shopping cycles range from conventional shopping 2-3 times a week up to once a month in order to deliberately restrict impulse purchase. Allinterviewees are eager to make good shopping deals and showcase pride when recounting their savings. Their logic is often hard to follow as they show drawers cramped with chocolate bars (to maximize the benefits of a -25% discount) or fridgesfilled with 2.5 kg buckets of yoghurt (which are consumers in three consecutive “yoghurt days”). Bulk purchases are stored in special cupboards or deep freezers.
(3) Establishment of an excellent information networkAll of our interviewees have a very good understanding of grocery products’ retail prices across different retail stores. They use vast sources of information such as leaflets, newspapers, mobile apps, loyalty clubs, or information from friends and
65
2
formal long interviews (McCracken, 1988), accompanied shopping tours and in-home visits.Our approach was inspired by Hill (2016) demanding to “take the time to meet with and listen to the poor in their living environments and see their worlds through their eyes”. We furtherconducted rounds of follow-up interviews to reflect on the insights, with both our focal cases and people in their close environment (e.g. social workers, children, or store managers), in order to enrich our understanding of their lives and to triangulate emergent themes.
Our sampling approach was strongly influenced by Fournier’s (1998) seminal work on brand relationships, and her in-depth longitudinal work with two households and their members. In the selection of our cases, we assured structural variation to access different life situations, contexts, and perspectives. Laura is a retired Viennese who still leaves in close proximity to the house she grew up in. After an eclectic professional life of 47 years, she now structures her life around the nine animals she lives with, and her two daughters. Her pension amounts to figure that puts her at the very threshold of many social supermarkets and social services – sometimes she is slightly above the income limit, sometimes she is below the threshold. Michael, in turn, retired after only nine years of work, due to his inborn disability, which exacerbated over the years because of neurological problems that occurred at a later stage. He is supported by social workers who help in the household but also when he shops for groceries. Lisa is a housewife who has emmigrated to Austria 25 years ago, where she gave birth to and raised her two children, who are still living in the family household. While highly educated in her home country, Lisa never worked because she was not eligible to work in the area of her studies and not emotionally equipped to work as a caretaker or housekeeper.Prolonged encounters, observations, and interactions with each of our cases allowed us to understand their lived reality and comprehend their perspectives on their precarious situation.
FindingsWe find that consumers have developed sets of practices and strategies to manage therestrictions they face in everyday life. Four themes in particular have emerged across the various cases of the research:
(1) Thresholds within the social system have a strong influence on behaviours.Interviewees undertake strong efforts to gain a better understanding of the multiple thresholds of the social system that directly impact their income (e.g., minimum benefit level, exemptions from broadcasting or public transport fees, gaining access to food donations, etc.). They navigate the thresholds by deploying different strategies (e.g. creating goodwill through connections) and practices (e.g. extremely meticulous energy saving in the household).
(2) Resourcefulness goes with unconventional shopping, storage, and consumption behaviour. Grocery shopping cycles range from conventional shopping 2-3 times a week up to once a month in order to deliberately restrict impulse purchase. Allinterviewees are eager to make good shopping deals and showcase pride when recounting their savings. Their logic is often hard to follow as they show drawers cramped with chocolate bars (to maximize the benefits of a -25% discount) or fridgesfilled with 2.5 kg buckets of yoghurt (which are consumers in three consecutive “yoghurt days”). Bulk purchases are stored in special cupboards or deep freezers.
(3) Establishment of an excellent information networkAll of our interviewees have a very good understanding of grocery products’ retail prices across different retail stores. They use vast sources of information such as leaflets, newspapers, mobile apps, loyalty clubs, or information from friends and
3
family, to guide their shopping behaviour Mobile devices are used extensively. Time is no restriction in their shopping routine as few of them are in working relationships.
(4) Strong interest for social interaction and openness in sharing their experiences. Our interviewees are all keen to show and explain their “system,” and to provide tips and tricks regarding shopping, storing, and cooking. Laura, Michael, and Lisa have gained a level of confidence with their modus operandi and want to contribute by sharing their insights.
These findings show the diverse themes that influence our consumers in their everyday shopping behaviour. What might defy rational logic (e.g. using one’s limited budget to look after 9 animals; bulk purchases in light of monetary constraints) makes sense and provides value (e.g. companionship; assurance) to consumers at risk of poverty. These consumers seem to create their own, unique system of practices, strategies, and logics to manoeuvre life at the threshold. In this vein, they defy notions of vulnerability but demonstrate that they are active and resourceful participants of society. The implications are potentially far-reaching in that they draw our attention to the usefulness, indeed appropriateness, of certain types of social support that is primarily conceived via financial measures.
Original/valueThe ethnographic approach allowed insights about consumers at risk of poverty at an unprecedented level of depth. While consumer researchers have a good understanding of individuals living at extreme levels of poverty (Hill 2001; Hill & Gaines, 2007), little is known about the situation of about a fifth of the EU population that lives at risk of poverty or social exclusion. For public policy makers, these insights are crucial in planning and implementing social measures and conceiving thresholds to guide the distribution of social support. For retailers, results can help to finetune their CSR activities in regards to social engagement, donations, or communication with consumers and communities (Louis et al. 2019).
Research limitations and outlookResults are preliminary so far as field research is undergoing.
References*Arnould, E. J. and Thompson, C. J. (2005). “Consumer culture theory (CCT): Twenty years
of research”, Journal of consumer research, Vol. 31 Nr. 4, pp. 868-882.Atkinson, P., Coffey, A., Delamont, S., Lofland, J., and Lofland, L. (Eds.). (2001). Handbook
of ethnography. Sage.
Eurostat (2017), “People at Risk of Poverty or Social Inclusion” available at
https://ec.europa.eu/eurostat/statistics-explained/index.php/People_at_risk_of_poverty_or_social_exclusion#Number_of_people_at_risk_of_poverty_or_social_exclusion (accessed March 9th 2020)
Fournier, S. (1998), “Consumers and their brands: Developing relationship theory in consumer research”, Journal of consumer research, Vol. 24 Nr.4, pp. 343-373.
66
4
Hammersley, M. and Atkinson, P. (2007), Ethnography. Principles in practice. London and New York: Routledge.
Hill, Ronald P. (2001), “Surviving in a Material World: Evidence from Ethnographic Consumer Research on People in Poverty”, Journal of Contemporary Ethnographic,Vol. 30 Nr. 4, pp. 364-391.
Hill, R. P. and Gaines, J. (2007), “The consumer culture of poverty: behavioral research findings and their implications in an ethnographic context”, The Journal of American Culture, Vol. 30 Nr.1, pp. 81-95.
Hill, Ronald P. (2016), “Poverty as we never knew it: THE source of vulnerability for most of humankind”, Journal of Marketing Management, Vol 32 Nr.3-4, 365-370.
Holweg, C. and Lienbacher, E. (2016). Social Supermarkets in Europe - Investigations from a retailing perspective in selected European countries. Vienna: WU Vienna
Kotler, Philip and Nancy R. Lee (2009), Up and Out of Poverty: The Social Marketing Solution. München: Pearson
Louis, Didier, Cindy Lombart and Fabien Durif (2019), “Impact of a retailer’s CSR activities on consumers’ loyalty”, International Journal of Retail & Distribution Management, Vol. 47 Nr.8, pp. 793-816.
McCracken, G. (1988). The long interview (Vol. 13). Sage.
Mick, D. G., Pettigrew, S., Pechmann, C. C., and Ozanne, J. L. (Eds.). (2012). Transformative consumer research for personal and collective well-being. Routledge.
Passport Euromonitor (2020), “Discount brand share development 2014-2019”, available atPassport Euromonitor Database (accessed March 9th 2020)
Piacentini, Maria, Sally Hibbert and Haya Al-Dajani (2001), “Diversity in deprivation: exploring the grocery shopping behaviour of disadvantaged consumers,” International Review of Retail, Distribution and Consumer Research, Vol. 11 Nr. 2, pp. 141-158.
Keywords*Shopper behaviour, consumer behaviour, impoverished consumers, ethnography,
67
DIGITAL SYSTEMS FOR URBAN RETAILERS (DSUR) IN FRANCE. EMPIRICAL
REVIEW AND ANALYTICAL TYPOLOGY
Anne-Sophie Clément
ESCP
Paris, France
Pr. Olivier Badot
ESCP/Caen University
Paris, France
Abstract:
New retailing channels and formats have modified shopper behaviors and tend to encourageconsumers to purchase outside of city-centers. Hence, many cities have high store vacancyrates while retailers’ revenues decrease and commercial leases increase. Meanwhile,becoming “phygital” seems to be a necessity for retailers as consumers are more and morecombining online and offline business formats. As such, stores in urban environment need toadapt their strategies. Encouraged by political nation-wide initiatives, many Digital Systemsfor Urban Retailers (DSURs) — from private and/or a public instigation — have emerged tostimulate urban retailers. Based on an empirical investigation, this paper presents an analysisof these DSURs and of their impacts.
Keywords: digital systems, urban retail, phygital, city center, retailing channels
.
68
Introduction and managerial background
This research intervenes at a time when the worlds of mass distribution and commerce seem to be undergoing reinvention and digitization (Verhoef, Kannan and Inman, 2015; Belghiti and Badot, 2016). In the digital era, we have witnessed the increasing power of e-commerce, m-commerce, distribution and cross-channel communication methods that triggered the advent of new consumption patterns. Setting out from this premise, the ongoing “commercial revolution” (Moati, 2011) that we are experiencing makes us understand that a valid question emerges regarding physical stores as they are to be directly impacted by these transcending digital evolutions. According to Badot and Moreno (2016), retail spaces that are still capable of operating are those whose shopping experiences are, as a first step, differentiated and of high quality or experiential, that is to say “highly emotional and participative”. But would these tangible experiencing strategies be enough, in the long run, to fully content customers of the 4.0 society? In 2018, all over France, the commercial vacancy rate was up to 11.9% according to Procos1, as compared to 7.2% in 2012 and 9.5% in 2015. This phenomenon is all the more true in smaller cities. As such, retailer’s revenues decrease, because of the decline incustomers and an overall increase in commercial leases.
In her PhD research, Belghiti (2016) notices that consumers are no longer satisfied by online or offline shopping experiences only but require and practice these two forms of shopping, a reality described as “phygital”. Thus, integrating digital elements to his physical shop, the retailer can reunite these two dimensions (Claes, Quartier and Vanrie, 2017). “Phygital” thus echoes with the recognition that “physical retail is not dead”, but that getting digitized has however, become a necessity (Belghiti and Badot, 2016).
For two years now, the French government has decided to tackle the problem of commercial vacancy rates in city-centers, including digital measures to modernize the activity of small retailers in order to make them more compliant with new consumption patterns. That stance marked the emergence of various DSURs on the territory that wish to reinvigorate inner-city retailers through digital technologies. Today, these digital tools are promoted and developed locally all over the country. Therefore, regions, Chambers of commerce, City authorities, elected local officials and retailers associations implement DSURs as a way to help their businesses recovering, regaining traffic of customers.
Theoretical contributions
From a theoretical point of view, a multitude of platform types exist and have been identified in the academic literature: market platforms of goods and services, of product developments, of industrial productions, etc. and raises a lot of enthusiasm in the context described above.
The emergence of DSURs that integrate local retailers and the conditions of their implementation and development doing so has not been covered much by academic literature. Through this doctoral research, we wish to expand the academic literature on digital platforms by integrating a typology of the effects we identified regarding the implementation of DSURswithin cities, to contribute to the literature on commercial urban development, and to submit a rational and rigorous analysis of DSURs.
Objectives and research question
The objective of this research is to contribute to the literature on digital platforms, as we have little information on these at a territorial level or on their organizational designs. Also, we 1 The federation for the promotion of specialized trade
69
Introduction and managerial background
This research intervenes at a time when the worlds of mass distribution and commerce seem to be undergoing reinvention and digitization (Verhoef, Kannan and Inman, 2015; Belghiti and Badot, 2016). In the digital era, we have witnessed the increasing power of e-commerce, m-commerce, distribution and cross-channel communication methods that triggered the advent of new consumption patterns. Setting out from this premise, the ongoing “commercial revolution” (Moati, 2011) that we are experiencing makes us understand that a valid question emerges regarding physical stores as they are to be directly impacted by these transcending digital evolutions. According to Badot and Moreno (2016), retail spaces that are still capable of operating are those whose shopping experiences are, as a first step, differentiated and of high quality or experiential, that is to say “highly emotional and participative”. But would these tangible experiencing strategies be enough, in the long run, to fully content customers of the 4.0 society? In 2018, all over France, the commercial vacancy rate was up to 11.9% according to Procos1, as compared to 7.2% in 2012 and 9.5% in 2015. This phenomenon is all the more true in smaller cities. As such, retailer’s revenues decrease, because of the decline incustomers and an overall increase in commercial leases.
In her PhD research, Belghiti (2016) notices that consumers are no longer satisfied by online or offline shopping experiences only but require and practice these two forms of shopping, a reality described as “phygital”. Thus, integrating digital elements to his physical shop, the retailer can reunite these two dimensions (Claes, Quartier and Vanrie, 2017). “Phygital” thus echoes with the recognition that “physical retail is not dead”, but that getting digitized has however, become a necessity (Belghiti and Badot, 2016).
For two years now, the French government has decided to tackle the problem of commercial vacancy rates in city-centers, including digital measures to modernize the activity of small retailers in order to make them more compliant with new consumption patterns. That stance marked the emergence of various DSURs on the territory that wish to reinvigorate inner-city retailers through digital technologies. Today, these digital tools are promoted and developed locally all over the country. Therefore, regions, Chambers of commerce, City authorities, elected local officials and retailers associations implement DSURs as a way to help their businesses recovering, regaining traffic of customers.
Theoretical contributions
From a theoretical point of view, a multitude of platform types exist and have been identified in the academic literature: market platforms of goods and services, of product developments, of industrial productions, etc. and raises a lot of enthusiasm in the context described above.
The emergence of DSURs that integrate local retailers and the conditions of their implementation and development doing so has not been covered much by academic literature. Through this doctoral research, we wish to expand the academic literature on digital platforms by integrating a typology of the effects we identified regarding the implementation of DSURswithin cities, to contribute to the literature on commercial urban development, and to submit a rational and rigorous analysis of DSURs.
Objectives and research question
The objective of this research is to contribute to the literature on digital platforms, as we have little information on these at a territorial level or on their organizational designs. Also, we 1 The federation for the promotion of specialized trade
seek to know more about how urban retailers can use them and what insights we can learn from it? In addition, the stakes behind the implementation of such initiatives remain unknown. The following question therefore arises:
What are the impacts of the adoption and of the use of DSUR?
Epistemology and research protocol
In order to study DSURs within city-centers, we adopt a phenomenological approach. This approach will allow us to probe the depth of the phenomenon we study and is of importance in the way that the validity of a phenomenological research is directly linked to the researcher’s writing and to the quality of the descriptive data he collected (Morais, 2013). It is therefore through one’s subjective experience that the phenomenological approach linked to the lived experience makes sense. Indeed, the goal is not the generalization of results but the comprehensive exploration of a phenomenon in situ and in tempo.
Formerly, few researches have been conducted regarding DSURs at the level of city centers and local stores. Therefore, an inductive research design has been selected in order to reach arobust data collection and analysis but, as an inductive process, the selection of DSUR has not been based on a quantitative segmentation. Hence, the following pair has been considered:DSUR/city or town. To date, 58 semi-guided interviews with DSUR operators and/or city authorities’ officers have been conducted, as well as 10 other interviews with urban retailers that use one of the DSURs identified in the research. The data analysis led to a cross-category analysis of the corpus.
The reading of an academic literature related to the research topic during the phases of data collection and analysis is supposed to enable the researcher to pre-evaluate the relevance of the emerging findings. Here, the Spiggle process (1994) has been strictly respected so very few literature has been mobilized during the interview phase. As explained by Gioia, Corley and Hamilton (2013), “knowing the literature intimately too early puts blinders on and leads to prior hypothesis bias (confirmation bias)”. Alvesson and Kärreman (2007) warned about the risk of transitioning from an inductive research protocol to an abductive one and the riskto adapt theory to data collection and analysis and vice versa. Therefore, the academic literature is only mobilized at the end of the process in order to discuss the findings and the contributions presented.
Once each case analyzed, a multi-case 1st-order analysis has been conducted where respondents’ words have been respected with “little attempt to distill categories” (Gioia et al.,2013). 60 themes have emerged. Then, in the 2nd-order analysis phase, the number of emerging themes has been reduced from 60 to 38. After, according to Gioia et al. (2013), the process led to “distill the emergent 2nd-order themes even further”... to 7 and finally, to 4“aggregate dimensions” (see data structure, Appendix 1).
Research findings
Whether born from private and/or public initiatives, we have studied the adoption and use of DSURs in France and identified four major insights:
1- Effects linked to the context DSURs develop in: this context presents obstacles and opportunities originating in the attitude of retailers regarding digital tools, and their pessimism towards the novelty of DSURs. In this respect, they result to be poorly motivated by the digital transformation they are offered, because of a lack of
70
knowledge, interest, but also money and time to invest. Moreover, because DSURssuffer from a low level of awareness, they show difficulties entering the market andtrying to get more legitimacy: how to trust and invest in a digital system whose effects have not been established yet? How to convince urban retailers to adopt one of them when they are strongly skeptical and disappointed by the uses of the DSURs?
2- Effects linked to operational management decisions, relating to supporting retailersafter they adopted a DSUR, and linked to communication expenses that are invested to raise awareness about the DSUR after implementation. The findings figure out that many retailers are left without any monitoring once they adopted a digital system. Thus, it is obvious that the deficiency of maintenance directly impacts the use of DSURs by local retailers. In addition, the lack of financial support in communication and promotion by DSURs operators and local authorities leads to a low level of awareness by the shoppers and a low level of motivation by the retailers.
3- Effects linked to territorial governance and local authorities. Some effects appeared based on whether private and/or public stakeholders cooperated in implementing aDSUR. So, cooperation between public and private bodies shows positive effects on retailers’ attitude and good effectiveness of DSURs. On the one hand, retailers adhere more massively to the tool when it is supported by public sector, as when, for instance,DSURs implementation and free training sessions for retailers are supported by local authorities. Also, public authorities can be considered as a legitimate representative and messenger to reassure and to spread the digital transformation at a local level. In addition, political issues were identified at different stages of the establishment of DSURs: sometimes, projects are not fully implemented because of political strugglesbetween local decision-makers or newly elected representatives. It also appeared that the adoption of some DSURs was more based on political motivations than efficiency seeking.
4- Effects linked to DSURs themselves appeared: in the very definition of their business models and within their value propositions, DSURs can show signs of misalignmentwith the needs and expectations of retailers. Indeed, the cost for adopting the DSUR is frequently perceived as much higher than what retailers expected. They consider the return on investment too low and too slow mostly because they don't have any clear vision of the concrete impact on the traffic creation or conversion rate.
Conclusion and practical implications
This research, under an inductive protocol, provides rich findings and we hope that with their analysis, we will contribute significantly to helping collectivities and other stakeholders in showing the first effects of digitizing retailers, at a local level. Even though DSURs are broadly implemented in towns and cities in order to help urban retailers to compete with e-commerce, few researches exist on the perceptions of the users and the assessment of their impacts. Consequently, the results of this research represent an empirical contribution.
Chambers of commerce, local authorities, retailers associations, retailers themselves...promote the use of DSURs at a local scale on a regular basis. Yet, they do so without fullyanticipating the effects DSURs might have in the long run. So far, what we understand is that digitizing local retailers does not come without challenges given that many obstacles emerge at each step of the digitizing process.
71
knowledge, interest, but also money and time to invest. Moreover, because DSURssuffer from a low level of awareness, they show difficulties entering the market andtrying to get more legitimacy: how to trust and invest in a digital system whose effects have not been established yet? How to convince urban retailers to adopt one of them when they are strongly skeptical and disappointed by the uses of the DSURs?
2- Effects linked to operational management decisions, relating to supporting retailersafter they adopted a DSUR, and linked to communication expenses that are invested to raise awareness about the DSUR after implementation. The findings figure out that many retailers are left without any monitoring once they adopted a digital system. Thus, it is obvious that the deficiency of maintenance directly impacts the use of DSURs by local retailers. In addition, the lack of financial support in communication and promotion by DSURs operators and local authorities leads to a low level of awareness by the shoppers and a low level of motivation by the retailers.
3- Effects linked to territorial governance and local authorities. Some effects appeared based on whether private and/or public stakeholders cooperated in implementing aDSUR. So, cooperation between public and private bodies shows positive effects on retailers’ attitude and good effectiveness of DSURs. On the one hand, retailers adhere more massively to the tool when it is supported by public sector, as when, for instance,DSURs implementation and free training sessions for retailers are supported by local authorities. Also, public authorities can be considered as a legitimate representative and messenger to reassure and to spread the digital transformation at a local level. In addition, political issues were identified at different stages of the establishment of DSURs: sometimes, projects are not fully implemented because of political strugglesbetween local decision-makers or newly elected representatives. It also appeared that the adoption of some DSURs was more based on political motivations than efficiency seeking.
4- Effects linked to DSURs themselves appeared: in the very definition of their business models and within their value propositions, DSURs can show signs of misalignmentwith the needs and expectations of retailers. Indeed, the cost for adopting the DSUR is frequently perceived as much higher than what retailers expected. They consider the return on investment too low and too slow mostly because they don't have any clear vision of the concrete impact on the traffic creation or conversion rate.
Conclusion and practical implications
This research, under an inductive protocol, provides rich findings and we hope that with their analysis, we will contribute significantly to helping collectivities and other stakeholders in showing the first effects of digitizing retailers, at a local level. Even though DSURs are broadly implemented in towns and cities in order to help urban retailers to compete with e-commerce, few researches exist on the perceptions of the users and the assessment of their impacts. Consequently, the results of this research represent an empirical contribution.
Chambers of commerce, local authorities, retailers associations, retailers themselves...promote the use of DSURs at a local scale on a regular basis. Yet, they do so without fullyanticipating the effects DSURs might have in the long run. So far, what we understand is that digitizing local retailers does not come without challenges given that many obstacles emerge at each step of the digitizing process.
These findings could enable public actors and DSUR operators to better master the design, the promotion of DSURs, and the shoppers and retailers expectations; a great challenge to contribute to the revitalization of city centers in France as well as in many western countries. In this context, a policy paper based on this research has provided recommendations to the Ministry of Economy and Finance in February 2020.
References
Alvesson, M., & Kärreman, D. (2007). Constructing mystery: Empirical matters in theory development. Academy of management review, 32(4), 1265-1281.
Belghiti, S et Badot, O. (2016). L’expérience de magasinage phygital : tentative de conceptualisation et investigation empirique. Article en cour d’écriture sous la direction d’Olivier Badot, ESCP Europe.
Badot, O., et Moreno, D. (2016). Commerce et urbanisme commercial : les grands enjeux de demain. Cormelles-le-Royal. Editions Management et Société.
Claes, S., Quartier, K., et Vanrie, J. (2017). Thinking across Channels: Retail Designers' Competencies in the context of Omnichannel in Retail. The Design Journal. Taylor & Francis.
Corley, K. G., & Gioia, D. A. (2004). Identity ambiguity and change in the wake of a corporate spin-off. Administrative science quarterly, 49(2), 173-208.
Gioia, D. A., Corley, K. G., & Hamilton, A. L. (2013). Seeking qualitative rigor in inductive research: Notes on the Gioia methodology. Organizational research methods, 16(1), 15-31.
Moati, P. (2011). La Nouvelle Révolution commerciale. Paris, Odile Jacob.
Morais, S. (2013). Le chemin de la phénoménologie : une méthode vécue comme une expérience de chercheur. In Actes du 3e colloque rifreq, «Du singulier à l’universel», hors-série «Les actes» de la revue Association pour la recherche qualitative (arq), Trois-Rivières, Canada.
Spiggle, S. (1994). Analysis and interpretation of qualitative data in consumer research. Journal of consumer research, 21(3), 491-503.
Verhoef, P. C., Kannan, P. K., et Inman, J. J. (2015). From multi-channel retailing to omni-channel retailing: introduction to the special issue on multi-channel retailing. Journal of retailing, 91(2), 174-181.
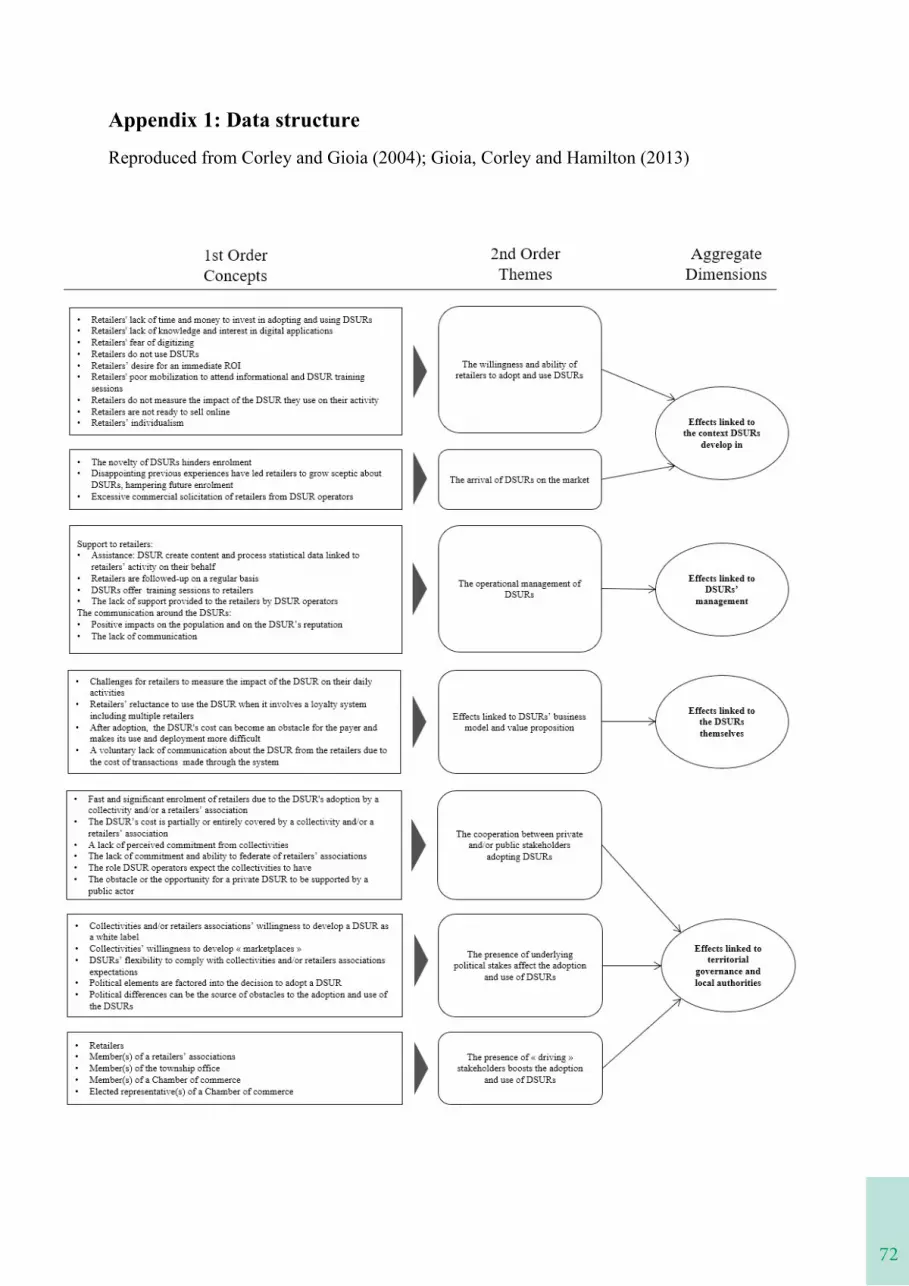
72
Appendix 1: Data structure
Reproduced from Corley and Gioia (2004); Gioia, Corley and Hamilton (2013)
73
Appendix 1: Data structure
Reproduced from Corley and Gioia (2004); Gioia, Corley and Hamilton (2013)
“PROVIDING DIGITALLY‐TRANSFERRED CONDITIONAL ACCESS‐PERMISSION: BENEFIT VS. SAFETY‐CONCERN IN UNATTENDED HOME DELIVERY SERVICE”
Tobias Röding, Sascha Steinmann, Anne Fota, HannaSchramm-Klein (University of Siegen)
The change digitization brings into the business world but also to society, offers opportunities (e.g., service enhancement through technological innovations and/or sustainable use of resources) as well as threats (users’ data-security issues). Due to the increasing relevance of an efficient and sustainable “last mile” delivery-process, the integration of information technology is becoming highly important for research and suppliers. In center of interest is users’ perception of CEP (courier, express and parcel) service providers, especially when it comes to the delivery with the help of smart lock-systems (at the front-door or a parcel locker).
Hereby, our research refers of Privacy Calculus theory, focusing on users’ benefits and data-safety-concerns regarding their intention to provide digitally-transferred conditional access-permission in context of home- or parcel locker-delivery. By conducting an online survey (N = 299 participants), we show that especially in case of the access-permission to the private home, beneficial aspects as convenience and sustainability exceed users’ privacy concerns in the CEP service provider as well as users’ issue of trust in the (final) deliverer. Findings lead to meaningful implications for future research and for concrete possibilities for practical implementation. We argue for a stronger alignment within the communication-strategy regarding the ecological sustainability of using unattended home delivery services in practice. Moreover, a smart combination on aspects of convenience and likewise environmental protection might be possible. In this context, we call for further in-depth analysis on BEV (battery electric vehicle) vans and their saving potential of CO2 emissions in the course of inner-city-logistics use.
74
1
PRODUCT AFFINITY SEGMENTATION OF MULTICHANNEL GROCERY SHOPPERS APPLYING COMMUNITY DETECTION
Koen VANHOOFDepartment of Business Informatics
Hasselt University, Hasselt, Belgium
Marta FRASQUETDepartment of Marketing
University of Valencia, Valencia, Spain
Ivett FUENTESComputer Sciences Department
Central University Las Villas, Santa Clara, Cuba
IntroductionGrocery retailers usually maintain complex information systems (IS) for capturing records about Customer Purchasing Behaviours (CPBs) in a cost-effective manner. Ensuring the productive use of the information gathered through loyalty cards offers great opportunities to improve targeted marketing campaigns. A deep understanding of underlying patterns in the stored information becomes an ever more complex and more challenging task, mainly because: (i) CPBs are generally diverse and dynamic; (ii) many entities come to play, such as products, customers and transactions (orders) and (iii) the amount of available entities is large and increasing constantly. Depending on the goals of the retailer (i.e., revenues, customer loyalty), it is possible to define different patterns of purchasing behaviours and target the appropriate groups to optimise the efficiency of marketing actions.
The task of analysing CPBs becomes ever more challenging with the introduction of online channels by grocery retailers (Biyalogorsky & Naik, 2003; Hernant & Rosengren, 2017). Introducing an online channel has been reported to display different effects in terms of customers’ purchasing patterns (Ansari et al., 2008; Hernant & Rosengren, 2017; Konuş, Verhoef, & Neslin, 2008). Segmenting and profiling customers is an effective practice to gain a richer understanding of multichannel shoppers (Neslin et al., 2006; Verhoef et al., 2015). Several studies have segmented shoppers based on channel usage or preference (e.g. Nakano & Kondo, 2018; Peker, Kocyigit, & Eren, 2017). However, there is scarcity of research that takes into account information at the customer transaction and product level.
75
1
PRODUCT AFFINITY SEGMENTATION OF MULTICHANNEL GROCERY SHOPPERS APPLYING COMMUNITY DETECTION
Koen VANHOOFDepartment of Business Informatics
Hasselt University, Hasselt, Belgium
Marta FRASQUETDepartment of Marketing
University of Valencia, Valencia, Spain
Ivett FUENTESComputer Sciences Department
Central University Las Villas, Santa Clara, Cuba
IntroductionGrocery retailers usually maintain complex information systems (IS) for capturing records about Customer Purchasing Behaviours (CPBs) in a cost-effective manner. Ensuring the productive use of the information gathered through loyalty cards offers great opportunities to improve targeted marketing campaigns. A deep understanding of underlying patterns in the stored information becomes an ever more complex and more challenging task, mainly because: (i) CPBs are generally diverse and dynamic; (ii) many entities come to play, such as products, customers and transactions (orders) and (iii) the amount of available entities is large and increasing constantly. Depending on the goals of the retailer (i.e., revenues, customer loyalty), it is possible to define different patterns of purchasing behaviours and target the appropriate groups to optimise the efficiency of marketing actions.
The task of analysing CPBs becomes ever more challenging with the introduction of online channels by grocery retailers (Biyalogorsky & Naik, 2003; Hernant & Rosengren, 2017). Introducing an online channel has been reported to display different effects in terms of customers’ purchasing patterns (Ansari et al., 2008; Hernant & Rosengren, 2017; Konuş, Verhoef, & Neslin, 2008). Segmenting and profiling customers is an effective practice to gain a richer understanding of multichannel shoppers (Neslin et al., 2006; Verhoef et al., 2015). Several studies have segmented shoppers based on channel usage or preference (e.g. Nakano & Kondo, 2018; Peker, Kocyigit, & Eren, 2017). However, there is scarcity of research that takes into account information at the customer transaction and product level.
2
PurposeDue to the large number of transactional records of grocery retail chains and mainly because CPBs are heterogeneous and diverse, companies direct their actions to segments of customers with similar preferences (behaviours), avoiding the cost to have a customized strategy for each customer. Our paper is motivated by the increasing complexity of shopping behaviour in the multichannel retail context, as well as by the opportunities provided by the online channel to targeted marketing campaigns. Building on those realities, we aim to show the value added ofapplying a community detection algorithm to identify grocery customer segments according to product affinity. Community detection, compared to other segmentation approaches, allows to take into consideration each customer’s purchases at the product/brand level.
Conceptual frameworkAlthough it is possible to undertake customer segmentation employing a classical clustering approach, we alternatively suggest identifying customer segments applying a community detection (CD) algorithm. Community detection refers to the procedure of identifying groupsof interacting vertices (i.e., nodes) in a network depending upon their structural properties (Kelley et al., 2012; Yang et al., 2016). As Javed et al. (2018) state, community detection algorithms would be very useful to identify users having similar behavior in e-commerce.Product affinity segmentation explores the links between customers and product baskets to identify customer segments, offering cross-selling and promotion opportunities to increase sales and profits (Zhang et al., 2019). By identifying shoppers having the same patterns towards purchasing some products, managers can improve product recommendation systems in online channels (Krishnamurthy and Wang, 2000; Ju and Xu, 2013).
CD algorithms simultaneously exploit the pairwise similarities used in the classical clustering approaches, and the topology of cases. Such methods are powerful since they not only take into account the interaction between objects, but also the flow of information that travels through the topological structure. A multitude of dimensions can be included into the model, depending on the application of community detection (Javed et al., 2018). In the retail context, transactions are the main dimensions, which usually comprise information about customers, products and customer-product purchases. Thus, the approach proposed and detailed in this paper starts from transactional data for modelling the interaction among customers by means of a weighted complex network. Additional variables are then used for characterizing the obtained communities.
The main stages to implement customer segmentation through a CD algorithm are as follows:Stage 1: (Purchasing data transformation). In this stage we capture the information
attached to customers (i.e., customer, product and order information) and the database is transformed by considering a specific customer purchasing representation from the original records. Also, the data is pre-processed for discarding irrelevant transaction records, through the data gathering, stratification and cleaning steps.
Stage 2: (Customer network construction). This stage is devoted to determining the semantics of edges, nodes and layers in the complex network, while quantifying the interactions between each pair of customers.
Stage 3: (Customer community detection). Separate the customer into communities by applying community detection algorithms.
Stage 4: (Customer community evaluation and characterization). The analysis is focused on the customer-product characteristics in each customer segment, which allows evaluating
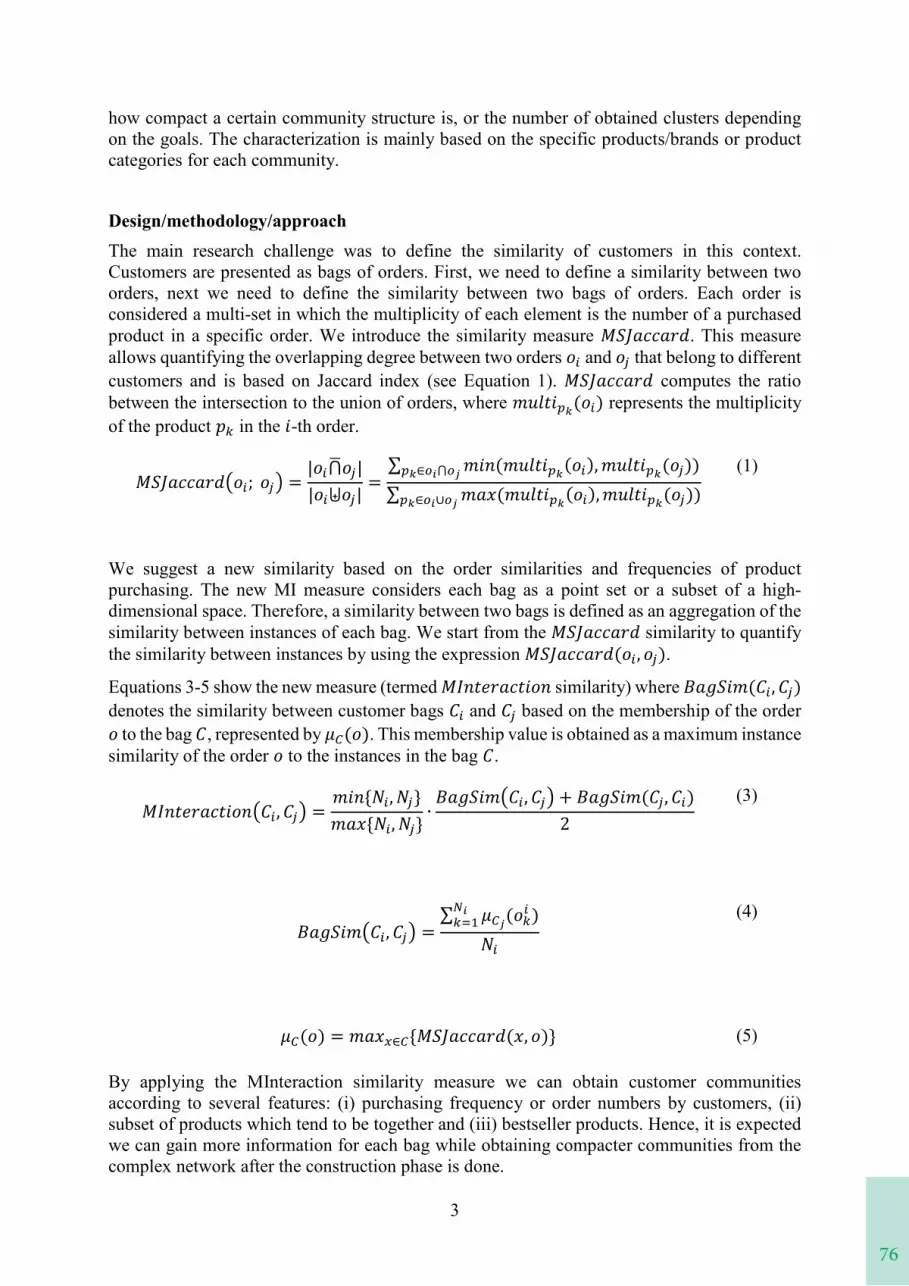
76
3
how compact a certain community structure is, or the number of obtained clusters depending on the goals. The characterization is mainly based on the specific products/brands or product categories for each community.
Design/methodology/approachThe main research challenge was to define the similarity of customers in this context. Customers are presented as bags of orders. First, we need to define a similarity between two orders, next we need to define the similarity between two bags of orders. Each order is considered a multi-set in which the multiplicity of each element is the number of a purchased product in a specific order. We introduce the similarity measure 𝑀𝑀𝑀𝑀𝑀𝑀𝑀𝑀𝑀𝑀𝑀𝑀𝑀𝑀𝑀𝑀𝑀𝑀𝑀𝑀𝑀𝑀𝑀𝑀𝑀𝑀𝑀𝑀𝑀𝑀𝑀𝑀𝑀𝑀𝑀𝑀. This measure allows quantifying the overlapping degree between two orders 𝑜𝑜𝑜𝑜𝑖𝑖𝑖𝑖 and 𝑜𝑜𝑜𝑜𝑗𝑗𝑗𝑗 that belong to different customers and is based on Jaccard index (see Equation 1). 𝑀𝑀𝑀𝑀𝑀𝑀𝑀𝑀𝑀𝑀𝑀𝑀𝑀𝑀𝑀𝑀𝑀𝑀𝑀𝑀𝑀𝑀𝑀𝑀𝑀𝑀𝑀𝑀𝑀𝑀𝑀𝑀𝑀𝑀𝑀𝑀 computes the ratio between the intersection to the union of orders, where 𝑚𝑚𝑚𝑚𝑚𝑚𝑚𝑚𝑚𝑚𝑚𝑚𝑚𝑚𝑚𝑚𝑚𝑚𝑚𝑚𝑝𝑝𝑝𝑝𝑘𝑘𝑘𝑘(𝑜𝑜𝑜𝑜𝑖𝑖𝑖𝑖) represents the multiplicity of the product 𝑝𝑝𝑝𝑝𝑘𝑘𝑘𝑘 in the 𝑚𝑚𝑚𝑚-th order.
𝑀𝑀𝑀𝑀𝑀𝑀𝑀𝑀𝑀𝑀𝑀𝑀𝑀𝑀𝑀𝑀𝑀𝑀𝑀𝑀𝑀𝑀𝑀𝑀𝑀𝑀𝑀𝑀𝑀𝑀𝑀𝑀𝑀𝑀𝑀𝑀�𝑜𝑜𝑜𝑜𝑖𝑖𝑖𝑖; 𝑜𝑜𝑜𝑜𝑗𝑗𝑗𝑗� =|𝑜𝑜𝑜𝑜𝑖𝑖𝑖𝑖⋂�𝑜𝑜𝑜𝑜𝑗𝑗𝑗𝑗||𝑜𝑜𝑜𝑜𝑖𝑖𝑖𝑖⨄𝑜𝑜𝑜𝑜𝑗𝑗𝑗𝑗|
=∑ 𝑚𝑚𝑚𝑚𝑚𝑚𝑚𝑚𝑚𝑚𝑚𝑚 (𝑚𝑚𝑚𝑚𝑚𝑚𝑚𝑚𝑚𝑚𝑚𝑚𝑚𝑚𝑚𝑚𝑚𝑚𝑚𝑚𝑝𝑝𝑝𝑝𝑘𝑘𝑘𝑘(𝑜𝑜𝑜𝑜𝑖𝑖𝑖𝑖),𝑚𝑚𝑚𝑚𝑚𝑚𝑚𝑚𝑚𝑚𝑚𝑚𝑚𝑚𝑚𝑚𝑚𝑚𝑚𝑚𝑝𝑝𝑝𝑝𝑘𝑘𝑘𝑘(𝑜𝑜𝑜𝑜𝑗𝑗𝑗𝑗))𝑝𝑝𝑝𝑝𝑘𝑘𝑘𝑘∈𝑜𝑜𝑜𝑜𝑖𝑖𝑖𝑖⋂𝑜𝑜𝑜𝑜𝑗𝑗𝑗𝑗
∑ 𝑚𝑚𝑚𝑚𝑀𝑀𝑀𝑀𝑚𝑚𝑚𝑚 (𝑚𝑚𝑚𝑚𝑚𝑚𝑚𝑚𝑚𝑚𝑚𝑚𝑚𝑚𝑚𝑚𝑚𝑚𝑚𝑚𝑝𝑝𝑝𝑝𝑘𝑘𝑘𝑘(𝑜𝑜𝑜𝑜𝑖𝑖𝑖𝑖),𝑚𝑚𝑚𝑚𝑚𝑚𝑚𝑚𝑚𝑚𝑚𝑚𝑚𝑚𝑚𝑚𝑚𝑚𝑚𝑚𝑝𝑝𝑝𝑝𝑘𝑘𝑘𝑘(𝑜𝑜𝑜𝑜𝑗𝑗𝑗𝑗))𝑝𝑝𝑝𝑝𝑘𝑘𝑘𝑘∈𝑜𝑜𝑜𝑜𝑖𝑖𝑖𝑖∪𝑜𝑜𝑜𝑜𝑗𝑗𝑗𝑗
(1)
We suggest a new similarity based on the order similarities and frequencies of product purchasing. The new MI measure considers each bag as a point set or a subset of a high-dimensional space. Therefore, a similarity between two bags is defined as an aggregation of the similarity between instances of each bag. We start from the 𝑀𝑀𝑀𝑀𝑀𝑀𝑀𝑀𝑀𝑀𝑀𝑀𝑀𝑀𝑀𝑀𝑀𝑀𝑀𝑀𝑀𝑀𝑀𝑀𝑀𝑀𝑀𝑀𝑀𝑀𝑀𝑀𝑀𝑀𝑀𝑀 similarity to quantify the similarity between instances by using the expression 𝑀𝑀𝑀𝑀𝑀𝑀𝑀𝑀𝑀𝑀𝑀𝑀𝑀𝑀𝑀𝑀𝑀𝑀𝑀𝑀𝑀𝑀𝑀𝑀𝑀𝑀𝑀𝑀𝑀𝑀𝑀𝑀𝑀𝑀𝑀𝑀(𝑜𝑜𝑜𝑜𝑖𝑖𝑖𝑖, 𝑜𝑜𝑜𝑜𝑗𝑗𝑗𝑗).
Equations 3-5 show the new measure (termed 𝑀𝑀𝑀𝑀𝑀𝑀𝑀𝑀𝑚𝑚𝑚𝑚𝑚𝑚𝑚𝑚𝑀𝑀𝑀𝑀𝑀𝑀𝑀𝑀𝑀𝑀𝑀𝑀𝑀𝑀𝑀𝑀𝑚𝑚𝑚𝑚𝑚𝑚𝑚𝑚𝑜𝑜𝑜𝑜𝑚𝑚𝑚𝑚 similarity) where 𝐵𝐵𝐵𝐵𝑀𝑀𝑀𝑀𝐵𝐵𝐵𝐵𝑀𝑀𝑀𝑀𝑚𝑚𝑚𝑚𝑚𝑚𝑚𝑚(𝐶𝐶𝐶𝐶𝑖𝑖𝑖𝑖,𝐶𝐶𝐶𝐶𝑗𝑗𝑗𝑗)denotes the similarity between customer bags 𝐶𝐶𝐶𝐶𝑖𝑖𝑖𝑖 and 𝐶𝐶𝐶𝐶𝑗𝑗𝑗𝑗 based on the membership of the order 𝑜𝑜𝑜𝑜 to the bag 𝐶𝐶𝐶𝐶, represented by 𝜇𝜇𝜇𝜇𝐶𝐶𝐶𝐶(𝑜𝑜𝑜𝑜). This membership value is obtained as a maximum instance similarity of the order 𝑜𝑜𝑜𝑜 to the instances in the bag 𝐶𝐶𝐶𝐶.
𝑀𝑀𝑀𝑀𝑀𝑀𝑀𝑀𝑚𝑚𝑚𝑚𝑚𝑚𝑚𝑚𝑀𝑀𝑀𝑀𝑀𝑀𝑀𝑀𝑀𝑀𝑀𝑀𝑀𝑀𝑀𝑀𝑚𝑚𝑚𝑚𝑚𝑚𝑚𝑚𝑜𝑜𝑜𝑜𝑚𝑚𝑚𝑚�𝐶𝐶𝐶𝐶𝑖𝑖𝑖𝑖,𝐶𝐶𝐶𝐶𝑗𝑗𝑗𝑗� =𝑚𝑚𝑚𝑚𝑚𝑚𝑚𝑚𝑚𝑚𝑚𝑚{𝑁𝑁𝑁𝑁𝑖𝑖𝑖𝑖,𝑁𝑁𝑁𝑁𝑗𝑗𝑗𝑗}𝑚𝑚𝑚𝑚𝑀𝑀𝑀𝑀𝑚𝑚𝑚𝑚{𝑁𝑁𝑁𝑁𝑖𝑖𝑖𝑖,𝑁𝑁𝑁𝑁𝑗𝑗𝑗𝑗}
∙𝐵𝐵𝐵𝐵𝑀𝑀𝑀𝑀𝐵𝐵𝐵𝐵𝑀𝑀𝑀𝑀𝑚𝑚𝑚𝑚𝑚𝑚𝑚𝑚�𝐶𝐶𝐶𝐶𝑖𝑖𝑖𝑖,𝐶𝐶𝐶𝐶𝑗𝑗𝑗𝑗� + 𝐵𝐵𝐵𝐵𝑀𝑀𝑀𝑀𝐵𝐵𝐵𝐵𝑀𝑀𝑀𝑀𝑚𝑚𝑚𝑚𝑚𝑚𝑚𝑚(𝐶𝐶𝐶𝐶𝑗𝑗𝑗𝑗,𝐶𝐶𝐶𝐶𝑖𝑖𝑖𝑖)
2(3)
𝐵𝐵𝐵𝐵𝑀𝑀𝑀𝑀𝐵𝐵𝐵𝐵𝑀𝑀𝑀𝑀𝑚𝑚𝑚𝑚𝑚𝑚𝑚𝑚�𝐶𝐶𝐶𝐶𝑖𝑖𝑖𝑖,𝐶𝐶𝐶𝐶𝑗𝑗𝑗𝑗� =∑ 𝜇𝜇𝜇𝜇𝐶𝐶𝐶𝐶𝑗𝑗𝑗𝑗(𝑜𝑜𝑜𝑜𝑘𝑘𝑘𝑘
𝑖𝑖𝑖𝑖 )𝑁𝑁𝑁𝑁𝑖𝑖𝑖𝑖𝑘𝑘𝑘𝑘=1
𝑁𝑁𝑁𝑁𝑖𝑖𝑖𝑖
(4)
𝜇𝜇𝜇𝜇𝐶𝐶𝐶𝐶(𝑜𝑜𝑜𝑜) = 𝑚𝑚𝑚𝑚𝑀𝑀𝑀𝑀𝑚𝑚𝑚𝑚𝑥𝑥𝑥𝑥∈𝐶𝐶𝐶𝐶{𝑀𝑀𝑀𝑀𝑀𝑀𝑀𝑀𝑀𝑀𝑀𝑀𝑀𝑀𝑀𝑀𝑀𝑀𝑀𝑀𝑀𝑀𝑀𝑀𝑀𝑀𝑀𝑀𝑀𝑀𝑀𝑀𝑀𝑀𝑀𝑀(𝑚𝑚𝑚𝑚, 𝑜𝑜𝑜𝑜)} (5)
By applying the MInteraction similarity measure we can obtain customer communities according to several features: (i) purchasing frequency or order numbers by customers, (ii) subset of products which tend to be together and (iii) bestseller products. Hence, it is expected we can gain more information for each bag while obtaining compacter communities from the complex network after the construction phase is done.
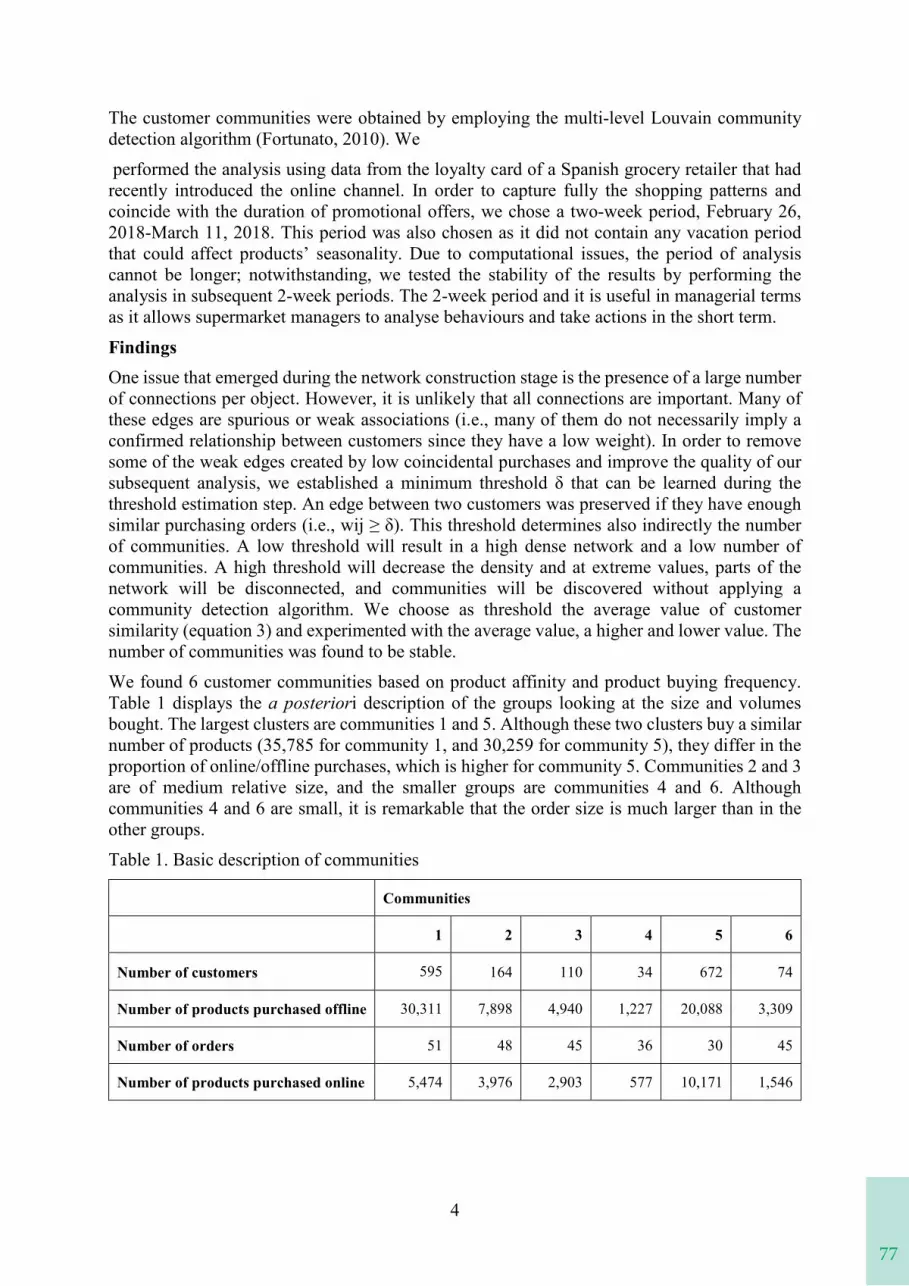
77
3
how compact a certain community structure is, or the number of obtained clusters depending on the goals. The characterization is mainly based on the specific products/brands or product categories for each community.
Design/methodology/approachThe main research challenge was to define the similarity of customers in this context. Customers are presented as bags of orders. First, we need to define a similarity between two orders, next we need to define the similarity between two bags of orders. Each order is considered a multi-set in which the multiplicity of each element is the number of a purchased product in a specific order. We introduce the similarity measure 𝑀𝑀𝑀𝑀𝑀𝑀𝑀𝑀𝑀𝑀𝑀𝑀𝑀𝑀𝑀𝑀𝑀𝑀𝑀𝑀𝑀𝑀𝑀𝑀𝑀𝑀𝑀𝑀𝑀𝑀𝑀𝑀𝑀𝑀𝑀𝑀. This measure allows quantifying the overlapping degree between two orders 𝑜𝑜𝑜𝑜𝑖𝑖𝑖𝑖 and 𝑜𝑜𝑜𝑜𝑗𝑗𝑗𝑗 that belong to different customers and is based on Jaccard index (see Equation 1). 𝑀𝑀𝑀𝑀𝑀𝑀𝑀𝑀𝑀𝑀𝑀𝑀𝑀𝑀𝑀𝑀𝑀𝑀𝑀𝑀𝑀𝑀𝑀𝑀𝑀𝑀𝑀𝑀𝑀𝑀𝑀𝑀𝑀𝑀𝑀𝑀 computes the ratio between the intersection to the union of orders, where 𝑚𝑚𝑚𝑚𝑚𝑚𝑚𝑚𝑚𝑚𝑚𝑚𝑚𝑚𝑚𝑚𝑚𝑚𝑚𝑚𝑝𝑝𝑝𝑝𝑘𝑘𝑘𝑘(𝑜𝑜𝑜𝑜𝑖𝑖𝑖𝑖) represents the multiplicity of the product 𝑝𝑝𝑝𝑝𝑘𝑘𝑘𝑘 in the 𝑚𝑚𝑚𝑚-th order.
𝑀𝑀𝑀𝑀𝑀𝑀𝑀𝑀𝑀𝑀𝑀𝑀𝑀𝑀𝑀𝑀𝑀𝑀𝑀𝑀𝑀𝑀𝑀𝑀𝑀𝑀𝑀𝑀𝑀𝑀𝑀𝑀𝑀𝑀𝑀𝑀�𝑜𝑜𝑜𝑜𝑖𝑖𝑖𝑖; 𝑜𝑜𝑜𝑜𝑗𝑗𝑗𝑗� =|𝑜𝑜𝑜𝑜𝑖𝑖𝑖𝑖⋂�𝑜𝑜𝑜𝑜𝑗𝑗𝑗𝑗||𝑜𝑜𝑜𝑜𝑖𝑖𝑖𝑖⨄𝑜𝑜𝑜𝑜𝑗𝑗𝑗𝑗|
=∑ 𝑚𝑚𝑚𝑚𝑚𝑚𝑚𝑚𝑚𝑚𝑚𝑚 (𝑚𝑚𝑚𝑚𝑚𝑚𝑚𝑚𝑚𝑚𝑚𝑚𝑚𝑚𝑚𝑚𝑚𝑚𝑚𝑚𝑝𝑝𝑝𝑝𝑘𝑘𝑘𝑘(𝑜𝑜𝑜𝑜𝑖𝑖𝑖𝑖),𝑚𝑚𝑚𝑚𝑚𝑚𝑚𝑚𝑚𝑚𝑚𝑚𝑚𝑚𝑚𝑚𝑚𝑚𝑚𝑚𝑝𝑝𝑝𝑝𝑘𝑘𝑘𝑘(𝑜𝑜𝑜𝑜𝑗𝑗𝑗𝑗))𝑝𝑝𝑝𝑝𝑘𝑘𝑘𝑘∈𝑜𝑜𝑜𝑜𝑖𝑖𝑖𝑖⋂𝑜𝑜𝑜𝑜𝑗𝑗𝑗𝑗
∑ 𝑚𝑚𝑚𝑚𝑀𝑀𝑀𝑀𝑚𝑚𝑚𝑚 (𝑚𝑚𝑚𝑚𝑚𝑚𝑚𝑚𝑚𝑚𝑚𝑚𝑚𝑚𝑚𝑚𝑚𝑚𝑚𝑚𝑝𝑝𝑝𝑝𝑘𝑘𝑘𝑘(𝑜𝑜𝑜𝑜𝑖𝑖𝑖𝑖),𝑚𝑚𝑚𝑚𝑚𝑚𝑚𝑚𝑚𝑚𝑚𝑚𝑚𝑚𝑚𝑚𝑚𝑚𝑚𝑚𝑝𝑝𝑝𝑝𝑘𝑘𝑘𝑘(𝑜𝑜𝑜𝑜𝑗𝑗𝑗𝑗))𝑝𝑝𝑝𝑝𝑘𝑘𝑘𝑘∈𝑜𝑜𝑜𝑜𝑖𝑖𝑖𝑖∪𝑜𝑜𝑜𝑜𝑗𝑗𝑗𝑗
(1)
We suggest a new similarity based on the order similarities and frequencies of product purchasing. The new MI measure considers each bag as a point set or a subset of a high-dimensional space. Therefore, a similarity between two bags is defined as an aggregation of the similarity between instances of each bag. We start from the 𝑀𝑀𝑀𝑀𝑀𝑀𝑀𝑀𝑀𝑀𝑀𝑀𝑀𝑀𝑀𝑀𝑀𝑀𝑀𝑀𝑀𝑀𝑀𝑀𝑀𝑀𝑀𝑀𝑀𝑀𝑀𝑀𝑀𝑀𝑀𝑀 similarity to quantify the similarity between instances by using the expression 𝑀𝑀𝑀𝑀𝑀𝑀𝑀𝑀𝑀𝑀𝑀𝑀𝑀𝑀𝑀𝑀𝑀𝑀𝑀𝑀𝑀𝑀𝑀𝑀𝑀𝑀𝑀𝑀𝑀𝑀𝑀𝑀𝑀𝑀𝑀𝑀(𝑜𝑜𝑜𝑜𝑖𝑖𝑖𝑖, 𝑜𝑜𝑜𝑜𝑗𝑗𝑗𝑗).
Equations 3-5 show the new measure (termed 𝑀𝑀𝑀𝑀𝑀𝑀𝑀𝑀𝑚𝑚𝑚𝑚𝑚𝑚𝑚𝑚𝑀𝑀𝑀𝑀𝑀𝑀𝑀𝑀𝑀𝑀𝑀𝑀𝑀𝑀𝑀𝑀𝑚𝑚𝑚𝑚𝑚𝑚𝑚𝑚𝑜𝑜𝑜𝑜𝑚𝑚𝑚𝑚 similarity) where 𝐵𝐵𝐵𝐵𝑀𝑀𝑀𝑀𝐵𝐵𝐵𝐵𝑀𝑀𝑀𝑀𝑚𝑚𝑚𝑚𝑚𝑚𝑚𝑚(𝐶𝐶𝐶𝐶𝑖𝑖𝑖𝑖,𝐶𝐶𝐶𝐶𝑗𝑗𝑗𝑗)denotes the similarity between customer bags 𝐶𝐶𝐶𝐶𝑖𝑖𝑖𝑖 and 𝐶𝐶𝐶𝐶𝑗𝑗𝑗𝑗 based on the membership of the order 𝑜𝑜𝑜𝑜 to the bag 𝐶𝐶𝐶𝐶, represented by 𝜇𝜇𝜇𝜇𝐶𝐶𝐶𝐶(𝑜𝑜𝑜𝑜). This membership value is obtained as a maximum instance similarity of the order 𝑜𝑜𝑜𝑜 to the instances in the bag 𝐶𝐶𝐶𝐶.
𝑀𝑀𝑀𝑀𝑀𝑀𝑀𝑀𝑚𝑚𝑚𝑚𝑚𝑚𝑚𝑚𝑀𝑀𝑀𝑀𝑀𝑀𝑀𝑀𝑀𝑀𝑀𝑀𝑀𝑀𝑀𝑀𝑚𝑚𝑚𝑚𝑚𝑚𝑚𝑚𝑜𝑜𝑜𝑜𝑚𝑚𝑚𝑚�𝐶𝐶𝐶𝐶𝑖𝑖𝑖𝑖,𝐶𝐶𝐶𝐶𝑗𝑗𝑗𝑗� =𝑚𝑚𝑚𝑚𝑚𝑚𝑚𝑚𝑚𝑚𝑚𝑚{𝑁𝑁𝑁𝑁𝑖𝑖𝑖𝑖,𝑁𝑁𝑁𝑁𝑗𝑗𝑗𝑗}𝑚𝑚𝑚𝑚𝑀𝑀𝑀𝑀𝑚𝑚𝑚𝑚{𝑁𝑁𝑁𝑁𝑖𝑖𝑖𝑖,𝑁𝑁𝑁𝑁𝑗𝑗𝑗𝑗}
∙𝐵𝐵𝐵𝐵𝑀𝑀𝑀𝑀𝐵𝐵𝐵𝐵𝑀𝑀𝑀𝑀𝑚𝑚𝑚𝑚𝑚𝑚𝑚𝑚�𝐶𝐶𝐶𝐶𝑖𝑖𝑖𝑖,𝐶𝐶𝐶𝐶𝑗𝑗𝑗𝑗� + 𝐵𝐵𝐵𝐵𝑀𝑀𝑀𝑀𝐵𝐵𝐵𝐵𝑀𝑀𝑀𝑀𝑚𝑚𝑚𝑚𝑚𝑚𝑚𝑚(𝐶𝐶𝐶𝐶𝑗𝑗𝑗𝑗,𝐶𝐶𝐶𝐶𝑖𝑖𝑖𝑖)
2(3)
𝐵𝐵𝐵𝐵𝑀𝑀𝑀𝑀𝐵𝐵𝐵𝐵𝑀𝑀𝑀𝑀𝑚𝑚𝑚𝑚𝑚𝑚𝑚𝑚�𝐶𝐶𝐶𝐶𝑖𝑖𝑖𝑖,𝐶𝐶𝐶𝐶𝑗𝑗𝑗𝑗� =∑ 𝜇𝜇𝜇𝜇𝐶𝐶𝐶𝐶𝑗𝑗𝑗𝑗(𝑜𝑜𝑜𝑜𝑘𝑘𝑘𝑘
𝑖𝑖𝑖𝑖 )𝑁𝑁𝑁𝑁𝑖𝑖𝑖𝑖𝑘𝑘𝑘𝑘=1
𝑁𝑁𝑁𝑁𝑖𝑖𝑖𝑖
(4)
𝜇𝜇𝜇𝜇𝐶𝐶𝐶𝐶(𝑜𝑜𝑜𝑜) = 𝑚𝑚𝑚𝑚𝑀𝑀𝑀𝑀𝑚𝑚𝑚𝑚𝑥𝑥𝑥𝑥∈𝐶𝐶𝐶𝐶{𝑀𝑀𝑀𝑀𝑀𝑀𝑀𝑀𝑀𝑀𝑀𝑀𝑀𝑀𝑀𝑀𝑀𝑀𝑀𝑀𝑀𝑀𝑀𝑀𝑀𝑀𝑀𝑀𝑀𝑀𝑀𝑀𝑀𝑀𝑀𝑀(𝑚𝑚𝑚𝑚, 𝑜𝑜𝑜𝑜)} (5)
By applying the MInteraction similarity measure we can obtain customer communities according to several features: (i) purchasing frequency or order numbers by customers, (ii) subset of products which tend to be together and (iii) bestseller products. Hence, it is expected we can gain more information for each bag while obtaining compacter communities from the complex network after the construction phase is done.
4
The customer communities were obtained by employing the multi-level Louvain community detection algorithm (Fortunato, 2010). We
performed the analysis using data from the loyalty card of a Spanish grocery retailer that had recently introduced the online channel. In order to capture fully the shopping patterns and coincide with the duration of promotional offers, we chose a two-week period, February 26,2018-March 11, 2018. This period was also chosen as it did not contain any vacation period that could affect products’ seasonality. Due to computational issues, the period of analysis cannot be longer; notwithstanding, we tested the stability of the results by performing the analysis in subsequent 2-week periods. The 2-week period and it is useful in managerial terms as it allows supermarket managers to analyse behaviours and take actions in the short term.
FindingsOne issue that emerged during the network construction stage is the presence of a large number of connections per object. However, it is unlikely that all connections are important. Many of these edges are spurious or weak associations (i.e., many of them do not necessarily imply a confirmed relationship between customers since they have a low weight). In order to remove some of the weak edges created by low coincidental purchases and improve the quality of our subsequent analysis, we established a minimum threshold δ that can be learned during the threshold estimation step. An edge between two customers was preserved if they have enough similar purchasing orders (i.e., wij ≥ δ). This threshold determines also indirectly the number of communities. A low threshold will result in a high dense network and a low number of communities. A high threshold will decrease the density and at extreme values, parts of the network will be disconnected, and communities will be discovered without applying a community detection algorithm. We choose as threshold the average value of customer similarity (equation 3) and experimented with the average value, a higher and lower value. The number of communities was found to be stable.
We found 6 customer communities based on product affinity and product buying frequency. Table 1 displays the a posteriori description of the groups looking at the size and volumes bought. The largest clusters are communities 1 and 5. Although these two clusters buy a similar number of products (35,785 for community 1, and 30,259 for community 5), they differ in the proportion of online/offline purchases, which is higher for community 5. Communities 2 and 3 are of medium relative size, and the smaller groups are communities 4 and 6. Although communities 4 and 6 are small, it is remarkable that the order size is much larger than in the other groups.
Table 1. Basic description of communities
Communities
1 2 3 4 5 6
Number of customers 595 164 110 34 672 74
Number of products purchased offline 30,311 7,898 4,940 1,227 20,088 3,309
Number of orders 51 48 45 36 30 45
Number of products purchased online 5,474 3,976 2,903 577 10,171 1,546
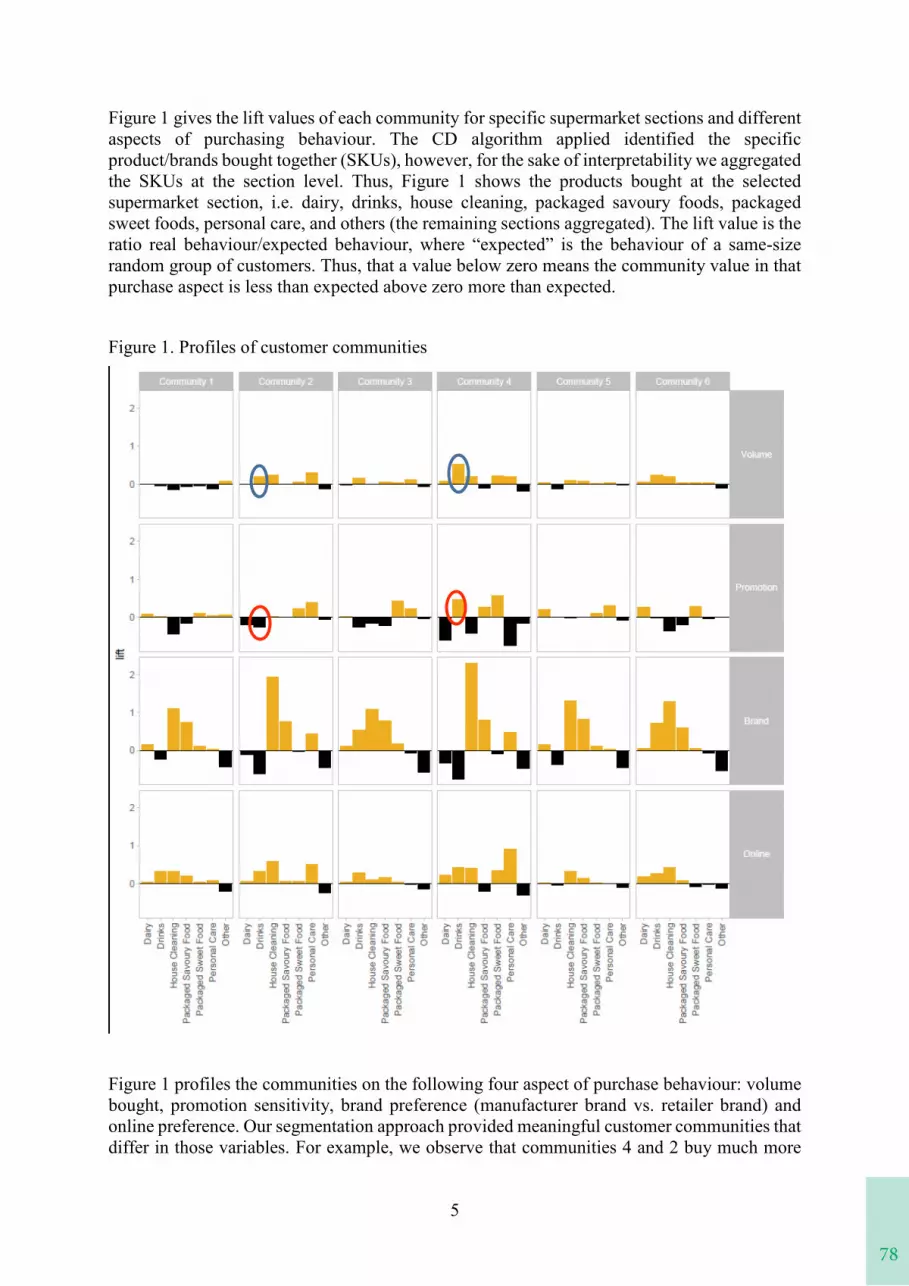
78
5
Figure 1 gives the lift values of each community for specific supermarket sections and different aspects of purchasing behaviour. The CD algorithm applied identified the specific product/brands bought together (SKUs), however, for the sake of interpretability we aggregated the SKUs at the section level. Thus, Figure 1 shows the products bought at the selected supermarket section, i.e. dairy, drinks, house cleaning, packaged savoury foods, packaged sweet foods, personal care, and others (the remaining sections aggregated). The lift value is the ratio real behaviour/expected behaviour, where “expected” is the behaviour of a same-size random group of customers. Thus, that a value below zero means the community value in that purchase aspect is less than expected above zero more than expected.
Figure 1. Profiles of customer communities
Figure 1 profiles the communities on the following four aspect of purchase behaviour: volume bought, promotion sensitivity, brand preference (manufacturer brand vs. retailer brand) and online preference. Our segmentation approach provided meaningful customer communities that differ in those variables. For example, we observe that communities 4 and 2 buy much more
79
5
Figure 1 gives the lift values of each community for specific supermarket sections and different aspects of purchasing behaviour. The CD algorithm applied identified the specific product/brands bought together (SKUs), however, for the sake of interpretability we aggregated the SKUs at the section level. Thus, Figure 1 shows the products bought at the selected supermarket section, i.e. dairy, drinks, house cleaning, packaged savoury foods, packaged sweet foods, personal care, and others (the remaining sections aggregated). The lift value is the ratio real behaviour/expected behaviour, where “expected” is the behaviour of a same-size random group of customers. Thus, that a value below zero means the community value in that purchase aspect is less than expected above zero more than expected.
Figure 1. Profiles of customer communities
Figure 1 profiles the communities on the following four aspect of purchase behaviour: volume bought, promotion sensitivity, brand preference (manufacturer brand vs. retailer brand) and online preference. Our segmentation approach provided meaningful customer communities that differ in those variables. For example, we observe that communities 4 and 2 buy much more
6
drinks than expected (blue circles), but customers of community 4 are quite sensitive to promotions on drinks while customers of community 2 are not (red circles). The findings display significant differences regarding the proportion of private label product bought. Community 1 seems to be less keen of purchasing private label products. Although all customers buy more manufacturer brands within the category of house cleaning products this proportion is larger for community 4. Regarding the use of online versus offline channels, our data reveals the categories that are purchased online more frequently by each community, for example in the case of community 5 it is house cleaning products.
Original/valueThis paper presents a product affinity segmentation of multichannel grocery shoppers applying a community detection algorithm. Analysing data for online and offline purchases, our study identifies communities of shoppers based on the subset of products bought together, the products bought most often, and the shopping frequency. We also show that the behaviour of the communities differs on total volume, use of online vs offline channel, promotion sensitivity, and preference for manufacturer vs. retailer brand. Previous segmentation studies of shoppers have been mainly based on clustering algorithms (e.g. k-means, latent segmentation). While these studies are useful to identify groups based on the average shopping patterns during a given period, such as RFM (recency, frequency, monetary), they are not able to produce segments based on the individual products bought together. To the best of our knowledge, community detection algorithms based on customers as bags of orders has not been previously applied to segment shoppers in a multichannel context.
Practical implicationsOur findings suggest interesting implications for multichannel grocery retailers. By applying community detection algorithm based on Multiple interaction similarity we have been able to show the diversity of shopping patterns at the level of products/brands bought together in a shopping trip and profile the resulting segments in terms of shopping preferences. Our approach is able to profile segments based on purchase behaviour at the product/brand level, unlike other clustering algorithms that provide information in more aggregated ways. For example, retailers can use this product affinity segmentation approach to target specific groups of customers for the recommendation of specific products/brands. Moreover, as we are able to profile the communities on volume purchased, channel preference, promotion sensitivity and brand preference, marketers are able to identify which market segments are more profitable, more likely to buy online/offline, more loyal to the retail brand, and more likely to respond to promotions. In this way they can optimize their marketing efforts by making more accurate and efficient product recommendations and promotions.
Research limitations and outlookThere are some limitations of this study based on the data analysed. Our research is based on transactional data of a single retailer, which can pose some bias on the results. Moreover, this retailer has a short history of online sales, therefore the finding related to preference for online vs. offline channel should be taken cautiously. We were not able to use sociodemographic data linked to the loyalty card due to high number of incomplete cases or unreliability of age and gender data due to different members of the family using the same card.
80
7
Future research could further explore the differences between online and offline purchase behaviour of multichannel shoppers by applying multi-layer detection algorithm. The data representation as a multi-layer network, where each layer is a channel, would offer useful insights of multichannel shoppers for retailers.
ReferencesAnsari, A., Mela, C. F., & Neslin, S. A. (2008). Customer Channel Migration. Journal of
Marketing Research, XLV(February), 60–76.
Biyalogorsky, E., & Naik, P. (2003). Clicks and mortar: The effect of on-line activities on off-line sales. Marketing Letters, 14(1), 21–32.
Fortunato, S. (2010). Community detection in graphs. Physics Reports, 486(3-5), 75-174.
Fuentes, I., Napoles, N., Arco, L., & Vanhoof, K. (2018). Customer segmentation using multiple instance clustering and purchasing behaviors, in Lecture Notes in Computer Science Sseries, 11047, 193-200.
Hernant, M., & Rosengren, S. (2017). Now what? Evaluating the sales effects of introducing an online store. Journal of Retailing and Consumer Services, 39(June), 305–313.
Huttenlocher, D. P., Klanderman, G. A., & Rucklidge, W. J. (1993). Comparing images using the Hausdorff distance. IEEE Transactions on Pattern Analysis and Machine Intelligence,15(9), 850-863.
Kelley, S., Goldberg, M., Magdon-Ismail, M., Mertsalov, K., & Wallace, A. (2012). Defining and discovering communities in social networks. In Handbook of Optimization in Complex Networks (pp. 139-168). Springer, Boston, MA.
Konuş, U., Verhoef, P., & Neslin, S. (2008). Multichannel Shopper Segments and Their Covariates. Journal of Retailing, 84(4), 398–413.
Javed, M. A., Younis, M. S., Latif, S., Qadir, J., & Baig, A. (2018). Community detection in networks: A multidisciplinary review. Journal of Network and Computer Applications, 108, 87-111.
Ju, C., & Xu, C. (2013). A new collaborative recommendation approach based on users clustering using artificial bee colony algorithm. The Scientific World Journal, Vol. 2013, http://dx.doi.org/10.1155/2013/869658 2013
Krishnamurthy, B., & Wang, J. (2000). On network-aware clustering of web clients. In Proceedings of the conference on Applications, Technologies, Architectures, and Protocols for Computer Communication (pp. 97-110)
Nakano, S., & Kondo, F. N. (2018). Customer segmentation with purchase channels and media touchpoints using single source panel data. Journal of Retailing and Consumer Services,
Neslin, S. A., Grewal, D., Leghorn, R., Shankar, V., Teerling, M. L., Thomas, J. S., & Verhoef, P. C. (2006). Challenges and Opportunities in Multichannel Customer Management. Journal of Service Research, 9(2), 95–112.
Peker, S., Kocyigit, A., & Eren, P. E. (2017). LRFMP model for customer segmentation in the grocery retail industry: a case study. Marketing Intelligence and Planning, 35(4), 544–559.
Verhoef, P. C., Kannan, P. K., & Inman, J. J. (2015). From Multi-Channel Retailing to Omni-Channel Retailing Introduction to the Special Issue on Multi-Channel Retailing. Journal of Retailing, 91(2), 174–181.

81
7
Future research could further explore the differences between online and offline purchase behaviour of multichannel shoppers by applying multi-layer detection algorithm. The data representation as a multi-layer network, where each layer is a channel, would offer useful insights of multichannel shoppers for retailers.
ReferencesAnsari, A., Mela, C. F., & Neslin, S. A. (2008). Customer Channel Migration. Journal of
Marketing Research, XLV(February), 60–76.
Biyalogorsky, E., & Naik, P. (2003). Clicks and mortar: The effect of on-line activities on off-line sales. Marketing Letters, 14(1), 21–32.
Fortunato, S. (2010). Community detection in graphs. Physics Reports, 486(3-5), 75-174.
Fuentes, I., Napoles, N., Arco, L., & Vanhoof, K. (2018). Customer segmentation using multiple instance clustering and purchasing behaviors, in Lecture Notes in Computer Science Sseries, 11047, 193-200.
Hernant, M., & Rosengren, S. (2017). Now what? Evaluating the sales effects of introducing an online store. Journal of Retailing and Consumer Services, 39(June), 305–313.
Huttenlocher, D. P., Klanderman, G. A., & Rucklidge, W. J. (1993). Comparing images using the Hausdorff distance. IEEE Transactions on Pattern Analysis and Machine Intelligence,15(9), 850-863.
Kelley, S., Goldberg, M., Magdon-Ismail, M., Mertsalov, K., & Wallace, A. (2012). Defining and discovering communities in social networks. In Handbook of Optimization in Complex Networks (pp. 139-168). Springer, Boston, MA.
Konuş, U., Verhoef, P., & Neslin, S. (2008). Multichannel Shopper Segments and Their Covariates. Journal of Retailing, 84(4), 398–413.
Javed, M. A., Younis, M. S., Latif, S., Qadir, J., & Baig, A. (2018). Community detection in networks: A multidisciplinary review. Journal of Network and Computer Applications, 108, 87-111.
Ju, C., & Xu, C. (2013). A new collaborative recommendation approach based on users clustering using artificial bee colony algorithm. The Scientific World Journal, Vol. 2013, http://dx.doi.org/10.1155/2013/869658 2013
Krishnamurthy, B., & Wang, J. (2000). On network-aware clustering of web clients. In Proceedings of the conference on Applications, Technologies, Architectures, and Protocols for Computer Communication (pp. 97-110)
Nakano, S., & Kondo, F. N. (2018). Customer segmentation with purchase channels and media touchpoints using single source panel data. Journal of Retailing and Consumer Services,
Neslin, S. A., Grewal, D., Leghorn, R., Shankar, V., Teerling, M. L., Thomas, J. S., & Verhoef, P. C. (2006). Challenges and Opportunities in Multichannel Customer Management. Journal of Service Research, 9(2), 95–112.
Peker, S., Kocyigit, A., & Eren, P. E. (2017). LRFMP model for customer segmentation in the grocery retail industry: a case study. Marketing Intelligence and Planning, 35(4), 544–559.
Verhoef, P. C., Kannan, P. K., & Inman, J. J. (2015). From Multi-Channel Retailing to Omni-Channel Retailing Introduction to the Special Issue on Multi-Channel Retailing. Journal of Retailing, 91(2), 174–181.
8
Yang, Z., Algesheimer, R., & Tessone, C. J. (2016). A comparative analysis of community detection algorithms on artificial networks. Scientific Reports, 6, 30750.
Zhang, L., Priestley, J., DeMaio, J., & Ni, S. (2019). A Product Affinity Segmentation Framework. Grey Literature from PhD Candidates, 13. Kennesaw State University.
KeywordsCommunity detection, product affinity, multichannel shoppers, grocery retailing.
AcknowledgementThis work was financed by the Spanish Ministry of Science, Innovation and Universities, Spanish State Research Agency (Research Grant ECO 2017-83051-R).
82
WHY DO CONSUMERS USE INTERACTIVE TECHNOLOGIES IN STORES? A USES AND GRATIFICATIONS APPROACH
Hafida BoudkoussUniv. Lille, ULR 4112 - LSMRC, F-59000 Lille, France
Souad DjelassiUniv. Lille, ULR 4112 - LSMRC, F-59000 Lille, France
Chair TREND(S)[email protected]
AbstractThe study draws on a uses and gratifications perspective in a phygital context. In applying this perspective, this research explores and discusses the uses and gratifications that consumers obtain from digital devices in physical stores, especially self-checkout and interactive kiosks.It also seeks to provide a better understanding of why consumers use these technologies. Aqualitative approach was adopted, with 20 in-depth interviews. The research findings identifiedfour specific gratifications from interactive kiosks (enjoyment, flow, information-seeking and social interaction) and two common gratifications from interactive kiosks and self-checkouts(control and time saving). The research contributes to previous studies on the use of digital technologies in stores and has important managerial implications.
Keywords – Phygital, Uses and Gratification Theory, Interactive technologies, Self-checkout, Interactive kiosk
83
IntroductionMany retailers are now venturing into phygital and introducing digital tools into their physical stores (Hagberg et al., 2017). Phygital seems to be one of the priorities that has recently concerned both retailers and scholars and has been the subject of numerous studies in marketing(Fuentes et al., 2017; Mosquera et al., 2017). These works have explored the potential of interactive technologies to transform the shopping experience in stores and have highlighted their impact on shopping value. However, little is known about why consumers use interactive technologies in physical stores.
The present study addresses the aforementioned gap by examining the different motivationsunderlying the use of interactive technologies in stores. More specifically, we focus on the use of self-checkouts1 and interactive kiosks in French stores. These technologies are being widely introduced by French retailers. However, according to the statistics, very few French consumers are willing to use them2. To achieve the research objective, we employ Uses and Gratifications Theory (UGT). As underlined by Rauschnabel (2018), even though UGT has its limitations, it is still one of the most generally applied theories for investigating the adoption and use of technologies and services. Luo et al (2011) have shown that UGT is a useful approach for identifying usage motivations regarding interactive technologies. Similarly, Dolan et al. (2016) argue that UGT, a well-established theoretical perspective, provides valuable insights into interactive media and technologies.
This study provides a better understanding of the uses of and gratifications obtained from digital devices in physical stores. UGT has been applied in different contexts such as TV, the Internet and social media, but to our knowledge, never in a phygital context. On the managerial side, the study will help retailers to determine the critical motivations behind the success of interactive technologies. These motivations can be used in retailers’ communications to attract potential users of these technologies.
The remainder of the paper is structured as follows. First, we present a literature review oninteractive technologies and UGT. Second, the method for collecting and analyzing data is described. Third, the findings are presented and discussed. We conclude with theoretical and practical implications and lastly with the limitations of the study.
Literature ReviewPhygital and Interactive technologiesRetail is seen as one of the sectors largely affected by phygital and digital transformations (Hagberg et al., 2017). The concept of phygital stems from the linkage of two realms: digital and physical (Moravcikova and Kliestikova, 2017, p. 149). It involves “hybridizing the physical (the point of sale, its products, etc.) and digital components (touch screens, connected mirrors, NFC cards, etc.) at the same time and in the same place” (Belghiti et al., 2017).These digital components, also known as Self-Service Technologies (SST) are designed to facilitate transactions and allow consumers to produce a service independently of direct
1 Nielson 2019 shows a significant increase in the use of self-checkout machines by brands, with 57% of French stores now equipped with self-service checkouts. Source: https://banque.meilleurtaux.com/frais-bancaires/actualites/2019-septembre/les-caisses-en-libre-service-seduisent-de-plus-en-plus-de-clients-en-france.html (consulted 18 February 2020)2 According to Samsung Smart Retail Barometer 2019, only 38% of French people believe that the presence of digital devices (interactive kiosks, self-scanning, self-check-out, virtual fitting screens, etc.) would encourage them to visit more stores. Source: https://comarketing-news.fr/digital-le-second-souffle-des-magasins/ (consulted 21st February 2020)
84
employee involvement (Meuter, 2000). Consumers become active participants in the delivery of services rather than a passive audience (Prahalad and Ramaswamy, 2000).Two streams of research have emerged from the SST literature: consumer adoption factors (Liljander et al., 2006) and the influence of SST on shopping experience and value (Blázquez,2014; Curran and Meuter, 2005; Schramm-Klein et al., 2011). Various factors influence the adoption and use of these technologies, such as ease of use, perceived usefulness, perceived pleasure and trust in the seller (Demoulin and Djelassi, 2016; Foroudi et al., 2018). SSTsprovide a range of benefits: autonomy, relational benefits, enjoyment and usefulness. However, they can also involve sacrifices, such as effort in use, lack of control, and riskregarding private data (Feenstra, Stan and Glérant-Gliksson, 2018). Uses and gratifications theory (UGT)Uses and gratifications theory (Katz et al., 1973) provides an appropriate theoretical basis for understanding why and how individuals actively seek the use of certain media to fulfill specific needs. UGT is one of the first approaches that considers the active role of consumers in the choice and use of media (Dolan et al., 2016). Consumers are seen as active gratification seekers interacting with media, rather than passive recipients (Eighmey and McCord, 1998). They act in a goal-oriented manner and actively choose the media they want to consume, driven by their individual needs and motivations (Rauschnabel, 2018). Initially applied to understand user motivations in the context of traditional media (Blumler and Katz, 1974), UGT has increasingly become a relevant and a much-used theoretical framework in studies on the adoption of different technologies (Ray et al., 2019). It has been used in relation to the Internet (Luo et al., 2011; Eighmey and McCord, 1998), social media (Dolan et al., 2016; Lim and Kumar, 2019) and food delivery applications (Ray et al., 2019). These previous studies have shown that information seeking (e.g. information about a brand or a product), convenience (e.g. comfort, avoiding waiting time), incentive seeking (e.g. monetary incentives in the form of coupons, non-monetary incentives such as acknowledgement),entertainment, connectedness and social interaction seem to be important gratifications forweb-based information technologies and systems.
MethodologyThe objective of the research is to understand why consumers use interactive technologies in physical stores. We have chosen two types of technology: self-checkout machines and interactive kiosks which are the most widely implemented technologies by French retailers3.We used a qualitative approach involving in-depth interviews. We interviewed 20 consumers– 11 women and 9 men – aged between 20 and 454. Respondents were recruited by means of snowballing. They were asked to share their motivations for using the two technologies instores. Interviews took place at the respondents' home or workplace and lasted between 50 and 80 minutes. All interviews were recorded and transcribed in full. They were then coded separately by two researchers who processed by vertical (intra-respondent and intra-technology) and horizontal (inter-respondent and inter-technology) thematic content analysis(Miles and Huberman, 1994). After comparison of the researchers’ interpretations, the codingswere grouped by theme.
3 Nielson 2019 shows a significant increase in the use of self-checkout machines by brands, with 57% of French stores now equipped with self-service checkouts. Source: https://banque.meilleurtaux.com/frais-bancaires/actualites/2019-septembre/les-caisses-en-libre-service-seduisent-de-plus-en-plus-de-clients-en-france.html (consulted 18 February 2020) 4 This age group lies within the age range of connected people in France according to Digital Report France 2020 (Source: https://wearesocial.com/fr/blog/2020/02/digital-report-france-2020, consulted 18 February 2020)
85
Results and discussionThe discourse analysis identified four specific gratifications obtained from interactive kiosks (enjoyment, flow, information-seeking and social interaction); and two common gratifications from interactive kiosks and self-checkout machines (control and time saving).
Gratifications specific to interactive kiosksHedonic gratification: The first hedonic gratification (enjoyment) refers to the extent to which the activity of using a medium is perceived to be enjoyable (Li et al., 2015). Many respondents reported that they used interactive kiosks for reasons of enjoyment. For them, these technologies are fun, pleasant and exciting. “It is an enjoyable experience when using aninteractive kiosk…It's cool, and it's fun” (Anas, 27), “I'm satisfied when I use interactive kiosksthat make my life easier, I feel happy, I feel good, my shopping is going well” (Léa, 21). This finding is in line with the work of Li et al. (2015) and Xu et al. (2012), which provide evidence that individuals use interactive media for hedonic gratification. The second hedonic gratification (flow) refers to a state of optimal psychological experience, or the most enjoyable experience possible, when a person is unconsciously engaged in an activity (Novak et al., 2000). In the state of flow, people are so involved in the activity that they become intensely absorbed, lose the sense of time, and nothing seems to matter to them (Csikszentmihalyi, 1990).Respondents stated that they use interactive kiosks to have an optimal in-store experience. “Iwent to a sports shop to buy running shoes, I used an interactive kiosk with treadmills to try shoes, this made me feel like I was running outside, I felt the pleasure of being immersed in the brand’s universe” (Valentine, 45). The result is consistent with previous studies on other technologies such as television (Sherry, 2004). Utilitarian gratification: The first utilitarian gratification related to the use of interactive kiosksis information seeking. This refers to the use of a technology or medium to seek outinformation or to self-educate (Whiting and Williams, 2013). In our study, interviewers reported that they use interactive kiosks in stores to find information about products (available sizes, colors) or about promotional offers. I use interactive kiosks to get the information I need, see if my size is in the store, if I want to buy too many items, see if there are any promotions..."(Pauline, 22). The result is consistent with previous studies in other contexts such as the Internet (Papacharissi and Rubin, 2000). Information seeking was found to be one of primary motives spurring individuals’ use of the Internet.Social gratification: Social interaction has been identified as the social gratification of using interactive kiosks. This gratification refers to the extent to which a medium “is used as a communication medium to interact with others” (Gan and Li, 2018, p. 309). According to some interviewees, interactive kiosks allow them to share their experiences with family and friends.“Interactive kiosks in the clothing shop allow me to try articles and share pictures with friends via social networks” (Anas, 27). This is consistent with the findings of Lim and Kumar (2019),Jackson and Wang et al. (2013) and Zhang et al. (2016) in the context of networking sites. Common gratifications between self-checkout machines and interactive kiosksUtilitarian gratification: Our study shows that control is the utilitarian gratification soughtfrom the use of self-check machines and interactive kiosks in stores. According to Cyr et al. (2009), control refers to the extent to which an individual can choose the timing, content and sequence of a communication. Users may experience a sense of control over a website, for example, when they can select the language or use a search engine to find the information they want. Interviewees mentioned that these technologies allow them to control their transactions and make them clearer. “For example, when I use a self-checkout machine, there is clarity in the transactions, for example you can see the prices as you scan the product, maybe it reassures me and I have the impression that I can control my expenditure more effectively” (Sophie, 29).
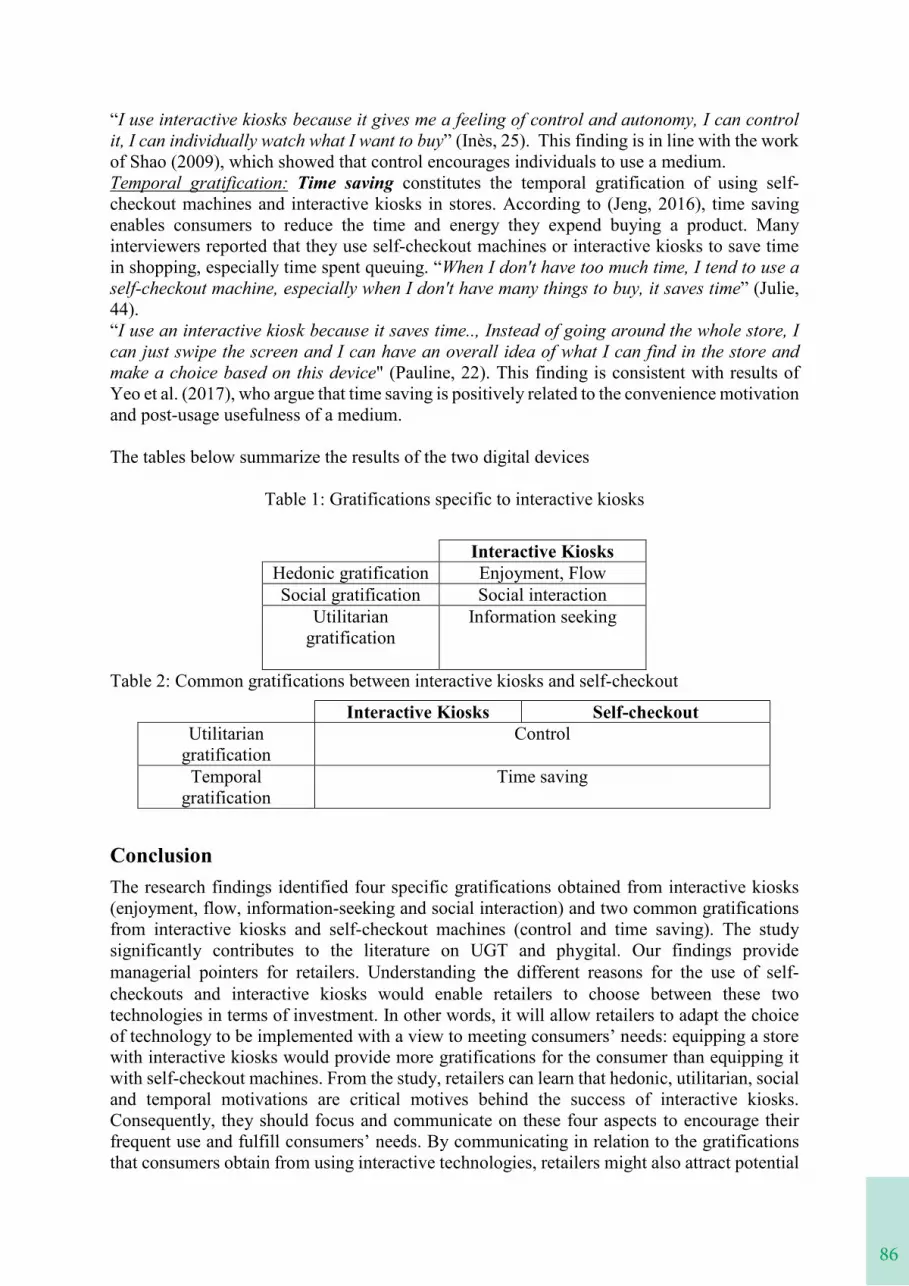
86
“I use interactive kiosks because it gives me a feeling of control and autonomy, I can control it, I can individually watch what I want to buy” (Inès, 25). This finding is in line with the work of Shao (2009), which showed that control encourages individuals to use a medium.Temporal gratification: Time saving constitutes the temporal gratification of using self-checkout machines and interactive kiosks in stores. According to (Jeng, 2016), time saving enables consumers to reduce the time and energy they expend buying a product. Many interviewers reported that they use self-checkout machines or interactive kiosks to save time in shopping, especially time spent queuing. “When I don't have too much time, I tend to use aself-checkout machine, especially when I don't have many things to buy, it saves time” (Julie, 44).“I use an interactive kiosk because it saves time.., Instead of going around the whole store, Ican just swipe the screen and I can have an overall idea of what I can find in the store and make a choice based on this device" (Pauline, 22). This finding is consistent with results of Yeo et al. (2017), who argue that time saving is positively related to the convenience motivationand post-usage usefulness of a medium.
The tables below summarize the results of the two digital devices
Table 1: Gratifications specific to interactive kiosks
Interactive KiosksHedonic gratification Enjoyment, FlowSocial gratification Social interaction
Utilitarian gratification
Information seeking
Table 2: Common gratifications between interactive kiosks and self-checkout
Interactive Kiosks Self-checkout Utilitarian
gratificationControl
Temporal gratification
Time saving
ConclusionThe research findings identified four specific gratifications obtained from interactive kiosks(enjoyment, flow, information-seeking and social interaction) and two common gratifications from interactive kiosks and self-checkout machines (control and time saving). The study significantly contributes to the literature on UGT and phygital. Our findings provide managerial pointers for retailers. Understanding the different reasons for the use of self-checkouts and interactive kiosks would enable retailers to choose between these two technologies in terms of investment. In other words, it will allow retailers to adapt the choice of technology to be implemented with a view to meeting consumers’ needs: equipping a store with interactive kiosks would provide more gratifications for the consumer than equipping it with self-checkout machines. From the study, retailers can learn that hedonic, utilitarian, socialand temporal motivations are critical motives behind the success of interactive kiosks.Consequently, they should focus and communicate on these four aspects to encourage theirfrequent use and fulfill consumers’ needs. By communicating in relation to the gratifications that consumers obtain from using interactive technologies, retailers might also attract potential
87
users of these technologies, especially reluctant consumers. This study is not without its limitations. First, only 20 consumers were interviewed for the two technologies, and it would be worthwhile carrying out additional interviews to obtain more detailed results. Second, asthe current study is qualitative in nature, a quantitative study would be fruitful for identifyingthe antecedents and consequences of the gratifications identified in this research.
References
Belghiti, S. Ochs, A. Lemoine, J. F. and Badot, O. (2017), “The Phygital Shopping Experience: An Attempt at Conceptualization and Empirical Investigation”, In Academy of Marketing Science World Marketing Congress (pp. 61-74). Springer, Cham.
Blázquez, M. (2014), “Fashion shopping in multichannel retail: The role of technology in enhancing the customer experience”, International Journal of Electronic Commerce, Vol. 18 No. 4, pp. 97-116.
Blumler J.G. and Katz E. (1974), The uses of mass communications: Current perspectives on gratifications research, Beverly Hills, CA: Sage.
Csikszentmihalyi M. (1990), Flow: the psychology of optimal experience, New York, Harper and Row
Curran, J.M., Meuter, M.L., Surprenant, C.F. (2003), “Intentions to use SSTs: a confluence of multiple attitudes”, Journal of Service Research, Vol. 5 No. 3, pp. 209–224.
Cyr, D., Head, M., Larios, H. and Pan, B. (2009), “Exploring Human Images in Website Design: A Multi-Method Approach”, MIS Quarterly, Vol.33 No.3, pp. 539-566.
Demoulin, N. et Djelassi, S. (2016), “An Integrated Model of Self-Service Technology (SST) Usage in a Retail Context”, International Journal of Retail & Distribution Management, Vol. 44 No. 5, pp. 540-559.
Dolan, R., Conduit, J., Fahy, J., and Goodman, S. (2016), “Social media engagement behaviour: A uses and gratifications perspective”, Journal of Strategic Marketing, Vol. 24 No. 3–4, pp. 261–277.
Eighmey, J., and McCord, L. (1998), “Adding value in the information age : Uses and gratifications of sites on the world wide web”, Journal of Business Research, Vol. 41, pp. 187–194.
Feenstra, F., Stan, V. and Glérant-Glikson, A. (2018), “My name is SSIT, I am here to help you! An empirical investigation on value creation with digital decision aids instore”. In: Colloque Etienne Thil.
Foroudi, P. Gupta, S. Sivarajah, U. et al (2018), “Investigating the effects of smart technology on customer dynamics and customer experience”, Computers in Human Behavior, Vol. 80, pp. 271- 282.
Fuentes C., Bäckström K. and Svingstedt A. , (2017), “Smartphones and the reconfiguration of retailscapes: Stores, shopping, and digitalization”, Journal of Retailing and Consumer Services, Vol. 39, pp. 270–278.
Gan, C. and Li, H. (2018), “Understanding the effects of gratifications on the continuance intention to use WeChat in China: A perspective on uses and gratifications”, Computers in Human Behavior, Vol. 78, pp. 306–315.
Hagberg J., Jonsson A. and Egels-Zandén N. (2017), “Retail digitalization: Implications for physical stores”, Journal of Retailing and Consumer Services, Vol. 39, pp. 264–269.
Jeng, S.-P., (2016), “ The influences of airline brand credibility on consumer purchase intentions”. J. Air Transp. Manag. Vol. 55, pp. 1–8.
Katz, Elihu, Jay G. Blumler, and Michael Gurevitch, (1973), “Uses and Gratifications Research.” Public Opinion Quarterly, Vol. 37 No. 4, pp. 509–523.
88
Li, H., Liu, Y., Xu, X., Heikkil a, J., and van der Heijden, H. (2015), “Modeling hedonic is continuance through the uses and gratifications theory : An empirical study in online games”, Computers in Human Behavior, Vol. 48, pp. 261-272.
Liljander V, Gillberg F, Gummerus J, et al. (2006), “Technology readiness and the evaluation and adoption of self- service technologies”, Journal of Retailing and Consumer Services, Vol. 13 No. 3, pp. 177–191.
Lim, H., Kumar, A., (2019), “Variations in consumers’ use of brand online social networking: A uses and gratifications approach”, Journal of Retailing and Consumer Services, Vol. 51, pp. 450–457.
Luo, M., Chea, S., Chen, J. (2011), “Web-based information service adoption: A comparison of the motivational model and the uses and gratifications theory”, Decision Support Systems, Vol. 51, pp. 21–30.
Meuter, M. , Ostrom, A. , Roundtree, R., et al. (2000), “Self-Service Technologies: Understanding Customer Satisfaction with Technology-Based Service Encounters”, Journal of Marketing, Vol 64, pp. 50–64.
Miles, M., and Huberman, A., (1994), Qualitative data analysis, Thousand Oaks: Sage Publications.
Moravcikova, D., and Kliestikova, J. (2017), “Brand building with using phygital marketing communication”,Journal of Economics, Business and Management, Vol. 5 No. 3, pp. 148-152.
Mosquera, A., Olarte Pascual, C. and Juaneda, AE. (2017), “Understanding the customer experience in the age of omni-channel shopping”, Icono, Vol. 14, 15 No. 2: pp. 166-185.
Papacharissi, Z., (2002), “The self-Online : The utility of personal home pages”, Journal of Broadcasting & Electronic Media, Vol. 46 No. 3, pp. 346-368.
Philipp, A., Rauschnabel, (2018), “Virtually enhancing the real world with holograms: An exploration of expected gratifications of using augmented reality smart glasses”, Psychology and Marketing, Vol. 35, pp. 557–572.
Prahalad, C. K., and Ramaswamy, V. (2000), “Co-Opting Customer Competence”, Harvard Business Review,Vol. 78, pp. 79-90.
Ray, A. Dhir, A., Kumar Bala, P., Kaur, P. (2019), “Why do people use food delivery apps (FDA)? A uses and gratification theory Perspective”, Journal of Retailing and Consumer Services, Vol. 51, pp. 221–230.
Schramm-Klein, H., Wagner, G., Steinmann, S., and Morschett, D. (2011), “Crosschannel integration – is it valued by customers ?”, The International Review of Retail, Distribution and Consumer Research, Vol. 21 No. 5, pp. 501–511.
Shao, G. S. (2009), “Understanding the appeal of user-generated media: A uses and gratification perspective”,Internet Research, Vol. 19 No. 1, pp. 7-25.
Sherry, J. L., (2004), “Flow and media enjoyment”, Communication Theory, Vol. 14, 392–410.
Jackson, L. A., and Wang, J. L., (2013), “Cultural differences in social networking site use: A comparative study of China and the United States”, Computers in Human Behavior, Vol. 29 No. 3, pp. 910–921.
Whiting, A., Williams, D., (2013), “Why people use social media: a uses and gratifications approach”. Qual. Mark. Res.: Int. J. Vol. 16 No. 4, pp. 362–369.
Xu, C., Ryan, S., Prybutok, V., and Wen, C., (2012), “It is not for fun: An examination of social network site usage”, Information & Management, Vol. 49 No. 5, pp. 210-217.
Yeo, V.C.S., Goh, S.-K., Rezaei, S., (2017), “Consumer experiences, attitude and behavioral intention toward online food delivery (OFD) service”, J. Retail. Consum. Serv. pp. 150–162.
Zhang, Y., Baghirov, F., Hashim, H., Murphy, J., (2016), “Gender and instagram hashtags : A study of #malaysianfood”. In: Proceedings of the ‘eTourism: Empowering Places’, ENTER’16.
89
“FROM OWNING TO RENTING THROUGH RENTAL‐COMMERCE WEBSITES”
Anne Fota, Katja Wagner, Hanna Schramm-Klein(University of Siegen)
Ownership and non-ownership can be perceived as both an advantage or as a disadvantage by consumers. Looking at the literature, it can be stated that there are opposing theoretical approaches, e.g. the property rights theory as well as the theory of perceived ownership and the endowment effect that show the varying relevance of ownership for consumers. With a view to current consumer studies, especially the sharing model of rental-commerce, i.e. renting products from website retailers, has recently become increasingly popular among both companies and consumers. When engaging in rental-commerce, consumers pay a contractually-agreed price for the duration of use monthly and can then use the product to its full extent without owning the proprietary rights of the product. The participation in rental-commerce is here used to explain and investigate the idea and feelings of ownership, so that this study is intended to provide information on when consumers can do without own possession and which determinants play a role in the decision making process to use products temporarily rather than to own them.

90
“USING NLP TO INVESTIGATE CONSUMERS’ EXPECTATIONS REGARDING FOOD RETAIL”
Yolande Piris (University Bretagne Sud – LEGO)Anne-Cécile Gay (University Bretagne Sud Foundation)
Purpose
This study investigates the changes in consumers’ expectations regarding the players in the food distribution sector using the data collected on a citizen consultation platform regarding the issue of "Eating better".
Design/methodology/approach
Nearly 6,000 propositions were examined using natural language processing methods based upon machine learning and deep learning.
Findings
Results indicate that consumers take an increasingly critical look at the sector and make demands that go beyond the sector core business. Consumers expect retailers to be more than just intermediaries, use their power, and commit to the great societal causes. The issue of digital technology is absent in this context.
Research limitations/implications
The data collected are focused upon one question only, "How do we eat better?” This framework draws attention to the various spheres consumers operate in, but a more general enquiry regarding the future of the distribution sector could unveil knowledge about other issues.
Practical implications
The managerial implications relate to the issue of consumer satisfaction. At a time when retailers find it difficult to generate growth, the findings provide another view of the direction retailers could take to renew their offering. Digital technology may be a powerful support for retailers' actions, but it is not an end.
Originality/value
The originality lies in the nature of the data used and the processing methods. Citizens, rather than consumers, are addressed. The study uses the techniques of machine learning and deep learning that enable a finer-grained analysis of large volumes of data and produce generalizable results.
91
“USING NLP TO INVESTIGATE CONSUMERS’ EXPECTATIONS REGARDING FOOD RETAIL”
Purpose
This study investigates the changes in consumers’ expectations regarding the players in the food distribution sector using the data collected on a citizen consultation platform regarding the issue of "Eating better".
Design/methodology/approach
Nearly 6,000 propositions were examined using natural language processing methods based upon machine learning and deep learning.
Findings
Results indicate that consumers take an increasingly critical look at the sector and make demands that go beyond the sector core business. Consumers expect retailers to be more than just intermediaries, use their power, and commit to the great societal causes. The issue of digital technology is absent in this context.
Research limitations/implications
The data collected are focused upon one question only, "How do we eat better?” This framework draws attention to the various spheres consumers operate in, but a more general enquiry regarding the future of the distribution sector could unveil knowledge about other issues.
Practical implications
The managerial implications relate to the issue of consumer satisfaction. At a time when retailers find it difficult to generate growth, the findings provide another view of the direction retailers could take to renew their offering. Digital technology may be a powerful support for retailers' actions, but it is not an end.
Originality/value
The originality lies in the nature of the data used and the processing methods. Citizens, rather than consumers, are addressed. The study uses the techniques of machine learning and deep learning that enable a finer-grained analysis of large volumes of data and produce generalizable results.
1
ONLINE BEHAVIORAL ADVERTISING:BENEFITS AND RISKS OF DATA-DRIVEN DIGITAL ADVERTISING
Simone AiolfiPh.D. Adjunct Professor
Department of Economics and Business Management, University of Parma, Via J.F. Kennedy 6 – Parma - 43125, Phone number: +390521902479
e-mail: [email protected] (corresponding author)
Silvia BelliniAssociate Professor
Department of Economics and Business Management, University of Parma, Via J.F. Kennedy 6 – Parma - 43125, Phone number: +390521032416
e-mail: [email protected]
IntroductionTechnology allows firms to target consumers based on their general interests thanks to theanalysis of the editorial content of the web page on which the ad would be displayed (Goldfarb and Tucker, 2011). Furthermore, recent developments in online tracking and profiling technologies allows the targeting and personalization process in real time while a user browses the Internet (Moore et al., 2015; Sinclair, 2016).
Thus, to personalize and target advertisements firms can use data collected through the online behaviour of users. Researchers identify this phenomenon as the so called Online Behavioral Advertising (OBA). In literature, there are several definitions of OBA, but all of them identified two common characteristics: the monitoring and tracking of consumer online behavior and the use of data collected to target ads (Boerman et al., 2017; Varnali, 2019).
In a nutshell, this type of advertising is based on tracking users in order to make insightsabout their potential interests and convey relevant and personalized advertisements relatedboth to the preferences of the users and their online behavior.
The theoretical background of OBA research is highly fragmented. The most used theories,that focus on the antecedents and mediation variables of the OBA, refer to the persuasion knowledge model (Van Noort et al., 2013; Ham and Nelson, 2016), the psychological reactance theory (Tucker, 2014; Aguirre et al., 2015; Bleier and Eisenbeiss, 2015a and 2015b), the privacy calculus theory (Gironde and Korgaonkar, 2018); the theory of uses and gratifications (Sutanto et al., 2013; Ozcelik and Varnali, 2019) and the information boundary theory (Sutanto et al., 2013).
Many studies focus on the effects of the OBA and how to measures acceptance and resistance to the OBA (McDonald and Cranor, 2010; Ur et al., 2012: Smit et al., 2014; Boerman et al., 2017), but the perceptions about the OBA seem to be divergent. On the consumers’ perspective, some researches seem to see benefits in online targeted ads (McDonald and
92
2
Cranor, 2010; Ur et al., 2012), while most seem to be skeptical, finding this techniqueinvasive especially as far as individual’s privacy (Ur et al., 2012; Smit et al., 2014).
Literature state that the OBA is characterized by a continuous contrast between benefits and risks. The OBA makes advertisements more relevant to consumers who, seeing a relevant and personalized ad for them, are less likely to avoid the advertising. Conversely, individuals consider the collection and use of personal data as an invasive tactic that leads to the rise of negative perceptions namely in terms of the loss of privacy (Moore et al., 2015; Phelan et al., 2016; Summers et al., 2016; Varnali, 2019). Specifically, the lack of control over personal data and the loss of privacy are considered the main concerns on the acceptance and effectiveness of the OBA (Turow et al., 2009; McDonald and Cranor, 2010; Baek and Morimoto, 2012; Ur et al., 2012; Lambrecht and Tucker, 2013; Van Doorn and Hoekstra, 2013; Yang, 2013; Smit et al., 2014; Lee et al., 2015; Moore et al., 2015).
According to ethical problems in marketing studied by the acquisition-transaction theory (Baek and Morimoto, 2012), the likelihood of a consumer purchasing a product or service depends on the comparison between perceived benefits and perceived risks and costs (Baek and Morimoto, 2012). Therefore, it becomes crucial to understand how and in which measure consumers value both the benefits of the OBA (relevance, credibility, perceived usefulness) and its costs (privacy concerns) in order to accept or avoid the OBA. Consequently the acceptance or the avoidance of the OBA will affect consumer’s’ actual purchasing behavior.
PurposeThe research aims to investigate how individuals can be persuaded to purchase a product or service through repeated and personalized messages. Specifically, the study aims to identify the potential contents able to provide value for individuals, and therefore capable of influencing them. Thus, it may result in a behavioural intention to purchase the products communicated through the online behavioural advertising. In addition, the research focuses on the role of privacy concerns in terms of affecting avoidance or adoption of this new type of advertising.
Finally, the end purpose of our work is to come out with a structural equation model, whichcan help researchers and practitioners to better understand shopping behavior in the online retailing setting as far as the potential benefits and risks of the online behavioral and data-driven digital advertising.
Conceptual frameworkOur conceptual framework bases on the following hypothesis (see Figure 1):
H1: The higher the level of relevance of the OBA, the higher the level of acceptance of the OBA.
H2: The higher the level of credibility of the OBA, the higher the level of acceptance of the OBA.
H3: The higher the level of perceived usefulness of the OBA, the higher the level of acceptance of the OBA.
H4: The higher the level of privacy concerns about the OBA, the higher the level of avoidanceof the OBA.
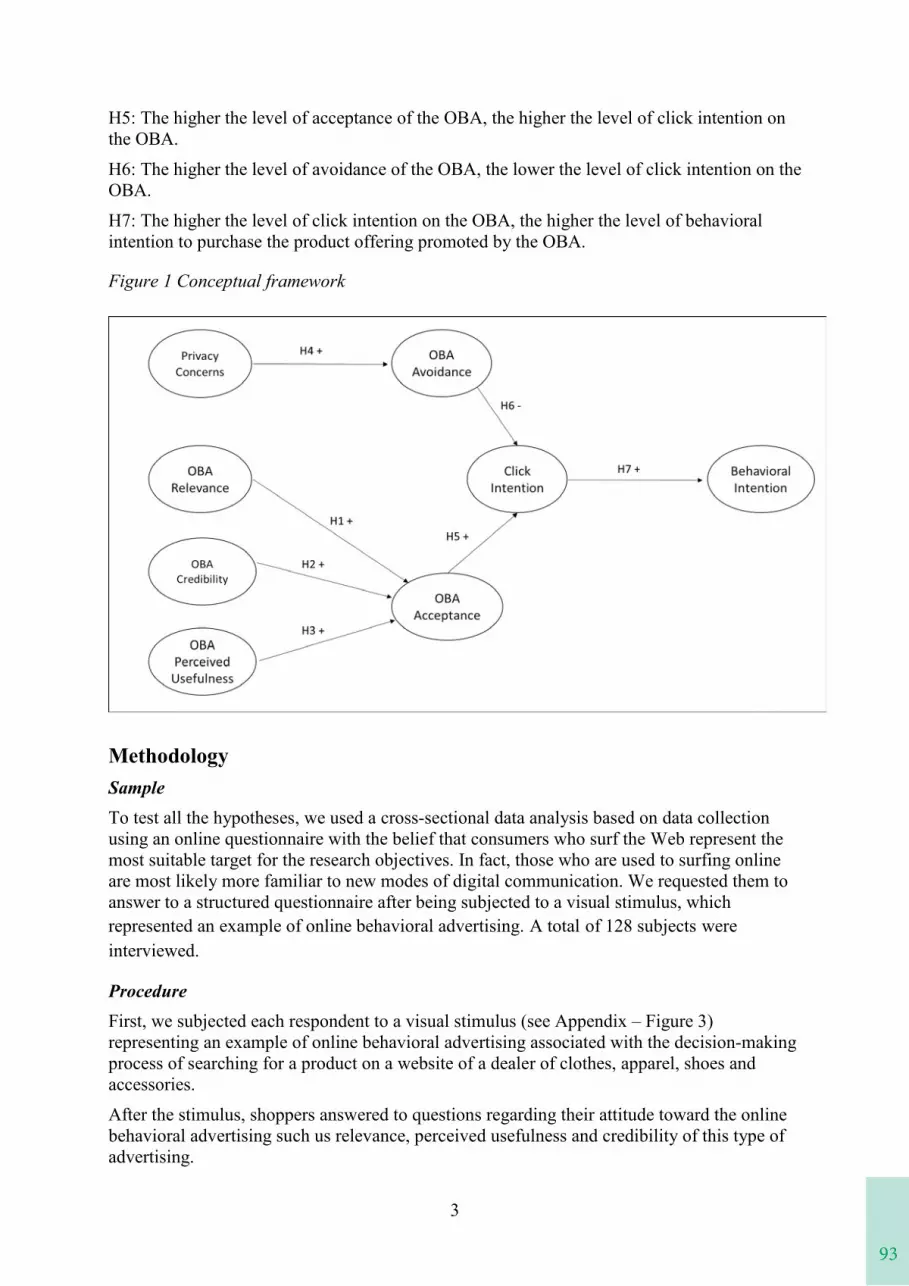
93
2
Cranor, 2010; Ur et al., 2012), while most seem to be skeptical, finding this techniqueinvasive especially as far as individual’s privacy (Ur et al., 2012; Smit et al., 2014).
Literature state that the OBA is characterized by a continuous contrast between benefits and risks. The OBA makes advertisements more relevant to consumers who, seeing a relevant and personalized ad for them, are less likely to avoid the advertising. Conversely, individuals consider the collection and use of personal data as an invasive tactic that leads to the rise of negative perceptions namely in terms of the loss of privacy (Moore et al., 2015; Phelan et al., 2016; Summers et al., 2016; Varnali, 2019). Specifically, the lack of control over personal data and the loss of privacy are considered the main concerns on the acceptance and effectiveness of the OBA (Turow et al., 2009; McDonald and Cranor, 2010; Baek and Morimoto, 2012; Ur et al., 2012; Lambrecht and Tucker, 2013; Van Doorn and Hoekstra, 2013; Yang, 2013; Smit et al., 2014; Lee et al., 2015; Moore et al., 2015).
According to ethical problems in marketing studied by the acquisition-transaction theory (Baek and Morimoto, 2012), the likelihood of a consumer purchasing a product or service depends on the comparison between perceived benefits and perceived risks and costs (Baek and Morimoto, 2012). Therefore, it becomes crucial to understand how and in which measure consumers value both the benefits of the OBA (relevance, credibility, perceived usefulness) and its costs (privacy concerns) in order to accept or avoid the OBA. Consequently the acceptance or the avoidance of the OBA will affect consumer’s’ actual purchasing behavior.
PurposeThe research aims to investigate how individuals can be persuaded to purchase a product or service through repeated and personalized messages. Specifically, the study aims to identify the potential contents able to provide value for individuals, and therefore capable of influencing them. Thus, it may result in a behavioural intention to purchase the products communicated through the online behavioural advertising. In addition, the research focuses on the role of privacy concerns in terms of affecting avoidance or adoption of this new type of advertising.
Finally, the end purpose of our work is to come out with a structural equation model, whichcan help researchers and practitioners to better understand shopping behavior in the online retailing setting as far as the potential benefits and risks of the online behavioral and data-driven digital advertising.
Conceptual frameworkOur conceptual framework bases on the following hypothesis (see Figure 1):
H1: The higher the level of relevance of the OBA, the higher the level of acceptance of the OBA.
H2: The higher the level of credibility of the OBA, the higher the level of acceptance of the OBA.
H3: The higher the level of perceived usefulness of the OBA, the higher the level of acceptance of the OBA.
H4: The higher the level of privacy concerns about the OBA, the higher the level of avoidanceof the OBA.
3
H5: The higher the level of acceptance of the OBA, the higher the level of click intention onthe OBA.
H6: The higher the level of avoidance of the OBA, the lower the level of click intention on the OBA.
H7: The higher the level of click intention on the OBA, the higher the level of behavioral intention to purchase the product offering promoted by the OBA.
MethodologySampleTo test all the hypotheses, we used a cross-sectional data analysis based on data collection using an online questionnaire with the belief that consumers who surf the Web represent the most suitable target for the research objectives. In fact, those who are used to surfing online are most likely more familiar to new modes of digital communication. We requested them to answer to a structured questionnaire after being subjected to a visual stimulus, which represented an example of online behavioral advertising. A total of 128 subjects were interviewed.
ProcedureFirst, we subjected each respondent to a visual stimulus (see Appendix – Figure 3)representing an example of online behavioral advertising associated with the decision-making process of searching for a product on a website of a dealer of clothes, apparel, shoes and accessories.
After the stimulus, shoppers answered to questions regarding their attitude toward the online behavioral advertising such us relevance, perceived usefulness and credibility of this type of advertising.
Figure 1 Conceptual framework
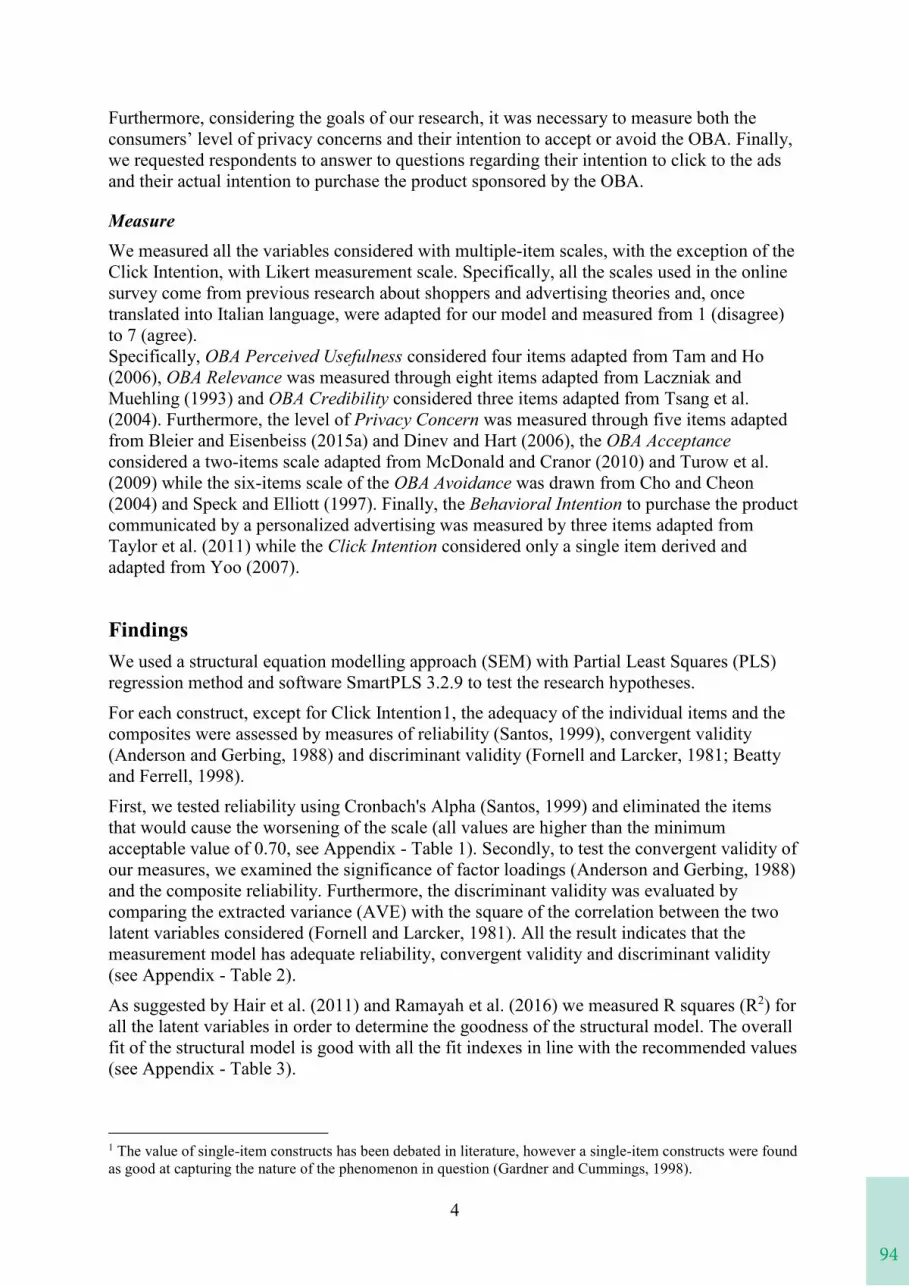
94
4
Furthermore, considering the goals of our research, it was necessary to measure both the consumers’ level of privacy concerns and their intention to accept or avoid the OBA. Finally, we requested respondents to answer to questions regarding their intention to click to the ads and their actual intention to purchase the product sponsored by the OBA.
MeasureWe measured all the variables considered with multiple-item scales, with the exception of the Click Intention, with Likert measurement scale. Specifically, all the scales used in the online survey come from previous research about shoppers and advertising theories and, once translated into Italian language, were adapted for our model and measured from 1 (disagree) to 7 (agree).Specifically, OBA Perceived Usefulness considered four items adapted from Tam and Ho (2006), OBA Relevance was measured through eight items adapted from Laczniak and Muehling (1993) and OBA Credibility considered three items adapted from Tsang et al. (2004). Furthermore, the level of Privacy Concern was measured through five items adapted from Bleier and Eisenbeiss (2015a) and Dinev and Hart (2006), the OBA Acceptanceconsidered a two-items scale adapted from McDonald and Cranor (2010) and Turow et al. (2009) while the six-items scale of the OBA Avoidance was drawn from Cho and Cheon (2004) and Speck and Elliott (1997). Finally, the Behavioral Intention to purchase the product communicated by a personalized advertising was measured by three items adapted from Taylor et al. (2011) while the Click Intention considered only a single item derived and adapted from Yoo (2007).
FindingsWe used a structural equation modelling approach (SEM) with Partial Least Squares (PLS) regression method and software SmartPLS 3.2.9 to test the research hypotheses.
For each construct, except for Click Intention1, the adequacy of the individual items and the composites were assessed by measures of reliability (Santos, 1999), convergent validity (Anderson and Gerbing, 1988) and discriminant validity (Fornell and Larcker, 1981; Beatty and Ferrell, 1998).
First, we tested reliability using Cronbach's Alpha (Santos, 1999) and eliminated the items that would cause the worsening of the scale (all values are higher than the minimum acceptable value of 0.70, see Appendix - Table 1). Secondly, to test the convergent validity of our measures, we examined the significance of factor loadings (Anderson and Gerbing, 1988)and the composite reliability. Furthermore, the discriminant validity was evaluated by comparing the extracted variance (AVE) with the square of the correlation between the two latent variables considered (Fornell and Larcker, 1981). All the result indicates that the measurement model has adequate reliability, convergent validity and discriminant validity(see Appendix - Table 2).
As suggested by Hair et al. (2011) and Ramayah et al. (2016) we measured R squares (R2) for all the latent variables in order to determine the goodness of the structural model. The overall fit of the structural model is good with all the fit indexes in line with the recommended values(see Appendix - Table 3).
1 The value of single-item constructs has been debated in literature, however a single-item constructs were found as good at capturing the nature of the phenomenon in question (Gardner and Cummings, 1998).
95
4
Furthermore, considering the goals of our research, it was necessary to measure both the consumers’ level of privacy concerns and their intention to accept or avoid the OBA. Finally, we requested respondents to answer to questions regarding their intention to click to the ads and their actual intention to purchase the product sponsored by the OBA.
MeasureWe measured all the variables considered with multiple-item scales, with the exception of the Click Intention, with Likert measurement scale. Specifically, all the scales used in the online survey come from previous research about shoppers and advertising theories and, once translated into Italian language, were adapted for our model and measured from 1 (disagree) to 7 (agree).Specifically, OBA Perceived Usefulness considered four items adapted from Tam and Ho (2006), OBA Relevance was measured through eight items adapted from Laczniak and Muehling (1993) and OBA Credibility considered three items adapted from Tsang et al. (2004). Furthermore, the level of Privacy Concern was measured through five items adapted from Bleier and Eisenbeiss (2015a) and Dinev and Hart (2006), the OBA Acceptanceconsidered a two-items scale adapted from McDonald and Cranor (2010) and Turow et al. (2009) while the six-items scale of the OBA Avoidance was drawn from Cho and Cheon (2004) and Speck and Elliott (1997). Finally, the Behavioral Intention to purchase the product communicated by a personalized advertising was measured by three items adapted from Taylor et al. (2011) while the Click Intention considered only a single item derived and adapted from Yoo (2007).
FindingsWe used a structural equation modelling approach (SEM) with Partial Least Squares (PLS) regression method and software SmartPLS 3.2.9 to test the research hypotheses.
For each construct, except for Click Intention1, the adequacy of the individual items and the composites were assessed by measures of reliability (Santos, 1999), convergent validity (Anderson and Gerbing, 1988) and discriminant validity (Fornell and Larcker, 1981; Beatty and Ferrell, 1998).
First, we tested reliability using Cronbach's Alpha (Santos, 1999) and eliminated the items that would cause the worsening of the scale (all values are higher than the minimum acceptable value of 0.70, see Appendix - Table 1). Secondly, to test the convergent validity of our measures, we examined the significance of factor loadings (Anderson and Gerbing, 1988)and the composite reliability. Furthermore, the discriminant validity was evaluated by comparing the extracted variance (AVE) with the square of the correlation between the two latent variables considered (Fornell and Larcker, 1981). All the result indicates that the measurement model has adequate reliability, convergent validity and discriminant validity(see Appendix - Table 2).
As suggested by Hair et al. (2011) and Ramayah et al. (2016) we measured R squares (R2) for all the latent variables in order to determine the goodness of the structural model. The overall fit of the structural model is good with all the fit indexes in line with the recommended values(see Appendix - Table 3).
1 The value of single-item constructs has been debated in literature, however a single-item constructs were found as good at capturing the nature of the phenomenon in question (Gardner and Cummings, 1998).
5
The results of the path analysis are shown in Figure 2 with all the path coefficients (intensity and direction of relations) and the significance (t-value) for each of them.
Discussion of the resultsResults allow us to support the majority of our hypothesis, except for H3 and H6 (see Appendix - Table 4). Specifically, the final SEM allows us to confirm the evidence of a positive and direct effect of the relevance (H1) and the credibility (H2) of the contents promoted by the OBA on the acceptance of the personalized advertising. This results in a more click intention rate (H5) and consequently in a positive behavioral intention in terms of actual purchase behavior (H7). In addition, the model confirms how the consumers’ privacy concerns about data-driven advertising positively affect the intention to avoid the adoption of OBA (H4) resulting in a lower level of click intention rate (H6). Despite the negative effect of OBA Avoidance on Click Intention, this ultimate relationship is not statistical significant. One possible justification might come from the Privacy Paradox: although people say they care about their privacy and are not willing to share their information, actually they give their data in exchange for small benefits or for convenience (Norberg et al., 2007). Therefore, although people say they are opposed to the OBA because of privacy risks, people express the opposite and click on the advertising.
Note: **: p-value<0.001; *: p-value<0.01; ns: p-value>0.05
Contributions and ImplicationsOur research may contribute to advance the state of knowledge about personalized and data-driven digital advertising and its application in the new online retail environment. Prior research came up with theoretical frameworks that explain antecedents of OBA focusing only on ethical issues in marketing (Boerman et al., 2017) or only on the effectiveness of a single OBA campaign or how to create a successful advertising campaign (Varnali, 2019).
Figure 2 Structural Model
96
6
Literature identifies factors controlled by advertisers and factors controlled by consumers in order to create comprehensive theoretical frameworks of the effectiveness of the OBA. However, besides being complex models, no study focuses on the intended or actual behaviour of shoppers. Specifically, any research apply a structural equation modelingapproach in order to identify the antecedents of the actual behaviour of individuals in terms of actual purchases of products or services promoted by OBA.
Filling the gap in the existing literature, the research, through a SEM approach, seeks to build up a simplified model that considers both the benefits (relevance, credibility and perceived usefulness of personalized online behavioural advertising) and the risks (privacy and ethical concerns) of the OBA.
According to prior studies, our research demonstrates how OBA is a controversial type of advertising. In fact, it activates opposing reactions on consumers’ perspective: relevance and credibility on the one hand and concerns and intrusiveness on the other. Acceptance of the OBA is positively related to the relevance and the credibility of the personalized advertisements, intended as the reliability and capability of the OBA of being a significant guide into the purchasing process while the intention to avoid personalized ads is strictly related to the concerns for privacy. Consequently, acceptance and avoidance of OBA affected (positively and negatively respectively) the intention of clicks and the behavioral intention that are decisive in the success of the personalized advertising.
As far as the negative effect of the OBA, concern for privacy is one of the central problems for the digital advertising industry. Due to its privacy implications, the OBA will soon enter the political agenda of several states. Despite these negative effects, personalized advertising seems to be the future of advertising.
The Internet and new media have changed individuals' habits and the way they use advertising messages, revolutionizing the way companies invest, promote and define measurement metrics.
The research should help advertisers consider the level of ad personalization since ads perceived as too personal could be seen as too intrusive and, consequently, lead to lower click and purchase rates. Consumers, indeed, will tend to accept OBA only if the benefits outweigh the costs in terms of loss of privacy. In addition, retailers should be more transparent, benefiting from open communication in the collection and use of data in order to personalize the advertising.
Research limitations and outlookSome limitations are associated with the online survey and respondents may have been influenced by the presence of the visual stimulus and then distorted the answers in order to accomplish the research. Another concern is about the generalizability. Our sample, interviewed online, is probably neither truly random nor necessarily representative of any larger population.
For future research, we intend to enlarge the sample and investigate the phenomenon through experimental approach in order to understand the actual shopping behaviour in a simulated laboratory.
97
6
Literature identifies factors controlled by advertisers and factors controlled by consumers in order to create comprehensive theoretical frameworks of the effectiveness of the OBA. However, besides being complex models, no study focuses on the intended or actual behaviour of shoppers. Specifically, any research apply a structural equation modelingapproach in order to identify the antecedents of the actual behaviour of individuals in terms of actual purchases of products or services promoted by OBA.
Filling the gap in the existing literature, the research, through a SEM approach, seeks to build up a simplified model that considers both the benefits (relevance, credibility and perceived usefulness of personalized online behavioural advertising) and the risks (privacy and ethical concerns) of the OBA.
According to prior studies, our research demonstrates how OBA is a controversial type of advertising. In fact, it activates opposing reactions on consumers’ perspective: relevance and credibility on the one hand and concerns and intrusiveness on the other. Acceptance of the OBA is positively related to the relevance and the credibility of the personalized advertisements, intended as the reliability and capability of the OBA of being a significant guide into the purchasing process while the intention to avoid personalized ads is strictly related to the concerns for privacy. Consequently, acceptance and avoidance of OBA affected (positively and negatively respectively) the intention of clicks and the behavioral intention that are decisive in the success of the personalized advertising.
As far as the negative effect of the OBA, concern for privacy is one of the central problems for the digital advertising industry. Due to its privacy implications, the OBA will soon enter the political agenda of several states. Despite these negative effects, personalized advertising seems to be the future of advertising.
The Internet and new media have changed individuals' habits and the way they use advertising messages, revolutionizing the way companies invest, promote and define measurement metrics.
The research should help advertisers consider the level of ad personalization since ads perceived as too personal could be seen as too intrusive and, consequently, lead to lower click and purchase rates. Consumers, indeed, will tend to accept OBA only if the benefits outweigh the costs in terms of loss of privacy. In addition, retailers should be more transparent, benefiting from open communication in the collection and use of data in order to personalize the advertising.
Research limitations and outlookSome limitations are associated with the online survey and respondents may have been influenced by the presence of the visual stimulus and then distorted the answers in order to accomplish the research. Another concern is about the generalizability. Our sample, interviewed online, is probably neither truly random nor necessarily representative of any larger population.
For future research, we intend to enlarge the sample and investigate the phenomenon through experimental approach in order to understand the actual shopping behaviour in a simulated laboratory.
7
ReferencesAbdi, H. (2007), “Partial least square regression” In: Neil Salkind (Ed.), Encyclopedia of Measurement and Statistics, Thousand Oaks (CA): Sage.
Aguirre E., Mahr D., Grewal D., De Ruyter K. and Wetzels M. (2015), “Unraveling the personalization paradox: the effect of information collection and trust-building strategies on online advertisement effectiveness”, Journal of Retailing, Vol. 91 No. 1, pp. 34–49.
Anderson, J.C. and Gerbing, D.W. (1988), “Structural equation modeling in practice: a review and recommended two-step approach”, Psychological Bulletin, Vol. 103 No. 3, pp. 411-423.
Baek, T. H. and Morimoto, M. (2012), “Stay away from me: examining the determinants of consumer avoidance of personalized advertising”, Journal of Advertising, Vol. 41 No. 1, pp.59–76.
Barclay, D., Higgins, C. and Thompson R. (1995), "The partial least squares (PLS) approach to causal modeling: Personal computer adoption and use as an illustration", Technology Studies, Vol. 2 No. 2, pp. 285–309.
Beatty, S. and Ferrell, E. (1998), “Impulse buying: modeling its precursors”, Journal of Retailing, Vol. 74 No. 2, pp. 169-191. http://dx.doi.org/10.1016/s0022-4359(99)80092-x.
Bleier, A. and Eisenbeiss, M. (2015a), “The importance of trust for personalized online advertising”, Journal of Retailing, Vol. 91 No. 3, pp. 390–409.
Bleier, A. and Eisenbeiss, M. (2015b), “Personalized online advertising effectiveness: the interplay of what, when, and where”, Marketing Science, Vol. 34, pp. 669–688.
Boerman, S. C., Kruikemeier, S. and Zuiderveen Borgesius, F.J. (2017), “Online behavioral advertising: a literature review and research agenda”, Journal of Advertising, Vol. 46 No. 3,pp. 363-376.
Cho, C. H. and Cheon, H. J. (2004), “Why do people avoid advertising on the internet?”,Journal of Advertising, Vol. 33 No. 4, pp. 89-97.
Dinev, T. and Hart, P. (2006), “Internet privacy concerns and social awareness as determinants of intention to transact”, International Journal of Electronic Commerce, Vol. 10No. 2, pp. 7–29.
eMarketer, Digital Ad Spending 2019 Global (2019), https://www.emarketer.com/content/global-digital-ad-spending-2019
Esposito Vinzi, V., Chin, W.W., Henseler, J. and Wang, H. (2010), Handbook of Partial Least Squares Concepts, Methods and Applications, Series: Springer Handbooks of Computational Statistics, Springer.
Fornell, C. and Larcker, D.F. (1981), "Evaluating structural equation models with unob-servable variables and measurement error", Journal of Marketing Research, Vol. 18 No. 2, pp. 39-50.
98
8
Fornell, C., and Bookstein, F. L. (1982), “Two structural equation models: LISREL and PLS applied to consumer exit-voice theory”, Journal of Marketing Research, Vol. 19, pp. 440–452.
Gardner, D.G. and Cummings, L.L. (1998), “Single-item versus multiple-item measurement scales: an empirical comparison”, Educational and Psychological Measurement, Vol. 58 No. 6, pp. 898-915.
Gefen, D., Straub, D. and Boudreau, M. C. (2000), “Structural equation modeling techniques and regression: guidelines for research practice”, Communications of the AIS, Vol. 1 No. 7,pp. 1-78.
Gironda, J. T. and Korgaonkar, P. K. (2018), “iSpy? tailored versus invasive ads and consumers’ perceptions of personalized advertising”, Electronic Commerce Research & Applications, Vol. 29, pp. 64–77.
Goldfarb, A. and Tucker, C. E. (2011), “Online display advertising: targeting and obtrusiveness”, Marketing Science, Vol. 30, pp. 389–404.
Hair, J.F., Ringle, C.M. and Sarstedt, M. (2011), “PLS-SEM: indeed a silver bullet”, Journal of Marketing Theory Practice, Vol. 19 No. 2, pp. 139-152.
Ham, C. D. and Nelson, M.R. (2016), “The role of persuasion knowledge, assessment of benefit and harm, and third-person perception in coping with online behavioral advertising”,Computers in Human Behavior, Vol. 62, pp. 689–702.
Laczniak, R. N. and Muehling, D. D. (1993), “The relationship between experimental manipulations and tests of theory in an advertising message involvement context”, Journal of Advertising, Vol. 22 No. 3, pp. 59–74.
Lambrecht, A. and Tucker, C. (2013), “When does retargeting work? Information specificity in online advertising”, Journal of Marketing Research, Vol. 50 No. 5, pp. 561–76.
Lee, S., Lee, Y., Lee, J. and Park, J. (2015), “Personalized e-services: consumer privacy concern and information sharing”, Social Behavior and Personality: An International Journal, Vol. 43 No. 5, pp. 729–40.
Mardegan, P., Riva, G. and Scatena, S. F. (2016), Digital advertising 3.0. Il futuro della pubblicità digitale, Maggioli Editore, Milano
McDonald, A. M. and Cranor, L. F. (2010), “Beliefs and behaviors: internet users’ understanding of behavioral advertising,” TPRC 2010, http://aleecia.com/authors-drafts/tprc-behav-AV.pdf.
Moore, R. S., Moore, M. L., Shanahan, K. J. and Mack, B. (2015), “Creepy marketing: three dimensions of perceived excessive online privacy violation”, Marketing Management Vol. 25,pp. 42–53.
Osservatori.net, (2019), Il mercato dei media digitali: quanto vale e come evolve, https://blog.osservatori.net/it_it/mercato-media-digitali
99
8
Fornell, C., and Bookstein, F. L. (1982), “Two structural equation models: LISREL and PLS applied to consumer exit-voice theory”, Journal of Marketing Research, Vol. 19, pp. 440–452.
Gardner, D.G. and Cummings, L.L. (1998), “Single-item versus multiple-item measurement scales: an empirical comparison”, Educational and Psychological Measurement, Vol. 58 No. 6, pp. 898-915.
Gefen, D., Straub, D. and Boudreau, M. C. (2000), “Structural equation modeling techniques and regression: guidelines for research practice”, Communications of the AIS, Vol. 1 No. 7,pp. 1-78.
Gironda, J. T. and Korgaonkar, P. K. (2018), “iSpy? tailored versus invasive ads and consumers’ perceptions of personalized advertising”, Electronic Commerce Research & Applications, Vol. 29, pp. 64–77.
Goldfarb, A. and Tucker, C. E. (2011), “Online display advertising: targeting and obtrusiveness”, Marketing Science, Vol. 30, pp. 389–404.
Hair, J.F., Ringle, C.M. and Sarstedt, M. (2011), “PLS-SEM: indeed a silver bullet”, Journal of Marketing Theory Practice, Vol. 19 No. 2, pp. 139-152.
Ham, C. D. and Nelson, M.R. (2016), “The role of persuasion knowledge, assessment of benefit and harm, and third-person perception in coping with online behavioral advertising”,Computers in Human Behavior, Vol. 62, pp. 689–702.
Laczniak, R. N. and Muehling, D. D. (1993), “The relationship between experimental manipulations and tests of theory in an advertising message involvement context”, Journal of Advertising, Vol. 22 No. 3, pp. 59–74.
Lambrecht, A. and Tucker, C. (2013), “When does retargeting work? Information specificity in online advertising”, Journal of Marketing Research, Vol. 50 No. 5, pp. 561–76.
Lee, S., Lee, Y., Lee, J. and Park, J. (2015), “Personalized e-services: consumer privacy concern and information sharing”, Social Behavior and Personality: An International Journal, Vol. 43 No. 5, pp. 729–40.
Mardegan, P., Riva, G. and Scatena, S. F. (2016), Digital advertising 3.0. Il futuro della pubblicità digitale, Maggioli Editore, Milano
McDonald, A. M. and Cranor, L. F. (2010), “Beliefs and behaviors: internet users’ understanding of behavioral advertising,” TPRC 2010, http://aleecia.com/authors-drafts/tprc-behav-AV.pdf.
Moore, R. S., Moore, M. L., Shanahan, K. J. and Mack, B. (2015), “Creepy marketing: three dimensions of perceived excessive online privacy violation”, Marketing Management Vol. 25,pp. 42–53.
Osservatori.net, (2019), Il mercato dei media digitali: quanto vale e come evolve, https://blog.osservatori.net/it_it/mercato-media-digitali
9
Ozcelik, A. B. and Varnali, K. (2019), “Effectiveness of online behavioral targeting: a psychological perspective”, Electronic Commerce Research & Applications, Vol. 33, pp. 1–11.
Phelan, C., Lampe, C. and Resnick, P. (2016), “It’s Creepy, but it doesn’t bother me,” Proceedings of the 2016 CHI Conference on Human Factors in Computing Systems, New York: Association for Computing Machinery, 5240–51.
Ramayah, T., Ling, N.S., Taghizadeh, S.K. and Rahman, S.A. (2016), “Factors influencing SMEs website continuance intention inMalaysia”, Telematics and Informatics, Vol. 33 No. 1, pp. 150-164.
Santos, J.R.A. (1999), “Cronbach's alpha: a tool for assessing the reliability of scales”, Journal of Extention, Vol. 37, No. 2, pp. 1-5.
Sinclair, J. (2016), “Advertising and media in the age of the algorithm”, International Journal of Communication, Vol. 10, pp. 3522–3535.
Smit, E. G., Van Noort, G. and Voorveld, H.A. (2014), “Understanding online behavioural advertising: user knowledge, privacy concerns, and online coping behaviour in Europe”,Computers in Human Behavior, Vol. 32, pp. 15–22.
Speck, P. S. and Elliott, M. T. (1997), “Predictors of advertising avoidance in print and broadcast media”, Journal of Advertising, Vol. 26 No. 3, pp. 61-76.
Summers, C. A., Smith, R. W. and Reczek, R. W. (2016), “An audience of one: behaviorally targeted ads as implied social labels”, Journal of Consumer Research, Vol. 43 No. 1, pp. 156-78.
Sutanto, J., Palme, E., Tan, C. and Phang, C. W. (2013), “Addressing the personalization–privacy paradox: an empirical assessment from a field experiment on smartphone users”, MIS Quarterly, Vol. 37 No. 4, pp. 1141–64.
Taviani, G. (2017), Retargeting: strategie di digital marketing per l'ecommerce, HOEPLI Editore.
Taylor, D.G., Lewin, J.E. and Strutton, D. (2011) “Friends, Fans, and followers: do ads work on social networks?”, Journal of Advertising Research, Vol. 51 No.1, pp. 258–275.
Tsang, M.M., Ho, S. C. and Liang, T. P. (2004), “Consumer attitudes toward mobile advertising: an empirical study”, International Journal of Electronic Commerce, Vol. 8 No. 3, pp. 65–78.
Tucker, C. E. (2014), “Social Networks, personalized advertising, and privacy controls”, Journal of Marketing Research, Vol. 51 No. 5, pp. 546–62
Turow, J., King, J., Hoofnagle, C.J, Bleakley, A. and Hennessy, M. (2009), “Americans reject tailored advertising and three activities that enable it”, Available at SSRN 1478214, http://papers.ssrn.com/sol3/papers.cfm?abstract_idD1478214.
100
10
Ur, B., Leon, P. G., Cranor, L. F., Shay, R. and Wang, Y. (2012), “Smart, useful, scary, creepy: perceptions of online behavioral advertising”, in Proceedings of the Eighth Symposium on Usable Privacy and Security, art. 4.
Van Doorn, J. and Hoekstra, J.C. (2013), “Customization of Online advertising: the role of intrusiveness”, Marketing Letters, Vol. 24 No. 4, pp. 339-5.
Van Noort, G., Smit, E.G. and Voorveld, H.A. (2013), The online behavioural advertising icon: two user studies, in Advances in Advertising Research. In Advances in Advertising Research, Vol. 4, pp. 365-378, Springer Gabler.
Varnali, K. (2019), “Online behavioral advertising: An integrative review”, Journal of Marketing Communications, pp.1-22.
Yang, H. (2013), “Young American consumers’ online privacy concerns,trust, risk, social media use, and regulatory support”, Journal of New Communications Research, Vol. 5 No. 1,pp. 1-30.
Yoo, C. Y. (2007), “Implicit memory measures for web advertising effectiveness”,Journalism & Mass Communication Quarterly, Vol. 84 No. 1, pp. 7-23.
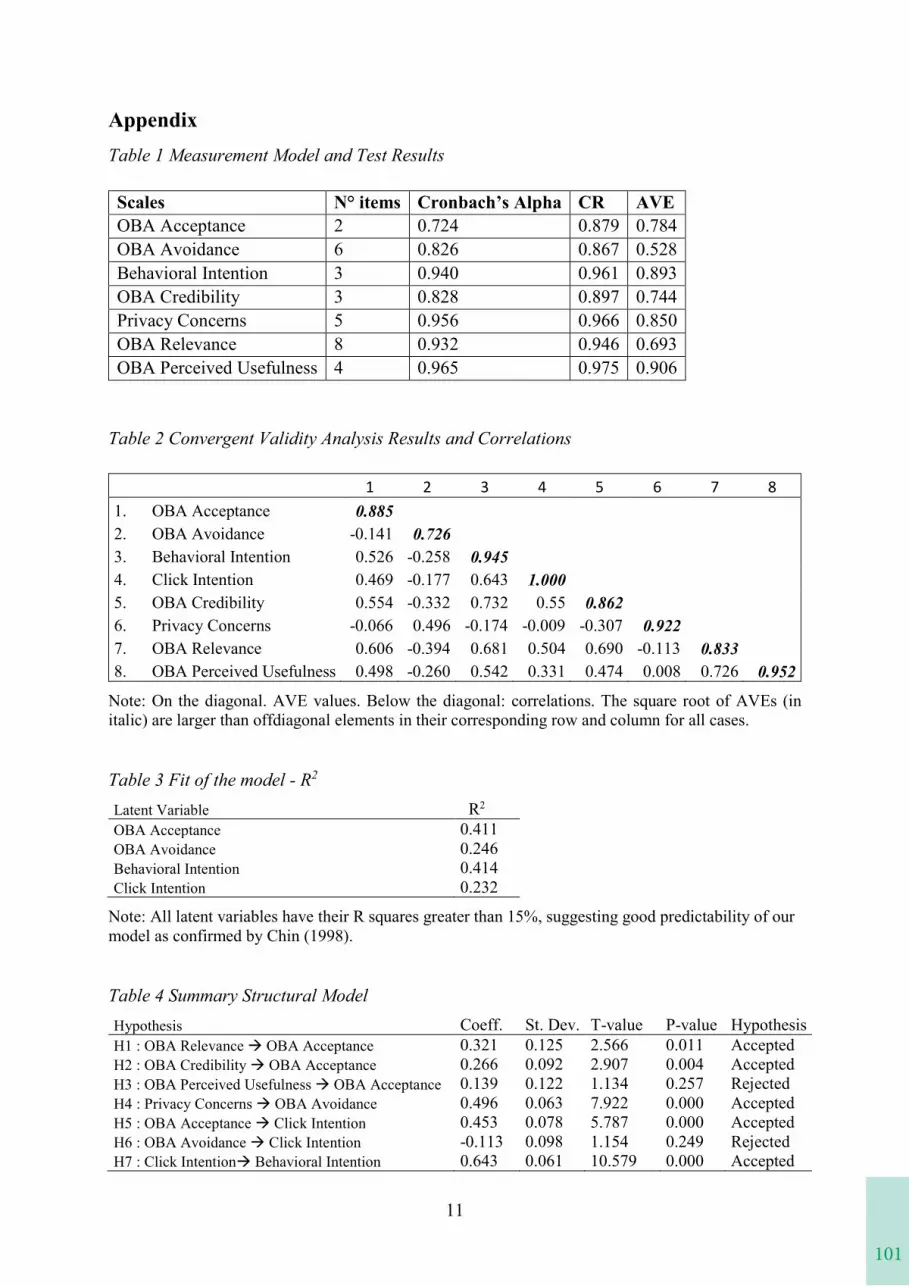
101
10
Ur, B., Leon, P. G., Cranor, L. F., Shay, R. and Wang, Y. (2012), “Smart, useful, scary, creepy: perceptions of online behavioral advertising”, in Proceedings of the Eighth Symposium on Usable Privacy and Security, art. 4.
Van Doorn, J. and Hoekstra, J.C. (2013), “Customization of Online advertising: the role of intrusiveness”, Marketing Letters, Vol. 24 No. 4, pp. 339-5.
Van Noort, G., Smit, E.G. and Voorveld, H.A. (2013), The online behavioural advertising icon: two user studies, in Advances in Advertising Research. In Advances in Advertising Research, Vol. 4, pp. 365-378, Springer Gabler.
Varnali, K. (2019), “Online behavioral advertising: An integrative review”, Journal of Marketing Communications, pp.1-22.
Yang, H. (2013), “Young American consumers’ online privacy concerns,trust, risk, social media use, and regulatory support”, Journal of New Communications Research, Vol. 5 No. 1,pp. 1-30.
Yoo, C. Y. (2007), “Implicit memory measures for web advertising effectiveness”,Journalism & Mass Communication Quarterly, Vol. 84 No. 1, pp. 7-23.
11
AppendixTable 1 Measurement Model and Test Results
Table 2 Convergent Validity Analysis Results and Correlations
Note: On the diagonal. AVE values. Below the diagonal: correlations. The square root of AVEs (in italic) are larger than offdiagonal elements in their corresponding row and column for all cases.
Table 3 Fit of the model - R2
Latent Variable R2
OBA Acceptance 0.411OBA Avoidance 0.246Behavioral Intention 0.414Click Intention 0.232
Note: All latent variables have their R squares greater than 15%, suggesting good predictability of our model as confirmed by Chin (1998).
Table 4 Summary Structural ModelHypothesis Coeff. St. Dev. T-value P-value HypothesisH1 : OBA Relevance OBA Acceptance 0.321 0.125 2.566 0.011 AcceptedH2 : OBA Credibility OBA Acceptance 0.266 0.092 2.907 0.004 AcceptedH3 : OBA Perceived Usefulness OBA Acceptance 0.139 0.122 1.134 0.257 RejectedH4 : Privacy Concerns OBA Avoidance 0.496 0.063 7.922 0.000 AcceptedH5 : OBA Acceptance Click Intention 0.453 0.078 5.787 0.000 AcceptedH6 : OBA Avoidance Click Intention -0.113 0.098 1.154 0.249 RejectedH7 : Click Intention Behavioral Intention 0.643 0.061 10.579 0.000 Accepted
Scales N° items Cronbach’s Alpha CR AVEOBA Acceptance 2 0.724 0.879 0.784OBA Avoidance 6 0.826 0.867 0.528Behavioral Intention 3 0.940 0.961 0.893OBA Credibility 3 0.828 0.897 0.744Privacy Concerns 5 0.956 0.966 0.850OBA Relevance 8 0.932 0.946 0.693OBA Perceived Usefulness 4 0.965 0.975 0.906
1 2 3 4 5 6 7 8 1. OBA Acceptance 0.8852. OBA Avoidance -0.141 0.7263. Behavioral Intention 0.526 -0.258 0.9454. Click Intention 0.469 -0.177 0.643 1.0005. OBA Credibility 0.554 -0.332 0.732 0.55 0.8626. Privacy Concerns -0.066 0.496 -0.174 -0.009 -0.307 0.9227. OBA Relevance 0.606 -0.394 0.681 0.504 0.690 -0.113 0.8338. OBA Perceived Usefulness 0.498 -0.260 0.542 0.331 0.474 0.008 0.726 0.952
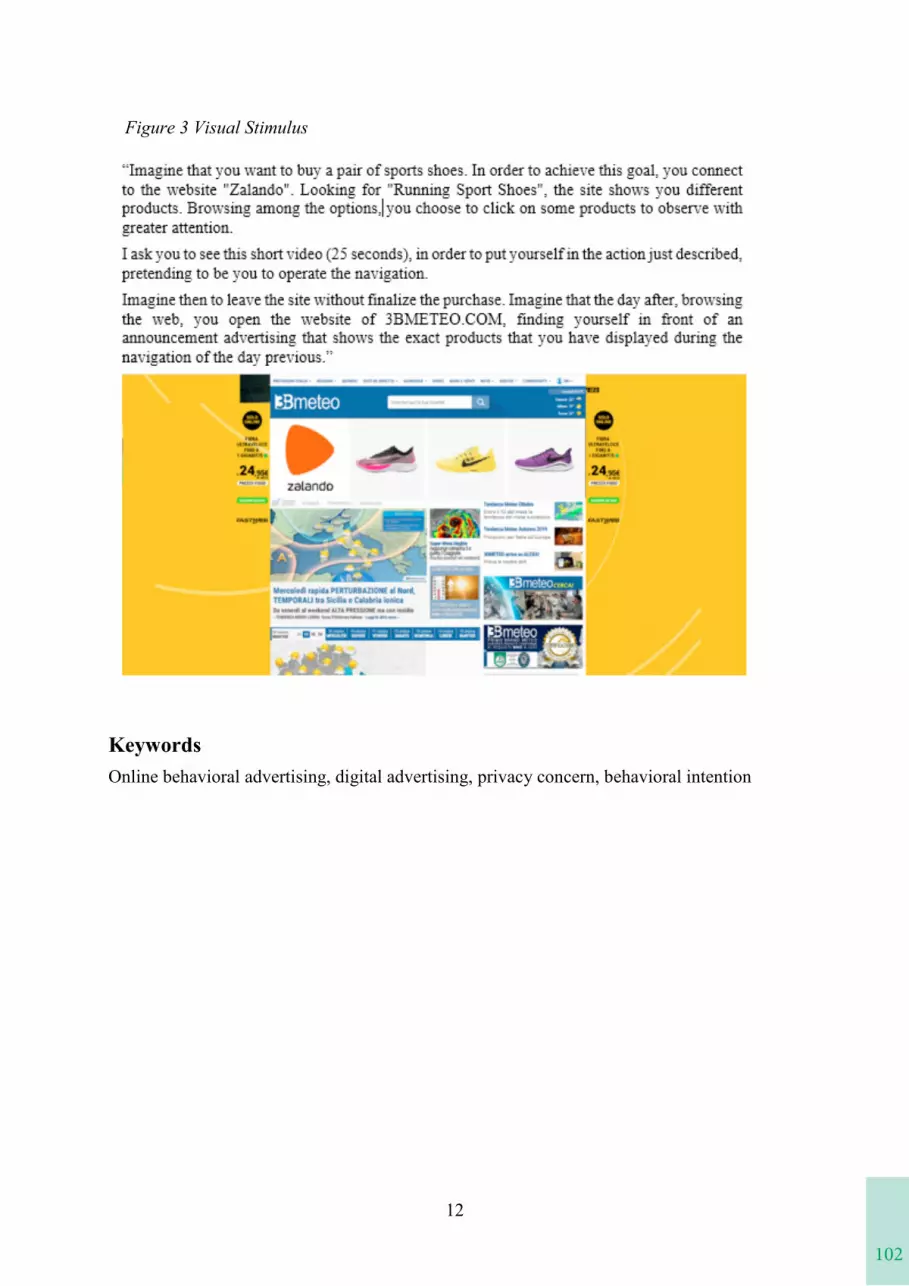
102
12
KeywordsOnline behavioral advertising, digital advertising, privacy concern, behavioral intention
Figure 3 Visual Stimulus
103
12
KeywordsOnline behavioral advertising, digital advertising, privacy concern, behavioral intention
Figure 3 Visual Stimulus
1
YOU’LL NEVER SHOP ALONE! –CUSTOMER-TO-CUSTOMER INTERACTION AT THE DISCOUNT
STORE.
Cordula Cerha (corresponding author)
Institute for Retailing and Marketing, Department Marketing
WU Vienna, Vienna, Austria
Fabian NindlInstitute for Retailing and Marketing, Department Marketing
WU Vienna, Vienna, Austria
IntroductionWith the emergence of digital retail channels, brick-and-mortar retailers are under pressure to stay relevant. As digital channels are difficult to compete with regarding assortment and price, many retailers strive to provide the best in-store experience in order to create value for theircustomers (Lemon/Verhoef 2016).
Yet, as proposed by the service-dominant (SD-)logic by Vargo/Lusch (2004), value is not created by a service provider, in this case the retailer, alone but rather co-created with the customers. In line with this, Ramaswamy (2011) argues that value comes from experiences, experiences come from interactions, and firms are entities that facilitate the creation of experience-based value through interactions.
Inspired by SD-logic, a growing body of research deals with customer-to-customer (CTC)-interactions during the service encounter. Many publications focus on positive interactions (Kim/Choi, 2016; Rosenbaum/Massiah, 2007), fewer on mixed or negative ones (Jung et al., 2017; Raajpoot/Sharma, 2006). While most of the extant research deals with CTC-interactions in tourism, leisure or entertainment settings (Heinonen et al. 2018; Nicholls 2010), there is a smaller number of studies in the context of retailing (Harris et al, 1995; McGrath/Otnes 1995;Parker/Ward 2000). Only few papers focus on positive and negative encounters simultaneously.
PurposeThis research suggests that both positive and negative CTC-interactions play a substantial role in shaping the in-store experience. There is still a lack of understanding of these interactions. Deeper insight could help retailers design a suitable service environment and support positive encounters.
This research is exploratory in its nature. The purpose is to gain insight into CTC-interactions at the point of sale. As the authors are interested in both positive and negative CTC-interactionsand their implications, i.e. the potential co-creation and co-destruction of customer value,grocery shopping at the discount store, where customers have encounters of all nature, was chosen as a context.
The proposition of the SD-logic has substantially changed the view of customers, suggesting that they play an active role in the service process. The paradigm refers to all kinds of services,with retailing being no exception. Interactions between customers lead to the co-creation of a
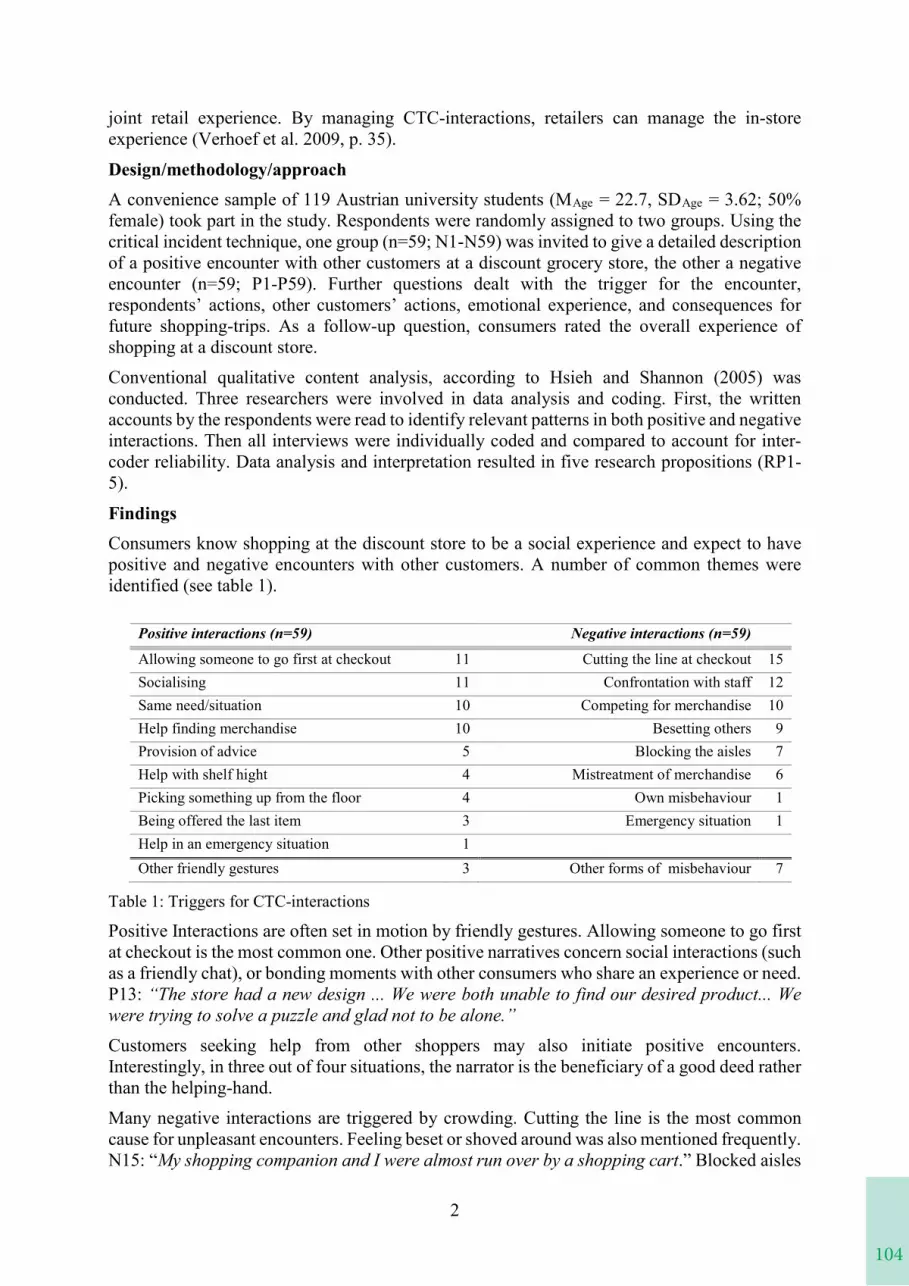
104
2
joint retail experience. By managing CTC-interactions, retailers can manage the in-storeexperience (Verhoef et al. 2009, p. 35).
Design/methodology/approachA convenience sample of 119 Austrian university students (MAge = 22.7, SDAge = 3.62; 50%female) took part in the study. Respondents were randomly assigned to two groups. Using the critical incident technique, one group (n=59; N1-N59) was invited to give a detailed description of a positive encounter with other customers at a discount grocery store, the other a negative encounter (n=59; P1-P59). Further questions dealt with the trigger for the encounter, respondents’ actions, other customers’ actions, emotional experience, and consequences for future shopping-trips. As a follow-up question, consumers rated the overall experience of shopping at a discount store.
Conventional qualitative content analysis, according to Hsieh and Shannon (2005) wasconducted. Three researchers were involved in data analysis and coding. First, the written accounts by the respondents were read to identify relevant patterns in both positive and negative interactions. Then all interviews were individually coded and compared to account for inter-coder reliability. Data analysis and interpretation resulted in five research propositions (RP1-5).
FindingsConsumers know shopping at the discount store to be a social experience and expect to have positive and negative encounters with other customers. A number of common themes wereidentified (see table 1).
Positive interactions (n=59) Negative interactions (n=59)
Allowing someone to go first at checkout 11 Cutting the line at checkout 15Socialising 11 Confrontation with staff 12Same need/situation 10 Competing for merchandise 10Help finding merchandise 10 Besetting others 9Provision of advice 5 Blocking the aisles 7Help with shelf hight 4 Mistreatment of merchandise 6Picking something up from the floor 4 Own misbehaviour 1Being offered the last item 3 Emergency situation 1Help in an emergency situation 1Other friendly gestures 3 Other forms of misbehaviour 7
Table 1: Triggers for CTC-interactions
Positive Interactions are often set in motion by friendly gestures. Allowing someone to go first at checkout is the most common one. Other positive narratives concern social interactions (such as a friendly chat), or bonding moments with other consumers who share an experience or need. P13: “The store had a new design ... We were both unable to find our desired product... We were trying to solve a puzzle and glad not to be alone.”Customers seeking help from other shoppers may also initiate positive encounters.Interestingly, in three out of four situations, the narrator is the beneficiary of a good deed rather than the helping-hand.
Many negative interactions are triggered by crowding. Cutting the line is the most common cause for unpleasant encounters. Feeling beset or shoved around was also mentioned frequently. N15: “My shopping companion and I were almost run over by a shopping cart.” Blocked aisles
105
2
joint retail experience. By managing CTC-interactions, retailers can manage the in-storeexperience (Verhoef et al. 2009, p. 35).
Design/methodology/approachA convenience sample of 119 Austrian university students (MAge = 22.7, SDAge = 3.62; 50%female) took part in the study. Respondents were randomly assigned to two groups. Using the critical incident technique, one group (n=59; N1-N59) was invited to give a detailed description of a positive encounter with other customers at a discount grocery store, the other a negative encounter (n=59; P1-P59). Further questions dealt with the trigger for the encounter, respondents’ actions, other customers’ actions, emotional experience, and consequences for future shopping-trips. As a follow-up question, consumers rated the overall experience of shopping at a discount store.
Conventional qualitative content analysis, according to Hsieh and Shannon (2005) wasconducted. Three researchers were involved in data analysis and coding. First, the written accounts by the respondents were read to identify relevant patterns in both positive and negative interactions. Then all interviews were individually coded and compared to account for inter-coder reliability. Data analysis and interpretation resulted in five research propositions (RP1-5).
FindingsConsumers know shopping at the discount store to be a social experience and expect to have positive and negative encounters with other customers. A number of common themes wereidentified (see table 1).
Positive interactions (n=59) Negative interactions (n=59)
Allowing someone to go first at checkout 11 Cutting the line at checkout 15Socialising 11 Confrontation with staff 12Same need/situation 10 Competing for merchandise 10Help finding merchandise 10 Besetting others 9Provision of advice 5 Blocking the aisles 7Help with shelf hight 4 Mistreatment of merchandise 6Picking something up from the floor 4 Own misbehaviour 1Being offered the last item 3 Emergency situation 1Help in an emergency situation 1Other friendly gestures 3 Other forms of misbehaviour 7
Table 1: Triggers for CTC-interactions
Positive Interactions are often set in motion by friendly gestures. Allowing someone to go first at checkout is the most common one. Other positive narratives concern social interactions (such as a friendly chat), or bonding moments with other consumers who share an experience or need. P13: “The store had a new design ... We were both unable to find our desired product... We were trying to solve a puzzle and glad not to be alone.”Customers seeking help from other shoppers may also initiate positive encounters.Interestingly, in three out of four situations, the narrator is the beneficiary of a good deed rather than the helping-hand.
Many negative interactions are triggered by crowding. Cutting the line is the most common cause for unpleasant encounters. Feeling beset or shoved around was also mentioned frequently. N15: “My shopping companion and I were almost run over by a shopping cart.” Blocked aisles
3
also spark negative experience. N2 recounts: „An older woman softly bumped into me with her shopping cart. When I turned around with a resentful look, she did not apologise and told me in an annoyed tone that I was in her way.”Competing for merchandise is another trigger. N55 mentions an example: “A woman wanted to buy the same t-shirt as my mother… There was only one ... left. She wanted to snatch the t-shirt from my mom, but my mom had it first.”Mistreatment of merchandise is also considered problematic behaviour. For example, N12 observed a shopper in the fruit section: “I could see a woman rummaging around the bananas and tossing them back. Unfortunately, I had to approach her and tell her that she was handling food.”
RP1: CTC-interactions at the discount store are shaped by norms (and double standards).There are both explicit and implicit norms on how to behave and not to behave in-store (with customers referring to norms in more than 30% of positive and more than 40% of negative narratives). In line with the expectation/confirmation paradigm, critical incidents are caused by shoppers’ deviation from behavioural norms.
Deviations occur in both directions. P28 mentions being surprised by a positive interaction: “It made my shopping trip ‘friendlier’. Usually people rather want to be left alone when shopping”.N52, on the other hand, complains about another shopper not following the rules: “If everyone else went about it like that, there would be chaos!”When it comes to complying with norms, consumers have double standards. What is okay for them is considered rude in others. An example concerning psychological ownership of shopping carts illustrates this: N24 mocks other consumers, who do not want anyone to touch their shopping cart: “The entire aisle is blocked with shopping carts. You want to move one of them, and the ‘owner ‘comes quickly and gets upset about it”. A couple of sentences later, the same respondent complains about “somebody unscrupulously moving my shopping cart”.
Study participants present themselves as considerate shoppers and disassociate themselves from misbehaving others. N7 reports an incident, in which several other customers loudly complain about slow service: „I did not want to be considered one of them.” Only one of the 119 study participants (N13) narrates an encounter that was caused by himself not following the rules.
RP2: In negative encounters with other customers, shoppers often assume a passive role. Very often study participants describe unpleasant situations in which they assume a passive role. In 45% of all negative narratives, the interviewee is only a bystander, witnessing other customers’ misbehaviour (e.g. confrontations with the staff or other customers). By comparison, the respondent only acts as a bystander in 5% of all positive incidents.N46 mentions being upset because another person cut the line: „I was angry about this behaviour, but I didn’t say anything“. N57 whose reaction to a similar situation is the same explains: „I didn’t want to start a big crosstalk, so I kept my own thoughts on the matter to myself in the end.” Many study participants do not even react when they are the victim of misbehaviour. N39 recounts ignoring people who were insulting her, which left her “offended, feeling awkward,powerless, stupid and angry”
RP3: Solidarity is an important factor that can make or break critical incidents at the POS.
106
4
Interviews reveal solidarity as an important factor, especially in unpleasant interactions with other customers. A lack of solidarity is disappointing. N14: “Other consumers only looked on sheepishly, but they didn’t say anything.” N30: “I was shocked by everyone’s indifference”.Especially in situations, in which the shopper himself is a victim, inactivity of others results in negative emotions. N23: “I felt humiliated and inferior, as other people behind me hadoverheard everything and had nothing to interpose.” Given their own passivity in many situations, this again illustrates the double standards shoppers have.
On the other hand, acts of solidarity are reassuring to shoppers. N57: “The other customers were obviously taking my side, even if they didn’t intervene.” They may turn around a negative experience, even if they are only small gestures. P25 recounts being overwhelmed, when packing her bags at the checkout. A shopper behind her supported her with „ a friendly smile… compassion and one or two sentences like ‘Yes, that’s always a little too fast for me as well.’”
RP4: Non-verbal interaction plays a major role in CTC-encounters.Very often customers’ first attempt to interact is by sending non-verbal signals. In positive encounters, people tend to exchange looks before starting a conversation. Non-verbal signals are also used to support others. P57: “I thanked her with a smile.” N12: “Another woman looked at me reassuringly and rolled her eyes.” In negative encounters, people show their dissent using body language. N38: “I expressed my negative emotions – rolling my eyes or something like that – but I didn’t say anything.”
RP5: CTC-interactions may influence the perception of the retail brand.66% of all respondents mention consequences for future shopping, 23% say that there are none, and 10% that there are hardly any. Some people, like P46, state that they “associate this experience with the person and not the discounter“. Others hold the retailer accountable, like N20: “I will definitely not go to (retail brand) again. Both parties deviated strongly from all behavioural norms, which made me feel unwelcome.”A comparison of the general assessment of the overall experience of shopping at a discount store reveals differences between study participants in the two groups. Those who recounted a negative interaction with other customers rated shopping at the discount store worse in sevenof eight categories. Differences were highly significant for friendliness (p=0.002) and pleasantness (p=0.001), and significant for attractiveness (p=0.036).
Value and outlookThe study is exploratory and operated with a student sample, yet it provides insight into CTC-interactions at the point of sale. It indicates that encounters with other customers strongly influence the in-store experience. The findings encourage further research (esp. observations),concerning role-patterns, and nature of the verbal and nonverbal exchange.Especially the role of solidarity among shoppers constitutes a promising topic for future studies. Negative events are sometimes the trigger for positive interactions, when customers are sharing the experience and supporting one another.
Customer interaction often seems to be the tipping point for customers’ emotional state in store. Change of mood – from negative to positive – seems to be especially interesting due to the extensive literature, linking mood to shopping duration, basket size, and word-of-mouth.
Findings of this study were gathered in the context of discount shopping. As CTC-interactions are shaped by expectations and norms, which may differ substantially based on shopping mission and sales format, researching encounters in other settings (e.g. recreational shopping or shopping events) may provide additional insight.
107
4
Interviews reveal solidarity as an important factor, especially in unpleasant interactions with other customers. A lack of solidarity is disappointing. N14: “Other consumers only looked on sheepishly, but they didn’t say anything.” N30: “I was shocked by everyone’s indifference”.Especially in situations, in which the shopper himself is a victim, inactivity of others results in negative emotions. N23: “I felt humiliated and inferior, as other people behind me hadoverheard everything and had nothing to interpose.” Given their own passivity in many situations, this again illustrates the double standards shoppers have.
On the other hand, acts of solidarity are reassuring to shoppers. N57: “The other customers were obviously taking my side, even if they didn’t intervene.” They may turn around a negative experience, even if they are only small gestures. P25 recounts being overwhelmed, when packing her bags at the checkout. A shopper behind her supported her with „ a friendly smile… compassion and one or two sentences like ‘Yes, that’s always a little too fast for me as well.’”
RP4: Non-verbal interaction plays a major role in CTC-encounters.Very often customers’ first attempt to interact is by sending non-verbal signals. In positive encounters, people tend to exchange looks before starting a conversation. Non-verbal signals are also used to support others. P57: “I thanked her with a smile.” N12: “Another woman looked at me reassuringly and rolled her eyes.” In negative encounters, people show their dissent using body language. N38: “I expressed my negative emotions – rolling my eyes or something like that – but I didn’t say anything.”
RP5: CTC-interactions may influence the perception of the retail brand.66% of all respondents mention consequences for future shopping, 23% say that there are none, and 10% that there are hardly any. Some people, like P46, state that they “associate this experience with the person and not the discounter“. Others hold the retailer accountable, like N20: “I will definitely not go to (retail brand) again. Both parties deviated strongly from all behavioural norms, which made me feel unwelcome.”A comparison of the general assessment of the overall experience of shopping at a discount store reveals differences between study participants in the two groups. Those who recounted a negative interaction with other customers rated shopping at the discount store worse in sevenof eight categories. Differences were highly significant for friendliness (p=0.002) and pleasantness (p=0.001), and significant for attractiveness (p=0.036).
Value and outlookThe study is exploratory and operated with a student sample, yet it provides insight into CTC-interactions at the point of sale. It indicates that encounters with other customers strongly influence the in-store experience. The findings encourage further research (esp. observations),concerning role-patterns, and nature of the verbal and nonverbal exchange.Especially the role of solidarity among shoppers constitutes a promising topic for future studies. Negative events are sometimes the trigger for positive interactions, when customers are sharing the experience and supporting one another.
Customer interaction often seems to be the tipping point for customers’ emotional state in store. Change of mood – from negative to positive – seems to be especially interesting due to the extensive literature, linking mood to shopping duration, basket size, and word-of-mouth.
Findings of this study were gathered in the context of discount shopping. As CTC-interactions are shaped by expectations and norms, which may differ substantially based on shopping mission and sales format, researching encounters in other settings (e.g. recreational shopping or shopping events) may provide additional insight.
5
The study hints at an effect of CTC-interactions, on not only the experience in-store but also the perception of the retail brand. Retailers should be aware that they are providing the setting for customer encounters, which affect the experience with their brand. Strategies that encourage positive and prevent negative CTC-interactions may provide a competitive advantage.
ReferencesHarris, K., Baron, S. & Ratcliffe, J. (1995), “Customers as oral participants in a service setting”, Journal of Services Marketing, Vol. 9 No. 4, pp. 64-76.
Heinonen, K., Jaakkola, E., & Neganova, I. (2018). “Drivers, types and value outcomes of customer-to-customer interaction”, Journal of Service Theory and Practice, Vol. 28 No. 6, pp.710-732
Hsieh, H. F., & Shannon, S. E. (2005), “Three approaches to qualitative content analysis”, Qualitative health research, Vol. 15 No. 9, pp. 1277-1288.
Jung, J. H., Yoo, J. J., & Arnold, T. J. (2017). “Service climate as a moderator of the effects of customer-to-customer interactions on customer support and service quality”, Journal of Service Research, Vol. 20 No 4, pp. 426-440.
Kim, H. S., & Choi, B. (2016), “The effects of three customer-to-customer interaction quality types on customer experience quality and citizenship behavior in mass service settings”, Journal of Services Marketing, Vol. 30 No. 4, pp. 384-397.
Lemon, K. N., & Verhoef, P. C. (2016), “Understanding customer experience throughout the customer journey”, Journal of marketing, Vol. 80 No. 6, pp. 69-96.
McGrath, M.A. & Otnes, C. (1995), “Unacquainted influencers: when strangers interact in the retail setting”, Journal of Business Research, Vol. 32 No. 3, pp. 261-272.
Nicholls, R. (2010), “New directions for customer-to-customer interaction research”, Journal of Services Marketing, Vol. 24 No. 1, pp. 87-97.
Parker, C. & Ward, P. (2000), “An analysis of role adoptions and scripts during customer‐to‐customer encounters”, European Journal of Marketing, Vol. 34 No. 3/4, pp. 341-359.
Raajpoot, N. A., & Sharma, A. (2006), “Perceptions of incompatibility in customer‐to‐customer interactions: examining individual level differences”, Journal of Services Marketing, Vol. 20 No. 5, pp. 324-32.
Ramaswamy, V. (2011), “It’s about human experiences . . . and beyond, to co-creation”,Industrial Marketing Management, Vol. 4 No. 2, pp. 195-196.
Rosenbaum, M. S. & Massiah, C. A. (2007), “When customers receive support from other customers”, Journal of Service Research, Vol. 9 No. 3, pp. 257-270.Vargo, S. L., & Lusch, R. F. (2004), “Evolving to a new dominant logic for marketing”,Journal of Marketing, Vol. 68 No. 1, pp. 1-17.
Verhoef, P. C., Lemon, K. N., Parasuraman, A., Roggeveen, A.,Tsiros, M. & Schlesinger, L.A. (2009), “Customer experience creation: determinants, dynamics and management strategies”, Journal of Retailing, Vol. 85 No.1, pp. 31-41.

108
6
Keywordscritical incidents, consumer misbehaviour, customer-to-customer interaction, customer-to-customer support, in-store experience, social encounter, value in experience
109
“AN EPHEMERAL’S STORE ATMOSPHERIC CHARACTERISTICS”
Ghalia Boustani, Jean-françois Lemoine (Paris 1, Panthéon Sorbonne)
This research is interested in looking at ephemeral store atmospheres, whether the ephemeral store’s vocation was commercial or event-based, to gain better understanding of their characteristics.An in-situ observation was carried out in 26 ephemeral stores having a commercial or event-based vocation in France. Following an observation guide, notes and pictures were taken on-site to collect relevant information about the store and visitors. Research findings highlight characteristics specific to the ephemeral store atmospheres. When the ephemeral store’s vocation is commercial, the characteristics are related to the conception, design, temporality and social aspects. In the case of event-based ephemeral store vocation, the characteristics relate to the layout and the social aspects.The characteristics of a point of sale’s atmosphere have been the subject of several academic research since the 1980s; however, very little research is interested in ephemeral points of sale.
110
“HURRY UP! EFFECT OF POP‐UP STORES’ EPHEMERALITY ON CONSUMERS’ INTENTION TO VISIT”
Laura Henkel, Waldemar Toporowski (University of Göttingen)
Retail channels are in constant transformation in line with the increased digitalization and changing consumption habits. Consumers increasingly prefer ephemerality and immediacy. Retail has answered this trend with pop-up stores: an ephemeral, experiential store format. As pop-ups are highly original, it is no surprise that research has determined their target group as having a high need for uniqueness (NFU). Still, the question remains as to which pop-up characteristics lead consumers to perceive the store as attractive. Research has identified experience as having an impact on consumer behavior. However, experience does not exclusively define pop-ups but applies to all experiential stores. We hypothesize that ephemerality, pop-ups’ main distinguishing feature, may contribute to consumers’ visit. Specifically, we aim to investigate the effect of store ephemerality through anticipated product scarcity on intention to visit by considering the moderating role of NFU. We test our hypotheses in two studies. In study 1, we employed a one-factor, two-level (flagship vs. pop-up) between-subjects design. For study 2, participants were randomly assigned to one of four conditions as part of a 2 (store ephemerality: flagship vs. pop-up) × 2 (NFU: low NFU vs. high NFU) between-subjects design. To analyze our model, we performed a moderated mediation. Our work suggests that, despite pop-ups’ non-sales focus, store ephemerality translates into the anticipation of a limited product assortment which further drives consumers’ intention to visit, especially for those with a high need for uniqueness. Unexpectedly, we found no direct effect of store ephemerality on intention to visit.
111
“HURRY UP! EFFECT OF POP‐UP STORES’ EPHEMERALITY ON CONSUMERS’ INTENTION TOVISIT”
Retail channels are in constant transformation in line with the increased digitalization andchanging consumption habits. Consumers increasingly prefer ephemerality and immediacy.Retail has answered this trend with pop-up stores: an ephemeral, experiential store format. Aspop-ups are highly original, it is no surprise that research has determined their target group ashaving a high need for uniqueness (NFU). Still, the question remains as to which pop-up characteristics lead consumers to perceive the store as attractive. Research has identifiedexperience as having an impact on consumer behavior. However, experience does notexclusively define pop-ups but applies to all experiential stores. We hypothesize thatephemerality, pop-ups’ main distinguishing feature, may contribute to consumers’ visit.Specifically, we aim to investigate the effect of store ephemerality through anticipated productscarcity on intention to visit by considering the moderating role of NFU. We test our hypotheses in two studies. In study 1, we employed a one-factor, two-level (flagship vs. pop-up) between-subjects design. For study 2, participants were randomly assigned to one of four conditions aspart of a 2 (store ephemerality: flagship vs. pop-up) × 2 (NFU: low NFU vs. high NFU) between-subjects design. To analyze our model, we performed a moderated mediation. Our worksuggests that, despite pop-ups’ non-sales focus, store ephemerality translates into theanticipation of a limited product assortment which further drives consumers’ intention to visit,especially for those with a high need for uniqueness. Unexpectedly, we found no direct effect ofstore ephemerality on intention to visit.
“FRANCHISOR‐FRANCHISEE RELATIONSHIP AND CUSTOMER DATA MANAGEMENT IN THE DATA ERA”
Hanene OUESLATI (Université de Haute-Alsace)Martine DEPARIS (European Business School)Saloua BENNAGHMOUCH (Université de Haute-Alsace)
Managing customer data in franchise networks is a delicate, complicated and little studied issue. In order to better understand its challenges and the keys to success, this research work offers a study in three stages following the process of grounded theory (Glaser and Strauss, 1967). Thus, a qualitative study was carried out with around thirty franchisors, franchisees and franchise experts. It helped to explore the world of customer data management in franchise networks and to identify its strengths and weaknesses in the context of GDPR (General Data Protection Regulations). The results of the qualitative study helped to clarify our theoretical framework and to position ourselves on the side of the founding theories of the relationship marketing (Morgan and Hunt, 1994).
A research model was then defined and tested using a quantitative study administered to a total sample of 192 franchisors and franchisees. Statistical tests carried out show that relational quality, through its determinants (inter-organizational communication, franchisee autonomy, technical and human equipment and the contractualization about customer data management) contributes to achieving positive marketing and commercial performance. Likewise, it has been noted that the collection of customer data cannot be an aim in itself and that it should be accompanied by a real data culture in franchise networks.
112
“VALUE CO‐CREATION BETWEEN CONSUMERS AND DISTRIBUTORS: THE MODERATING EFFECT OF RELATIONSHIP CHARACTERISTICS”
Natalia Rubio, Nieves Villaseñor, MªJesús Yague(Universidad Autónoma Madrid)
Although value co-creation has been widely analyzed in digital contexts and various types of services (tourism, healthcare, etc.), it has received less study in the area of retail distribution. This study therefore proposes two variables that are important from a relationship marketing perspective: Trust in the retailer and perceived support can encourage co-creation behavior on various levels: a basic level related to communication of service errors and a moderate-high level related to participation in service innovation. This study also proposes modelling for two different segments: the segment that participates in a loyalty program vs. the segment that does not, and customers with longer relationship duration vs customers with shorter relationship duration.
The results show differences in the formation of co-creation behaviors, depending on the groups of customers analyzed. To encourage communication of service errors, it is crucial that customers affiliated with the program and customers with the longest customer-firm relationships trust the distributor; perceived support has no influence whatsoever on these groups. Perceived support is crucial, however, in encouraging feedback on service errors among non-affiliated and new customers. As to moderate/high level of co-creation—that is, co-creation to promote service innovation—the most significant antecedent is perceived support, followed by trust, independently of whether or not the customer belongs to the loyalty program. As to duration of relationship with the firm, customers with the longest relationship participate in co-innovation activities motivated equally by trust in the retailer and the support they perceive from the retailer. Customers with shorter relationship duration only participate in co-innovation activities if they believe that the distributor hears their opinions and takes them into account.
113
1
EVIDENCE STRUCTURE OF THE EMOTIONAL CONTENT IN ONLINE CUSTOMER REVIEWS
Clara Koetz, ESC Rennes School of Business, Rennes, France, [email protected]
Tanja Mlinar, IÉSEG School of Management (LEM-CNRS 9221), Paris La Defense Cedex, France, [email protected]
Vladan Mlinar, Research Institute for Advanced Materials Design, Providence, RI 02906, USA, [email protected]
Abstract
The objective of this article is to investigate the role of emotions, and more specifically, the strength of positive and negative emotions and the emotional charge in online consumer reviews across distinct product categories with hedonic and utilitarian attributes and the level of product involvement. We extracted 357,328 online customer reviews posted on 1,485 products, representing distinct levels of hedonic and utilitarian attributes and the level of product involvement, as well as the reviewer name, star rating and date of each review. We used SentiStrength to measure the emotional content of the reviews, and the theory of evidence to construct an evidence structure to determine the level of support for the emotional content and ratings across different product attributes. Our analysis demonstrates that there is not only one product attribute that explains the emotional characteristics of online customer reviews, but rather a combination of these attributes that differently affect the way consumers express emotions in these contexts. Our findings provide important theoretical implications by demonstrating that customers express emotions in online reviews in distinct ways, depending on product characteristics, such as the hedonic and utilitarian nature, and the level ofinvolvement. From a practitioner standpoint, our results show to online retailing companies that they should take these product characteristics into account in their marketing strategies.
1. Introduction
Online customer reviews are an important source of information, and a space where individuals share their consumption opinions and experiences and engage in a word-of-mouth process with others (Chen and Xie, 2008). The content of these comments can be cognitive or emotional (Moore, 2015). Thus, consumers can engage in a word-of-mouth process not only to discuss the benefits and drawbacks of a product, but also to express their emotions towards the consumption experience, regulate emotions, such as by venting or receiving and providing social support, and create social bonds (Berger, 2014). The emotional nature of online reviews is one of the drivers of word-of-mouth, influencing on decisions of what to talk (Berger, 2014) and whether to share online content (Berger and Milkman, 2012). Online customer reviews have shown an important impact on consumer behavior, influencing attitudes (Zablocki et al., 2019), perceived usefulness (Felbermayr and Nanopoulus, 2016), and conversion rates (Ludwig et al., 2013).
The mechanisms underpinning emotional processes in word-of-mouth communications are explained with basis on emotional social sharing. This theory considers that an emotional experience may start a process involving cognitive, symbolic affective and social aspects, which are part of and as important as the emotional experience itself (Rime, 2009). The nature of the

114
2
product, in terms of its utilitarian and hedonic attributes, and the level of involvement, may also influence these processes. Utilitarian products are considered as mainly cognitive and functional, and purchased as a result of a necessity, e.g., dust pan and brush set, whereas hedonic products are mainly emotional and experiential, and are purchased as a result of pleasure and enjoyment, e.g., jewelry (Moore, 2015, Holbrook and Hirshman, 1982). Product involvement is associated with the relevance and importance of a product for a consumer, which is likely to affect the level of attention he/she focuses on it (Ratchford, 1987).
The analysis of the emotions expressed in online reviews has become a managerial priority to understand products evaluations and it has been extensively investigated in the marketing literature (e.g., Felbermayr and Nanopoulos, 2016; Ludwig et al., 2013; Zablocki et al., 2019). Some of these studies approach differences regarding products hedonic or utilitarian attributes (e.g., Ullah et al., 2016; Kronrod and Danziger, 2013) and distinct levels of product involvement (e.g., Candi et al., 2017). However, to the best of our knowledge, no previous study has examined the emotional content in online customer reviews across a diverse range of products categories with various combinations of attributes and the level of involvement, nor has investigated the emotional dynamics on consumers’ opinions with basis on evidence theory.
2. Purpose
The objective of this work is to examine the emotional content, dynamics in customer reviews in a multi-dimensional way (emotional strength, charge and ratings) across several product categories with utilitarian/hedonic, and product involvement attributes. We conducted a pre-test to classify products into multidimensional quadrants with utilitarian/hedonic attributes and the level of product involvement to classify products into multidimensional quadrants with utilitarian/hedonic attributes and the level of product involvement with basis on Voss et al. (2003) and Ratchford (1987). We then employ the Dempster-Shafer Theory (DST) of evidence (Dempster, 1967, Shafer, 1976, Mlinar, 2015) in order to construct an evidence structure using the star ratings and emotional content from user reviews, and to determine the level of support for the hypotheses defined.
3. Methodology
3.1. Pretest We conducted a pretest in MTurk in order to measure the hedonic and utilitarian
dimensions of different products and their level of product involvement based on the scales of Voss et al. (2003) and Ratchford (1987). We selected 43 product types based on their classification on previous literature (e.g., jeans in Voss et al, 2003) and our own perception of their utilitarian/ hedonic and involvement characteristics. 432 participants were randomly assigned to one of seven versions of the questionnaire including seven products (six different products and one same product that was tested across the seven versions). Participants were asked to evaluate the hedonic, utilitarian and involvement attributes of each product, and to indicate whether they had previously used and purchased the product
We conducted t-tests to identify the utilitarian versus hedonic characteristics, and the low versus high levels of involvement of the products. Thus, we classified the product categories into different quadrants considering Low (L)/High (H) Hedonic (H) and Low
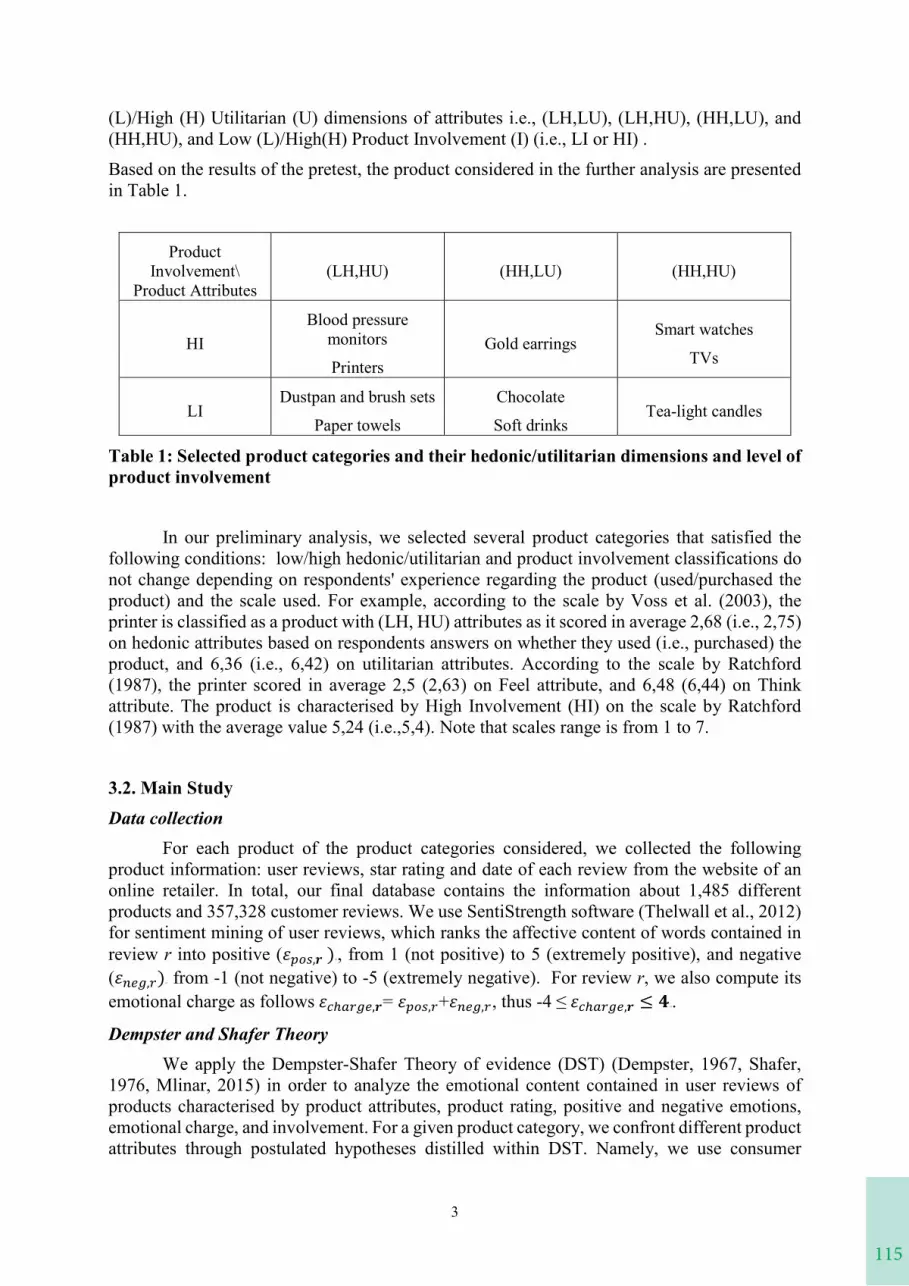
115
2
product, in terms of its utilitarian and hedonic attributes, and the level of involvement, may also influence these processes. Utilitarian products are considered as mainly cognitive and functional, and purchased as a result of a necessity, e.g., dust pan and brush set, whereas hedonic products are mainly emotional and experiential, and are purchased as a result of pleasure and enjoyment, e.g., jewelry (Moore, 2015, Holbrook and Hirshman, 1982). Product involvement is associated with the relevance and importance of a product for a consumer, which is likely to affect the level of attention he/she focuses on it (Ratchford, 1987).
The analysis of the emotions expressed in online reviews has become a managerial priority to understand products evaluations and it has been extensively investigated in the marketing literature (e.g., Felbermayr and Nanopoulos, 2016; Ludwig et al., 2013; Zablocki et al., 2019). Some of these studies approach differences regarding products hedonic or utilitarian attributes (e.g., Ullah et al., 2016; Kronrod and Danziger, 2013) and distinct levels of product involvement (e.g., Candi et al., 2017). However, to the best of our knowledge, no previous study has examined the emotional content in online customer reviews across a diverse range of products categories with various combinations of attributes and the level of involvement, nor has investigated the emotional dynamics on consumers’ opinions with basis on evidence theory.
2. Purpose
The objective of this work is to examine the emotional content, dynamics in customer reviews in a multi-dimensional way (emotional strength, charge and ratings) across several product categories with utilitarian/hedonic, and product involvement attributes. We conducted a pre-test to classify products into multidimensional quadrants with utilitarian/hedonic attributes and the level of product involvement to classify products into multidimensional quadrants with utilitarian/hedonic attributes and the level of product involvement with basis on Voss et al. (2003) and Ratchford (1987). We then employ the Dempster-Shafer Theory (DST) of evidence (Dempster, 1967, Shafer, 1976, Mlinar, 2015) in order to construct an evidence structure using the star ratings and emotional content from user reviews, and to determine the level of support for the hypotheses defined.
3. Methodology
3.1. Pretest We conducted a pretest in MTurk in order to measure the hedonic and utilitarian
dimensions of different products and their level of product involvement based on the scales of Voss et al. (2003) and Ratchford (1987). We selected 43 product types based on their classification on previous literature (e.g., jeans in Voss et al, 2003) and our own perception of their utilitarian/ hedonic and involvement characteristics. 432 participants were randomly assigned to one of seven versions of the questionnaire including seven products (six different products and one same product that was tested across the seven versions). Participants were asked to evaluate the hedonic, utilitarian and involvement attributes of each product, and to indicate whether they had previously used and purchased the product
We conducted t-tests to identify the utilitarian versus hedonic characteristics, and the low versus high levels of involvement of the products. Thus, we classified the product categories into different quadrants considering Low (L)/High (H) Hedonic (H) and Low
3
(L)/High (H) Utilitarian (U) dimensions of attributes i.e., (LH,LU), (LH,HU), (HH,LU), and (HH,HU), and Low (L)/High(H) Product Involvement (I) (i.e., LI or HI) .
Based on the results of the pretest, the product considered in the further analysis are presented in Table 1.
Product Involvement\
Product Attributes(LH,HU) (HH,LU) (HH,HU)
HIBlood pressure
monitors
PrintersGold earrings
Smart watches
TVs
LIDustpan and brush sets
Paper towels
Chocolate
Soft drinksTea-light candles
Table 1: Selected product categories and their hedonic/utilitarian dimensions and level of product involvement
In our preliminary analysis, we selected several product categories that satisfied the following conditions: low/high hedonic/utilitarian and product involvement classifications donot change depending on respondents' experience regarding the product (used/purchased the product) and the scale used. For example, according to the scale by Voss et al. (2003), the printer is classified as a product with (LH, HU) attributes as it scored in average 2,68 (i.e., 2,75)on hedonic attributes based on respondents answers on whether they used (i.e., purchased) the product, and 6,36 (i.e., 6,42) on utilitarian attributes. According to the scale by Ratchford(1987), the printer scored in average 2,5 (2,63) on Feel attribute, and 6,48 (6,44) on Thinkattribute. The product is characterised by High Involvement (HI) on the scale by Ratchford (1987) with the average value 5,24 (i.e.,5,4). Note that scales range is from 1 to 7.
3.2. Main StudyData collection
For each product of the product categories considered, we collected the following product information: user reviews, star rating and date of each review from the website of an online retailer. In total, our final database contains the information about 1,485 different products and 357,328 customer reviews. We use SentiStrength software (Thelwall et al., 2012) for sentiment mining of user reviews, which ranks the affective content of words contained in review r into positive (𝜀𝜀𝜀𝜀𝑝𝑝𝑝𝑝𝑝𝑝𝑝𝑝𝑝𝑝𝑝𝑝,𝒓𝒓𝒓𝒓 )23T, from 1 (not positive) to 5 (extremely positive), and negative (𝜀𝜀𝜀𝜀𝑛𝑛𝑛𝑛𝑛𝑛𝑛𝑛𝑛𝑛𝑛𝑛,𝑟𝑟𝑟𝑟)23T from -1 (not negative) to -5 (extremely negative). For review r, we also compute its emotional charge as follows 𝜀𝜀𝜀𝜀𝑐𝑐𝑐𝑐ℎ𝑎𝑎𝑎𝑎𝑟𝑟𝑟𝑟𝑛𝑛𝑛𝑛𝑛𝑛𝑛𝑛,𝒓𝒓𝒓𝒓= 𝜀𝜀𝜀𝜀𝑝𝑝𝑝𝑝𝑝𝑝𝑝𝑝𝑝𝑝𝑝𝑝,𝑟𝑟𝑟𝑟+𝜀𝜀𝜀𝜀𝑛𝑛𝑛𝑛𝑛𝑛𝑛𝑛𝑛𝑛𝑛𝑛,𝑟𝑟𝑟𝑟, thus -4 ≤ 𝜀𝜀𝜀𝜀𝑐𝑐𝑐𝑐ℎ𝑎𝑎𝑎𝑎𝑟𝑟𝑟𝑟𝑛𝑛𝑛𝑛𝑛𝑛𝑛𝑛,𝒓𝒓𝒓𝒓 ≤ 𝟒𝟒𝟒𝟒23T.
Dempster and Shafer TheoryWe apply the Dempster-Shafer Theory of evidence (DST) (Dempster, 1967, Shafer,
1976, Mlinar, 2015) in order to analyze the emotional content contained in user reviews of products characterised by product attributes, product rating, positive and negative emotions, emotional charge, and involvement. For a given product category, we confront different product attributes through postulated hypotheses distilled within DST. Namely, we use consumer
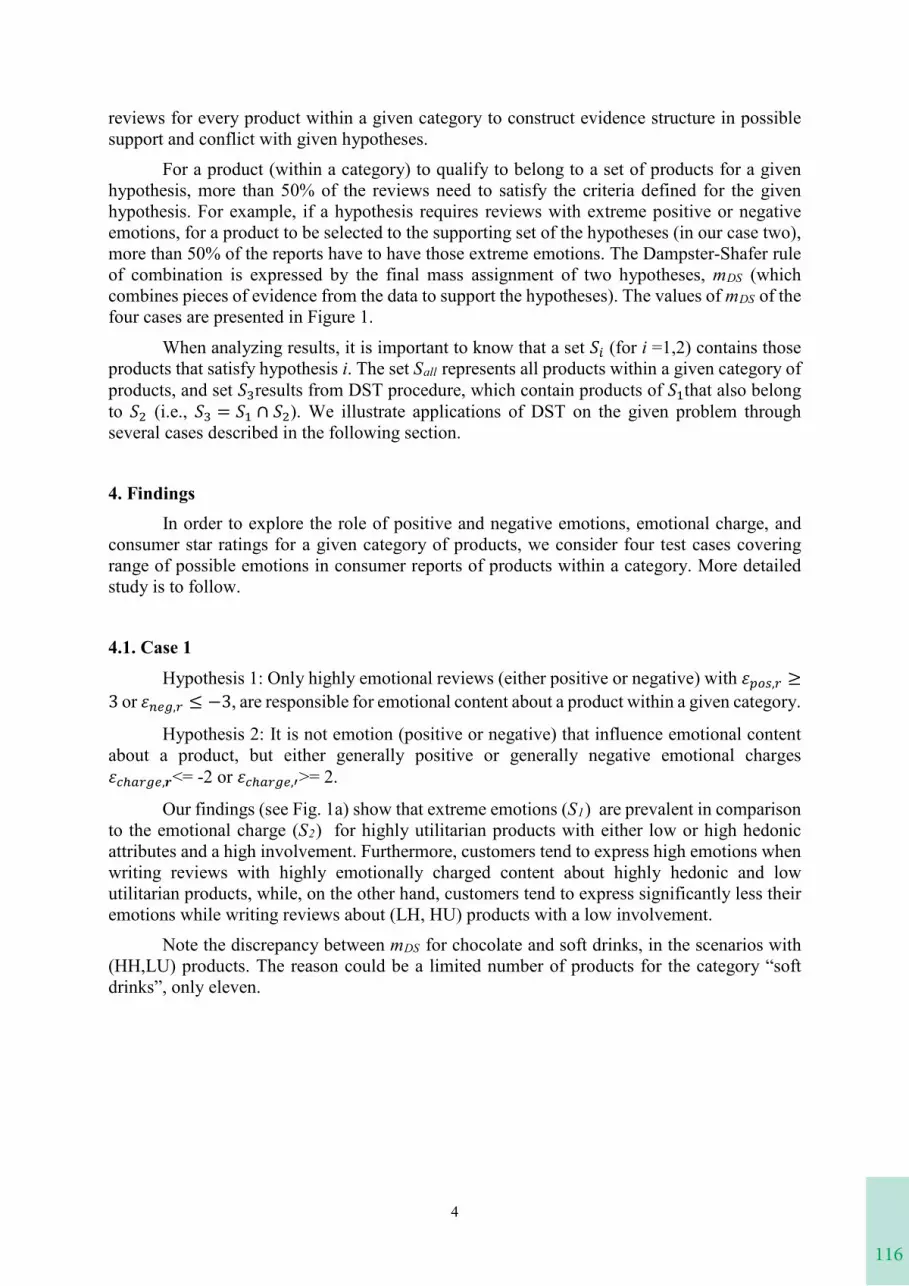
116
4
reviews for every product within a given category to construct evidence structure in possible support and conflict with given hypotheses.
For a product (within a category) to qualify to belong to a set of products for a given hypothesis, more than 50% of the reviews need to satisfy the criteria defined for the given hypothesis. For example, if a hypothesis requires reviews with extreme positive or negative emotions, for a product to be selected to the supporting set of the hypotheses (in our case two),more than 50% of the reports have to have those extreme emotions. The Dampster-Shafer rule of combination is expressed by the final mass assignment of two hypotheses, mDS (which combines pieces of evidence from the data to support the hypotheses). The values of mDS of the four cases are presented in Figure 1.
When analyzing results, it is important to know that a set 𝑆𝑆𝑆𝑆𝑖𝑖𝑖𝑖 (for i =1,2) contains those products that satisfy hypothesis i. The set Sall represents all products within a given category of products, and set 𝑆𝑆𝑆𝑆3results from DST procedure, which contain products of 𝑆𝑆𝑆𝑆1that also belong to 𝑆𝑆𝑆𝑆2 (i.e., 𝑆𝑆𝑆𝑆3 = 𝑆𝑆𝑆𝑆1 ∩ 𝑆𝑆𝑆𝑆2). We illustrate applications of DST on the given problem through several cases described in the following section.
4. FindingsIn order to explore the role of positive and negative emotions, emotional charge, and
consumer star ratings for a given category of products, we consider four test cases covering range of possible emotions in consumer reports of products within a category. More detailed study is to follow.
4.1. Case 1
Hypothesis 1: Only highly emotional reviews (either positive or negative) with 𝜀𝜀𝜀𝜀𝑝𝑝𝑝𝑝𝑝𝑝𝑝𝑝𝑝𝑝𝑝𝑝,𝑟𝑟𝑟𝑟 ≥3 or 𝜀𝜀𝜀𝜀𝑛𝑛𝑛𝑛𝑛𝑛𝑛𝑛𝑛𝑛𝑛𝑛,𝑟𝑟𝑟𝑟 ≤ −3, are responsible for emotional content about a product within a given category.
Hypothesis 2: It is not emotion (positive or negative) that influence emotional content about a product, but either generally positive or generally negative emotional charges𝜀𝜀𝜀𝜀𝑐𝑐𝑐𝑐ℎ𝑎𝑎𝑎𝑎𝑟𝑟𝑟𝑟𝑛𝑛𝑛𝑛𝑛𝑛𝑛𝑛,𝒓𝒓𝒓𝒓<= -2 or 𝜀𝜀𝜀𝜀𝑐𝑐𝑐𝑐ℎ𝑎𝑎𝑎𝑎𝑟𝑟𝑟𝑟𝑛𝑛𝑛𝑛𝑛𝑛𝑛𝑛,′>= 2.
Our findings (see Fig. 1a) show that extreme emotions (S1) are prevalent in comparison to the emotional charge (S2) for highly utilitarian products with either low or high hedonic attributes and a high involvement. Furthermore, customers tend to express high emotions whenwriting reviews with highly emotionally charged content about highly hedonic and low utilitarian products, while, on the other hand, customers tend to express significantly less their emotions while writing reviews about (LH, HU) products with a low involvement.
Note the discrepancy between mDS for chocolate and soft drinks, in the scenarios with (HH,LU) products. The reason could be a limited number of products for the category “soft drinks”, only eleven.
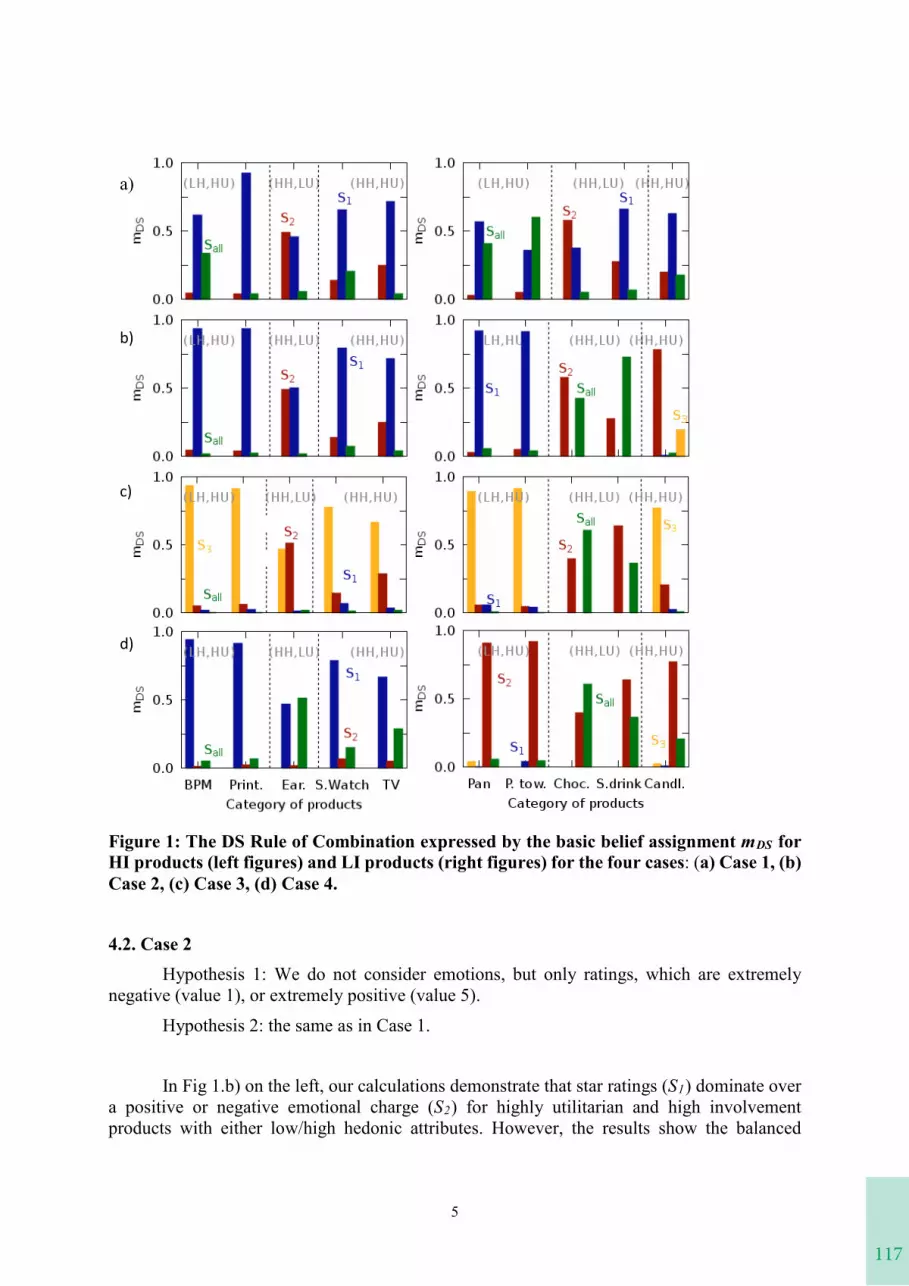
117
4
reviews for every product within a given category to construct evidence structure in possible support and conflict with given hypotheses.
For a product (within a category) to qualify to belong to a set of products for a given hypothesis, more than 50% of the reviews need to satisfy the criteria defined for the given hypothesis. For example, if a hypothesis requires reviews with extreme positive or negative emotions, for a product to be selected to the supporting set of the hypotheses (in our case two),more than 50% of the reports have to have those extreme emotions. The Dampster-Shafer rule of combination is expressed by the final mass assignment of two hypotheses, mDS (which combines pieces of evidence from the data to support the hypotheses). The values of mDS of the four cases are presented in Figure 1.
When analyzing results, it is important to know that a set 𝑆𝑆𝑆𝑆𝑖𝑖𝑖𝑖 (for i =1,2) contains those products that satisfy hypothesis i. The set Sall represents all products within a given category of products, and set 𝑆𝑆𝑆𝑆3results from DST procedure, which contain products of 𝑆𝑆𝑆𝑆1that also belong to 𝑆𝑆𝑆𝑆2 (i.e., 𝑆𝑆𝑆𝑆3 = 𝑆𝑆𝑆𝑆1 ∩ 𝑆𝑆𝑆𝑆2). We illustrate applications of DST on the given problem through several cases described in the following section.
4. FindingsIn order to explore the role of positive and negative emotions, emotional charge, and
consumer star ratings for a given category of products, we consider four test cases covering range of possible emotions in consumer reports of products within a category. More detailed study is to follow.
4.1. Case 1
Hypothesis 1: Only highly emotional reviews (either positive or negative) with 𝜀𝜀𝜀𝜀𝑝𝑝𝑝𝑝𝑝𝑝𝑝𝑝𝑝𝑝𝑝𝑝,𝑟𝑟𝑟𝑟 ≥3 or 𝜀𝜀𝜀𝜀𝑛𝑛𝑛𝑛𝑛𝑛𝑛𝑛𝑛𝑛𝑛𝑛,𝑟𝑟𝑟𝑟 ≤ −3, are responsible for emotional content about a product within a given category.
Hypothesis 2: It is not emotion (positive or negative) that influence emotional content about a product, but either generally positive or generally negative emotional charges𝜀𝜀𝜀𝜀𝑐𝑐𝑐𝑐ℎ𝑎𝑎𝑎𝑎𝑟𝑟𝑟𝑟𝑛𝑛𝑛𝑛𝑛𝑛𝑛𝑛,𝒓𝒓𝒓𝒓<= -2 or 𝜀𝜀𝜀𝜀𝑐𝑐𝑐𝑐ℎ𝑎𝑎𝑎𝑎𝑟𝑟𝑟𝑟𝑛𝑛𝑛𝑛𝑛𝑛𝑛𝑛,′>= 2.
Our findings (see Fig. 1a) show that extreme emotions (S1) are prevalent in comparison to the emotional charge (S2) for highly utilitarian products with either low or high hedonic attributes and a high involvement. Furthermore, customers tend to express high emotions whenwriting reviews with highly emotionally charged content about highly hedonic and low utilitarian products, while, on the other hand, customers tend to express significantly less their emotions while writing reviews about (LH, HU) products with a low involvement.
Note the discrepancy between mDS for chocolate and soft drinks, in the scenarios with (HH,LU) products. The reason could be a limited number of products for the category “soft drinks”, only eleven.
5
Figure 1: The DS Rule of Combination expressed by the basic belief assignment mDS for HI products (left figures) and LI products (right figures) for the four cases: (a) Case 1, (b) Case 2, (c) Case 3, (d) Case 4.
4.2. Case 2Hypothesis 1: We do not consider emotions, but only ratings, which are extremely
negative (value 1), or extremely positive (value 5).
Hypothesis 2: the same as in Case 1.
In Fig 1.b) on the left, our calculations demonstrate that star ratings (S1) dominate overa positive or negative emotional charge (S2) for highly utilitarian and high involvement products with either low/high hedonic attributes. However, the results show the balanced
a)
b)
c)
d)
118
6
influence of both emotionally charged content and star ratings on user reviews for (HH,LU) and high involvement products.
When the products are characterised by a high hedonic attribute (i.e., (HH,LU) and (HH,HU)) and a low involvement (Fig 1.b) on the right), our calculations reveal that the emotional charge dominates over the ratings. However, for (HH,LU) products, mDS(Sall) is higher (0,424 and 0,727, for chocolate and soft drinks, respectively), showing that some product attributes other than emotional charge can play an important role.
4.3. Case 3Hypothesis 1: the same as in Case 2.
Hypothesis 2: Different to Hypothesis 2 of the first two cases, we consider the low level of emotional charge −2 < 𝜀𝜀𝜀𝜀𝑐𝑐𝑐𝑐ℎ𝑎𝑎𝑎𝑎𝑟𝑟𝑟𝑟𝑟𝑟𝑟𝑟𝑟𝑟𝑟𝑟,𝑟𝑟𝑟𝑟 < 223TR .
Our results reveal that for most product categories especially those with high utilitarian attributes, customers tend to give extremely positive/negative ratings when writing neutral emotionally charged contents (see Fig 1.c). Emotional content of reviews about (HH,LU) products are characterised by neutral emotionally charged contents but also by other product attributes.
4.4. Case 4Hypothesis 1: We consider only moderate ratings in the interval [2,4].
Hypothesis 2: the same as in Case 1.
Results for the case 4 (Fig. 1d) reveal that for high involvement products, customers rather post moderate ratings than write neutral emotionally charged reviews. On the other hand, for (LI) products, the review content is rather neutral than with moderate ratings. For highlyhedonic products, especially those with low utilitarian attributes, other attributes in addition to neutral emotional charge are responsible to the emotional content about a product.
5. Original Value
Our analysis demonstrates that there is not only one product attribute, among those considered in this study, that explain the emotional characteristics of online customer reviews, but rather a mix of these attributes that may differently affect the way consumers express emotions in these contexts. Our findings provide important theoretical and managerial implications. Regarding the former, we add to previous studies approaching emotions in online customer reviews (e.g., Felbermayr and Nanopoulos, 2016; Kronrod and Danziger, 2013; Ullah et al., 2016; Zablocki et al., 2019) by demonstrating that customers express emotions in online reviews in distinct ways, depending on product characteristics, such as the hedonic and utilitarian nature, and the level of involvement. From a practitioner standpoint, our results show to online retailing companies that they should take these product characteristics into account in their marketing strategies.
119
6
influence of both emotionally charged content and star ratings on user reviews for (HH,LU) and high involvement products.
When the products are characterised by a high hedonic attribute (i.e., (HH,LU) and (HH,HU)) and a low involvement (Fig 1.b) on the right), our calculations reveal that the emotional charge dominates over the ratings. However, for (HH,LU) products, mDS(Sall) is higher (0,424 and 0,727, for chocolate and soft drinks, respectively), showing that some product attributes other than emotional charge can play an important role.
4.3. Case 3Hypothesis 1: the same as in Case 2.
Hypothesis 2: Different to Hypothesis 2 of the first two cases, we consider the low level of emotional charge −2 < 𝜀𝜀𝜀𝜀𝑐𝑐𝑐𝑐ℎ𝑎𝑎𝑎𝑎𝑟𝑟𝑟𝑟𝑟𝑟𝑟𝑟𝑟𝑟𝑟𝑟,𝑟𝑟𝑟𝑟 < 223TR .
Our results reveal that for most product categories especially those with high utilitarian attributes, customers tend to give extremely positive/negative ratings when writing neutral emotionally charged contents (see Fig 1.c). Emotional content of reviews about (HH,LU) products are characterised by neutral emotionally charged contents but also by other product attributes.
4.4. Case 4Hypothesis 1: We consider only moderate ratings in the interval [2,4].
Hypothesis 2: the same as in Case 1.
Results for the case 4 (Fig. 1d) reveal that for high involvement products, customers rather post moderate ratings than write neutral emotionally charged reviews. On the other hand, for (LI) products, the review content is rather neutral than with moderate ratings. For highlyhedonic products, especially those with low utilitarian attributes, other attributes in addition to neutral emotional charge are responsible to the emotional content about a product.
5. Original Value
Our analysis demonstrates that there is not only one product attribute, among those considered in this study, that explain the emotional characteristics of online customer reviews, but rather a mix of these attributes that may differently affect the way consumers express emotions in these contexts. Our findings provide important theoretical and managerial implications. Regarding the former, we add to previous studies approaching emotions in online customer reviews (e.g., Felbermayr and Nanopoulos, 2016; Kronrod and Danziger, 2013; Ullah et al., 2016; Zablocki et al., 2019) by demonstrating that customers express emotions in online reviews in distinct ways, depending on product characteristics, such as the hedonic and utilitarian nature, and the level of involvement. From a practitioner standpoint, our results show to online retailing companies that they should take these product characteristics into account in their marketing strategies.
7
6. KeywordsOnline customer reviews, Word-of-mouth, Social sharing of emotions, Hedonic/ utilitarian product attributes, Product involvement, Theory of Evidence.
ReferencesBatra, R., Ahtola, O. T. (1990), Measuring the Hedonic and Utilitarian Sources of
Consumer Attitudes, Marketing Letters, 2 (2), 159-70.
Berger, J. (2014), Word-of-Mouth and Interpersonal Communication: A Review and Directions for Future Research, Journal of Consumer Psychology, 24 (4), 586–607.
Berger, J., Milkman, K. (2012), What Makes Online Content Viral. Journal of Marketing Research, vol. XLIX (April), 192-205.
Candi, M., Jae, H., Makarem, S., Mohan, M. (2017). Consumer responses to functional, aesthetic and symbolic product design in online reviews. Journal of Business Research, 81, 31-39.
Chen, Y., Xie, J. (2008), Online consumer review: Word-of-mouth as a new element of marketing communication mix. Management Science, 54(3), 477-491.
Chitturi, R., Raghunathan, R., Mahajan, V. (2007), Form versus Function: How the Intensities of Specific Emotions Evoked in Functional versus Hedonic Trade-Offs Mediate Product Preferences. Journal of Marketing Research, 44(4), 702-714.
Crowley, A. E., Spangenberg, E., Hughes, K.R. (1992), Measuring the Hedonic and Utilitarian Dimensions of Attitudes Toward Product Categories. Marketing Letters, 3 (3), 239-49.
Dhar, R., Wertenbroch, K. (2000), Consumer Choice between Hedonic and Utilitarian Goods, Journal of Marketing Research, 37 (1), 60–71.
Dempster, A. P. (1967). Upper and lower probabilities induced by a multivalued mapping, The Annals of Mathematical Statistics, 38(2), 325–39
Felbermayr, A., Nanopoulos, A. (2016). The role of emotions for the perceived usefulness in online customer reviews. Journal of Interactive Marketing, 36, 60–76.
Godes, D., Silva, J. C. (2012). Sequential and temporal dynamics of online opinion. Marketing Science, 31(3), 448-473.
Gu, B., Park, J., Konana, P. (2012). Research note—the impact of external word-of-mouth sources on retailer sales of high-involvement products. Information Systems Research, 23(1), 182-196.
Harber, K. D., Cohen, D. J. (2005), The emotional broadcaster theory of social sharing. Journal of Language and Social Psychology, 24(4), 382-400.
Holbrook, M. B., Hirschman, E. C. (1982), The Experiential Aspects of Consumption: Consumer Fantasies, Feelings, and Fun, Journal of Consumer Research, 9 (2), 132–40.
Jiang, C., Duan, R., Jain, H. K., Liu, S., & Liang, K. (2015). Hybrid collaborative filtering for high-involvement products: A solution to opinion sparsity and dynamics. Decision Support Systems, 79, 195-208.
120
8
Ludwig, S., de Ruyter, K., Friedman, M., Brüggen, E.C., Wetzels, M. and Pfann, G. 2013. More than words: the influence of affective content and linguistic style matches in online reviews on conversion rates. Journal of Marketing. 77 (1), 87-103
Mlinar, V. (2015). Constraints on nanomaterial structure from experiment and theory: reconciling partial representations. Materials Research Express, 2(1), 015015.
Moe, W. W., Schweidel, D. A. (2012). Online product opinions: Incidence, evaluation, and evolution. Marketing Science, 31(3), 372-386.
Moore, S. G. (2015), Attitude Predictability and Helpfulness in Online Reviews: The Role of Explained Actions and Reactions, Journal of Consumer Research, Volume 42, Issue 1 (June), 30–44.
Okada, E. M. (2005), Justification Effects on Consumer Choice of Hedonic and Utilitarian Goods, Journal of Marketing Research, 42 (February), 43–53.
Ordenes, F.V., Ludwig, S., De Ruyter, K., Grewal, D., Wetzels, M. (2017), Unveiling What Is Written in the Stars: Analyzing Explicit, Implicit, and Discourse Patterns of Sentiment in Social Media, Journal of Consumer Research, 43(6), 875-894.
Parkinson, B. (2011), Interpersonal Emotion Transfer: Contagion and Social Appraisal. Interpersonal Emotion Transfer, 5. 428-439.
Peters, K., Kashima, Y. (2015), A multimodal theory of affect diffusion. Psychological Bulletin, 14(5), 966-992.
Ratchford, B. T. (1987), New insights about the FCB grid. Journal of Advertising Research, 27(4), 24–38.
Rime, B. (2009), Emotion elicits the social sharing of emotions. Theory and empirical review. Emotion Review, 1(1), 60-85.
Shafer, G. (1976), A mathematical theory of evidence (Vol. 42). Princeton university press.
Tang, T.Y., Fang, E.E., Wang, F. (2014), Is neutral really neutral? The effects of neutral user-generated content on product sales. Journal of Marketing, Vol. 78(4), 41-58.
Thelwall, M., Buckley, K., Paltoglou, G. (2012), Sentiment strength detection for the social web. Journal of the American Society for Information Science and Technology, 63(1), 163-173.
Voss, K. E., Spangenberg, E., Grohmann, B. (2003), Measuring the Hedonic and Utilitarian Dimensions of Consumer Attitude, Journal of Marketing Research, 40 (3), 310–20.
Zablocki, A., Makri, K. and Houston, M.J. (2019), Emotions within online reviews and their influence on product attitudes in Austria, USA and Thailand, Journal of Interactive Marketing, Vol. 46, pp. 20-39.

121
8
Ludwig, S., de Ruyter, K., Friedman, M., Brüggen, E.C., Wetzels, M. and Pfann, G. 2013. More than words: the influence of affective content and linguistic style matches in online reviews on conversion rates. Journal of Marketing. 77 (1), 87-103
Mlinar, V. (2015). Constraints on nanomaterial structure from experiment and theory: reconciling partial representations. Materials Research Express, 2(1), 015015.
Moe, W. W., Schweidel, D. A. (2012). Online product opinions: Incidence, evaluation, and evolution. Marketing Science, 31(3), 372-386.
Moore, S. G. (2015), Attitude Predictability and Helpfulness in Online Reviews: The Role of Explained Actions and Reactions, Journal of Consumer Research, Volume 42, Issue 1 (June), 30–44.
Okada, E. M. (2005), Justification Effects on Consumer Choice of Hedonic and Utilitarian Goods, Journal of Marketing Research, 42 (February), 43–53.
Ordenes, F.V., Ludwig, S., De Ruyter, K., Grewal, D., Wetzels, M. (2017), Unveiling What Is Written in the Stars: Analyzing Explicit, Implicit, and Discourse Patterns of Sentiment in Social Media, Journal of Consumer Research, 43(6), 875-894.
Parkinson, B. (2011), Interpersonal Emotion Transfer: Contagion and Social Appraisal. Interpersonal Emotion Transfer, 5. 428-439.
Peters, K., Kashima, Y. (2015), A multimodal theory of affect diffusion. Psychological Bulletin, 14(5), 966-992.
Ratchford, B. T. (1987), New insights about the FCB grid. Journal of Advertising Research, 27(4), 24–38.
Rime, B. (2009), Emotion elicits the social sharing of emotions. Theory and empirical review. Emotion Review, 1(1), 60-85.
Shafer, G. (1976), A mathematical theory of evidence (Vol. 42). Princeton university press.
Tang, T.Y., Fang, E.E., Wang, F. (2014), Is neutral really neutral? The effects of neutral user-generated content on product sales. Journal of Marketing, Vol. 78(4), 41-58.
Thelwall, M., Buckley, K., Paltoglou, G. (2012), Sentiment strength detection for the social web. Journal of the American Society for Information Science and Technology, 63(1), 163-173.
Voss, K. E., Spangenberg, E., Grohmann, B. (2003), Measuring the Hedonic and Utilitarian Dimensions of Consumer Attitude, Journal of Marketing Research, 40 (3), 310–20.
Zablocki, A., Makri, K. and Houston, M.J. (2019), Emotions within online reviews and their influence on product attitudes in Austria, USA and Thailand, Journal of Interactive Marketing, Vol. 46, pp. 20-39.
9
122
“INFLUENCING FACTORS ON INTENTIONAL USE OF CONVERSATIONAL COMMERCE”
Katja Wagner, Hanna Schramm-Klein, Anne Fota(University of Siegen)
Digital voice assistants have become part of consumers' everyday lives and reached a technological maturity with which they generate enough value to also become relevant for retail. This study investigates drivers and barriers of online shopping via voice, also called conversational commerce, on the intentional use. In comparison to traditional online shopping via keyboard, here, a linguistic input with the help of a digital voice assistant creates a purchase order. Digital voice assistants differ from traditional technologies using natural language meaning a natural and comfortable way of communication which can lead to anthropomorphism, so the transfer from human attributes to non-human actors. Referred to the parasocial interaction theory, we assume that consumer establish a social relationship with the assistant. Thus, voice assistants could have the potential to replace or to extend a human salesperson. With the help of a problem-oriented semi-structured interview guideline, we conducted a qualitative survey (N = 18) to identify relevant influencing factors which can foster or prevent consumers to use this new technology for buying online. Based on a derived category system developed through a qualitative content analysis, the findings show that distribution, trust/safety, the product category, convenience and anthropomorphism play a key role concerning the intentional use. Retailers can open a new sales channel und extend the customer journey by combining conversational shopping with online or stationary shopping.
123
“INFLUENCING FACTORS ON INTENTIONAL USE OF CONVERSATIONAL COMMERCE”
Digital voice assistants have become part of consumers' everyday lives and reached a technological maturity with which they generate enough value to also become relevant for retail. This study investigates drivers and barriers of online shopping via voice, also called conversational commerce, on the intentional use. In comparison to traditional online shopping via keyboard, here, a linguistic input with the help of a digital voice assistant creates a purchase order. Digital voice assistants differ from traditional technologies using natural language meaning a natural and comfortable way of communication which can lead to anthropomorphism, so the transfer from human attributes to non-human actors. Referred to the parasocial interaction theory, we assume that consumer establish a social relationship with the assistant. Thus, voice assistants could have the potential to replace or to extend a human salesperson. With the help of a problem-oriented semi-structured interview guideline, we conducted a qualitative survey (N = 18) to identify relevant influencing factors which can foster or prevent consumers to use this new technology for buying online. Based on a derived category system developed through a qualitative content analysis, the findings show that distribution, trust/safety, the product category, convenience and anthropomorphism play a key role concerning the intentional use. Retailers can open a new sales channel und extend the customer journey by combining conversational shopping with online or stationary shopping.
1
RETHINKING THE COMMERCIAL SPACE OF PARISIAN RAILWAY STATIONS: TOWARD A HYBRID ECOSYSTEM
Marie-Catherine Paquier
European Business School Paris – CNAM LIRSA EA 4603
Martine Deparis
European Business School Paris
Mariem El Euch Maalej
Inseec School of Business
KeywordsRailway stations - Ecosystem - Mobiquity - Smartphone usage - Ethnography
124
2
Purpose and introductionTokyo, Saint Pancras, Atocha, Gare Montparnasse... Railway stations are being transformed into commercial spaces, which are contributing to the strong growth of the Travel Retail sector (Xerfi, 2018). Representing one third of sales in transit areas, they are growth drivers for retailers, sources of revenue up to five times more efficient than shopping malls (Gaillard and Marton, 2018). Considered consumption spaces, transit areas are the subject of multidisciplinary research in sociology, geography and marketing (Bergadaà, 2009; Capo, 2015; Dang Vu and Jeaneau, 2008). Nevertheless, to our knowledge no retail research has focused on the railway station as an ecosystem─ conducive to new modes of consumption via smartphone ─ combining mobility and ubiquity called mobiquity1 by Schierz et al. (2010). Our research echoes the calls for research about transformation of public spaces in marketplaces (Castilhos and Dolbec, 2018). Framed by business ecosystem literature, and nourished by ethnographic data collection through observation and interviews with various stakeholders, this work aims firstly to characterize a hybridization between a travel-oriented ecosystem and a consumption-oriented ecosystem within the newly refurbished Parisian railway stations, and secondly to understand if, and how, connected travellers become consumers by interacting with this ecosystem.
Conceptual frameworkThe railway station in the context of mobiquityPostmodern society is constantly conquering time and space against a backdrop of widespread acceleration and a juxtaposition of different rhythms of life and multitasking activities (Rosa, 2016). In this context, the use of digital tools promotes protean mobility, which is adjusted in real time to situations experienced simultaneously in physical and virtual spaces (Balasubramanian et al., 2002). Mobiquity, an aggregation of ubiquity and mobile technologies, makes it possible to multiply spatial mobility in a constrained timeframe(Ascher, 2006; Schierz et al., 2010).
Mobiquitic behaviour concerns shopping experiences when the connected consumer chooses between points of sales and integrates his purchasing path into the course of his daily life while minimising the time and effort required. (Bardhi and Eckhardt, 2017; Belk, 2013; Dion and Michaud-Trevinal, 2004; Voropanova and Deparis, 2018). This purchasing process resembles a constellation of physical and virtual contact points in a controlled space-time (Lallement and Gourmelen, 2018; Badot et al., 2019). The smartphone, one of the most widely used connected objects in mobility today, combines continuity, immediacy, portability, searchability (Okazaki and Mendez, 2013). It also offers the feature of combiningthe temporal convenience of "anytime" with the spatial convenience of "anywhere" (Wagner, 2011).
The railway station connects its neighbourhood with the transport network, allows transfer between different modes of travel, and facilitates the commercial use of its location (Zemp et al., 2011) in a constrained and planned time (Baron, 2019).Its spatial dimension evolved considerably: massive and central in the 19th century, the railway station became invisible and underground in the 20th century, and has today one again become central (Bellanger and
1 “Mobiquity" is an individual consumer characteristic that expresses the need to benefit from a service at any moment (time), anywhere (space) and through any media (object). The concept "individual mobility" developed by Schierz et al (2010) identifies a significant and positive link between individual mobility and the intention to use mobile services.
125
2
Purpose and introductionTokyo, Saint Pancras, Atocha, Gare Montparnasse... Railway stations are being transformed into commercial spaces, which are contributing to the strong growth of the Travel Retail sector (Xerfi, 2018). Representing one third of sales in transit areas, they are growth drivers for retailers, sources of revenue up to five times more efficient than shopping malls (Gaillard and Marton, 2018). Considered consumption spaces, transit areas are the subject of multidisciplinary research in sociology, geography and marketing (Bergadaà, 2009; Capo, 2015; Dang Vu and Jeaneau, 2008). Nevertheless, to our knowledge no retail research has focused on the railway station as an ecosystem─ conducive to new modes of consumption via smartphone ─ combining mobility and ubiquity called mobiquity1 by Schierz et al. (2010). Our research echoes the calls for research about transformation of public spaces in marketplaces (Castilhos and Dolbec, 2018). Framed by business ecosystem literature, and nourished by ethnographic data collection through observation and interviews with various stakeholders, this work aims firstly to characterize a hybridization between a travel-oriented ecosystem and a consumption-oriented ecosystem within the newly refurbished Parisian railway stations, and secondly to understand if, and how, connected travellers become consumers by interacting with this ecosystem.
Conceptual frameworkThe railway station in the context of mobiquityPostmodern society is constantly conquering time and space against a backdrop of widespread acceleration and a juxtaposition of different rhythms of life and multitasking activities (Rosa, 2016). In this context, the use of digital tools promotes protean mobility, which is adjusted in real time to situations experienced simultaneously in physical and virtual spaces (Balasubramanian et al., 2002). Mobiquity, an aggregation of ubiquity and mobile technologies, makes it possible to multiply spatial mobility in a constrained timeframe(Ascher, 2006; Schierz et al., 2010).
Mobiquitic behaviour concerns shopping experiences when the connected consumer chooses between points of sales and integrates his purchasing path into the course of his daily life while minimising the time and effort required. (Bardhi and Eckhardt, 2017; Belk, 2013; Dion and Michaud-Trevinal, 2004; Voropanova and Deparis, 2018). This purchasing process resembles a constellation of physical and virtual contact points in a controlled space-time (Lallement and Gourmelen, 2018; Badot et al., 2019). The smartphone, one of the most widely used connected objects in mobility today, combines continuity, immediacy, portability, searchability (Okazaki and Mendez, 2013). It also offers the feature of combiningthe temporal convenience of "anytime" with the spatial convenience of "anywhere" (Wagner, 2011).
The railway station connects its neighbourhood with the transport network, allows transfer between different modes of travel, and facilitates the commercial use of its location (Zemp et al., 2011) in a constrained and planned time (Baron, 2019).Its spatial dimension evolved considerably: massive and central in the 19th century, the railway station became invisible and underground in the 20th century, and has today one again become central (Bellanger and
1 “Mobiquity" is an individual consumer characteristic that expresses the need to benefit from a service at any moment (time), anywhere (space) and through any media (object). The concept "individual mobility" developed by Schierz et al (2010) identifies a significant and positive link between individual mobility and the intention to use mobile services.
3
Marzloff, 1997). As a hub of exchange and interconnection within a global urban plan, the railway station is now the synthesis of transport infrastructure, real estate, and marketplace(Riot, 2015): it thus promotes economic and social synergies by playing the role of City Booster (Lévy, 2008; Gasnier, 2007; Ropert, 2017).
Railway station spaces, historically dedicated to public passenger transport services, are being transformed into commercial spaces co-managed by public/private partnerships (Castilhos and Dolbec, 2018; Dang Vu and Jeaneau, 2008). The station has therefore become a liquid space (Bauman, 2013), a sort of hyper-lieu saturated with spatial, digital, commercial and logistical interactions (Lussault, 2017), and where digitalisation is intended to make travel as fluid as possible for a mobiquited traveller. The major Parisian railway stations are thus points of support for a shopping life via smartphone, which is currently being challenged by a group ofarchitects calling for commercial moderation in often remarkable heritage sites (Verhaest-Cochery, 2019).
Theoretical framework about business ecosystemsThe business ecosystem gathers heterogeneous actors involved in a common strategic vision oriented towards innovation (Moore, 1993). As suggested by Iansiti and Levien (2004), the actors are various species who play the roles of keystones, dominators or niche players. The coopetition between these species is defined as a horizontal form of cooperation combining collective and competitive strategies (Bresser, 1988) that can be cooperation-dominant, equality, or competition-dominant (Bengtsson and Kock, 2000). Relationships between the actors can be analysed through their architecture –centralized around a leader-player, or de-centralized with a communitarian network (Assens, 2003) –; through the nature of their coordination – contractual or shared (Daidj, 2011) –; and through their geographic distribution– concentrated or deployed (Inkpen and Tsang, 2005). The multilayer approach highlights the three dimensions of a business ecosystem: whereas upperground actors bring new ideas and trends without being directly involved in the commercial or industrial domain, the actors of the middle-ground bring, manage and provide the structure necessary to make creative material economically viable. Underground actors generate the informal culture that nourishes and influences the ecosystem (Simon, 2009).These different ecosystem approaches, nested in one another, have never been mobilized to characterize the interactions between the different actors involved in a consumption context. The originality of our work is to use this framework for the analysis of the ecosystem of the new-generation railway station (Appendix 1).
MethodologyIn order to characterize the ecosystem of the new Parisian railway stations and to understand if, and how, the connected travellers become consumers, we conducted a qualitative ethnographic study (Belk et al., 2013). To this aim, three data-collection stages were carried out. First, we interviewed 11 experts and professionals representing the stakeholders regarding the commercial transformation of the railway stations (Appendix 2). Second, we conducted 9 hours of in-situ observation in the railway station “Gare Montparnasse” at various times during the week (Arnould and Wallendorf, 1994). This made it possible to identify travellers’ typical journeys from their arrival at the station to their train’s departure.Third, we interviewed 18 mainline travellers using an interview guide that combined questions about memories they had of journeys through the station and projective scenarios for a departing journey (Appendix 3). The transcription of the semi-directive interviews (14hours with experts and 17 hours with travellers) and the comparison of our field note observations led to a manual coding by the authors (Belk et al., 2013). An in-depth comparative analysis led to the emergence of a traveller typology (from interviews with
126
4
experts, Appendix 4) and six different themes related to travellers’ experiences at the railway station (from interviews with travellers, Appendix 5).
FindingsThe railway station is a hybrid ecosystemInterviews with experts and upstream stakeholders fed our analysis of ecosystem players and their relationships with each other through data. The incontestable leader player, SNCF SA, manager of public spaces owned by the State, deploys its centralized public culture through its subsidiary Gares and Connexion (dedicated to station management) which assigns the management and deployment of commercial spaces to Retail and Connexion.
Thus, a travel-oriented ecosystem and a consumption-oriented ecosystem coexist and form a hybrid ecosystem. This development of merchant services at the station, carried out in partnership with retail property companies, retailers and brands, contributes to the profitability of the initially public space. Three main segments of individuals frequenting the stations emerged from our interviews: travellers taking a train, their companions, and the "passers-by". Of these three segments, that of travellers gives rise to an in-depth typology by our respondents (Appendix 4). The interviews with professionals show that in transformed stations the offer to be developed must include both reassuring trade located on the path of travellers as well fluid and adaptable trade, which creates surprise, and which displaces the flow of travellers and passers-by.
Regarding the data, the business ecosystem of French stations is characterized by a silo architecture, probably inherited from successive additions of semi-private and then completely private players to the historic SNCF public service. Indeed, several apps2 intended to make life easier for travellers/consumers coexist without interacting with each other. This bursting of data in hermetic silos ─ both within the SNCF and between actors in a situation of coopetition ─ resonates with the beginnings of multichannel distribution (Vanheems, 2009).
Finally, the railway business ecosystem is characterized by two essential elements: 1/ a hybridization between a travel-oriented ecosystem and a consumption-oriented ecosystem and 2/ a silo data architecture.
Travellers are only grazing the consumption ecosystemAnalysis of 18 mainline travellers’ verbatim reports reveals strong similarities in the spatial and temporal development of the journey in stations (Appendix 5). Indeed, for all the profiles, the journey upon arrival at the station involves a ritualization of three anticipated gestures: 1/checking the timetable and the platform, 2/buying products related to the journey (newspapers or books, catering or snacking, gifts for guests) and 3/getting on the train. Depending on the waiting time, the succession of the three gestures is the same; only the time assigned to each changes with the possible introduction of a time to relax and discover new shops without the intention of buying. "The journey starts in the station" and the waiting time is a travel time that incorporates a bubble of consumption linked to the journey, and if possible a time of relaxation (reading, daydreaming, listening to the piano, using the smartphone).
We note that the use of the smartphone is variable according to age and can be slowed down by fear of theft or battery discharge before the trip. The mobile phone maintains the link
2 “OUISNCF” for the purchase of tickets, “Gare 360” for orientation at the station, “En Gare” for easy access to market services, “Wiish” for loyalty to the brands/retailers managed by the main concessionaire, and finally all the apps offered by the different brands present in the station.
127
4
experts, Appendix 4) and six different themes related to travellers’ experiences at the railway station (from interviews with travellers, Appendix 5).
FindingsThe railway station is a hybrid ecosystemInterviews with experts and upstream stakeholders fed our analysis of ecosystem players and their relationships with each other through data. The incontestable leader player, SNCF SA, manager of public spaces owned by the State, deploys its centralized public culture through its subsidiary Gares and Connexion (dedicated to station management) which assigns the management and deployment of commercial spaces to Retail and Connexion.
Thus, a travel-oriented ecosystem and a consumption-oriented ecosystem coexist and form a hybrid ecosystem. This development of merchant services at the station, carried out in partnership with retail property companies, retailers and brands, contributes to the profitability of the initially public space. Three main segments of individuals frequenting the stations emerged from our interviews: travellers taking a train, their companions, and the "passers-by". Of these three segments, that of travellers gives rise to an in-depth typology by our respondents (Appendix 4). The interviews with professionals show that in transformed stations the offer to be developed must include both reassuring trade located on the path of travellers as well fluid and adaptable trade, which creates surprise, and which displaces the flow of travellers and passers-by.
Regarding the data, the business ecosystem of French stations is characterized by a silo architecture, probably inherited from successive additions of semi-private and then completely private players to the historic SNCF public service. Indeed, several apps2 intended to make life easier for travellers/consumers coexist without interacting with each other. This bursting of data in hermetic silos ─ both within the SNCF and between actors in a situation of coopetition ─ resonates with the beginnings of multichannel distribution (Vanheems, 2009).
Finally, the railway business ecosystem is characterized by two essential elements: 1/ a hybridization between a travel-oriented ecosystem and a consumption-oriented ecosystem and 2/ a silo data architecture.
Travellers are only grazing the consumption ecosystemAnalysis of 18 mainline travellers’ verbatim reports reveals strong similarities in the spatial and temporal development of the journey in stations (Appendix 5). Indeed, for all the profiles, the journey upon arrival at the station involves a ritualization of three anticipated gestures: 1/checking the timetable and the platform, 2/buying products related to the journey (newspapers or books, catering or snacking, gifts for guests) and 3/getting on the train. Depending on the waiting time, the succession of the three gestures is the same; only the time assigned to each changes with the possible introduction of a time to relax and discover new shops without the intention of buying. "The journey starts in the station" and the waiting time is a travel time that incorporates a bubble of consumption linked to the journey, and if possible a time of relaxation (reading, daydreaming, listening to the piano, using the smartphone).
We note that the use of the smartphone is variable according to age and can be slowed down by fear of theft or battery discharge before the trip. The mobile phone maintains the link
2 “OUISNCF” for the purchase of tickets, “Gare 360” for orientation at the station, “En Gare” for easy access to market services, “Wiish” for loyalty to the brands/retailers managed by the main concessionaire, and finally all the apps offered by the different brands present in the station.
5
between the traveller and his ecosystems, both personal (websites, Netflix, Spotify, Youtube and social media) and professional (e-mails, online courses), and creates an additional link with the travel-oriented ecosystem (e-ticket, App OuiSNCF, App Gare 360). However, the mobile phone is not used to interact with the consumption-oriented ecosystem.
Anticipated, ritualised and connected, the journey through the station is that of an individual traveller and not a consumer. For some respondents, the Parisian station is seen as a heritage space dedicated to travel and whose recent commercial developments provide embellishment, light, life and an improved waiting experience. For others, it is a complete opposite perception as some of our respondents find the station cold in both senses of the word, stressful, anxiety provoking and not very safe. It shows not only the absence of a physical appropriation of the station but also the desire to mobilize a personal ecosystem to comfort them, to escape and to be entertained. However, for all interviewers Parisian railway stations aren’t seen as a shopping space in their own right, and some voices even express a form of resistance to the commodification of space-time historically reserved for contemplative phases of transition towards departure.
Values and future researchThe main theoretical contribution of this research is to mobilize the business ecosystem literature (Moore, 1993; Simon, 2009) to analyse the transformation of a public space into a market space (Castilhos and Dolbec, 2018). In the middle-ground, the players are in a situation of predominantly competitive cooperation orchestrated by the SNCF leader-playerand constitute a hybrid ecosystem. A travel-oriented and a consumption-oriented ecosystem co-exist without really interconnecting, except when travellers purchase products to improvetheir traveling experience. In their peregrinations, individuals remain travellers who re-enchant their trips with bubbles of relaxation, graze consumption through purchases linked to their travel, and escape by interacting with their personal and professional ecosystems thanks to their smartphone. The upper ground of this hybrid ecosystem is imbued with the monopolistic and public service culture of SNCF SA, as well as with the patrimonial socio-cultural perception of the Parisian railway stations. Finally, the under-ground layer reveals resistance both from a collective movement of architects and from the mainlines travellers themselves, who challenge the market’s invasion of spaces and moments which were formally free of consumption.
Before making a practical and complete contribution, this work will undergo further research. To begin, we will pursue our data collection among travellers who use suburban train lines for daily journeys, probably seeking convenience on their route. We also plan to interview the retailers involved in the consumption-oriented ecosystem in order to better understand the way they try to interact with the other stakeholders.
128
6
ReferencesArnould, E., and Wallendorf, M. (1994), "Market-Oriented Ethnography: Interpretation Building and Marketing Strategy Formation", Journal of Marketing Research, XXXI(November), pp. 484-504.
Ascher, F. (2006), "Le futur au quotidien: de la fin des routines à l'individualisation des espaces-temps", Dans N. Aubert, L'individu hypermoderne (pp. 273-290). Paris: Erès.
Assens, C. (2003), "Le réseau d'entreprises: vers une synthèse des connaissances", Management International, 24(1), pp. 120-136.
Badot, O., Lemoine, J., and Ochs, A. (2019), "Distribution 4.0: une nouvelle révolution commerciale?", L'économie politique, 1(81), pp. 8-22.
Balasubramanian, S., Peterson, R., and Jarvenpaa, S. (2002), "Exploring the implications of m-commerce for markets and marketing", Journal of the Academy of Marketing Science, 20(4), pp. 348-361.
Bardhi, F., and Eckhardt, G. (2017), "Liquid consumption", Journal of Consumer Research, 44(3), pp. 582-597.
Baron, N. (2019), "Designing Paris Gare du Nord for pedestrians or for clients? New retail patterns as flow optimization strategy", European planning studies, 27(3), pp. 618-637.
Bauman, Z. (2013), Liquid modernity, John Wiley and Sons.
Belk, R. (2013), "Extended-self in a digital world", Journal of Consumer Research, 40(3), pp. 477-500.
Belk, R., Eileen F., and Kozinets R.V. (2013), Qualitative Consumer and Marketing Research,London:Sage.
Bellanger, F., and Marzloff, B. (1997), Transit: les lieux et les temps de la mobilité, e-book: FeniXX.
Bengtsson, M., and Kock, S. (2000), "Coopetition in business networks - To cooperate and compete simultaneously", Industrial Marketing Management, 29, pp. 411-426.
Bergadaà, M. (2009), "Le temps économique et le temps psychologique du voyageur dans un aéroport international", Revue Française de Gestion, 236, pp. 13-23.
Bresser, R. (1988), Matching collective and compettive strategies", Strategic Management Journal, 9, pp. 375-385.
Cao L., and Li L. (2018), "Determinants of retailers' cross-channel integration: an innovation diffusion perspective on omni-channel retailing", Journal of Interactive Marketing (44), pp. 1–16.
Capo, C. (2015), "Proximité et commerce en gare - La consommation en gare au Japon",Colloque Etienne Thil. Paris: ESCP-Europe.
Castilhos, R. B., and Dolbec, P. Y. (2018), "Conceptualizing spatial types: characteristics, transitions, and research avenues", Marketing Theory, 18(2), pp. 154-168.
Daidj, N. (2011), "Les écosystèmes d'affaires: une nouvelle forme d'organisation en réseau?",Management et Avenir, 46(6), pp. 105-130.
Dang Vu, H., and Jeaneau, H. (2008), "Concevoir un espace de transit et de consommation: la gestion de site dans les gares parisiennes", Espaces et Sociétés(135), pp. 45-62.
129
6
ReferencesArnould, E., and Wallendorf, M. (1994), "Market-Oriented Ethnography: Interpretation Building and Marketing Strategy Formation", Journal of Marketing Research, XXXI(November), pp. 484-504.
Ascher, F. (2006), "Le futur au quotidien: de la fin des routines à l'individualisation des espaces-temps", Dans N. Aubert, L'individu hypermoderne (pp. 273-290). Paris: Erès.
Assens, C. (2003), "Le réseau d'entreprises: vers une synthèse des connaissances", Management International, 24(1), pp. 120-136.
Badot, O., Lemoine, J., and Ochs, A. (2019), "Distribution 4.0: une nouvelle révolution commerciale?", L'économie politique, 1(81), pp. 8-22.
Balasubramanian, S., Peterson, R., and Jarvenpaa, S. (2002), "Exploring the implications of m-commerce for markets and marketing", Journal of the Academy of Marketing Science, 20(4), pp. 348-361.
Bardhi, F., and Eckhardt, G. (2017), "Liquid consumption", Journal of Consumer Research, 44(3), pp. 582-597.
Baron, N. (2019), "Designing Paris Gare du Nord for pedestrians or for clients? New retail patterns as flow optimization strategy", European planning studies, 27(3), pp. 618-637.
Bauman, Z. (2013), Liquid modernity, John Wiley and Sons.
Belk, R. (2013), "Extended-self in a digital world", Journal of Consumer Research, 40(3), pp. 477-500.
Belk, R., Eileen F., and Kozinets R.V. (2013), Qualitative Consumer and Marketing Research,London:Sage.
Bellanger, F., and Marzloff, B. (1997), Transit: les lieux et les temps de la mobilité, e-book: FeniXX.
Bengtsson, M., and Kock, S. (2000), "Coopetition in business networks - To cooperate and compete simultaneously", Industrial Marketing Management, 29, pp. 411-426.
Bergadaà, M. (2009), "Le temps économique et le temps psychologique du voyageur dans un aéroport international", Revue Française de Gestion, 236, pp. 13-23.
Bresser, R. (1988), Matching collective and compettive strategies", Strategic Management Journal, 9, pp. 375-385.
Cao L., and Li L. (2018), "Determinants of retailers' cross-channel integration: an innovation diffusion perspective on omni-channel retailing", Journal of Interactive Marketing (44), pp. 1–16.
Capo, C. (2015), "Proximité et commerce en gare - La consommation en gare au Japon",Colloque Etienne Thil. Paris: ESCP-Europe.
Castilhos, R. B., and Dolbec, P. Y. (2018), "Conceptualizing spatial types: characteristics, transitions, and research avenues", Marketing Theory, 18(2), pp. 154-168.
Daidj, N. (2011), "Les écosystèmes d'affaires: une nouvelle forme d'organisation en réseau?",Management et Avenir, 46(6), pp. 105-130.
Dang Vu, H., and Jeaneau, H. (2008), "Concevoir un espace de transit et de consommation: la gestion de site dans les gares parisiennes", Espaces et Sociétés(135), pp. 45-62.
7
Dion, D., and Michaud-Trevinal, A. (2004), "Les enjeux de la mobilité des consommateurs: de la gestion des stocks à la gestion des flux de clientèle", Décisions Marketing, 34, pp. 17-27.
Gaillard, T., and Marton, M. (2018), Travel Retail 2018 - les commerces en gare, Paris: Cushman and Wakefield.
Gasnier, A. (2007), Les temps de mobilités des consommateurs au coeur des nouvelles logiques d'imp"lantation de l'offre commerciale", Espace populations sociétés, 2-3, pp. 243-254.
Iansiti, M., and Levien, R. (2004), "Strategy as Ecology", Harvard Business Review, 82(3), pp.68-78.
Inkpen, A., and Tsang, E. (2005), "Social Capital, Networks, and Knowledge Transfer",Academy of Management Review, 30, pp. 146-165.
Lallement, J., and Gourmelen, A. (2018), "Le temps des consommateurs: état des recherches et perspectives", Recherche et Applications en Marketing, 33(4), pp. 98-131.
Lévy, A. (2008), La renaissance des gares, Medium, 2, pp. 39-47.
Lussault, M. (2017), Hyper-lieux. Les nouvelles géographies de la mondialisation, Paris: Seuil.
Moore, J. (1993), "Predators and prey: a new ecology of competition", Harvard Business Review, May-June, pp. 75-86.
Okazaki, S., and Mendez, F. (2013), "Perceived ubiquity in mobile services", Journal of Interactive Marketing, 27(2), pp. 98-111.
Riot, E. (2015), L’agencement des grandes gares historiques pour le marché ferroviaire européen, L’intégration des principes concurrentiels dans l’aménagement et la gestion des gares de London St Pancras, Paris Nord et Milano Centrale. Univ. Paris-Est: Thèse de Doctorat en Aménagement sous la dir. de Nacima Baron et Vincent Kaufmann.
Ropert, P. (2017), City Booster: les gares à l'aube d'une révolution, Paris: Débats Publics Editions.
Rosa, H. (2016), "La logique d'accélération s'empare de notre esprit et de notre corps", CERAS Revue Projet, 6(355), pp. 6-16.
Schierz, P. G., O. Schilke, and B. W. Wirtz. 2010. Understanding consumer acceptance of mobile payment services: An empirical analysis. Electronic Commerce Research and Applications, 9(3), pp. 209-216.
Simon, L. (2009), "Underground, upperground et middle-ground: les collectifs créatifs et la capacité créative de la ville", Management International, 13, pp. 37-51.
Vanheems, R. (2009), "Distribution multicanal: Pourquoi les clients mixtes doivent faire l'objet d'une attention particulière?", Décisions Marketing(55), pp. 41-52.
Verhaest-Cochery, V. (2019), "Les gares parisiennes: un renouveau d'ici 2024", Revue Générale des Chemins de Fer, Octobre (297), pp. 36-39
Voropanova, E., and Deparis, M. (2018), Le rapport à l'espace et au temps du consommateur connecté en mobilité, Dans R. Perrigot, Retailing et localisation: une approche transdisciplinaire, pp. 325-343, Aix en Provence: Presses Univesrsitaires de Provence.
Wagner, J. (2011), "Anytime/Anywhere - Playing catch up with the mond of the smartphone consumer", International Journal of Mobile Marketing, 6(1), pp. 28-53.
Xerfi. (2018), Les stratégies dans le travel retail , ref. 8DIS80 / XPT. Paris, France: Groupe Xerfi.

130
8
Zemp, S., Stauffacher, M., and Lang, D. S. (2011), "Generic functions of railways stations-Aconceptual basis for the development of common system under standing and assessment criteria", Transport Policy, 18, pp. 446-455.
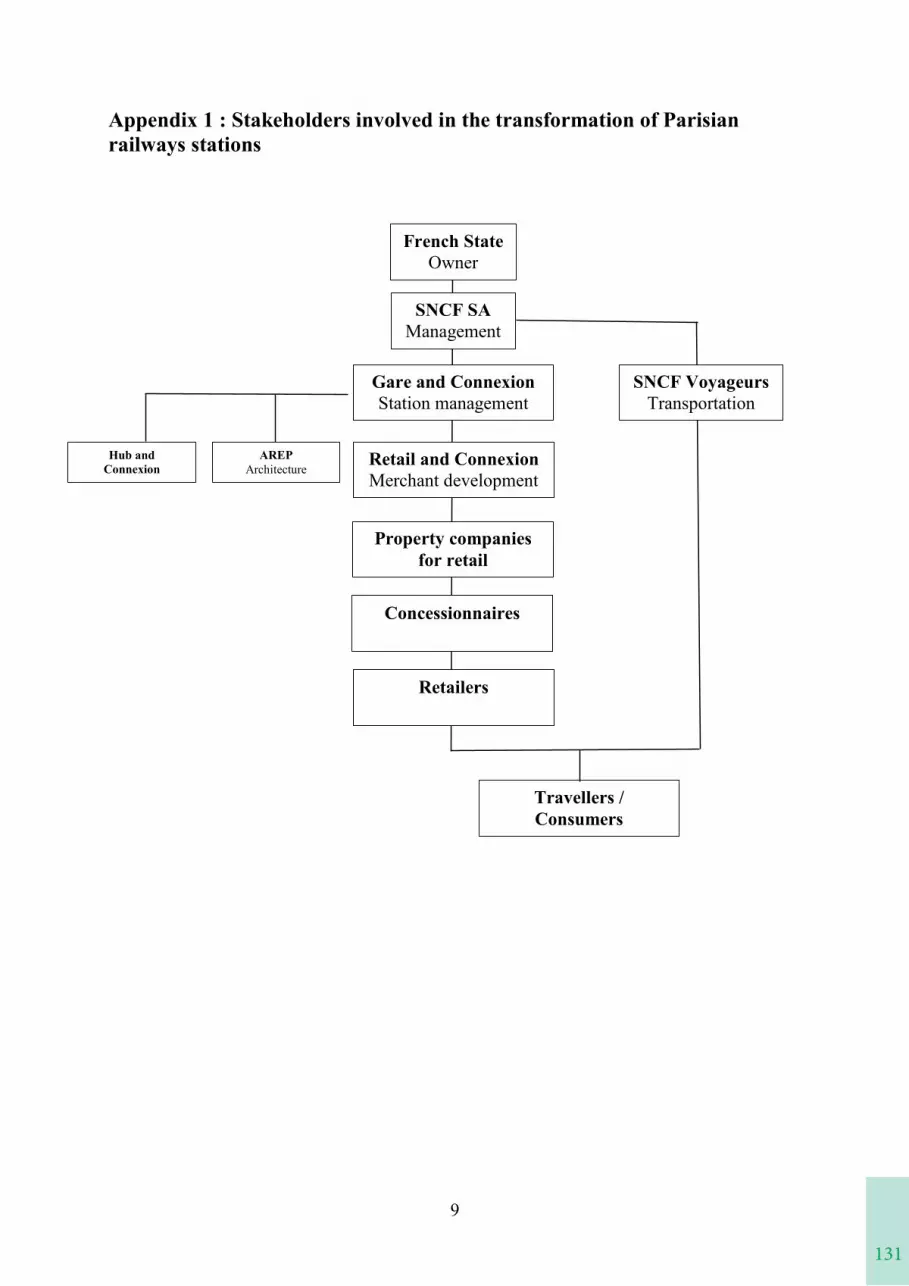
131
8
Zemp, S., Stauffacher, M., and Lang, D. S. (2011), "Generic functions of railways stations-Aconceptual basis for the development of common system under standing and assessment criteria", Transport Policy, 18, pp. 446-455.
9
Appendix 1 : Stakeholders involved in the transformation of Parisian railways stations
French StateOwner
SNCF SAManagement
Gare and ConnexionStation management
Retail and ConnexionMerchant development
AREPArchitecture
Hub andConnexion
Property companies for retail
Concessionnaires
SNCF VoyageursTransportation
Retailers
Travellers / Consumers
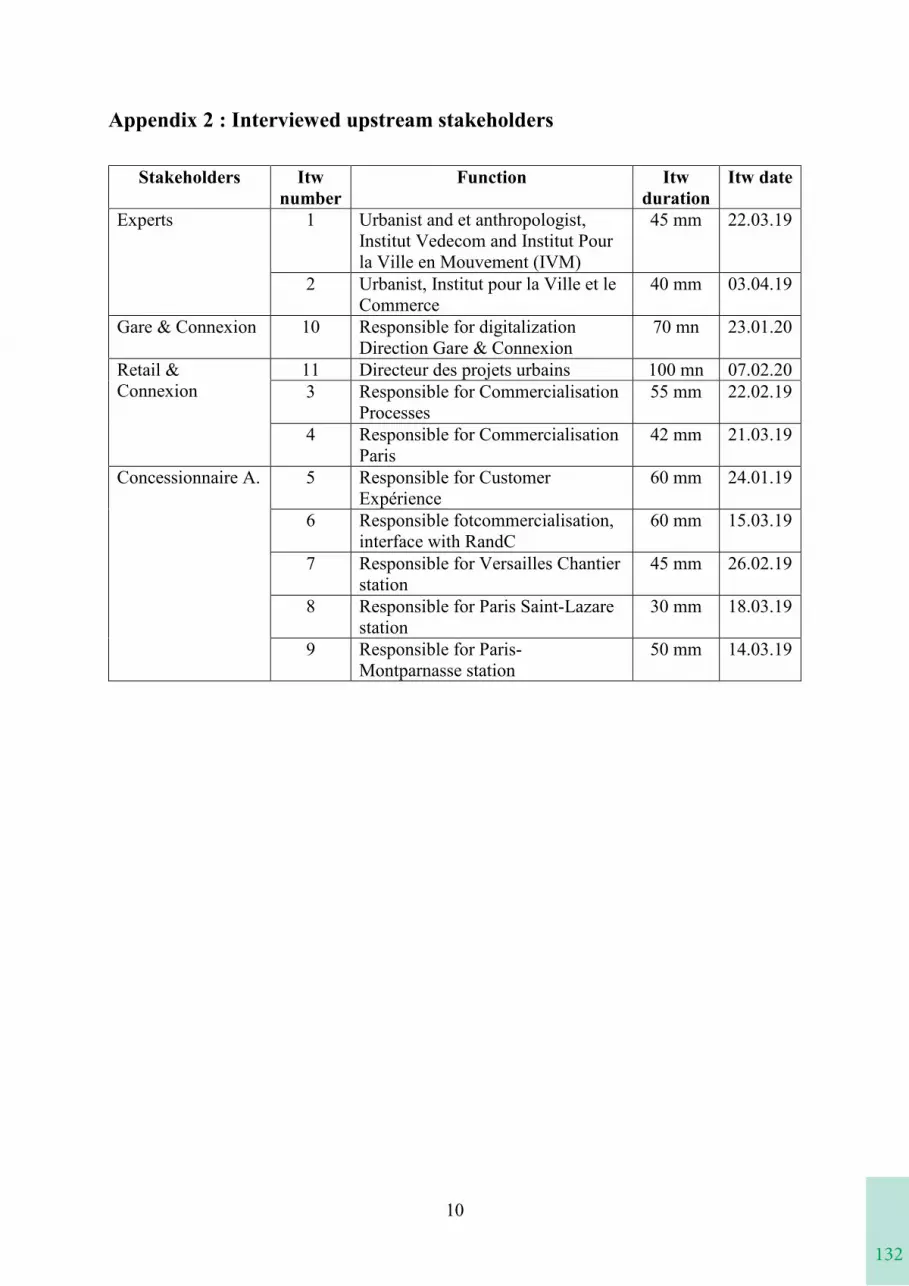
132
10
Appendix 2 : Interviewed upstream stakeholders
Stakeholders Itw number
Function Itw duration
Itw date
Experts 1 Urbanist and et anthropologist,Institut Vedecom and Institut Pour la Ville en Mouvement (IVM)
45 mm 22.03.19
2 Urbanist, Institut pour la Ville et le Commerce
40 mm 03.04.19
Gare & Connexion 10 Responsible for digitalizationDirection Gare & Connexion
70 mn 23.01.20
Retail & Connexion
11 Directeur des projets urbains 100 mn 07.02.203 Responsible for Commercialisation
Processes55 mm 22.02.19
4 Responsible for Commercialisation Paris
42 mm 21.03.19
Concessionnaire A. 5 Responsible for Customer Expérience
60 mm 24.01.19
6 Responsible fotcommercialisation, interface with RandC
60 mm 15.03.19
7 Responsible for Versailles Chantier station
45 mm 26.02.19
8 Responsible for Paris Saint-Lazare station
30 mm 18.03.19
9 Responsible for Paris-Montparnasse station
50 mm 14.03.19
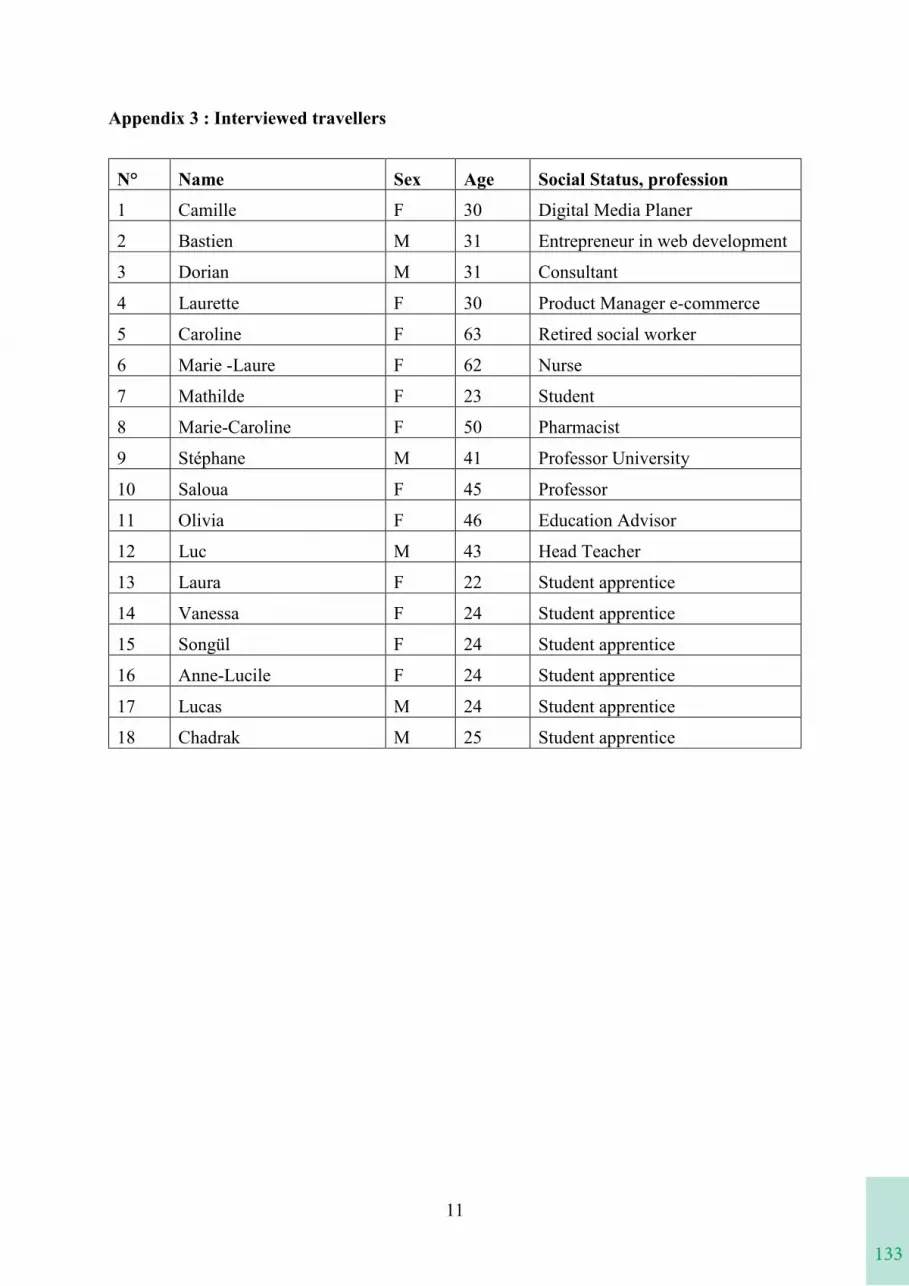
133
10
Appendix 2 : Interviewed upstream stakeholders
Stakeholders Itw number
Function Itw duration
Itw date
Experts 1 Urbanist and et anthropologist,Institut Vedecom and Institut Pour la Ville en Mouvement (IVM)
45 mm 22.03.19
2 Urbanist, Institut pour la Ville et le Commerce
40 mm 03.04.19
Gare & Connexion 10 Responsible for digitalizationDirection Gare & Connexion
70 mn 23.01.20
Retail & Connexion
11 Directeur des projets urbains 100 mn 07.02.203 Responsible for Commercialisation
Processes55 mm 22.02.19
4 Responsible for Commercialisation Paris
42 mm 21.03.19
Concessionnaire A. 5 Responsible for Customer Expérience
60 mm 24.01.19
6 Responsible fotcommercialisation, interface with RandC
60 mm 15.03.19
7 Responsible for Versailles Chantier station
45 mm 26.02.19
8 Responsible for Paris Saint-Lazare station
30 mm 18.03.19
9 Responsible for Paris-Montparnasse station
50 mm 14.03.19
11
Appendix 3 : Interviewed travellers
N° Name Sex Age Social Status, profession
1 Camille F 30 Digital Media Planer
2 Bastien M 31 Entrepreneur in web development
3 Dorian M 31 Consultant
4 Laurette F 30 Product Manager e-commerce
5 Caroline F 63 Retired social worker
6 Marie -Laure F 62 Nurse
7 Mathilde F 23 Student
8 Marie-Caroline F 50 Pharmacist
9 Stéphane M 41 Professor University
10 Saloua F 45 Professor
11 Olivia F 46 Education Advisor
12 Luc M 43 Head Teacher
13 Laura F 22 Student apprentice
14 Vanessa F 24 Student apprentice
15 Songül F 24 Student apprentice
16 Anne-Lucile F 24 Student apprentice
17 Lucas M 24 Student apprentice
18 Chadrak M 25 Student apprentice
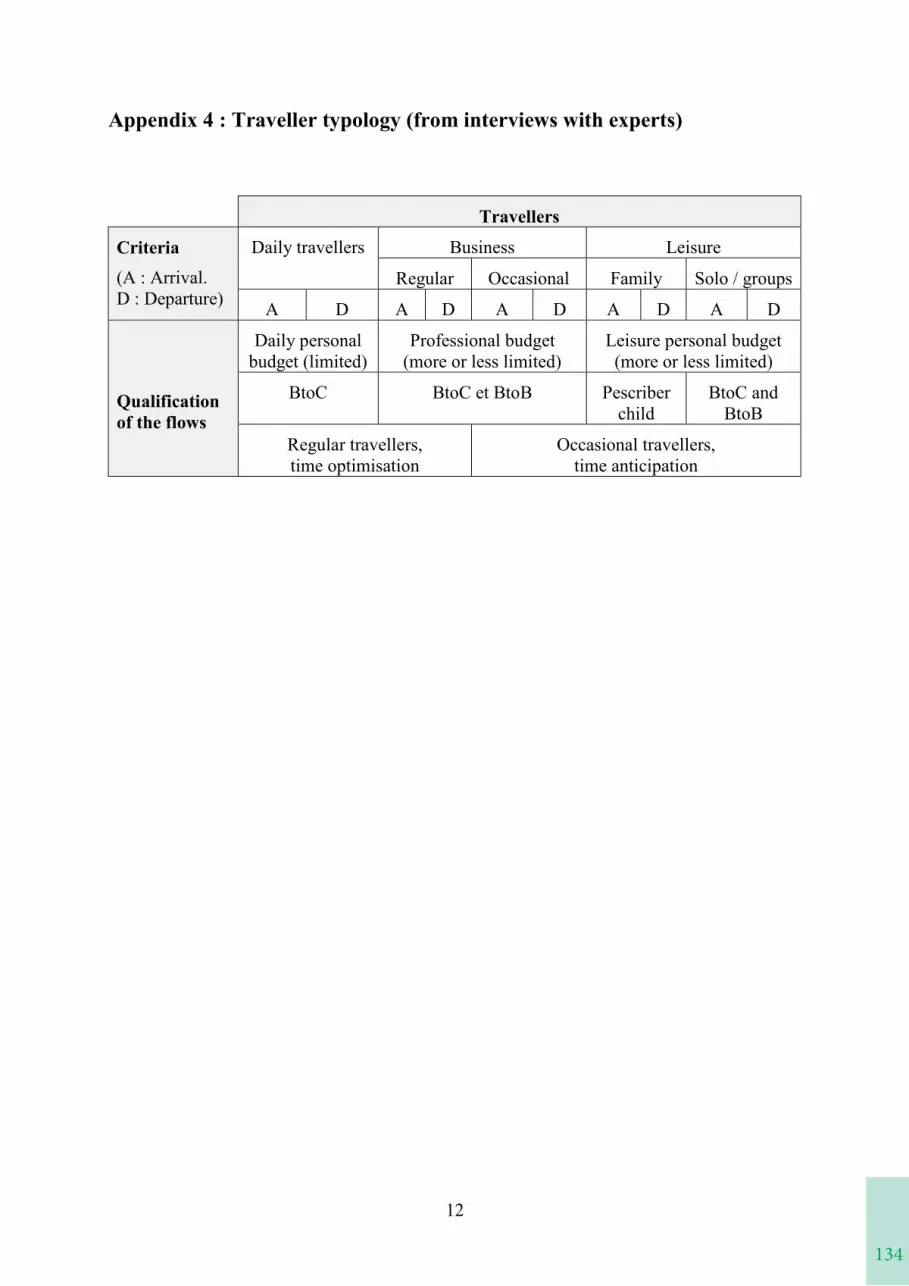
134
12
Appendix 4 : Traveller typology (from interviews with experts)
Travellers
Criteria(A : Arrival.D : Departure)
Daily travellers Business Leisure
Regular Occasional Family Solo / groups
A D A D A D A D A D
Qualificationof the flows
Daily personal budget (limited)
Professional budget (more or less limited)
Leisure personal budget (more or less limited)
BtoC BtoC et BtoB Pescriber child
BtoC andBtoB
Regular travellers, time optimisation
Occasional travellers, time anticipation
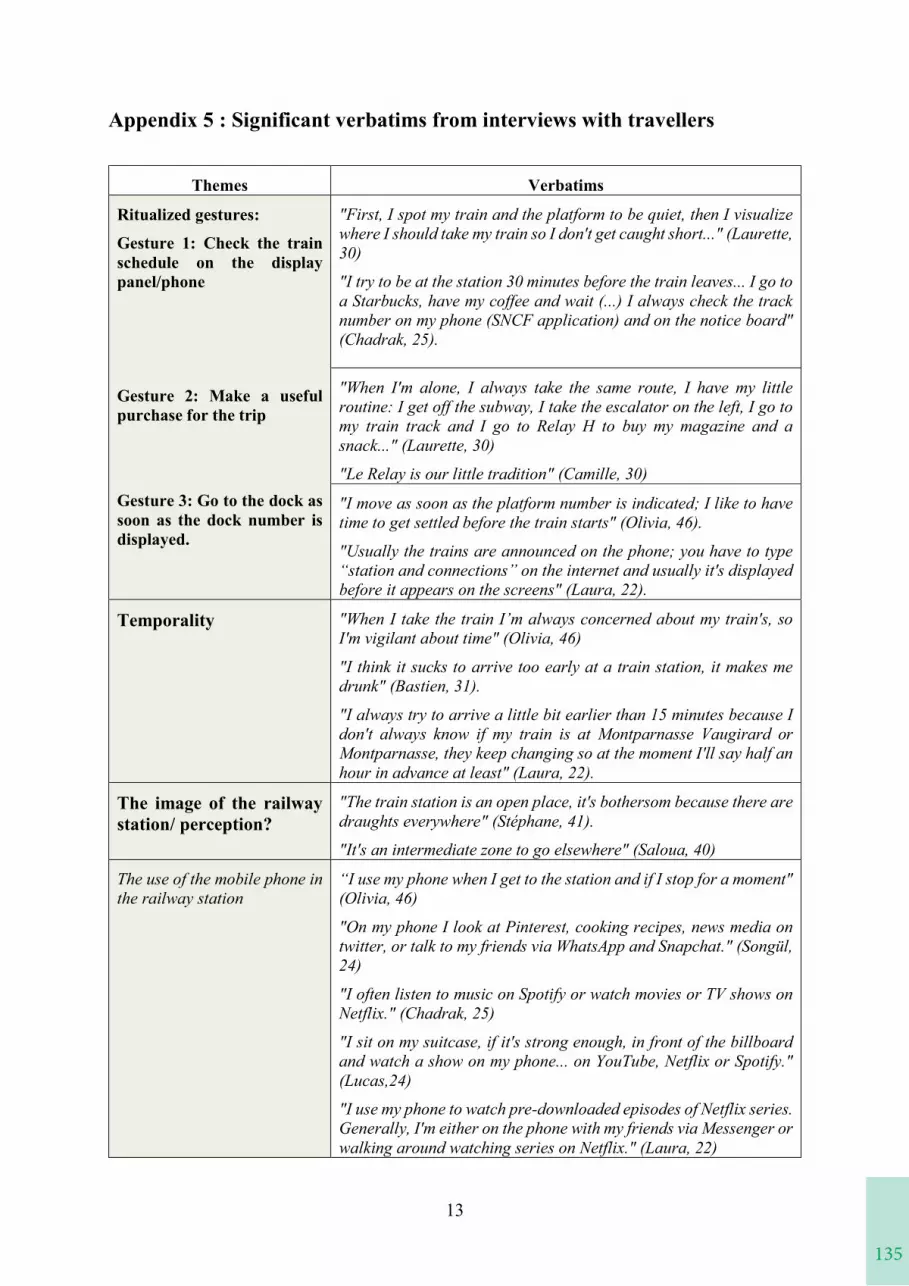
135
12
Appendix 4 : Traveller typology (from interviews with experts)
Travellers
Criteria(A : Arrival.D : Departure)
Daily travellers Business Leisure
Regular Occasional Family Solo / groups
A D A D A D A D A D
Qualificationof the flows
Daily personal budget (limited)
Professional budget (more or less limited)
Leisure personal budget (more or less limited)
BtoC BtoC et BtoB Pescriber child
BtoC andBtoB
Regular travellers, time optimisation
Occasional travellers, time anticipation
13
Appendix 5 : Significant verbatims from interviews with travellers
Themes Verbatims
Ritualized gestures:
Gesture 1: Check the train schedule on the display panel/phone
Gesture 2: Make a useful purchase for the trip
Gesture 3: Go to the dock as soon as the dock number is displayed.
"First, I spot my train and the platform to be quiet, then I visualize where I should take my train so I don't get caught short..." (Laurette, 30)
"I try to be at the station 30 minutes before the train leaves... I go to a Starbucks, have my coffee and wait (...) I always check the track number on my phone (SNCF application) and on the notice board" (Chadrak, 25).
"When I'm alone, I always take the same route, I have my little routine: I get off the subway, I take the escalator on the left, I go to my train track and I go to Relay H to buy my magazine and a snack..." (Laurette, 30)
"Le Relay is our little tradition" (Camille, 30)
"I move as soon as the platform number is indicated; I like to have time to get settled before the train starts" (Olivia, 46).
"Usually the trains are announced on the phone; you have to type “station and connections” on the internet and usually it's displayed before it appears on the screens" (Laura, 22).
Temporality "When I take the train I’m always concerned about my train's, so I'm vigilant about time" (Olivia, 46)
"I think it sucks to arrive too early at a train station, it makes me drunk" (Bastien, 31).
"I always try to arrive a little bit earlier than 15 minutes because I don't always know if my train is at Montparnasse Vaugirard or Montparnasse, they keep changing so at the moment I'll say half an hour in advance at least" (Laura, 22).
The image of the railway station/ perception?
"The train station is an open place, it's bothersom because there are draughts everywhere" (Stéphane, 41).
"It's an intermediate zone to go elsewhere" (Saloua, 40)
The use of the mobile phone in the railway station
“I use my phone when I get to the station and if I stop for a moment"(Olivia, 46)
"On my phone I look at Pinterest, cooking recipes, news media on twitter, or talk to my friends via WhatsApp and Snapchat." (Songül, 24)
"I often listen to music on Spotify or watch movies or TV shows on Netflix." (Chadrak, 25)
"I sit on my suitcase, if it's strong enough, in front of the billboard and watch a show on my phone... on YouTube, Netflix or Spotify." (Lucas,24)
"I use my phone to watch pre-downloaded episodes of Netflix series. Generally, I'm either on the phone with my friends via Messenger or walking around watching series on Netflix." (Laura, 22)
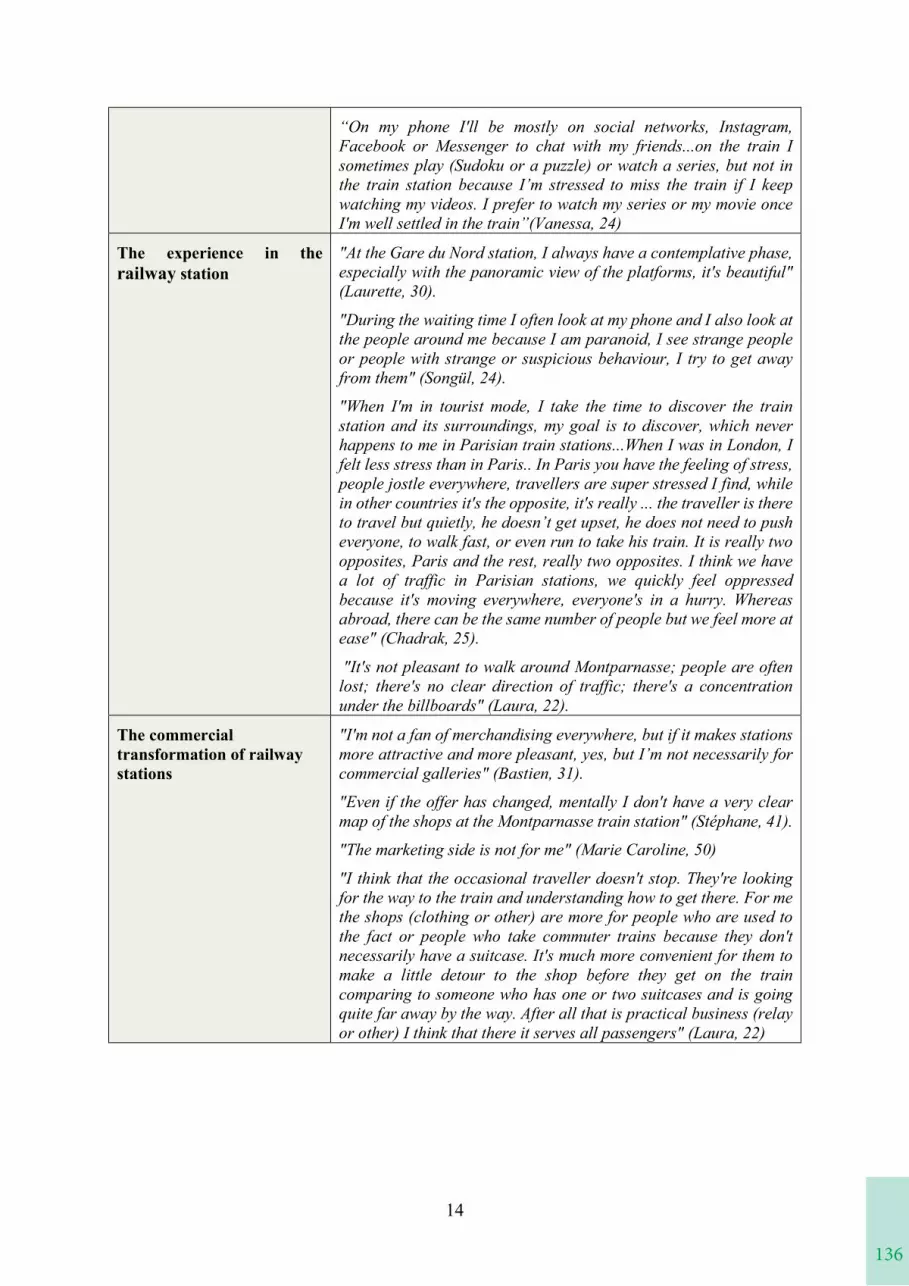
136
14
“On my phone I'll be mostly on social networks, Instagram, Facebook or Messenger to chat with my friends...on the train Isometimes play (Sudoku or a puzzle) or watch a series, but not in the train station because I’m stressed to miss the train if I keep watching my videos. I prefer to watch my series or my movie once I'm well settled in the train”(Vanessa, 24)
The experience in the railway station
"At the Gare du Nord station, I always have a contemplative phase, especially with the panoramic view of the platforms, it's beautiful" (Laurette, 30).
"During the waiting time I often look at my phone and I also look at the people around me because I am paranoid, I see strange people or people with strange or suspicious behaviour, I try to get away from them" (Songül, 24).
"When I'm in tourist mode, I take the time to discover the train station and its surroundings, my goal is to discover, which never happens to me in Parisian train stations...When I was in London, I felt less stress than in Paris.. In Paris you have the feeling of stress, people jostle everywhere, travellers are super stressed I find, while in other countries it's the opposite, it's really ... the traveller is there to travel but quietly, he doesn’t get upset, he does not need to push everyone, to walk fast, or even run to take his train. It is really two opposites, Paris and the rest, really two opposites. I think we have a lot of traffic in Parisian stations, we quickly feel oppressed because it's moving everywhere, everyone's in a hurry. Whereas abroad, there can be the same number of people but we feel more at ease" (Chadrak, 25).
"It's not pleasant to walk around Montparnasse; people are often lost; there's no clear direction of traffic; there's a concentration under the billboards" (Laura, 22).
The commercial transformation of railway stations
"I'm not a fan of merchandising everywhere, but if it makes stations more attractive and more pleasant, yes, but I’m not necessarily for commercial galleries" (Bastien, 31).
"Even if the offer has changed, mentally I don't have a very clear map of the shops at the Montparnasse train station" (Stéphane, 41).
"The marketing side is not for me" (Marie Caroline, 50)
"I think that the occasional traveller doesn't stop. They're looking for the way to the train and understanding how to get there. For me the shops (clothing or other) are more for people who are used to the fact or people who take commuter trains because they don't necessarily have a suitcase. It's much more convenient for them to make a little detour to the shop before they get on the train comparing to someone who has one or two suitcases and is going quite far away by the way. After all that is practical business (relay or other) I think that there it serves all passengers" (Laura, 22)
137
14
“On my phone I'll be mostly on social networks, Instagram, Facebook or Messenger to chat with my friends...on the train Isometimes play (Sudoku or a puzzle) or watch a series, but not in the train station because I’m stressed to miss the train if I keep watching my videos. I prefer to watch my series or my movie once I'm well settled in the train”(Vanessa, 24)
The experience in the railway station
"At the Gare du Nord station, I always have a contemplative phase, especially with the panoramic view of the platforms, it's beautiful" (Laurette, 30).
"During the waiting time I often look at my phone and I also look at the people around me because I am paranoid, I see strange people or people with strange or suspicious behaviour, I try to get away from them" (Songül, 24).
"When I'm in tourist mode, I take the time to discover the train station and its surroundings, my goal is to discover, which never happens to me in Parisian train stations...When I was in London, I felt less stress than in Paris.. In Paris you have the feeling of stress, people jostle everywhere, travellers are super stressed I find, while in other countries it's the opposite, it's really ... the traveller is there to travel but quietly, he doesn’t get upset, he does not need to push everyone, to walk fast, or even run to take his train. It is really two opposites, Paris and the rest, really two opposites. I think we have a lot of traffic in Parisian stations, we quickly feel oppressed because it's moving everywhere, everyone's in a hurry. Whereas abroad, there can be the same number of people but we feel more at ease" (Chadrak, 25).
"It's not pleasant to walk around Montparnasse; people are often lost; there's no clear direction of traffic; there's a concentration under the billboards" (Laura, 22).
The commercial transformation of railway stations
"I'm not a fan of merchandising everywhere, but if it makes stations more attractive and more pleasant, yes, but I’m not necessarily for commercial galleries" (Bastien, 31).
"Even if the offer has changed, mentally I don't have a very clear map of the shops at the Montparnasse train station" (Stéphane, 41).
"The marketing side is not for me" (Marie Caroline, 50)
"I think that the occasional traveller doesn't stop. They're looking for the way to the train and understanding how to get there. For me the shops (clothing or other) are more for people who are used to the fact or people who take commuter trains because they don't necessarily have a suitcase. It's much more convenient for them to make a little detour to the shop before they get on the train comparing to someone who has one or two suitcases and is going quite far away by the way. After all that is practical business (relay or other) I think that there it serves all passengers" (Laura, 22)
1
THE EFFECT OF COMPANIES’ COMMUNICATION OF DATA-USE AND HANDLING IN PRODUCT PRESENTATION
Tobias Roeding Julian Schmitz Hanna Schramm-KleinChair for Marketing and Retailing
Chair for Marketing and Retailing
Chair for Marketing and Retailing
University of Siegen University of Siegen University of [email protected]
IntroductionAs in current days certain customized services are a result of customers’ direct or indirect information-disclosure (e.g., Bleier and Eisenbeiss, 2015), the access to shopper information is a key advantage for retailers in today’s business landscape (Wakefield 2013). Hereby, the exchange of data for certain added values is a highly discussed phenomenon in current literature, in which especially the support of personal data-disclosure decision through incentivation leads to an intuitive weighting or mental processing of perceived benefits and risks (e.g., White et al., 2014). Even if studies on the integration of incentives in context of data-disclosure show different levels of success (e.g., Premazzi et al., 2010), customers’ general positive ‘motivation’ through additional information or explanation regarding the data-use is often proofed (e.g., Benlian, 2015).
Recent literature agrees on the fact that information privacy is defined as a state of self-determination by a person, in which this individual is interested in substantial influence and control with regard to the collection and handling of individual personal information and where external actors have only limited access to the personal information of this person (e.g. Karwatzki et al., 2017). Hong and Thong (2013) emphasize the relevance of customers’ awareness of the data-handling in this context. Studies have shown that it should be in retailers' interest to minimize customers' privacy concerns, as those are determined for customers' dealing with a product presentation (Bleier and Eisenbeiss, 2015). As data-disclosure is generally negative related to customers’ privacy concerns, the effect of the communication of personalized content might not follow this well-known pattern.
PurposeAccording to Awad and Krishnan (2006) the desire for greater information transparency is negatively related to customers’ willingness to be profiled. This phenomenon is referred to the ‘personalization-privacy paradox’ and is commonly accepted in the literature (Karwatzki et al., 2017). As this rather contrary effect takes strong response in research, we assume vice versa that the communication of ‘profiling’ or data-collection in terms of smartphone use, emphasized by the incentive of personalized services, is not increasing customers’ privacy concerns, but decreases them due to the fact that data-collection is omnipresent in current days and its communication (in contrast to a concealment) is perceived more positively. At this point, we see a relevant research gap as customers’ perception of incentivation on privacy concerns generally does not function as a signal for data-use and handling, potentially increasing customers’ perception regarding the promotion or even reaction regarding the purchase of (or willingness to pay for) a product.
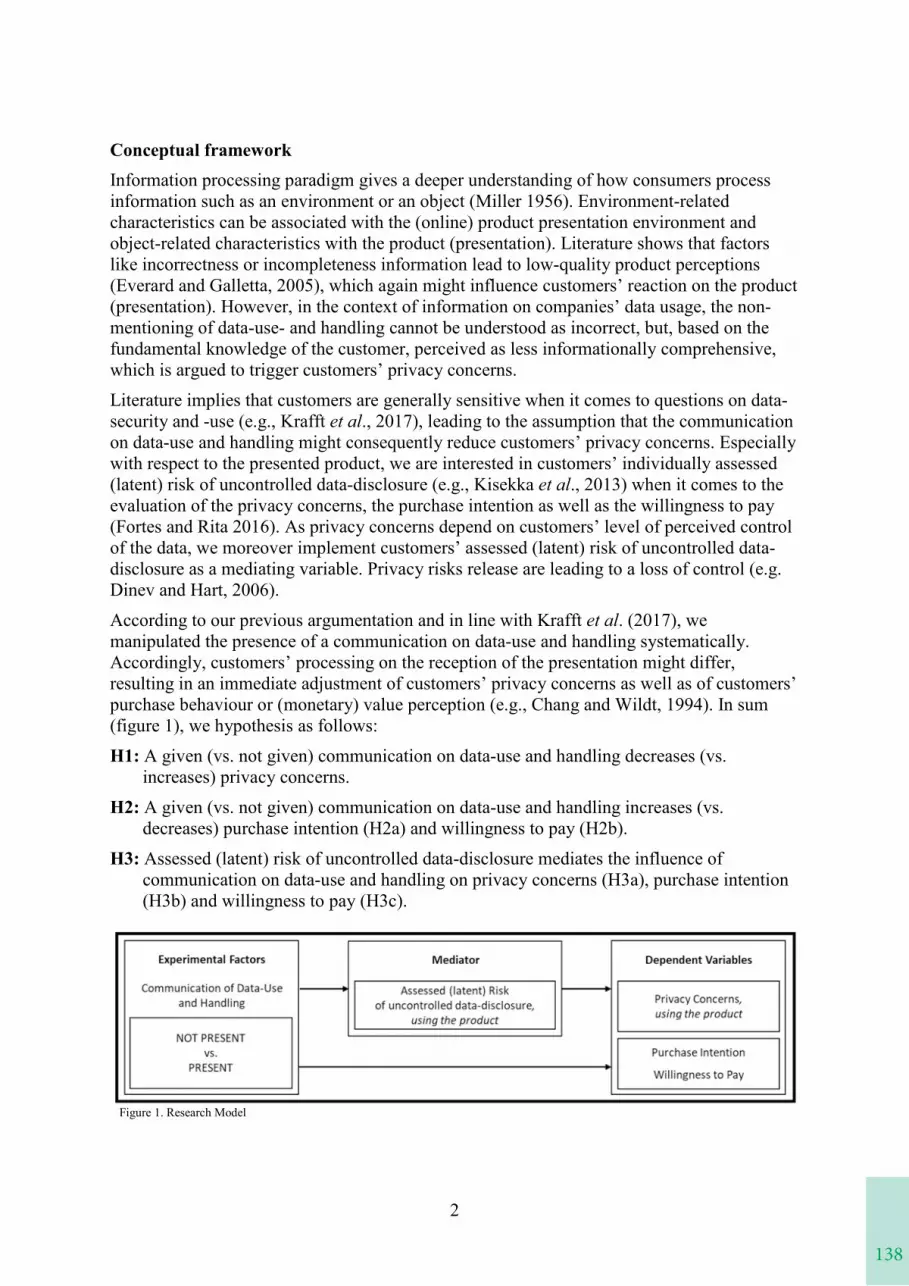
138
2
Conceptual frameworkInformation processing paradigm gives a deeper understanding of how consumers process information such as an environment or an object (Miller 1956). Environment-related characteristics can be associated with the (online) product presentation environment and object-related characteristics with the product (presentation). Literature shows that factors like incorrectness or incompleteness information lead to low-quality product perceptions (Everard and Galletta, 2005), which again might influence customers’ reaction on the product (presentation). However, in the context of information on companies’ data usage, the non-mentioning of data-use- and handling cannot be understood as incorrect, but, based on the fundamental knowledge of the customer, perceived as less informationally comprehensive,which is argued to trigger customers’ privacy concerns.
Literature implies that customers are generally sensitive when it comes to questions on data-security and -use (e.g., Krafft et al., 2017), leading to the assumption that the communication on data-use and handling might consequently reduce customers’ privacy concerns. Especially with respect to the presented product, we are interested in customers’ individually assessed (latent) risk of uncontrolled data-disclosure (e.g., Kisekka et al., 2013) when it comes to the evaluation of the privacy concerns, the purchase intention as well as the willingness to pay (Fortes and Rita 2016). As privacy concerns depend on customers’ level of perceived control of the data, we moreover implement customers’ assessed (latent) risk of uncontrolled data-disclosure as a mediating variable. Privacy risks release are leading to a loss of control (e.g. Dinev and Hart, 2006).
According to our previous argumentation and in line with Krafft et al. (2017), we manipulated the presence of a communication on data-use and handling systematically. Accordingly, customers’ processing on the reception of the presentation might differ, resulting in an immediate adjustment of customers’ privacy concerns as well as of customers’ purchase behaviour or (monetary) value perception (e.g., Chang and Wildt, 1994). In sum(figure 1), we hypothesis as follows:
H1: A given (vs. not given) communication on data-use and handling decreases (vs. increases) privacy concerns.
H2: A given (vs. not given) communication on data-use and handling increases (vs. decreases) purchase intention (H2a) and willingness to pay (H2b).
H3: Assessed (latent) risk of uncontrolled data-disclosure mediates the influence of communication on data-use and handling on privacy concerns (H3a), purchase intention (H3b) and willingness to pay (H3c).
Figure 1. Research Model
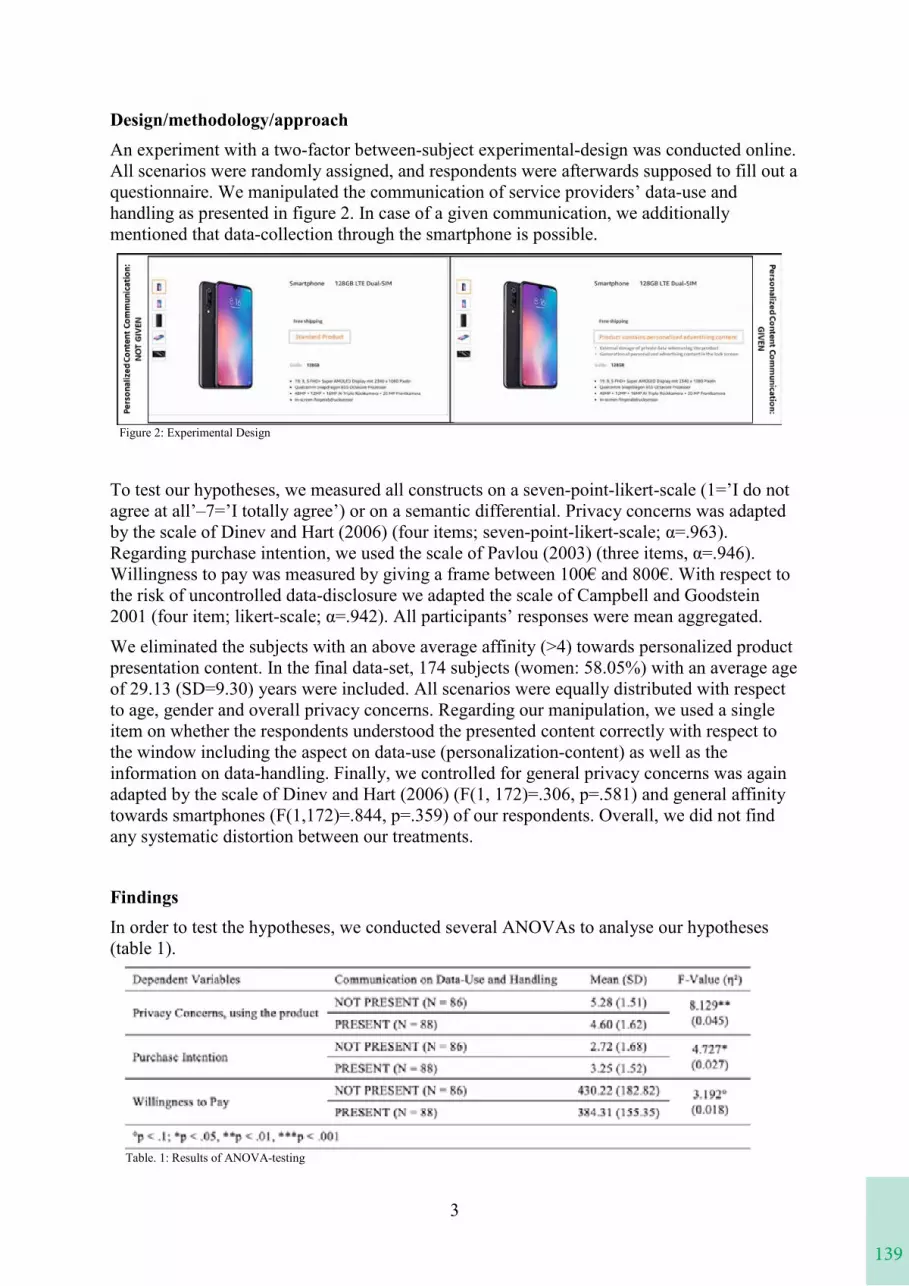
139
2
Conceptual frameworkInformation processing paradigm gives a deeper understanding of how consumers process information such as an environment or an object (Miller 1956). Environment-related characteristics can be associated with the (online) product presentation environment and object-related characteristics with the product (presentation). Literature shows that factors like incorrectness or incompleteness information lead to low-quality product perceptions (Everard and Galletta, 2005), which again might influence customers’ reaction on the product (presentation). However, in the context of information on companies’ data usage, the non-mentioning of data-use- and handling cannot be understood as incorrect, but, based on the fundamental knowledge of the customer, perceived as less informationally comprehensive,which is argued to trigger customers’ privacy concerns.
Literature implies that customers are generally sensitive when it comes to questions on data-security and -use (e.g., Krafft et al., 2017), leading to the assumption that the communication on data-use and handling might consequently reduce customers’ privacy concerns. Especially with respect to the presented product, we are interested in customers’ individually assessed (latent) risk of uncontrolled data-disclosure (e.g., Kisekka et al., 2013) when it comes to the evaluation of the privacy concerns, the purchase intention as well as the willingness to pay (Fortes and Rita 2016). As privacy concerns depend on customers’ level of perceived control of the data, we moreover implement customers’ assessed (latent) risk of uncontrolled data-disclosure as a mediating variable. Privacy risks release are leading to a loss of control (e.g. Dinev and Hart, 2006).
According to our previous argumentation and in line with Krafft et al. (2017), we manipulated the presence of a communication on data-use and handling systematically. Accordingly, customers’ processing on the reception of the presentation might differ, resulting in an immediate adjustment of customers’ privacy concerns as well as of customers’ purchase behaviour or (monetary) value perception (e.g., Chang and Wildt, 1994). In sum(figure 1), we hypothesis as follows:
H1: A given (vs. not given) communication on data-use and handling decreases (vs. increases) privacy concerns.
H2: A given (vs. not given) communication on data-use and handling increases (vs. decreases) purchase intention (H2a) and willingness to pay (H2b).
H3: Assessed (latent) risk of uncontrolled data-disclosure mediates the influence of communication on data-use and handling on privacy concerns (H3a), purchase intention (H3b) and willingness to pay (H3c).
Figure 1. Research Model
3
Design/methodology/approachAn experiment with a two-factor between-subject experimental-design was conducted online. All scenarios were randomly assigned, and respondents were afterwards supposed to fill out a questionnaire. We manipulated the communication of service providers’ data-use and handling as presented in figure 2. In case of a given communication, we additionally mentioned that data-collection through the smartphone is possible.
Figure 2: Experimental Design
To test our hypotheses, we measured all constructs on a seven-point-likert-scale (1=’I do not agree at all’–7=’I totally agree’) or on a semantic differential. Privacy concerns was adapted by the scale of Dinev and Hart (2006) (four items; seven-point-likert-scale; α=.963). Regarding purchase intention, we used the scale of Pavlou (2003) (three items, α=.946). Willingness to pay was measured by giving a frame between 100€ and 800€. With respect to the risk of uncontrolled data-disclosure we adapted the scale of Campbell and Goodstein 2001 (four item; likert-scale; α=.942). All participants’ responses were mean aggregated. We eliminated the subjects with an above average affinity (>4) towards personalized product presentation content. In the final data-set, 174 subjects (women: 58.05%) with an average age of 29.13 (SD=9.30) years were included. All scenarios were equally distributed with respect to age, gender and overall privacy concerns. Regarding our manipulation, we used a single item on whether the respondents understood the presented content correctly with respect to the window including the aspect on data-use (personalization-content) as well as the information on data-handling. Finally, we controlled for general privacy concerns was again adapted by the scale of Dinev and Hart (2006) (F(1, 172)=.306, p=.581) and general affinity towards smartphones (F(1,172)=.844, p=.359) of our respondents. Overall, we did not find any systematic distortion between our treatments.
FindingsIn order to test the hypotheses, we conducted several ANOVAs to analyse our hypotheses (table 1).
Table. 1: Results of ANOVA-testing
140
4
Findings generally imply that the communication on data-use and handling seems to have a significant effect on privacy concerns as well as on purchase intention, however the influence on willingness to pay is not significant. Nonetheless, the tendency on the latter goes even contrary the results on privacy concerns or purchase intention. Results generally support our assumptions towards an empirical confirmation of H1 and H2a, but not (completely) by of H2b.
Concentrating on the proposed mediating impact of assessed (latent) risk of uncontrolled data-disclosure (H3) on the relationship between the communication on data-use and handling and the dependent variables, we conducted multiple analyses of covariance (ANCOVAs) based on Hayes and Preacher (2013). Hereby, we followed the causal steps approach of Baron and Kenny (1986). Given a general effect within step one, step two (assessed (latent) risk of uncontrolled data-disclosure: Mnot_present = 4.51(1.49); Mpresent = 3.95 (1.49); F (1,172) = 6.221, p < .01, η² = 0.035) and three were also significant. In a fourth step, we identify a MS-decrease regarding privacy concerns and of purchase intention. MS of willingness to pay, did not show any decrease here. In sum we could support H3a and H3b,but not H3c.
Original/valueWe are able to show first approach towards the differentiated form of information processing with respect to the used manipulation. In fact, customers seem to build a comprehensive picture out of the presented information, confirming information processing paradigm in this context (Miller 1956). Moreover, we are able to extent Awad and Krishna (2006) as the clear information of being profiled causes a decrease of privacy concerns. Moreover, this effect is fully mediated by assessed (latent) risk of uncontrolled data-disclosure. Risk evaluation through the product seems to be a decisive factor in this context, as it seems to be more present for the customer in case of a communicated data-handling and -use.
Moreover, results go in line with Everard and Galletta (2005), who showed similar negative effects of a qualitatively ‘inferior’ respectively informationally less complete product presentation on customers’ perception and reaction. Interestingly, customers show an ambivalent behaviour, facing a higher interest to purchase, but a lower willingness to pay. One might conclude that this contrary effect can be traced back to a certain form of mental processing respectively calculation on perceived risks (data-disclosure) and benefits (lower price of the product) which is manifested by a lower willingness to pay for it. This divergence stands in contrast to the common knowledge on the generally positive relation of price/value and purchase intention (e.g., Chang and Wildt, 1994). We emphasize a contrary perception of the customer regarding common outcome variables, as we assume that customers might perceive the communication of data-use and handling in two steps: first, the completeness of the service provider is rewarded, followed by, second, some form of assumed scepticism, expressed in a lower monetary valuation. One explanation might be customers’ underlying sensibility, malaise and inner-conflict, which is still carried around when it comes to data-related disclosure and customers underlying mental processing on benefits and risks.
Practical implicationsFindings emphasize the importance of a clearer communication of data-use and -handling in context of product presentation. As is should be service providers’ as well as retailers’ aim to pursue a satisfactory exchange of data for both parties (Culnan and Armstrong, 1999), the
141
4
Findings generally imply that the communication on data-use and handling seems to have a significant effect on privacy concerns as well as on purchase intention, however the influence on willingness to pay is not significant. Nonetheless, the tendency on the latter goes even contrary the results on privacy concerns or purchase intention. Results generally support our assumptions towards an empirical confirmation of H1 and H2a, but not (completely) by of H2b.
Concentrating on the proposed mediating impact of assessed (latent) risk of uncontrolled data-disclosure (H3) on the relationship between the communication on data-use and handling and the dependent variables, we conducted multiple analyses of covariance (ANCOVAs) based on Hayes and Preacher (2013). Hereby, we followed the causal steps approach of Baron and Kenny (1986). Given a general effect within step one, step two (assessed (latent) risk of uncontrolled data-disclosure: Mnot_present = 4.51(1.49); Mpresent = 3.95 (1.49); F (1,172) = 6.221, p < .01, η² = 0.035) and three were also significant. In a fourth step, we identify a MS-decrease regarding privacy concerns and of purchase intention. MS of willingness to pay, did not show any decrease here. In sum we could support H3a and H3b,but not H3c.
Original/valueWe are able to show first approach towards the differentiated form of information processing with respect to the used manipulation. In fact, customers seem to build a comprehensive picture out of the presented information, confirming information processing paradigm in this context (Miller 1956). Moreover, we are able to extent Awad and Krishna (2006) as the clear information of being profiled causes a decrease of privacy concerns. Moreover, this effect is fully mediated by assessed (latent) risk of uncontrolled data-disclosure. Risk evaluation through the product seems to be a decisive factor in this context, as it seems to be more present for the customer in case of a communicated data-handling and -use.
Moreover, results go in line with Everard and Galletta (2005), who showed similar negative effects of a qualitatively ‘inferior’ respectively informationally less complete product presentation on customers’ perception and reaction. Interestingly, customers show an ambivalent behaviour, facing a higher interest to purchase, but a lower willingness to pay. One might conclude that this contrary effect can be traced back to a certain form of mental processing respectively calculation on perceived risks (data-disclosure) and benefits (lower price of the product) which is manifested by a lower willingness to pay for it. This divergence stands in contrast to the common knowledge on the generally positive relation of price/value and purchase intention (e.g., Chang and Wildt, 1994). We emphasize a contrary perception of the customer regarding common outcome variables, as we assume that customers might perceive the communication of data-use and handling in two steps: first, the completeness of the service provider is rewarded, followed by, second, some form of assumed scepticism, expressed in a lower monetary valuation. One explanation might be customers’ underlying sensibility, malaise and inner-conflict, which is still carried around when it comes to data-related disclosure and customers underlying mental processing on benefits and risks.
Practical implicationsFindings emphasize the importance of a clearer communication of data-use and -handling in context of product presentation. As is should be service providers’ as well as retailers’ aim to pursue a satisfactory exchange of data for both parties (Culnan and Armstrong, 1999), the
5
integration of the underlying data-use and handling seems to be a relevant aspect in order to enhance the purchase of a product.
However, the addressor of these product presentations needs to take into account that the purchase- and data-related out/income could be a rather short-term company objective, whereas in the middle- to long-run more concrete financial indicators come to play, followed by determinants like loyalty or a positive word-of-mouth. Out of a strategic perspective, service providers as well as retailers need to evaluate their individual value from these kinds of product presentation. In this line it should moreover be verified, how risk of uncontrolled data-disclosure can be useful for the company.
Regarding purchase intention, this risk needs to be balanced in order to generate data on the one side but hold purchases on a constant level. Especially this weighting brings a great potential for future companies’ success, however, future research might need to spend more focus on this aspect, in order to evaluate to what extent a company can force this process.
Research limitations and outlookA deeper analysis on the psychological phenomenon of postulated perception of an intuitively expected or even well-deserved monetary compensation for the disclosed data is required. As the data-collection is carried out in the background and customers generally show a rather positive reaction, at least on its communication, the level of mental accounting is additionally of interest and might depend on further factors as the amount of information within the product presentation, certain affective influences, as pleasure or dominance (Mehrabian and Russell, 1974), or certain characteristics with respect to the customer (e.g., Awad and Krishna, 2006). In our study we point out that the perceived risks might be balanced out by about 45€ (430.22€ vs. 384.31€), nonetheless different influences might increase or decrease this cap. In fact, the actual value of the perceived data for the company with respect to an assigned price needs more focus. The incentivation through a monetary (perceptual) discount (e.g., Premazzi et al., 2010) or information on the use of the data for exemplarily insurance-purposes might change customers’ behaviour.
ReferencesAwad, N. F. and Krishnan, M. S. (2006), “The personalization privacy paradox: an empirical
evaluation of information transparency and the willingness to be profiled online for personalization”, MIS quarterly, pp.13-28.
Baron, R. M. and D. A. Kenny (1986), “The moderator-mediator variable distinction in social psychological research: Conceptual, strategic, and statistical considerations”, Journal of Personality and Social Psychology, Vol. 51 No. 6, pp.1173-1182.
Benlian, A. (2015), “Web personalization cues and their differential effects on user assessments of website value”, Journal of Management Information Systems, Vol. 32 No. 1, pp.225-260.
Bleier, A. and Eisenbeiss, M. (2015), “The Importance of Trust for Personalized Online Advertising”, Journal of Retailing, Vol. 91 No. 3, pp.390-409.
Chang, T. Z. and Wildt, A. R. (1994), “Price, product information, and purchase intention: An empirical study”, Journal of the Academy of Marketing science, Vol. 22 No. 1, pp.16-27.
Culnan, M. J. and Armstrong, P. K. (1999), “Information privacy concerns proceduralfairness and impersonal trust: an empirical investigation”, Organization Science, Vol. 10No. 1, pp.104-115.
142
6
Dinev, T. and Hart, P. (2006), “An extended privacy calculus model for e-commerce transactions”, Information Systems Research, Vol. 17 No. 1, pp.61-80.
Everard, A. and Galletta, D. F. (2005), “How presentation flaws affect perceived site quality, trust, and intention to purchase from an online store”, Journal of Management Information Systems, Vol. 22 No. 3, pp.56-95.
Fortes, N. and Rita, P. (2016), “Privacy concerns and online purchasing behavior: Towards an integrated model”, European Research on Management and Business Economics, Vol. 22 No. 3, pp.167-176.
Hayes, A. F. and K. J. Preacher, (2013), “Statistical mediation analysis with a multicategorical independent variable”, British Journal of Mathematical and Statistical Psychology, Vol. 67 No. 3, pp.451-470.
Karwatzki, S., Dytynko, O., Trenz, M. and Veit, D. (2017), “Beyond the personalization-privacy paradox: Privacy valuation, transparency features, and service personalization”,Journal of Management Information Systems, Vol. 34 No. 2, pp.369-400.
Kisekka, V., Bagchi-Sen, S. and Rao, H. R. (2013), “Extent of private information disclosure on online social networks: An exploration of Facebook mobile phone users”, Computers in human behavior, Vol. 29 No. 6, pp.2722-2729.
Krafft, M., Arden, C. and Verhoef, P. (2017), “Permission Marketing and Privacy Concerns—Why Do Customers (Not) Grant Permissions?”, Journal of interactive marketing, No. 39, pp.39-54.
Mehrabian, A. and Russell, J.A. (1974), “An Approach to Store Environmental Psychology”,MA: MIT Press.
Miller, G. A. (1956), “The magical number seven, plus or minus two: Some limits on our capacity for processing information”, Psychological review, Vol. 63 No. 2, p.81.
Pavlou, P. A. (2003), “Consumer acceptance of electronic commerce: Integrating trust and risk with the technology acceptance model”, International Journal of Electronic Commerce, Vol. 7 No. 3, pp.101-134.
Premazzi, K., Castaldo, S., Grosso, M., Raman, P., Brudvig, S. and Hofacker, C. F. (2010),“Customer Information Sharing with E-Vendors: The Roles of Incentives and Trust”,International Journal of Electronic Commerce, Vol. 14 No. 3, pp.63-91.
Wakefield, R. (2013), “The influence of user affect in online privacy concerns towards the frontline service”, The Journal of Strategic Information Systems, Vol. 22 No. 2, pp.157-174.
White, T. B., Novak, T. P. and Hoffman, D. L. (2014), “No strings attached: When giving it away versus making them pay reduces consumer information disclosure”, Journal of Interactive Marketing, Vol. 28 No. 3, pp.184-195.
KeywordsProduct Presentation, Data-Use and Handling, Privacy Concerns
143
A PROCESS MODEL FOR THE SELECTION OF SOCIAL MEDIA CHANNELS BY MEANS OF INFORMATION QUALITY ASSESSMENT OF FASHION BLOGS FOR
APPAREL SUPPLY CHAINS Samaneh Beheshti-Kashi and Aseem Kinra
University of Bremen, International Graduate School for Dynamics in Logistics (IGS), Hochschulring 20, 28359 Bremen, Germany, [email protected]
University of Bremen, Global Supply Chain Management, Biba Gebaude, Hochschulring 20, 28359 Bremen, Germany, [email protected]
Abstract:
Purpose: This paper targets the development of an artifact designed as a process model for the selection of adequate social media channels considering social media characteristics, in particular, the veracity feature, for fashion and apparel supply chains.
Methodology: The research is based on a Design Dcience Research approach and follows the Design Science Research Methodology Process Model. The main activities of that Process Model described in this paper are the design & development of the artifact, a demonstration of its use, as well as a presentation of the evaluation approach by focusing on the determination of possible evaluands.
Findings: Channel selection on upper and on media level are the two main processes developed both including the application of information quality dimensions.
Practical implications: The artifact developed enables fashion and apparel supply chain stakeholders to select social media channels in a systematic approach. This approach will provide them richer data in terms of quality aspects.
Originality: In contrast to most existing research, the value of this paper lies in particular in the consideration of social media characteristics, while using social media based sources for fashion and apparel supply chains. A systematic selection of potentially relevant social media channels for supply chain stakeholders by means of information quality dimensions is put forward. Moreover, the use of the artifact is demonstrated in a case study where the artifact is applied on real world fashion blogs.
Keywords: fashion and apparel supply chains, social media characteristics, information quality assessment, veracity
The fashion industry faces challenges in meeting the demand of the customers. Often retailers are confronted with losses due to stock-outs or overstocked inventories (Fisher and Raman,
144
2010). Besides, the demand for fashion is impacted by various factors such as changing weather conditions, celebrities, events, holidays or the general economic situation (Thomassey, 2010). A crucial challenge is that most fashion products are highly short-lived compared to their long time-to-market. Most production plants are situated in countries such as China, Taiwan, India or Bangladesh. Lately, even these countries are turning too expensive for companies due to an increased standard of living and higher salaries. Consequently, the first firms have started to locate some production plants to African countries such as Ethiopia or South Africa (NTV.de 2015). Though, the target regions are often European countries or the United States. Therefore, retailers are confronted with long transportation and shipping routes. In traditional retailing, reproducing good selling items during a current season is hardly possible or rather solely with additional costs. These circumstances result in high uncertainties for the respective stakeholders. In order to deal with this uncertainty, the exploitation of additional information sources is put forward. In this regard, big data and big data sources are increasingly discussed as a formidable opportunity for decision makers in logistics and Supply Chain Management (SCM) (Waller and Fawcett, 2013). Hence, the use of big data analytics in supply chain (SC) has been studied by different researchers (e.g. (Awwad et al., 2018; Fosso Wamba et al., 2018; Tiwari et al., 2018)) and practitioners. The utilisation of big data analytics, with its variety of sources and techniques such as the Internet of Things, cloud computing, wireless sensor networks and social media, is considered to have a huge impact on SCM and logistics (Tiwari et al., 2018; Waller and Fawcett, 2013). In the fashion and apparel SC context, in particular, social media-based sources are increasingly gaining relevance as in Cui et al. (2018), Boldt et al. (2016), Itikhar and Khan (2019) or See-To and Ngai (2018). Kaplan and Haenlein (2010) define social media as a group of Internet-based applications that build on the ideological and technological foundations of Web 2.0, and that allow the creation and exchange of User Generated Content. In this regard, social media analytics has been emerged and deals with handling social media data. Although in the field of social media analytics, the consideration of social media characteristics is recently gaining an increased relevance, existing approaches on the use of social media in fashion SC hardly consider the characteristics of social media. In this regard, in particular, neglecting the veracity factor can have large impacts on decision making. The quality assessment of social media data plays a fundamental requirement while harnessing data from social media-based sources. This is aligned with Hazen et al. (2014) bringing out the importance of considering the garbage in garbage out-problem about big data for SCM, and emphasise the monitoring and controlling of big data quality. Moreover, it is notable to mention that huge impacts on data quality were brought already by the internet as collecting and sharing information had been fundamentally changed. This impact is increased through User-Generated-Content (UGC) published on social media (Borchers, 2009). A quality-based assessment of social media data turns more crucial when the extracted data is used for decision-making since poor data and information quality have an impact on it (Redman, 1998). Data quality research (Wang and Strong, 1996) suggests a range of dimensions for assessing the quality of data. However, these dimensions are developed to be applicable to transactional data and not on social media data. Given this problem, we frame the following research question in this paper:
RQ. how to select social media channels for decision processes in fashion and apparel supply chains considering social media characteristics?
145
2010). Besides, the demand for fashion is impacted by various factors such as changing weather conditions, celebrities, events, holidays or the general economic situation (Thomassey, 2010). A crucial challenge is that most fashion products are highly short-lived compared to their long time-to-market. Most production plants are situated in countries such as China, Taiwan, India or Bangladesh. Lately, even these countries are turning too expensive for companies due to an increased standard of living and higher salaries. Consequently, the first firms have started to locate some production plants to African countries such as Ethiopia or South Africa (NTV.de 2015). Though, the target regions are often European countries or the United States. Therefore, retailers are confronted with long transportation and shipping routes. In traditional retailing, reproducing good selling items during a current season is hardly possible or rather solely with additional costs. These circumstances result in high uncertainties for the respective stakeholders. In order to deal with this uncertainty, the exploitation of additional information sources is put forward. In this regard, big data and big data sources are increasingly discussed as a formidable opportunity for decision makers in logistics and Supply Chain Management (SCM) (Waller and Fawcett, 2013). Hence, the use of big data analytics in supply chain (SC) has been studied by different researchers (e.g. (Awwad et al., 2018; Fosso Wamba et al., 2018; Tiwari et al., 2018)) and practitioners. The utilisation of big data analytics, with its variety of sources and techniques such as the Internet of Things, cloud computing, wireless sensor networks and social media, is considered to have a huge impact on SCM and logistics (Tiwari et al., 2018; Waller and Fawcett, 2013). In the fashion and apparel SC context, in particular, social media-based sources are increasingly gaining relevance as in Cui et al. (2018), Boldt et al. (2016), Itikhar and Khan (2019) or See-To and Ngai (2018). Kaplan and Haenlein (2010) define social media as a group of Internet-based applications that build on the ideological and technological foundations of Web 2.0, and that allow the creation and exchange of User Generated Content. In this regard, social media analytics has been emerged and deals with handling social media data. Although in the field of social media analytics, the consideration of social media characteristics is recently gaining an increased relevance, existing approaches on the use of social media in fashion SC hardly consider the characteristics of social media. In this regard, in particular, neglecting the veracity factor can have large impacts on decision making. The quality assessment of social media data plays a fundamental requirement while harnessing data from social media-based sources. This is aligned with Hazen et al. (2014) bringing out the importance of considering the garbage in garbage out-problem about big data for SCM, and emphasise the monitoring and controlling of big data quality. Moreover, it is notable to mention that huge impacts on data quality were brought already by the internet as collecting and sharing information had been fundamentally changed. This impact is increased through User-Generated-Content (UGC) published on social media (Borchers, 2009). A quality-based assessment of social media data turns more crucial when the extracted data is used for decision-making since poor data and information quality have an impact on it (Redman, 1998). Data quality research (Wang and Strong, 1996) suggests a range of dimensions for assessing the quality of data. However, these dimensions are developed to be applicable to transactional data and not on social media data. Given this problem, we frame the following research question in this paper:
RQ. how to select social media channels for decision processes in fashion and apparel supply chains considering social media characteristics?
The RQ is framed in a Design Science Research-based approach, particularly following the Design Science Research Methodology Process Model (DSRM). The objective of our research is to introduce an artifact designed as a process model for the selection of adequate social media channels considering social media characteristics, in particular, the veracity feature. In this regard, the main focus of the paper is the illustration of the design & development and the demonstration of the artifact. Moreover, the elaboration of the evaluation approach, which tackles the utility of the artifact is prominently presented. The focus of the evaluation approach illustration is the determination of possible evaluands targeting at fast fashion and luxury markets. The rest of the paper is structured as follows. Section 2 presents a short overview on the use of social media-based sources in fashion and apparel SCs. Before illustrating the methodology conducted, the analytical framework in which social media characteristics are elaborated is shortly illustrated. The methodology section gives a short overview of the DSRM, and illustrates the implemented steps design & development, demonstration and presenting the targeted approach for the evaluation. The rest of the paper follows then the defined DSRM structure. The design & development of the artifact as well as its use is shown by a demonstration follow in the proceeding sections. The evaluation methodology is shown with a focus on the determination of the evaluands. This is done by a comparison of fast fashion and luxury processes. Thereafter, a conclusion and an outlook for future activities are drawn.
In literature, a range of work exists focusing on the use of social media-based sources for fashion SC processes. Cui et al. (2018) is one of the main works conducted on the use of social media information in fashion sales forecasting. In this work, the operational value of social media information by incorporating social media information in sales forecasting is examined, and the quantification of this value is put forward. Using publicly available social media information from the company's official Facebook site and operational data from an apparel company. Similarly, Boldt et al. (2016) integrate social media data for the sales forecasting of sports apparel using Nike's ten most active Facebook pages based on total likes. The authors outline a high forecasting accuracy for some of the simple regression models. A different approach is conducted by af Rosenborg et al. (2017). In this work, the relation between the activity of HM's Facebook page and the financial performance of the company by considering total posts, comments and likes numbers, and a relationship between the Facebook data and corresponding business data is examined. Apart from Facebook, fashion blogs are discussed as a further potential source for SC processes. Fashion blogs are the biggest group amongst the blogosphere Halvorsen et al. (2013). Fashion bloggers has gained increased relevance from the fashion industry and are considered as opinion leaders or influencers (Uzunoglu and Misci Kip, 2014). A weblog-text trending approach is introduced by Rickman and Cosenza (2007) focusing on catching the actual buzz from the fashion posts. The authors concluded that for the use of fashion blogs for trend forecasting purposes, different development is needed such as rich accumulation of fashion communication or the acceptance of fashion bloggers by the marketers. In this research, it is claimed that both developments have occurred within the last years. In this context, Beheshti-Kashi et al. (2015) introduce the TrendFashion tool for the collection and analysis of fashion blog posts and focus on the identification of fashion trends for supporting forecasting decisions. Another research examines Italian fashion blogs, and real-world data from an Italian retailer identify for some colours that of both data sets correspond (Beheshti-Kashi et al., 2016). Beheshti-Kashi et al. (2018) illustrate a decision-support case in the social media analytics framework using fashion blogs. The potential of fashion blogs in fashion and apparel SCs are showcased, and the potential benefits of SC stakeholders, in particular fashion buyers, are discussed. The authors report that the development of some fashion topics was observable.
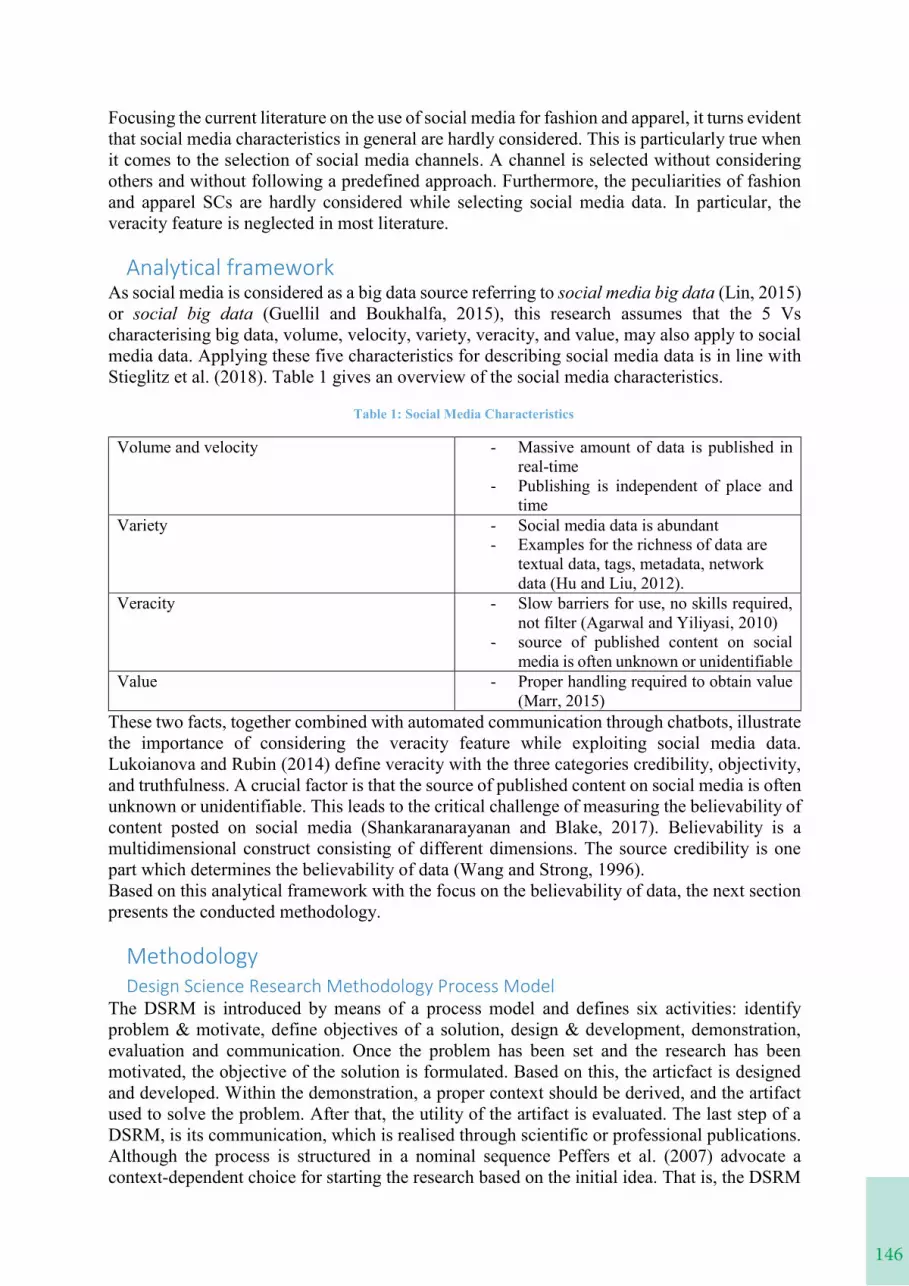
146
Focusing the current literature on the use of social media for fashion and apparel, it turns evident that social media characteristics in general are hardly considered. This is particularly true when it comes to the selection of social media channels. A channel is selected without considering others and without following a predefined approach. Furthermore, the peculiarities of fashion and apparel SCs are hardly considered while selecting social media data. In particular, the veracity feature is neglected in most literature.
As social media is considered as a big data source referring to social media big data (Lin, 2015) or social big data (Guellil and Boukhalfa, 2015), this research assumes that the 5 Vs characterising big data, volume, velocity, variety, veracity, and value, may also apply to social media data. Applying these five characteristics for describing social media data is in line with Stieglitz et al. (2018). Table 1 gives an overview of the social media characteristics.
Table 1: Social Media Characteristics
Volume and velocity - Massive amount of data is published in real-time
- Publishing is independent of place and time
Variety - Social media data is abundant - Examples for the richness of data are
textual data, tags, metadata, network data (Hu and Liu, 2012).
Veracity - Slow barriers for use, no skills required, not filter (Agarwal and Yiliyasi, 2010)
- source of published content on social media is often unknown or unidentifiable
Value - Proper handling required to obtain value (Marr, 2015)
These two facts, together combined with automated communication through chatbots, illustrate the importance of considering the veracity feature while exploiting social media data. Lukoianova and Rubin (2014) define veracity with the three categories credibility, objectivity, and truthfulness. A crucial factor is that the source of published content on social media is often unknown or unidentifiable. This leads to the critical challenge of measuring the believability of content posted on social media (Shankaranarayanan and Blake, 2017). Believability is a multidimensional construct consisting of different dimensions. The source credibility is one part which determines the believability of data (Wang and Strong, 1996). Based on this analytical framework with the focus on the believability of data, the next section presents the conducted methodology.
The DSRM is introduced by means of a process model and defines six activities: identify problem & motivate, define objectives of a solution, design & development, demonstration, evaluation and communication. Once the problem has been set and the research has been motivated, the objective of the solution is formulated. Based on this, the articfact is designed and developed. Within the demonstration, a proper context should be derived, and the artifact used to solve the problem. After that, the utility of the artifact is evaluated. The last step of a DSRM, is its communication, which is realised through scientific or professional publications. Although the process is structured in a nominal sequence Peffers et al. (2007) advocate a context-dependent choice for starting the research based on the initial idea. That is, the DSRM
147
Focusing the current literature on the use of social media for fashion and apparel, it turns evident that social media characteristics in general are hardly considered. This is particularly true when it comes to the selection of social media channels. A channel is selected without considering others and without following a predefined approach. Furthermore, the peculiarities of fashion and apparel SCs are hardly considered while selecting social media data. In particular, the veracity feature is neglected in most literature.
As social media is considered as a big data source referring to social media big data (Lin, 2015) or social big data (Guellil and Boukhalfa, 2015), this research assumes that the 5 Vs characterising big data, volume, velocity, variety, veracity, and value, may also apply to social media data. Applying these five characteristics for describing social media data is in line with Stieglitz et al. (2018). Table 1 gives an overview of the social media characteristics.
Table 1: Social Media Characteristics
Volume and velocity - Massive amount of data is published in real-time
- Publishing is independent of place and time
Variety - Social media data is abundant - Examples for the richness of data are
textual data, tags, metadata, network data (Hu and Liu, 2012).
Veracity - Slow barriers for use, no skills required, not filter (Agarwal and Yiliyasi, 2010)
- source of published content on social media is often unknown or unidentifiable
Value - Proper handling required to obtain value (Marr, 2015)
These two facts, together combined with automated communication through chatbots, illustrate the importance of considering the veracity feature while exploiting social media data. Lukoianova and Rubin (2014) define veracity with the three categories credibility, objectivity, and truthfulness. A crucial factor is that the source of published content on social media is often unknown or unidentifiable. This leads to the critical challenge of measuring the believability of content posted on social media (Shankaranarayanan and Blake, 2017). Believability is a multidimensional construct consisting of different dimensions. The source credibility is one part which determines the believability of data (Wang and Strong, 1996). Based on this analytical framework with the focus on the believability of data, the next section presents the conducted methodology.
The DSRM is introduced by means of a process model and defines six activities: identify problem & motivate, define objectives of a solution, design & development, demonstration, evaluation and communication. Once the problem has been set and the research has been motivated, the objective of the solution is formulated. Based on this, the articfact is designed and developed. Within the demonstration, a proper context should be derived, and the artifact used to solve the problem. After that, the utility of the artifact is evaluated. The last step of a DSRM, is its communication, which is realised through scientific or professional publications. Although the process is structured in a nominal sequence Peffers et al. (2007) advocate a context-dependent choice for starting the research based on the initial idea. That is, the DSRM
defines four different entry points to the research that are problem-centered initiation, objective-centered solution, design & development-centered initiation as well as client/context initiated.
The DSRM applied to the present study focuses on an artifact of a suitable selection of social media channels and involves the following activities. The entry point of this research is a problem-centred initiation. In this way, the DSRM is followed in its nominally sequential order starting with identifying the specific problem and illustrating the relevance of the importance of the research. This is conducted in the introduction. Based on the problem definition, the objective of a potential artifact is elaborated at the end of the literature review. Due to the interdisciplinarity of the presented approach, it is required to glance at different concepts. The design & development involves the creation of the artifact. This is followed by the demonstration of the use of the artifact. The fifth activity, the evaluation of the artifact is not conducted yet. However, in this paper, one possible evaluation approach of the artifact is elaborated and illustrated.
Design & development is the third activity in the DSRM, and it includes the creation of the artifact. An artifact can have different forms such as constructs, models, methods or instantiations (Hevner et al., 2004). The first step of designing the artifact involves the elaboration of requirements. This is done by elaborating on the characteristics of social media and social media data, and the challenges involved in dealing with social media data. The artifact created is designed as a process model. Process models have different features, one of which is the level of formalisation (Filß et al., 2005). Formalisation enables the representation of complex processes with all relevant elements such as data streams, events, branches or roles (Allweyer, 2015). Notation languages are a typically used in formalisation. This research uses Business Process Model and Notation (BPMN) for the visualisation of the process model.
According to Peffers et al. (2007), a range of methods are applicable for demonstrating the use of the developed artifact. These may involve simulations, experimentations, proof or case studies. For this research, a case study method is considered as the suitable method for demonstrating the utility of the artifact, since a case study approach is especially suited for explanatory examinations in which the phenomenon has not been sufficiently explored (Meredith, 1998). The case study features are based on the following reflections. In order to be reliable, the law of large numbers needs to be applied, which in turn requires a large dataset. As the sales volume of menswear is typically much lower than that of womenswear, we targeted the latter in our case study. Due to the availability of sales data in Germany, we additionally considered the German market and German blogs targeting women only. Lastly, to keep our case simple yet realistic, we focused on the essential feature in textiles and apparel, which is the colour. The definition of the case study features is highly relevant in the context of defining measurable features for the information quality dimension relevance. A summary of the case study features is presented in Table 3.
Table 3: Case study features
Case study feature Value Target group Women Product type Women's outer apparel Product feature Colour Language German
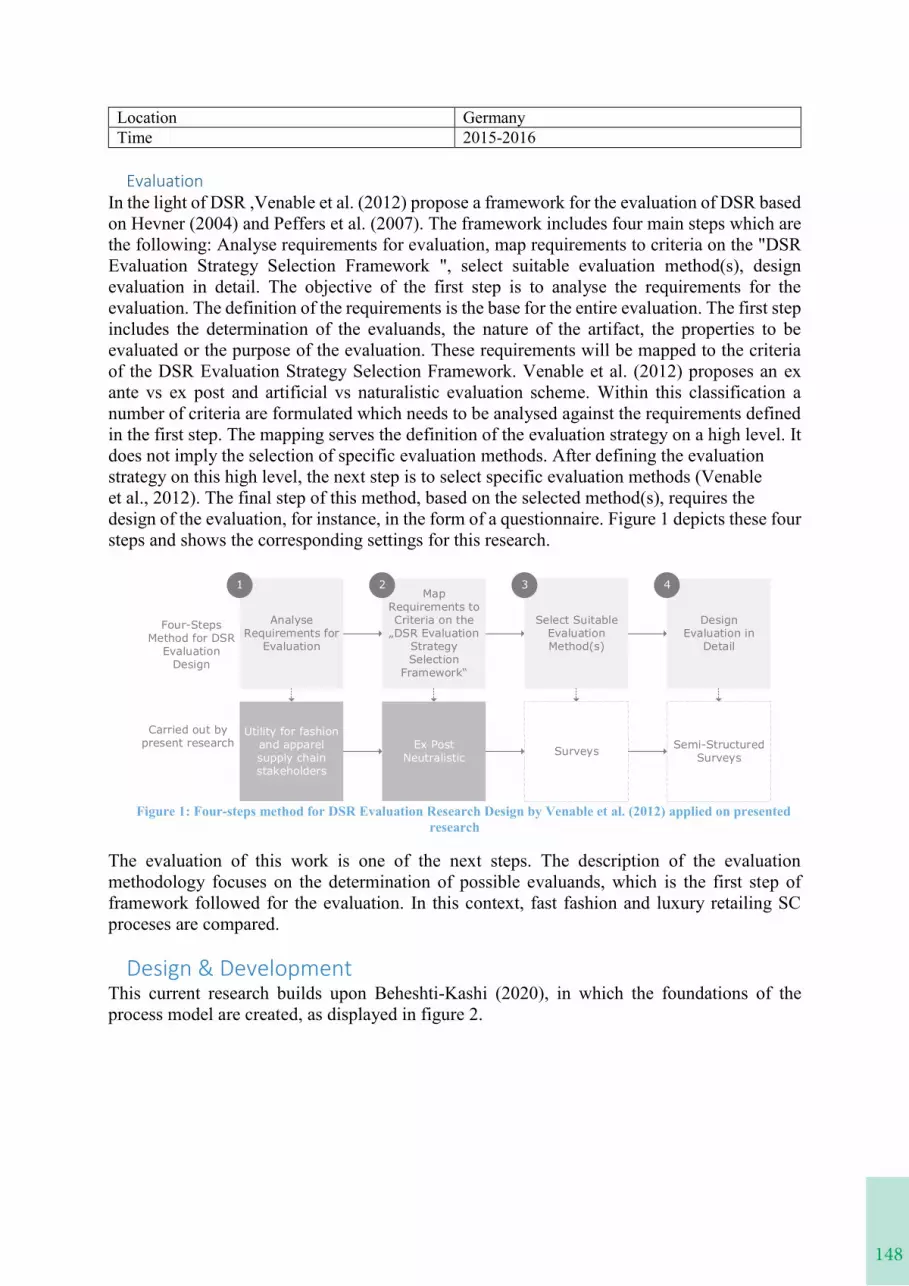
148
Location Germany Time 2015-2016
In the light of DSR ,Venable et al. (2012) propose a framework for the evaluation of DSR based on Hevner (2004) and Peffers et al. (2007). The framework includes four main steps which are the following: Analyse requirements for evaluation, map requirements to criteria on the "DSR Evaluation Strategy Selection Framework ", select suitable evaluation method(s), design evaluation in detail. The objective of the first step is to analyse the requirements for the evaluation. The definition of the requirements is the base for the entire evaluation. The first step includes the determination of the evaluands, the nature of the artifact, the properties to be evaluated or the purpose of the evaluation. These requirements will be mapped to the criteria of the DSR Evaluation Strategy Selection Framework. Venable et al. (2012) proposes an ex ante vs ex post and artificial vs naturalistic evaluation scheme. Within this classification a number of criteria are formulated which needs to be analysed against the requirements defined in the first step. The mapping serves the definition of the evaluation strategy on a high level. It does not imply the selection of specific evaluation methods. After defining the evaluation strategy on this high level, the next step is to select specific evaluation methods (Venable et al., 2012). The final step of this method, based on the selected method(s), requires the design of the evaluation, for instance, in the form of a questionnaire. Figure 1 depicts these four steps and shows the corresponding settings for this research.
Figure 1: Four-steps method for DSR Evaluation Research Design by Venable et al. (2012) applied on presented
research
The evaluation of this work is one of the next steps. The description of the evaluation methodology focuses on the determination of possible evaluands, which is the first step of framework followed for the evaluation. In this context, fast fashion and luxury retailing SC proceses are compared.
This current research builds upon Beheshti-Kashi (2020), in which the foundations of the process model are created, as displayed in figure 2.
Analyse Requirements for
Evaluation
Map Requirements to Criteria on the
DSR Evaluation Strategy Selection
Framework
Select Suitable Evaluation Method(s)
Design Evaluation in
Detail
1 2 3 4
Utility for fashion and apparel supply chain stakeholders
Ex PostNeutralistic Surveys Semi-Structured
Surveys
Four-Steps Method for DSR
Evaluation Design
Carried out by present research
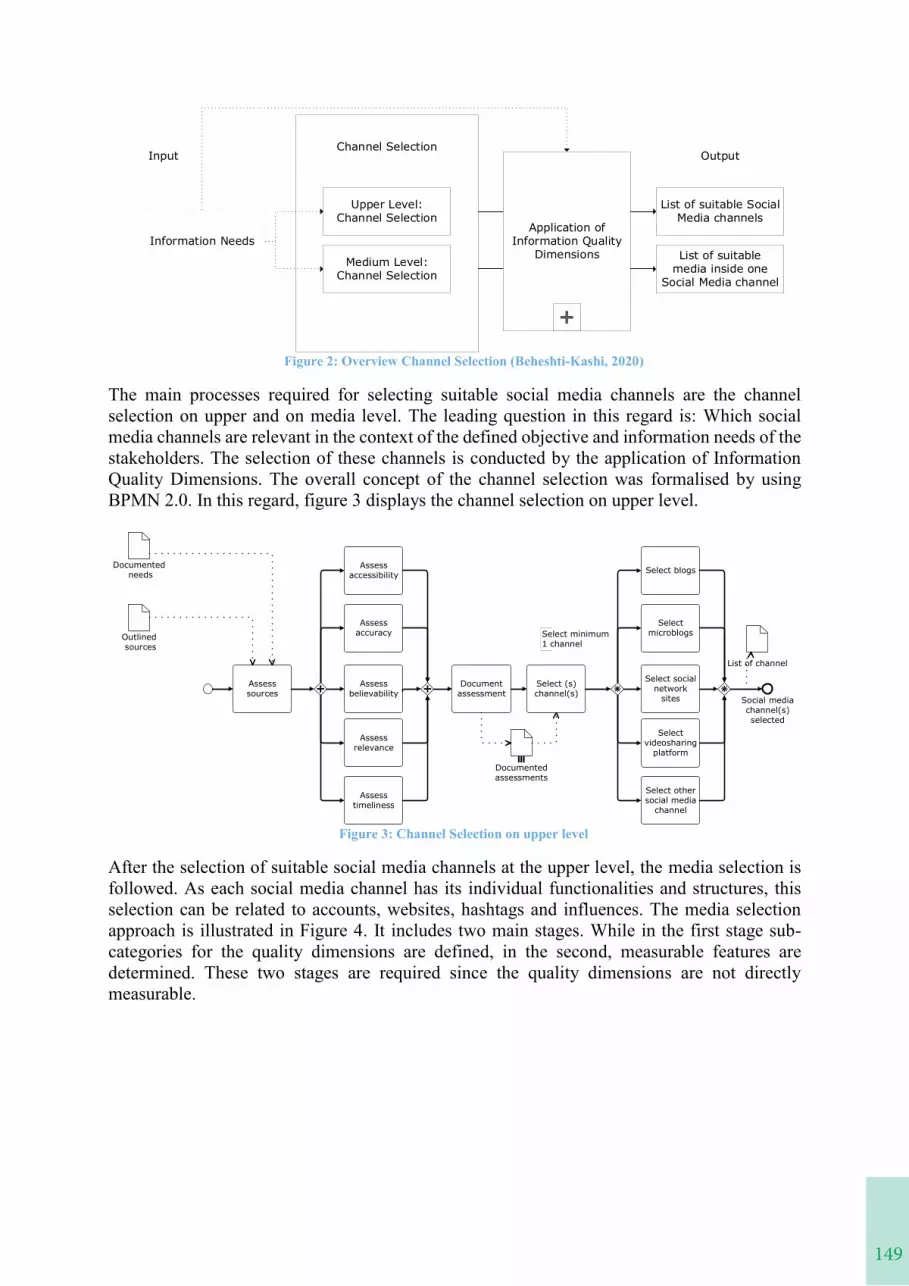
149
Location Germany Time 2015-2016
In the light of DSR ,Venable et al. (2012) propose a framework for the evaluation of DSR based on Hevner (2004) and Peffers et al. (2007). The framework includes four main steps which are the following: Analyse requirements for evaluation, map requirements to criteria on the "DSR Evaluation Strategy Selection Framework ", select suitable evaluation method(s), design evaluation in detail. The objective of the first step is to analyse the requirements for the evaluation. The definition of the requirements is the base for the entire evaluation. The first step includes the determination of the evaluands, the nature of the artifact, the properties to be evaluated or the purpose of the evaluation. These requirements will be mapped to the criteria of the DSR Evaluation Strategy Selection Framework. Venable et al. (2012) proposes an ex ante vs ex post and artificial vs naturalistic evaluation scheme. Within this classification a number of criteria are formulated which needs to be analysed against the requirements defined in the first step. The mapping serves the definition of the evaluation strategy on a high level. It does not imply the selection of specific evaluation methods. After defining the evaluation strategy on this high level, the next step is to select specific evaluation methods (Venable et al., 2012). The final step of this method, based on the selected method(s), requires the design of the evaluation, for instance, in the form of a questionnaire. Figure 1 depicts these four steps and shows the corresponding settings for this research.
Figure 1: Four-steps method for DSR Evaluation Research Design by Venable et al. (2012) applied on presented
research
The evaluation of this work is one of the next steps. The description of the evaluation methodology focuses on the determination of possible evaluands, which is the first step of framework followed for the evaluation. In this context, fast fashion and luxury retailing SC proceses are compared.
This current research builds upon Beheshti-Kashi (2020), in which the foundations of the process model are created, as displayed in figure 2.
Analyse Requirements for
Evaluation
Map Requirements to Criteria on the
DSR Evaluation Strategy Selection
Framework
Select Suitable Evaluation Method(s)
Design Evaluation in
Detail
1 2 3 4
Utility for fashion and apparel supply chain stakeholders
Ex PostNeutralistic Surveys Semi-Structured
Surveys
Four-Steps Method for DSR
Evaluation Design
Carried out by present research
Figure 2: Overview Channel Selection (Beheshti-Kashi, 2020)
The main processes required for selecting suitable social media channels are the channel selection on upper and on media level. The leading question in this regard is: Which social media channels are relevant in the context of the defined objective and information needs of the stakeholders. The selection of these channels is conducted by the application of Information Quality Dimensions. The overall concept of the channel selection was formalised by using BPMN 2.0. In this regard, figure 3 displays the channel selection on upper level.
Figure 3: Channel Selection on upper level
After the selection of suitable social media channels at the upper level, the media selection is followed. As each social media channel has its individual functionalities and structures, this selection can be related to accounts, websites, hashtags and influences. The media selection approach is illustrated in Figure 4. It includes two main stages. While in the first stage sub-categories for the quality dimensions are defined, in the second, measurable features are determined. These two stages are required since the quality dimensions are not directly measurable.
Information Needs
Channel Selection
Application of Information Quality
Dimensions
Input Output
Upper Level:Channel Selection
Medium Level:Channel Selection
List of suitable Social Media channels
List of suitable media inside one
Social Media channel
Assess sources
Assess accessibility
Assess accuracy
Assess believability
Assess relevance
Assess timeliness
Document assessment
Select (s) channel(s)
Select blogs
Select microblogs
Select social network
sites
Select videosharing
platform
Select other social media
channel
Select minimum 1 channel
Documented assessments
Outlined sources
Documented needs
Social media channel(s) selected
List of channel

150
Figure 4: Channel selection on media level
Select social media channel on media level
Define
subcategories
for IQ
dimensions
Define
measurable
features
Use identiy,
expertise &
reputation
for
believability
Define
measurable
features
Define
features for
identity
Define
features for
expertise
Define
features for
reputation
Create
ranking/
CO- Criteria
Assess each
media
Assess
accessibility
Access
accuracy
Assess
relevance
Assess
believability
Features
approved?
Do not
include in
corpus
Features
approved?
Do not
include in
corpus
No
YesYe
s
Features
approved?
Do not
include in
corpus
No
All IQ
dimensions
assessed for
one media?
Assess
identity of
source
Assess
expertise of
source
Assess
reputation
of source
Approve
assessment
All
approved?
No
Not include
in corpus
No
All IQ
approved?
Yes
Do not
include in
corpus
No
Include
media into
corpus
Yes
Extract
data
For defined IQ
dimensions
Accessibility
Accuracy
Relevance
Timeliness
Other
For all IQ
dimensions
Defined
categories
Defined
features
Defined
features for
reputation
Defined
features
for identity
Defined
features for
expertise
Defined
information
requirements
Ranking on
relevance of IQ
dimensions in
accordance
with defined
objective
Defined
objetive
List of
potential
relevant media
per channel
Assess
timeliness
Features
approved?
Do not
include in
corpus
No
Yes
Select social
media channel
on upper level
List of
channel(s)
Assess
other IQ
dimension
Do not
include in
corpus
No
Features
approved?
L
List of media
for each
channel
No
Yes
Yes
Yes
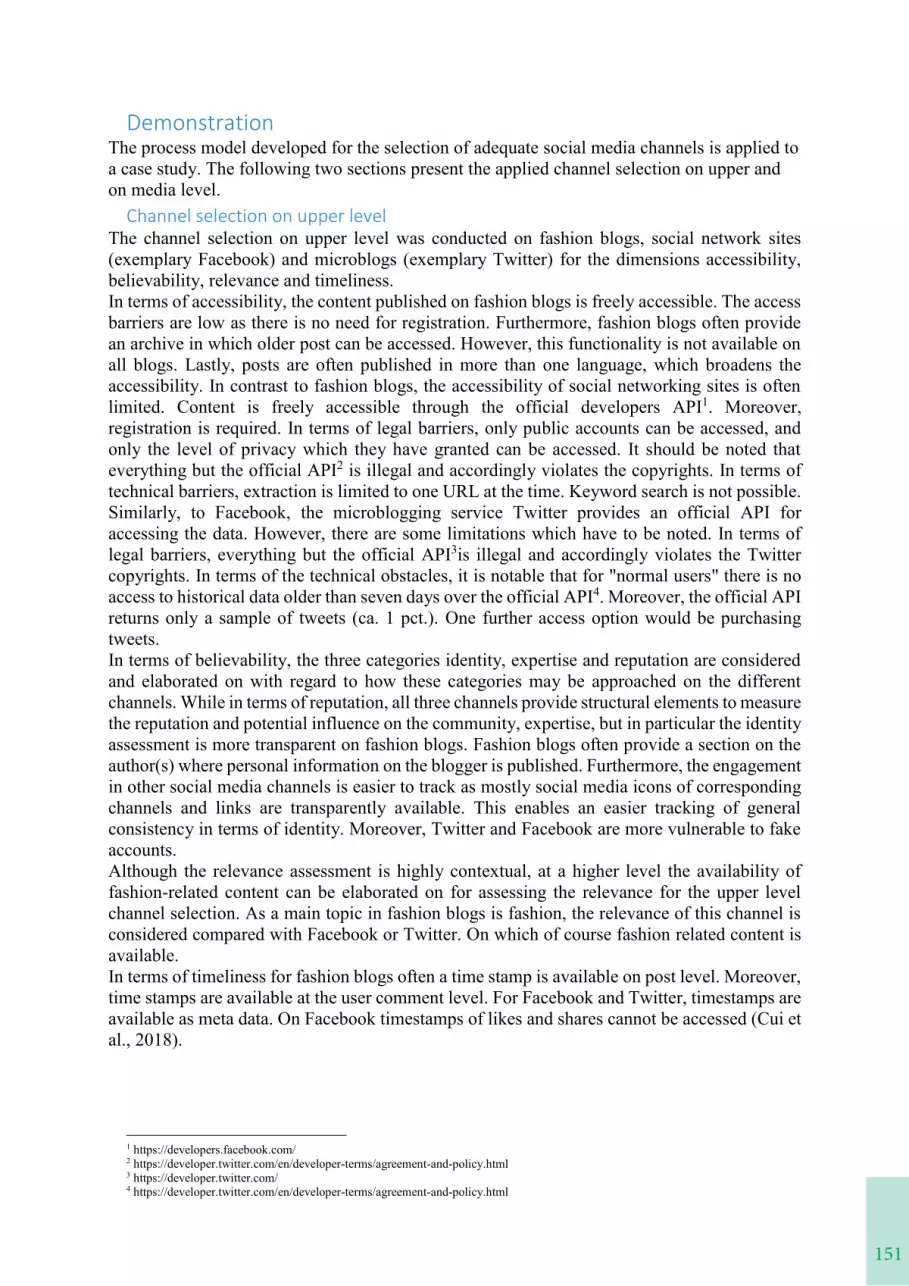
151
Figure 4: Channel selection on media level
Select social media channel on media level
Define
subcategories
for IQ
dimensions
Define
measurable
features
Use identiy,
expertise &
reputation
for
believability
Define
measurable
features
Define
features for
identity
Define
features for
expertise
Define
features for
reputation
Create
ranking/
CO- Criteria
Assess each
media
Assess
accessibility
Access
accuracy
Assess
relevance
Assess
believability
Features
approved?
Do not
include in
corpus
Features
approved?
Do not
include in
corpus
No
YesYe
s
Features
approved?
Do not
include in
corpus
No
All IQ
dimensions
assessed for
one media?
Assess
identity of
source
Assess
expertise of
source
Assess
reputation
of source
Approve
assessment
All
approved?
No
Not include
in corpus
No
All IQ
approved?
Yes
Do not
include in
corpus
No
Include
media into
corpus
Yes
Extract
data
For defined IQ
dimensions
Accessibility
Accuracy
Relevance
Timeliness
Other
For all IQ
dimensions
Defined
categories
Defined
features
Defined
features for
reputation
Defined
features
for identity
Defined
features for
expertise
Defined
information
requirements
Ranking on
relevance of IQ
dimensions in
accordance
with defined
objective
Defined
objetive
List of
potential
relevant media
per channel
Assess
timeliness
Features
approved?
Do not
include in
corpus
No
Yes
Select social
media channel
on upper level
List of
channel(s)
Assess
other IQ
dimension
Do not
include in
corpus
No
Features
approved?
L
List of media
for each
channel
No
Yes
Yes
Yes
The process model developed for the selection of adequate social media channels is applied to a case study. The following two sections present the applied channel selection on upper and on media level.
The channel selection on upper level was conducted on fashion blogs, social network sites (exemplary Facebook) and microblogs (exemplary Twitter) for the dimensions accessibility, believability, relevance and timeliness. In terms of accessibility, the content published on fashion blogs is freely accessible. The access barriers are low as there is no need for registration. Furthermore, fashion blogs often provide an archive in which older post can be accessed. However, this functionality is not available on all blogs. Lastly, posts are often published in more than one language, which broadens the accessibility. In contrast to fashion blogs, the accessibility of social networking sites is often limited. Content is freely accessible through the official developers API1. Moreover, registration is required. In terms of legal barriers, only public accounts can be accessed, and only the level of privacy which they have granted can be accessed. It should be noted that everything but the official API2 is illegal and accordingly violates the copyrights. In terms of technical barriers, extraction is limited to one URL at the time. Keyword search is not possible. Similarly, to Facebook, the microblogging service Twitter provides an official API for accessing the data. However, there are some limitations which have to be noted. In terms of legal barriers, everything but the official API3is illegal and accordingly violates the Twitter copyrights. In terms of the technical obstacles, it is notable that for "normal users" there is no access to historical data older than seven days over the official API4. Moreover, the official API returns only a sample of tweets (ca. 1 pct.). One further access option would be purchasing tweets. In terms of believability, the three categories identity, expertise and reputation are considered and elaborated on with regard to how these categories may be approached on the different channels. While in terms of reputation, all three channels provide structural elements to measure the reputation and potential influence on the community, expertise, but in particular the identity assessment is more transparent on fashion blogs. Fashion blogs often provide a section on the author(s) where personal information on the blogger is published. Furthermore, the engagement in other social media channels is easier to track as mostly social media icons of corresponding channels and links are transparently available. This enables an easier tracking of general consistency in terms of identity. Moreover, Twitter and Facebook are more vulnerable to fake accounts. Although the relevance assessment is highly contextual, at a higher level the availability of fashion-related content can be elaborated on for assessing the relevance for the upper level channel selection. As a main topic in fashion blogs is fashion, the relevance of this channel is considered compared with Facebook or Twitter. On which of course fashion related content is available. In terms of timeliness for fashion blogs often a time stamp is available on post level. Moreover, time stamps are available at the user comment level. For Facebook and Twitter, timestamps are available as meta data. On Facebook timestamps of likes and shares cannot be accessed (Cui et al., 2018).
1 https://developers.facebook.com/ 2 https://developer.twitter.com/en/developer-terms/agreement-and-policy.html 3 https://developer.twitter.com/ 4 https://developer.twitter.com/en/developer-terms/agreement-and-policy.html
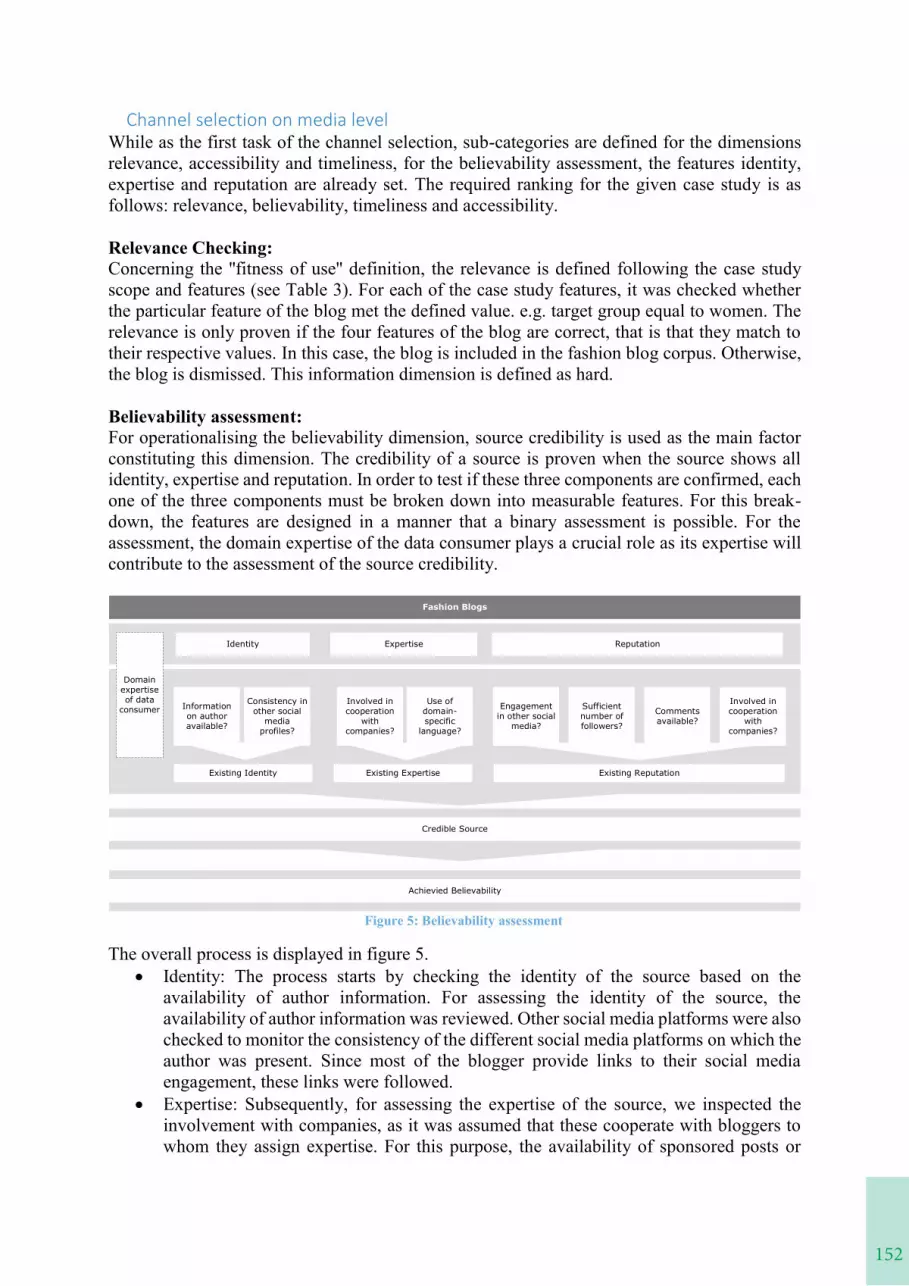
152
While as the first task of the channel selection, sub-categories are defined for the dimensions relevance, accessibility and timeliness, for the believability assessment, the features identity, expertise and reputation are already set. The required ranking for the given case study is as follows: relevance, believability, timeliness and accessibility. Relevance Checking: Concerning the ''fitness of use'' definition, the relevance is defined following the case study scope and features (see Table 3). For each of the case study features, it was checked whether the particular feature of the blog met the defined value. e.g. target group equal to women. The relevance is only proven if the four features of the blog are correct, that is that they match to their respective values. In this case, the blog is included in the fashion blog corpus. Otherwise, the blog is dismissed. This information dimension is defined as hard. Believability assessment: For operationalising the believability dimension, source credibility is used as the main factor constituting this dimension. The credibility of a source is proven when the source shows all identity, expertise and reputation. In order to test if these three components are confirmed, each one of the three components must be broken down into measurable features. For this break-down, the features are designed in a manner that a binary assessment is possible. For the assessment, the domain expertise of the data consumer plays a crucial role as its expertise will contribute to the assessment of the source credibility.
Figure 5: Believability assessment
The overall process is displayed in figure 5. Identity: The process starts by checking the identity of the source based on the
availability of author information. For assessing the identity of the source, the availability of author information was reviewed. Other social media platforms were also checked to monitor the consistency of the different social media platforms on which the author was present. Since most of the blogger provide links to their social media engagement, these links were followed.
Expertise: Subsequently, for assessing the expertise of the source, we inspected the involvement with companies, as it was assumed that these cooperate with bloggers to whom they assign expertise. For this purpose, the availability of sponsored posts or
Involved in cooperation
with companies?
Use of domain-specific
language?
Engagement in other social
media?
Sufficient number of followers?
Comments available?
Involved in cooperation
with companies?
Domain expertise of data
consumer
Identity ReputationExpertise
Fashion Blogs
Credible Source
Achievied Believability
Existing Identity
Information on author available?
Consistency in other social
media profiles?
Existing Expertise Existing Reputation
153
While as the first task of the channel selection, sub-categories are defined for the dimensions relevance, accessibility and timeliness, for the believability assessment, the features identity, expertise and reputation are already set. The required ranking for the given case study is as follows: relevance, believability, timeliness and accessibility. Relevance Checking: Concerning the ''fitness of use'' definition, the relevance is defined following the case study scope and features (see Table 3). For each of the case study features, it was checked whether the particular feature of the blog met the defined value. e.g. target group equal to women. The relevance is only proven if the four features of the blog are correct, that is that they match to their respective values. In this case, the blog is included in the fashion blog corpus. Otherwise, the blog is dismissed. This information dimension is defined as hard. Believability assessment: For operationalising the believability dimension, source credibility is used as the main factor constituting this dimension. The credibility of a source is proven when the source shows all identity, expertise and reputation. In order to test if these three components are confirmed, each one of the three components must be broken down into measurable features. For this break-down, the features are designed in a manner that a binary assessment is possible. For the assessment, the domain expertise of the data consumer plays a crucial role as its expertise will contribute to the assessment of the source credibility.
Figure 5: Believability assessment
The overall process is displayed in figure 5. Identity: The process starts by checking the identity of the source based on the
availability of author information. For assessing the identity of the source, the availability of author information was reviewed. Other social media platforms were also checked to monitor the consistency of the different social media platforms on which the author was present. Since most of the blogger provide links to their social media engagement, these links were followed.
Expertise: Subsequently, for assessing the expertise of the source, we inspected the involvement with companies, as it was assumed that these cooperate with bloggers to whom they assign expertise. For this purpose, the availability of sponsored posts or
Involved in cooperation
with companies?
Use of domain-specific
language?
Engagement in other social
media?
Sufficient number of followers?
Comments available?
Involved in cooperation
with companies?
Domain expertise of data
consumer
Identity ReputationExpertise
Fashion Blogs
Credible Source
Achievied Believability
Existing Identity
Information on author available?
Consistency in other social
media profiles?
Existing Expertise Existing Reputation
affiliated links were examined. Moreover, the domain-specific language was checked as its use considered to show the expertise in the field of fashion.
Reputation: For assessing the reputation, four features were checked. First, the engagement of the blogger in other social media was checked. Bloggers usually link their other social media engagements on their blogs. These links were used for assessing engagement in other social media. Other indicators for the reputation are the number of followers and friends. Moreover, the availability of comments on published posts was assessed. Similar to the expertise assessment, the cooperation with companies was considered as an indicator for the reputation of the blog. It is assumed that companies preferably cooperate with bloggers who have a broad reach and enable coverage to potential customers for the companies.
The overall believability assessment was conducted through the perspective of the data consumer who is the domain expert, and, who is thus able to assess the information regarding the described fashion related topics by her/his knowledge and expertise. When identity, expertise and reputation had been proved, the blog was considered to be a credible source. Thus, data believability is achieved, and the blog included in the fashion blog corpus. The result of the believability assessment was that all of the blogs had passed the assessment. Timeliness and accessibility checking: After the believability assessment, the timeliness dimension was checked. For this purpose, the availability of a complete time stamp on blog post level was examined. In case, it was not available, the availability of time-related components on the post URL level was checked. Finally, it was checked if the posts could be extracted with reasonable effort. Following this proposed methodology, a fashion blog corpus consisting of 46 individual blogs was created.
Based on the DSR Evaluation Strategy Selection Framework (Venable et al. 2012), a naturalistic and ex-post evaluation is selected as appropriate for the evaluation of the presented process model. Following this evaluation strategy, real users of the artifact developed should serve as evaluands. At this stage of the research, we will focus on the determination of the evaluands. Fashion markets are highly complex and diverse considering their SC strategies, and configurations implemented. These settings result into differences in lead and time-to-market times, as well as in range building processes. Due to this situation, it is worthwhile glancing at the determination of potential evaluands, before conducting the actual evaluation. This could be done, by, for instance, elaborating on fast fashion retailing and luxury markets. This is done in the following sections.
Fast fashion retailers strategy is oriented towards customers' demand and targets at responding to market changes in a timely manner. This demand is often tracked through sales data captured in the stores. In addition, mostly small and medium volumes are produced. In contrast, traditional apparel retailers place large quantities. Often fast fashion retailers follow a backward vertical integration. This strategy enables the companies to manage the different steps from design to distribution. Commonly a large portion of the SC is owned by the retailer, and the rest is usually controlled due to close distances. One significant difference between traditional and fast fashion retailing is the difference in lead times. Traditional retailing is characterised through long lead times, taking up to 29 weeks from the first design to the delivery to the stores. In contrast, fast fashion retailers take 15 days, including the shipping to the stores. Also, concerning forecasts traditional retailers act differently: they do generate predictions before the selling season. Whereas fast fashion is more closely to the season and also base often real-time
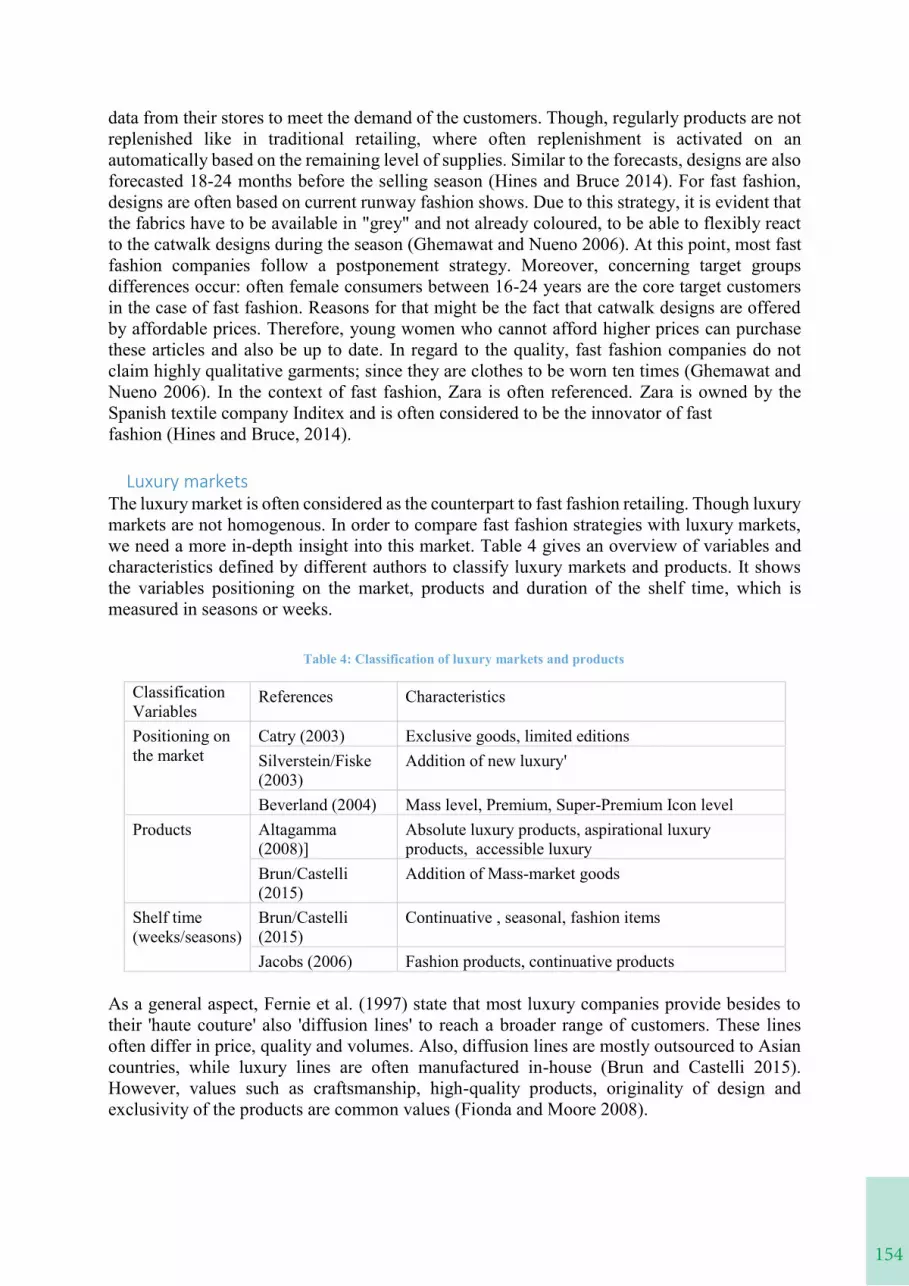
154
data from their stores to meet the demand of the customers. Though, regularly products are not replenished like in traditional retailing, where often replenishment is activated on an automatically based on the remaining level of supplies. Similar to the forecasts, designs are also forecasted 18-24 months before the selling season (Hines and Bruce 2014). For fast fashion, designs are often based on current runway fashion shows. Due to this strategy, it is evident that the fabrics have to be available in "grey" and not already coloured, to be able to flexibly react to the catwalk designs during the season (Ghemawat and Nueno 2006). At this point, most fast fashion companies follow a postponement strategy. Moreover, concerning target groups differences occur: often female consumers between 16-24 years are the core target customers in the case of fast fashion. Reasons for that might be the fact that catwalk designs are offered by affordable prices. Therefore, young women who cannot afford higher prices can purchase these articles and also be up to date. In regard to the quality, fast fashion companies do not claim highly qualitative garments; since they are clothes to be worn ten times (Ghemawat and Nueno 2006). In the context of fast fashion, Zara is often referenced. Zara is owned by the Spanish textile company Inditex and is often considered to be the innovator of fast fashion (Hines and Bruce, 2014).
The luxury market is often considered as the counterpart to fast fashion retailing. Though luxury markets are not homogenous. In order to compare fast fashion strategies with luxury markets, we need a more in-depth insight into this market. Table 4 gives an overview of variables and characteristics defined by different authors to classify luxury markets and products. It shows the variables positioning on the market, products and duration of the shelf time, which is measured in seasons or weeks.
Table 4: Classification of luxury markets and products
Classification Variables
References Characteristics
Positioning on the market
Catry (2003) Exclusive goods, limited editions Silverstein/Fiske (2003)
Addition of new luxury'
Beverland (2004) Mass level, Premium, Super-Premium Icon level Products Altagamma
(2008)] Absolute luxury products, aspirational luxury products, accessible luxury
Brun/Castelli (2015)
Addition of Mass-market goods
Shelf time (weeks/seasons)
Brun/Castelli (2015)
Continuative , seasonal, fashion items
Jacobs (2006) Fashion products, continuative products As a general aspect, Fernie et al. (1997) state that most luxury companies provide besides to their 'haute couture' also 'diffusion lines' to reach a broader range of customers. These lines often differ in price, quality and volumes. Also, diffusion lines are mostly outsourced to Asian countries, while luxury lines are often manufactured in-house (Brun and Castelli 2015). However, values such as craftsmanship, high-quality products, originality of design and exclusivity of the products are common values (Fionda and Moore 2008).
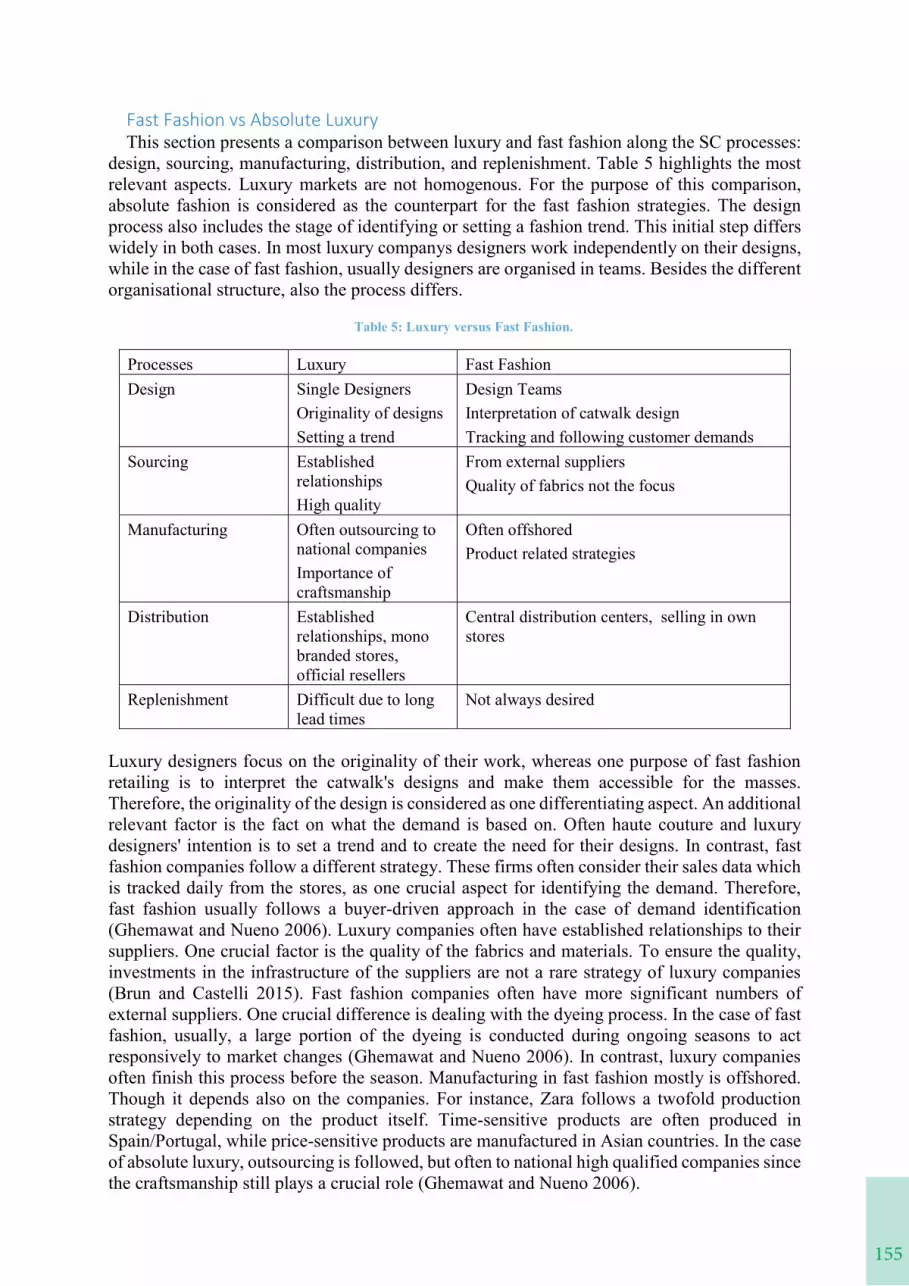
155
data from their stores to meet the demand of the customers. Though, regularly products are not replenished like in traditional retailing, where often replenishment is activated on an automatically based on the remaining level of supplies. Similar to the forecasts, designs are also forecasted 18-24 months before the selling season (Hines and Bruce 2014). For fast fashion, designs are often based on current runway fashion shows. Due to this strategy, it is evident that the fabrics have to be available in "grey" and not already coloured, to be able to flexibly react to the catwalk designs during the season (Ghemawat and Nueno 2006). At this point, most fast fashion companies follow a postponement strategy. Moreover, concerning target groups differences occur: often female consumers between 16-24 years are the core target customers in the case of fast fashion. Reasons for that might be the fact that catwalk designs are offered by affordable prices. Therefore, young women who cannot afford higher prices can purchase these articles and also be up to date. In regard to the quality, fast fashion companies do not claim highly qualitative garments; since they are clothes to be worn ten times (Ghemawat and Nueno 2006). In the context of fast fashion, Zara is often referenced. Zara is owned by the Spanish textile company Inditex and is often considered to be the innovator of fast fashion (Hines and Bruce, 2014).
The luxury market is often considered as the counterpart to fast fashion retailing. Though luxury markets are not homogenous. In order to compare fast fashion strategies with luxury markets, we need a more in-depth insight into this market. Table 4 gives an overview of variables and characteristics defined by different authors to classify luxury markets and products. It shows the variables positioning on the market, products and duration of the shelf time, which is measured in seasons or weeks.
Table 4: Classification of luxury markets and products
Classification Variables
References Characteristics
Positioning on the market
Catry (2003) Exclusive goods, limited editions Silverstein/Fiske (2003)
Addition of new luxury'
Beverland (2004) Mass level, Premium, Super-Premium Icon level Products Altagamma
(2008)] Absolute luxury products, aspirational luxury products, accessible luxury
Brun/Castelli (2015)
Addition of Mass-market goods
Shelf time (weeks/seasons)
Brun/Castelli (2015)
Continuative , seasonal, fashion items
Jacobs (2006) Fashion products, continuative products As a general aspect, Fernie et al. (1997) state that most luxury companies provide besides to their 'haute couture' also 'diffusion lines' to reach a broader range of customers. These lines often differ in price, quality and volumes. Also, diffusion lines are mostly outsourced to Asian countries, while luxury lines are often manufactured in-house (Brun and Castelli 2015). However, values such as craftsmanship, high-quality products, originality of design and exclusivity of the products are common values (Fionda and Moore 2008).
This section presents a comparison between luxury and fast fashion along the SC processes: design, sourcing, manufacturing, distribution, and replenishment. Table 5 highlights the most relevant aspects. Luxury markets are not homogenous. For the purpose of this comparison, absolute fashion is considered as the counterpart for the fast fashion strategies. The design process also includes the stage of identifying or setting a fashion trend. This initial step differs widely in both cases. In most luxury companys designers work independently on their designs, while in the case of fast fashion, usually designers are organised in teams. Besides the different organisational structure, also the process differs.
Table 5: Luxury versus Fast Fashion.
Processes Luxury Fast Fashion Design Single Designers
Originality of designs Setting a trend
Design Teams Interpretation of catwalk design Tracking and following customer demands
Sourcing Established relationships High quality
From external suppliers Quality of fabrics not the focus
Manufacturing Often outsourcing to national companies Importance of craftsmanship
Often offshored Product related strategies
Distribution Established relationships, mono branded stores, official resellers
Central distribution centers, selling in own stores
Replenishment Difficult due to long lead times
Not always desired
Luxury designers focus on the originality of their work, whereas one purpose of fast fashion retailing is to interpret the catwalk's designs and make them accessible for the masses. Therefore, the originality of the design is considered as one differentiating aspect. An additional relevant factor is the fact on what the demand is based on. Often haute couture and luxury designers' intention is to set a trend and to create the need for their designs. In contrast, fast fashion companies follow a different strategy. These firms often consider their sales data which is tracked daily from the stores, as one crucial aspect for identifying the demand. Therefore, fast fashion usually follows a buyer-driven approach in the case of demand identification (Ghemawat and Nueno 2006). Luxury companies often have established relationships to their suppliers. One crucial factor is the quality of the fabrics and materials. To ensure the quality, investments in the infrastructure of the suppliers are not a rare strategy of luxury companies (Brun and Castelli 2015). Fast fashion companies often have more significant numbers of external suppliers. One crucial difference is dealing with the dyeing process. In the case of fast fashion, usually, a large portion of the dyeing is conducted during ongoing seasons to act responsively to market changes (Ghemawat and Nueno 2006). In contrast, luxury companies often finish this process before the season. Manufacturing in fast fashion mostly is offshored. Though it depends also on the companies. For instance, Zara follows a twofold production strategy depending on the product itself. Time-sensitive products are often produced in Spain/Portugal, while price-sensitive products are manufactured in Asian countries. In the case of absolute luxury, outsourcing is followed, but often to national high qualified companies since the craftsmanship still plays a crucial role (Ghemawat and Nueno 2006).
156
Zara, for instance, owns a central distribution centre in the North of Spain where all products weather they are produced in-house or outsourced/offshored has to be passed through. Often the garments are sold in their stores. Luxury companies often sell their products in mono-brand stores either owned or franchised stores. Often also they work with official resellers (Brun and Castelli 2015). In regard to replenishment strategies, most fast fashion companies follow the principle that there is no need for replenishment. With this strategy, they want to give the feeling of limitedness to their customers and want to attract them more often to their stores. Often the sold-out products, are entered to the market and stores, in a variation within the same season (Hines and Bruce 2014). In contrast, replenishment in luxury companies is, in some cases, desired, but difficult to realise due to the long lead times.
This paper introduces a DSR based approach for developing an artifact for the selection of social media channels considering social media characteristics, in particular, the veracity feature. In this regard, a process model mainly consisting of the two main processes of channel selection on upper and on media level is developed. The process model was designed, employing BPMN 2.0. The use of the artifact is demonstrated by applying it on a case study. A significant focus is put on the believability assessment. As a proceeding step, the evaluation approach with an emphasis on the determination of possible evaluands put forward. This implies a comparison of fast fashion and luxury processes. As future work, a questionnaire will be designed to distribute to representatives of fast fashion and luxury organisations to evaluate the utility of the artifact for two different settings. For this purpose, different stakeholders involved in the diverse steps of a fashion and apparel SC will be interviewed in order to evaluate the utility of the process model developed.
af Rosenborg, K., Christina, D., Buhl-Andersen, I., Nilsson, L. B., Rebild, M. P., Mukkamala, R. R., Hussain, A., and Vatrapu, R. (2017). Buzz vs. sales: Big social data analytics of style icon campaigns and fashion designer collaborations on h&m's facebook page. In 50th Hawaii International Conference on System Sciences (HICSS), pages 1861–1870. Allweyer, T. (2015). BPMN 2.0-Business Process Model and Notation: Einführung in den Standard für die Geschäftsprozessmodellierung. BoD–Books on Demand. Altagamma (2008) Fashion and luxury insight, www.altagamma.it Agarwal, N. and Yiliyasi, Y. (2010). Information quality challenges in social media. In ICIQ. Awwad, M., Kulkarni, P., Bapna, R., and Marathe, A. (2018). Big Data Analytics in Supply Chain : A Literature Review. In International Conference on Industrial Engineering and Operations Management. Beheshti-Kashi, S., Lütjen, M., Stoever, L., and Thoben, K.-D. (2015). TrendFashion – A Framework for the Identification of Fashion Trends. In Cunningham, D., Hofstedt, P., Meer, K., Schmitt, I., editor, INFORMATIK 2015, Lecture Notes in Informatics (LNI), Bonn 2015. Beheshti-Kashi, S., Hribernik, K., Lützenberger, J., Arabsolgar, D., and Thoben, K.-D. (2016). Fashion Supply Chains and Social Media: Examining the Potential of Data Analysis of Social-Media Texts for Decision Making-Processes in Fashion Supply Chains. In Workshop on Business Models and ICT Technologies for the Fashion Supply Chain, pages 271–281. Springer. Beheshti-Kashi, S., Lütjen, M., and Thoben, K.-D. (2018). Social Media Analytics for Decision Support in Fashion Buying Processes. In Artificial Intelligence for Fashion Industry in the Big Data Era, pages 71–93. Springer. Samaneh Beheshti-Kashi (2020) Development of a social media process model for fashion and apparel supply chain decisions, Cyber-Physical Systems, 6:2, 76-95, DOI: 10.1080/23335777.2019.1680577
157
Zara, for instance, owns a central distribution centre in the North of Spain where all products weather they are produced in-house or outsourced/offshored has to be passed through. Often the garments are sold in their stores. Luxury companies often sell their products in mono-brand stores either owned or franchised stores. Often also they work with official resellers (Brun and Castelli 2015). In regard to replenishment strategies, most fast fashion companies follow the principle that there is no need for replenishment. With this strategy, they want to give the feeling of limitedness to their customers and want to attract them more often to their stores. Often the sold-out products, are entered to the market and stores, in a variation within the same season (Hines and Bruce 2014). In contrast, replenishment in luxury companies is, in some cases, desired, but difficult to realise due to the long lead times.
This paper introduces a DSR based approach for developing an artifact for the selection of social media channels considering social media characteristics, in particular, the veracity feature. In this regard, a process model mainly consisting of the two main processes of channel selection on upper and on media level is developed. The process model was designed, employing BPMN 2.0. The use of the artifact is demonstrated by applying it on a case study. A significant focus is put on the believability assessment. As a proceeding step, the evaluation approach with an emphasis on the determination of possible evaluands put forward. This implies a comparison of fast fashion and luxury processes. As future work, a questionnaire will be designed to distribute to representatives of fast fashion and luxury organisations to evaluate the utility of the artifact for two different settings. For this purpose, different stakeholders involved in the diverse steps of a fashion and apparel SC will be interviewed in order to evaluate the utility of the process model developed.
af Rosenborg, K., Christina, D., Buhl-Andersen, I., Nilsson, L. B., Rebild, M. P., Mukkamala, R. R., Hussain, A., and Vatrapu, R. (2017). Buzz vs. sales: Big social data analytics of style icon campaigns and fashion designer collaborations on h&m's facebook page. In 50th Hawaii International Conference on System Sciences (HICSS), pages 1861–1870. Allweyer, T. (2015). BPMN 2.0-Business Process Model and Notation: Einführung in den Standard für die Geschäftsprozessmodellierung. BoD–Books on Demand. Altagamma (2008) Fashion and luxury insight, www.altagamma.it Agarwal, N. and Yiliyasi, Y. (2010). Information quality challenges in social media. In ICIQ. Awwad, M., Kulkarni, P., Bapna, R., and Marathe, A. (2018). Big Data Analytics in Supply Chain : A Literature Review. In International Conference on Industrial Engineering and Operations Management. Beheshti-Kashi, S., Lütjen, M., Stoever, L., and Thoben, K.-D. (2015). TrendFashion – A Framework for the Identification of Fashion Trends. In Cunningham, D., Hofstedt, P., Meer, K., Schmitt, I., editor, INFORMATIK 2015, Lecture Notes in Informatics (LNI), Bonn 2015. Beheshti-Kashi, S., Hribernik, K., Lützenberger, J., Arabsolgar, D., and Thoben, K.-D. (2016). Fashion Supply Chains and Social Media: Examining the Potential of Data Analysis of Social-Media Texts for Decision Making-Processes in Fashion Supply Chains. In Workshop on Business Models and ICT Technologies for the Fashion Supply Chain, pages 271–281. Springer. Beheshti-Kashi, S., Lütjen, M., and Thoben, K.-D. (2018). Social Media Analytics for Decision Support in Fashion Buying Processes. In Artificial Intelligence for Fashion Industry in the Big Data Era, pages 71–93. Springer. Samaneh Beheshti-Kashi (2020) Development of a social media process model for fashion and apparel supply chain decisions, Cyber-Physical Systems, 6:2, 76-95, DOI: 10.1080/23335777.2019.1680577
Beverland M (2004) Uncovering ‚theories in use ': building luxury wine brands, European Journal of Marketing, 38: 446-466. Boldt, L. C., Vinayagamoorthy, V.,Winder, F., Schnittger, M., Ekran, M., Mukkamala, R. R., Lassen, N. B., Flesch, B., Hussain, A., and Vatrapu, R. (2016). Forecasting Nike's sales using Facebook data. In 2016 IEEE International Conference on Big Data (Big Data), pages 2447–2456. IEEE. Borchers, A. (2009). A Multidisciplinary View of Data Quality. Encyclopedia of Information Science and Technology, pages 2741–2747. Brun A, Castelli C (2015) Supply chain strategy in the fashion and luxury industry, Logistics and Retail Management, editors Fernie, J, Sparks, L, 4th edition. Catry B, (2003) The great pretenders, Business Strategy Review, 14, (3): 10-17. Crawford Camiciottoli, B., Ranfagni, S., and Guercini, S. (2014). Exploring brand associations: an innovative methodological approach. European Journal of Marketing, 48(5/6):1092–1112. Cui, R., Gallino, S., Moreno, A., and Zhang, D. J. (2018). The operational value of social media information. Production and Operations Management, 27(10):1749–1769. Fernie J, Moore C, Lawrie A, Hallsworth A (1997) The internationalisation of the high fashion brand: the case of Central London, Journal of Product and Brand Management, 6, (3):151-162. Filß, C., Höhn, R., Höppner, S., and Wetzel, H. (2005). Arbeitsbericht der Gl Fachgruppe WI-VM Arbeitskreis Vorgehensmodelltypen: Rahmen zur Auswahl von Vorgehensmodellen. In Petrasch, R., editor, Entscheidungsfall Vorgehensmodelle : 12. Workshop der Fachgruppe WI-VM der Gesellschaft für Informatik e.V. (GI), pages 183–227, Aachen. Shaker. Fionda A, Moore C (2008) The anatomy of the luxury fashion brand, Brand Management,16, (5/6):347–363 Fisher M, Raman A (2010) The New Science of Retailing: How Analytics are Transforming Supply Chains and Improving Performance. Fosso Wamba, S., Gunasekaran, A., Papadopoulos, T., and Ngai, E. (2018). Big data analytics in logistics and supply chain management. The International Journal of Logistics Management, 29(2):478–484. Halvorsen, K., Hoffmann, J., Coste-Manière, I., and Stankeviciute, R. (2013). Can fashion blogs function as a marketing tool to influence consumer behavior? Evidence from Norway. Journal of Global Fashion Marketing, 4(3):211–224. Hazen, B. T., C. A. Boone, J. D. Ezell, and L. A. Jones-Farmer. 2014. "Data quality for data science, predictive analytics, and big data in supply chain management: An introduction to the problem and suggestions for research and applications." International Journal of Production Economics 154: 72-80. Hevner, A. R., March, S. T., Park, J., and Ram, S. (2004). Design Science in Information Systems Research. MIS Q., 28(1):75–105. Hines T, Bruce M (2014) Supply chain strategies, structures and relationships, Fashion Marketing: Contemporary issues, Butterworth-Heinemann, Oxford, third edition: 27-53. Hopkins, J., and P. Hawking. 2018. "Big Data Analytics and IoT in logistics: a case study." International Journal of Logistics Management 29 (2) 575-591. doi: 10.1108/IJLM-05-2017-0109 Guellil, I. and Boukhalfa, K. (2015). Social big data mining: A survey focused on opinion mining and sentiments analysis. In IEEE 12th International Symposium on Programming and Systems (ISPS), pages 1–10. IEEE. Ghemawat, P, Nueno, JL (2006) Zara: Fast Fashion, Harvard Business Review. Iftikhar, R. and Khan, D. M. (2019). Social media big data analytics for demand forecasting: Development and case implementation of an innovative framework. Journal of Global Information Management, 28:103–120.
158
Ivanov, D. (2017). "Simulation-based single vs dual sourcing analysis in the supply chain with consideration of capacity disruptions, Big Data and demand patterns." International Journal of Integrated Supply Management 11 (1): 24-43. Jacobs D (2006) The promise of demand chain management in fashion, Journal of fashion marketing and management, 10, (1): 84-96 Jeble, S., R. Dubey, S. J. Childe, T. Papadopoulos, D. Roubaud, and A. Prakash. 2018. "Impact of big data and predictive analytics capability on supply chain sustainability." The International Journal of Logistics Management 29 (2): 513-538. doi: 10.1108/IJLM-05-2017-0134 Hu, X. and Liu, H. (2012). Text analytics in social media. In Mining text data, pages 385–414. Springer. Kaplan, A. M. and Haenlein, M. (2010). Users of the world, unite! The challenges and opportunities of Social Media. Business Horizons, 53(1):59–68. Lee, H. L. 2018. "Big Data and the Innovation Cycle." Production and Operations Management 27 (9): 1642-1646. doi:10.1111/poms.12845 Lin, J. (2015). On building better mousetraps and understanding the human condition: Reflections on big data in the social sciences. The ANNALS of the American Academy of Political and Social Science, 659(1):33–47. Lukoianova, T. and Rubin, V. (2014). Veracity Roadmap: Is Big Data Objective, Truthful and Credible? Advances in Classification Research Online, 24(1):4–15. Marr, B. (2015). Why only one of the 5 Vs of big data really matters. Mehmood, R., R. Meriton, G. Graham, P. Hennelly, and M. Kumar. 2017. "Exploring the influence of big data on city transport operations: a Markovian approach." International Journal of Operations & Production Management 37 (1): 75-104. Meredith, J. (1998). Building operations management theory through case and field research. Journal of Operations Management, 16(4):441–454. Peffers, K., Tuunanen, T., Rothenberger, M., and Chatterjee, S. (2007). A Design Science Research Methodology for Information Systems Research. Journal of Management Information Systems, 24(3):45–77. Redman, T. C. (1998). The impact of poor data quality on the typical enterprise. Communications of the ACM, 41(2):79–82. Rickman, T. A. and Cosenza, R. M. (2007). The changing digital dynamics of multichannel marketing: The feasibility of the weblog: text mining approach for fast fashion trending. Journal of Fashion Marketing and Management: An International Journal, 11(4):604–621. Silverstein MJ, FiskeN (2003) Trading up: The new American luxury, New York: Portfolio/Penguin Group. Schoenherr, T., and C. Speier-Pero. 2015. "Data science, predictive analytics, and big data in supply chain management: Current state and future potential." Journal of Business Logistics 36 (1): 120-132. doi: 10.1111/jbl.12082. Sebei, H., Hadj Taieb, M. A., and Ben Aouicha, M. (2018). Review of social media analytics process and big data pipeline. Social Network Analysis and Mining, 8. See-To, E. W. and Ngai, E. W. (2018). Customer reviews for demand distribution and sales nowcasting: A big data approach. Annals of Operations Research, 270(1-2):415–431. Shankaranarayanan, G. and Blake, R. (2017). From content to context: The evolution and growth of data quality research. Journal of Data and Information Quality (JDIQ), 8(2):9. Stieglitz, S. and Dang-Xuan, L. (2013). Social media and political communication: a social media analytics framework. Social Network Analysis and Mining, 3(4):1277–1291.
159
Ivanov, D. (2017). "Simulation-based single vs dual sourcing analysis in the supply chain with consideration of capacity disruptions, Big Data and demand patterns." International Journal of Integrated Supply Management 11 (1): 24-43. Jacobs D (2006) The promise of demand chain management in fashion, Journal of fashion marketing and management, 10, (1): 84-96 Jeble, S., R. Dubey, S. J. Childe, T. Papadopoulos, D. Roubaud, and A. Prakash. 2018. "Impact of big data and predictive analytics capability on supply chain sustainability." The International Journal of Logistics Management 29 (2): 513-538. doi: 10.1108/IJLM-05-2017-0134 Hu, X. and Liu, H. (2012). Text analytics in social media. In Mining text data, pages 385–414. Springer. Kaplan, A. M. and Haenlein, M. (2010). Users of the world, unite! The challenges and opportunities of Social Media. Business Horizons, 53(1):59–68. Lee, H. L. 2018. "Big Data and the Innovation Cycle." Production and Operations Management 27 (9): 1642-1646. doi:10.1111/poms.12845 Lin, J. (2015). On building better mousetraps and understanding the human condition: Reflections on big data in the social sciences. The ANNALS of the American Academy of Political and Social Science, 659(1):33–47. Lukoianova, T. and Rubin, V. (2014). Veracity Roadmap: Is Big Data Objective, Truthful and Credible? Advances in Classification Research Online, 24(1):4–15. Marr, B. (2015). Why only one of the 5 Vs of big data really matters. Mehmood, R., R. Meriton, G. Graham, P. Hennelly, and M. Kumar. 2017. "Exploring the influence of big data on city transport operations: a Markovian approach." International Journal of Operations & Production Management 37 (1): 75-104. Meredith, J. (1998). Building operations management theory through case and field research. Journal of Operations Management, 16(4):441–454. Peffers, K., Tuunanen, T., Rothenberger, M., and Chatterjee, S. (2007). A Design Science Research Methodology for Information Systems Research. Journal of Management Information Systems, 24(3):45–77. Redman, T. C. (1998). The impact of poor data quality on the typical enterprise. Communications of the ACM, 41(2):79–82. Rickman, T. A. and Cosenza, R. M. (2007). The changing digital dynamics of multichannel marketing: The feasibility of the weblog: text mining approach for fast fashion trending. Journal of Fashion Marketing and Management: An International Journal, 11(4):604–621. Silverstein MJ, FiskeN (2003) Trading up: The new American luxury, New York: Portfolio/Penguin Group. Schoenherr, T., and C. Speier-Pero. 2015. "Data science, predictive analytics, and big data in supply chain management: Current state and future potential." Journal of Business Logistics 36 (1): 120-132. doi: 10.1111/jbl.12082. Sebei, H., Hadj Taieb, M. A., and Ben Aouicha, M. (2018). Review of social media analytics process and big data pipeline. Social Network Analysis and Mining, 8. See-To, E. W. and Ngai, E. W. (2018). Customer reviews for demand distribution and sales nowcasting: A big data approach. Annals of Operations Research, 270(1-2):415–431. Shankaranarayanan, G. and Blake, R. (2017). From content to context: The evolution and growth of data quality research. Journal of Data and Information Quality (JDIQ), 8(2):9. Stieglitz, S. and Dang-Xuan, L. (2013). Social media and political communication: a social media analytics framework. Social Network Analysis and Mining, 3(4):1277–1291.
Stieglitz, S., Dang-Xuan, L., Bruns, A., and Neuberger, C. (2014a). Social media analytics. Business & Information Systems Engineering, 6(2):89–96. Stieglitz, S., Mirbabaie, M., Ross, B., and Neuberger, C. (2018). Social media analytics–Challenges in topic discovery, data collection, and data preparation. International journal of information management, 39:156–168. Tiwari, S., Wee, H. M., and Daryanto, Y. (2018). Computers & Industrial Engineering Big data analytics in supply chain management between 2010 and 2016: Insights to industries. Computers & Industrial Engineering, 115(May 2017):319–330. Uzuno˘glu, E. and Misci Kip, S. (2014). Brand communication through digital influencers: Leveraging blogger engagement. International Journal of Information Management, 34(5):592–602. Venable, J., Pries-Heje, J., and Baskerville, R. (2012). A Comprehensive Framework for Evaluation in Design Science Research. In Peffers, K., Rothenberger, M., and Kuechler, B., editors, Design Science Research in Information Systems. Advances in Theory and Practice, pages 423–438, Berlin. Springer Berlin Heidelberg. Waller, M. A. and Fawcett, S. E. (2013). Data science, predictive analytics, and big data: a revolution that will transform supply chain design and management. Journal of Business Logistics, 34(2):77–84. Wang, R. Y. and Strong, D. M. (1996). Beyond accuracy: What data quality means to data consumers. Journal of management information systems, 12(4):5–33. Wu, J., H. Li, Z. Lin, and K.-Y. Goh. 2017. "How big data and analytics reshape the wearable device market – the context of e-health." International Journal of Production Research 55 (17): 5168-5182. doi: 10.1080/00207543.2015.1059521.
160
1
LOGISTICS POOLING AND MARKETING DIFFERENTIATION:THE NEW SOURCES OF COMPETITIVE ADVANTAGE IN A
DIGITALIZATION CONTEXT
Sophie JeanpertCRET-LOG
Aix-Marseille University, Aix-en-Provence, [email protected]
Anne Marianne SeckCERGAM
Aix-Marseille University, Aix-en-Provence, [email protected]
Gilles PachéCRET-LOG
Aix-Marseille University, Aix-en-Provence, [email protected]
KeywordsCity logistics, Competitive advantage, Differentiation, Digitalization, E-commerce, Local authorities, Pooling, Supply chain, Urban deliveries.
IntroductionThe development of e-commerce is one of the most significant advances in the evolution of distribution channels towards digitalization. Significant academic literature has focused in particular on how retailers develop attractive websites in addition to and/or in place of their physical stores in order to create strong consumer loyalty (Beck and Rygl, 2015; Fornari et al., 2016; Haridasan and Fernando, 2018; Davies et al., 2019). The result is multi-channel organizations of different types (Volle and Isaac, 2014), as shown in Figure 1, which multiply the touch points between the company and the consumer. More specifically with regard to the Internet channel, a significant effort is devoted to defining the offer, the ergonomics of the sites, or the ease of the ordering process. In a logic of fierce competition between websites, the implementation of an effective marketing strategy is perceived as a key element of differentiation from other companies, especially in order to build customer loyalty.
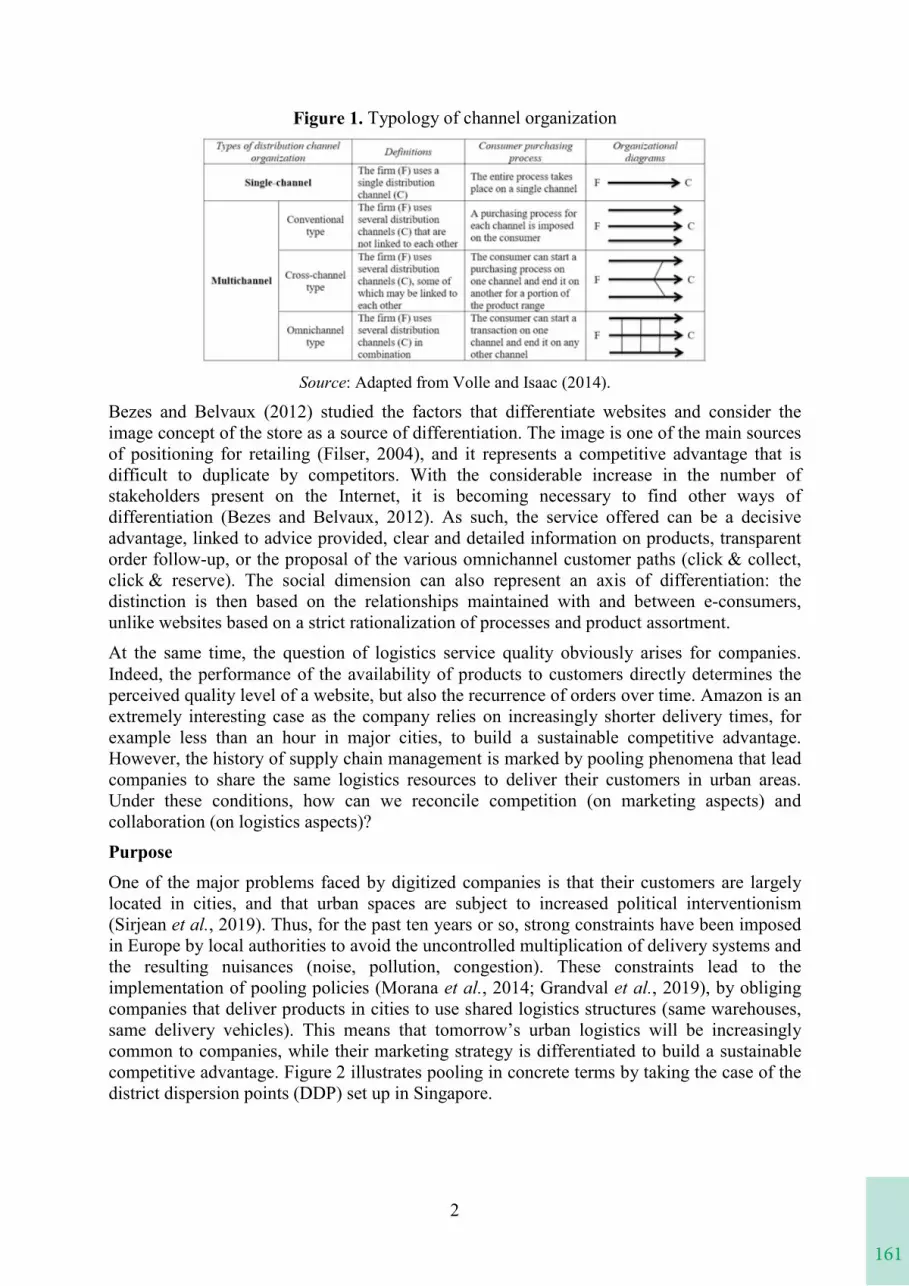
161
1
LOGISTICS POOLING AND MARKETING DIFFERENTIATION:THE NEW SOURCES OF COMPETITIVE ADVANTAGE IN A
DIGITALIZATION CONTEXT
Sophie JeanpertCRET-LOG
Aix-Marseille University, Aix-en-Provence, [email protected]
Anne Marianne SeckCERGAM
Aix-Marseille University, Aix-en-Provence, [email protected]
Gilles PachéCRET-LOG
Aix-Marseille University, Aix-en-Provence, [email protected]
KeywordsCity logistics, Competitive advantage, Differentiation, Digitalization, E-commerce, Local authorities, Pooling, Supply chain, Urban deliveries.
IntroductionThe development of e-commerce is one of the most significant advances in the evolution of distribution channels towards digitalization. Significant academic literature has focused in particular on how retailers develop attractive websites in addition to and/or in place of their physical stores in order to create strong consumer loyalty (Beck and Rygl, 2015; Fornari et al., 2016; Haridasan and Fernando, 2018; Davies et al., 2019). The result is multi-channel organizations of different types (Volle and Isaac, 2014), as shown in Figure 1, which multiply the touch points between the company and the consumer. More specifically with regard to the Internet channel, a significant effort is devoted to defining the offer, the ergonomics of the sites, or the ease of the ordering process. In a logic of fierce competition between websites, the implementation of an effective marketing strategy is perceived as a key element of differentiation from other companies, especially in order to build customer loyalty.
2
Figure 1. Typology of channel organization
Source: Adapted from Volle and Isaac (2014).
Bezes and Belvaux (2012) studied the factors that differentiate websites and consider the image concept of the store as a source of differentiation. The image is one of the main sources of positioning for retailing (Filser, 2004), and it represents a competitive advantage that is difficult to duplicate by competitors. With the considerable increase in the number of stakeholders present on the Internet, it is becoming necessary to find other ways of differentiation (Bezes and Belvaux, 2012). As such, the service offered can be a decisive advantage, linked to advice provided, clear and detailed information on products, transparent order follow-up, or the proposal of the various omnichannel customer paths (click & collect, click & reserve). The social dimension can also represent an axis of differentiation: the distinction is then based on the relationships maintained with and between e-consumers, unlike websites based on a strict rationalization of processes and product assortment.
At the same time, the question of logistics service quality obviously arises for companies. Indeed, the performance of the availability of products to customers directly determines the perceived quality level of a website, but also the recurrence of orders over time. Amazon is an extremely interesting case as the company relies on increasingly shorter delivery times, for example less than an hour in major cities, to build a sustainable competitive advantage. However, the history of supply chain management is marked by pooling phenomena that lead companies to share the same logistics resources to deliver their customers in urban areas. Under these conditions, how can we reconcile competition (on marketing aspects) and collaboration (on logistics aspects)?
PurposeOne of the major problems faced by digitized companies is that their customers are largely located in cities, and that urban spaces are subject to increased political interventionism (Sirjean et al., 2019). Thus, for the past ten years or so, strong constraints have been imposed in Europe by local authorities to avoid the uncontrolled multiplication of delivery systems and the resulting nuisances (noise, pollution, congestion). These constraints lead to the implementation of pooling policies (Morana et al., 2014; Grandval et al., 2019), by obliging companies that deliver products in cities to use shared logistics structures (same warehouses, same delivery vehicles). This means that tomorrow’s urban logistics will be increasingly common to companies, while their marketing strategy is differentiated to build a sustainable competitive advantage. Figure 2 illustrates pooling in concrete terms by taking the case of the district dispersion points (DDP) set up in Singapore.
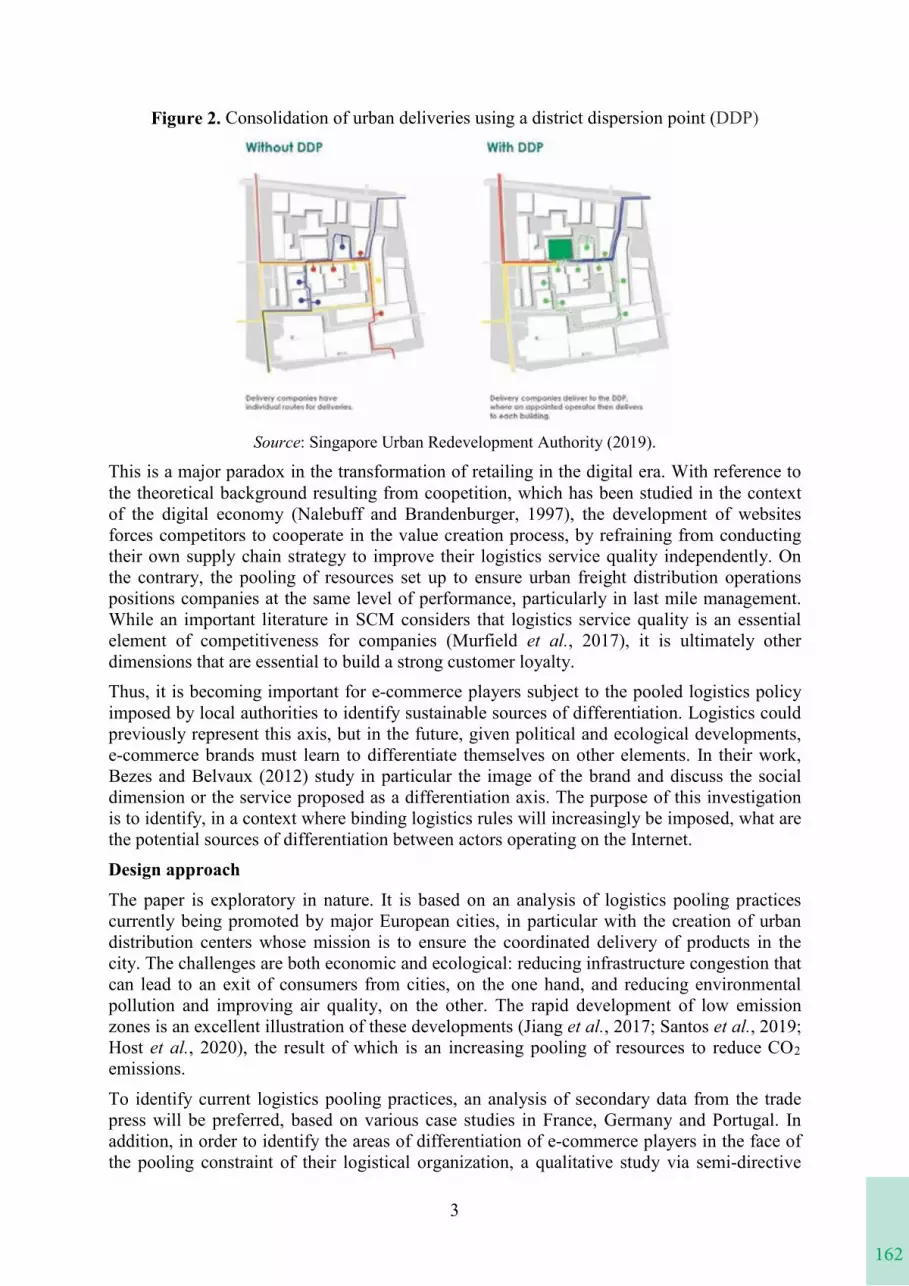
162
3
Figure 2. Consolidation of urban deliveries using a district dispersion point (DDP)
Source: Singapore Urban Redevelopment Authority (2019).
This is a major paradox in the transformation of retailing in the digital era. With reference to the theoretical background resulting from coopetition, which has been studied in the context of the digital economy (Nalebuff and Brandenburger, 1997), the development of websites forces competitors to cooperate in the value creation process, by refraining from conducting their own supply chain strategy to improve their logistics service quality independently. On the contrary, the pooling of resources set up to ensure urban freight distribution operations positions companies at the same level of performance, particularly in last mile management. While an important literature in SCM considers that logistics service quality is an essential element of competitiveness for companies (Murfield et al., 2017), it is ultimately other dimensions that are essential to build a strong customer loyalty.Thus, it is becoming important for e-commerce players subject to the pooled logistics policy imposed by local authorities to identify sustainable sources of differentiation. Logistics could previously represent this axis, but in the future, given political and ecological developments, e-commerce brands must learn to differentiate themselves on other elements. In their work, Bezes and Belvaux (2012) study in particular the image of the brand and discuss the social dimension or the service proposed as a differentiation axis. The purpose of this investigation is to identify, in a context where binding logistics rules will increasingly be imposed, what are the potential sources of differentiation between actors operating on the Internet.
Design approachThe paper is exploratory in nature. It is based on an analysis of logistics pooling practices currently being promoted by major European cities, in particular with the creation of urban distribution centers whose mission is to ensure the coordinated delivery of products in the city. The challenges are both economic and ecological: reducing infrastructure congestion that can lead to an exit of consumers from cities, on the one hand, and reducing environmental pollution and improving air quality, on the other. The rapid development of low emission zones is an excellent illustration of these developments (Jiang et al., 2017; Santos et al., 2019;Host et al., 2020), the result of which is an increasing pooling of resources to reduce CO2emissions.
To identify current logistics pooling practices, an analysis of secondary data from the trade press will be preferred, based on various case studies in France, Germany and Portugal. In addition, in order to identify the areas of differentiation of e-commerce players in the face of the pooling constraint of their logistical organization, a qualitative study via semi-directive
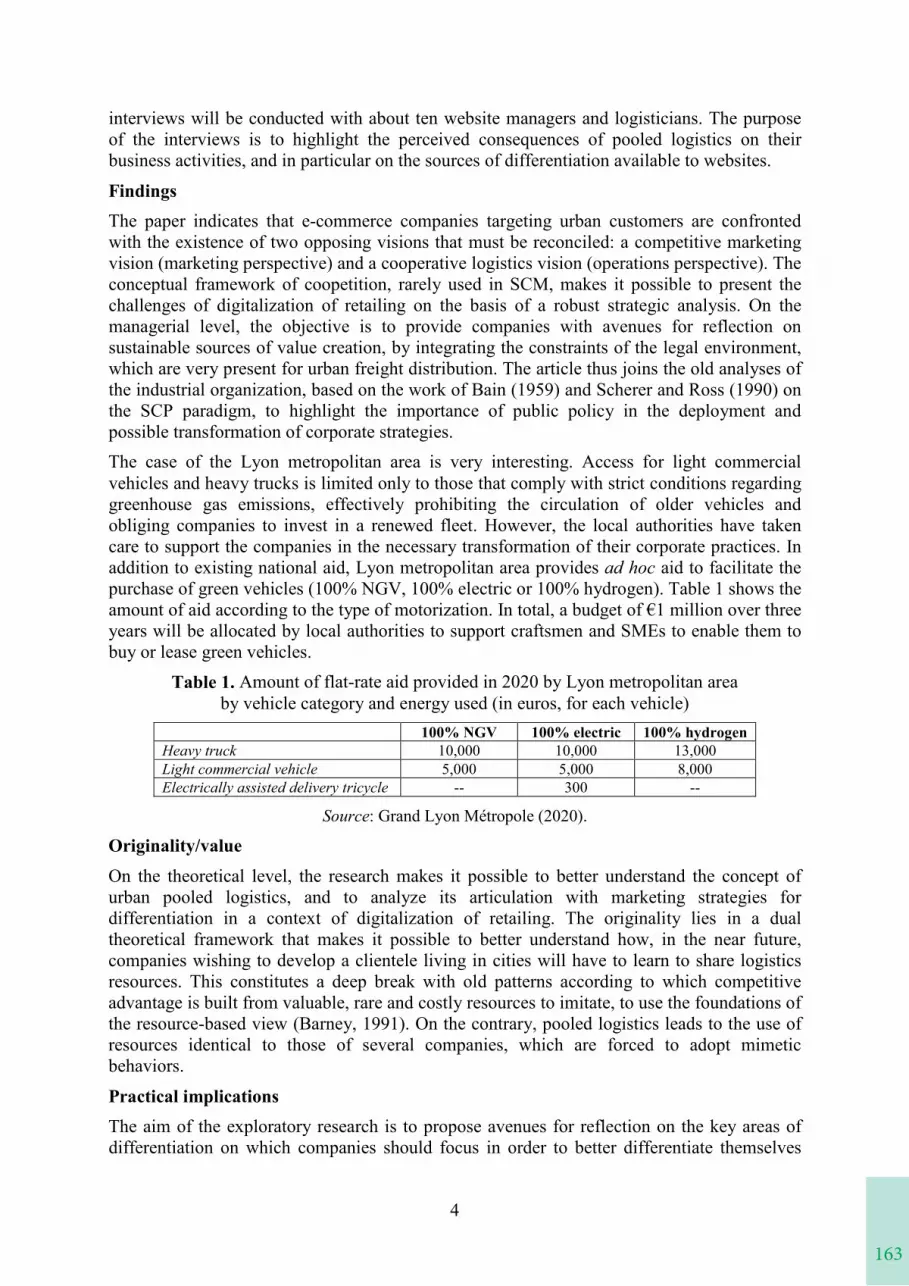
163
3
Figure 2. Consolidation of urban deliveries using a district dispersion point (DDP)
Source: Singapore Urban Redevelopment Authority (2019).
This is a major paradox in the transformation of retailing in the digital era. With reference to the theoretical background resulting from coopetition, which has been studied in the context of the digital economy (Nalebuff and Brandenburger, 1997), the development of websites forces competitors to cooperate in the value creation process, by refraining from conducting their own supply chain strategy to improve their logistics service quality independently. On the contrary, the pooling of resources set up to ensure urban freight distribution operations positions companies at the same level of performance, particularly in last mile management. While an important literature in SCM considers that logistics service quality is an essential element of competitiveness for companies (Murfield et al., 2017), it is ultimately other dimensions that are essential to build a strong customer loyalty.Thus, it is becoming important for e-commerce players subject to the pooled logistics policy imposed by local authorities to identify sustainable sources of differentiation. Logistics could previously represent this axis, but in the future, given political and ecological developments, e-commerce brands must learn to differentiate themselves on other elements. In their work, Bezes and Belvaux (2012) study in particular the image of the brand and discuss the social dimension or the service proposed as a differentiation axis. The purpose of this investigation is to identify, in a context where binding logistics rules will increasingly be imposed, what are the potential sources of differentiation between actors operating on the Internet.
Design approachThe paper is exploratory in nature. It is based on an analysis of logistics pooling practices currently being promoted by major European cities, in particular with the creation of urban distribution centers whose mission is to ensure the coordinated delivery of products in the city. The challenges are both economic and ecological: reducing infrastructure congestion that can lead to an exit of consumers from cities, on the one hand, and reducing environmental pollution and improving air quality, on the other. The rapid development of low emission zones is an excellent illustration of these developments (Jiang et al., 2017; Santos et al., 2019;Host et al., 2020), the result of which is an increasing pooling of resources to reduce CO2emissions.
To identify current logistics pooling practices, an analysis of secondary data from the trade press will be preferred, based on various case studies in France, Germany and Portugal. In addition, in order to identify the areas of differentiation of e-commerce players in the face of the pooling constraint of their logistical organization, a qualitative study via semi-directive
4
interviews will be conducted with about ten website managers and logisticians. The purpose of the interviews is to highlight the perceived consequences of pooled logistics on their business activities, and in particular on the sources of differentiation available to websites.
FindingsThe paper indicates that e-commerce companies targeting urban customers are confronted with the existence of two opposing visions that must be reconciled: a competitive marketing vision (marketing perspective) and a cooperative logistics vision (operations perspective). The conceptual framework of coopetition, rarely used in SCM, makes it possible to present the challenges of digitalization of retailing on the basis of a robust strategic analysis. On the managerial level, the objective is to provide companies with avenues for reflection on sustainable sources of value creation, by integrating the constraints of the legal environment, which are very present for urban freight distribution. The article thus joins the old analyses of the industrial organization, based on the work of Bain (1959) and Scherer and Ross (1990) on the SCP paradigm, to highlight the importance of public policy in the deployment and possible transformation of corporate strategies.The case of the Lyon metropolitan area is very interesting. Access for light commercial vehicles and heavy trucks is limited only to those that comply with strict conditions regarding greenhouse gas emissions, effectively prohibiting the circulation of older vehicles and obliging companies to invest in a renewed fleet. However, the local authorities have taken care to support the companies in the necessary transformation of their corporate practices. In addition to existing national aid, Lyon metropolitan area provides ad hoc aid to facilitate the purchase of green vehicles (100% NGV, 100% electric or 100% hydrogen). Table 1 shows the amount of aid according to the type of motorization. In total, a budget of €1 million over three years will be allocated by local authorities to support craftsmen and SMEs to enable them to buy or lease green vehicles.
Table 1. Amount of flat-rate aid provided in 2020 by Lyon metropolitan areaby vehicle category and energy used (in euros, for each vehicle)
100% NGV 100% electric 100% hydrogenHeavy truck 10,000 10,000 13,000Light commercial vehicle 5,000 5,000 8,000Electrically assisted delivery tricycle -- 300 --
Source: Grand Lyon Métropole (2020).
Originality/valueOn the theoretical level, the research makes it possible to better understand the concept of urban pooled logistics, and to analyze its articulation with marketing strategies for differentiation in a context of digitalization of retailing. The originality lies in a dual theoretical framework that makes it possible to better understand how, in the near future, companies wishing to develop a clientele living in cities will have to learn to share logistics resources. This constitutes a deep break with old patterns according to which competitive advantage is built from valuable, rare and costly resources to imitate, to use the foundations of the resource-based view (Barney, 1991). On the contrary, pooled logistics leads to the use of resources identical to those of several companies, which are forced to adopt mimetic behaviors.
Practical implicationsThe aim of the exploratory research is to propose avenues for reflection on the key areas of differentiation on which companies should focus in order to better differentiate themselves
164
5
from their competitors. With pooled logistics, elements of differentiation between e-commerce companies can be strengthened, but others can also emerge step by step. For decision-makers, identifying these factors should facilitate the implementation of targeted, effective and efficient marketing strategies and actions to better attract and retain customers. Indeed, while the battle has been raging for a decade between e-commerce companies to propose a reduction in the time it takes to make products available to consumers, using this argument in their institutional communication, such as the Amazon case mentioned above, it is undoubtedly on the side of the other variables of the marketing mix that we will now have to turn. The logistics lever must therefore be reevaluated downwards, both in its practices and in the investments required to build a sustainable competitive advantage in a digitalization context.
ReferencesBain, J. (1959), Industrial organization: a treatise, John Wiley & Sons, New York (NY).Barney, J. (1991), “Firm resources and sustained competitive advantage”, Journal of
Management, Vol. 17 No. 1, pp. 99-120.Beck, N. and Rygl, D. (2015), “Categorization of multiple channel retailing in multi-, cross-,
and omni‐channel retailing for retailers and retailing”, Journal of Retailing & Consumer Services, Vol. 27, pp. 170-178.
Bezes, C. and Belvaux, B. (2012), “Quels éléments de différenciation pour les sites marchands? Une approche par l’image transmise”, Management & Avenir, No.°58, pp. 33-54.
Davies, A., Dolega, L. and Arribas-Bel, D. (2019), “Buy online collect in-store: exploring grocery click & collect using a national case study”, International Journal of Retail &Distribution Management, Vol. 47 No. 3, pp. 278-291.
Filser, M. (2004), “La stratégie de la distribution: des interrogations managériales aux contributions académiques”, Revue Française du Marketing, No. 198, pp. 7-17.
Fornari, E., Fornari, D., Grandi, S., Menegatti, M. and Hofacker, C. (2016), “Adding store to web: migration and synergy effects in multi-channel retailing”, International Journal of Retail & Distribution Management, Vol. 44 No. 6, pp. 658-674.
Grandval, S., Nimtrakool, K. and Grant, D. (2019), “Factors of adoption governing the emergence of urban consolidation centres”, Supply Chain Forum: An International Journal, Vol. 20 No. 4, pp. 247-265.
Haridasan, A. and Fernando, A. (2018), “Online or in-store: unravelling consumer’s channel choice motives”, Journal of Research in Interactive Marketing, Vol. 12 No. 2, pp. 215-230.
Host, S., Honoré, C., Joly, F., Saunal, A., Le Tertre, A. and Medina, S. (2020), “Implementation of various hypothetical low emission zone scenarios in Greater Paris: assessment of fine-scale reduction in exposure and expected health benefits”, Environmental Research, Vol. 185, Article 109405.
Jiang, W., Boltze, M., Groer, S. and Scheuvens, D. (2017), “Impacts of low emission zones in Germany on air pollution levels”, Transportation Research Procedia, Vol. 25, pp. 3370-3382.
Morana, J., Gonzalez-Feliu, J. and Semet, F. (2014), “Urban consolidation and logistics pooling”, in Gonzalez-Feliu, J., Semet, F. and Routhier, J.-L. (Eds.), Sustainable urban logistics: concepts, methods and information systems, Springer, Heidelberg, pp. 187-210.
Murfield, M., Boone, C., Rutner, P. and Thomas, R. (2017), “Investigating logistics service quality in omni-channel retailing”, International Journal of Physical Distribution &Logistics Management, Vol. 47 No. 4, pp. 263-296.

165
5
from their competitors. With pooled logistics, elements of differentiation between e-commerce companies can be strengthened, but others can also emerge step by step. For decision-makers, identifying these factors should facilitate the implementation of targeted, effective and efficient marketing strategies and actions to better attract and retain customers. Indeed, while the battle has been raging for a decade between e-commerce companies to propose a reduction in the time it takes to make products available to consumers, using this argument in their institutional communication, such as the Amazon case mentioned above, it is undoubtedly on the side of the other variables of the marketing mix that we will now have to turn. The logistics lever must therefore be reevaluated downwards, both in its practices and in the investments required to build a sustainable competitive advantage in a digitalization context.
ReferencesBain, J. (1959), Industrial organization: a treatise, John Wiley & Sons, New York (NY).Barney, J. (1991), “Firm resources and sustained competitive advantage”, Journal of
Management, Vol. 17 No. 1, pp. 99-120.Beck, N. and Rygl, D. (2015), “Categorization of multiple channel retailing in multi-, cross-,
and omni‐channel retailing for retailers and retailing”, Journal of Retailing & Consumer Services, Vol. 27, pp. 170-178.
Bezes, C. and Belvaux, B. (2012), “Quels éléments de différenciation pour les sites marchands? Une approche par l’image transmise”, Management & Avenir, No.°58, pp. 33-54.
Davies, A., Dolega, L. and Arribas-Bel, D. (2019), “Buy online collect in-store: exploring grocery click & collect using a national case study”, International Journal of Retail &Distribution Management, Vol. 47 No. 3, pp. 278-291.
Filser, M. (2004), “La stratégie de la distribution: des interrogations managériales aux contributions académiques”, Revue Française du Marketing, No. 198, pp. 7-17.
Fornari, E., Fornari, D., Grandi, S., Menegatti, M. and Hofacker, C. (2016), “Adding store to web: migration and synergy effects in multi-channel retailing”, International Journal of Retail & Distribution Management, Vol. 44 No. 6, pp. 658-674.
Grandval, S., Nimtrakool, K. and Grant, D. (2019), “Factors of adoption governing the emergence of urban consolidation centres”, Supply Chain Forum: An International Journal, Vol. 20 No. 4, pp. 247-265.
Haridasan, A. and Fernando, A. (2018), “Online or in-store: unravelling consumer’s channel choice motives”, Journal of Research in Interactive Marketing, Vol. 12 No. 2, pp. 215-230.
Host, S., Honoré, C., Joly, F., Saunal, A., Le Tertre, A. and Medina, S. (2020), “Implementation of various hypothetical low emission zone scenarios in Greater Paris: assessment of fine-scale reduction in exposure and expected health benefits”, Environmental Research, Vol. 185, Article 109405.
Jiang, W., Boltze, M., Groer, S. and Scheuvens, D. (2017), “Impacts of low emission zones in Germany on air pollution levels”, Transportation Research Procedia, Vol. 25, pp. 3370-3382.
Morana, J., Gonzalez-Feliu, J. and Semet, F. (2014), “Urban consolidation and logistics pooling”, in Gonzalez-Feliu, J., Semet, F. and Routhier, J.-L. (Eds.), Sustainable urban logistics: concepts, methods and information systems, Springer, Heidelberg, pp. 187-210.
Murfield, M., Boone, C., Rutner, P. and Thomas, R. (2017), “Investigating logistics service quality in omni-channel retailing”, International Journal of Physical Distribution &Logistics Management, Vol. 47 No. 4, pp. 263-296.
6
Nalebuff, B. and Brandenburger, A. (1997), “Co-opetition: competitive and cooperative business strategies for the digital economy”, Strategy & Leadership, Vol. 25 No. 6, pp. 28-33.
Santos, F., Gómez-Losada, A. and Pires, J. (2019), “Impact of the implementation of Lisbon low emission zone on air quality”, Journal of Hazardous Materials, Vol. 365, pp. 632-641.
Scherer, F. and Ross, D. (1990), Industrial market structure and economic performance,Houghton Mifflin, Boston (MA), 3rd ed.
Sirjean, S., Morel, C. and Paché, G. (2019), “Challenges of urban deliveries in the wholesale trade: a comprehensive analysis of policy-makers’ sustainable strategies”, Journal of Supply Chain Management: Research & Practice, Vol. 13 No. 1, pp. 1-13.
Volle, P. and Isaac, J. (2014), E-commerce: de la stratégie à la mise en œuvre opérationnelle,Pearson Education, Paris, 3rd ed.
166
1
OPERATIONS PLANNING FOR PUBLIC HOLIDAYS IN GROCERY RETAILING
Elisabeth Obermair, Andreas HolzapfelDepartment of Logistics Management
Hochschule Geisenheim University, Geisenheim, Germany
[email protected], [email protected]
Heinrich KuhnDepartment of Supply Chain Management and Operations
Catholic University Eichstätt-Ingolstadt, Germany
IntroductionIn retailing, demand fluctuates during the week, the year and especially around holidays (Ehrenthal 2014). Public holiday seasons are associated with an increase in revenue and play a major role for the annual performance. During these seasons, retailers offer a multitude of promotional articles to further increase sales (Urbatsch 2013, Ahluwalia et al. 2013, Qiu and Wenqing 2016). However, for example in German retailing, employees are not permitted to work on public holidays. Consequently, there is less time available for all logistics processes (e.g., picking at the distribution centers or deliveries to customers), but the same or even higher volumes have to be handled compared to standard weeks. In some countries, regional differences in public holiday regulations further complicate logistics processes and planning. Additionally, public holiday constellations change every year, thus special plans are required resulting in considerable additional effort.
This public holiday problem influences all subsystems of retail logistics. Especially, the operational planning areas disposition, warehouse management and transport are affected. The literature is rich in considering these operational planning areas in general (e.g., Stadler et al. 2012, Ross 2015). Demand forecasting models are developed (e.g., Gur Ali and Pinar2016, Ramanathan and Muyldermans 2010), logistics operations are discussed for warehouse management (e.g., Gu et al. 2007, Kuhn and Sternbeck 2013, van Gils et al. 2018) and transportation (e.g., Günther and Seiler 2009, Holzapfel et al. 2016, Kuhn and Sternbeck2013, Martins et al. 2007). Moreover, public holiday weeks (e.g., Christmas holidays) and shopping events such as Thanksgiving or Back-to-School are mostly analyzed from a marketing perspective (e.g., Qiu and Wenqing 2016, Warner and Barsky 1995).
Research has studied the planning areas also for pure online, multi- or omni-channel retailing. For example, warehouse management of retailers operating an online channel is discussed byHübner et al. (2015). The transport of online retailing varies from the bricks-and-mortar retailing especially in terms of the last mile process. Last mile designs are captured in research regarding delivery modes, time windows, etc. (e.g., Agatz et al. 2008, Agatz et al. 2011, Hübner et al. 2016 or Duin et al. 2016). Additional transport models for omni-channel retailers, as for example shared vehicle routing problems (e.g., Paul et al. 2019), are developed. Additionally, the marketing perspective on holiday business in online retailing is
167
1
OPERATIONS PLANNING FOR PUBLIC HOLIDAYS IN GROCERY RETAILING
Elisabeth Obermair, Andreas HolzapfelDepartment of Logistics Management
Hochschule Geisenheim University, Geisenheim, Germany
[email protected], [email protected]
Heinrich KuhnDepartment of Supply Chain Management and Operations
Catholic University Eichstätt-Ingolstadt, Germany
IntroductionIn retailing, demand fluctuates during the week, the year and especially around holidays (Ehrenthal 2014). Public holiday seasons are associated with an increase in revenue and play a major role for the annual performance. During these seasons, retailers offer a multitude of promotional articles to further increase sales (Urbatsch 2013, Ahluwalia et al. 2013, Qiu and Wenqing 2016). However, for example in German retailing, employees are not permitted to work on public holidays. Consequently, there is less time available for all logistics processes (e.g., picking at the distribution centers or deliveries to customers), but the same or even higher volumes have to be handled compared to standard weeks. In some countries, regional differences in public holiday regulations further complicate logistics processes and planning. Additionally, public holiday constellations change every year, thus special plans are required resulting in considerable additional effort.
This public holiday problem influences all subsystems of retail logistics. Especially, the operational planning areas disposition, warehouse management and transport are affected. The literature is rich in considering these operational planning areas in general (e.g., Stadler et al. 2012, Ross 2015). Demand forecasting models are developed (e.g., Gur Ali and Pinar2016, Ramanathan and Muyldermans 2010), logistics operations are discussed for warehouse management (e.g., Gu et al. 2007, Kuhn and Sternbeck 2013, van Gils et al. 2018) and transportation (e.g., Günther and Seiler 2009, Holzapfel et al. 2016, Kuhn and Sternbeck2013, Martins et al. 2007). Moreover, public holiday weeks (e.g., Christmas holidays) and shopping events such as Thanksgiving or Back-to-School are mostly analyzed from a marketing perspective (e.g., Qiu and Wenqing 2016, Warner and Barsky 1995).
Research has studied the planning areas also for pure online, multi- or omni-channel retailing. For example, warehouse management of retailers operating an online channel is discussed byHübner et al. (2015). The transport of online retailing varies from the bricks-and-mortar retailing especially in terms of the last mile process. Last mile designs are captured in research regarding delivery modes, time windows, etc. (e.g., Agatz et al. 2008, Agatz et al. 2011, Hübner et al. 2016 or Duin et al. 2016). Additional transport models for omni-channel retailers, as for example shared vehicle routing problems (e.g., Paul et al. 2019), are developed. Additionally, the marketing perspective on holiday business in online retailing is
2
analyzed. For instance, Oh and Kwon (2009) study customer sensitivity to price promotions in multi-channel retailing. Ettouzami and Yates (2012) outline a research gap with regard to seasonality and promotional articles.
In conclusion, research has so far not combined the analysis of public holiday seasons with operational logistics planning from a practical view.
PurposeLogistics in grocery retailing can be structured into four planning areas: procurement, warehousing, distribution and sales. Within these areas different planning tasks can be determined according to their time horizon. The public holiday problem studied is especially challenging for short-term planning areas as uncertainties and volume fluctuations affect operational planning such as personnel scheduling or the capacity plans. Therefore, the focus in this research is on disposition, warehousing and transport planning. Disposition is in charge of forecasting and builds the basis for all further planning areas. It determines the order quantities and thus the volumes to be handled in the distribution centers. Orders can be aligned to shifts enabling personnel scheduling. Thereby, delivery times and requirements must be balanced with warehouse capacities in terms of space, utilities and human resources. Finally, transportation planning considers the transport between distribution centers and stores or the last mile to the customer (Hübner et al. 2013 and 2016). The objective of this research is to identify and systematize the fields of action and the solution approaches in these operations planning areas of grocery retailers during holiday seasons.
Conceptual frameworkThe public holiday problem described has so far received little attention in research, especially from a logistics perspective. An exploratory qualitative research study is appropriate for uncovering such unstudied research areas as data from practice enrich the findings (Stebbins 2001, Flynn et al. 1990). The goal of the study presented is therefore to explore logistics processes, problems and actions of grocery retailers due to public holidays. Developing a theory out of the empirical data, we followed a grounded theory approach(Glaser and Strauss 1967, Manuj and Pohlen 2012).
Design/ methodology/ approachData are collected by conducting semi-structured, face-to-face interviews following a multi-step research design. This method provides information and systematizes fields of action without formulating restrictive hypotheses in advance. Moreover, it is an effective way forobtaining in-depth information. Therefore, we design an interview guideline, but the order of the questions raised during the interviews is flexible (Lindlof and Taylor 2019, Creswell 2014, Manuj and Pohlen 2012).
Grocery retailing is characterized by country-specific patterns and shopping behavior. Creating a unified context, the focus of the study is on the German grocery market. This enables comparisons between the companies and an evaluation of the representativeness of the data recorded. The 30 top-selling grocery retailers in Germany are the target group of the study. In total, 18 of these take part in the study. Interviews are conducted with 25 top managers, who have a holistic view on logistics and operations processes in their company. They represent 23 sales lines, from which three are online shops.
The data analysis follows the grounded theory approach (Corbin and Strauss 1990). The theory should be built by developing categories and using a constant comparative approach (Lindlof and Taylor 2019, Flick 2015, Glaser and Strauss 1967). For this, an inductive
168
3
analysis is applied by formulating abstract groups and assigning data to it (Creswell 2014, Gephart 2004). By coding data, we build substantive categories (Maxwell 2008). Two researchers independently work on the coding to reach internal reliability (Bryman 2015).The coding is processed using MAXQDA.
FindingsThe problems of grocery retailers during public holiday seasons can be classified into the two categories 'uncertainties' and 'missing resources' affecting the operational planning areas. The demand fluctuates due to uncontrollable uncertainties such as the weather, short-term orders or promotional articles. Generally, demand uncertainties are higher in the online channel dueto short order times and less historical data. The volatility of the demand complicates the planning in all areas. Furthermore, the skill shortage is appreciable in public holiday seasons, when additional volumes have to be handled. Missing pickers or drivers result in delivery delays.
The following solution approaches face the two problem categories outlined: a higher degree of automation, personnel resources, temporal time shifts of logistics tasks and cooperation.Automation facilitates the demand forecasting and increases forecast accuracy. Furthermore, it gains in importance for warehouse operations due to the skill shortage. Nevertheless, nowadays personnel resources are essential in peak times as adjustments of the personnel input are the reaction of fluctuations. For instance, the warehouse staff works over- or under-time for a certain period. Further solution instruments can be summarized as temporal time shifts of logistics tasks: adjustments of delivery days, pre-picking, pre-delivery and thus stockpiling. The aim is to balance the volume over a longer period. For instance for online deliveries, the orders are prepared at the evening and only the fresh products are added in the morning of the delivery day. Finally, the cooperation with supply chain partners builds the last solution approach category. For example, a close supplier relationship reduces delivery failures and enables just-in-time deliveries to minimize the storage time.
Practical implicationsThe study provides a market overview of logistics planning for public holiday seasons in German grocery retailing. It enables retailers to compare their challenges and solutions with those of competitors. Moreover, the analysis of suitable solution approaches shows grocery retailers possible ways of action for logistics operations. The practical relevance of the topic is highlighted by the high participation rate of our study. 60% of top-30 German grocery retailers covering around 80% of the total market volume provide insights into the holiday business.
Research limitations and outlookOur study focuses on operational planning areas. In a next step, the influence of mid-term decisions could be considered in order to analyze the assortment ranges or the impact ofadvertisement actions on balancing the volume peaks. Moreover, further research could include the perspective of upstream supply chain partners such as suppliers and producers.Especially, the possibilities of transport collaboration or stockpiling could be analyzed.Additionally, future research could focus on how automation techniques can support transport and warehouse processes to compensate the general skills shortage. Furthermore, the study refers to the German grocery market. Further research could analyze whether the findinggenerated can be generalized for other grocery markets.
169
3
analysis is applied by formulating abstract groups and assigning data to it (Creswell 2014, Gephart 2004). By coding data, we build substantive categories (Maxwell 2008). Two researchers independently work on the coding to reach internal reliability (Bryman 2015).The coding is processed using MAXQDA.
FindingsThe problems of grocery retailers during public holiday seasons can be classified into the two categories 'uncertainties' and 'missing resources' affecting the operational planning areas. The demand fluctuates due to uncontrollable uncertainties such as the weather, short-term orders or promotional articles. Generally, demand uncertainties are higher in the online channel dueto short order times and less historical data. The volatility of the demand complicates the planning in all areas. Furthermore, the skill shortage is appreciable in public holiday seasons, when additional volumes have to be handled. Missing pickers or drivers result in delivery delays.
The following solution approaches face the two problem categories outlined: a higher degree of automation, personnel resources, temporal time shifts of logistics tasks and cooperation.Automation facilitates the demand forecasting and increases forecast accuracy. Furthermore, it gains in importance for warehouse operations due to the skill shortage. Nevertheless, nowadays personnel resources are essential in peak times as adjustments of the personnel input are the reaction of fluctuations. For instance, the warehouse staff works over- or under-time for a certain period. Further solution instruments can be summarized as temporal time shifts of logistics tasks: adjustments of delivery days, pre-picking, pre-delivery and thus stockpiling. The aim is to balance the volume over a longer period. For instance for online deliveries, the orders are prepared at the evening and only the fresh products are added in the morning of the delivery day. Finally, the cooperation with supply chain partners builds the last solution approach category. For example, a close supplier relationship reduces delivery failures and enables just-in-time deliveries to minimize the storage time.
Practical implicationsThe study provides a market overview of logistics planning for public holiday seasons in German grocery retailing. It enables retailers to compare their challenges and solutions with those of competitors. Moreover, the analysis of suitable solution approaches shows grocery retailers possible ways of action for logistics operations. The practical relevance of the topic is highlighted by the high participation rate of our study. 60% of top-30 German grocery retailers covering around 80% of the total market volume provide insights into the holiday business.
Research limitations and outlookOur study focuses on operational planning areas. In a next step, the influence of mid-term decisions could be considered in order to analyze the assortment ranges or the impact ofadvertisement actions on balancing the volume peaks. Moreover, further research could include the perspective of upstream supply chain partners such as suppliers and producers.Especially, the possibilities of transport collaboration or stockpiling could be analyzed.Additionally, future research could focus on how automation techniques can support transport and warehouse processes to compensate the general skills shortage. Furthermore, the study refers to the German grocery market. Further research could analyze whether the findinggenerated can be generalized for other grocery markets.
4
ReferencesAgatz, N., Campbell, A., Fleischmann, M. and Savelsbergh, M. (2011), “Time slot management in attended home delivery”, Transportation Science, Vol. 45 No. 3, pp. 435-449.
Agatz, N., Fleischmann, M. and van Nunen, J. (2008), “E-fulfillment and multi-channel distribution”, European Journal of Operational Research, Vol. 187 No. 2, pp. 339-356.
Ahluwalia, P., Hughes, J. and Midha, V. (2013), “Drivers of e-retailer peak sales period price behavior: an empirical analysis”, International Journal of Accounting and Information Management, Vol. 21 No. 1, pp. 72-90.
Bryman, A. and Bell, E. (2015), “Business research methods”, 4th ed., Oxford university press, Oxford.
Corbin, J. and Strauss, A. (1990), “Grounded theory research: Procedures, canons, and evaluative criteria”, Qualitative Sociology, Vol. 13 No.1, pp. 3-21.
Creswell, J. W. (2014), “Research Design”, 4th ed., SAGE, Thousand Oaks.
Duin, J., Goffau, W., Wiegmans, B., Tavasszy, L. and Saes, M. (2016), “Improving home delivery efficiency by using principles of address intelligence for B2C deliveries”, Transportation Research Procedia, Vol. 14, pp. 14-25.
Ehrenthal, J. C. F., Honhon, D. and van Woensel, T. (2014), “Demand seasonality in retail inventory management“, European Journal of Operations Management, Vol. 238, pp. 527-539.
Ettouzami, Y. and Yates, N. (2012), “Examining retail on shelf availability: promotional impact and a call for research”, International Journal of Physical Distribution & Logistics Management, Vol. 42 No. 3, pp. 213-243.
Flick, U. (2015), “Introducing research methodology”, 2nd ed., SAGE, London.
Flynn, B., Sakakibara, S., Schroeder, R., Kimberly, A. and Flynn, J. (1990), “Empirical research methods in operations management”, Journal of Operations Management, Vol. 9No. 2, pp. 250-284.
Gephart, R. P. (2004), “Qualitative Research and the Academy of Management Journal”, Academy of Management Journal, Vol. 47 No. 4, pp. 454-462.
Glaser, B.G. and Strauss, A. (1967), “The Discovery of Grounded Theory: Strategies for Qualitative Research”, Aldine de Gruyter, New York.
Gu, J., Goetschalckx, M. and McGinnis, L. F. (2007), “Research on warehouse operations: A comprehensive review”, European Journal of Operation Research, Vol. 177, pp. 1-27.
Gur Ali, O. and Pinar, E. (2016), “Multi-period-ahead forecasting with residual extrapolation and information sharing − utilizing a multitude of retail series”, International Journal of Forecasting, Vol. 32, pp. 502-517.
Günther, H. and Seiler, T. (2009), “Operative transportation planning in consumer goods supply chains“, Flexible Service and Manufacturing Journal, Vol. 21, pp. 51-74.
Holzapfel, A., Hübner, A., Kuhn, A. and Sternbeck, M. (2016), “Delivery pattern and transportation planning in grocery retailing“, European Journal of Operation Research, Vol. 252, pp. 54-68.
170
5
Hübner, A., Kuhn, H. and Sternbeck, M. (2013), “Demand and supply chain planning in grocery retail: an operations planning framework”, International Journal of Retail & Distribution Management, Vol. 41 No.7, pp. 512-530.
Hübner, A., Holzapfel, A. and Kuhn, H. (2015), “Operations management in multi-channel retailing: an exploratory study”, Operations Management Research, Vol. 8 No. 3/4, pp. 84-100.
Hübner, A., Kuhn, H. and Wollenburg, J. (2016), “Last mile fulfillment and distribution in omni-channel grocery retailing: A strategic planning framework“, International Journal of Retail & Distribution Management, Vol. 44 No. 3, pp. 228-247.
Kuhn, H. and Sternbeck, M. (2013), “Integrative retail logistics: An exploratory study”, Operations Management, Vol. 6 No. 1, pp. 2-18.
Oh, H. and Kwon, K.-N. (2009), “An exploratory study of sales promotions for multichannel holiday shopping”, International Journal of Retail & Distribution Management, Vol. 37 No. 10, pp. 867-887.
Qiu, C. and Wenqing, Z. (2016), “Managing long queues for holiday sales shopping”, Journal of Revenue and Pricing Management, Vol. 15 No. 1, pp. 52-65.
Lindlof, T. R. and Taylor, B. C. (2019), “Qualitative communication research methods”, 4th
ed., SAGE, Los Angeles.
Manuj, I. and Pohlen, T. L. (2012), “A reviewer’s guide to the grounded theory methodology in logistics and supply chain management research”, International Journal of Physical Distribution & Logistics Management, Vol. 42 No. 8/9, pp. 784-803
Martin, S., Amorim, P. and Almada-lobo, B. (2018), “Delivery mode planning for distribution to bricks-and-mortar retail stores: discussion and literature review”, Flexible Services and Manufacturing Journal, Vol. 30, pp. 785-812.
Maxwell, J. A. (2008), “Designing a qualitative study”, in: Bickman, L. and Rog, D.J. (Eds.), The SAGE handbook of applied social research methods, 2nd ed., SAGE, Los Angeles, pp. 214-253.
Paul, J., Agatz, N., Spliet, R. and de Koster, R. B. M. (2019), “Shared capacity routing problem − an omni-channel retail study”, European Journal of Operational Research, Vol. 273 No. 2, pp. 731-739.
Ramanathan, U. and Muyldermans, L. (2010), “Identifying demand factors for promotional planning and forecasting: A case of a soft drink company in the UK”, International Journal of Production Economics, Vol. 128 No. 2, pp. 538-545.
Ross, D. F. (2015), “Distribution Planning and Control”, 3rd ed., Springer, New York.
Stadler, H., Fleischmann, B., Grunow, M., Meyr, H. and Sürie, C. (2012), “Advanced Planning in Supply Chain”, Springer, Berlin, Heidelberg.
Stebbins, R. A. (2001), “Exploratory research in the social sciences”, SAGE, Thousand Oaks.
Urbatsch, R. (2013), “Employment effects of Thanksgiving timing”, Economic Letters, Vol. 119, pp. 42-44.

171
5
Hübner, A., Kuhn, H. and Sternbeck, M. (2013), “Demand and supply chain planning in grocery retail: an operations planning framework”, International Journal of Retail & Distribution Management, Vol. 41 No.7, pp. 512-530.
Hübner, A., Holzapfel, A. and Kuhn, H. (2015), “Operations management in multi-channel retailing: an exploratory study”, Operations Management Research, Vol. 8 No. 3/4, pp. 84-100.
Hübner, A., Kuhn, H. and Wollenburg, J. (2016), “Last mile fulfillment and distribution in omni-channel grocery retailing: A strategic planning framework“, International Journal of Retail & Distribution Management, Vol. 44 No. 3, pp. 228-247.
Kuhn, H. and Sternbeck, M. (2013), “Integrative retail logistics: An exploratory study”, Operations Management, Vol. 6 No. 1, pp. 2-18.
Oh, H. and Kwon, K.-N. (2009), “An exploratory study of sales promotions for multichannel holiday shopping”, International Journal of Retail & Distribution Management, Vol. 37 No. 10, pp. 867-887.
Qiu, C. and Wenqing, Z. (2016), “Managing long queues for holiday sales shopping”, Journal of Revenue and Pricing Management, Vol. 15 No. 1, pp. 52-65.
Lindlof, T. R. and Taylor, B. C. (2019), “Qualitative communication research methods”, 4th
ed., SAGE, Los Angeles.
Manuj, I. and Pohlen, T. L. (2012), “A reviewer’s guide to the grounded theory methodology in logistics and supply chain management research”, International Journal of Physical Distribution & Logistics Management, Vol. 42 No. 8/9, pp. 784-803
Martin, S., Amorim, P. and Almada-lobo, B. (2018), “Delivery mode planning for distribution to bricks-and-mortar retail stores: discussion and literature review”, Flexible Services and Manufacturing Journal, Vol. 30, pp. 785-812.
Maxwell, J. A. (2008), “Designing a qualitative study”, in: Bickman, L. and Rog, D.J. (Eds.), The SAGE handbook of applied social research methods, 2nd ed., SAGE, Los Angeles, pp. 214-253.
Paul, J., Agatz, N., Spliet, R. and de Koster, R. B. M. (2019), “Shared capacity routing problem − an omni-channel retail study”, European Journal of Operational Research, Vol. 273 No. 2, pp. 731-739.
Ramanathan, U. and Muyldermans, L. (2010), “Identifying demand factors for promotional planning and forecasting: A case of a soft drink company in the UK”, International Journal of Production Economics, Vol. 128 No. 2, pp. 538-545.
Ross, D. F. (2015), “Distribution Planning and Control”, 3rd ed., Springer, New York.
Stadler, H., Fleischmann, B., Grunow, M., Meyr, H. and Sürie, C. (2012), “Advanced Planning in Supply Chain”, Springer, Berlin, Heidelberg.
Stebbins, R. A. (2001), “Exploratory research in the social sciences”, SAGE, Thousand Oaks.
Urbatsch, R. (2013), “Employment effects of Thanksgiving timing”, Economic Letters, Vol. 119, pp. 42-44.
6
Van Gils, T, Ramaekers, K., Caris, A. and de Koster, R. B. M. (2018), “Designing efficient order picking systems by combining planning problems: State-of-the-art classification and review”, European Journal of Operation Research, Vol. 267 No.1, pp. 1-15.
Warner, E. J. and Barsky, R. B. (1995), “The timing and Magnitude of Retail Store Markdowns Evidence from Weekends and Holidays”, The Quarterly Journal of Economics,Vol. 110 No. 2, pp. 321-352.
KeywordsGrocery retailing, public holidays, operations, logistics planning, holiday seasons
172
RELATIONSHIP QUALITY, VALUE CO-CREATION AND ECONOMIC SATISFACTION IN B2B VALUE CHAIN
IntroductionService Dominant Logic (SDL) has been a catalyst for several research guidelines and a growing customer-driven operational approach (Wilden et al., 2017; Vargo and Lusch, 2017). However, when studying Value co-Creation (VcC) and Relationship Quality (RQ),interactions in retailing and manufacturing firms in business-to-business (B2B) have attracted less attention compared to service contexts (Hein et al., 2019; Marcos-Cuevas et al., 2016). Moreover, few papers cope with models offering triadic approaches; this is, taking into account relationships upstream the value chain, from the retailer backwards to the industrial manufacturer and then also to other industrial suppliers, as most studies focus just on dyadic relationships (e.g. Kohtamäki and Rajala, 2016; O’Cass and Ngo, 2012).
This research studies the role of VcC in the Relationship Quality-Economic Satisfaction chain. We conduct our study in the Spanish furniture industry. The study contributes to research in the RQ-VcC-ES chain. First, following the research agenda of Zolkiewski et al.(2017), we consider an affective social dimension as part of RQ. We model RQ as a second-order construct (Vesel and Zabkar , 2010) consisting of three first-order dimensions: Trust, Commitment, and Social Satisfaction (SS). Second, the literature encompasses conflicting approaches about RQ and VcC. Traditional studies consider Value Creation as a consequence of relational variables (e.g. Hessling et al., 2018), while other authors consider VcC as antecedent (e.g. Franklin and Marshall, 2019; Thiruvattal, 2017). Hence, we have tested theeffect of VcC as antecedent of RQ (Model 1) and an alternative model where VcC is amediating variable (Model 2). Third, the literature rarely considers a holistic vision of the supply chain. Therefore, we conduct a triadic approach, so the mediation model is validated upstream the supply chain in two pairs of dyads, where a same actor has different roles (Zolkiewski et al., 2017). For these purposes, the paper reports a study conducted with a sample of 77 Spanish furniture firms and measures RQ, VcC and ES in the retailer-manufacturer-supplier triad.
Purpose*Li et al. (2020) define RQ as the quality of business interaction between providers and customers, which includes dyadic relationships (Prayag et al., 2019). Traditionally, RQ reviews highlight difficulties for agreement on the dimensions of RQ (Athanasopoulou, 2009; Palmatier et al., 2006; Vieira et al., 2008). According to this, two competing streams of research address the dimensionality of RQ. A prevailing group of authors define RQ in termsof basic dimensions, namely Trust, Commitment and Satisfaction, while a second approach extends this dimensionality to other variables (e.g. Casidy and Nyadzayo, 2017; Jiang et al.,2016; Matikainen et al., 2015).
The literature offers varied perspectives on which relational constructs have an effect on traditional outcomes such as Customer Loyalty (Morgan and Hunt, 1994; Palmatier et al.,2006; Hennig-Thurau, 2000; Kyoum Kim et al., 2011). More recently, authors have studied RQ and its outcomes in the services B2C context (Hirshberg and Shoham, 2017; Prayag et al., 2019; Jiang et al., 2016; Sarmento et al., 2015; Bandara et al., 2017). Prayag et al. (2019) review the literature ambiguity about antecedents and outcomes of RQ, for instance in the
case of Satisfaction. Song et al. (2012) excluded Satisfaction from the dimensionality of RQand variables such as Cooperation and Coordination may influence the effect of Trust on Satisfaction (Barnes et al., 2011), especially with the separation of Social and Economic Satisfaction (Ferro et al., 2016; Ha et al., 2016; Rodríguez del Bosque et al., 2006).
The role of VcC in relation to RQ is not clear in the literature. Trust and Commitment areconsidered precursors of Customer Value in B2B relationships (Möller, 2006). Hessling et al.(2018) demonstrate that Affective Commitment, Trust and Shared Values are needed for value-based Commitment and Value Creation. Merz et al. (2018) provide evidence that Brand Trustworthiness and Brand Commitment are part of a higher-order customer VcC. Otherwise, there are some studies that consider VcC as an antecedent of Satisfaction and/or Loyalty (e.g. Woratschek et al., 2019; Thiruvattal, 2017; Cossío-Silva et al., 2016; Navarro et al., 2016; Vega-Vazquez et al., 2013). Regarding Trust, Franklin and Marshall (2019) empirically confirm that co-creation and integrity affect Trust, while Affective Trust is especially important in service industries. Coherently, Pereira et al. (2015) posit anantecedent role of Value on Commitment in B2B relationship. Other authors study the role of Value as antecedent of relationship variables (e.g. Sharma and Klein, 2020; Izogo et al.,2020).
The purpose of this paper is to face gaps in VcC and RQ literature by reviewing the RQ concept when Satisfaction is addressed as Social and Economic separately, and estimatingcompeting models when we introduce VcC in the B2B context, under a triadic perspective ofthe supply chain management.
Conceptual framework and hypotheses As aforementioned, the paper compares two conceptual models of the RQ-ES chain, where VcC may act either as antecedent of RQ (Figure 1) or as a mediator between RQ and ES(Figure 2).
Figure 1. Alternative Model 1. VcC as antecedent in the RQ-ES chain.
Value co-Creation
Relationship Quality
Economic Satisfaction
H1.1 H1.2
Relationship Quality
Value co-Creation
Economic Satisfaction
H2.1 H2.2
H2.3
(Independent variable) (Mediating variable) (Dependent variable)
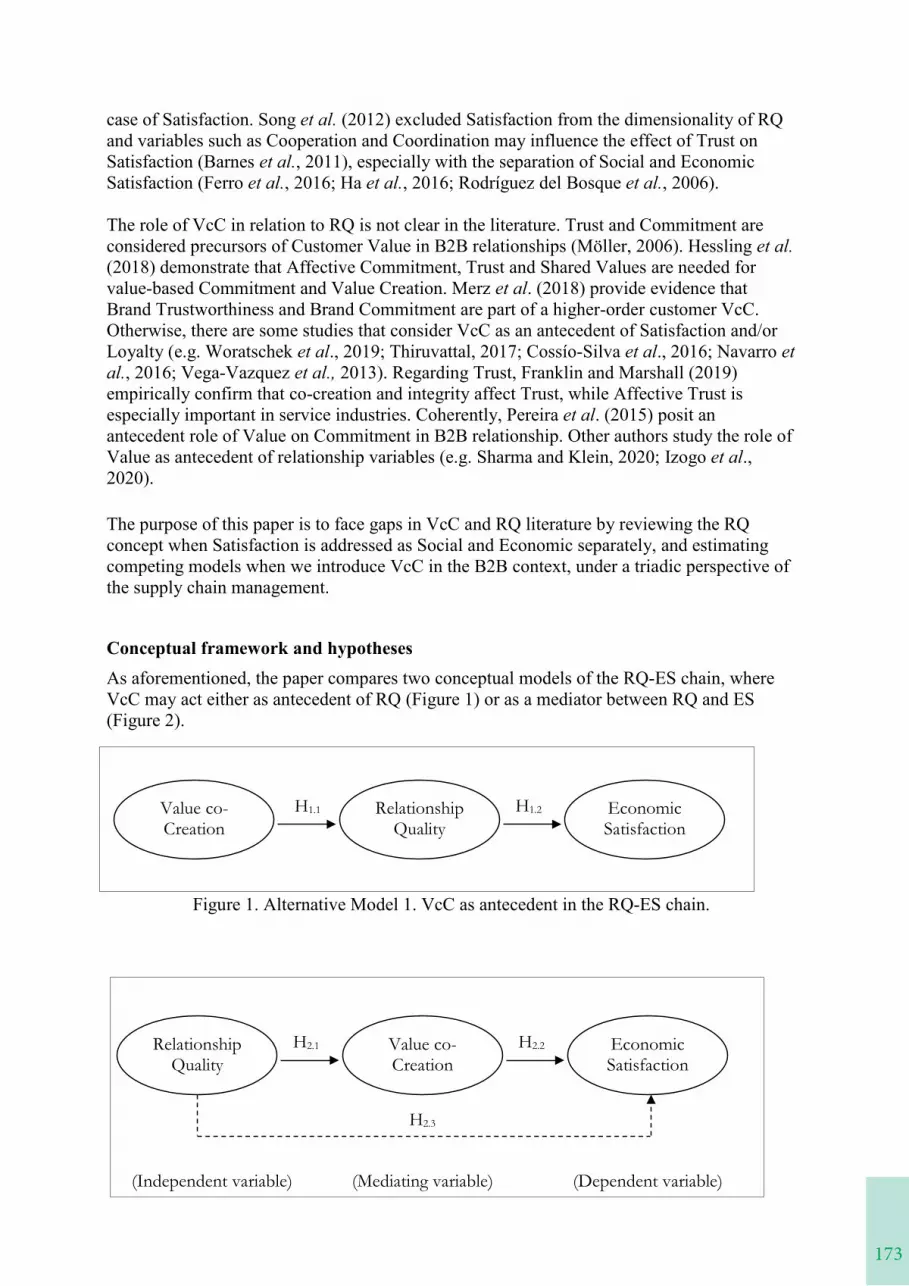
173
RELATIONSHIP QUALITY, VALUE CO-CREATION AND ECONOMIC SATISFACTION IN B2B VALUE CHAIN
IntroductionService Dominant Logic (SDL) has been a catalyst for several research guidelines and a growing customer-driven operational approach (Wilden et al., 2017; Vargo and Lusch, 2017). However, when studying Value co-Creation (VcC) and Relationship Quality (RQ),interactions in retailing and manufacturing firms in business-to-business (B2B) have attracted less attention compared to service contexts (Hein et al., 2019; Marcos-Cuevas et al., 2016). Moreover, few papers cope with models offering triadic approaches; this is, taking into account relationships upstream the value chain, from the retailer backwards to the industrial manufacturer and then also to other industrial suppliers, as most studies focus just on dyadic relationships (e.g. Kohtamäki and Rajala, 2016; O’Cass and Ngo, 2012).
This research studies the role of VcC in the Relationship Quality-Economic Satisfaction chain. We conduct our study in the Spanish furniture industry. The study contributes to research in the RQ-VcC-ES chain. First, following the research agenda of Zolkiewski et al.(2017), we consider an affective social dimension as part of RQ. We model RQ as a second-order construct (Vesel and Zabkar , 2010) consisting of three first-order dimensions: Trust, Commitment, and Social Satisfaction (SS). Second, the literature encompasses conflicting approaches about RQ and VcC. Traditional studies consider Value Creation as a consequence of relational variables (e.g. Hessling et al., 2018), while other authors consider VcC as antecedent (e.g. Franklin and Marshall, 2019; Thiruvattal, 2017). Hence, we have tested theeffect of VcC as antecedent of RQ (Model 1) and an alternative model where VcC is amediating variable (Model 2). Third, the literature rarely considers a holistic vision of the supply chain. Therefore, we conduct a triadic approach, so the mediation model is validated upstream the supply chain in two pairs of dyads, where a same actor has different roles (Zolkiewski et al., 2017). For these purposes, the paper reports a study conducted with a sample of 77 Spanish furniture firms and measures RQ, VcC and ES in the retailer-manufacturer-supplier triad.
Purpose*Li et al. (2020) define RQ as the quality of business interaction between providers and customers, which includes dyadic relationships (Prayag et al., 2019). Traditionally, RQ reviews highlight difficulties for agreement on the dimensions of RQ (Athanasopoulou, 2009; Palmatier et al., 2006; Vieira et al., 2008). According to this, two competing streams of research address the dimensionality of RQ. A prevailing group of authors define RQ in termsof basic dimensions, namely Trust, Commitment and Satisfaction, while a second approach extends this dimensionality to other variables (e.g. Casidy and Nyadzayo, 2017; Jiang et al.,2016; Matikainen et al., 2015).
The literature offers varied perspectives on which relational constructs have an effect on traditional outcomes such as Customer Loyalty (Morgan and Hunt, 1994; Palmatier et al.,2006; Hennig-Thurau, 2000; Kyoum Kim et al., 2011). More recently, authors have studied RQ and its outcomes in the services B2C context (Hirshberg and Shoham, 2017; Prayag et al., 2019; Jiang et al., 2016; Sarmento et al., 2015; Bandara et al., 2017). Prayag et al. (2019) review the literature ambiguity about antecedents and outcomes of RQ, for instance in the
case of Satisfaction. Song et al. (2012) excluded Satisfaction from the dimensionality of RQand variables such as Cooperation and Coordination may influence the effect of Trust on Satisfaction (Barnes et al., 2011), especially with the separation of Social and Economic Satisfaction (Ferro et al., 2016; Ha et al., 2016; Rodríguez del Bosque et al., 2006).
The role of VcC in relation to RQ is not clear in the literature. Trust and Commitment areconsidered precursors of Customer Value in B2B relationships (Möller, 2006). Hessling et al.(2018) demonstrate that Affective Commitment, Trust and Shared Values are needed for value-based Commitment and Value Creation. Merz et al. (2018) provide evidence that Brand Trustworthiness and Brand Commitment are part of a higher-order customer VcC. Otherwise, there are some studies that consider VcC as an antecedent of Satisfaction and/or Loyalty (e.g. Woratschek et al., 2019; Thiruvattal, 2017; Cossío-Silva et al., 2016; Navarro et al., 2016; Vega-Vazquez et al., 2013). Regarding Trust, Franklin and Marshall (2019) empirically confirm that co-creation and integrity affect Trust, while Affective Trust is especially important in service industries. Coherently, Pereira et al. (2015) posit anantecedent role of Value on Commitment in B2B relationship. Other authors study the role of Value as antecedent of relationship variables (e.g. Sharma and Klein, 2020; Izogo et al.,2020).
The purpose of this paper is to face gaps in VcC and RQ literature by reviewing the RQ concept when Satisfaction is addressed as Social and Economic separately, and estimatingcompeting models when we introduce VcC in the B2B context, under a triadic perspective ofthe supply chain management.
Conceptual framework and hypotheses As aforementioned, the paper compares two conceptual models of the RQ-ES chain, where VcC may act either as antecedent of RQ (Figure 1) or as a mediator between RQ and ES(Figure 2).
Figure 1. Alternative Model 1. VcC as antecedent in the RQ-ES chain.
Value co-Creation
Relationship Quality
Economic Satisfaction
H1.1 H1.2
Relationship Quality
Value co-Creation
Economic Satisfaction
H2.1 H2.2
H2.3
(Independent variable) (Mediating variable) (Dependent variable)
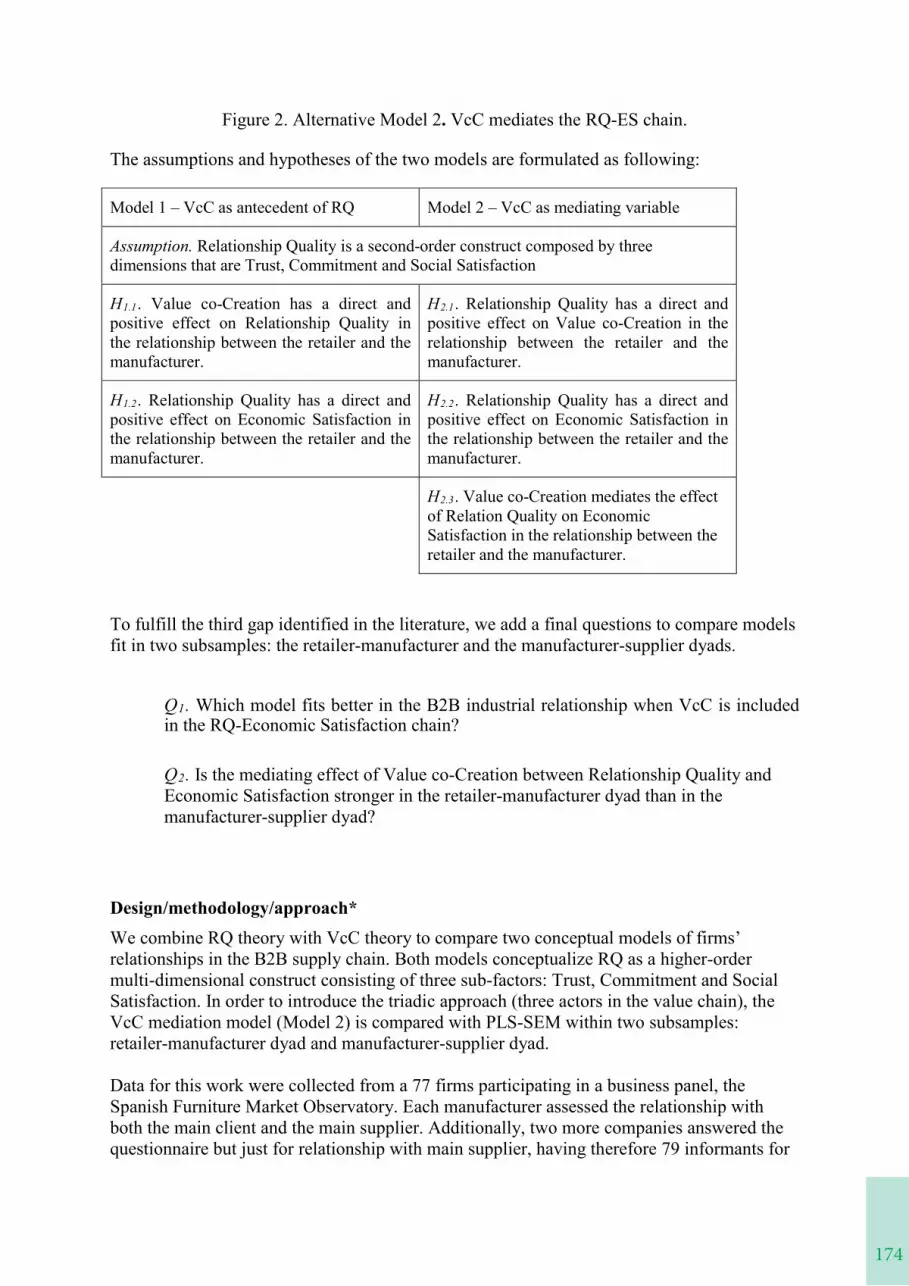
174
Figure 2. Alternative Model 2. VcC mediates the RQ-ES chain.
The assumptions and hypotheses of the two models are formulated as following:
Model 1 – VcC as antecedent of RQ Model 2 – VcC as mediating variable
Assumption. Relationship Quality is a second-order construct composed by three dimensions that are Trust, Commitment and Social Satisfaction
H1.1. Value co-Creation has a direct and positive effect on Relationship Quality in the relationship between the retailer and the manufacturer.
H2.1. Relationship Quality has a direct and positive effect on Value co-Creation in the relationship between the retailer and the manufacturer.
H1.2. Relationship Quality has a direct and positive effect on Economic Satisfaction in the relationship between the retailer and the manufacturer.
H2.2. Relationship Quality has a direct and positive effect on Economic Satisfaction in the relationship between the retailer and the manufacturer.
H2.3. Value co-Creation mediates the effect of Relation Quality on Economic Satisfaction in the relationship between the retailer and the manufacturer.
To fulfill the third gap identified in the literature, we add a final questions to compare models fit in two subsamples: the retailer-manufacturer and the manufacturer-supplier dyads.
Q1. Which model fits better in the B2B industrial relationship when VcC is included in the RQ-Economic Satisfaction chain?
Q2. Is the mediating effect of Value co-Creation between Relationship Quality and Economic Satisfaction stronger in the retailer-manufacturer dyad than in the manufacturer-supplier dyad?
Design/methodology/approach*We combine RQ theory with VcC theory to compare two conceptual models of firms’ relationships in the B2B supply chain. Both models conceptualize RQ as a higher-order multi-dimensional construct consisting of three sub-factors: Trust, Commitment and Social Satisfaction. In order to introduce the triadic approach (three actors in the value chain), the VcC mediation model (Model 2) is compared with PLS-SEM within two subsamples:retailer-manufacturer dyad and manufacturer-supplier dyad.
Data for this work were collected from a 77 firms participating in a business panel, the Spanish Furniture Market Observatory. Each manufacturer assessed the relationship with both the main client and the main supplier. Additionally, two more companies answered the questionnaire but just for relationship with main supplier, having therefore 79 informants for
175
Figure 2. Alternative Model 2. VcC mediates the RQ-ES chain.
The assumptions and hypotheses of the two models are formulated as following:
Model 1 – VcC as antecedent of RQ Model 2 – VcC as mediating variable
Assumption. Relationship Quality is a second-order construct composed by three dimensions that are Trust, Commitment and Social Satisfaction
H1.1. Value co-Creation has a direct and positive effect on Relationship Quality in the relationship between the retailer and the manufacturer.
H2.1. Relationship Quality has a direct and positive effect on Value co-Creation in the relationship between the retailer and the manufacturer.
H1.2. Relationship Quality has a direct and positive effect on Economic Satisfaction in the relationship between the retailer and the manufacturer.
H2.2. Relationship Quality has a direct and positive effect on Economic Satisfaction in the relationship between the retailer and the manufacturer.
H2.3. Value co-Creation mediates the effect of Relation Quality on Economic Satisfaction in the relationship between the retailer and the manufacturer.
To fulfill the third gap identified in the literature, we add a final questions to compare models fit in two subsamples: the retailer-manufacturer and the manufacturer-supplier dyads.
Q1. Which model fits better in the B2B industrial relationship when VcC is included in the RQ-Economic Satisfaction chain?
Q2. Is the mediating effect of Value co-Creation between Relationship Quality and Economic Satisfaction stronger in the retailer-manufacturer dyad than in the manufacturer-supplier dyad?
Design/methodology/approach*We combine RQ theory with VcC theory to compare two conceptual models of firms’ relationships in the B2B supply chain. Both models conceptualize RQ as a higher-order multi-dimensional construct consisting of three sub-factors: Trust, Commitment and Social Satisfaction. In order to introduce the triadic approach (three actors in the value chain), the VcC mediation model (Model 2) is compared with PLS-SEM within two subsamples:retailer-manufacturer dyad and manufacturer-supplier dyad.
Data for this work were collected from a 77 firms participating in a business panel, the Spanish Furniture Market Observatory. Each manufacturer assessed the relationship with both the main client and the main supplier. Additionally, two more companies answered the questionnaire but just for relationship with main supplier, having therefore 79 informants for
the manufacturer-supplier subsample. These subsample sizes are in line with other empirical studies in the B2B context (e.g. Hamidi and Gharneh, 2017; Kohtamäki and Partanen, 2016; O’Cass and Ngo, 2012). We also conducted a Statistical Power test with software G*Power v.3.1.9.2. to confirm the suitability of the two subsamples (Faul et al., 2007), obtaining results of (1-β) = .87 (87%) and (1-β) = .86 (86%). Both subsamples exceed the threshold of .80 as required for Social Sciences (Nitzl, 2016; Chin and Newsted, 1999; Cohen, 1988).
Multi-item scales were adapted from previous studies. We have adopted a collaboration-based definition of co-Creation, being suitable for an interorganizational framework(Ramaswamy and Ozcan, 2018; Bharti et al., 2015). The VcC construct was therefore measured with six indicators as used by Claro and Claro (2010), reflecting main aspects of firm collaboration (joint planning, problem solving, and flexibility). To measure Trust and Commitment, as their dimensionality is not the focus of our study, we have adapted unidimensional parsimonious scales as used by Ferro et al. (2016). Finally, we have measured Social and Economic Satisfaction with three indicators as proposed by Chung et al.(2011). A 7-point Likert scale was used for all measures. All the scales showed high Cronbach’s alpha values in both subsamples (being .79 the minimum value for Trust and .93 the maximum value for Commitment, with composite reliability of .88 and .95, respectively). In addition, the AVE values varied between .56 for VcC and .87 for Commitment. In the light of these results, no item was deleted.
We have validated the proposed models with Partial Least Squares (PLS-SEM) by using the software SmartPLS v.3.2.7. (Ringle et al., 2015). There is rationale for using PLS-SEM: the small size of the subsamples and the non-normal distributions found in both subsamples (Hair et al. (2014). As well as the fact of being in early stage of theory development (Richter et al.,2016).
Findings*Results evidence that SS and ES act differently in the B2B relationship. Here, SS isintroduced as a first-order dimension of a RQ second-order construct. Results suggest that the effect of RQ on ES is greater when VcC is introduced in the chain as a mediating variable(Model 2), although the mediation may be partial in the chain. Moreover, regarding the comparison by subsamples in the triad, the mediating effect is greater in the manufacturer-supplier relationship than for the manufacturer-retailer one.
Original/value*This paper aimed at improving the understanding and practices of VcC in relation to RQ in the supply chain management. In this sense, we contribute to reducing the conceptual gap between value exchanges in B2C and B2B contexts posed by Mencarelli and Riviére (2015).The paper introduces a new perspective about the importance of SS as an affective dimension of RQ (Zolkiewski et al., 2017). Thus, we widen the scope of the conventional understanding on SS and ES as main forms of Satisfaction and its relation to RQ. Instead, we propose to deal with SS as a relational dimension of RQ (being a second-order construct), while ES iskept as outcome of the B2B relationship. This is in line with recent authors that have explored the separate role of both Satisfaction dimensions in B2B relationships (Mohd Noor et al., 2015; Briggs et al., 2016). Furthermore, we introduce VcC as a fundamental construct for B2B relationships, following recent studies (Franklin and Marshall, 2019; Thiruvattal,
176
2017). By empirically comparing two alternative models, we conclude that VcC contributes to enlarge the effect of RQ over ES, mainly through a mediating effect in the retailer-manufacturer relationship.
Related to supply chain management, while B2B studies usually focus on services, this paper focuses on the retailing firm with its industrial chain. The paper also introduces a less common B2B triadic by testing two dyads (Nätti et al., 2014; Murthy et al., 2016). Thus, variations in the perceptions about the B2B relationship are captured as the role of each actor in the supply chain changes depending on the dyad.
Practical implicationsThe paper is also valuable for managers in retailing firms and for their partners upstream in the value chain. Depicting a triadic approach within the supply chain, the paper adds evidence about how to address greater ES with B2B partners through VcC practices in industrial relationships.
The paper has also implications for supply value management. As practices of VcC are evidenced to be greater in the value chain for manufacturers and suppliers, it is necessary to align the rest of the supply chain by involving retailers in business networks that make easier the introduction of VcC practices.
Research limitations and outlookResults are limited to the Spanish furniture business with a cross-sectional approach. Thefindings cannot be easily generalized for other sectors in accordance with the highly contextuality of value creation (Akaka et al., 2013) and the complexity of B2B service interactions (Zolkiewski et al., 2017). Thus, contrasting RQ models in other business contexts is needed. Multicollinearity with Trust and Commitment should be also addressed.
Suggestions for future research include taking into account longitudinal studies in order to understand how ES may grow over time when RQ and VcC are consolidated between B2B partners. Another guideline would be reviewing the role of Trust within the RQ construct, dealing with cognitive and affective aspects (Prayag et al., 2019), as well as with anti-Trust or Trust erosion issues in line with recent studies (Brown et al., 2019). Other suggestion is to include in the model new variables such as technological skills of partners that may foster VcC and ES in the chain. Finally, by adding other actors’ perceptions in the triad, synergic networks or ecosystems may be studied by introducing additional players of the supply chain.
References*
Akaka, M.A., Vargo, S.L. and Lusch, R.F. (2013), “The Complexity of Context: A Service Ecosystems Approach for International Marketing”, Journal of International Marketing,Vol. 21 No. 4, pp. 1-20.
Athanasopoulou, P. (2009), “Relationship quality: A critical literature review and research agenda”, European Journal of Marketing, Vol. 43 No. 5/6, pp. 583-610.
Bandara, S., Leckie, C., Lobo, A. and Hewege, C. (2017), “Power and relationship quality in supply chains: the case of the Australian organic fruit and vegetable industry”. Asia Pacific Journal of Marketing and Logistics, Vol. 29 No. 3, pp. 501-518.
177
2017). By empirically comparing two alternative models, we conclude that VcC contributes to enlarge the effect of RQ over ES, mainly through a mediating effect in the retailer-manufacturer relationship.
Related to supply chain management, while B2B studies usually focus on services, this paper focuses on the retailing firm with its industrial chain. The paper also introduces a less common B2B triadic by testing two dyads (Nätti et al., 2014; Murthy et al., 2016). Thus, variations in the perceptions about the B2B relationship are captured as the role of each actor in the supply chain changes depending on the dyad.
Practical implicationsThe paper is also valuable for managers in retailing firms and for their partners upstream in the value chain. Depicting a triadic approach within the supply chain, the paper adds evidence about how to address greater ES with B2B partners through VcC practices in industrial relationships.
The paper has also implications for supply value management. As practices of VcC are evidenced to be greater in the value chain for manufacturers and suppliers, it is necessary to align the rest of the supply chain by involving retailers in business networks that make easier the introduction of VcC practices.
Research limitations and outlookResults are limited to the Spanish furniture business with a cross-sectional approach. Thefindings cannot be easily generalized for other sectors in accordance with the highly contextuality of value creation (Akaka et al., 2013) and the complexity of B2B service interactions (Zolkiewski et al., 2017). Thus, contrasting RQ models in other business contexts is needed. Multicollinearity with Trust and Commitment should be also addressed.
Suggestions for future research include taking into account longitudinal studies in order to understand how ES may grow over time when RQ and VcC are consolidated between B2B partners. Another guideline would be reviewing the role of Trust within the RQ construct, dealing with cognitive and affective aspects (Prayag et al., 2019), as well as with anti-Trust or Trust erosion issues in line with recent studies (Brown et al., 2019). Other suggestion is to include in the model new variables such as technological skills of partners that may foster VcC and ES in the chain. Finally, by adding other actors’ perceptions in the triad, synergic networks or ecosystems may be studied by introducing additional players of the supply chain.
References*
Akaka, M.A., Vargo, S.L. and Lusch, R.F. (2013), “The Complexity of Context: A Service Ecosystems Approach for International Marketing”, Journal of International Marketing,Vol. 21 No. 4, pp. 1-20.
Athanasopoulou, P. (2009), “Relationship quality: A critical literature review and research agenda”, European Journal of Marketing, Vol. 43 No. 5/6, pp. 583-610.
Bandara, S., Leckie, C., Lobo, A. and Hewege, C. (2017), “Power and relationship quality in supply chains: the case of the Australian organic fruit and vegetable industry”. Asia Pacific Journal of Marketing and Logistics, Vol. 29 No. 3, pp. 501-518.
Barnes, B.R., Yen, D. and Zhou, L. (2011), “Investigating Guanxi dimensions and relationship outcomes: insights from Sino-Anglo business relationships”, Industrial Marketing Management, Vol. 40 No. 4, pp. 510-521.
Bharti, K., Agrawal, R., and Sharma, V. (2015), “Value co-creation. Literature review and proposed conceptual Framework”, International Journal of Market Research, Vol. 57 No. 4, pp. 571-603.
Briggs, E., Landry, T.D. and Daugherty, P.J. (2016), “A framework of satisfaction for continually delivered business services”, Journal of Business & Industrial Marketing, Vol. 31 No. 1, pp. 112-122.
Brown, J.R., Crosno, J.L. and Tong P.Y. (2019), “Is the theory of trust and commitment in marketing relationships incomplete?”, Industrial Marketing Management, Vol. 77,February 2019, pp. 155-169.
Casidy, R. and Nyadzayo, M. (2017), “Drivers and outcomes of relationship quality with professional service firms: an SME owner-manager perspective”, Industrial Marketing Management, Vol. 78, pp. 27-42.
Claro, D.P., and Claro, P.B.O. (2010), “Collaborative buyer–supplier relationships and downstream information in marketing channels”, Industrial Marketing Management, Vol. 39 No. 2, pp. 221–228.
Cohen, J. (1988), Statistical power analysis for the behavioral sciences, Lawrence Erlbaum Associates, 2nd edition, Hilsdale, NJ.
Cossío-Silva, F.J., Revilla-Camacho, M.Á., Vega-Vázquez, M. and Palacios-Florencio, B. (2016), “Value co-Creation and customer loyalty”, Journal of Business Research, Vol. 69 No. 5, pp. 1621-1625.
Chin, W.W. and Newsted, P.R. (1999), “Structural equation modelling analysis with small samples using partial least squares”, in Hoyle, R. (Ed.), Statistical strategies for small samples research, Thousand Oaks, CA: Sage, pp. 307-341.
Chung, J-E., Huang, Y., Jin, B. and Sternquist, B. (2011), “The Impact of Market Orientation on Chinese Retailers' Channel Relationships”, Journal of Business & Industrial Marketing, Vol. 26 No. 1, pp. 14-25.
Faul, F., Erdfelder, E., Lang, A.-G. and Buchner, A. (2007), “G*Power 3: A flexible statistical power analysis program for the social, behavioral, and biomedical sciences”, Behavior Research Methods, Vol. 39, pp. 175-191.
Ferro, C., Padin, C., Svensson, G. and Payan, J. (2016), “Trust and Commitment as Mediators between Economic and Non-Economic Satisfaction in Manufacturer-Supplier Relationships”, Journal of Business & Industrial Marketing, Vol. 31 No. 1, pp. 13-23.
Franklin, D. and Marshall, R. (2019), “Adding co-creation as an antecedent condition leading to trust in business-to-business relationships”, Industrial Marketing Management, Vol. 77, pp 170-181.
Ha, H.-Y., Lee, M.-S. and Janda, S. (2016), “Effects of Economic and Social Satisfaction on Partner Trust: An Investigation of Temporal Carryover Effects”, European Journal of Marketing, Vol. 50 No. 1/2, pp. 100-123.
Hair, J.F., Hult, G., Ringle, C. and Sarstedt, M. (2014). “A primer on Partial Least Squares Structural Equation Modeling (PLS-SEM)”, Thousand Oaks: CA: Sage.
178
Hamidi, F. and Gharneh, N.S. (2017), “Impact of co-creation on innovation capability and firm performance: a structural equation modeling”, AD-minister, Vol. 30, pp. 73-90.
Hein, A., Weking, J., Schreieck, M., Wieschel, M., Böhm, M. and Krcmar, H. (2019), “Value co-creation practices in business-to-business platform ecosystems”, Electronic Markets –The International Journal of Networked Business, Special Issue on “The future of shared services”, pp. 6-16.
Hennig-Thurau, T. (2000), “Relationship quality and customer retention through strategic communication of customer skills”, Journal of Marketing Management, Vol. 16 No. 1/3, pp. 55-79.
Hessling, V., Åsberg, M. and Roxenhall, T. (2018), “Relationship commitment and value creation in sponsorship relationships”, Journal of Business-to-Business Marketing, Vol. 25 No. 2, pp. 137-160.
Hirshberg, R.S. and Shoham, A. (2017), “A behavioral model of international channel relationships”, Journal of Business-to-Business Marketing, Vol. 24 No. 4, pp. 257-282.
Izogo, E.E., Jayawardhena, Ch. and Adegbola, E.A. (2020), “Creating particularized trust in e-retailers through experiential value and generalized trust”, Journal of Strategic Marketing, Vol. 28 No. 1, pp. 16-38.
Jiang, Z., Shiu, E., Henneberg, S. and Naude, P. (2016), “Relationship Quality in Business to Business Relationships—Reviewing the Current Literatures and Proposing a New Measurement Model”, Psychology & Marketing, Vol. 33 No. 4, pp. 297-313.
Kohtamäki, M. and Partanen, J. (2016), “Co-creating value from knowledge-intensive business services in manufacturing firms: The moderating role of relationship learning in supplier-customer interactions”, Journal of Business Research, Vol. 69 No. 7, pp. 2498-2506.
Kohtamäki, M. and Rajala, R. (2016), “Theory and practice of Value co-Creation in B2B systems”, Industrial Marketing Management, Vol. 56, pp. 4–13.
Kyoum Kim, Y., Jae Ko, Y. and James, J. (2011), “The impact of relationship quality on attitude toward a sponsor”, Journal of Business & Industrial Marketing, Vol. 26 No. 8, pp. 566-576.
Li Y., Zhang Y., Xu J., and Feng T. (2020). “The impacts of customer involvement on the relationship between relationship quality and performance”. Journal of Business & Industrial Marketing, Vol. 35 No. 2, pp. 270-283.
Matikainen, M., Terho, H., Matikainen, E., Parvinen, P. and Juppo, A. (2015), “Effective implementation of relationship orientation in new product launches”, Industrial Marketing Management, Vol. 45, pp. 35-46.
Marcos-Cuevas, J., Nätti, S., Palo, T. and Baumann, J. (2016), “Value co-creation practices and capabilities: Sustained purposeful engagement across B2B systems”, Industrial Marketing Management, Vol. 56, pp. 97-107.
Mencarelli, R. and Rivière, A. (2015), “Perceived value in B2B and B2C: A comparative approach and cross-fertilization”, Marketing Theory, Vol. 15 No. 2, pp. 201–220.
Merz, M.A., Zarantonello, L. and Grappi S. (2018), “How valuable are your customers in the brand value co-creation process? The development of a Customer Co-Creation Value (CCCV) scale”, Journal of Business Research, Vol. 82, pp. 79-89.
179
Hamidi, F. and Gharneh, N.S. (2017), “Impact of co-creation on innovation capability and firm performance: a structural equation modeling”, AD-minister, Vol. 30, pp. 73-90.
Hein, A., Weking, J., Schreieck, M., Wieschel, M., Böhm, M. and Krcmar, H. (2019), “Value co-creation practices in business-to-business platform ecosystems”, Electronic Markets –The International Journal of Networked Business, Special Issue on “The future of shared services”, pp. 6-16.
Hennig-Thurau, T. (2000), “Relationship quality and customer retention through strategic communication of customer skills”, Journal of Marketing Management, Vol. 16 No. 1/3, pp. 55-79.
Hessling, V., Åsberg, M. and Roxenhall, T. (2018), “Relationship commitment and value creation in sponsorship relationships”, Journal of Business-to-Business Marketing, Vol. 25 No. 2, pp. 137-160.
Hirshberg, R.S. and Shoham, A. (2017), “A behavioral model of international channel relationships”, Journal of Business-to-Business Marketing, Vol. 24 No. 4, pp. 257-282.
Izogo, E.E., Jayawardhena, Ch. and Adegbola, E.A. (2020), “Creating particularized trust in e-retailers through experiential value and generalized trust”, Journal of Strategic Marketing, Vol. 28 No. 1, pp. 16-38.
Jiang, Z., Shiu, E., Henneberg, S. and Naude, P. (2016), “Relationship Quality in Business to Business Relationships—Reviewing the Current Literatures and Proposing a New Measurement Model”, Psychology & Marketing, Vol. 33 No. 4, pp. 297-313.
Kohtamäki, M. and Partanen, J. (2016), “Co-creating value from knowledge-intensive business services in manufacturing firms: The moderating role of relationship learning in supplier-customer interactions”, Journal of Business Research, Vol. 69 No. 7, pp. 2498-2506.
Kohtamäki, M. and Rajala, R. (2016), “Theory and practice of Value co-Creation in B2B systems”, Industrial Marketing Management, Vol. 56, pp. 4–13.
Kyoum Kim, Y., Jae Ko, Y. and James, J. (2011), “The impact of relationship quality on attitude toward a sponsor”, Journal of Business & Industrial Marketing, Vol. 26 No. 8, pp. 566-576.
Li Y., Zhang Y., Xu J., and Feng T. (2020). “The impacts of customer involvement on the relationship between relationship quality and performance”. Journal of Business & Industrial Marketing, Vol. 35 No. 2, pp. 270-283.
Matikainen, M., Terho, H., Matikainen, E., Parvinen, P. and Juppo, A. (2015), “Effective implementation of relationship orientation in new product launches”, Industrial Marketing Management, Vol. 45, pp. 35-46.
Marcos-Cuevas, J., Nätti, S., Palo, T. and Baumann, J. (2016), “Value co-creation practices and capabilities: Sustained purposeful engagement across B2B systems”, Industrial Marketing Management, Vol. 56, pp. 97-107.
Mencarelli, R. and Rivière, A. (2015), “Perceived value in B2B and B2C: A comparative approach and cross-fertilization”, Marketing Theory, Vol. 15 No. 2, pp. 201–220.
Merz, M.A., Zarantonello, L. and Grappi S. (2018), “How valuable are your customers in the brand value co-creation process? The development of a Customer Co-Creation Value (CCCV) scale”, Journal of Business Research, Vol. 82, pp. 79-89.
Mohd Noor, N.A., Perumal, S. and Goaill, M.M. (2015), “The Impact of Relational Marketing Bonds on Retailers' Economic and Social Satisfaction”, Journal of Relationship Marketing, Vol. 14 No. 2, pp. 124-151.
Möller, K. (2006), “Role of competences in creating customer value: a value-creation logic approach”, Industrial Marketing Management, Vol. 35 No. 8, pp. 913-924.
Morgan, R.M. and Hunt, S.D. (1994), “The Commitment-Trust Theory of Relationship Marketing”, Journal of Marketing, Vol. 58, July 1994, pp. 20-38.
Murthy, C., Padhi, S.S., Gupta, N. and Kapil, K. (2016), “An empirical investigation of the antecedents of Value co-Creation in B2B IT services outsourcing”, Business Process Management Journal, Vol. 22 No. 3, pp. 484-506.
Nätti, S., Pekkarinen, S., Hartikka, A. and Holapa, T. (2014), “The intermediator role in Value co-Creation within a triadic business service relationship”, Industrial Marketing Management, Vol. 13 No. 6, pp. 977-984.
Navarro, S., Llinares, C., and Garzon, D. (2016). “Exploring the relationship between co-creation and satisfaction using QCA”, Journal of Business Research, Vol. 69 No. 4, pp.1336-39.
Nitzl, C. (2016), “The use of partial least squares structural equation modelling (PLS-SEM) in management accounting research: Directions for future theory development”, Journal of Accounting Literature, Vol. 37, pp. 19-35.
O’Cass, A. and Ngo, L.V. (2012), “Creating superior customer value for B2B firms through supplier firm capabilities”, Industrial Marketing Management, Vol. 41, pp. 125–135.
Palmatier, R.W., Dant, R.P., Grewal, D. and Evans, K.R. (2006), “Factors influencing the effectiveness of relationship marketing: a meta-analysis”, Journal of Marketing, Vol. 70 No. 4, pp. 136-153.
Pereira I.L., Ribeiro A.H.P., da Veiga R.T., and Robbe R.S. (2015), “Value Generation And Impact On Commitment In Business-To-Business Relationships”, in Robinson, Jr. L. (eds) Marketing Dynamism & Sustainability: Things Change, Things Stay the Same…. Developments in Marketing Science: Proceedings of the Academy of Marketing Science.Springer, Cham.
Prayag G., Hosany S., Taheri B. and Ekiz, EH. (2019), “Antecedents and outcomes of relationship quality in casual dining restaurants. The mediating effects of relationship quality and moderating roles of gender”, International Journal of Contemporary Hospitality Management, Vol. 31 No. 2, pp. 575-593.
Ramaswamy, V. and Ozcan, K. (2018), “What is co-creation? An interactional creation framework and its implications for value creation”, Journal of Business Research, Vol. 84, pp 196-205.
Richter, N.F., Sinkovics, R.R., Ringle, C.M. and Schlägel, C. (2016), “A critical look at the use of SEM in international business research”, International Marketing Review, Vol. 33 No. 3, pp. 376-404.
Ringle, C.M., Wende, S. and Becker, J.M. (2015). SmartPLS 3. Boenningstedt: SmartPLS GmbH, available at http://www.smartpls.com (accessed February 2018).
180
Rodríguez del Bosque, I., Collado Agudo, J. and San Martín Gutiérrez, H. (2006), “Determinants of Economic and Social Satisfaction in Manufacturer–distributor Relationships”, Industrial Marketing Management, Vol. 35 No. 6, pp. 666-75.
Sarmento, M., Simões, C. and Farhangmehr, M. (2015), “Applying a relationship marketing perspective to B2B trade fairs: the role of socialization episodes”, Industrial Marketing Management, Vol. 44, pp. 131-141.
Sharma, V.M. and Klein, A. (2020). “Consumer perceived value, involvement, trust, susceptibility to interpersonal influence, and intention to participate in online group buying”, Journal of Retailing and Consumer Services, Vol. 52, January 2020, 101946.
Song, Y., Su, Q., Liu, Q. and Wang, T. (2012), “Impact of business relationship functions on relationship quality and buyer’s performance”, Journal of Business & Industrial Marketing, Vol. 27 No. 4, pp. 286-298.
Thiruvattal, E. (2017), “Impact of Value co-Creation on logistics customers’ loyalty”, Journal of Global Operations and Strategic Sourcing, Vol. 10 No. 3, pp. 334-361.
Vargo, S.L. and Lusch, R.F. (2017), “Service-Dominant Logic 2025”, International Journal of Research in Marketing, Vol. 34 No. 1, pp. 46-67.
Vega-Vazquez, M., Revilla-Camacho, M. Á., and Cossío-Silva, F. J. (2013), “The value co-creation process as a determinant of customer satisfaction”, Management Decision, Vol. 51 No. 10, pp. 1945-53.
Vesel, P. and Zabkar, V. (2010), “Comprehension of relationship quality in the retail environment”, Managing Service Quality, Vol. 20 No. 3, pp. 213-235.
Vieira, A.L., Winklhofer, H. and Ennew, C.T. (2008), “Relationship quality: a literature review and research agenda”, Journal of Customer Behaviour, Vol. 7 No. 4, pp. 269-291.
Wilden, R., Akaka, M.A., Karpen, I.O. and Hohberger, J. (2017), “The Evolution and Prospects of Service-Dominant Logic: An Investigation of Past, Present, and Future Research”, Journal of Service Research, Vol. 20 No. 4, pp. 345-361.
Woratschek, H., Horbel, C. and Popp, B. (2019), “Determining customer satisfaction and loyalty from a value co-creation perspective”, The Service Industries Journal, Published Online: 22 Apr 2019.
Zolkiewski, J., Story, V., Burton, J., Chan, P., Gomes, A., Hunter-Jones, P., O’Malley, L., Peters, L.D., Raddats, C. and Robinson, W. (2017), "Strategic B2B customer experience management: the importance of outcomes-based measures", Journal of Services Marketing, Vol. 31, No. 2, pp. 172-184.
Keywords*Value co-Creation, Relationship Quality, Trust, Commitment, Social Satisfaction, Economic Satisfaction, B2B, Supply Chain Management
181
Rodríguez del Bosque, I., Collado Agudo, J. and San Martín Gutiérrez, H. (2006), “Determinants of Economic and Social Satisfaction in Manufacturer–distributor Relationships”, Industrial Marketing Management, Vol. 35 No. 6, pp. 666-75.
Sarmento, M., Simões, C. and Farhangmehr, M. (2015), “Applying a relationship marketing perspective to B2B trade fairs: the role of socialization episodes”, Industrial Marketing Management, Vol. 44, pp. 131-141.
Sharma, V.M. and Klein, A. (2020). “Consumer perceived value, involvement, trust, susceptibility to interpersonal influence, and intention to participate in online group buying”, Journal of Retailing and Consumer Services, Vol. 52, January 2020, 101946.
Song, Y., Su, Q., Liu, Q. and Wang, T. (2012), “Impact of business relationship functions on relationship quality and buyer’s performance”, Journal of Business & Industrial Marketing, Vol. 27 No. 4, pp. 286-298.
Thiruvattal, E. (2017), “Impact of Value co-Creation on logistics customers’ loyalty”, Journal of Global Operations and Strategic Sourcing, Vol. 10 No. 3, pp. 334-361.
Vargo, S.L. and Lusch, R.F. (2017), “Service-Dominant Logic 2025”, International Journal of Research in Marketing, Vol. 34 No. 1, pp. 46-67.
Vega-Vazquez, M., Revilla-Camacho, M. Á., and Cossío-Silva, F. J. (2013), “The value co-creation process as a determinant of customer satisfaction”, Management Decision, Vol. 51 No. 10, pp. 1945-53.
Vesel, P. and Zabkar, V. (2010), “Comprehension of relationship quality in the retail environment”, Managing Service Quality, Vol. 20 No. 3, pp. 213-235.
Vieira, A.L., Winklhofer, H. and Ennew, C.T. (2008), “Relationship quality: a literature review and research agenda”, Journal of Customer Behaviour, Vol. 7 No. 4, pp. 269-291.
Wilden, R., Akaka, M.A., Karpen, I.O. and Hohberger, J. (2017), “The Evolution and Prospects of Service-Dominant Logic: An Investigation of Past, Present, and Future Research”, Journal of Service Research, Vol. 20 No. 4, pp. 345-361.
Woratschek, H., Horbel, C. and Popp, B. (2019), “Determining customer satisfaction and loyalty from a value co-creation perspective”, The Service Industries Journal, Published Online: 22 Apr 2019.
Zolkiewski, J., Story, V., Burton, J., Chan, P., Gomes, A., Hunter-Jones, P., O’Malley, L., Peters, L.D., Raddats, C. and Robinson, W. (2017), "Strategic B2B customer experience management: the importance of outcomes-based measures", Journal of Services Marketing, Vol. 31, No. 2, pp. 172-184.
Keywords*Value co-Creation, Relationship Quality, Trust, Commitment, Social Satisfaction, Economic Satisfaction, B2B, Supply Chain Management
Authors
Vicente Sales-Vivó
Business Analysis and Strategy section
AIDIMME Technology Institute, Valencia, Spain
Irene Gil-Saura
Faculty of Economics, Department of Marketing
University of Valencia, Valencia, Spain
Martina G. Gallarza
Faculty of Economics, Department of Marketing
University of Valencia, Valencia, Spain
182
1
DYNAMIC MARKETING CAPABILITIES AS DRIVERS ININTERNATIONAL CHANNEL INTEGRATION IN LATIN-AMERICAN
FIRMS
- Paula Andrea Garcia Ortiz- Full-Time Professor in Marketing Program- Universidad de Ibague, Ibague, Colombia
- Haydee Calderon Garcia - Assisstant Professor and Director of Marketing & Market Research Department
- Universitat de Valencia, Valencia, Spain - [email protected]
- Teresa Fayos Gardo- Associate Professor in Marketing & Market Research Department
- Universitat de Valencia, Valencia, Spain - [email protected]
- Nidia Roa Vivas- Full-Time Professor and Director of Marketing Program
- Universidad de Ibague, Ibague, Colombia- [email protected]
Introduction
The business environment is characterized by its complexity and ambiguity (Schoemaker, Heaton and Teece, 2018). It requires regular renewal of firms to articulate new challenges (Weerawardena et al., 2007; Barrales, Martínez and Gázquez, 2014), seek internationalization (Morgan, Katsikeas and Vorhies, 2012) and ensure its sustainability. In this context, dynamic marketing capabilities are a source of competitive advantage in internationalized firms (Martin, Javalgi and Cavusgil, 2017). The marketing capabilities are difficult to imitate in terms of technological and operational capabilities due to the tacit knowledge and imperfect mobility (Wu, 2013).
To seize the international market opportunities firms depend on the adaptation and integration of marketing capabilities and develop some of them, that link to more traditional practices to their core competences (Mora and Johnston, 2017). This research recognizes the importance of developing and strengthen the distribution channels, due to firms must seek a wider and deeper coverage in each country (Rambocas et al., 2015) to promote synergy with the distributor (Theoharakis, Angelis and Batsakis, 2019) and facilitate entry into the destination country.
The literature does not show a structural perspective to determine which functions of the distribution channels should be integrated and how (Saghiri et al., 2017). These difficulties require companies to develop dynamic marketing capabilities (Konwar et al., 2017) to drive their internationalization processes through key intermediaries, thus overcoming their organizational rigidities (Langlois and Robertson, 2000) and obtaining superior positional
183
1
DYNAMIC MARKETING CAPABILITIES AS DRIVERS ININTERNATIONAL CHANNEL INTEGRATION IN LATIN-AMERICAN
FIRMS
- Paula Andrea Garcia Ortiz- Full-Time Professor in Marketing Program- Universidad de Ibague, Ibague, Colombia
- Haydee Calderon Garcia - Assisstant Professor and Director of Marketing & Market Research Department
- Universitat de Valencia, Valencia, Spain - [email protected]
- Teresa Fayos Gardo- Associate Professor in Marketing & Market Research Department
- Universitat de Valencia, Valencia, Spain - [email protected]
- Nidia Roa Vivas- Full-Time Professor and Director of Marketing Program
- Universidad de Ibague, Ibague, Colombia- [email protected]
Introduction
The business environment is characterized by its complexity and ambiguity (Schoemaker, Heaton and Teece, 2018). It requires regular renewal of firms to articulate new challenges (Weerawardena et al., 2007; Barrales, Martínez and Gázquez, 2014), seek internationalization (Morgan, Katsikeas and Vorhies, 2012) and ensure its sustainability. In this context, dynamic marketing capabilities are a source of competitive advantage in internationalized firms (Martin, Javalgi and Cavusgil, 2017). The marketing capabilities are difficult to imitate in terms of technological and operational capabilities due to the tacit knowledge and imperfect mobility (Wu, 2013).
To seize the international market opportunities firms depend on the adaptation and integration of marketing capabilities and develop some of them, that link to more traditional practices to their core competences (Mora and Johnston, 2017). This research recognizes the importance of developing and strengthen the distribution channels, due to firms must seek a wider and deeper coverage in each country (Rambocas et al., 2015) to promote synergy with the distributor (Theoharakis, Angelis and Batsakis, 2019) and facilitate entry into the destination country.
The literature does not show a structural perspective to determine which functions of the distribution channels should be integrated and how (Saghiri et al., 2017). These difficulties require companies to develop dynamic marketing capabilities (Konwar et al., 2017) to drive their internationalization processes through key intermediaries, thus overcoming their organizational rigidities (Langlois and Robertson, 2000) and obtaining superior positional
2
advantage in their initial stages of internationalization. Nevertheless, Latin-American firms lack resources, knowledge, capabilities and experience (Martínez, 2011) to establish international channels and deploy more advanced internationalization processes (Fletcher and Harris, 2012). Hardly any alternative channels are available to companies, and integration with members of available channels is also very limited. So, in these markets, high levels of marketing capabilities are essential to sustain a superior positional advantage in the export venture (Martin, Javalgi and Cavusgil, 2017), easing the international process (Zhou, Wu and Barnes, 2012).
Thus, this study provides a better understanding of dynamic marketing capabilities in an ignored debate: internationalization process in emerging markets, grossly underrepresented in the literature (Martin, Javalgi and Cavusgil, 2017; Mora and Johnston, 2018). So, the research project is focused on determining the specific dynamic marketing capabilities that influence the integration and the coordination of the functions of the different members of the distribution channel in order to boot international processes, in Latin American small and medium-sized enterprises (SMEs).
Purpose*
The aim of this project is to identify the specific dynamic capabilities of marketing needed to integrate and coordinate the functions of the international distribution channel and boost the internationalization process in Latin-American SMEs.
Literature review and model proposal Conceptual framework
The dynamic capabilities are defined as “higher-level competences that determine the firm’s ability to integrate, build, and reconfigure internal and external resources/competences to address, and possibly shape, rapidly changing business environments” (Teece, 2012, P.1395).The literature demonstrates that companies which understand the environment can achieve competitive advantages in a different manner from their competitors (Eisenhardt and Martin, 2000). In this sense, the marketing capabilities are one of the primary ways to achieve a competitive advantage (Day, 1994) in order to improve the operational capabilities of the companies (Morgan, 2012) and their international performance (Ripollés and Blesa, 2012).According to Hoque (2017), a dynamic marketing capability has been defined as “market-knowledge adoption and deployment into cross-functional business processes through the organisation’s possession of higher-order marketing capabilities” (P.27). The dynamic marketing capabilities impact on specialized/functional capabilities and cross-functional capabilities such as pricing, advertising and promotion, product management and selling, considered as low-level marketing capabilities (Konwar et al., 2017; Morgan, Feng and Whitler, 2017). Nevertheless, this study focuses on the distribution channel strategy, key element to boost international process on inexperienced firms.
The preceding literature has identified four dynamic marketing capabilities to driveinternational processes: a. Networking capability with strategic partners (v.g. Eriksson, Nummela and Saarenketo, 2014; Pham, Monkhouse and Barnes, 2017; Bai and Johanson, 2018); b. Market Orientation Capability ( v.g. Barrales-Molina, Martínez-López and Gázquez-Abad, 2014; Evers, 2017; Kachouie, Mavondo and Sands, 2018), c. Market Adaptation to International Markets (v.g. Frasquet, Miquel and Mollá, 2017; Efrat et al.,
184
3
2018) and d. Innovation Capability (v.g. Figueiredo, 2010; Kachouie, Mavondo and Sands, 2018; Kaleka and Morgan, 2019).
With an intensifying worldwide competition, firms are starting to export to diversify business risks, pursue growth chances and increase revenues (Tan and Sousa, 2015). However, Latin-American SMEs lack resources, knowledge, capabilities and experience (Martínez, 2011) to develop international channels and deploy more advanced internationalization processes (Fletcher and Harris, 2012).
The challenge of contemporary firms is to create win-win situations to achieve international partner’s cooperation (Eriksson, Nummela and Saarenketo, 2014b). Facing this challenge, dynamic networking capabilities allow companies to generate non-available knowledge, understand competitors’ strategies and identify international market changes (Heirati, O’Cass and Ngo, 2013) through strategic networks (Ciravegna, Lopez and Kundu, 2013). Most of the companies cooperate with their marketing intermediaries to offer products, since they improve money flows and provide diverse purchasing possibilities to the consumers (Fayaz and Azizinia, 2016). The higher the networking capability, the more effective a company can positively influence and handle their distribution channel members (Pham, Monkhouse and Barnes, 2017).Bianchi, Glavas and Mathews (2017) demonstrate that Networking Capabilities improves international performance in Chilean SMEs. Following the above discussion, we propose the following research question: RQ1. Does the specific dynamic capability of networking with strategic partners boost the internationalization process of Latin-American SMEs through the integration and coordination of the functions of the different members of the distribution channel?
The market-oriented firms seek learning from consumers, competitors and external environment, processing all the information internally and using it to achieve success (Day, 1994). Recent empirical studies demonstrate that market orientation capabilities are important to learning about foreign markets and adjusting products and strategies to satisfy foreign demand (He and Brouthers, 2016). Market orientation influences compromise and confidence perception of different members of the distribution channel and reduce their opportunism (Qu and Zhang, 2015). Nevertheless, there are some literature gaps about the impact of the market orientation capability in the channel integration (Lin, Wang and Yu, 2010). Hunt (2012)suggests analyzing the application of market orientation in theories of distribution channels in future studies. Fuerst & Zettinig (2015) studied four Born Globals located in the city of Medellin (Colombia) that show a lack of market orientation to achieve better performance with international partners and establish marketing channels. Thus: RQ2. Does the specific dynamic capability of market orientation boost the internationalization process of Latin-American SMEs through the integration and coordination of the functions of the different members of the distribution channel?
The use of market knowledge translates into an effective adaptation of strategies to the environment to respond to dynamic markets and their competitors (Bull, Dibrell and Down, 2007; Efrat et al., 2018). The strategy adaptation is an efficient manner to develop and keep the distribution channels (de Carvalho and Sequeira, 2013). Adaptation allows firms to change their structure to respond to their partners and reduce the distance between them to strengthen their business relationships (Lukkari and Parvinen, 2008). In fact, the firms should align their distribution channels with the environment to achieve improvements in their exporting performance (Giovannini and Prencipe, 2017). Brenes, Montoya and Ciravegna (2014) identified that Latin-American Agribusiness are adaptive and flexible in their
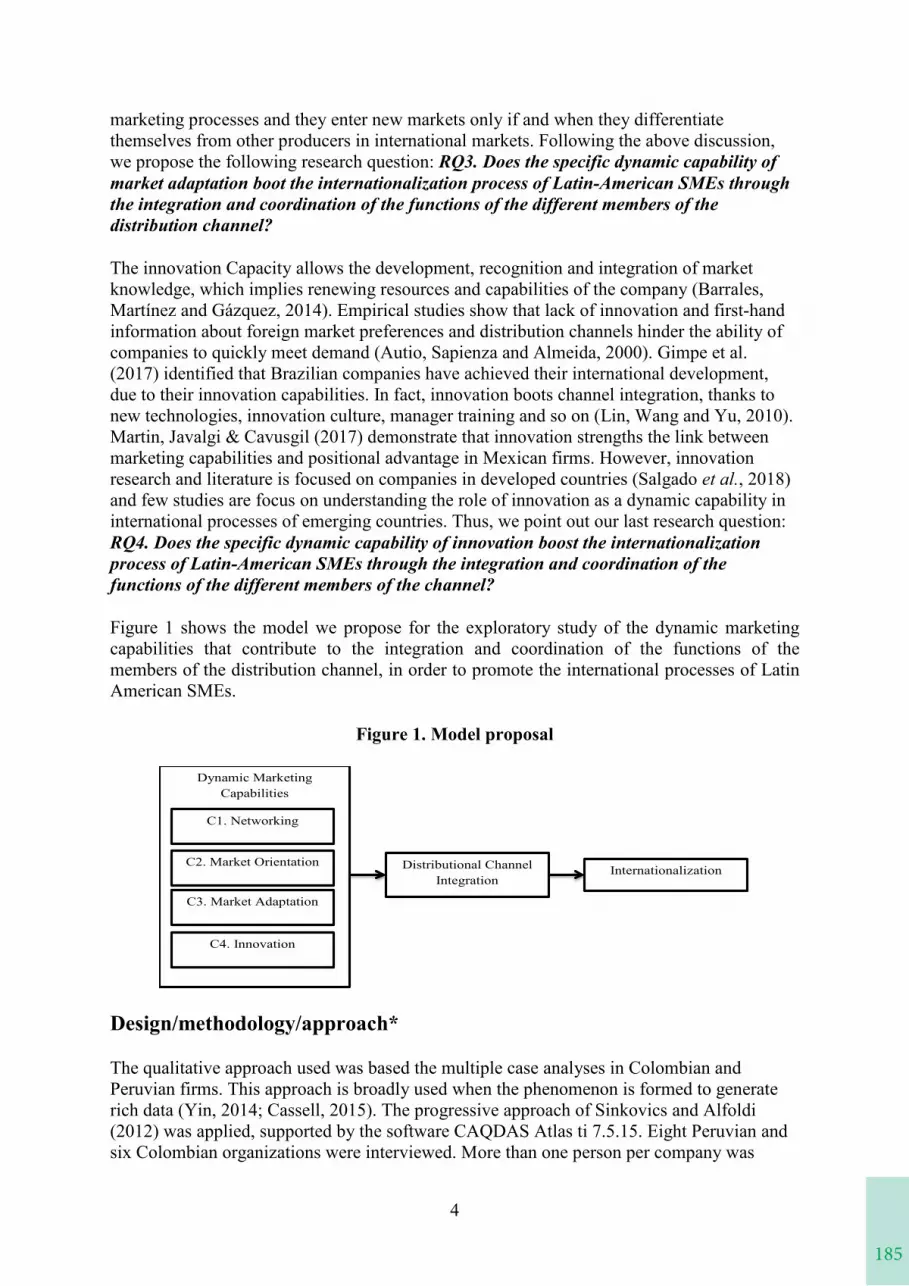
185
3
2018) and d. Innovation Capability (v.g. Figueiredo, 2010; Kachouie, Mavondo and Sands, 2018; Kaleka and Morgan, 2019).
With an intensifying worldwide competition, firms are starting to export to diversify business risks, pursue growth chances and increase revenues (Tan and Sousa, 2015). However, Latin-American SMEs lack resources, knowledge, capabilities and experience (Martínez, 2011) to develop international channels and deploy more advanced internationalization processes (Fletcher and Harris, 2012).
The challenge of contemporary firms is to create win-win situations to achieve international partner’s cooperation (Eriksson, Nummela and Saarenketo, 2014b). Facing this challenge, dynamic networking capabilities allow companies to generate non-available knowledge, understand competitors’ strategies and identify international market changes (Heirati, O’Cass and Ngo, 2013) through strategic networks (Ciravegna, Lopez and Kundu, 2013). Most of the companies cooperate with their marketing intermediaries to offer products, since they improve money flows and provide diverse purchasing possibilities to the consumers (Fayaz and Azizinia, 2016). The higher the networking capability, the more effective a company can positively influence and handle their distribution channel members (Pham, Monkhouse and Barnes, 2017).Bianchi, Glavas and Mathews (2017) demonstrate that Networking Capabilities improves international performance in Chilean SMEs. Following the above discussion, we propose the following research question: RQ1. Does the specific dynamic capability of networking with strategic partners boost the internationalization process of Latin-American SMEs through the integration and coordination of the functions of the different members of the distribution channel?
The market-oriented firms seek learning from consumers, competitors and external environment, processing all the information internally and using it to achieve success (Day, 1994). Recent empirical studies demonstrate that market orientation capabilities are important to learning about foreign markets and adjusting products and strategies to satisfy foreign demand (He and Brouthers, 2016). Market orientation influences compromise and confidence perception of different members of the distribution channel and reduce their opportunism (Qu and Zhang, 2015). Nevertheless, there are some literature gaps about the impact of the market orientation capability in the channel integration (Lin, Wang and Yu, 2010). Hunt (2012)suggests analyzing the application of market orientation in theories of distribution channels in future studies. Fuerst & Zettinig (2015) studied four Born Globals located in the city of Medellin (Colombia) that show a lack of market orientation to achieve better performance with international partners and establish marketing channels. Thus: RQ2. Does the specific dynamic capability of market orientation boost the internationalization process of Latin-American SMEs through the integration and coordination of the functions of the different members of the distribution channel?
The use of market knowledge translates into an effective adaptation of strategies to the environment to respond to dynamic markets and their competitors (Bull, Dibrell and Down, 2007; Efrat et al., 2018). The strategy adaptation is an efficient manner to develop and keep the distribution channels (de Carvalho and Sequeira, 2013). Adaptation allows firms to change their structure to respond to their partners and reduce the distance between them to strengthen their business relationships (Lukkari and Parvinen, 2008). In fact, the firms should align their distribution channels with the environment to achieve improvements in their exporting performance (Giovannini and Prencipe, 2017). Brenes, Montoya and Ciravegna (2014) identified that Latin-American Agribusiness are adaptive and flexible in their
4
marketing processes and they enter new markets only if and when they differentiatethemselves from other producers in international markets. Following the above discussion, we propose the following research question: RQ3. Does the specific dynamic capability ofmarket adaptation boot the internationalization process of Latin-American SMEs through the integration and coordination of the functions of the different members of the distribution channel?
The innovation Capacity allows the development, recognition and integration of market knowledge, which implies renewing resources and capabilities of the company (Barrales, Martínez and Gázquez, 2014). Empirical studies show that lack of innovation and first-hand information about foreign market preferences and distribution channels hinder the ability of companies to quickly meet demand (Autio, Sapienza and Almeida, 2000). Gimpe et al. (2017) identified that Brazilian companies have achieved their international development, due to their innovation capabilities. In fact, innovation boots channel integration, thanks to new technologies, innovation culture, manager training and so on (Lin, Wang and Yu, 2010).Martin, Javalgi & Cavusgil (2017) demonstrate that innovation strengths the link between marketing capabilities and positional advantage in Mexican firms. However, innovation research and literature is focused on companies in developed countries (Salgado et al., 2018)and few studies are focus on understanding the role of innovation as a dynamic capability in international processes of emerging countries. Thus, we point out our last research question:RQ4. Does the specific dynamic capability of innovation boost the internationalization process of Latin-American SMEs through the integration and coordination of the functions of the different members of the channel?
Figure 1 shows the model we propose for the exploratory study of the dynamic marketing capabilities that contribute to the integration and coordination of the functions of the members of the distribution channel, in order to promote the international processes of Latin American SMEs.
Figure 1. Model proposal
Design/methodology/approach*
The qualitative approach used was based the multiple case analyses in Colombian and Peruvian firms. This approach is broadly used when the phenomenon is formed to generate rich data (Yin, 2014; Cassell, 2015). The progressive approach of Sinkovics and Alfoldi (2012) was applied, supported by the software CAQDAS Atlas ti 7.5.15. Eight Peruvian and six Colombian organizations were interviewed. More than one person per company was
Dynamic Marketing Capabilities
C1. Networking
C2. Market Orientation
C3. Market Adaptation
C4. Innovation
Distributional Channel Integration
Internationalization
186
5
interviewed, to overcome the limitations of the qualitative methodology, by obtaining different concepts from the same companies (Eisenhardt and Graebner, 2007). The interviews were made face to face. The selection criteria were based on: companies with initial internationalization processes, small and medium firms enterprises with a maximum of 200 workers; agri-food companies, specialized in the production of coffee, mango and agrochemicals, due to the participation of these economic activities to generate jobs; and companies located in different stages of the international distribution channel. The interviews were recorded and transcribed to avoid the loss or distortion in the collected information. Then, we assigned codes to each company according to their origin (Colombia or Peru) that were included in the CAQDAS Atlas.ti. The content analysis was made according to Hutchinson et al. (2009), where common topics were identified and grouped according to the literature review. The codification doubts were created and solved within the research team. Once the procedure described was performed, the results were analyzed again collectively, according to the steps indicated by Miles, Huberman and Saldaña (1994) and Jurgenson (2005), to generate a point of view of each case and generate final conclusions.
Findings*
The results suggest that the Peruvian and Colombian companies under study show a low level of channel development. According to Blanco, Garza and Garza (2013), designing and selecting distribution channels in emerging countries is extremely challenging. Therefore, we have only found two types of distribution channels in their export operations that are not always available in both countries. The two types of international distribution channels are mainly formed by distributors and agents. In each channel, the dynamic marketing capabilities allow producers and intermediaries to collaborate with each other to generate consistency in product information, to properly service international customer orders, to simultaneously record purchase history and to provide optimal customer service, actions that ultimately drive their internationalization processes.
Original/value*
Previous research has focused on the study of dynamic marketing capabilities and their influence on different distribution channels in the international context of companies from developed countries. However, the dynamic marketing capabilities and their influence on the internationalization of Latin American SMEs in the agro-food sector have not been studiedenough. It is important to explore the issue given the difficulty of these companies in integrating and coordinating the functions of their international distribution channel.
Practical implications
The conceptual model offers managers to identify specific dynamic marketing capabilities that help a Latin-American company thrust its internationalization process and establish synchronized operations and decisions with their international intermediaries. Therefore, these findings are valuable for entrepreneurs and researchers who want to know what types of marketing capabilities are appropriate and how to build, maintain and improve them in Latin-American companies to integrate international channel functions and deploy more advanced internationalization processes.
Research limitations and outlook
187
5
interviewed, to overcome the limitations of the qualitative methodology, by obtaining different concepts from the same companies (Eisenhardt and Graebner, 2007). The interviews were made face to face. The selection criteria were based on: companies with initial internationalization processes, small and medium firms enterprises with a maximum of 200 workers; agri-food companies, specialized in the production of coffee, mango and agrochemicals, due to the participation of these economic activities to generate jobs; and companies located in different stages of the international distribution channel. The interviews were recorded and transcribed to avoid the loss or distortion in the collected information. Then, we assigned codes to each company according to their origin (Colombia or Peru) that were included in the CAQDAS Atlas.ti. The content analysis was made according to Hutchinson et al. (2009), where common topics were identified and grouped according to the literature review. The codification doubts were created and solved within the research team. Once the procedure described was performed, the results were analyzed again collectively, according to the steps indicated by Miles, Huberman and Saldaña (1994) and Jurgenson (2005), to generate a point of view of each case and generate final conclusions.
Findings*
The results suggest that the Peruvian and Colombian companies under study show a low level of channel development. According to Blanco, Garza and Garza (2013), designing and selecting distribution channels in emerging countries is extremely challenging. Therefore, we have only found two types of distribution channels in their export operations that are not always available in both countries. The two types of international distribution channels are mainly formed by distributors and agents. In each channel, the dynamic marketing capabilities allow producers and intermediaries to collaborate with each other to generate consistency in product information, to properly service international customer orders, to simultaneously record purchase history and to provide optimal customer service, actions that ultimately drive their internationalization processes.
Original/value*
Previous research has focused on the study of dynamic marketing capabilities and their influence on different distribution channels in the international context of companies from developed countries. However, the dynamic marketing capabilities and their influence on the internationalization of Latin American SMEs in the agro-food sector have not been studiedenough. It is important to explore the issue given the difficulty of these companies in integrating and coordinating the functions of their international distribution channel.
Practical implications
The conceptual model offers managers to identify specific dynamic marketing capabilities that help a Latin-American company thrust its internationalization process and establish synchronized operations and decisions with their international intermediaries. Therefore, these findings are valuable for entrepreneurs and researchers who want to know what types of marketing capabilities are appropriate and how to build, maintain and improve them in Latin-American companies to integrate international channel functions and deploy more advanced internationalization processes.
Research limitations and outlook
6
This research is a first exploratory study focused on Colombian and Peruvian SMEs that does not seek the generalization of the results. Further research should be focus on other countries and sectors, through a mixed-method approach, in order to analyze the influence of the specific dynamic capabilities of marketing in different internationalization processes. Also, ambidextrousness can be addressed more intensively in future research, to understand how dynamic marketing capabilities simultaneously can improve the internationalization process and then, influence the exporting performance in emerging countries firms.
References
Autio, E., Sapienza, H. J. and Almeida, J. G. (2000) ‘Effects of age at entry, knowledge intensity, and imitability on international growth’, Academy of Management Journal, 43(5), pp. 909–924. doi: 10.2307/1556419.
Bai, W. and Johanson, M. (2018) ‘International opportunity networks’, Industrial Marketing Management. Elsevier, 70(June), pp. 167–179. doi: 10.1016/j.indmarman.2017.07.004.
Barrales, V., Martínez, F. J. and Gázquez, J. C. (2014) ‘Dynamic marketing capabilities: Toward an integrative framework’, International Journal of Management Reviews, 16(4), pp. 397–416. doi: 10.1111/ijmr.12026.
Bengesi, K. M. K. and Roux, I. Le (2014) ‘The Influence of Dimensions of Networking Capability in Small and Medium Enterprise Performance’, International Journal of Business and Social Science, 5(2), pp. 189–200. Available at: www.ijbssnet.com.
Bianchi, C., Glavas, C. and Mathews, S. (2017) ‘SME international performance in Latin America’, Journal of Small Business and Enterprise Development, 24(1), pp. 176–195. doi: 10.1108/jsbed-09-2016-0142.
Brenes, E. R., Montoya, D. and Ciravegna, L. (2014) ‘Differentiation strategies in emerging markets: The case of Latin American agribusinesses’, Journal of Business Research, 67(5), pp. 847–855. doi: 10.1016/j.jbusres.2013.07.003.
Bull, L., Dibrell, C. and Down, J. (2007) ‘Dynamic Strategic Planning: Achieving Strategic Flexibility Through Formalization’, Journal of Business and Management, 1(13), pp. 21–36.
de Carvalho, J. C. and Sequeira, L. (2013) ‘Buyer-seller conflict and cooperation in marketing channels: Port wine distribution’, International Journal of Wine Research, 5(1), pp. 9–21. doi: 10.2147/IJWR.S43152.
Cassell, C. (2015) Qualitative research methods. Oxford bibliographies in management, New York: Oxford University Press.
Ciravegna, L., Lopez, L. and Kundu, S. (2013) ‘The effects of country of origin and networks on internationalization’, 67, pp. 916–923. doi: 10.1016/j.jbusres.2013.07.011.
Day, G. S. (1994) ‘The Capabilities of Market-Driven Organizations’, Journal of Marketing,58(4), pp. 37–52. doi: 10.1177/002224299405800404.
Efrat, K. et al. (2018) ‘Leveraging of Dynamic export capabilities for competitive advantage
188
7
and performance consequences: Evidence from China’, Journal of Business Research.Elsevier, 84(August 2017), pp. 114–124. doi: 10.1016/j.jbusres.2017.11.018.
Eisenhardt, H. and Martin, J. (2000) ‘Strategic Management Journal’, Dynamic Capabilities: What Are They?, 21(10), pp. 1105–1121.
Eisenhardt, K. M. and Graebner, M. E. (2007) ‘Theory building from cases: Opportunities and challenges’, Academy of Management Journal, 50(1), pp. 25–32. doi: 10.5465/AMJ.2007.24160888.
Eriksson, T., Nummela, N. and Saarenketo, S. (2014a) ‘Dynamic capability in a small global factory’, International Business Review, 23(1), pp. 169–180. doi: 10.1016/j.ibusrev.2013.03.007.
Eriksson, T., Nummela, N. and Saarenketo, S. (2014b) ‘Dynamic capability in a small global factory’, International Business Review. Elsevier Ltd, 23(1), pp. 169–180. doi: 10.1016/j.ibusrev.2013.03.007.
Evers, N. (2017) ‘International new ventures in “ low tech ” sectors : a dynamic capabilities perspective’, (August 2011). doi: 10.1108/14626001111155682.
Fayaz, R. and Azizinia, M. (2016) ‘Current challenges in distribution channels of cultural goods and services’, Marketing and Branding Research, 3(1), pp. 75–85. doi: 10.33844/mbr.2016.60219.
Figueiredo, P. N. (2010) ‘Discontinuous innovation capability accumulation in latecomer natural resource-processing firms’, Technological Forecasting and Social Change. Elsevier Inc., 77(7), pp. 1090–1108. doi: 10.1016/j.techfore.2010.02.004.
Fletcher, M. and Harris, S. (2012) Knowledge acquisition for the internationalization of the smaller firm: content and sources.
Francis, D. and Bessant, J. (2005) ‘Targeting innovation and implications for capability development’, 25, pp. 171–183. doi: 10.1016/j.technovation.2004.03.004.
Frasquet, M., Miquel, M. J. and Mollá, A. (2017) Complaining at the Store or Through Social Media: The Influence of the Purchase Channel, Satisfaction, and Commitment. doi: 10.1007/978-3-319-59701-0_10.
Fuerst, S. and Zettinig, P. (2015) ‘Knowledge creation dynamics within the international new venture’, European Business Review, 27(2), pp. 182–213. doi: 10.1108/EBR-03-2013-0036.
Gallino, S., Moreno, A. and Stamatopoulos, I. (2014) ‘Channel Integration, Sales Dispersion, and Inventory Management’, Ssrn, (July 2019). doi: 10.2139/ssrn.2494516.
Blanco, E. E., Garza, J., & Garza, J. (2012). ESD Working Paper Series Multichannel Distribution Strategies in Latin America ESD-WP-2012-16 Multichannel Distribution Strategies in Latin America, (June), 10. Retrieved from esd.mit.edu/wps
Giovannini, V. and Prencipe, A. (2017) ‘Are you Culturally Intelligent ? Export Performance
189
7
and performance consequences: Evidence from China’, Journal of Business Research.Elsevier, 84(August 2017), pp. 114–124. doi: 10.1016/j.jbusres.2017.11.018.
Eisenhardt, H. and Martin, J. (2000) ‘Strategic Management Journal’, Dynamic Capabilities: What Are They?, 21(10), pp. 1105–1121.
Eisenhardt, K. M. and Graebner, M. E. (2007) ‘Theory building from cases: Opportunities and challenges’, Academy of Management Journal, 50(1), pp. 25–32. doi: 10.5465/AMJ.2007.24160888.
Eriksson, T., Nummela, N. and Saarenketo, S. (2014a) ‘Dynamic capability in a small global factory’, International Business Review, 23(1), pp. 169–180. doi: 10.1016/j.ibusrev.2013.03.007.
Eriksson, T., Nummela, N. and Saarenketo, S. (2014b) ‘Dynamic capability in a small global factory’, International Business Review. Elsevier Ltd, 23(1), pp. 169–180. doi: 10.1016/j.ibusrev.2013.03.007.
Evers, N. (2017) ‘International new ventures in “ low tech ” sectors : a dynamic capabilities perspective’, (August 2011). doi: 10.1108/14626001111155682.
Fayaz, R. and Azizinia, M. (2016) ‘Current challenges in distribution channels of cultural goods and services’, Marketing and Branding Research, 3(1), pp. 75–85. doi: 10.33844/mbr.2016.60219.
Figueiredo, P. N. (2010) ‘Discontinuous innovation capability accumulation in latecomer natural resource-processing firms’, Technological Forecasting and Social Change. Elsevier Inc., 77(7), pp. 1090–1108. doi: 10.1016/j.techfore.2010.02.004.
Fletcher, M. and Harris, S. (2012) Knowledge acquisition for the internationalization of the smaller firm: content and sources.
Francis, D. and Bessant, J. (2005) ‘Targeting innovation and implications for capability development’, 25, pp. 171–183. doi: 10.1016/j.technovation.2004.03.004.
Frasquet, M., Miquel, M. J. and Mollá, A. (2017) Complaining at the Store or Through Social Media: The Influence of the Purchase Channel, Satisfaction, and Commitment. doi: 10.1007/978-3-319-59701-0_10.
Fuerst, S. and Zettinig, P. (2015) ‘Knowledge creation dynamics within the international new venture’, European Business Review, 27(2), pp. 182–213. doi: 10.1108/EBR-03-2013-0036.
Gallino, S., Moreno, A. and Stamatopoulos, I. (2014) ‘Channel Integration, Sales Dispersion, and Inventory Management’, Ssrn, (July 2019). doi: 10.2139/ssrn.2494516.
Blanco, E. E., Garza, J., & Garza, J. (2012). ESD Working Paper Series Multichannel Distribution Strategies in Latin America ESD-WP-2012-16 Multichannel Distribution Strategies in Latin America, (June), 10. Retrieved from esd.mit.edu/wps
Giovannini, V. and Prencipe, A. (2017) ‘Are you Culturally Intelligent ? Export Performance
8
and Alliance Portfolio Performance of SMEs : A Managerial Perspective’.
He, X. and Brouthers, K. D. (2016) ‘Market orientation and export performance : the moderation of channel and institutional distance’. doi: 10.1108/IMR-09-2015-0194.
Heirati, N., O’Cass, A. and Ngo, L. V. (2013) ‘The contingent value of marketing and social networking capabilities in firm performance’, Journal of Strategic Marketing, 21(1), pp. 82–98. doi: 10.1080/0965254X.2012.742130.
Hoque, M. T. (2017) ‘Dynamic Marketing Capability “Evolving dynamic marketing capability (DMC) and its role on export performance: An empirical study on export-oriented organizations in Bangladesh”’, University of East Anglia, (Dmc), pp. 1–273. Available at: https://ueaeprints.uea.ac.uk/63167/.
Hunt, S. D. (2012) ‘Explaining empirically successful marketing theories : the inductive realist model , approximate truth , and market orientation’, pp. 5–18. doi: 10.1007/s13162-012-0023-8.
Kachouie, R., Mavondo, F. and Sands, S. (2018) Dynamic marketing capabilities view on creating market change, European Journal of Marketing. doi: 10.1108/EJM-10-2016-0588.
Kaleka, A. and Morgan, N. A. (2019) ‘How marketing capabilities and current performance drive strategic intentions in international markets’, Industrial Marketing Management. The Authors, 78, pp. 108–121. doi: 10.1016/j.indmarman.2017.02.001.
Konwar, Z. et al. (2017) ‘Dynamic marketing capabilities, foreign ownership modes, sub-national locations and the performance of foreign affiliates in developing economies’, International Marketing Review, 34(5), pp. 674–704. doi: 10.1108/IMR-01-2016-0004.
Langlois, R., & Robertson, P. (2000). Empresas, mercados y cambio económico: una teoría dinámica de las instituciones empresariales. Anthropos Editorial.
Lin, Y., Wang, Y. and Yu, C. (2010) ‘Int . J . Production Economics Investigating the drivers of the innovation in channel integration and supply chain performance : A strategy orientated perspective’, Intern. Journal of Production Economics. Elsevier, 127(2), pp. 320–332. doi: 10.1016/j.ijpe.2009.08.009.
Lu, Y. et al. (2014) ‘Capabilities as a mediator linking of and the international performance in an emerging economy’, Journal of International Business Studies, 41(3), pp. 419–436.
Lukkari, P. and Parvinen, P. (2008) ‘Pharmaceutical marketing through the customer portfolio: Institutional influence and adaptation’, Industrial Marketing Management. Elsevier Inc., 37(8), pp. 965–976. doi: 10.1016/j.indmarman.2007.08.003.
Martin, S. L., Javalgi, R. G. and Cavusgil, E. (2017) ‘Marketing capabilities, positional advantage, and performance of born global firms: Contingent effect of ambidextrous innovation’, International Business Review. Elsevier Ltd, 26(3), pp. 527–543. doi: 10.1016/j.ibusrev.2016.11.006.
190
9
Martínez, P. (2011) ‘Influencia de la promoción de exportaciones en el proceso del desarrollo exportador de las Pymes. Un estudio de caso.’, Revista científica Pensamiento y Gestión,0(23).
Mora, R. M., & Johnston, W. J. (2018). Needed B2B marketing capabilities : Insights from the USA and emerging Latin America. International Business Review, 27(3), 594–609. https://doi.org/10.1016/j.ibusrev.2017.10.008
Moretta Tartaglione, A. and Formisano, V. (2018) ‘A Dynamic View of Marketing Capabilities for SMEs’ Export Performance’, International Journal of Marketing Studies,10(1), p. 126. doi: 10.5539/ijms.v10n1p126.
Morgan, N. A. (2012) ‘Marketing and business performance’, (July 2011), pp. 102–119. doi: 10.1007/s11747-011-0279-9.
Morgan, N. A., Feng, H. and Whitler, K. A. (2017) ‘Marketing Capabilities in International Marketing’, Journal of International Marketing, 26(1), pp. 61–95. doi: 10.1509/jim.17.0056.
Morgan, N. A., Katsikeas, C. S. and Vorhies, D. W. (2012) ‘Export marketing strategy implementation, export marketing capabilities, and export venture performance’, Journal of the Academy of Marketing Science, 40(2), pp. 271–289. doi: 10.1007/s11747-011-0275-0.
Pham, T. S. H., Monkhouse, L. Le and Barnes, B. R. (2017) ‘The influence of relational capability and marketing capabilities on the export performance of emerging market firms’, International Marketing Review, 34(5), pp. 606–628. doi: 10.1108/IMR-07-2014-0235.
Qu, R. and Zhang, Z. (2015) ‘Market orientation and business performance in MNC foreign subsidiaries — Moderating effects of integration and responsiveness’, Journal of Business Research. Elsevier Inc., 68(5), pp. 919–924. doi: 10.1016/j.jbusres.2014.09.018.
Rambocas, M. et al. (2015) ‘Direct or indirect channel structures. evaluating the impact of channel governance structure on export performance’, International Business Review, 24(1), pp. 124–132. doi: 10.1016/j.ibusrev.2014.07.002.
Ripollés, M. and Blesa, A. (2012) ‘International new ventures as “ small multinationals”: The importance of marketing capabilities’, Journal of World Business, 47(2), pp. 277–287. doi: 10.1016/j.jwb.2011.04.015.
Saghiri, S. et al. (2017) ‘Toward a three-dimensional framework for omni-channel’, Journal of Business Research. Elsevier, 77(June 2016), pp. 53–67. doi: 10.1016/j.jbusres.2017.03.025.
Salgado, E. G. et al. (2018) ‘New product development in small and medium-sized technology based companies: A multiple case study’, Acta Scientiarum - Technology,40(2005), pp. 1–11. doi: 10.4025/actascitechnol.v40i1.35242.
Schoemaker, P. J. H., Heaton, S. and Teece, D. (2018) ‘Innovation, dynamic capabilities, and leadership’, California Management Review, 61(1), pp. 15–42. doi: 10.1177/0008125618790246.
10
Sinkovics, R. R. and Alfoldi, E. (2012) ‘Progressive focusing and trustworthiness in qualitative research.’, Management International Review, 52(6), pp. 817–845.
Song, M., Di Benedetto, C. A. and Nason, R. W. (2007) ‘Capabilities and financial performance: The moderating effect of strategic type’, Journal of the Academy of MarketingScience, 35(1), pp. 18–34. doi: 10.1007/s11747-006-0005-1.
Tan, Q. and Sousa, C. M. P. (2015) ‘Leveraging marketing capabilities into competitive advantage and export performance’, International Marketing Review, 32(1), pp. 78–102. doi: 10.1108/IMR-12-2013-0279.
Teece, D. J. (2012) ‘Dynamic Capabilities: Routines versus Entrepreneurial Action’, Journal of Management Studies, 49(8), pp. 1395–1401. doi: 10.1111/j.1467-6486.2012.01080.x.
Theoharakis, V., Angelis, Y. and Batsakis, G. (2019) ‘Architectural marketing capabilities of exporting ventures: The contingent effect of the distributor’, International Marketing Review,36(6), pp. 1026–1041. doi: 10.1108/IMR-02-2019-0081.
Weerawardena, J. et al. (2007) ‘Conceptualizing accelerated internationalization in the born global firm: A dynamic capabilities perspective’, Journal of World Business, 42(3), pp. 294–306. doi: 10.1016/j.jwb.2007.04.004.
Wu, J. (2013). Intern . J . of Research in Marketing Marketing capabilities , institutional development , and the performance of emerging market fi rms : A multinational study. International Journal of Research in Marketing, 30(1), 36–45. https://doi.org/10.1016/j.ijresmar.2012.07.001
Yin, R. (2014) Case study research and applications: Design and methods. Sage publications.
Zhou, L., Wu, A. and Barnes, B. R. (2012) ‘The Effects of Early Internationalization on Performance Outcomes in Young International Ventures: The Mediating Role of Marketing Capabilities’, Journal of International Marketing, 20(4), pp. 25–45. doi: 10.1509/jim.12.0076.
Keywords*
Internationalization, dynamic marketing capabilities, Channel Integration
191
9
Martínez, P. (2011) ‘Influencia de la promoción de exportaciones en el proceso del desarrollo exportador de las Pymes. Un estudio de caso.’, Revista científica Pensamiento y Gestión,0(23).
Mora, R. M., & Johnston, W. J. (2018). Needed B2B marketing capabilities : Insights from the USA and emerging Latin America. International Business Review, 27(3), 594–609. https://doi.org/10.1016/j.ibusrev.2017.10.008
Moretta Tartaglione, A. and Formisano, V. (2018) ‘A Dynamic View of Marketing Capabilities for SMEs’ Export Performance’, International Journal of Marketing Studies,10(1), p. 126. doi: 10.5539/ijms.v10n1p126.
Morgan, N. A. (2012) ‘Marketing and business performance’, (July 2011), pp. 102–119. doi: 10.1007/s11747-011-0279-9.
Morgan, N. A., Feng, H. and Whitler, K. A. (2017) ‘Marketing Capabilities in International Marketing’, Journal of International Marketing, 26(1), pp. 61–95. doi: 10.1509/jim.17.0056.
Morgan, N. A., Katsikeas, C. S. and Vorhies, D. W. (2012) ‘Export marketing strategy implementation, export marketing capabilities, and export venture performance’, Journal of the Academy of Marketing Science, 40(2), pp. 271–289. doi: 10.1007/s11747-011-0275-0.
Pham, T. S. H., Monkhouse, L. Le and Barnes, B. R. (2017) ‘The influence of relational capability and marketing capabilities on the export performance of emerging market firms’, International Marketing Review, 34(5), pp. 606–628. doi: 10.1108/IMR-07-2014-0235.
Qu, R. and Zhang, Z. (2015) ‘Market orientation and business performance in MNC foreign subsidiaries — Moderating effects of integration and responsiveness’, Journal of Business Research. Elsevier Inc., 68(5), pp. 919–924. doi: 10.1016/j.jbusres.2014.09.018.
Rambocas, M. et al. (2015) ‘Direct or indirect channel structures. evaluating the impact of channel governance structure on export performance’, International Business Review, 24(1), pp. 124–132. doi: 10.1016/j.ibusrev.2014.07.002.
Ripollés, M. and Blesa, A. (2012) ‘International new ventures as “ small multinationals”: The importance of marketing capabilities’, Journal of World Business, 47(2), pp. 277–287. doi: 10.1016/j.jwb.2011.04.015.
Saghiri, S. et al. (2017) ‘Toward a three-dimensional framework for omni-channel’, Journal of Business Research. Elsevier, 77(June 2016), pp. 53–67. doi: 10.1016/j.jbusres.2017.03.025.
Salgado, E. G. et al. (2018) ‘New product development in small and medium-sized technology based companies: A multiple case study’, Acta Scientiarum - Technology,40(2005), pp. 1–11. doi: 10.4025/actascitechnol.v40i1.35242.
Schoemaker, P. J. H., Heaton, S. and Teece, D. (2018) ‘Innovation, dynamic capabilities, and leadership’, California Management Review, 61(1), pp. 15–42. doi: 10.1177/0008125618790246.
10
Sinkovics, R. R. and Alfoldi, E. (2012) ‘Progressive focusing and trustworthiness in qualitative research.’, Management International Review, 52(6), pp. 817–845.
Song, M., Di Benedetto, C. A. and Nason, R. W. (2007) ‘Capabilities and financial performance: The moderating effect of strategic type’, Journal of the Academy of MarketingScience, 35(1), pp. 18–34. doi: 10.1007/s11747-006-0005-1.
Tan, Q. and Sousa, C. M. P. (2015) ‘Leveraging marketing capabilities into competitive advantage and export performance’, International Marketing Review, 32(1), pp. 78–102. doi: 10.1108/IMR-12-2013-0279.
Teece, D. J. (2012) ‘Dynamic Capabilities: Routines versus Entrepreneurial Action’, Journal of Management Studies, 49(8), pp. 1395–1401. doi: 10.1111/j.1467-6486.2012.01080.x.
Theoharakis, V., Angelis, Y. and Batsakis, G. (2019) ‘Architectural marketing capabilities of exporting ventures: The contingent effect of the distributor’, International Marketing Review,36(6), pp. 1026–1041. doi: 10.1108/IMR-02-2019-0081.
Weerawardena, J. et al. (2007) ‘Conceptualizing accelerated internationalization in the born global firm: A dynamic capabilities perspective’, Journal of World Business, 42(3), pp. 294–306. doi: 10.1016/j.jwb.2007.04.004.
Wu, J. (2013). Intern . J . of Research in Marketing Marketing capabilities , institutional development , and the performance of emerging market fi rms : A multinational study. International Journal of Research in Marketing, 30(1), 36–45. https://doi.org/10.1016/j.ijresmar.2012.07.001
Yin, R. (2014) Case study research and applications: Design and methods. Sage publications.
Zhou, L., Wu, A. and Barnes, B. R. (2012) ‘The Effects of Early Internationalization on Performance Outcomes in Young International Ventures: The Mediating Role of Marketing Capabilities’, Journal of International Marketing, 20(4), pp. 25–45. doi: 10.1509/jim.12.0076.
Keywords*
Internationalization, dynamic marketing capabilities, Channel Integration
192
“THE COMPLEMENTARITY OF ONLINE RETAILERS’ PAYMENT, DELIVERY AND RETURN SERVICES”
Carin Rehncrona (Lund University)
The purpose of this paper is to investigate online retailers’ service offering in terms of payment, delivery and returns. Data from 204 online retailers in Sweden were collected on their payment options, delivery and return policy and average transaction value. This data was analysed with descriptive statistics, correlation and logit regressions with average marginal effects to determine differences in the generosity of retailers’ online service offering. This study finds that retailers tend to offer an “all or nothing service”, meaning that retailers that take on a high cost by offering a service also offers additional more costly services, for instance American Express, free delivery and returns. Research on payment methods, delivery and returns are scarce in combination. This study considers these different service points that makes up a large part of online retailers service offer.
193
“THE COMPLEMENTARITY OF ONLINE RETAILERS’ PAYMENT, DELIVERY AND RETURN SERVICES”
The purpose of this paper is to investigate online retailers’ service offering in terms of payment, delivery and returns. Data from 204 online retailers in Sweden were collected on their payment options, delivery and return policy and average transaction value. This data was analysed with descriptive statistics, correlation and logit regressions with average marginal effects to determine differences in the generosity of retailers’ online service offering. This study finds that retailers tend to offer an “all or nothing service”, meaning that retailers that take on a high cost by offering a service also offers additional more costly services, for instance American Express, free delivery and returns. Research on payment methods, delivery and returns are scarce in combination. This study considers these different service points that makes up a large part of online retailers service offer.
“THE REALITIES OF PRICING IN ONLINE FASHION RETAILING”
Steve Wood (University of Surrey)Iain Watson (University of Surrey)Christoph Teller (Johannes Kepler University Linz)
Purpose: First, we critically examine contemporary pricing challenges online and omni-channel fashion retailers face as they seek to develop data-driven and responsive organisations. Second, we conceptualise practical management strategies for addressing shortfalls and identify avenues for empirical research.
Methodology: We conducted 55 interviews with executives representing five leading international online fashion retailers.
Findings: A gulf between the online pricing practices observed and academic marketing research is identified deepening our understanding of data driven pricing in a digital environment. We find no evidence of Value-Based Pricing–rather, pricing practices embedded within a portfolio of organisational routines and silos, a focus on Buy-in-Margin (BIM), and alignment with competitor pricing and historical pricing. International pricing tended to be set on the home market price complemented by an uplift. Processes for managing markdowns also varied substantially between and within retail firms−from highly responsive to bureaucratic and rule-driven. Online price visibility further served to constrain ability to adapt price.
Value: We conceptualise strategies for addressing deficiencies in online retail pricing practice. These include a need for consistency in incentives between actors in the price setting and management process, an openness to new data sources and departure from established routines, and clarity over the link between price/range architecture and rules concerning price management. For the academic discipline of retail marketing, there is the need for a research agenda that extends to pricing practices and the organisational context of the online retail firm.
194
THE OMNI-CHANNEL RETAILING CAPABILITIES WHEEL:EXPLORING DYNAMIC CAPABILITIES OF SPECIALIST RETAILERS IN GERMANY
Bastian MrutzekFaculty 7 – Business Sciences
University of Bremen, Bremen, [email protected]
Purpose:
In this study, I examined dynamic capabilities to manage omni-channel retailing. Since, the introduction of the smartphone and the possibility to buy products everywhere, at any time and from which retailer the customer wants to buy from, strategies to counteract the diverging customer behavior are key to retain competitive advantages and a superior firm performance. Considering the retailing sector as a highly dynamic environment with altering conditions, rapidly evolving new market trends and changing customer need, companies have to adapt. Retailing companies do not only have to adapt, they need to adjust their product portfolio and improve their service level, they also must offer different touchpoints to the customer, which can be used simultaneously and switched seamlessly. Within the concept of omni-channel retailing, touchpoints are those elements that guarantee access to products as well as bi-directional communication, whereby they also can be defined as channels. Omni-channel touchpoints thus enabling the utilization of the advantages of physical stores and the quality of online shopping with the improved information level. Even more, in the terms of the omni-channel retailing concept, these touchpoints should be connected, so that the customer is able to switch between these touchpoints boundlessly. For example, the customer is shopping in an offline store, but his favorized trousers is not available in his size. The staff of the offline store then should be able to order the right size of trousers in the online shop and send this product directly to this customer, whereby the online and offline channel will be connected. With offering such omni-channel retailing services the companies are guaranteeing an improved shopping experience for the customer as well as customer needs can be fulfilled easier. But in order to adopt, implement and manage such omni-channel retailing operations, companies need resources and capabilities. In the following, the paper is focusing on capabilities, which are divided into ordinary and dynamic capabilities. Hence, the paper is following the research question, which sets of dynamic and ordinary capabilities can be identified, that are important to implement and manage omni-channel retailing? Moreover, the further research intends to narrow the focus by exploring selected dynamic capabilities of small and medium enterprises (SMEs) operating as a specialist retailer in Germany. Therefore, I interviewed six experts, who are operating in leading positions in their specialist retailing companies, which was guided by the following research question: Which dynamic omni-channel retailing capabilities are important for SME specialist retailers?
Design/methodology/approach:
Within this paper I follow the notions of Teece (2014) to identify sets of dynamic and ordinary capabilities. This advanced approach of capabilities bases on the dynamic capabilities view (DCV) of Teece et al. (1997). This DCV approach is applied in order to separate capabilities into dynamic and ordinary capabilities. Especially in the highly dynamic business environment of retailing, the differentiated view on dynamic and ordinary capabilities is useful. Ordinary capabilities on the one side are characterized as basic operative
195
competences to manage daily operations properly. Dynamic capabilities on the other side are capabilities, which are sensing, seizing and transforming opportunities and threats. Moreover, they lead to a change in ordinary capabilities and the resource base to foster improved firm performances and competitive advantages (Laaksonen and Peltoniemi, 2018). The authors are reasoning the approach of focusing on capabilities by characterizing omni-channel retailing as a service innovation following the notion of Hertog et al. (2010). They introduced the six-dimensional model of service innovations. Their definition of service innovations is that it is a new service experience or service solution that includes one of the following features: new service concept, new customer interaction, new value system or business partners, new revenue model, new organizational or technological service delivery system. Omni-channel retailing as a concept includes several of these dimensions. For example, the simultaneous usage of different touchpoints or the creation of new communications channels for the customer. Therefore, they are argumenting that companies that want to establish such a service innovation need capabilities regarding technology, personnel, organization and culture. On this basis, I conduct a content-based literature analysis. The analysis is structured as the systematic review published by Denyer and Tranfield (2009). The conduction of the literature analysis uses the guidance of Denyer and Tranfield (2009) with their proposed four categories of the question formulation (1), locating studies (2), study selection and evaluation(3) as well as analysis and synthesis (4). The formulated question is named in the first section. The location of studies is conducted with the database of Scopus due to its large set of peer-reviewed literature and within a time period of ten years. The process of paper selection and evaluation reduces the number of articles from 153 articles to 63 articles, which are used in the following analysis and synthesis. Within the last step, a consolidation approach of the 63 articles is realized, whereby similar findings of the literature review are merged. Therefore, the outcome is more profound and the descriptive synthesis results in a development of aconceptual model to identify and assign capabilities, which are important for implementing and managing the concept of omni-channel retailing. Additionally, to gather insights in the field of dynamic capabilities related to omni-channel retailing, interviews with experts are conducted. In this research study and related to the second research question, experts are defined as persons in manager positions of SME specialist retailers. In total, 45 SMEs in the greater Bremen area were contacted, out of which six accepted the interview request. The companies interconnect that all of them have less than 20 employees, they are operating in the B2C retailing sector and can be characterized as specialist retailers. I conduct semi-structured and guideline-based interviews. The guideline for the interviews is based on the results of the previous conducted literature analysis. The topics of the interviews are focusing solely on dynamic capabilities constructs, which are gained through the literature analysis. Therefore, this study is narrowing down the object of investigation and increases the validity. Thestructure of this method is based on the qualitative content analysis of Mayring (2010). To gain better insights from the expert interviews, the approach of Mayring (2010) is combined with aspects of the qualitative content analysis of Kuckartz (2012). From the approach of Kuckartz (2012) the category building and category-based analysis is added to the main approach of this study to better combine the results of the literature review with the expert interviews. The interviews are recorded, a transcript is made and then coded by following a coding guide. The coding guide subdivides into the different dynamic capabilities found in the literature analysis and therefore, refers directly to the results of the previous method. The interviews, category development and coding are always executed by two persons as well asdocumented, by what the objectivity and reliability is given at any point of the qualitative approach. This approach was made possible through the cooperation with student assistants,which are studying in this field of research, whereby they are familiar with the content and also already gained experience in executing expert interviews.
196
Findings:
The findings provide a conceptual model for omni-channel retailing capabilities, where capabilities are separated into dynamic and ordinary capabilities. With the literature analysis Iidentified a set of eight capabilities in total. Two capabilities are by definition ordinary capabilities and six capabilities were identified as dynamic capabilities. Every of these eight capabilities are constructs, which are including several of different variables. Each variable is a specific capability found in the literature and therefore, they can be directly linked to one or several academic articles. The two ordinary capability constructs include the provision of assortments in every channel and forecasting of requirements regarding both the customer and the market. (availability, implementation) The six dynamic capability constructs refer to e.g. reacting initiatively on market shifts, implementing innovative technologies for the creation of unique selling points, transparency policy among all channels, utilization of customer-generated content, providing digital assistants or switching to cloud services for further use. (supply chain management, innovativeness, omnichannel environment, customer interaction, integration & coordination, customer/market understanding) For the interviews of the experts a focus on the six dynamic capability constructs was applied. The interviews gathered insights into opportunities and threats of dynamic capabilities in the field of SME specialist retailing companies. The service quality is a superior aspect of specialist retailers and is the most prominent feature named by the retailers. An ongoing adaption to customer needs and the possibility to get advices from these companies is of the utmost importance. Therefore, omni-channel retailers need to sensitize their staff to strengthen customer satisfaction and increase customer loyalty. An important capability is also the dynamic change and adaption of selling points on customer demands. Moreover, the SME specialist retailers are aware of the powerful tool of bi-directional communication through social-media channels to gain insights.Another aspect, which is mentioned to be important, is the implementation of various customer touchpoints and by that the enhancement of transparency among all these touchpoints and communication channels. Within the construct of integration & coordination, the importance of an efficient information management system with flexible customization possibilities are necessary in order to fulfil customer expectations. A highly important capability is the harmonization competence, where online and offline offers are synchronized and cross-channel interactions are easy to realize. All of these aspects are opportunities and threats at the same time, due to a lack of personnel and budget of SMEs. Whereby high potential aspects of digitalization are not implemented a lot within the study, for example the usage of technical assistants or all-encompassing information systems.
Originality/value:
To my knowledge, the literature analysis on dynamic and ordinary capabilities on the field of omni-channel retailing with the expert interviews in the field of specialist retailers from SMEs is one of the first studies with this research focus. The resulting omni-channel retailing capabilities wheel helps to identify needed capabilities in order to foster omni-channel retailing strategies and therefore the firm performance and competitive advantages. Moreover,the particular segment of SME specialist retailers is an interesting area of research due to their restricted possibilities and their need to focus on efficient capabilities and competences. With this in mind, the research adds important insights in both the general omni-channel retailing research field as well as specific business areas of specialist retailers and their needs. This kind of retailers need certain dynamic capabilities more than other dynamic capabilities due to restrictions, wherefore they need to concentrate on specific capabilities. In particular, customer preferences, high-level customer understanding as well as the provision of knowledge is key. The findings provide management implications for SMEs operating in the
197
field of specialist retailers. The supply chain management has not only to be efficient, moreover, it should be partly independent, which can be achieved through in-house production or different suppliers for their warehouses to supply customers from different channels. An open internal information management is necessary for the management of multiple channels simultaneously. The touchpoints have to be chosen in respect to the company’s philosophy and the corporate identity to increase the acceptance of customers. Self-reflection is seen as an important factor for reacting on shifts. Besides self-reflection and a good analysis of the market as well as forecasting, an agile assortment is highly important for SME specialist retailers to sustain competitive advantages. The capability for bi-directional communication is highlighted as the key for SME retailers in specialist industries. Omni-channel retailing with its combination of different offline and online channels is fostering this aspect. Therefore, capabilities to adapt to these areas are necessary. This first explorative approach to gain insights into needed dynamic capabilities of specialist retailers isthe beginning of the research agenda to empirically validate the model created from the literature analysis. Further discussions of research possibilities are necessary and will be part of the future research.
References:
Denyer, D. and Tranfield, D. (2009): “Producing a systematic review”, The Sage handbook of organizational research methods. pp. 671–689.Hertog, P. den, van der Aa, W., de Jong, M.W. (2010), “Capabilities for managing serviceinnovation: towards a conceptual framework”, Journal of Service Management, 21, 4, pp.490–514.Kuckartz, U. (2012), “Qualitative Inhaltsanalyse. Methoden, Praxis, Computerunterstützung”,Beltz Juventa, Weinheim.Laaksonen, O. and Peltoniemi, M. (2018): “The Essence of Dynamic Capabilities and their Measurement”, International Journal of Management Reviews, 20, 2, pp. 184–205.Mayring, P. (2010), „Qualitative inhaltsanalyse“, In: Handbuch qualitative Forschung in der Psychologie, Springer, pp. 601–613.Teece, D.J. (2014), “The foundations of enterprise performance: Dynamic and ordinary capabilities in an (economic) theory of firms”, Academy of management perspectives, 28, 4,pp. 328–352.Teece, D.J., Pisano, G., Shuen, A. (1997), “Dynamic capabilities and strategic management”,Strategic Management Journal, 18, 7, pp. 509–533.
Keywords: Service innovations, omni-channel retailing, omni-channel retailing capabilities wheel, specialist retailers, small and medium enterprise.
198
1
UNDERSTANDING ONLINE CHANNEL ADOPTION: A CUSTOMER SEGMENTATION ANALYSIS
Marta FrasquetFaculty of Economics,
University of Valencia, València (Spain)
email: [email protected]
Marco Ieva1
Department of Economics and Management,
University of Parma, Parma (Italy)
email: [email protected]
Cristina Ziliani Department of Economics and Management,
University of Parma, Parma (Italy)
email: [email protected]
IntroductionThe introduction of a new online channel can be challenging for brick-and-mortar retailers, which have invested a lot in the physical store network and struggle with the risk that online sales will cannibalize store sales (Biyalogorsky and Naik, 2003; Hernant and Rosengren, 2017). However, they have increasingly taken this step with the aim to drive higher sales, acquire new customers and, more importantly, to foster customer satisfaction and loyalty in the long-term. Introducing an online channel has been reported to display different effects in terms of customers’ purchasing patterns. Shoppers migrating to the online channel were found to buyless from the company in the long term (Ansari et al., 2008). However, Hernant and Rosengren (2017) reported that shoppers adopting the online channel increased overall frequency but with a minimum net effect on sales, due to a reduction in the average amount spent, hence proving the existence of cannibalization of offline sales. As far as loyalty is concerned, multichannel shoppers have been found more loyal, possibly because the augmented service levels with channel availability increases satisfaction (Wallace et el, 2004). On the other hand, in a segmentation study, Konuş et al. (2008) found that the most loyal segment was those “store-focused”. Given the reported diversity in customer behaviour stemming from the adoption of the online channel, more research is needed in this field, and we believe that a segmentation approach could uncover different purchase behaviour patterns. This, in turn, would provide a valuable contribution to investigate multichannel shopping behaviour (Ansari et al., 2008). Segmenting customers is an effective practice to gain a richer understanding of multichannel shoppers (Neslin et al., 2006; Verhoef et al., 2015). Several studies have segmented shoppers based on channel usage or preference (e.g. Nakano and Kondo, 2018; Peker et al., 2017). However, only a few of them have employed behavioural data that allow for the inclusion of
1 Corresponding author: [email protected]. Department of Economics and Management, University of Parma, Via Kennedy 6, 43125, Parma (Italy), +39 0521 902099.
199
1
UNDERSTANDING ONLINE CHANNEL ADOPTION: A CUSTOMER SEGMENTATION ANALYSIS
Marta FrasquetFaculty of Economics,
University of Valencia, València (Spain)
email: [email protected]
Marco Ieva1
Department of Economics and Management,
University of Parma, Parma (Italy)
email: [email protected]
Cristina Ziliani Department of Economics and Management,
University of Parma, Parma (Italy)
email: [email protected]
IntroductionThe introduction of a new online channel can be challenging for brick-and-mortar retailers, which have invested a lot in the physical store network and struggle with the risk that online sales will cannibalize store sales (Biyalogorsky and Naik, 2003; Hernant and Rosengren, 2017). However, they have increasingly taken this step with the aim to drive higher sales, acquire new customers and, more importantly, to foster customer satisfaction and loyalty in the long-term. Introducing an online channel has been reported to display different effects in terms of customers’ purchasing patterns. Shoppers migrating to the online channel were found to buyless from the company in the long term (Ansari et al., 2008). However, Hernant and Rosengren (2017) reported that shoppers adopting the online channel increased overall frequency but with a minimum net effect on sales, due to a reduction in the average amount spent, hence proving the existence of cannibalization of offline sales. As far as loyalty is concerned, multichannel shoppers have been found more loyal, possibly because the augmented service levels with channel availability increases satisfaction (Wallace et el, 2004). On the other hand, in a segmentation study, Konuş et al. (2008) found that the most loyal segment was those “store-focused”. Given the reported diversity in customer behaviour stemming from the adoption of the online channel, more research is needed in this field, and we believe that a segmentation approach could uncover different purchase behaviour patterns. This, in turn, would provide a valuable contribution to investigate multichannel shopping behaviour (Ansari et al., 2008). Segmenting customers is an effective practice to gain a richer understanding of multichannel shoppers (Neslin et al., 2006; Verhoef et al., 2015). Several studies have segmented shoppers based on channel usage or preference (e.g. Nakano and Kondo, 2018; Peker et al., 2017). However, only a few of them have employed behavioural data that allow for the inclusion of
1 Corresponding author: [email protected]. Department of Economics and Management, University of Parma, Via Kennedy 6, 43125, Parma (Italy), +39 0521 902099.
2
behavioral patterns preceding online channel introduction, and that account for the dynamics of new channel adoption and cross-channel behavior (Hernant and Rosengren, 2017).
PurposeThe main aim of this study is to analyse the purchase behaviour heterogeneity of multichannelgrocery shoppers when the online channel is introduced. The analysis is performed through an RFM model extended to include variables that specify the shopper’s behaviour across channels (online vs. in-store).
Theoretical FrameworkA central question in multichannel literature is whether multichannel customers are more valuable than their single-channel counterparts. Multichannel shopping has been associated with higher customer spending (Ansari et al., 2008; Breugelmans and Campo, 2016; Kumar et al., 2018; Kushwaha and Shankar, 2013), frequency of visit (Ansari et al., 2008; A. Kumar et al., 2018) and profitability (A. Kumar et al., 2018; Montaguti et al., 2016). However, there is also evidence that multichannel customers are not always the best customers; Kushwaha andShankar (2013) obtained that for low-risk purchases, offline customers provided higher monetary value; in a replication study, Cambra-Fierro et al. (2016) found that full multichannel banking customers are not the most profitable. There are fewer papers that have segmented multichannel shoppers based on behavioural data. Thomas and Sullivan (2005) is an early example of such studies. Their work considered three channels employed by a retailer (catalog, Internet, brick-and-mortar store), and used price, product category, distance to store, and marketing communication as covariates. Li et al. (2015), using panel data in the health and natural products industry, segment customers based on the speed of adoption of online channels using as covariates purchase amount and channel chosen before and after the online channel introduction. Last but not least, Nakano and Kondo (2018) undertake a segmentation analysis of multichannel shoppers combining behavioural scanner panel data with survey data. This approach allows them to consider, in addition to purchase frequency and monetary value, psychographic characteristics (e.g. innovativeness, shopping enjoyment), and information channels. All these studies are multi-category and not specifically focused on grocery retailing.
The present study focuses on segmenting adopters of an online channel, namely home delivery, based on RFM variables computed separately for their purchase behaviour in the offline and online channels. Moreover, this work relates offline purchase behaviour prior to the introduction of the online channel with subsequent multichannel purchase behaviour, thus identifying how past behaviour might change after the adoption of a new online channel (Peker et al., 2017). The RFM model is a segmentation approach that was developed by Hughes (1996) to distinguish key customers in a large customer base with reference to three variables related to customer purchase behaviour: recency, frequency, and monetary. Specifically, recency is expressed as the number of days occurring since the last purchase; frequency is described as the number of purchases or visits occurring in a given time period; monetary is the amount spent within a certain time period (Cheng and Chen, 2009). Recency, frequency and monetary are measured at the customer level.
Based on these premises, our study seeks to answer the following research questions:
1. Which multichannel customer segments emerge following the introduction of the online channel by an offline retailer?
200
3
2. How does customers’ previous offline purchase behavior predict multichannel behavioural heterogeneity?
Design/methodology/approach*The present study employs data related to a grocery retailer operating in Spain that introduced the online channel with home delivery service in 2016. The dataset was extracted from this company’s loyalty card system spanning from 18 months before and after the launch of the home delivery service: 1151 customers - who have adopted the online channel and have been active in the period before and after the adoption of the home delivery - were selected. A Latent Class Analysis on recency, frequency, and monetary was conducted to identify customer segments that display different offline and online purchase behaviours before and after adopting the home delivery. We employed the “one-step approach”, in which indicators and covariates simultaneously contribute to identify subgroups of customers. The indicators were variables computed after the introduction of the online channel, namely, recency, frequency, and monetary referred to online and offline purchases separately. The covariates were recency, frequency, and monetary referred to offline purchases before the introduction of the home delivery, in addition to age and gender. The employed procedure ran the algorithm with 100 random sets and 500 iterations for each number of clusters. The Bayesian Information Criterion (BIC) index, together with interpretability were used as criteria to select the appropriate number of clusters across several solutions evaluated.
FindingsThe seven-cluster solution was deemed to be appropriate according to the abovementioned criteria. After selecting the seven-cluster solution, the significance of each model indicator was assessed by means of the Wald test. The associated p-value was lower than 0.05, thus showing that the employed indicators could be considered as discriminating among the identified segments (Vermunt and Magidson, 2005). Concerning the covariates, the following variableswere reported to significantly influence the probability of belonging to the latent segments: recency, frequency, and monetary prior the introduction of the online channel, and age. To summarize, different customer segments emerge:
- offline shoppers displaying high or low amount spent offline that adopt the home delivery but then stop using it after four or five purchases (cluster 2 and cluster 3);
- average spending shoppers that after adopting the home delivery shift purchases from the offline channel to the online channel significantly (cluster 4);
- average spending customers that adopted the online channel and keep using both channels (cluster 1);
- top spending customers that use both channels, preferring the online channel (cluster 6) or the offline channel (cluster 5);
- shoppers that after the adoption of the home delivery churn regardless of the channel used (cluster 7);
201
3
2. How does customers’ previous offline purchase behavior predict multichannel behavioural heterogeneity?
Design/methodology/approach*The present study employs data related to a grocery retailer operating in Spain that introduced the online channel with home delivery service in 2016. The dataset was extracted from this company’s loyalty card system spanning from 18 months before and after the launch of the home delivery service: 1151 customers - who have adopted the online channel and have been active in the period before and after the adoption of the home delivery - were selected. A Latent Class Analysis on recency, frequency, and monetary was conducted to identify customer segments that display different offline and online purchase behaviours before and after adopting the home delivery. We employed the “one-step approach”, in which indicators and covariates simultaneously contribute to identify subgroups of customers. The indicators were variables computed after the introduction of the online channel, namely, recency, frequency, and monetary referred to online and offline purchases separately. The covariates were recency, frequency, and monetary referred to offline purchases before the introduction of the home delivery, in addition to age and gender. The employed procedure ran the algorithm with 100 random sets and 500 iterations for each number of clusters. The Bayesian Information Criterion (BIC) index, together with interpretability were used as criteria to select the appropriate number of clusters across several solutions evaluated.
FindingsThe seven-cluster solution was deemed to be appropriate according to the abovementioned criteria. After selecting the seven-cluster solution, the significance of each model indicator was assessed by means of the Wald test. The associated p-value was lower than 0.05, thus showing that the employed indicators could be considered as discriminating among the identified segments (Vermunt and Magidson, 2005). Concerning the covariates, the following variableswere reported to significantly influence the probability of belonging to the latent segments: recency, frequency, and monetary prior the introduction of the online channel, and age. To summarize, different customer segments emerge:
- offline shoppers displaying high or low amount spent offline that adopt the home delivery but then stop using it after four or five purchases (cluster 2 and cluster 3);
- average spending shoppers that after adopting the home delivery shift purchases from the offline channel to the online channel significantly (cluster 4);
- average spending customers that adopted the online channel and keep using both channels (cluster 1);
- top spending customers that use both channels, preferring the online channel (cluster 6) or the offline channel (cluster 5);
- shoppers that after the adoption of the home delivery churn regardless of the channel used (cluster 7);
4
Finally, we also notice that specific customer segments display a higher amount spent after adopting the home delivery (clusters 1, 2, 5 and 6), in contrast to other segments that reveal the opposite behaviour (clusters 3, 4 and 7)2.
Original/valueOur results provide the following contributions. First, we contribute to the body of literature on multichannel consumer behavior by displaying that adopters should not be considered as a homogenous group of customers displaying a similar behavior, as suggested by Verhoef et al.,(2015). Second, we show, by implementing the RFM approach in a multichannel setting, that it is possible to identify how customers adopt and keep using a new channel. Third, this study adds to the literature on the effects of online channel adoption by analyzing the changes in spending, frequency, and the chances of cannibalization occurring with the introduction of home delivery.
Practical implicationsRetailers could benefit from the results of the present study to support the evaluation of: i) the performance, ii) appropriate CRM strategies, and iii) adequate planning and investment in the new channels. Results provide evidence on what retailers could expect in terms of heterogeneous customer response when introducing the home delivery service. Our study points to the need for retailers to develop CRM strategies aimed at different multichannel customer segments. First and foremost, to retain top spenders that use both channels. They can provide incentives, such as free delivery or discounts to increase the amount spent online and to reduce the likelihood of adopters discontinuing their use of the online channel. Non-monetary incentives such as “status” recognition of these top spenders by means of exclusive services or by telling their stories on the retailer’s media outlets may also be employed, which could also attract other customers to try the new channel. Secondly, retailers are urged to carefully monitor those adopters that start to display high recency across both online and offline channels, as this is a hint of likely churn. Finally, findings on the relationship between offline purchase behaviour before the home delivery launch and subsequent purchase behaviour can support retailers in predicting to what extent their customer base might display multichannel behavior if they introduce the home delivery option. These estimates will prove valuable in the planning of scalable capacity for the new channel, and allocation of investment over time.
Research limitations and outlookOur analysis only includes adopters of the home delivery service. Further research could examine how adopters and non-adopters differ in their purchase behaviour after the launch of the new online channel. No psychographic variables were measured in the present study.Psychographic variables could help to explain the reasons behind the displayed behavioural patterns.
ReferencesAnsari, A., Mela, C. F., and Neslin, S. A. (2008). Customer Channel Migration. Journal of
Marketing Research, XLV(February), 60–76.
2 Tables displaying validation indexes and results for the identified clusters are available upon request
202
5
Biyalogorsky, E., and Naik, P. (2003). Clicks and mortar: The effect of on-line activities on off-line sales. Marketing Letters, 14(1), 21–32. https://doi.org/10.1023/A:1022854017292
Breugelmans, E., and Campo, K. (2016). Cross-Channel Effects of Price Promotions: An Empirical Analysis of the Multi-Channel Grocery Retail Sector. Journal of Retailing,92(3), 333–351. https://doi.org/10.1016/j.jretai.2016.02.003.
Cambra-Fierro, J., Kamakura, W. A., Melero-Polo, I., and Sese, F. J. (2016). “Are multichannel customers really more valuable? An analysis of banking services.” International Journal of Research in Marketing, 33(1), 208–212. https://doi.org/10.1016/j.ijresmar.2015.12.007
Cheng, C. H., and Chen, Y. S. (2009). Classifying the segmentation of customer value via RFM model and RS theory. Expert Systems with Applications, 36(3 PART 1), 4176–4184.https://doi.org/10.1016/j.eswa.2008.04.003.
Hernant, M., and Rosengren, S. (2017). Now what? Evaluating the sales effects of introducing an online store. Journal of Retailing and Consumer Services, 39(June), 305–313. https://doi.org/10.1016/j.jretconser.2017.08.010.
Hughes, A. M. (1996). Boosting response with RFM. Marketing Tools, 3(3), 4–10. Retrieved from http://eds.b.ebscohost.com/eds/detail/detail?sid=4e801eda-4576-4696-81d7-a54e6591d96e%40sessionmgr104andvid=10andhid=108andbdata=JnNpdGU9ZWRzLWxpdmUmc2NvcGU9c2l0ZQ%3D%3D#AN=9605081861anddb=heh
Konuş, U., Verhoef, P., and Neslin, S. (2008). Multichannel Shopper Segments and Their Covariates☆. Journal of Retailing, 84(4), 398–413.https://doi.org/10.1016/j.jretai.2008.09.002.
Kumar, A., Bezawada, R., and Trivedi, M. (2018). The Effects of Multichannel Shopping on Customer Spending, Customer Visit Frequency, and Customer Profitability. Journal of the Association for Consumer Research, 3(3), 294–311. https://doi.org/10.1086/698876
Kushwaha, T., and Shankar, V. (2013). Are Multichannel Customers Really More Valuable? The Moderating Role of Product Category Characteristics. Journal of Marketing, 77(July), 67–85.
Li, J., Konuş, U., Pauwels, K., and Langerak, F. (2015). The Hare and the Tortoise: Do Earlier Adopters of Online Channels Purchase More? Journal of Retailing, 91(2), 289–308. https://doi.org/10.1016/j.jretai.2015.01.001.
Montaguti, E., Neslin, S., and Valentini, S. (2016). Do Marketing Campaigns Produce Multichannel Buying and More Profitable Customers? A Field Experiment. Marketing Science, 35(2), 201–217. https://doi.org/10.2139/ssrn.2141824.
Nakano, S., and Kondo, F. N. (2018). Customer segmentation with purchase channels and media touchpoints using single source panel data. Journal of Retailing and Consumer Services,
Neslin, S. A., Grewal, D., Leghorn, R., Shankar, V., Teerling, M. L., Thomas, J. S., andVerhoef, P. C. (2006). Challenges and Opportunities in Multichannel Customer Management. Journal of Service Research, 9(2), 95–112. https://doi.org/10.1177/1094670506293559
Peker, S., Kocyigit, A., and Eren, P. E. (2017). LRFMP model for customer segmentation in the grocery retail industry: a case study. Marketing Intelligence and Planning, 35(4), 544–559.
Thomas, J. S., and Sullivan, U. Y. (2005). Managing marketing communications with multichannel customers. Journal of Marketing, 69(4), 774–787.
Verhoef, P. C., Kannan, P. K., and Inman, J. J. (2015). From Multi-Channel Retailing to Omni-Channel Retailing Introduction to the Special Issue on Multi-Channel Retailing. Journal of Retailing, 91(2), 174–181. https://doi.org/10.1016/j.jretai.2015.02.005
Vermunt, J. K., and Magidson, J. (2005). Latent Gold 4.0 User’s Guide.

203
5
Biyalogorsky, E., and Naik, P. (2003). Clicks and mortar: The effect of on-line activities on off-line sales. Marketing Letters, 14(1), 21–32. https://doi.org/10.1023/A:1022854017292
Breugelmans, E., and Campo, K. (2016). Cross-Channel Effects of Price Promotions: An Empirical Analysis of the Multi-Channel Grocery Retail Sector. Journal of Retailing,92(3), 333–351. https://doi.org/10.1016/j.jretai.2016.02.003.
Cambra-Fierro, J., Kamakura, W. A., Melero-Polo, I., and Sese, F. J. (2016). “Are multichannel customers really more valuable? An analysis of banking services.” International Journal of Research in Marketing, 33(1), 208–212. https://doi.org/10.1016/j.ijresmar.2015.12.007
Cheng, C. H., and Chen, Y. S. (2009). Classifying the segmentation of customer value via RFM model and RS theory. Expert Systems with Applications, 36(3 PART 1), 4176–4184.https://doi.org/10.1016/j.eswa.2008.04.003.
Hernant, M., and Rosengren, S. (2017). Now what? Evaluating the sales effects of introducing an online store. Journal of Retailing and Consumer Services, 39(June), 305–313. https://doi.org/10.1016/j.jretconser.2017.08.010.
Hughes, A. M. (1996). Boosting response with RFM. Marketing Tools, 3(3), 4–10. Retrieved from http://eds.b.ebscohost.com/eds/detail/detail?sid=4e801eda-4576-4696-81d7-a54e6591d96e%40sessionmgr104andvid=10andhid=108andbdata=JnNpdGU9ZWRzLWxpdmUmc2NvcGU9c2l0ZQ%3D%3D#AN=9605081861anddb=heh
Konuş, U., Verhoef, P., and Neslin, S. (2008). Multichannel Shopper Segments and Their Covariates☆. Journal of Retailing, 84(4), 398–413.https://doi.org/10.1016/j.jretai.2008.09.002.
Kumar, A., Bezawada, R., and Trivedi, M. (2018). The Effects of Multichannel Shopping on Customer Spending, Customer Visit Frequency, and Customer Profitability. Journal of the Association for Consumer Research, 3(3), 294–311. https://doi.org/10.1086/698876
Kushwaha, T., and Shankar, V. (2013). Are Multichannel Customers Really More Valuable? The Moderating Role of Product Category Characteristics. Journal of Marketing, 77(July), 67–85.
Li, J., Konuş, U., Pauwels, K., and Langerak, F. (2015). The Hare and the Tortoise: Do Earlier Adopters of Online Channels Purchase More? Journal of Retailing, 91(2), 289–308. https://doi.org/10.1016/j.jretai.2015.01.001.
Montaguti, E., Neslin, S., and Valentini, S. (2016). Do Marketing Campaigns Produce Multichannel Buying and More Profitable Customers? A Field Experiment. Marketing Science, 35(2), 201–217. https://doi.org/10.2139/ssrn.2141824.
Nakano, S., and Kondo, F. N. (2018). Customer segmentation with purchase channels and media touchpoints using single source panel data. Journal of Retailing and Consumer Services,
Neslin, S. A., Grewal, D., Leghorn, R., Shankar, V., Teerling, M. L., Thomas, J. S., andVerhoef, P. C. (2006). Challenges and Opportunities in Multichannel Customer Management. Journal of Service Research, 9(2), 95–112. https://doi.org/10.1177/1094670506293559
Peker, S., Kocyigit, A., and Eren, P. E. (2017). LRFMP model for customer segmentation in the grocery retail industry: a case study. Marketing Intelligence and Planning, 35(4), 544–559.
Thomas, J. S., and Sullivan, U. Y. (2005). Managing marketing communications with multichannel customers. Journal of Marketing, 69(4), 774–787.
Verhoef, P. C., Kannan, P. K., and Inman, J. J. (2015). From Multi-Channel Retailing to Omni-Channel Retailing Introduction to the Special Issue on Multi-Channel Retailing. Journal of Retailing, 91(2), 174–181. https://doi.org/10.1016/j.jretai.2015.02.005
Vermunt, J. K., and Magidson, J. (2005). Latent Gold 4.0 User’s Guide.
6
Wallace, D. W., Giese, J. L., and Johnson, J. L. (2004). Customer retailer loyalty in the context of multiple channel strategies. Journal of Retailing, 80, 249–263.https://doi.org/10.1016/j.jretai.2004.10.002.
Keywords*Multichannel retailing, home delivery, channel adoption, RFM, Latent Class Analysis
AcknowledgementThis work was financed by the Spanish Ministry of Science, Innovation and Universities, Spanish State Research Agency (Research Grant ECO 2017-83051-R).
204
1
A CLASSIFICATION OF POS-SERVICE-TECHNOLOGIES
Tobias Roeding Sascha Steinmann Gerhard WagnerChair for Marketing and Retailing Chair for Marketing and Retailing Chair for Marketing and
Retailing University of Siegen University of Siegen University of [email protected] [email protected]
Frank Hälsig Hanna Schramm-KleinChair for Marketing Chair for Marketing and Retailing HTW Saar (Saarbrücken) University of [email protected] [email protected]
Abstract
The optimal integration of technologies at the PoS (Point of Sale) is widely discussed. Recent literature points out that in today’s stationary retailing it is the augmentation of the interpersonal interaction between customer and frontline-employee through innovative technologies, enhancing the service encounter. Depending on customers’ individual and situational service needs as well as apprehensions, the use and the value of a certain technology within the service encounter differs. Hereby, our research focuses on a systematic comparison of six as relevant identified PoS-service-technologies regarding customer’s perception of usefulness-, ease of use-, entertainment- and data-security-related factors.
By conducting an online survey (N=620), we create three clusters, indicating three categories: operation-focused-, information-focused- and enjoyment-focused-technology-infused PoS-service. Based on WebQual and ServQual and referring to uses and gratifications as well as privacy calculus theory, we derive meaningful theoretical implications, but moreover practical strategies for retailers.
In detail, our findings confirm elements of U&G theory in which the intuitive operation with technology-infused PoS-service leads to a form of gratification of the customer. However, by providing innovative, enjoyable new technologies at the PoS for new types of connected technology-infused PoS-service, retailers can enhance the shopping experience and make stationary shopping even more convenient. In fact, we could demonstrate that the evaluation of technology-infused stationary services differs significantly across technologies at the PoS, stationary retailers should provide adequate PoS-service-technologies that customers utilize for stationary activities. Moreover, the findings indicate that retailers should consider the relevant attributes and capabilities of a PoS-service-technology to design a positive service environment.
Keywords: Retailing, PoS-Technologies, Interpersonal-Service
205
1
A CLASSIFICATION OF POS-SERVICE-TECHNOLOGIES
Tobias Roeding Sascha Steinmann Gerhard WagnerChair for Marketing and Retailing Chair for Marketing and Retailing Chair for Marketing and
Retailing University of Siegen University of Siegen University of [email protected] [email protected]
Frank Hälsig Hanna Schramm-KleinChair for Marketing Chair for Marketing and Retailing HTW Saar (Saarbrücken) University of [email protected] [email protected]
Abstract
The optimal integration of technologies at the PoS (Point of Sale) is widely discussed. Recent literature points out that in today’s stationary retailing it is the augmentation of the interpersonal interaction between customer and frontline-employee through innovative technologies, enhancing the service encounter. Depending on customers’ individual and situational service needs as well as apprehensions, the use and the value of a certain technology within the service encounter differs. Hereby, our research focuses on a systematic comparison of six as relevant identified PoS-service-technologies regarding customer’s perception of usefulness-, ease of use-, entertainment- and data-security-related factors.
By conducting an online survey (N=620), we create three clusters, indicating three categories: operation-focused-, information-focused- and enjoyment-focused-technology-infused PoS-service. Based on WebQual and ServQual and referring to uses and gratifications as well as privacy calculus theory, we derive meaningful theoretical implications, but moreover practical strategies for retailers.
In detail, our findings confirm elements of U&G theory in which the intuitive operation with technology-infused PoS-service leads to a form of gratification of the customer. However, by providing innovative, enjoyable new technologies at the PoS for new types of connected technology-infused PoS-service, retailers can enhance the shopping experience and make stationary shopping even more convenient. In fact, we could demonstrate that the evaluation of technology-infused stationary services differs significantly across technologies at the PoS, stationary retailers should provide adequate PoS-service-technologies that customers utilize for stationary activities. Moreover, the findings indicate that retailers should consider the relevant attributes and capabilities of a PoS-service-technology to design a positive service environment.
Keywords: Retailing, PoS-Technologies, Interpersonal-Service
2
IntroductionSocial interactions between frontline-employees and customers are bound to happen in brick-and-mortar stores (Yoo 2017). However, the infusion of technological assistance influences today’s PoS (Point of Sale)-service increasingly by enhancing the information base of the customer though an improved access to (potentially) beneficial information (e.g., Rust andHuang 2014). Depending on customers’ individual and situational service needs as well as apprehensions, the use and the value of a certain technology within the service encounter differs (e.g., de Keyser et al. 2019). Research focusing on the PoS-service-technologies highlights numerous positive aspects, as an improvement of the overall customer service, frontline-employees’ adaptability, customers’ perceived customization, as well as a positive impact on customer delight (e.g., Ahearne et al. 2008; Ahearne and Rapp 2010; Bitner et al. 2000).
In order to systemise the different potential of PoS-technologies, Grewal et al. (2020) suggested a model, emphasizing social presence and convenience as central factors. However, in traditional PoS-services social presence includes the immediate interaction between two parties (e.g., Biocca and Novak, 2001), social presence can be triggered just by the signalling of humanity, warmth, or human involvement (van Doorn et al., 2017). Consequently, even technologies are able to create this feeling (Grewal et al., 2020). However, we still see an essential advantage within the presence of a human service employee, as the frontline interaction between the customer and the service-counterpart is important when it comes to the question which and how certain technologies should be infused (e.g., Parasuraman, 2000).
However, an empirical proof of a PoS-service-technology-classification is missing in academic and practical discussion. Especially for the stationary retailer it is important to understand, which PoS-service-technology is (or are) the most promising with respect to the individual product or the store atmosphere, the concerns or interests of the customers as well as companies’ monetary benefit. This is based on the fact, that in-store technologies create not just opportunities but bring also challenges for retailers (Piotrowicz and Cuthbertson 2014). In this manner, our study emphasizes the specific relevance of PoS-service-technologies with respect to their individual characteristic and extends the existing knowledge in this field by classifying the multiple PoS-service-technologies. Consequently, we offer a heuristic and empirically proofed categorization of PoS-service-technologies from customers’ perceptionby following two research questions:
RQ1: How can PoS-service-technologies be classified, considering a general focus on the social interaction between frontline employee and customer?
RQ2: To what extent are usefulness, ease of use, entertainment and data-security decisive for customers’ perception of PoS-service-technologies as well as its integration for practice?
PurposeWithin a first analysis, we identify six PoS-service-technologies to be the most relevant ones in context of usability within a human-based PoS-service. As we identify these PoS-service-technologies of having the most potential to support the PoS-service interaction, we use the term PoS-service-technologies. Because our study is aiming for a categorization of technology-infused PoS-services, we concentrate on the specific differences with regard to the current literature (e.g., Grewal et al., 2020; van Doorn et al., 2017). Our categorization is further based on Loiacono et al.’s (2007) approach of WebQual and refers to ServQual by
206
3
Parasuraman et al. (1988) as well as to the uses and gratifications (U&G) theory and to Privacy Calculus (PC) theory.
By proposing the research question, how customers’ general perception of different types of PoS-service-technologies can be classified, our research contributes to the knowledge of Services Marketing in several ways. We identify three independent clusters of technology-infused PoS-services: (A) Operation-focused technology-infused PoS-service; (B) Information-focused technology-infused PoS-service; (C) Enjoyment-focused technology-infused PoS-service. On the base of these findings, we offer useful knowledge for further investigation of stationary consumer behaviour (e.g., the design of experiments, surveys, or modelling approaches). Moreover, we deliver important implications for marketing practice decisions (e.g., regarding formulating strategies on a smart infusion of PoS-service-technologies within stationary retail environment respectively the PoS-service, by focusing as well on the customer as on the frontline-employee).
Conceptual frameworkWe draw on the uses and gratifications theory, introduced by Blumler and Katz (1974). U&G predicts that a specific medium will be used as a means to satisfy customer’s wants or interests and is therefore applicable for the use of a PoS-technology (Keeling et al. 2007). As a theoretical framework, U&G aids in understanding and explaining the motivations for using new media and technology through a “how and why” approach (Kim and Lee 2013). For example, gratification can be obtained from technological attributes (e.g., information quality) or from familiarity with technological utilization (e.g., intuitive operation). U&G, however, allows the incorporation of the possibility that users might have alternatives to satisfy their needs, and it is capable of helping to identify why consumers comprehend with a specific technology, for instance within a service interaction at the PoS.
As additional influences we draw on the extension of technology acceptance model (TAM) (Davis 1986), implementing for instance enjoyment or trust (Ha and Stoel 2008). Hereby we refer to the WebQual-instrument by Loiacono et al. (2007), as we focus on digital-influences and build on the ServQual-instrument by Parasuraman et al. (1988), as the interaction between customer and frontline employee is of relevance. In detail, WebQual focus specifically on websites’ interface. However, following Loiacono et al., (2007) this approach might be beneficial for new and innovative information technologies used in order to understand customers’ behaviour and perception. This instrument offers a set of scales covering the dimensions: usefulness, ease of use, complementary relationship and entertainment. Moreover, we refer to Laufer et al.’s (1977) theory of Privacy Calculus. It argues that customers’ intuition to weight between the risk and benefit is transferable to the context of customers’ willingness to share personal data. As in today’s retail environment, access to customers’ data is seen as a key advantage (Wakefield 2013), every form of interaction, online with a website as well as offline with the frontline-employee, can be seen as a potential data-supply and thereby as a possible security-threat for the customer.
In order to classify the services, we integrated ease of understanding, intuitive operation and relative advantage (all derived from U&G), functional fit-to-task, information quality and tailored information, innovativeness and perceived enjoyment (all derived from WebQual) and data-security attitude (derived from Privacy Calculus).
Design/methodology/approach
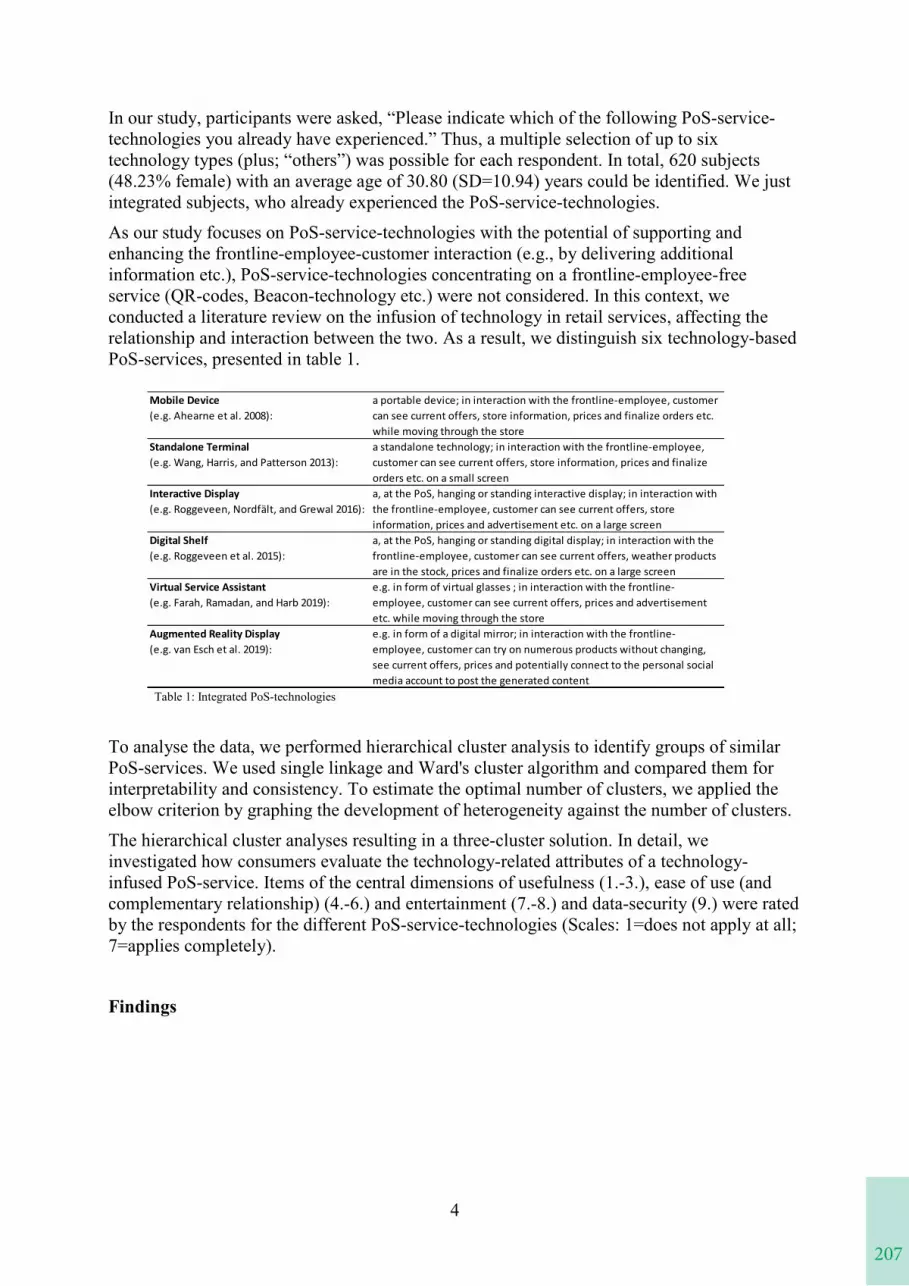
207
3
Parasuraman et al. (1988) as well as to the uses and gratifications (U&G) theory and to Privacy Calculus (PC) theory.
By proposing the research question, how customers’ general perception of different types of PoS-service-technologies can be classified, our research contributes to the knowledge of Services Marketing in several ways. We identify three independent clusters of technology-infused PoS-services: (A) Operation-focused technology-infused PoS-service; (B) Information-focused technology-infused PoS-service; (C) Enjoyment-focused technology-infused PoS-service. On the base of these findings, we offer useful knowledge for further investigation of stationary consumer behaviour (e.g., the design of experiments, surveys, or modelling approaches). Moreover, we deliver important implications for marketing practice decisions (e.g., regarding formulating strategies on a smart infusion of PoS-service-technologies within stationary retail environment respectively the PoS-service, by focusing as well on the customer as on the frontline-employee).
Conceptual frameworkWe draw on the uses and gratifications theory, introduced by Blumler and Katz (1974). U&G predicts that a specific medium will be used as a means to satisfy customer’s wants or interests and is therefore applicable for the use of a PoS-technology (Keeling et al. 2007). As a theoretical framework, U&G aids in understanding and explaining the motivations for using new media and technology through a “how and why” approach (Kim and Lee 2013). For example, gratification can be obtained from technological attributes (e.g., information quality) or from familiarity with technological utilization (e.g., intuitive operation). U&G, however, allows the incorporation of the possibility that users might have alternatives to satisfy their needs, and it is capable of helping to identify why consumers comprehend with a specific technology, for instance within a service interaction at the PoS.
As additional influences we draw on the extension of technology acceptance model (TAM) (Davis 1986), implementing for instance enjoyment or trust (Ha and Stoel 2008). Hereby we refer to the WebQual-instrument by Loiacono et al. (2007), as we focus on digital-influences and build on the ServQual-instrument by Parasuraman et al. (1988), as the interaction between customer and frontline employee is of relevance. In detail, WebQual focus specifically on websites’ interface. However, following Loiacono et al., (2007) this approach might be beneficial for new and innovative information technologies used in order to understand customers’ behaviour and perception. This instrument offers a set of scales covering the dimensions: usefulness, ease of use, complementary relationship and entertainment. Moreover, we refer to Laufer et al.’s (1977) theory of Privacy Calculus. It argues that customers’ intuition to weight between the risk and benefit is transferable to the context of customers’ willingness to share personal data. As in today’s retail environment, access to customers’ data is seen as a key advantage (Wakefield 2013), every form of interaction, online with a website as well as offline with the frontline-employee, can be seen as a potential data-supply and thereby as a possible security-threat for the customer.
In order to classify the services, we integrated ease of understanding, intuitive operation and relative advantage (all derived from U&G), functional fit-to-task, information quality and tailored information, innovativeness and perceived enjoyment (all derived from WebQual) and data-security attitude (derived from Privacy Calculus).
Design/methodology/approach
4
In our study, participants were asked, “Please indicate which of the following PoS-service-technologies you already have experienced.” Thus, a multiple selection of up to six technology types (plus; “others”) was possible for each respondent. In total, 620 subjects (48.23% female) with an average age of 30.80 (SD=10.94) years could be identified. We just integrated subjects, who already experienced the PoS-service-technologies.
As our study focuses on PoS-service-technologies with the potential of supporting and enhancing the frontline-employee-customer interaction (e.g., by delivering additional information etc.), PoS-service-technologies concentrating on a frontline-employee-free service (QR-codes, Beacon-technology etc.) were not considered. In this context, we conducted a literature review on the infusion of technology in retail services, affecting the relationship and interaction between the two. As a result, we distinguish six technology-based PoS-services, presented in table 1.
Table 1: Integrated PoS-technologies
To analyse the data, we performed hierarchical cluster analysis to identify groups of similar PoS-services. We used single linkage and Ward's cluster algorithm and compared them for interpretability and consistency. To estimate the optimal number of clusters, we applied the elbow criterion by graphing the development of heterogeneity against the number of clusters.
The hierarchical cluster analyses resulting in a three-cluster solution. In detail, we investigated how consumers evaluate the technology-related attributes of a technology-infused PoS-service. Items of the central dimensions of usefulness (1.-3.), ease of use (and complementary relationship) (4.-6.) and entertainment (7.-8.) and data-security (9.) were rated by the respondents for the different PoS-service-technologies (Scales: 1=does not apply at all; 7=applies completely).
Findings
Mobile Device (e.g. Ahearne et al. 2008):
a portable device; in interaction with the frontline-employee, customer can see current offers, store information, prices and finalize orders etc. while moving through the store
Standalone Terminal (e.g. Wang, Harris, and Patterson 2013):
a standalone technology; in interaction with the frontline-employee, customer can see current offers, store information, prices and finalize orders etc. on a small screen
Interactive Display (e.g. Roggeveen, Nordfält, and Grewal 2016):
a, at the PoS, hanging or standing interactive display; in interaction with the frontline-employee, customer can see current offers, store information, prices and advertisement etc. on a large screen
Digital Shelf (e.g. Roggeveen et al. 2015):
a, at the PoS, hanging or standing digital display; in interaction with the frontline-employee, customer can see current offers, weather products are in the stock, prices and finalize orders etc. on a large screen
Virtual Service Assistant (e.g. Farah, Ramadan, and Harb 2019):
e.g. in form of virtual glasses ; in interaction with the frontline-employee, customer can see current offers, prices and advertisement etc. while moving through the store
Augmented Reality Display (e.g. van Esch et al. 2019):
e.g. in form of a digital mirror; in interaction with the frontline-employee, customer can try on numerous products without changing, see current offers, prices and potentially connect to the personal social media account to post the generated content
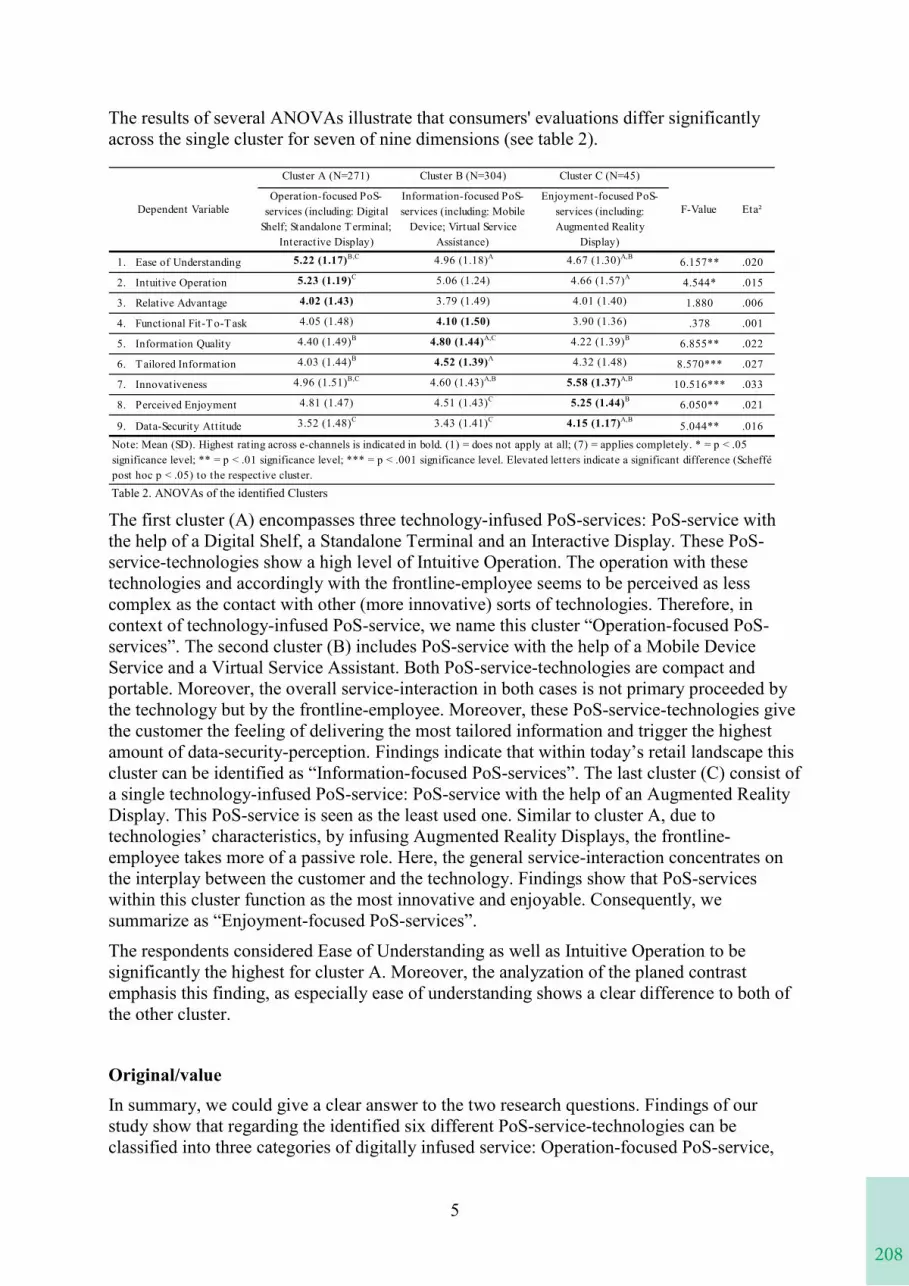
208
5
The results of several ANOVAs illustrate that consumers' evaluations differ significantly across the single cluster for seven of nine dimensions (see table 2).
Table 2. ANOVAs of the identified Clusters
The first cluster (A) encompasses three technology-infused PoS-services: PoS-service with the help of a Digital Shelf, a Standalone Terminal and an Interactive Display. These PoS-service-technologies show a high level of Intuitive Operation. The operation with these technologies and accordingly with the frontline-employee seems to be perceived as less complex as the contact with other (more innovative) sorts of technologies. Therefore, in context of technology-infused PoS-service, we name this cluster “Operation-focused PoS-services”. The second cluster (B) includes PoS-service with the help of a Mobile Device Service and a Virtual Service Assistant. Both PoS-service-technologies are compact and portable. Moreover, the overall service-interaction in both cases is not primary proceeded by the technology but by the frontline-employee. Moreover, these PoS-service-technologies give the customer the feeling of delivering the most tailored information and trigger the highest amount of data-security-perception. Findings indicate that within today’s retail landscape this cluster can be identified as “Information-focused PoS-services”. The last cluster (C) consist of a single technology-infused PoS-service: PoS-service with the help of an Augmented Reality Display. This PoS-service is seen as the least used one. Similar to cluster A, due to technologies’ characteristics, by infusing Augmented Reality Displays, the frontline-employee takes more of a passive role. Here, the general service-interaction concentrates on the interplay between the customer and the technology. Findings show that PoS-services within this cluster function as the most innovative and enjoyable. Consequently, we summarize as “Enjoyment-focused PoS-services”.
The respondents considered Ease of Understanding as well as Intuitive Operation to be significantly the highest for cluster A. Moreover, the analyzation of the planed contrast emphasis this finding, as especially ease of understanding shows a clear difference to both of the other cluster.
Original/valueIn summary, we could give a clear answer to the two research questions. Findings of our study show that regarding the identified six different PoS-service-technologies can be classified into three categories of digitally infused service: Operation-focused PoS-service,
Cluster A (N=271) Cluster B (N=304) Cluster C (N=45)
Operation-focused PoS-services (including: Digital
Shelf; Standalone Terminal; Interactive Display)
Information-focused PoS-services (including: Mobile
Device; Virtual Service Assistance)
Enjoyment-focused PoS-services (including: Augmented Reality
Display)
1. Ease of Understanding 5.22 (1.17)B,C 4.96 (1.18)A 4.67 (1.30)A,B 6.157** .020
2. Intuitive Operation 5.23 (1.19)C 5.06 (1.24) 4.66 (1.57)A 4.544* .015
3. Relative Advantage 4.02 (1.43) 3.79 (1.49) 4.01 (1.40) *1.880* .006
4. Functional Fit-To-Task 4.05 (1.48) 4.10 (1.50) 3.90 (1.36) .378 .001
5. Information Quality 4.40 (1.49)B 4.80 (1.44)A,C 4.22 (1.39)B 6.855** .022
6. Tailored Information 4.03 (1.44)B 4.52 (1.39)A 4.32 (1.48) 8.570*** .027
7. Innovativeness 4.96 (1.51)B,C 4.60 (1.43)A,B 5.58 (1.37)A,B 10.516*** .033
8. Perceived Enjoyment 4.81 (1.47) 4.51 (1.43)C 5.25 (1.44)B 6.050** .021
9. Data-Security Attitude 3.52 (1.48)C 3.43 (1.41)C 4.15 (1.17)A,B5.044** .016
Dependent Variable F-Value Eta²
Note: Mean (SD). Highest rating across e-channels is indicated in bold. (1) = does not apply at all; (7) = applies completely. * = p < .05 significance level; ** = p < .01 significance level; *** = p < .001 significance level. Elevated letters indicate a significant difference (Scheffé post hoc p < .05) to the respective cluster.
209
5
The results of several ANOVAs illustrate that consumers' evaluations differ significantly across the single cluster for seven of nine dimensions (see table 2).
Table 2. ANOVAs of the identified Clusters
The first cluster (A) encompasses three technology-infused PoS-services: PoS-service with the help of a Digital Shelf, a Standalone Terminal and an Interactive Display. These PoS-service-technologies show a high level of Intuitive Operation. The operation with these technologies and accordingly with the frontline-employee seems to be perceived as less complex as the contact with other (more innovative) sorts of technologies. Therefore, in context of technology-infused PoS-service, we name this cluster “Operation-focused PoS-services”. The second cluster (B) includes PoS-service with the help of a Mobile Device Service and a Virtual Service Assistant. Both PoS-service-technologies are compact and portable. Moreover, the overall service-interaction in both cases is not primary proceeded by the technology but by the frontline-employee. Moreover, these PoS-service-technologies give the customer the feeling of delivering the most tailored information and trigger the highest amount of data-security-perception. Findings indicate that within today’s retail landscape this cluster can be identified as “Information-focused PoS-services”. The last cluster (C) consist of a single technology-infused PoS-service: PoS-service with the help of an Augmented Reality Display. This PoS-service is seen as the least used one. Similar to cluster A, due to technologies’ characteristics, by infusing Augmented Reality Displays, the frontline-employee takes more of a passive role. Here, the general service-interaction concentrates on the interplay between the customer and the technology. Findings show that PoS-services within this cluster function as the most innovative and enjoyable. Consequently, we summarize as “Enjoyment-focused PoS-services”.
The respondents considered Ease of Understanding as well as Intuitive Operation to be significantly the highest for cluster A. Moreover, the analyzation of the planed contrast emphasis this finding, as especially ease of understanding shows a clear difference to both of the other cluster.
Original/valueIn summary, we could give a clear answer to the two research questions. Findings of our study show that regarding the identified six different PoS-service-technologies can be classified into three categories of digitally infused service: Operation-focused PoS-service,
Cluster A (N=271) Cluster B (N=304) Cluster C (N=45)
Operation-focused PoS-services (including: Digital
Shelf; Standalone Terminal; Interactive Display)
Information-focused PoS-services (including: Mobile
Device; Virtual Service Assistance)
Enjoyment-focused PoS-services (including: Augmented Reality
Display)
1. Ease of Understanding 5.22 (1.17)B,C 4.96 (1.18)A 4.67 (1.30)A,B 6.157** .020
2. Intuitive Operation 5.23 (1.19)C 5.06 (1.24) 4.66 (1.57)A 4.544* .015
3. Relative Advantage 4.02 (1.43) 3.79 (1.49) 4.01 (1.40) *1.880* .006
4. Functional Fit-To-Task 4.05 (1.48) 4.10 (1.50) 3.90 (1.36) .378 .001
5. Information Quality 4.40 (1.49)B 4.80 (1.44)A,C 4.22 (1.39)B 6.855** .022
6. Tailored Information 4.03 (1.44)B 4.52 (1.39)A 4.32 (1.48) 8.570*** .027
7. Innovativeness 4.96 (1.51)B,C 4.60 (1.43)A,B 5.58 (1.37)A,B 10.516*** .033
8. Perceived Enjoyment 4.81 (1.47) 4.51 (1.43)C 5.25 (1.44)B 6.050** .021
9. Data-Security Attitude 3.52 (1.48)C 3.43 (1.41)C 4.15 (1.17)A,B5.044** .016
Dependent Variable F-Value Eta²
Note: Mean (SD). Highest rating across e-channels is indicated in bold. (1) = does not apply at all; (7) = applies completely. * = p < .05 significance level; ** = p < .01 significance level; *** = p < .001 significance level. Elevated letters indicate a significant difference (Scheffé post hoc p < .05) to the respective cluster.
6
Information-focused PoS-service and Enjoyment-focused PoS-service. Especially retailers’ awareness regarding the associated challenges, the infusion of PoS-service-technologies might bring, need to be understood and considered (Piotrowicz and Cuthbertson 2014). In contrary to the more Intuitive-Operation-focused PoS-services, in which customers seem to appreciate the facile and familiar access to information, Enjoyment-focused PoS-services open a new field. It is interesting, that the included Augmented Reality Display is perceived the most innovate and likewise the most (data-)secure. These findings are in line with Krafft, Arden and Verhoef (2017) emphasizing that privacy concerns as well as information disclosure behaviour can be leveraged by entertainment-related factors.
Practical implicationsOur findings also suggest practical implications both for the introduction and adoption of new technologies at the PoS. Results demonstrate that the evaluation of technology-infused stationary services differs significantly across technologies at the PoS, stationary retailers should provide adequate PoS-service-technologies that customers utilize for stationary activities. Moreover, the findings indicate that retailers should consider the relevant attributes and capabilities of a PoS-service-technology to design a positive service environment that enhances consumers' stationary shopping experiences. Our findings also confirm elements of U&G theory (Blumler and Katz 1974) in which the intuitive operation with technology-infused PoS-service leads to a form of gratification of the customer. However, by providing innovative, enjoyable new technologies at the PoS for new types of connected technology-infused PoS-service, retailers can enhance the shopping experience and make stationary shopping even more convenient.
Research limitations and outlookIn our study, consumer behaviour was investigated based on self-reported experience of PoS-service-technologies and the utilization intentions of customers in the stationary retail environment. Future studies need to extend the data-set especially with respect to customers’ evaluation of different branches and retail formats. It might be interesting to use a perceptual map through a multidimensional scaling (MDS). The input would be a similarity matrix (based on ranking or similarity of objects). As an output a low-dimensional dataset called MDS configuration results hereby. This matrix offers an overview on which and how the respected technologies are linked. In more detail, a property fitting approach might deliverfurther interesting aspects. Moreover, PoS-service-technologies should be compared with respect to customers’ actual shopping behaviour (e.g., purchase intention) to validate the results of our study and to generalize our findings.
ReferencesAhearne, M., Jones, E., Rapp, A., and Mathieu, J., (2008). High touch through high tech: The
impact of salesperson technology usage on sales performance via mediating mechanisms.Management Science, 54 (4), 671-685.
Biocca, F., and Nowak, K. (2001). Plugging your body into the telecommunication system: Mediated embodiment, media interfaces, and social virtual environments. In C. Lin & D. Atkin (Eds.), Communication technology and society (pp. 407–447). Waverly Hill: Hampton Press.
210
7
Blumler, J. G., and Katz, E., (1974). The uses of mass communications: Current perspectives on gratifications research. Beverly Hills, CA: Sage Publications.
Borg, I., and Groenen, P. J. F., (2005). Modern multidimensional scaling: Theory and applications. New York, NY: Springer.
Davis, F. D., (1986). A technology acceptance model for empirically testing new end-user information systems: Theory and results. Cambridge, MA: Massachusetts Institute of Technology, Sloan School of Management.
Farah, M. F., Ramadan, Z. B., and Harb, D. H., (2019). The examination of virtual reality at the intersection of consumer experience, shopping journey and physical retailing. Journal of Retailing and Consumer Services, 48, 136-143.
Dinev, T., McConnell, A. R., and Smith, H. J., (2015). Research commentary—informing privacy research through information systems, psychology, and behavioural economics: thinking outside the “APCO” box. Information Systems Research, 26 (4), 639-655.
Ha, S., and Stoel, L., (2008). Consumer e-shopping acceptance: Antecedents in a technology acceptance model. Journal of Business Research, 62 (5), 565-571.
Hong, W., and Thong, J. Y. L., 2013. Internet privacy concerns: An integrated conceptualization and four empirical studies. MIS Quarterly, 37 (1), 275-298.
Huang, M.-H., and Rust, R. T., 2018. Artificial intelligence in service. Journal of Service Research, 21 (2), 155-172.
Hui, K.-L., Teo, H. H., and Lee, S.-Y. T., (2007). The value of privacy assurance: an exploratory field experiment. MIS Quarterly, 31 (1), 19-33.
Keeling, K., Macaulay, L. A., and McGoldrick, P., (2007). DiTV and e-commerce among disadvantaged community groups. Behaviour & Information Technology, 26 (6), 545-560.
de Keyser, A., Köcher, S., Alkire, L., Verbeeck, C., and Kandampully, J., (2019). Frontline Service Technology-infusion: conceptual archetypes and future research directions. Journal of Service Management, 30 (1), 156-183.
Kim, J., and Lee, K. H. 2013. "Towards a theoretical framework of motivations and interactivity for using IPTV," Journal of Business Research (66:2), pp. 260-264.
Krafft, M., Arden, C., and Verhoef, P., (2017). Permission Marketing and Privacy Concerns—Why Do Customers (Not) Grant Permissions?. Journal of Interactive Marketing (39), 39-54.
Laufer, R. S., and Wolfe, M., (1977). Privacy as a concept and a social issue: A multidimensional developmental theory. Journal of Social Issues, 33 (3), 22-42.
Loiacono, E., Watson, R., and Goodhue, D., (2007). "Webqual: An instrument for consumer evaluation of web sites. International Journal of Electronic Commerce, 11 (3), 51-87.
Muthitcharoen, A., Palvia, P. C., and Grover, V., (2011). Building a model of technology preference: The case of channel choices. Decision Sciences, 42 (1), 205-237.
Padgett, D., and Mulvey, M. S., (2007). Differentiation via technology: Strategic positioning of services following the introduction of disruptive technology. Journal of Retailing, 83 (4), 375-391.
Parasuraman, A., Zeithaml, V. A., and Berry, L. L. (1988). Servqual: A multiple-item scale for measuring consumer perc. Journal of retailing, 64(1), 12.
211
7
Blumler, J. G., and Katz, E., (1974). The uses of mass communications: Current perspectives on gratifications research. Beverly Hills, CA: Sage Publications.
Borg, I., and Groenen, P. J. F., (2005). Modern multidimensional scaling: Theory and applications. New York, NY: Springer.
Davis, F. D., (1986). A technology acceptance model for empirically testing new end-user information systems: Theory and results. Cambridge, MA: Massachusetts Institute of Technology, Sloan School of Management.
Farah, M. F., Ramadan, Z. B., and Harb, D. H., (2019). The examination of virtual reality at the intersection of consumer experience, shopping journey and physical retailing. Journal of Retailing and Consumer Services, 48, 136-143.
Dinev, T., McConnell, A. R., and Smith, H. J., (2015). Research commentary—informing privacy research through information systems, psychology, and behavioural economics: thinking outside the “APCO” box. Information Systems Research, 26 (4), 639-655.
Ha, S., and Stoel, L., (2008). Consumer e-shopping acceptance: Antecedents in a technology acceptance model. Journal of Business Research, 62 (5), 565-571.
Hong, W., and Thong, J. Y. L., 2013. Internet privacy concerns: An integrated conceptualization and four empirical studies. MIS Quarterly, 37 (1), 275-298.
Huang, M.-H., and Rust, R. T., 2018. Artificial intelligence in service. Journal of Service Research, 21 (2), 155-172.
Hui, K.-L., Teo, H. H., and Lee, S.-Y. T., (2007). The value of privacy assurance: an exploratory field experiment. MIS Quarterly, 31 (1), 19-33.
Keeling, K., Macaulay, L. A., and McGoldrick, P., (2007). DiTV and e-commerce among disadvantaged community groups. Behaviour & Information Technology, 26 (6), 545-560.
de Keyser, A., Köcher, S., Alkire, L., Verbeeck, C., and Kandampully, J., (2019). Frontline Service Technology-infusion: conceptual archetypes and future research directions. Journal of Service Management, 30 (1), 156-183.
Kim, J., and Lee, K. H. 2013. "Towards a theoretical framework of motivations and interactivity for using IPTV," Journal of Business Research (66:2), pp. 260-264.
Krafft, M., Arden, C., and Verhoef, P., (2017). Permission Marketing and Privacy Concerns—Why Do Customers (Not) Grant Permissions?. Journal of Interactive Marketing (39), 39-54.
Laufer, R. S., and Wolfe, M., (1977). Privacy as a concept and a social issue: A multidimensional developmental theory. Journal of Social Issues, 33 (3), 22-42.
Loiacono, E., Watson, R., and Goodhue, D., (2007). "Webqual: An instrument for consumer evaluation of web sites. International Journal of Electronic Commerce, 11 (3), 51-87.
Muthitcharoen, A., Palvia, P. C., and Grover, V., (2011). Building a model of technology preference: The case of channel choices. Decision Sciences, 42 (1), 205-237.
Padgett, D., and Mulvey, M. S., (2007). Differentiation via technology: Strategic positioning of services following the introduction of disruptive technology. Journal of Retailing, 83 (4), 375-391.
Parasuraman, A., Zeithaml, V. A., and Berry, L. L. (1988). Servqual: A multiple-item scale for measuring consumer perc. Journal of retailing, 64(1), 12.
8
Parasuraman, A. (2000). Technology Readiness Index (TRI): a multiple-item scale to measure readiness to embrace new technologies”. Journal of Service Research, Vol. 2 No. 4, pp. 307-320.
Piotrowicz, W., and Cuthbertson, R., (2014). Introduction to the Special Issue Information Technology in Retail: Toward Omnichannel Retailing. International Journal of Electronic Commerce, 18 (4), 5-16.
Rust, R. T., and Huang, M.-H., (2014). The service revolution and the transformation of marketing science. Marketing Science, 33 (2), 206-221.
Roggeveen, A. L., Grewal, D., Townsend, C., and Krishnan, R., (2015). The impact of dynamic presentation format on consumer preferences for hedonic products and services. Journal of Marketing, 79 (6), 34-49.
Roggeveen, A. L., Nordfält, J., and Grewal, D., (2016). Do digital displays enhance sales? Role of retail format and message content. Journal of Retailing, 92 (1), 122-131.
van Esch, P., Black, J. S., and Ferolie, J., (2019). Marketing AI recruitment: the next phase in job application and selection. Computers in Human Behaviour, 90, 215-222.
Wang, C., Harris, J., and Patterson, P., (2013). The roles of habit, self-efficacy, and satisfaction in driving continued use of self-service technologies: a longitudinal study. Journal of Service Research, 16 (3), 400-414.
Wang, J., (2012). Geometric structure of high-dimensional data and dimensionality reduction.Berlin, Heidelberg: Springer.
Yoo, J., (2017). Customer power and frontline-employee voice behaviour. European Journal of Marketing, 51 (1), 238-256.
KeywordsRetailing, PoS-Service-Technologies, Classification, Interpersonal-Service, Customer Behaviour
212
“CUSTOMER ENGAGEMENT BEHAVIOUR ON SOCIAL MEDIA PLATFORMS: HOW ARE SMES FASHION RETAILERS ENGAGING?”
Firm reputation refers to the way in which customers can recognize and correctly interpret a firm’s identity. Customers can influence firm reputation through word of mouth communication with the scale of this impact facilitated through social media and online communications. A firm’s reputation is a key prerequisite for engendering high levels of customer engagement behaviour and customer engagement behaviours on social media has the potential to influence the relationships between firms and their customers. The emergence of social media platforms as a means of engagement is highly advantageous for SMEs as it offers opportunities to engage with customers and to extend communication to existing and future customers. Using observations of social media posting across three platforms (Facebook, Instagram and Twitter) this study compares the engagement of customers and small fashion retailers categorised under three social media engagement behaviours. Termed as sharing and watching brand-related content (consumption), posting brand-related content (creation) and commenting or liking brand-related content (contribution) these activities help understand both the type and level of engagement behaviour between SMEs and their customers.
213
“CUSTOMER ENGAGEMENT BEHAVIOUR ON SOCIAL MEDIA PLATFORMS: HOW ARE SMES FASHION RETAILERS ENGAGING?”
Firm reputation refers to the way in which customers can recognize and correctly interpret a firm’s identity. Customers can influence firm reputation through word of mouth communication with the scale of this impact facilitated through social media and online communications. A firm’s reputation is a key prerequisite for engendering high levels of customer engagement behaviour and customer engagement behaviours on social media has the potential to influence the relationships between firms and their customers. The emergence of social media platforms as a means of engagement is highly advantageous for SMEs as it offers opportunities to engage with customers and to extend communication to existing and future customers. Using observations of social media posting across three platforms (Facebook, Instagram and Twitter) this study compares the engagement of customers and small fashion retailers categorised under three social media engagement behaviours. Termed as sharing and watching brand-related content (consumption), posting brand-related content (creation) and commenting or liking brand-related content (contribution) these activities help understand both the type and level of engagement behaviour between SMEs and their customers.
“DRIVERS OF SERVICE SUPPLIERS’ LOYALTY TOWARDS ONLINE PLATFORMS”
Hanna Schramm-Klein (University of Siegen)Natalie David (EM Strasbourg Business School)Oliver Roßmannek (University of Freiburg)
Based on an online study among service suppliers of two European internationally operating lodging platforms (brand A: n = 658; brand B: n = 960), on which service suppliers offer their homes for hol-iday rental, we analyze factors that influence service suppliers’ loyalty towards service platforms. As drivers of service suppliers’ satisfaction and commitment to the platform, we analyze the role of per-ceived service quality and platform attractiveness in driving satisfaction with the platform and com-mitment to the platform, as previous research suggests their importance in building loyalty. Our data suggests that platform satisfaction is more important than commitment and that platform performance and service quality as well as brand attractiveness are key in driving suppliers’ satisfaction with the platform. Managers therefore need to optimize their service strategies. With regard to theory, our re-sults imply that platform attractiveness for suppliers that are in competition to each other rather is driv-en by brand and customer related elements, while competitors’ attractiveness seems to reduce satisfac-tion with the platform.
214
“FROM PHYSICAL STORE TO DIGITAL STORE: THE ROLE OF DIGITAL TERMINAL ON CUSTOMER’S BEHAVIOR”
Aurely Lao (Lille University / Iae Lille)Mariana Vlad (Bordeaux University/ Irgo)Annabel Martin Salerno (Lille University / Iae Lille)
In an increasingly competitive context, retailers are looking to innovate by implementing digital terminal in their stores. These terminals provide sensorial stimulation for consumers and can modify their behavior in the store.
The goal of this research is to identify how the experience of using a digital terminal in a physical store can influence the customer behavior, taking into account mental imagery and the shopping value. To answer this question, we conducted two empirical studies: for the first one the questionnaire was administered online (115 respondents) and for the second one after the shopping journey in the stores of one international retailer that sells sport equipment (220 respondents).
Our results confirm the significant influences of the terminal use on the utilitarian, hedonic and social dimensions of shopping value, but above all emphasize the central role of the self-mental imagery. In both studies, the self-mental imagery is reinforced by the four dimensions of experience (cognitive, pragmatic, sensorial and social) and it favors strongly the two behavioral intentions: purchase intention and word-of-mouth. Purchase intention and word-of-mouth intentions are also positively influenced by the improvement in the utilitarian value, and to a lesser extent in the social value.
The originality of this work lies in highlighting the impact of terminal use experience on mental imagery and shopping value which in turn influence consumer behavior.
215
“FROM PHYSICAL STORE TO DIGITAL STORE: THE ROLE OF DIGITAL TERMINAL ON CUSTOMER’S BEHAVIOR”
In an increasingly competitive context, retailers are looking to innovate by implementing digital terminal in their stores. These terminals provide sensorial stimulation for consumers and can modify their behavior in the store.
The goal of this research is to identify how the experience of using a digital terminal in a physical store can influence the customer behavior, taking into account mental imagery and the shopping value. To answer this question, we conducted two empirical studies: for the first one the questionnaire was administered online (115 respondents) and for the second one after the shopping journey in the stores of one international retailer that sells sport equipment (220 respondents).
Our results confirm the significant influences of the terminal use on the utilitarian, hedonic and social dimensions of shopping value, but above all emphasize the central role of the self-mental imagery. In both studies, the self-mental imagery is reinforced by the four dimensions of experience (cognitive, pragmatic, sensorial and social) and it favors strongly the two behavioral intentions: purchase intention and word-of-mouth. Purchase intention and word-of-mouth intentions are also positively influenced by the improvement in the utilitarian value, and to a lesser extent in the social value.
The originality of this work lies in highlighting the impact of terminal use experience on mental imagery and shopping value which in turn influence consumer behavior.
TOWARDS A FIRST CONCEPTUALIZATION OF SHOPPERS’ AMBIVALENCE TO DIGITALIZATION
Author names and affiliations Fabien ROGEON
- Title: PhD Student- Institution: lab. CeReGe EA 1722- Université: La Rochelle Université, La Rochelle, France- E-mail address: [email protected]
Aurélia MICHAUD-TREVINAL
- Title: Associate Professor- Institution: lab. CeReGe EA 1722- Université: La Rochelle Université, La Rochelle, France- E-mail address: [email protected]
Isabelle COLLIN-LACHAUD
- Title: Professor- Institution: LSMRC- Université: Université de Lille, Lille, France- E-mail address: [email protected]
216
IntroductionDigitalization of retailing describes the process of integration of digital technologies
during shopping. It is an ongoing process, with no clear beginning or end, which is not merely imposed on people and organizations. Digitalization is about what people and organizations “do” and produce themselves through human activities, practices, interactions and configurations (Hagberg, Sundstrom, and Egels-Zandén, 2016; Reddy and Reinartz, 2017). Verhoef, Kannan, and Inman (2015) emphasize that digitalization both influence and is influenced by the retail landscape. Retailers provide shoppers with various services, that are simultaneously adapted to the use of technologies (e.g. stores open cashier-free at Amazon Go via the application of the same name) and affected by the new forms of shopping associated with these technologies (e.g. restaurants and concept store that appoint a dedicated space for souvenir photos to be shared on Instagram). The deep changes due to digitalization in the retail landscape were the focus of numerous research (Grewal, Roggeveen, and Nordfält, 2017; Reinartz, Wiegand, and Imschloss,2019).
A first large stream of research concerns the digitalization in retailing. While sometimes pointing out the difficulties inherent to its implementation, or recently emphasizing "the dichotomous nature of technology" with "both benefits and harms for consumers" (Markos, Labrecque, and Milne, 2018, p 59), the vast majority of research in retailing focuses on the benefits of digitalization. They rarely discuss the contradictory reactions digitalization is likely to generate for shoppers (Johnson, Bardhi and Dunn, 2008; Dholakia 2019).
Moreover, another stream of research focuses on shoppers’ ambivalence to technology.Following Thompson, Zanna and Griffin (1995), Otnes, Lowrey and Shrum (1997) introduce the idea that consumers can be ambivalent, i.e., they can simultaneously feel and show positive and negative reactions to a person, product or phenomenon (Ardelet et al. 2017; Rothman et al. 2017). As Sincoff (1990) points out, it is interesting to note that ambivalence is not synonymous with a single conflict between two opposing reactions, but rather a set of conflicts. Individuals feel and experience contradictory reactions regarding different components of the same attitudinal object (Ruth, Brunel and Otnes, 2002). These contradictions have been studied in different contexts, particularly with respect to consumers’ relationships to technologies (Mick and Fournier, 1998). When confronted with technologies, shoppers switch between reactions described as positive (e.g., feelings of control, freedom and usefulness) and reactions described as negative (e.g., feelings of chaos, enslavement and uselessness). Taken individually, each reaction is incontestably true, but when juxtaposed against each other, they appear inherently contradictory (Johnson, Bardhi, and Dunn, 2008).
This stream of research focuses on shoppers’ ambivalence to technology. For instance, Schweitzer and Van den Hende (2016) and Schweitzer et al. (2019) demonstrate that individuals associate technology with negative reactions as disempowerment and enslavement. But they do not investigate the ambivalent reactions to the digitalization of retailing.
It is therefore at the crossroads of these sections of the literature that this research takes place.
PurposeTo address this main gap in the literature, we conceptualize the ambivalence of shoppers
to the digitalization of retailing. We point out the theoretical and managerial interest of this concept in retailing. Thus, the objective is twofold: 1) to reveal the components of retail
217
2
IntroductionDigitalization of retailing describes the process of integration of digital technologies
during shopping. It is an ongoing process, with no clear beginning or end, which is not merelyimposed on people and organizations. Digitalization is about what people and organizations “do”and produce themselves through human activities, practices, interactions and configurations(Hagberg, Sundstrom, and Egels-Zandén, 2016; Reddy and Reinartz, 2017). Verhoef, Kannan, and Inman (2015) emphasize that digitalization both influence and is influenced by the retaillandscape. Retailers provide shoppers with various services, that are simultaneously adapted tothe use of technologies (e.g. stores open cashier-free at Amazon Go via the application of the same name) and affected by the new forms of shopping associated with these technologies (e.g. restaurants and concept store that appoint a dedicated space for souvenir photos to be shared on Instagram). The deep changes due to digitalization in the retail landscape were the focus ofnumerous research (Grewal, Roggeveen, and Nordfält, 2017; Reinartz, Wiegand, and Imschloss,2019).
A first large stream of research concerns the digitalization in retailing. While sometimes pointingout the difficulties inherent to its implementation, or recently emphasizing "the dichotomousnature of technology" with "both benefits and harms for consumers" (Markos, Labrecque, and Milne, 2018, p 59), the vast majority of research in retailing focuses on the benefits ofdigitalization. They rarely discuss the contradictory reactions digitalization is likely to generatefor shoppers (Johnson, Bardhi and Dunn, 2008; Dholakia 2019).
Moreover, another stream of research focuses on shoppers’ ambivalence to technology.Following Thompson, Zanna and Griffin (1995), Otnes, Lowrey and Shrum (1997) introduce theidea that consumers can be ambivalent, i.e., they can simultaneously feel and show positive and negative reactions to a person, product or phenomenon (Ardelet et al. 2017; Rothman et al. 2017). As Sincoff (1990) points out, it is interesting to note that ambivalence is not synonymous with asingle conflict between two opposing reactions, but rather a set of conflicts. Individuals feel and experience contradictory reactions regarding different components of the same attitudinal object (Ruth, Brunel and Otnes, 2002). These contradictions have been studied in different contexts, particularly with respect to consumers’ relationships to technologies (Mick and Fournier, 1998). When confronted with technologies, shoppers switch between reactions described as positive(e.g., feelings of control, freedom and usefulness) and reactions described as negative (e.g., feelings of chaos, enslavement and uselessness). Taken individually, each reaction isincontestably true, but when juxtaposed against each other, they appear inherently contradictory(Johnson, Bardhi, and Dunn, 2008).
This stream of research focuses on shoppers’ ambivalence to technology. For instance,Schweitzer and Van den Hende (2016) and Schweitzer et al. (2019) demonstrate that individualsassociate technology with negative reactions as disempowerment and enslavement. But they donot investigate the ambivalent reactions to the digitalization of retailing.
It is therefore at the crossroads of these sections of the literature that this research takesplace.
PurposeTo address this main gap in the literature, we conceptualize the ambivalence of shoppers
to the digitalization of retailing. We point out the theoretical and managerial interest of thisconcept in retailing. Thus, the objective is twofold: 1) to reveal the components of retail
digitalization associated with of shoppers’ ambivalent reactions to retail digitalization and 2) to identify research priorities on shoppers’ ambivalence to digitalization of retailing.
Therefore, according to the objectives of the research, a systematic literature review was conducted on the shoppers’ contradictory positive and negative reactions to digitalization of retailing.
Research methodologyA systematic literature review on digitalization of retailing has been conducted. “In
contrast to an expert review using ad hoc literature selection” (Kitchenham et al., 2009, p 8), a systematic literature review is a methodologically rigorous review of research results relating to a specific question (Denyer and Neely 2004). With its transparent approach, the systematic literature review enables to locate, analyze, report the evidence and reach reasonably clear and objective conclusions about what is and is not (Denyer and Tranfield, 2009). Taking that into account, we describe below 1) the selection process of papers and 2) the analysis process of papers selected.
Selection process:
A keyword search has been undertaken to identify relevant literature on the topic (Tranfield, Denyer, and Smart, 2003). The following terms were used: “digitalization”, “digitization”, “digital transformation”, “digital marketing”, “digital technology”, “new technology”, “technology infusion”, “technology infused”, “omni-channel”, “cross-channel” and “multi-channel”. To conduct the search, four inclusion-exclusion criteria were applied for including work in this study (Tranfield, Denyer, and Smart, 2003):
- Papers must have been published between January 2005 and May 2020 (inclusive). It iswithin this period that most papers have been published on the digital changes in retaillandscape (Verhoef, Kannan, and Inman, 2015).
- Papers must have been published in the twenty Marketing journals ranked at least 3* bythe Academic Journal Guide (2018) to focus on work that meet a high-quality threshold.Our selection also included papers published in the French journal “Recherche etApplications en Marketing”.
- Papers meeting these two search criteria were kept (or excluded) depending on whetherthey outlined (or not) shoppers experiences or reactions to digitalization of retailing(Raddats et al., 2019).
The Appendix A provides the list of the reviews analyzed, their rank, number of papersselected in each journal, references of selected articles and their citations number (Google Scholar).
Analysis process:
To capture the increasing importance of digitalization in the shopping process, a detailed analysis of the 108 selected papers was conducted to systematically collect shoppers’ negative and positive reactions outlined by the authors. Then, these reactions were gathered around key components (e.g. Utility, Personal data, Power, etc.) to highlight shoppers’ contradictory reactions. Our conceptualization was built through an iterative coding process, involving discussions among the research team about the identification and conceptualization of the shoppers’ ambivalence to digitalization. The aim was to allow the interpretation of the literature to be adapted and refined through the course of the study (Tranfield, Denyer, and Smart, 2003).
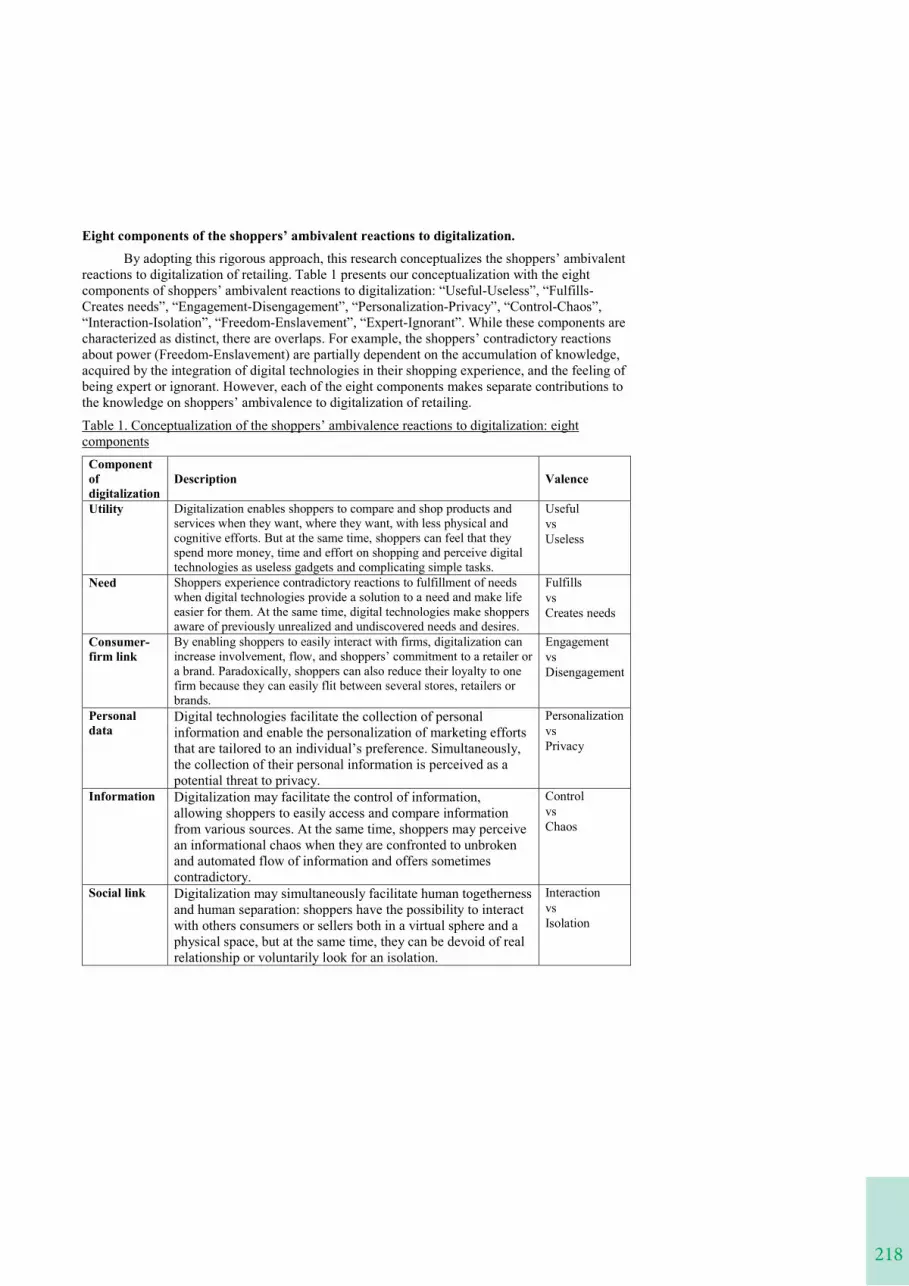
218
Eight components of the shoppers’ ambivalent reactions to digitalization.By adopting this rigorous approach, this research conceptualizes the shoppers’ ambivalent
reactions to digitalization of retailing. Table 1 presents our conceptualization with the eight components of shoppers’ ambivalent reactions to digitalization: “Useful-Useless”, “Fulfills-Creates needs”, “Engagement-Disengagement”, “Personalization-Privacy”, “Control-Chaos”, “Interaction-Isolation”, “Freedom-Enslavement”, “Expert-Ignorant”. While these components are characterized as distinct, there are overlaps. For example, the shoppers’ contradictory reactions about power (Freedom-Enslavement) are partially dependent on the accumulation of knowledge, acquired by the integration of digital technologies in their shopping experience, and the feeling of being expert or ignorant. However, each of the eight components makes separate contributions to the knowledge on shoppers’ ambivalence to digitalization of retailing.
Table 1. Conceptualization of the shoppers’ ambivalence reactions to digitalization: eight components
Component of digitalization
Description Valence
Utility Digitalization enables shoppers to compare and shop products and services when they want, where they want, with less physical and cognitive efforts. But at the same time, shoppers can feel that they spend more money, time and effort on shopping and perceive digital technologies as useless gadgets and complicating simple tasks.
Useful vsUseless
Need Shoppers experience contradictory reactions to fulfillment of needs when digital technologies provide a solution to a need and make life easier for them. At the same time, digital technologies make shoppers aware of previously unrealized and undiscovered needs and desires.
Fulfills vs Creates needs
Consumer-firm link
By enabling shoppers to easily interact with firms, digitalization can increase involvement, flow, and shoppers’ commitment to a retailer or a brand. Paradoxically, shoppers can also reduce their loyalty to one firm because they can easily flit between several stores, retailers or brands.
Engagementvs Disengagement
Personal data
Digital technologies facilitate the collection of personal information and enable the personalization of marketing efforts that are tailored to an individual’s preference. Simultaneously,the collection of their personal information is perceived as a potential threat to privacy.
Personalization vs Privacy
Information Digitalization may facilitate the control of information, allowing shoppers to easily access and compare information from various sources. At the same time, shoppers may perceive an informational chaos when they are confronted to unbroken and automated flow of information and offers sometimes contradictory.
Control vsChaos
Social link Digitalization may simultaneously facilitate human togetherness and human separation: shoppers have the possibility to interact with others consumers or sellers both in a virtual sphere and a physical space, but at the same time, they can be devoid of real relationship or voluntarily look for an isolation.
Interaction vs Isolation
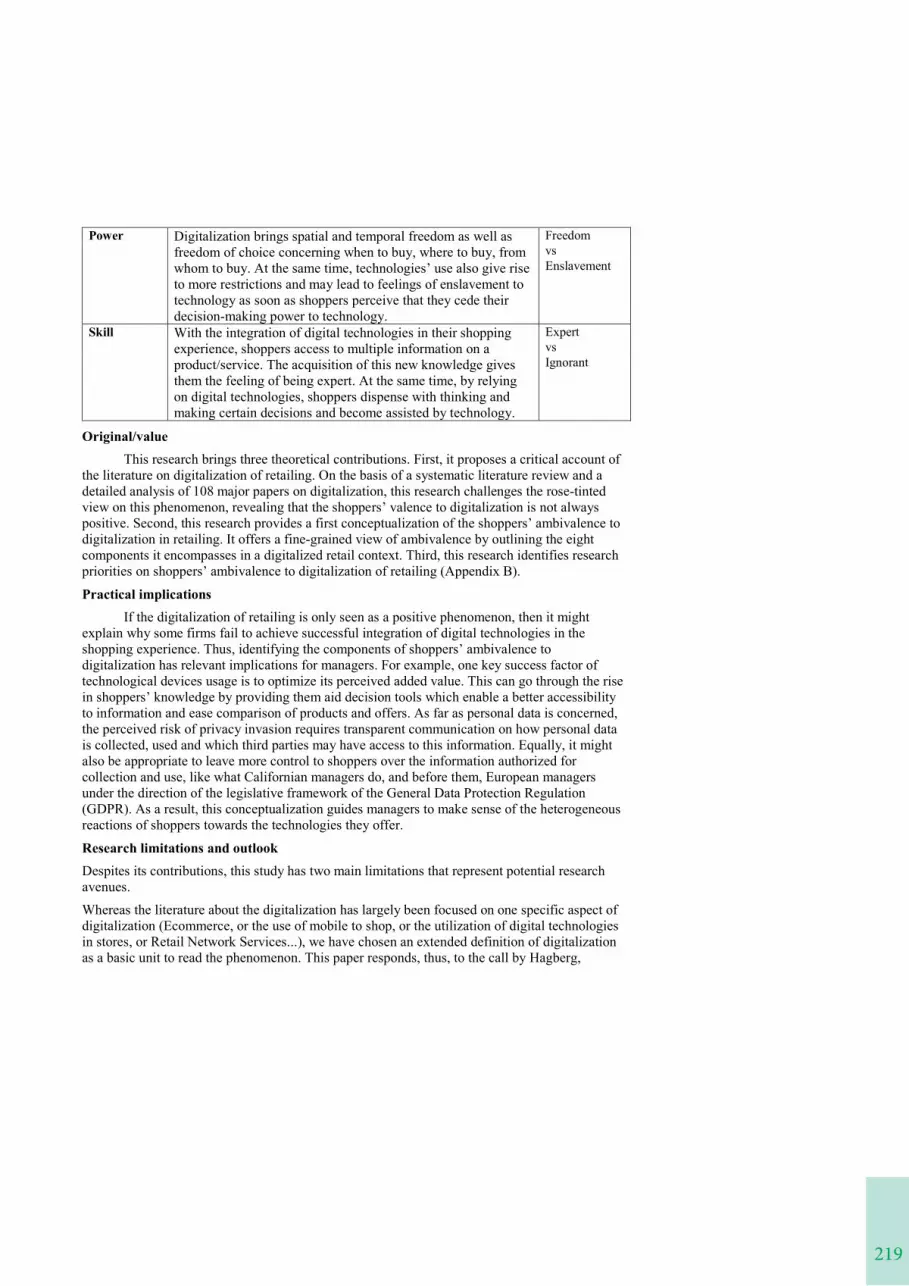
219
4
Eight components of the shoppers’ ambivalent reactions to digitalization.By adopting this rigorous approach, this research conceptualizes the shoppers’ ambivalent
reactions to digitalization of retailing. Table 1 presents our conceptualization with the eightcomponents of shoppers’ ambivalent reactions to digitalization: “Useful-Useless”, “Fulfills-Creates needs”, “Engagement-Disengagement”, “Personalization-Privacy”, “Control-Chaos”, “Interaction-Isolation”, “Freedom-Enslavement”, “Expert-Ignorant”. While these components are characterized as distinct, there are overlaps. For example, the shoppers’ contradictory reactionsabout power (Freedom-Enslavement) are partially dependent on the accumulation of knowledge, acquired by the integration of digital technologies in their shopping experience, and the feeling ofbeing expert or ignorant. However, each of the eight components makes separate contributions tothe knowledge on shoppers’ ambivalence to digitalization of retailing.
Table 1. Conceptualization of the shoppers’ ambivalence reactions to digitalization: eightcomponents
Componentofdigitalization
Description Valence
Utility Digitalization enables shoppers to compare and shop products andservices when they want, where they want, with less physical and cognitive efforts. But at the same time, shoppers can feel that theyspend more money, time and effort on shopping and perceive digitaltechnologies as useless gadgets and complicating simple tasks.
UsefulvsUseless
Need Shoppers experience contradictory reactions to fulfillment of needswhen digital technologies provide a solution to a need and make lifeeasier for them. At the same time, digital technologies make shoppersaware of previously unrealized and undiscovered needs and desires.
FulfillsvsCreates needs
Consumer-firm link
By enabling shoppers to easily interact with firms, digitalization canincrease involvement, flow, and shoppers’ commitment to a retailer or a brand. Paradoxically, shoppers can also reduce their loyalty to onefirm because they can easily flit between several stores, retailers orbrands.
EngagementvsDisengagement
Personaldata
Digital technologies facilitate the collection of personal information and enable the personalization of marketing effortsthat are tailored to an individual’s preference. Simultaneously,the collection of their personal information is perceived as apotential threat to privacy.
PersonalizationvsPrivacy
Information Digitalization may facilitate the control of information,allowing shoppers to easily access and compare informationfrom various sources. At the same time, shoppers may perceive an informational chaos when they are confronted to unbroken and automated flow of information and offers sometimescontradictory.
ControlvsChaos
Social link Digitalization may simultaneously facilitate human togethernessand human separation: shoppers have the possibility to interactwith others consumers or sellers both in a virtual sphere and aphysical space, but at the same time, they can be devoid of realrelationship or voluntarily look for an isolation.
InteractionvsIsolation
Power Digitalization brings spatial and temporal freedom as well as freedom of choice concerning when to buy, where to buy, from whom to buy. At the same time, technologies’ use also give rise to more restrictions and may lead to feelings of enslavement to technology as soon as shoppers perceive that they cede their decision-making power to technology.
Freedom vs Enslavement
Skill With the integration of digital technologies in their shopping experience, shoppers access to multiple information on a product/service. The acquisition of this new knowledge givesthem the feeling of being expert. At the same time, by relying on digital technologies, shoppers dispense with thinking and making certain decisions and become assisted by technology.
Expert vsIgnorant
Original/valueThis research brings three theoretical contributions. First, it proposes a critical account of
the literature on digitalization of retailing. On the basis of a systematic literature review and a detailed analysis of 108 major papers on digitalization, this research challenges the rose-tinted view on this phenomenon, revealing that the shoppers’ valence to digitalization is not always positive. Second, this research provides a first conceptualization of the shoppers’ ambivalence to digitalization in retailing. It offers a fine-grained view of ambivalence by outlining the eight components it encompasses in a digitalized retail context. Third, this research identifies research priorities on shoppers’ ambivalence to digitalization of retailing (Appendix B).
Practical implicationsIf the digitalization of retailing is only seen as a positive phenomenon, then it might
explain why some firms fail to achieve successful integration of digital technologies in the shopping experience. Thus, identifying the components of shoppers’ ambivalence to digitalization has relevant implications for managers. For example, one key success factor of technological devices usage is to optimize its perceived added value. This can go through the rise in shoppers’ knowledge by providing them aid decision tools which enable a better accessibility to information and ease comparison of products and offers. As far as personal data is concerned, the perceived risk of privacy invasion requires transparent communication on how personal data is collected, used and which third parties may have access to this information. Equally, it might also be appropriate to leave more control to shoppers over the information authorized for collection and use, like what Californian managers do, and before them, European managers under the direction of the legislative framework of the General Data Protection Regulation (GDPR). As a result, this conceptualization guides managers to make sense of the heterogeneous reactions of shoppers towards the technologies they offer.
Research limitations and outlookDespites its contributions, this study has two main limitations that represent potential research avenues.
Whereas the literature about the digitalization has largely been focused on one specific aspect of digitalization (Ecommerce, or the use of mobile to shop, or the utilization of digital technologies in stores, or Retail Network Services...), we have chosen an extended definition of digitalization as a basic unit to read the phenomenon. This paper responds, thus, to the call by Hagberg,

220
Sundstrom, and Egels-Zandén, 2016) to move beyond considering narrow aspects of digitalization to a more complete understanding of all-encompassing transformations. However, our definition choice induces that shoppers’ contradictory reactions about one of these specific aspects of digitalization can be contingent of each technology. This opens several research avenues as mentioned in appendix B.
Another limitation is that digitalization is here discussed specifically within the context of individuals’ reactions, and focuses especially on the shoppers. We conceptualize the potential and interpersonal ambivalence of shoppers to digitalization. Consequently, future work could use our conceptualization to investigate which components are prone to 1) felt and intrapersonal ambivalent reactions, 2) potential and interpersonal ambivalent reactions, or 3) only polarized reactions.
Besides, this conceptual research represents the first step of a larger research project that entails empirical data collection. Consumer ambivalence research hold that negative experiences generate anxiety and stress that elicit avoidance responses from individuals (Mick and Fournier, 1998). In the same time, positive shoppers’ experiences increase the trust in technology and the likelihood that the technology can be relied on in the future (Johnson et al., 2008). But, what about ambivalent experiences? Consequently, it may be relevant to study the psychological and behavioral consequences of shoppers’ ambivalence to digitalization of retailing (Giebelhausen et al., 2014).
KeywordsDigitalization, Retailing, Shoppers, Ambivalence, Systematic Literature Review
221
6
Sundstrom, and Egels-Zandén, 2016) to move beyond considering narrow aspects ofdigitalization to a more complete understanding of all-encompassing transformations. However, our definition choice induces that shoppers’ contradictory reactions about one of these specific aspects of digitalization can be contingent of each technology. This opens several researchavenues as mentioned in appendix B.
Another limitation is that digitalization is here discussed specifically within the context ofindividuals’ reactions, and focuses especially on the shoppers. We conceptualize the potential andinterpersonal ambivalence of shoppers to digitalization. Consequently, future work could use ourconceptualization to investigate which components are prone to 1) felt and intrapersonalambivalent reactions, 2) potential and interpersonal ambivalent reactions, or 3) only polarizedreactions.
Besides, this conceptual research represents the first step of a larger research project that entailsempirical data collection. Consumer ambivalence research hold that negative experiencesgenerate anxiety and stress that elicit avoidance responses from individuals (Mick and Fournier, 1998). In the same time, positive shoppers’ experiences increase the trust in technology and the likelihood that the technology can be relied on in the future (Johnson et al., 2008). But, whatabout ambivalent experiences? Consequently, it may be relevant to study the psychological andbehavioral consequences of shoppers’ ambivalence to digitalization of retailing (Giebelhausen etal., 2014).
KeywordsDigitalization, Retailing, Shoppers, Ambivalence, Systematic Literature Review
ReferencesArdelet C., Veg-Sala N., Goudey A., et al. (2017), “Entre crainte et désir pour les objets
connectés : comprendre l’ambivalence des consommateurs”, Décisions Marketing, Vol. 86, pp. 31–46.
Denyer D. and Neely A. (2004), “Introduction to special issue: Innovation and productivity performance in the UK”, International Journal of Management Reviews, Vol. 5, No. 3-4,pp. 131–135.
Denyer D. and Tranfield D. (2009), “Producing a systematic review”, in Buchanan David andBryman Alan (Eds.), The Sage Handbook of Organizational Research Methods, Sage Publications Ltd, Thousand Oaks, CA, pp. 671–689.
Dholakia U. (2019), “All’s Not Well on the Marketing Frontlines: Understanding the Challenges of Adverse Technology–Consumer Interactions”, In Review of Marketing Research, Emerald Publishing Limited, pp. 121–140.
Giebelhausen M., Robinson S.G., Sirianni N.J., et al. (2014), “Touch Versus Tech: When Technology Functions as a Barrier or a Benefit to Service Encounters”, Journal of Marketing, Vol. 78, No. 4, pp. 113–124.
Grewal D., Roggeveen A.L. and Nordfält J. (2017), “The Future of Retailing”, Journal of Retailing, Vol. 93, No. 1, pp. 1-6.
Hagberg J., Sundstrom M. and Egels-Zandén N. (2016), “The digitalization of retailing: anexploratory framework”, International Journal of Retail & Distribution Management, Vol. 44, No. 7, pp. 694–712.
Johnson D.S., Bardhi F. and Dunn D.T. (2008), “Understanding how technology paradoxes affect customer satisfaction with self-service technology: The role of performance ambiguity and trust in technology”, Psychology and Marketing,Vol. 25, No. 5, pp.416–443.
Kitchenham B., Pearl Brereton O., Budgen D., et al. (2009), “Systematic literature reviews in software engineering – A systematic literature review”, Information and Software Technology, Vol. 51, No. 1, pp. 7–15.
Markos E., Labrecque L.I. and Milne G.R. (2018), “A New Information Lens: The Self-concept and Exchange Context as a Means to Understand Information Sensitivity of Anonymous and Personal Identifying Information”, Journal of Interactive Marketing, Vol. 42, pp. 46–62.
Mick D.G. and Fournier S. (1998), “Paradoxes of Technology: Consumer Cognizance, Emotions, and Coping Strategies”, Journal of Consumer Research, Vol.25, No. 2, pp. 123–143.
Otnes C., Lowrey T.M. and Shrum L.J. (1997), “Toward an Understanding of Consumer Ambivalence”, Journal of Consumer Research, Vol. 24, No. 1, pp. 80–93.
Raddats C., Kowalkowski C., Benedettini O., et al. (2019), “Servitization: A contemporary thematic review of four major research streams”, Industrial Marketing Management, Vol. 83, pp. 207-223.
Reddy S.K. and Reinartz W. (2017), “Digital Transformation and Value Creation: Sea Change Ahead”, GfK Marketing Intelligence Review, Vol. 9, No.1, pp. 10–17.
222
8
Reinartz W., Wiegand N. and Imschloss M. (2019), “The impact of digital transformation on the retailing value chain”, International Journal of Research in Marketing, Vol. 36, pp. 350–366.
Rothman N.B., Pratt M.G., Rees .L, et al. (2017), “Understanding the Dual Nature of Ambivalence: Why and When Ambivalence Leads to Good and Bad Outcomes”, Academy of Management Annals, Vol. 11, No. 1, pp. 33–72.
Ruth J.A., Brunel F.F. and Otnes C.C. (2002), “Linking Thoughts to Feelings: Investigating Cognitive Appraisals and Consumption Emotions in a Mixed-Emotions Context”, Journal of the Academy of Marketing Science, Vol. 30, No. 1, pp. 44–58.
Schweitzer F. and Van den Hende E.A. (2016), “To Be or Not to Be in Thrall to the March of Smart Products”, Psychology & Marketing, Vol. 33, No. 10, pp. 830–842.
Schweitzer F., Belk R., Jordan W., et al. (2019), “Servant, friend or master? The relationships users build with voice-controlled smart devices”, Journal of Marketing Management, Vol. 35, No. 7–8, pp. 693–715.
Sincoff J (1990), “The psychological characteristics of ambivalent people”, Clinical Psychology Review, Vol. 10, No. 1, pp. 43–68.
Thompson M., Zanna M. and Griffin D. (1995) “Let’s Not Be Indifferent About (Attitudinal) Ambivalence”, in Petty Richard E. & Krosnick Jon (Eds.), Attitude Strength: Antecedents and Consequences, Lawrence Erlbaum Associates, Mahwah, N.J, pp. 361–386.
Tranfield D., Denyer D. and Smart P. (2003), “Towards a Methodology for Developing Evidence-Informed Management Knowledge by Means of Systematic Review”, British Journal of Management, Vol. 14, No. 3: 207–222.
Verhoef P.C., Kannan P.K. and Inman J.J. (2015), “From Multi-Channel Retailing to Omni-Channel Retailing”, Journal of Retailing, Vol. 91, No. 2, pp. 174–181.
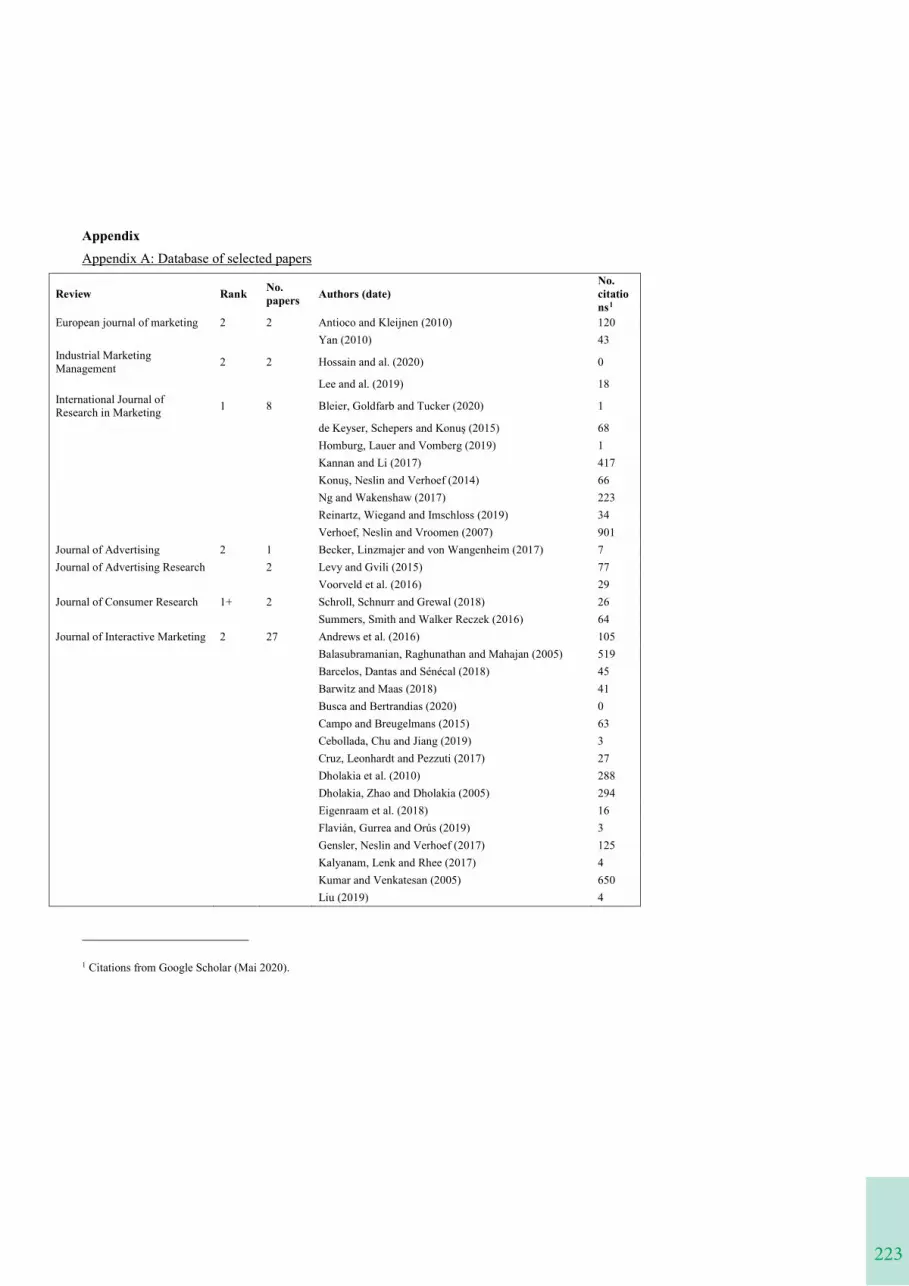
223
8
Reinartz W., Wiegand N. and Imschloss M. (2019), “The impact of digital transformation on theretailing value chain”, International Journal of Research in Marketing, Vol. 36, pp. 350–366.
Rothman N.B., Pratt M.G., Rees .L, et al. (2017), “Understanding the Dual Nature ofAmbivalence: Why and When Ambivalence Leads to Good and Bad Outcomes”,Academy of Management Annals, Vol. 11, No. 1, pp. 33–72.
Ruth J.A., Brunel F.F. and Otnes C.C. (2002), “Linking Thoughts to Feelings: Investigating Cognitive Appraisals and Consumption Emotions in a Mixed-Emotions Context”, Journalof the Academy of Marketing Science, Vol. 30, No. 1, pp. 44–58.
Schweitzer F. and Van den Hende E.A. (2016), “To Be or Not to Be in Thrall to the March ofSmart Products”, Psychology & Marketing, Vol. 33, No. 10, pp. 830–842.
Schweitzer F., Belk R., Jordan W., et al. (2019), “Servant, friend or master? The relationshipsusers build with voice-controlled smart devices”, Journal of Marketing Management, Vol. 35, No. 7–8, pp. 693–715.
Sincoff J (1990), “The psychological characteristics of ambivalent people”, Clinical PsychologyReview, Vol. 10, No. 1, pp. 43–68.
Thompson M., Zanna M. and Griffin D. (1995) “Let’s Not Be Indifferent About (Attitudinal)Ambivalence”, in Petty Richard E. & Krosnick Jon (Eds.), Attitude Strength: Antecedentsand Consequences, Lawrence Erlbaum Associates, Mahwah, N.J, pp. 361–386.
Tranfield D., Denyer D. and Smart P. (2003), “Towards a Methodology for Developing Evidence-Informed Management Knowledge by Means of Systematic Review”, BritishJournal of Management, Vol. 14, No. 3: 207–222.
Verhoef P.C., Kannan P.K. and Inman J.J. (2015), “From Multi-Channel Retailing to Omni-Channel Retailing”, Journal of Retailing, Vol. 91, No. 2, pp. 174–181.
Con formato: Español (España)
AppendixAppendix A: Database of selected papers
Review Rank No. papers Authors (date)
No. citations1
European journal of marketing 2 2 Antioco and Kleijnen (2010) 120Yan (2010) 43
Industrial Marketing Management 2 2 Hossain and al. (2020) 0
Lee and al. (2019) 18International Journal of Research in Marketing 1 8 Bleier, Goldfarb and Tucker (2020) 1
de Keyser, Schepers and Konuş (2015) 68Homburg, Lauer and Vomberg (2019) 1Kannan and Li (2017) 417Konuş, Neslin and Verhoef (2014) 66Ng and Wakenshaw (2017) 223Reinartz, Wiegand and Imschloss (2019) 34Verhoef, Neslin and Vroomen (2007) 901
Journal of Advertising 2 1 Becker, Linzmajer and von Wangenheim (2017) 7Journal of Advertising Research 2 Levy and Gvili (2015) 77
Voorveld et al. (2016) 29Journal of Consumer Research 1+ 2 Schroll, Schnurr and Grewal (2018) 26
Summers, Smith and Walker Reczek (2016) 64Journal of Interactive Marketing 2 27 Andrews et al. (2016) 105
Balasubramanian, Raghunathan and Mahajan (2005) 519Barcelos, Dantas and Sénécal (2018) 45Barwitz and Maas (2018) 41Busca and Bertrandias (2020) 0Campo and Breugelmans (2015) 63Cebollada, Chu and Jiang (2019) 3Cruz, Leonhardt and Pezzuti (2017) 27Dholakia et al. (2010) 288Dholakia, Zhao and Dholakia (2005) 294Eigenraam et al. (2018) 16Flavián, Gurrea and Orús (2019) 3Gensler, Neslin and Verhoef (2017) 125Kalyanam, Lenk and Rhee (2017) 4Kumar and Venkatesan (2005) 650Liu (2019) 4
1 Citations from Google Scholar (Mai 2020).
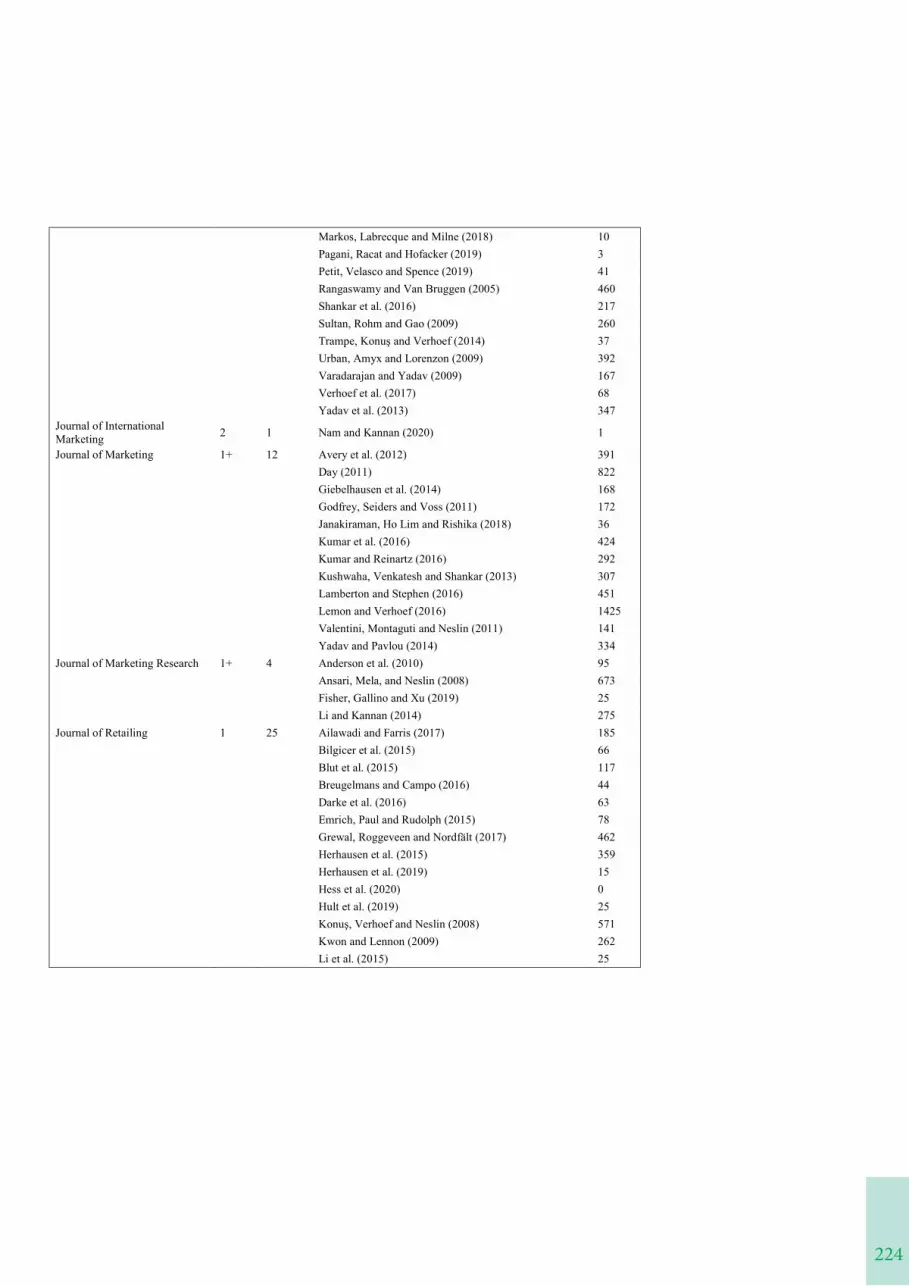
224
Markos, Labrecque and Milne (2018) 10Pagani, Racat and Hofacker (2019) 3Petit, Velasco and Spence (2019) 41Rangaswamy and Van Bruggen (2005) 460Shankar et al. (2016) 217Sultan, Rohm and Gao (2009) 260Trampe, Konuş and Verhoef (2014) 37Urban, Amyx and Lorenzon (2009) 392Varadarajan and Yadav (2009) 167Verhoef et al. (2017) 68Yadav et al. (2013) 347
Journal of International Marketing 2 1 Nam and Kannan (2020) 1
Journal of Marketing 1+ 12 Avery et al. (2012) 391Day (2011) 822Giebelhausen et al. (2014) 168Godfrey, Seiders and Voss (2011) 172Janakiraman, Ho Lim and Rishika (2018) 36Kumar et al. (2016) 424Kumar and Reinartz (2016) 292Kushwaha, Venkatesh and Shankar (2013) 307Lamberton and Stephen (2016) 451Lemon and Verhoef (2016) 1425Valentini, Montaguti and Neslin (2011) 141Yadav and Pavlou (2014) 334
Journal of Marketing Research 1+ 4 Anderson et al. (2010) 95Ansari, Mela, and Neslin (2008) 673Fisher, Gallino and Xu (2019) 25Li and Kannan (2014) 275
Journal of Retailing 1 25 Ailawadi and Farris (2017) 185Bilgicer et al. (2015) 66Blut et al. (2015) 117Breugelmans and Campo (2016) 44Darke et al. (2016) 63Emrich, Paul and Rudolph (2015) 78Grewal, Roggeveen and Nordfält (2017) 462Herhausen et al. (2015) 359Herhausen et al. (2019) 15Hess et al. (2020) 0Hult et al. (2019) 25Konuş, Verhoef and Neslin (2008) 571Kwon and Lennon (2009) 262Li et al. (2015) 25
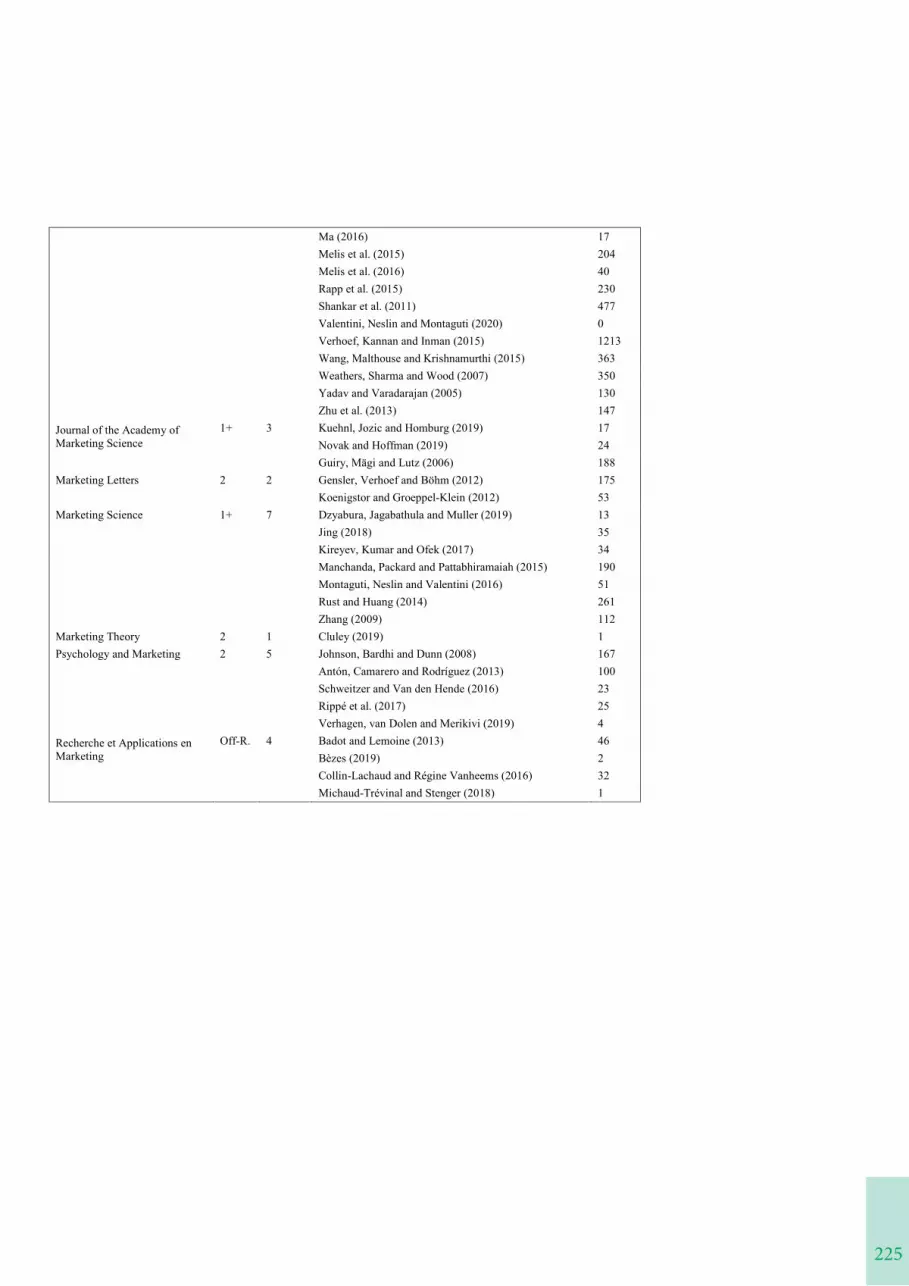
225
10
Markos, Labrecque and Milne (2018) 10Pagani, Racat and Hofacker (2019) 3Petit, Velasco and Spence (2019) 41Rangaswamy and Van Bruggen (2005) 460Shankar et al. (2016) 217Sultan, Rohm and Gao (2009) 260Trampe, Konuş and Verhoef (2014) 37Urban, Amyx and Lorenzon (2009) 392Varadarajan and Yadav (2009) 167Verhoef et al. (2017) 68Yadav et al. (2013) 347
Journal of InternationalMarketing 2 1 Nam and Kannan (2020) 1
Journal of Marketing 1+ 12 Avery et al. (2012) 391Day (2011) 822Giebelhausen et al. (2014) 168Godfrey, Seiders and Voss (2011) 172Janakiraman, Ho Lim and Rishika (2018) 36Kumar et al. (2016) 424Kumar and Reinartz (2016) 292Kushwaha, Venkatesh and Shankar (2013) 307Lamberton and Stephen (2016) 451Lemon and Verhoef (2016) 1425Valentini, Montaguti and Neslin (2011) 141Yadav and Pavlou (2014) 334
Journal of Marketing Research 1+ 4 Anderson et al. (2010) 95Ansari, Mela, and Neslin (2008) 673Fisher, Gallino and Xu (2019) 25Li and Kannan (2014) 275
Journal of Retailing 1 25 Ailawadi and Farris (2017) 185Bilgicer et al. (2015) 66Blut et al. (2015) 117Breugelmans and Campo (2016) 44Darke et al. (2016) 63Emrich, Paul and Rudolph (2015) 78Grewal, Roggeveen and Nordfält (2017) 462Herhausen et al. (2015) 359Herhausen et al. (2019) 15Hess et al. (2020) 0Hult et al. (2019) 25Konuş, Verhoef and Neslin (2008) 571Kwon and Lennon (2009) 262Li et al. (2015) 25
Ma (2016) 17Melis et al. (2015) 204Melis et al. (2016) 40Rapp et al. (2015) 230Shankar et al. (2011) 477Valentini, Neslin and Montaguti (2020) 0Verhoef, Kannan and Inman (2015) 1213Wang, Malthouse and Krishnamurthi (2015) 363Weathers, Sharma and Wood (2007) 350Yadav and Varadarajan (2005) 130Zhu et al. (2013) 147
Journal of the Academy of Marketing Science
1+ 3 Kuehnl, Jozic and Homburg (2019) 17Novak and Hoffman (2019) 24Guiry, Mägi and Lutz (2006) 188
Marketing Letters 2 2 Gensler, Verhoef and Böhm (2012) 175Koenigstor and Groeppel-Klein (2012) 53
Marketing Science 1+ 7 Dzyabura, Jagabathula and Muller (2019) 13Jing (2018) 35Kireyev, Kumar and Ofek (2017) 34Manchanda, Packard and Pattabhiramaiah (2015) 190Montaguti, Neslin and Valentini (2016) 51Rust and Huang (2014) 261Zhang (2009) 112
Marketing Theory 2 1 Cluley (2019) 1Psychology and Marketing 2 5 Johnson, Bardhi and Dunn (2008) 167
Antón, Camarero and Rodríguez (2013) 100Schweitzer and Van den Hende (2016) 23Rippé et al. (2017) 25Verhagen, van Dolen and Merikivi (2019) 4
Recherche et Applications en Marketing
Off-R. 4 Badot and Lemoine (2013) 46Bèzes (2019) 2Collin-Lachaud and Régine Vanheems (2016) 32Michaud-Trévinal and Stenger (2018) 1
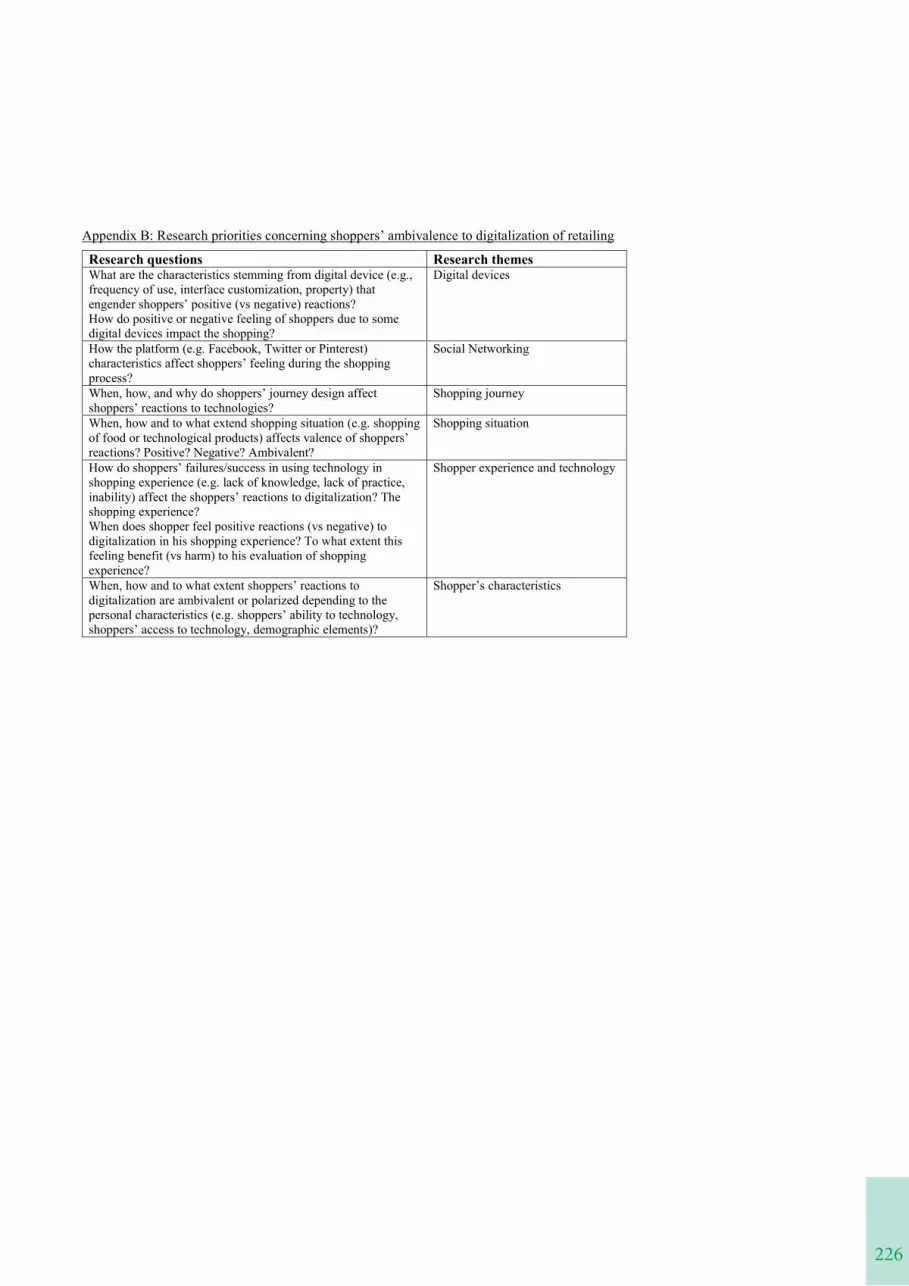
226
Appendix B: Research priorities concerning shoppers’ ambivalence to digitalization of retailing
Research questions Research themesWhat are the characteristics stemming from digital device (e.g., frequency of use, interface customization, property) that engender shoppers’ positive (vs negative) reactions?
Digital devices
How do positive or negative feeling of shoppers due to some digital devices impact the shopping?How the platform (e.g. Facebook, Twitter or Pinterest) characteristics affect shoppers’ feeling during the shopping process?
Social Networking
When, how, and why do shoppers’ journey design affect shoppers’ reactions to technologies?
Shopping journey
When, how and to what extend shopping situation (e.g. shopping of food or technological products) affects valence of shoppers’reactions? Positive? Negative? Ambivalent?
Shopping situation
How do shoppers’ failures/success in using technology in shopping experience (e.g. lack of knowledge, lack of practice, inability) affect the shoppers’ reactions to digitalization? The shopping experience?
Shopper experience and technology
When does shopper feel positive reactions (vs negative) to digitalization in his shopping experience? To what extent this feeling benefit (vs harm) to his evaluation of shopping experience?When, how and to what extent shoppers’ reactions to digitalization are ambivalent or polarized depending to the personal characteristics (e.g. shoppers’ ability to technology, shoppers’ access to technology, demographic elements)?
Shopper’s characteristics
227
1
DIGITAL NATIVES’ BUYING HABITS ACROSS CHANNELS- EVIDENCE FROM CONSUMER DIARIES
Carin RehncronaDepartment of service management and service studies
Lund University, Campus Helsingborg, Sweden
Ola ThufvessonDepartment of service management and service studies
Lund University, Campus Helsingborg, Sweden
IntroductionWith new shopping channels, payment services and devices consumers face more choices in their everyday shopping opportunities. Retail touchpoints have different characteristics and research show that service value across touchpoints in a multichannel environment are experienced differently by consumers (Huré et al. 2017). Boundaries between different digital touchpoints are becoming blurred (Hallikainen et al. 2019), thus it is interesting to see whether this can be found in how and where consumers make their purchases. The different touchpoints can be conceptualised as situational factors, as they do represent situations. Situational factors have in the literature been modelled to represent more cultural and social factors (Grewal and Roggeveen 2020). For this paper, viewing the touchpoint or sales channel as a situational variable acknowledges that it is set in a particular context in terms of how, where and when the consumer shops.
There is extensive research on consumption behaviour in different channels (Frasquet et al.2015, Sands et al. 2016, Frasquet and Miquel 2017, De Haan et al. 2018), however little is known on the more serial behaviour of individual consumers across channels. In addition to new devices that can be used for shopping, new payment solutions have also emerged to accommodate customer needs. Consumption behaviour across channels coupled with payment method used is scarcely researched. As different payment methods have been shown to impact consumption behaviour (Khan et al. 2015, van der Cruijsen and Plooij 2018), the interaction of channel choice and payment method is interesting to pursue.
By studying consumer diaries from young consumers (“digital natives”), a mapping of where and how these consumers buy different products across different retail channel touchpoints can be discerned. This study is done in the context of Sweden, which today is one of the countries with highest level of digitalisation and lowest cash use. New payment services have emerged, for example, digital invoice is becoming increasingly popular. Studies show that many western countries are on the path of becoming cashless (van der Cruijsen and Plooij 2018), thus Sweden serves as an interesting example which can have implications for how development might occur elsewhere.
228
2
The research questions for this paper is as follows: Is there consistency in individuals’ serial shopping behaviour? What patterns can be noted across young consumers’ everyday shopping lives and how do they use different channels and devices for different type of purchases?Exploring the how, when and where of purchases of consumers opens up for further research on the “why”, that is: consumer motivations in the patterns discovered.
PurposeThe purpose of this paper is to map out the everyday purchases of young consumers and investigate how much “digitalisation” that forms their shopping behaviour by analysing which channels, devices and payment methods they use for different type of purchases.
With digitalisation and an increasing number of touchpoints consumers now face greater possibilities for shopping (Treadgold and Reynolds 2016), for this reason their motives have increased in complexity and new ways classifying consumption are increasingly visible in practice and research (Horváth and Adıgüzel 2018). The aim of this paper is to contribute to the understanding of new ways of shopping and making purchases.
Conceptual frameworkEarlier work on consumer behaviour concluded that situational factors and not only individual characteristics have a significant effect on consumer behaviour (Belk 1975). Situational factors have previously have been conceptualised to include factors internal to the participant such as mood, feelings, availability of money (Belk 1974, 1975, Badgaiyan and Verma 2015). The situational factors in this study is simplified into elements outside of the individual person, and thus does not include such internal motivators.
The situational factors for this study include five elements: the purchase amount, product type, store type, sales channel/device used for purchase, payment instrument. How these elements may affect consumer behaviour was conceptualised using previous literature.
The type of device used for shopping can influence behaviour, Wang et al. 2015, find that customers tend to increase their spending when adopting mobile shopping practices (tablet or smartphone), and that mobile devices is to a large extent used for habitual products because of convenience. Customers perceive higher security risks with mobile devices, but still show a higher purchase intention compared to a desktop device (Kaatz 2020). This study theorizes that the extent that different type of products are bought depends on which device that is used.
Choice of payment method can largely be traced to habit (van der Cruijsen et al. 2017), but preferences also vary with purchase amount and environment (Abdul-Muhmin 2010, Wang and Wolman 2016). Substitution between different payment methods depends to a great extent on convenience (Borzekowski and Kiser 2008), which is also a strong predictor of mobile payment adoption (Park et al. 2019). Spending behaviour can also be affected by method of payment(Khan et al. 2015), for example credit-based alternatives is shown to increase spending (Runnemark et al. 2015). This study theorises that differences in which payment method is used, will vary depending on the five situational elements listed above.
Design/methodology/approachThis paper uses empirical data collected from 119 consumer diaries of persons in between 20-24 years, during 1 week of everyday purchases and transactions. The participants were studentsenrolled in an undergraduate program in service management, of which 30 percent were men.
229
3
Given that all were full-time students, it is assumed that there is a fairly homogenous income distribution among the participants. The data added up to approximately 1600 purchases in total. Collecting data with diaries where doings are recorded continuously can be superior to surveys or interviews where consumers have to estimate their behaviour in past times or hypothetical situations. It has been shown that there is a bias when consumers have to recall their purchases (Wind and Lerner 1979).
The diaries where designed with pre-determined fields, which the consumer had to fill in, but included an open field for self-reflection.
With an initial content analysis, the purchases were divided into categories of “social purchases”, “necessary purchases”, “recreational purchases” and “non-essential purchases”. These categories were based on a synthesis on how previous literature has divided differenttype of purchases.
Subsequently, the data was analysed with descriptive statistics and correlation matrices in order to discover patterns across the consumers. The data was also checked for differences across gender. Furthermore, consistencies/inconsistencies in individual behaviour was studied, for example if an individual was consistent in purchasing certain product types in the same way.
Finally, the respondents’ reflections in the diaries were analysed with content analysis.
Preliminary findingsA majority of the consumers make “social purchases” in the physical environment, such as going to a café for coffee and cake or a bar for beer. Many of them also still buy their groceriesphysically. Other products such as clothes, books, are bought online mostly through the computer, but also on-the-go with their smartphone. The smartphone is frequently used to buy tickets for local transportation and to transfer money between friends and also to pay bills. One consumer gave a reason for paying bills with a smartphone:
“It is easy to scan the bills with your phone, at least those that have a QR-code, then you don’t have to write in the long number series”.
In regard of payment methods, the most used one is the debit card. The purchases made with cash is extremely low, approximately 1-2 percent. Some consumers reflected upon the low use of cash. One expressed that he at one time wanted to use cash but did not have any in his wallet, another one reported that she always used debit card even if she had cash in her wallet because it was faster. Almost none of the consumers use a credit card, however they tend to shop online using invoice as a payment method. Other devices that are used for making purchases included: Smartwatch, Game console and TV.
We find that these consumers are not always planned in their shopping behaviour and use different channels for the same type of products. One example is a woman who one day shops for groceries in a physical store, and then the following purchase the same day she orders a single toothbrush online from an online retailer that offers pharmaceuticals and hygiene products. In this instance the rational thing would have been to buy the toothbrush with the grocery shopping, it is also intuitively struck as odd to order a toothbrush online if it was something that she had forgotten during the grocery shopping as it would take a few days to deliver. Finally, not dwelling too much on the toothbrush, it is also traditionally categorised as an ordinary good or repeat purchases which would then also not be an expected one time online purchase. But this and other examples are perhaps signs that everyday purchases are moving to the online channel.
2
The research questions for this paper is as follows: Is there consistency in individuals’ serial shopping behaviour? What patterns can be noted across young consumers’ everyday shopping lives and how do they use different channels and devices for different type of purchases?Exploring the how, when and where of purchases of consumers opens up for further research on the “why”, that is: consumer motivations in the patterns discovered.
PurposeThe purpose of this paper is to map out the everyday purchases of young consumers and investigate how much “digitalisation” that forms their shopping behaviour by analysing which channels, devices and payment methods they use for different type of purchases.
With digitalisation and an increasing number of touchpoints consumers now face greater possibilities for shopping (Treadgold and Reynolds 2016), for this reason their motives have increased in complexity and new ways classifying consumption are increasingly visible in practice and research (Horváth and Adıgüzel 2018). The aim of this paper is to contribute to the understanding of new ways of shopping and making purchases.
Conceptual frameworkEarlier work on consumer behaviour concluded that situational factors and not only individual characteristics have a significant effect on consumer behaviour (Belk 1975). Situational factors have previously have been conceptualised to include factors internal to the participant such as mood, feelings, availability of money (Belk 1974, 1975, Badgaiyan and Verma 2015). The situational factors in this study is simplified into elements outside of the individual person, and thus does not include such internal motivators.
The situational factors for this study include five elements: the purchase amount, product type, store type, sales channel/device used for purchase, payment instrument. How these elements may affect consumer behaviour was conceptualised using previous literature.
The type of device used for shopping can influence behaviour, Wang et al. 2015, find that customers tend to increase their spending when adopting mobile shopping practices (tablet or smartphone), and that mobile devices is to a large extent used for habitual products because of convenience. Customers perceive higher security risks with mobile devices, but still show a higher purchase intention compared to a desktop device (Kaatz 2020). This study theorizes that the extent that different type of products are bought depends on which device that is used.
Choice of payment method can largely be traced to habit (van der Cruijsen et al. 2017), but preferences also vary with purchase amount and environment (Abdul-Muhmin 2010, Wang and Wolman 2016). Substitution between different payment methods depends to a great extent on convenience (Borzekowski and Kiser 2008), which is also a strong predictor of mobile payment adoption (Park et al. 2019). Spending behaviour can also be affected by method of payment(Khan et al. 2015), for example credit-based alternatives is shown to increase spending (Runnemark et al. 2015). This study theorises that differences in which payment method is used, will vary depending on the five situational elements listed above.
Design/methodology/approachThis paper uses empirical data collected from 119 consumer diaries of persons in between 20-24 years, during 1 week of everyday purchases and transactions. The participants were studentsenrolled in an undergraduate program in service management, of which 30 percent were men.
230
4
Original/valueIn contrast to previous diary studies, this systematically takes into account that consumers can shop in different channels on different devices. It shows the serial behaviour of individual consumers and which channels they choose for different type of products and services. It draws conclusions on patterns which can be seen among young consumers’ shopping habits. This is of interest to marketers in understanding shopping behaviour in the increased digital retail landscape.
Practical implicationsFrom the analysis of where young consumers buy products and through which devices, companies can adapt their service offer for this target group and also make sure to be present at the particular touchpoint where it is most likely that they will make a purchase.
Social implicationsWith less cash use, consumers are able to gain control over their spending since everything is registered electronically. It might however also contribute to more spending since research has shown that consumers have a higher willingness to pay with debit card rather than cash(Runnemark et al. 2015). With new credit options available this might affect young consumers to add more debt to their account without thinking of the consequences.
ReferencesAbdul-Muhmin, A.G., 2010. Transaction size effects on consumers’ retail payment mode
choice. International Journal of Retail & Distribution Management, 38 (2), 460–478.
Badgaiyan, A.J. and Verma, A., 2015. Does urge to buy impulsively differ from impulsive buying behaviour? Assessing the impact of situational factors. Journal of Retailing and Consumer Services, 22, 145–157.
Belk, R.W., 1974. An Exploratory Assessment of Situational Effects in Buyer Behavior. Journal of Marketing Research, 11 (2), 156.
Belk, R.W., 1975. Situational Variables and Consumer Behavior. Journal of Consumer Research, 2 (3), 157.
Borzekowski, R. and Kiser, E.K., 2008. The choice at the checkout: Quantifying demand across payment instruments. International Journal of Industrial Organization, 26, 889–902.
van der Cruijsen, C., Hernandez, L., and Jonker, N., 2017. In love with the debit card but still married to cash. Applied Economics, 49 (30), 2989–3004.
van der Cruijsen, C. and Plooij, M., 2018. Drivers of Payment Patterns at the Point of Sale: Stable or Not? Contemporary Economic Policy, 36 (2), 363–380.
Frasquet, M. and Miquel, M.-J., 2017. Do channel integration efforts pay-off in terms of online and offline customer loyalty? International Journal of Retail & Distribution Management,45 (7/8), 859–873.
Frasquet, M., Mollá, A., and Ruiz, E., 2015. Identifying patterns in channel usage across the search, purchase and post-sales stages of shopping. Electronic Commerce Research and Applications, 14 (6), 654–665.
231
5
Grewal, D. and Roggeveen, A.L., 2020. Understanding Retail Experiences and Customer Journey Management. Journal of Retailing, 96 (1), 3–8.
De Haan, E., Kannan, P.K., Verhoef, P.C., and Wiesel, T., 2018. Device switching in online purchasing: Examining the strategic contingencies. Journal of Marketing, 82 (5), 1–19.
Hallikainen, H., Alamäki, A., and Laukkanen, T., 2019. Individual preferences of digital touchpoints: A latent class analysis. Journal of Retailing and Consumer Services, 50 (July 2018), 386–393.
Horváth, C. and Adıgüzel, F., 2018. Shopping enjoyment to the extreme: Hedonic shopping motivations and compulsive buying in developed and emerging markets. Journal of Business Research, 86, 300–310.
Huré, E., Picot-Coupey, K., and Ackermann, C.-L., 2017. Understanding omni-channel shopping value: A mixed-method study. Journal of Retailing and Consumer Services, 39, 314–330.
Kaatz, C., 2020. Retail in my pocket– replicating and extending the construct of service quality into the mobile commerce context. Journal of Retailing and Consumer Services, 53.
Khan, J., Belk, R.W., and Craig-Lees, M., 2015. Measuring consumer perceptions of payment mode. Journal of Economic Psychology, 47, 34–49.
Park, J.K., Ahn, J., Thavisay, T., and Ren, T., 2019. Examining the role of anxiety and social influence in multi-benefits of mobile payment service. Journal of Retailing and Consumer Services, 47, 140–149.
Runnemark, E., Hedman, J., and Xiao, X., 2015. Do consumers pay more using debit cards than cash? Electronic Commerce Research and Applications, 14, 285–291.
Sands, S., Ferraro, C., Campbell, C., and Pallant, J., 2016. Segmenting multichannel consumers across search, purchase and after-sales. Journal of Retailing and Consumer Services, 33, 62–71.
Treadgold, A.D. and Reynolds, J., 2016. Navigating the new retail landscape : a guide for business leaders. Oxford : Oxford University Press, 2016.
Wang, R.J.H., Malthouse, E.C., and Krishnamurthi, L., 2015. On the Go: How Mobile Shopping Affects Customer Purchase Behavior. Journal of Retailing, 91 (2), 217–234.
Wang, Z. and Wolman, A.L., 2016. Payment choice and currency use: Insights from two billion retail transactions. Journal of Monetary Economics, 84, 94–115.
Wind, Y. and Lerner, D., 1979. On the Measurement of Purchase Data: Surveys versus Purchase Diaries. Journal of Marketing Research, 16 (1), 39.
KeywordsMulti-channel shoppers, Payment services, Young consumers, Diary study, Channel choice,On-the-go consumption
4
Original/valueIn contrast to previous diary studies, this systematically takes into account that consumers can shop in different channels on different devices. It shows the serial behaviour of individual consumers and which channels they choose for different type of products and services. It draws conclusions on patterns which can be seen among young consumers’ shopping habits. This is of interest to marketers in understanding shopping behaviour in the increased digital retail landscape.
Practical implicationsFrom the analysis of where young consumers buy products and through which devices, companies can adapt their service offer for this target group and also make sure to be present at the particular touchpoint where it is most likely that they will make a purchase.
Social implicationsWith less cash use, consumers are able to gain control over their spending since everything is registered electronically. It might however also contribute to more spending since research has shown that consumers have a higher willingness to pay with debit card rather than cash(Runnemark et al. 2015). With new credit options available this might affect young consumers to add more debt to their account without thinking of the consequences.
ReferencesAbdul-Muhmin, A.G., 2010. Transaction size effects on consumers’ retail payment mode
choice. International Journal of Retail & Distribution Management, 38 (2), 460–478.
Badgaiyan, A.J. and Verma, A., 2015. Does urge to buy impulsively differ from impulsive buying behaviour? Assessing the impact of situational factors. Journal of Retailing and Consumer Services, 22, 145–157.
Belk, R.W., 1974. An Exploratory Assessment of Situational Effects in Buyer Behavior. Journal of Marketing Research, 11 (2), 156.
Belk, R.W., 1975. Situational Variables and Consumer Behavior. Journal of Consumer Research, 2 (3), 157.
Borzekowski, R. and Kiser, E.K., 2008. The choice at the checkout: Quantifying demand across payment instruments. International Journal of Industrial Organization, 26, 889–902.
van der Cruijsen, C., Hernandez, L., and Jonker, N., 2017. In love with the debit card but still married to cash. Applied Economics, 49 (30), 2989–3004.
van der Cruijsen, C. and Plooij, M., 2018. Drivers of Payment Patterns at the Point of Sale: Stable or Not? Contemporary Economic Policy, 36 (2), 363–380.
Frasquet, M. and Miquel, M.-J., 2017. Do channel integration efforts pay-off in terms of online and offline customer loyalty? International Journal of Retail & Distribution Management,45 (7/8), 859–873.
Frasquet, M., Mollá, A., and Ruiz, E., 2015. Identifying patterns in channel usage across the search, purchase and post-sales stages of shopping. Electronic Commerce Research and Applications, 14 (6), 654–665.
232
“AT THE SOURCE OF INTEGRATED INTERACTIONS ACROSS CHANNELS”
In what is now an omnichannel context, channel integration has become a priority for most retailers. But how in practice should the channels be combined for this integration to be per-ceived by customers? The research design uses an online survey on four different types of existing multi-channel buyers. Based on recent research in psychology, this study conceptually demonstrates that integration perceived by consumers, particularly integrated interactions, is the outcome of a judgment of congruence that, rather than opposing channels, seeks to build relationships between them in order to combine them better. The empirical study shows that channel integration is a cumulative, selective and subjective psychological process.
Full integration does not imply that the retailer in question homogenizes or even matches up all the attributes of its channels. The retailer is thus able to act on attributes that promote this integration, while being relatively free to cultivate the incongruence of other attributes more likely to smoothly guide customers to a particular channel – in other words, a path midway between cross-channel and omnichannel.
233
“THE GAME OF SHOPPING: HOW TO ENGAGE CONSUMERS TO BUY TOWARDS MOBILE APPS”
Francesca De Canio (University of Modena and Reggio Emilia)Maria Fuentes-Blasco (Pablo de Olavide University)Elisa Martinelli (University of Modena and Reggio Emilia)
Purpose – The purpose of this paper is to examine the influence of several intrinsic motivations on the consumer’s buying intention using a mobile device, namely shopping gamification, focused attention, shopping enjoyment and socialness, through the mediating role of shopping engagement. Moreover, the online shopping experience is investigated in its dual role as direct driver of the intention to buy in a mobile app and as moderator of the shopping engagement – the intention to buy using a mobile app path.
Design/methodology/approach – The empirical analysis was performed in China due to the extensive usage of mobile shopping apps among the Chinese population. A structural equation model was estimated on 893 valid and completed structured questionnaires collected among Chinese consumers.
Findings – Findings confirm that intrinsic motivations (i.e. shopping gamification, focused attention, shopping enjoyment and socialness) indirectly influence the intention to buy using a mobile device by the means of shopping engagement. Most remarkably, results show that online shopping experience positively moderates the shopping engagement – intention to buy using a mobile app relationship.
Originality/Value –The novelty of the paper lies in the analysis of several intrinsic motivations related to shopping gamification, contributing to the scant literature on the topic. The study investigates intrinsic motivations as antecedents of shopping engagement and indirectly of the mobile shopping intention. Furthermore, the paper provides insights into the moderating role of the online shopping experience.
Keywords – Mobile shopping; Engagement; Gamification; Online shopping experience.
Paper Type – Research paper
“AT THE SOURCE OF INTEGRATED INTERACTIONS ACROSS CHANNELS”
In what is now an omnichannel context, channel integration has become a priority for most retailers. But how in practice should the channels be combined for this integration to be per-ceived by customers? The research design uses an online survey on four different types of existing multi-channel buyers. Based on recent research in psychology, this study conceptually demonstrates that integration perceived by consumers, particularly integrated interactions, is the outcome of a judgment of congruence that, rather than opposing channels, seeks to build relationships between them in order to combine them better. The empirical study shows that channel integration is a cumulative, selective and subjective psychological process.
Full integration does not imply that the retailer in question homogenizes or even matches up all the attributes of its channels. The retailer is thus able to act on attributes that promote this integration, while being relatively free to cultivate the incongruence of other attributes more likely to smoothly guide customers to a particular channel – in other words, a path midway between cross-channel and omnichannel.
234
1
THE IMPACT OF THE INTRODUCTION OF THE ONLINE CHANNEL IN GROCERY CONSUMER BEHAVIOR1
Alejandro Mollá-DescalsDepartamento de Comercialización e Investigación de Mercados
Universitat de Valencia, Valencia, [email protected]
María-Eugenia Ruiz-MolinaDepartamento de Comercialización e Investigación de Mercados
Universitat de Valencia, Valencia, [email protected]
María Caballer-TarazonaDepartamento de Economía Aplicada
Universitat de Valencia, Valencia, [email protected]
Cristina Pardo-GarcíaDepartamento de Economía Aplicada
Universitat de Valencia, Valencia, [email protected]
Trinidad Casasús-EstellésDepartamento de Matemáticas para la Economía y la Empresa
Universitat de Valencia, Valencia, [email protected]
IntroductionNowadays, companies and consumers interact in a multichannel context in which the proliferation of channels and devices define the main business challenges (Grewal et al., 2017; Leeflang et al., 2014; Verhoef et al., 2015). The multichannel strategy means that new channels are added to the existing channel mix, allowing consumers to combine different channels during the purchasing process. Following Lamberton and Stephen (2016), the distinction between digital and traditional marketing is no longer valid in some settings in which almost all the marketing activities have some digital features. In this regard, the Marketing Science Institute (MSI, 2018) highlights that the consumer hyperconnectivity influences the way customers interact with companies and underlines the need to understand the complex journeys of the new purchasing processes.
Notwithstanding, the literature still has not provided conclusive evidence on the profitability of the multichannel strategy. In this sense, whereas some initial studies in the multichannel context argued that multichannel consumers are more loyal to the company (Wallace et al., 2004; Venkatesan et al., 2007), other authors point out that loyalty to the new online channel
1 This paper was financed by the Spanish Ministry of Science, Innovation and Universities, Spanish State Research Agency (Research Grant ECO 2017-83051-R).
235
2
is lower than loyalty to the pre-existing channel, and indeed, loyalty to both channels decreases with the addition of a new channel (Gensler et al., 2007). This fact has been justified in the sense that, as far as consumers gain experience in the online purchasing process, they start to easily switch from the online store of a retailer to the e-store of anotherretailer, what would suggest that multichannel buyers are less loyal to the retailer (Bilgicer et al., 2016).
Moreover, many retailers are in transition to the multichannel retailing, thus needing to reset their capabilities to manage marketing channels, new logistic processes, and the huge quantity of data that the multichannel activity generates.
PurposeThe main aim of this study is to analyse the impact of the introduction of the online channel on consumer behaviour, with a double objective: firstly, to shed light on the existent controversy in the literature regarding whether the online channel contributes or not to increase customer loyalty towards the retailer and, secondly, to infer managerial implications for the management of the online and offline channels of retailers. To achieve this aim, we analyse the combined use of the online and offline channels by multichannel grocery shoppers, characterised by repetitive, utilitarian purchases with low risk (mainly packaged food products).
Conceptual frameworkRetailers have massively opened online stores, initially managing the online channel as an independent division, but later trying to coordinate and integrate the online and the offline channels (Herhausen et al., 2015), in transition from a multichannel model to an multichannel model that aims to blur the borders between both channels (Verhoef et al., 2015). Some initial studies in the multichannel context argued that the multichannel consumer was more loyal to the company (Wallace et al., 2004; Venkatesan et al., 2007). In contrast, after exploring theloyalty to the different channels of the company, Gensler et al. (2007) found that the loyalty to the new online channel is lower than the one of the pre-existing channel, and moreover, the loyalty to both channels diminishes with the addition of a new channel. Similarly, Bilgicer et al. (2016) found that as far as consumers gain experience in the online purchasing process, it becomes easier for them to switch from a retailer’s online store to the website of another retailer, thus resulting in lower levels of loyalty towards the retailer.
To deepen in the understanding of the purchasing processes in the multichannel context, Bradlow et al. (2017) highlight the need to use a huge quantity and variety of data at individual level that the multichannel customer generates. These include the transactional data of the offline and the online channels, provided by loyalty cards, among others (Grewal et al., 2017). Focusing on customers who are holders of a loyalty card, we assume that the retailer’s decision to add a new channel may facilitate purchasing from this retailer and, therefore, the benefits from being a loyal customer of this retailer. Thus, we posit:
H1: The introduction of the online channel contributes to increase customer loyalty towards the retailer.In order to differentiate themselves from competitors and increase customer loyalty, retailers have introduced and developed a strategy regarding private labels (PL) or store brands (Ailawadi et al., 2008). Past research has found that non-users of PLs know less about these brands than non-users of national brands about the latter (Dawes and Nenycz-Thiel, 2014). This difference in knowledge about brands has been explained by out-of-store advertising for national brands. Notwithstanding, in the online environment, private labels may be more likely to be noticed by non-users thanks to the retailer’s actions, e.g. links to PL lines in the
1
THE IMPACT OF THE INTRODUCTION OF THE ONLINE CHANNEL IN GROCERY CONSUMER BEHAVIOR1
Alejandro Mollá-DescalsDepartamento de Comercialización e Investigación de Mercados
Universitat de Valencia, Valencia, [email protected]
María-Eugenia Ruiz-MolinaDepartamento de Comercialización e Investigación de Mercados
Universitat de Valencia, Valencia, [email protected]
María Caballer-TarazonaDepartamento de Economía Aplicada
Universitat de Valencia, Valencia, [email protected]
Cristina Pardo-GarcíaDepartamento de Economía Aplicada
Universitat de Valencia, Valencia, [email protected]
Trinidad Casasús-EstellésDepartamento de Matemáticas para la Economía y la Empresa
Universitat de Valencia, Valencia, [email protected]
IntroductionNowadays, companies and consumers interact in a multichannel context in which the proliferation of channels and devices define the main business challenges (Grewal et al., 2017; Leeflang et al., 2014; Verhoef et al., 2015). The multichannel strategy means that new channels are added to the existing channel mix, allowing consumers to combine different channels during the purchasing process. Following Lamberton and Stephen (2016), the distinction between digital and traditional marketing is no longer valid in some settings in which almost all the marketing activities have some digital features. In this regard, the Marketing Science Institute (MSI, 2018) highlights that the consumer hyperconnectivity influences the way customers interact with companies and underlines the need to understand the complex journeys of the new purchasing processes.
Notwithstanding, the literature still has not provided conclusive evidence on the profitability of the multichannel strategy. In this sense, whereas some initial studies in the multichannel context argued that multichannel consumers are more loyal to the company (Wallace et al., 2004; Venkatesan et al., 2007), other authors point out that loyalty to the new online channel
1 This paper was financed by the Spanish Ministry of Science, Innovation and Universities, Spanish State Research Agency (Research Grant ECO 2017-83051-R).
236
3
retailer’s online store. Indeed, empirical evidence has been found in the sense that PL products enjoy a slightly higher share of purchases online than offline (Dawes and Nenycz-Thiel, 2014). Thus, we posit:
H2: The introduction of the online channel contributes to increase sales of the retailer’s products under private label.
Design/methodology/approachTo achieve the proposed objective, quantitative research has been conducted using scanner data.Table 1 shows the main research features.
TABLE 1. Technical details of the researchUniverse Grocery shoppersGeographical scope Spain
Sample size 4,780,236 tickets belonging to 2,494 multichannel member customers (584,619 online tickets and 4,195,617 offline tickets)
Sample design Scanner data (tickets of online and offline purchases)Data collection period 18 months before and 18 months after the introduction of the online channel
Statistical techniques
Descriptive analysisNon-parametric tests for means differences between groups (related samples)
Statistical Software R version 3.4.2IBM SPSS version 26
In order to conduct this study, we have a database of purchase tickets from one of the largest grocery retailers in Spain, that includes data on purchases made both online and offline by customer cardholders of the loyalty program.
Only tickets of customers who have been holders of a member customer card during the whole period of the study (i.e. 18 months before and 18 months after the introduction of the online channel) have been taken into consideration for the present analyses.
In order to analyze the behavior of those that may be considered as regular, representative customers of this retailer and exclude outliers, we consider in the final sample the tickets of those consumers whose total expenditure in the whole period is between the first quartile (i.e. Q1 = 4,054.07 euro) and the third quartile (i.e. Q3 = 15,832 euro). The household average expenditure in groceries in Spain in 2018, 4,223.33 euro, according to the Spanish Institute of Statistics (INE, 2020), is included in this rank (i.e. between 1,351.36 and 5,277 euro per year), so that we can consider this sample as representative of the Spanish population of grocery consumers. Finally, data for 1,041 customers were analyzed in the present study.
FindingsSince the objective of this paper is to analyze multichannel consumer behavior after the introduction of the online channel in comparison to the previous period, the analysis is focused on scanner data of multichannel consumers (i.e. holders of the retailer’s loyalty card that have ever bought online during the period studied).
Regarding the average expenditure per customer (in general, for all products), the purchase frequency (number of tickets), total expenditure and average percentage of expenditure in private label, Table 2 shows average values and non-parametric tests for differences between groups, i.e. Z for the Wilcoxon signed ranks test and for the Signs test.
TABLE 2. Average values and non-parametric tests for differences between groups
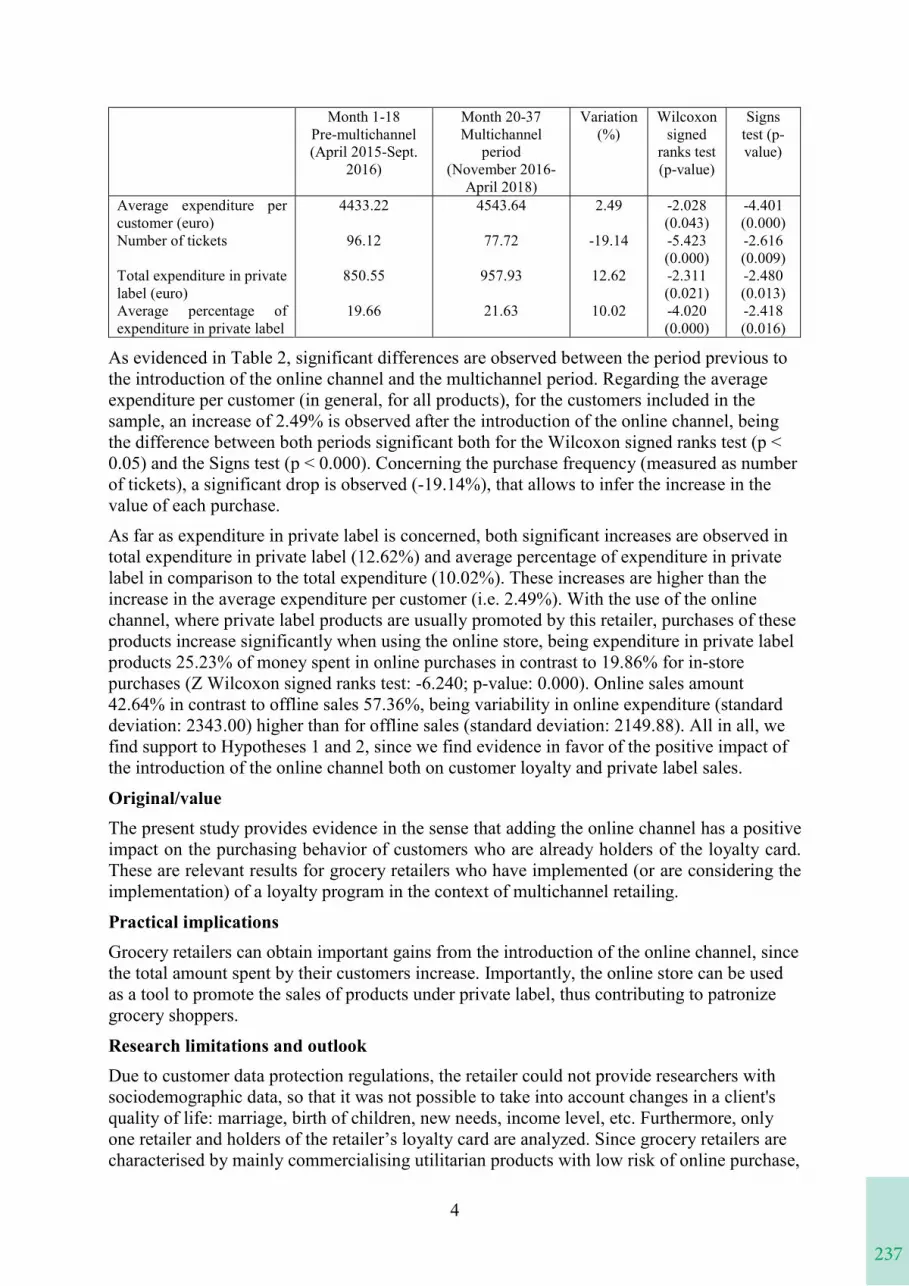
237
4
Month 1-18Pre-multichannel(April 2015-Sept.
2016)
Month 20-37Multichannel
period(November 2016-
April 2018)
Variation (%)
Wilcoxon signed
ranks test(p-value)
Signs test (p-value)
Average expenditure per customer (euro)Number of tickets
Total expenditure in private label (euro)Average percentage of expenditure in private label
4433.22
96.12
850.55
19.66
4543.64
77.72
957.93
21.63
2.49
-19.14
12.62
10.02
-2.028(0.043)-5.423(0.000)-2.311(0.021)-4.020(0.000)
-4.401(0.000)-2.616(0.009)-2.480(0.013)-2.418(0.016)
As evidenced in Table 2, significant differences are observed between the period previous to the introduction of the online channel and the multichannel period. Regarding the average expenditure per customer (in general, for all products), for the customers included in the sample, an increase of 2.49% is observed after the introduction of the online channel, being the difference between both periods significant both for the Wilcoxon signed ranks test (p < 0.05) and the Signs test (p < 0.000). Concerning the purchase frequency (measured as number of tickets), a significant drop is observed (-19.14%), that allows to infer the increase in the value of each purchase.
As far as expenditure in private label is concerned, both significant increases are observed in total expenditure in private label (12.62%) and average percentage of expenditure in private label in comparison to the total expenditure (10.02%). These increases are higher than the increase in the average expenditure per customer (i.e. 2.49%). With the use of the online channel, where private label products are usually promoted by this retailer, purchases of these products increase significantly when using the online store, being expenditure in private label products 25.23% of money spent in online purchases in contrast to 19.86% for in-store purchases (Z Wilcoxon signed ranks test: -6.240; p-value: 0.000). Online sales amount42.64% in contrast to offline sales 57.36%, being variability in online expenditure (standard deviation: 2343.00) higher than for offline sales (standard deviation: 2149.88). All in all, we find support to Hypotheses 1 and 2, since we find evidence in favor of the positive impact of the introduction of the online channel both on customer loyalty and private label sales.
Original/valueThe present study provides evidence in the sense that adding the online channel has a positive impact on the purchasing behavior of customers who are already holders of the loyalty card.These are relevant results for grocery retailers who have implemented (or are considering the implementation) of a loyalty program in the context of multichannel retailing.
Practical implicationsGrocery retailers can obtain important gains from the introduction of the online channel, since the total amount spent by their customers increase. Importantly, the online store can be used as a tool to promote the sales of products under private label, thus contributing to patronize grocery shoppers.
Research limitations and outlookDue to customer data protection regulations, the retailer could not provide researchers with sociodemographic data, so that it was not possible to take into account changes in a client's quality of life: marriage, birth of children, new needs, income level, etc. Furthermore, only one retailer and holders of the retailer’s loyalty card are analyzed. Since grocery retailers are characterised by mainly commercialising utilitarian products with low risk of online purchase,
3
retailer’s online store. Indeed, empirical evidence has been found in the sense that PL products enjoy a slightly higher share of purchases online than offline (Dawes and Nenycz-Thiel, 2014). Thus, we posit:
H2: The introduction of the online channel contributes to increase sales of the retailer’s products under private label.
Design/methodology/approachTo achieve the proposed objective, quantitative research has been conducted using scanner data.Table 1 shows the main research features.
TABLE 1. Technical details of the researchUniverse Grocery shoppersGeographical scope Spain
Sample size 4,780,236 tickets belonging to 2,494 multichannel member customers (584,619 online tickets and 4,195,617 offline tickets)
Sample design Scanner data (tickets of online and offline purchases)Data collection period 18 months before and 18 months after the introduction of the online channel
Statistical techniques
Descriptive analysisNon-parametric tests for means differences between groups (related samples)
Statistical Software R version 3.4.2IBM SPSS version 26
In order to conduct this study, we have a database of purchase tickets from one of the largest grocery retailers in Spain, that includes data on purchases made both online and offline by customer cardholders of the loyalty program.
Only tickets of customers who have been holders of a member customer card during the whole period of the study (i.e. 18 months before and 18 months after the introduction of the online channel) have been taken into consideration for the present analyses.
In order to analyze the behavior of those that may be considered as regular, representative customers of this retailer and exclude outliers, we consider in the final sample the tickets of those consumers whose total expenditure in the whole period is between the first quartile (i.e. Q1 = 4,054.07 euro) and the third quartile (i.e. Q3 = 15,832 euro). The household average expenditure in groceries in Spain in 2018, 4,223.33 euro, according to the Spanish Institute of Statistics (INE, 2020), is included in this rank (i.e. between 1,351.36 and 5,277 euro per year), so that we can consider this sample as representative of the Spanish population of grocery consumers. Finally, data for 1,041 customers were analyzed in the present study.
FindingsSince the objective of this paper is to analyze multichannel consumer behavior after the introduction of the online channel in comparison to the previous period, the analysis is focused on scanner data of multichannel consumers (i.e. holders of the retailer’s loyalty card that have ever bought online during the period studied).
Regarding the average expenditure per customer (in general, for all products), the purchase frequency (number of tickets), total expenditure and average percentage of expenditure in private label, Table 2 shows average values and non-parametric tests for differences between groups, i.e. Z for the Wilcoxon signed ranks test and for the Signs test.
TABLE 2. Average values and non-parametric tests for differences between groups
238
5
results should be validated considering other types of product (e.g. hedonic products and/or items with high risk in online purchasing). Moreover, other food retail formats and additional geographical contexts should be taken into consideration in further research.
ReferencesAilawadi, K.L., Pauwels, K. and Steenkamp, J.-B.E.M. (2008), “Private-label use and storeloyalty”, Journal of Marketing, Vol. 72 No. 6, pp. 19–30.
Bilgicer, T., Jedidi, K., Lehmann, D.R. and Neslin, S.A. (2015), “Social contagion and customer adoption of new sales channels”, Journal of Retailing, Vol. 91 No. 2, pp. 254-271.
Bradlow, E.T., Gangwar, M., Kopalle, P. and Voleti, S. (2017), “The Role of Big Data and Predictive Analytics in Retailing”, Journal of Retailing, Vol. 93 No. 1, pp. 79-95.
Dawes, J. and Nenycz-Thiel, M. (2014), “Comparing retailer purchase patterns and brand metrics for in-store and online grocery purchasing”, Journal of Marketing Management, Vol. 30 No. 3-4, pp. 364-382.
Gensler, S., Dekimpe, M.G. and Skiera, B. (2007), “Evaluating channel performance in multi-channel environments”, Journal of Retailing and Consumer Services, Vol. 14 No. 1, pp. 17-23.
Grewal, D., Roggeveen, A.L. and Nordfält, J. (2017), “The future of retailing”, Journal of Retailing, Vol. 93 No. 1, pp. 1-6.
Herhausen, D., Binder, J., Schögel, M. and Herrmann, A. (2015), “Integrating bricks with clicks: retailer-level and channel-level outcomes of online–offline channel integration”, Journal of Retailing, Vol. 91 No. 2, pp. 309-325.
INE (2020), “Gasto total, gastos medios y distribución del gasto de los hogares”, available at: https://www.ine.es/jaxiT3/Datos.htm?t=24900 (accessed 12 February 2020).
Lamberton, C. and Stephen, A.T. (2016), “A thematic exploration of digital, social media, and mobile marketing: research evolution from 2000 to 2015 and an agenda for future inquiry”,Journal of Marketing, Vol. 80 No. 6, pp. 146-172.
Leeflang, P.S., Verhoef, P.C., Dahlström, P. and Freundt, T. (2014), “Challenges and solutions for marketing in a digital era”, European Management Journal, Vol. 32 No. 1, pp.1-12.
MSI (2018), Research priorities 2018-20, Marketing Science Institute, Cambridge MA, available at: https://www.msi.org/research/2018-2020-research-priorities/ (accessed 27February 2020).
Venkatesan, R., Kumar, V. and Ravishanker, N. (2007), “Multichannel shopping: causes and consequences”, Journal of Marketing, Vol. 71 No. 2, pp. 114-132.Verhoef, P.C., Kannan, P.K. and Inman, J.J. (2015), “From multi-channel retailing to omni-channel retailing”, Journal of Retailing, Vol. 91 No. 2, pp. 174-181.
Wallace, D.W., Giese, J.L. and Johnson, J.L. (2004), “Customer retailer loyalty in the contextof multiple channel strategies”, Journal of Retailing, Vol. 80 No. 4, pp. 249-263.
KeywordsScanner data, online channel, multichannel consumer behavior, grocery retailers.

239
1
ARTIFICIAL INTELLIGENCE IN RETAIL: APPLICATIONS AND
VALUE CREATION LOGICS
CAO LANLAN
Professor, Marketing Department, NEOMA Business School
Boulevard André Siegfried, 76825 Mont-Saint-Aignan, France
Tel. 0033 6 99 58 68 88
240
2
ARTIFICIAL INTELLIGENCE IN RETAIL: APPLICATIONS AND VALUE CREATION LOGICS
IntroductionExponential progress in machine learning, deep learning, natural language processing, and computer vision technology, fueled by combinations of cloud, big data, and new algorithms, is leading to the development of artificial intelligence (AI)-based solutions for retail. However, McKinsey (McKinsey, 2017) revealed that more than four in 10 (41%) of the investigated retailers were uncertain about AI’s benefits, specifically the business cases and return on investment (ROI). Thus, it is important to understand how retailers can apply AI in their diverse activities and create value for themselves and their customers, especially based on multiple-firm case studies (Holtel, 2016, Kaartemo and Helkkula, 2018).
Despite increased attention, the theoretical and empirical knowledge of AI’s applications in retail remains limited and offers few insights to help top managers capture AI-driven business opportunities. Most existing studies investigated only one retail activity, such as sales forecasting (Aras et al., 2017, McIntyre et al., 1993), retail segmentation (Boone and Roehm, 2002), customer service and relationship management (Chopra, 2019, Kumar et al., 2019, Robinson et al., 2019, Seranmadevi and Senthil Kumar, 2019), warehouse management (Mahroof, 2019), or merchandising management (Singh et al., 1988). The investigation of the generic advancement of AI in retail remains limited. (Grewal et al., 2017) broadly envisioned AI’s influence on future retail and (Shankar, 2018) further suggests that retailers can use and benefit from AI in multiple ways. However, their study is descriptive, without providing the details about how retailers can apply AI and create values through the applications. More studies, especially multiple-case ones, are needed to investigate the best practices of AI applications in retail.
Regarding the value creation logics of the application of AI in business and management, most of the existing studies are based on limited logic and have not yet clearly identified the detailed mechanisms linked to each logic. For instance, automation (Duchessi et al., 1993, Garbuio and Lin, 2019, Wright and Schultz, 2018), complementarity (DeCanio, 2016, Jarrahi, 2018, Riikkinen et al., 2018, Shrestha et al., 2019, Singh et al., 2019, Wirth, 2018) and personalization (Garbuio and Lin, 2019, Kumar et al., 2019).
Purpose*We address these theoretical gaps by identifying the main and detailed applications of AI and their value creation logics as well as their related mechanisms in retail.
Conceptual frameworkConceptualizing AI AI is defined as an ability exhibited by machines (Haenlein and Kaplan, 2019, Namaki, 2018, Pan, 2016, Syam and Sharma, 2018, Wirth, 2018). This ability refers to the capabilities of simulating human intelligence, particularly those involving cognition (DeCanio, 2016, Holtel, 2016, Namaki, 2018, Syam and Sharma, 2018).
Second, AI relates to a machine, which is not a simple mechanical device that is not only able to apply preprogrammed decisions (Makridakis, 2017) but is a system that can learn how to learn (Haenlein and Kaplan, 2019, Humerick, 2018). This system perceives its environment and takes actions that maximize its chances of success at a specific goal (Haenlein and Kaplan, 2019, Wirth, 2018).
241
3
Third, AI is not a static state but relates to very dynamic processes (Humerick, 2018, Namaki, 2018, Pan, 2016, Wirth, 2018). These processes allow an AI to “continuously learn from, and solve new problems within, an ever-changing environment, based on its continuing collection of data” (Humerick, 2018), and include “learning (the acquisition of information and rules for the use of this information), reasoning (using rules to reach approximate or definite conclusions) and self-correction (self-initiated adjustment or mending of errors and malfunctions).” (Namaki, 2018).
Understanding AI applications from two perspectivesHow can firms use AI in their business? Two main approaches appear in the literature: data-centric vs. solution-centric perspectives. Data-centric perspectives assert that AI applications are highly data-driven and need to focus on data management (Brock and von Wangenheim, 2019, Shankar, 2018). Firms’ data management capabilities, especially cloud computing (Shankar, 2018), make their data ready for AI to analyse (Brock and von Wangenheim, 2019)and ensure that firms’ computing is powerful enough to support advanced algorithms (e.g. machine learning (ML), deep learning, and neural networks) so as to produce desired results for firms (Seranmadevi and Senthil Kumar, 2019). Vice versa, the adoption of AI technologies boost firms’ data management, especially big data capabilities. AI enables firms to collect huge volumes of data in real time, treat various data (including numeric, text, voice, and visual/image/video data), and analyse big data more effectively (Shankar, 2018). Thus, firms implement AI typically associated with other advanced digital technologies (e.g. Internet of Things / IoT and cloud computing) in firms’ digital transformation projects (Brock and von Wangenheim, 2019).
In contrast, solution-centric perspectives highlight that AI applications are oriented byproviding solutions to help address business issues and need to focus on analyzing the applications landscape (Garbuio and Lin, 2019). AI systems’ contributions are more likely to be a function of how they integrate and interface with other hardware, software, policies, procedures, and organizational arrangements that collectively constitute an improved business process (Duchessi et al., 1993, Kumar et al., 2019). Thus, AI is deployed mostly in support of firms’ existing business, demystifying some of the transformative claims made about AI (Brock and von Wangenheim, 2019).
On its own, neither perspective can fully discuss AI applications because AI applications relate to both digital transformation projects and incremental approaches focused on current business (Brock and von Wangenheim, 2019). We approach our empirical study from both perspectives to understand AI applications, focusing on two main areas: AI-related data management and AI-powered solutions in business.
Value creation logicThe concept of value creation logic, which was originally developed by(Stabell and Fjeldstad, 1998), refers to the typology of the alternative value creation forms for expressing and exploring how firms differ competitively. We adopted (Sorescu et al., 2011) and (Cao et al., 2018) view of value, which focuses on the value created for retailers and their customers.
Design/methodology/approach*To achieve our research objectives we used a multi-case inductive study approach, based on a comparative analysis of 54 retail firms. We followed the procedure recommended by (Eisenhardt, 1989) and (Yin, 1994).
Given the application of AI is developing very quickly in the retail area (Shankar, 2018), we used the Factiva database to identify the most mentioned retail firms at the level of AI’s
2
ARTIFICIAL INTELLIGENCE IN RETAIL: APPLICATIONS AND VALUE CREATION LOGICS
IntroductionExponential progress in machine learning, deep learning, natural language processing, and computer vision technology, fueled by combinations of cloud, big data, and new algorithms, is leading to the development of artificial intelligence (AI)-based solutions for retail. However, McKinsey (McKinsey, 2017) revealed that more than four in 10 (41%) of the investigated retailers were uncertain about AI’s benefits, specifically the business cases and return on investment (ROI). Thus, it is important to understand how retailers can apply AI in their diverse activities and create value for themselves and their customers, especially based on multiple-firm case studies (Holtel, 2016, Kaartemo and Helkkula, 2018).
Despite increased attention, the theoretical and empirical knowledge of AI’s applications in retail remains limited and offers few insights to help top managers capture AI-driven business opportunities. Most existing studies investigated only one retail activity, such as sales forecasting (Aras et al., 2017, McIntyre et al., 1993), retail segmentation (Boone and Roehm, 2002), customer service and relationship management (Chopra, 2019, Kumar et al., 2019, Robinson et al., 2019, Seranmadevi and Senthil Kumar, 2019), warehouse management (Mahroof, 2019), or merchandising management (Singh et al., 1988). The investigation of the generic advancement of AI in retail remains limited. (Grewal et al., 2017) broadly envisioned AI’s influence on future retail and (Shankar, 2018) further suggests that retailers can use and benefit from AI in multiple ways. However, their study is descriptive, without providing the details about how retailers can apply AI and create values through the applications. More studies, especially multiple-case ones, are needed to investigate the best practices of AI applications in retail.
Regarding the value creation logics of the application of AI in business and management, most of the existing studies are based on limited logic and have not yet clearly identified the detailed mechanisms linked to each logic. For instance, automation (Duchessi et al., 1993, Garbuio and Lin, 2019, Wright and Schultz, 2018), complementarity (DeCanio, 2016, Jarrahi, 2018, Riikkinen et al., 2018, Shrestha et al., 2019, Singh et al., 2019, Wirth, 2018) and personalization (Garbuio and Lin, 2019, Kumar et al., 2019).
Purpose*We address these theoretical gaps by identifying the main and detailed applications of AI and their value creation logics as well as their related mechanisms in retail.
Conceptual frameworkConceptualizing AI AI is defined as an ability exhibited by machines (Haenlein and Kaplan, 2019, Namaki, 2018, Pan, 2016, Syam and Sharma, 2018, Wirth, 2018). This ability refers to the capabilities of simulating human intelligence, particularly those involving cognition (DeCanio, 2016, Holtel, 2016, Namaki, 2018, Syam and Sharma, 2018).
Second, AI relates to a machine, which is not a simple mechanical device that is not only able to apply preprogrammed decisions (Makridakis, 2017) but is a system that can learn how to learn (Haenlein and Kaplan, 2019, Humerick, 2018). This system perceives its environment and takes actions that maximize its chances of success at a specific goal (Haenlein and Kaplan, 2019, Wirth, 2018).
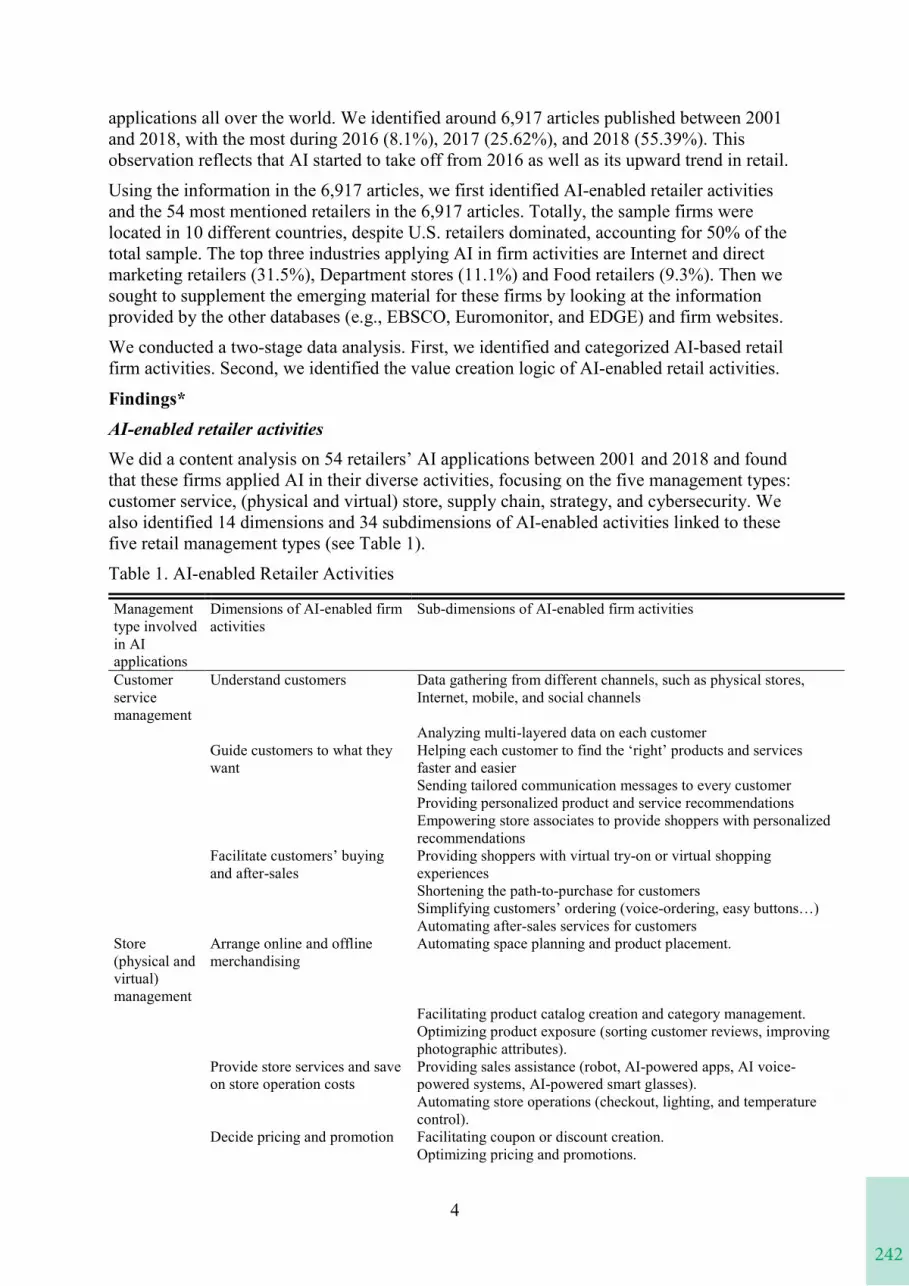
242
4
applications all over the world. We identified around 6,917 articles published between 2001 and 2018, with the most during 2016 (8.1%), 2017 (25.62%), and 2018 (55.39%). This observation reflects that AI started to take off from 2016 as well as its upward trend in retail.
Using the information in the 6,917 articles, we first identified AI-enabled retailer activities and the 54 most mentioned retailers in the 6,917 articles. Totally, the sample firms were located in 10 different countries, despite U.S. retailers dominated, accounting for 50% of the total sample. The top three industries applying AI in firm activities are Internet and direct marketing retailers (31.5%), Department stores (11.1%) and Food retailers (9.3%). Then we sought to supplement the emerging material for these firms by looking at the information provided by the other databases (e.g., EBSCO, Euromonitor, and EDGE) and firm websites.
We conducted a two-stage data analysis. First, we identified and categorized AI-based retail firm activities. Second, we identified the value creation logic of AI-enabled retail activities.
Findings*AI-enabled retailer activitiesWe did a content analysis on 54 retailers’ AI applications between 2001 and 2018 and foundthat these firms applied AI in their diverse activities, focusing on the five management types: customer service, (physical and virtual) store, supply chain, strategy, and cybersecurity. We also identified 14 dimensions and 34 subdimensions of AI-enabled activities linked to these five retail management types (see Table 1).
Table 1. AI-enabled Retailer Activities
Management type involved in AI applications
Dimensions of AI-enabled firm activities
Sub-dimensions of AI-enabled firm activities
Customer service management
Understand customers Data gathering from different channels, such as physical stores, Internet, mobile, and social channels
Analyzing multi-layered data on each customerGuide customers to what they want
Helping each customer to find the ‘right’ products and services faster and easierSending tailored communication messages to every customerProviding personalized product and service recommendationsEmpowering store associates to provide shoppers with personalized recommendations
Facilitate customers’ buying and after-sales
Providing shoppers with virtual try-on or virtual shopping experiencesShortening the path-to-purchase for customers Simplifying customers’ ordering (voice-ordering, easy buttons…)Automating after-sales services for customers
Store (physical and virtual) management
Arrange online and offline merchandising
Automating space planning and product placement.
Facilitating product catalog creation and category management.Optimizing product exposure (sorting customer reviews, improving photographic attributes).
Provide store services and save on store operation costs
Providing sales assistance (robot, AI-powered apps, AI voice-powered systems, AI-powered smart glasses).Automating store operations (checkout, lighting, and temperature control).
Decide pricing and promotion Facilitating coupon or discount creation.Optimizing pricing and promotions.
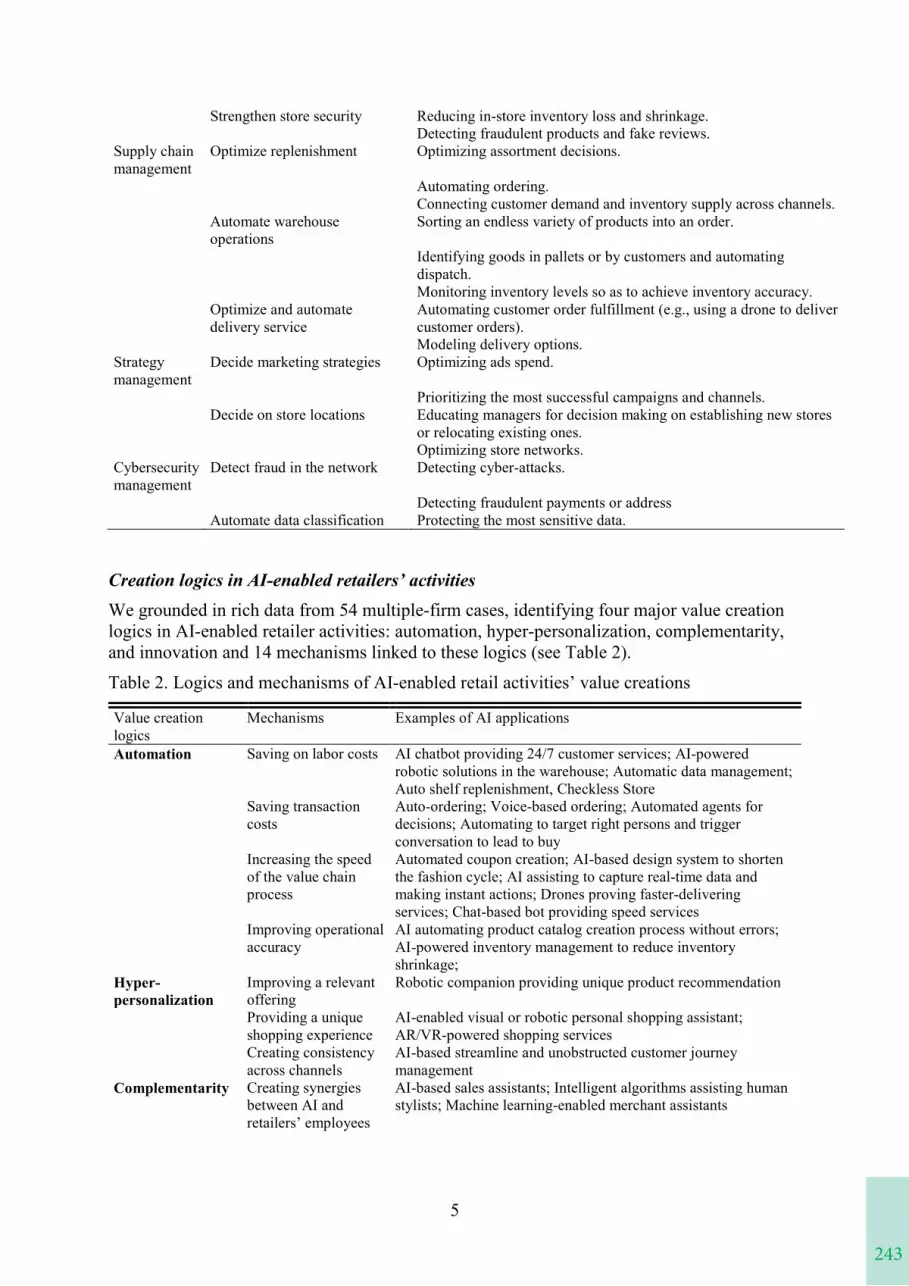
243
5
Strengthen store security Reducing in-store inventory loss and shrinkage.Detecting fraudulent products and fake reviews.
Supply chain management
Optimize replenishment Optimizing assortment decisions.
Automating ordering.Connecting customer demand and inventory supply across channels.
Automate warehouse operations
Sorting an endless variety of products into an order.
Identifying goods in pallets or by customers and automating dispatch.Monitoring inventory levels so as to achieve inventory accuracy.
Optimize and automate delivery service
Automating customer order fulfillment (e.g., using a drone to deliver customer orders).Modeling delivery options.
Strategy management
Decide marketing strategies Optimizing ads spend.
Prioritizing the most successful campaigns and channels.Decide on store locations Educating managers for decision making on establishing new stores
or relocating existing ones.Optimizing store networks.
Cybersecurity management
Detect fraud in the network Detecting cyber-attacks.
Detecting fraudulent payments or addressAutomate data classification Protecting the most sensitive data.
Creation logics in AI-enabled retailers’ activitiesWe grounded in rich data from 54 multiple-firm cases, identifying four major value creation logics in AI-enabled retailer activities: automation, hyper-personalization, complementarity, and innovation and 14 mechanisms linked to these logics (see Table 2).
Table 2. Logics and mechanisms of AI-enabled retail activities’ value creations
Value creation logics
Mechanisms Examples of AI applications
Automation Saving on labor costs AI chatbot providing 24/7 customer services; AI-powered robotic solutions in the warehouse; Automatic data management; Auto shelf replenishment, Checkless Store
Saving transaction costs
Auto-ordering; Voice-based ordering; Automated agents for decisions; Automating to target right persons and trigger conversation to lead to buy
Increasing the speed of the value chain process
Automated coupon creation; AI-based design system to shorten the fashion cycle; AI assisting to capture real-time data and making instant actions; Drones proving faster-delivering services; Chat-based bot providing speed services
Improving operational accuracy
AI automating product catalog creation process without errors; AI-powered inventory management to reduce inventory shrinkage;
Hyper-personalization
Improving a relevant offering
Robotic companion providing unique product recommendation
Providing a unique shopping experience
AI-enabled visual or robotic personal shopping assistant; AR/VR-powered shopping services
Creating consistency across channels
AI-based streamline and unobstructed customer journey management
Complementarity Creating synergies between AI and retailers’ employees
AI-based sales assistants; Intelligent algorithms assisting human stylists; Machine learning-enabled merchant assistants
4
applications all over the world. We identified around 6,917 articles published between 2001 and 2018, with the most during 2016 (8.1%), 2017 (25.62%), and 2018 (55.39%). This observation reflects that AI started to take off from 2016 as well as its upward trend in retail.
Using the information in the 6,917 articles, we first identified AI-enabled retailer activities and the 54 most mentioned retailers in the 6,917 articles. Totally, the sample firms were located in 10 different countries, despite U.S. retailers dominated, accounting for 50% of the total sample. The top three industries applying AI in firm activities are Internet and direct marketing retailers (31.5%), Department stores (11.1%) and Food retailers (9.3%). Then we sought to supplement the emerging material for these firms by looking at the information provided by the other databases (e.g., EBSCO, Euromonitor, and EDGE) and firm websites.
We conducted a two-stage data analysis. First, we identified and categorized AI-based retail firm activities. Second, we identified the value creation logic of AI-enabled retail activities.
Findings*AI-enabled retailer activitiesWe did a content analysis on 54 retailers’ AI applications between 2001 and 2018 and foundthat these firms applied AI in their diverse activities, focusing on the five management types: customer service, (physical and virtual) store, supply chain, strategy, and cybersecurity. We also identified 14 dimensions and 34 subdimensions of AI-enabled activities linked to these five retail management types (see Table 1).
Table 1. AI-enabled Retailer Activities
Management type involved in AI applications
Dimensions of AI-enabled firm activities
Sub-dimensions of AI-enabled firm activities
Customer service management
Understand customers Data gathering from different channels, such as physical stores, Internet, mobile, and social channels
Analyzing multi-layered data on each customerGuide customers to what they want
Helping each customer to find the ‘right’ products and services faster and easierSending tailored communication messages to every customerProviding personalized product and service recommendationsEmpowering store associates to provide shoppers with personalized recommendations
Facilitate customers’ buying and after-sales
Providing shoppers with virtual try-on or virtual shopping experiencesShortening the path-to-purchase for customers Simplifying customers’ ordering (voice-ordering, easy buttons…)Automating after-sales services for customers
Store (physical and virtual) management
Arrange online and offline merchandising
Automating space planning and product placement.
Facilitating product catalog creation and category management.Optimizing product exposure (sorting customer reviews, improving photographic attributes).
Provide store services and save on store operation costs
Providing sales assistance (robot, AI-powered apps, AI voice-powered systems, AI-powered smart glasses).Automating store operations (checkout, lighting, and temperature control).
Decide pricing and promotion Facilitating coupon or discount creation.Optimizing pricing and promotions.
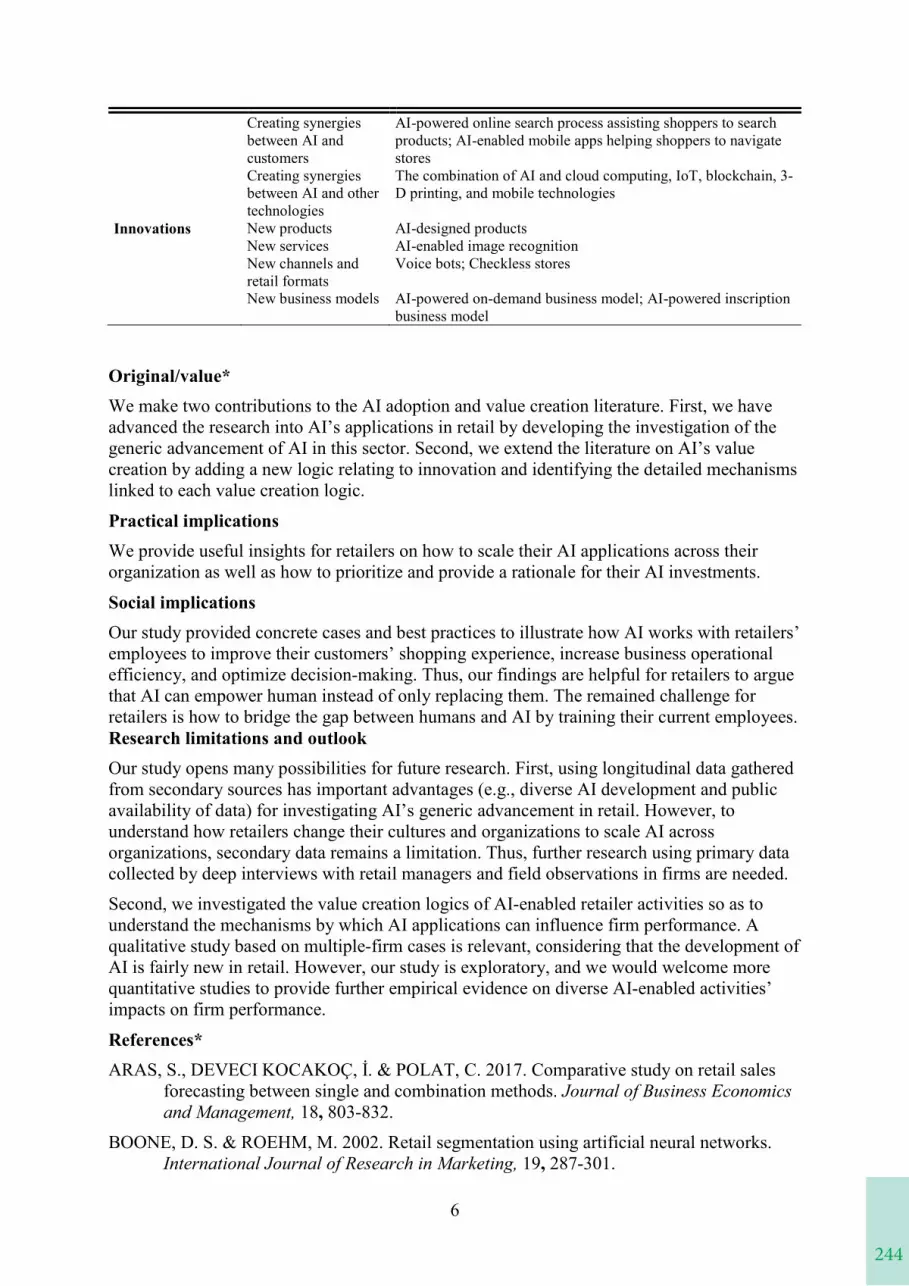
244
6
Creating synergies between AI and customers
AI-powered online search process assisting shoppers to search products; AI-enabled mobile apps helping shoppers to navigate stores
Creating synergies between AI and other technologies
The combination of AI and cloud computing, IoT, blockchain, 3-D printing, and mobile technologies
Innovations New products AI-designed productsNew services AI-enabled image recognitionNew channels and retail formats
Voice bots; Checkless stores
New business models AI-powered on-demand business model; AI-powered inscription business model
Original/value*We make two contributions to the AI adoption and value creation literature. First, we have advanced the research into AI’s applications in retail by developing the investigation of the generic advancement of AI in this sector. Second, we extend the literature on AI’s value creation by adding a new logic relating to innovation and identifying the detailed mechanisms linked to each value creation logic.
Practical implicationsWe provide useful insights for retailers on how to scale their AI applications across their organization as well as how to prioritize and provide a rationale for their AI investments.
Social implicationsOur study provided concrete cases and best practices to illustrate how AI works with retailers’ employees to improve their customers’ shopping experience, increase business operational efficiency, and optimize decision-making. Thus, our findings are helpful for retailers to argue that AI can empower human instead of only replacing them. The remained challenge for retailers is how to bridge the gap between humans and AI by training their current employees. Research limitations and outlookOur study opens many possibilities for future research. First, using longitudinal data gathered from secondary sources has important advantages (e.g., diverse AI development and public availability of data) for investigating AI’s generic advancement in retail. However, to understand how retailers change their cultures and organizations to scale AI across organizations, secondary data remains a limitation. Thus, further research using primary data collected by deep interviews with retail managers and field observations in firms are needed.
Second, we investigated the value creation logics of AI-enabled retailer activities so as to understand the mechanisms by which AI applications can influence firm performance. A qualitative study based on multiple-firm cases is relevant, considering that the development of AI is fairly new in retail. However, our study is exploratory, and we would welcome more quantitative studies to provide further empirical evidence on diverse AI-enabled activities’ impacts on firm performance.
References*ARAS, S., DEVECI KOCAKOÇ, İ. & POLAT, C. 2017. Comparative study on retail sales
forecasting between single and combination methods. Journal of Business Economics and Management, 18, 803-832.
BOONE, D. S. & ROEHM, M. 2002. Retail segmentation using artificial neural networks. International Journal of Research in Marketing, 19, 287-301.
245
7
BROCK, J. K.-U. & VON WANGENHEIM, F. 2019. Demystifying AI: What Digital Transformation Leaders Can Teach You about Realistic Artificial Intelligence. California Management Review, 61, 110-134.
CAO, L., NAVARE, J. & JIN, Z. 2018. Business model innovation: How the international retailers rebuild their core business logic in a new host country. International Business Review, 27, 543-562.
CHOPRA, K. 2019. Indian shopper motivation to use artificial intelligence: Generating Vroom's expectancy theory of motivation using grounded theory approach. International Journal of Retail & Distribution Management, 47, 331-347.
DECANIO, S. J. 2016. Robots and humans – complements or substitutes? Journal of Macroeconomics, 49, 280-291.
DUCHESSI, P., O'KEEFE, R. & O'LEARY, D. 1993. A Research Perspective: Artificial Intelligence, Management and Organizations. International Journal of Intelligent Systems in Accounting Finance & Management, 2, 151-159.
EISENHARDT, K. M. 1989. Building Theories from Case Study Research. Academy of Management.
GARBUIO, M. & LIN, N. 2019. Artificial Intelligence as a Growth Engine for Health Care Startups: EMERGING BUSINESS MODELS. California Management Review, 61,59-83.
GREWAL, D., ROGGEVEEN, A. L. & NORDFÄLT, J. 2017. The Future of Retailing. Journal of Retailing, 93, 1-6.
HAENLEIN, M. & KAPLAN, A. 2019. A Brief History of Artificial Intelligence: On the Past, Present, and Future of Artificial Intelligence. California Management Review,61, 5-14.
HOLTEL, S. 2016. Artificial Intelligence Creates a Wicked Problem for the Enterprise. Procedia Computer Science, 99, 171-180.
HUMERICK, M. 2018. TAKING AI PERSONALLY: HOW THE E.U. MUST LEARN TO BALANCE THE INTERESTS OF PERSONAL DATA PRIVACY & ARTIFICIAL INTELLIGENCE. Santa Clara High Technology Law Journal, 34, 393.
JARRAHI, M. H. 2018. Artificial intelligence and the future of work: Human-AI symbiosis in organizational decision making. Business Horizons, 61, 577-586.
KAARTEMO, V. & HELKKULA, A. 2018. A Systematic Review of Artificial Intelligence and Robots in Value Co-creation: Current Status and Future Research Avenues. Journal of Creating Value, 4, 211.
KUMAR, V., RAJAN, B., VENKATESAN, R. & LECINSKI, J. 2019. Understanding the Role of Artificial Intelligence in Personalized Engagement Marketing. California Management Review, 61, 135-155.
MAHROOF, K. 2019. A human-centric perspective exploring the readiness towards smart warehousing: The case of a large retail distribution warehouse. International Journal of Information Management, 45, 176-190.
MAKRIDAKIS, S. 2017. Forecasting the Impact of Artificial Intelligence (AI). Foresight: The International Journal of Applied Forecasting, 7-13.
6
Creating synergies between AI and customers
AI-powered online search process assisting shoppers to search products; AI-enabled mobile apps helping shoppers to navigate stores
Creating synergies between AI and other technologies
The combination of AI and cloud computing, IoT, blockchain, 3-D printing, and mobile technologies
Innovations New products AI-designed productsNew services AI-enabled image recognitionNew channels and retail formats
Voice bots; Checkless stores
New business models AI-powered on-demand business model; AI-powered inscription business model
Original/value*We make two contributions to the AI adoption and value creation literature. First, we have advanced the research into AI’s applications in retail by developing the investigation of the generic advancement of AI in this sector. Second, we extend the literature on AI’s value creation by adding a new logic relating to innovation and identifying the detailed mechanisms linked to each value creation logic.
Practical implicationsWe provide useful insights for retailers on how to scale their AI applications across their organization as well as how to prioritize and provide a rationale for their AI investments.
Social implicationsOur study provided concrete cases and best practices to illustrate how AI works with retailers’ employees to improve their customers’ shopping experience, increase business operational efficiency, and optimize decision-making. Thus, our findings are helpful for retailers to argue that AI can empower human instead of only replacing them. The remained challenge for retailers is how to bridge the gap between humans and AI by training their current employees. Research limitations and outlookOur study opens many possibilities for future research. First, using longitudinal data gathered from secondary sources has important advantages (e.g., diverse AI development and public availability of data) for investigating AI’s generic advancement in retail. However, to understand how retailers change their cultures and organizations to scale AI across organizations, secondary data remains a limitation. Thus, further research using primary data collected by deep interviews with retail managers and field observations in firms are needed.
Second, we investigated the value creation logics of AI-enabled retailer activities so as to understand the mechanisms by which AI applications can influence firm performance. A qualitative study based on multiple-firm cases is relevant, considering that the development of AI is fairly new in retail. However, our study is exploratory, and we would welcome more quantitative studies to provide further empirical evidence on diverse AI-enabled activities’ impacts on firm performance.
References*ARAS, S., DEVECI KOCAKOÇ, İ. & POLAT, C. 2017. Comparative study on retail sales
forecasting between single and combination methods. Journal of Business Economics and Management, 18, 803-832.
BOONE, D. S. & ROEHM, M. 2002. Retail segmentation using artificial neural networks. International Journal of Research in Marketing, 19, 287-301.
246
8
MCINTYRE, S. H., ACHABAL, D. D. & MILLER, C. M. 1993. Applying Case-Based Reasoning to Forecasting Retail Sales. Journal of Retailing, 69, 372.
MCKINSEY 2017. ARTIFICIAL INTELLIGENCE THE NEXT DIGITAL FRONTIER?
NAMAKI, M. S. S. E. 2018. How Companies are Applying AI to the Business Strategy Formulation. Scholedge International Journal of Business Policy & Governance, 5,77-82.
PAN, Y. 2016. Heading toward Artificial Intelligence 2.0. Engineering, 2, 409-413.
RIIKKINEN, M., SAARIJÄRVI, H., SARLIN, P. & LÄHTEENMÄKI, I. 2018. Using artificial intelligence to create value in insurance. International Journal of Bank Marketing, 36, 1145-1168.
ROBINSON, S., ORSINGHER, C., ALKIRE, L., DE KEYSER, A., GIEBELHAUSEN, M., PAPAMICHAIL, K. N., SHAMS, P. & TEMERAK, M. S. 2019. Frontline encounters of the AI kind: An evolved service encounter framework. Journal of Business Research.
SERANMADEVI, R. & SENTHIL KUMAR, A. 2019. Experiencing the AI emergence in Indian retail – Early adopters approach. Management Science Letters, 9, 33-42.
SHANKAR, V. 2018. How Artificial Intelligence (AI) is Reshaping Retailing. Journal of Retailing, 94, vi-xi.
SHRESTHA, Y. R., BEN-MENAHEM, S. M. & VON KROGH, G. 2019. Organizational Decision-Making Structures in the Age of Artificial Intelligence. California Management Review, 61, 66-83.
SINGH, J., FLAHERTY, K., SOHI, R. S., DEETER-SCHMELZ, D., HABEL, J., LE MEUNIER-FITZHUGH, K., MALSHE, A., MULLINS, R. & ONYEMAH, V. 2019. Sales profession and professionals in the age of digitization and artificial intelligence technologies: concepts, priorities, and questions. Journal of Personal Selling & Sales Management, 39, 2-22.
SINGH, M. G., COOK, R. & CORSTJENS, M. 1988. A Hybrid Knowledge-Based System for Allocating Retail Space and for Other Allocation Problems. Interfaces, 18, 13-22.
SORESCU, A., FRAMBACH, R. T., SINGH, J., RANGASWAMY, A. & BRIDGES, C. 2011. Innovations in Retail Business Models. Journal of Retailing, 87, S3-S16.
STABELL, C. B. & FJELDSTAD, Ø. D. 1998. Configuring value for competitive advantage: On chains, shops, and networks. Strategic Management Journal (John Wiley & Sons, Inc.), 19, 413.
SYAM, N. & SHARMA, A. 2018. Waiting for a sales renaissance in the fourth industrial revolution: Machine learning and artificial intelligence in sales research and practice. Industrial Marketing Management, 69, 135-146.
WIRTH, N. 2018. Hello marketing, what can artificial intelligence help you with? International Journal of Market Research, 60, 435-438.
WRIGHT, S. A. & SCHULTZ, A. E. 2018. The rising tide of artificial intelligence and business automation: Developing an ethical framework. Business Horizons, 61, 823-832.
YIN, R. K. 1994. Case study research: Design and methods (2nd ed), Thousand Oaks, CA, Sage Publishing.

247
9
Keywords*Artificial intelligence, AI, AI application, value creation, retail sector
8
MCINTYRE, S. H., ACHABAL, D. D. & MILLER, C. M. 1993. Applying Case-Based Reasoning to Forecasting Retail Sales. Journal of Retailing, 69, 372.
MCKINSEY 2017. ARTIFICIAL INTELLIGENCE THE NEXT DIGITAL FRONTIER?
NAMAKI, M. S. S. E. 2018. How Companies are Applying AI to the Business Strategy Formulation. Scholedge International Journal of Business Policy & Governance, 5,77-82.
PAN, Y. 2016. Heading toward Artificial Intelligence 2.0. Engineering, 2, 409-413.
RIIKKINEN, M., SAARIJÄRVI, H., SARLIN, P. & LÄHTEENMÄKI, I. 2018. Using artificial intelligence to create value in insurance. International Journal of Bank Marketing, 36, 1145-1168.
ROBINSON, S., ORSINGHER, C., ALKIRE, L., DE KEYSER, A., GIEBELHAUSEN, M., PAPAMICHAIL, K. N., SHAMS, P. & TEMERAK, M. S. 2019. Frontline encounters of the AI kind: An evolved service encounter framework. Journal of Business Research.
SERANMADEVI, R. & SENTHIL KUMAR, A. 2019. Experiencing the AI emergence in Indian retail – Early adopters approach. Management Science Letters, 9, 33-42.
SHANKAR, V. 2018. How Artificial Intelligence (AI) is Reshaping Retailing. Journal of Retailing, 94, vi-xi.
SHRESTHA, Y. R., BEN-MENAHEM, S. M. & VON KROGH, G. 2019. Organizational Decision-Making Structures in the Age of Artificial Intelligence. California Management Review, 61, 66-83.
SINGH, J., FLAHERTY, K., SOHI, R. S., DEETER-SCHMELZ, D., HABEL, J., LE MEUNIER-FITZHUGH, K., MALSHE, A., MULLINS, R. & ONYEMAH, V. 2019. Sales profession and professionals in the age of digitization and artificial intelligence technologies: concepts, priorities, and questions. Journal of Personal Selling & Sales Management, 39, 2-22.
SINGH, M. G., COOK, R. & CORSTJENS, M. 1988. A Hybrid Knowledge-Based System for Allocating Retail Space and for Other Allocation Problems. Interfaces, 18, 13-22.
SORESCU, A., FRAMBACH, R. T., SINGH, J., RANGASWAMY, A. & BRIDGES, C. 2011. Innovations in Retail Business Models. Journal of Retailing, 87, S3-S16.
STABELL, C. B. & FJELDSTAD, Ø. D. 1998. Configuring value for competitive advantage: On chains, shops, and networks. Strategic Management Journal (John Wiley & Sons, Inc.), 19, 413.
SYAM, N. & SHARMA, A. 2018. Waiting for a sales renaissance in the fourth industrial revolution: Machine learning and artificial intelligence in sales research and practice. Industrial Marketing Management, 69, 135-146.
WIRTH, N. 2018. Hello marketing, what can artificial intelligence help you with? International Journal of Market Research, 60, 435-438.
WRIGHT, S. A. & SCHULTZ, A. E. 2018. The rising tide of artificial intelligence and business automation: Developing an ethical framework. Business Horizons, 61, 823-832.
YIN, R. K. 1994. Case study research: Design and methods (2nd ed), Thousand Oaks, CA, Sage Publishing.
248
“THE USE OF ARTIFICIAL INTELLIGENCE IN COMPLAINT MANAGEMENT”
Anne Fota, Katja Wagner, Hanna Schramm-Klein(University of Siegen)
To distinguish from other competitors, companies have to establish good quality and price but also an excellent service policy. Especially the after-sales service should guarantee that customers having problems are supported and satisfied. Following, good complaint management is important. With the increase of economically profitable chatbots, there is a possibility to provide a 24/7 service to the customers. To investigate what kind of chatbot avatar, which compensation, and what kind of reaction lead to a higher behavioral intention, a 2x2x2 between-subject design was conducted (N=389). The results show that the choice of the avatar, the reaction, as well as the compensation, play a decisive role in influencing consumer behavior and, thus, increase the probability that the customer, despite a complaint, returns and buys again from the retailer. Further, the behavioral intention can be explained by the mediating influences of anthropomorphism and the evaluation of redress.
249
REVISITING AUSTRIAN RETAIL LOGISTICS – ANEVALUATION OF PROMISING TECHNOLOGIES AND
FUTURE RETAIL LOGISTICS PRACTICESMarike Kellermayr-Scheucher
University of Applied Sciences Upper Austria, Steyr, Austria,[email protected]
Michael PlaschUniversity of Applied Sciences Upper Austria, Steyr, Austria,
[email protected] Gasperlmair
University of Applied Sciences Upper Austria, Steyr, Austria,[email protected] and
Mark StieningerUniversity of Applied Sciences Upper Austria, Steyr, Austria,
AbstractPurpose – The purpose of the present research refers to the identification and application practice of retail logistics technologies and concepts. It aims at the selection of appropriate novel technologies and concepts considered relevant for application for store retailing in Austrian retail businesses.Design/methodology/approach – The methodology is based on secondary (i.e. literature review) and primary (i.e. qualitative research with semi-structured interviews and an expert workshop) research. To validate literature and the results of the interviews, the expert workshop with interdisciplinary retail technology and retailing experts proofed to be an important methodological step to achieve an unbiased and objective view on insights.Findings – The underlying applied research approach captures the status-quo in retail logistics practice concerning novel technologies and concepts. The web to store / store to web approach is regarded as highly relevant for the future of the Austrian retail from both, retailers and experts. Through its scalability the concept also holds great potential for smaller retail companies.Practical implications – Implications reveal those retail logistics technologies and concepts –corresponding to the research context – that potentially support order processing and the fulfilment of the logistics process steps from a business perspective. This concerns in-store customer experience on the one hand and required order processing as well as logistics fulfilment operations on the other hand.Originality/value – This is the first study that analyses relevance, applicability and fit of retail logistics technologies and concepts in Austrian retail environments.Keywords Retail logistics, Technology integration, Digital retail, Brick-and-mortar retailing, Technology fitPaper type Research paper
IntroductionOnline retailing has been very successful in exploiting the possibilities of digitalization and is thus experiencing an annual increase in revenues. However, brick-and-mortar retail is still the largest sales channel by far (Statista, 2020). For years, the threat from globally operating e-
“THE USE OF ARTIFICIAL INTELLIGENCE IN COMPLAINT MANAGEMENT”
To distinguish from other competitors, companies have to establish good quality and price but also an excellent service policy. Especially the after-sales service should guarantee that customers having problems are supported and satisfied. Following, good complaint management is important. With the increase of economically profitable chatbots, there is a possibility to provide a 24/7 service to the customers. To investigate what kind of chatbot avatar, which compensation, and what kind of reaction lead to a higher behavioral intention, a 2x2x2 between-subject design was conducted (N=389). The results show that the choice of the avatar, the reaction, as well as the compensation, play a decisive role in influencing consumer behavior and, thus, increase the probability that the customer, despite a complaint, returns and buys again from the retailer. Further, the behavioral intention can be explained by the mediating influences of anthropomorphism and the evaluation of redress.
250
commerce companies such as Amazon or Alibaba to store-based retailing has been growing. However, studies show that consumers prefer hybrid shopping models (Arora et al., 2017; Buschmann et al., 2015; Collin-Lachaud and Vanheems, 2016; Metter, 2017) which combine the advantages of both worlds - online and offline - and thus offer maximum benefit and convenience. The rapid growth of the online retail sector has produced numerous innovative products and services. Some of these innovations also offer the opportunity to brick-and-mortar retailing to advance their already existing advantages with new technologies (Grewal et al.,2017). In this vein, especially logistics and its related technologies and concepts play a crucial role in effectively managing these two worlds of retailing. Today, retail logistics is no longer limited to store distribution or warehouse management, but comprises processes including material, information, and financial flows from suppliers to consumers and vice versa. Innovative technologies are expected to impact organizational structure, strategy, communication, and operational procedures of retailers’ businesses (Pantano and Naccarato, 2010; Xing et al., 2011). Applicability and fit of logistics technologies and concepts in future stores will be a decisive element in this disruptive but inevitable development. Scholars as well as practitioners believe that retailing can benefit from these technological opportunities (Willems et al., 2017). However, it is unclear to a certain point, which technologies and concepts (e.g. robotics, exoskeleton systems, 3D-detection systems etc.) are the most promisingfor retail logistics.
Technology investments often bring high costs and disruption – without guarantee of success. Especially smaller retail businesses usually lack resources and expertise to form an opinion on technologies and determine which are worth investing in (Renko and Ficko, 2010). For that reason, they are the last to adopt novel technologies (Pantano and Vannucci, 2019). However,when it comes to the development and expansion of the range of services offered by technology-supported processes in logistics, companies of all sizes are facing major challenges. Big retail companies are mostly faster in testing as well as adopting novel technologies, due to their financial capabilities and the corresponding risk-taking propensity. This is why our research focus is on them.
Our research investigates the current state of store-based retailing in Austria. The focus is on the logistics technologies and concepts that potentially support order processing and the fulfilment of the logistics process steps from a business perspective. In order to meet customer requirements in stores and enhance overall process performance, the supporting logistics processes are decisive for retailers. However, technology-supported processes in logistics should not be considered for their own sake – without taking the practical relevance into account (Stern and Ander, 2008).
The research question, the methodology and the context of the research are presented in the following section. Afterwards the steps of the chosen research design and the sample of the investigated companies are described. Next, identified retail logistics technologies and business perspectives from the secondary research are discussed. This is followed by the results and implications. Finally, limitations, an outlook and the conclusion are provided.
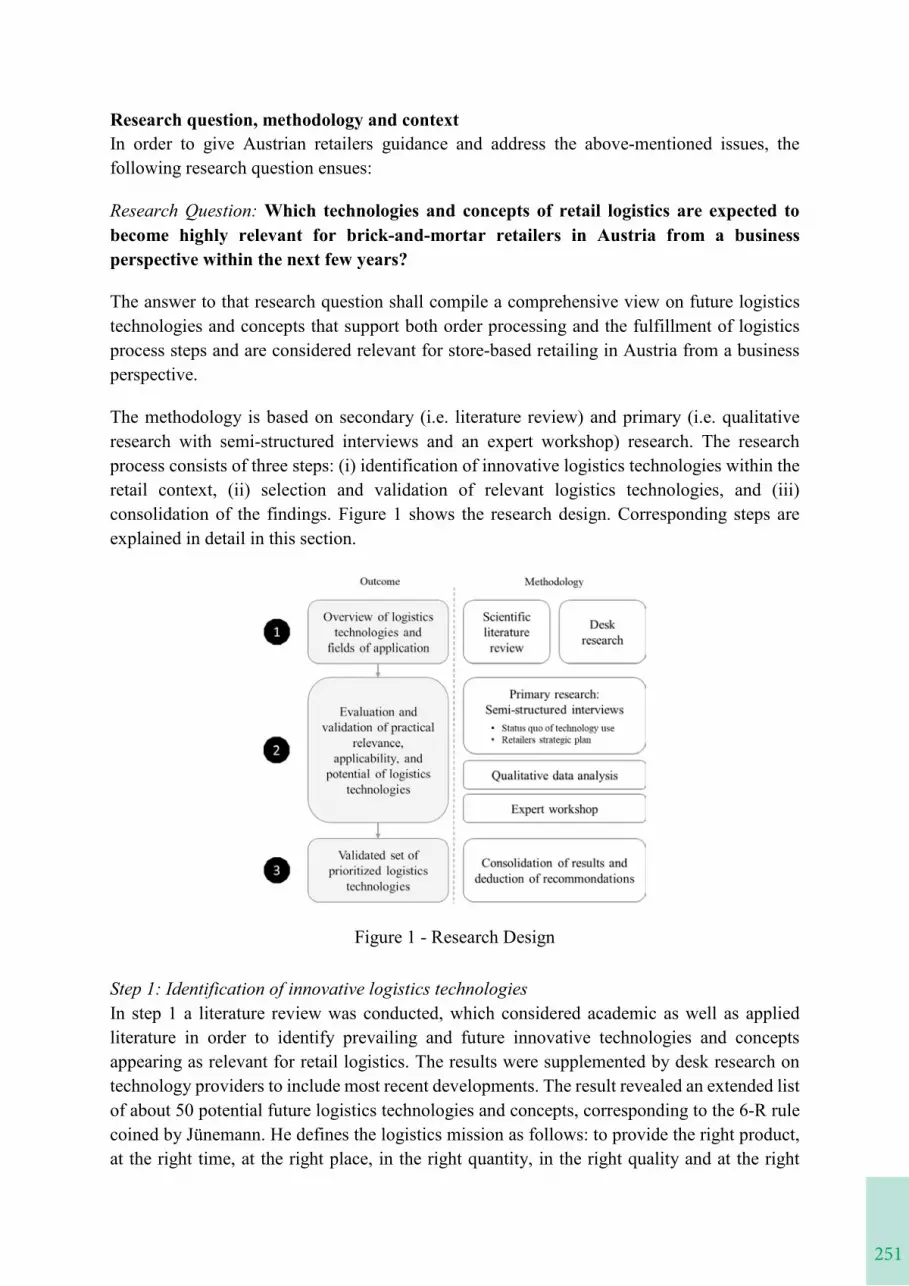
251
Research question, methodology and contextIn order to give Austrian retailers guidance and address the above-mentioned issues, the following research question ensues:
Research Question: Which technologies and concepts of retail logistics are expected to become highly relevant for brick-and-mortar retailers in Austria from a business perspective within the next few years?
The answer to that research question shall compile a comprehensive view on future logistics technologies and concepts that support both order processing and the fulfillment of logistics process steps and are considered relevant for store-based retailing in Austria from a business perspective.
The methodology is based on secondary (i.e. literature review) and primary (i.e. qualitative research with semi-structured interviews and an expert workshop) research. The research process consists of three steps: (i) identification of innovative logistics technologies within the retail context, (ii) selection and validation of relevant logistics technologies, and (iii) consolidation of the findings. Figure 1 shows the research design. Corresponding steps are explained in detail in this section.
Figure 1 - Research Design
Step 1: Identification of innovative logistics technologiesIn step 1 a literature review was conducted, which considered academic as well as applied literature in order to identify prevailing and future innovative technologies and concepts appearing as relevant for retail logistics. The results were supplemented by desk research on technology providers to include most recent developments. The result revealed an extended list of about 50 potential future logistics technologies and concepts, corresponding to the 6-R rule coined by Jünemann. He defines the logistics mission as follows: to provide the right product, at the right time, at the right place, in the right quantity, in the right quality and at the right
commerce companies such as Amazon or Alibaba to store-based retailing has been growing. However, studies show that consumers prefer hybrid shopping models (Arora et al., 2017; Buschmann et al., 2015; Collin-Lachaud and Vanheems, 2016; Metter, 2017) which combine the advantages of both worlds - online and offline - and thus offer maximum benefit and convenience. The rapid growth of the online retail sector has produced numerous innovative products and services. Some of these innovations also offer the opportunity to brick-and-mortar retailing to advance their already existing advantages with new technologies (Grewal et al.,2017). In this vein, especially logistics and its related technologies and concepts play a crucial role in effectively managing these two worlds of retailing. Today, retail logistics is no longer limited to store distribution or warehouse management, but comprises processes including material, information, and financial flows from suppliers to consumers and vice versa. Innovative technologies are expected to impact organizational structure, strategy, communication, and operational procedures of retailers’ businesses (Pantano and Naccarato, 2010; Xing et al., 2011). Applicability and fit of logistics technologies and concepts in future stores will be a decisive element in this disruptive but inevitable development. Scholars as well as practitioners believe that retailing can benefit from these technological opportunities (Willems et al., 2017). However, it is unclear to a certain point, which technologies and concepts (e.g. robotics, exoskeleton systems, 3D-detection systems etc.) are the most promisingfor retail logistics.
Technology investments often bring high costs and disruption – without guarantee of success. Especially smaller retail businesses usually lack resources and expertise to form an opinion on technologies and determine which are worth investing in (Renko and Ficko, 2010). For that reason, they are the last to adopt novel technologies (Pantano and Vannucci, 2019). However,when it comes to the development and expansion of the range of services offered by technology-supported processes in logistics, companies of all sizes are facing major challenges. Big retail companies are mostly faster in testing as well as adopting novel technologies, due to their financial capabilities and the corresponding risk-taking propensity. This is why our research focus is on them.
Our research investigates the current state of store-based retailing in Austria. The focus is on the logistics technologies and concepts that potentially support order processing and the fulfilment of the logistics process steps from a business perspective. In order to meet customer requirements in stores and enhance overall process performance, the supporting logistics processes are decisive for retailers. However, technology-supported processes in logistics should not be considered for their own sake – without taking the practical relevance into account (Stern and Ander, 2008).
The research question, the methodology and the context of the research are presented in the following section. Afterwards the steps of the chosen research design and the sample of the investigated companies are described. Next, identified retail logistics technologies and business perspectives from the secondary research are discussed. This is followed by the results and implications. Finally, limitations, an outlook and the conclusion are provided.
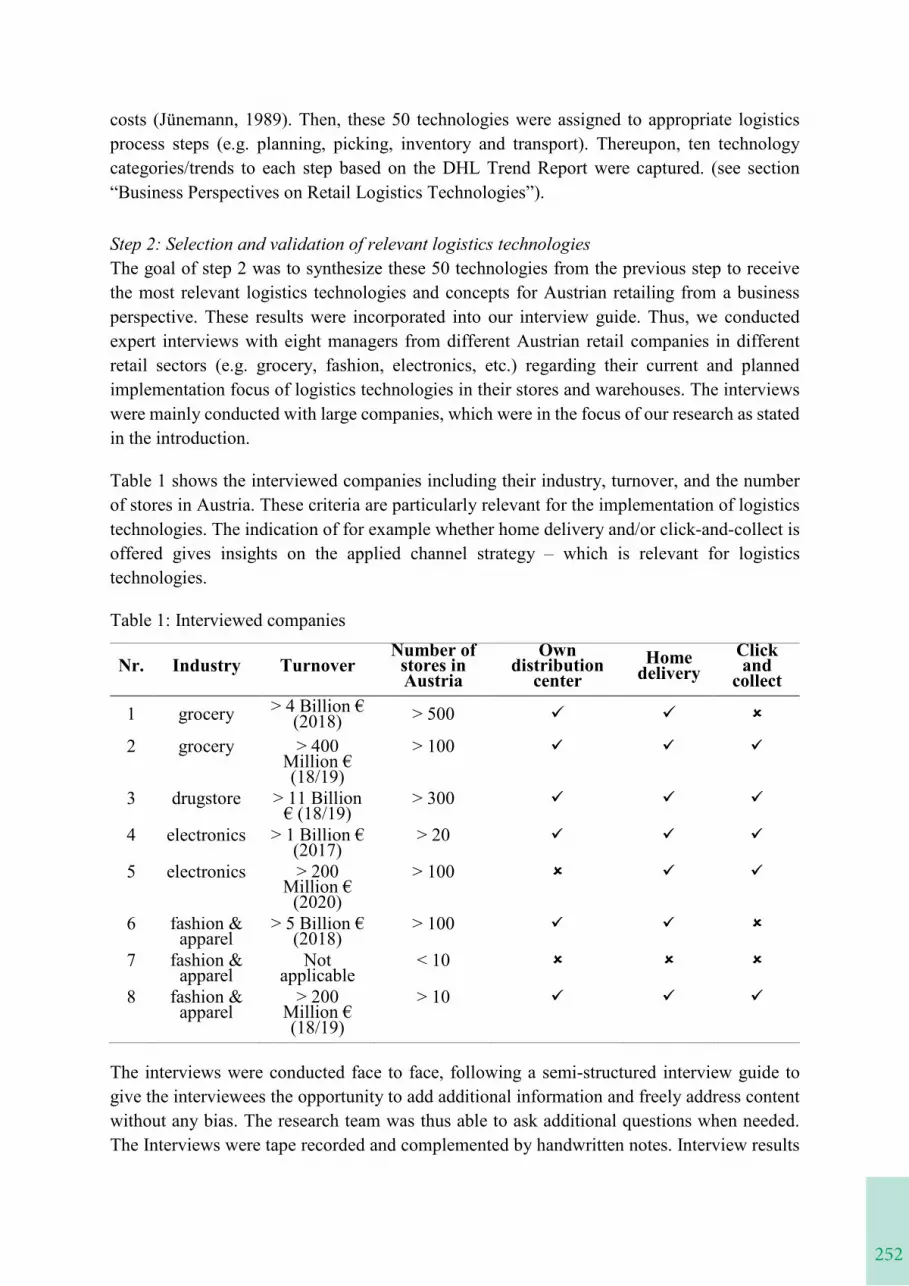
252
costs (Jünemann, 1989). Then, these 50 technologies were assigned to appropriate logistics process steps (e.g. planning, picking, inventory and transport). Thereupon, ten technology categories/trends to each step based on the DHL Trend Report were captured. (see section “Business Perspectives on Retail Logistics Technologies”).
Step 2: Selection and validation of relevant logistics technologiesThe goal of step 2 was to synthesize these 50 technologies from the previous step to receive the most relevant logistics technologies and concepts for Austrian retailing from a businessperspective. These results were incorporated into our interview guide. Thus, we conducted expert interviews with eight managers from different Austrian retail companies in different retail sectors (e.g. grocery, fashion, electronics, etc.) regarding their current and planned implementation focus of logistics technologies in their stores and warehouses. The interviews were mainly conducted with large companies, which were in the focus of our research as stated in the introduction.
Table 1 shows the interviewed companies including their industry, turnover, and the number of stores in Austria. These criteria are particularly relevant for the implementation of logistics technologies. The indication of for example whether home delivery and/or click-and-collect is offered gives insights on the applied channel strategy – which is relevant for logistics technologies.
Table 1: Interviewed companies
Nr. Industry TurnoverNumber of
stores in Austria
Own distribution
centerHome
deliveryClick and
collect
1 grocery > 4 Billion € (2018) > 500
2 grocery > 400Million € (18/19)
> 100
3 drugstore > 11 Billion € (18/19)
> 300
4 electronics > 1 Billion € (2017)
> 20
5 electronics > 200Million €
(2020)
> 100
6 fashion & apparel
> 5 Billion € (2018)
> 100
7 fashion & apparel
Not applicable
< 10
8 fashion & apparel
> 200Million € (18/19)
> 10
The interviews were conducted face to face, following a semi-structured interview guide to give the interviewees the opportunity to add additional information and freely address content without any bias. The research team was thus able to ask additional questions when needed. The Interviews were tape recorded and complemented by handwritten notes. Interview results
253
were subsequently evaluated by means of a qualitative data analysis. For this purpose, the handwritten notes were summarized and compared with transcripts. To ensure a systematic, rule-driven qualitative data analysis, the remediated transcripts were imported into the software tool MAXQDA, which is specialized in computer based qualitative data and text analysis, to evaluate and interpret the results. Therefore, the transcripts were coded regarding the mention of technologies and application potential. This resulted in a table showing the current status and future strategic directions of novel logistics technologies. To validate the results of the interviews, an expert workshop with interdisciplinary retail technology and retailing experts was conducted. Twelve experts from retailing, shop-fitting, technology provision, and academia were invited to objectively validate primary research findings.
Step 3: Consolidation of resultsThe captured results were summarized and enabled the development of a logistics technology overview, which gives guidance for logistics technology selection and implementationpotential.
Research Context: The Austrian retail landscapeThe Austrian retail landscape – to establish the context of the underlying research – is diverse: from small retailers with only one shop to national retail chains (e.g. food and drugstore) to internationally operating retail chains (e.g. fashion). According to a structural analysis conducted by KMU Forschung Austria in 2019, 37,600 Austrian retail stores offer 13.8 million square meters sales area, which accounts for 1.56 square meters sales area per inhabitant. Thisvalue is considerably higher, compared to the average of the EU-28, which is 1.18 square meters. The degree of chain store penetration is 40%, which means chain stores operate 40 percent of the shops. (KMU Forschung Austria, 2019) 22 percent of Austrian retailers operate an online shop (base year 2017) while consumers spent a total of EUR 7 billion in domestic and foreign online shops in 2017; 62% of the Austrians shop online at least once a year. This is why the adaption of practices and technologies in brick-and-mortar concepts – especially in logistics – has to be adapted as well in order to keep up with online retailing fulfillment.
In retail, technologies along the entire customer journey often focus on point of sale (POS)technologies or digitization at the POS. This situation also applies to Austria. Even if logistics is more and more seen as the central enabler, it is also difficult to assign where a technology can be considered. That is because POS actions directly trigger logistics processes (e.g. intelligent shelves for out of stock detection automatically initiate the replenishment process;data can also be passed on directly to their suppliers or manufacturers). In the Austrian retail sector, there are many small and medium-sized enterprises. This is special for the underlying research context as it is all the more important for the industry that the larger companies take the first step in retail technology application. Smaller ones benefit from the knowledge gained by their larger competitors.
The next section covers the results of consolidated retail logistics technologies and business perspectives in terms of technology selection and adoption in retail businesses.
costs (Jünemann, 1989). Then, these 50 technologies were assigned to appropriate logistics process steps (e.g. planning, picking, inventory and transport). Thereupon, ten technology categories/trends to each step based on the DHL Trend Report were captured. (see section “Business Perspectives on Retail Logistics Technologies”).
Step 2: Selection and validation of relevant logistics technologiesThe goal of step 2 was to synthesize these 50 technologies from the previous step to receive the most relevant logistics technologies and concepts for Austrian retailing from a businessperspective. These results were incorporated into our interview guide. Thus, we conducted expert interviews with eight managers from different Austrian retail companies in different retail sectors (e.g. grocery, fashion, electronics, etc.) regarding their current and planned implementation focus of logistics technologies in their stores and warehouses. The interviews were mainly conducted with large companies, which were in the focus of our research as stated in the introduction.
Table 1 shows the interviewed companies including their industry, turnover, and the number of stores in Austria. These criteria are particularly relevant for the implementation of logistics technologies. The indication of for example whether home delivery and/or click-and-collect is offered gives insights on the applied channel strategy – which is relevant for logistics technologies.
Table 1: Interviewed companies
Nr. Industry TurnoverNumber of
stores in Austria
Own distribution
centerHome
deliveryClick and
collect
1 grocery > 4 Billion € (2018) > 500
2 grocery > 400Million € (18/19)
> 100
3 drugstore > 11 Billion € (18/19)
> 300
4 electronics > 1 Billion € (2017)
> 20
5 electronics > 200Million €
(2020)
> 100
6 fashion & apparel
> 5 Billion € (2018)
> 100
7 fashion & apparel
Not applicable
< 10
8 fashion & apparel
> 200Million € (18/19)
> 10
The interviews were conducted face to face, following a semi-structured interview guide to give the interviewees the opportunity to add additional information and freely address content without any bias. The research team was thus able to ask additional questions when needed. The Interviews were tape recorded and complemented by handwritten notes. Interview results
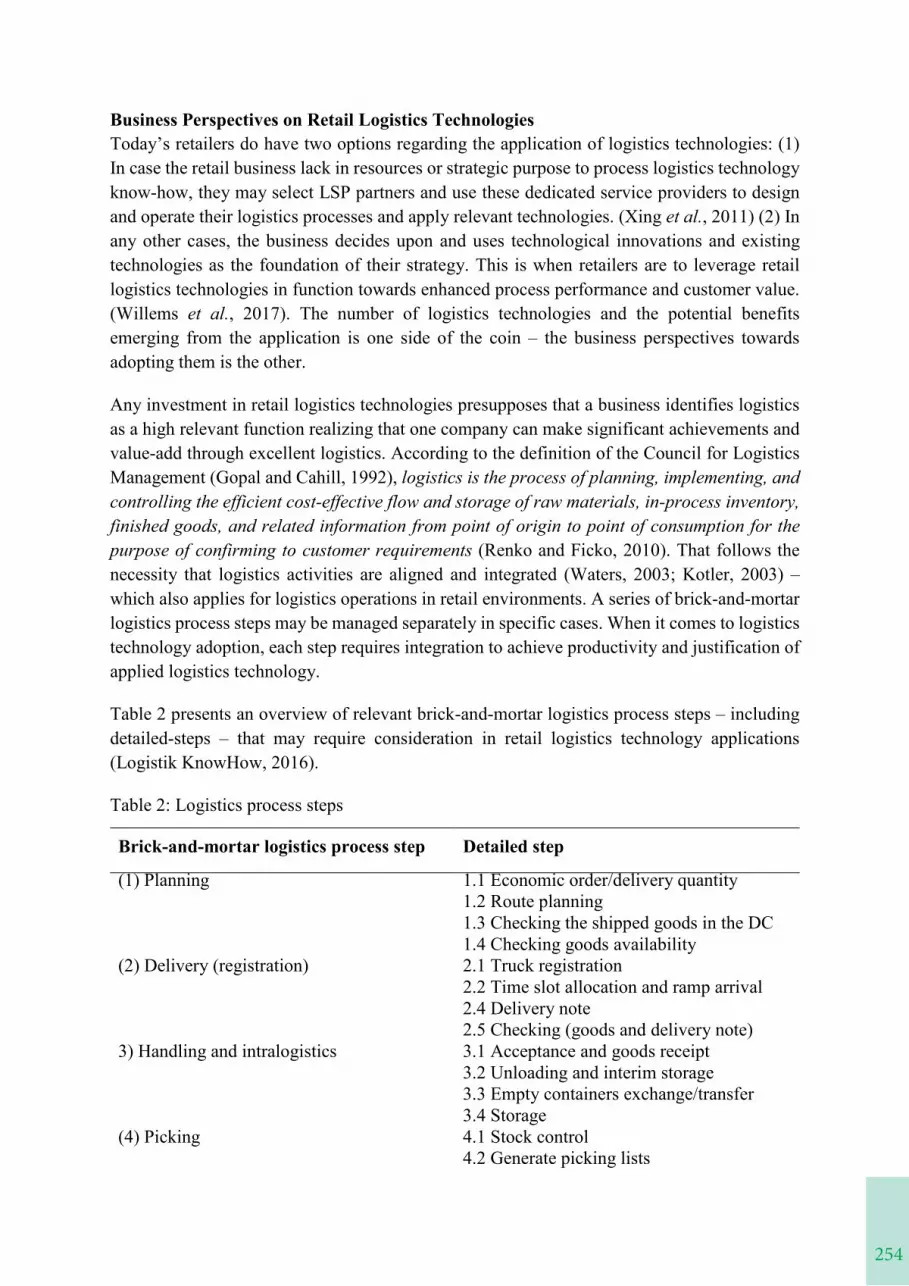
254
Business Perspectives on Retail Logistics TechnologiesToday’s retailers do have two options regarding the application of logistics technologies: (1) In case the retail business lack in resources or strategic purpose to process logistics technology know-how, they may select LSP partners and use these dedicated service providers to design and operate their logistics processes and apply relevant technologies. (Xing et al., 2011) (2) In any other cases, the business decides upon and uses technological innovations and existing technologies as the foundation of their strategy. This is when retailers are to leverage retail logistics technologies in function towards enhanced process performance and customer value. (Willems et al., 2017). The number of logistics technologies and the potential benefits emerging from the application is one side of the coin – the business perspectives towards adopting them is the other.
Any investment in retail logistics technologies presupposes that a business identifies logistics as a high relevant function realizing that one company can make significant achievements and value-add through excellent logistics. According to the definition of the Council for Logistics Management (Gopal and Cahill, 1992), logistics is the process of planning, implementing, and controlling the efficient cost-effective flow and storage of raw materials, in-process inventory, finished goods, and related information from point of origin to point of consumption for the purpose of confirming to customer requirements (Renko and Ficko, 2010). That follows the necessity that logistics activities are aligned and integrated (Waters, 2003; Kotler, 2003) –which also applies for logistics operations in retail environments. A series of brick-and-mortar logistics process steps may be managed separately in specific cases. When it comes to logistics technology adoption, each step requires integration to achieve productivity and justification of applied logistics technology.
Table 2 presents an overview of relevant brick-and-mortar logistics process steps – including detailed-steps – that may require consideration in retail logistics technology applications(Logistik KnowHow, 2016).
Table 2: Logistics process steps
Brick-and-mortar logistics process step Detailed step
(1) Planning 1.1 Economic order/delivery quantity1.2 Route planning1.3 Checking the shipped goods in the DC1.4 Checking goods availability
(2) Delivery (registration) 2.1 Truck registration2.2 Time slot allocation and ramp arrival2.4 Delivery note2.5 Checking (goods and delivery note)
3) Handling and intralogistics 3.1 Acceptance and goods receipt3.2 Unloading and interim storage3.3 Empty containers exchange/transfer3.4 Storage
(4) Picking 4.1 Stock control4.2 Generate picking lists
255
4.3 Picking goods(5) (Move) Storage -
(6) Inventory 6.1 Evaluate stock level (ERP system)6.2 Determining the actual stock level
(7) Disposal 7.1 Remove materials from POS7.2 Temporary storage7.3 Waste disposal
(8) Goods Delivery 8.1 Goods provision8.2 Packing8.3 Goods transfer (truck/LSP)
(9) Loading 9.1 Loading of return shipments9.2 Filling/Provision of pick-up stations
(10) Transport 10.1 Store-logistics tracking10.2 Home delivery
The table was compiled on the basis of secondary research. The findings were consolidated in a brainstorming session by the team of researchers. Relevant detailed steps were defined for the process steps where suitable. First (i) the above mentioned 50 technologies were assigned to the appropriate process steps and second, (ii) subordinated to a technology category/trend taken from the DHL Trend Report. This enabled to state for each technology category/trend its applicability in a given process step.
The following list shows, in which logistics process steps the technology categories/trends are applicable (the numbers in brackets refer to the logistics process steps in table 2):
- augmented reality (4) (5)- bionic enhancement (4)- blockchain (1) (2) (10)- cross-channel/omni-channel (1) (9) (10)- digital application (1) (3) (4) (5)- Internet of Things (1) (6)- picking technology (1) (3) (4) (5)- robotics automation (3) (4) (5) (6) (7) (8)- smart containerization (1) (2) (10)- storage technology (1) (5)
Augmented reality covers “smart glasses” and “smart lenses”, which provide visual displays of e.g. picking instructions and information on where stock items are located and where they need to be placed. This frees the picker's hands from any scanners etc. and makes picking more efficient and convenient. Although cost savings in storage through efficiency effects can be realized, businesses expect high costs regarding management of personalization.
Bionic enhancement comprises “smart gloves” and “exoskeletons”: Smart gloves use barcode scanners that can be activated with the thumb – successful scanning is confirmed either optically, acoustically or haptically (vibration). Exoskeletons facilitate physical work and
Business Perspectives on Retail Logistics TechnologiesToday’s retailers do have two options regarding the application of logistics technologies: (1) In case the retail business lack in resources or strategic purpose to process logistics technology know-how, they may select LSP partners and use these dedicated service providers to design and operate their logistics processes and apply relevant technologies. (Xing et al., 2011) (2) In any other cases, the business decides upon and uses technological innovations and existing technologies as the foundation of their strategy. This is when retailers are to leverage retail logistics technologies in function towards enhanced process performance and customer value. (Willems et al., 2017). The number of logistics technologies and the potential benefits emerging from the application is one side of the coin – the business perspectives towards adopting them is the other.
Any investment in retail logistics technologies presupposes that a business identifies logistics as a high relevant function realizing that one company can make significant achievements and value-add through excellent logistics. According to the definition of the Council for Logistics Management (Gopal and Cahill, 1992), logistics is the process of planning, implementing, and controlling the efficient cost-effective flow and storage of raw materials, in-process inventory, finished goods, and related information from point of origin to point of consumption for the purpose of confirming to customer requirements (Renko and Ficko, 2010). That follows the necessity that logistics activities are aligned and integrated (Waters, 2003; Kotler, 2003) –which also applies for logistics operations in retail environments. A series of brick-and-mortar logistics process steps may be managed separately in specific cases. When it comes to logistics technology adoption, each step requires integration to achieve productivity and justification of applied logistics technology.
Table 2 presents an overview of relevant brick-and-mortar logistics process steps – including detailed-steps – that may require consideration in retail logistics technology applications(Logistik KnowHow, 2016).
Table 2: Logistics process steps
Brick-and-mortar logistics process step Detailed step
(1) Planning 1.1 Economic order/delivery quantity1.2 Route planning1.3 Checking the shipped goods in the DC1.4 Checking goods availability
(2) Delivery (registration) 2.1 Truck registration2.2 Time slot allocation and ramp arrival2.4 Delivery note2.5 Checking (goods and delivery note)
3) Handling and intralogistics 3.1 Acceptance and goods receipt3.2 Unloading and interim storage3.3 Empty containers exchange/transfer3.4 Storage
(4) Picking 4.1 Stock control4.2 Generate picking lists
256
absorb a part of the goods weight. When lifting heavy items or packages, the (felt) weight can be reduced by 40%. In fact, working conditions can be prepared more health-friendly, although the technologies cannot be used for all existing processes or product ranges without costly adjustments.
In course of the blockchain trend, “smart contracts” considered as a (logistics) process technology is intended to facilitate business transactions and contract processing as well as provide greater contractual security. Smart contracts can be created, managed and executed via the block chain. The forgery of logistics contracts, shipping documents etc. can be prevented –but there is a lack of successful implementations in logistics practice.
For cross channel/omni-channel, retail business may apply “store-to-web / web-to-store”technologies that include click-and-collect, click-and-reserve, store-pick-up and ship-from-store concepts. The aim is to provide an integrated and harmonized channel-strategy that offers consumers diverse multi-channel services and fulfilment (e.g. availability query, reserve ordered shop items, location-based services, etc.). Retail businesses perceive important opportunities but have concerns regarding data privacy, assortments and brick-and-mortar locations as well as infrastructure.
Digital application refers to “logistics software for efficient transport planning”, “goods receipt assistance system” and “intelligent shelf” technologies. While time window management and live tracking systems can be integrated quite easily, customization of these tools is more difficult, as they need to be adapted to fit to individual company processes. That for example includes shelf technology that informs about inventory, items sale and provides support for business decisions. However, transport tracking and pooling requires implementation efforts with partners and digital assistance systems on receipt and shelf-management require investments and wise alignment of processes.
The internet of things category contains “transponder technologies (RFID tags and labels)”.As the cost and scope of transponder technologies decreases, businesses will be able to integrate RFID tags and labels even into smaller everyday products to monitor the status of each item in inventory. The concepts can be used for a variety of applications. The goal is to minimize costs, maximize transparency, optimize processes and increase customer satisfaction.Even if transparency and traceability in logistics processes can be realized, calculated cost per day/item (i.e. for low-price retail products) is too expensive in use and tags are usually "lost" after the sale of the goods (as they are no longer returned).
Picking technology covers “pick-by-ink / pick-by-light / pick-by-voice / pick-by-vision”, “roll cage sequencing” and “automatic recording station for article dimensions and weight”. Diverse technical applications for picking allow efficient picking sequences, dynamic routing and enable direct warehouse management system connection as well as real-time stock display.Roll cage sequencing can improve picking and store handling processes. Roll cages in the central/regional warehouse are loaded in the sequence corresponding to the shelf layout. Article recording stations precisely capture morphological data e.g. articles’ volume, weight, quantities, stacking data, EAN, barcodes etc. and ensure efficient capturing of new articles,
257
corresponding packages or designs as well as precise calculation of warehouse space required.Although cost savings can be realized through more efficient operations, businesses expect high efforts in organizational integration and costs regarding investments and training.
Robotics automation refer to the identified concepts “stacker and crane guidance systems”and “robot technologies” When handling and transferring goods, stackers and cranes can be upgraded with technical equipment e.g. a detection device helps locating the warehouse unit and assigns handling orders from distance. Cycle time reduction in DCs can be achieved by autonomously following handling/picking robots. Once the order picker has finished picking an order, the robot drives autonomously to a defined location while another one is already on its way to the order picker so that the latter can process the next order. Work processes can be carried out more easily, inventories can be better controlled - but many companies are critical of robotics and integrated automation in in-store logistics due to the often lack of technical possibilities, legal uncertainty and the question of cost-effectiveness.
In smart containerization, the “intelligent container” and “returnable container” are identified as relevant. Equipped as energy self-sufficient, intelligent containers can locate the exact position due to its technology and can report up to 7,000 times even without power supply. In addition, sensors can also be used to detect when the ambient temperature changes or is in the wrong range. In order to increase handling costs and transport capacity utilization, businesses may use returnable containers with 2D code marking, ready to accommodate cooled packaging for sensitive goods and to be converted into reusable last-mile delivery containers. Localization of the container (i.e. message if wrongly placed/routed) and its stackability offer potential: high acquisition costs and individual adaptation of the container to business’ requirements can be expected.
Storage technology refers to e.g. “cube storage” which include robots, grid, workstations, containers and controllers. The aluminum grid keeps the containers neatly stacked and at the same time provides the robots with rails to drive on. The containers are durable and can accommodate a variety of goods content. Robots move along the top of the grid, are wirelessly connected and recharge when not in use. At the workstations, picking, storage or inventory can be performed. The "controller" keeps an overview of the entire warehouse and controls“traffic”. Aside from the investment and operational decision, businesses may gain from several aspects: fast movers and slow movers are thus automatically sorted, storage space is optimally used, and robots continuously and fully autonomously check their condition.
Evaluation of Retail Logistics TechnologiesIn this section, we discuss the results of the primary research approach in detail and present the evaluation results regarding logistics technology adoption and potential in store-based retailing in Austria.
The Retailers’ Assessment of Retail Logistics TechnologiesProceeding from the set of retail logistics technologies and business perspectives identified in current literature (see section “Business Perspectives on Retail Logistics Technologies”), the
absorb a part of the goods weight. When lifting heavy items or packages, the (felt) weight can be reduced by 40%. In fact, working conditions can be prepared more health-friendly, although the technologies cannot be used for all existing processes or product ranges without costly adjustments.
In course of the blockchain trend, “smart contracts” considered as a (logistics) process technology is intended to facilitate business transactions and contract processing as well as provide greater contractual security. Smart contracts can be created, managed and executed via the block chain. The forgery of logistics contracts, shipping documents etc. can be prevented –but there is a lack of successful implementations in logistics practice.
For cross channel/omni-channel, retail business may apply “store-to-web / web-to-store”technologies that include click-and-collect, click-and-reserve, store-pick-up and ship-from-store concepts. The aim is to provide an integrated and harmonized channel-strategy that offers consumers diverse multi-channel services and fulfilment (e.g. availability query, reserve ordered shop items, location-based services, etc.). Retail businesses perceive important opportunities but have concerns regarding data privacy, assortments and brick-and-mortar locations as well as infrastructure.
Digital application refers to “logistics software for efficient transport planning”, “goods receipt assistance system” and “intelligent shelf” technologies. While time window management and live tracking systems can be integrated quite easily, customization of these tools is more difficult, as they need to be adapted to fit to individual company processes. That for example includes shelf technology that informs about inventory, items sale and provides support for business decisions. However, transport tracking and pooling requires implementation efforts with partners and digital assistance systems on receipt and shelf-management require investments and wise alignment of processes.
The internet of things category contains “transponder technologies (RFID tags and labels)”.As the cost and scope of transponder technologies decreases, businesses will be able to integrate RFID tags and labels even into smaller everyday products to monitor the status of each item in inventory. The concepts can be used for a variety of applications. The goal is to minimize costs, maximize transparency, optimize processes and increase customer satisfaction.Even if transparency and traceability in logistics processes can be realized, calculated cost per day/item (i.e. for low-price retail products) is too expensive in use and tags are usually "lost" after the sale of the goods (as they are no longer returned).
Picking technology covers “pick-by-ink / pick-by-light / pick-by-voice / pick-by-vision”, “roll cage sequencing” and “automatic recording station for article dimensions and weight”. Diverse technical applications for picking allow efficient picking sequences, dynamic routing and enable direct warehouse management system connection as well as real-time stock display.Roll cage sequencing can improve picking and store handling processes. Roll cages in the central/regional warehouse are loaded in the sequence corresponding to the shelf layout. Article recording stations precisely capture morphological data e.g. articles’ volume, weight, quantities, stacking data, EAN, barcodes etc. and ensure efficient capturing of new articles,
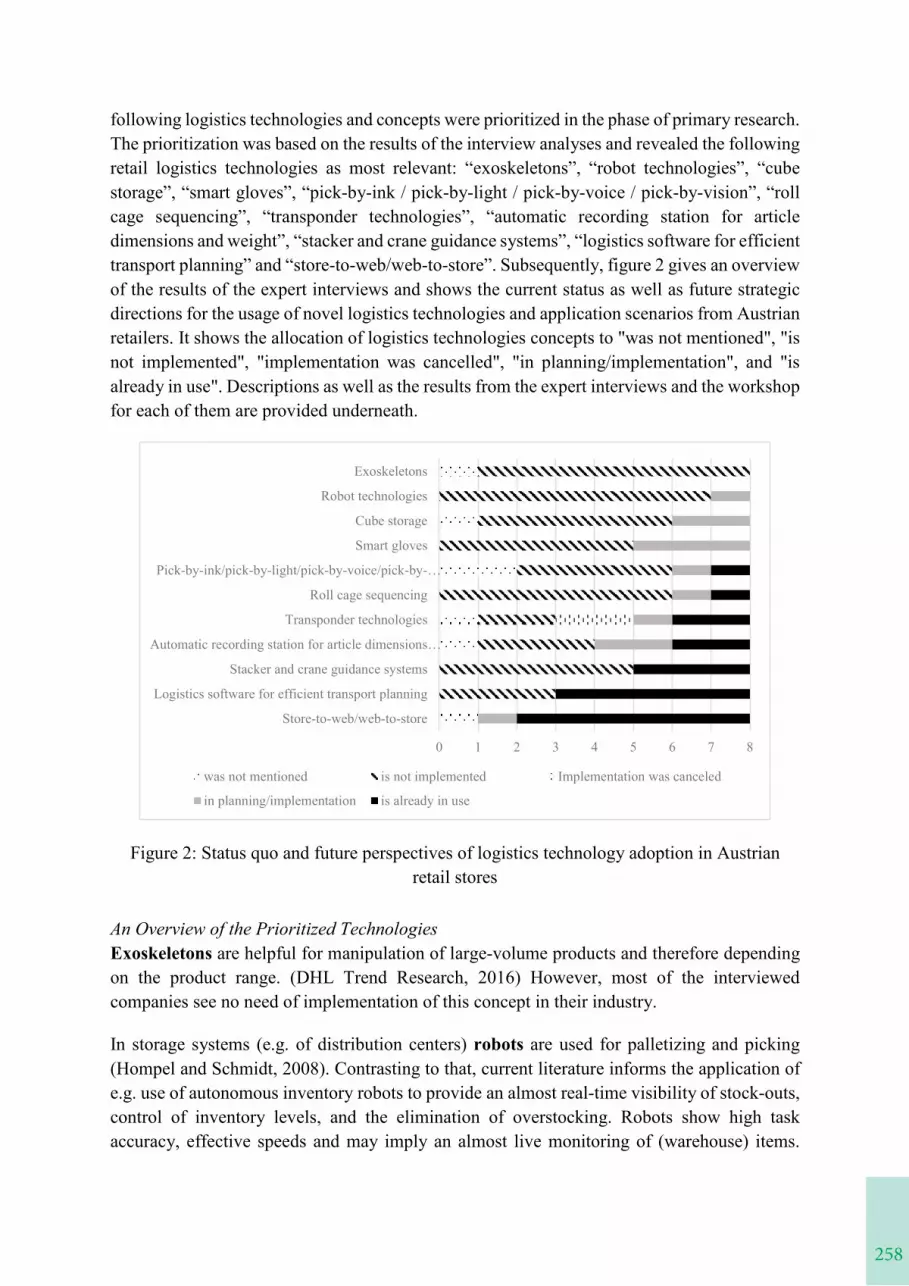
258
following logistics technologies and concepts were prioritized in the phase of primary research.The prioritization was based on the results of the interview analyses and revealed the following retail logistics technologies as most relevant: “exoskeletons”, “robot technologies”, “cube storage”, “smart gloves”, “pick-by-ink / pick-by-light / pick-by-voice / pick-by-vision”, “roll cage sequencing”, “transponder technologies”, “automatic recording station for article dimensions and weight”, “stacker and crane guidance systems”, “logistics software for efficient transport planning” and “store-to-web/web-to-store”. Subsequently, figure 2 gives an overview of the results of the expert interviews and shows the current status as well as future strategic directions for the usage of novel logistics technologies and application scenarios from Austrian retailers. It shows the allocation of logistics technologies concepts to "was not mentioned", "is not implemented", "implementation was cancelled", "in planning/implementation", and "is already in use". Descriptions as well as the results from the expert interviews and the workshop for each of them are provided underneath.
Figure 2: Status quo and future perspectives of logistics technology adoption in Austrian retail stores
An Overview of the Prioritized TechnologiesExoskeletons are helpful for manipulation of large-volume products and therefore depending on the product range. (DHL Trend Research, 2016) However, most of the interviewed companies see no need of implementation of this concept in their industry.
In storage systems (e.g. of distribution centers) robots are used for palletizing and picking(Hompel and Schmidt, 2008). Contrasting to that, current literature informs the application of e.g. use of autonomous inventory robots to provide an almost real-time visibility of stock-outs, control of inventory levels, and the elimination of overstocking. Robots show high task accuracy, effective speeds and may imply an almost live monitoring of (warehouse) items.
0 1 2 3 4 5 6 7 8
Store-to-web/web-to-store
Logistics software for efficient transport planning
Stacker and crane guidance systems
Automatic recording station for article dimensions…
Transponder technologies
Roll cage sequencing
Pick-by-ink/pick-by-light/pick-by-voice/pick-by-…
Smart gloves
Cube storage
Robot technologies
Exoskeletons
was not mentioned is not implemented Implementation was canceled
in planning/implementation is already in use
259
With their systems participation they enable a business to connect the physical and digital worldin decisive manner (Morenza-Cinos et al., 2019). According to the interviewees, the reason why autonomous robots are not yet being used in the Austrian logistics centers is due to the fact that they are too expensive. One executive noted the benefits of a combination of vacuum robots with a put to light system and autonomous industrial trucks, but also draws attention to the high risk, as the technology is still too immature.
Cube storage systems achieve a high storage density and also have many applications, including parking systems, warehouses, and container terminals (Zaerpour et al., 2017). The concept was identified as relevant in the expert workshop as it perfectly supports the intra-logistics processes. However, this system seems not to be relevant for companies in the food and clothing industry or even companies without an own distribution center. A critical necessity of cube storages is the uniform sizes for packaging. Therefore, only less than half of the investigated retailers considered its implementation.
Smart glove technologies have been in the focus of research within logistics processes for several years. Scanning devices are dominant and common in this domain. Several versions exist that are using smart glove technology to support operating personnel during logistics processes – either applying RFID or barcode scanning devices (Scheuermann et al., 2017).Factory environments, logistics and warehouse operations can be improved focusing on different aspects such as personnel’s efficiency, ergonomic arrangement of tools or the connected user comfort (Scheuermann et al., 2016). When it comes to Austrian retail smart gloves are considered from both retailers and experts to have great potential. Despite the positive outlook, the interviewed companies have had particular difficulties with the connection to existing systems, which means smart gloves have not yet been fully implemented.
Literature suggests, even when advanced picking technologies are applied (Hompel and Schmidt, 2008), picking performance is still greatly dependent on the extent to which pickers are able to use these technologies efficiently. Therefore, it is of interest to investigate the influence of individual pickers and their interaction with the installed picking technology(Vries et al., 2016). In the Austrian retail trade, these methods are rarely used for order picking. Pick by light is mainly used whereas pick by ink is not an option here. Some of the interviewed companies have already tested pick-by-voice, however the technology is not yet mature enough to create real added value for the employees.
Roll cage sequencing is described as the integration of the store layout into packing processes and the loading aids for store delivery. Although literature reveal great benefits for the stores(Kuhn and Sternbeck, 2013), the advantage of time savings achieved by the concept can be compensated by well-trained employees, according to a surveyed expert. They are picking and placing the goods much faster, than otherwise the loading process of roll cages would take. Additionally, the layout in the stores changes regularly in many companies, which makes roll cage sequencing for some of the interviewed companies unpracticable.
following logistics technologies and concepts were prioritized in the phase of primary research.The prioritization was based on the results of the interview analyses and revealed the following retail logistics technologies as most relevant: “exoskeletons”, “robot technologies”, “cube storage”, “smart gloves”, “pick-by-ink / pick-by-light / pick-by-voice / pick-by-vision”, “roll cage sequencing”, “transponder technologies”, “automatic recording station for article dimensions and weight”, “stacker and crane guidance systems”, “logistics software for efficient transport planning” and “store-to-web/web-to-store”. Subsequently, figure 2 gives an overview of the results of the expert interviews and shows the current status as well as future strategic directions for the usage of novel logistics technologies and application scenarios from Austrian retailers. It shows the allocation of logistics technologies concepts to "was not mentioned", "is not implemented", "implementation was cancelled", "in planning/implementation", and "is already in use". Descriptions as well as the results from the expert interviews and the workshop for each of them are provided underneath.
Figure 2: Status quo and future perspectives of logistics technology adoption in Austrian retail stores
An Overview of the Prioritized TechnologiesExoskeletons are helpful for manipulation of large-volume products and therefore depending on the product range. (DHL Trend Research, 2016) However, most of the interviewed companies see no need of implementation of this concept in their industry.
In storage systems (e.g. of distribution centers) robots are used for palletizing and picking(Hompel and Schmidt, 2008). Contrasting to that, current literature informs the application of e.g. use of autonomous inventory robots to provide an almost real-time visibility of stock-outs, control of inventory levels, and the elimination of overstocking. Robots show high task accuracy, effective speeds and may imply an almost live monitoring of (warehouse) items.
0 1 2 3 4 5 6 7 8
Store-to-web/web-to-store
Logistics software for efficient transport planning
Stacker and crane guidance systems
Automatic recording station for article dimensions…
Transponder technologies
Roll cage sequencing
Pick-by-ink/pick-by-light/pick-by-voice/pick-by-…
Smart gloves
Cube storage
Robot technologies
Exoskeletons
was not mentioned is not implemented Implementation was canceled
in planning/implementation is already in use
260
Transponder technologies ensure that products and objects in logistics are able to communicate with their environment. Literature shows that transponder technologies support internal logistics processes well (e.g. monitoring, tracking, display availability, support picking, …) and are also beneficial for the supply chain across companies (Franke and Dangelmaier, 2006). Some of the interviewed retailers are already using transponder technologies to speed up the inventory process. Nevertheless, many companies complain about the high implementation costs. In order to be able to use RFID tags or other transponder technologies efficiently, manufacturers would have to integrate them into the packaging already, as retrofitting is inefficient, error-prone and expensive.
In the field of warehousing, it is important to describe the products as precisely as possible to ensure efficient warehouse utilization. According to experts from the interviews, this information usually comes from manufacturers in an insufficient form, which results in subsequent recording of the articles with regard to weight and dimensions. Some Austrian retailers have already recognized the need for article recording stations and use them for data collection. Others are following, whereby companies that sell their products online also see potential in an automatic recording station (KHT, 2020; MM Logistik, 2019).
Stacker and Crane guidance systems are not relevant for companies that do not have their own distribution center. For these normal picking lists are enough. In contrast, Austrian companies active in the electronics, drugstore and grocery trade, this concept is already an important part of their logistics as the proper handling and transferring of retail goods is growing in importance. Guidance systems operate with sensor technology, logic and interfaces – can switch to manually guidance – and aim to optimally use time and space capacities. (ABF, 2020a, 2020b)
Advanced technical logistics infrastructure and tools like logistics software for efficient transport planning are widely in use or even in planning or implementation. Specific logistics software providers offer e.g. cloud-based and end-to-end transport solution applicable for involved (retail) network partners. Offers are sensitive to specific technology solutions of modular and highly customizable character (TRANSPOREON, 2020b, 2020a). In Austria the tracking of transports is increasingly important for both, companies with and without distribution center, nevertheless some have fixed tour plans and rely on experience values.
The combination of online store with offline retail opens new possibilities in logistics – with adirect impact on the customer's shopping experience. Web-to-store/store-to-web services such as availability queries, article reservations, click-and-collect and consultation appointments are already regarded as standard services (Heinemann, 2017). In order to comply with the increasing information, need of customers, employees in the store can use handhelds to access customer data, check product availability or make article reservations. Results of the expert interviews show that the digital integration of the flow of goods is already in frequent use. The expert workshop also approves this concept to be the most relevant for the future from the business perspective. Although this concept has been often implemented in Austrian retail so far, experts report low consumer usage.

261
Expert Validation of the Technology PrioritizationThe prioritized set of logistics technologies and concepts was the basis for an unbiased expert workshop used to validate the captured findings. As a result of the expert workshop, the retailers’ assessment could be complemented by further relevant aspects. In general, experts assess the Austrian retail businesses status quo as “lagging behind” international developments. However, within Europe, Austrian retail businesses keep pace and managers are expected to decide on necessary investments in order not to lose sight of international retail operationstandards.
The web to store / store to web approach is regarded as highly relevant for the future of the Austrian retail. Many of the interviewed companies already implemented multichannel services and more want to follow. Through scalability of the services and the fact that even small connections between web and store can be implemented promptly, it holds great potential for smaller retail companies, too. Experts agree that the increasing use of smartphones will make this concept even more important. Besides advantages, the difficulty for logistics lies in the high requirements. Wrong data and misinformation can cause internal problems but is also directly visible on the customer side. Thus, it is important to guarantee a seamless implementation. Austrian retailers can apply this concept and the various possibilities to their business to better get revisited by customers.
Darkstore concepts represent retail distribution centers for online orders exclusively dedicated for efficient processing of orders in a time and space saving manner. Dark stores are commonly located close to existing retail stores to realize synergy effects with present structures, logistics, flow of goods and staff without significant investments (Ettouzani et al., 2012). The aspect is closely linked with the above presented category -cross channel/omni-channel- and definitely complies with developments regarding the dramatic increase in online retail and the associated cost and availability implications on the consumers’ side.
A general but nevertheless highly relevant topic was additionally mentioned: last mile. The issue of last mile is particularly important for every retailer in a cross-channel environment and probably the most costly part in retail logistics (Hübner et al., 2016). Therefore, new approaches are needed and highly welcome. In the majority of the cases, retailers themselves have only limited influence, since the last mile is largely taken over by their logistics service providers or carriers. Retailers themselves may not put the highest effort in the topic and may therefore not push operational investments in last mile technologies at first priority (Vakulenkoet al., 2018).
Finally, the term digital twin in the context of retail businesses has also been coined relevant. As per definition, a digital twin is “a digital representation of a physical object. It includes the model of the physical object, data from the object, a unique one-to-one correspondence to the object, and the ability to monitor the object” (Gartner, 2017). In terms of retail logistics, a digital twin can be used to track the flow of products through supply chains, for example, or building systems that can extract valuable insights from aggregated data. That may reflect a virtual representation of the store (including store inventory systems, stock-out management etc.) and on a generic level, it may concern future design, operation, and optimization of
Transponder technologies ensure that products and objects in logistics are able to communicate with their environment. Literature shows that transponder technologies support internal logistics processes well (e.g. monitoring, tracking, display availability, support picking, …) and are also beneficial for the supply chain across companies (Franke and Dangelmaier, 2006). Some of the interviewed retailers are already using transponder technologies to speed up the inventory process. Nevertheless, many companies complain about the high implementation costs. In order to be able to use RFID tags or other transponder technologies efficiently, manufacturers would have to integrate them into the packaging already, as retrofitting is inefficient, error-prone and expensive.
In the field of warehousing, it is important to describe the products as precisely as possible to ensure efficient warehouse utilization. According to experts from the interviews, this information usually comes from manufacturers in an insufficient form, which results in subsequent recording of the articles with regard to weight and dimensions. Some Austrian retailers have already recognized the need for article recording stations and use them for data collection. Others are following, whereby companies that sell their products online also see potential in an automatic recording station (KHT, 2020; MM Logistik, 2019).
Stacker and Crane guidance systems are not relevant for companies that do not have their own distribution center. For these normal picking lists are enough. In contrast, Austrian companies active in the electronics, drugstore and grocery trade, this concept is already an important part of their logistics as the proper handling and transferring of retail goods is growing in importance. Guidance systems operate with sensor technology, logic and interfaces – can switch to manually guidance – and aim to optimally use time and space capacities. (ABF, 2020a, 2020b)
Advanced technical logistics infrastructure and tools like logistics software for efficient transport planning are widely in use or even in planning or implementation. Specific logistics software providers offer e.g. cloud-based and end-to-end transport solution applicable for involved (retail) network partners. Offers are sensitive to specific technology solutions of modular and highly customizable character (TRANSPOREON, 2020b, 2020a). In Austria the tracking of transports is increasingly important for both, companies with and without distribution center, nevertheless some have fixed tour plans and rely on experience values.
The combination of online store with offline retail opens new possibilities in logistics – with adirect impact on the customer's shopping experience. Web-to-store/store-to-web services such as availability queries, article reservations, click-and-collect and consultation appointments are already regarded as standard services (Heinemann, 2017). In order to comply with the increasing information, need of customers, employees in the store can use handhelds to access customer data, check product availability or make article reservations. Results of the expert interviews show that the digital integration of the flow of goods is already in frequent use. The expert workshop also approves this concept to be the most relevant for the future from the business perspective. Although this concept has been often implemented in Austrian retail so far, experts report low consumer usage.
262
logistics infrastructure such as warehouses, distribution centers, and cross-dock facilities (DHL Trend Research, 2019).
ImplicationsThe managerial implications of the underlying research lie in the insights that are provided on(i) which technologies and concepts of retail logistics are expected to become highly relevant for brick-and-mortar retailers in Austria and (ii) what perspectives have businesses regarding the technological relevance of presented issues within the next few years.
Main emphasis of logistics technologies currently still appears to be on functional benefits and cost/time savings. This may over time change the growing role of logistics as a high relevant function and the differentiating potential of relevant logistics technologies in the retail sector.Due to the shortage of (skilled) workers, for example in warehouses, companies need to consider investments in automation and robotic technologies.
In their work from 2017, Inman/Nikolova recapture technologies in their “Brief Overview Of Retail Technology: Past, Present, And Future”, referring to barcode scanning, smart shelves, in-store CRM, etc. and argue the relevance of shopper technology adoption and the dependence on shoppers’ utilization (Inman and Nikolova, 2017). In Drucker’s view (Drucker, 1962) – the economy’s dark continent, which describes the background functions of logistics – the technologies may be seen independently form the ultimate consumer (i.e. shopper). And that is what businesses may consider: The adoption and successful application of retail logistics technologies require integrated flows of information and goods but may remain self-reliant from shoppers’ perceptions.
This is the first study that analyses relevance, applicability and fit of retail logistics technologies and application scenarios in Austrian companies. The underlying applied research approach captures the status-quo in retail logistics practice concerning novel technologies and concepts based on current literature.
The practical relevance of the present research is legitimated by the obvious need of Austrian retail companies for guidance regarding the selection of suitable logistics concepts andtechnologies. Implications provide an enhanced knowledge of novel retail logistics technologies that have to be taken into account in strategic decision making.
Limitations and future researchThe limitations of the research refer to the size of the sample and number of interviewees, the country-specific sample and respective retail business environment. Future research should investigate industry specific issues, best practices of retail logistics application (including investment – effect ratio) and user acceptance – from the viewpoint of operating employees.User acceptance could be evaluated by appropriate technology tests in companies or in laboratory environments.
263
ConclusionThe practical relevance of the present research refers to (i) the existence of retail logistics technologies and concepts and (ii) the selection of technologies and concepts relevant for Austrian retail businesses. Implications provide an enhanced knowledge of existing and novel logistics technologies and concepts that can be used for strategic decision making.
In many cases it is challenging for retailers to evaluate the adoption of logistics technologies and estimate what it can potentially deliver to their processes (Inman and Nikolova, 2017). As even the implementation of test settings for the evaluation of novel logistics technologies entails high capital expenditure, it is up to the bigger players to identify appropriate technologies due to their financial capabilities. The retailers’ strategic focus to invest in innovative technologies is under-researched.
In order to compile a comprehensive view on logistics technologies and concepts considered relevant in retail practice, this research was conducted as part of an applied research projectfocusing on retail technology advancements and acceptance. In the project, the use of novel technologies and their benefit for brick-and-mortar retailing are analyzed. This concerns in-store customer experience on the one hand and required order processing as well as logistics fulfilment operations on the other hand.
The web to store / store to web approach is regarded as highly relevant for the future of the Austrian retail from both, retailers and experts. It is already implemented from most of the interviewed companies by offering different services using the connection of web and store. Through scalability of the services it also holds great potential for smaller retail companies.
The current COVID-19 crisis underscores the need for more cross-channel solutions and flexible resource allocation in retail networks. This could accelerate the move toward online and digital purchasing offers from businesses. Further, it may trigger more agile and dynamic resourcing from brick-and-mortar stores to distribution centers and end-consumers. It could revolutionize existing business models and may drive new models of collaboration between retailers and their stakeholders to address scarce capabilities and enable the labor pool to move more fluidly in order to meet demand across priority activities.
AcknowledgementsParts of this work were funded by the Federal State of Upper Austria.
ReferencesABF (2020a), “Forklift Guidance System OneBase®MFT”, available at:
https://www.abf.at/en/products/forklift-guidance-system-onebase%C2%AEmft (accessed 18 May 2020).
ABF (2020b), “Intralogistics Suite”, available at: https://www.abf.at/en/intralogistics-suite(accessed 18 May 2020).
Arora, S., Singha, K. and Sahney, S. (2017), “Understanding consumer’s showrooming behaviour”, Asia Pacific Journal of Marketing and Logistics, Vol. 29 No. 2, pp. 409–431.
logistics infrastructure such as warehouses, distribution centers, and cross-dock facilities (DHL Trend Research, 2019).
ImplicationsThe managerial implications of the underlying research lie in the insights that are provided on(i) which technologies and concepts of retail logistics are expected to become highly relevant for brick-and-mortar retailers in Austria and (ii) what perspectives have businesses regarding the technological relevance of presented issues within the next few years.
Main emphasis of logistics technologies currently still appears to be on functional benefits and cost/time savings. This may over time change the growing role of logistics as a high relevant function and the differentiating potential of relevant logistics technologies in the retail sector.Due to the shortage of (skilled) workers, for example in warehouses, companies need to consider investments in automation and robotic technologies.
In their work from 2017, Inman/Nikolova recapture technologies in their “Brief Overview Of Retail Technology: Past, Present, And Future”, referring to barcode scanning, smart shelves, in-store CRM, etc. and argue the relevance of shopper technology adoption and the dependence on shoppers’ utilization (Inman and Nikolova, 2017). In Drucker’s view (Drucker, 1962) – the economy’s dark continent, which describes the background functions of logistics – the technologies may be seen independently form the ultimate consumer (i.e. shopper). And that is what businesses may consider: The adoption and successful application of retail logistics technologies require integrated flows of information and goods but may remain self-reliant from shoppers’ perceptions.
This is the first study that analyses relevance, applicability and fit of retail logistics technologies and application scenarios in Austrian companies. The underlying applied research approach captures the status-quo in retail logistics practice concerning novel technologies and concepts based on current literature.
The practical relevance of the present research is legitimated by the obvious need of Austrian retail companies for guidance regarding the selection of suitable logistics concepts andtechnologies. Implications provide an enhanced knowledge of novel retail logistics technologies that have to be taken into account in strategic decision making.
Limitations and future researchThe limitations of the research refer to the size of the sample and number of interviewees, the country-specific sample and respective retail business environment. Future research should investigate industry specific issues, best practices of retail logistics application (including investment – effect ratio) and user acceptance – from the viewpoint of operating employees.User acceptance could be evaluated by appropriate technology tests in companies or in laboratory environments.
264
Buschmann, S., Stüber, E. and Klinksiek-Rumpf, S. (2015), Cross-Channel im Umbruch. Das Informations- und Kaufverhalten der Konsumenten., 7th ed., ECC Köln, Köln.
Collin-Lachaud, I. and Vanheems, R. (2016), “Navigating between real and virtual spaces: An exploration of the hybrid shopping experience”, Recherche et Applications en Marketing (English Edition), Vol. 31 No. 2, pp. 40–58.
DHL Trend Research (2016), “Robotics in Logistics. A DPDHL perspectve on implications and use cases for the logistics industry”, available at: https://www.dhl.com/content/dam/downloads/g0/about_us/logistics_insights/dhl_trendreport_robotics.pdf (accessed 18 May 2020).
DHL Trend Research (2019), “Digital Twins in Logistics. A DHL perspective on the impact of digital twins on the logistics industry”, available at: https://www.dhl.com/content/dam/dhl/global/core/documents/pdf/glo-core-digital-twins-in-logistics.pdf (accessed 18 May 2020).
Drucker, P. (1962), “The economy’s dark continent”, Fortune, Vol. 65 No. 103, pp. 265–270.Ettouzani, Y., Yates, N. and Mena, C. (2012), “Examining retail on shelf availability:
promotional impact and a call for research”, International Journal of Physical Distribution & Logistics Management, Vol. 42 No. 3, pp. 213–243.
Franke, W. and Dangelmaier, W. (2006), RFID-Leitfaden für die Logistik, 1st ed., Gabler.Gartner (2017), “Prepare for the Impact of Digital Twins”, available at:
https://www.gartner.com/smarterwithgartner/prepare-for-the-impact-of-digital-twins/(accessed 18 May 2020).
Gopal, C. and Cahill, G. (1992), Logistics in Manufacturing, Irwin Professional Pub.Grewal, D., Roggeveen, A.L. and Nordfält, J. (2017), “The Future of Retailing”, Journal of
Retailing, Vol. 93 No. 1, pp. 1–6.Heinemann, G. (2017), Die Neuerfindung des stationären Einzelhandels, Springer Fachmedien
Wiesbaden, Wiesbaden.Hompel, M. ten and Schmidt, T. (2008), Warehouse Management: Organisation und
Steuerung von Lager- und Kommissioniersystemen ; mit 48 Tabellen, VDI-Buch, 3rd ed., Springer-Verlag Berlin Heidelberg, Berlin, Heidelberg.
Hübner, A.H., Kuhn, H., Wollenburg, J., Towers, N. and Kotzab, H. (2016), “Last mile fulfilment and distribution in omni-channel grocery retailing: a strategic planning framework”, International Journal of Retail & Distribution Management.
Inman, J.J. and Nikolova, H. (2017), “Shopper-Facing Retail Technology: A Retailer Adoption Decision Framework Incorporating Shopper Attitudes and Privacy Concerns”, Journal of Retailing, Vol. 93 No. 1, pp. 7–28.
Jünemann, R. (1989), Materialfluss und Logistik: Systemtechnische Grundlagen mit Praxisbeispielen, Berlin.
KHT (2020), “Messtechnik”, available at: https://kht.de/messtechnik/multiscan/ (accessed 18 May 2020).
KMU Forschung Austria (2019), “Strukturanalyse im stationären Einzelhandel 2019”, available at: https://www.kmuforschung.ac.at/wp-content/uploads/2019/06/Executive-Summary-Strukturanalyse-2019.pdf (accessed 18 May 2020).
Kotler, P. (2003), Marketing Management, 11th ed., Pearson Education Ltd., New Jersey.
265
Kuhn, H. and Sternbeck, M.G. (2013), “Integrative retail logistics: An exploratory study”, Operations Management Research, Vol. 6 No. 1-2, pp. 2–18.
Logistik KnowHow (2016), “Optimierung mittels Prozesskettenmanagement”, available at: https://logistikknowhow.com/lagerarchitektur/optimierung-mittels-prozesskettenmanagement/ (accessed 18 May 2020).
Metter, A. (2017), “Das digitale Einkaufserlebnis im stationären Handel”, Wirtschaftsinformatik & Management, Vol. 2017 No. 6, pp. 62–71.
MM Logistik (2019), “KHT stellt auf der Messe Promat aus”, available at: https://www.mm-logistik.vogel.de/kht-stellt-auf-der-messe-promat-aus-a-813068/ (accessed 18 May 2020).
Morenza-Cinos, M., Casamayor-Pujol, V. and Pous, R. (2019), “Stock visibility for retail using an RFID robot”, International Journal of Physical Distribution & Logistics Management,Vol. 49 No. 10, pp. 1020–1042.
Pantano, E. and Naccarato, G. (2010), “Entertainment in retailing: The influences of advanced technologies”, Journal of Retailing and Consumer Services, Vol. 17 No. 3, pp. 200–204.
Pantano, E. and Vannucci, V. (2019), “Who is innovating? An exploratory research of digital technologies diffusion in retail industry”, Journal of Retailing and Consumer Services,Vol. 49, pp. 297–304.
Renko, S. and Ficko, D. (2010), “New logistics technologies in improving customer value in retailing service”, Journal of Retailing and Consumer Services, Vol. 17 No. 3, pp. 216–223.
Scheuermann, C., Heinz, F., Bruegge, B. and Verclas, S. (2017), “Real-Time Support Duringa Logistic Process Using Smart Gloves”, Smart SysTech, Vol. 273, pp. 1–8.
Scheuermann, C., Strobel, M., Bruegge, B. and Verclas, S. (2016), “Increasing the Support to Humans in Factory Environments Using a Smart Glove: An Evaluation”, Intl IEEE Conferences on Ubiquitous Intelligence & Computing, Advanced and Trusted Computing, Scalable Computing and Communications, Cloud and Big Data Computing, Internet of People, and Smart World Congress, pp. 847–854.
Statista (2020), “E-Commerce-Anteil am Gesamtumsatz des Einzelhandels in Europa nach Ländern 2019”, available at: https://de.statista.com/statistik/daten/studie/996604/umfrage/e-commerce-anteil-am-gesamtumsatz-des-einzelhandels-in-europa/ (accessed 12 May 2020).
Stern, N.Z. and Ander, W.N. (2008), Greentailing and other Revolutions in Retail: Hot Ideas that are Grabbing Customers’ Attention and Raising Profits, John Wiley & Sons, New Jersey.
TRANSPOREON (2020a), “Innovative Logistics Software Solutions”, available at: https://www.transporeon.com/en/products/ (accessed 18 May 2020).
TRANSPOREON (2020b), “Mercareon driven by Transporeon”, available at: https://www.transporeon.com/en/about-us/mercareon/ (accessed 18 May 2020).
Vakulenko, Y., Hellström, D. and Hjort, K. (2018), “What’s in the parcel locker? Exploring customer value in e-commerce last mile delivery”, Journal of Business Research, Vol. 88, pp. 421–427.
Vries, J. de, Koster, R. de and Stam, D. (2016), “Exploring the role of picker personality in predicting picking performance with pick by voice, pick to light and RF-terminal picking”, International Journal of Production Research, Vol. 54 No. 8, pp. 2260–2274.
Buschmann, S., Stüber, E. and Klinksiek-Rumpf, S. (2015), Cross-Channel im Umbruch. Das Informations- und Kaufverhalten der Konsumenten., 7th ed., ECC Köln, Köln.
Collin-Lachaud, I. and Vanheems, R. (2016), “Navigating between real and virtual spaces: An exploration of the hybrid shopping experience”, Recherche et Applications en Marketing (English Edition), Vol. 31 No. 2, pp. 40–58.
DHL Trend Research (2016), “Robotics in Logistics. A DPDHL perspectve on implications and use cases for the logistics industry”, available at: https://www.dhl.com/content/dam/downloads/g0/about_us/logistics_insights/dhl_trendreport_robotics.pdf (accessed 18 May 2020).
DHL Trend Research (2019), “Digital Twins in Logistics. A DHL perspective on the impact of digital twins on the logistics industry”, available at: https://www.dhl.com/content/dam/dhl/global/core/documents/pdf/glo-core-digital-twins-in-logistics.pdf (accessed 18 May 2020).
Drucker, P. (1962), “The economy’s dark continent”, Fortune, Vol. 65 No. 103, pp. 265–270.Ettouzani, Y., Yates, N. and Mena, C. (2012), “Examining retail on shelf availability:
promotional impact and a call for research”, International Journal of Physical Distribution & Logistics Management, Vol. 42 No. 3, pp. 213–243.
Franke, W. and Dangelmaier, W. (2006), RFID-Leitfaden für die Logistik, 1st ed., Gabler.Gartner (2017), “Prepare for the Impact of Digital Twins”, available at:
https://www.gartner.com/smarterwithgartner/prepare-for-the-impact-of-digital-twins/(accessed 18 May 2020).
Gopal, C. and Cahill, G. (1992), Logistics in Manufacturing, Irwin Professional Pub.Grewal, D., Roggeveen, A.L. and Nordfält, J. (2017), “The Future of Retailing”, Journal of
Retailing, Vol. 93 No. 1, pp. 1–6.Heinemann, G. (2017), Die Neuerfindung des stationären Einzelhandels, Springer Fachmedien
Wiesbaden, Wiesbaden.Hompel, M. ten and Schmidt, T. (2008), Warehouse Management: Organisation und
Steuerung von Lager- und Kommissioniersystemen ; mit 48 Tabellen, VDI-Buch, 3rd ed., Springer-Verlag Berlin Heidelberg, Berlin, Heidelberg.
Hübner, A.H., Kuhn, H., Wollenburg, J., Towers, N. and Kotzab, H. (2016), “Last mile fulfilment and distribution in omni-channel grocery retailing: a strategic planning framework”, International Journal of Retail & Distribution Management.
Inman, J.J. and Nikolova, H. (2017), “Shopper-Facing Retail Technology: A Retailer Adoption Decision Framework Incorporating Shopper Attitudes and Privacy Concerns”, Journal of Retailing, Vol. 93 No. 1, pp. 7–28.
Jünemann, R. (1989), Materialfluss und Logistik: Systemtechnische Grundlagen mit Praxisbeispielen, Berlin.
KHT (2020), “Messtechnik”, available at: https://kht.de/messtechnik/multiscan/ (accessed 18 May 2020).
KMU Forschung Austria (2019), “Strukturanalyse im stationären Einzelhandel 2019”, available at: https://www.kmuforschung.ac.at/wp-content/uploads/2019/06/Executive-Summary-Strukturanalyse-2019.pdf (accessed 18 May 2020).
Kotler, P. (2003), Marketing Management, 11th ed., Pearson Education Ltd., New Jersey.

266
Waters, D. (2003), Logistics: An Introduction to Supply Chain Management, UK.Willems, K., Smolders, A., Brengman, M., Luyten, K. and Schöning, J. (2017), “The path-to-
purchase is paved with digital opportunities: An inventory of shopper-oriented retail technologies”, Technological Forecasting and Social Change, Vol. 124, pp. 228–242.
Xing, Y., Grant, D.B., McKinnon, A.C. and Fernie, J. (2011), “The interface between retailers and logistics service providers in the online market”, European Journal of Marketing,Vol. 45 No. 3, pp. 334–357.
Zaerpour, N., Yu, Y. and Koster, R.B.M. de (2017), “Response time analysis of a live-cube compact storage system with two storage classes”, IISE Transactions, Vol. 49 No. 5, pp. 461–480.
Corresponding authorMarike Kellermayr-Scheucher can be contacted at: [email protected]
267
1
SCOUTING THE FUTURE OF RETAIL (SCORE) - A CORPORATE FORESIGHT BASED RETAIL RESEARCH METHODOLOGY
Brandtner, Patrick*; Massimiani, Andrea*; Schauer, Oliver*
*University of Applied Sciences Upper Austria
The retail sector is and has always been characterized by a high degree of change – either in terms of customer requirements, market conditions, legal constraints, political interferences or in terms of global mega trends like individualization, servitization, digitalization or urbanization. Especially during the last two decades, the speed of this change has accelerated, leading to e.g. the growing power of online market players or the rise of big platforms controlling whole retail ecosystems. The retail sector has to be prepared for impending transformations and the ability to identify, analyse and contextually react to these changes will be an essential one in the future. However, most retail practitioners seem to rather react to changes than to proact and prepare for them. Also, scientific literature does not provide practicable, implementable and evaluated uncertainty reduction approaches for the retail sector. The current paper addresses this area of tension between practical relevance and research gap. In the form of the SCORE initiative, a corporate foresight based methodology for retail research is developed and presented. Its implementation is done in the course of large-scale Austrian research project (logistikum.RETAIL). The main results of the paper are the SCORE methodology consisting of the four elements of 1) the SCORE community, 2) the software platform Trendwatch, 3) the developed trend monitoring approach, 4) quarterly focus workshops and 5) trend profiles as a basis for driving change in practice.
1. IntroductionThe motto "trade is change" is more valid today than ever before. However, it is no longer retail itself that is driving this change, but is rather being driven by it. While sales in online retailing continue to grow steadily, stationary retailers are losing customers to online trading, especially to the major global online platforms such as Amazon. Customers have become more demanding, their expectations of retail have changed and they are increasingly becoming the shaping force of digital change. In addition, digitalization is creating new standards in terms of product availability, price transparency, service and consulting, as well as innovative business models. The majority of stationary retailers perceives digitalization and the simultaneous online and offline offering of their goods as a major challenge. Against this background, it is essential to build up the necessary skills and an appropriate infrastructure within the company, which enables the recognition of weak signals of this change in the business environment, the identification of trends and the derivation of concrete action measures. Nevertheless, in the context of retail and retail management, research methodologies and theoretically grounded approaches to strategic uncertainty reduction, which are also applicable and implementable from practitioners’ point of view, are scarce. The concept Strategic or Corporate Foresight offers one way of making the future of retail tangible and depictable in scenarios. It is precisely this challenge that the SCORE initiative of the Network of Excellence Logistics -logistikum.RETAIL is addressing.
Hence, the main research question of the paper is defined as follows: How to develop apracticable methodology for strategic uncertainty reduction in retail and how to establish and ensure (i.e. implement) a community of practitioners and scientific experts with the joint vision of identifying, monitoring, discussing and dealing with the implications of trends in the retail sector. To address this question, the paper presents the SCORE initiative. As an alliance of
Waters, D. (2003), Logistics: An Introduction to Supply Chain Management, UK.Willems, K., Smolders, A., Brengman, M., Luyten, K. and Schöning, J. (2017), “The path-to-
purchase is paved with digital opportunities: An inventory of shopper-oriented retail technologies”, Technological Forecasting and Social Change, Vol. 124, pp. 228–242.
Xing, Y., Grant, D.B., McKinnon, A.C. and Fernie, J. (2011), “The interface between retailers and logistics service providers in the online market”, European Journal of Marketing,Vol. 45 No. 3, pp. 334–357.
Zaerpour, N., Yu, Y. and Koster, R.B.M. de (2017), “Response time analysis of a live-cube compact storage system with two storage classes”, IISE Transactions, Vol. 49 No. 5, pp. 461–480.
Corresponding authorMarike Kellermayr-Scheucher can be contacted at: [email protected]
268
2
business and science, SCORE pursues the goal of identifying and analysing trends and developments in the context of the retail of the future and preparing them as a starting point for internal company use case definition. To this end, SCORE applies central elements of Corporate Foresight and adapts it to the specifics of the retail sector in the form of the developed SCORE methodology for retail. SCORE is part of the Excellence Network Logistics -logistikum.RETAIL, which pursues the vision of establishing an internationally leading innovation and competence centre for the retail sector and the strengthening the innovation chain of education, business and research. Against this background and based on the community of Logistikum.RETAIL, the developed SCORE methodology and initiative is critically discussed and based on the application results and the practitioner feedback gained so far.
2. Research Background
2.1. Uncertainties in the Retail SectorThe retail business represents an ever-evolving landscape. It has become progressively wider and global in scope. Retailers find themselves in a mature environment, in which clients’ expectations are continuously increasing and evolving (Grewal et al., 2009). Customer satisfaction derived from their subjective fulfilment of their expectations will determine their continued store choice (Paul et al., 2016). Companies in the retail sector also face new challenges with more competition due to the accelerated pace of technological change, more sophisticated management practices, and industry consolidation (Sirohi et al., 1998). Innovation and the application of technology are core elements to develop more satisfying shopping experiences; both enable ambiances that strongly impact on customer persuasion (Sharma, Stafford, 2000). The retail sector is also widely affected by the emergence of new trends. While it is widely common to refer to trends as strong determinants of change, the problem is knowing how to identify which to act on. Forward looking analysis can assist individuals, business sector, institutions and the policy sphere to better prepare for the future and look for potential opportunities and threats (Gallouj et al., 2015).
2.2. Corporate ForesightFrom a theoretical perspective, the paper builds on the approach of Corporate Foresight (CF) (Voros, 2003, Rohrbeck, 2011). CF has its roots in the field of strategic early warning and places a special emphasis on applied future research in companies. Initial approaches in this area were presented as early as the 1970s, specifically combining elements of corporate environment monitoring and future forecasting with the aim of reducing uncertainty (Peter, Jarratt 2013). Various definitions of the term can be found in the scientific literature. In this paper, corporate foresight is defined as an approach to identify and assess weak signals from the internal and external corporate environment at an early stage. CF enables the identification of trends and strategic issues and highlights their interrelationships. By supporting the interpretation of their consequences for the company, CF serves as a basis for corporate and innovation strategy planning and can therefore be regarded as part of strategic innovation management (Brandtner, 2018a; Brandtner et al., 2014).
3. The SCORE MethodologyVarious foresight frameworks and approaches can be found in the literature, two of the most recognized CF frameworks are represented in the form of the "Successful Foresight Process" by Horton (Horton 1999) and the "Generic Foresight Process Framework" by Voros (Voros 2003), which is based on it. Based on these two approaches, a three-step methodology is defined
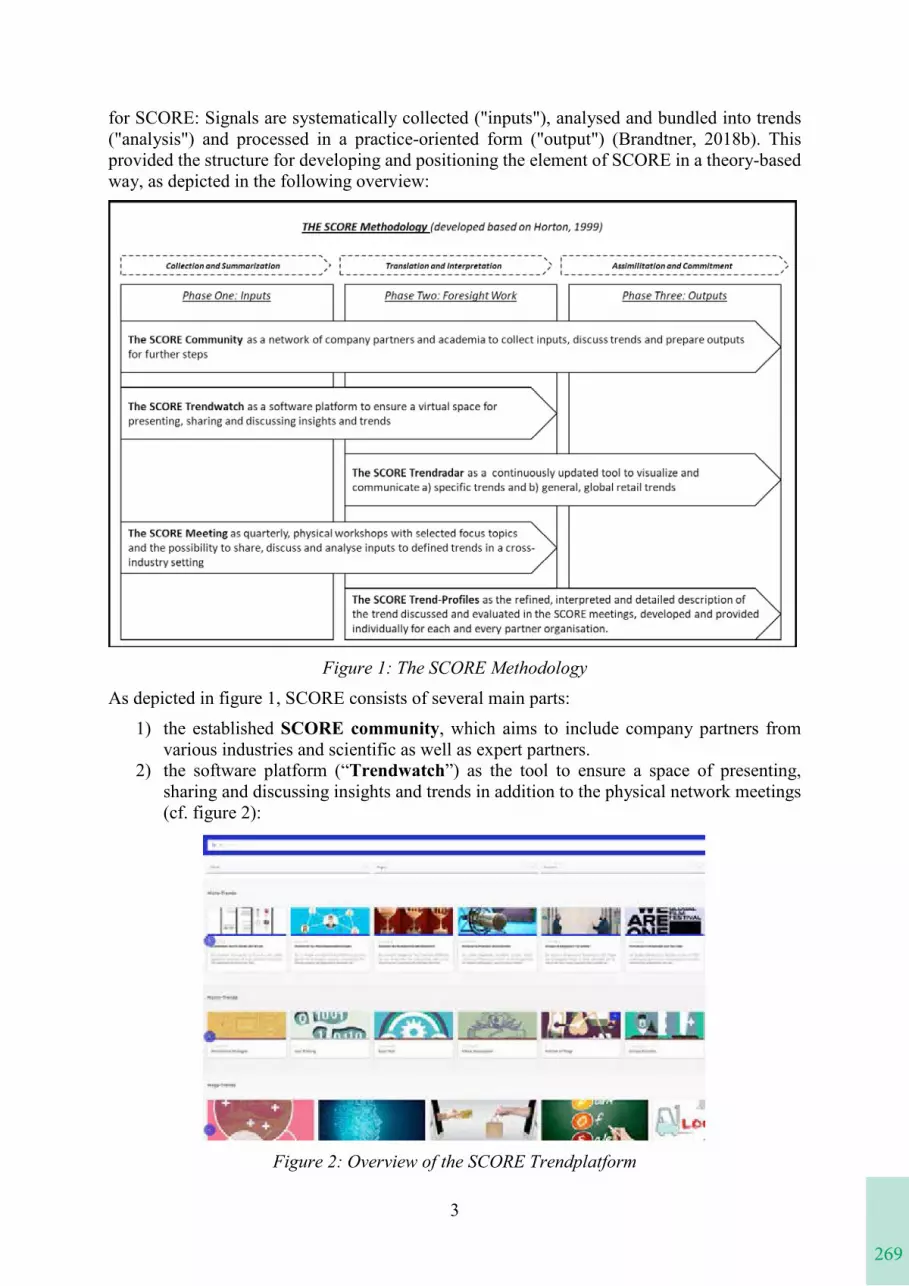
269
3
for SCORE: Signals are systematically collected ("inputs"), analysed and bundled into trends ("analysis") and processed in a practice-oriented form ("output") (Brandtner, 2018b). Thisprovided the structure for developing and positioning the element of SCORE in a theory-based way, as depicted in the following overview:
Figure 1: The SCORE MethodologyAs depicted in figure 1, SCORE consists of several main parts:
1) the established SCORE community, which aims to include company partners from various industries and scientific as well as expert partners.
2) the software platform (“Trendwatch”) as the tool to ensure a space of presenting, sharing and discussing insights and trends in addition to the physical network meetings (cf. figure 2):
Figure 2: Overview of the SCORE Trendplatform
2
business and science, SCORE pursues the goal of identifying and analysing trends and developments in the context of the retail of the future and preparing them as a starting point for internal company use case definition. To this end, SCORE applies central elements of Corporate Foresight and adapts it to the specifics of the retail sector in the form of the developed SCORE methodology for retail. SCORE is part of the Excellence Network Logistics -logistikum.RETAIL, which pursues the vision of establishing an internationally leading innovation and competence centre for the retail sector and the strengthening the innovation chain of education, business and research. Against this background and based on the community of Logistikum.RETAIL, the developed SCORE methodology and initiative is critically discussed and based on the application results and the practitioner feedback gained so far.
2. Research Background
2.1. Uncertainties in the Retail SectorThe retail business represents an ever-evolving landscape. It has become progressively wider and global in scope. Retailers find themselves in a mature environment, in which clients’ expectations are continuously increasing and evolving (Grewal et al., 2009). Customer satisfaction derived from their subjective fulfilment of their expectations will determine their continued store choice (Paul et al., 2016). Companies in the retail sector also face new challenges with more competition due to the accelerated pace of technological change, more sophisticated management practices, and industry consolidation (Sirohi et al., 1998). Innovation and the application of technology are core elements to develop more satisfying shopping experiences; both enable ambiances that strongly impact on customer persuasion (Sharma, Stafford, 2000). The retail sector is also widely affected by the emergence of new trends. While it is widely common to refer to trends as strong determinants of change, the problem is knowing how to identify which to act on. Forward looking analysis can assist individuals, business sector, institutions and the policy sphere to better prepare for the future and look for potential opportunities and threats (Gallouj et al., 2015).
2.2. Corporate ForesightFrom a theoretical perspective, the paper builds on the approach of Corporate Foresight (CF) (Voros, 2003, Rohrbeck, 2011). CF has its roots in the field of strategic early warning and places a special emphasis on applied future research in companies. Initial approaches in this area were presented as early as the 1970s, specifically combining elements of corporate environment monitoring and future forecasting with the aim of reducing uncertainty (Peter, Jarratt 2013). Various definitions of the term can be found in the scientific literature. In this paper, corporate foresight is defined as an approach to identify and assess weak signals from the internal and external corporate environment at an early stage. CF enables the identification of trends and strategic issues and highlights their interrelationships. By supporting the interpretation of their consequences for the company, CF serves as a basis for corporate and innovation strategy planning and can therefore be regarded as part of strategic innovation management (Brandtner, 2018a; Brandtner et al., 2014).
3. The SCORE MethodologyVarious foresight frameworks and approaches can be found in the literature, two of the most recognized CF frameworks are represented in the form of the "Successful Foresight Process" by Horton (Horton 1999) and the "Generic Foresight Process Framework" by Voros (Voros 2003), which is based on it. Based on these two approaches, a three-step methodology is defined
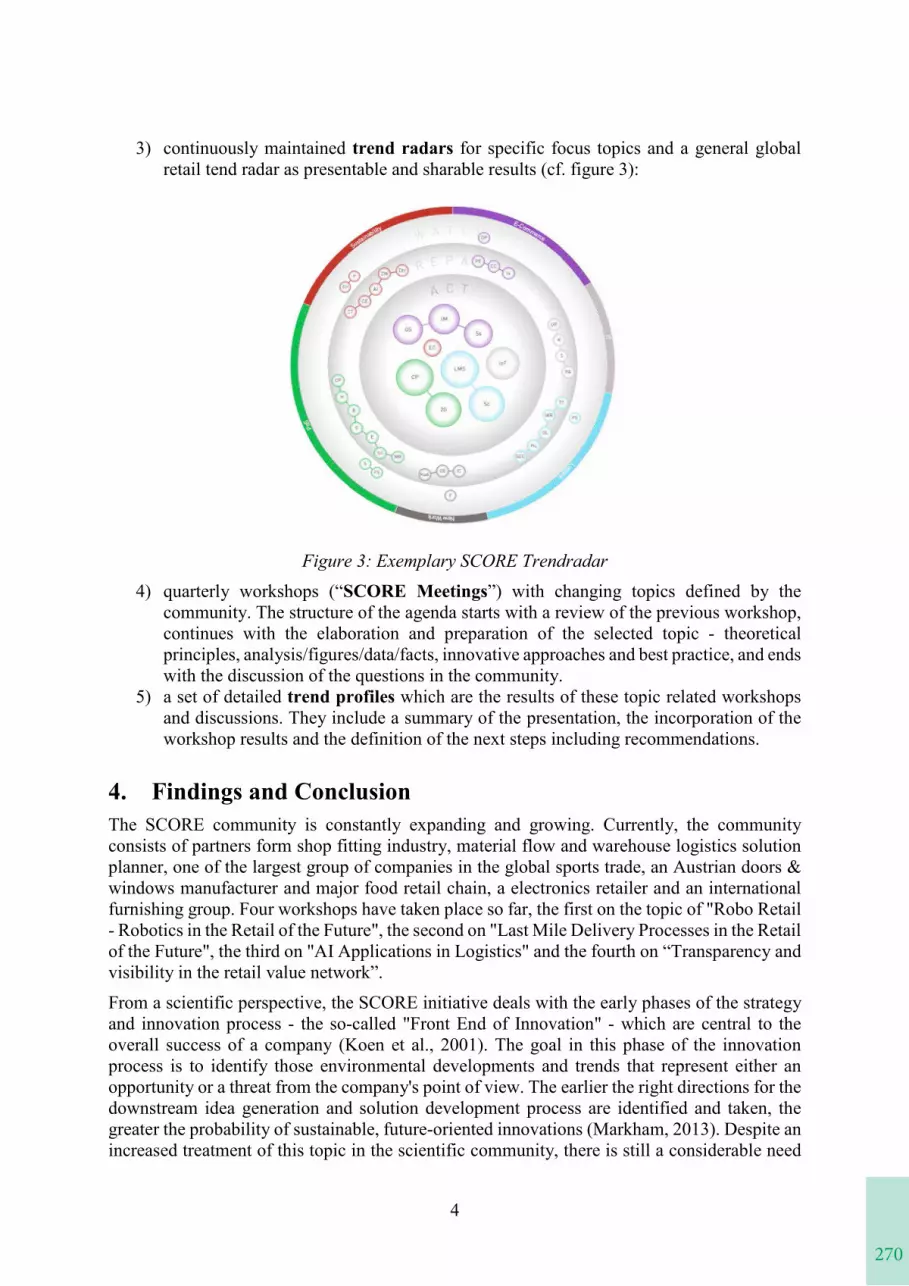
270
4
3) continuously maintained trend radars for specific focus topics and a general global retail tend radar as presentable and sharable results (cf. figure 3):
Figure 3: Exemplary SCORE Trendradar4) quarterly workshops (“SCORE Meetings”) with changing topics defined by the
community. The structure of the agenda starts with a review of the previous workshop, continues with the elaboration and preparation of the selected topic - theoretical principles, analysis/figures/data/facts, innovative approaches and best practice, and ends with the discussion of the questions in the community.
5) a set of detailed trend profiles which are the results of these topic related workshops and discussions. They include a summary of the presentation, the incorporation of the workshop results and the definition of the next steps including recommendations.
4. Findings and ConclusionThe SCORE community is constantly expanding and growing. Currently, the community consists of partners form shop fitting industry, material flow and warehouse logistics solution planner, one of the largest group of companies in the global sports trade, an Austrian doors & windows manufacturer and major food retail chain, a electronics retailer and an international furnishing group. Four workshops have taken place so far, the first on the topic of "Robo Retail - Robotics in the Retail of the Future", the second on "Last Mile Delivery Processes in the Retail of the Future", the third on "AI Applications in Logistics" and the fourth on “Transparency and visibility in the retail value network”.
From a scientific perspective, the SCORE initiative deals with the early phases of the strategy and innovation process - the so-called "Front End of Innovation" - which are central to the overall success of a company (Koen et al., 2001). The goal in this phase of the innovation process is to identify those environmental developments and trends that represent either an opportunity or a threat from the company's point of view. The earlier the right directions for the downstream idea generation and solution development process are identified and taken, the greater the probability of sustainable, future-oriented innovations (Markham, 2013). Despite an increased treatment of this topic in the scientific community, there is still a considerable need
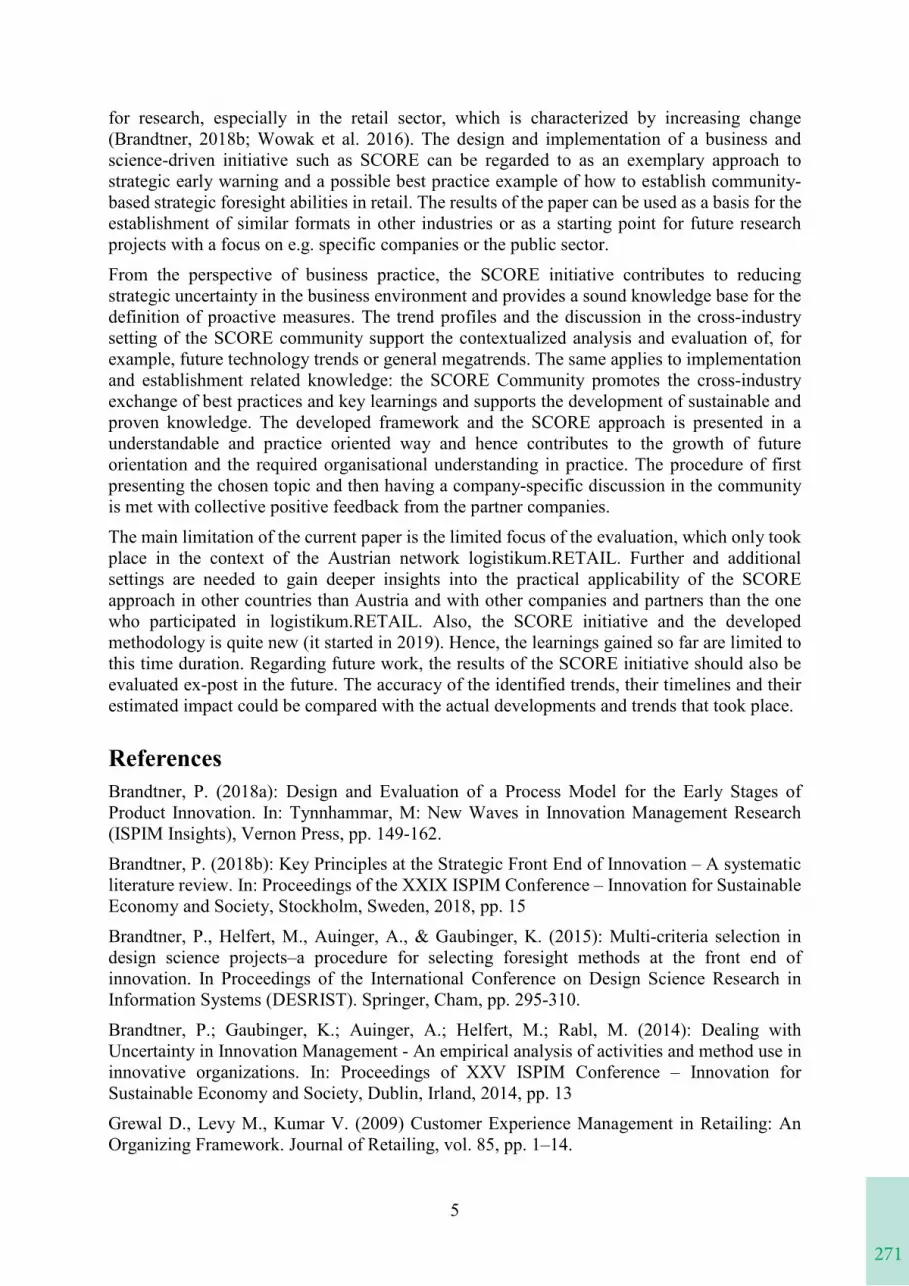
271
5
for research, especially in the retail sector, which is characterized by increasing change (Brandtner, 2018b; Wowak et al. 2016). The design and implementation of a business and science-driven initiative such as SCORE can be regarded to as an exemplary approach to strategic early warning and a possible best practice example of how to establish community-based strategic foresight abilities in retail. The results of the paper can be used as a basis for the establishment of similar formats in other industries or as a starting point for future research projects with a focus on e.g. specific companies or the public sector.
From the perspective of business practice, the SCORE initiative contributes to reducing strategic uncertainty in the business environment and provides a sound knowledge base for the definition of proactive measures. The trend profiles and the discussion in the cross-industry setting of the SCORE community support the contextualized analysis and evaluation of, for example, future technology trends or general megatrends. The same applies to implementation and establishment related knowledge: the SCORE Community promotes the cross-industry exchange of best practices and key learnings and supports the development of sustainable and proven knowledge. The developed framework and the SCORE approach is presented in a understandable and practice oriented way and hence contributes to the growth of future orientation and the required organisational understanding in practice. The procedure of first presenting the chosen topic and then having a company-specific discussion in the community is met with collective positive feedback from the partner companies.
The main limitation of the current paper is the limited focus of the evaluation, which only took place in the context of the Austrian network logistikum.RETAIL. Further and additional settings are needed to gain deeper insights into the practical applicability of the SCORE approach in other countries than Austria and with other companies and partners than the one who participated in logistikum.RETAIL. Also, the SCORE initiative and the developed methodology is quite new (it started in 2019). Hence, the learnings gained so far are limited to this time duration. Regarding future work, the results of the SCORE initiative should also be evaluated ex-post in the future. The accuracy of the identified trends, their timelines and their estimated impact could be compared with the actual developments and trends that took place.
ReferencesBrandtner, P. (2018a): Design and Evaluation of a Process Model for the Early Stages of Product Innovation. In: Tynnhammar, M: New Waves in Innovation Management Research (ISPIM Insights), Vernon Press, pp. 149-162.
Brandtner, P. (2018b): Key Principles at the Strategic Front End of Innovation – A systematic literature review. In: Proceedings of the XXIX ISPIM Conference – Innovation for Sustainable Economy and Society, Stockholm, Sweden, 2018, pp. 15
Brandtner, P., Helfert, M., Auinger, A., & Gaubinger, K. (2015): Multi-criteria selection in design science projects–a procedure for selecting foresight methods at the front end of innovation. In Proceedings of the International Conference on Design Science Research in Information Systems (DESRIST). Springer, Cham, pp. 295-310.
Brandtner, P.; Gaubinger, K.; Auinger, A.; Helfert, M.; Rabl, M. (2014): Dealing with Uncertainty in Innovation Management - An empirical analysis of activities and method use in innovative organizations. In: Proceedings of XXV ISPIM Conference – Innovation for Sustainable Economy and Society, Dublin, Irland, 2014, pp. 13
Grewal D., Levy M., Kumar V. (2009) Customer Experience Management in Retailing: An Organizing Framework. Journal of Retailing, vol. 85, pp. 1–14.
4
3) continuously maintained trend radars for specific focus topics and a general global retail tend radar as presentable and sharable results (cf. figure 3):
Figure 3: Exemplary SCORE Trendradar4) quarterly workshops (“SCORE Meetings”) with changing topics defined by the
community. The structure of the agenda starts with a review of the previous workshop, continues with the elaboration and preparation of the selected topic - theoretical principles, analysis/figures/data/facts, innovative approaches and best practice, and ends with the discussion of the questions in the community.
5) a set of detailed trend profiles which are the results of these topic related workshops and discussions. They include a summary of the presentation, the incorporation of the workshop results and the definition of the next steps including recommendations.
4. Findings and ConclusionThe SCORE community is constantly expanding and growing. Currently, the community consists of partners form shop fitting industry, material flow and warehouse logistics solution planner, one of the largest group of companies in the global sports trade, an Austrian doors & windows manufacturer and major food retail chain, a electronics retailer and an international furnishing group. Four workshops have taken place so far, the first on the topic of "Robo Retail - Robotics in the Retail of the Future", the second on "Last Mile Delivery Processes in the Retail of the Future", the third on "AI Applications in Logistics" and the fourth on “Transparency and visibility in the retail value network”.
From a scientific perspective, the SCORE initiative deals with the early phases of the strategy and innovation process - the so-called "Front End of Innovation" - which are central to the overall success of a company (Koen et al., 2001). The goal in this phase of the innovation process is to identify those environmental developments and trends that represent either an opportunity or a threat from the company's point of view. The earlier the right directions for the downstream idea generation and solution development process are identified and taken, the greater the probability of sustainable, future-oriented innovations (Markham, 2013). Despite an increased treatment of this topic in the scientific community, there is still a considerable need
272
6
FaÏz Gallouj, Matthias Weber, Metka Stare, Luis Rubalcaba. The futures of the service economy in Europe: a foresight analysis. Technological Forecasting and Social Change, Elsevier, 2015, pp.TSF18028. ffhalshs-01133897 (accessed 07.05.2020)
Koen, P. A. et al. (2001): Providing Clarity and a Common Language to the "Fuzzy Front End". In Research technology management. 44 (2), pp. 46-55.
Markham, S. K. (2013): The Impact of Front-End Innovation Activities on Product Performance. In Journal of Product Innovation Management 30 (S1), pp. 77-92.
Paul J., Sankaranarayanan K.G., Mekoth N. (2016) Consumer satisfaction in retail stores: Theory and implications. International Journal of Consumer Studies, Volume 40, Issue 6, pp. 635-642
Peter, M. K.; Jarratt, D. G. (2013): The practice of foresight in long-term planning. In Technological Forecasting and Social Change 3(1), pp. 49-61.
Rohrbeck, R. (2011): Corporate Foresight. Heidelberg: Physica-Verlag HD.
Sharma A., Stafford T. (2000) The Effect of Retail Atmospherics on Customers’ Perceptions of Salespeople and Customer Persuasion: An Empirical Investigation. Journal of Business Research, vol. 49, pp. 183–191.
Sirohi N., McLaughlin E., Wittink D. (1998) A model of consumer perceptions and store loyalty intentions for a supermarket retailer., Journal of Retailing, vol. 74, pp. 223–245.
Voros, J. (2003): A generic foresight process framework. In Foresight 5 (3), pp. 10-21.
Wowak, K. D. et al. (2016): Toward a “Theoretical Toolbox” for the Supplier-Enabled Fuzzy Front End of the New Product Development Process. In Journal of Supply Chain Management 52 (1), pp. 66-81.
Keywords*Corporate Foresight, Retail Management, Strategic Uncertainty Reduction, Retail Trends, Retail Research
273
“A MODEL OF USAGE INTENTION FOR AR‐BASED SELF‐SERVICE TECHNOLOGIES”
Maria-Jose Castillo (University of Valencia)Enrique Bigne (University of Valencia)
Two important trends motivate the present study. Augmented reality and self-service technologies are becoming popular in the retail sector. These two technologies have triggered increasing, but fragmented, academic research. Therefore, integrative models are needed. Accordingly, this paper proposes a model that identifies factors that, in the retail context, influence consumers’ acceptance of, and usage intentions towards, augmented reality self-service technologies: the augmented reality in retail model (ARiR model). The ARiR model extends the original technology acceptance model to augmented reality and introduces five new constructs: need for personal interaction, aesthetics, navigation, self-efficacy, and technology readiness. To capture potential differences based on levels of internet use and economic development, the empirical study was conducted in a developing country, Nicaragua, and in a developed country, the USA. The model was tested through partial least squares structural equation modeling. The study findings suggested that perceived usefulness, attitude, and technology readiness are the main factors that influence usage intention for AR-based SSTs; and the other antecedent constructs were proven to be significant predictors, except for the need for personal interaction. Cross-cultural comparisons indicate that both countries have similar attitudes and usage intentions towards AR-based SSTs. This paper provides insights into the perceived value, and motives, for customers to use and accept AR-based SSTs; these insights can serve as guidelines for future applications. Furthermore, it validates the proposed ARiR model in technology acceptance of augmented reality in retailing, in both developed and developing countries.
274
“FIELD OBSERVATIONS ON THE STRATEGIC PLACEMENT OF RETAIL ROBOTS”
Laurens De Gauquier, Malaika Brengman, Kim Willems, Hoang-Long Cao, Bram Vanderborght(Vrije Universiteit Brussel)
The purpose of this paper is to empirically verify the optimal strategic placement of humanoid service robots (HSRs) by inspecting subsequent performance metrics, along the point-of-sale (POS) conversion funnel. The study was conducted by means of unobtrusive observations in a Belgian chocolate store. In total, 28 hours of video observation material was collected and analyzed, evenly spread over two conditions: (1) an HSR placed outside and (2) an HSR inside the store. All passers-by and their interactions with the robot have been systematically recorded and compared. The study found that there is no universal optimal placement of robots, but rather that the placement should depend on the main purpose the retailer has for its implementation (cf. POS Conversion Funnel). An HSR placed outside the store is advisable to attract attention, while an HSR placed inside the store is more lucrative in generating sales conversions. This study was not able to verify the internal emotional/cognitive state of the passers-by, as the method comprised unobtrusive camera observations. A more longitudinal research design is necessary to exclude a potential bias due to the novelty effect. While research on robots in retail services is booming, this study is practically the first to provide insights for retailers on how to decide on the placement of robots in/outside the store, depending on the particular goals they are aiming to reach at the point-of-purchase.
275
“THE ROLE OF CUSTOMER INSPIRATION AND CUSTOMER CONFUSION IN ONLINE ASSORTMENT ORGANIZATION”
Laura Bertrandie, Stephan Zielke (University of Wuppertal)
Offline retailers can organize their assortments per substitutes (within one category i.e. different shirts) or per complements (across categories i.e. complete outfits). Recently, complementary organization has been adapted to online sales channels. The question remains whether effects of complementary organization are transferable to the online environment. This paper will focus on the counteracting forces of customer inspiration and customer confusion evoked by complementary assortment organization. In our study, we examine the influence of substitutive vs. complementary online assortment organization on cognitive and affective customer confusion, customer inspiration and their net impact on assortment perception. In an experiment with three scenarios, we manipulate an online shop including substitutive or complementary organization (with or without display of the total set price). The results show that assortment organization has an influence on assortment perception via customer inspiration and customer confusion. For customer confusion, we find a double mediation effect: complementary organization leads to more cognitive confusion than substitutive organization and assortment perception is only influenced negatively if cognitive confusion leads to a negative evaluation of the situation (i.e. affective confusion). Complementary organization also leads to more customer inspiration, which mediates assortment perception positively. However, this effect is mitigated when the total price of the complementary set is displayed. The net impact of complementary assortment organization on assortment perception is positive due to the stronger effect of inspiration. Online and multi-channel retailers should employ complementary organization additionally and use design elements (e.g. pictures) to tap into the benefits of customer inspiration.
“FIELD OBSERVATIONS ON THE STRATEGIC PLACEMENT OF RETAIL ROBOTS”
The purpose of this paper is to empirically verify the optimal strategic placement of humanoid service robots (HSRs) by inspecting subsequent performance metrics, along the point-of-sale (POS) conversion funnel. The study was conducted by means of unobtrusive observations in a Belgian chocolate store. In total, 28 hours of video observation material was collected and analyzed, evenly spread over two conditions: (1) an HSR placed outside and (2) an HSR inside the store. All passers-by and their interactions with the robot have been systematically recorded and compared. The study found that there is no universal optimal placement of robots, but rather that the placement should depend on the main purpose the retailer has for its implementation (cf. POS Conversion Funnel). An HSR placed outside the store is advisable to attract attention, while an HSR placed inside the store is more lucrative in generating sales conversions. This study was not able to verify the internal emotional/cognitive state of the passers-by, as the method comprised unobtrusive camera observations. A more longitudinal research design is necessary to exclude a potential bias due to the novelty effect. While research on robots in retail services is booming, this study is practically the first to provide insights for retailers on how to decide on the placement of robots in/outside the store, depending on the particular goals they are aiming to reach at the point-of-purchase.
276
INVESTIGATING FACTORS THAT INFLUENCE LIVE-
STREAMING SALES BEHAVIOR: TRUST TRANSFER AND
PARA-SOCIAL INTERACTION PERSPECTIVE Bo LuSchool of ManagementHarbin Institute of Technology, Hei Longjiang province, [email protected] Li GuoxinSchool of ManagementHarbin Institute of Technology, Hei Longjiang province, [email protected] Roisin VizeSchool of MarketingTU Dublin, Dublin, [email protected] Etain KidneySchool of MarketingTU Dublin, Dublin, [email protected] Yufeng He School of ManagementHarbin Institute of Technology, Hei Longjiang province, [email protected]
KeywordsLive streaming, online influencers, trust transfer, para-social interaction, panel data
IntroductionThis study develops a conceptual model that explores the antecedents of sales performance in a live streaming context. Specifically, the study explores how consumer trust transfers from influencer to product via para-social interaction in live streaming shopping. Para-social interaction is proposed as a mediator between the antecedents (influencer popularity and influencer expertise) and behavioral loyalty (product sales). Live streaming has become a popular tactic for online retailers to show case and sell products. In 2017, the global live streaming market was valued at $32 billion and is expected to reach $60 billion by 2026 (Industry Research, 2019). Live streamingplatforms have contributed to the rapidly growing demand of online influencers who are considered by their large number of followers as trusted opinion leaders (Lou and Yuan, 2019). Brands and businesses are also interested in finding ways to leverage "popular figures" as brand ambassadors on live streaming campaigns. In the e-retailing
277
environment, trust transfer and para-social interactions exist because of the characteristics of online shopping participants and live streaming (Liu et al.,2018;Boerman, 2020). Research suggests that trust transfer and para-social interactions influence in an online context (Teoh et al. ,2008). However, there is a significant deficiency in our understanding of how trust and para-social interaction between the influencer and the consumer can stimulate purchases in a live-streaming context. Our study is the first to examine the impact of live streaming trust among consumers, influencers and brands. Also, the study is the first to investigate para-social interaction between an influencer and fans using real-time data. Our panel dataset for empirical validation for our hypotheses comes from Kwai, the largest users and the earliest picture and video sharing social app in China. The data is collected ranging from 1st October to 2019 to 31st January 2020. Consequently, our dataset mainly consists of three parts: (1) product attributes (i.e., sales, categories) of each live streaming, (2) users interaction information (i.e., likes viewers, and interactions), (3) influencers information (i.e., followers, gender, onstellation and number of live streaming activities).
PurposeThis study investigates influencer marketing in a live streaming context. Specifically, we explore factors relating to perceived influencer expertise and influencer popularity as antecedents to sales performance. The aim is to investigate this relatively new sales method, i.e., social commerce that retailers are increasingly engaging in to entice sales.We use panel data to explore and address this phenomenon. Trust transfer (Stewart, 2003)and para-social interaction (Horton and Richard Wohl, 1956)theories underpin the conceptual model. Live streaming has altered traditional social commerce (Sun et al., 2019). Live streaming is an emerging video content creation platform, which facilitates engaging and timely interaction amongst users (Zhao et al., 2019). Live streaming literature highlights several potential factors that may influence live streaming effectiveness, which typically includes streamers personalities, the extent of expertise, social interactivity (Zhao et al., 2019; Leung, Kim and Tse, 2020;Park and Lin, 2020)and source credibility (Todd and Melancon, 2018). Research shows that the effectiveness of live streaming aligns with purchase intention (Zhang et al., 2019),engagement(Sun et al., 2019), intention for continuous viewing of the event (Hu, Zhang and Wang, 2017), investment in streamers and perceived entertainment value of streamers(Todd and Melancon, 2018). In the context of live streaming, trust is a building block for interpersonal interactions (Hollebeek & Macky, 2019). Trust helps to reduce social complexity and uncertainty involved in the social commercial environment and trust is viewed to be a significant factor in forming and maintaining long-term customer relationships(Sharma, Menard and Mutchler, 2019). It is therefore reasonable to assert that trust can be used to foster brand attitude, engagement, eWOM, nurture sales, and contribute to customer loyalty development (Hollebeek & Macky, 2019; Shin, 2019; Sarkar et al., 2020). Bennett and Rundle-Thiele (2002) examined that behavioral loyalty is the result of attitudinal loyalty and these results can be market share, sales or others. Based on trust transfer theory (Stewart, 2003), a consumer’s trust in an established trusted entity (e.g., online influencers) can transfer to a related entity
INVESTIGATING FACTORS THAT INFLUENCE LIVE-
STREAMING SALES BEHAVIOR: TRUST TRANSFER AND
PARA-SOCIAL INTERACTION PERSPECTIVE Bo LuSchool of ManagementHarbin Institute of Technology, Hei Longjiang province, [email protected] Li GuoxinSchool of ManagementHarbin Institute of Technology, Hei Longjiang province, [email protected] Roisin VizeSchool of MarketingTU Dublin, Dublin, [email protected] Etain KidneySchool of MarketingTU Dublin, Dublin, [email protected] Yufeng He School of ManagementHarbin Institute of Technology, Hei Longjiang province, [email protected]
KeywordsLive streaming, online influencers, trust transfer, para-social interaction, panel data
IntroductionThis study develops a conceptual model that explores the antecedents of sales performance in a live streaming context. Specifically, the study explores how consumer trust transfers from influencer to product via para-social interaction in live streaming shopping. Para-social interaction is proposed as a mediator between the antecedents (influencer popularity and influencer expertise) and behavioral loyalty (product sales). Live streaming has become a popular tactic for online retailers to show case and sell products. In 2017, the global live streaming market was valued at $32 billion and is expected to reach $60 billion by 2026 (Industry Research, 2019). Live streamingplatforms have contributed to the rapidly growing demand of online influencers who are considered by their large number of followers as trusted opinion leaders (Lou and Yuan, 2019). Brands and businesses are also interested in finding ways to leverage "popular figures" as brand ambassadors on live streaming campaigns. In the e-retailing
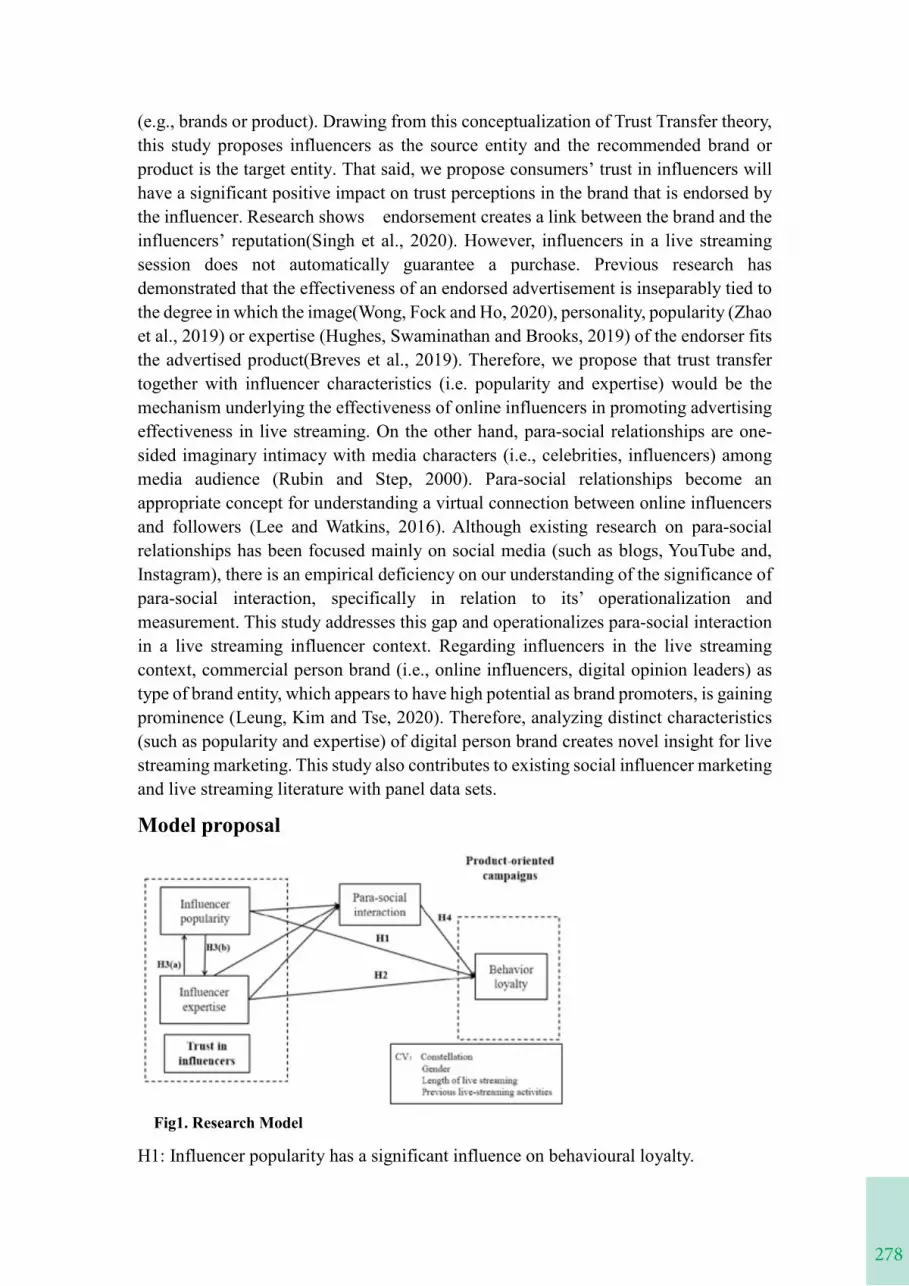
278
(e.g., brands or product). Drawing from this conceptualization of Trust Transfer theory, this study proposes influencers as the source entity and the recommended brand or product is the target entity. That said, we propose consumers’ trust in influencers will have a significant positive impact on trust perceptions in the brand that is endorsed by the influencer. Research shows endorsement creates a link between the brand and the influencers’ reputation(Singh et al., 2020). However, influencers in a live streaming session does not automatically guarantee a purchase. Previous research has demonstrated that the effectiveness of an endorsed advertisement is inseparably tied to the degree in which the image(Wong, Fock and Ho, 2020), personality, popularity (Zhao et al., 2019) or expertise (Hughes, Swaminathan and Brooks, 2019) of the endorser fits the advertised product(Breves et al., 2019). Therefore, we propose that trust transfer together with influencer characteristics (i.e. popularity and expertise) would be the mechanism underlying the effectiveness of online influencers in promoting advertising effectiveness in live streaming. On the other hand, para-social relationships are one-sided imaginary intimacy with media characters (i.e., celebrities, influencers) among media audience (Rubin and Step, 2000). Para-social relationships become an appropriate concept for understanding a virtual connection between online influencers and followers (Lee and Watkins, 2016). Although existing research on para-social relationships has been focused mainly on social media (such as blogs, YouTube and, Instagram), there is an empirical deficiency on our understanding of the significance of para-social interaction, specifically in relation to its’ operationalization and measurement. This study addresses this gap and operationalizes para-social interaction in a live streaming influencer context. Regarding influencers in the live streaming context, commercial person brand (i.e., online influencers, digital opinion leaders) as type of brand entity, which appears to have high potential as brand promoters, is gaining prominence (Leung, Kim and Tse, 2020). Therefore, analyzing distinct characteristics (such as popularity and expertise) of digital person brand creates novel insight for live streaming marketing. This study also contributes to existing social influencer marketing and live streaming literature with panel data sets.
Model proposal
Fig1. Research Model
H1: Influencer popularity has a significant influence on behavioural loyalty.
279
H2: Influencer expertise has a significant influence on behavioural loyalty..H3: There is significant positive link between influencer popularity and influencer expertise.H3(a): The higher influencer expertise, the greater influencer popularity.H3(b): The greater influencer popularity, the higher influencer expertise.H4: Para-social interaction has a significant positive influence on consumers behavior loyalty.H5: Para-social interaction is a significant mediator between the antecedents and behavioural loyalty.H5(a): Para-social interaction positively mediates the impact of influencer popularity on consumers behavioural loyalty.H5(b): Para-social interaction positively mediates the impact of influencer expertise on consumers behavioural loyalty.H5(c): Para-social interaction positively mediates the impact of influencer popularity and influencer expertise on consumers behavioural loyalty.
MethodologyResearch contextOur panel dataset for empirical validation for our hypotheses comes from Kwai (or Kuaishou in Chinese pinyin), the largest users and an earliest picture and video sharing social app in China which is similar to YouTube Live. Kwai has always been the one ofthe leading operators of live streaming campaigns, which enable sellers to launch live streaming activities or streamers perform talent living show (i.e. singing, dancing, or playing computer games). Consistent with our study object, we contract selling activities from live streaming campaigns. There are two reasons for our decision to choose Kwai to depict our story. First, Kwai is one of the earliest live streaming platforms enabling users to form stable belongings to the app. Second, live streaming influencers comes from all economic level cities in China. Panels are employed widely in market research to study consumer purchase patterns, test new products, and evaluate promotional campaigns(Lohse, G., Bellman, S., & Johnson, 2000).Panel data set contains observations on multiple phenomena observed over multiple time periods, which is two-dimensional: time series and cross-sectional(Hsiao, 2014). Longitudinal data allows a researcher to analyze a number of important economic questions that cannot be addressed using cross-sectional or time-series data sets (Hsiao, 2014). Panel data are repeated observations on the same cross section, typically of individuals or firms in microeconomics applications, observed for several time periods. The advantages of panel data are increased precision in estimation, the possibility of consistent estimation of the fixed effects model, which allows for unobserved individual heterogeneity that may be correlated with regressors and the possibility of learning more about the dynamics of individual behavior than is possible from a single cross section(Cameron, A. C., & Trivedi, 2005). There are three key types of panel data models. Pooled OLS model (Ordinary Least Square) model consider a
(e.g., brands or product). Drawing from this conceptualization of Trust Transfer theory, this study proposes influencers as the source entity and the recommended brand or product is the target entity. That said, we propose consumers’ trust in influencers will have a significant positive impact on trust perceptions in the brand that is endorsed by the influencer. Research shows endorsement creates a link between the brand and the influencers’ reputation(Singh et al., 2020). However, influencers in a live streaming session does not automatically guarantee a purchase. Previous research has demonstrated that the effectiveness of an endorsed advertisement is inseparably tied to the degree in which the image(Wong, Fock and Ho, 2020), personality, popularity (Zhao et al., 2019) or expertise (Hughes, Swaminathan and Brooks, 2019) of the endorser fits the advertised product(Breves et al., 2019). Therefore, we propose that trust transfer together with influencer characteristics (i.e. popularity and expertise) would be the mechanism underlying the effectiveness of online influencers in promoting advertising effectiveness in live streaming. On the other hand, para-social relationships are one-sided imaginary intimacy with media characters (i.e., celebrities, influencers) among media audience (Rubin and Step, 2000). Para-social relationships become an appropriate concept for understanding a virtual connection between online influencers and followers (Lee and Watkins, 2016). Although existing research on para-social relationships has been focused mainly on social media (such as blogs, YouTube and, Instagram), there is an empirical deficiency on our understanding of the significance of para-social interaction, specifically in relation to its’ operationalization and measurement. This study addresses this gap and operationalizes para-social interaction in a live streaming influencer context. Regarding influencers in the live streaming context, commercial person brand (i.e., online influencers, digital opinion leaders) as type of brand entity, which appears to have high potential as brand promoters, is gaining prominence (Leung, Kim and Tse, 2020). Therefore, analyzing distinct characteristics (such as popularity and expertise) of digital person brand creates novel insight for live streaming marketing. This study also contributes to existing social influencer marketing and live streaming literature with panel data sets.
Model proposal
Fig1. Research Model
H1: Influencer popularity has a significant influence on behavioural loyalty.
280
dataset as cross-sectional data and omits that the data has time and individual dimension. Fixed effects models explore data further by taking into consideration the differences between individual entities. A random effects model takes into account these individual variations as well as time dependent variations. The model eliminates biases from variables that are unobserved and change over time (Hsiao, 2014).Data CollectionThe data consist of 21,517 product-oriented campaigns by 729 online influencers, collected ranging from 1st October to 2019 to 31st January 2020, lasting 16 weeks. Consistent with Kwai published product in a range of 14 categories, we detailed them into 31 groups to explore, which influencers are more likely to endorse a product (Lin, 2014). We tracked the product and influencers pages of the live streaming campaigns endorsed product, obtaining sales data, number of fans/likes/viewers/interactions ,online influencers expertise area, and product categories recommended byonline influencers during live streaming and average broadcasting time length on the unit of each daily live streaming product-oriented activity by one influencer. Consequently, our dataset mainly consists of three parts: (1) product attribute (i.e., sales, categories) of each live streaming, (2) users interaction information (i.e., likes, views and interactions), (3) influencer information (i.e., followers, gender, constellation and number of previous live streaming activities).Empirical modelAs our dataset includes daily live streaming activities, we operationalized variables at the daily activity level. Specifically, let subscript i denote each individual live streaming, and subscript t denote each time period (daily). The dependent variable is product i’sdaily sales quantity, Sales it, measured as the total number of product i sold in day t. Next, our independent variables include the number of followers, the number of likes, the number of interactions, the number of viewers and the extent of expertise.Regarding the measurement of expertise, it is a displayed behavior within a specialized domain and/or related domain in the form of consistently demonstrated actions of an individual that are both optimally efficient in their execution and effective in their results (McGuire, 2011,p241). Thus, expertise can be considered as the consistency connecting individual expertise area and actual behavior. In our study, online influencers recommend different areas of products in live streaming activities, while almost influencers have his/her expertised product areas in the dataset. Based on McGuire (2011) to operationalize expertise, we match recommended product areas (actual behavior) and expertised product areas (expertise area). Specifically, for each live streaming campaign by influencers, we calculate the number of expertised product areas in recommended areas and divide the number of expertised product areas in recommended areas by the number of recommended areas.
(1) Expertise it=Nexpertised/recomit
𝑁𝑁𝑁𝑁𝑁𝑁𝑁𝑁𝑁𝑁𝑁𝑁𝑁𝑁𝑁𝑁𝑁𝑁𝑁𝑁𝑁𝑁𝑁𝑁itWe use this Expertise formation (1) to measure expertise, in which Nexpertised/recommit stands for the number of expertised product areas in recommended areas, and Nrecommit means the number of recommended areas (product i sold in day t) ranging from 0 to 1.Since expertised product areas by some influencers
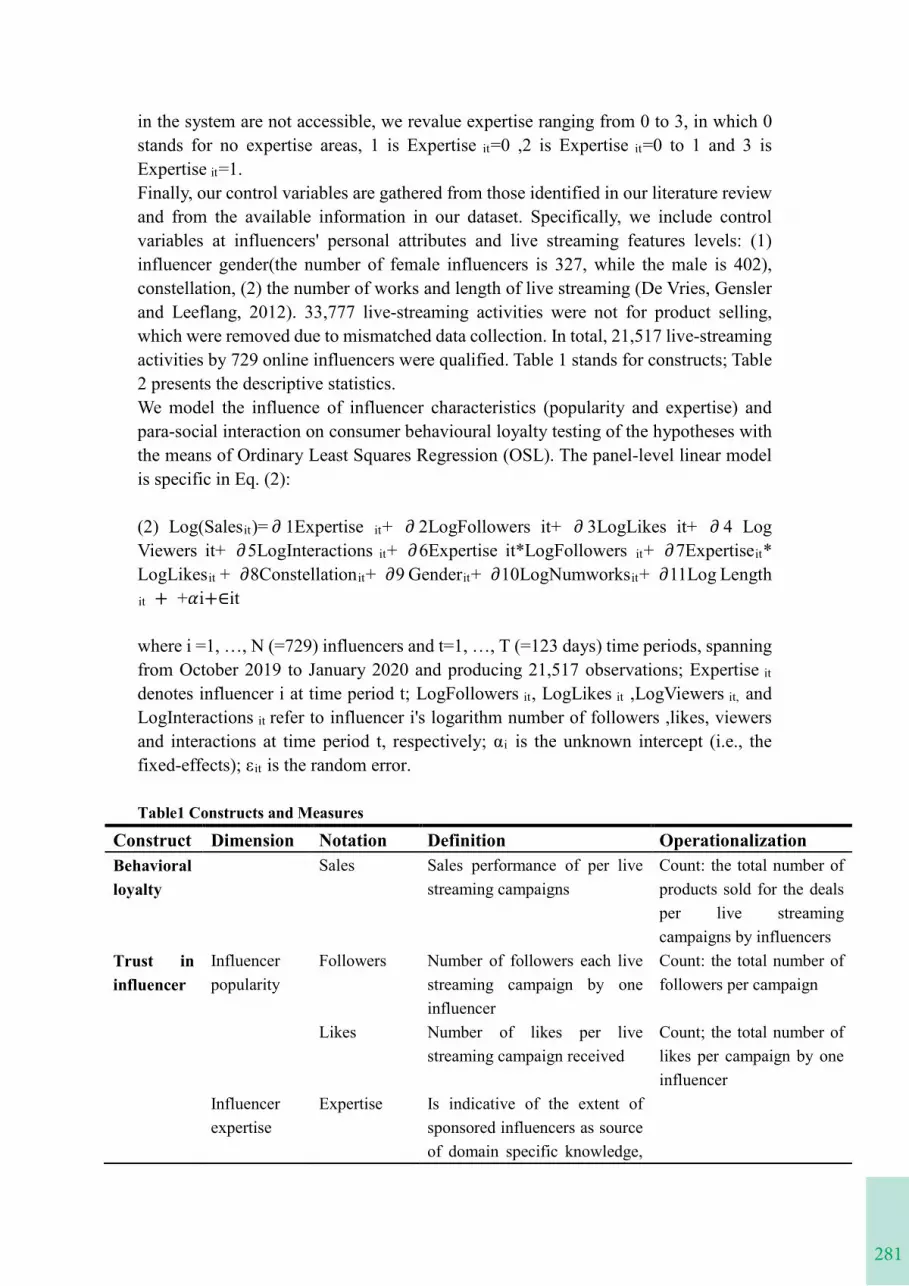
281
in the system are not accessible, we revalue expertise ranging from 0 to 3, in which 0 stands for no expertise areas, 1 is Expertise it=0 ,2 is Expertise it=0 to 1 and 3 is Expertise it=1.Finally, our control variables are gathered from those identified in our literature review and from the available information in our dataset. Specifically, we include control variables at influencers' personal attributes and live streaming features levels: (1) influencer gender(the number of female influencers is 327, while the male is 402), constellation, (2) the number of works and length of live streaming (De Vries, Gensler and Leeflang, 2012). 33,777 live-streaming activities were not for product selling, which were removed due to mismatched data collection. In total, 21,517 live-streaming activities by 729 online influencers were qualified. Table 1 stands for constructs; Table 2 presents the descriptive statistics. We model the influence of influencer characteristics (popularity and expertise) and para-social interaction on consumer behavioural loyalty testing of the hypotheses with the means of Ordinary Least Squares Regression (OSL). The panel-level linear model is specific in Eq. (2):
(2) Log(Salesit)= 𝜕𝜕𝜕𝜕 1Expertise it+ 𝜕𝜕𝜕𝜕 2LogFollowers it+ 𝜕𝜕𝜕𝜕 3LogLikes it+ 𝜕𝜕𝜕𝜕 4 LogViewers it+ 𝜕𝜕𝜕𝜕 5LogInteractions it+ 𝜕𝜕𝜕𝜕 6Expertise it*LogFollowers it+ 𝜕𝜕𝜕𝜕 7Expertiseit*LogLikesit + 𝜕𝜕𝜕𝜕8Constellationit+ 𝜕𝜕𝜕𝜕9 Genderit+ 𝜕𝜕𝜕𝜕10LogNumworksit+ 𝜕𝜕𝜕𝜕11Log Length it + +𝛼𝛼𝛼𝛼i+∈it
where i =1, …, N (=729) influencers and t=1, …, T (=123 days) time periods, spanning from October 2019 to January 2020 and producing 21,517 observations; Expertise it
denotes influencer i at time period t; LogFollowers it, LogLikes it ,LogViewers it, and LogInteractions it refer to influencer i's logarithm number of followers ,likes, viewers and interactions at time period t, respectively; αi is the unknown intercept (i.e., the fixed-effects); εit is the random error.
Table1 Constructs and Measures
Construct Dimension Notation Definition OperationalizationBehavioralloyalty
Sales Sales performance of per live streaming campaigns
Count: the total number of products sold for the deals per live streaming campaigns by influencers
Trust in influencer
Influencer popularity
Influencer expertise
Followers
Likes
Expertise
Number of followers each live streaming campaign by one influencerNumber of likes per live streaming campaign received
Is indicative of the extent of sponsored influencers as source of domain specific knowledge,
Count: the total number of followers per campaign
Count; the total number of likes per campaign by one influencer
dataset as cross-sectional data and omits that the data has time and individual dimension. Fixed effects models explore data further by taking into consideration the differences between individual entities. A random effects model takes into account these individual variations as well as time dependent variations. The model eliminates biases from variables that are unobserved and change over time (Hsiao, 2014).Data CollectionThe data consist of 21,517 product-oriented campaigns by 729 online influencers, collected ranging from 1st October to 2019 to 31st January 2020, lasting 16 weeks. Consistent with Kwai published product in a range of 14 categories, we detailed them into 31 groups to explore, which influencers are more likely to endorse a product (Lin, 2014). We tracked the product and influencers pages of the live streaming campaigns endorsed product, obtaining sales data, number of fans/likes/viewers/interactions ,online influencers expertise area, and product categories recommended byonline influencers during live streaming and average broadcasting time length on the unit of each daily live streaming product-oriented activity by one influencer. Consequently, our dataset mainly consists of three parts: (1) product attribute (i.e., sales, categories) of each live streaming, (2) users interaction information (i.e., likes, views and interactions), (3) influencer information (i.e., followers, gender, constellation and number of previous live streaming activities).Empirical modelAs our dataset includes daily live streaming activities, we operationalized variables at the daily activity level. Specifically, let subscript i denote each individual live streaming, and subscript t denote each time period (daily). The dependent variable is product i’sdaily sales quantity, Sales it, measured as the total number of product i sold in day t. Next, our independent variables include the number of followers, the number of likes, the number of interactions, the number of viewers and the extent of expertise.Regarding the measurement of expertise, it is a displayed behavior within a specialized domain and/or related domain in the form of consistently demonstrated actions of an individual that are both optimally efficient in their execution and effective in their results (McGuire, 2011,p241). Thus, expertise can be considered as the consistency connecting individual expertise area and actual behavior. In our study, online influencers recommend different areas of products in live streaming activities, while almost influencers have his/her expertised product areas in the dataset. Based on McGuire (2011) to operationalize expertise, we match recommended product areas (actual behavior) and expertised product areas (expertise area). Specifically, for each live streaming campaign by influencers, we calculate the number of expertised product areas in recommended areas and divide the number of expertised product areas in recommended areas by the number of recommended areas.
(1) Expertise it=Nexpertised/recomit
𝑁𝑁𝑁𝑁𝑁𝑁𝑁𝑁𝑁𝑁𝑁𝑁𝑁𝑁𝑁𝑁𝑁𝑁𝑁𝑁𝑁𝑁𝑁𝑁itWe use this Expertise formation (1) to measure expertise, in which Nexpertised/recommit stands for the number of expertised product areas in recommended areas, and Nrecommit means the number of recommended areas (product i sold in day t) ranging from 0 to 1.Since expertised product areas by some influencers
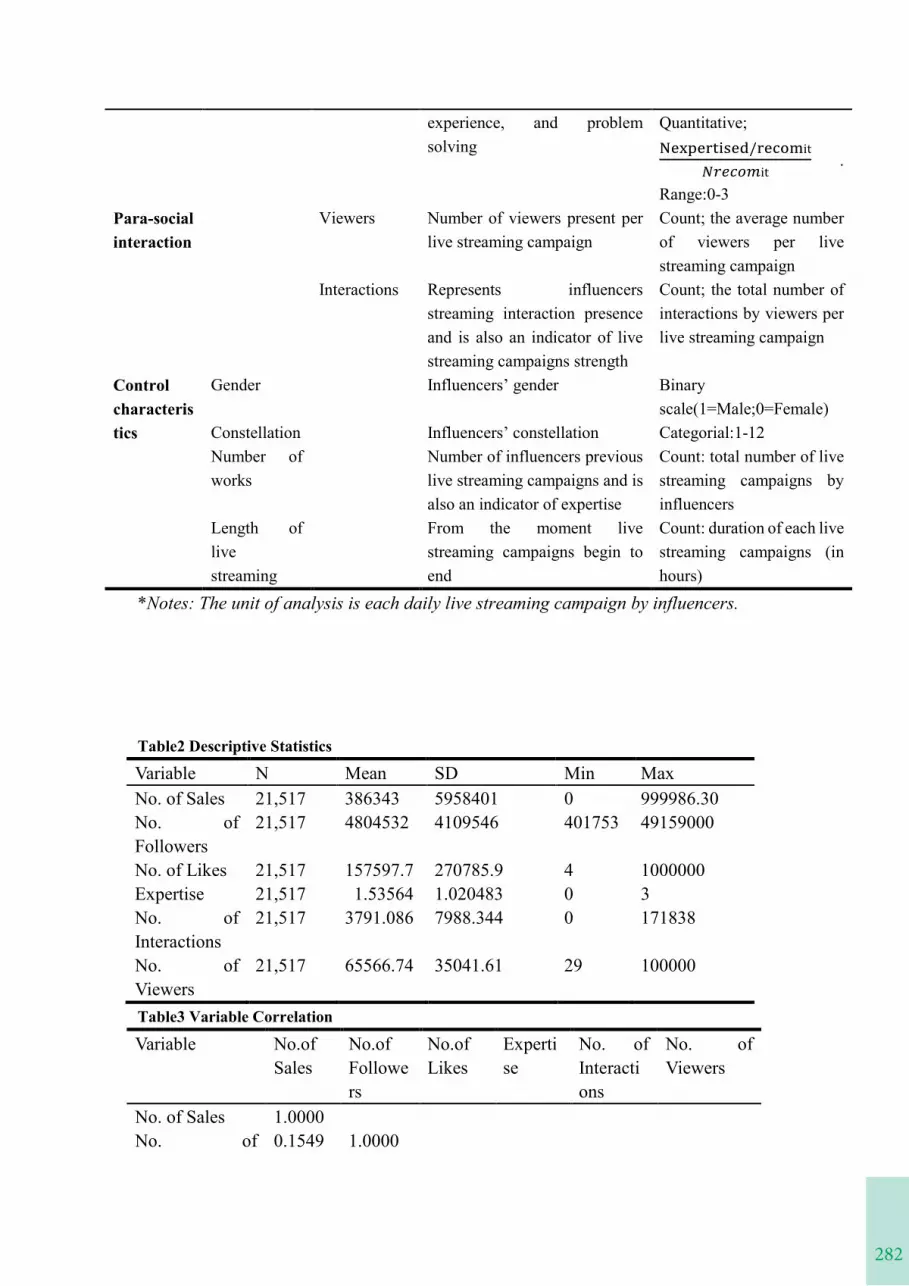
282
experience, and problem solving
Quantitative;Nexpertised/recomit
𝑁𝑁𝑁𝑁𝑁𝑁𝑁𝑁𝑁𝑁𝑁𝑁𝑁𝑁𝑁𝑁𝑁𝑁𝑁𝑁𝑁𝑁𝑁𝑁it.
Range:0-3Para-social interaction
Viewers Number of viewers present per live streaming campaign
Count; the average number of viewers per live streaming campaign
Interactions Represents influencers streaming interaction presence and is also an indicator of live streaming campaigns strength
Count; the total number of interactions by viewers per live streaming campaign
Control characteristics
Gender Influencers’ gender
Influencers’ constellationNumber of influencers previous live streaming campaigns and is also an indicator of expertiseFrom the moment live streaming campaigns begin to end
Binary scale(1=Male;0=Female)
Constellation Categorial:1-12Number of works
Count: total number of live streaming campaigns by influencers
Length of live streaming
Count: duration of each live streaming campaigns (in hours)
*Notes: The unit of analysis is each daily live streaming campaign by influencers.
Table2 Descriptive Statistics
Table3 Variable Correlation
Variable No.of Sales
No.of Followers
No.of Likes
Expertise
No. of Interactions
No. of Viewers
No. of Sales 1.0000No. of 0.1549 1.0000
Variable N Mean SD Min MaxNo. of Sales 21,517 386343 5958401 0 999986.30No. of Followers
21,517 4804532 4109546 401753 49159000
No. of Likes 21,517 157597.7 270785.9 4 1000000Expertise 21,517 1.53564 1.020483 0 3No. of Interactions
21,517 3791.086 7988.344 0 171838
No. of Viewers
21,517 65566.74 35041.61 29 100000
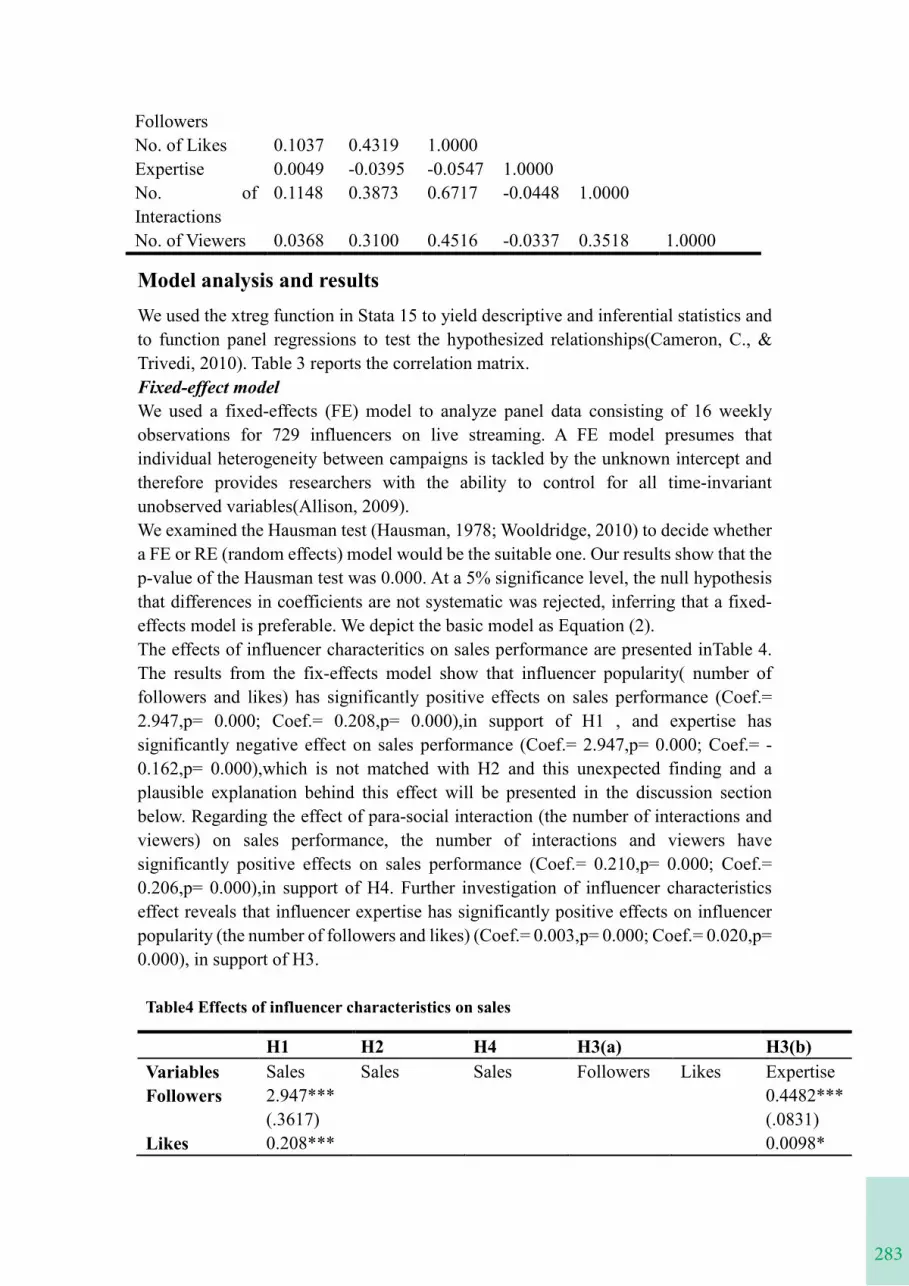
283
FollowersNo. of Likes 0.1037 0.4319 1.0000Expertise 0.0049 -0.0395 -0.0547 1.0000No. of Interactions
0.1148 0.3873 0.6717 -0.0448 1.0000
No. of Viewers 0.0368 0.3100 0.4516 -0.0337 0.3518 1.0000
Model analysis and resultsWe used the xtreg function in Stata 15 to yield descriptive and inferential statistics and to function panel regressions to test the hypothesized relationships(Cameron, C., & Trivedi, 2010). Table 3 reports the correlation matrix.Fixed-effect modelWe used a fixed-effects (FE) model to analyze panel data consisting of 16 weekly observations for 729 influencers on live streaming. A FE model presumes that individual heterogeneity between campaigns is tackled by the unknown intercept and therefore provides researchers with the ability to control for all time-invariant unobserved variables(Allison, 2009).We examined the Hausman test (Hausman, 1978; Wooldridge, 2010) to decide whether a FE or RE (random effects) model would be the suitable one. Our results show that the p-value of the Hausman test was 0.000. At a 5% significance level, the null hypothesis that differences in coefficients are not systematic was rejected, inferring that a fixed-effects model is preferable. We depict the basic model as Equation (2).The effects of influencer characteritics on sales performance are presented inTable 4. The results from the fix-effects model show that influencer popularity( number of followers and likes) has significantly positive effects on sales performance (Coef.= 2.947,p= 0.000; Coef.= 0.208,p= 0.000),in support of H1 , and expertise has significantly negative effect on sales performance (Coef.= 2.947,p= 0.000; Coef.= -0.162,p= 0.000),which is not matched with H2 and this unexpected finding and a plausible explanation behind this effect will be presented in the discussion section below. Regarding the effect of para-social interaction (the number of interactions and viewers) on sales performance, the number of interactions and viewers have significantly positive effects on sales performance (Coef.= 0.210,p= 0.000; Coef.= 0.206,p= 0.000),in support of H4. Further investigation of influencer characteristics effect reveals that influencer expertise has significantly positive effects on influencer popularity (the number of followers and likes) (Coef.= 0.003,p= 0.000; Coef.= 0.020,p= 0.000), in support of H3.
Table4 Effects of influencer characteristics on sales
H1 H2 H4 H3(a) H3(b)Variables Sales Sales Sales Followers Likes ExpertiseFollowers 2.947***
(.3617)0.4482***(.0831)
Likes 0.208*** 0.0098*
experience, and problem solving
Quantitative;Nexpertised/recomit
𝑁𝑁𝑁𝑁𝑁𝑁𝑁𝑁𝑁𝑁𝑁𝑁𝑁𝑁𝑁𝑁𝑁𝑁𝑁𝑁𝑁𝑁𝑁𝑁it.
Range:0-3Para-social interaction
Viewers Number of viewers present per live streaming campaign
Count; the average number of viewers per live streaming campaign
Interactions Represents influencers streaming interaction presence and is also an indicator of live streaming campaigns strength
Count; the total number of interactions by viewers per live streaming campaign
Control characteristics
Gender Influencers’ gender
Influencers’ constellationNumber of influencers previous live streaming campaigns and is also an indicator of expertiseFrom the moment live streaming campaigns begin to end
Binary scale(1=Male;0=Female)
Constellation Categorial:1-12Number of works
Count: total number of live streaming campaigns by influencers
Length of live streaming
Count: duration of each live streaming campaigns (in hours)
*Notes: The unit of analysis is each daily live streaming campaign by influencers.
Table2 Descriptive Statistics
Table3 Variable Correlation
Variable No.of Sales
No.of Followers
No.of Likes
Expertise
No. of Interactions
No. of Viewers
No. of Sales 1.0000No. of 0.1549 1.0000
Variable N Mean SD Min MaxNo. of Sales 21,517 386343 5958401 0 999986.30No. of Followers
21,517 4804532 4109546 401753 49159000
No. of Likes 21,517 157597.7 270785.9 4 1000000Expertise 21,517 1.53564 1.020483 0 3No. of Interactions
21,517 3791.086 7988.344 0 171838
No. of Viewers
21,517 65566.74 35041.61 29 100000
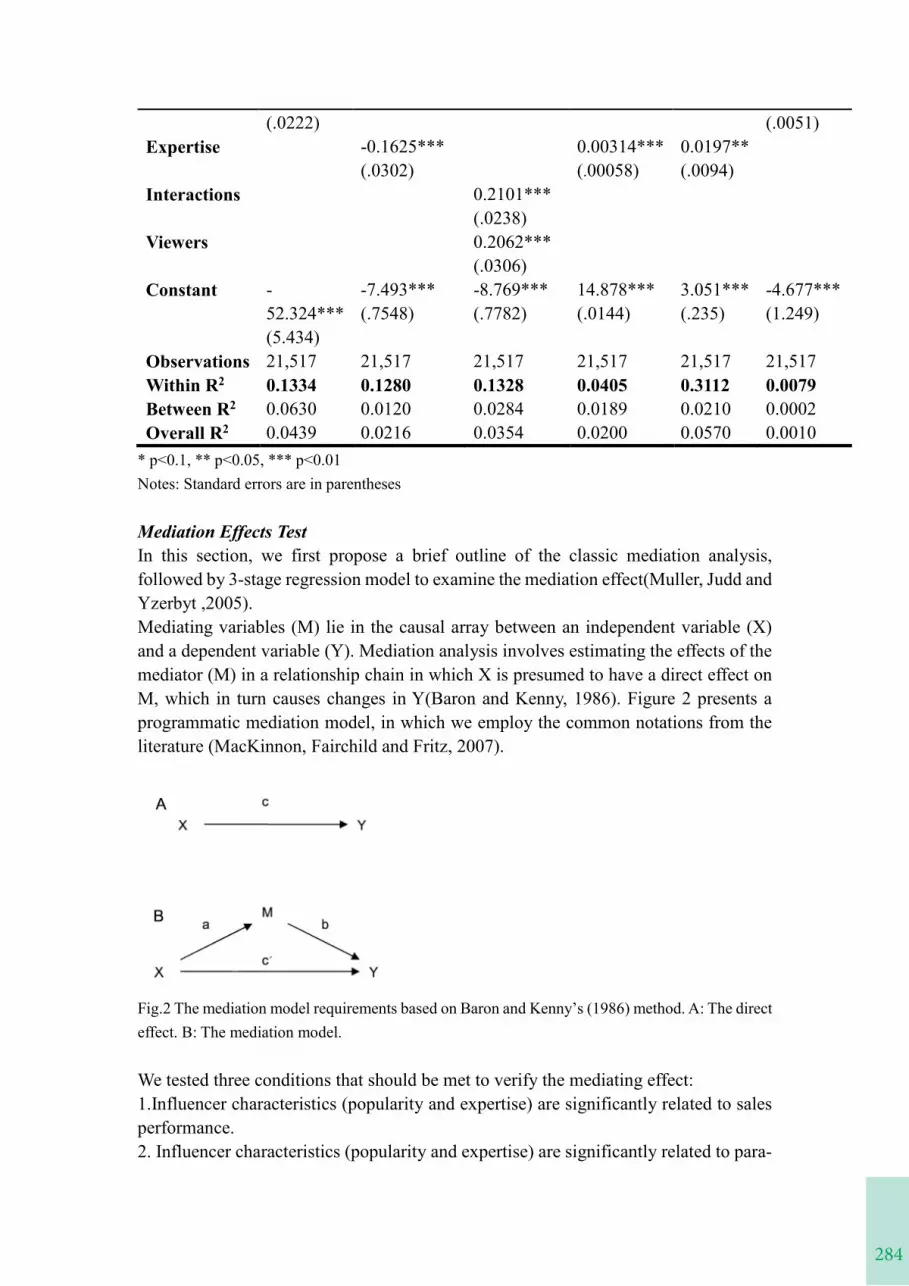
284
* p<0.1, ** p<0.05, *** p<0.01 Notes: Standard errors are in parentheses
Mediation Effects TestIn this section, we first propose a brief outline of the classic mediation analysis, followed by 3-stage regression model to examine the mediation effect(Muller, Judd and Yzerbyt ,2005).Mediating variables (M) lie in the causal array between an independent variable (X) and a dependent variable (Y). Mediation analysis involves estimating the effects of themediator (M) in a relationship chain in which X is presumed to have a direct effect on M, which in turn causes changes in Y(Baron and Kenny, 1986). Figure 2 presents a programmatic mediation model, in which we employ the common notations from the literature (MacKinnon, Fairchild and Fritz, 2007).
Fig.2 The mediation model requirements based on Baron and Kenny’s (1986) method. A: The direct effect. B: The mediation model.
We tested three conditions that should be met to verify the mediating effect:1.Influencer characteristics (popularity and expertise) are significantly related to sales performance.2. Influencer characteristics (popularity and expertise) are significantly related to para-
(.0222) (.0051) Expertise -0.1625***
(.0302)0.00314***(.00058)
0.0197**(.0094)
Interactions 0.2101***(.0238)
Viewers 0.2062***(.0306)
Constant -52.324***(5.434)
-7.493***(.7548)
-8.769***(.7782)
14.878***(.0144)
3.051***(.235)
-4.677***(1.249)
Observations 21,517 21,517 21,517 21,517 21,517 21,517Within R2 0.1334 0.1280 0.1328 0.0405 0.3112 0.0079Between R2 0.0630 0.0120 0.0284 0.0189 0.0210 0.0002Overall R2 0.0439 0.0216 0.0354 0.0200 0.0570 0.0010
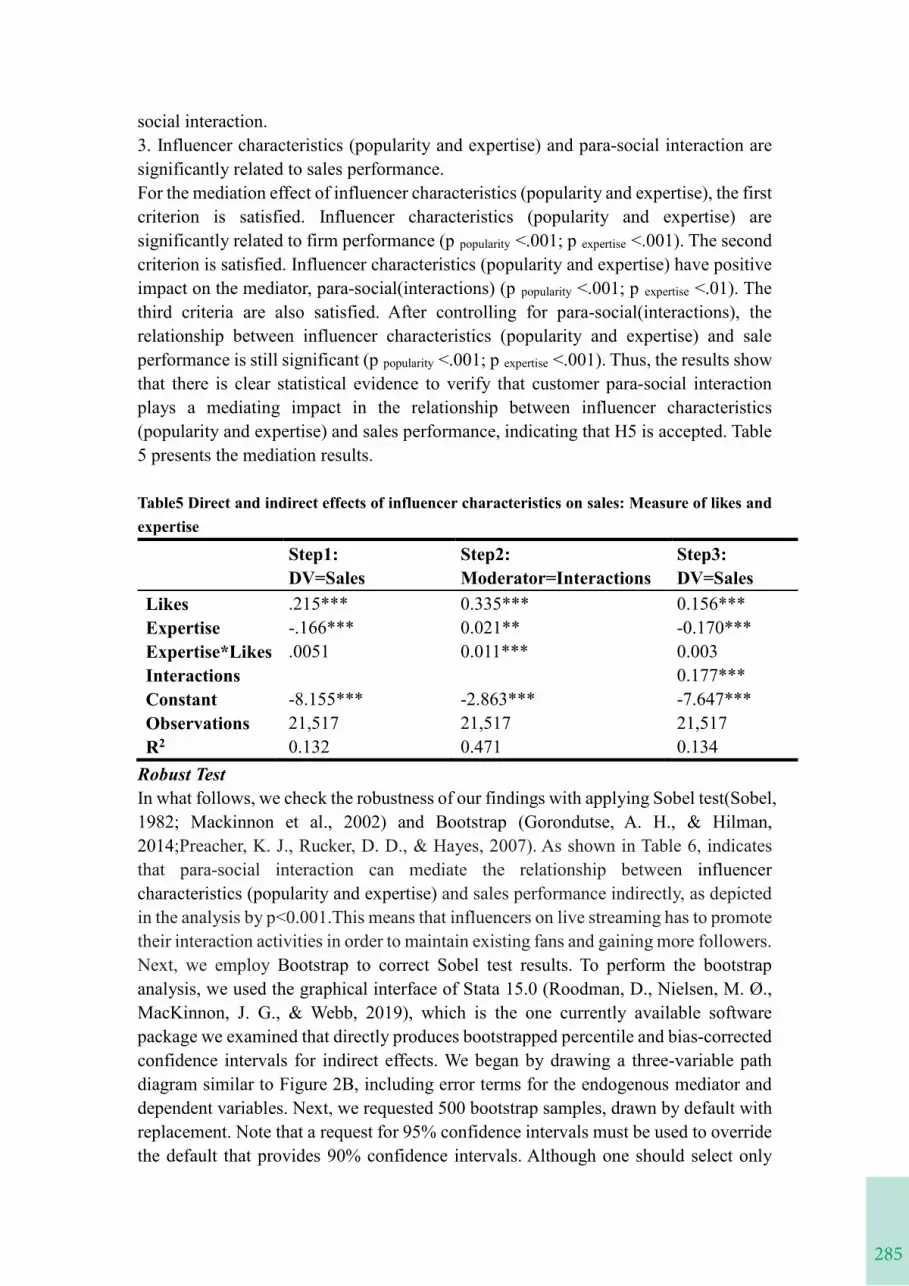
285
social interaction.3. Influencer characteristics (popularity and expertise) and para-social interaction are significantly related to sales performance.For the mediation effect of influencer characteristics (popularity and expertise), the first criterion is satisfied. Influencer characteristics (popularity and expertise) are significantly related to firm performance (p popularity <.001; p expertise <.001). The second criterion is satisfied. Influencer characteristics (popularity and expertise) have positive impact on the mediator, para-social(interactions) (p popularity <.001; p expertise <.01). The third criteria are also satisfied. After controlling for para-social(interactions), the relationship between influencer characteristics (popularity and expertise) and sale performance is still significant (p popularity <.001; p expertise <.001). Thus, the results show that there is clear statistical evidence to verify that customer para-social interaction plays a mediating impact in the relationship between influencer characteristics (popularity and expertise) and sales performance, indicating that H5 is accepted. Table 5 presents the mediation results.
Table5 Direct and indirect effects of influencer characteristics on sales: Measure of likes and expertise
Step1: DV=Sales
Step2: Moderator=Interactions
Step3: DV=Sales
Likes .215*** 0.335*** 0.156***Expertise -.166*** 0.021** -0.170***Expertise*Likes .0051 0.011*** 0.003Interactions 0.177***Constant -8.155*** -2.863*** -7.647***Observations 21,517 21,517 21,517R2 0.132 0.471 0.134
Robust TestIn what follows, we check the robustness of our findings with applying Sobel test(Sobel, 1982; Mackinnon et al., 2002) and Bootstrap (Gorondutse, A. H., & Hilman, 2014;Preacher, K. J., Rucker, D. D., & Hayes, 2007). As shown in Table 6, indicates that para-social interaction can mediate the relationship between influencer characteristics (popularity and expertise) and sales performance indirectly, as depicted in the analysis by p<0.001.This means that influencers on live streaming has to promote their interaction activities in order to maintain existing fans and gaining more followers.Next, we employ Bootstrap to correct Sobel test results. To perform the bootstrap analysis, we used the graphical interface of Stata 15.0 (Roodman, D., Nielsen, M. Ø., MacKinnon, J. G., & Webb, 2019), which is the one currently available software package we examined that directly produces bootstrapped percentile and bias-corrected confidence intervals for indirect effects. We began by drawing a three-variable path diagram similar to Figure 2B, including error terms for the endogenous mediator and dependent variables. Next, we requested 500 bootstrap samples, drawn by default with replacement. Note that a request for 95% confidence intervals must be used to override the default that provides 90% confidence intervals. Although one should select only
* p<0.1, ** p<0.05, *** p<0.01 Notes: Standard errors are in parentheses
Mediation Effects TestIn this section, we first propose a brief outline of the classic mediation analysis, followed by 3-stage regression model to examine the mediation effect(Muller, Judd and Yzerbyt ,2005).Mediating variables (M) lie in the causal array between an independent variable (X) and a dependent variable (Y). Mediation analysis involves estimating the effects of themediator (M) in a relationship chain in which X is presumed to have a direct effect on M, which in turn causes changes in Y(Baron and Kenny, 1986). Figure 2 presents a programmatic mediation model, in which we employ the common notations from the literature (MacKinnon, Fairchild and Fritz, 2007).
Fig.2 The mediation model requirements based on Baron and Kenny’s (1986) method. A: The direct effect. B: The mediation model.
We tested three conditions that should be met to verify the mediating effect:1.Influencer characteristics (popularity and expertise) are significantly related to sales performance.2. Influencer characteristics (popularity and expertise) are significantly related to para-
(.0222) (.0051) Expertise -0.1625***
(.0302)0.00314***(.00058)
0.0197**(.0094)
Interactions 0.2101***(.0238)
Viewers 0.2062***(.0306)
Constant -52.324***(5.434)
-7.493***(.7548)
-8.769***(.7782)
14.878***(.0144)
3.051***(.235)
-4.677***(1.249)
Observations 21,517 21,517 21,517 21,517 21,517 21,517Within R2 0.1334 0.1280 0.1328 0.0405 0.3112 0.0079Between R2 0.0630 0.0120 0.0284 0.0189 0.0210 0.0002Overall R2 0.0439 0.0216 0.0354 0.0200 0.0570 0.0010
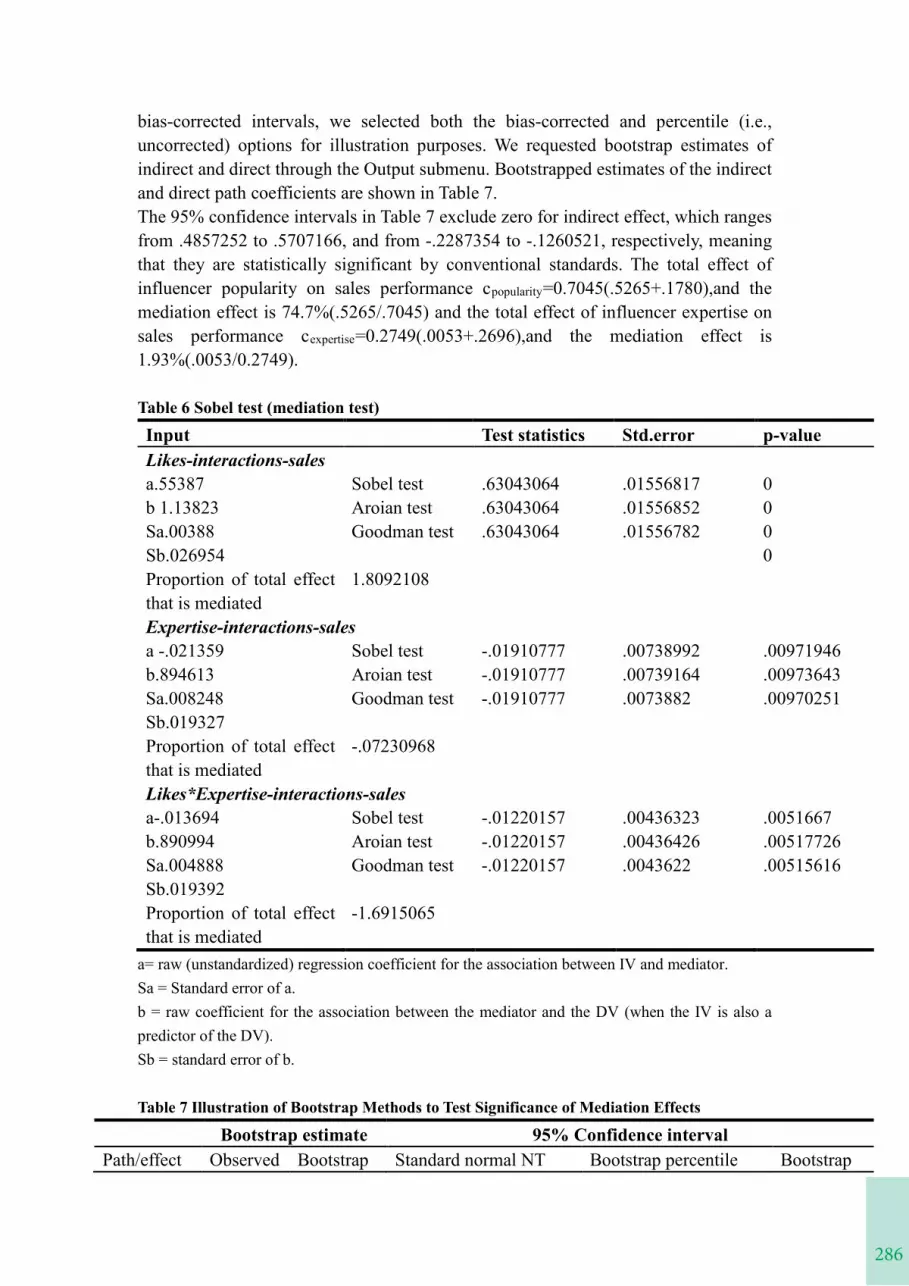
286
bias-corrected intervals, we selected both the bias-corrected and percentile (i.e., uncorrected) options for illustration purposes. We requested bootstrap estimates of indirect and direct through the Output submenu. Bootstrapped estimates of the indirect and direct path coefficients are shown in Table 7. The 95% confidence intervals in Table 7 exclude zero for indirect effect, which ranges from .4857252 to .5707166, and from -.2287354 to -.1260521, respectively, meaning that they are statistically significant by conventional standards. The total effect of influencer popularity on sales performance cpopularity=0.7045(.5265+.1780),and the mediation effect is 74.7%(.5265/.7045) and the total effect of influencer expertise on sales performance cexpertise=0.2749(.0053+.2696),and the mediation effect is 1.93%(.0053/0.2749).
Table 6 Sobel test (mediation test)Input Test statistics Std.error p-valueLikes-interactions-salesa.55387 Sobel test .63043064 .01556817 0b 1.13823 Aroian test .63043064 .01556852 0Sa.00388 Goodman test .63043064 .01556782 0Sb.026954 0Proportion of total effect that is mediated
1.8092108
Expertise-interactions-salesa -.021359 Sobel test -.01910777 .00738992 .00971946b.894613 Aroian test -.01910777 .00739164 .00973643Sa.008248 Goodman test -.01910777 .0073882 .00970251Sb.019327Proportion of total effect that is mediated
-.07230968
Likes*Expertise-interactions-salesa-.013694 Sobel test -.01220157 .00436323 .0051667b.890994 Aroian test -.01220157 .00436426 .00517726Sa.004888 Goodman test -.01220157 .0043622 .00515616Sb.019392Proportion of total effect that is mediated
-1.6915065
a= raw (unstandardized) regression coefficient for the association between IV and mediator.Sa = Standard error of a.b = raw coefficient for the association between the mediator and the DV (when the IV is also a predictor of the DV).Sb = standard error of b.
Table 7 Illustration of Bootstrap Methods to Test Significance of Mediation Effects
Bootstrap estimate 95% Confidence intervalPath/effect Observed Bootstrap Standard normal NT Bootstrap percentile Bootstrap
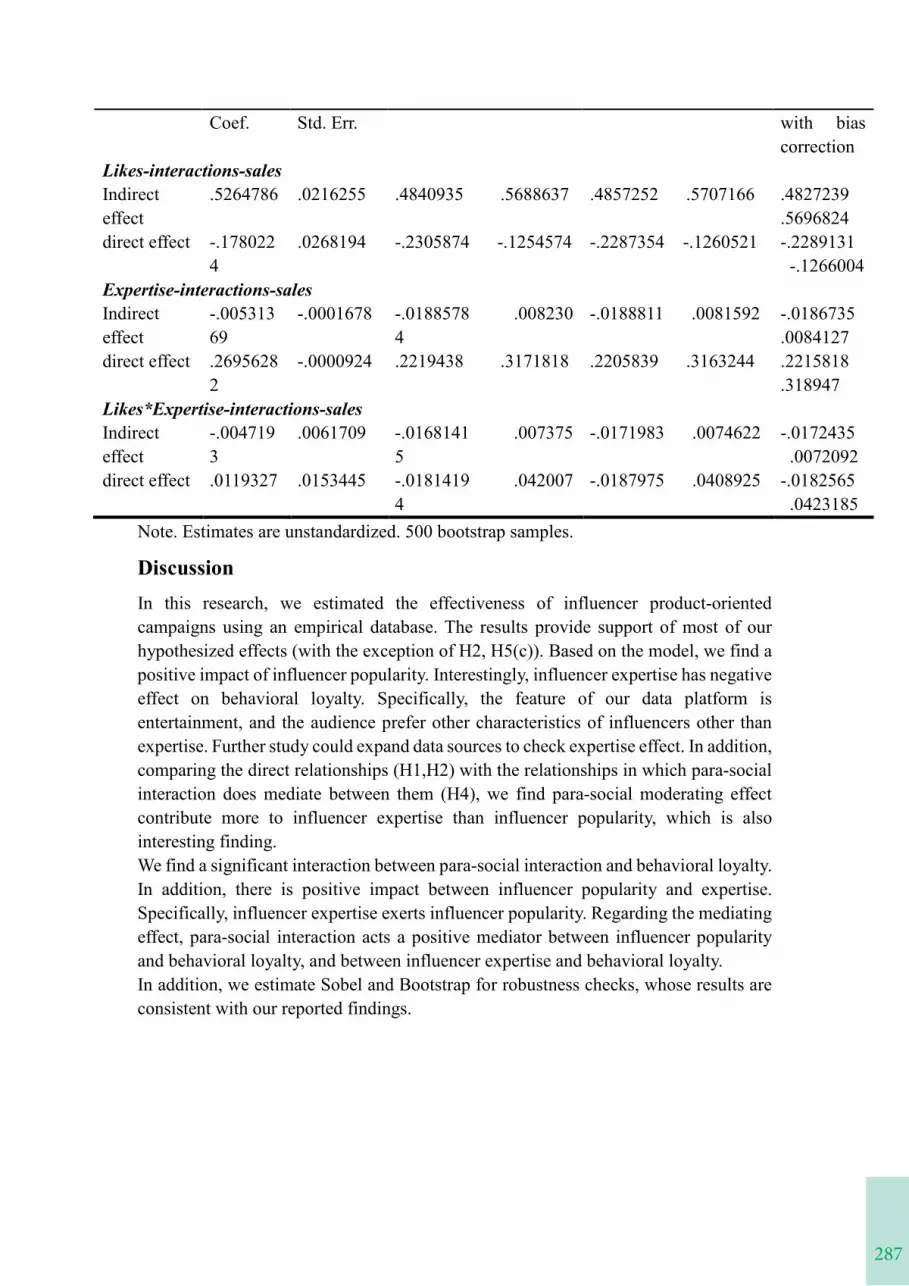
287
Coef. Std. Err. with bias correction
Likes-interactions-salesIndirect effect
.5264786 .0216255 .4840935 .5688637 .4857252 .5707166 .4827239.5696824
direct effect -.1780224
.0268194 -.2305874 -.1254574 -.2287354 -.1260521 -.2289131-.1266004
Expertise-interactions-salesIndirect effect
-.00531369
-.0001678 -.0188578 .0082304
-.0188811 .0081592 -.0186735.0084127
direct effect .26956282
-.0000924 .2219438 .3171818 .2205839 .3163244 .2215818.318947
Likes*Expertise-interactions-salesIndirect effect
-.0047193
.0061709 -.0168141 .0073755
-.0171983 .0074622 -.0172435.0072092
direct effect .0119327 .0153445 -.0181419 .0420074
-.0187975 .0408925 -.0182565.0423185
Note. Estimates are unstandardized. 500 bootstrap samples.
Discussion In this research, we estimated the effectiveness of influencer product-oriented campaigns using an empirical database. The results provide support of most of our hypothesized effects (with the exception of H2, H5(c)). Based on the model, we find a positive impact of influencer popularity. Interestingly, influencer expertise has negative effect on behavioral loyalty. Specifically, the feature of our data platform is entertainment, and the audience prefer other characteristics of influencers other than expertise. Further study could expand data sources to check expertise effect. In addition,comparing the direct relationships (H1,H2) with the relationships in which para-social interaction does mediate between them (H4), we find para-social moderating effect contribute more to influencer expertise than influencer popularity, which is also interesting finding.We find a significant interaction between para-social interaction and behavioral loyalty. In addition, there is positive impact between influencer popularity and expertise. Specifically, influencer expertise exerts influencer popularity. Regarding the mediating effect, para-social interaction acts a positive mediator between influencer popularity and behavioral loyalty, and between influencer expertise and behavioral loyalty.In addition, we estimate Sobel and Bootstrap for robustness checks, whose results are consistent with our reported findings.
bias-corrected intervals, we selected both the bias-corrected and percentile (i.e., uncorrected) options for illustration purposes. We requested bootstrap estimates of indirect and direct through the Output submenu. Bootstrapped estimates of the indirect and direct path coefficients are shown in Table 7. The 95% confidence intervals in Table 7 exclude zero for indirect effect, which ranges from .4857252 to .5707166, and from -.2287354 to -.1260521, respectively, meaning that they are statistically significant by conventional standards. The total effect of influencer popularity on sales performance cpopularity=0.7045(.5265+.1780),and the mediation effect is 74.7%(.5265/.7045) and the total effect of influencer expertise on sales performance cexpertise=0.2749(.0053+.2696),and the mediation effect is 1.93%(.0053/0.2749).
Table 6 Sobel test (mediation test)Input Test statistics Std.error p-valueLikes-interactions-salesa.55387 Sobel test .63043064 .01556817 0b 1.13823 Aroian test .63043064 .01556852 0Sa.00388 Goodman test .63043064 .01556782 0Sb.026954 0Proportion of total effect that is mediated
1.8092108
Expertise-interactions-salesa -.021359 Sobel test -.01910777 .00738992 .00971946b.894613 Aroian test -.01910777 .00739164 .00973643Sa.008248 Goodman test -.01910777 .0073882 .00970251Sb.019327Proportion of total effect that is mediated
-.07230968
Likes*Expertise-interactions-salesa-.013694 Sobel test -.01220157 .00436323 .0051667b.890994 Aroian test -.01220157 .00436426 .00517726Sa.004888 Goodman test -.01220157 .0043622 .00515616Sb.019392Proportion of total effect that is mediated
-1.6915065
a= raw (unstandardized) regression coefficient for the association between IV and mediator.Sa = Standard error of a.b = raw coefficient for the association between the mediator and the DV (when the IV is also a predictor of the DV).Sb = standard error of b.
Table 7 Illustration of Bootstrap Methods to Test Significance of Mediation Effects
Bootstrap estimate 95% Confidence intervalPath/effect Observed Bootstrap Standard normal NT Bootstrap percentile Bootstrap
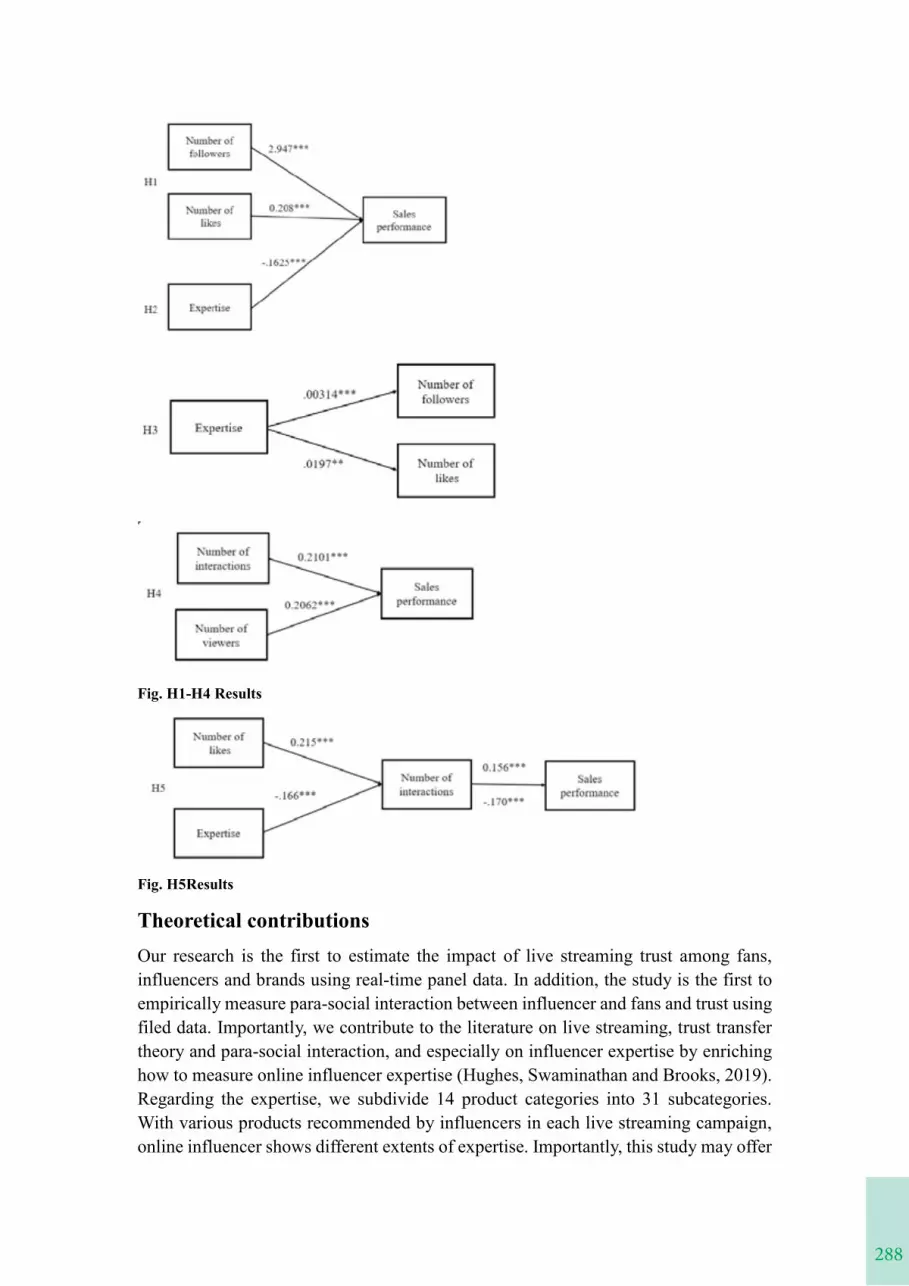
288
Fig. H1-H4 Results
Fig. H5Results
Theoretical contributions Our research is the first to estimate the impact of live streaming trust among fans, influencers and brands using real-time panel data. In addition, the study is the first to empirically measure para-social interaction between influencer and fans and trust using filed data. Importantly, we contribute to the literature on live streaming, trust transfer theory and para-social interaction, and especially on influencer expertise by enriching how to measure online influencer expertise (Hughes, Swaminathan and Brooks, 2019).Regarding the expertise, we subdivide 14 product categories into 31 subcategories. With various products recommended by influencers in each live streaming campaign, online influencer shows different extents of expertise. Importantly, this study may offer
289
novel insight into measuring influencer expertise, popularity and para-social interaction using real-time data.
Practical implicationsWe offer novel insights to managers and online influencers implementing live streaming campaigns. First, this article delineates best practices for online influencers based on the live streaming platform. Trust from fans to influencers has positive impact on consumer behavior loyalty. Filled with risks and privacy in the virtual world, online influencers should focus on how to develop fans' trust (i.e., promote influencers popularity). Interestingly, when trying to bolster live streaming trial campaigns, online influencers expertise has a negative influence on behavior loyalty, which means balance the expertise area and consumers flavor. When selecting influencers to endorse, mangers should consider the extent of influencers match and fans favor. Second, when implementing campaigns on live streaming, online influencers should develop para-social relationship with fans which makes fans not only treat online influencers as a star but also a friend who can be trusted. In other words, for forming a long-term relationship with fans, online influencers should carefully consider the quality of products or brands. In addition, regarding para-social interaction mediating impact, para-social interaction promotes the effect on influencer expertise to sales performance. We further recommend that online influencers make more efforts on live streaming to increase fans’ trust in brands recommended by influencers.
Research limitations and outlookThis research is subject to certain restrictions, which may present new directions for further analysis. We examined only a limited set of outcome metrics associated with a live streaming platform in China. Future studies should increase the set of outcome measures in various background cultures associated with consumer psychological theories. Further investigation may also explore how different live streaming platforms and how various intent campaigns of live streaming affect trust from fans to brands or commercial sales are worth examining and would extend Hughes et al. (2019)framework. Our results thus far have been based on real-time data (actual product-oriented campaigns), providing high generalization and meaningful insights into complex interplay of multiple factors that influence how these campaigns actually perform in real life. However, filed data limit our ability to manipulate other key independent variables, therefore we will enrich our findings by employing various data collecting methods such as experiments. In addition, this research uses the influencers’ live streaming activities but does not formally take into account the entire past performance or longevity of the influencers’careers. This could be an important variable to consider in future research. Finally, there is room for research on how influencer expertise in the live streaming context. Importantly, para-social interaction mediation effect between influencer characteristics and sales performance.
References
Fig. H1-H4 Results
Fig. H5Results
Theoretical contributions Our research is the first to estimate the impact of live streaming trust among fans, influencers and brands using real-time panel data. In addition, the study is the first to empirically measure para-social interaction between influencer and fans and trust using filed data. Importantly, we contribute to the literature on live streaming, trust transfer theory and para-social interaction, and especially on influencer expertise by enriching how to measure online influencer expertise (Hughes, Swaminathan and Brooks, 2019).Regarding the expertise, we subdivide 14 product categories into 31 subcategories. With various products recommended by influencers in each live streaming campaign, online influencer shows different extents of expertise. Importantly, this study may offer
290
Allison, P. D. (2009) Fixed effects regression models. SAGE Publications.Baron, R. M. and Kenny, D. A. (1986) ‘The Moderator-Mediator Variable Distinction in Social Psychological Research. Conceptual, Strategic, and Statistical Considerations’, Journal of Personality and Social Psychology, 51(6), pp. 1173–1182.doi: 10.1037/0022-3514.51.6.1173.Bennett, R. and Rundle-Thiele, S. (2002) ‘A comparison of attitudinal loyalty measurement approaches’, Journal of Brand Management, 9(3), pp. 193–209. doi: 10.1057/palgrave.bm.2540069.Boerman, S. C. (2020) ‘The effects of the standardized instagram disclosure for micro-and meso-influencers’, Computers in Human Behavior. Elsevier, 103(September 2019), pp. 199–207. doi: 10.1016/j.chb.2019.09.015.Breves, P. L. et al. (2019) ‘The Perceived Fit between Instagram Influencers and the Endorsed Brand’, Journal of Advertising Research, (August), p. JAR-2019-030. doi: 10.2501/jar-2019-030.Cameron, A. C., & Trivedi, P. K. (2005) Microeconometrics: methods and applications, Cambridge university press. doi: 10.1192/bjp.111.479.1009-a.Cameron, C., & Trivedi, P. (2010) ‘Micro econometrics Using Stata’, College Stations.Gorondutse, A. H., & Hilman, H. (2014) ‘Mediation effect of customer satisfaction on the relationships between service quality and customer loyalty in the Nigerian foods and beverages industry : Sobel test approach’, International Journal of Management Science and Engineering Management, 9(1), pp. 1–8. doi: 10.1080/17509653.2013.812337.Hausman, J. A. (1978) ‘Specification tests in econometrics’, Journal of the econometric society, pp. 1251–1271.Hollebeek, L. D. and Macky, K. (2019) ‘Digital Content Marketing’s Role in Fostering Consumer Engagement, Trust, and Value: Framework, Fundamental Propositions, and Implications’, Journal of Interactive Marketing. Direct Marketing Educational Foundation, Inc. dba Marketing EDGE, 45, pp. 27–41. doi: 10.1016/j.intmar.2018.07.003.Horton, D. and Richard Wohl, R. (1956) ‘Mass Communication and Para-Social Interaction’, Psychiatry, 19(3), pp. 215–229. doi: 10.1080/00332747.1956.11023049.Hsiao, C. (2014) Analysis of Panel Data, Cambridge university press. doi: 10.1017/CBO9781107415324.004.Hu, M., Zhang, M. and Wang, Y. (2017) ‘Why do audiences choose to keep watching on live video streaming platforms? An explanation of dual identification framework’, Computers in Human Behavior, 75, pp. 594–606. doi: 10.1016/j.chb.2017.06.006.Hughes, C., Swaminathan, V. and Brooks, G. (2019) ‘Driving Brand Engagement Through Online Social Influencers: An Empirical Investigation of Sponsored Blogging Campaigns’, Journal of Marketing, 83(5), pp. 78–96. doi: 10.1177/0022242919854374.Industry Research (2019) Global Live Streaming Market Research Report 2019-2026: Industry Share and Size, by Value and Volume. Available at: https://www.theexpresswire.com/pressrelease/Global-Live-Streaming-Market-Research-Report-2019-2026-Industry-Share-and-Size-by-Value-and-Volume_10466370.
291
Lee, J. E. and Watkins, B. (2016) ‘YouTube vloggers’ influence on consumer luxury brand perceptions and intentions’, Journal of Business Research. Elsevier Inc., 69(12), pp. 5753–5760. doi: 10.1016/j.jbusres.2016.04.171.Leung, F. F., Kim, S. and Tse, C. H. (2020) ‘Highlighting Effort Versus Talent in Service Employee Performance : Customer Attributions and Responses’. doi: 10.1177/0022242920902722.Lin, Z. (2014) ‘An empirical investigation of user and system recommendations in e-commerce’, Decision Support Systems. Elsevier B.V., 68, pp. 111–124. doi: 10.1016/j.dss.2014.10.003.Liu, L. et al. (2018) ‘Trust transfer in social media brand communities: The role of consumer engagement’, International Journal of Information Management. Elsevier, 41(28), pp. 1–13. doi: 10.1016/j.ijinfomgt.2018.02.006.Lohse, G., Bellman, S., & Johnson, E. J. (2000) ‘Consumer buying behavior on the Internet: Findings from panel data’, Journal of Interactive Marketing. Elsevier, 14(1), pp. 15–29. doi: 10.1002/(SICI)1520-6653(200024)14.Lou, C. and Yuan, S. (2019) ‘Influencer Marketing: How Message Value and Credibility Affect Consumer Trust of Branded Content on Social Media’, Journal of Interactive Advertising. Routledge, 19(1), pp. 58–73. doi: 10.1080/15252019.2018.1533501.Mackinnon, D. P. et al. (2002) ‘A Comparison of Methods to Test Mediation and Other Intervening Variable Effects’, 7(1), pp. 83–104. doi: 10.1037//1082-989X.7.1.83.MacKinnon, D. P., Fairchild, A. J. and Fritz, M. S. (2007) ‘Mediation Analysis’, Annual Review of Psychology, 58(1), pp. 593–614. doi: 10.1146/annurev.psych.58.110405.085542.McGuire, D. (2011) Foundations of human resource development, Human Resource Development: Theory and Practice. doi: 10.4135/9781446251065.n1.Muller, D., Judd, C. M. and Yzerbyt, V. Y. (2005) ‘When moderation is mediated and mediation is moderated’, Journal of Personality and Social Psychology, 89(6), pp. 852–863. doi: 10.1037/0022-3514.89.6.852.Park, H. J. and Lin, L. M. (2020) ‘The effects of match-ups on the consumer attitudes toward internet celebrities and their live streaming contents in the context of product endorsement’, Journal of Retailing and Consumer Services. Elsevier Ltd, 52(August 2019), p. 101934. doi: 10.1016/j.jretconser.2019.101934.Preacher, K. J., Rucker, D. D., & Hayes, A. F. (2007) ‘Addressing moderated mediation hypotheses: Theory, methods, and prescriptions’, Multivariate behavioral research, 42(1), pp. 185–227. doi: 10.1080/00273170701341316.Roodman, D., Nielsen, M. Ø., MacKinnon, J. G., & Webb, M. D. (2019) ‘Fast and wild: Bootstrap inference in Stata using boottest’, The Stata Journal, 19(1), pp. 4–60.Rubin, A. M. and Step, M. M. (2000) ‘Impact of motivation, attraction, and parasocial interaction on talk radio listening’, Journal of Broadcasting and Electronic Media, pp. 635–654. doi: 10.1207/s15506878jobem4404_7.Sarkar, S., Chauhan, S. and Khare, A. (2020) ‘A meta-analysis of antecedents and consequences of trust in mobile commerce’, International Journal of Information Management. Elsevier, 50(August 2019), pp. 286–301. doi:
Allison, P. D. (2009) Fixed effects regression models. SAGE Publications.Baron, R. M. and Kenny, D. A. (1986) ‘The Moderator-Mediator Variable Distinction in Social Psychological Research. Conceptual, Strategic, and Statistical Considerations’, Journal of Personality and Social Psychology, 51(6), pp. 1173–1182.doi: 10.1037/0022-3514.51.6.1173.Bennett, R. and Rundle-Thiele, S. (2002) ‘A comparison of attitudinal loyalty measurement approaches’, Journal of Brand Management, 9(3), pp. 193–209. doi: 10.1057/palgrave.bm.2540069.Boerman, S. C. (2020) ‘The effects of the standardized instagram disclosure for micro-and meso-influencers’, Computers in Human Behavior. Elsevier, 103(September 2019), pp. 199–207. doi: 10.1016/j.chb.2019.09.015.Breves, P. L. et al. (2019) ‘The Perceived Fit between Instagram Influencers and the Endorsed Brand’, Journal of Advertising Research, (August), p. JAR-2019-030. doi: 10.2501/jar-2019-030.Cameron, A. C., & Trivedi, P. K. (2005) Microeconometrics: methods and applications, Cambridge university press. doi: 10.1192/bjp.111.479.1009-a.Cameron, C., & Trivedi, P. (2010) ‘Micro econometrics Using Stata’, College Stations.Gorondutse, A. H., & Hilman, H. (2014) ‘Mediation effect of customer satisfaction on the relationships between service quality and customer loyalty in the Nigerian foods and beverages industry : Sobel test approach’, International Journal of Management Science and Engineering Management, 9(1), pp. 1–8. doi: 10.1080/17509653.2013.812337.Hausman, J. A. (1978) ‘Specification tests in econometrics’, Journal of the econometric society, pp. 1251–1271.Hollebeek, L. D. and Macky, K. (2019) ‘Digital Content Marketing’s Role in Fostering Consumer Engagement, Trust, and Value: Framework, Fundamental Propositions, and Implications’, Journal of Interactive Marketing. Direct Marketing Educational Foundation, Inc. dba Marketing EDGE, 45, pp. 27–41. doi: 10.1016/j.intmar.2018.07.003.Horton, D. and Richard Wohl, R. (1956) ‘Mass Communication and Para-Social Interaction’, Psychiatry, 19(3), pp. 215–229. doi: 10.1080/00332747.1956.11023049.Hsiao, C. (2014) Analysis of Panel Data, Cambridge university press. doi: 10.1017/CBO9781107415324.004.Hu, M., Zhang, M. and Wang, Y. (2017) ‘Why do audiences choose to keep watching on live video streaming platforms? An explanation of dual identification framework’, Computers in Human Behavior, 75, pp. 594–606. doi: 10.1016/j.chb.2017.06.006.Hughes, C., Swaminathan, V. and Brooks, G. (2019) ‘Driving Brand Engagement Through Online Social Influencers: An Empirical Investigation of Sponsored Blogging Campaigns’, Journal of Marketing, 83(5), pp. 78–96. doi: 10.1177/0022242919854374.Industry Research (2019) Global Live Streaming Market Research Report 2019-2026: Industry Share and Size, by Value and Volume. Available at: https://www.theexpresswire.com/pressrelease/Global-Live-Streaming-Market-Research-Report-2019-2026-Industry-Share-and-Size-by-Value-and-Volume_10466370.
292
10.1016/j.ijinfomgt.2019.08.008.Sharma, S., Menard, P. and Mutchler, L. A. (2019) ‘Who to Trust? Applying Trust to Social Commerce’, Journal of Computer Information Systems, 59(1), pp. 32–42. doi:10.1080/08874417.2017.1289356.Shin, D. D. H. (2019) ‘Blockchain: The emerging technology of digital trust’, Telematics and Informatics, 45(June), p. 101278. doi: 10.1016/j.tele.2019.101278.Singh, J. et al. (2020) ‘“To trust or not to trust”: The impact of social media influencers on the reputation of corporate brands in crisis’, Journal of Business Research. Elsevier, (March), pp. 1–17. doi: 10.1016/j.jbusres.2020.03.039.Sobel, M. E. (1982) ‘Asymptotic Confidence Intervals for Indirect Effects in Structural Equation Models’, Sociological Methodology, 13(May), p. 290. doi: 10.2307/270723.Stewart, K. J. (2003) ‘Trust transfer on the World Wide Web’, Organization Science, 14(1), pp. 5–17. doi: 10.1287/orsc.14.1.5.12810.Sun, Y. et al. (2019) ‘How live streaming influences purchase intentions in social commerce: An IT affordance perspective’, Electronic Commerce Research and Applications, 37(December 2018). doi: 10.1016/j.elerap.2019.100886.Teoh, K. K., & Cyril, E. U. (2008) ‘The role of presence and para social presence on trust in online virtual electronic commerce’, Journal of Applied Sciences, 16(8), pp. 2834–2842.Todd, P. R. and Melancon, J. (2018) ‘Gender and live-streaming: source credibility and motivation’, Journal of Research in Interactive Marketing, 12(1), pp. 79–93. doi: 10.1108/JRIM-05-2017-0035.De Vries, L., Gensler, S. and Leeflang, P. S. H. (2012) ‘Popularity of Brand Posts on Brand Fan Pages: An Investigation of the Effects of Social Media Marketing’, Journal of Interactive Marketing, 26(2), pp. 83–91. doi: 10.1016/j.intmar.2012.01.003.Wong, V. C., Fock, H. and Ho, C. K. Y. (2020) ‘Toward a Process-Transfer Model of the Endorser Effect’. doi: 10.1177/0022243720910453.Wooldridge, J. M. (2010) Econometric analysis of cross section and panel data, MIT press. doi: 10.1515/humr.2003.021.Zhang, M. et al. (2019) ‘The impact of live video streaming on online purchase intention’, Service Industries Journal. Taylor & Francis, 0(0), pp. 1–26. doi: 10.1080/02642069.2019.1576642.Zhao, K. et al. (2019) ‘Understanding Factors that Influence User Popularity in Live Streaming Platforms’, SSRN Electronic Journal, pp. 1–46. doi: 10.2139/ssrn.3388949.
293
DO STORE FLEYRS TRIGGER CROSS-CATEGORY SALES? THE MODERATING
ROLE OF CATEGORIES’ RELATEDNESS
Saeid VafainiaDepartement of Marketing
ESCP Business School, Paris, [email protected]
Els BreugelmansDepartment of Marketing
KU Leuven, Leuven, [email protected]
Tammo H.A. BijmoltFaculty of Economics and Business
University of Groningen, Groningen, The [email protected]
INTRODUCTION
Store flyers are a key marketing instrument for retailers, even in the digital age (Ziliani & Ieva,
2015), accounting for over 50% of retailers’ marketing budget (Gázquez-Abad and Martínez-
López 2016). Retailers use store flyers to communicate to customers on (part of) their assortment
and promotions, and thereby hope to attract customers to visit the store.
In this study, we intend to investigate the own- and cross-category sales impact of
featuring categories in a store flyer. While the own-category sales impact of store flyers has
been shown by prior literature in the past (Gázquez-Abad & Martínez-López, 2016;
Gijsbrechts, Campo, & Goossens, 2003), we are one of the first to do an extensive study on the
cross-category sales impact of featuring categories in a store flyer.
In addition to investigating the overall cross-category impact of store flyers, we explore
how the relatedness between pairs of (featured and other) categories explains differences in
cross-sales effects. Previous studies, in the context of sales promotion, have demonstrated that
the strength of linkages between brands or categories is a good predictor of the magnitude of
sales spillover (Leeflang and Parreño-Selva 2012). Following prior literature, we propose that
categories can be related via: i) similarity in usage (degree of complementarity and degree of
294
substitution), ii) similarity in category characteristics (such as the level of involvement or the
degree of hedonism/utilitarianism), and iii) physical proximity (distance between categories in
the store) (Leeflang and Parreño-Selva 2012; Sahni 2016). Figure 1 summarizes the conceptual
framework of this study.
[Insert Figure 1 here]
THEORETICAL BACKGROUND
Cross-sales impact of featuring categories in a store flyer
Direct marketing literature has shown that a store flyer has a positive impact on both store traffic
(Gijsbrechts et al., 2003; Gázquez-Abad and Martinez-Lopez, 2016). Given that consumers
oftentimes buy multiple categories during one shopping trip (Sahni, 2016), it is not unlikely that
consumers – once they are in the store – end up buying not only featured categories but spend
money on other categories as well (Leeflang and Parreño-Selva, 2012).
On the other hand, and according to mental accounting theory (Thaler, 1985), when
consumers face a binding budget constraint on a shopping trip, an increase in the amount spent
for a product category featured in a store flyer (on a given shopping trip) would decrease the
amount that is perceived to be available to spend on other categories, producing potential
negative cross-sales effects.
Moderation effect of category relatedness a store flyer
According to the accessibility-diagnosticity framework of Feldman and Lynch (1988), the
transfer of information of a cue pertaining to one category (such as the information coming
from featuring a category in a store flyer) to another category depends on the nature and the
strength of the link between the two categories (accessibility) (Kushwaha & Shankar, 2013).
Based on this literature, we focus on three dimensions of category relatedness that could
influence the degree of cross-sales flyer effects: (i) the extent to which the categories are related
in usage, (ii) the similarity between categories based on an overlap in category characteristics,
and (iii) the physical distance between categories in a store.
295
EMPIRICAL SETTING
In this study we use a unique scanner weekly sales dataset from a large independent retailer in
The Netherlands, with a single store of more than 22,000 m² surface area and around 300,000
visitors in a year. The retailer has a large variety of categories within eight departments.
The retailer’s main marketing communications are door-to-door specialist flyers (65%
of all direct marketing communications), where two or three departments are featured per flyer
and the retailer wants to convey the message that they are a specialist in the featured
departments (they label their flyers as ‘specialist in departments x and y’).
MODEL
In line with Gielens (2012) and Datta, Ailawadi, and Van Heerde (2017), we use a two-stage
model. In the first stage, we model the cross-sales flyer effects for each pair (either two
departments for the department-level model, or two categories for the category-level model).
Then, in the second stage, we extract the estimated cross-sales flyer coefficients from the first
stage and use them as dependent variables to explore the impact of the relatedness between pairs.
First-stage models
Department-level model
Given that there are eight departments, we estimate eight sales response models with the log
of the sales of department j at week t, t = 1, …, Τ, as the dependent variables. We use a regression
model with the following equation:
𝐼𝐼𝐼𝐼) 𝐿𝐿𝐿𝐿𝐿𝐿𝐿𝐿Sales𝑗𝑗𝑗𝑗𝑗𝑗𝑗𝑗 = 𝛽𝛽𝛽𝛽𝑗𝑗𝑗𝑗0 + (� 𝛽𝛽𝛽𝛽𝑗𝑗𝑗𝑗1𝑘𝑘𝑘𝑘𝐶𝐶𝐶𝐶𝐶𝐶𝐶𝐶𝐶𝐶𝐶𝐶𝐶𝐶𝐶𝐶𝐶𝐶𝐶𝐶𝐶𝐶𝐶𝐶𝐶𝐶𝐶𝐶𝑝𝑝𝑝𝑝_𝑓𝑓𝑓𝑓𝑓𝑓𝑓𝑓𝑓𝑓𝑓𝑓𝐶𝐶𝐶𝐶𝐶𝐶𝐶𝐶𝑘𝑘𝑘𝑘𝑗𝑗𝑗𝑗)𝑘𝑘𝑘𝑘=𝑛𝑛𝑛𝑛
𝑘𝑘𝑘𝑘=1+ 𝛽𝛽𝛽𝛽𝑗𝑗𝑗𝑗2𝑂𝑂𝑂𝑂𝑂𝑂𝑂𝑂𝐿𝐿𝐿𝐿_𝑓𝑓𝑓𝑓𝑓𝑓𝑓𝑓𝑓𝑓𝑓𝑓𝐶𝐶𝐶𝐶𝐶𝐶𝐶𝐶𝑗𝑗𝑗𝑗𝑗𝑗𝑗𝑗
+ 𝛽𝛽𝛽𝛽𝑗𝑗𝑗𝑗3𝐻𝐻𝐻𝐻𝐶𝐶𝐶𝐶𝑓𝑓𝑓𝑓𝐻𝐻𝐻𝐻𝐶𝐶𝐶𝐶𝐻𝐻𝐻𝐻𝑓𝑓𝑓𝑓_𝑝𝑝𝑝𝑝𝐶𝐶𝐶𝐶𝐶𝐶𝐶𝐶𝐻𝐻𝐻𝐻𝐶𝐶𝐶𝐶𝐶𝐶𝐶𝐶𝑗𝑗𝑗𝑗 + 𝛽𝛽𝛽𝛽𝑗𝑗𝑗𝑗4𝐶𝐶𝐶𝐶𝑓𝑓𝑓𝑓𝐶𝐶𝐶𝐶𝐶𝐶𝐶𝐶𝐶𝐶𝐶𝐶𝐶𝐶𝐶𝐶𝐶𝐶𝐶𝐶_𝐶𝐶𝐶𝐶𝐻𝐻𝐻𝐻𝑓𝑓𝑓𝑓𝑗𝑗𝑗𝑗
+ ��𝛽𝛽𝛽𝛽𝑗𝑗𝑗𝑗5,𝑄𝑄𝑄𝑄
𝑄𝑄𝑄𝑄=4
𝑄𝑄𝑄𝑄=2
𝑄𝑄𝑄𝑄𝐶𝐶𝐶𝐶𝐻𝐻𝐻𝐻𝐶𝐶𝐶𝐶𝑄𝑄𝑄𝑄𝐶𝐶𝐶𝐶𝐶𝐶𝐶𝐶_𝐶𝐶𝐶𝐶𝐶𝐶𝐶𝐶𝑑𝑑𝑑𝑑𝑑𝑑𝑑𝑑𝑓𝑓𝑓𝑓𝑗𝑗𝑗𝑗� + 𝛽𝛽𝛽𝛽𝑗𝑗𝑗𝑗6𝑇𝑇𝑇𝑇𝑂𝑂𝑂𝑂𝐶𝐶𝐶𝐶_𝑆𝑆𝑆𝑆𝑝𝑝𝑝𝑝𝐶𝐶𝐶𝐶𝑆𝑆𝑆𝑆𝐻𝐻𝐻𝐻𝐻𝐻𝐻𝐻𝑓𝑓𝑓𝑓𝐻𝐻𝐻𝐻𝐶𝐶𝐶𝐶𝑄𝑄𝑄𝑄𝑗𝑗𝑗𝑗𝑗𝑗𝑗𝑗
+ 𝛽𝛽𝛽𝛽𝑗𝑗𝑗𝑗7𝑂𝑂𝑂𝑂𝑄𝑄𝑄𝑄ℎ𝐶𝐶𝐶𝐶𝐶𝐶𝐶𝐶_𝑀𝑀𝑀𝑀𝐻𝐻𝐻𝐻𝐶𝐶𝐶𝐶𝑀𝑀𝑀𝑀𝐶𝐶𝐶𝐶𝑄𝑄𝑄𝑄𝐻𝐻𝐻𝐻𝐿𝐿𝐿𝐿𝑀𝑀𝑀𝑀_𝐴𝐴𝐴𝐴𝑆𝑆𝑆𝑆𝑄𝑄𝑄𝑄𝐻𝐻𝐻𝐻𝐶𝐶𝐶𝐶𝐿𝐿𝐿𝐿𝐶𝐶𝐶𝐶𝑗𝑗𝑗𝑗𝑗𝑗𝑗𝑗
+ (� 𝛽𝛽𝛽𝛽𝑗𝑗𝑗𝑗8𝑘𝑘𝑘𝑘𝐶𝐶𝐶𝐶𝐶𝐶𝐶𝐶𝑝𝑝𝑝𝑝𝐶𝐶𝐶𝐶𝑓𝑓𝑓𝑓𝐻𝐻𝐻𝐻_𝐶𝐶𝐶𝐶𝐶𝐶𝐶𝐶𝐶𝐶𝐶𝐶𝐶𝐶𝐶𝐶𝐶𝐶𝐶𝐶𝐶𝐶𝐶𝐶𝐶𝐶𝐶𝐶𝑝𝑝𝑝𝑝_𝑓𝑓𝑓𝑓𝑓𝑓𝑓𝑓𝑓𝑓𝑓𝑓𝐶𝐶𝐶𝐶𝐶𝐶𝐶𝐶𝑘𝑘𝑘𝑘)𝑘𝑘𝑘𝑘=𝑚𝑚𝑚𝑚
𝑘𝑘𝑘𝑘=1 +𝛽𝛽𝛽𝛽𝑗𝑗𝑗𝑗9𝐶𝐶𝐶𝐶𝐶𝐶𝐶𝐶𝑝𝑝𝑝𝑝𝐶𝐶𝐶𝐶𝑓𝑓𝑓𝑓𝐻𝐻𝐻𝐻_𝑂𝑂𝑂𝑂𝑂𝑂𝑂𝑂𝐿𝐿𝐿𝐿_𝑓𝑓𝑓𝑓𝑓𝑓𝑓𝑓𝑓𝑓𝑓𝑓𝐶𝐶𝐶𝐶𝐶𝐶𝐶𝐶𝑗𝑗𝑗𝑗+ ∈𝑗𝑗𝑗𝑗 .
substitution), ii) similarity in category characteristics (such as the level of involvement or the
degree of hedonism/utilitarianism), and iii) physical proximity (distance between categories in
the store) (Leeflang and Parreño-Selva 2012; Sahni 2016). Figure 1 summarizes the conceptual
framework of this study.
[Insert Figure 1 here]
THEORETICAL BACKGROUND
Cross-sales impact of featuring categories in a store flyer
Direct marketing literature has shown that a store flyer has a positive impact on both store traffic
(Gijsbrechts et al., 2003; Gázquez-Abad and Martinez-Lopez, 2016). Given that consumers
oftentimes buy multiple categories during one shopping trip (Sahni, 2016), it is not unlikely that
consumers – once they are in the store – end up buying not only featured categories but spend
money on other categories as well (Leeflang and Parreño-Selva, 2012).
On the other hand, and according to mental accounting theory (Thaler, 1985), when
consumers face a binding budget constraint on a shopping trip, an increase in the amount spent
for a product category featured in a store flyer (on a given shopping trip) would decrease the
amount that is perceived to be available to spend on other categories, producing potential
negative cross-sales effects.
Moderation effect of category relatedness a store flyer
According to the accessibility-diagnosticity framework of Feldman and Lynch (1988), the
transfer of information of a cue pertaining to one category (such as the information coming
from featuring a category in a store flyer) to another category depends on the nature and the
strength of the link between the two categories (accessibility) (Kushwaha & Shankar, 2013).
Based on this literature, we focus on three dimensions of category relatedness that could
influence the degree of cross-sales flyer effects: (i) the extent to which the categories are related
in usage, (ii) the similarity between categories based on an overlap in category characteristics,
and (iii) the physical distance between categories in a store.
296
𝐶𝐶𝐶𝐶𝐶𝐶𝐶𝐶𝐶𝐶𝐶𝐶𝐶𝐶𝐶𝐶𝐶𝐶𝐶𝐶𝐶𝐶𝐶𝐶𝐶𝐶𝐶𝐶𝐶𝐶𝐶𝐶_𝑓𝑓𝑓𝑓𝑓𝑓𝑓𝑓𝑓𝑓𝑓𝑓𝐶𝐶𝐶𝐶𝐶𝐶𝐶𝐶𝑘𝑘𝑘𝑘𝑗𝑗𝑗𝑗 is the share in a flyer in week t for each of the other departments k
(k=1 to m, with k≠j) and 𝑂𝑂𝑂𝑂𝑂𝑂𝑂𝑂𝐿𝐿𝐿𝐿_𝑓𝑓𝑓𝑓𝑓𝑓𝑓𝑓𝑓𝑓𝑓𝑓𝐶𝐶𝐶𝐶𝐶𝐶𝐶𝐶𝑗𝑗𝑗𝑗𝑗𝑗𝑗𝑗 is the share of the focal department j in the flyer in week
t. We control for the impact of these other marketing communication activities in our analyses,
holiday period, days that the store is closed, and the different quarters in a year (quarter one is
the baseline).
We also need to control for the endogeneity of the own-department and cross-department
flyer share variables as the decision of a retailer to feature certain departments in a given week is
not random. To do so, we rely on an instrument-free method using Gaussian copulas, which was
introduced by Park and Gupta (2012).
Category-level model
Next to the department-level model, we estimate a category-level model within each department.
In particular, we model category i’s log of sales at week t, t = 1, …, Τ as a function of cross-
category flyer share, where we limit the effects to categories within the same department
and use a similar model as in Equation I but adapted to the category level.
𝐼𝐼𝐼𝐼𝐼𝐼𝐼𝐼) 𝐿𝐿𝐿𝐿𝐿𝐿𝐿𝐿 Sales𝑖𝑖𝑖𝑖𝑗𝑗𝑗𝑗 = 𝛽𝛽𝛽𝛽𝑖𝑖𝑖𝑖0 + (� 𝛽𝛽𝛽𝛽𝑖𝑖𝑖𝑖1𝑙𝑙𝑙𝑙𝐶𝐶𝐶𝐶𝐶𝐶𝐶𝐶𝐶𝐶𝐶𝐶𝐶𝐶𝐶𝐶𝐶𝐶𝐶𝐶𝑆𝑆𝑆𝑆𝑆𝑆𝑆𝑆𝑄𝑄𝑄𝑄_𝑓𝑓𝑓𝑓𝑓𝑓𝑓𝑓𝑓𝑓𝑓𝑓𝐶𝐶𝐶𝐶𝐶𝐶𝐶𝐶𝑙𝑙𝑙𝑙𝑗𝑗𝑗𝑗)𝑙𝑙𝑙𝑙=𝑚𝑚𝑚𝑚
𝑙𝑙𝑙𝑙=1+ 𝛽𝛽𝛽𝛽𝑖𝑖𝑖𝑖2𝑂𝑂𝑂𝑂𝑂𝑂𝑂𝑂𝐿𝐿𝐿𝐿_𝑓𝑓𝑓𝑓𝑓𝑓𝑓𝑓𝑓𝑓𝑓𝑓𝐶𝐶𝐶𝐶𝐶𝐶𝐶𝐶𝑖𝑖𝑖𝑖𝑗𝑗𝑗𝑗
+ (� 𝛽𝛽𝛽𝛽𝑖𝑖𝑖𝑖3𝑘𝑘𝑘𝑘𝐶𝐶𝐶𝐶𝐶𝐶𝐶𝐶𝐶𝐶𝐶𝐶𝐶𝐶𝐶𝐶𝐶𝐶𝐶𝐶𝐶𝐶𝐶𝐶𝐶𝐶𝐶𝐶𝐶𝐶𝐶𝐶_𝑓𝑓𝑓𝑓𝑓𝑓𝑓𝑓𝑓𝑓𝑓𝑓𝐶𝐶𝐶𝐶𝐶𝐶𝐶𝐶𝑘𝑘𝑘𝑘𝑗𝑗𝑗𝑗)𝑘𝑘𝑘𝑘=𝑛𝑛𝑛𝑛
𝑘𝑘𝑘𝑘=1+ +𝛽𝛽𝛽𝛽𝑖𝑖𝑖𝑖4𝐻𝐻𝐻𝐻𝐶𝐶𝐶𝐶𝑓𝑓𝑓𝑓𝐻𝐻𝐻𝐻𝐶𝐶𝐶𝐶𝑆𝑆𝑆𝑆𝑓𝑓𝑓𝑓_𝐶𝐶𝐶𝐶𝐶𝐶𝐶𝐶𝐶𝐶𝐶𝐶𝐻𝐻𝐻𝐻𝐶𝐶𝐶𝐶𝐶𝐶𝐶𝐶𝑗𝑗𝑗𝑗
+ 𝛽𝛽𝛽𝛽𝑖𝑖𝑖𝑖5𝐶𝐶𝐶𝐶𝑓𝑓𝑓𝑓𝐶𝐶𝐶𝐶𝐶𝐶𝐶𝐶𝐶𝐶𝐶𝐶𝐶𝐶𝐶𝐶𝐶𝐶𝐶𝐶_𝐶𝐶𝐶𝐶𝑆𝑆𝑆𝑆𝑓𝑓𝑓𝑓𝑗𝑗𝑗𝑗 + �𝛽𝛽𝛽𝛽𝑖𝑖𝑖𝑖6,𝑄𝑄𝑄𝑄
𝑄𝑄𝑄𝑄=4
𝑄𝑄𝑄𝑄=2
𝑄𝑄𝑄𝑄𝐶𝐶𝐶𝐶𝑆𝑆𝑆𝑆𝐶𝐶𝐶𝐶𝑄𝑄𝑄𝑄𝐶𝐶𝐶𝐶𝐶𝐶𝐶𝐶_𝐶𝐶𝐶𝐶𝐶𝐶𝐶𝐶𝑑𝑑𝑑𝑑𝑑𝑑𝑑𝑑𝑓𝑓𝑓𝑓𝑗𝑗𝑗𝑗 + 𝛽𝛽𝛽𝛽𝑖𝑖𝑖𝑖7𝑇𝑇𝑇𝑇𝑂𝑂𝑂𝑂𝐶𝐶𝐶𝐶_𝐶𝐶𝐶𝐶𝐶𝐶𝐶𝐶𝐶𝐶𝐶𝐶𝑆𝑆𝑆𝑆𝐻𝐻𝐻𝐻𝑆𝑆𝑆𝑆𝑓𝑓𝑓𝑓𝐻𝐻𝐻𝐻𝐶𝐶𝐶𝐶𝑄𝑄𝑄𝑄𝑖𝑖𝑖𝑖𝑗𝑗𝑗𝑗
+ 𝛽𝛽𝛽𝛽𝑖𝑖𝑖𝑖8𝑂𝑂𝑂𝑂𝑄𝑄𝑄𝑄ℎ𝐶𝐶𝐶𝐶𝐶𝐶𝐶𝐶_𝑀𝑀𝑀𝑀𝑆𝑆𝑆𝑆𝐶𝐶𝐶𝐶𝑀𝑀𝑀𝑀𝐶𝐶𝐶𝐶𝑄𝑄𝑄𝑄𝐻𝐻𝐻𝐻𝐿𝐿𝐿𝐿𝑀𝑀𝑀𝑀_𝐴𝐴𝐴𝐴𝑆𝑆𝑆𝑆𝑄𝑄𝑄𝑄𝐻𝐻𝐻𝐻𝐶𝐶𝐶𝐶𝐿𝐿𝐿𝐿𝐶𝐶𝐶𝐶𝑖𝑖𝑖𝑖𝑗𝑗𝑗𝑗 + (� 𝛽𝛽𝛽𝛽𝑖𝑖𝑖𝑖9𝑙𝑙𝑙𝑙𝐶𝐶𝐶𝐶𝐶𝐶𝐶𝐶𝐶𝐶𝐶𝐶𝐶𝐶𝐶𝐶𝑓𝑓𝑓𝑓𝑆𝑆𝑆𝑆_𝐶𝐶𝐶𝐶𝐶𝐶𝐶𝐶𝐶𝐶𝐶𝐶𝐶𝐶𝐶𝐶𝐶𝐶𝐶𝐶𝑆𝑆𝑆𝑆𝑄𝑄𝑄𝑄_𝑓𝑓𝑓𝑓𝑓𝑓𝑓𝑓𝑓𝑓𝑓𝑓𝐶𝐶𝐶𝐶𝐶𝐶𝐶𝐶𝑙𝑙𝑙𝑙)𝑙𝑙𝑙𝑙=𝑚𝑚𝑚𝑚
𝑙𝑙𝑙𝑙=1
+ 𝛽𝛽𝛽𝛽𝑖𝑖𝑖𝑖10𝐶𝐶𝐶𝐶𝐶𝐶𝐶𝐶𝐶𝐶𝐶𝐶𝐶𝐶𝐶𝐶𝑓𝑓𝑓𝑓𝑆𝑆𝑆𝑆_𝑂𝑂𝑂𝑂𝑂𝑂𝑂𝑂𝐿𝐿𝐿𝐿_𝑓𝑓𝑓𝑓𝑓𝑓𝑓𝑓𝑓𝑓𝑓𝑓𝐶𝐶𝐶𝐶𝐶𝐶𝐶𝐶𝑖𝑖𝑖𝑖𝑗𝑗𝑗𝑗 + (� 𝛽𝛽𝛽𝛽𝑖𝑖𝑖𝑖11𝑘𝑘𝑘𝑘𝐶𝐶𝐶𝐶𝐶𝐶𝐶𝐶𝐶𝐶𝐶𝐶𝐶𝐶𝐶𝐶𝑓𝑓𝑓𝑓𝑆𝑆𝑆𝑆_𝐶𝐶𝐶𝐶𝐶𝐶𝐶𝐶𝐶𝐶𝐶𝐶𝐶𝐶𝐶𝐶𝐶𝐶𝐶𝐶𝑠𝑠𝑠𝑠𝐶𝐶𝐶𝐶𝐶𝐶𝐶𝐶_𝑓𝑓𝑓𝑓𝑓𝑓𝑓𝑓𝑓𝑓𝑓𝑓𝐶𝐶𝐶𝐶𝐶𝐶𝐶𝐶𝑘𝑘𝑘𝑘)𝑘𝑘𝑘𝑘=𝑛𝑛𝑛𝑛
𝑘𝑘𝑘𝑘=1+ ∈
𝐶𝐶𝐶𝐶𝐶𝐶𝐶𝐶𝐶𝐶𝐶𝐶𝐶𝐶𝐶𝐶𝐶𝐶𝐶𝐶𝑆𝑆𝑆𝑆𝑆𝑆𝑆𝑆𝑄𝑄𝑄𝑄_𝑓𝑓𝑓𝑓𝑓𝑓𝑓𝑓𝑓𝑓𝑓𝑓𝐶𝐶𝐶𝐶𝐶𝐶𝐶𝐶𝑙𝑙𝑙𝑙𝑗𝑗𝑗𝑗 is the share in a flyer in week t for each of the other categories l (l=1 to m,
with l≠i) within the same department j.
Second-stage estimations
To investigate the moderating impact of relatedness on these cross-sales effects of flyers, we
regress the coefficients of the cross-sales flyer effects extracted from the first-stage department-
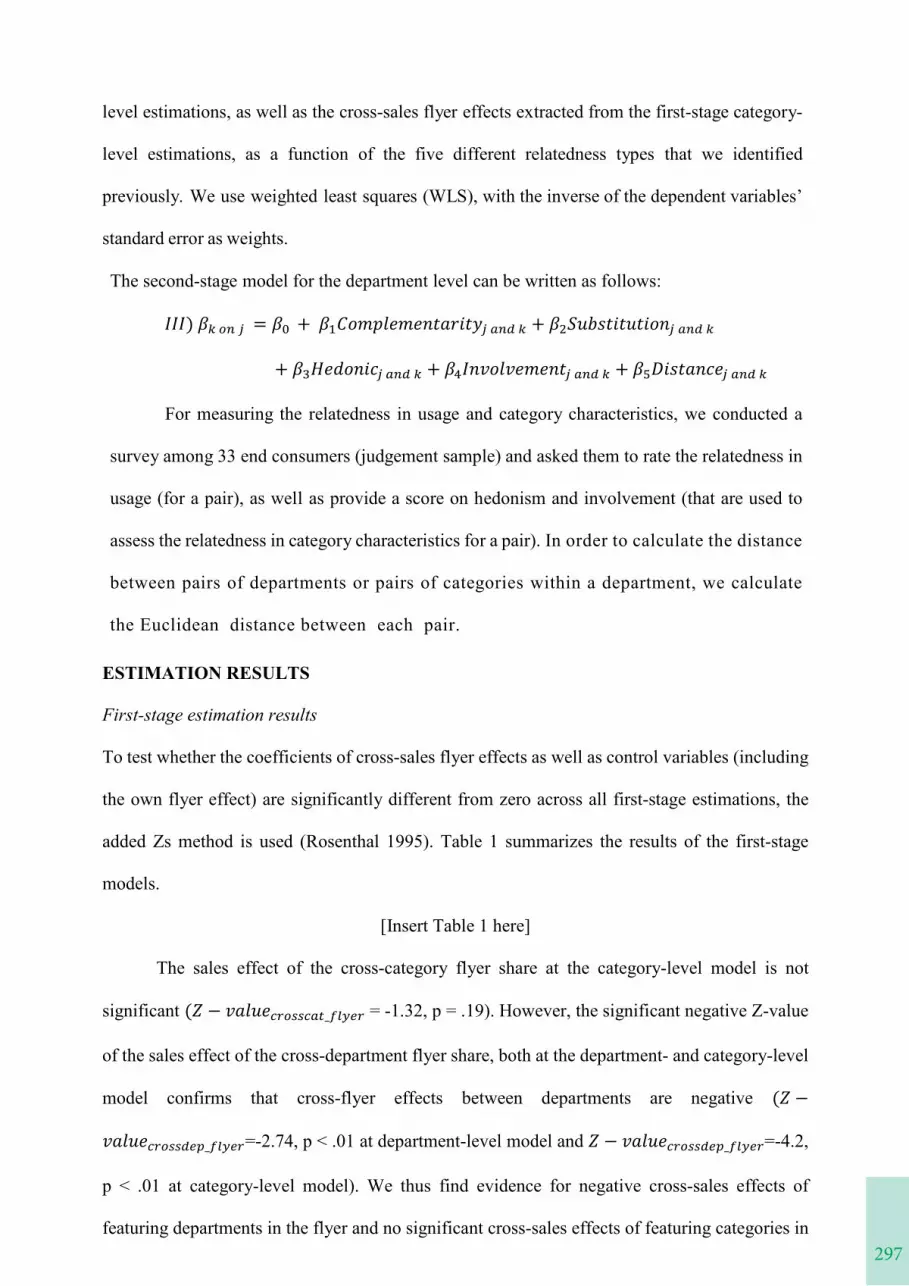
297
level estimations, as well as the cross-sales flyer effects extracted from the first-stage category-
level estimations, as a function of the five different relatedness types that we identified
previously. We use weighted least squares (WLS), with the inverse of the dependent variables’
standard error as weights.
The second-stage model for the department level can be written as follows:
𝐼𝐼𝐼𝐼𝐼𝐼𝐼𝐼𝐼𝐼𝐼𝐼) 𝛽𝛽𝛽𝛽𝑘𝑘𝑘𝑘 𝑜𝑜𝑜𝑜𝑛𝑛𝑛𝑛 𝑗𝑗𝑗𝑗 = 𝛽𝛽𝛽𝛽0 + 𝛽𝛽𝛽𝛽1𝐶𝐶𝐶𝐶𝐶𝐶𝐶𝐶𝑑𝑑𝑑𝑑𝑑𝑑𝑑𝑑𝑑𝑑𝑑𝑑𝐶𝐶𝐶𝐶𝑑𝑑𝑑𝑑𝐶𝐶𝐶𝐶𝐿𝐿𝐿𝐿𝐿𝐿𝐿𝐿𝐿𝐿𝐿𝐿𝐶𝐶𝐶𝐶𝐻𝐻𝐻𝐻𝐿𝐿𝐿𝐿𝐻𝐻𝐻𝐻𝑗𝑗𝑗𝑗 𝑎𝑎𝑎𝑎𝑛𝑛𝑛𝑛𝑎𝑎𝑎𝑎 𝑘𝑘𝑘𝑘 + 𝛽𝛽𝛽𝛽2𝑆𝑆𝑆𝑆𝐶𝐶𝐶𝐶𝑆𝑆𝑆𝑆𝐶𝐶𝐶𝐶𝐿𝐿𝐿𝐿𝐻𝐻𝐻𝐻𝐿𝐿𝐿𝐿𝐶𝐶𝐶𝐶𝐿𝐿𝐿𝐿𝐻𝐻𝐻𝐻𝐶𝐶𝐶𝐶𝐿𝐿𝐿𝐿𝑗𝑗𝑗𝑗 𝑎𝑎𝑎𝑎𝑛𝑛𝑛𝑛𝑎𝑎𝑎𝑎 𝑘𝑘𝑘𝑘
+ 𝛽𝛽𝛽𝛽3𝐻𝐻𝐻𝐻𝐶𝐶𝐶𝐶𝐶𝐶𝐶𝐶𝐶𝐶𝐶𝐶𝐿𝐿𝐿𝐿𝐻𝐻𝐻𝐻𝑆𝑆𝑆𝑆𝑗𝑗𝑗𝑗 𝑎𝑎𝑎𝑎𝑛𝑛𝑛𝑛𝑎𝑎𝑎𝑎 𝑘𝑘𝑘𝑘 + 𝛽𝛽𝛽𝛽4𝐼𝐼𝐼𝐼𝐿𝐿𝐿𝐿𝐼𝐼𝐼𝐼𝐶𝐶𝐶𝐶𝑑𝑑𝑑𝑑𝐼𝐼𝐼𝐼𝐶𝐶𝐶𝐶𝑑𝑑𝑑𝑑𝐶𝐶𝐶𝐶𝐿𝐿𝐿𝐿𝐿𝐿𝐿𝐿𝑗𝑗𝑗𝑗 𝑎𝑎𝑎𝑎𝑛𝑛𝑛𝑛𝑎𝑎𝑎𝑎 𝑘𝑘𝑘𝑘 + 𝛽𝛽𝛽𝛽5𝑠𝑠𝑠𝑠𝐻𝐻𝐻𝐻𝐶𝐶𝐶𝐶𝐿𝐿𝐿𝐿𝐿𝐿𝐿𝐿𝐿𝐿𝐿𝐿𝑆𝑆𝑆𝑆𝐶𝐶𝐶𝐶𝑗𝑗𝑗𝑗 𝑎𝑎𝑎𝑎𝑛𝑛𝑛𝑛𝑎𝑎𝑎𝑎 𝑘𝑘𝑘𝑘
For measuring the relatedness in usage and category characteristics, we conducted a
survey among 33 end consumers (judgement sample) and asked them to rate the relatedness in
usage (for a pair), as well as provide a score on hedonism and involvement (that are used to
assess the relatedness in category characteristics for a pair). In order to calculate the distance
between pairs of departments or pairs of categories within a department, we calculate
the Euclidean distance between each pair.
ESTIMATION RESULTS
First-stage estimation results
To test whether the coefficients of cross-sales flyer effects as well as control variables (including
the own flyer effect) are significantly different from zero across all first-stage estimations, the
added Zs method is used (Rosenthal 1995). Table 1 summarizes the results of the first-stage
models.
[Insert Table 1 here]
The sales effect of the cross-category flyer share at the category-level model is not
significant (𝑍𝑍𝑍𝑍 − 𝐼𝐼𝐼𝐼𝐿𝐿𝐿𝐿𝑑𝑑𝑑𝑑𝐶𝐶𝐶𝐶𝐶𝐶𝐶𝐶𝑐𝑐𝑐𝑐𝑐𝑐𝑐𝑐𝑜𝑜𝑜𝑜𝑐𝑐𝑐𝑐𝑐𝑐𝑐𝑐𝑐𝑐𝑐𝑐𝑎𝑎𝑎𝑎𝑎𝑎𝑎𝑎_𝑓𝑓𝑓𝑓𝑙𝑙𝑙𝑙𝑓𝑓𝑓𝑓𝑓𝑓𝑓𝑓𝑐𝑐𝑐𝑐 = -1.32, p = .19). However, the significant negative Z-value
of the sales effect of the cross-department flyer share, both at the department- and category-level
model confirms that cross-flyer effects between departments are negative (𝑍𝑍𝑍𝑍 −
𝐼𝐼𝐼𝐼𝐿𝐿𝐿𝐿𝑑𝑑𝑑𝑑𝐶𝐶𝐶𝐶𝐶𝐶𝐶𝐶𝑐𝑐𝑐𝑐𝑐𝑐𝑐𝑐𝑜𝑜𝑜𝑜𝑐𝑐𝑐𝑐𝑐𝑐𝑐𝑐𝑎𝑎𝑎𝑎𝑓𝑓𝑓𝑓𝑠𝑠𝑠𝑠_𝑓𝑓𝑓𝑓𝑙𝑙𝑙𝑙𝑓𝑓𝑓𝑓𝑓𝑓𝑓𝑓𝑐𝑐𝑐𝑐=-2.74, p < .01 at department-level model and 𝑍𝑍𝑍𝑍 − 𝐼𝐼𝐼𝐼𝐿𝐿𝐿𝐿𝑑𝑑𝑑𝑑𝐶𝐶𝐶𝐶𝐶𝐶𝐶𝐶𝑐𝑐𝑐𝑐𝑐𝑐𝑐𝑐𝑜𝑜𝑜𝑜𝑐𝑐𝑐𝑐𝑐𝑐𝑐𝑐𝑎𝑎𝑎𝑎𝑓𝑓𝑓𝑓𝑠𝑠𝑠𝑠_𝑓𝑓𝑓𝑓𝑙𝑙𝑙𝑙𝑓𝑓𝑓𝑓𝑓𝑓𝑓𝑓𝑐𝑐𝑐𝑐=-4.2,
p < .01 at category-level model). We thus find evidence for negative cross-sales effects of
featuring departments in the flyer and no significant cross-sales effects of featuring categories in
𝐶𝐶𝐶𝐶𝐶𝐶𝐶𝐶𝐶𝐶𝐶𝐶𝐶𝐶𝐶𝐶𝐶𝐶𝐶𝐶𝐶𝐶𝐶𝐶𝐶𝐶𝐶𝐶𝐶𝐶𝐶𝐶_𝑓𝑓𝑓𝑓𝑓𝑓𝑓𝑓𝑓𝑓𝑓𝑓𝐶𝐶𝐶𝐶𝐶𝐶𝐶𝐶𝑘𝑘𝑘𝑘𝑗𝑗𝑗𝑗 is the share in a flyer in week t for each of the other departments k
(k=1 to m, with k≠j) and 𝑂𝑂𝑂𝑂𝑂𝑂𝑂𝑂𝐿𝐿𝐿𝐿_𝑓𝑓𝑓𝑓𝑓𝑓𝑓𝑓𝑓𝑓𝑓𝑓𝐶𝐶𝐶𝐶𝐶𝐶𝐶𝐶𝑗𝑗𝑗𝑗𝑗𝑗𝑗𝑗 is the share of the focal department j in the flyer in week
t. We control for the impact of these other marketing communication activities in our analyses,
holiday period, days that the store is closed, and the different quarters in a year (quarter one is
the baseline).
We also need to control for the endogeneity of the own-department and cross-department
flyer share variables as the decision of a retailer to feature certain departments in a given week is
not random. To do so, we rely on an instrument-free method using Gaussian copulas, which was
introduced by Park and Gupta (2012).
Category-level model
Next to the department-level model, we estimate a category-level model within each department.
In particular, we model category i’s log of sales at week t, t = 1, …, Τ as a function of cross-
category flyer share, where we limit the effects to categories within the same department
and use a similar model as in Equation I but adapted to the category level.
𝐼𝐼𝐼𝐼𝐼𝐼𝐼𝐼) 𝐿𝐿𝐿𝐿𝐿𝐿𝐿𝐿 Sales𝑖𝑖𝑖𝑖𝑗𝑗𝑗𝑗 = 𝛽𝛽𝛽𝛽𝑖𝑖𝑖𝑖0 + (� 𝛽𝛽𝛽𝛽𝑖𝑖𝑖𝑖1𝑙𝑙𝑙𝑙𝐶𝐶𝐶𝐶𝐶𝐶𝐶𝐶𝐶𝐶𝐶𝐶𝐶𝐶𝐶𝐶𝐶𝐶𝐶𝐶𝑆𝑆𝑆𝑆𝑆𝑆𝑆𝑆𝑄𝑄𝑄𝑄_𝑓𝑓𝑓𝑓𝑓𝑓𝑓𝑓𝑓𝑓𝑓𝑓𝐶𝐶𝐶𝐶𝐶𝐶𝐶𝐶𝑙𝑙𝑙𝑙𝑗𝑗𝑗𝑗)𝑙𝑙𝑙𝑙=𝑚𝑚𝑚𝑚
𝑙𝑙𝑙𝑙=1+ 𝛽𝛽𝛽𝛽𝑖𝑖𝑖𝑖2𝑂𝑂𝑂𝑂𝑂𝑂𝑂𝑂𝐿𝐿𝐿𝐿_𝑓𝑓𝑓𝑓𝑓𝑓𝑓𝑓𝑓𝑓𝑓𝑓𝐶𝐶𝐶𝐶𝐶𝐶𝐶𝐶𝑖𝑖𝑖𝑖𝑗𝑗𝑗𝑗
+ (� 𝛽𝛽𝛽𝛽𝑖𝑖𝑖𝑖3𝑘𝑘𝑘𝑘𝐶𝐶𝐶𝐶𝐶𝐶𝐶𝐶𝐶𝐶𝐶𝐶𝐶𝐶𝐶𝐶𝐶𝐶𝐶𝐶𝐶𝐶𝐶𝐶𝐶𝐶𝐶𝐶𝐶𝐶𝐶𝐶_𝑓𝑓𝑓𝑓𝑓𝑓𝑓𝑓𝑓𝑓𝑓𝑓𝐶𝐶𝐶𝐶𝐶𝐶𝐶𝐶𝑘𝑘𝑘𝑘𝑗𝑗𝑗𝑗)𝑘𝑘𝑘𝑘=𝑛𝑛𝑛𝑛
𝑘𝑘𝑘𝑘=1+ +𝛽𝛽𝛽𝛽𝑖𝑖𝑖𝑖4𝐻𝐻𝐻𝐻𝐶𝐶𝐶𝐶𝑓𝑓𝑓𝑓𝐻𝐻𝐻𝐻𝐶𝐶𝐶𝐶𝑆𝑆𝑆𝑆𝑓𝑓𝑓𝑓_𝐶𝐶𝐶𝐶𝐶𝐶𝐶𝐶𝐶𝐶𝐶𝐶𝐻𝐻𝐻𝐻𝐶𝐶𝐶𝐶𝐶𝐶𝐶𝐶𝑗𝑗𝑗𝑗
+ 𝛽𝛽𝛽𝛽𝑖𝑖𝑖𝑖5𝐶𝐶𝐶𝐶𝑓𝑓𝑓𝑓𝐶𝐶𝐶𝐶𝐶𝐶𝐶𝐶𝐶𝐶𝐶𝐶𝐶𝐶𝐶𝐶𝐶𝐶𝐶𝐶_𝐶𝐶𝐶𝐶𝑆𝑆𝑆𝑆𝑓𝑓𝑓𝑓𝑗𝑗𝑗𝑗 + �𝛽𝛽𝛽𝛽𝑖𝑖𝑖𝑖6,𝑄𝑄𝑄𝑄
𝑄𝑄𝑄𝑄=4
𝑄𝑄𝑄𝑄=2
𝑄𝑄𝑄𝑄𝐶𝐶𝐶𝐶𝑆𝑆𝑆𝑆𝐶𝐶𝐶𝐶𝑄𝑄𝑄𝑄𝐶𝐶𝐶𝐶𝐶𝐶𝐶𝐶_𝐶𝐶𝐶𝐶𝐶𝐶𝐶𝐶𝑑𝑑𝑑𝑑𝑑𝑑𝑑𝑑𝑓𝑓𝑓𝑓𝑗𝑗𝑗𝑗 + 𝛽𝛽𝛽𝛽𝑖𝑖𝑖𝑖7𝑇𝑇𝑇𝑇𝑂𝑂𝑂𝑂𝐶𝐶𝐶𝐶_𝐶𝐶𝐶𝐶𝐶𝐶𝐶𝐶𝐶𝐶𝐶𝐶𝑆𝑆𝑆𝑆𝐻𝐻𝐻𝐻𝑆𝑆𝑆𝑆𝑓𝑓𝑓𝑓𝐻𝐻𝐻𝐻𝐶𝐶𝐶𝐶𝑄𝑄𝑄𝑄𝑖𝑖𝑖𝑖𝑗𝑗𝑗𝑗
+ 𝛽𝛽𝛽𝛽𝑖𝑖𝑖𝑖8𝑂𝑂𝑂𝑂𝑄𝑄𝑄𝑄ℎ𝐶𝐶𝐶𝐶𝐶𝐶𝐶𝐶_𝑀𝑀𝑀𝑀𝑆𝑆𝑆𝑆𝐶𝐶𝐶𝐶𝑀𝑀𝑀𝑀𝐶𝐶𝐶𝐶𝑄𝑄𝑄𝑄𝐻𝐻𝐻𝐻𝐿𝐿𝐿𝐿𝑀𝑀𝑀𝑀_𝐴𝐴𝐴𝐴𝑆𝑆𝑆𝑆𝑄𝑄𝑄𝑄𝐻𝐻𝐻𝐻𝐶𝐶𝐶𝐶𝐿𝐿𝐿𝐿𝐶𝐶𝐶𝐶𝑖𝑖𝑖𝑖𝑗𝑗𝑗𝑗 + (� 𝛽𝛽𝛽𝛽𝑖𝑖𝑖𝑖9𝑙𝑙𝑙𝑙𝐶𝐶𝐶𝐶𝐶𝐶𝐶𝐶𝐶𝐶𝐶𝐶𝐶𝐶𝐶𝐶𝑓𝑓𝑓𝑓𝑆𝑆𝑆𝑆_𝐶𝐶𝐶𝐶𝐶𝐶𝐶𝐶𝐶𝐶𝐶𝐶𝐶𝐶𝐶𝐶𝐶𝐶𝐶𝐶𝑆𝑆𝑆𝑆𝑄𝑄𝑄𝑄_𝑓𝑓𝑓𝑓𝑓𝑓𝑓𝑓𝑓𝑓𝑓𝑓𝐶𝐶𝐶𝐶𝐶𝐶𝐶𝐶𝑙𝑙𝑙𝑙)𝑙𝑙𝑙𝑙=𝑚𝑚𝑚𝑚
𝑙𝑙𝑙𝑙=1
+ 𝛽𝛽𝛽𝛽𝑖𝑖𝑖𝑖10𝐶𝐶𝐶𝐶𝐶𝐶𝐶𝐶𝐶𝐶𝐶𝐶𝐶𝐶𝐶𝐶𝑓𝑓𝑓𝑓𝑆𝑆𝑆𝑆_𝑂𝑂𝑂𝑂𝑂𝑂𝑂𝑂𝐿𝐿𝐿𝐿_𝑓𝑓𝑓𝑓𝑓𝑓𝑓𝑓𝑓𝑓𝑓𝑓𝐶𝐶𝐶𝐶𝐶𝐶𝐶𝐶𝑖𝑖𝑖𝑖𝑗𝑗𝑗𝑗 + (� 𝛽𝛽𝛽𝛽𝑖𝑖𝑖𝑖11𝑘𝑘𝑘𝑘𝐶𝐶𝐶𝐶𝐶𝐶𝐶𝐶𝐶𝐶𝐶𝐶𝐶𝐶𝐶𝐶𝑓𝑓𝑓𝑓𝑆𝑆𝑆𝑆_𝐶𝐶𝐶𝐶𝐶𝐶𝐶𝐶𝐶𝐶𝐶𝐶𝐶𝐶𝐶𝐶𝐶𝐶𝐶𝐶𝑠𝑠𝑠𝑠𝐶𝐶𝐶𝐶𝐶𝐶𝐶𝐶_𝑓𝑓𝑓𝑓𝑓𝑓𝑓𝑓𝑓𝑓𝑓𝑓𝐶𝐶𝐶𝐶𝐶𝐶𝐶𝐶𝑘𝑘𝑘𝑘)𝑘𝑘𝑘𝑘=𝑛𝑛𝑛𝑛
𝑘𝑘𝑘𝑘=1+ ∈
𝐶𝐶𝐶𝐶𝐶𝐶𝐶𝐶𝐶𝐶𝐶𝐶𝐶𝐶𝐶𝐶𝐶𝐶𝐶𝐶𝑆𝑆𝑆𝑆𝑆𝑆𝑆𝑆𝑄𝑄𝑄𝑄_𝑓𝑓𝑓𝑓𝑓𝑓𝑓𝑓𝑓𝑓𝑓𝑓𝐶𝐶𝐶𝐶𝐶𝐶𝐶𝐶𝑙𝑙𝑙𝑙𝑗𝑗𝑗𝑗 is the share in a flyer in week t for each of the other categories l (l=1 to m,
with l≠i) within the same department j.
Second-stage estimations
To investigate the moderating impact of relatedness on these cross-sales effects of flyers, we
regress the coefficients of the cross-sales flyer effects extracted from the first-stage department-
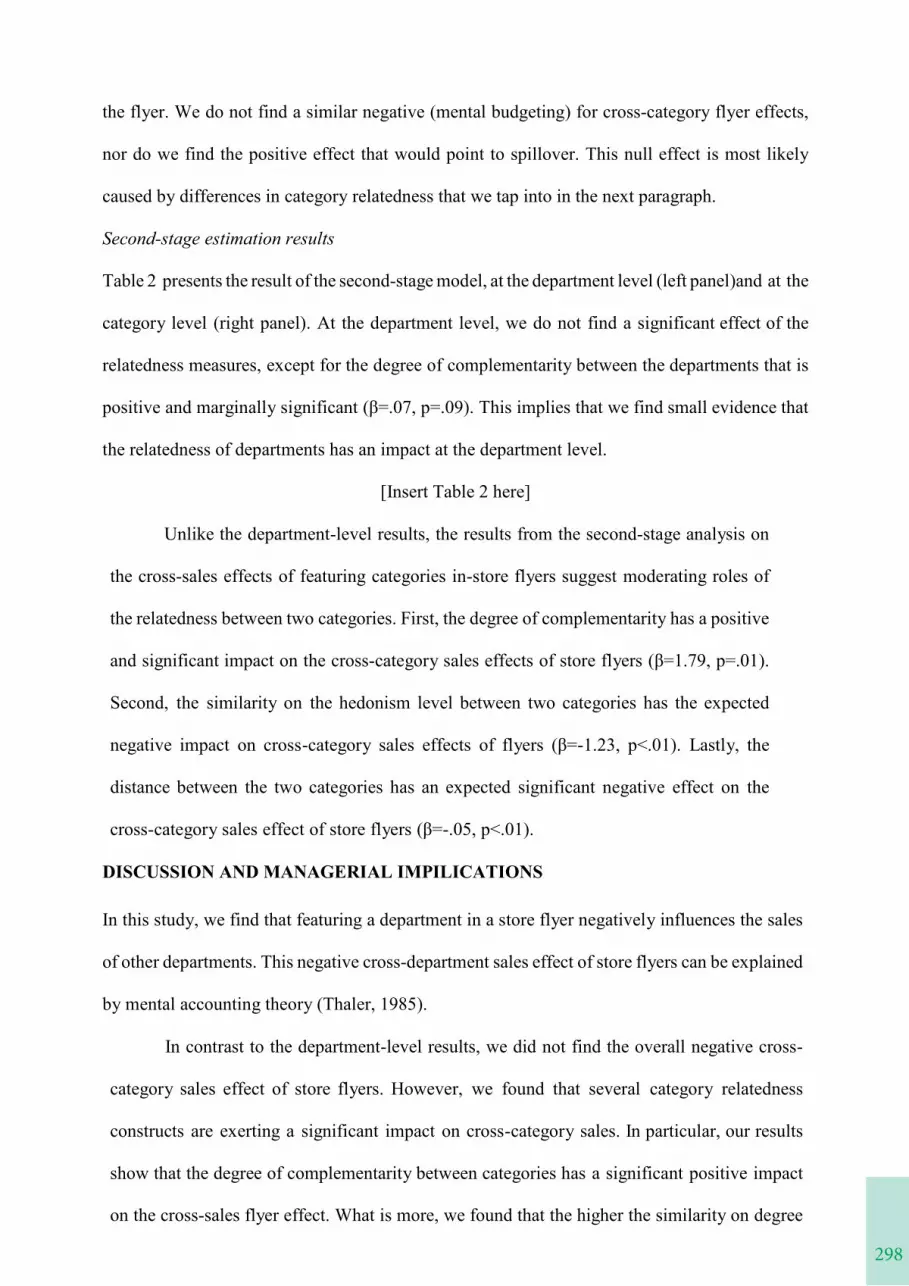
298
the flyer. We do not find a similar negative (mental budgeting) for cross-category flyer effects,
nor do we find the positive effect that would point to spillover. This null effect is most likely
caused by differences in category relatedness that we tap into in the next paragraph.
Second-stage estimation results
Table 2 presents the result of the second-stage model, at the department level (left panel)and at the
category level (right panel). At the department level, we do not find a significant effect of the
relatedness measures, except for the degree of complementarity between the departments that is
positive and marginally significant (β=.07, p=.09). This implies that we find small evidence that
the relatedness of departments has an impact at the department level.
[Insert Table 2 here]
Unlike the department-level results, the results from the second-stage analysis on
the cross-sales effects of featuring categories in-store flyers suggest moderating roles of
the relatedness between two categories. First, the degree of complementarity has a positive
and significant impact on the cross-category sales effects of store flyers (β=1.79, p=.01).
Second, the similarity on the hedonism level between two categories has the expected
negative impact on cross-category sales effects of flyers (β=-1.23, p<.01). Lastly, the
distance between the two categories has an expected significant negative effect on the
cross-category sales effect of store flyers (β=-.05, p<.01).
DISCUSSION AND MANAGERIAL IMPILICATIONS
In this study, we find that featuring a department in a store flyer negatively influences the sales
of other departments. This negative cross-department sales effect of store flyers can be explained
by mental accounting theory (Thaler, 1985).
In contrast to the department-level results, we did not find the overall negative cross-
category sales effect of store flyers. However, we found that several category relatedness
constructs are exerting a significant impact on cross-category sales. In particular, our results
show that the degree of complementarity between categories has a significant positive impact
on the cross-sales flyer effect. What is more, we found that the higher the similarity on degree
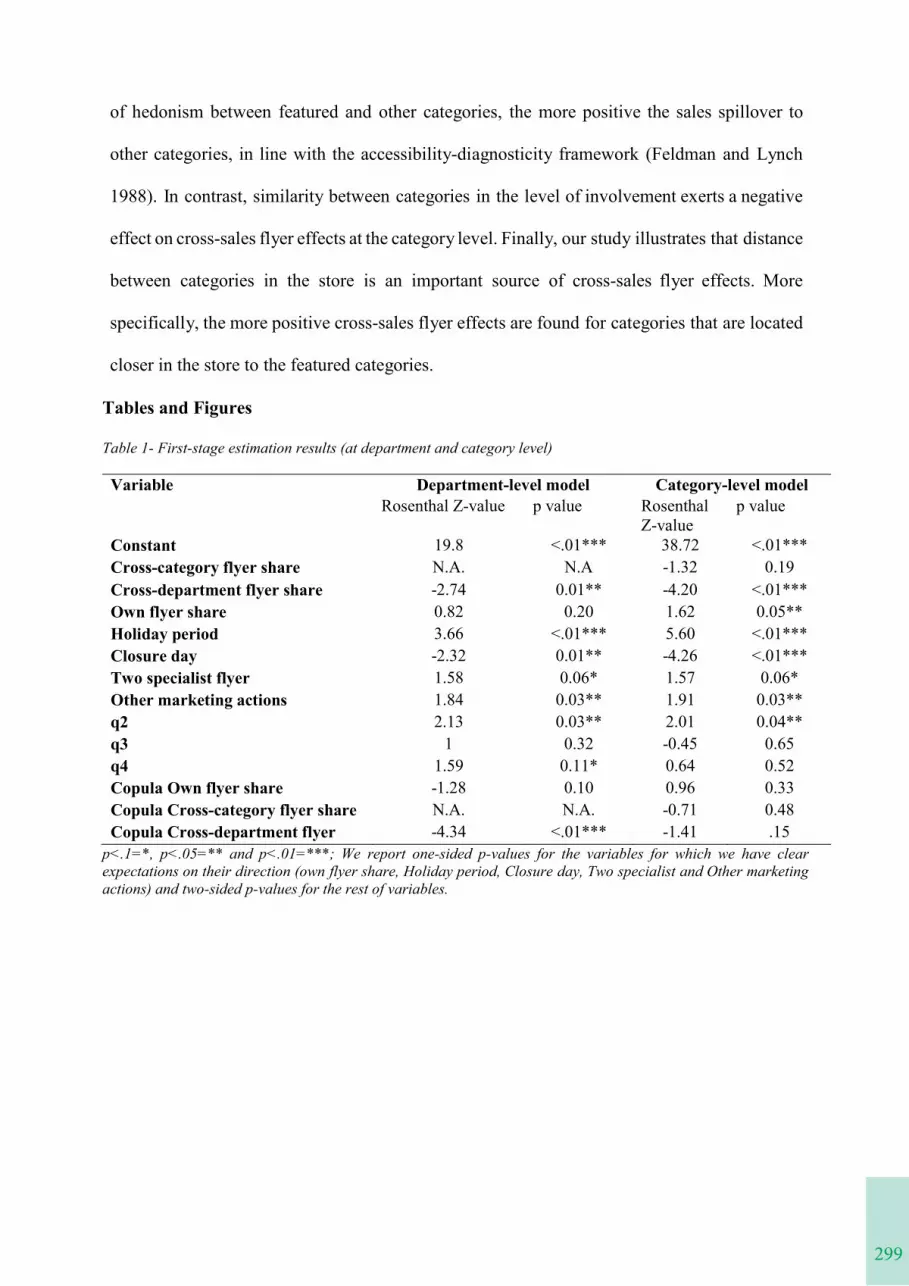
299
of hedonism between featured and other categories, the more positive the sales spillover to
other categories, in line with the accessibility-diagnosticity framework (Feldman and Lynch
1988). In contrast, similarity between categories in the level of involvement exerts a negative
effect on cross-sales flyer effects at the category level. Finally, our study illustrates that distance
between categories in the store is an important source of cross-sales flyer effects. More
specifically, the more positive cross-sales flyer effects are found for categories that are located
closer in the store to the featured categories.
Tables and Figures
Table 1- First-stage estimation results (at department and category level)
Variable Department-level model Category-level modelRosenthal Z-value p value Rosenthal
Z-valuep value
Constant 19.8 <.01*** 38.72 <.01***Cross-category flyer share N.A. N.A -1.32 0.19Cross-department flyer share -2.74 0.01** -4.20 <.01***Own flyer share 0.82 0.20 1.62 0.05**Holiday period 3.66 <.01*** 5.60 <.01***Closure day -2.32 0.01** -4.26 <.01***Two specialist flyer 1.58 0.06* 1.57 0.06*Other marketing actions 1.84 0.03** 1.91 0.03**q2 2.13 0.03** 2.01 0.04**q3 1 0.32 -0.45 0.65q4 1.59 0.11* 0.64 0.52Copula Own flyer share -1.28 0.10 0.96 0.33Copula Cross-category flyer share N.A. N.A. -0.71 0.48Copula Cross-department flyer -4.34 <.01*** -1.41 .15
p<.1=*, p<.05=** and p<.01=***; We report one-sided p-values for the variables for which we have clear expectations on their direction (own flyer share, Holiday period, Closure day, Two specialist and Other marketing actions) and two-sided p-values for the rest of variables.
the flyer. We do not find a similar negative (mental budgeting) for cross-category flyer effects,
nor do we find the positive effect that would point to spillover. This null effect is most likely
caused by differences in category relatedness that we tap into in the next paragraph.
Second-stage estimation results
Table 2 presents the result of the second-stage model, at the department level (left panel)and at the
category level (right panel). At the department level, we do not find a significant effect of the
relatedness measures, except for the degree of complementarity between the departments that is
positive and marginally significant (β=.07, p=.09). This implies that we find small evidence that
the relatedness of departments has an impact at the department level.
[Insert Table 2 here]
Unlike the department-level results, the results from the second-stage analysis on
the cross-sales effects of featuring categories in-store flyers suggest moderating roles of
the relatedness between two categories. First, the degree of complementarity has a positive
and significant impact on the cross-category sales effects of store flyers (β=1.79, p=.01).
Second, the similarity on the hedonism level between two categories has the expected
negative impact on cross-category sales effects of flyers (β=-1.23, p<.01). Lastly, the
distance between the two categories has an expected significant negative effect on the
cross-category sales effect of store flyers (β=-.05, p<.01).
DISCUSSION AND MANAGERIAL IMPILICATIONS
In this study, we find that featuring a department in a store flyer negatively influences the sales
of other departments. This negative cross-department sales effect of store flyers can be explained
by mental accounting theory (Thaler, 1985).
In contrast to the department-level results, we did not find the overall negative cross-
category sales effect of store flyers. However, we found that several category relatedness
constructs are exerting a significant impact on cross-category sales. In particular, our results
show that the degree of complementarity between categories has a significant positive impact
on the cross-sales flyer effect. What is more, we found that the higher the similarity on degree
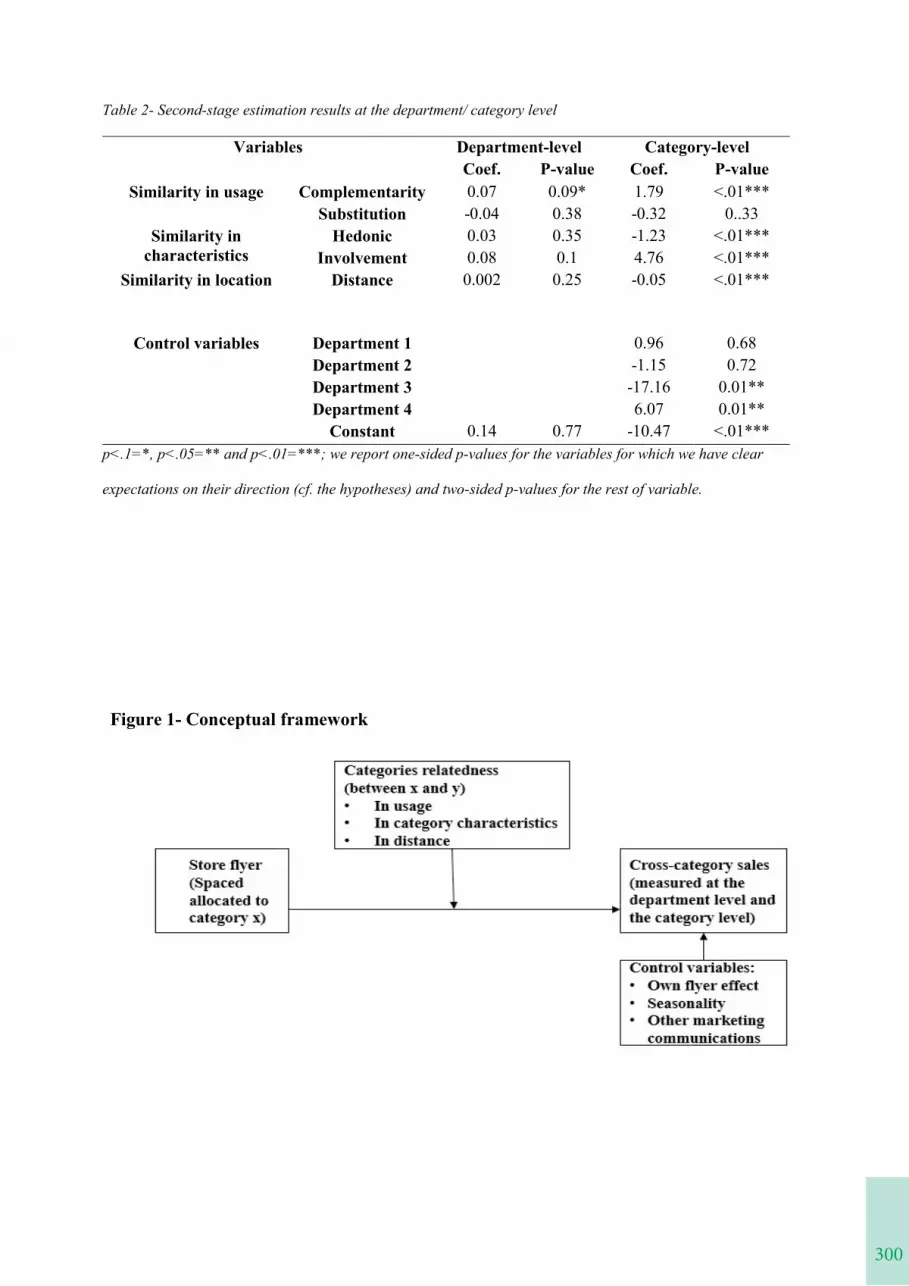
300
Table 2- Second-stage estimation results at the department/ category level
Variables Department-level Category-levelCoef. P-value Coef. P-value
Similarity in usage Complementarity 0.07 0.09* 1.79 <.01***Substitution -0.04 0.38 -0.32 0..33
Similarity in characteristics
Hedonic 0.03 0.35 -1.23 <.01***Involvement 0.08 0.1 4.76 <.01***
Similarity in location Distance 0.002 0.25 -0.05 <.01***
Control variables Department 1 0.96 0.68Department 2 -1.15 0.72Department 3 -17.16 0.01**Department 4 6.07 0.01**
Constant 0.14 0.77 -10.47 <.01***p<.1=*, p<.05=** and p<.01=***; we report one-sided p-values for the variables for which we have clear
expectations on their direction (cf. the hypotheses) and two-sided p-values for the rest of variable.
Figure 1- Conceptual framework
301
Comments of reviewers
- Reviewers´ 1 ratings and suggestions:(1.) The overall contribution of the paper to retail research: 5(2.) The readability of the manuscript: 1(3.) The review of the existing literature: 3(4.) The research method and discussion of results: 3(5.) The managerial/social implications: 3(6.) Decision: Rejected(7.) Suggestions: “The used two-stage model should be explained further. It should be clearlyand more accurately shown how the second-stage model is related to the first-stage model andin which case it is well-justified.More information on data collection method should be provided.How this study can be used by manager and its limits should be added.”
- Reviewers’ 2 ratings and suggestions:(1.) The overall contribution of the paper to retail research: 7(2.) The readability of the manuscript: 7(3.) The review of the existing literature: 6(4.) The research method and discussion of results: 7(5.) The managerial/social implications: 3(6.) Decision: Accepted(7.) Suggestions: “This paper covers a very interesting topic in a well-presented and easilyunderstandable manner. The quality of the methodology used and the presentation of the resultsare very high. The discussion could be substantially longer as the results offer potential forincluding specific recommendations for retailers. I still highly recommend the acceptance ofthis study.”
Table 2- Second-stage estimation results at the department/ category level
Variables Department-level Category-levelCoef. P-value Coef. P-value
Similarity in usage Complementarity 0.07 0.09* 1.79 <.01***Substitution -0.04 0.38 -0.32 0..33
Similarity incharacteristics
Hedonic 0.03 0.35 -1.23 <.01***Involvement 0.08 0.1 4.76 <.01***
Similarity in location Distance 0.002 0.25 -0.05 <.01***
Control variables Department 1 0.96 0.68Department 2 -1.15 0.72Department 3 -17.16 0.01**Department 4 6.07 0.01**
Constant 0.14 0.77 -10.47 <.01***p<.1=*, p<.05=** and p<.01=***; we report one-sided p-values for the variables for which we have clear
expectations on their direction (cf. the hypotheses) and two-sided p-values for the rest of variable.
Figure 1- Conceptual framework
302
REFRENCES
Aaker, D. A., & Keller, K. L. (1990). Consumer Evaluations of Brand Extensions. Journal of Marketing,54(1), 27.
Ataman, M. B., Van Heerde, H. J., & Mela, C. F. (2010). The Long-Term Effect of Marketing Strategyon Brand Sales. Journal of Marketing Research, 47(5), 866–882.
Blattberg, R. C., & Neslin, S. (1990). Sales Promotion: Concepts, Methods, and Strategies. PrenticeHall.
Bloovi. (2018). Onderzoek: Nog 9 op de 10 Belgen Lezen Reclamefolders. Retrieved from https://www.bloovi.be/artikels/marketing/2018/onderzoek-nog-9-op-de-10-belgen-lezen-reclamefolders
Datta, H., Ailawadi, K. L., & Van Heerde, H. J. (2017). How Well Does Consumer-Based Brand EquityAlign with Sales-Based Brand Equity and Marketing-Mix Response? Journal of Marketing, 81(3),1–20.
Gázquez-Abad, J. C., & Martínez-López, F. J. (2016). Understanding the Impact of Store Flyers on Purchase Behaviour: An Empirical Analysis in the Context of Spanish Households. Journal of Retailing and Consumer Services, 28(2), 263–273.
Gielens, K. (2012). New Products: The Antidote to Private Label Growth? Journal of MarketingResearch, 49(3), 408–423.
Gijsbrechts, E., Campo, K., & Goossens, T. (2003). The Impact of Store Flyers on Store Traffic andStore sales: A Geo-marketing Approach. Journal of Retailing, 79(1), 1–16.
Keller, K. L. (1987). Memory Factors in Advertising: The Effect of Advertising Retrieval Cues onBrand Evaluations. Journal of Consumer Research, 14(3), 316.
Kushwaha, T., & Shankar, V. (2013). Are Multichannel Customers Really More Valuable? TheModerating Role of Rroduct Category Characteristics. Journal of Marketing, 77(4), 67–85.
Leeflang, P. S. H., & Parreño-Selva, J. (2012). Cross-Category Demand Effects of Erice Promotions.Journal of the Academy of Marketing Science, 40(4), 572–586.
Lei, J., Dawar, N., & Lemmink, J. (2008). Negative Spillover in Brand Portfolios: Exploring theAntecedents of Asymmetric Effects. Journal of Marketing, 72(3), 111–123.
Lewis, J. B., & Linzer, D. A. (2005). Estimating Regression Models in Which the Dependent Variableis Based on Estimates. Political Analysis, 13(4), 345–364.
Pieters, R., Wedel, M., & Zhang, J. (2007). Optimal Feature Advertising Design under CompetitiveClutter. Management Science, 53(11), 1815–1828.
Roehm, M. L., & Tybout, A. M. (2006). When Will a Brand Scandal Spillover, and How ShouldCompetitors Respond? Journal of Marketing Research, 43(3), 366–373.
Sahni, N. S. (2016). Advertising Spillovers: Evidence from Online Field Experiments and Implications for Returns on Advertising. Journal of Marketing Research, 53(4), 459–478.
Thaler, R. (1985). Mental Accounting and Consumer Choice. Marketing Science, 4(3), 199–214.
Zhao, J., Zhou, Y., & Wahab, M. I. M. (2016). Joint Optimization Models for Shelf Display andInventory Control Considering the Impact of Spatial Relationship on Demand. European Journalof Operational Research, 255(3), 797–808.
Ziliani, C., & Ieva, M. (2015). Retail Shopper Marketing: The Future of Promotional Flyers.International Journal of Retail and Distribution Management, 43(6), 488–502.
303
“CREATIVE CONCEPT OR WATERED‐DOWN VERSION? FACTORS THAT INFLUENCE HOW NEW STORE FORMATS CONTRIBUTE TO A RETAIL PORTFOLIO”
Steve Burt (University of Stirling)Carys Egan-Wyer (Lund School of Economics and Management)Jens Hultman (Kristianstad University)Ulf Johansson, Alice Beckman, and Clara Michelsen (Lund School of Economics and Management)
The purpose of this paper is identify factors that influence how a concept store format contributes to a retail portfolio from a customer experience standpoint. Our case study is exploratory in nature, meaning that we aim to open discussions about new store formats and to make tentative suggestions for future, more conclusive, research. With this in mind, we focus on qualitatively reconnoitring the development of new format, city-centre stores from multiple perspectives: that of customers, industry experts and managers.
Our three-perspective approach allows us to highlight the contributions of the concept store to the retail portfolio: improved customer experience, market penetration, learnings, revived corporate image, and positive (as well as negative) financial outcomes.
We pinpoint influential factors that can help retailers to determine how a concept store will contribute to a retail portfolio. In contrast to previous research, which suggests that format diversification results in reduced competitiveness, our findings indicate that diversification might allow retailers to maintain competitiveness as well as attracting latent customers.
Our findings are intended to stimulate academic discussions about measuring the success of a diversified retail portfolio as well as providing retailers with some initial knowledge and tools with which to do so.
REFRENCES
Aaker, D. A., & Keller, K. L. (1990). Consumer Evaluations of Brand Extensions. Journal of Marketing,54(1), 27.
Ataman, M. B., Van Heerde, H. J., & Mela, C. F. (2010). The Long-Term Effect of Marketing Strategyon Brand Sales. Journal of Marketing Research, 47(5), 866–882.
Blattberg, R. C., & Neslin, S. (1990). Sales Promotion: Concepts, Methods, and Strategies. PrenticeHall.
Bloovi. (2018). Onderzoek: Nog 9 op de 10 Belgen Lezen Reclamefolders. Retrieved from https://www.bloovi.be/artikels/marketing/2018/onderzoek-nog-9-op-de-10-belgen-lezen-reclamefolders
Datta, H., Ailawadi, K. L., & Van Heerde, H. J. (2017). How Well Does Consumer-Based Brand EquityAlign with Sales-Based Brand Equity and Marketing-Mix Response? Journal of Marketing, 81(3),1–20.
Gázquez-Abad, J. C., & Martínez-López, F. J. (2016). Understanding the Impact of Store Flyers on Purchase Behaviour: An Empirical Analysis in the Context of Spanish Households. Journal ofRetailing and Consumer Services, 28(2), 263–273.
Gielens, K. (2012). New Products: The Antidote to Private Label Growth? Journal of MarketingResearch, 49(3), 408–423.
Gijsbrechts, E., Campo, K., & Goossens, T. (2003). The Impact of Store Flyers on Store Traffic andStore sales: A Geo-marketing Approach. Journal of Retailing, 79(1), 1–16.
Keller, K. L. (1987). Memory Factors in Advertising: The Effect of Advertising Retrieval Cues onBrand Evaluations. Journal of Consumer Research, 14(3), 316.
Kushwaha, T., & Shankar, V. (2013). Are Multichannel Customers Really More Valuable? TheModerating Role of Rroduct Category Characteristics. Journal of Marketing, 77(4), 67–85.
Leeflang, P. S. H., & Parreño-Selva, J. (2012). Cross-Category Demand Effects of Erice Promotions.Journal of the Academy of Marketing Science, 40(4), 572–586.
Lei, J., Dawar, N., & Lemmink, J. (2008). Negative Spillover in Brand Portfolios: Exploring theAntecedents of Asymmetric Effects. Journal of Marketing, 72(3), 111–123.
Lewis, J. B., & Linzer, D. A. (2005). Estimating Regression Models in Which the Dependent Variableis Based on Estimates. Political Analysis, 13(4), 345–364.
Pieters, R., Wedel, M., & Zhang, J. (2007). Optimal Feature Advertising Design under CompetitiveClutter. Management Science, 53(11), 1815–1828.
Roehm, M. L., & Tybout, A. M. (2006). When Will a Brand Scandal Spillover, and How ShouldCompetitors Respond? Journal of Marketing Research, 43(3), 366–373.
Sahni, N. S. (2016). Advertising Spillovers: Evidence from Online Field Experiments and Implicationsfor Returns on Advertising. Journal of Marketing Research, 53(4), 459–478.
Thaler, R. (1985). Mental Accounting and Consumer Choice. Marketing Science, 4(3), 199–214.
Zhao, J., Zhou, Y., & Wahab, M. I. M. (2016). Joint Optimization Models for Shelf Display andInventory Control Considering the Impact of Spatial Relationship on Demand. European Journalof Operational Research, 255(3), 797–808.
Ziliani, C., & Ieva, M. (2015). Retail Shopper Marketing: The Future of Promotional Flyers.International Journal of Retail and Distribution Management, 43(6), 488–502.
304
“CUSTOMERS FIRST, ARE YOU KIDDING ?”
Fabien Eymas, Faouzi Bensebaa (Université Paris 8)
Purpose – Despite the critical role acknowledged to small independent retailers (SIR) in the revitalisation of city centres, a few studies were conducted better to understand their competitive strategies. Besides, researches on the topic are either normative - saying rather what should be done than focusing on what is actually done – or quite old. Thus, specifically, the purpose of this paper is to examine empirically SIRs’ competitive behaviour.
Design/methodology/approach – This study is based on the interpretative phenomenological analysis (IPA) of the transcriptions of the semi-structured interviews of SIRs’ executives.
Findings – Despite being usually considered as key to success, customer orientation appears to be a simple option. SIRs can focus their attention on other elements when it comes to design and implement their competitive strategies. Five types of SIRs then emerged from the study.
Practical implications – The typology should be a useful tool for SIRs interested in competitive strategies and for municipalities looking for new insights to succeed in the revitalisation of their city centre.
Social implications – Revitalisation of city centres is a big challenge for many Western cities, especially small and middle-size ones.
Originality/value – To the best of our knowledge, the typology that comes from this study seems to be the very first one on SIRs. Theoretically, it may help organising researches on SIRs’ competitive behaviour. Pragmatically, it allows better to understand SIRs’ competitive strategies.
Keywords – Competitive behaviour, competitive strategy, customer orientation, interpretative phenomenological analysis, small independent retailer.
Paper type – Research paper
305
1
SUSTAINABILITY, INNOVATION AND SATISFACTION: THE MODERATING EFFECT OF GENDER IN RETAILING
ANTONIO MARÍN GARCÍA¹
IRENE GIL-SAURA¹
MARIA EUGENIA RUIZ-MOLINA¹
¹ Facultat d’Economia, Universitat de València
IntroductionAlthough traditionally the empirical and conceptual evidence has pointed out the existence of differences in the use of ICT, especially the Internet, between men and women in retailing (Meuter et al., 2005; Weijters et al., 2007), more recent studies provide results in the opposite direction (Contreras et al., 2016; Torres and Arroyo-Cañada, 2016). These new contributions argue that in retailing, there are no significant differences regarding gender, neither in the use of ICT or in the perception of the innovations introduced by retailers. Moreover, as far as sustainability is concerned, the studies that have tackled with differences between men and women, have not obtained concluding results. Whereas some researchers conclude the existence of a moderating effect of gender in the perception that customers have regarding the sustainable practices implemented by stores (Das, 2014; Walsh et al., 2017), others do not find such effect (Calabrese et al., 2016; Kassinis et al., 2016).
In addition to this, the literature highlights that innovation and sustainability emerge as two key elements in the development of competitive advantages for the organisations (Gonzalez-Lafaysse and Lapassouse-Madrid, 2016; Marcon et al., 2017; Marín and Gil- Saura, 2017; Ruiz-Molina et al., 2017; Marín et al., 2019a; Marín et al., 2019b). In particular, it has been pointed out that innovation, from the perspective of the consumer, can be built through product innovation, marketing innovation and relational innovation (Lin, 2015); however, few studies tackle with innovation in retailing under a multidimensional approach. As far as sustainability is concerned, it is commonly understood under the Triple Bottom Line perspective (Elkington, 2004), and its study in marketing, and more specifically in retailing, poses important challenges (Marín et al., 2019a), thus representing an opportunity for further research.
Purpose*Based on the foregoing, in the context of grocery retailing, this study progresses in the analysis of the effects of innovation and sustainability on customer satisfaction, and aims at examining the existence of significant differences between men and women in such relations.
Conceptual frameworkThe current literature in retailing shows that innovation and sustainability are postulated as variables that can facilitate the development of competitive advantages for organizations (Marín et al., 2019a; Marín et al., 2019b). One of the main reasons for economic growth in retailing is the implementation of innovative practices by organizations (Lin, 2015), which
“CUSTOMERS FIRST, ARE YOU KIDDING ?”
Purpose – Despite the critical role acknowledged to small independent retailers (SIR) in the revitalisation of city centres, a few studies were conducted better to understand their competitive strategies. Besides, researches on the topic are either normative - saying rather what should be done than focusing on what is actually done – or quite old. Thus, specifically, the purpose of this paper is to examine empirically SIRs’ competitive behaviour.
Design/methodology/approach – This study is based on the interpretative phenomenological analysis (IPA) of the transcriptions of the semi-structured interviews of SIRs’ executives.
Findings – Despite being usually considered as key to success, customer orientation appears to be a simple option. SIRs can focus their attention on other elements when it comes to design and implement their competitive strategies. Five types of SIRs then emerged from the study.
Practical implications – The typology should be a useful tool for SIRs interested in competitive strategies and for municipalities looking for new insights to succeed in the revitalisation of their city centre.
Social implications – Revitalisation of city centres is a big challenge for many Western cities, especially small and middle-size ones.
Originality/value – To the best of our knowledge, the typology that comes from this study seems to be the very first one on SIRs. Theoretically, it may help organising researches on SIRs’ competitive behaviour. Pragmatically, it allows better to understand SIRs’ competitive strategies.
Keywords – Competitive behaviour, competitive strategy, customer orientation, interpretative phenomenological analysis, small independent retailer.
Paper type – Research paper
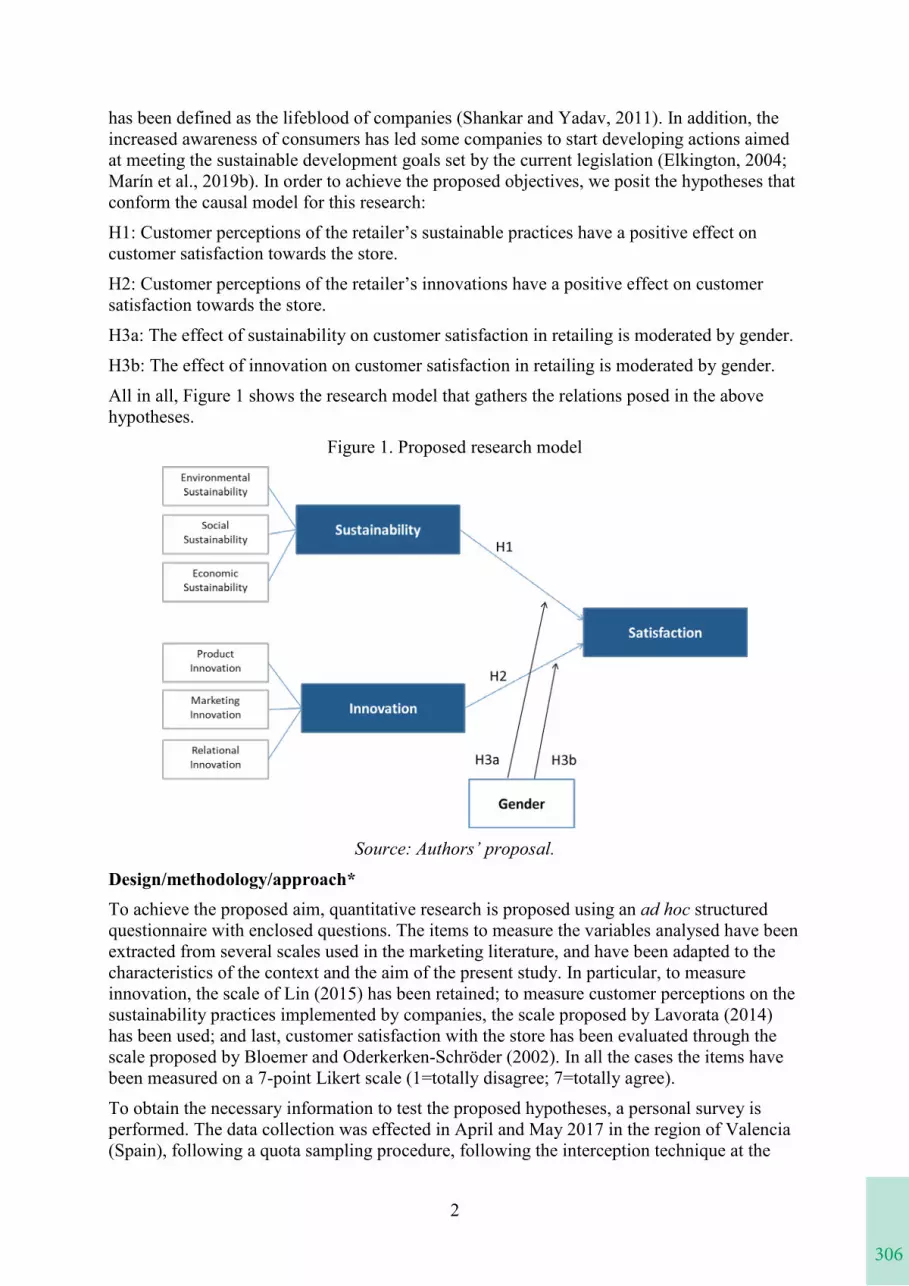
306
2
has been defined as the lifeblood of companies (Shankar and Yadav, 2011). In addition, the increased awareness of consumers has led some companies to start developing actions aimed at meeting the sustainable development goals set by the current legislation (Elkington, 2004; Marín et al., 2019b). In order to achieve the proposed objectives, we posit the hypotheses that conform the causal model for this research:
H1: Customer perceptions of the retailer’s sustainable practices have a positive effect on customer satisfaction towards the store.
H2: Customer perceptions of the retailer’s innovations have a positive effect on customer satisfaction towards the store.
H3a: The effect of sustainability on customer satisfaction in retailing is moderated by gender.
H3b: The effect of innovation on customer satisfaction in retailing is moderated by gender.
All in all, Figure 1 shows the research model that gathers the relations posed in the abovehypotheses.
Figure 1. Proposed research model
Source: Authors’ proposal.
Design/methodology/approach*To achieve the proposed aim, quantitative research is proposed using an ad hoc structured questionnaire with enclosed questions. The items to measure the variables analysed have been extracted from several scales used in the marketing literature, and have been adapted to the characteristics of the context and the aim of the present study. In particular, to measure innovation, the scale of Lin (2015) has been retained; to measure customer perceptions on the sustainability practices implemented by companies, the scale proposed by Lavorata (2014)has been used; and last, customer satisfaction with the store has been evaluated through the scale proposed by Bloemer and Oderkerken-Schröder (2002). In all the cases the items have been measured on a 7-point Likert scale (1=totally disagree; 7=totally agree).
To obtain the necessary information to test the proposed hypotheses, a personal survey is performed. The data collection was effected in April and May 2017 in the region of Valencia(Spain), following a quota sampling procedure, following the interception technique at the
307
3
store exit. Five grocery retailers were selected according to their wide assortment and their positioning in the Spanish market in three commercial formats (hypermarket, supermarket and discount store). 510 valid questionnaires were collected, of which 59.6% correspond to women and 40.4% to men.
The data analysis was conducted in two phases. Firstly, the measurement instrument was validated; and secondly, the structural equation model was estimated. Both analyses were performed using the Partial Least Squares (PLS) technique. Some authors (e.g. Fornell and Bookstein, 1982) point out that the use of the PLS avoids, on the one hand, inadmissible solutions such as negative estimates of the variance of the indicators and standardized loads greater than 1; and, on the other hand, the indeterminacy of factors thanks to the fact that the PLS explicitly defines the latent variables, making it easier to have the scores of the latent variables or factors.
Findings*The results obtained in this research reveal important findings. Firstly, the evidence obtained allows to conclude that, in retailing, innovation and sustainability are two multidimensional constructs that can be conceptualized as second-order constructs. In particular, innovation is built from three factors: product innovation, marketing innovation and relational innovation,thus confirming the results obtained by previous works such as the one of Lin (2015). As far as sustainability in retailing is concerned, it is aligned with the basic principles of the Triple Bottom Line model, being composed by the economic, environmental and social dimensions.
Second, we confirm that the R² values of the dependent constructs on the structural model includes are higher than 0.1, the minimum threshold established by Falk and Miller (1992). In this sense, it is observed that satisfaction presents an R² value of 0.411.
Thirdly, the results of the present study reflect the importance of sustainability and innovation as master pillars in retailing, given their positive impact on the level of customer satisfaction (β1=0.405, p < 0.01, H1; β2=0.341, p < 0.01, H2). In this sense, these findings allow to progress in the knowledge about these variables, and invite to go further of customer satisfaction toobserve their bonds with other outcome variables such as retail equity (Marín et al., 2019a), trust and/or eWOM (Bhat et al., 2020).
Furthermore, in grocery retailing, we do not observe significant differences because of gender in the effects on the satisfaction explained by the intensity of the retailer’s innovative practices and by his actions to promote sustainability. These results are aligned with recent studies that conclude the non-existence of differences between men and women regarding the use of ICT tools (Gil-Saura et al., 2009), the use of Internet (Torres and Arroyo-Cañada, 2016), the perception of retailer’s innovations (Contreras et al., 2016) and/or the implementation of sustainable practices (Calabrese et al., 2016; Kassinis et al., 2016), in contrast to those works that found differences across gender (Meuter et al., 2005).
Original/value*The present study concludes that the effects of sustainability and innovation on customer satisfaction do not differ by gender, and consequently, satisfaction of both male and female consumers towards the store is explained by innovation (that is built, in turn, by product innovation, marketing innovation, and relational innovation) and sustainability (in theireconomic, environmental and social dimensions). Although both factors are important in generating customer satisfaction, the results obtained allow to conclude that in grocery retailing, the effect of sustainability is more relevant than the effect of innovation.
Practical implications
2
has been defined as the lifeblood of companies (Shankar and Yadav, 2011). In addition, the increased awareness of consumers has led some companies to start developing actions aimed at meeting the sustainable development goals set by the current legislation (Elkington, 2004; Marín et al., 2019b). In order to achieve the proposed objectives, we posit the hypotheses that conform the causal model for this research:
H1: Customer perceptions of the retailer’s sustainable practices have a positive effect on customer satisfaction towards the store.
H2: Customer perceptions of the retailer’s innovations have a positive effect on customer satisfaction towards the store.
H3a: The effect of sustainability on customer satisfaction in retailing is moderated by gender.
H3b: The effect of innovation on customer satisfaction in retailing is moderated by gender.
All in all, Figure 1 shows the research model that gathers the relations posed in the abovehypotheses.
Figure 1. Proposed research model
Source: Authors’ proposal.
Design/methodology/approach*To achieve the proposed aim, quantitative research is proposed using an ad hoc structured questionnaire with enclosed questions. The items to measure the variables analysed have been extracted from several scales used in the marketing literature, and have been adapted to the characteristics of the context and the aim of the present study. In particular, to measure innovation, the scale of Lin (2015) has been retained; to measure customer perceptions on the sustainability practices implemented by companies, the scale proposed by Lavorata (2014)has been used; and last, customer satisfaction with the store has been evaluated through the scale proposed by Bloemer and Oderkerken-Schröder (2002). In all the cases the items have been measured on a 7-point Likert scale (1=totally disagree; 7=totally agree).
To obtain the necessary information to test the proposed hypotheses, a personal survey is performed. The data collection was effected in April and May 2017 in the region of Valencia(Spain), following a quota sampling procedure, following the interception technique at the
308
4
The findings of the present study allow to conclude the need to implement innovative actions and sustainable practices with the main purpose to build satisfaction in consumers, both men and women, in grocery retailing. In this sense, concerning innovation, some of the practices that may be developed in retailing should be addressed to generate new products, deliveradditional innovative services, introduce changes in the store decoration or develop newpromotions. In this way, retailers may consider a narrower collaboration with their customers by means of programs such as tester-customer already developed by some store chains, or other participation/co-creation programs, meetings with customers, and online forum, among others. Regarding sustainability, it would be important that grocery store managers promote the introduction of ecological and fair trade products in the store assortment, the participation of the company in humanitarian actions, the use of the public transport by employees, the reduction of energy consumption, product recycling or the elimination of plastic packaging of of some products and/or the replacement by biodegradable materials. Currently, there are movements such as “Fridays for future” that try to make society aware of the importance of acting against climate change and global warming. Movements like this support responsible consumption by consumers, as well as the development of a sustainable productive activity by companies, causing the least possible harm to society and the environment. Furthermore, as a consequence of the COVID19 crisis, many retail establishments will be forced to make decisions, probably innovative, to adapt their businesses to this new reality.
In this way, it seems evident that, operating on the innovation dimensions (product, marketing and relational innovation) and the sustainability dimensions (environmental, social and economic sustainability), consumers will be more satisfied with the retailer.
Research limitations and outlookThe results obtained in this work allow to infer opportunities for further research in marketing. In this sense, we consider that it is necessary to extend the model proposed to include other variables that may act as antecedents or as consequents, thus improving the explanatory capacity of the model. Retail equity, loyalty or commitment may be variables to be taken into account to gain insight into the mechanisms through which innovation and sustainability generate bonds between customers and retailers. Similarly, other moderating variables may be analyzed, e.g. customer age, occupation, or behavioural variables (purchasefrequency) that may contribute to explain how the effects of innovation and sustainability are intensified in the development of satisfaction.
References*Bhat, S. A., Darzi, M. A., & Bhat, S. U. (2020). Sustainable Business Model in B2C Online Retailing: An Indian Consumer Perspective. In Technological Innovations for Sustainability and Business Growth (pp. 147-185). IGI Global.
Calabrese, A., Costa, R., & Rosati, F. (2016), “Gender differences in customer expectations and perceptions of corporate social responsibility”, Journal of Cleaner Production, Vol. 116,pp. 135–149.
Contreras, R. A. O., Valencia, N. E. R., & Toraño, M. J. C. (2016), “Innovación de productos: acercamiento al fenómeno desde una perspectiva internacional y de género”, Red Internacional de Investigadores en Competitividad, Vol. 9, No. 1, pp1236-1252.
Das, G. (2014), “Impacts of retail brand personality and self-congruity on store loyalty: The moderating role of gender”, Journal of Retailing and Consumer services, Vol. 21, No. 2, pp.130-138.
309
5
Elkington, J. (2004). Enter the triple bottom line. In Henriques, A. and Richardson, J. (Ed.), The triple bottom line: Does it all add up?’Assessing the sustainability of CSR (pp. 1-16). Earthscan Publications: London.
Falk, R. F., & Miller, N. B. (1992). A primer for soft modeling. University of Akron Press: Ohio.
Fornell, C., & Bookstein, F. L. (1982), “Two structural equation models: LISREL and PLS applied to consumer exit-voice theory”, Journal of Marketing Research, pp. 440-452.
Gil-Saura, I., Ruiz-Molina, M. E., & Calderón-García, H. (2009), “La influencia de las TIC en la satisfacción del cliente en el comercio minorista”, Cuadernos de Administración, Vol. 22,No. 39, pp. 59-73.
González-Lafaysse, L., & Lapassouse-Madrid, C. (2016), “Facebook and sustainable development: a case study of a French supermarket chain”, International Journal of Retail & Distribution Management, Vol. 44 No. 5, pp. 560-582.
Kassinis, G., Panayiotou, A., Dimou, A., & Katsifaraki, G. (2016). “Gender and environmental sustainability: A longitudinal analysis”, Corporate Social Responsibility and Environmental Management, Vol. 23, No. 6, pp. 399-412.
Lin, C. (2015), “Conceptualizing and measuring consumer perceptions of retailer innovativeness in Taiwan”, Journal of Retailing and Consumer Services, Vol. 24, pp. 33-41.
Lavorata, L. (2014), “Influence of retailers’ commitment to sustainable development on store image, consumer loyalty and consumer boycotts: Proposal for a model using the theory of planned behaviour”, Journal of Retailing and Consumer Services, Vol. 21 Np. 6, pp. 1021-1027.
Marcon, A., de Medeiros, J. F., & Ribeiro, J. L. D. (2017), “Innovation and environmentally sustainable economy: Identifying the best practices developed by multinationals in Brazil”, Journal of Cleaner Production, Vol. 160, pp. 83-97.
Marin Garcia, A., & Gil-Saura, I. (2017), “Innovation in retail: influence of ICT and its impact on customer satisfaction”, Cuadernos de Gestión, Vol. 17, No. 2, pp. 109-133.
Marín-García, A., Gil-Saura, I. and Ruíz-Molina, M. (2019a), "How do innovation and sustainability contribute to generate retail equity? Evidence from Spanish retailing", Journal of Product & Brand Management, Vol. ahead-of-print No. ahead-of-print. https://doi.org/10.1108/JPBM-12-2018-2173
Marín-García, A., Gil-Saura, I. and Ruíz-Molina, M. (2019b). “Influencia del formato comercial en la sostenibilidad en el comercio minorista de alimentación en España”, UCJC Business and Society Review, 2019, Vol. 16, No 4, pp. 132-173.Meuter, M. L., Bitner, M. J. Ostrom, A. L. and Brown, S. W. (2005), “Choosing among alternative service delivery modes: An investigation of customer trial of self-service technologies”, Journal of Marketing, Vol. 69, No. 2, pp. 61-83.
Ruiz-Molina, M. E., Gil-Saura, I., & Servera-Francés, D. (2017), “Innovation as a key to strengthen the effect of relationship benefits on loyalty in retailing”, Journal of Services Marketing, Vol. 31 No. 2, pp. 131-141
Torres, J. A. S., & Arroyo-Cañada, F. J. (2016), “Diferencias de la adopción del comercio electrónico entre países”, Suma de negocios, Vol. 7, No. 16, pp. 141-150.
Shankar, V., & Yadav, M. S. (2011), “Innovations in retailing”, Journal of Retailing, 87, S1-S2.
4
The findings of the present study allow to conclude the need to implement innovative actions and sustainable practices with the main purpose to build satisfaction in consumers, both men and women, in grocery retailing. In this sense, concerning innovation, some of the practices that may be developed in retailing should be addressed to generate new products, deliveradditional innovative services, introduce changes in the store decoration or develop newpromotions. In this way, retailers may consider a narrower collaboration with their customers by means of programs such as tester-customer already developed by some store chains, or other participation/co-creation programs, meetings with customers, and online forum, among others. Regarding sustainability, it would be important that grocery store managers promote the introduction of ecological and fair trade products in the store assortment, the participation of the company in humanitarian actions, the use of the public transport by employees, the reduction of energy consumption, product recycling or the elimination of plastic packaging of of some products and/or the replacement by biodegradable materials. Currently, there are movements such as “Fridays for future” that try to make society aware of the importance of acting against climate change and global warming. Movements like this support responsible consumption by consumers, as well as the development of a sustainable productive activity by companies, causing the least possible harm to society and the environment. Furthermore, as a consequence of the COVID19 crisis, many retail establishments will be forced to make decisions, probably innovative, to adapt their businesses to this new reality.
In this way, it seems evident that, operating on the innovation dimensions (product, marketing and relational innovation) and the sustainability dimensions (environmental, social and economic sustainability), consumers will be more satisfied with the retailer.
Research limitations and outlookThe results obtained in this work allow to infer opportunities for further research in marketing. In this sense, we consider that it is necessary to extend the model proposed to include other variables that may act as antecedents or as consequents, thus improving the explanatory capacity of the model. Retail equity, loyalty or commitment may be variables to be taken into account to gain insight into the mechanisms through which innovation and sustainability generate bonds between customers and retailers. Similarly, other moderating variables may be analyzed, e.g. customer age, occupation, or behavioural variables (purchasefrequency) that may contribute to explain how the effects of innovation and sustainability are intensified in the development of satisfaction.
References*Bhat, S. A., Darzi, M. A., & Bhat, S. U. (2020). Sustainable Business Model in B2C Online Retailing: An Indian Consumer Perspective. In Technological Innovations for Sustainability and Business Growth (pp. 147-185). IGI Global.
Calabrese, A., Costa, R., & Rosati, F. (2016), “Gender differences in customer expectations and perceptions of corporate social responsibility”, Journal of Cleaner Production, Vol. 116,pp. 135–149.
Contreras, R. A. O., Valencia, N. E. R., & Toraño, M. J. C. (2016), “Innovación de productos: acercamiento al fenómeno desde una perspectiva internacional y de género”, Red Internacional de Investigadores en Competitividad, Vol. 9, No. 1, pp1236-1252.
Das, G. (2014), “Impacts of retail brand personality and self-congruity on store loyalty: The moderating role of gender”, Journal of Retailing and Consumer services, Vol. 21, No. 2, pp.130-138.

310
6
Walsh, G., Schaarschmidt, M. and Ivens, S. (2017), "Effects of customer-based corporate reputation on perceived risk and relational outcomes: empirical evidence from gender moderation in fashion retailing", Journal of Product & Brand Management, Vol. 26 No. 3, pp. 227-238.
Weijters, B., Rangarajan, D., Falk, T. and Schillewaert, N. (2007), “Determinants and outcomes of customers’ use of self-service technology in a retail setting”, Journal of Service Research, Vol. 10, No. 1, pp. 3-2.
AppendixKeywords*Sustainability, innovation, satisfaction, gender, retailing
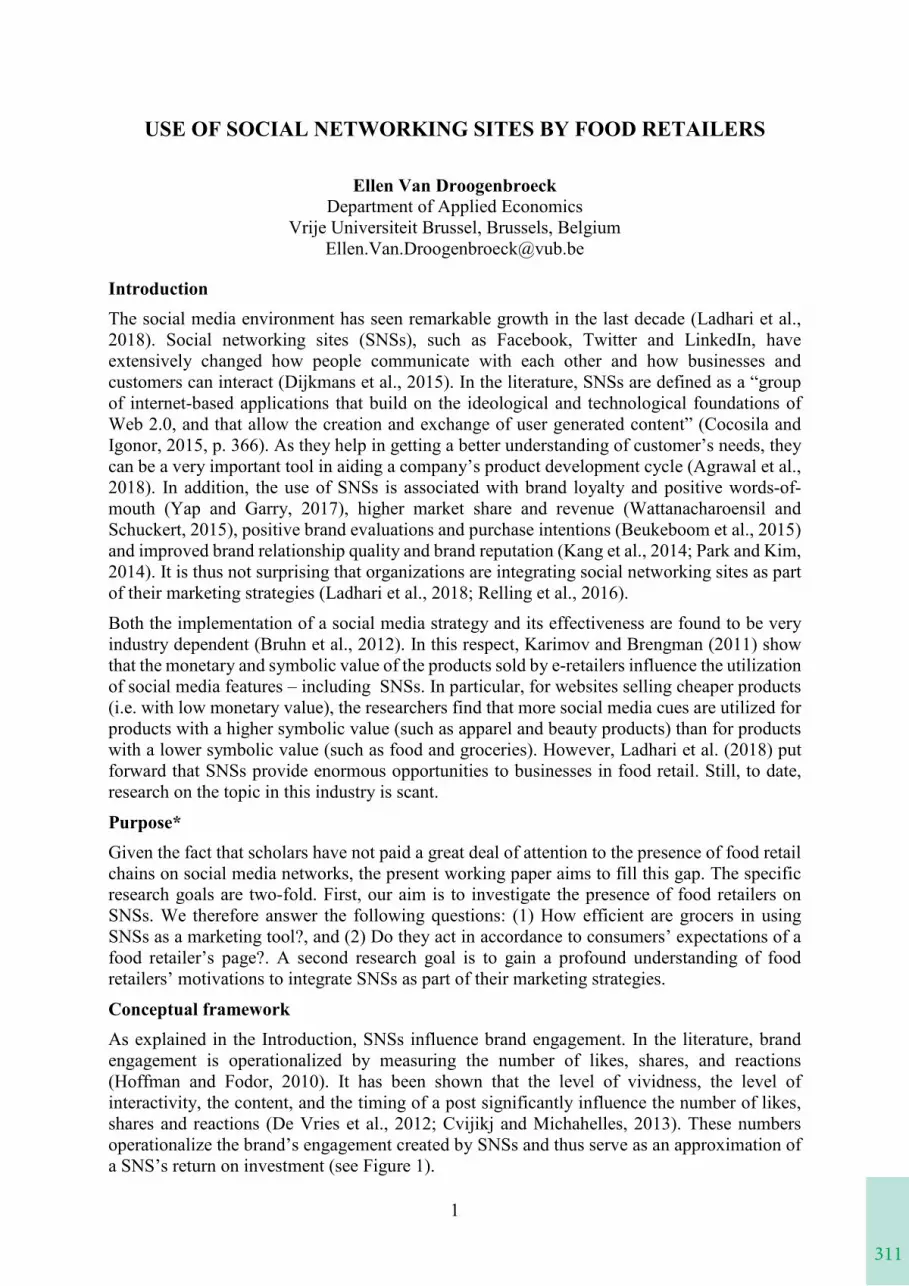
311
1
USE OF SOCIAL NETWORKING SITES BY FOOD RETAILERS
Ellen Van DroogenbroeckDepartment of Applied Economics
Vrije Universiteit Brussel, Brussels, [email protected]
IntroductionThe social media environment has seen remarkable growth in the last decade (Ladhari et al., 2018). Social networking sites (SNSs), such as Facebook, Twitter and LinkedIn, have extensively changed how people communicate with each other and how businesses and customers can interact (Dijkmans et al., 2015). In the literature, SNSs are defined as a “group of internet-based applications that build on the ideological and technological foundations of Web 2.0, and that allow the creation and exchange of user generated content” (Cocosila andIgonor, 2015, p. 366). As they help in getting a better understanding of customer’s needs, they can be a very important tool in aiding a company’s product development cycle (Agrawal et al., 2018). In addition, the use of SNSs is associated with brand loyalty and positive words-of-mouth (Yap and Garry, 2017), higher market share and revenue (Wattanacharoensil andSchuckert, 2015), positive brand evaluations and purchase intentions (Beukeboom et al., 2015)and improved brand relationship quality and brand reputation (Kang et al., 2014; Park and Kim, 2014). It is thus not surprising that organizations are integrating social networking sites as part of their marketing strategies (Ladhari et al., 2018; Relling et al., 2016).
Both the implementation of a social media strategy and its effectiveness are found to be very industry dependent (Bruhn et al., 2012). In this respect, Karimov and Brengman (2011) show that the monetary and symbolic value of the products sold by e-retailers influence the utilization of social media features – including SNSs. In particular, for websites selling cheaper products (i.e. with low monetary value), the researchers find that more social media cues are utilized forproducts with a higher symbolic value (such as apparel and beauty products) than for products with a lower symbolic value (such as food and groceries). However, Ladhari et al. (2018) put forward that SNSs provide enormous opportunities to businesses in food retail. Still, to date,research on the topic in this industry is scant.
Purpose*Given the fact that scholars have not paid a great deal of attention to the presence of food retail chains on social media networks, the present working paper aims to fill this gap. The specific research goals are two-fold. First, our aim is to investigate the presence of food retailers on SNSs. We therefore answer the following questions: (1) How efficient are grocers in using SNSs as a marketing tool?, and (2) Do they act in accordance to consumers’ expectations of afood retailer’s page?. A second research goal is to gain a profound understanding of food retailers’ motivations to integrate SNSs as part of their marketing strategies.
Conceptual frameworkAs explained in the Introduction, SNSs influence brand engagement. In the literature, brand engagement is operationalized by measuring the number of likes, shares, and reactions (Hoffman and Fodor, 2010). It has been shown that the level of vividness, the level of interactivity, the content, and the timing of a post significantly influence the number of likes, shares and reactions (De Vries et al., 2012; Cvijikj and Michahelles, 2013). These numbers operationalize the brand’s engagement created by SNSs and thus serve as an approximation of a SNS’s return on investment (see Figure 1).
6
Walsh, G., Schaarschmidt, M. and Ivens, S. (2017), "Effects of customer-based corporate reputation on perceived risk and relational outcomes: empirical evidence from gender moderation in fashion retailing", Journal of Product & Brand Management, Vol. 26 No. 3, pp. 227-238.
Weijters, B., Rangarajan, D., Falk, T. and Schillewaert, N. (2007), “Determinants and outcomes of customers’ use of self-service technology in a retail setting”, Journal of Service Research, Vol. 10, No. 1, pp. 3-2.
AppendixKeywords*Sustainability, innovation, satisfaction, gender, retailing
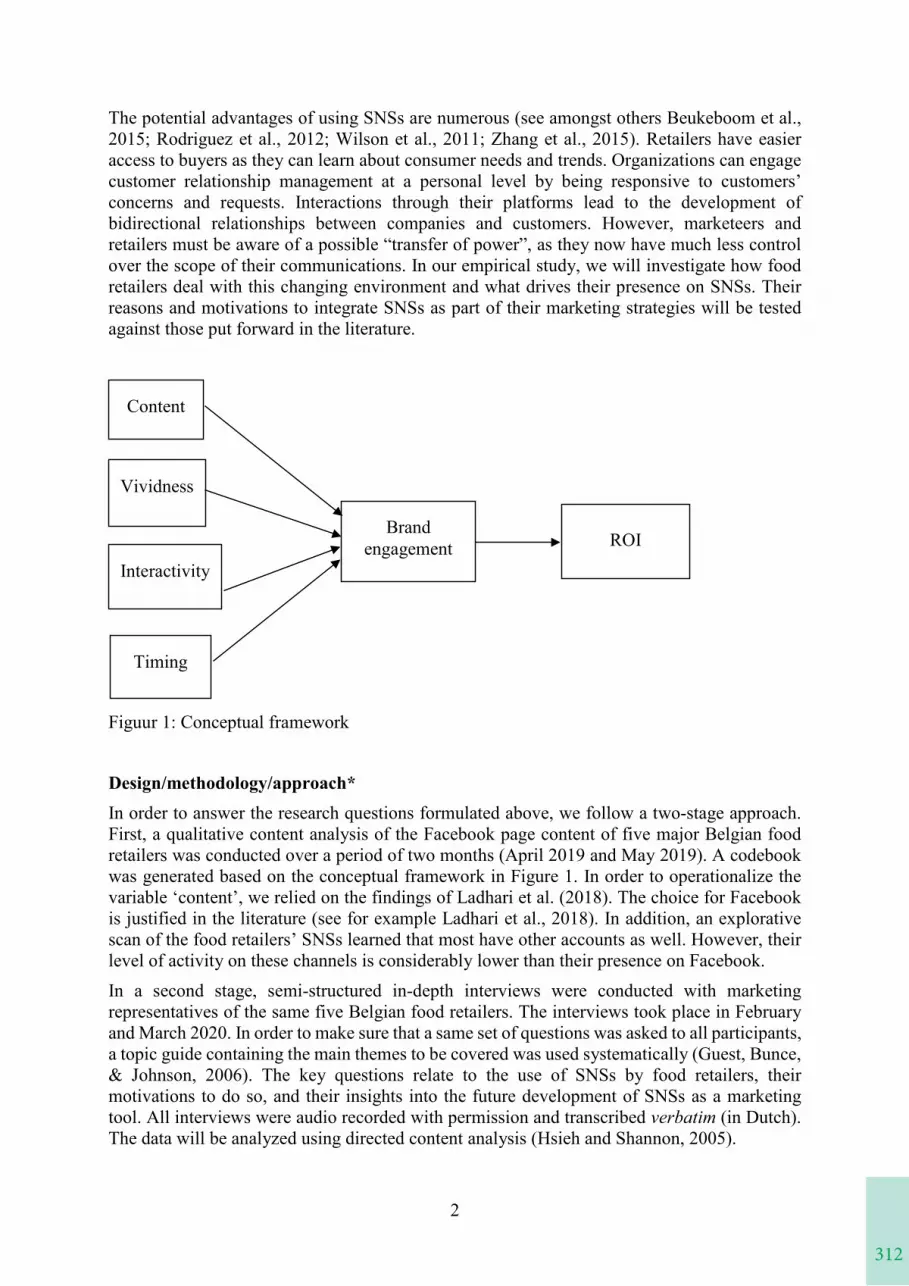
312
2
The potential advantages of using SNSs are numerous (see amongst others Beukeboom et al., 2015; Rodriguez et al., 2012; Wilson et al., 2011; Zhang et al., 2015). Retailers have easier access to buyers as they can learn about consumer needs and trends. Organizations can engage customer relationship management at a personal level by being responsive to customers’ concerns and requests. Interactions through their platforms lead to the development of bidirectional relationships between companies and customers. However, marketeers and retailers must be aware of a possible “transfer of power”, as they now have much less control over the scope of their communications. In our empirical study, we will investigate how food retailers deal with this changing environment and what drives their presence on SNSs. Their reasons and motivations to integrate SNSs as part of their marketing strategies will be tested against those put forward in the literature.
Figuur 1: Conceptual framework
Design/methodology/approach*In order to answer the research questions formulated above, we follow a two-stage approach. First, a qualitative content analysis of the Facebook page content of five major Belgian foodretailers was conducted over a period of two months (April 2019 and May 2019). A codebook was generated based on the conceptual framework in Figure 1. In order to operationalize the variable ‘content’, we relied on the findings of Ladhari et al. (2018). The choice for Facebook is justified in the literature (see for example Ladhari et al., 2018). In addition, an explorative scan of the food retailers’ SNSs learned that most have other accounts as well. However, their level of activity on these channels is considerably lower than their presence on Facebook. In a second stage, semi-structured in-depth interviews were conducted with marketing representatives of the same five Belgian food retailers. The interviews took place in February and March 2020. In order to make sure that a same set of questions was asked to all participants, a topic guide containing the main themes to be covered was used systematically (Guest, Bunce, & Johnson, 2006). The key questions relate to the use of SNSs by food retailers, their motivations to do so, and their insights into the future development of SNSs as a marketing tool. All interviews were audio recorded with permission and transcribed verbatim (in Dutch). The data will be analyzed using directed content analysis (Hsieh and Shannon, 2005).
Content
Vividness
Interactivity
Timing
Brand engagement ROI
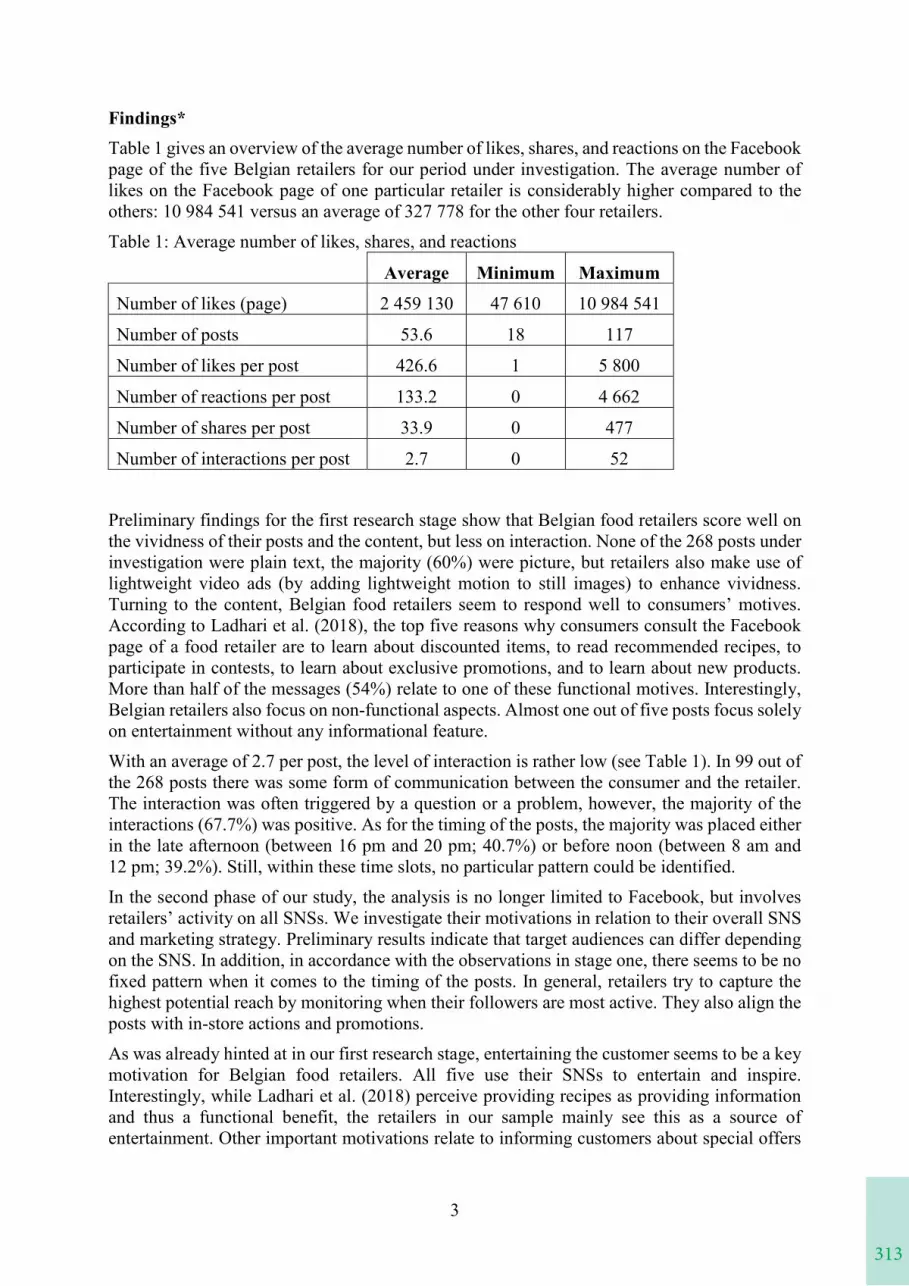
313
3
Findings*Table 1 gives an overview of the average number of likes, shares, and reactions on the Facebook page of the five Belgian retailers for our period under investigation. The average number of likes on the Facebook page of one particular retailer is considerably higher compared to the others: 10 984 541 versus an average of 327 778 for the other four retailers.
Table 1: Average number of likes, shares, and reactions
Average Minimum Maximum
Number of likes (page) 2 459 130 47 610 10 984 541
Number of posts 53.6 18 117
Number of likes per post 426.6 1 5 800
Number of reactions per post 133.2 0 4 662
Number of shares per post 33.9 0 477
Number of interactions per post 2.7 0 52
Preliminary findings for the first research stage show that Belgian food retailers score well on the vividness of their posts and the content, but less on interaction. None of the 268 posts under investigation were plain text, the majority (60%) were picture, but retailers also make use oflightweight video ads (by adding lightweight motion to still images) to enhance vividness.Turning to the content, Belgian food retailers seem to respond well to consumers’ motives.According to Ladhari et al. (2018), the top five reasons why consumers consult the Facebook page of a food retailer are to learn about discounted items, to read recommended recipes, to participate in contests, to learn about exclusive promotions, and to learn about new products. More than half of the messages (54%) relate to one of these functional motives. Interestingly, Belgian retailers also focus on non-functional aspects. Almost one out of five posts focus solely on entertainment without any informational feature.
With an average of 2.7 per post, the level of interaction is rather low (see Table 1). In 99 out of the 268 posts there was some form of communication between the consumer and the retailer. The interaction was often triggered by a question or a problem, however, the majority of the interactions (67.7%) was positive. As for the timing of the posts, the majority was placed either in the late afternoon (between 16 pm and 20 pm; 40.7%) or before noon (between 8 am and 12 pm; 39.2%). Still, within these time slots, no particular pattern could be identified.
In the second phase of our study, the analysis is no longer limited to Facebook, but involves retailers’ activity on all SNSs. We investigate their motivations in relation to their overall SNSand marketing strategy. Preliminary results indicate that target audiences can differ depending on the SNS. In addition, in accordance with the observations in stage one, there seems to be no fixed pattern when it comes to the timing of the posts. In general, retailers try to capture the highest potential reach by monitoring when their followers are most active. They also align the posts with in-store actions and promotions.
As was already hinted at in our first research stage, entertaining the customer seems to be a keymotivation for Belgian food retailers. All five use their SNSs to entertain and inspire. Interestingly, while Ladhari et al. (2018) perceive providing recipes as providing information and thus a functional benefit, the retailers in our sample mainly see this as a source of entertainment. Other important motivations relate to informing customers about special offers
2
The potential advantages of using SNSs are numerous (see amongst others Beukeboom et al., 2015; Rodriguez et al., 2012; Wilson et al., 2011; Zhang et al., 2015). Retailers have easier access to buyers as they can learn about consumer needs and trends. Organizations can engage customer relationship management at a personal level by being responsive to customers’ concerns and requests. Interactions through their platforms lead to the development of bidirectional relationships between companies and customers. However, marketeers and retailers must be aware of a possible “transfer of power”, as they now have much less control over the scope of their communications. In our empirical study, we will investigate how food retailers deal with this changing environment and what drives their presence on SNSs. Their reasons and motivations to integrate SNSs as part of their marketing strategies will be tested against those put forward in the literature.
Figuur 1: Conceptual framework
Design/methodology/approach*In order to answer the research questions formulated above, we follow a two-stage approach. First, a qualitative content analysis of the Facebook page content of five major Belgian foodretailers was conducted over a period of two months (April 2019 and May 2019). A codebook was generated based on the conceptual framework in Figure 1. In order to operationalize the variable ‘content’, we relied on the findings of Ladhari et al. (2018). The choice for Facebook is justified in the literature (see for example Ladhari et al., 2018). In addition, an explorative scan of the food retailers’ SNSs learned that most have other accounts as well. However, their level of activity on these channels is considerably lower than their presence on Facebook. In a second stage, semi-structured in-depth interviews were conducted with marketing representatives of the same five Belgian food retailers. The interviews took place in February and March 2020. In order to make sure that a same set of questions was asked to all participants, a topic guide containing the main themes to be covered was used systematically (Guest, Bunce, & Johnson, 2006). The key questions relate to the use of SNSs by food retailers, their motivations to do so, and their insights into the future development of SNSs as a marketing tool. All interviews were audio recorded with permission and transcribed verbatim (in Dutch). The data will be analyzed using directed content analysis (Hsieh and Shannon, 2005).
Content
Vividness
Interactivity
Timing
Brand engagement ROI
314
4
and promotions and enhanced customer service and interaction. Overall, food retailers’ SNSs are not used for internal communication, nor for communication with suppliers or partners.
Original/value*The present working paper contributes to the literature on the use of SNSs as a marketing tool. As the implementation of a social media strategy is driven by industry-specific characteristics,it is important to investigate this matter on a sector level. Our research focuses on the currently understudied sector of food retailing.
References*Agrawal, Y., Kawathekar, S., Malve, S. S., Malviya, S. and Shelke, S. D. (2018). “Implementing social CRM system for an online grocery shopping platform using customer reviews”, International Research Journal of Engineering and Technology, Vol. 5 No. 8, pp. 1116-1119.
Beukeboom, C.J., Kerkhof, P. and de Vries, M. (2015). “Does a virtual like cause actual liking? How following a brand's Facebook updates enhances brand evaluations and purchaseintention”, Journal of Interactive Marketing, Vol. 32, pp. 26–36.
Bruhn, M., Schoenmueller, V. and Schäfer, D. B. (2012). “Are social media replacing traditional media in terms of brand equity creation?”, Management Research Review, Vol. 35 No. 9, pp. 770-790.
Cvijikj, I. P. and Michahelles, F. (2013). “Online engagement factors on Facebook brand pages”, Social network analysis and mining, Vol. 3 No. 4, pp. 843-861.
Cocosila, M. and Igonor, A. (2015). “How important is the “social” in social networking? A perceived value empirical investigation”, Information Technology & People, Vol. 28 No. 2, pp. 366-382.
De Vries, L., Gensler, S. and Leeflang, P. S. (2012). “Popularity of brand posts on brand fan pages: An investigation of the effects of social media marketing”, Journal of interactive marketing, Vol. 26 No. 2, pp. 83-91.
Dijkmans, C., Kerkhof, P. and Beukeboom, C. J. (2015). “A stage to engage: Social media use and corporate reputation”, Tourism management, Vol. 47, pp. 58-67.
Guest, G., Bunce, A. and Johnson, L. (2006). “How many interviews are enough? An experiment with data saturation and variability”, Field Methods, Vol. 18 No. 1, pp. 59-82.
Hoffman, D. L. and Fodor, M. (2010). “Can you measure the ROI of your social media marketing?”, MIT Sloan Management Review, Vol. 52 No.1, pp. 41-49.
Hsieh, H.-F. and Shannon, S. E. (2005). “Three approaches to qualitative content analysis”,Qualitative Health Research, Vol. 15 No. 9, pp. 1277-1288.Kang, J., Tang, L. and Fiore, A. M. (2014). “Enhancing consumer–brand relationships on restaurant Facebook fan pages: Maximizing consumer benefits and increasing active participation”, International Journal of Hospitality Management, Vol. 36, pp. 145-155.
Karimov, F. P. and Brengman, M. (2011). “Adoption of social media by online retailers: Assessment of current practices and future directions”, International Journal of E-Entrepreneurship and Innovation, Vol. 2 No. 1, pp. 26-45.
Ladhari, R., Rioux, M. C., Souiden, N. and Chiadmi, N. E. (2019). “Consumers’ motives for visiting a food retailer's Facebook page”, Journal of Retailing and Consumer Services, Vol. 50, pp. 379-385.
315
5
Park, H. and Kim, Y. K. (2014). “The role of social network websites in the consumer–brand relationship”, Journal of Retailing and Consumer Services, Vol. 21 No. 4, pp. 460-467.
Relling, M., Schnittka, O., Sattler, H. and Johnen, M. (2016). “Each can help or hurt: Negative and positive word of mouth in social network brand communities”, International Journal of Research in Marketing, Vol. 33 No. 1, pp. 42-58.
Rodriguez, M., Peterson, R. M. and Krishnan, V. (2012). “Social media’s influence on business-to-business sales performance”, Journal of Personal Selling & Sales Management, Vol. 32 No. 3, pp. 365-378.
Wattanacharoensil, W. and Schuckert, M. (2015). “How global airports engage social media users: A study of Facebook use and its role in stakeholder communication”, Journal of Travel & Tourism Marketing, Vol. 32 No. 6, pp. 656-676.
Wilson, H. J., Guinan, P. J., Parise, S. and Weinberg, B. D. (2011). “What's your social media strategy?”, Harvard Business Review, pp. 23-25.
Yap, W. C. and Garry, W. H. T. (2017). “Mobile social media marketing: a partial least squares structural equation modelling approach”, International Journal of Modelling in Operations Management, Vol. 6 No. 3, pp. 172-193.
Zhang, H., Lu, Y., Wang, B. and Wu, S. (2015). “The impacts of technological environments and co-creation experiences on customer participation”, Information & Management, Vol. 52No. 4, pp. 468-482.
Keywords*Social networking sites, food retailing, social media marketing, brand engagement, content analysis
4
and promotions and enhanced customer service and interaction. Overall, food retailers’ SNSs are not used for internal communication, nor for communication with suppliers or partners.
Original/value*The present working paper contributes to the literature on the use of SNSs as a marketing tool. As the implementation of a social media strategy is driven by industry-specific characteristics,it is important to investigate this matter on a sector level. Our research focuses on the currently understudied sector of food retailing.
References*Agrawal, Y., Kawathekar, S., Malve, S. S., Malviya, S. and Shelke, S. D. (2018). “Implementing social CRM system for an online grocery shopping platform using customer reviews”, International Research Journal of Engineering and Technology, Vol. 5 No. 8, pp. 1116-1119.
Beukeboom, C.J., Kerkhof, P. and de Vries, M. (2015). “Does a virtual like cause actual liking? How following a brand's Facebook updates enhances brand evaluations and purchaseintention”, Journal of Interactive Marketing, Vol. 32, pp. 26–36.
Bruhn, M., Schoenmueller, V. and Schäfer, D. B. (2012). “Are social media replacing traditional media in terms of brand equity creation?”, Management Research Review, Vol. 35 No. 9, pp. 770-790.
Cvijikj, I. P. and Michahelles, F. (2013). “Online engagement factors on Facebook brand pages”, Social network analysis and mining, Vol. 3 No. 4, pp. 843-861.
Cocosila, M. and Igonor, A. (2015). “How important is the “social” in social networking? A perceived value empirical investigation”, Information Technology & People, Vol. 28 No. 2, pp. 366-382.
De Vries, L., Gensler, S. and Leeflang, P. S. (2012). “Popularity of brand posts on brand fan pages: An investigation of the effects of social media marketing”, Journal of interactive marketing, Vol. 26 No. 2, pp. 83-91.
Dijkmans, C., Kerkhof, P. and Beukeboom, C. J. (2015). “A stage to engage: Social media use and corporate reputation”, Tourism management, Vol. 47, pp. 58-67.
Guest, G., Bunce, A. and Johnson, L. (2006). “How many interviews are enough? An experiment with data saturation and variability”, Field Methods, Vol. 18 No. 1, pp. 59-82.
Hoffman, D. L. and Fodor, M. (2010). “Can you measure the ROI of your social media marketing?”, MIT Sloan Management Review, Vol. 52 No.1, pp. 41-49.
Hsieh, H.-F. and Shannon, S. E. (2005). “Three approaches to qualitative content analysis”,Qualitative Health Research, Vol. 15 No. 9, pp. 1277-1288.Kang, J., Tang, L. and Fiore, A. M. (2014). “Enhancing consumer–brand relationships on restaurant Facebook fan pages: Maximizing consumer benefits and increasing active participation”, International Journal of Hospitality Management, Vol. 36, pp. 145-155.
Karimov, F. P. and Brengman, M. (2011). “Adoption of social media by online retailers: Assessment of current practices and future directions”, International Journal of E-Entrepreneurship and Innovation, Vol. 2 No. 1, pp. 26-45.
Ladhari, R., Rioux, M. C., Souiden, N. and Chiadmi, N. E. (2019). “Consumers’ motives for visiting a food retailer's Facebook page”, Journal of Retailing and Consumer Services, Vol. 50, pp. 379-385.
316
1
CO-CREATION BEHAVIOUR IN FASHION RETAILING SECTOR: A LATENT SEGMENTATION APPROACH
Carlota LORENZO-ROMERODepartment of Business Administratio
University of Castilla-La Mancha, Albacete, Spain
Marta FRASQUETDepartment of Marketing
University of Valencia, Valencia, Spain
Maria-Carmen ALARCÓN-DEL AMODepartment of Marketing
University of Murcia, Murcia, Spain
IntroductionThe new technologies are a challenge for all sectors, forcing marketers to rethink the most appropriate ways to reach an increasingly young public, much more accustomed to the use of digital devices and interaction with brands. Although some people still need to see and feel products on international catwalks and fairs (Hägg and Preiholt, 2006), the digital age offers possibilities that are beginning to influence the marketing of luxury goods and, therefore the trends of marketing strategies in mass-market fashion.
Digital marketing strategies in fashion retailing, through communication by social networks, websites, bloggers, or influencers, are essential to innovate in the ways to interact with consumers, and in the design of the communication and distribution systems. Brands need toreinvent their marketing and business strategies to adapt to and approach emerging markets of consumers who are eager to consume fashion (González-Romo and Plaza-Romero, 2017),generating customized responses to users to create motivating experiences during their online shopping process (Lorenzo-Romero and Constantinides, 2019). Firms are investing considerable resources in developing online engagement platforms that allow high levels of interactivity with customers and create brand equity, for example, the interactive NikeID platform which allows customers to co-design their shoes (Ramaswamy and Ozcan, 2016).
Following the opportunities that online channels provide to firms for managing online co-creation encounters, interest has grown in investigating the processes of online co-creation.However, the literature is still scarce and fragmented with some conceptual papers that develop frameworks and research propositions (e.g., Ramaswamy and Ozcan, 2016; Zwass, 2010) and a few empirical papers that draw on existing theories to develop research models.
317
1
CO-CREATION BEHAVIOUR IN FASHION RETAILING SECTOR: A LATENT SEGMENTATION APPROACH
Carlota LORENZO-ROMERODepartment of Business Administratio
University of Castilla-La Mancha, Albacete, Spain
Marta FRASQUETDepartment of Marketing
University of Valencia, Valencia, Spain
Maria-Carmen ALARCÓN-DEL AMODepartment of Marketing
University of Murcia, Murcia, Spain
IntroductionThe new technologies are a challenge for all sectors, forcing marketers to rethink the most appropriate ways to reach an increasingly young public, much more accustomed to the use of digital devices and interaction with brands. Although some people still need to see and feel products on international catwalks and fairs (Hägg and Preiholt, 2006), the digital age offers possibilities that are beginning to influence the marketing of luxury goods and, therefore the trends of marketing strategies in mass-market fashion.
Digital marketing strategies in fashion retailing, through communication by social networks, websites, bloggers, or influencers, are essential to innovate in the ways to interact with consumers, and in the design of the communication and distribution systems. Brands need toreinvent their marketing and business strategies to adapt to and approach emerging markets of consumers who are eager to consume fashion (González-Romo and Plaza-Romero, 2017),generating customized responses to users to create motivating experiences during their online shopping process (Lorenzo-Romero and Constantinides, 2019). Firms are investing considerable resources in developing online engagement platforms that allow high levels of interactivity with customers and create brand equity, for example, the interactive NikeID platform which allows customers to co-design their shoes (Ramaswamy and Ozcan, 2016).
Following the opportunities that online channels provide to firms for managing online co-creation encounters, interest has grown in investigating the processes of online co-creation.However, the literature is still scarce and fragmented with some conceptual papers that develop frameworks and research propositions (e.g., Ramaswamy and Ozcan, 2016; Zwass, 2010) and a few empirical papers that draw on existing theories to develop research models.
2
Among those empirical papers, the ones referring to retail co-creation experience are very scarce (e.g. Anaza, 2014; Frasquet-Deltoro, Alarcón-del-Amo and Lorenzo-Romero, 2019; Gebauer et al., 2013). The limited literature in this field has not investigated the heterogeneity among online co-creators through a segmentation approach. A segmentation study is useful for both fashion retailers and consumers, as it allows to offer customized products thatincrease engagement and satisfaction with the brand.
PurposeBased on the limited knowledge of on-line co-creation behaviour in the retail sector, this study takes a segmentation approach that allows examining the diversity of behaviours. Thus,the general objective of this paper is to analyse the heterogeneity of co-creator’s behaviours in the online retail environment. This study examines different indicators that determine the co-creation behaviour by users (i.e., co-creation values and activities, engagement with the company/brand, satisfaction with the co-creation process, intention to continue co-creating),in the Spanish fashion sector, to segment fashion retail co-creating customers. The findings will offer to fashion retailers, an interesting perspective for attracting customers in co-creation ventures during the fashion online shopping process
Conceptual frameworkIn light of this situation within the fashion industry, companies focus on the joint creation of personalized experiences as an appropriate strategy for achieving sustainability and meeting basic human needs (López-Navarro and Lozano-Gómez, 2014). The term co-creation, coined by Prahalad and Ramaswamy (2004), represents a new philosophy about the customers to whom marketing strategies are aimed. It refers to the process by which products, services, and experiences are developed jointly by companies and their stakeholders, opening up a new world of value. Customers, as an essential group of stakeholders, and the company are closely committed to creating truly unique and rewarding value propositions. Co-creative fashion firms aim to foster emotional ties between customers, brands, and garments through the development of positive and meaningful experiences by appealing to values such as transparency, respect, or social and environmental responsibility. Thus, within the strategy of experience co-creation, value creation does not only derive from the company's internal activities (Ramaswamy, 2011).
The increased digitalization and the adoption of omnichannel strategies by firms (Verhoef et al., 2015) empower consumers, at the same time that enable mass and multifaceted co-creation (Zhang et al., 2017). Customer co-creation behaviours are easier to perform online than offline and are particularly stimulated through the use of social network sites (Wu et al., 2017).
MethodologyThis research was carried out based on an online questionnaire aimed at active online co-creators in the fashion retail sector in Spain. The survey was managed by a market research institute that had access to an online panel. The individuals were asked to answer the questions about the retailer they co-created with most recently, which they could choose from an extensive list of retailers or else write a valid name. The final sample size was 400individuals.
The measures for the constructs used in our study were mainly scales validated in previous online co-creation studies: co-creation value (Yi and Gong,2013), co-creation activities (Nysveen and Pedersen, 2014; Constantinides, Brünik and Lorenzo, 2015), engagement
318
3
(Blasco-Arcas, Hernandez-Ortega and Jimenez-Martinez, 2014; Medlin and Green, 2003;Sprott, Czellar and Spangenberg, 2009); satisfaction (Navarré, Mafé and Blas,2010;Oliver,1980), intention to continue co-creating (Blasco et al., 2014). All items were measured on Likert scales of seven points, where 1=completely disagree, and 7=completely agree.
We first applied confirmatory factor analysis (CFA) using EQS software, to test the validity and reliability of the constructs. A latent segmentation methodology using Latent Gold 4.5®
statistical software was used to define the segments and profile the individuals. The factor scores created during this process were used as variables (indicators) to develop a cluster analysis based on the variables measured as continuous variables.
The advantage of latent class models is that they permit the incorporation of variables with different measurement scales (continuous, ordinal or nominal). In addition, the models can usually incorporate independent variables that are used to describe (rather than to define or measure) the latent classes. These exogenous variables are known as covariates (Vermunt and Magidson, 2005). We analyzed gender, age, level of education, work situation, marital status, and income at covariates to profile co-creators in the fashion retail sector.
FindingsIn applying the latent segmentation approach, the first step consists of selecting the optimum number of segments. Our model estimated from one (no heterogeneity existed) up to eight segments. The model fit was evaluated according to the Bayesian Information Criterion (BIC) that allows the identification of the model with the least number of classes that best fit the data. The lowest BIC value was considered as the best model indicator. The best solution was the obtention of three different groups of co-creators, as the BIC was minimized in this case. The statistic values indicate that the model has a good fit, because the entropy statistic (Es) and R2 is close to 1. For all the indicators, a significant p-value associated with the Wald statistics was obtained, confirming that each indicator discriminates between the clusters in a significant way (Vermunt and Magidson, 2005).
The profiles of the three clusters are based on the average score of the indicators and their size. We named the clusters according to their profile: The cluster named “co-creators oriented to the company/brand” includes 42.47% of co-innovators; the “full-co-creators” segment includes 33.25% of co-innovators, and the “co-creators oriented to others” segment includes 24.29% of co-innovators.
In order to refine the resulting segments and provide more information about their characteristics, we analyzed different descriptive variables -or covariates- that could be related to co-creation behaviours of users. Specifically, gender, age, level of education, work situation, marital status, and income. Independence tests associated with statistic Wald conclude that significant differences (≥95% confidence level) exist between the segments for the variables of age, education, and marital status. Regarding gender, all clusters display balanced participation of men and women.
Based on the average score of each segment in each of the indicators and providing the socio-demographic characteristics of each cluster, a detailed description of each segment is provided next.
Firstly, the “co-creator oriented to the company/brand” segment shows higher mean in co-creation value CV-personal interactions with the company (5.2890) and CV-information interchange with the company (5.0656) as co-creation values. High means in CV- responsible behaviour (4.9825) and CV-business advocacy (4.8506) also show co-creation behaviours of this cluster focused on the brand. Regarding co-creation activities (CA), CA-direct co-co-participation with the company (2.8485), compared with the CA-co-participation with other
319
3
(Blasco-Arcas, Hernandez-Ortega and Jimenez-Martinez, 2014; Medlin and Green, 2003;Sprott, Czellar and Spangenberg, 2009); satisfaction (Navarré, Mafé and Blas,2010;Oliver,1980), intention to continue co-creating (Blasco et al., 2014). All items were measured on Likert scales of seven points, where 1=completely disagree, and 7=completely agree.
We first applied confirmatory factor analysis (CFA) using EQS software, to test the validity and reliability of the constructs. A latent segmentation methodology using Latent Gold 4.5®
statistical software was used to define the segments and profile the individuals. The factor scores created during this process were used as variables (indicators) to develop a cluster analysis based on the variables measured as continuous variables.
The advantage of latent class models is that they permit the incorporation of variables with different measurement scales (continuous, ordinal or nominal). In addition, the models can usually incorporate independent variables that are used to describe (rather than to define or measure) the latent classes. These exogenous variables are known as covariates (Vermunt and Magidson, 2005). We analyzed gender, age, level of education, work situation, marital status, and income at covariates to profile co-creators in the fashion retail sector.
FindingsIn applying the latent segmentation approach, the first step consists of selecting the optimum number of segments. Our model estimated from one (no heterogeneity existed) up to eight segments. The model fit was evaluated according to the Bayesian Information Criterion (BIC) that allows the identification of the model with the least number of classes that best fit the data. The lowest BIC value was considered as the best model indicator. The best solution was the obtention of three different groups of co-creators, as the BIC was minimized in this case. The statistic values indicate that the model has a good fit, because the entropy statistic (Es) and R2 is close to 1. For all the indicators, a significant p-value associated with the Wald statistics was obtained, confirming that each indicator discriminates between the clusters in a significant way (Vermunt and Magidson, 2005).
The profiles of the three clusters are based on the average score of the indicators and their size. We named the clusters according to their profile: The cluster named “co-creators oriented to the company/brand” includes 42.47% of co-innovators; the “full-co-creators” segment includes 33.25% of co-innovators, and the “co-creators oriented to others” segment includes 24.29% of co-innovators.
In order to refine the resulting segments and provide more information about their characteristics, we analyzed different descriptive variables -or covariates- that could be related to co-creation behaviours of users. Specifically, gender, age, level of education, work situation, marital status, and income. Independence tests associated with statistic Wald conclude that significant differences (≥95% confidence level) exist between the segments for the variables of age, education, and marital status. Regarding gender, all clusters display balanced participation of men and women.
Based on the average score of each segment in each of the indicators and providing the socio-demographic characteristics of each cluster, a detailed description of each segment is provided next.
Firstly, the “co-creator oriented to the company/brand” segment shows higher mean in co-creation value CV-personal interactions with the company (5.2890) and CV-information interchange with the company (5.0656) as co-creation values. High means in CV- responsible behaviour (4.9825) and CV-business advocacy (4.8506) also show co-creation behaviours of this cluster focused on the brand. Regarding co-creation activities (CA), CA-direct co-co-participation with the company (2.8485), compared with the CA-co-participation with other
4
people (2.4975) also indicate, although with less intensity, a co-creation behaviour of this segment oriented to the company. In this segment, the engagement towards the company/brand (5.0258) is higher than the satisfaction with the co-creation process (4.6604) and intention to continue co-creating (4.3634). This cluster is the largest in the sample (42.47%) and is mainly made up of consumers between 41 and 65 years old (45%), with a university degree (44%), singles and married in similar proportion (35 and 39%, respectively).In comparison with the other clusters, the “co-creator oriented to the company/brand” segment shows the highest percentage of people with medium age (41-65 years old) and the lowest percentage of young people (18-25 years old).
Secondly, the “full-cocreator” cluster has the highest scores in all co-creation behaviours (i.e. co-creation values, co-creation activities, engagement, satisfaction and continuing actively co-creating). This segment shows the highest means (more than 6 points) in CV-personal interactions with the company (6.2609), CV-business advocacy (6.1166), and CV-feedback with the company/brand (6.0254). Related to co-creation activities for this segment, the comparison between CA-direct co-co-participation with the company (3.7973) and CA-co-participation with other people (3.0903) indicates that co-creators become more involved with the brand in their co-creation activities. “Full co-creators” show lower scores in satisfaction with the co-creation process (5.9665) and to intention to continue co-creating (5.9572) than engagement with the brand (6.6401). This segment is mainly made up of married consumers (48%) between 41 and 65 years old (44%), and holding a university degree (43.
Thirdly, the “co-creator oriented to others” cluster shows higher mean values in CV-help to other people (5.2032) and CV-search for information with other people -remember 1 strongly disagree, 7 strongly agree- respect to co-creation values. Regarding co-creation activities, CA-direct co-participation with the company (1.7593), compared with the CA-co-participation with other people (3.1634), also indicates that the co-creation behaviour of this segment is oriented to others. In this segment, as the main difference versus the others, engagement with the brand (4.0998) has a lower score than satisfaction with the co-creation process (4.5072) and the intention to continue co-creating in the future (4.5143). The profile of this cluster is composed of younger people than other segments (37% are 26-40 years old, and 38% are 41-65 years old), with university degrees (43%), and mainly married (44%).
As main differences between clusters, the “full co-creator” shows harder co-creation behaviours in all indicator variables (i.e., factors about co-creation values, co-creation activities, engagement with the brand, satisfaction with the co-creation process, and intention to continue co-creating). Moreover, this co-creator profile has a behaviour oriented to the company with more intensity than oriented to the other people (even higher than scores of “co-creator oriented to the brand” segment). However, the scores toward co-creation behaviours to other people are higher than the “co-creator oriented to other people” cluster. Young people are more oriented to co-create with other people and older people are more oriented to co-create with the company during their co-creation process. “Co-creators oriented to the company/brand” segment shows a lower percentage of co-creators in professional school, as level of education, than “co-creator oriented to other people” cluster. On the other hand, single people are oriented to co-create with the company in higher proportion than the other two clusters. In contrast, married people are “oriented to co-create with other people” in higher percentage than the other groups (although near “full co-creator” segment”).
Original/value
320
5
This paper investigates online co-creation behaviour in fashion retailing through asegmentation approach. Co-creation activities through social media are increasingly used by retailers to build customer engagement and loyalty, but research on this field is still limited. Our study investigated online co-creation behaviours related to a specific company/brand, combining personal characteristics to obtain different co-creators profiles. This informationcould be useful for fashion retailers to motivate different segments of users to participate actively in co-creation activities. It could improve the online experience in the fashion retailer and, in consequence, increase the sales offering different products adapted to different obtained segments.
As main limitations, we have found the following ones. Difficulty in finding a valid sample fulfilling the specific requirements (fashion online cocreators) due to only 21% of Spanish fashion online buyers are co-creators with brands (INE 2018). Some scarcity of literature directly related to this line of research on segmentation in emerging markets of co-creators. Moreover, our study has analysed only one country, as the possible comparison of several leading countries in the fashion industry, such as the UK or Italy would provide more information.
ReferencesAnaza, N.A. (2014), “Personality antecedents of customer citizenship behaviors in online shopping situation”, Psychology & Marketing, Vol. 31 No. 4, pp. 251-26.
Blasco-Arcas, L., Hernandez-Ortega, B.I. and Jimenez-Martinez, J. (2014), “Collaborating online: the roles of interactivity and personalization”, The Service Industries Journal, Vol. 34 No. 8, pp. 677-698.
Constantinides, E., Brünink, L.A. and Lorenzo-Romero, L.A. (2015), “Customer motives and benefits forparticipating in online co-creation activities”, International Journal of Internet Marketing and Advertising, Vol. 9 No. 1, pp. 21-47.
Frasquet-Deltoro, M., Alarcón-del-Amo, M.C. and Lorenzo-Romero, C. (2019). “Antecedents and consequences of virtual customer co-creation behaviours”, Internet Research, Vol. 29 No. 1, pp. 218-244.
Gebauer, J., Füller, J. and Pezzei, R. (2013), “The dark and the bright side of co-creation: triggers of member behavior in online innovation communities”, Journal of Business Research, Vol. 66 No. 9, pp. 1516-1527.
González-Romo, Z. F. and Plaza-Romero, N. (2017). “Estrategias de marketing digital en el sector de la moda de lujo. Interacción y redes sociales como herramienta necesaria”.Hipertext.net, Vol. 15, pp. 17-27.
Hägg, C. and Preiholt, H. (2006). “Growth opportunities in luxury goods and real estate”.Journal of Fashion Marketing and Management: An International Journal, Vol. 10 No. 1, pp.114-119.
López-Navarro, M.A, Lozano-Gomez, C. (2014). “Co-creation Experiences as the Basis for Value Creation in the Sustainable Fashion Industry”, in Kandampully, J. (Ed.), Customer Experience Management: Enhancing Experience and Value through Service Management,ResearchGate.net, pp. 133-152.
Lorenzo-Romero, C. and Constantinides, E. (2019). “On-line Crowdsourcing: Motives of Customers to Participate in Online Collaborative Innovation Processes”, Sustainability, Vol. 11 No. 12, pp. 3479.
321
5
This paper investigates online co-creation behaviour in fashion retailing through asegmentation approach. Co-creation activities through social media are increasingly used by retailers to build customer engagement and loyalty, but research on this field is still limited. Our study investigated online co-creation behaviours related to a specific company/brand, combining personal characteristics to obtain different co-creators profiles. This informationcould be useful for fashion retailers to motivate different segments of users to participate actively in co-creation activities. It could improve the online experience in the fashion retailer and, in consequence, increase the sales offering different products adapted to different obtained segments.
As main limitations, we have found the following ones. Difficulty in finding a valid sample fulfilling the specific requirements (fashion online cocreators) due to only 21% of Spanish fashion online buyers are co-creators with brands (INE 2018). Some scarcity of literature directly related to this line of research on segmentation in emerging markets of co-creators. Moreover, our study has analysed only one country, as the possible comparison of several leading countries in the fashion industry, such as the UK or Italy would provide more information.
ReferencesAnaza, N.A. (2014), “Personality antecedents of customer citizenship behaviors in online shopping situation”, Psychology & Marketing, Vol. 31 No. 4, pp. 251-26.
Blasco-Arcas, L., Hernandez-Ortega, B.I. and Jimenez-Martinez, J. (2014), “Collaborating online: the roles of interactivity and personalization”, The Service Industries Journal, Vol. 34 No. 8, pp. 677-698.
Constantinides, E., Brünink, L.A. and Lorenzo-Romero, L.A. (2015), “Customer motives and benefits forparticipating in online co-creation activities”, International Journal of Internet Marketing and Advertising, Vol. 9 No. 1, pp. 21-47.
Frasquet-Deltoro, M., Alarcón-del-Amo, M.C. and Lorenzo-Romero, C. (2019). “Antecedents and consequences of virtual customer co-creation behaviours”, Internet Research, Vol. 29 No. 1, pp. 218-244.
Gebauer, J., Füller, J. and Pezzei, R. (2013), “The dark and the bright side of co-creation: triggers of member behavior in online innovation communities”, Journal of Business Research, Vol. 66 No. 9, pp. 1516-1527.
González-Romo, Z. F. and Plaza-Romero, N. (2017). “Estrategias de marketing digital en el sector de la moda de lujo. Interacción y redes sociales como herramienta necesaria”.Hipertext.net, Vol. 15, pp. 17-27.
Hägg, C. and Preiholt, H. (2006). “Growth opportunities in luxury goods and real estate”.Journal of Fashion Marketing and Management: An International Journal, Vol. 10 No. 1, pp.114-119.
López-Navarro, M.A, Lozano-Gomez, C. (2014). “Co-creation Experiences as the Basis for Value Creation in the Sustainable Fashion Industry”, in Kandampully, J. (Ed.), Customer Experience Management: Enhancing Experience and Value through Service Management,ResearchGate.net, pp. 133-152.
Lorenzo-Romero, C. and Constantinides, E. (2019). “On-line Crowdsourcing: Motives of Customers to Participate in Online Collaborative Innovation Processes”, Sustainability, Vol. 11 No. 12, pp. 3479.
6
Medlin, B. and Green, K. W. (2009). “Enhancing performance through goal setting, engagement and optimism”, Industrial Management and Data Systems, Vol. 109 No. 7, 943-956.
Navarré, C. L., Mafé, C. R. and Blas, S. S. (2010). “Implicaciones de la satisfacción, confianza y lealtad en el uso de los servicios bancarios online: un análisis aplicado al caso español”, Revista Europea de Dirección y Economía de la Empresa, Vol. 19 No. 1, pp. 27-46.
Nysveen, H. and Pedersen, P.E. (2014), “Influences of co-creation on brand experience: the role of brand engagement”, International Journal of Market Research, Vol. 56 No. 6, pp. 807-832.
Oliver, R. (1980), “A cognitive model of the antecedents and consequences of satisfaction decisions”, Journal of Marketing Research, Vol. 17 No. 4, pp. 460-469.
Prahalad, C.K. and Ramaswamy, V. (2004). “Co-creation experiences: The next practice in value creation”, Journal of Interactive Marketing, Vol. 18 No. 3, pp. 5-14.
Ramaswamy, V. (2011). “It´s about human experiences and beyond co-creation”, Industrial Marketing Management, Vol. 40, pp. 195-196.
Ramaswamy, V. and Ozcan, K. (2016). “Brand value co-creation in a digitalized world: an integrative framework and research implications”, International Journal of Research in Marketing, Vol. 33 No. 1, pp. 93-106.
Sprott, D., Czellar, S. and Spangenberg, E. (2009). “The importance of a general measure of Brand engagement on market behavior: Development and validation of a scale”, Journal of Marketing Research, Vol. 46 No. 1, pp. 92.
Verhoef, P.C., Kannan, P.K. and Inman, J.J. (2015). “From multi-channel retailing to Omni-channel retailing: introduction to the special issue on multi-channel retailing”, Journal of Retailing, Vol. 91 No. 2, pp. 174-181.
Vermunt J.K., and Magidson J. (2005), Latent GOLD 4.0 User’s Guide, Statistical Innovation, Inc., Belmont, Massachusetts.
Wu, S.H., Huang, S.C.T., Tsai, C.Y.D. and Lin, P.Y. (2017). “Customer citizenship behavior on social networking sites: the role of relationship quality, identification, and service attributes”, Internet Research, Vol. 27 No. 2, pp. 428-448.
Yi, Y. and Gong, T. (2013). “Customer value co-creation behavior: scale development and validation”, Journal of Business Research, Vol. 66 No. 9, pp. 1279-1284.
Zhang, M., Hu, M., Guo, M. and Liu, W. (2017), “Understanding relationships among customer experience, engagement, and word-of-mouth intention on online brand communities: the perspective of service ecosystem”, Internet Research, Vol. 27 No. 4, pp. 839-857.Zwass, V. (2010), “Co-creation: toward a taxonomy and an integrated research perspective”,International Journal of Electronic Commerce, Vol. 15 No. 1, pp. 11-48.
KeywordsCo-creation values and activities, Engagement, Satisfaction, Users latent profile, Fashion retailing sector in Spain.

322
7
AcknowledgementThis work was financed by the Spanish Ministry of Science, Innovation and Universities, Spanish State Research Agency (Research Grant ECO 2017-83051-R).
323
7
AcknowledgementThis work was financed by the Spanish Ministry of Science, Innovation and Universities, Spanish State Research Agency (Research Grant ECO 2017-83051-R).
1
DOES EMOTIONAL LABOUR MATTER IN CUSTOMER-SERVICE ROBOT INTERACTIONS?
Carmen-Maria AlbrechtMSB Muenster School of Business
Muenster University of Applied Sciences, Muenster, Germany
Mathis HonekampMSB Muenster School of Business
Muenster University of Applied Sciences, Muenster, Germany
Introduction & PurposeService robots can interact, communicate, and deliver service to customers and are predicted to replace human service employees in many industries (Wirtz et al., 2018; Mende et al.,2019). Up to now, more than 25,000 humanoid “Pepper” and “NAO” robots have been sold worldwide (SoftBank, 2019). Humanoid service robots are said to be “easy to relate thanks to their human-like mannerisms and emotions (Bloomberg, 2017). However, it has also been acknowledged that service robots “are unlikely to be a source of competitive advantage” (p. 910), while service employees are and continue to be such a source (Wirtz et al., 2018).
Service employees play a key role in developing and maintaining customer relationships (Houston III et al., 2018). The manner in which service employees face customers accounts for more than 40% of the customers’ reconsideration of their purchase intentions in the store (Court et al., 2009). Many service organizations usually employ explicit or implicit emotional display rules, that is, norms and standards of behaviour that suggest which emotions are appropriate within a service interaction and thus should be publicly expressed toward customers (Groth et al., 2009). Emotional labour (with deep acting and surface acting strategies) refers to this emotion management (Hochschild, 1983). Service employees can reveal emotions not only through facial cues but also through other behavioural channels (e.g., the tone of their voice) (Houston III et al., 2018). Similarly, service robots can express emotions through verbal and non-verbal signals (e.g., facial expressions) (Wirtz et al., 2018; Stock and Nguyen, 2019).
Research has raised the question whether service robot behaviours (e.g., emotional display, gestures) influence customers’ perception of the service (De Keyser et al., 2019). Service robots are programmed to display certain emotions and behaviours to customers. Depending on the details and lavishness of the programming, customers might perceive a difference in the genuineness with which emotional display behaviour is transmitted.
Thus, the questions arise whether customers perceive a service robot as apparently more deep acting than surface acting and whether deep and surface acting perceptions differ for interactions with human service employees and humanoid service robots. Moreover, the
324
2
question arises whether customers’ gender has an impact on these evaluations since women have been found to be more receptive to emotional communication (Mattila et al., 2003).
Literature ReviewConsumers’ Reactions to Humanoid Service Robots in Retail and Service SectorsStock and Merkle (2018) focus on how consumers perceive innovative cues (i.e., the extent to which a service representative creates new ideas and solutions for the customer) shown by either a human service employee or a humanoid service robot. In their experimental study, they find that consumers show positive responses in the form of delight to a service robot’s innovative behaviour. However, consumers who face the innovative acting service robot are not significantly more satisfied than consumers who face the neutral, but friendly and professionally acting human service employee. Thus, compared to human service employees, customers’ reactions are less positive for service robots.
Merkle (2019), on the contrary, finds that consumers rate the satisfaction with a humanoid service robot as comparably high as with a human service employee when the service is considered as appropriate and no service failure occurred. When faced with a service failure, consumers also rated their satisfaction level higher within the customer-robot interaction than within the customer-employee interaction, indicating that consumers forgive humanoid service robots more than human service employees.
van Pinxteren et al. (2019) identifies anthropomorphism (i.e., the tendency to assign human characteristics to inanimate objects) as an antecedent to trust in humanoid service robots. This finding has, however, to be evaluated in more detail since Mende et al.’s (2019) results indicate that robots that highly resemble humans in their appearance can have a negative effect on consumers’ evaluations. When interacting with humanoid service robots, Mende et al. (2019) find that consumers display compensatory responses (e.g., buying status goods in a retail context, eating more in a restaurant context) compared to consumer-employee interactions because consumers feel discomfort when interacting with a service robot.
Up to now, consumers’ reactions to humanoid service robots have not been largely examined. Moreover, there is – to the best of our knowledge – no research study that investigates how consumers perceive and react to different emotional labour strategies within service interactions with service robots compared to human service employees.
Emotional LabourHochschild (1983, p. 7) originally defined emotional labour as the “management of feeling to create a publicly observable facial and bodily display.” Service employees regulate their emotions and emotional expressions to satisfy organizational display rules (e.g., “service with a smile”) within a service encounter. Deep and surface acting are two emotional labourstrategies that service employees use to comply with these corporate rules (Hochschild, 1983).When employees truly feel the expressed emotions and thus make the effort to either create the emotions within themselves (“exhorting feelings”) or to evoke thoughts, images, and memories (“trained imagination”), they use deep acting (Hochschild, 1983). When they fake the displayed emotions, shape and work only on their outward appearance to fit the situation, they perform surface acting (e.g., Grandey 2003; Hennig-Thurau et al., 2006). These regulatory strategies differ in the degree of genuineness or authenticity of the displayed emotions. The emotions displayed in deep acting have been found to be perceived as more authentic compared to surface acting emotions (Grandey et al., 2005). Moreover, it has been found that deep acting is linked to more favourable customer outcomes (e.g., service quality perceptions) (Hennig-Thurau et al., 2006; Groth et al., 2009). As to gender reactions to emotional displays, Mattila et al. (2003) show that women focus more on the emotional
325
2
question arises whether customers’ gender has an impact on these evaluations since women have been found to be more receptive to emotional communication (Mattila et al., 2003).
Literature ReviewConsumers’ Reactions to Humanoid Service Robots in Retail and Service SectorsStock and Merkle (2018) focus on how consumers perceive innovative cues (i.e., the extent to which a service representative creates new ideas and solutions for the customer) shown by either a human service employee or a humanoid service robot. In their experimental study, they find that consumers show positive responses in the form of delight to a service robot’s innovative behaviour. However, consumers who face the innovative acting service robot are not significantly more satisfied than consumers who face the neutral, but friendly and professionally acting human service employee. Thus, compared to human service employees, customers’ reactions are less positive for service robots.
Merkle (2019), on the contrary, finds that consumers rate the satisfaction with a humanoid service robot as comparably high as with a human service employee when the service is considered as appropriate and no service failure occurred. When faced with a service failure, consumers also rated their satisfaction level higher within the customer-robot interaction than within the customer-employee interaction, indicating that consumers forgive humanoid service robots more than human service employees.
van Pinxteren et al. (2019) identifies anthropomorphism (i.e., the tendency to assign human characteristics to inanimate objects) as an antecedent to trust in humanoid service robots. This finding has, however, to be evaluated in more detail since Mende et al.’s (2019) results indicate that robots that highly resemble humans in their appearance can have a negative effect on consumers’ evaluations. When interacting with humanoid service robots, Mende et al. (2019) find that consumers display compensatory responses (e.g., buying status goods in a retail context, eating more in a restaurant context) compared to consumer-employee interactions because consumers feel discomfort when interacting with a service robot.
Up to now, consumers’ reactions to humanoid service robots have not been largely examined. Moreover, there is – to the best of our knowledge – no research study that investigates how consumers perceive and react to different emotional labour strategies within service interactions with service robots compared to human service employees.
Emotional LabourHochschild (1983, p. 7) originally defined emotional labour as the “management of feeling to create a publicly observable facial and bodily display.” Service employees regulate their emotions and emotional expressions to satisfy organizational display rules (e.g., “service with a smile”) within a service encounter. Deep and surface acting are two emotional labourstrategies that service employees use to comply with these corporate rules (Hochschild, 1983).When employees truly feel the expressed emotions and thus make the effort to either create the emotions within themselves (“exhorting feelings”) or to evoke thoughts, images, and memories (“trained imagination”), they use deep acting (Hochschild, 1983). When they fake the displayed emotions, shape and work only on their outward appearance to fit the situation, they perform surface acting (e.g., Grandey 2003; Hennig-Thurau et al., 2006). These regulatory strategies differ in the degree of genuineness or authenticity of the displayed emotions. The emotions displayed in deep acting have been found to be perceived as more authentic compared to surface acting emotions (Grandey et al., 2005). Moreover, it has been found that deep acting is linked to more favourable customer outcomes (e.g., service quality perceptions) (Hennig-Thurau et al., 2006; Groth et al., 2009). As to gender reactions to emotional displays, Mattila et al. (2003) show that women focus more on the emotional
3
displays than men because women are more process-oriented and men more outcome-oriented.
HypothesesAt the moment, robots cannot feel real emotions and engage in deep acting (Wirtz et al., 2018), but they can be programmed in such a way that customers might perceive a difference in the genuineness with which emotional display behaviour is transmitted and consequently perceive a service robot as apparently more deep acting than surface acting (H1). Research on service robots assumes that “customers are unlikely to respond to robot-displayed emotions as they would to […] emotions from human frontline employees” (Wirtz et al., 2018, p. 911).Thus, customers’ reactions to deep and surface acting are more positive within a service employee interaction than a service robot interaction (H2). Since women are believed to be more emotional and focus more on the emotional display (Mattila et al. 2003), it can be further hypothesized that women (in contrast to men) do not perceive a difference between surface and deep acting within a service robot interaction (H3).
Design/methodology/approachThe hypotheses were tested through an online experiment. For the main experiment, a usable set of 179 consumers (mean age = 30.4; 52.5% male) was recruited to take part in the study. A 2 (service agent: human service employee vs. humanoid service robot) x 2 (emotional labour: deep acting vs. surface acting) between-subjects factorial design was employed where participants were randomly assigned to one of the four scenarios. In the end, 88 (91) participants were in the human service employee (humanoid service robot) condition. Regarding emotional labour, 96 (83) were in the deep acting (surface acting) condition.
Each participant received a short scenario and a questionnaire. The scenario described a service interaction situation, and participants were instructed to read the scenario and put themselves into the described situation. The service agent was manipulated in such a way that s/he was described as either being a human service employee or a humanoid service robot (Merkle, 2019). Emotional labour was manipulated by (1) following the procedure by Houston III et al. (2018) who focused on authenticity and described the displayed emotions of a service employee as genuine (e.g., warm smile, a broad genuine smile) or not genuine (e.g., puts on a big smile) in scenarios and (2) by considering the emotional labour literature. The scenarios were pretested with 50 participants in a marketing graduate course (mean age = 23.3; 22.0% male). The results of the pre-test revealed that the chosen manipulation was successful.
FindingsIn the main experiment, the manipulations were successful. 90% (74%) of the participants in the human (robot) scenario successfully recognized a service employee (service robot) as the service agent. Customer perceptions of deep and surface was measured on 7-point scales (with 7=highly agree) by Groth et al. (2009). The deep acting condition was perceived as deep acting (MDA=6.69, MSA=4.81; F(1, 177) = 27.81, p < .01) and the surface acting condition was perceived as surface acting (MDA=3.74, MSA=5.12; F(1, 177) = 35.91, p < .01) by the participants. Moreover, deep acting was perceived to be more authentic than surface acting (MDA=4.43, MSA=3.23; F(1, 177) = 29.75, p < .01; Hennig-Thurau et al. 2006).
For the group of participants who faced the service robot, an ANOVA was performed with perceptions of deep acting and service acting as dependent variables. Consumers who interacted with the service robot perceived the deep acting robot as more deep acting (MDA=5.37, MSA=4.36; F(1, 89) = 4.12, p < .05) and the surface acting robot as more surface
326
4
acting (MDA=4.42, MSA=5.29; F(1, 89) = 8.20, p < .01). Thus, consumers perceived a difference in genuineness that is associated with the two emotional labour strategies for customer-service robot interactions. Thus, H1 is supported.
We performed two more ANOVAs with loyalty intentions as the dependent variable. Perceived competence of the service agent, consumers’ affinity for technology interaction, and consumers’ ability to put themselves into the situation were controlled for. For the group who faced the deep acting strategy, the effect of a human employee on loyalty intentions was higher than of a service robot (MH=6.08, MR=4.87; F(1, 91) = 7.79, p < .01). For the group who faced the surface acting strategy, the same effect held (MH = 5.32, MR = 4.31; F(1, 78) = 3.80, p < .01). Thus, H2 is supported.
Another ANOVA was conducted with loyalty intentions as dependent variable and the manipulations of the service agent and emotional labour as well as gender and their interactions as independent variables. The same controls were used. The results revealed a main effect of service agent and emotional labour on loyalty intentions. In particular, human service employees had a stronger impact on loyalty intentions than service robots (MH=5.74,MR=4.60; F(1, 168) = 13.00, p < .01) and deep acting had a stronger effect on loyalty intentions than surface acting (MDA=5.49, MSA=4.79; F(1, 168) = 5.53, p < .01). Interestingly, there was also a three-way interaction between service agent, emotional labour, and gender(F(1, 168) = 3.00, p < .10). For women who interacted with a human service employee, deep acting had a stronger influence on loyalty intentions than surface acting (MDA=6.39,MSA=5.54; F(1, 31) = 3.71, p < .10). However when women interacted with a service robot, there was no significant difference between the impact of deep and surface acting (MDA=4.65,MSA=4.60; F(1, 44) = .07, p > .10), suggesting that they do not respond differently to various degrees of emotional behaviours of robots. As to men, for both human and robot interactions, there was a significant difference. Thus, H3 is supported.
Original/valueThe study is the first to investigate whether and how consumers perceive and react to different emotional labour strategies within service interactions with service robots compared to human service employees.
Practical implicationsRetailers that think about using humanoid service robots have to keep in mind that customers respond to human service employees more positively than to service robots. Thus, service robots should be seen as supporting the service employees than as replacing them. Moreover, women react differently to various degrees of emotional behaviours of robots than men, suggesting that robots should be programmed in such a way to best appeal to female and male customers.
Social implicationsUsing service robots in order to support human service employees seems to be beneficial. However, this development might make retailers hire fewer human service employees because robots take over more and more service roles.
Research limitations A scenario approach was used in the experimental study. Further research might employimages or even videos as stimuli material to provide a more realistic setting.
327
4
acting (MDA=4.42, MSA=5.29; F(1, 89) = 8.20, p < .01). Thus, consumers perceived a difference in genuineness that is associated with the two emotional labour strategies for customer-service robot interactions. Thus, H1 is supported.
We performed two more ANOVAs with loyalty intentions as the dependent variable. Perceived competence of the service agent, consumers’ affinity for technology interaction, and consumers’ ability to put themselves into the situation were controlled for. For the group who faced the deep acting strategy, the effect of a human employee on loyalty intentions was higher than of a service robot (MH=6.08, MR=4.87; F(1, 91) = 7.79, p < .01). For the group who faced the surface acting strategy, the same effect held (MH = 5.32, MR = 4.31; F(1, 78) = 3.80, p < .01). Thus, H2 is supported.
Another ANOVA was conducted with loyalty intentions as dependent variable and the manipulations of the service agent and emotional labour as well as gender and their interactions as independent variables. The same controls were used. The results revealed a main effect of service agent and emotional labour on loyalty intentions. In particular, human service employees had a stronger impact on loyalty intentions than service robots (MH=5.74,MR=4.60; F(1, 168) = 13.00, p < .01) and deep acting had a stronger effect on loyalty intentions than surface acting (MDA=5.49, MSA=4.79; F(1, 168) = 5.53, p < .01). Interestingly, there was also a three-way interaction between service agent, emotional labour, and gender(F(1, 168) = 3.00, p < .10). For women who interacted with a human service employee, deep acting had a stronger influence on loyalty intentions than surface acting (MDA=6.39,MSA=5.54; F(1, 31) = 3.71, p < .10). However when women interacted with a service robot, there was no significant difference between the impact of deep and surface acting (MDA=4.65,MSA=4.60; F(1, 44) = .07, p > .10), suggesting that they do not respond differently to various degrees of emotional behaviours of robots. As to men, for both human and robot interactions, there was a significant difference. Thus, H3 is supported.
Original/valueThe study is the first to investigate whether and how consumers perceive and react to different emotional labour strategies within service interactions with service robots compared to human service employees.
Practical implicationsRetailers that think about using humanoid service robots have to keep in mind that customers respond to human service employees more positively than to service robots. Thus, service robots should be seen as supporting the service employees than as replacing them. Moreover, women react differently to various degrees of emotional behaviours of robots than men, suggesting that robots should be programmed in such a way to best appeal to female and male customers.
Social implicationsUsing service robots in order to support human service employees seems to be beneficial. However, this development might make retailers hire fewer human service employees because robots take over more and more service roles.
Research limitations A scenario approach was used in the experimental study. Further research might employimages or even videos as stimuli material to provide a more realistic setting.
5
ReferencesBloomberg (2017), “Creating consumer buzz with human-like robots“, available at:
https://www.bloomberg.com/news/videos/2017-03-30/creating-consumer-buzz-with-human-like-robots-video (accessed January 29, 2020).
Court D., Elzinga D., Mulder S. and Vetvik O.J. (2009), “The consumer decision journey“, McKinsey Quarterly, Vol. 3 No. 3, pp. 96-107.
De Keyser A., Köcher S., Alkire L., Verbeeck C. and Kandampully J. (2019), “Frontline service technology infusion: conceptual archetypes and future research directions“, Journal of Service Management, Vol. 30 No. 1, pp. 156-183.
Grandey A.A., Fisk G.M., Mattila A.S., Jansen K.J. and Sideman L.A. (2005), “Is “service with a smile” enough? Authenticity of positive displays during service encounters“, Organizational Behavior and Human Decision Processes, Vol. 96 No. 1, pp. 38-55.
Groth M., Hennig-Thurau T. and Walsh G. (2009), “Customer reactions to emotional labor: The roles of employee acting strategies and customer detection accuracy“, Academy of Management Journal, Vol. 52 No. 5, pp. 958-974.
Hennig-Thurau T., Groth M., Paul M. and Gremler D.D. (2006), “Are all smiles created equal? How emotional contagion and emotional labor affect service relationships“, Journal of Marketing, Vol. 70 No. 3, pp. 58-73.
Hochschild A.R. (1983), The Managed Heart: Commercialization of Human Feeling, University of California Press, Berkeley.
Houston III L., Grandey A.A. and Sawyer K. (2018), “Who cares if “service with a smile” is authentic? An expectancy-based model of customer race and differential service reactions“, Organizational Behavior and Human Decision Processes, Vol. 144 No., pp. 85-96.
Mattila A.S., Grandey A.A. and Fisk G.M. (2003), “The interplay of gender and affective tone in service encounter satisfaction“, Journal of Service Research, Vol. 6 No. 2, pp. 136-143.
Mende M., Scott M.L., van Doorn J., Grewal D. and Shanks I. (2019), “Service robots rising: How humanoid robots influence service experiences and elicit compensatory consumer responses“, Journal of Marketing Research, Vol. 56 No. 4, pp. 535-556.
Merkle M. (2019) Customer responses to service robots–comparing human-robot interaction with human-human interaction. Proceedings of the 52nd Hawaii International Conference on System Sciences, pp. 1396-1405.
SoftBank (2019), “The power of robotics to benefit humanity“, available at: https://www.softbank.jp/en/robot/ (accessed January 29, 2020).
Stock R.M. and Merkle M. (2018) Can humanoid service robots perform better than service employees? A comparison of innovative behavior cues. Proceedings of the 51st Hawaii International Conference on System Sciences, pp. 1056-1065.
Stock R.M. and Nguyen M.A. (2019) Robotic psychology. What do we know about human-robot interaction and what do we still need to learn? Proceedings of the 52nd Hawaii international conference on system sciences, pp. 1936-1945.
van Pinxteren M.M.E., Wetzels R.W.H., Rüger J., Pluymaekers M. and Wetzels M. (2019), “Trust in humanoid robots: implications for services marketing“, Journal of Services Marketing, Vol. 33 No. 4, pp. 507-518.

328
6
Wirtz J., Patterson P.G., Kunz W.H., Gruber T., Lu V.N., Paluch S. and Martins A. (2018), “Brave new world: service robots in the frontline“, Journal of Service Management,Vol. 29 No. 5, pp. 907-931.
KeywordsService robots, Service employees, Emotional labour, Customer perception, Experimental study
329
6
Wirtz J., Patterson P.G., Kunz W.H., Gruber T., Lu V.N., Paluch S. and Martins A. (2018), “Brave new world: service robots in the frontline“, Journal of Service Management,Vol. 29 No. 5, pp. 907-931.
KeywordsService robots, Service employees, Emotional labour, Customer perception, Experimental study
IMPULSE BUYING AND E-GROCERY: A CONCEPTUAL MODEL
Benedetta Grandi
Department of Economics
University of Parma, Italy
Via Kennedy 6, 43123 Parma (Italy)
E-mail: [email protected]
Tel: +39 0521 902479
Maria Grazia Cardinali
Department of Economics
University of Parma, Italy
E-mail: [email protected]
Tel: +39 0521 032439
Introduction
The growing penetration of digital technologies and mobile devices is transforming individuals’ life in every aspect, from the way people communicate to the design of the shopping cycle they face, from the information seeking to the purchase itself. The boundaries between online and offline environment are just crossed.
The phenomenon of e-commerce in the Italian context is expected to show a growth rate of 7,3% in the period 2020-2024. The market's largest segment is Electronics & Media, while Food and Personal Care sector represents the 12% of the market value in 2020 (Statista).
With the growing acceptance of the Internet among the population and the rapid growth of multi-channel sales, consumers are constantly exposed to marketing stimuli that seek to stimulate impulse buying. For example, the web is an alternative channel to stimulate impulse purchases and allows the consumer to buy during his free time, offering shopping opportunities 24 hours a day and seven days a week, anywhere (Phau & Lo, 2004).
Consumers often act impulsively when making online decisions. In fact, the 40 percent of online purchases can be defined on impulse. This is triggered by easy access to products, ease of purchase (just a click to order) and absence of social pressures and efforts (Jeffrey & Hodge, 2007).
So what about e-grocery? How consumers behave when they buy food products online? Is the phenomenon of impulse buying still present online? If yes, to what extent? In the literature, many studies have identified the variables affecting impulse buying during the physical grocery shopping trip (Beatty & Elizabeth Ferrell, 1998; Bhakat & Muruganantham, 2013; Hultén & Vanyushyn, 2011). Prior research on impulse buying in grocery sector found its antecedents in three main categories which include both endogenous and exogenous variables: individual characteristics (Weun, 1998); product category variables and type of food consumed (Inman et al., 2009; Jones et al., 2003; Mishra et al., 2012) and situational factors (Beatty & Elizabeth Ferrell, 1998; Belk, 1975).

330
Other studies have focused their attention on developing models in order to understand the impulse buying behaviour also online, but mainly in sectors other than the grocery one, like fashion or electronics and media (Jeffrey & Hodge, 2007). Thus, the present work, by combining the theory of offline impulse buying in the grocery sector and online impulse buying, intends to measure the phenomenon of impulse buying in the e-grocery context.
Conceptual framework
Online shopping frees consumers from the restrictions that occur in offline shopping, increasing the chances of the adoption of impulsive behaviours (Chan et al., 2017). Thus, it is reasonable to think that this can also occur while people look for food products. Many researchers have identify two main types of variables: endogenous and exogenous. The endogenous ones focus directly on the individual, examining the personal characteristics that push him to implement impulsive purchasing behaviour. These factors concern the personality of consumers, their inner tendency to behave impulsively, emotional states and socio-demographic factors (Kacen & Lee, 2002).
On the other hand, the exogenous variables refer to marketing stimuli that aim to influence urge to buy impulsively and then consumer’s actual purchasing behaviour (Dawson & Kim, 2009). In particular, different authors have found in website design, assortment, price, website usability,money and time spent online as antecedents of impulse buying.
Specifically, Jeffrey and Hodge (Jeffrey & Hodge, 2007) studied the influence of the amount of money spent by consumers on the likelihood that consumers would purchase a product impulsively. The results of a logistic regression analysis have shown a significant effect: the higher the amount spent, the higher the amount of purchases made on impulse. Similarly, the more time spent browsing on the website looking for food products, the more purchases are made impulsively. This because the possibility to see more products could increase the probability to buy something not planned before (Buttle, 1984).
Furthermore, also the products offered, the prices and how the website is design could influence the way customers browse the web and consequently the urge to buy impulsively and then the impulsive behaviour. Researches speak of level of attractiveness of the assortment, in terms of perception of the assortment size, adequacy of the value for money of the products offered, the average level of price, presence of price-cut, consistency with consumer's interest (Newman, 2015).The amount of purchases made impulsively increases when customers have a positive perception and attitude towards assortment and price.
In the same way, also perceived ease experienced while visiting the online store has an impact on shopping behaviour. Specifically, is has been found that a positive evaluation of the site's usability, including ease of use, and the design of the website, arouse positive emotions and this leads to a positive impact on impulse buying behaviour (Éthier et al., 2006).
Finally, a great importance must be given to the device through which customers make their shopping. Many studies have, in fact, found that the touch interfaces can change consumer behaviour (Brasel & Gips, 2014). However, according to the authors’ knowledge, no clear evidences are given about the effect on impulse buying behaviour in the grocery setting.
Purpose
Given all the above considerations, the present work wants to measure the phenomenon of impulse buying in the e-grocery sector. In doing so, we have combined the models already tested in the literature. In particular we took into consideration the impulse buying models in the grocery sector(offline purchases) and the models in the online environment (not specifically tested for food products). Furthermore, we wanted to test the impact of the device (mobile vs computer) on shoppers impulsivity.
331
Other studies have focused their attention on developing models in order to understand the impulse buying behaviour also online, but mainly in sectors other than the grocery one, like fashion or electronics and media (Jeffrey & Hodge, 2007). Thus, the present work, by combining the theory of offline impulse buying in the grocery sector and online impulse buying, intends to measure the phenomenon of impulse buying in the e-grocery context.
Conceptual framework
Online shopping frees consumers from the restrictions that occur in offline shopping, increasing the chances of the adoption of impulsive behaviours (Chan et al., 2017). Thus, it is reasonable to think that this can also occur while people look for food products. Many researchers have identify two main types of variables: endogenous and exogenous. The endogenous ones focus directly on the individual, examining the personal characteristics that push him to implement impulsive purchasing behaviour. These factors concern the personality of consumers, their inner tendency to behave impulsively, emotional states and socio-demographic factors (Kacen & Lee, 2002).
On the other hand, the exogenous variables refer to marketing stimuli that aim to influence urge to buy impulsively and then consumer’s actual purchasing behaviour (Dawson & Kim, 2009). In particular, different authors have found in website design, assortment, price, website usability,money and time spent online as antecedents of impulse buying.
Specifically, Jeffrey and Hodge (Jeffrey & Hodge, 2007) studied the influence of the amount of money spent by consumers on the likelihood that consumers would purchase a product impulsively. The results of a logistic regression analysis have shown a significant effect: the higher the amount spent, the higher the amount of purchases made on impulse. Similarly, the more time spent browsing on the website looking for food products, the more purchases are made impulsively. This because the possibility to see more products could increase the probability to buy something not planned before (Buttle, 1984).
Furthermore, also the products offered, the prices and how the website is design could influence the way customers browse the web and consequently the urge to buy impulsively and then the impulsive behaviour. Researches speak of level of attractiveness of the assortment, in terms of perception of the assortment size, adequacy of the value for money of the products offered, the average level of price, presence of price-cut, consistency with consumer's interest (Newman, 2015).The amount of purchases made impulsively increases when customers have a positive perception and attitude towards assortment and price.
In the same way, also perceived ease experienced while visiting the online store has an impact on shopping behaviour. Specifically, is has been found that a positive evaluation of the site's usability, including ease of use, and the design of the website, arouse positive emotions and this leads to a positive impact on impulse buying behaviour (Éthier et al., 2006).
Finally, a great importance must be given to the device through which customers make their shopping. Many studies have, in fact, found that the touch interfaces can change consumer behaviour (Brasel & Gips, 2014). However, according to the authors’ knowledge, no clear evidences are given about the effect on impulse buying behaviour in the grocery setting.
Purpose
Given all the above considerations, the present work wants to measure the phenomenon of impulse buying in the e-grocery sector. In doing so, we have combined the models already tested in the literature. In particular we took into consideration the impulse buying models in the grocery sector(offline purchases) and the models in the online environment (not specifically tested for food products). Furthermore, we wanted to test the impact of the device (mobile vs computer) on shoppers impulsivity.
Design/methodology/approach
In order to meet our goal, we conducted an experiment in a laboratory setting. We divided a sample of 122 participants (80% female, 25 average age) into two homogeneous groups for each of the devices considered (mobile and computer). Then, we asked them to fill in a brief questionnaire about their shopping habits, socio-demographic characteristics and their diet and to draw up a shopping list imagining to recreate a real shopping experience. Then, they were invited to browse the online shopping page of a leading Italian chain using the mobile app or the website. After the online grocery shopping they were asked to express an opinion about their experience and their perception about the assortment, the price, the site design and the site usability and the urge felt by participant to buy impulsively during the shopping. Then, we took note of the total amount and the time spent for the purchases. Finally, we measured the impulse buying comparing the basket of each participant with the shopping list drafted at the beginning of the experiment. All the data has been analyzed using SmartPLS package and a model has been proposed.
Findings
Looking at the results of the of the structural equation model we found that the site design influences the way customers browse the web and have a positive impact on impulsive purchases. On the contrary, we found a negative relationship between site usability and browsing. We found no relationship between assortment and price perception on browsing and impulse buying. Furthermore, we found a positive impact of money spent on impulse buying, while we found no effect of the time spent for the shopping. Finally, concerning the device, we found that participants experienced more impulsive purchases when the shop using a computer rather than using the mobile app.
Originality/value
The present work is the first attempt to analyze and measure the phenomenon of impulse buying behaviour in the e-grocery sector and the role of the device on the shopping experience.
Managerial implications
These results could help retailers to better understand how consumers behave when they shop online and to develop different marketing strategies based on the device used.
Research limitations
The limitations of the present work are connected with the sample size, not really representative of a larger population since we considered the website/app of a single Italian retailer. Finally, we conducted our measures in a laboratory setting and not considering real situations.
References
Beatty, S. E., & Elizabeth Ferrell, M. (1998). Impulse buying: Modeling its precursors. Journal of Retailing, 74(2), 161–167. https://doi.org/10.1016/S0022-4359(98)90009-4
Belk, R. W. (1975). Situational Variables and Consumer Behavior. Journal of Consumer Research,2(3), 157. https://doi.org/10.1086/208627
Bhakat, R. S., & Muruganantham, G. (2013). A Review of Impulse Buying Behavior. International Journal of Marketing Studies, 5(3). https://doi.org/10.5539/ijms.v5n3p149
Brasel, S. A., & Gips, J. (2014). Tablets, touchscreens, and touchpads: How varying touch interfaces trigger psychological ownership and endowment. Journal of Consumer Psychology, 24(2), 226–233. https://doi.org/10.1016/j.jcps.2013.10.003
Buttle, F. (1984). Merchandising. European Journal of Marketing, 18(6/7), 104–123.https://doi.org/10.1108/EUM0000000004795

332
Chan, T. K. H., Cheung, C. M. K., & Lee, Z. W. Y. (2017). The state of online impulse-buying research: A literature analysis. Information & Management, 54(2), 204–217. https://doi.org/10.1016/j.im.2016.06.001
Dawson, S., & Kim, M. (2009). External and internal trigger cues of impulse buying online. Direct Marketing: An International Journal, 3(1), 20–34. https://doi.org/10.1108/17505930910945714
Éthier, J., Hadaya, P., Talbot, J., & Cadieux, J. (2006). B2C web site quality and emotions during online shopping episodes: An empirical study. Information & Management, 43(5), 627–639.https://doi.org/10.1016/j.im.2006.03.004
Hultén, P., & Vanyushyn, V. (2011). Impulse purchases of groceries in France and Sweden. Journal of Consumer Marketing, 28(5), 376–384. https://doi.org/10.1108/07363761111150026
Inman, J. J., Winer, R. S., & Ferraro, R. (2009). The Interplay Among Category Characteristics, Customer Characteristics, and Customer Activities on In-Store Decision Making. Journal of Marketing, 73(5), 19–29. https://doi.org/10.1509/jmkg.73.5.19
Jeffrey, S. A., & Hodge, R. (2007). Factors influencing impulse buying during an online purchase. Electronic Commerce Research, 7(3–4), 367–379. https://doi.org/10.1007/s10660-007-9011-8
Jones, M. A., Reynolds, K. E., Weun, S., & Beatty, S. E. (2003). The product-specific nature of impulse buying tendency. Journal of Business Research, 56(7), 505–511.https://doi.org/10.1016/S0148-2963(01)00250-8
Kacen, J. J., & Lee, J. A. (2002). The Influence of Culture on Consumer Impulsive Buying Behavior. Journal of Consumer Psychology, 12(2), 163–176.https://doi.org/10.1207/S15327663JCP1202_08
Mishra, A., Mishra, H., & Masters, T. M. (2012). The Influence of Bite Size on Quantity of Food Consumed: A Field Study: Figure 1. Journal of Consumer Research, 38(5), 791–795.https://doi.org/10.1086/660838
Newman, A. (2015). Impulse Purchasing. In C. L. Cooper (Ed.), Wiley Encyclopedia of Management (pp. 1–1). John Wiley & Sons, Ltd. https://doi.org/10.1002/9781118785317.weom090472
Phau, I., & Lo, C. (2004). Profiling fashion innovators: A study of self‐concept, impulse buying and Internet purchase intent. Journal of Fashion Marketing and Management: An International Journal, 8(4), 399–411. https://doi.org/10.1108/13612020410559993
Weun, S. (1998). DEVELOPMENT AND VALIDATION OF THE IMPULSE BUYING TENDENCY SCALE. Psychological Reports, 82(3), 1123. https://doi.org/10.2466/PR0.82.3.1123-1133
333
Chan, T. K. H., Cheung, C. M. K., & Lee, Z. W. Y. (2017). The state of online impulse-buying research: A literature analysis. Information & Management, 54(2), 204–217. https://doi.org/10.1016/j.im.2016.06.001
Dawson, S., & Kim, M. (2009). External and internal trigger cues of impulse buying online. Direct Marketing: An International Journal, 3(1), 20–34. https://doi.org/10.1108/17505930910945714
Éthier, J., Hadaya, P., Talbot, J., & Cadieux, J. (2006). B2C web site quality and emotions during online shopping episodes: An empirical study. Information & Management, 43(5), 627–639.https://doi.org/10.1016/j.im.2006.03.004
Hultén, P., & Vanyushyn, V. (2011). Impulse purchases of groceries in France and Sweden. Journal of Consumer Marketing, 28(5), 376–384. https://doi.org/10.1108/07363761111150026
Inman, J. J., Winer, R. S., & Ferraro, R. (2009). The Interplay Among Category Characteristics, Customer Characteristics, and Customer Activities on In-Store Decision Making. Journal of Marketing, 73(5), 19–29. https://doi.org/10.1509/jmkg.73.5.19
Jeffrey, S. A., & Hodge, R. (2007). Factors influencing impulse buying during an online purchase. Electronic Commerce Research, 7(3–4), 367–379. https://doi.org/10.1007/s10660-007-9011-8
Jones, M. A., Reynolds, K. E., Weun, S., & Beatty, S. E. (2003). The product-specific nature of impulse buying tendency. Journal of Business Research, 56(7), 505–511.https://doi.org/10.1016/S0148-2963(01)00250-8
Kacen, J. J., & Lee, J. A. (2002). The Influence of Culture on Consumer Impulsive Buying Behavior. Journal of Consumer Psychology, 12(2), 163–176.https://doi.org/10.1207/S15327663JCP1202_08
Mishra, A., Mishra, H., & Masters, T. M. (2012). The Influence of Bite Size on Quantity of Food Consumed: A Field Study: Figure 1. Journal of Consumer Research, 38(5), 791–795.https://doi.org/10.1086/660838
Newman, A. (2015). Impulse Purchasing. In C. L. Cooper (Ed.), Wiley Encyclopedia of Management (pp. 1–1). John Wiley & Sons, Ltd. https://doi.org/10.1002/9781118785317.weom090472
Phau, I., & Lo, C. (2004). Profiling fashion innovators: A study of self‐concept, impulse buying and Internet purchase intent. Journal of Fashion Marketing and Management: An International Journal, 8(4), 399–411. https://doi.org/10.1108/13612020410559993
Weun, S. (1998). DEVELOPMENT AND VALIDATION OF THE IMPULSE BUYING TENDENCY SCALE. Psychological Reports, 82(3), 1123. https://doi.org/10.2466/PR0.82.3.1123-1133
1
IMPULSIVE AND COMPULSIVE PURCHASE IN THE DIGITAL MOBILE ENVIRONMENT
Author 1:
- FirstName: Yuchen SurName: Zhang
- Department: Faculty of Economics & Business.
- University, city, country: Complutense University of Madrid (Spain)
- Email: [email protected]
Author 2:- FirstName: María SurName: Puelles-Gallo
- Department: Faculty of Economics & Business.
- University, city, country: Complutense University of Madrid (Spain)
- Email: [email protected]
Author 3:- FirstName: Karine SurName: Picot-Coupey
- Department: CREM UMR CNRS 6211
- University, city, country: University of Rennes 1 (France)
- Email: [email protected]
The suggestions of the reviewers:
-Reviewers´ 1 :This research presents a quantitative future research. The aim of the study is analyzing the use of smatrphones and impulsive/compulsive purchasing behaviors. terms potentially related in a theoretical model addressed to identify relationships between the smartphone use as a purchase channel. It considers a lot of variables and there are two main dependent ones: impulsive and compulsive purchase.
Motivations is a variable not defined. It needs to specify its role before presenting criteria or indicators.
-Reviewers’ 2: I commend the authors for taking on this research. However, it needs much improvement in different sections. Firstly, this study is not new in the field, as authors have claimed it to be be the first one. Secondly, there is lack of over-arching theoretical framework which guide the flow of the study. In result, the constructs
334
2
selected for study looks random and scattered with no logical inter-connection. Secondly, authors need to go through the recent literature to justify their study novelty and significance. Here are some suggestive piece of research which may help the authors to improve their work (1- Understanding Compulsive Buying Behavior of Mobile Shoppers for Fashion Products- 2019- by Gulandom Aminjonova, 2- How do product recommendations affect impulse buying? An empirical study on WeChat social commerce- 2018 by Yanhong Chen, 3- Factors Affecting Online Impulse Buying: Evidence from Chinese Social Commerce Environment- 2018- by Umair Akram, 4- Understanding impulse buying in mobile commerce: An investigation into hedonic and utilitarian browsing- 2019 by Xiabing Zheng, 5- What drives impulse buying behaviors in a mobile auction? The perspective of the Stimulus-Organism-Response model- 2018 by Chia Chen). ”
ABSTRACT
Mobile commerce (m-commerce) is growing steadily all over the world, introducing substantial changes in the way people buy, and potentially affecting consumption habits. The present study focuses on the investigation of the behavioral dimensions of impulsive buying through hedonic/utilitarian set of motivations within the mobile shopping environment. Impulsive buying accounts for a significant part of sells in the retail sector. Past studies point out that m-commerce would increase consumers’impulse buying behavior. The objective of the research consists in analyzing the effect and correlation of exposure to smartphone functions with the development of impulsive and eventually compulsive purchases among young people within a cross-cultural perspective. To achieve this objective a model is designed in order to identify the relationships between the smartphone use as a purchase channel and hedonic/utilitarian motivations mediated by a set of situational factors that are commonly found in mobile digital platforms. This model construct is designed to examine the impact of seven technological factors that are related to the impulse/inhibition of making unplanned purchases in mobile environment through hedonic/utilitarian motivations: 1) Comparators, Price & Product Information; 2) Serendipity; 3) Mobile payment; 4) Brand awareness and involvement; 5) eWOM and online peer recommendations; 6) Big Data and profile-targeted advertising; 7) SNS image activity and personal photographs. Next, comparative empirical data are obtained in a cross-cultural perspective study in order to identify variations in motivations and the related factors between young consumers in Spain, France and China. The materials and method are described to include both qualitative and quantitative data from Focus Group and Survey.
Keywords: m-commerce, retail, consumer behavior, impulsive/compulsive, cross-cultural

335
2
selected for study looks random and scattered with no logical inter-connection. Secondly, authors need to go through the recent literature to justify their study novelty and significance. Here are some suggestive piece of research which may help the authors to improve their work (1- Understanding Compulsive Buying Behavior of Mobile Shoppers for Fashion Products- 2019- by Gulandom Aminjonova, 2- How do product recommendations affect impulse buying? An empirical study on WeChat social commerce- 2018 by Yanhong Chen, 3- Factors Affecting Online Impulse Buying: Evidence from Chinese Social Commerce Environment- 2018- by Umair Akram, 4- Understanding impulse buying in mobile commerce: An investigation into hedonic and utilitarian browsing- 2019 by Xiabing Zheng, 5- What drives impulse buying behaviors in a mobile auction? The perspective of the Stimulus-Organism-Response model- 2018 by Chia Chen). ”
ABSTRACT
Mobile commerce (m-commerce) is growing steadily all over the world, introducing substantial changes in the way people buy, and potentially affecting consumption habits. The present study focuses on the investigation of the behavioral dimensions of impulsive buying through hedonic/utilitarian set of motivations within the mobile shopping environment. Impulsive buying accounts for a significant part of sells in the retail sector. Past studies point out that m-commerce would increase consumers’impulse buying behavior. The objective of the research consists in analyzing the effect and correlation of exposure to smartphone functions with the development of impulsive and eventually compulsive purchases among young people within a cross-cultural perspective. To achieve this objective a model is designed in order to identify the relationships between the smartphone use as a purchase channel and hedonic/utilitarian motivations mediated by a set of situational factors that are commonly found in mobile digital platforms. This model construct is designed to examine the impact of seven technological factors that are related to the impulse/inhibition of making unplanned purchases in mobile environment through hedonic/utilitarian motivations: 1) Comparators, Price & Product Information; 2) Serendipity; 3) Mobile payment; 4) Brand awareness and involvement; 5) eWOM and online peer recommendations; 6) Big Data and profile-targeted advertising; 7) SNS image activity and personal photographs. Next, comparative empirical data are obtained in a cross-cultural perspective study in order to identify variations in motivations and the related factors between young consumers in Spain, France and China. The materials and method are described to include both qualitative and quantitative data from Focus Group and Survey.
Keywords: m-commerce, retail, consumer behavior, impulsive/compulsive, cross-cultural
3
336
4
EXTENDED ABSTRACT
Introduction
The adoption of smartphones and permanent connectivity on the Internet is a
technological factor with great social, economic and cultural implications. To take
advantage of the commercial potential of this mobile ecosystem, companies and
retailers develop functional tools that enhance the use of mobile commerce
(m-commerce) and transform smartphone into a ubiquitous purchase device.
Consumption habits are greatly influenced by the technological environment,
channels and tools available to proceed to the purchasing act. Smartphones currently
represent the largest-scale technology used by commerce (GSM, 2019). The
commercial use of smartphone also implies multi and cross channel strategies and
shopping behavior, especially important for the future of retailing.
Justification
The use of smartphones entails the rapid change in the organization of retailing
(Maity & Dass, 2014; Parker & Wang, 2016). Commercial offer from companies and
purchasing acts from customers can be made ubiquitous through online access,
everywhere, at any time and any place. It is fundamental to analyze possible
relationships between smartphone use and impulses in the purchase decision process
and the level of control over consumer habits. As it was historically the case for
television sales channels and advertising for example, technological innovations can
rise impulsive buying and contribute to the development of compulsive behaviors,
especially when combined with factors of enhancing personal appearance or social
image (Lee, Lennon & Rudd, 2000).
The study of impulsive behavior is crucial from the point of view of retailers,
because it can explain a very significant part of product sales, especially in some
sectors such as fashion (Bayley & Nancarrow, 1998; Dhurup, 2014). In addition,
studies indicate that consumers themselves do not consider this behavior as
intrinsically bad or harmful even though they may regret some purchases (Hausman,
2000).
337
4
EXTENDED ABSTRACT
Introduction
The adoption of smartphones and permanent connectivity on the Internet is a
technological factor with great social, economic and cultural implications. To take
advantage of the commercial potential of this mobile ecosystem, companies and
retailers develop functional tools that enhance the use of mobile commerce
(m-commerce) and transform smartphone into a ubiquitous purchase device.
Consumption habits are greatly influenced by the technological environment,
channels and tools available to proceed to the purchasing act. Smartphones currently
represent the largest-scale technology used by commerce (GSM, 2019). The
commercial use of smartphone also implies multi and cross channel strategies and
shopping behavior, especially important for the future of retailing.
Justification
The use of smartphones entails the rapid change in the organization of retailing
(Maity & Dass, 2014; Parker & Wang, 2016). Commercial offer from companies and
purchasing acts from customers can be made ubiquitous through online access,
everywhere, at any time and any place. It is fundamental to analyze possible
relationships between smartphone use and impulses in the purchase decision process
and the level of control over consumer habits. As it was historically the case for
television sales channels and advertising for example, technological innovations can
rise impulsive buying and contribute to the development of compulsive behaviors,
especially when combined with factors of enhancing personal appearance or social
image (Lee, Lennon & Rudd, 2000).
The study of impulsive behavior is crucial from the point of view of retailers,
because it can explain a very significant part of product sales, especially in some
sectors such as fashion (Bayley & Nancarrow, 1998; Dhurup, 2014). In addition,
studies indicate that consumers themselves do not consider this behavior as
intrinsically bad or harmful even though they may regret some purchases (Hausman,
2000).
5
Smartphone are powerful communication tools, enhanced by a vast possibility of
complementary applications (Apps) with great commercial implications for retailers.
For consumers, smartphones make the process of finding information about products,
purchase and acquisition faster, less time consuming and less effort consuming.
Furthermore, the desire to possess material goods and the proliferation of stimuli
through technological platforms and projection of personal image in social media are
suspected to create favorable conditions for the development of impulsive and/or
compulsive purchasing acts (Chung, Song & Lee, 2017; Aragoncillo & Orus, 2018).
Bravo (2019) cites the example of people buying clothes just for the purpose of
sharing photos on Instagram. Social networks (SNS) are used to enhance the personal
image and can mediate an increase in impulse purchases (Deters, Mehl & Eid, 2014).
More broadly, digital environment provides a set of functions and stimuli used in
e-retailers’ sales promotion strategy with the goal to create impulsive responses from
consumers (Dawson & Kim, 2010; Lo, Lin & Hsu, 2016),
Therefore, it is very likely that this new technological device could influence the
development of impulsive and compulsive behaviors in consumers during their
purchase process in both online and offline retail channel. The better understanding of
this influence is important both for retailers academic researchers. To date there are
few studies investigating the relationship between the use of smartphones and
impulsive and compulsive purchasing behavior, and none is oriented at a
cross-cultural perspective in order to identify possible variations in the cultural
background of users that could determine situational factors.
In order to contribute to fill the gaps in research in this area, new studies should
focus on the influence of the use of smartphone devices on the incidence lack of
control in shopping behaviors taking into account cultural identity and a set of
situational factors related to the use of mobile technology.
Theoretical Framework
Impulsive buying is a complex phenomenon that, during the last decades, is
mainly analyzed from the point of view of the consumer behavior and its situational
and cognitive context, rather than the mere characteristics of products. As Hausman
338
6
(2000, p.43) points out, impulsive buying “accounts for a substantial volume of the
goods sold every year across a broad range of product categories”.
From the point of view of the psychiatric literature, compulsive buying behavior
is considered an addictive disorder that is diagnosed based on a clinical form (APA,
2012). The damage caused to oneself or to others as a symptom is taken into
consideration. However, as pointed out by Ridgway, Kukar-Kinney & Monroe (2008),
there are many people who suffer from a compulsive behavior that is underlying, not
diagnosed, and that is reflected in attitudes of lack of impulse control purchase. In
addition, the financial statement indicator is not valid for people who have high
incomes. Consequently, they propose a scale of measurement of compulsive buying
behaviors for people who are not diagnosed with psychiatric disorder. This can serve
as a research basis from the perspective of consumer’s behavior in different contexts,
coupled with items referring to the motivations of buying and the
facilitating/inhibiting factors. In the marketing literature, this approach is considered
valid and effective, and had been used in several previous investigations (He,
Kukar-Kinney & Ridgway, 2018; Horváth & Adigüzel, 2018). From this point of view,
impulsive buying can be considered a precursor of compulsive buying when it comes
to the factor of repetition (Park, Kim & Cardona, 2006).
The act of purchase is described as a constructive process driven by motivation
(Hausman, 20000; Solomon, 2018; Zheng et al. 2019). Consumers evaluate a set of
internal factors (their needs, their desires, their cultural profile, etc.) and external
factors (the extent of the offer, the price, the efforts necessary to make the purchase
through the channel, etc.) in order to establish purchasing habits and self-regulation
mechanisms. These are consolidated through shopping routines. When consumer
behavior is out of the patterns of self-regulated habits then impulsive purchases appear.
When impulsive purchases are repeated regularly, and are perceived as a pressing
need on the part of the consumer, it can be described as a compulsive behavior. The
consolidation of this type of behavior can lead to serious financial problems and a
failure to manage personal life goals in the long term (Dittmar, 2004).
For the present study, following previous literature (Hausman, 2000; Lo, Lin &
Hsu, 2016; Akram et al 2018; He, Kukar-Kinney & Ridgway, 2018; Zheng et al.
2019), we consider that motivation shopping includes two main dimensions: hedonic
339
6
(2000, p.43) points out, impulsive buying “accounts for a substantial volume of the
goods sold every year across a broad range of product categories”.
From the point of view of the psychiatric literature, compulsive buying behavior
is considered an addictive disorder that is diagnosed based on a clinical form (APA,
2012). The damage caused to oneself or to others as a symptom is taken into
consideration. However, as pointed out by Ridgway, Kukar-Kinney & Monroe (2008),
there are many people who suffer from a compulsive behavior that is underlying, not
diagnosed, and that is reflected in attitudes of lack of impulse control purchase. In
addition, the financial statement indicator is not valid for people who have high
incomes. Consequently, they propose a scale of measurement of compulsive buying
behaviors for people who are not diagnosed with psychiatric disorder. This can serve
as a research basis from the perspective of consumer’s behavior in different contexts,
coupled with items referring to the motivations of buying and the
facilitating/inhibiting factors. In the marketing literature, this approach is considered
valid and effective, and had been used in several previous investigations (He,
Kukar-Kinney & Ridgway, 2018; Horváth & Adigüzel, 2018). From this point of view,
impulsive buying can be considered a precursor of compulsive buying when it comes
to the factor of repetition (Park, Kim & Cardona, 2006).
The act of purchase is described as a constructive process driven by motivation
(Hausman, 20000; Solomon, 2018; Zheng et al. 2019). Consumers evaluate a set of
internal factors (their needs, their desires, their cultural profile, etc.) and external
factors (the extent of the offer, the price, the efforts necessary to make the purchase
through the channel, etc.) in order to establish purchasing habits and self-regulation
mechanisms. These are consolidated through shopping routines. When consumer
behavior is out of the patterns of self-regulated habits then impulsive purchases appear.
When impulsive purchases are repeated regularly, and are perceived as a pressing
need on the part of the consumer, it can be described as a compulsive behavior. The
consolidation of this type of behavior can lead to serious financial problems and a
failure to manage personal life goals in the long term (Dittmar, 2004).
For the present study, following previous literature (Hausman, 2000; Lo, Lin &
Hsu, 2016; Akram et al 2018; He, Kukar-Kinney & Ridgway, 2018; Zheng et al.
2019), we consider that motivation shopping includes two main dimensions: hedonic 7
shopping motivation and utilitarian shopping motivation, each one influenced by
several determinant factors. In fact, “most typologies consider instrumental and
hedonic motivations as fundamental to understanding consumer shopping behavior
because they maintain a basic underlying presence across consumption phenomena”
(Childers et al., 2001, p.513).
In previous studies, the relationship between the impulsive buying and
smartphone use as a purchase channel has been analyzed from different theoretical
perspectives: the Signaling Theory (Chen et al. 2019), pointing out that smartphones
functions are conveying informational cues that facilitate the decision-making; the
Stimulus-Organism-Response (S-O-R) model, with a measurement of hedonic
motivations triggered by external and situational factors (Chang, Eckamn & Yan,
2011; Chen & Yao, 2018); the cognitive decision-making process, conceptualized into
the Engel, Kollat, and Blackwell model (EKB model) (Lo, Lin & Hsu, 2016). Some
studies don’t use a specific theoretical foundation and propose to study the impulsive
buying from an empiric and behavioral perspective, in social media platforms,
applying a model with different dimensions related hedonic shopping values and
situational factors (Akram et al. 2019), or based on the measurement of materialistic
values from consumers (Aminjonova & Jun, 2019).
Fort the present study, in order to research the relationship between use of
smartphone devices and impulsive/compulsive purchases, we use a motivation model
based in seven constructs identified in the literature review a technological and
situational factors: 1) Comparators, Price & Product Information; 2) Serendipity; 3)
Mobile payment; 4) Brand awareness and involvement; 5) eWOM and online peer
recommendations; 6) Big Data and profile-targeted advertising; 7) SNS image activity
and personal photographs (All detailed in “Research Model” section).
Research objective
The general objective of the research work consists in analyzing the effect and
correlation of exposure to mobile phone internet functions with the development of
impulsive and compulsive purchases among young people. Comparative empirical
data are obtained in a cross-cultural perspective with consumers in China, France and
Spain. The model construct is designed to over-ach several dimensions
340
8
Consumer behavior is a particularly complex reality since it is influenced by a
great variety of internal factors (personality, personal characteristics, perceived needs,
tastes, etc.), external factors (channels, access, efforts, price, etc.) and social
circumstances (Solomon, 2018; Aminjonova & Jun, 2019). For this study, we are
particularly interested in an external factor that is the availability of a smartphone to
make purchases and to what extent it can affect the purchasing process in retailer
channels, the degree of planning and the level of self-control for consumers, en
relation to the type of motivation.
Research model
To achieve the objective, a model is proposed based on hedonic motivations and
utilitarian motivations. These two groups of motivations constitute two different but
interrelated poles in the model: the utilitarian set of motivations is mainly based on
rational considerations and behavior planning. On the other hand, the hedonistic set of
motivations is mainly based on emotional-type evaluations and pleasure oriented
experiences, with a reduced planning margin. An act of purchase is influenced by a
combination of the factors belonging to these two poles (Childers et alt. 2001;
O’Brien, 2010; Parker & Wang, 2016; Zheng et al. 2019). The proposed model is
based on a scale to measure hedonic and utilitarian motivations associated to seven
situational factors commonly found in mobile commerce environment. These seven
factors are described as follow and outlined in Figure 1:
• Comparator (Price & Product Information): services and platforms that allow
consumers to perform searches and price comparisons (Cliquet et al. 2014,
2015).
• Serendipity: it refers to the product information that reaches the Internet user
while not looking for it (Chung, Song & Lee, 2017).
• Mobile payment: the development of mobile payment methods affects both
electronic commerce and purchases made in physical stores (Garrett et al.
2014).
• Brand awareness and involvement: basically defined as the level of consumer
consciousness of a company, this concept extends to personal adhesion to the
341
8
Consumer behavior is a particularly complex reality since it is influenced by a
great variety of internal factors (personality, personal characteristics, perceived needs,
tastes, etc.), external factors (channels, access, efforts, price, etc.) and social
circumstances (Solomon, 2018; Aminjonova & Jun, 2019). For this study, we are
particularly interested in an external factor that is the availability of a smartphone to
make purchases and to what extent it can affect the purchasing process in retailer
channels, the degree of planning and the level of self-control for consumers, en
relation to the type of motivation.
Research model
To achieve the objective, a model is proposed based on hedonic motivations and
utilitarian motivations. These two groups of motivations constitute two different but
interrelated poles in the model: the utilitarian set of motivations is mainly based on
rational considerations and behavior planning. On the other hand, the hedonistic set of
motivations is mainly based on emotional-type evaluations and pleasure oriented
experiences, with a reduced planning margin. An act of purchase is influenced by a
combination of the factors belonging to these two poles (Childers et alt. 2001;
O’Brien, 2010; Parker & Wang, 2016; Zheng et al. 2019). The proposed model is
based on a scale to measure hedonic and utilitarian motivations associated to seven
situational factors commonly found in mobile commerce environment. These seven
factors are described as follow and outlined in Figure 1:
• Comparator (Price & Product Information): services and platforms that allow
consumers to perform searches and price comparisons (Cliquet et al. 2014,
2015).
• Serendipity: it refers to the product information that reaches the Internet user
while not looking for it (Chung, Song & Lee, 2017).
• Mobile payment: the development of mobile payment methods affects both
electronic commerce and purchases made in physical stores (Garrett et al.
2014).
• Brand awareness and involvement: basically defined as the level of consumer
consciousness of a company, this concept extends to personal adhesion to the 9
values and brand image of commercial products (Van Doorn et al. 2010; Liu
et al. 2017).
• eWOM: the word-of-mouth is a powerful vector for recommending products
since it is based on the personal experience of a community of peer
consumers review, affecting decision process both in online and offline
retailer channels (Goldsmith & Horowitz, 2010; Matute, Polo & Utrillas,
2015).
• Big Data: the data obtained from the activity of the users on the Internet
allows sending personalized advertising according to their profile, about
products matching the tastes and personal preferences, incrementing the
opportunities of exposure to serendipity and optimizing the information
research by the consumer (Valls, 2017).
• SNS image and personal photographs: the social network platforms are
mediating the construction of the personal image and its projection towards
the rest of society, and can be a motivation for buying products in order to
share photographs and enhance social prestige (Yu & Ye, 2013; Aragoncillo &
Orus, 2018).
Hypotheses
In order to analyze the effect and correlation of use to smartphone devices with
the development of impulsive/compulsive purchases among young people in China,
Spain and France a total of nine hypotheses are stated:
H1: Impulsive and compulsive behaviors are differentiated by the factor of
repetition and frequency (Kwak et al. 2006; Park, Kim & Cardona, 2006), not taking
into account harm to the self or to others for retailer marketing focused research.
H2: Utilitarian motivations through greater amount information available, and
prices comparison, can also influence the development of impulsive and compulsive
buying because of access to a larger offer of bargains matching the interest of
consumer (Yu & Ye, 2013).
342
10
H3: The availability of mobile payment can reduce the time between decision
making and effective payment of the product, aside from the absence of tangible
representation of money given away, as in credit card payment, reducing margin of
self-control (Park & Burns, 2006; Garrett et al. 2014) both in offline and online
retailing platforms.
H4: Recommendations and satisfactory experiences reviews of the products from
other consumers (eWOM) can increase the impulse of buying (Yu & Ye, 2013; Matute,
Polo-Redondo & Utrillas, 2015; Erkan & Evans, 2016), both from utilitarian and
hedonic perspectives.
H5: Application of Big Data strategies form advertisers can facilitate purchase
without planning and with a reduced margin of self-control, due to more personalized
recommendations and advertising (Valls, 2017), both from utilitarian and hedonic
perspectives.
H6: Personal and identity adhesion to a commercial brand (Brand awareness) can
be an impulsive and compulsive buying factor, mediating a greater emotional
motivation when buying products of this particular brand (Khorrami, Esfidani &
Delavari, 2015; Lee & Workman, 2015) and increasing trust.
H7: A greater time spent on the Internet has a correlation with impulse buying
acts, through the serendipity factor (spontaneous information that reaches users when
they surf the Internet) (Chung, Song & Lee, 2017).
H8.1: The construction of the image and the personal identity through high
visibility on internet social networks (SNS) can have correlation with the
development of impulse buying behaviors (Aragoncillo & Orus, 2018).
H8.2: There is a correlation between the tendency to send personal photographs
in SNS and the development of impulse buying behaviors (Bravo, 2019).
H9: There is an influence of sociocultural contexts in the development of
impulsive and compulsive traits in consumption (Horváth, Adigüzel & Herk, 2013).
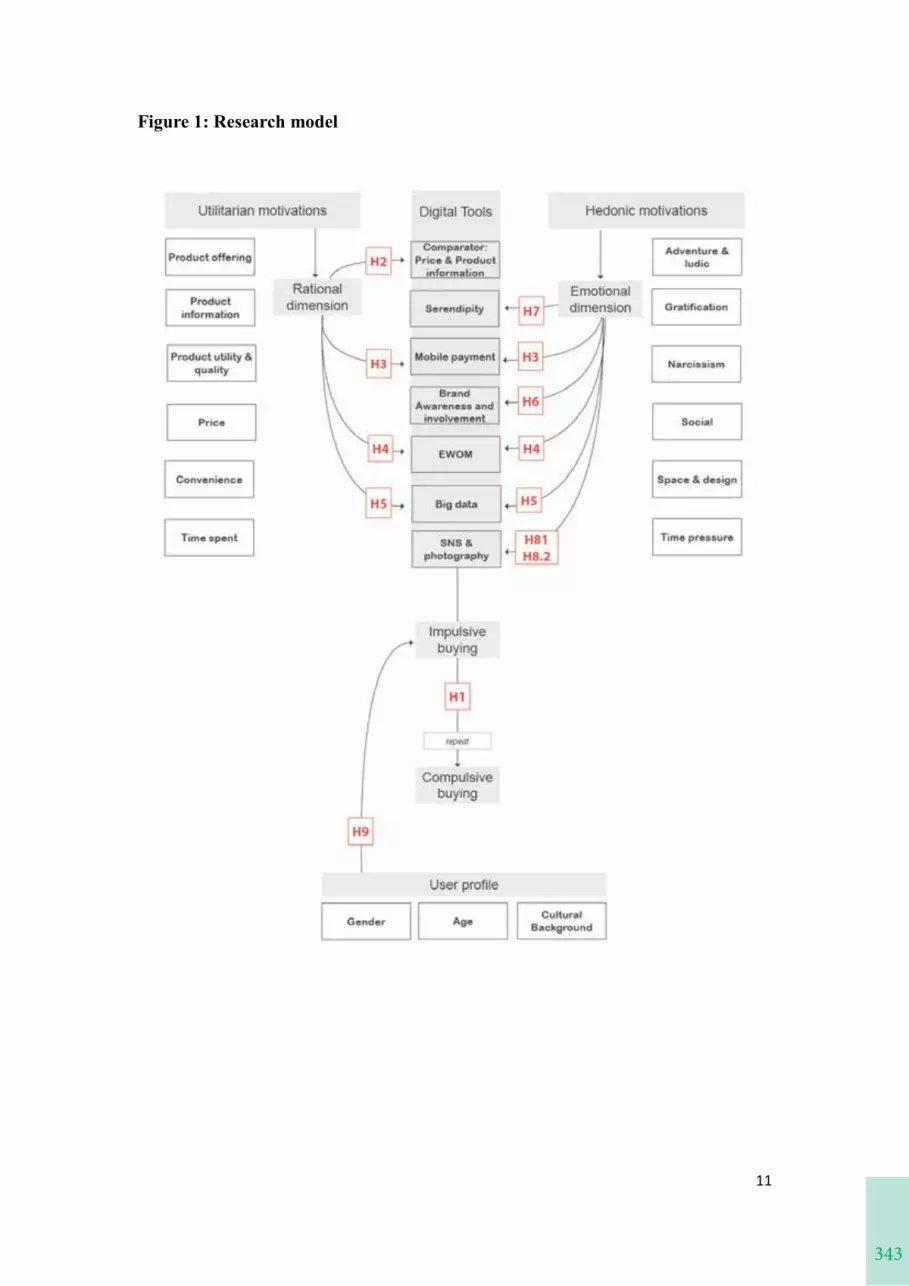
343
10
H3: The availability of mobile payment can reduce the time between decision
making and effective payment of the product, aside from the absence of tangible
representation of money given away, as in credit card payment, reducing margin of
self-control (Park & Burns, 2006; Garrett et al. 2014) both in offline and online
retailing platforms.
H4: Recommendations and satisfactory experiences reviews of the products from
other consumers (eWOM) can increase the impulse of buying (Yu & Ye, 2013; Matute,
Polo-Redondo & Utrillas, 2015; Erkan & Evans, 2016), both from utilitarian and
hedonic perspectives.
H5: Application of Big Data strategies form advertisers can facilitate purchase
without planning and with a reduced margin of self-control, due to more personalized
recommendations and advertising (Valls, 2017), both from utilitarian and hedonic
perspectives.
H6: Personal and identity adhesion to a commercial brand (Brand awareness) can
be an impulsive and compulsive buying factor, mediating a greater emotional
motivation when buying products of this particular brand (Khorrami, Esfidani &
Delavari, 2015; Lee & Workman, 2015) and increasing trust.
H7: A greater time spent on the Internet has a correlation with impulse buying
acts, through the serendipity factor (spontaneous information that reaches users when
they surf the Internet) (Chung, Song & Lee, 2017).
H8.1: The construction of the image and the personal identity through high
visibility on internet social networks (SNS) can have correlation with the
development of impulse buying behaviors (Aragoncillo & Orus, 2018).
H8.2: There is a correlation between the tendency to send personal photographs
in SNS and the development of impulse buying behaviors (Bravo, 2019).
H9: There is an influence of sociocultural contexts in the development of
impulsive and compulsive traits in consumption (Horváth, Adigüzel & Herk, 2013).
11
Figure 1: Research model
344
12
Field work
Due to the complexity of the factors that intervene into the model, the Fieldwork
is developed in two stages. First obtaining qualitative data collection through focus
groups and then quantitative data collection based on questionnaire survey. The two
research data collection methods are performed with samples of young consumers in
China, Frances and Spain, applying a cross-cultural perspective to point out possible
differences in consumer behavior between western Europe countries (Spain, France)
and China, an emergent country that currently is leader in global m-commerce (Stern,
2019). Cross-country comparison can be performed to get a better understanding and
determining the influence of cultural underlying factors in compulsive/impulsive
consumer behavior research (Horváth, Adigüzel & Herk, 2013; Baker et al. 2014).
The sociodemographic criterion to define the study population is firstly belonging
to the segment of ‘young people’. The young people are usually intense users of
mobile technology and are the main target for m-commerce applications (Zhang et al.
2002; Zhang et al. 2013). For the present study, young people are considered with
biological and social criteria: they are between 18 and 30 years old and they are not
married. Since the study is carried out in a culturally mixed environment, we chose to
define a fairly broad biological age segment (up to 30 years old) but retaining a
criterion of sociocultural behavior typical of a stage of life in which sociocultural
identity is still in the process of construction (the fact of not being married yet).
Qualitative study
The method of focus group is based on obtaining a structured discourse
attributable to a social segment, thanks to the dynamics of the discussion among the
participants selected on their profile and delimited according to social typology
criteria. From the review of the literature on compulsive/impulsive shopping behavior,
three typological criteria are selected for the preparation of focus groups: 1) gender, 2)
the source of income, 3) to be or not an expert in fashion. Focus groups are used at the
stage of designing the quantitative measurement instrument (the questionnaire) to
improve the definition of the variables and the formulation of the questions for the
measure instrument. We currently have done the first focus group session held in
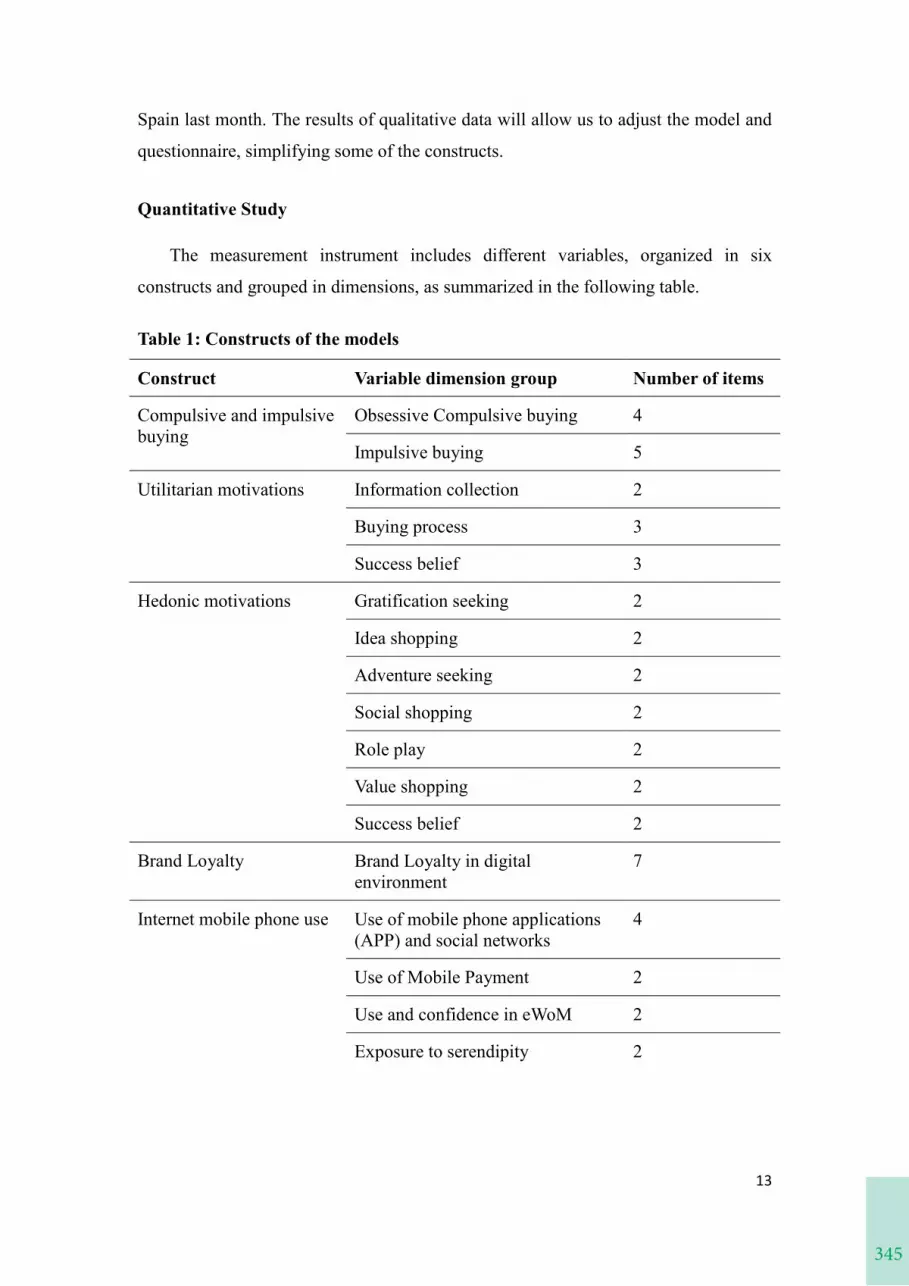
345
12
Field work
Due to the complexity of the factors that intervene into the model, the Fieldwork
is developed in two stages. First obtaining qualitative data collection through focus
groups and then quantitative data collection based on questionnaire survey. The two
research data collection methods are performed with samples of young consumers in
China, Frances and Spain, applying a cross-cultural perspective to point out possible
differences in consumer behavior between western Europe countries (Spain, France)
and China, an emergent country that currently is leader in global m-commerce (Stern,
2019). Cross-country comparison can be performed to get a better understanding and
determining the influence of cultural underlying factors in compulsive/impulsive
consumer behavior research (Horváth, Adigüzel & Herk, 2013; Baker et al. 2014).
The sociodemographic criterion to define the study population is firstly belonging
to the segment of ‘young people’. The young people are usually intense users of
mobile technology and are the main target for m-commerce applications (Zhang et al.
2002; Zhang et al. 2013). For the present study, young people are considered with
biological and social criteria: they are between 18 and 30 years old and they are not
married. Since the study is carried out in a culturally mixed environment, we chose to
define a fairly broad biological age segment (up to 30 years old) but retaining a
criterion of sociocultural behavior typical of a stage of life in which sociocultural
identity is still in the process of construction (the fact of not being married yet).
Qualitative study
The method of focus group is based on obtaining a structured discourse
attributable to a social segment, thanks to the dynamics of the discussion among the
participants selected on their profile and delimited according to social typology
criteria. From the review of the literature on compulsive/impulsive shopping behavior,
three typological criteria are selected for the preparation of focus groups: 1) gender, 2)
the source of income, 3) to be or not an expert in fashion. Focus groups are used at the
stage of designing the quantitative measurement instrument (the questionnaire) to
improve the definition of the variables and the formulation of the questions for the
measure instrument. We currently have done the first focus group session held in
13
Spain last month. The results of qualitative data will allow us to adjust the model and
questionnaire, simplifying some of the constructs.
Quantitative Study
The measurement instrument includes different variables, organized in six
constructs and grouped in dimensions, as summarized in the following table.
Table 1: Constructs of the models
Construct Variable dimension group Number of items
Compulsive and impulsive buying
Obsessive Compulsive buying 4
Impulsive buying 5
Utilitarian motivations Information collection 2
Buying process 3
Success belief 3
Hedonic motivations Gratification seeking 2
Idea shopping 2
Adventure seeking 2
Social shopping 2
Role play 2
Value shopping 2
Success belief 2
Brand Loyalty Brand Loyalty in digital environment
7
Internet mobile phone use Use of mobile phone applications (APP) and social networks
4
Use of Mobile Payment 2
Use and confidence in eWoM 2
Exposure to serendipity 2
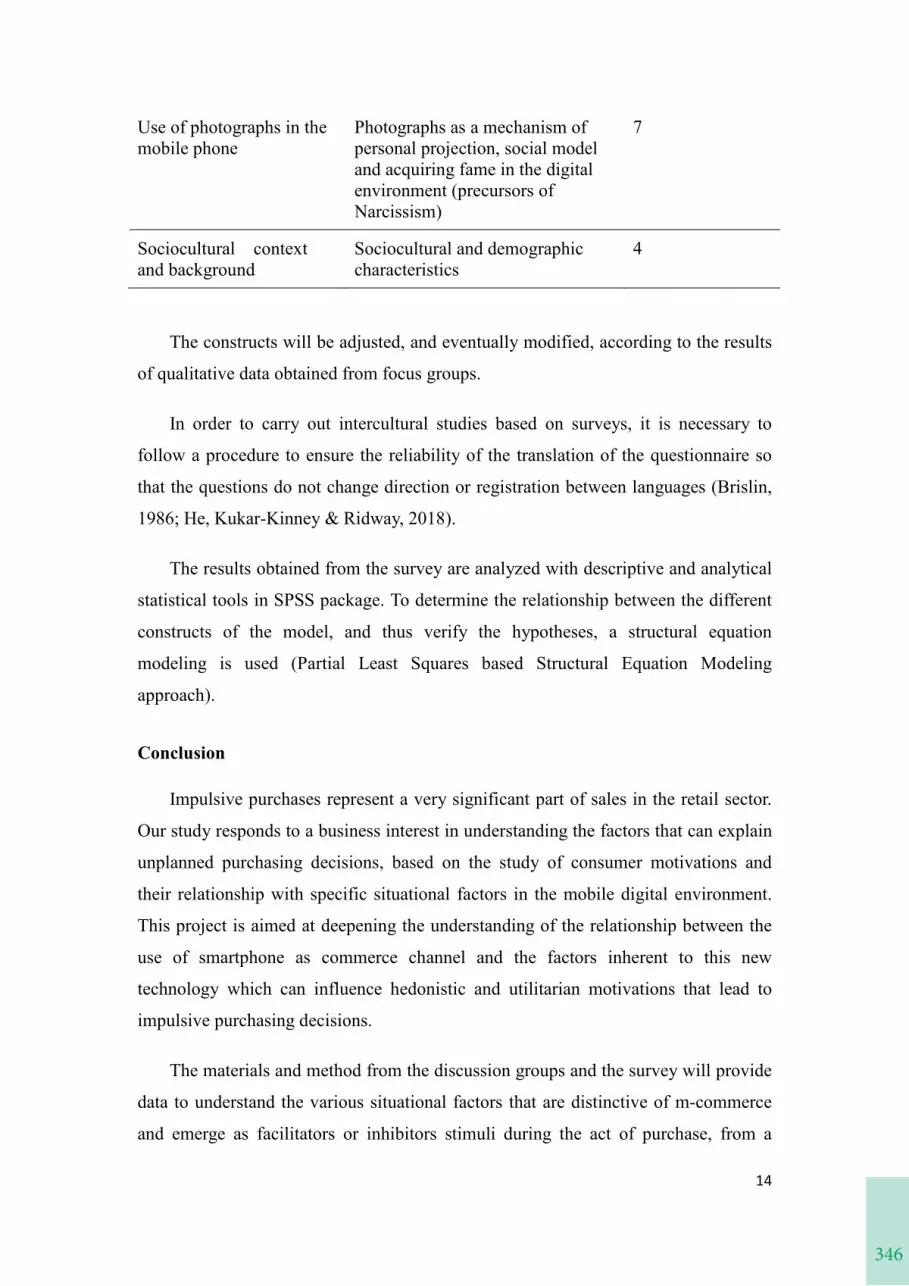
346
14
Use of photographs in the mobile phone
Photographs as a mechanism of personal projection, social model and acquiring fame in the digital environment (precursors of Narcissism)
7
Sociocultural context and background
Sociocultural and demographic characteristics
4
The constructs will be adjusted, and eventually modified, according to the results
of qualitative data obtained from focus groups.
In order to carry out intercultural studies based on surveys, it is necessary to
follow a procedure to ensure the reliability of the translation of the questionnaire so
that the questions do not change direction or registration between languages (Brislin,
1986; He, Kukar-Kinney & Ridway, 2018).
The results obtained from the survey are analyzed with descriptive and analytical
statistical tools in SPSS package. To determine the relationship between the different
constructs of the model, and thus verify the hypotheses, a structural equation
modeling is used (Partial Least Squares based Structural Equation Modeling
approach).
Conclusion
Impulsive purchases represent a very significant part of sales in the retail sector.
Our study responds to a business interest in understanding the factors that can explain
unplanned purchasing decisions, based on the study of consumer motivations and
their relationship with specific situational factors in the mobile digital environment.
This project is aimed at deepening the understanding of the relationship between the
use of smartphone as commerce channel and the factors inherent to this new
technology which can influence hedonistic and utilitarian motivations that lead to
impulsive purchasing decisions.
The materials and method from the discussion groups and the survey will provide
data to understand the various situational factors that are distinctive of m-commerce
and emerge as facilitators or inhibitors stimuli during the act of purchase, from a
347
14
Use of photographs in the mobile phone
Photographs as a mechanism of personal projection, social model and acquiring fame in the digital environment (precursors of Narcissism)
7
Sociocultural context and background
Sociocultural and demographic characteristics
4
The constructs will be adjusted, and eventually modified, according to the results
of qualitative data obtained from focus groups.
In order to carry out intercultural studies based on surveys, it is necessary to
follow a procedure to ensure the reliability of the translation of the questionnaire so
that the questions do not change direction or registration between languages (Brislin,
1986; He, Kukar-Kinney & Ridway, 2018).
The results obtained from the survey are analyzed with descriptive and analytical
statistical tools in SPSS package. To determine the relationship between the different
constructs of the model, and thus verify the hypotheses, a structural equation
modeling is used (Partial Least Squares based Structural Equation Modeling
approach).
Conclusion
Impulsive purchases represent a very significant part of sales in the retail sector.
Our study responds to a business interest in understanding the factors that can explain
unplanned purchasing decisions, based on the study of consumer motivations and
their relationship with specific situational factors in the mobile digital environment.
This project is aimed at deepening the understanding of the relationship between the
use of smartphone as commerce channel and the factors inherent to this new
technology which can influence hedonistic and utilitarian motivations that lead to
impulsive purchasing decisions.
The materials and method from the discussion groups and the survey will provide
data to understand the various situational factors that are distinctive of m-commerce
and emerge as facilitators or inhibitors stimuli during the act of purchase, from a
15
multicultural perspective, also analyzing the potential risk of uncontrolled repetition
of impulsive behaviors that could be linked to harmful compulsive habits. The
multicultural approach will allow us to understand the influence of cultural conditions
and differences between European countries and China. Our study can benefit
retailers and e-retailers by providing a better understanding of the factors underlying
the consumers’ impulse buying while using smartphone.
References
Akram, U., Hui, P., Khan, M. K., Yan, C., & Akram, Z. (2018). Factors affecting
online impulse buying: evidence from Chinese social commerce environment.
Sustainability, 10(2), 352.
Aminjonova, G., & Jun, S. H. (2019). Understanding Compulsive Buying Behavior of
Mobile Shoppers for Fashion Products. Journal of International Trade &
Commerce, 15(2), 15-29.
Anderson, K. C., Knight, D. K., Pookulangara, S., & Josiam, B. (2014). Influence of
hedonic and utilitarian motivations on retailer loyalty and purchase intention: a
facebook perspective. Journal of Retailing and Consumer Services, 21(5),
773-779.
APA (2013). Diagnostic and Statistical Manual of mental Disorders. (DSM – 5) Fifth
Edition. Washington: American Psychiatric Publishing.
Aragoncillo, L., & Orus, C. (2018). Impulse buying behaviour: an online-offline
comparative and the impact of social media. Spanish Journal of Marketing-ESIC,
22(1), 42-62.
Bayley, G., & Nancarrow, C. (1998). “Impulse purchasing: a qualitative exploration
of the phenomenon”. Qualitative Market Research: An International Journal, 1
(2), 99-114.
Bravo, L. (2019). How To Break Up With Fast Fashion: A guilt-free guide to changing
the way you shop for good. London: Headline Publishing Group.
348
16
Brislin, R. N. (1986). “The wording and translation of research instruments”. In:
Fields Methods in Cross-Cultural Research (pp. 137-164).
Chen, Y., Lu, Y., Wang, B., & Pan, Z. (2019). How do product recommendations
affect impulse buying? An empirical study on WeChat social commerce.
Information & Management, 56(2), 236-248.
Chen, C. C., & Yao, J. Y. (2018). What drives impulse buying behaviors in a mobile
auction? The perspective of the Stimulus-Organism-Response model. Telematics
and Informatics, 35(5), 1249-1262.
Childers, T. L., Carr, C. L., Peck, J., & Carson, S. (2001). Hedonic and utilitarian
motivations for online retail shopping behavior. Journal of retailing, 77(4),
511-535.
Chung, N., Song, H. G., & Lee, H. (2017). Consumers’ impulsive buying behavior of
restaurant products in social commerce. International Journal of Contemporary
Hospitality Management, 29(2), 709-731.
Dawson, S., & Kim, M. (2010). Cues on apparel web sites that trigger impulse
purchases. Journal of Fashion Marketing and Management, 14, 230–246.
Deters, F. G, Mehl, M. R., & Eid, M. (2014). Narcissistic power poster? On the
relationship between narcissism and status updating activity on Facebook.
Journal of Research in Personality, 53, 165-174.
Dhurup, M. (2014). Impulsive fashion apparel consumption: the role of hedonism,
fashion involvement and emotional gratification in fashion apparel impulsive
buying behaviour in a developing country. Mediterranean Journal of Social
Sciences, 5(8), 168-177.
Dittmar, H., Beattie, J., & Friese, S. (1995). Gender identity and material symbols:
Objects and decision considerations in impulse purchases. Journal of Economic
Psychology, 16, 491–511.
349
16
Brislin, R. N. (1986). “The wording and translation of research instruments”. In:
Fields Methods in Cross-Cultural Research (pp. 137-164).
Chen, Y., Lu, Y., Wang, B., & Pan, Z. (2019). How do product recommendations
affect impulse buying? An empirical study on WeChat social commerce.
Information & Management, 56(2), 236-248.
Chen, C. C., & Yao, J. Y. (2018). What drives impulse buying behaviors in a mobile
auction? The perspective of the Stimulus-Organism-Response model. Telematics
and Informatics, 35(5), 1249-1262.
Childers, T. L., Carr, C. L., Peck, J., & Carson, S. (2001). Hedonic and utilitarian
motivations for online retail shopping behavior. Journal of retailing, 77(4),
511-535.
Chung, N., Song, H. G., & Lee, H. (2017). Consumers’ impulsive buying behavior of
restaurant products in social commerce. International Journal of Contemporary
Hospitality Management, 29(2), 709-731.
Dawson, S., & Kim, M. (2010). Cues on apparel web sites that trigger impulse
purchases. Journal of Fashion Marketing and Management, 14, 230–246.
Deters, F. G, Mehl, M. R., & Eid, M. (2014). Narcissistic power poster? On the
relationship between narcissism and status updating activity on Facebook.
Journal of Research in Personality, 53, 165-174.
Dhurup, M. (2014). Impulsive fashion apparel consumption: the role of hedonism,
fashion involvement and emotional gratification in fashion apparel impulsive
buying behaviour in a developing country. Mediterranean Journal of Social
Sciences, 5(8), 168-177.
Dittmar, H., Beattie, J., & Friese, S. (1995). Gender identity and material symbols:
Objects and decision considerations in impulse purchases. Journal of Economic
Psychology, 16, 491–511.
17
Erkan, I., & Evans, C. (2016). The influence of eWOM in social media on consumers’
purchase intentions: An extended approach to information adoption. Computers
in Human Behavior, 61, 47-55.
Garrett, J. L., Rodermund, R., Anderson, N., Berkowitz, S., & Robb, C. A. (2014).
Adoption of mobile payment technology by consumers. Family and Consumer
Sciences Research Journal, 42(4), 358-368.
Goldsmith, R. E., & Horowitz, D. (2010). Measuring motivations for online opinion
seeking. Journal of Interactive Advertising, 6(2), 3–14.
GSMA (2019). Global Mobile Economy Report. London: GSMA Intelligence.
Hausman, A. (2000). A multi-method investigation of consumer motivations in
impulse buying behavior. Journal of Consumer Marketing, 17(5), 403-426.
He, H., Kukar-Kinney, M., & Ridgway, N. M. (2018). “Compulsive buying in China:
Measurement, prevalence, and online drivers”. Journal of Business Research, 91,
28-39.
Horváth, C., Adigüzel, F., & Herk, H. V. (2013). Cultural aspects of compulsive
buying in emerging and developed economies: A cross cultural study in
compulsive buying. Organizations and Markets in Emerging Economies, 4(2),
8-24.
Khorrami, M. S., Esfidani, M. R., & Delavari, S. (2015). The effect of situational
factors on impulse buying and compulsive buying: Clothing. International
Journal of Management, Accounting and Economics, 2(8), 823-837.
Kwak, H., Zinkhan, G. M., DeLorme, D. E., & Larsen, T. (2006). Revisiting
normative influences on impulsive buying behavior and an extension to
compulsive buying behavior: A case from South Korea. Journal of International
Consumer Marketing, 18(3), 57-80.
Lee, S.-H., Lennon, S. J., & Rudd, N. A. (2000). Compulsive Consumption
Tendencies Among Television Shoppers. Family and Consumer Sciences
Research Journal, 28(4), 463–488.
350
18
Lee, S. H., & Workman, J. E. (2015). Compulsive buying and branding phenomena.
Journal of Open Innovation: Technology, Market, and Complexity, 1(1), 3.
Liu, C. W., Hsieh, A. Y., Lo, S. K., & Hwang, Y. (2017). What consumers see when
time is running out: Consumers’ browsing behaviors on online shopping websites
when under time pressure. Computers in Human Behavior, 70, 391-397.
Lo, L. Y. S., Lin, S. W., & Hsu, L. Y. (2016). Motivation for online impulse buying: A
two-factor theory perspective. International Journal of Information Management,
36(5), 759-772.
Maity, M., & Dass, M. (2014). Consumer decision-making across modern and
traditional channels: E-commerce, m-commerce, in-store. Decision Support
Systems, 61, 34-46.
Matute, J., Polo-Redondo, Y., & Utrillas, A. (2016). The influence of eWOM
characteristics on online repurchase intention. Online Information Review, 40(7),
1090-1110.
Müller, A., Mitchell, J. E., & de Zwaan, M. (2015). Compulsive buying. The
American Journal on Addictions, 24(2), 132-137.
O’Brien, H. L. (2010). The influence of hedonic and utilitarian motivations on user
engagement: The case of online shopping experiences. Interacting with
computers, 22(5), 344-352.
Park, H. J., & Burns, L. D. (2005). Fashion orientation, credit card use, and
compulsive buying. Journal of Consumer Marketing, 22(3), 135-141.
Park, E. J., Kim, E. Y., & Cardona, J. (2006). “A structural model of fashion-oriented
impulse buying behavior”. Journal of Fashion Marketing and Management,
10(4), 433-444.
Parker, C. J., & Wang, H. (2016). Examining hedonic and utilitarian motivations for
m-commerce fashion retail app engagement. Journal of Fashion Marketing and
Management, 20(4), 487-506.
351
18
Lee, S. H., & Workman, J. E. (2015). Compulsive buying and branding phenomena.
Journal of Open Innovation: Technology, Market, and Complexity, 1(1), 3.
Liu, C. W., Hsieh, A. Y., Lo, S. K., & Hwang, Y. (2017). What consumers see when
time is running out: Consumers’ browsing behaviors on online shopping websites
when under time pressure. Computers in Human Behavior, 70, 391-397.
Lo, L. Y. S., Lin, S. W., & Hsu, L. Y. (2016). Motivation for online impulse buying: A
two-factor theory perspective. International Journal of Information Management,
36(5), 759-772.
Maity, M., & Dass, M. (2014). Consumer decision-making across modern and
traditional channels: E-commerce, m-commerce, in-store. Decision Support
Systems, 61, 34-46.
Matute, J., Polo-Redondo, Y., & Utrillas, A. (2016). The influence of eWOM
characteristics on online repurchase intention. Online Information Review, 40(7),
1090-1110.
Müller, A., Mitchell, J. E., & de Zwaan, M. (2015). Compulsive buying. The
American Journal on Addictions, 24(2), 132-137.
O’Brien, H. L. (2010). The influence of hedonic and utilitarian motivations on user
engagement: The case of online shopping experiences. Interacting with
computers, 22(5), 344-352.
Park, H. J., & Burns, L. D. (2005). Fashion orientation, credit card use, and
compulsive buying. Journal of Consumer Marketing, 22(3), 135-141.
Park, E. J., Kim, E. Y., & Cardona, J. (2006). “A structural model of fashion-oriented
impulse buying behavior”. Journal of Fashion Marketing and Management,
10(4), 433-444.
Parker, C. J., & Wang, H. (2016). Examining hedonic and utilitarian motivations for
m-commerce fashion retail app engagement. Journal of Fashion Marketing and
Management, 20(4), 487-506.
19
Ridgway, N. M., Kukar-Kinney, M., & Monroe, K. B. (2008). “An expanded
Conceptualization and a New Measure of Compulsive Buying”. Journal of
Consumer Research, 35, 622-639.
Stern, N. (2019, Feb 5). China To Become The World's Largest Retail Market, Even
With A Slowdown. Forbes, available at URL:
https://www.forbes.com/sites/neilstern/2019/02/05/china-to-become-the-worlds-l
argest-retail-market-even-with-a-slowdown/#5467205d133f
Valls, J. P. (2017). Big data: Atrapando al consumidor. Barcelona: Editorial Profit.
Van Doorn, J., Lemon, K. N., Mittal, V., Nass, S., Pick, D., Pirner, P., & Verhoef, P. C.
(2010). Customer engagement behavior: Theoretical foundations and research
directions. Journal of Service Research, 13(3), 253-266.
Wu, Y. L., & Ye, Y. S. (2013). “Understanding Impulsive Buying Behavior in Mobile
Commerce”. In: PACIS 2013 Proceedings (142), Association for Information
Systems.
Zheng, X., Men, J., Yang, F., & Gong, X. (2019). Understanding impulse buying in
mobile commerce: An investigation into hedonic and utilitarian browsing.
International Journal of Information Management, 48, 151-160.
352
“HOW CAN DIGITALIZATION MITIGATE PANDEMIC-INDUCED DEMAND SHOCKS? A CASE STUDY FROM THE FAST FASHION INDUSTRY”
Zsolt Matyusz, (Corvinus University of Budapest)Bence Pistrui (Corvinus University of Budapest)Zsuzsa, Deli-Gray (ESSCA School of Management)
Digitalization is one of the most relevant global processes of our time that includes many aspects of everyday life, and also transforms retail. Regardless of their digitalization maturity, most companies and organizations were caught off guard by the current CoViD-19 pandemic, that rattled and is still rattling many businesses. In our paper we investigate how digital solutions can help mitigate this situation and what digitalization approaches seem to be more important to prepare for these kind of events in the future. We focus our attention to the fast fashion segment of retail and look at a Hungarian subsidiary of a global fast fashion company as a case study to formulate our conclusions.Based on our current experience, digitalization can play a role in this effort. In a lockdown phase, when physical movements and activities are severely limited, online sales channels seem to be the only viable way to continue business at a lower scale. Hence it is imperative that more businesses create an online presence if they do not want to lose their customers in a pandemic-induced demand shock. This requires well-established back-end digital solutions. Digitalization can also be helpful in the opening up phase, when certain front-end, in-store solutions can improve business results.
353
“HOW CAN DIGITALIZATION MITIGATE PANDEMIC-INDUCED DEMAND SHOCKS? A CASE STUDY FROM THE FAST FASHION INDUSTRY”
Digitalization is one of the most relevant global processes of our time that includes many aspects of everyday life, and also transforms retail. Regardless of their digitalization maturity, most companies and organizations were caught off guard by the current CoViD-19 pandemic, that rattled and is still rattling many businesses. In our paper we investigate how digital solutions can help mitigate this situation and what digitalization approaches seem to be more important to prepare for these kind of events in the future. We focus our attention to the fast fashion segment of retail and look at a Hungarian subsidiary of a global fast fashion company as a case study to formulate our conclusions.Based on our current experience, digitalization can play a role in this effort. In a lockdown phase, when physical movements and activities are severely limited, online sales channels seem to be the only viable way to continue business at a lower scale. Hence it is imperative that more businesses create an online presence if they do not want to lose their customers in a pandemic-induced demand shock. This requires well-established back-end digital solutions. Digitalization can also be helpful in the opening up phase, when certain front-end, in-store solutions can improve business results.
1
POP-UP RETAIL AND ITS PATTERNS – DEVELOPING A DATA BASED FRAMEWORK FOR DIGITIZING THE PROCESS
ACCORDING TO THE 3P IMPETUS
Stefan Nertinger, University of Applied Sciences St.Gallen (FHS), Institute for ManagementIFU-FHS, 9000 St.Gallen, [email protected];https://www.fhsg.ch/de/personen/member/stefan-nertinger-5613/
Klaus Frick, Interstate University of Applied Sciences of Technology Buchs (NTB), Institute for Computational Engineering, 9470 Buchs, [email protected];https://www.ntb.ch/person/klaus-frick/
The paper validates and defines Pop-up Retail Patterns based upon a literature review and a validation through qualitative research, namely in-depth interviews with pop-up retailers in Switzerland. Pop-up Retail Patterns cluster location needs of particular Pop-up Retailers dependent on their branch, core motivation, and their customer focus. We conducted 17 interviews with Pop-up Retailers having run their retail projects between 2018 and 2019 in Swiss towns St.Gallen and Zurich. We were able to identify three valid Retail Patterns: Market Testing, Outlet/Sales, and Brand Experience among three of overall 9 clusters of Merchant Categories. We defined these Merchant chain categories according to their generic location needs and types of customers shopping behaviors (e.g. experience shopping vs weekly one-stop shopping) based upon a literature review. Based on the findings of the undertaken qualitative research we used location-based data from Open Street Map to investigate the importance of the structure of the nearest store neighbors (400m x 400m) by using route distancing. We stated the hypothesis that dependent on the particular Retail Pattern location choice is determined beside footfall's quantity and structure, by the structure of space opportunity's nearest neighbors. Within our sample of qualitative and quantitative data, mainly location-based data we were able to point out interdependencies, which seem to be generalizable at least for covered cities Zurich and St.Gallen. Currently, we are enhancing our data basis and derive supervised machine learning models to make predictions and recommendations for location choice in pop-up retail based on given retail profiles and patterns.
354
2
Introduction
Lifecycles and dwell times of brick-and-mortar shops are decreasing, the challenge of no-line retail is rising and indeed the dynamic of retail's digital transformation is pacing up. Flexible retail is key. Pop-up retail seems to be the most important part of Flexible Retail. Pop-upRetails' rising is reflecting new and even more complex customer journeys and the need for integrated and seamless customer experiences (e.g. Childs et al. 2019). Furthermore, it is underlining the need for enabling customers' experiences through visiting on-site stores. In an operations' view, it is necessary to adapt the traditional process like the location choice and planning towards the new deal of flexible retail. The paper is reflecting the first step towards developing an AI-based tool for digitizing and self-automating the location choice process of Pop-up Retail.
Purpose*Facing the facts and characteristics of pop-up shops being undertaken for one day up to four or five months, traditional methods of location choice are not proper anymore. There is a need for digitizing the process through stringent use of location data and pop-up user habits and needs, we call them Pop-Up Retail Patterns (RePats).We stick to the idea of digitizing the location choice process from "cradle-to-grave". According to the well-known phrase of 3-P: Profile-Pattern-Predict! (see figure 1). So we may state the following research question:
RQ1: Is it possible to digitize and optimize the process of location choice of Pop-Up Retailers through developing an AI-Tool matching location-data based KPI (ReLocS) and retailers’ needs derived from merchant category related retail patterns (RePatS)being mainly determined by retailer’s core motivation such a transaction or communication and its merchant category origin.
Concerning the step of Profiling, we did a qualitative assessment of pop-up retailers in Switzerland for their characteristics, location measures, goals, and habits. Based upon a literature review we identified three Retail Patterns among nine merchant (chain) categoryclusters (MCC1). We enhanced our findings with experts' knowledge and analysis of underlying location data, mainly the retail industry structure from Open Street Map. So the next step to take will be mainstreaming our data basis regarding two aspects: firstly, we have to enlarge our sample of investigated Pop-up retail projects and secondly, we have to broaden our data analysis to transactional, demographics and pedestrian traffic data.
1 We used Merchant Category codes according to ISO 18245:2003 Retail financial services – merchant category code, and clustered particular, complementary merchants.
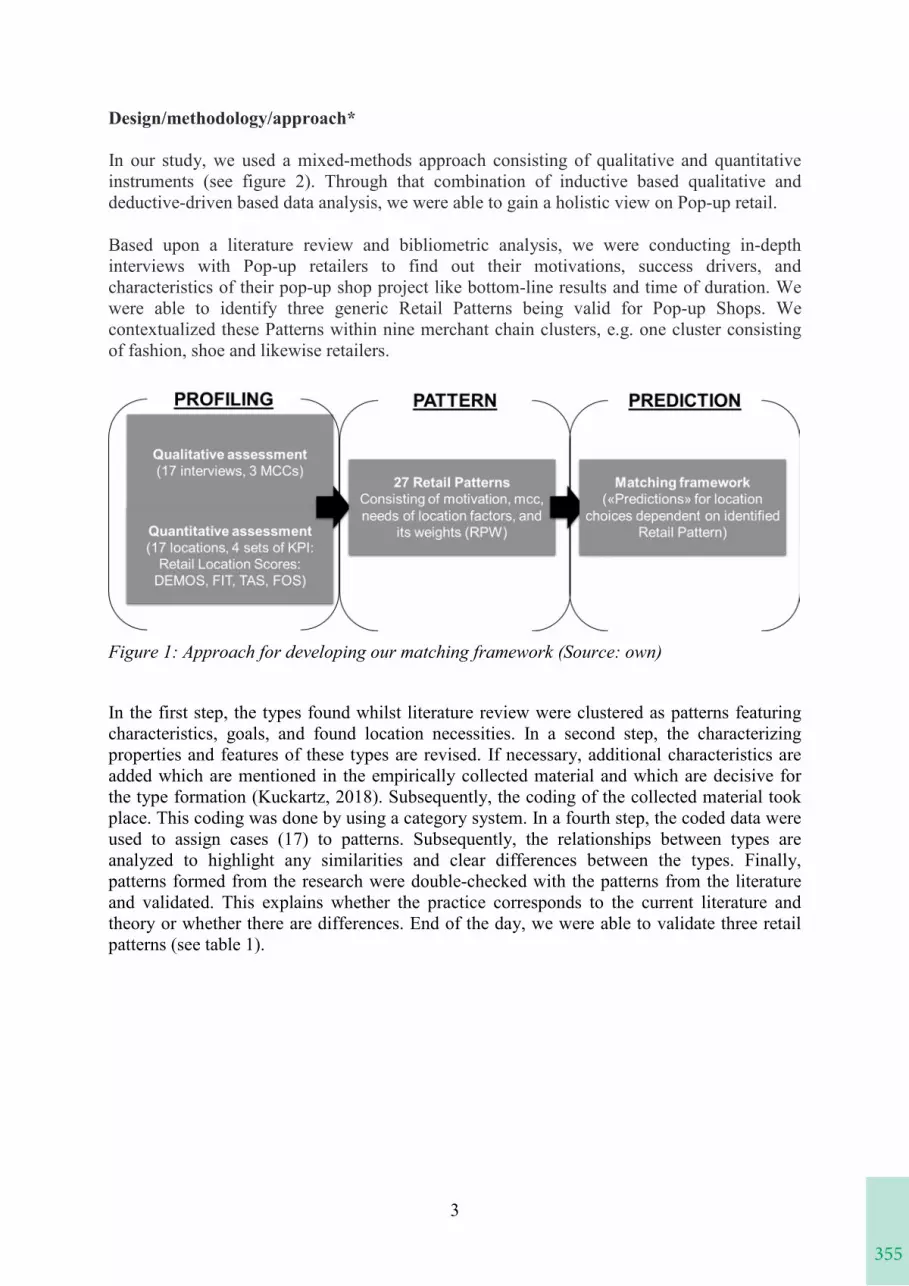
355
2
Introduction
Lifecycles and dwell times of brick-and-mortar shops are decreasing, the challenge of no-line retail is rising and indeed the dynamic of retail's digital transformation is pacing up. Flexible retail is key. Pop-up retail seems to be the most important part of Flexible Retail. Pop-upRetails' rising is reflecting new and even more complex customer journeys and the need for integrated and seamless customer experiences (e.g. Childs et al. 2019). Furthermore, it is underlining the need for enabling customers' experiences through visiting on-site stores. In an operations' view, it is necessary to adapt the traditional process like the location choice and planning towards the new deal of flexible retail. The paper is reflecting the first step towards developing an AI-based tool for digitizing and self-automating the location choice process of Pop-up Retail.
Purpose*Facing the facts and characteristics of pop-up shops being undertaken for one day up to four or five months, traditional methods of location choice are not proper anymore. There is a need for digitizing the process through stringent use of location data and pop-up user habits and needs, we call them Pop-Up Retail Patterns (RePats).We stick to the idea of digitizing the location choice process from "cradle-to-grave". According to the well-known phrase of 3-P: Profile-Pattern-Predict! (see figure 1). So we may state the following research question:
RQ1: Is it possible to digitize and optimize the process of location choice of Pop-Up Retailers through developing an AI-Tool matching location-data based KPI (ReLocS) and retailers’ needs derived from merchant category related retail patterns (RePatS)being mainly determined by retailer’s core motivation such a transaction or communication and its merchant category origin.
Concerning the step of Profiling, we did a qualitative assessment of pop-up retailers in Switzerland for their characteristics, location measures, goals, and habits. Based upon a literature review we identified three Retail Patterns among nine merchant (chain) categoryclusters (MCC1). We enhanced our findings with experts' knowledge and analysis of underlying location data, mainly the retail industry structure from Open Street Map. So the next step to take will be mainstreaming our data basis regarding two aspects: firstly, we have to enlarge our sample of investigated Pop-up retail projects and secondly, we have to broaden our data analysis to transactional, demographics and pedestrian traffic data.
1 We used Merchant Category codes according to ISO 18245:2003 Retail financial services – merchant category code, and clustered particular, complementary merchants.
3
Design/methodology/approach*
In our study, we used a mixed-methods approach consisting of qualitative and quantitative instruments (see figure 2). Through that combination of inductive based qualitative and deductive-driven based data analysis, we were able to gain a holistic view on Pop-up retail.
Based upon a literature review and bibliometric analysis, we were conducting in-depth interviews with Pop-up retailers to find out their motivations, success drivers, and characteristics of their pop-up shop project like bottom-line results and time of duration. We were able to identify three generic Retail Patterns being valid for Pop-up Shops. We contextualized these Patterns within nine merchant chain clusters, e.g. one cluster consisting of fashion, shoe and likewise retailers.
Figure 1: Approach for developing our matching framework (Source: own)
In the first step, the types found whilst literature review were clustered as patterns featuring characteristics, goals, and found location necessities. In a second step, the characterizing properties and features of these types are revised. If necessary, additional characteristics are added which are mentioned in the empirically collected material and which are decisive for the type formation (Kuckartz, 2018). Subsequently, the coding of the collected material took place. This coding was done by using a category system. In a fourth step, the coded data were used to assign cases (17) to patterns. Subsequently, the relationships between types are analyzed to highlight any similarities and clear differences between the types. Finally, patterns formed from the research were double-checked with the patterns from the literature and validated. This explains whether the practice corresponds to the current literature and theory or whether there are differences. End of the day, we were able to validate three retail patterns (see table 1).
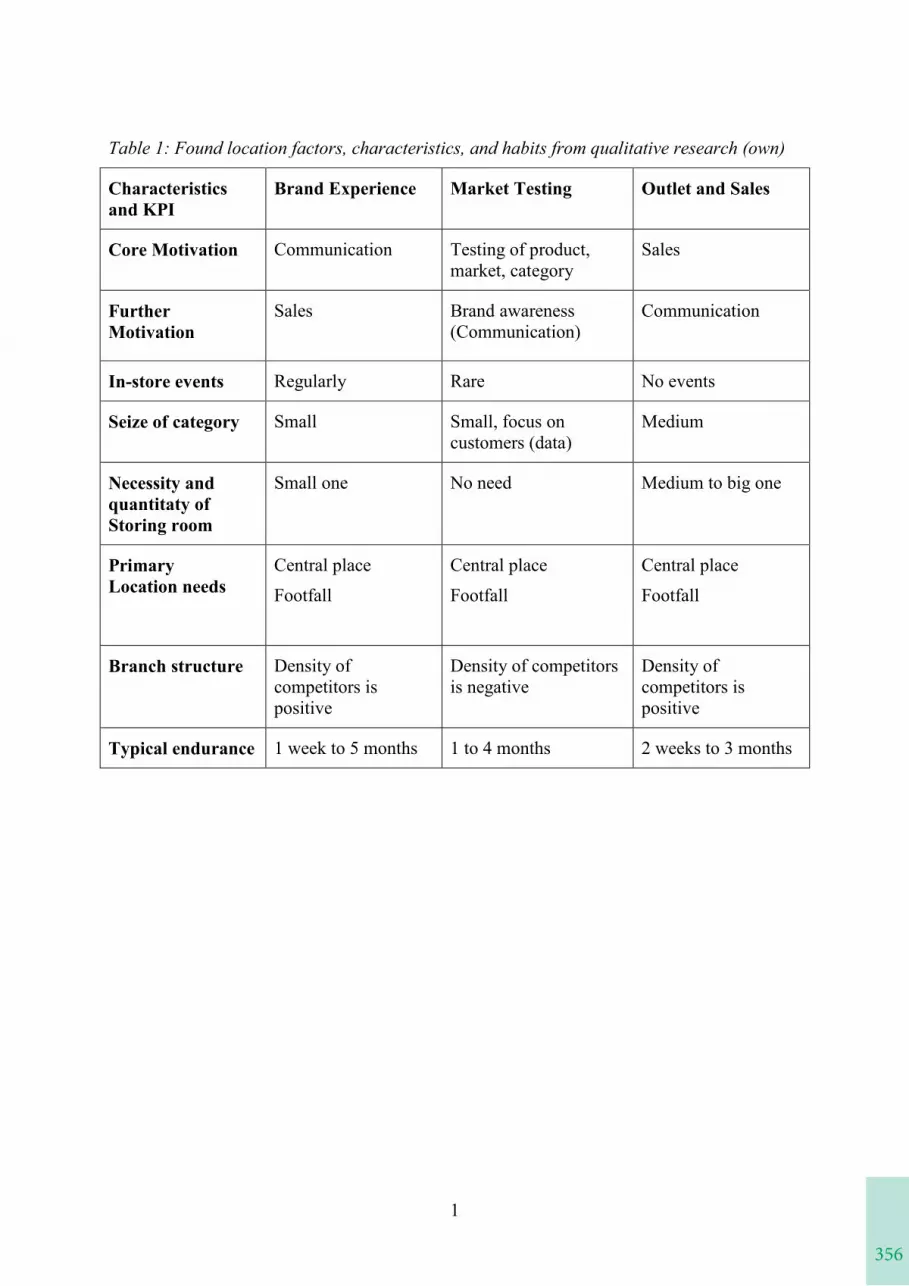
356
1
Table 1: Found location factors, characteristics, and habits from qualitative research (own)
Characteristics and KPI
Brand Experience Market Testing Outlet and Sales
Core Motivation Communication Testing of product, market, category
Sales
Further Motivation
Sales Brand awareness (Communication)
Communication
In-store events Regularly Rare No events
Seize of category Small Small, focus on customers (data)
Medium
Necessity and quantitaty of Storing room
Small one No need Medium to big one
PrimaryLocation needs
Central place
Footfall
Central place
Footfall
Central place
Footfall
Branch structure Density of competitors is positive
Density of competitors is negative
Density of competitors is positive
Typical endurance 1 week to 5 months 1 to 4 months 2 weeks to 3 months
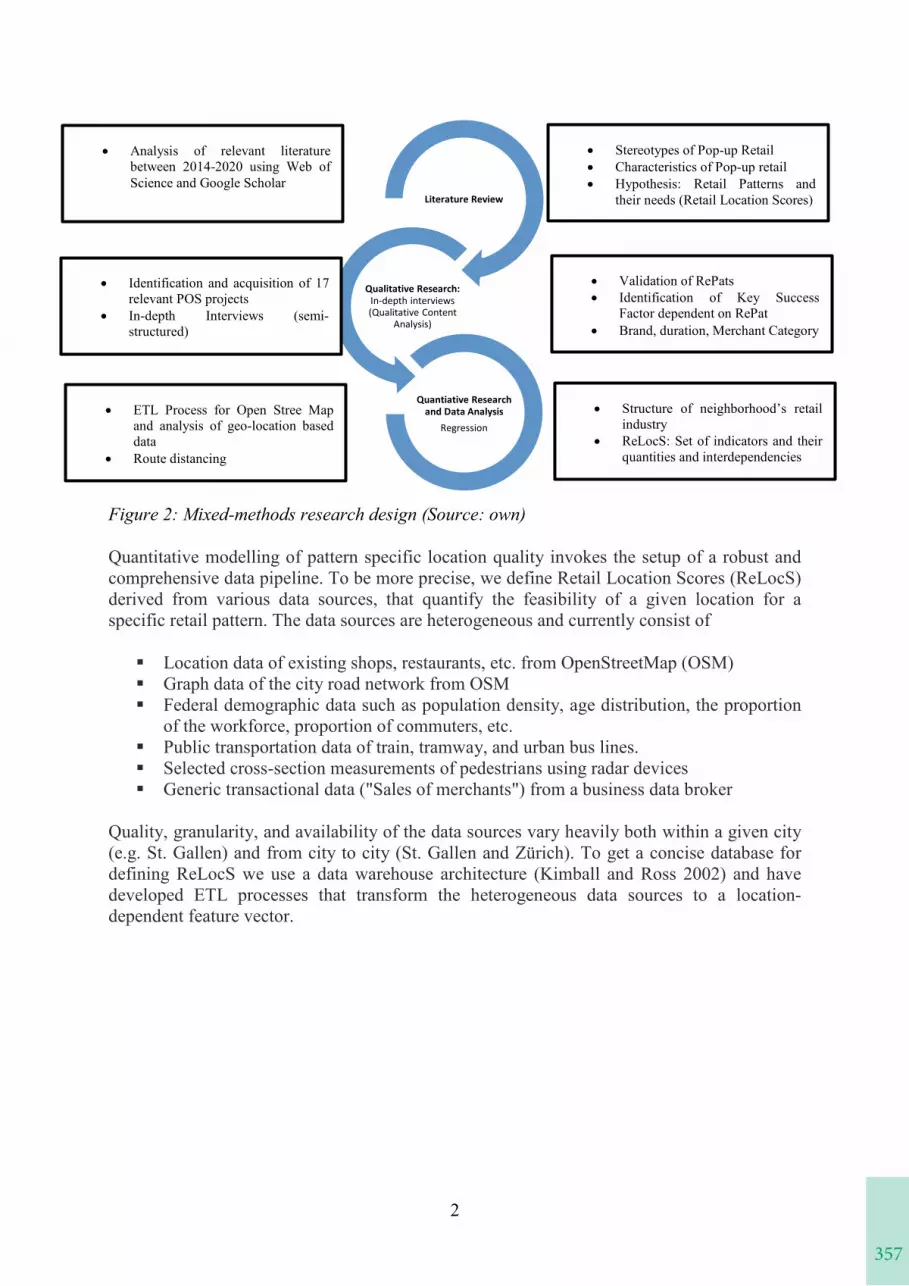
357
1
Table 1: Found location factors, characteristics, and habits from qualitative research (own)
Characteristics and KPI
Brand Experience Market Testing Outlet and Sales
Core Motivation Communication Testing of product, market, category
Sales
Further Motivation
Sales Brand awareness (Communication)
Communication
In-store events Regularly Rare No events
Seize of category Small Small, focus on customers (data)
Medium
Necessity and quantitaty of Storing room
Small one No need Medium to big one
PrimaryLocation needs
Central place
Footfall
Central place
Footfall
Central place
Footfall
Branch structure Density of competitors is positive
Density of competitors is negative
Density of competitors is positive
Typical endurance 1 week to 5 months 1 to 4 months 2 weeks to 3 months
2
Figure 2: Mixed-methods research design (Source: own)
Quantitative modelling of pattern specific location quality invokes the setup of a robust and comprehensive data pipeline. To be more precise, we define Retail Location Scores (ReLocS) derived from various data sources, that quantify the feasibility of a given location for a specific retail pattern. The data sources are heterogeneous and currently consist of
Location data of existing shops, restaurants, etc. from OpenStreetMap (OSM) Graph data of the city road network from OSM Federal demographic data such as population density, age distribution, the proportion
of the workforce, proportion of commuters, etc. Public transportation data of train, tramway, and urban bus lines. Selected cross-section measurements of pedestrians using radar devices Generic transactional data ("Sales of merchants") from a business data broker
Quality, granularity, and availability of the data sources vary heavily both within a given city (e.g. St. Gallen) and from city to city (St. Gallen and Zürich). To get a concise database for defining ReLocS we use a data warehouse architecture (Kimball and Ross 2002) and have developed ETL processes that transform the heterogeneous data sources to a location-dependent feature vector.
Literature Review
Qualitative Research: In-depth interviews (Qualitative Content
Analysis)
Quantiative Research and Data Analysis
Regression
• Stereotypes of Pop-up Retail• Characteristics of Pop-up retail• Hypothesis: Retail Patterns and
their needs (Retail Location Scores)
• Validation of RePats• Identification of Key Success
Factor dependent on RePat• Brand, duration, Merchant Category
• Structure of neighborhood’s retail industry
• ReLocS: Set of indicators and their quantities and interdependencies
• Analysis of relevant literature between 2014-2020 using Web of Science and Google Scholar
• Identification and acquisition of 17 relevant POS projects
• In-depth Interviews (semi-structured)
• ETL Process for Open Stree Map and analysis of geo-location based data
• Route distancing
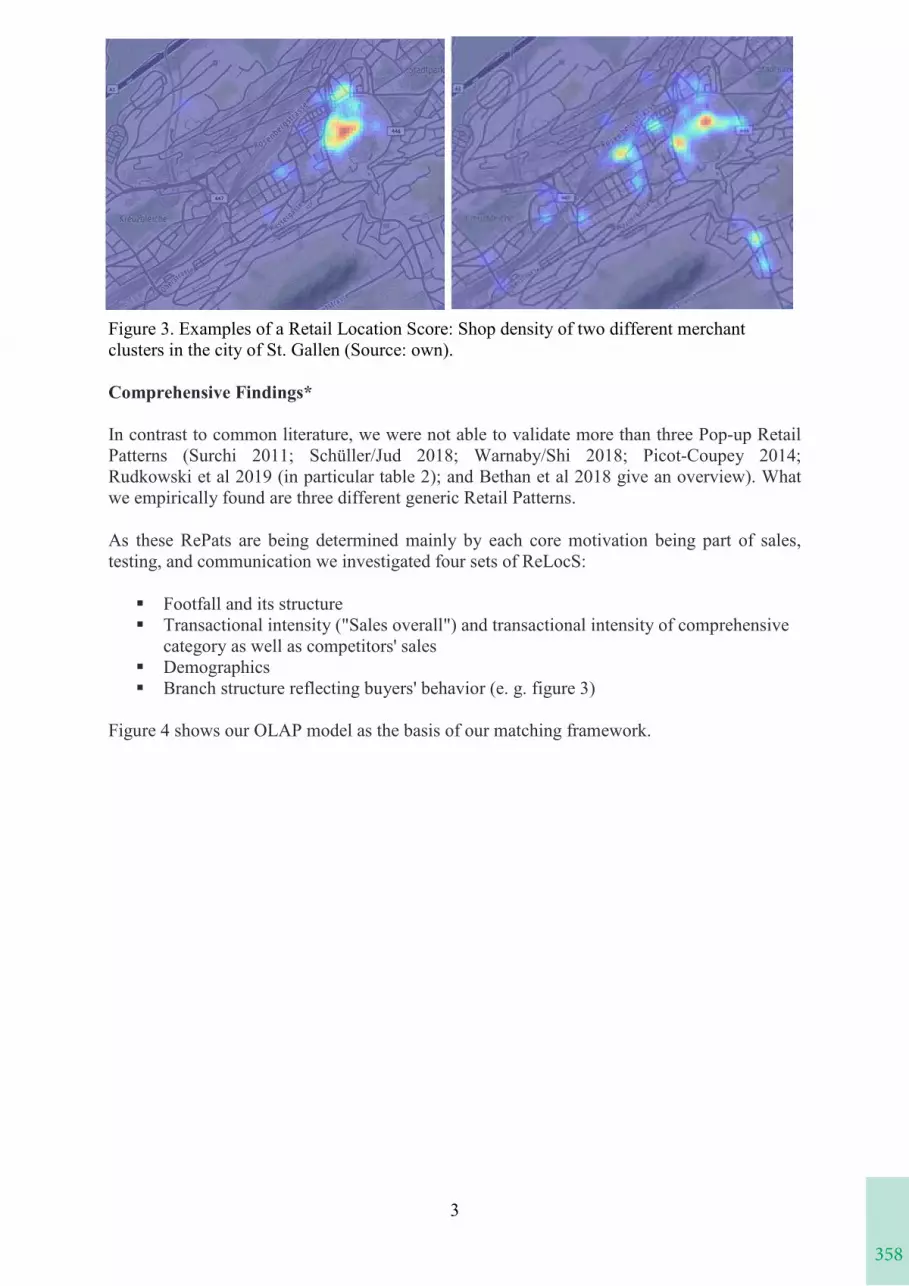
358
3
Figure 3. Examples of a Retail Location Score: Shop density of two different merchant clusters in the city of St. Gallen (Source: own).
Comprehensive Findings*
In contrast to common literature, we were not able to validate more than three Pop-up Retail Patterns (Surchi 2011; Schüller/Jud 2018; Warnaby/Shi 2018; Picot-Coupey 2014; Rudkowski et al 2019 (in particular table 2); and Bethan et al 2018 give an overview). What we empirically found are three different generic Retail Patterns.
As these RePats are being determined mainly by each core motivation being part of sales, testing, and communication we investigated four sets of ReLocS:
Footfall and its structure Transactional intensity ("Sales overall") and transactional intensity of comprehensive
category as well as competitors' sales Demographics Branch structure reflecting buyers' behavior (e. g. figure 3)
Figure 4 shows our OLAP model as the basis of our matching framework.
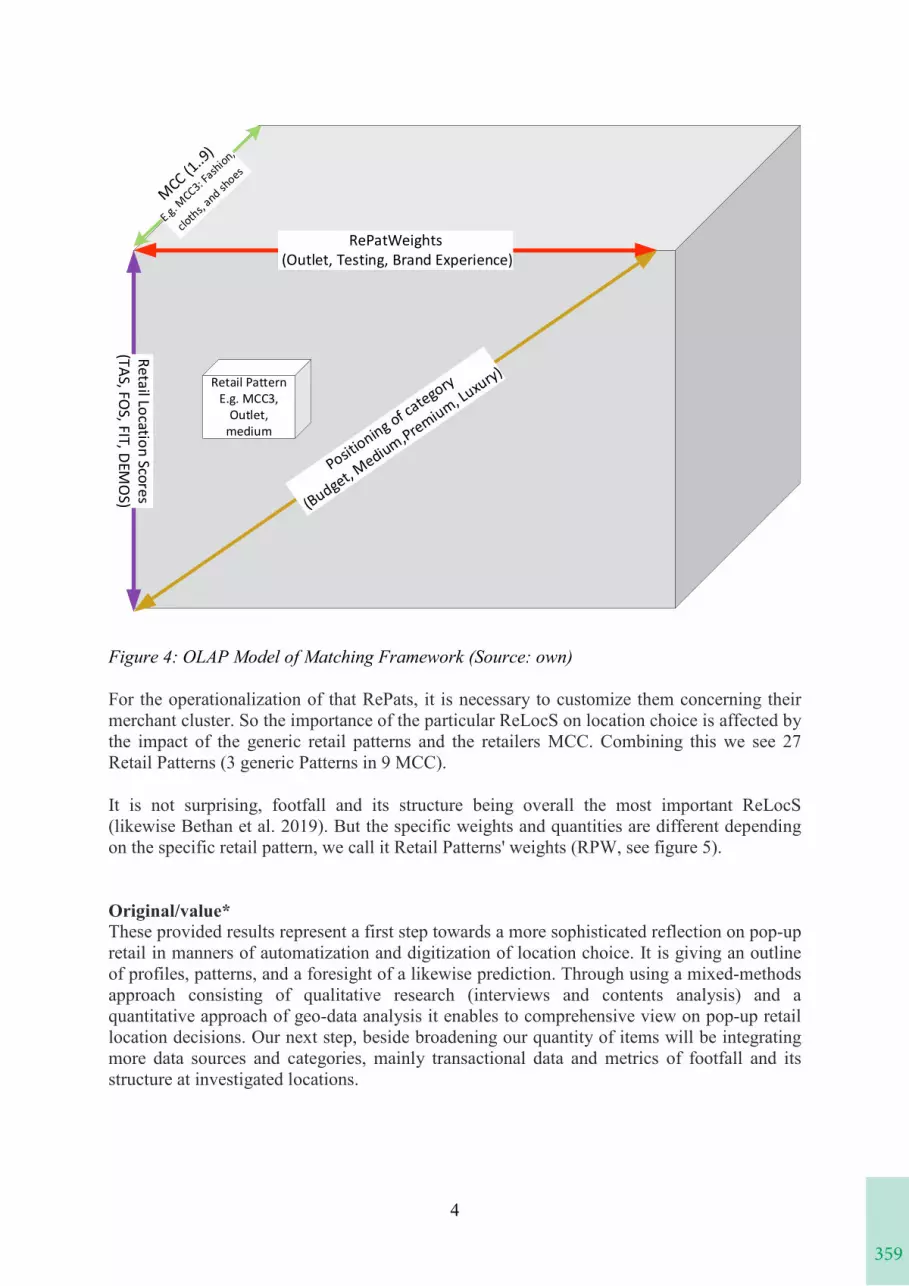
359
3
Figure 3. Examples of a Retail Location Score: Shop density of two different merchant clusters in the city of St. Gallen (Source: own).
Comprehensive Findings*
In contrast to common literature, we were not able to validate more than three Pop-up Retail Patterns (Surchi 2011; Schüller/Jud 2018; Warnaby/Shi 2018; Picot-Coupey 2014; Rudkowski et al 2019 (in particular table 2); and Bethan et al 2018 give an overview). What we empirically found are three different generic Retail Patterns.
As these RePats are being determined mainly by each core motivation being part of sales, testing, and communication we investigated four sets of ReLocS:
Footfall and its structure Transactional intensity ("Sales overall") and transactional intensity of comprehensive
category as well as competitors' sales Demographics Branch structure reflecting buyers' behavior (e. g. figure 3)
Figure 4 shows our OLAP model as the basis of our matching framework.
4
Retail Pattern E.g. MCC3,
Outlet, medium
RePatWeights (Outlet, Testing, Brand Experience)
Retail Location Scores (TAS, FO
S, FIT, DEMO
S)
Figure 4: OLAP Model of Matching Framework (Source: own)
For the operationalization of that RePats, it is necessary to customize them concerning their merchant cluster. So the importance of the particular ReLocS on location choice is affected by the impact of the generic retail patterns and the retailers MCC. Combining this we see 27 Retail Patterns (3 generic Patterns in 9 MCC).
It is not surprising, footfall and its structure being overall the most important ReLocS (likewise Bethan et al. 2019). But the specific weights and quantities are different depending on the specific retail pattern, we call it Retail Patterns' weights (RPW, see figure 5).
Original/value*These provided results represent a first step towards a more sophisticated reflection on pop-upretail in manners of automatization and digitization of location choice. It is giving an outline of profiles, patterns, and a foresight of a likewise prediction. Through using a mixed-methods approach consisting of qualitative research (interviews and contents analysis) and a quantitative approach of geo-data analysis it enables to comprehensive view on pop-up retail location decisions. Our next step, beside broadening our quantity of items will be integrating more data sources and categories, mainly transactional data and metrics of footfall and its structure at investigated locations.
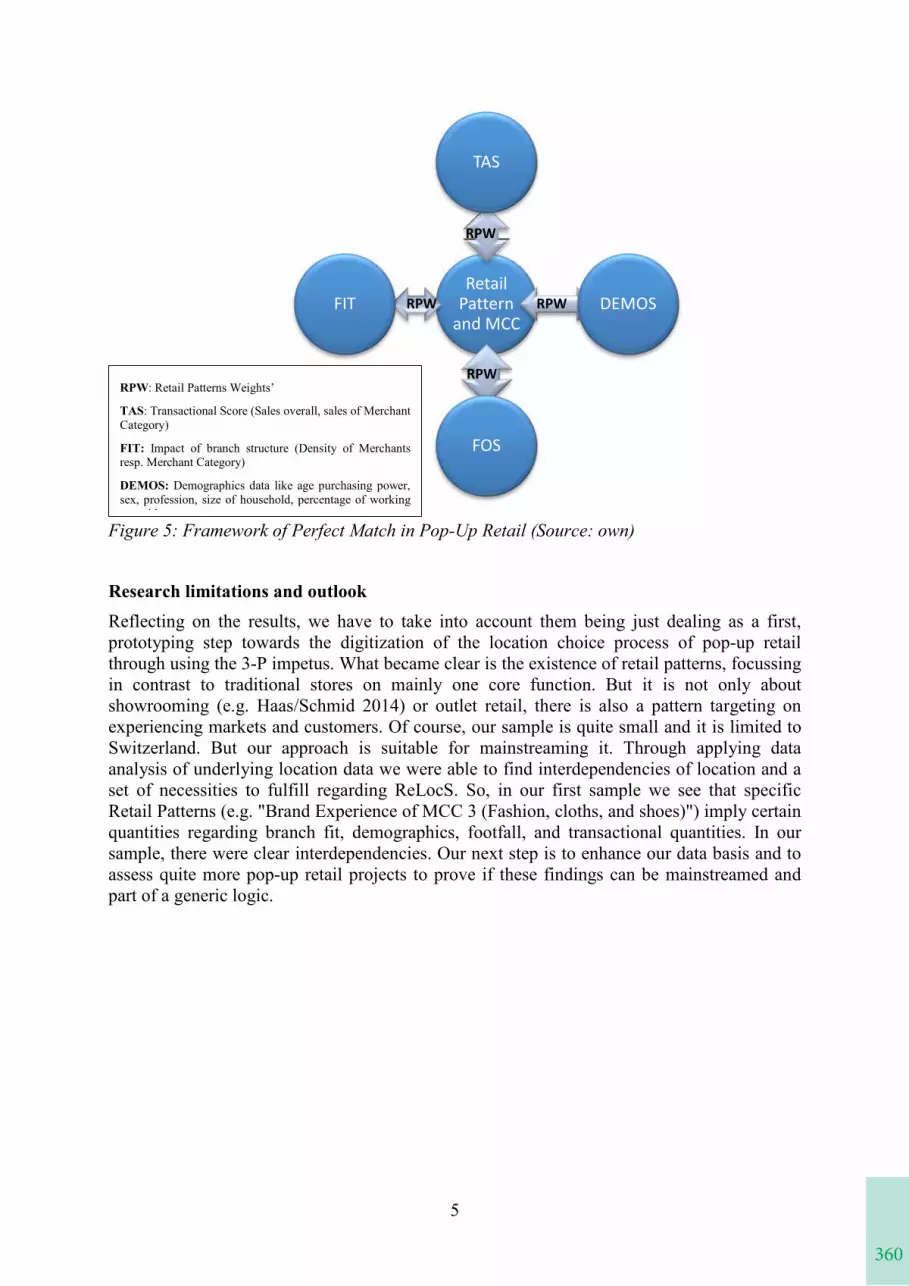
360
5
Figure 5: Framework of Perfect Match in Pop-Up Retail (Source: own)
Research limitations and outlookReflecting on the results, we have to take into account them being just dealing as a first, prototyping step towards the digitization of the location choice process of pop-up retail through using the 3-P impetus. What became clear is the existence of retail patterns, focussing in contrast to traditional stores on mainly one core function. But it is not only about showrooming (e.g. Haas/Schmid 2014) or outlet retail, there is also a pattern targeting on experiencing markets and customers. Of course, our sample is quite small and it is limited to Switzerland. But our approach is suitable for mainstreaming it. Through applying data analysis of underlying location data we were able to find interdependencies of location and a set of necessities to fulfill regarding ReLocS. So, in our first sample we see that specific Retail Patterns (e.g. "Brand Experience of MCC 3 (Fashion, cloths, and shoes)") imply certain quantities regarding branch fit, demographics, footfall, and transactional quantities. In our sample, there were clear interdependencies. Our next step is to enhance our data basis and to assess quite more pop-up retail projects to prove if these findings can be mainstreamed and part of a generic logic.
Retail Pattern
and MCC
RPW
TAS
RPW DEMOS
RPW
FOS
RPWFIT
RPW: Retail Patterns Weights’
TAS: Transactional Score (Sales overall, sales of Merchant Category)
FIT: Impact of branch structure (Density of Merchants resp. Merchant Category)
DEMOS: Demographics data like age purchasing power, sex, profession, size of household, percentage of working
id t t
361
5
Figure 5: Framework of Perfect Match in Pop-Up Retail (Source: own)
Research limitations and outlookReflecting on the results, we have to take into account them being just dealing as a first, prototyping step towards the digitization of the location choice process of pop-up retail through using the 3-P impetus. What became clear is the existence of retail patterns, focussing in contrast to traditional stores on mainly one core function. But it is not only about showrooming (e.g. Haas/Schmid 2014) or outlet retail, there is also a pattern targeting on experiencing markets and customers. Of course, our sample is quite small and it is limited to Switzerland. But our approach is suitable for mainstreaming it. Through applying data analysis of underlying location data we were able to find interdependencies of location and a set of necessities to fulfill regarding ReLocS. So, in our first sample we see that specific Retail Patterns (e.g. "Brand Experience of MCC 3 (Fashion, cloths, and shoes)") imply certain quantities regarding branch fit, demographics, footfall, and transactional quantities. In our sample, there were clear interdependencies. Our next step is to enhance our data basis and to assess quite more pop-up retail projects to prove if these findings can be mainstreamed and part of a generic logic.
Retail Pattern
and MCC
RPW
TAS
RPW DEMOS
RPW
FOS
RPWFIT
RPW: Retail Patterns Weights’
TAS: Transactional Score (Sales overall, sales of Merchant Category)
FIT: Impact of branch structure (Density of Merchants resp. Merchant Category)
DEMOS: Demographics data like age purchasing power, sex, profession, size of household, percentage of working
id t t
6
References*References to other publications must be in Harvard style and carefully checked for completeness, accuracy, and consistency. For more details please see https://cerr.sciencesconf.org/resource/page/id/3.
Bethan, A., Nobbs, K., & Varley, R. (2018). The growing permanence of pop-up outlets within the international location strategies of fashion retailers. International Journal of Retail & Distribution Management, 46(5), 487-506.
Childs, M., Blanchflower, T., Hur, S., & Matthews, D. (2019). Non-traditional marketplaces in the retail apocalypse: investigating consumers’ buying behaviours. International Journal of Retail and Distribution Management 48(3), 262-286.
Hass, S., & Schmid, L. (2016). What Drives the Success of Pop-up Stores? Wissenschaftliche Beiträge der TH Wildnau 20:86-95. https://doi.org/10.15771/0949-8214_2016_1_12.
Kimball, R., & Ross, M. (2002). The data warehouse toolkit: The complete guide to dimensional modeling. New York: Wiley.
Kuckartz, U. (2018). Qualitative Inhaltsanalyse. Methoden, Praxis, Computerunterstützung. (4. Auflage). Weinheim-Basel: Beltz.
Niehm, L. S., Fiore, A. M., Jeong, M., & Kim, H.-J. (2006). Pop-up retail's acceptability as an innovative business strategy and enhancer of the customer shopping experience. Journal of Shopping Center Research, 13(2), 1 – 30.
Picot-Coupey, K. (2014). The pop-up store as a foreign operation mode (FOM) for retailers. International Journal of Retail & Distribution Management, 42(2), 643 – 670.
Schüller, S., & Jud, B. (2018): The Revolution of Brick-and-Mortar-Retail Pop-up Stores – aTaxonomy. St.Gallen Marketing Review 35 (1). 60-68.
Surchi, M. (2011). The temporary store: A new marketing tool for fashion brands. Journal of Fashion Marketing and Management, 15(2), 257 – 270.
Rudkowski, J., Heney, C., Yu,H., Sedlezky, S., Gunn, F. (2019). Here Today, Gone Tomorrow? Mapping and modeling the pop-up retail customer journey. Journal of Retailing and Consumer Services, https://doi.org/10.1016/j.jretconser.2018.11.003
Warnaby, G., & Shi, C. (2018). Pop p-up Retailing: Managerial and Strategic Perspectives. Cham: Springer Gabler.
Appendix
Keywords*Pop-up, AI, retail, retail location choice, retail patterns, flexible retail, retail as a service, ephemeral retail, mixed-method.
362
1
THE COMPETITIVE ADVANTAGE OF MULTI-PLATFORM-BASEDECOSYSTEM: THE EVIDENCE FROM ALIBABA
Jin Shi (Corresponding author)
Graduate School of Humanities and Social Science, Saitama University, Saitama, Japan
Huifeng Bai
Liverpool Business School, Liverpool John Moores University, Liverpool, UK
Introduction
In the past two decades, the landscape of global market had experienced tremendous momentum due to emerging multinational corporations which adopted platforms and ecosystems as business models, for instance GAFA (Google, Apple, Facebook, Amazon) in the United States and BAT (Baidu, Alibaba, Tencent) in China. Given this profound phenomenon, many scholars predicted the focus of future competition among firms will shift toward platform or ecosystem (Moore et al., 1997; Tiwana et al., 2010; Eisenmann et al.,2011; Sussan & Acs, 2017). Meanwhile, platforms or ecosystems have also emerged as a prevailing research theme. For instance, in international business, the issue has been analyzedfrom various perspectives, including innovation, governance, and entrepreneurship, and has accumulated a large body of research (Moore,1993; Gawer & Cusumnamo, 2002; Evans, 2003; Tiwana & Bush, 2010; William & De Meyer, 2012; Adner & Kapoor, 2013; Hagiu, 2013; Sussan & Acs, 2017; Jacobides et al., 2018). Despite great contribution of prior literature, the understanding of platforms or ecosystems still remain under-developed. For example, the ecosystem deploying multiple platforms simultaneously, namely Multi-platform-based (MPB) ecosystem has been overlooked so far. Moreover, there is also a lack of research that examines the ecosystem's competitive advantage from a strategic point of view. In particular, the question of how the platform or ecosystem is built and how companies gain competitive advantage through it remains unclear. Furthermore, as identified by many researchers, there is still lack of empirical research.
Purpose
By the given gap in the current literature, this study aims to offer depth insights of competitive advantages of multiplatform-based ecosystem through case study of Alibaba, which is regarded as one of the most successful and powerful multinational corporations globally. There are several significant ecosystems simultaneously within Alibaba Group, including Fintech, logistics, entertainment, and cloud computing. This study, concentrated on its Fintech ecosystem, will dedicate to contribution insights for the following research questions:
- What is the development process of Alibaba’s multi-platform-based ecosystem?
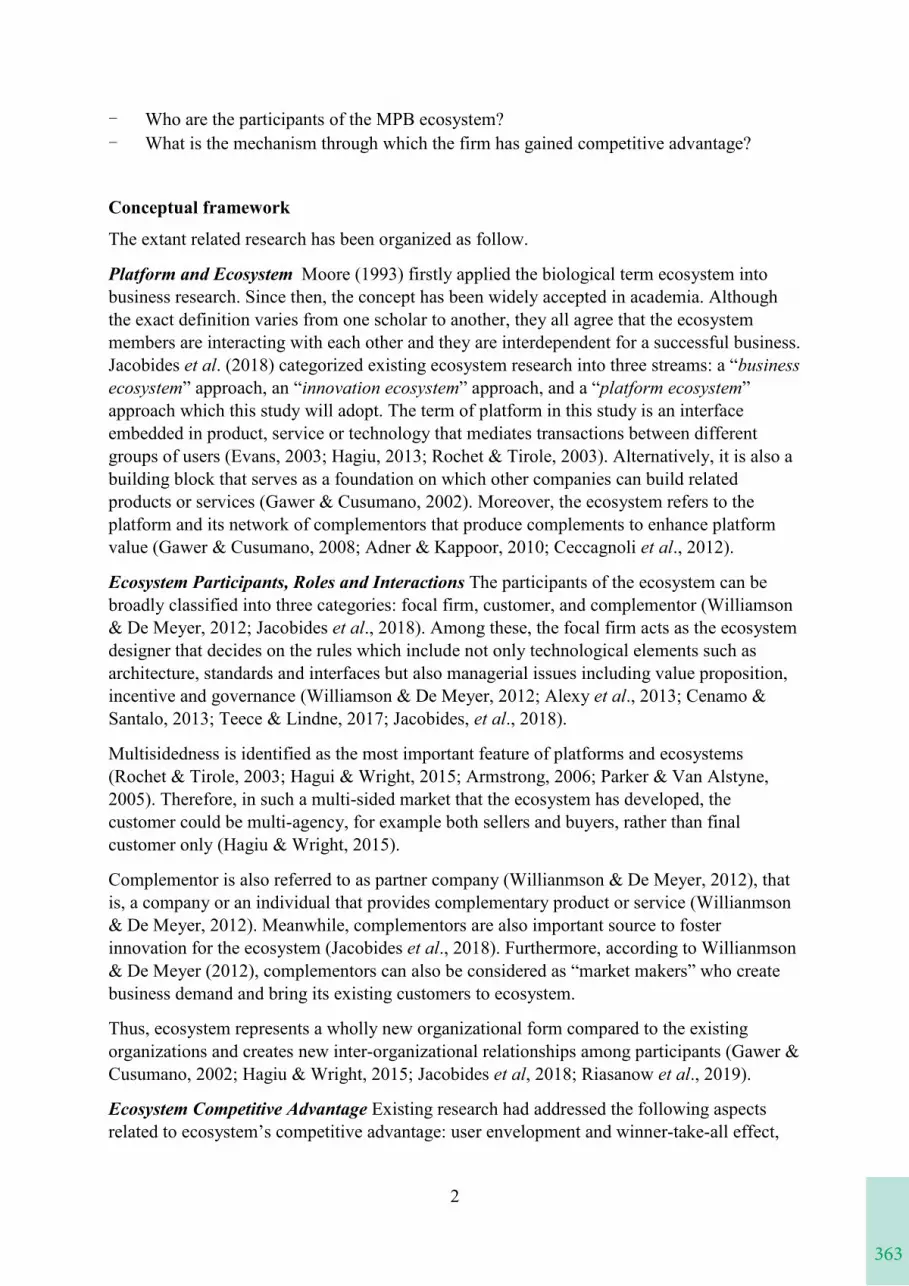
363
1
THE COMPETITIVE ADVANTAGE OF MULTI-PLATFORM-BASEDECOSYSTEM: THE EVIDENCE FROM ALIBABA
Jin Shi (Corresponding author)
Graduate School of Humanities and Social Science, Saitama University, Saitama, Japan
Huifeng Bai
Liverpool Business School, Liverpool John Moores University, Liverpool, UK
Introduction
In the past two decades, the landscape of global market had experienced tremendous momentum due to emerging multinational corporations which adopted platforms and ecosystems as business models, for instance GAFA (Google, Apple, Facebook, Amazon) in the United States and BAT (Baidu, Alibaba, Tencent) in China. Given this profound phenomenon, many scholars predicted the focus of future competition among firms will shift toward platform or ecosystem (Moore et al., 1997; Tiwana et al., 2010; Eisenmann et al.,2011; Sussan & Acs, 2017). Meanwhile, platforms or ecosystems have also emerged as a prevailing research theme. For instance, in international business, the issue has been analyzedfrom various perspectives, including innovation, governance, and entrepreneurship, and has accumulated a large body of research (Moore,1993; Gawer & Cusumnamo, 2002; Evans, 2003; Tiwana & Bush, 2010; William & De Meyer, 2012; Adner & Kapoor, 2013; Hagiu, 2013; Sussan & Acs, 2017; Jacobides et al., 2018). Despite great contribution of prior literature, the understanding of platforms or ecosystems still remain under-developed. For example, the ecosystem deploying multiple platforms simultaneously, namely Multi-platform-based (MPB) ecosystem has been overlooked so far. Moreover, there is also a lack of research that examines the ecosystem's competitive advantage from a strategic point of view. In particular, the question of how the platform or ecosystem is built and how companies gain competitive advantage through it remains unclear. Furthermore, as identified by many researchers, there is still lack of empirical research.
Purpose
By the given gap in the current literature, this study aims to offer depth insights of competitive advantages of multiplatform-based ecosystem through case study of Alibaba, which is regarded as one of the most successful and powerful multinational corporations globally. There are several significant ecosystems simultaneously within Alibaba Group, including Fintech, logistics, entertainment, and cloud computing. This study, concentrated on its Fintech ecosystem, will dedicate to contribution insights for the following research questions:
- What is the development process of Alibaba’s multi-platform-based ecosystem?
2
- Who are the participants of the MPB ecosystem? - What is the mechanism through which the firm has gained competitive advantage?
Conceptual framework
The extant related research has been organized as follow.
Platform and Ecosystem Moore (1993) firstly applied the biological term ecosystem intobusiness research. Since then, the concept has been widely accepted in academia. Although the exact definition varies from one scholar to another, they all agree that the ecosystem members are interacting with each other and they are interdependent for a successful business. Jacobides et al. (2018) categorized existing ecosystem research into three streams: a “business ecosystem” approach, an “innovation ecosystem” approach, and a “platform ecosystem”approach which this study will adopt. The term of platform in this study is an interface embedded in product, service or technology that mediates transactions between different groups of users (Evans, 2003; Hagiu, 2013; Rochet & Tirole, 2003). Alternatively, it is also abuilding block that serves as a foundation on which other companies can build related products or services (Gawer & Cusumano, 2002). Moreover, the ecosystem refers to theplatform and its network of complementors that produce complements to enhance platformvalue (Gawer & Cusumano, 2008; Adner & Kappoor, 2010; Ceccagnoli et al., 2012).
Ecosystem Participants, Roles and Interactions The participants of the ecosystem can be broadly classified into three categories: focal firm, customer, and complementor (Williamson & De Meyer, 2012; Jacobides et al., 2018). Among these, the focal firm acts as the ecosystem designer that decides on the rules which include not only technological elements such as architecture, standards and interfaces but also managerial issues including value proposition,incentive and governance (Williamson & De Meyer, 2012; Alexy et al., 2013; Cenamo & Santalo, 2013; Teece & Lindne, 2017; Jacobides, et al., 2018).
Multisidedness is identified as the most important feature of platforms and ecosystems(Rochet & Tirole, 2003; Hagui & Wright, 2015; Armstrong, 2006; Parker & Van Alstyne, 2005). Therefore, in such a multi-sided market that the ecosystem has developed, the customer could be multi-agency, for example both sellers and buyers, rather than finalcustomer only (Hagiu & Wright, 2015).
Complementor is also referred to as partner company (Willianmson & De Meyer, 2012), that is, a company or an individual that provides complementary product or service (Willianmson & De Meyer, 2012). Meanwhile, complementors are also important source to foster innovation for the ecosystem (Jacobides et al., 2018). Furthermore, according to Willianmson & De Meyer (2012), complementors can also be considered as “market makers” who create business demand and bring its existing customers to ecosystem.
Thus, ecosystem represents a wholly new organizational form compared to the existing organizations and creates new inter-organizational relationships among participants (Gawer & Cusumano, 2002; Hagiu & Wright, 2015; Jacobides et al, 2018; Riasanow et al., 2019).
Ecosystem Competitive Advantage Existing research had addressed the following aspectsrelated to ecosystem’s competitive advantage: user envelopment and winner-take-all effect,
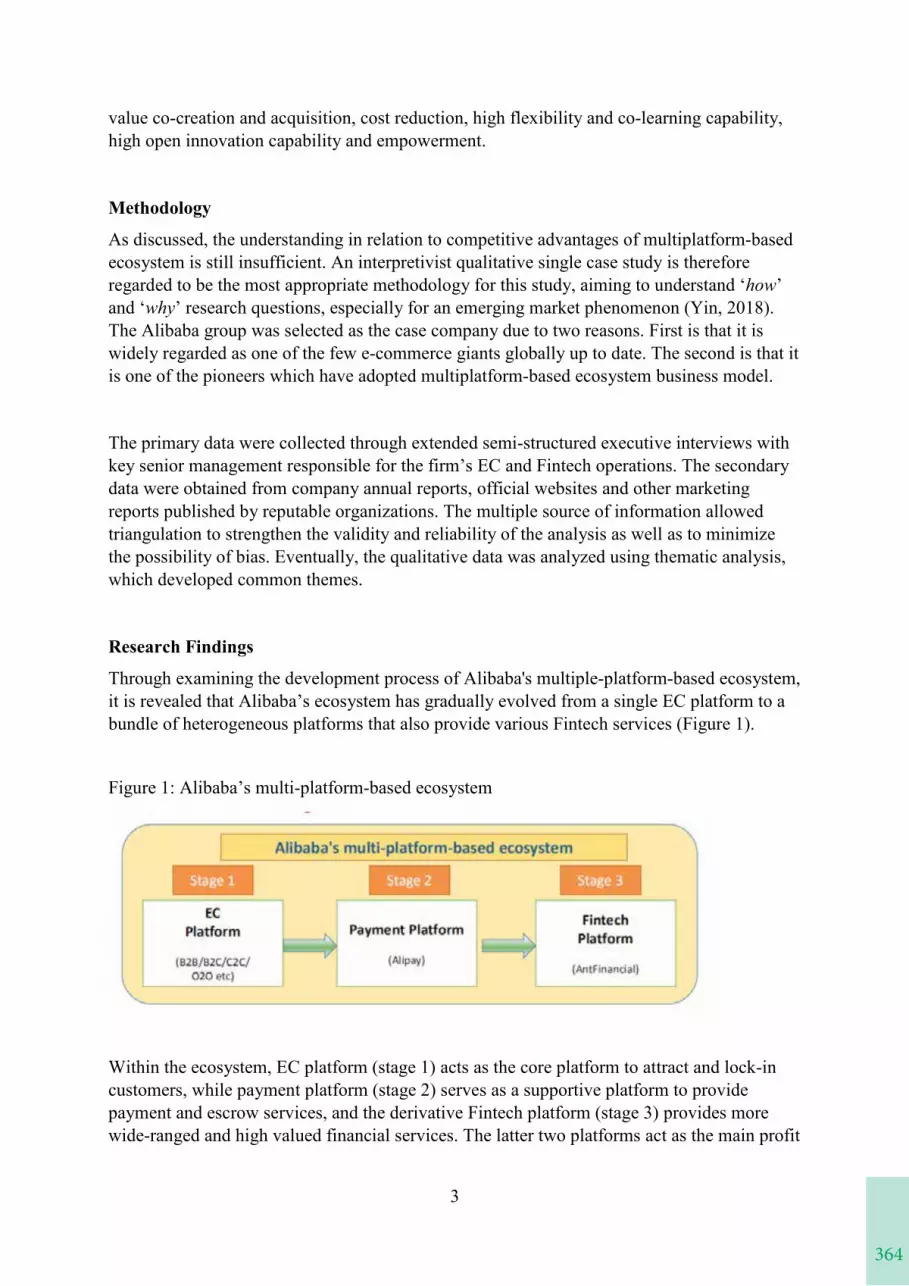
364
3
value co-creation and acquisition, cost reduction, high flexibility and co-learning capability, high open innovation capability and empowerment.
Methodology
As discussed, the understanding in relation to competitive advantages of multiplatform-based ecosystem is still insufficient. An interpretivist qualitative single case study is therefore regarded to be the most appropriate methodology for this study, aiming to understand ‘how’and ‘why’ research questions, especially for an emerging market phenomenon (Yin, 2018). The Alibaba group was selected as the case company due to two reasons. First is that it is widely regarded as one of the few e-commerce giants globally up to date. The second is that it is one of the pioneers which have adopted multiplatform-based ecosystem business model.
The primary data were collected through extended semi-structured executive interviews with key senior management responsible for the firm’s EC and Fintech operations. The secondary data were obtained from company annual reports, official websites and other marketing reports published by reputable organizations. The multiple source of information allowed triangulation to strengthen the validity and reliability of the analysis as well as to minimize the possibility of bias. Eventually, the qualitative data was analyzed using thematic analysis, which developed common themes.
Research Findings
Through examining the development process of Alibaba's multiple-platform-based ecosystem,it is revealed that Alibaba’s ecosystem has gradually evolved from a single EC platform to abundle of heterogeneous platforms that also provide various Fintech services (Figure 1).
Figure 1: Alibaba’s multi-platform-based ecosystem
Within the ecosystem, EC platform (stage 1) acts as the core platform to attract and lock-in customers, while payment platform (stage 2) serves as a supportive platform to provide payment and escrow services, and the derivative Fintech platform (stage 3) provides more wide-ranged and high valued financial services. The latter two platforms act as the main profit
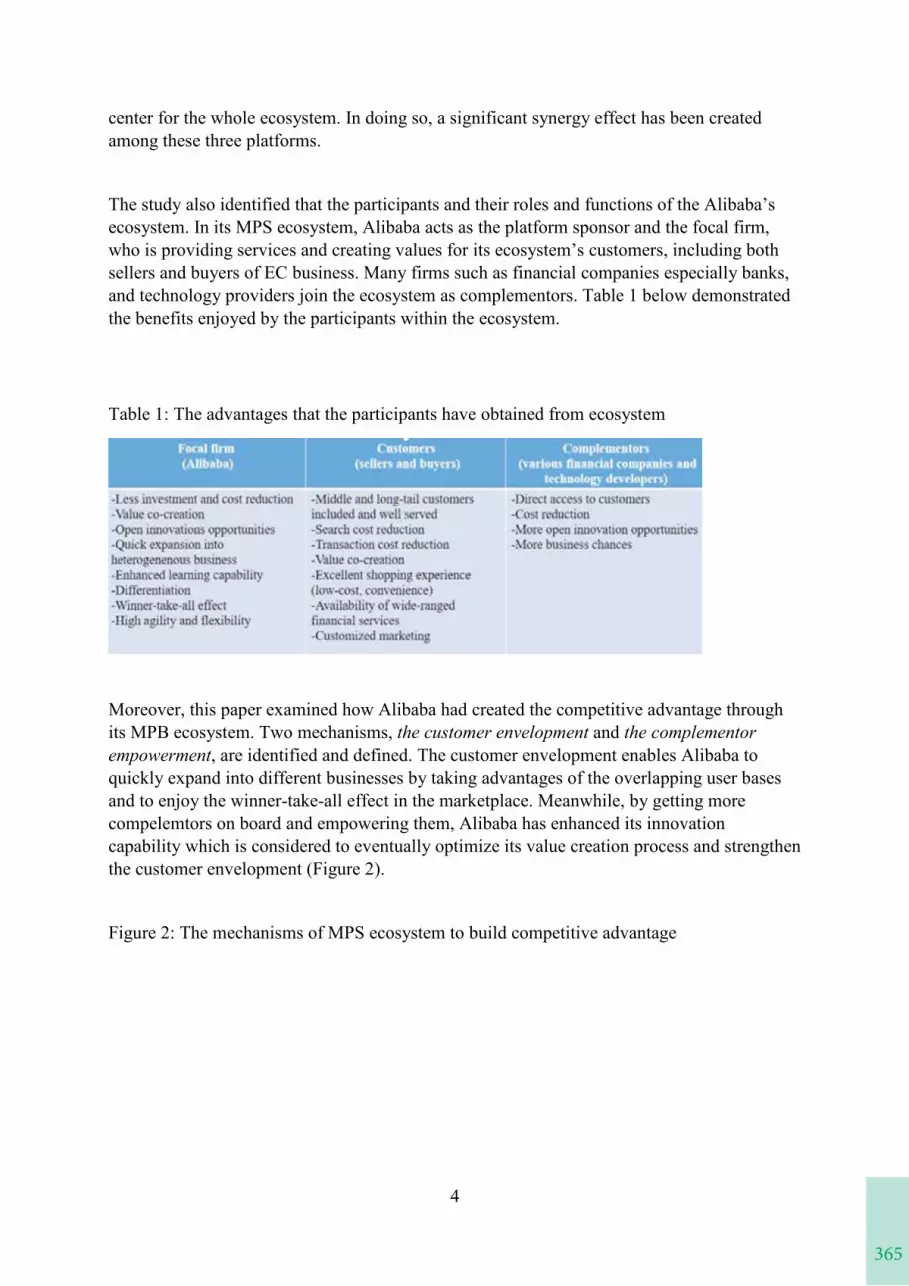
365
3
value co-creation and acquisition, cost reduction, high flexibility and co-learning capability, high open innovation capability and empowerment.
Methodology
As discussed, the understanding in relation to competitive advantages of multiplatform-based ecosystem is still insufficient. An interpretivist qualitative single case study is therefore regarded to be the most appropriate methodology for this study, aiming to understand ‘how’and ‘why’ research questions, especially for an emerging market phenomenon (Yin, 2018). The Alibaba group was selected as the case company due to two reasons. First is that it is widely regarded as one of the few e-commerce giants globally up to date. The second is that it is one of the pioneers which have adopted multiplatform-based ecosystem business model.
The primary data were collected through extended semi-structured executive interviews with key senior management responsible for the firm’s EC and Fintech operations. The secondary data were obtained from company annual reports, official websites and other marketing reports published by reputable organizations. The multiple source of information allowed triangulation to strengthen the validity and reliability of the analysis as well as to minimize the possibility of bias. Eventually, the qualitative data was analyzed using thematic analysis, which developed common themes.
Research Findings
Through examining the development process of Alibaba's multiple-platform-based ecosystem,it is revealed that Alibaba’s ecosystem has gradually evolved from a single EC platform to abundle of heterogeneous platforms that also provide various Fintech services (Figure 1).
Figure 1: Alibaba’s multi-platform-based ecosystem
Within the ecosystem, EC platform (stage 1) acts as the core platform to attract and lock-in customers, while payment platform (stage 2) serves as a supportive platform to provide payment and escrow services, and the derivative Fintech platform (stage 3) provides more wide-ranged and high valued financial services. The latter two platforms act as the main profit
4
center for the whole ecosystem. In doing so, a significant synergy effect has been createdamong these three platforms.
The study also identified that the participants and their roles and functions of the Alibaba’s ecosystem. In its MPS ecosystem, Alibaba acts as the platform sponsor and the focal firm, who is providing services and creating values for its ecosystem’s customers, including both sellers and buyers of EC business. Many firms such as financial companies especially banks, and technology providers join the ecosystem as complementors. Table 1 below demonstrated the benefits enjoyed by the participants within the ecosystem.
Table 1: The advantages that the participants have obtained from ecosystem
Moreover, this paper examined how Alibaba had created the competitive advantage through its MPB ecosystem. Two mechanisms, the customer envelopment and the complementorempowerment, are identified and defined. The customer envelopment enables Alibaba to quickly expand into different businesses by taking advantages of the overlapping user basesand to enjoy the winner-take-all effect in the marketplace. Meanwhile, by getting more compelemtors on board and empowering them, Alibaba has enhanced its innovation capability which is considered to eventually optimize its value creation process and strengthen the customer envelopment (Figure 2).
Figure 2: The mechanisms of MPS ecosystem to build competitive advantage
366
5
Value
By shedding light on the MPS ecosystem, a research object ignored by the extant research, this study has revealed how it has been developed and through which mechanism to buildcompetitive advantage. In doing so, this study has extended depth insights on the ecosystem and contributed to the theory-development.
Practical implications
This study has valuable managerial implications for both standalone and ecosystem firms. For standalone firms, this study has suggested, to win the battle with ecosystem, they need to develop innovative product or service to destroy the customer envelopment. For firms deploying ecosystem strategy, the study implies the importance to design a sophisticated business model to make profit and to strengthen the customer envelopment and the complementor empowerment effects.
Research limitations and outlook
Although this paper has shed light on the MPS ecosystem, our understanding is still not sufficient. More cases should be examined and more evidence is needed to be collected to help us gain more profound understanding of the ecosystem.
Because of the single case study approach, the purposive sampling and small sample are potentially challenged. However, as MPS ecosystem is still in the early stage, and there are not many companies had successfully developed their MPS system. As one of the most successful and powerful companies globally, the evidence from Alibaba is strong and varied enough to represent the market. As Alibaba is an emerging market multinational corporate (EM MNC), the differences from traditional multinational corporates is also considered. Therefore, the subsequent studies could test this study’s findings in quantitative methods through larger samples, especially traditional MNC originated from developed economies.
References*
367
5
Value
By shedding light on the MPS ecosystem, a research object ignored by the extant research, this study has revealed how it has been developed and through which mechanism to buildcompetitive advantage. In doing so, this study has extended depth insights on the ecosystem and contributed to the theory-development.
Practical implications
This study has valuable managerial implications for both standalone and ecosystem firms. For standalone firms, this study has suggested, to win the battle with ecosystem, they need to develop innovative product or service to destroy the customer envelopment. For firms deploying ecosystem strategy, the study implies the importance to design a sophisticated business model to make profit and to strengthen the customer envelopment and the complementor empowerment effects.
Research limitations and outlook
Although this paper has shed light on the MPS ecosystem, our understanding is still not sufficient. More cases should be examined and more evidence is needed to be collected to help us gain more profound understanding of the ecosystem.
Because of the single case study approach, the purposive sampling and small sample are potentially challenged. However, as MPS ecosystem is still in the early stage, and there are not many companies had successfully developed their MPS system. As one of the most successful and powerful companies globally, the evidence from Alibaba is strong and varied enough to represent the market. As Alibaba is an emerging market multinational corporate (EM MNC), the differences from traditional multinational corporates is also considered. Therefore, the subsequent studies could test this study’s findings in quantitative methods through larger samples, especially traditional MNC originated from developed economies.
References*
6
Adner, R. (2017). Ecosystem as structure: An actionable construct for strategy. Journal of Management, 43(1), 39-58.
Adner, R., & Kapoor, R. (2010). Value creation in innovation ecosystems: How the structure of technological interdependence affects firm performance in new technology generations. Strategic Management Journal, 31(3), 306-333.
Alexy, O., & George, G. (2013). Category divergence, straddling, and currency: Open innovation and the legitimation of illegitimate categories. Journal of Management Studies,50(2), 173-203.
Autio, E., & Thomas, L. (2014). Innovation ecosystems. The Oxford handbook of innovation management, 204-288.
Ceccagnoli, M., Forman, C., Huang, P., & Wu, D. J. (2012). Cocreation of value in a platform ecosystem! The case of enterprise software. MIS Quarterly, 263-290.
Cennamo, C., & Santalo, J. (2013). Platform competition: Strategic trade‐offs in platform markets. Strategic Management Journal, 34(11), 1331-1350.
de Reuver, M., Sørensen, C., & Basole, R. C. (2018). The digital platform: a research agenda. Journal of Information Technology, 33(2), 124-135.
Eisenmann, T., Parker, G., & Van Alstyne, M. (2011). Platform envelopment. Strategic Management Journal, 32(12), 1270-1285.
Evans, D. S. (2003). Some empirical aspects of multi-sided platform industries. Review of Network Economics, 2(3), 191-209.
Gawer, A., & Cusumano, M. A. (2002). Platform leadership: How Intel, Microsoft, and Cisco drive industry innovation (Vol. 5, pp. 29-30). Boston, MA: Harvard Business School Press.
Gawer, A., & Cusumano, M. A. (2008). Platform leaders. MIT Sloan Management Review; MIT Sloan School of Management: Boston, MA, USA, 68-75.
Hagiu, A. (2013). Strategic decisions for multisided platforms.http://marketing.mitsmr.com/PDF/STR0715-Top-10-Strategy.pdf#page=6
Hagiu, A., & Rothman, S. (2016). Network effects aren’t enough. Harvard Business Review,94(4), 64-71.
Hagiu, A., & Wright, J. (2015). Multi-sided platforms. International Journal of Industrial Organization, 43, 162-174.
Jacobides, M. G., Cennamo, C., & Gawer, A. (2018). Towards a theory of ecosystems. Strategic Management Journal, 39(8), 2255-2276.
Moore, J. C., Rao, H. R., Whinston, A., Nam, K., & Raghu, T. S. (1997). Information acquisition policies for resource allocation among multiple agents. Information Systems Research, 8(2), 151-170.
Moore, J. F. (1993). Predators and prey: a new ecology of competition. Harvard Business Review, 71(3), 75-86.
Riasanow, T., Floetgen, R. J., Greineder, M., Moeslein, D., Böhm, M., & Krcmar, H. (2019). Co-evolution in Business Ecosystems: Findings from Literature. In 40th GI EMISA.https://www.researchgate.net/profile/Tobias_Riasanow/publication/333186124_Co-
368
7
evolution_in_Business_Ecosystems_Findings_from_Literature/links/5cdfbbd7a6fdccc9ddb95384/Co-evolution-in-Business-Ecosystems-Findings-from-Literature.pdf
Rochet, J. C., & Tirole, J. (2003). Platform competition in two-sided markets. Journal of the European Economic Association, 1(4), 990-1029.
Sussan, F., & Acs, Z. J. (2017). The digital entrepreneurial ecosystem. Small Business Economics, 49(1), 55-73.
Teece, D. J., & Linden, G. (2017). Business models, value capture, and the digital enterprise. Journal of Organization Design, 6(1), 1-14.
Tiwana, A., Konsynski, B., & Bush, A. A. (2010). Research commentary—Platform evolution: Coevolution of platform architecture, governance, and environmental dynamics. Information Systems Research, 21(4), 675-687.
Williamson, P. J., & De Meyer, A. (2012). Ecosystem advantage: How to successfully harness the power of partners. California Management Review, 55(1), 24-46.
Yin, R. (2018). Case Study Research and Applications: Design and Methods (6th Ed). Los Angeles: SAGE.
Keywords*
Multi-platform-based Ecosystem, Platform, Ecosystem Competitive Advantage, Complementor Empowerment, Customer Envelopment, Innovation
369
7
evolution_in_Business_Ecosystems_Findings_from_Literature/links/5cdfbbd7a6fdccc9ddb95384/Co-evolution-in-Business-Ecosystems-Findings-from-Literature.pdf
Rochet, J. C., & Tirole, J. (2003). Platform competition in two-sided markets. Journal of the European Economic Association, 1(4), 990-1029.
Sussan, F., & Acs, Z. J. (2017). The digital entrepreneurial ecosystem. Small Business Economics, 49(1), 55-73.
Teece, D. J., & Linden, G. (2017). Business models, value capture, and the digital enterprise. Journal of Organization Design, 6(1), 1-14.
Tiwana, A., Konsynski, B., & Bush, A. A. (2010). Research commentary—Platform evolution: Coevolution of platform architecture, governance, and environmental dynamics. Information Systems Research, 21(4), 675-687.
Williamson, P. J., & De Meyer, A. (2012). Ecosystem advantage: How to successfully harness the power of partners. California Management Review, 55(1), 24-46.
Yin, R. (2018). Case Study Research and Applications: Design and Methods (6th Ed). Los Angeles: SAGE.
Keywords*
Multi-platform-based Ecosystem, Platform, Ecosystem Competitive Advantage, Complementor Empowerment, Customer Envelopment, Innovation
1
TRANSITIONG TO OMNI-CHANNEL IN GROCERY RETAIL: A DYNAMIC CAPABILTIES APPROACH
IntroductionThe retail industry is changing when online shopping grows and technology develops. Customers are demanding faster deliveries as well as more flexible and personalized shopping experiences. While the changes has been positive from a front-end perspective, retailers are struggling back-end (Kembro et al., 2018). The complexity of order fulfilment is increasing, profit margins are plummeting, expected lead times are decreasing, and product assortments are growing. Retailers are therefore investing in new warehouses, IT systems and logistics processes (Melacini et al., 2018).
For grocery retail, this change has been slower than in other retail sectors (Hübner et al., 2016). However, in recent years, the grocery retail sector has experienced a rapid growth in online sales. Traditional bricks-and- mortar retailers are starting up online channels as a complement to their existing store channels. The logistics network must therefore be able to handle both store- and online customer orders, different delivery requirements are shorter lead-times (Hübner et al., 2016). To cater to new demands, the logistics network must transform (Wollenburg et al., 2018). To handle the increasing complexity and changing customer demand,it is common for grocery retailers to invest in separated warehouses, i.e. online fulfilment centres (OFC) and new technology (Wollenburg et al., 2018).
This transformation, often referred to as omni-channel, entails changes both in general market development and in retailers’ internal logistics networks. The logistics network must now cater to end-customers’ new demands simultaneously, just as they cater to physical stores’ demands.The omni-channel transformation has created a rapidly changing environment that sets high requirements on retailers’ organisation and logistics capabilities (Eriksson et al., 2019). To be competitive in the future, grocery retailers must invest in new logistics processes, new warehouses, new automation technology, and new IT systems, as well as transforming their organisation (Eriksson, 2019).
As online sales continue to grow rapidly, it will be interesting to investigate grocery retailers that have managed to succeed in this environment. Teece et al. (1997) argue that to achieve and sustain a competitive advantage in a changing environment, a company must have ‘dynamic capabilities’. Teece et el., (1997) define dynamic capabilities as a company’s ‘ability to integrate, build and reconfigure internal and external (competencies) to address rapidly changing environments’ (Teece et al., 1997, p. 516). Logistics, operations, and warehousing are commonly viewed as ordinary capabilities. Shuen et al., (2014) argue “Strong ordinary capabilities indicate that the firm has achieved “best practices”, and owns or has access to skilled people and advanced equipment”. Dynamic capabilities can be used to understand how these ordinary capabilities yield value-enhancing differentiation.
There are several reasons why dynamic capabilities is a good tool to understand grocery retailers’ sustained competitive advantage in an omni-channel environment. Omni-channel grocery retail is a market characterised by rapid growth, changing customer expectations, and new technological development. Further, future competition and market development are difficult to anticipate. Moreover, retailers are making huge investments in warehousing and technology, and are transforming both organisations and logistics network (Eriksson et al.,
370
2
2019; Wollenburg et al., 2018). Analysing dynamic capabilities can help us understand how grocery retailers respond to these challenges and how they transform to omni-channel.
There are number of articles on dynamic capabilities on an organisational level (cf. Teece et al., 1997; Teece, 2007; Shuen et al., 2014; Feiler and Teece, 2014) and on dynamic capabilities from a supply chain perspective (cf. Defee and Fugate, 2010; Beske, 2012; Beske et al., 2014; Tatham et al., 2017; Gruchmann et al., 2019). However, there is a lack of knowledge on dynamic capabilities in grocery retail and logistics in an omni-channel environment. Mirsch et al., (2016) begins a discussion of dynamic capabilities in the transformation to omni-channel in their conference paper. However, their focus is on the organisation, not on the logistics, and they exclude the grocery retail context. Song et al., (2019) and Song and Song (2020) investigate the relationship between human resources and supply chain integration, with dynamic capabilities as a theoretical lens. Wollenburg et al. (2018) discuss capabilities in online grocery retail fulfilment, but do not go in-depth on how dynamic capabilities can be used to further the understanding. Hence, there is a lack of knowledge on the capabilities required for a sustained competitive advantage in omni-channel grocery retail environment.
Purpose*The rapid transformation of the grocery-retail enviromnent, in combination with large investments in the back-end logistics, calls for research on how and why certain grocery retailers manage to succeed in an omni-channel environment. Previous research hashighlighted the ability to transform the logistics network to cater new demands as of key importance in the omni-channel transformation (cf. Melacini et al., 2018; Wollenburg et al., 2018; Kembro et al., 2018). While research has begun to explore what successful omni-channel retailers are doing with their logistics network, there is still a lack of research on how they are able to transform. These specific characteristics of omni-channel grocery retail makes dynamic capabilities an appropriate theoretical approach to understand this transformation.The purpose of this study is thus ‘to explore and understand dynamic capabilities that successful grocery retailers possess in an omni-channel environment’.
Conceptual frameworkDynamic capabilities have not before been used to explore grocery retail and logistics in an omni-channel environment. The first task of this study is therefor to develop a conceptual framework for exploring and investigating dynamic capabilities in this context.
The first part of developing the conceptual framework was to understand the specific context of omni-channel grocery retail. Previous research has showed that logistics and warehousing play a critical role for omni-channel grocery retailers (Hübner et al., 2016; Wollenburg et al.,2018; Eriksson et al., 2019). However, this research stream has mainly focused on the configuration of the logistics network and material-handling nodes, and not on the capabilities required for this transformation. Still, this research area provides valuable knowledge on the context, situation, and development of omni-channel grocery retail.
Second, input from research on dynamic capabilities both from an organisational and supply chain perspective was collected. The conceptual framework will build on the works of Teece, (2007), Teece (2018), Defee and Fugate (2010), Koch (2010), Beske et al., 2014, and Tatham et al., (2017). According to Teece (2007), dynamic capabilities can be divided into three steps: i) sensing opportunities and threats, ii) seizing opportunities and iii) managing threats and reconfigurations. These three steps will be the fundament of the conceptual framework. The other articles will provide insight in to how to explore dynamic capabilities from a supply chain and logistics perspective. Defee and Fugate (2010) provide a model of dynamic supply chain capabilities which consist of three interrelated components, i) strategic orientations, ii) dynamic
371
2
2019; Wollenburg et al., 2018). Analysing dynamic capabilities can help us understand how grocery retailers respond to these challenges and how they transform to omni-channel.
There are number of articles on dynamic capabilities on an organisational level (cf. Teece et al., 1997; Teece, 2007; Shuen et al., 2014; Feiler and Teece, 2014) and on dynamic capabilities from a supply chain perspective (cf. Defee and Fugate, 2010; Beske, 2012; Beske et al., 2014; Tatham et al., 2017; Gruchmann et al., 2019). However, there is a lack of knowledge on dynamic capabilities in grocery retail and logistics in an omni-channel environment. Mirsch et al., (2016) begins a discussion of dynamic capabilities in the transformation to omni-channel in their conference paper. However, their focus is on the organisation, not on the logistics, and they exclude the grocery retail context. Song et al., (2019) and Song and Song (2020) investigate the relationship between human resources and supply chain integration, with dynamic capabilities as a theoretical lens. Wollenburg et al. (2018) discuss capabilities in online grocery retail fulfilment, but do not go in-depth on how dynamic capabilities can be used to further the understanding. Hence, there is a lack of knowledge on the capabilities required for a sustained competitive advantage in omni-channel grocery retail environment.
Purpose*The rapid transformation of the grocery-retail enviromnent, in combination with large investments in the back-end logistics, calls for research on how and why certain grocery retailers manage to succeed in an omni-channel environment. Previous research hashighlighted the ability to transform the logistics network to cater new demands as of key importance in the omni-channel transformation (cf. Melacini et al., 2018; Wollenburg et al., 2018; Kembro et al., 2018). While research has begun to explore what successful omni-channel retailers are doing with their logistics network, there is still a lack of research on how they are able to transform. These specific characteristics of omni-channel grocery retail makes dynamic capabilities an appropriate theoretical approach to understand this transformation.The purpose of this study is thus ‘to explore and understand dynamic capabilities that successful grocery retailers possess in an omni-channel environment’.
Conceptual frameworkDynamic capabilities have not before been used to explore grocery retail and logistics in an omni-channel environment. The first task of this study is therefor to develop a conceptual framework for exploring and investigating dynamic capabilities in this context.
The first part of developing the conceptual framework was to understand the specific context of omni-channel grocery retail. Previous research has showed that logistics and warehousing play a critical role for omni-channel grocery retailers (Hübner et al., 2016; Wollenburg et al.,2018; Eriksson et al., 2019). However, this research stream has mainly focused on the configuration of the logistics network and material-handling nodes, and not on the capabilities required for this transformation. Still, this research area provides valuable knowledge on the context, situation, and development of omni-channel grocery retail.
Second, input from research on dynamic capabilities both from an organisational and supply chain perspective was collected. The conceptual framework will build on the works of Teece, (2007), Teece (2018), Defee and Fugate (2010), Koch (2010), Beske et al., 2014, and Tatham et al., (2017). According to Teece (2007), dynamic capabilities can be divided into three steps: i) sensing opportunities and threats, ii) seizing opportunities and iii) managing threats and reconfigurations. These three steps will be the fundament of the conceptual framework. The other articles will provide insight in to how to explore dynamic capabilities from a supply chain and logistics perspective. Defee and Fugate (2010) provide a model of dynamic supply chain capabilities which consist of three interrelated components, i) strategic orientations, ii) dynamic
3
supply chain capabilities, and iii) supply chain performance. Beske et al., (2014) develop this model further, while Tatham et al., (2017) investigate different types of dynamic capabilities among supply chain managers.
Design/methodology/approach*In this planned study, we aim to explore and understand different types of dynamic capabilities that successful omni-channel grocery retailers possess. Further, we aim to identify underlying processes and factors in the external and internal environment that contribute to the development of these dynamic capabilities. The purpose of the study, in combination with the novelty of the phenomenon and the lack of existing research, makes a case study approach an appropriate method (Eisenhardt, 1989; Yin, 2009). The nature of the research objective makes it appropriate to use multiple cases with different contexts to be able to compare and contrast conclusions. Further, in a multiple case study, conclusions can be drawn from cross-case analysis and this can help increase generalizability (Voss et al., 2002).
In order to be able to identify and understand different types of dynamic capabilities, as well as underlying processes and factors that contribute to the development of these dynamic capabilities, people with different tasks, perspectives, and responsibilities will be interviewed.
The case analysis will follow the processes described by e.g., Eisenhardt (1989) and Miles and Huberman (1994). The analysis will include both a within-case analysis and cross-case analysis. The emerging patterns and results from the analysis are systematically compared with the conceptual framework in a highly iterative process as recommended by Eisenhardt (1989) in order to reach theory, which closely fits with the data.
Expected findings*The study will answer a number of detailed questions in order to accommodate to the purpose of the study. Examples of question can be seen below.
- How are grocery retailers sensing opportunities in the omni-channel environment?o What skills and processes are required in the organisation?
- How are grocery retailers seizing opportunities in the omni-channel environment?o How do grocery retailers make investment decisions related to omni-channel?o What types of warehouses/automation/IT are they investing in and why?o What capabilities are required to avoid bias toward existing solutions?o Who is taking omni-channel investment decisions in the organization and
why?o What skills and processes are required in the organisation?
- How are grocery retailers transforming and reconfiguring in the omni-channel environment?
o Who is responsible for executing the transformation decisions?o What skills and processes are required in the organisation?o Has the organisation structure changed, and if so how?o What capabilities are required for the implementation process of new, more
complex automation- and IT-systems?o What new competences and capabilities are required in OFC/DC to handle an
increased use of complex automation solutions?
Original/value*Grocery retail online is experiencing a rapid growth and retailers are investing heavily in new warehouses, automation, and IT. In recent years, research has investigated different aspects of grocery retailers transformation toward omni-channel (Colla and Lapoule, 2012; Hübner et al.,
372
4
2016; Wollenburg et al., 2018; Eriksson, 2019). However, there is a lack of research on how grocery retailers respond to the dynamic and changing environment and how they actuallytransform to omni-channel. This study provides value in that it aims to explore and understand different types of dynamic capabilities that successful omni-channel grocery retailers possess. Further, the study will explore underlying processes and factors in the external and internal environment that contribute to the development of these dynamic capabilities.
Practical implicationsGrocery retail online is growing rapidly. At the same time, grocery retailers are struggling with the transformation to omni-channel. Omni-channel grocery retail is a market characterised by rapid growth, changing customer expectations, and new technological development. Further, future competition and market development are difficult to anticipate. This study will provide insight on how successful omni-channel grocery retailers are transforming. Further, the results will give practitioners example of capabilities that are required in this new environment.
References*Beske, P., (2012)., “Dynamic capabilities and sustainable supply chain management”, International Journal of Physical Distribution & Logistics Management, Vol. 42, No. 44, pp. 372-387
Beske, P., Land, A., & Seuring, S., (2014), “Sustainable supply chain management practices and dynamic capabilities in the food industry: A critical analysis of the literature”,International journal of production economics, Vol. 152, pp. 131-143.
Colla, E., and Lapoule, P., (2012), “E-commerce: exploring critical success factors”, International Journal of Retail and Distribution Management, Vol. 40, No. 11, pp. 842-864
Defee, C. C., & Fugate, B. S., (2010), “Changing perspective of capabilities in the dynamic supply chain era”, The International Journal of Logistics Management.Eisenhardt, K. M. (1989), “Building theories from case study research”, Academy of management review, Vol. 14. No. 4, pp. 532
Eriksson, E., (2019), “An exploration of online fulfilment centres in omni-channel grocery retail”, Licentiate thesis, Faculty of Engineering, Lund University
Eriksson, E., Norrman, A., & Kembro, J. (2019), “Contextual adaptation of omni-channel grocery retailers’ online fulfilment centres”, International Journal of Retail & Distribution Management.Feiler, P., & Teece, D., (2014), “Case study, dynamic capabilities and upstream strategy: Supermajor EXP”, Energy Strategy Reviews, Vol. 3, pp. 14-20
Gruchmann, T., Seuring, S., & Petljak, K., (2019), “Assessing the role of dynamic capabilities in local food distribution: a theory-elaboration study”, Supply Chain Management: An International Journal.Hübner, A., Kuhn, H. and Wollenburg, J. (2016b), “Last mile fulfilment and distribution in omni-channel grocery retailing: a strategic planning framework”, International Journal of Retail and Distribution Management, Vol. 44 No. 3, pp. 228-247.
Kembro, J. H., Norrman, A., & Eriksson, E., (2018), “Adapting warehouse operations and design to omni-channel logistics”, International Journal of Physical Distribution & Logistics Management, Vol. 47, No. 4, pp. 348-411
Koch, H., (2010), “Developing dynamic capabilities in electronic marketplaces: A cross-case study”, The Journal of Strategic Information Systems, Vol. 19, No. 1, pp. 28-38.
373
4
2016; Wollenburg et al., 2018; Eriksson, 2019). However, there is a lack of research on how grocery retailers respond to the dynamic and changing environment and how they actuallytransform to omni-channel. This study provides value in that it aims to explore and understand different types of dynamic capabilities that successful omni-channel grocery retailers possess. Further, the study will explore underlying processes and factors in the external and internal environment that contribute to the development of these dynamic capabilities.
Practical implicationsGrocery retail online is growing rapidly. At the same time, grocery retailers are struggling with the transformation to omni-channel. Omni-channel grocery retail is a market characterised by rapid growth, changing customer expectations, and new technological development. Further, future competition and market development are difficult to anticipate. This study will provide insight on how successful omni-channel grocery retailers are transforming. Further, the results will give practitioners example of capabilities that are required in this new environment.
References*Beske, P., (2012)., “Dynamic capabilities and sustainable supply chain management”, International Journal of Physical Distribution & Logistics Management, Vol. 42, No. 44, pp. 372-387
Beske, P., Land, A., & Seuring, S., (2014), “Sustainable supply chain management practices and dynamic capabilities in the food industry: A critical analysis of the literature”,International journal of production economics, Vol. 152, pp. 131-143.
Colla, E., and Lapoule, P., (2012), “E-commerce: exploring critical success factors”, International Journal of Retail and Distribution Management, Vol. 40, No. 11, pp. 842-864
Defee, C. C., & Fugate, B. S., (2010), “Changing perspective of capabilities in the dynamic supply chain era”, The International Journal of Logistics Management.Eisenhardt, K. M. (1989), “Building theories from case study research”, Academy of management review, Vol. 14. No. 4, pp. 532
Eriksson, E., (2019), “An exploration of online fulfilment centres in omni-channel grocery retail”, Licentiate thesis, Faculty of Engineering, Lund University
Eriksson, E., Norrman, A., & Kembro, J. (2019), “Contextual adaptation of omni-channel grocery retailers’ online fulfilment centres”, International Journal of Retail & Distribution Management.Feiler, P., & Teece, D., (2014), “Case study, dynamic capabilities and upstream strategy: Supermajor EXP”, Energy Strategy Reviews, Vol. 3, pp. 14-20
Gruchmann, T., Seuring, S., & Petljak, K., (2019), “Assessing the role of dynamic capabilities in local food distribution: a theory-elaboration study”, Supply Chain Management: An International Journal.Hübner, A., Kuhn, H. and Wollenburg, J. (2016b), “Last mile fulfilment and distribution in omni-channel grocery retailing: a strategic planning framework”, International Journal of Retail and Distribution Management, Vol. 44 No. 3, pp. 228-247.
Kembro, J. H., Norrman, A., & Eriksson, E., (2018), “Adapting warehouse operations and design to omni-channel logistics”, International Journal of Physical Distribution & Logistics Management, Vol. 47, No. 4, pp. 348-411
Koch, H., (2010), “Developing dynamic capabilities in electronic marketplaces: A cross-case study”, The Journal of Strategic Information Systems, Vol. 19, No. 1, pp. 28-38.
5
Melacini, M., Perotti, S., Rasini, M., & Tappia, E., (2018), “E-fulfilment and distribution in omni-channel retailing: a systematic literature review”, International Journal of Physical Distribution & Logistics Management.Miles, M.B., and Huberman, A.M., (1994), Qualitative Data Analysis, 2nd Edition, Sage Publications
Shuen, A., Feiler, P. F., & Teece, D. J., (2014), “Dynamic capabilities in the upstream oil and gas sector: Managing next generation competition”, Energy Strategy Reviews, Vol. 3, pp. 5-13
Song, S., Shi, X., & Song, G., (2019), “Supply chain integration in omni-channel retailing: a human resource management perspective”, International Journal of Physical Distribution & Logistics Management.Song, G., & Song, S. (2020), “Fostering supply chain integration in omni-channel retailing through human resource factors: empirical study in China’s market”, International Journal of Logistics Research and Applications, pp. 1-22.
Tatham, P., Wu, Y., Kovács, G., & Butcher, T., (2017), “Supply chain management skills tosense and seize opportunities”, The International Journal of Logistics Management, Vol. 28, No. 2, pp. 266-289
Teece, D. J., Pisano, G., & Shuen, A., (1997), “Dynamic capabilities and strategic management”, Strategic management journal, Vol. 18, No. 7, pp. 509-533.
Teece, D. J., (2007), “Explicating dynamic capabilities: the nature and microfoundations of (sustainable) enterprise performance”, Strategic management journal, Vol. 28, No. 13, pp.1319-1350.
Teece, D. J. (2018), “Business models and dynamic capabilities”, Long Range Planning, Vol. 51, No. 1, pp. 40-49.
Voss, C., Tsikriktsis, N. and Frohlich, M., (2002), “Case research in operations management”, International Journal of Operations & Production Management, Vol. 22, No. 2, pp. 195-219.
Wollenburg, J., Hübner, A., Kuhn, H., & Trautrims, A. (2018), “From bricks-and-mortar to bricks-and-clicks: Logistics networks in omni-channel grocery retailing”, International Journal of Physical Distribution & Logistics Management, Vol. 48, No. 4, pp. 415-438.
Yin, R. K., (2009), Case study research Fourth edition ed. s.l.:Sage Public
Keywords*Omni-channel, Grocery retail, Logistics network, OFC, Automation, Dynamic capabilities, Warehouse, Transformation, DC

375
“ASSESSING THE AUTHENTICITY OF ONLINE-ONLY BRANDS”
Giovanni Pino. University of Chieti-Pescara (Italy) Kokho Jason Sit. University of Portsmouth (UK)Marco Pichierri. University of Salento (Italy)
The continuous growth of electronic commerce has fostered and sustained the rise of online-only brands (OOBs), namely those brands that are available only via the Internet. Consumers often purchase OOBs with little or no product-interaction opportunitie.
376
“ASSESSING THE AUTHENTICITY OF ONLINE-ONLY BRANDS”
The continuous growth of electronic commerce has fostered and sustained the rise of online-only brands (OOBs), namely those brands that are available only via the Internet. Consumers often purchase OOBs with little or no product-interaction opportunitie.
“BEYOND TRADITIONAL MOTIVATION: PREDICTING THE WEARABLE FITNESS TECHNOLOGY ADOPTION BY USING ORGANISMIC INTEGRATION THEORY”
Syed Waqar Haider (School of Management Xi'an Jiaotong University, China)
In the prior literature, the motivation to adopt wearable fitness technology (WFT) has been linked with either intrinsic or extrinsic. However, how the subcategories of extrinsic motivations (identified, introjected, and external) affect the consumers’ WFT adoption decision remains sparse. Furthermore, do regulatory focus (prevention vs. promotion), and gender differentiate the effects of different motivations on WFT adoption is almost unknown in the healthcare marketing literature. To fill this gap, the present study aims to deepen the understanding of WFT adoption by using Organismic Integration Theory (part of self-determined need theory SDT) and regulatory focus theory. The results show that intrinsic, identified, and external motivations have the greatest impact on consumers’ decision while introjected motivation was not significant directly. The moderation effects of regulatory focus are significant in such a way that prevention focus influence the introjected motivation and promotion focus affect the external motivation and WFT adoption decision. Furthermore, the findings on gender moderation show that female are more intrinsically motivated, and male are more externally motivated for WFT adoption. Finally, the implications and future research direction have been discussed.
377
“CONSUMER RISK PERCEPTIONS TOWARD INTERACTIVE SERVICES”
Chieko Minami (Kobe University) Liu Boyi (Kobe University) Kenichi Nishioka (Kansai University)
Smart services are considered highly technology-based, and this research aims to examine consumers’ responses to them, in terms of risk perception and intention to use to understand better how to introduce theses services in retailing. We developed the conceptual model which consists of five characteristics of smartness, four kinds of risks, consumer’s attitude and intention to use smart services. Online survey was conducted on the Prolific platform and 530 respondents were asked to respond the questionnaire about the smart services provided through smartwatch. PLS-based structural equation modelling was used to examine the proposed model. The research revealed as follows: 1. The most influential factors on consumers’ attitudes toward smart services are privacy risk and time risk. 2. The more intelligent the smart service, the more distinct its characteristics will be. Moreover, different characteristics bring different kinds of perceived risks and have different influences on them.This research contributes to the field of study by testing empirically the effects of characteristics of smart services on consumers’ intention to use. Retailers can avoid consumers’ negative attitudes through the following two ways: characteristics that will not affect risks can be upgraded, such as enhancing automation of smart services and increasing multi-functionality. They can also directly reduce various risks by increasing the ability to cooperate in smart services.
378
“CONSUMER RISK PERCEPTIONS TOWARD INTERACTIVE SERVICES”
Smart services are considered highly technology-based, and this research aims to examine consumers’ responses to them, in terms of risk perception and intention to use to understand better how to introduce theses services in retailing. We developed the conceptual model which consists of five characteristics of smartness, four kinds of risks, consumer’s attitude and intention to use smart services. Online survey was conducted on the Prolific platform and 530 respondents were asked to respond the questionnaire about the smart services provided through smartwatch. PLS-based structural equation modelling was used to examine the proposed model. The research revealed as follows: 1. The most influential factors on consumers’ attitudes toward smart services are privacy risk and time risk. 2. The more intelligent the smart service, the more distinct its characteristics will be. Moreover, different characteristics bring different kinds of perceived risks and have different influences on them.This research contributes to the field of study by testing empirically the effects of characteristics of smart services on consumers’ intention to use. Retailers can avoid consumers’ negative attitudes through the following two ways: characteristics that will not affect risks can be upgraded, such as enhancing automation of smart services and increasing multi-functionality. They can also directly reduce various risks by increasing the ability to cooperate in smart services.
“EXPLORING EARLY ADOPTER EXPECTATIONS IN UNATTENDED GROCERY DELIVERY”
John Olsson, Mary Catherine Osman ,Daniel Hellström, Yulia Vakulenko(Lund University, Department of Design Sciences)
PurposeThe purpose of this study is to empirically identify and understand the types and forms of customer expectations in unattended grocery delivery services in omni-channel retail, and suggest propositions for further research and development of the research area, providing practitioners with a better basis for managing such services. Design/methodology/approachThis study explores a novel phenomenon, as unattended delivery of groceries is an emerging practice that lacks examination from the consumers’ perspective. A multiple case study of early adopters was conducted to explore consumer expectations in unattended grocery delivery. Semi-structured interviews with 10 Swedish households were conducted and coded using open coding inspired by grounded theory. In addition, direct observations were made to capture the context of the individual households.
FindingsThe empirical evidence from the case studies suggests that consumers have three types of expectations: expected standard service, desired service and predicted service. The analysis further indicates that these expectations are formed by three determinants, personal needs, technology literacy, and situational factors in unattended grocery delivery. Based on the empirical findings we formulate a set of six propositions for further research. Research limitations/implications This case study focuses on one particular solution for unattended grocery delivery. Although the expectations in other unattended delivery solutions may be different, this study provides detailed explanations relevant to similar solutions contributing to the growing body of literature on last mile delivery.
Practical implications The findings provide managers with an understanding of the level of service consumers expect in unattended grocery delivery, building a better basis for managing such delivery services.
Original/valueThis study provides the first in-depth analysis of consumer expectations in unattended delivery in the context of omni-channel grocery retail, a novel yet emerging service for last mile delivery.
379
“FAST-FASHION RETAILERS’ DISTRIBUTION MANAGEMENT IN EMERGING COUNTRIES”
Asmaa Sabiri (Mechanical Engineering Research Laboratory)Hassan First (University, Morocco)Fouad Riane (Laboratoire de Génie Industriel, Centrale Supéléc Ecole Centrale Casablanca, Morocco)
The fast-fashion industry has grown to be an important pillar of the Moroccan economy. Investments had grown as fast as the potential unravels, but they will need to be backed by serious optimization tools to meet their end. In this paper, we address a distribution problem for supplying store with fashion items. We present a real-life case study where a company tries to build an effective strategy to cover its network. Two problems of concern are addressed, relating to products’ assignment to stores and to re-building assortments through inter-stores transfers. To tackle these problems, we used clustering and decision trees among others. The results are promising regarding the process, and help build a solid support for a foreseen forecasting system..
380
“FAST-FASHION RETAILERS’ DISTRIBUTION MANAGEMENT IN EMERGING COUNTRIES”
The fast-fashion industry has grown to be an important pillar of the Moroccan economy. Investments had grown as fast as the potential unravels, but they will need to be backed by serious optimization tools to meet their end. In this paper, we address a distribution problem for supplying store with fashion items. We present a real-life case study where a company tries to build an effective strategy to cover its network. Two problems of concern are addressed, relating to products’ assignment to stores and to re-building assortments through inter-stores transfers. To tackle these problems, we used clustering and decision trees among others. The results are promising regarding the process, and help build a solid support for a foreseen forecasting system..
“INTERPRETING SHOPLIFTING BEHAVIOR IN INDIAN CONTEXT: AN EXPERIMENTAL APPROACH”
Narasimhan Rajkumar, Sanjeev Varshney, Sourabh Arora (XLRI School of Management and Human Resources)
Despite the fact that spirituality has long been realised as a unique context of Indian culture (Lamont and Bates, 2007) and it has been found to negatively impact the consumer's attitude towards unethical behaviour (Vitell et al., 2018), its impact on shoplifting remains under-examined. It is argued that consumers high on spirituality are less likely to shoplift because of the high orientation of such consumers towards doing good (Vitell et al., 2018) which might impede them from adopting harmful behaviours like shoplifting. The study additionally examines the role of conspicuous consumption/materialism on shoplifting behaviour. Materialism, which essentially establishes the belief that possessions are a key to happiness (Richins, 1994), has been found to positively impact shoplifting behaviour (Bai et al., 2019). Past researchers have endorsed the view that highly materialistic consumers do not shy away from compromising on ethical rules (Ferrell and Gresham, 1985; Richins and Dawson, 1992) and due to the lack of sense of community (Belk, 1988) indulge in shoplifting. The study aims at verifying the same findings for Indian shoppers. The study also tries towards examining the role of levity/or humour as regards consumers shoplifting behaviour. As far as the knowledge of authors is concerned, humour has not been related to unethical consumer behaviour yet. However, past researchers have asserted that individuals often use humour as an excuse to pass off unsocial and criminal behaviour (Thomae and Pina, 2015; Yoon, 2016; Steer et al., 2017; Rawlings, 2018). Utilizing the work of Kraut (1976) and the extraversion principle of Egan and Taylor (2010), the study aims at exploring if shoplifting as a crime is being committed as a ‘dare’ since consequences are not perceived to be serious. We contend that a person high on levity will engage in more unethical behaviour like shoplifting since the action is more of a ‘dare’ for him/or her rather than a serious activity. The study further contributes by examining the impact of meaning in life on shoplifting which has been described as the strength, intensity and activity of people’s desire to establish their understanding of the meaning, significance and purpose of their lives in general (Steger et al., 2008). As per one of the studies by Steger et al. (2006), the presence of MIL correlated -.48 with depression implying that the presence of MIL leads to greater positive feelings about life in general. No study so far has looked at the relationship between MIL and unethical consumer behaviour like shoplifting.
381
“INVESTIGATING THE HEALTHINESS OF FOOD PRODUCTS ON PROMOTION: MARKET BRANDS AND OWN BRANDS”
Dr Emma Beacom (University College Cork, Ireland)Dr Lynsey Hollywood (Ulster University, Northern Ireland)Dr Christopher McLaughin (Institute of Technology Sligo, Ireland)
Supermarket own brand (OB) products are gaining prominence in retail markets due in part to consumer concerns about food affordability, increased investment in private label product development, and the rising popularity of discounters. This study analyses an existing audit tool containing nutritional information about a variety of foods on promotion (n=6776) from eight retail stores in Northern Ireland (NI) in order to investigate the proportionality of market brands (MB’s) versus OB’s on promotion, and to compare the healthiness of MB foods versus supermarket OB foods on promotion. Product healthiness was measured using a score aligned to the Food Standards Agency’s Front of Pack nutrient labelling methodology. The data set was analysed to examine differences between international/national and regional MB’s, and premium, mid-market and value tiered OB’s. Results found a balance in favour of health (52.4% amber/green versus 47.6% red) across retailer’s promotions in NI. Further, OB products were often found to be superior to MB’s with regards to nutrient status, and international/national brands were found to be healthier than regional brands. These results provide evidence that consumers with less disposable income to spend on food can achieve a nutritionally adequate diet using OB rather than MB foods. Retailers primarily market their OB products as preferential to MB’s because of their price, this study’s findings however indicate that promoting product characteristics (nutritional profile) could also create competitive advantage. Regarding MB’s, regional MB’s in particular should consider the nutritional profile of their products in line with the increasing consumer trend for health.
382
“INVESTIGATING THE HEALTHINESS OF FOOD PRODUCTS ON PROMOTION: MARKET BRANDS AND OWN BRANDS”
Supermarket own brand (OB) products are gaining prominence in retail markets due in part to consumer concerns about food affordability, increased investment in private label product development, and the rising popularity of discounters. This study analyses an existing audit tool containing nutritional information about a variety of foods on promotion (n=6776) from eight retail stores in Northern Ireland (NI) in order to investigate the proportionality of market brands (MB’s) versus OB’s on promotion, and to compare the healthiness of MB foods versus supermarket OB foods on promotion. Product healthiness was measured using a score aligned to the Food Standards Agency’s Front of Pack nutrient labelling methodology. The data set was analysed to examine differences between international/national and regional MB’s, and premium, mid-market and value tiered OB’s. Results found a balance in favour of health (52.4% amber/green versus 47.6% red) across retailer’s promotions in NI. Further, OB products were often found to be superior to MB’s with regards to nutrient status, and international/national brands were found to be healthier than regional brands. These results provide evidence that consumers with less disposable income to spend on food can achieve a nutritionally adequate diet using OB rather than MB foods. Retailers primarily market their OB products as preferential to MB’s because of their price, this study’s findings however indicate that promoting product characteristics (nutritional profile) could also create competitive advantage. Regarding MB’s, regional MB’s in particular should consider the nutritional profile of their products in line with the increasing consumer trend for health.
“WHAT DRIVES CONSUMERS’ TO COLLECT INFORMATION ONLINE BEFORE PURCHASING OFFLINE? INSIGHTS FROM WEBROOMING NARRATIVES"
SOURABH ARORA (XLRI Jamshedpur)Dr. Sangeeta Sahney (IIT Kharagpur)
Webrooming has emerged as one of the crucial issues in the contemporary multi-channel retailing dynamics. It denotes the purchase behaviour of those shoppers who intentionally visit an online store for collecting information but later purchase offline. The objective of the proposed research is to understand the consumers’ rationale behind deliberately adopting online search-offline purchase sequence by executing the narrative-based examination. A total of 21 webrooming-narratives were employed, and inductive thematic analysis was executed to identify key themes. Results of the study revealed that shoppers mainly webroomed to; maximize their shopping utility by combining benefits of both online and offline channels, form consideration sets, avoid the regret of making sub-optimal choices, gaining choice-confidence, avoiding online-risks, and because of the distrust towards online stores. Impact of product type and categories is also foreseen, along with the noteworthy impact of consumer-skills. Findings of the study can be utilized by online retailers for countering webroomers.
383
“WHO WILL INNOVATE NEXT? A COMPARISON BETWEEN LUXURY AND FAST FASHION RETAILERS”
Virginia Vannucci (University of Florence, Italy)Eleonora Pantano (University of Bristol, Bristol, UK)Milena Viassone (University of Turin, Italy)
Both luxury and fast fashion retailers are introducing innovative technologies to enhance consumers shopping experience and gain competitive advantage. However, the huge availability of innovations and the involved risks make the decision to innovate a complex task. For this reason, retailers are adopting different innovation and technology management strategies. The aim of this research is to compare and contrast fast fashion and luxury retailers willingness to innovate, in order to understand how innovation and technology management result into benefits for retail management. It further provides suggestions to improve the innovation management process, from a both theoretical and practical point of view.
384
“WHO WILL INNOVATE NEXT? A COMPARISON BETWEEN LUXURY AND FAST FASHION RETAILERS”
Both luxury and fast fashion retailers are introducing innovative technologies to enhance consumers shopping experience and gain competitive advantage. However, the huge availability of innovations and the involved risks make the decision to innovate a complex task. For this reason, retailers are adopting different innovation and technology management strategies. The aim of this research is to compare and contrast fast fashion and luxury retailers willingness to innovate, in order to understand how innovation and technology management result into benefits for retail management. It further provides suggestions to improve the innovation management process, from a both theoretical and practical point of view.
MAXIMIZING CUSTOMER LIFETIME VALUE THROUGH STRATEGIC CHANNEL MANAGEMENT: MOBILE APP VERSUS WEBSITE
Gokhan Gecer
Area of Marketing and Sales
University of Mannheim, Mannheim, Germany
Florian Kraus
Area of Marketing and Sales
University of Mannheim, Mannheim, Germany
385
1
The Suggestions of the Reviewers
- Reviewers´ 1 ratings and suggestions:
1. The overall contribution of the paper to retail research. 5
2. The readability of the manuscript. 6
3. The review of the existing literature. 6
4. The research method and discussion of results. 5
5. The managerial/social implications.4
6. Decision: Accepted
7. Suggestions: Very up-to date topic! Some minor suggestions, please:
- Can you elaborate more on customer groups? (there are segmentations in literature , e.g., loyal,frequent, occasional users)
- How do you define discount? (price reductions,% saving, .. how does this fit the overall pricingstrategy of the retailer?)
- What are the managerial implications per group? Could the loyal consumers get a different typeof reward to prevent discrimination? => watchout: If you only trade up occasional users and loseloyals, the overall profit effect might be negative!
386
1
The Suggestions of the Reviewers
- Reviewers´ 1 ratings and suggestions:
1. The overall contribution of the paper to retail research. 5
2. The readability of the manuscript. 6
3. The review of the existing literature. 6
4. The research method and discussion of results. 5
5. The managerial/social implications.4
6. Decision: Accepted
7. Suggestions: Very up-to date topic! Some minor suggestions, please:
- Can you elaborate more on customer groups? (there are segmentations in literature , e.g., loyal, frequent, occasional users)
- How do you define discount? (price reductions,% saving, .. how does this fit the overall pricingstrategy of the retailer?)
- What are the managerial implications per group? Could the loyal consumers get a different typeof reward to prevent discrimination? => watchout: If you only trade up occasional users and loseloyals, the overall profit effect might be negative!
2
- Reviewers’ 2 ratings and suggestions:
1. The overall contribution of the paper to retail research. 4
2. The readability of the manuscript. 5
3. The review of the existing literature. 3
4. The research method and discussion of results. 4
5. The managerial/social implications. 5
6. Decision:Accepted
7. Suggestions:
Introduction
- The authors conclude from a single use of M-Commerce to a permanent use. This abstractsfrom many important factors that have an influence in this regard (e.g. satisfaction with thischannel, technically problem-free, ...)
Methodology
- Sometimes there are (too) strong redundancies between introduction and methodology
- Why should purchases made via the website and the app be mutually exclusive? It is veryconceivable that customers use both channels (e.g. alternately).
- It would definitely be worthwhile and more realistic to consider cases in which there arechanges between the app and the website.
Findings
- Unfortunately, no empirical evidence seems to exist. This would be very useful for aninvestigation of this kind.
- The results seem to me to be quite general. I cannot see a critical reflection. This may be due tothe scope of the abstract.
I think this abstract can contribute to conference. The comments and questions I raised should be suitable for leading the discussion if they are not already answered in the oral presentation.
387
3
Introduction
Mobile devices have a customer engagement and adoption advantage over fixed devices. They are irreplaceable parts of today's life. Mobile apps are a central aspect of this trend. Hence, there is an indication that mobile channels might be more effective in terms of triggering purchasing than other sales channels, including websites (Dinner et al., 2015). Thus, mobile devices play a unique role by offering convenience to customers during the pre-purchase, purchase, and post-purchase phases for the customer decision process (Shankar and Balasubramanian, 2009). This unique nature gives customers the impression of a close relationship with the retailer and therefore leads them to develop habitual interactions with the firm (Wang et al., 2015). Moreover, perceived emotional values lead the users to adopt mobile devices for purchases (Nysveen et al., 2005; Strom et al., 2014).
We theorize that when the customers adopt mobile devices for their purchases, they start using these devices regularly and turn this into a habit. We assume that the customer lifetime value (CLV) of those mobile channel users tends to be larger than the CLV of website users. One ofthe main reasons behind this assumption is that users' order rates increase when they adoptmobile apps, resulting in a higher net monetary value in total spending (Narang and Shankar,2016; Wang et al., 2015). Moreover, smartphone and tablet users have a higher basket-to-conversion rate compared to fixed device customers purchasing over websites (de Haan et al.,2015). Consequently, online retailers should encourage their customers to switch to using mobiledevices. In practice, some firms already offer coupons, games, or loyalty points for this purpose.Naturally, another powerful option to incentivize the use of mobile devices could be offering adiscount for purchases made through m-commerce. Focusing on this option, the purpose of thisarticle is to develop a modeling approach to answer the following research questions:
1. To what type of customers should a discount be offered when purchases are conductedover mobile apps?
2. What is the optimal discount rate that should be offered?
Our approach is based on the idea that customers who start using a mobile device to purchase products online also start using the mobile channel on a regular basis and turn this behavior into a habit. Therefore, those mobile app users, who have a higher net monetary value in total spending, may become more valuable customers for companies. Thus, firms could choose to offer a discount to their customers to steer them to the mobile channel. In our analysis, we show to which customers the firm should offer a discount via the mobile app. The firm makes its decision based on how a discount rate changes the customer's purchasing probability, how well the customer adopts the mobile channel, what the current purchasing probability of the customer is, and how active the customer is.
388
3
Introduction
Mobile devices have a customer engagement and adoption advantage over fixed devices. Theyare irreplaceable parts of today's life. Mobile apps are a central aspect of this trend. Hence, there is an indication that mobile channels might be more effective in terms of triggering purchasingthan other sales channels, including websites (Dinner et al., 2015). Thus, mobile devices play aunique role by offering convenience to customers during the pre-purchase, purchase, and post-purchase phases for the customer decision process (Shankar and Balasubramanian, 2009). Thisunique nature gives customers the impression of a close relationship with the retailer andtherefore leads them to develop habitual interactions with the firm (Wang et al., 2015). Moreover, perceived emotional values lead the users to adopt mobile devices for purchases(Nysveen et al., 2005; Strom et al., 2014).
We theorize that when the customers adopt mobile devices for their purchases, they start usingthese devices regularly and turn this into a habit. We assume that the customer lifetime value(CLV) of those mobile channel users tends to be larger than the CLV of website users. One ofthe main reasons behind this assumption is that users' order rates increase when they adoptmobile apps, resulting in a higher net monetary value in total spending (Narang and Shankar, 2016; Wang et al., 2015). Moreover, smartphone and tablet users have a higher basket-to-conversion rate compared to fixed device customers purchasing over websites (de Haan et al., 2015). Consequently, online retailers should encourage their customers to switch to using mobile devices. In practice, some firms already offer coupons, games, or loyalty points for this purpose. Naturally, another powerful option to incentivize the use of mobile devices could be offering adiscount for purchases made through m-commerce. Focusing on this option, the purpose of thisarticle is to develop a modeling approach to answer the following research questions:
1. To what type of customers should a discount be offered when purchases are conducted over mobile apps?
2. What is the optimal discount rate that should be offered?
Our approach is based on the idea that customers who start using a mobile device to purchaseproducts online also start using the mobile channel on a regular basis and turn this behavior into a habit. Therefore, those mobile app users, who have a higher net monetary value in totalspending, may become more valuable customers for companies. Thus, firms could choose to offer a discount to their customers to steer them to the mobile channel. In our analysis, we showto which customers the firm should offer a discount via the mobile app. The firm makes itsdecision based on how a discount rate changes the customer's purchasing probability, how wellthe customer adopts the mobile channel, what the current purchasing probability of the customeris, and how active the customer is.
4
Methodology
We base our model on the assumption that once a customer adopts the mobile channel, she increases her purchasing frequency. Wang et al. (2015) show that mobile app users have a higher average order rate than non-users. We designed an analytical model based on this assumption. In the analysis of this model, we calculate the CLV of a customer based on her discounted expected transactions (DET) and show how offering a discount over the mobile app increases or does not increase the CLV.
Our modeling approach focuses on 1) how to calculate the CLV of a customer, 2) the idea of offering a discount to those who purchase over the mobile app, 3) which customers to target with a discount offer over the mobile app, 4) the optimal value of the discount rate, and 5) which strategy the firm should follow. Offering a discount to mobile app users may decrease the short-term profit. However, marketing managers should not only focus on the short-term profit but rather pay more attention to customer satisfaction on a long-term basis (Zhang et al., 2015). Among other strategies, offering a discount to customers is a way to strengthen the relationship between the firm and its customers.
Wang et al. (2015) show that the average order rate of mobile app users is higher than non-users. Users also tend to keep using the mobile app once they adopt it because of higher user engagement. Our objective is to increase the CLV of the customers by increasing their purchase rates (frequency) through mobile sales channel adoption. We propose the idea of offering a discount to mobile app purchasers to steer them to these sales.
In the model, we apply discrete time transactions to reach the discounted expected transactions (Fader et al., 2004). We calculate the CLV of a customer by multiplying the cash flow and DET.Our model follows with the calculation of the DET in two cases: (1) when a discount “e” over the mobile app is offered and (2) the discount is not offered. Then, we compare these transactions to find out in which cases it is more profitable for the firm to offer the discount. Lastly, we will show how to calculate the optimal discount level when it is optimal to offer it.
In the model, there are two sides: the firm and the customer. The firm is a profit maximizer. It sells its products over two sales channels: the website and the mobile app. It chooses between the strategies of offering or not offering a discount over the mobile app. The customer simply purchases on the firm's sales channels. She has a utility from purchasing products. Hence, we assume that she may purchase on a regular basis. Her DET is equal to the summation of all her transactions. When the firm offers a discount over the mobile app, she chooses between adopting the mobile app or not. In the beginning, we assume that the customer is active and purchases over the website and/or mobile app. Then, the firm decides on its strategy as well as the discount rate if it decides on offering it.
Transactions when a discount ”e” is not offered
In the first part of the model, the firm has two sales channels (the website and the mobile app) where the pricing is the same across both channels. The firm sells the products for the same prices over both of the channels. Assuming that the customer is active at the beginning of the first period, her possible purchases follow the basic structure in Table 1.
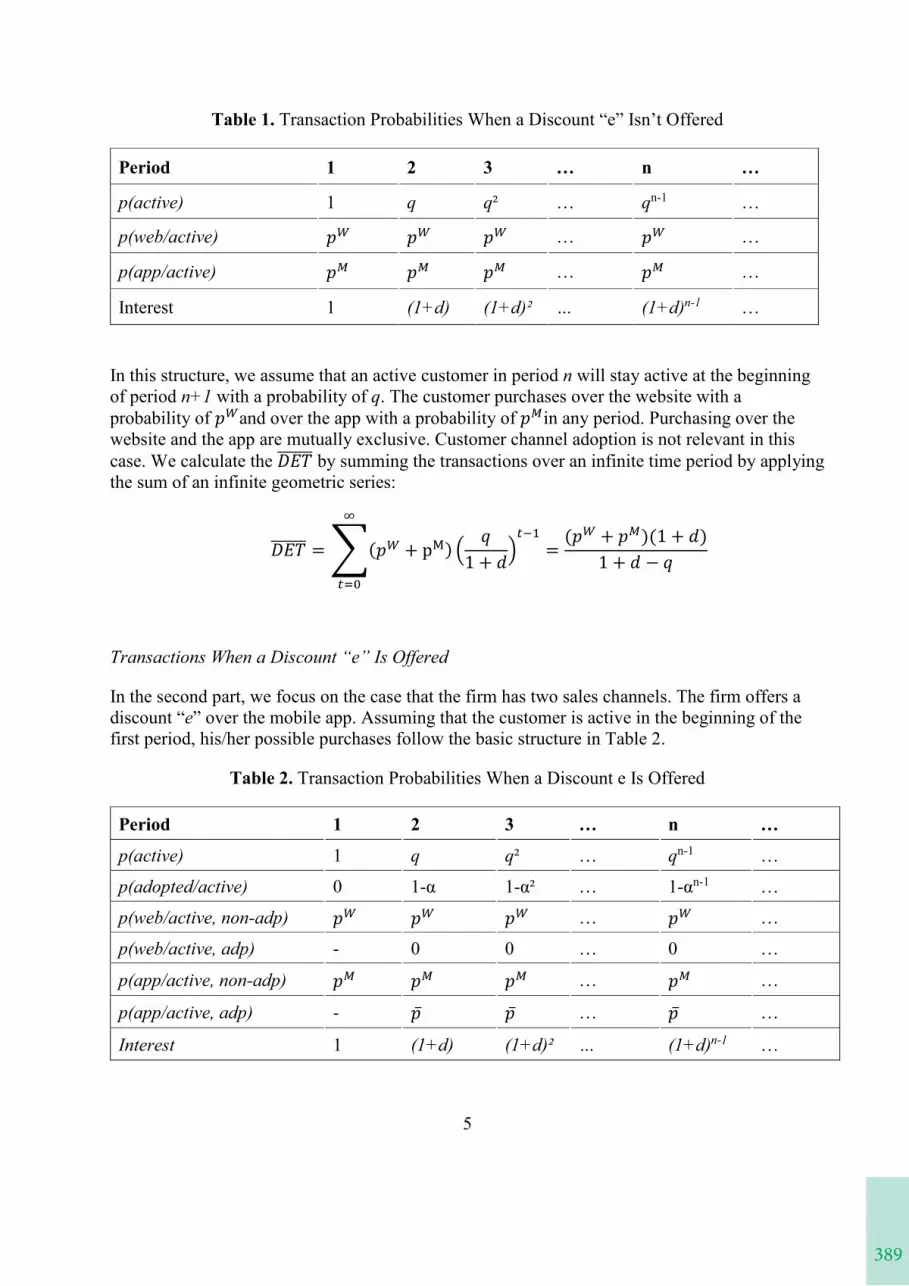
389
5
Table 1. Transaction Probabilities When a Discount “e” Isn’t Offered
Period 1 2 3 … n …
p(active) 1 q q² … qn-1 …
p(web/active) 𝑝𝑝𝑝𝑝𝑊𝑊𝑊𝑊 𝑝𝑝𝑝𝑝𝑊𝑊𝑊𝑊 𝑝𝑝𝑝𝑝𝑊𝑊𝑊𝑊 … 𝑝𝑝𝑝𝑝𝑊𝑊𝑊𝑊 …
p(app/active) 𝑝𝑝𝑝𝑝𝑀𝑀𝑀𝑀 𝑝𝑝𝑝𝑝𝑀𝑀𝑀𝑀 𝑝𝑝𝑝𝑝𝑀𝑀𝑀𝑀 … 𝑝𝑝𝑝𝑝𝑀𝑀𝑀𝑀 …
Interest 1 (1+d) (1+d)² … (1+d)n-1 …
In this structure, we assume that an active customer in period n will stay active at the beginning of period n+1 with a probability of q. The customer purchases over the website with a probability of 𝑝𝑝𝑝𝑝𝑊𝑊𝑊𝑊and over the app with a probability of 𝑝𝑝𝑝𝑝𝑀𝑀𝑀𝑀in any period. Purchasing over the website and the app are mutually exclusive. Customer channel adoption is not relevant in this case. We calculate the 𝐷𝐷𝐷𝐷𝐷𝐷𝐷𝐷𝐷𝐷𝐷𝐷������ by summing the transactions over an infinite time period by applying the sum of an infinite geometric series:
𝐷𝐷𝐷𝐷𝐷𝐷𝐷𝐷𝐷𝐷𝐷𝐷������ = �(𝑝𝑝𝑝𝑝𝑊𝑊𝑊𝑊 + pM) �𝑞𝑞𝑞𝑞
1 + 𝑑𝑑𝑑𝑑�𝑡𝑡𝑡𝑡−1
∞
𝑡𝑡𝑡𝑡=0
=(𝑝𝑝𝑝𝑝𝑊𝑊𝑊𝑊 + 𝑝𝑝𝑝𝑝𝑀𝑀𝑀𝑀)(1 + 𝑑𝑑𝑑𝑑)
1 + 𝑑𝑑𝑑𝑑 − 𝑞𝑞𝑞𝑞
Transactions When a Discount “e” Is Offered
In the second part, we focus on the case that the firm has two sales channels. The firm offers a discount “e” over the mobile app. Assuming that the customer is active in the beginning of the first period, his/her possible purchases follow the basic structure in Table 2.
Table 2. Transaction Probabilities When a Discount e Is Offered
Period 1 2 3 … n …
p(active) 1 q q² … qn-1 …
p(adopted/active) 0 1-α 1-α² … 1-αn-1 …
p(web/active, non-adp) 𝑝𝑝𝑝𝑝𝑊𝑊𝑊𝑊 𝑝𝑝𝑝𝑝𝑊𝑊𝑊𝑊 𝑝𝑝𝑝𝑝𝑊𝑊𝑊𝑊 … 𝑝𝑝𝑝𝑝𝑊𝑊𝑊𝑊 …
p(web/active, adp) - 0 0 … 0 …
p(app/active, non-adp) 𝑝𝑝𝑝𝑝𝑀𝑀𝑀𝑀 𝑝𝑝𝑝𝑝𝑀𝑀𝑀𝑀 𝑝𝑝𝑝𝑝𝑀𝑀𝑀𝑀 … 𝑝𝑝𝑝𝑝𝑀𝑀𝑀𝑀 …
p(app/active, adp) - �̅�𝑝𝑝𝑝 �̅�𝑝𝑝𝑝 … �̅�𝑝𝑝𝑝 …
Interest 1 (1+d) (1+d)² … (1+d)n-1 …
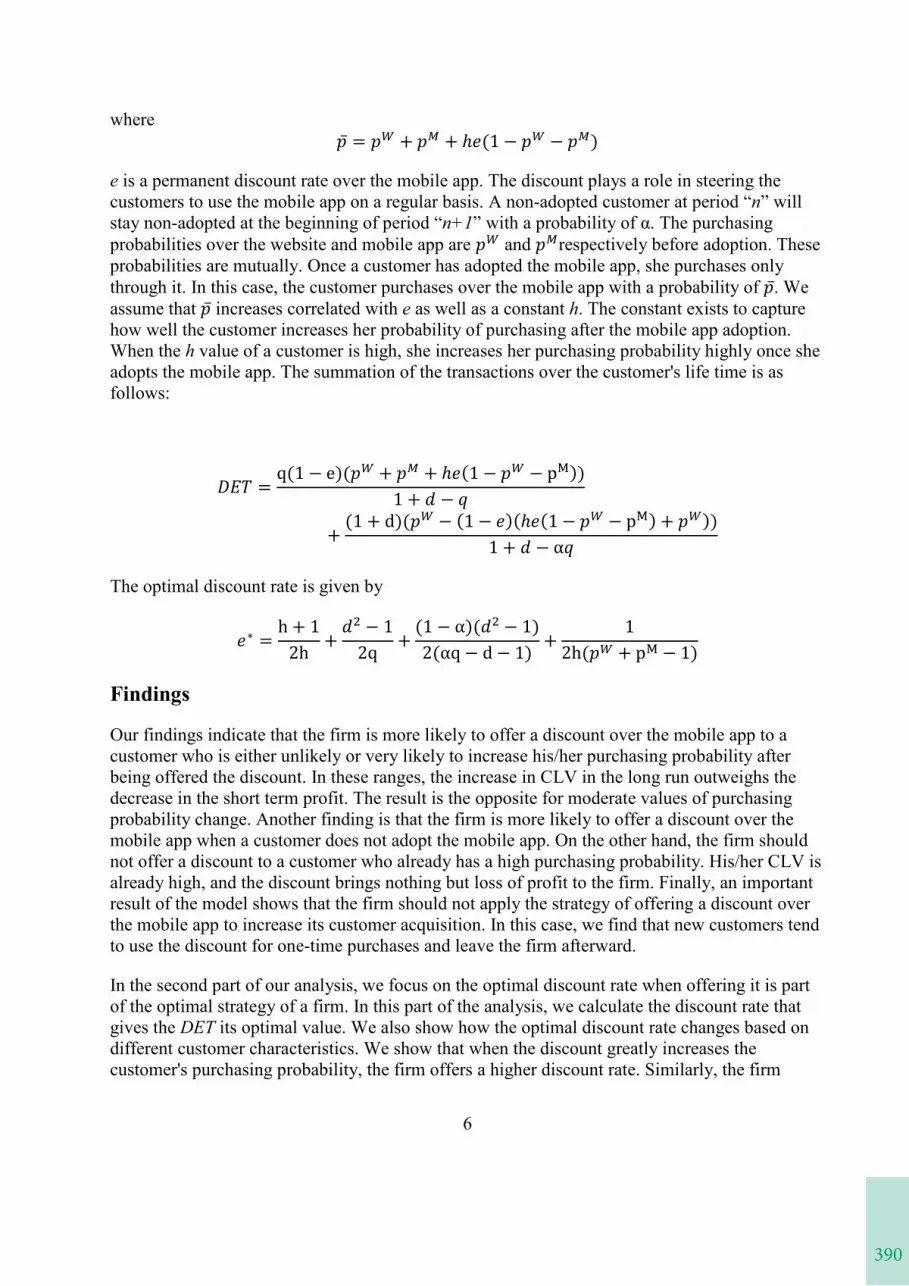
390
5
Table 1. Transaction Probabilities When a Discount “e” Isn’t Offered
Period 1 2 3 … n …
p(active) 1 q q² … qn-1 …
p(web/active) 𝑝𝑝𝑝𝑝𝑊𝑊𝑊𝑊 𝑝𝑝𝑝𝑝𝑊𝑊𝑊𝑊 𝑝𝑝𝑝𝑝𝑊𝑊𝑊𝑊 … 𝑝𝑝𝑝𝑝𝑊𝑊𝑊𝑊 …
p(app/active) 𝑝𝑝𝑝𝑝𝑀𝑀𝑀𝑀 𝑝𝑝𝑝𝑝𝑀𝑀𝑀𝑀 𝑝𝑝𝑝𝑝𝑀𝑀𝑀𝑀 … 𝑝𝑝𝑝𝑝𝑀𝑀𝑀𝑀 …
Interest 1 (1+d) (1+d)² … (1+d)n-1 …
In this structure, we assume that an active customer in period n will stay active at the beginningof period n+1 with a probability of q. The customer purchases over the website with aprobability of 𝑝𝑝𝑝𝑝𝑊𝑊𝑊𝑊and over the app with a probability of 𝑝𝑝𝑝𝑝𝑀𝑀𝑀𝑀in any period. Purchasing over thewebsite and the app are mutually exclusive. Customer channel adoption is not relevant in thiscase. We calculate the 𝐷𝐷𝐷𝐷𝐷𝐷𝐷𝐷𝐷𝐷𝐷𝐷������ by summing the transactions over an infinite time period by applyingthe sum of an infinite geometric series:
𝐷𝐷𝐷𝐷𝐷𝐷𝐷𝐷𝐷𝐷𝐷𝐷������ = �(𝑝𝑝𝑝𝑝𝑊𝑊𝑊𝑊 + pM) �𝑞𝑞𝑞𝑞
1 + 𝑑𝑑𝑑𝑑�𝑡𝑡𝑡𝑡−1
∞
𝑡𝑡𝑡𝑡=0
=(𝑝𝑝𝑝𝑝𝑊𝑊𝑊𝑊 + 𝑝𝑝𝑝𝑝𝑀𝑀𝑀𝑀)(1 + 𝑑𝑑𝑑𝑑)
1 + 𝑑𝑑𝑑𝑑 − 𝑞𝑞𝑞𝑞
Transactions When a Discount “e” Is Offered
In the second part, we focus on the case that the firm has two sales channels. The firm offers a discount “e” over the mobile app. Assuming that the customer is active in the beginning of thefirst period, his/her possible purchases follow the basic structure in Table 2.
Table 2. Transaction Probabilities When a Discount e Is Offered
Period 1 2 3 … n …
p(active) 1 q q² … qn-1 …
p(adopted/active) 0 1-α 1-α² … 1-αn-1 …
p(web/active, non-adp) 𝑝𝑝𝑝𝑝𝑊𝑊𝑊𝑊 𝑝𝑝𝑝𝑝𝑊𝑊𝑊𝑊 𝑝𝑝𝑝𝑝𝑊𝑊𝑊𝑊 … 𝑝𝑝𝑝𝑝𝑊𝑊𝑊𝑊 …
p(web/active, adp) - 0 0 … 0 …
p(app/active, non-adp) 𝑝𝑝𝑝𝑝𝑀𝑀𝑀𝑀 𝑝𝑝𝑝𝑝𝑀𝑀𝑀𝑀 𝑝𝑝𝑝𝑝𝑀𝑀𝑀𝑀 … 𝑝𝑝𝑝𝑝𝑀𝑀𝑀𝑀 …
p(app/active, adp) - �̅�𝑝𝑝𝑝 �̅�𝑝𝑝𝑝 … �̅�𝑝𝑝𝑝 …
Interest 1 (1+d) (1+d)² … (1+d)n-1 …
6
where �̅�𝑝𝑝𝑝 = 𝑝𝑝𝑝𝑝𝑊𝑊𝑊𝑊 + 𝑝𝑝𝑝𝑝𝑀𝑀𝑀𝑀 + ℎ𝑒𝑒𝑒𝑒(1 − 𝑝𝑝𝑝𝑝𝑊𝑊𝑊𝑊 − 𝑝𝑝𝑝𝑝𝑀𝑀𝑀𝑀)
e is a permanent discount rate over the mobile app. The discount plays a role in steering the customers to use the mobile app on a regular basis. A non-adopted customer at period “n” will stay non-adopted at the beginning of period “n+1” with a probability of α. The purchasing probabilities over the website and mobile app are 𝑝𝑝𝑝𝑝𝑊𝑊𝑊𝑊 and 𝑝𝑝𝑝𝑝𝑀𝑀𝑀𝑀respectively before adoption. These probabilities are mutually. Once a customer has adopted the mobile app, she purchases only through it. In this case, the customer purchases over the mobile app with a probability of �̅�𝑝𝑝𝑝. We assume that �̅�𝑝𝑝𝑝 increases correlated with e as well as a constant h. The constant exists to capture how well the customer increases her probability of purchasing after the mobile app adoption. When the h value of a customer is high, she increases her purchasing probability highly once she adopts the mobile app. The summation of the transactions over the customer's life time is as follows:
𝐷𝐷𝐷𝐷𝐷𝐷𝐷𝐷𝐷𝐷𝐷𝐷 =q(1 − e)(𝑝𝑝𝑝𝑝𝑊𝑊𝑊𝑊 + 𝑝𝑝𝑝𝑝𝑀𝑀𝑀𝑀 + ℎ𝑒𝑒𝑒𝑒(1 − 𝑝𝑝𝑝𝑝𝑊𝑊𝑊𝑊 − pM))
1 + 𝑑𝑑𝑑𝑑 − 𝑞𝑞𝑞𝑞
+(1 + d)(𝑝𝑝𝑝𝑝𝑊𝑊𝑊𝑊 − (1 − 𝑒𝑒𝑒𝑒)(ℎ𝑒𝑒𝑒𝑒(1 − 𝑝𝑝𝑝𝑝𝑊𝑊𝑊𝑊 − pM) + 𝑝𝑝𝑝𝑝𝑊𝑊𝑊𝑊))
1 + 𝑑𝑑𝑑𝑑 − α𝑞𝑞𝑞𝑞
The optimal discount rate is given by
𝑒𝑒𝑒𝑒∗ =h + 1
2h+𝑑𝑑𝑑𝑑2 − 1
2q+
(1 − α)(𝑑𝑑𝑑𝑑2 − 1)2(αq − d − 1)
+1
2h(𝑝𝑝𝑝𝑝𝑊𝑊𝑊𝑊 + pM − 1)
Findings
Our findings indicate that the firm is more likely to offer a discount over the mobile app to a customer who is either unlikely or very likely to increase his/her purchasing probability after being offered the discount. In these ranges, the increase in CLV in the long run outweighs the decrease in the short term profit. The result is the opposite for moderate values of purchasing probability change. Another finding is that the firm is more likely to offer a discount over the mobile app when a customer does not adopt the mobile app. On the other hand, the firm should not offer a discount to a customer who already has a high purchasing probability. His/her CLV is already high, and the discount brings nothing but loss of profit to the firm. Finally, an important result of the model shows that the firm should not apply the strategy of offering a discount over the mobile app to increase its customer acquisition. In this case, we find that new customers tend to use the discount for one-time purchases and leave the firm afterward.
In the second part of our analysis, we focus on the optimal discount rate when offering it is part of the optimal strategy of a firm. In this part of the analysis, we calculate the discount rate that gives the DET its optimal value. We also show how the optimal discount rate changes based on different customer characteristics. We show that when the discount greatly increases the customer's purchasing probability, the firm offers a higher discount rate. Similarly, the firm
391
7
offers a higher discount rate to those who tend to adopt the mobile app quickly as well as to more active customers. The idea behind the increase in those three customer characteristics is the same: the customer tends to spend more and increase his/her CLV with the discount. On the other hand, the firm decreases the discount rate when the current purchasing probability of a customer is high. It is important to note that, the strategy of offering a discount to the customers with high current purchasing probabilities is not the optimal one most of the time. However, even when it is the optimal strategy, the firm keeps the discount rate to these customers low. The logic behind this is simple: the customer's CLV is already high and offering a higher discount rate only decreases the firm's profit.
Our findings are informative for managers. This article presents a strategy to increase a firm's long-term profit. It clearly shows that this strategy is not a good one for customer acquisition. This is why it is not a good idea to try to attract someone who is not a customer by offering his/her a discount on the mobile app. The same is true for a strategy such as "shipping is free on mobile." The main takeaway for managers is that although this strategy increases the CLV of some customer types, certainly one discount does not fit all.
References
Adweek (2018), “Mobile Shopping Is on the Rise, But Remains Split Between the Mobile Web and Apps”, (accessed on February 9, 2020), [available at https://www.adweek.com/digital/mobile-shopping-is-on-the-rise-but-remains-split-between-the-mobile-web-and-apps/]
Balasubramanian, S., Peterson, R. A., & Jarvenpaa, S. L. (2002). Exploring the implications of m-commerce for markets and marketing. Journal of the academy of Marketing Science, 30(4),348-361.
Bucklin, R. E., Lattin, J. M., Ansari, A., Gupta, S., Bell, D., Coupey, E., ... & Steckel, J. (2002). Choice and the Internet: From clickstream to research stream. Marketing Letters, 13(3), 245-258.
De Haan, E., Kannan, P. K., Verhoef, P. C., & Wiesel, T. (2015). The role of mobile devices in the online customer journey. MSI Marketing Science Institute.
Dinner, Isaac M., Harald J. van Heerde, and Scott Neslin. "Creating customer engagement via mobile apps: How app usage drives purchase behavior." (2015).
Fader, Peter, Bruce Hardie, and Paul D. Berger. "Customer-base analysis with discrete-time transaction data." (2004).
Narang, Unnati, and Venkatesh Shankar. "The Effects of Mobile Apps on Shopper Purchases and Product Returns." (2016).
Nysveen, H., Pedersen, P. E., & Thorbjørnsen, H. (2005). Intentions to use mobile services: Antecedents and cross-service comparisons. Journal of the academy of marketing science, 33(3), 330-346.
392
7
offers a higher discount rate to those who tend to adopt the mobile app quickly as well as to moreactive customers. The idea behind the increase in those three customer characteristics is the same: the customer tends to spend more and increase his/her CLV with the discount. On theother hand, the firm decreases the discount rate when the current purchasing probability of acustomer is high. It is important to note that, the strategy of offering a discount to the customerswith high current purchasing probabilities is not the optimal one most of the time. However, even when it is the optimal strategy, the firm keeps the discount rate to these customers low. Thelogic behind this is simple: the customer's CLV is already high and offering a higher discountrate only decreases the firm's profit.
Our findings are informative for managers. This article presents a strategy to increase a firm'slong-term profit. It clearly shows that this strategy is not a good one for customer acquisition. This is why it is not a good idea to try to attract someone who is not a customer by offeringhis/her a discount on the mobile app. The same is true for a strategy such as "shipping is free on mobile." The main takeaway for managers is that although this strategy increases the CLV ofsome customer types, certainly one discount does not fit all.
References
Adweek (2018), “Mobile Shopping Is on the Rise, But Remains Split Between the Mobile Web and Apps”, (accessed on February 9, 2020), [available athttps://www.adweek.com/digital/mobile-shopping-is-on-the-rise-but-remains-split-between-the-mobile-web-and-apps/]
Balasubramanian, S., Peterson, R. A., & Jarvenpaa, S. L. (2002). Exploring the implications ofm-commerce for markets and marketing. Journal of the academy of Marketing Science, 30(4), 348-361.
Bucklin, R. E., Lattin, J. M., Ansari, A., Gupta, S., Bell, D., Coupey, E., ... & Steckel, J. (2002). Choice and the Internet: From clickstream to research stream. Marketing Letters, 13(3), 245-258.
De Haan, E., Kannan, P. K., Verhoef, P. C., & Wiesel, T. (2015). The role of mobile devices in the online customer journey. MSI Marketing Science Institute.
Dinner, Isaac M., Harald J. van Heerde, and Scott Neslin. "Creating customer engagement viamobile apps: How app usage drives purchase behavior." (2015).
Fader, Peter, Bruce Hardie, and Paul D. Berger. "Customer-base analysis with discrete-timetransaction data." (2004).
Narang, Unnati, and Venkatesh Shankar. "The Effects of Mobile Apps on Shopper Purchasesand Product Returns." (2016).
Nysveen, H., Pedersen, P. E., & Thorbjørnsen, H. (2005). Intentions to use mobile services:Antecedents and cross-service comparisons. Journal of the academy of marketing science, 33(3),330-346.
8
Okazaki, Shintaro, and Felipe Mendez. "Perceived ubiquity in mobile services." Journal of Interactive Marketing 27.2 (2013): 98-111.
Shankar, V., & Balasubramanian, S. (2009). Mobile marketing: a synthesis and prognosis. Journal of interactive marketing, 23(2), 118-129.
Shankar, V., Venkatesh, A., Hofacker, C., & Naik, P. (2010). Mobile marketing in the retailing environment: current insights and future research avenues. Journal of interactive marketing, 24(2), 111-120.
Shankar, V., Kleijnen, M., Ramanathan, S., Rizley, R., Holland, S., & Morrissey, S. (2016). Mobile shopper marketing: Key issues, current insights, and future research avenues. Journal of Interactive Marketing, 34, 37-48.
Statista (2018), “Mobile E-commerce is up and Poised for Further Growth”, (accessed on February 9, 2020), [available at https://www.statista.com/chart/13139/estimated-worldwide-mobile-e-commerce-sales/]
Str\"om, R., Vendel, M., & Bredican, J. (2014). Mobile marketing: A literature review on its value for consumers and retailers. Journal of Retailing and Consumer Services, 21(6), 1001-1012.
Wang, Rebecca Jen-Hui, Edward C. Malthouse, and Lakshman Krishnamurthi. "On the go: How mobile shopping affects customer purchase behavior." Journal of Retailing 91.2 (2015): 217-234.
Zhang, Yao, Eric T. Bradlow, and Dylan S. Small. "Predicting customer value using clumpiness: From RFM to RFMC." Marketing Science 34.2 (2014): 195-208.
Keywords
Customer lifetime value, Customer-base analysis, Mobile purchasing adoption, Multi-channel sales, Retail pricing
393
1
OPTIMAL IN-STORE FULFILMENT POLICIES FOR ONLINE ORDERS IN ANOMNI-CHANNEL RETAIL ENVIRONMENT
Rita Maria DifrancescoMarketing, Operations and Supply Department
Eada Business School Barcelona
Carrer d’Aragó 210, 08011 Barcelona, Spain
Isabelle van SchiltFaculty of Technology, Policy and Management
Delft University of Technology
Mekelweg 5, 2628 CD Delft, Netherlands
Matthias WinkenbachCenter for Transportation and Logistics
Massachusetts Institute of Technology
77 Massachusetts Avenue, Cambridge, MA 02139, USA
IntroductionThe explosive growth of e-commerce creates a need for increasingly responsive omni-channel fulfilment capabilities, which raises new challenges in inventory management and order fulfilment for retailers. Meeting customers' requirements and keeping up with quickly advancing service standards in e-commerce is becoming increasingly challenging from an operational point of view. A key determinant of the cost and complexity of online fulfilmentin omni-channel retailing is delivery speed. The emergence of delivery services with delivery lead times of two hours or less (Ehmke 2014, Castillo 2018) puts pressure on retailers striving to be successful in the omni-channel world. On the one hand, these delivery services further raise customer expectations and may become a key distinguishing factor for consumers to choose between competing vendors. On the other hand, the cost of fulfilment of online orders increases rapidly as delivery lead times reduce further. Therefore, it is critical for omni-channel retailers to find the optimal trade-off between providing a high service level and customer experience enabled by fast fulfilment capabilities and containing the fulfilment cost on their online orders. In this context, omni-channel retailers are increasingly looking at exploiting their physical store network to leverage localized inventory positions from which to fulfil online orders. Items stored in traditional Brick and Mortar shelf space and back room storage is thus used not only to satisfy walk-in customer demand in the physical channel, but
394
1
OPTIMAL IN-STORE FULFILMENT POLICIES FOR ONLINE ORDERS IN ANOMNI-CHANNEL RETAIL ENVIRONMENT
Rita Maria DifrancescoMarketing, Operations and Supply Department
Eada Business School Barcelona
Carrer d’Aragó 210, 08011 Barcelona, Spain
Isabelle van SchiltFaculty of Technology, Policy and Management
Delft University of Technology
Mekelweg 5, 2628 CD Delft, Netherlands
Matthias WinkenbachCenter for Transportation and Logistics
Massachusetts Institute of Technology
77 Massachusetts Avenue, Cambridge, MA 02139, USA
IntroductionThe explosive growth of e-commerce creates a need for increasingly responsive omni-channelfulfilment capabilities, which raises new challenges in inventory management and orderfulfilment for retailers. Meeting customers' requirements and keeping up with quicklyadvancing service standards in e-commerce is becoming increasingly challenging from anoperational point of view. A key determinant of the cost and complexity of online fulfilmentin omni-channel retailing is delivery speed. The emergence of delivery services with deliverylead times of two hours or less (Ehmke 2014, Castillo 2018) puts pressure on retailers striving to be successful in the omni-channel world. On the one hand, these delivery services furtherraise customer expectations and may become a key distinguishing factor for consumers tochoose between competing vendors. On the other hand, the cost of fulfilment of online ordersincreases rapidly as delivery lead times reduce further. Therefore, it is critical for omni-channel retailers to find the optimal trade-off between providing a high service level andcustomer experience enabled by fast fulfilment capabilities and containing the fulfilment coston their online orders. In this context, omni-channel retailers are increasingly looking atexploiting their physical store network to leverage localized inventory positions from which to fulfil online orders. Items stored in traditional Brick and Mortar shelf space and back roomstorage is thus used not only to satisfy walk-in customer demand in the physical channel, but
2
also to cater for online orders which are picked, packed and shipped to the customer directly from the stores. This concept is also known as “shift from store” (SFT) strategy and is most commonly seen in dense urban markets. Several retailers such as Walmart and Amazon-Whole Foods, as well as online marketplaces such as Instacart, have already implemented in-store e-commerce fulfilment concepts. While ship-from-store strategies can help retailers tomove closer to the consumer and enable higher sales, faster deliveries, lower cost, and improved margins (Accenture 2018, Cain 2018, Stelzer 2017), failure to properly implement such a strategy can result in a number of critical issues, including both online and offline stock-outs, higher costs, lost sales, and eventually customer dissatisfaction or loss.
PurposeIn this paper, we are modelling the in-store fulfilment process of an omni-channel retailer using an SFS strategy to fulfil online orders. The extant literature on omni-channel retailing addresses issues related to the integration of online and offline channels and customer behavior. Most of the existing studies focus on the problem of finding the optimal order quantities and reorder points in the different sales channels (e.g., Alawneh & Zhang 2018, Boyaci 2005, Zhao et al.2016) or investigate the impact of multi-channel and omnichannel strategies on in-store traffic, online and offline sales, and customer behavior (e.g., Gallino & Moreno 2014, Gallino et al. 2017, Jin et al. 2018). Note that we do not attempt to find an optimal ordering policy, nor studying the impact of omnichannel retail in terms of sales and customer changing behavior, which are problems widely discussed in the literature. Rather,we extend the existing studies by analysing a pure-play SFS strategy according to which both online orders and walk-in purchases are fulfilled from in-store available inventory. We focus on prescribing optimal in-store fulfilment policies for SFS strategies in omni-channel retailing, taking into consideration a variety of sources of uncertainty. Specifically, our model intends to determine the optimal amounts of time to allow for batching of online orders prior to starting the in-store picking process and of readily picked orders prior to starting the courier pickup and delivery process. We use our model to derive a set of managerial implications applicable to many omni-channel problems. The primary focus of our analysis is the trade-off between customer service level and cost. There are three main contributions of this paper. First, we develop a comprehensive end-to-end view of a typical in-store fulfilment process for omni-channel retailers following a ship-from-store strategy. This serves as the basis for our subsequent quantitative modelling and analysis of the trade-offs inherent to this process. Second, we derive simulation-based insights into optimal in-store fulfilment policies that are generally applicable to many omni-channel fulfilment problems. Third, we apply our proposed model to a realistic case study informed by real data from a major sporting goods retailer. This case study provides case-specific insights and demonstrated the applicability and relevance of our proposed method to real-world decision problems in omni-channel fulfilment.
Design/methodology/approachWe develop a discrete event simulation model to analyse and optimize the in-store e-commerce fulfilment process under a variety of sources of uncertainty. We combine our proposed simulation approach with an Exploratory Modelling and Analysis (EMA), which allows us to incorporate and test various fulfilment policies in a variety of scenarios of analysis. We then apply our proposed modelling approach to a case study informed by real data from a leading sporting goods omni-channel retailer in New York City in order to illustrate the practical applicability and the value of our approach.
395
3
FindingsOur results define the optimal in-store fulfilment policies for SFS strategies in omni-channel retailing, i.e., the optimal amounts of time to allow for batching of online orders prior to starting the in-store picking process and of readily picked orders prior to starting the delivery process. Our analysis reveals that (i) the arrival rate of in-store customers highly affects theonline orders service rate; (ii) the fulfilment policies affect the total cost of operations; and(iii) different combinations of fulfilment policies highly affect the in-store space requirementand the order lead time. Also, our results show the relationship and the trade-off between themodel constraints and performance, which are of importance while searching for the optimalpolicy. We then compare how our results change when considering different order arrivalrates, corresponding to different part of the day, suggesting if and when an omnichannelretailer needs to differentiate her fulfillment policies according to different time frames. Ourcase study illustrates how our proposed methodology can be employed to determine anoptimal policy for implementing a two-hours delivery ship-from-store online fulfillmentservice in a megacity such as New York City. Besides defining a single optimal policy, thiscase study also provides insight into the viable ranges of the various policy levers we explore.
Original/valueMotivated by the challenges of a real sports fashion retailer, this paper contributes to the omni-channel retail literature by studying a new fulfilment trend that has recently started to emerge: omnichannel retailers are starting to exploit the store space in excess to localize the inventory used to fulfil online orders. We study the fulfilment policy optimization considering both the virtual and physical inventory at the retailer operating in an omnichannel environment. The results of our work are of interest both for academics and practitioners.
Practical implicationsThe outcomes of our proposed method are of relevance also for real-world decision problems in omni-channel environment, suggesting how to set the major parameters and decision variables in order to guarantee a high service level and meeting the delivery due date while minimizing the costs. Practitioners can make use of our methodology and results to design their fulfilment policies, and measure and improve their performance.
Social implicationsWithin the study of the delivery process, this work explores the feasibility of an alternative transportation mode for the last mile delivery in megacities, i.e., electrical bicycles. Besides cost and service issues, important environmental and social aspects are associated to the last mile logistics, including CO2 emissions, traffic congestion and air pollution. Hence, it is of interest to present a viable solution for retailers which addresses, besides the economic aspects of the delivery process, also the environmental and social ones.
Research limitations and outlookThis work can be extended in the following ways. First, it will be of interest to include courier supply uncertainty, i.e., analyse how the model and results would change in case couriers are not always immediately available for delivery. Second, one could include restocking of the store inventory during the day and shelf space and back room storage constraints: in real life,
396
3
FindingsOur results define the optimal in-store fulfilment policies for SFS strategies in omni-channelretailing, i.e., the optimal amounts of time to allow for batching of online orders prior tostarting the in-store picking process and of readily picked orders prior to starting the deliveryprocess. Our analysis reveals that (i) the arrival rate of in-store customers highly affects theonline orders service rate; (ii) the fulfilment policies affect the total cost of operations; and(iii) different combinations of fulfilment policies highly affect the in-store space requirementand the order lead time. Also, our results show the relationship and the trade-off between themodel constraints and performance, which are of importance while searching for the optimalpolicy. We then compare how our results change when considering different order arrivalrates, corresponding to different part of the day, suggesting if and when an omnichannelretailer needs to differentiate her fulfillment policies according to different time frames. Ourcase study illustrates how our proposed methodology can be employed to determine anoptimal policy for implementing a two-hours delivery ship-from-store online fulfillmentservice in a megacity such as New York City. Besides defining a single optimal policy, thiscase study also provides insight into the viable ranges of the various policy levers we explore.
Original/valueMotivated by the challenges of a real sports fashion retailer, this paper contributes to theomni-channel retail literature by studying a new fulfilment trend that has recently started toemerge: omnichannel retailers are starting to exploit the store space in excess to localize theinventory used to fulfil online orders. We study the fulfilment policy optimization considering both the virtual and physical inventory at the retailer operating in an omnichannelenvironment. The results of our work are of interest both for academics and practitioners.
Practical implicationsThe outcomes of our proposed method are of relevance also for real-world decision problemsin omni-channel environment, suggesting how to set the major parameters and decisionvariables in order to guarantee a high service level and meeting the delivery due date whileminimizing the costs. Practitioners can make use of our methodology and results to design their fulfilment policies, and measure and improve their performance.
Social implicationsWithin the study of the delivery process, this work explores the feasibility of an alternativetransportation mode for the last mile delivery in megacities, i.e., electrical bicycles. Besidescost and service issues, important environmental and social aspects are associated to the lastmile logistics, including CO2 emissions, traffic congestion and air pollution. Hence, it is ofinterest to present a viable solution for retailers which addresses, besides the economicaspects of the delivery process, also the environmental and social ones.
Research limitations and outlookThis work can be extended in the following ways. First, it will be of interest to include couriersupply uncertainty, i.e., analyse how the model and results would change in case couriers arenot always immediately available for delivery. Second, one could include restocking of thestore inventory during the day and shelf space and back room storage constraints: in real life,
4
it may be desirable to be able to leverage intra-day replenishment as another policy lever to improve the performance of the company’s in-store fulfilment operations for online orders. Lastly, it would be of interest to extend this work to perishable products and investigates if and how the results obtained for non-perishable products would change.
ReferencesAccenture, 2018. How could last mile delivery evolve to sustainably meet customer expectations? Technical Report.
Alawneh, F., & Zhang, G. (2018). Dual-channel warehouse and inventory management with stochastic demand. Transportation Research Part E: Logistics and Transportation Review, 112, 84–106.
Boyaci, T. (2005). Competitive stocking and coordination in a multiple-channel distribution system. IIE Transactions (Institute of Industrial Engineers), 37, 407–427.
Castillo, V.E., Bell, J.E., Rose, W.J., Rodrigues, A.M., 2018. Crowdsourcing Last Mile Delivery: Strategic Implications and Future Research Directions. Journal of Business Logistics 39, 7–25.
Cain, A., 2018. Target is doubling down on a key advantage as it gears up for a holiday-shopping battle with Amazon. Business Insider.
Ehmke, J.F., Campbell, A.M., 2014. Customer acceptance mechanisms for home deliveries in metropolitan areas. European Journal of Operational Research 233, 193–207.
Gallino, S., & Moreno, A. (2014). Integration of Online and Offline Channels in Retail: The Impact of Sharing Reliable Inventory Availability Information. Management Science,60, 1434–145.
Gallino, S., Moreno, A., & Stamatopoulos, I. (2017). Channel Integration, Sales Dispersion, and Inventory Management. Management Science,63, 2813–2831.
Jin, M., Li, G., & Cheng, T. C. (2018). Buy online and pick up in-store: Design of the service area. European Journal of Operational Research,268, 613–623.
Stelzer, J., 2017. Ship From Store: Easier or Harder Than You Think...It Depends. URL: https://www.ibm.com/855blogs/watson-customer-engagement/2017/04/17/ship-from-store/.
Zhao, F., Wu, D., Liang, L., & Dolgui, A. (2016). Lateral inventory transshipment problem in online-to-offline supply chain. International Journal of Production Research, 54, 1951–1963.
Keywordse-commerce, omni-channel retailing, logistics, simulation, applied probability
397
1
PASSENGER’S SHOPPING BEHAVIOUR: AN EYE-TRACKING STUDY
IntroductionThe airport is big business (Doganis, 2005). It does not only carry economic significance, but it also often provides the first impression of the country to the visitors from the other countries (Matsuo et al., 2010). Airport generated USD$19 Billion alone from its offering of retail services in 2014. Some label airport retail as the Formula 1 of retail (Economist, 2014).Retailing in the airport environment has received wide attention from academics from various discipline such as retail, engineering and aviation. With the rapid development of airport retail, there are continuous discussions around the role of the airport. While some airlines believe airport should be only seen as "bus stop" (Nikolaeva, 2012), airports are becoming shopping centres or even small cities with runways (Humphreys, 1999, Orth et al., 2015).The growing demand for air travel would also mean that airport retail will benefit from aincreasing customer base.
Background and ContextThere is a rich literature on the impact of passengers’ social demographics on airport retail.Similar to general retail, passenger's characteristics such as gender, income exerts a significant influence on passenger shopping decision (Omar and Kent, 2001, Freathy and O'Connell, 2012). Geuens et al. (2004) pointed out that passengers could be categorised into different types of shoppers based on demographics, and they exhibit different needs for retail layouts. Adey (2008) further elaborated that the architectural design of some terminals limits the possible movement of passengers or unknowingly “guides” passenger movement in the terminal along “pre-planned routes” using obstacles in the terminal interior design, such as walls, glass and metal barriers. By guiding the movement or “flows” of passengers in the terminal, airports can potentially create more exposure for retail shops along the passenger flow paths and stimulate passenger spending. Therefore, passengers’ movement in the terminal is paramount to airport retailers. However, consumer’s behaviour and movement aremore widely studied in other retail environments (see (Baron and Wass, 1996, Crask, 1979, Reimers and Clulow, 2004, Zhu and Timmermans, 2011)), retailers in airports could benefit significantly with a better understanding of passenger behaviour and its associated movement.
Purpose*This study investigates how passengers spend their time and how they move around within the airport retail environment with limited time.
DesignAn on-site eye tracking exploratory study was conducted together with the use of questionnaire and interview. This study aims to help us to understand passenger’s shopping behaviour from a 1st person’s perspective. The focus of this exploratory study is mainly to observe passenger’s behaviour and their physical movements. Therefore, more attention was paid to participant’s observation and physical movement. Even though eye tracking video provides more dimensions of the understanding of the passenger movement in the airport terminal, it is too costly to run on a bigger sample size. Hence, the exploratory study is more qualitative rather than quantitative.
In order to better understand passenger’s behaviour in the retail environment provided by the airport, we observe the passenger's natural behaviour with minimal interference. To achieve this, we require passenger's movement data to understand when and which stores were visited.
398
1
PASSENGER’S SHOPPING BEHAVIOUR: AN EYE-TRACKINGSTUDY
IntroductionThe airport is big business (Doganis, 2005). It does not only carry economic significance, butit also often provides the first impression of the country to the visitors from the othercountries (Matsuo et al., 2010). Airport generated USD$19 Billion alone from its offering of retail services in 2014. Some label airport retail as the Formula 1 of retail (Economist, 2014).Retailing in the airport environment has received wide attention from academics from variousdiscipline such as retail, engineering and aviation. With the rapid development of airportretail, there are continuous discussions around the role of the airport. While some airlinesbelieve airport should be only seen as "bus stop" (Nikolaeva, 2012), airports are becomingshopping centres or even small cities with runways (Humphreys, 1999, Orth et al., 2015).The growing demand for air travel would also mean that airport retail will benefit from aincreasing customer base.
Background and ContextThere is a rich literature on the impact of passengers’ social demographics on airport retail.Similar to general retail, passenger's characteristics such as gender, income exerts a significant influence on passenger shopping decision (Omar and Kent, 2001, Freathy and O'Connell, 2012). Geuens et al. (2004) pointed out that passengers could be categorised into different types of shoppers based on demographics, and they exhibit different needs for retaillayouts. Adey (2008) further elaborated that the architectural design of some terminals limitsthe possible movement of passengers or unknowingly “guides” passenger movement in theterminal along “pre-planned routes” using obstacles in the terminal interior design, such aswalls, glass and metal barriers. By guiding the movement or “flows” of passengers in theterminal, airports can potentially create more exposure for retail shops along the passengerflow paths and stimulate passenger spending. Therefore, passengers’ movement in theterminal is paramount to airport retailers. However, consumer’s behaviour and movement aremore widely studied in other retail environments (see (Baron and Wass, 1996, Crask, 1979, Reimers and Clulow, 2004, Zhu and Timmermans, 2011)), retailers in airports could benefit significantly with a better understanding of passenger behaviour and its associated movement.
Purpose*This study investigates how passengers spend their time and how they move around withinthe airport retail environment with limited time.
DesignAn on-site eye tracking exploratory study was conducted together with the use ofquestionnaire and interview. This study aims to help us to understand passenger’s shoppingbehaviour from a 1st person’s perspective. The focus of this exploratory study is mainly to observe passenger’s behaviour and their physical movements. Therefore, more attention waspaid to participant’s observation and physical movement. Even though eye tracking video provides more dimensions of the understanding of the passenger movement in the airportterminal, it is too costly to run on a bigger sample size. Hence, the exploratory study is more qualitative rather than quantitative.
In order to better understand passenger’s behaviour in the retail environment provided by theairport, we observe the passenger's natural behaviour with minimal interference. To achieve this, we require passenger's movement data to understand when and which stores were visited.
2
This data should also include the passenger's timestamps to understand the impact of time on passenger’s behaviours. Lastly, we also need to collect passengers’ shopping diaries and seek additional information about the passenger's shopping strategy. This is achieved through a combination of questionnaire and a short interview. The questionnaire and short interviewincluded three types of question: (1) passenger's socio/travel-demographics, such as gender, income, travel purpose; (2) shopping information, such as preference, the item purchased, money spent; (3) an open-ended interview about passengers’ shopping strategy, such as planned shopping.
DataData was collected in one of the secondary airports in Asia. We used the Pupil Lab’s mobile eye-tracking bundle to conduct this exploratory study at the airport. Passengers were randomly intercepted and asked to participate in this exploratory study after they passed the immigration area. After they agree to participate, participants fill up the 1st part of a survey (demographics-related and shop preference-related questions). After passengers completed the 1st part of the survey, passenger put on the Pupil Lab eye tracker and completes the necessary steps required for offline calibration.
A random sample of 40 passengers (21 males and 19 females) were recruited to participate in the exploratory study. A valid sample consists of data from eye-tracker (left-eye data, right-eye data and world camera data), survey and the short interview discussion. As a result, only 34 of the participants completed the whole exploratory study, and their results are considered valid. Three samples are excluded due to the technical difficulty of the eye tracking device. Another three samples are excluded as passengers did not have time to complete the interview when they arrive late at the departure gate.
Basic Sample Characteristics from SurveyTable 1 lists some basic characteristics of the sample. There are more male passengers (56%) than female passengers (44%) in the data collected. According to Chen and Chao (2015),passengers can be classified as young (30 years or younger), middle (31-50 years) and senior (51 years and above). Young travellers (50%) are the dominant group in this sample, followed the middle-age group (38%) and senior travellers (12%). Regarding travel purpose, business traveller and leisure travellers are evenly split in the sample. Fewer passengers were travelling in groups (47%) than passenger travelling individually (53%). The participants also appear to possess high education qualifications with 6% diploma holders, 62% university degree and 32% master's degree holder in the sample. 44% of the participants earn a monthly salary of less than $1950 per month, and the other 56% has a monthly income of $1950 or higher. The average airside dwell time of the participants is 58 minutes.
Table 1 Basic Sample Characteristics of the sample (1)
Gender Male (19), Female (15)Age <20 (2), 20-30 (15), 31-40 (8), 41-50 (5), 51-60 (3), ≥ 60 (1)Travel Purpose Business (17), Leisure (17)Travel in a group Yes (16), No (18)Qualification Diploma (2), University degree (21), Master’s degree (11)Income (USD per month) (2)
< $980 (9), $980-$1949 (6), $1950-$2999 (5), ≥ $2950 (14)
Average dwell time 58 minutes(1) The unit measured is in the number unless stated otherwise(2) Converted from participants’ local currency
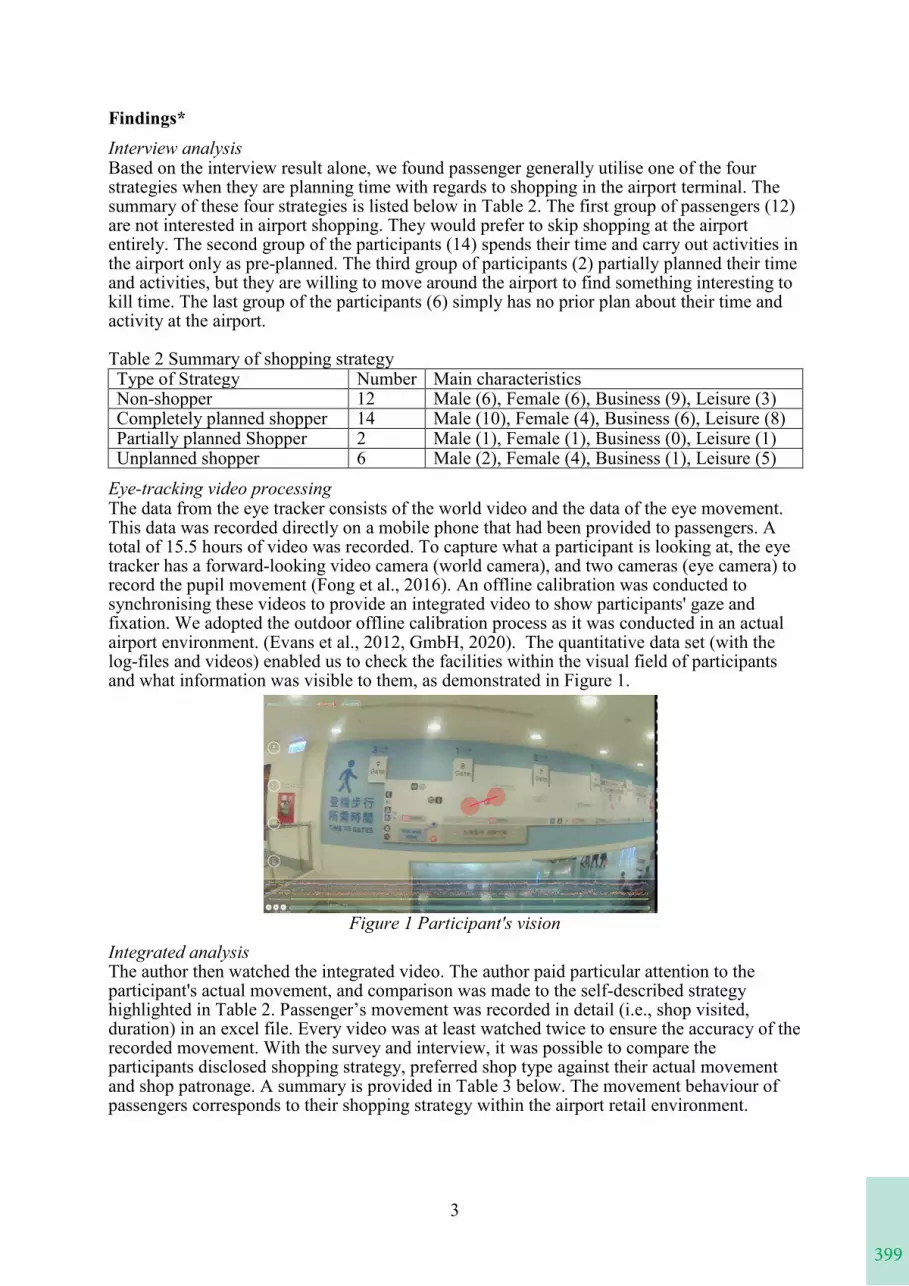
399
3
Findings*Interview analysisBased on the interview result alone, we found passenger generally utilise one of the four strategies when they are planning time with regards to shopping in the airport terminal. The summary of these four strategies is listed below in Table 2. The first group of passengers (12) are not interested in airport shopping. They would prefer to skip shopping at the airport entirely. The second group of the participants (14) spends their time and carry out activities in the airport only as pre-planned. The third group of participants (2) partially planned their time and activities, but they are willing to move around the airport to find something interesting to kill time. The last group of the participants (6) simply has no prior plan about their time and activity at the airport.
Table 2 Summary of shopping strategyType of Strategy Number Main characteristicsNon-shopper 12 Male (6), Female (6), Business (9), Leisure (3)Completely planned shopper 14 Male (10), Female (4), Business (6), Leisure (8)Partially planned Shopper 2 Male (1), Female (1), Business (0), Leisure (1)Unplanned shopper 6 Male (2), Female (4), Business (1), Leisure (5)
Eye-tracking video processing The data from the eye tracker consists of the world video and the data of the eye movement. This data was recorded directly on a mobile phone that had been provided to passengers. A total of 15.5 hours of video was recorded. To capture what a participant is looking at, the eye tracker has a forward-looking video camera (world camera), and two cameras (eye camera) to record the pupil movement (Fong et al., 2016). An offline calibration was conducted to synchronising these videos to provide an integrated video to show participants' gaze and fixation. We adopted the outdoor offline calibration process as it was conducted in an actual airport environment. (Evans et al., 2012, GmbH, 2020). The quantitative data set (with the log-files and videos) enabled us to check the facilities within the visual field of participants and what information was visible to them, as demonstrated in Figure 1.
Figure 1 Participant's visionIntegrated analysis The author then watched the integrated video. The author paid particular attention to the participant's actual movement, and comparison was made to the self-described strategy highlighted in Table 2. Passenger’s movement was recorded in detail (i.e., shop visited, duration) in an excel file. Every video was at least watched twice to ensure the accuracy of the recorded movement. With the survey and interview, it was possible to compare the participants disclosed shopping strategy, preferred shop type against their actual movementand shop patronage. A summary is provided in Table 3 below. The movement behaviour of passengers corresponds to their shopping strategy within the airport retail environment.
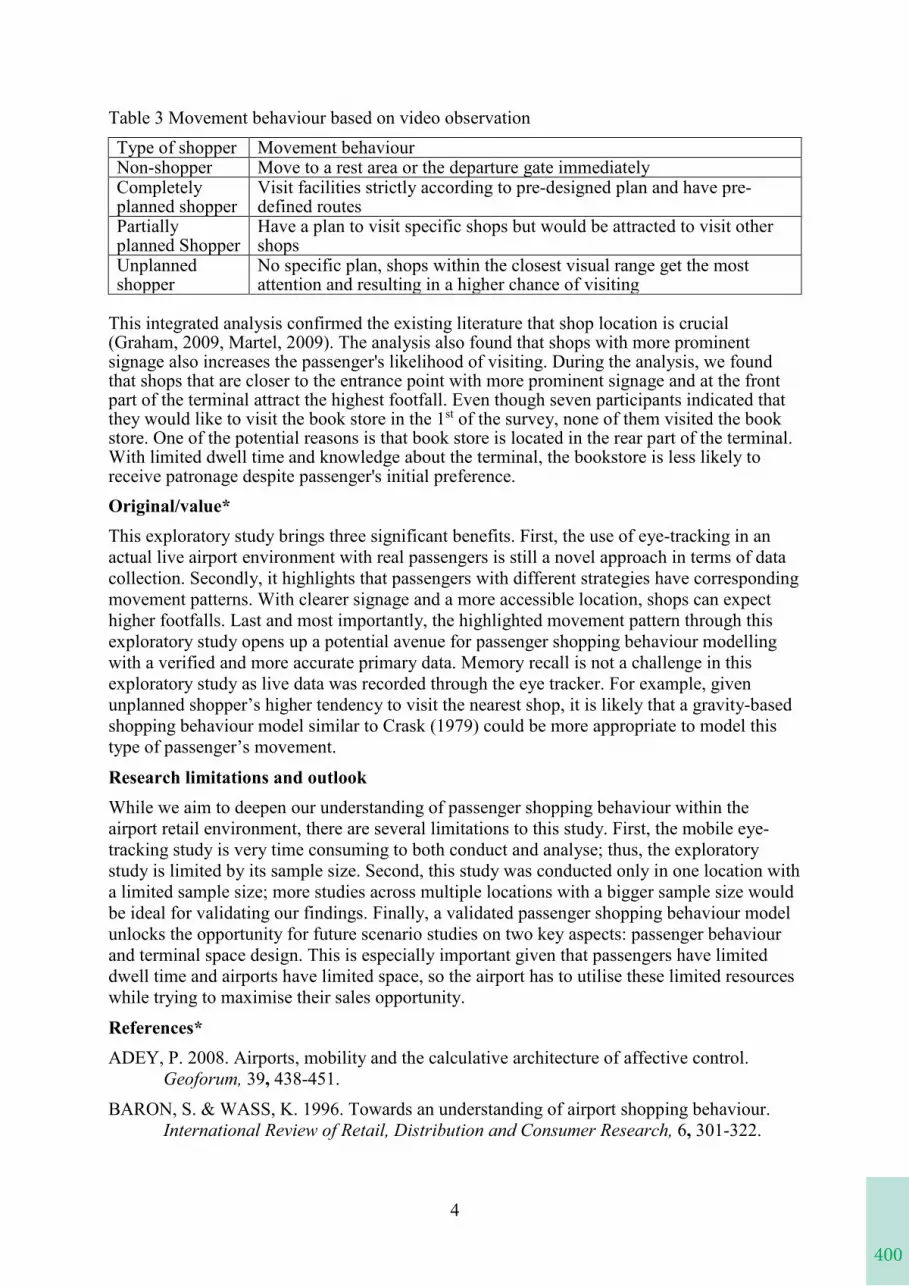
400
3
Findings*Interview analysisBased on the interview result alone, we found passenger generally utilise one of the four strategies when they are planning time with regards to shopping in the airport terminal. Thesummary of these four strategies is listed below in Table 2. The first group of passengers (12)are not interested in airport shopping. They would prefer to skip shopping at the airportentirely. The second group of the participants (14) spends their time and carry out activities inthe airport only as pre-planned. The third group of participants (2) partially planned their timeand activities, but they are willing to move around the airport to find something interesting tokill time. The last group of the participants (6) simply has no prior plan about their time and activity at the airport.
Table 2 Summary of shopping strategyType of Strategy Number Main characteristicsNon-shopper 12 Male (6), Female (6), Business (9), Leisure (3)Completely planned shopper 14 Male (10), Female (4), Business (6), Leisure (8)Partially planned Shopper 2 Male (1), Female (1), Business (0), Leisure (1)Unplanned shopper 6 Male (2), Female (4), Business (1), Leisure (5)
Eye-tracking video processing The data from the eye tracker consists of the world video and the data of the eye movement. This data was recorded directly on a mobile phone that had been provided to passengers. Atotal of 15.5 hours of video was recorded. To capture what a participant is looking at, the eyetracker has a forward-looking video camera (world camera), and two cameras (eye camera) to record the pupil movement (Fong et al., 2016). An offline calibration was conducted to synchronising these videos to provide an integrated video to show participants' gaze and fixation. We adopted the outdoor offline calibration process as it was conducted in an actualairport environment. (Evans et al., 2012, GmbH, 2020). The quantitative data set (with thelog-files and videos) enabled us to check the facilities within the visual field of participantsand what information was visible to them, as demonstrated in Figure 1.
Figure 1 Participant's visionIntegrated analysisThe author then watched the integrated video. The author paid particular attention to theparticipant's actual movement, and comparison was made to the self-described strategyhighlighted in Table 2. Passenger’s movement was recorded in detail (i.e., shop visited, duration) in an excel file. Every video was at least watched twice to ensure the accuracy of the recorded movement. With the survey and interview, it was possible to compare theparticipants disclosed shopping strategy, preferred shop type against their actual movementand shop patronage. A summary is provided in Table 3 below. The movement behaviour ofpassengers corresponds to their shopping strategy within the airport retail environment.
4
Table 3 Movement behaviour based on video observationType of shopper Movement behaviour Non-shopper Move to a rest area or the departure gate immediatelyCompletely planned shopper
Visit facilities strictly according to pre-designed plan and have pre-defined routes
Partially planned Shopper
Have a plan to visit specific shops but would be attracted to visit other shops
Unplanned shopper
No specific plan, shops within the closest visual range get the most attention and resulting in a higher chance of visiting
This integrated analysis confirmed the existing literature that shop location is crucial (Graham, 2009, Martel, 2009). The analysis also found that shops with more prominent signage also increases the passenger's likelihood of visiting. During the analysis, we found that shops that are closer to the entrance point with more prominent signage and at the front part of the terminal attract the highest footfall. Even though seven participants indicated that they would like to visit the book store in the 1st of the survey, none of them visited the book store. One of the potential reasons is that book store is located in the rear part of the terminal. With limited dwell time and knowledge about the terminal, the bookstore is less likely to receive patronage despite passenger's initial preference. Original/value*This exploratory study brings three significant benefits. First, the use of eye-tracking in an actual live airport environment with real passengers is still a novel approach in terms of data collection. Secondly, it highlights that passengers with different strategies have corresponding movement patterns. With clearer signage and a more accessible location, shops can expect higher footfalls. Last and most importantly, the highlighted movement pattern through this exploratory study opens up a potential avenue for passenger shopping behaviour modelling with a verified and more accurate primary data. Memory recall is not a challenge in this exploratory study as live data was recorded through the eye tracker. For example, given unplanned shopper’s higher tendency to visit the nearest shop, it is likely that a gravity-based shopping behaviour model similar to Crask (1979) could be more appropriate to model this type of passenger’s movement.
Research limitations and outlookWhile we aim to deepen our understanding of passenger shopping behaviour within the airport retail environment, there are several limitations to this study. First, the mobile eye-tracking study is very time consuming to both conduct and analyse; thus, the exploratory study is limited by its sample size. Second, this study was conducted only in one location with a limited sample size; more studies across multiple locations with a bigger sample size would be ideal for validating our findings. Finally, a validated passenger shopping behaviour model unlocks the opportunity for future scenario studies on two key aspects: passenger behaviourand terminal space design. This is especially important given that passengers have limited dwell time and airports have limited space, so the airport has to utilise these limited resources while trying to maximise their sales opportunity.
References*ADEY, P. 2008. Airports, mobility and the calculative architecture of affective control.
Geoforum, 39, 438-451.
BARON, S. & WASS, K. 1996. Towards an understanding of airport shopping behaviour. International Review of Retail, Distribution and Consumer Research, 6, 301-322.
401
5
CHEN, H.-T. & CHAO, C.-C. 2015. Airline choice by passengers from Taiwan and China: A case study of outgoing passengers from Kaohsiung International Airport. Journal of Air Transport Management, 49, 53-63.
CRASK, M. R. 1979. A simulation model of patronage behavior within shopping centers. Decision Sciences, 10, 1-15.
DOGANIS, R. 2005. The airport business, Routledge.
ECONOMIST, T. 2014. The sixth continent; Airport shopping. The Economist, May 10, 2014, p.69.
EVANS, K. M., JACOBS, R. A., TARDUNO, J. A. & PELZ, J. B. 2012. Collecting and analyzing eye tracking data in outdoor environments. Journal of Eye Movement Research, 5, 6.
FONG, A., HOFFMAN, D. & RATWANI, R. M. Making sense of mobile eye-tracking data in the real-world: A human-in-the-loop analysis approach. Proceedings of the Human Factors and Ergonomics Society Annual Meeting, 2016. SAGE Publications Sage CA: Los Angeles, CA, 1569-1573.
FREATHY, P. & O'CONNELL, F. 2012. Spending time, spending money: Passenger segmentation in an international airport. International Review of Retail, Distribution and Consumer Research, 22, 397-416.
GEUENS, M., VANTOMME, D. & BRENGMAN, M. 2004. Developing a typology of airport shoppers. Tourism Management, 25, 615-622.
GMBH, P. L. 2020. User Guide [Online]. Available: https://docs.pupil-labs.com/core/software/pupil-player/#analysis-plugins [Accessed 01022020].
GRAHAM, A. 2009. How important are commercial revenues to today's airports? Journal of Air Transport Management, 15, 106-111.
HUMPHREYS, I. 1999. Privatisation and commercialisation: changes in UK airport ownership patterns. Journal of Transport Geography, 7, 121-134.
MARTEL, F. O. 2009. External factors and their impact on non-aeronautical revenue. Journal of Airport Management, 3, 337-344.
MATSUO, S., HATORI, T. & FUKUDA, D. Evaluation of passenger flow lines in international airport terminals. Selected Proceedings of the 12th World Conference on Transport Research, 2010.
NIKOLAEVA, A. 2012. Designing public space for mobility: Contestation, negotiation and experiment at Amsterdam Airport Schiphol. Tijdschrift voor economische en sociale geografie, 103, 542-554.
OMAR, O. & KENT, A. 2001. International airport influences on impulsive shopping: Trait and normative approach. International Journal of Retail & Distribution Management, 29, 226-235.
ORTH, H., FREI, O. & WEIDMANN, U. 2015. Effects of non-aeronautical activities at airports on the public transport access system: A case study of Zurich Airport. Journal of Air Transport Management, 42, 37-46.
REIMERS, V. & CLULOW, V. 2004. Retail concentration: a comparison of spatial convenience in shopping strips and shopping centres. Journal of Retailing and Consumer services, 11, 207-221.

402
5
CHEN, H.-T. & CHAO, C.-C. 2015. Airline choice by passengers from Taiwan and China: Acase study of outgoing passengers from Kaohsiung International Airport. Journal ofAir Transport Management, 49, 53-63.
CRASK, M. R. 1979. A simulation model of patronage behavior within shopping centers. Decision Sciences, 10, 1-15.
DOGANIS, R. 2005. The airport business, Routledge.
ECONOMIST, T. 2014. The sixth continent; Airport shopping. The Economist, May 10, 2014, p.69.
EVANS, K. M., JACOBS, R. A., TARDUNO, J. A. & PELZ, J. B. 2012. Collecting and analyzing eye tracking data in outdoor environments. Journal of Eye MovementResearch, 5, 6.
FONG, A., HOFFMAN, D. & RATWANI, R. M. Making sense of mobile eye-tracking data in the real-world: A human-in-the-loop analysis approach. Proceedings of the Human Factors and Ergonomics Society Annual Meeting, 2016. SAGE Publications Sage CA:Los Angeles, CA, 1569-1573.
FREATHY, P. & O'CONNELL, F. 2012. Spending time, spending money: Passengersegmentation in an international airport. International Review of Retail, Distributionand Consumer Research, 22, 397-416.
GEUENS, M., VANTOMME, D. & BRENGMAN, M. 2004. Developing a typology ofairport shoppers. Tourism Management, 25, 615-622.
GMBH, P. L. 2020. User Guide [Online]. Available: https://docs.pupil-labs.com/core/software/pupil-player/#analysis-plugins [Accessed 01022020].
GRAHAM, A. 2009. How important are commercial revenues to today's airports? Journal ofAir Transport Management, 15, 106-111.
HUMPHREYS, I. 1999. Privatisation and commercialisation: changes in UK airportownership patterns. Journal of Transport Geography, 7, 121-134.
MARTEL, F. O. 2009. External factors and their impact on non-aeronautical revenue. Journalof Airport Management, 3, 337-344.
MATSUO, S., HATORI, T. & FUKUDA, D. Evaluation of passenger flow lines in international airport terminals. Selected Proceedings of the 12th World Conference on Transport Research, 2010.
NIKOLAEVA, A. 2012. Designing public space for mobility: Contestation, negotiation and experiment at Amsterdam Airport Schiphol. Tijdschrift voor economische en socialegeografie, 103, 542-554.
OMAR, O. & KENT, A. 2001. International airport influences on impulsive shopping: Traitand normative approach. International Journal of Retail & Distribution Management, 29, 226-235.
ORTH, H., FREI, O. & WEIDMANN, U. 2015. Effects of non-aeronautical activities at airports on the public transport access system: A case study of Zurich Airport. Journalof Air Transport Management, 42, 37-46.
REIMERS, V. & CLULOW, V. 2004. Retail concentration: a comparison of spatial convenience in shopping strips and shopping centres. Journal of Retailing and Consumer services, 11, 207-221.
6
ZHU, W. & TIMMERMANS, H. 2011. Modeling pedestrian shopping behavior using principles of bounded rationality: model comparison and validation. Journal of Geographical Systems, 13, 101-126.
Keywords*Airport Retail, Shopping Strategy, Passenger Movement, Eye Tracking, Passenger Shopping Behaviour,
403
1
THE ROLE OF TRUST IN ONLINE SHOPPING –AN INTERNATIONAL PERSPECTIVE
Katharina Maria HoferInstitute for Retailing, Sales and MarketingJohannes Kepler University Linz, Austria
Michaela LugerInstitute for Retailing, Sales and MarketingJohannes Kepler University Linz, Austria
IntroductionIn recent years, the number of consumers shopping through the internet has increased steadily, which led to the growing importance of digital distribution channels for firms in a huge number of industries. Advances in information and communication technologies have facilitated the development of digital channels and e-commerce. Thus, shopper behavior has changed (Teller et al., 2019), with trust playing a central role in the online shopping behavior of consumers (Kim and Peterson, 2017). However, online trust was found to differ considerably from offline trust (Bart et al., 2005). Furthermore, in a world that is increasingly globally integrated, an international approach to the topic is promising.
Purpose*Consumer trust is a vital consideration for the success of digital distribution channels. In the online environment, the building of trust poses a challenge to firms, as trust plays a more critical role in digital distribution channels in comparison to the traditional retail environment. The website is the communication interface with the customer, and direct contact between firm and customer is lacking, raising issues of security and risk. Thus, this study investigates antecedents of consumer trust in online shopping based on the technology acceptance model (Davis, 1989), and the effect of trust on purchase intention in two different countries, i.e. Austria and the Republic of Moldova. Austria is an advanced industrialized market and a member of the European Union (EU). Moldova is a member of the Central European Free Trade Agreement (CEFTA) and has a mixed economic system that includes a variety of private freedom, combined with centralized economic planning and government regulation(Michigan State University, 2020). While numerous studies of trust in online shopping are available either in advanced or in emerging markets (e.g., Bianchi and Andrews, 2012), only few studies have employed a perspective across different markets (e.g. Ashraf et al., 2014).Thus, this paper contributes to the literature on trust in online shopping by contrasting both advanced and emerging markets in one empirical study.
Conceptual framework
404
1
THE ROLE OF TRUST IN ONLINE SHOPPING –AN INTERNATIONAL PERSPECTIVE
Katharina Maria HoferInstitute for Retailing, Sales and MarketingJohannes Kepler University Linz, Austria
Michaela LugerInstitute for Retailing, Sales and MarketingJohannes Kepler University Linz, Austria
IntroductionIn recent years, the number of consumers shopping through the internet has increased steadily, which led to the growing importance of digital distribution channels for firms in a hugenumber of industries. Advances in information and communication technologies have facilitated the development of digital channels and e-commerce. Thus, shopper behavior haschanged (Teller et al., 2019), with trust playing a central role in the online shopping behaviorof consumers (Kim and Peterson, 2017). However, online trust was found to differconsiderably from offline trust (Bart et al., 2005). Furthermore, in a world that is increasinglyglobally integrated, an international approach to the topic is promising.
Purpose*Consumer trust is a vital consideration for the success of digital distribution channels. In theonline environment, the building of trust poses a challenge to firms, as trust plays a more critical role in digital distribution channels in comparison to the traditional retail environment. The website is the communication interface with the customer, and direct contact between firm and customer is lacking, raising issues of security and risk. Thus, this study investigatesantecedents of consumer trust in online shopping based on the technology acceptance model(Davis, 1989), and the effect of trust on purchase intention in two different countries, i.e. Austria and the Republic of Moldova. Austria is an advanced industrialized market and amember of the European Union (EU). Moldova is a member of the Central European Free Trade Agreement (CEFTA) and has a mixed economic system that includes a variety ofprivate freedom, combined with centralized economic planning and government regulation(Michigan State University, 2020). While numerous studies of trust in online shopping areavailable either in advanced or in emerging markets (e.g., Bianchi and Andrews, 2012), onlyfew studies have employed a perspective across different markets (e.g. Ashraf et al., 2014).Thus, this paper contributes to the literature on trust in online shopping by contrasting both advanced and emerging markets in one empirical study.
Conceptual framework
2
In contrast to offline trust, online trust focuses on the Internet, the website or the technology. The website of a firm can thus be regarded as a store when it comes to the development of consumer trust (Bart et al., 2005). Trust can be defined as “a psychological state comprising the intention to accept vulnerability based on positive expectations of the intentions or behaviors of another” (Rousseau et al., 1998, p. 395). This definition has been widely accepted in the literature (e.g. Bart et al., 2005). Our study is based on the technology acceptance model (TAM) by Davis (1989) and other theoretical considerations (e.g. Mayer et al., 1995; Gefen et al., 2003; Weng, 2015). We consider consumer experience, perceived company reputation, perceived website quality and perceived security as antecedent factors of building trust (H1-H4). Furthermore, we investigate the role of perceived risk, assuming that trust in online shopping reduces perceived risk (H5), which is important as perceived risk reduces consumers’ purchase intention (H6). Finally, we hypothesize that trust in onlineshopping has a positive influence on consumers’ purchase intention (H7). This leads to the following hypotheses:
H1: Experience has a positive influence on trust in online shopping.H2: Perceived reputation has a positive influence on trust in online shopping.H3: Perceived website quality has a positive influence on trust in online shopping.H4: Perceived security has a positive influence on trust in online shopping.H5: Trust in online shopping has a negative influence on perceived risk.H6: Perceived risk has a negative influence on purchase intention.H7: Trust in online shopping has a positive influence on purchase intention.
Design/methodology/approach*We test our hypotheses employing a quantitative, survey-based approach using an online questionnaire. A random sample among consumers in the two countries of Austria and Moldova yielded a total of 602 usable responses. 397 responses came from Austria, and 205 from Moldova. For construct measurement we adopted scales that had been previously validated in the literature. We used five-point Likert scales ranging from 1=”strongly disagree” to 5=”strongly agree”. In order to test our hypotheses, we analysed our data through structural equation modeling, particularly PLS path modeling. It is a multivariate data technique widely applied in the academic literature. This choice is based on the advantageous suitability when predicting and testing theoretical frameworks with complex structural models. Our PLS-SEM analysis includes the evaluation of the measurement model and the assessment of the structural model (Hair et al., 2019).
Findings*We evaluated the measurement model following the procedure suggested by Hair et al.(2019). Two items of the construct risk perception had to be eliminated because of loadings under the critical threshold of 0.4. All other factor loadings exhibit sufficient levels of convergent validity. Furthermore, all AVE values are at or above the critical value of 0.5, which underlines convergent validity. The next step was the assessment of internal consistency reliability, which is measured through composite reliability and Cronbach´s alpha. The composite reliability of the total sample ranged from 0.85 to 0.97. Although Hair et al. (2019) mention reliability values above 0.95 could be problematic, the authors emphasize that there is only one construct above this threshold. Furthermore, all constructs of the total sample exhibit sufficient levels of Cronbach´s alpha values exceeding the minimum
405
3
level of 0.7. Next, the authors employed heterotrait-monotrait (HTMT) ratio of correlations for discriminant validity assessment (Henseler et al., 2015). Five values of the total sample are above the threshold value of 0.90, however the inspection of the Austrian and Moldova measurement model shows all values within the acceptable range. Hence, the authors decided to move on with the evaluation of the structural model.
The assessment of the structural model involves the coefficient of determination (R2) and the path coefficients for evaluating of the statistical significance path coefficients based on thebootstrapping procedure with 5000 subsamples. The results of the structural model of the total sample reveal that perceived company reputation (p=0.508***), perceived security(p=0.220***) and perceived website quality (p=0.189***) have a positive influence on consumer trust in online shopping (R2=0.834). Thus, H2, H3 and H 4 are supported. The relationship between consumer experience and trust in online shopping (H1) could not be supported (p=0.065ns). Furthermore, the positive effect of trust on purchase intention became evident (p=0.824***; R2=0.670), leading us to support H7. We also analyzed the role of perceived risk and found support for the negative relationship between trust and perceived risk (p=-0.199***) as well as perceived risk and purchase intention (p=-0.054*), supporting both H5 and H6.
Finally, we employed PLS Multi-Group Analysis (PLS-MGA), a non-parametric significance test for differences of group-specific results. The difference between groups is significant if the p-value is smaller than 0.05 or larger than 0.95 (SmartPLS, 2019). Thus, a significant difference between Austria and Moldova according to the influence of experience (p=0.0029) and perceived website quality (p=0.9963) on trust in online shopping is observed. In the Austrian subsample, experience does have a positive influence on trust as opposed to a non-significant path of the relationship in the Moldovan sample. In Moldova perceived website quality has a positive influence on trust, as opposed to a non-significant path in the Austrian subsample. All tables are available from the authors upon request.
Original/value*In a globalized economy, the importance of digital channels has been increasing steadily, and at the same time the dynamic environment of the firm is changing constantly. Thus, up-to-date studies are necessary to investigate the central construct of consumer trust in online shopping in various settings to account for potential differences across markets. This study proposes a conceptual model of antecedents and consequences of consumer trust in onlineshopping and tests this model in two markets characterized by different institutional contexts.The results of the empirical analysis support a number of hypotheses and show differences across markets, thus advancing the literature on services marketing and international business.Given the paucity of cross-national empirical studies on trust in an online shopping environment, this paper contributes to the literature by identifying specifics regarding advanced vis-a-vis emerging markets.
Practical implicationsFor firms engaging in e-commerce it is central to keep the promises made and to enhance trust in order to increase sales through their online stores. Thus, building company reputation through measures such as external communication and facilitating word-of-mouth is advisable. Firms can further increase consumer trust by investing in the quality of the website as well as highlighting perceived security by securing data protection, especially in terms of payment. Trust can also serve as a means to decrease perceived risk among consumers and
406
3
level of 0.7. Next, the authors employed heterotrait-monotrait (HTMT) ratio of correlationsfor discriminant validity assessment (Henseler et al., 2015). Five values of the total sampleare above the threshold value of 0.90, however the inspection of the Austrian and Moldovameasurement model shows all values within the acceptable range. Hence, the authors decidedto move on with the evaluation of the structural model.
The assessment of the structural model involves the coefficient of determination (R2) and the path coefficients for evaluating of the statistical significance path coefficients based on thebootstrapping procedure with 5000 subsamples. The results of the structural model of the total sample reveal that perceived company reputation (p=0.508***), perceived security(p=0.220***) and perceived website quality (p=0.189***) have a positive influence on consumer trust in online shopping (R2=0.834). Thus, H2, H3 and H 4 are supported. The relationship between consumer experience and trust in online shopping (H1) could not besupported (p=0.065ns). Furthermore, the positive effect of trust on purchase intention becameevident (p=0.824***; R2=0.670), leading us to support H7. We also analyzed the role ofperceived risk and found support for the negative relationship between trust and perceivedrisk (p=-0.199***) as well as perceived risk and purchase intention (p=-0.054*), supportingboth H5 and H6.
Finally, we employed PLS Multi-Group Analysis (PLS-MGA), a non-parametric significancetest for differences of group-specific results. The difference between groups is significant if the p-value is smaller than 0.05 or larger than 0.95 (SmartPLS, 2019). Thus, a significantdifference between Austria and Moldova according to the influence of experience (p=0.0029)and perceived website quality (p=0.9963) on trust in online shopping is observed. In theAustrian subsample, experience does have a positive influence on trust as opposed to a non-significant path of the relationship in the Moldovan sample. In Moldova perceived websitequality has a positive influence on trust, as opposed to a non-significant path in the Austrian subsample. All tables are available from the authors upon request.
Original/value*In a globalized economy, the importance of digital channels has been increasing steadily, andat the same time the dynamic environment of the firm is changing constantly. Thus, up-to-date studies are necessary to investigate the central construct of consumer trust in onlineshopping in various settings to account for potential differences across markets. This studyproposes a conceptual model of antecedents and consequences of consumer trust in onlineshopping and tests this model in two markets characterized by different institutional contexts.The results of the empirical analysis support a number of hypotheses and show differencesacross markets, thus advancing the literature on services marketing and international business.Given the paucity of cross-national empirical studies on trust in an online shoppingenvironment, this paper contributes to the literature by identifying specifics regardingadvanced vis-a-vis emerging markets.
Practical implicationsFor firms engaging in e-commerce it is central to keep the promises made and to enhance trustin order to increase sales through their online stores. Thus, building company reputation through measures such as external communication and facilitating word-of-mouth is advisable. Firms can further increase consumer trust by investing in the quality of the websiteas well as highlighting perceived security by securing data protection, especially in terms ofpayment. Trust can also serve as a means to decrease perceived risk among consumers and
4
reduce negative effects of risk in terms of purchase behavior. For customer experience,managers should take a differentiated view, as it varies significantly between markets.
Research limitations and outlookWe have not yet tested for measurement invariance, which we plan as the next step in the further development of the paper. We employed a cross-sectional research design; however, a longitudinal study would be an interesting avenue for future research. The empirical setting of the study included a Western European country representing an industrialized, advanced market, and an Eastern European market in the status of transition. Future research could incorporate consumers in other European or non-European markets, further contributing to the generalizability of results. Finally, although our sample included people from all age groups, there is a slight bias towards younger people.
References*Ashraf, A. R., Thongpapanl, N., and Auh, S., (2014), “The Application of the Technology Acceptance Model under Different Cultural Contexts: The Case of Online Shopping Adoption”, Journal of International Marketing, 22 (3), 68-93.
Bart, Y., Shankar, V., Sultan, F., and Urban, G. L., (2005), “Are the Drivers and Role of Online Trust the Same for All Web Sites and Consumers? A Large-Scale Exploratory Empirical Study”, Journal of Marketing, 69, 133-152.
Bianchi, C., and Andrews, L. (2012), “Risk, trust and consumer online purchasing behavior: a Chilean perspective”, International Marketing Review, 29 (3), 253-276.
Davis, F. D., (1989), “Perceived usefulness, perceived ease of use, and user acceptance of information technology”, MIS Quarterly, 13, 319-339.
Gefen, D., Karahanna, E., and Straub, D. W., (2003), “Trust and TAM in online shopping: an integrated model”, MIS Quarterly, 27 (1), 51-90.
Hair, J. F., Risher, J. J., Sarstedt, M., and Ringle, C. M. (2019), “When to use and how to report the results of PLS-SEM”, European Business Review, 31 (1), S. 2-24.
Henseler, J., Ringle, C. M., and Sarstedt, M. (2015), “A new criterion for assessing discriminant validity in variance-based structural equation modelling”, Journal of the Academy of Marketing Science, 43, S. 115-135.
Kim, Y., and Peterson, R.A. (2017), “A Meta-analysis of Online Trust Relationships in E-commerce”, Journal of Interactive Marketing, 38, 44-54.
Mayer, R. C., Davis, J. H., and Schoorman, F. D., (1995), “An integrative model of organizational trust”, Academy of Management Review, 20 (3), 709-734.
Michigan State University (2020), “globalEdge”, available at:https://globaledge.msu.edu/countries/moldova (accessed 17 January 2020).
Rousseau, D. M., Bitkin, S. B., Burt, R. S., and Camerer, C., (1998), “Not So Different After All: A Cross-Discipline View of Trust,” Academy of Management Review, 23 (3), 393–404.
SmartPLS GmbH (2019), “Multigroup Analysis (MGA)”, available at: https://www.smartpls.com/documentation/algorithms-and-techniques/multigroup-analysis,(accessed 27 August 2019).
407
5
Teller, C., Brusset, X., and Kotzab, H. (2019), “Physical and digital market places – where marketing meets operations“, International Journal of Retail & Distribution Management, 47 (12), 1225-1231.Weng, M. L., (2015), "Antecedents and consequences of e-shopping: an integrated model", Internet Research, 25(2), 184 – 217.
AcknowledgementsWe cordially thank Elisabeth Brugger and Ana Slanina for their assistance in the data collection.Furthermore, we are tremendously grateful to Prof. Marta Frasquet and Prof. Christoph Teller for their valuable support.
AppendixKeywords*Trust, online shopping, consumer perceptions, international, purchase intention
408
1
ADEQUATE PRICING, USING BRANDING ELEMENTS
Author Details
Dr. Benedikt Lindenbeck
University of Hagen, Hagen, Germany
Structured Abstract
Purpose—Because consumer goods manufacturers and retailers operate in highly
competitive environments, their market survival requires them to offer products at reasonable
prices. Fur-thermore, using advertising leaflets and targeted marking elements provides
channels and op-portunities to promote high-quality products at appropriate prices. Therefore,
through an in-vestigation of the retail furniture industry, this article proposes and develops an
operationali-zation of key branding elements in advertising leaflets.
Design/approach—This study uses real data gathered from the German furniture industry
and an empirical investigation of optimal designs for the layout of advertising leaflets, with
regard to presenting price information.
Findings—Both manufacturers and retailers in the consumer goods industry can design ads
specifically to enable them to charge lower or higher prices. To develop these designs appro-
priately, they should conduct company-specific analyses, which offers a complement to cross-
company perspectives.
Originality— This study introduces a clear operationalization of advertising leaflets and the
branding elements contained therein. In contrast with prior research, this article presents a
comprehensive consideration of the activities represented by advertising leaflets, from the
409
5
Teller, C., Brusset, X., and Kotzab, H. (2019), “Physical and digital market places – wheremarketing meets operations“, International Journal of Retail & Distribution Management, 47 (12), 1225-1231.Weng, M. L., (2015), "Antecedents and consequences of e-shopping: an integrated model",Internet Research, 25(2), 184 – 217.
AcknowledgementsWe cordially thank Elisabeth Brugger and Ana Slanina for their assistance in the data collection.Furthermore, we are tremendously grateful to Prof. Marta Frasquet and Prof. Christoph Tellerfor their valuable support.
AppendixKeywords*Trust, online shopping, consumer perceptions, international, purchase intention
2
point of view of the companies conducting the advertising. In addition to a cross-company
analysis, this study provides an in-depth consideration of the respective companies, as real-
world example.
Keywords
branding strategy; consumer goods; retail market; path analysis; advertising leaflets
Introduction
Manufacturers and distributors of consumer goods function in highly competitive environ-
ments (Malysheva et al., 2016; Zaki et al., 2019), due to market saturation, variety-seeking
behaviours and preferences among consumers (Baltas et al., 2016; Jeong and Drolet, 2016;
Rubio et al., 2019; Yanine et al., 2019), and so forth. Therefore, it has become increasingly
important for both manufacturers and retailers to bind potential customers to their companies
and product offers, so that they can ensure their long-term survival in the market (Aktepe et
al., 2015; Szwajca, 2016; Ly and Loc, 2017). To do so, many firms rely heavily on branding
elements, including price strategies (Brexendorf et al., 2015; Olbrich et al., 2017), which they
might present through various advertising channels, such as leaflets.
By branding products, the sellers (both manufacturers that own the brands and retailers
that stock them) can achieve several notable benefits. In addition to signalling high, consistent
product quality, branding helps the sellers differentiate themselves effectively, through their
dedicated branding efforts (Pepe et al., 2012; ter Braak et al., 2013; Davcik and Sharma,
2015; Geyskens et al., 2018). In addition, manufacturers of branded products, which appear in
the retail locations of companies at the commercial level, can join indirect sales structures,
which should support product cross-sales. Yet it also is increasingly difficult for manufactur-
ers of branded products to position themselves prominently in retail market spaces, due to
410
3
high levels of saturation, especially if those brands are less appealing or recognisable to po-
tential buyers than competitive retail brands are.
In addition to branding as a means to bind customers to a seller, they might identify
price levels as a form of connection, assuming the required price meets their expectations
(David et al., 2017; Han et al., 2017). Specifically, customers require products that have suffi-
cient quality for the demanded price level, or else they demand that possessing these products
grants them a sense of social standing that also might justify the price (Zheng et al., 2012;
Gutsatz and Heine, 2018). Manufacturers and retailers of consumer goods can only remain in
the market in the long term if they succeed in justifying the prices they charge for their prod-
ucts.
In this context, this study seeks to identify and clarify how a company that manufac-
tures or distributes high-value consumer goods should position itself in the specific contexts
of advertising leaflets and in relation to its branding policy. In particular, this study asks, Is it
possible, according to a chosen brand strategy, to derive the price level that the company
should charge in exchange for its products?
To answer this question, the first step is to establish a clear operationalization of ad-
vertising leaflets and the marking elements that they contain. Using this operationalization, it
then becomes possible to examine which design features, in the context of this advertising ap-
proach, determine the appropriate, targeted price level. From this investigation, this article de-
rives specific, concrete implications and recommendations for how brand elements, including
the brand name and logo, should be shaped, how various design elements (e.g., the integration
of children, adults, and older persons in a display) influence the effects of different branding
elements and their use, and how the display itself should be designed. Therefore, the next sec-
tion outlines the methodology, which leads into the empirical results in the following section.
411
4
Finally, this article concludes with a discussion of some limitations, suggestions for further
research, and recommendations for appropriate actions in practical applications.
Methodology
The furniture industry is highly relevant to people’s daily lives, and purchases of furniture
generally evoke high levels of consumer involvement (e.g., Schoell et al., 1990; Lamb et al.,
2017; Kimmel, 2018). Most consumers seek to meet their furniture needs by visiting retailers
instead of the manufacturers’ showrooms directly (Statista, 2018a; Statista, 2018b). Accord-
ingly, these highly involved customers’ preferences for specific brands likely are acquired
through their experiences and product research, rather than formed ex ante (Thaichon and
Quach, 2015; Chevtchouk et al., 2017).
This empirical investigation starts with a review of 89 advertising leaflets from five
actual furniture retailers. The advertising leaflets were published between summer 2018 and
summer 2019, and the collected leaflets advertised 3,909 products. The advertised products
represent a wide range of different furniture. The cheapest product in the panel is a chair that
costs € 29. The most expensive chair, on the other hand, costs € 1,499. The most expensive
product in the panel is a wall unit that costs € 4,990. The cheapest wall unit, on the other
hand, costs € 149.
The collected leaflets contain 1,259 ad presentations. The ads identify 81 different
brands; some of them do not include any branding elements though. The five trading compa-
nies that published the leaflets together maintain 24 stores, all of which adopt a regional con-
centration strategy. These dealers are all located in North Rhine-Westphalia, the most popu-
lous federal state in Germany, so in a geographic sense, they compete directly with one an-
other. This study only includes those dealers that provide comprehensive retail advice and ser-
vices, such that it excludes furniture discounters, whose strategies generally do not align with
412
5
the goals of, and thus are not preferred retail partners of, manufacturers of high-end, branded
furniture (Ngobo, 2011; Babita et al., 2012).
To operationalize these advertisements in advertising leaflets, as the first step in the
research process, this study begins with descriptive evaluations. Then, to deduce practical im-
plications for designing advertisements that appropriately correspond with the price level
charged for the advertised products, as the second research objective, this study performs path
analyses. Specifically, path analyses offer statistical options for empirically testing the valid-
ity of complex causal relationships (Wright, 1921). They also are suitable for quantifying cor-
relations and graphically representing the results of corresponding assessments (e.g., Linden-
beck and Olbrich, 2018). With these approaches, the next section presents an aggregated con-
sideration of all companies and their advertising; then a more in-depth consideration offers
clearer insights into company-specific features.
Findings
Operationalization of Advertising Leaflets
To operationalize the uses of marking elements in the advertising leaflets, as well as integrate
additional panel data, this study differentiates the variables represented by the panel data ac-
cording to the objective of the examination, namely, whether they refer to branding elements
within a display, the representation of persons in the display, or the display itself. The corre-
sponding values then function as the exogenous variables in the path model. In line with the
primary research objectives, the price offered is the only endogenous variable included in the
model. Table 1 lists all the variables.
Variable Description Min. Max. Median
Branding Elements
Size of branding elements Size of branding elements in square centimetres 0.00 15.21 2.24
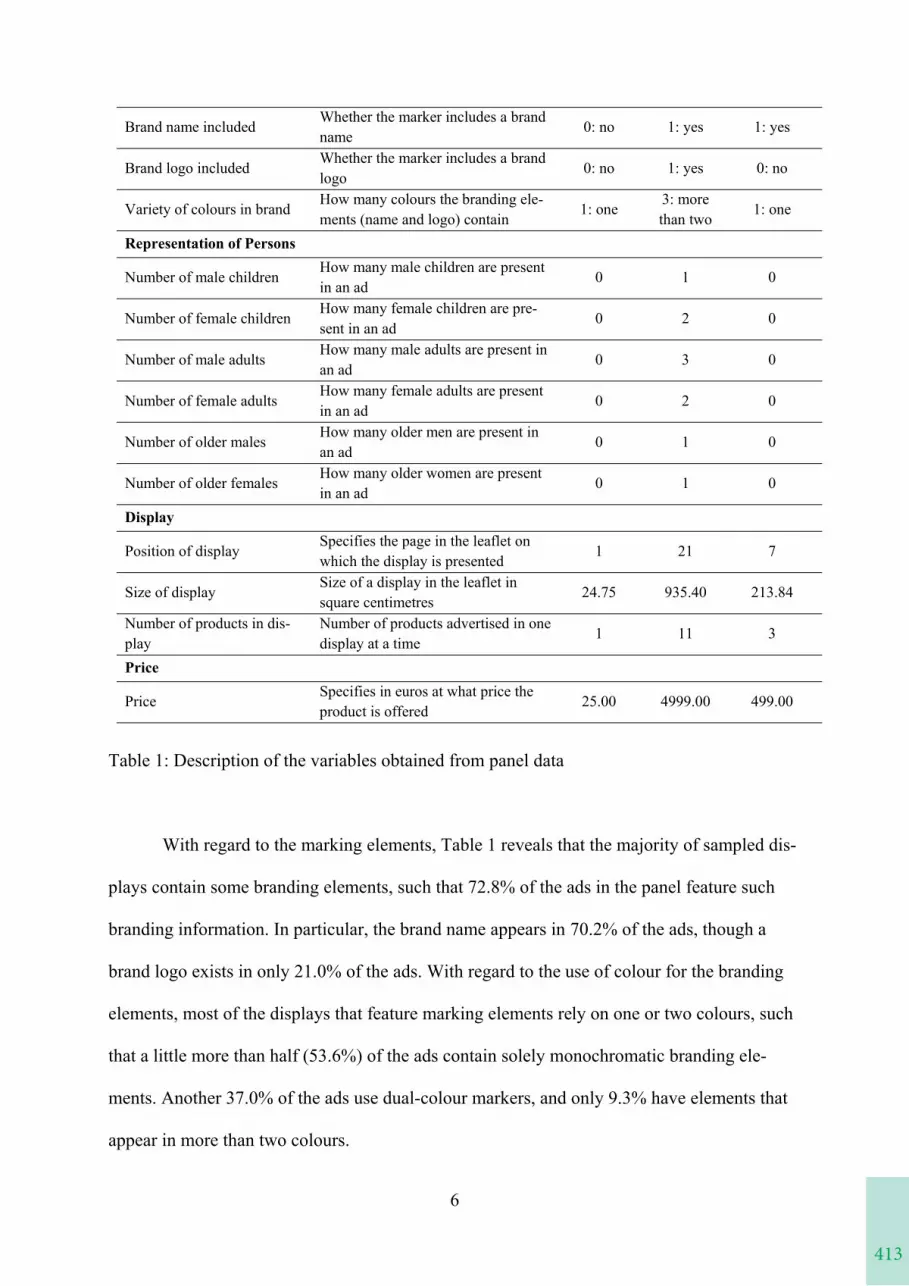
413
6
Brand name included Whether the marker includes a brand name 0: no 1: yes 1: yes
Brand logo included Whether the marker includes a brand logo 0: no 1: yes 0: no
Variety of colours in brand How many colours the branding ele-ments (name and logo) contain 1: one 3: more
than two 1: one
Representation of Persons
Number of male children How many male children are present in an ad 0 1 0
Number of female children How many female children are pre-sent in an ad 0 2 0
Number of male adults How many male adults are present in an ad 0 3 0
Number of female adults How many female adults are present in an ad 0 2 0
Number of older males How many older men are present in an ad 0 1 0
Number of older females How many older women are present in an ad 0 1 0
Display
Position of display Specifies the page in the leaflet on which the display is presented 1 21 7
Size of display Size of a display in the leaflet in square centimetres 24.75 935.40 213.84
Number of products in dis-play
Number of products advertised in one display at a time 1 11 3
Price
Price Specifies in euros at what price the product is offered 25.00 4999.00 499.00
Table 1: Description of the variables obtained from panel data
With regard to the marking elements, Table 1 reveals that the majority of sampled dis-
plays contain some branding elements, such that 72.8% of the ads in the panel feature such
branding information. In particular, the brand name appears in 70.2% of the ads, though a
brand logo exists in only 21.0% of the ads. With regard to the use of colour for the branding
elements, most of the displays that feature marking elements rely on one or two colours, such
that a little more than half (53.6%) of the ads contain solely monochromatic branding ele-
ments. Another 37.0% of the ads use dual-colour markers, and only 9.3% have elements that
appear in more than two colours.
414
7
Featuring people in the advertisements is relatively sporadic: 63.5% of the products
advertised do not show any people in the ad, using the advertised furniture. Another 27.6% of
the advertising for these products includes only one person; 7.9% of the products are adver-
tised with two people. More than two people appear in marketing for only 1% of the products.
In addition, women are shown more frequently than men, and adults are shown more fre-
quently than either children or older persons.
In terms of the combination of products, in approximately one-third of the displays
(31%), a single product is featured alone. In 18.9% of the advertisements, two products ap-
pear together. Then slightly less than half of the advertisements, combined, include three
(13.4%), four (11.9%), five (7.4%), six (6.4%), or seven (1.5%) products. Eight to eleven
products are advertised in the remaining 10.0% of the displays.
These detailed findings and the corresponding values for the branding elements are
relevant for deriving appropriate recommendations for action. Notably, branding elements
conventionally are designed by the product manufacturer, then made available to sellers, re-
tailers, and dealers of these products. The appearance of models and people in the ads simi-
larly tend to be chosen and determined by the manufacturer. The manufacturers then provide
the retailers with pictures of their products and the chosen models for use in their promotional
activities, so they can decide how many people and pieces of furniture to include in their ad-
vertising. However, with regard to the price, in the panel used for this study, the retailer has
exclusive rights to determine the precise amount. In Germany, a legal ban on vertical price
maintenance prohibits manufacturers from pre-setting or establishing required prices for the
dealers that sell their products (Schöning, 2015).
Influence of Marking Elements on Prices
For the second research objective, assessed on the basis of a path analysis, a necessary first
step checks for multicollinearity among the variables that get integrated as the independent
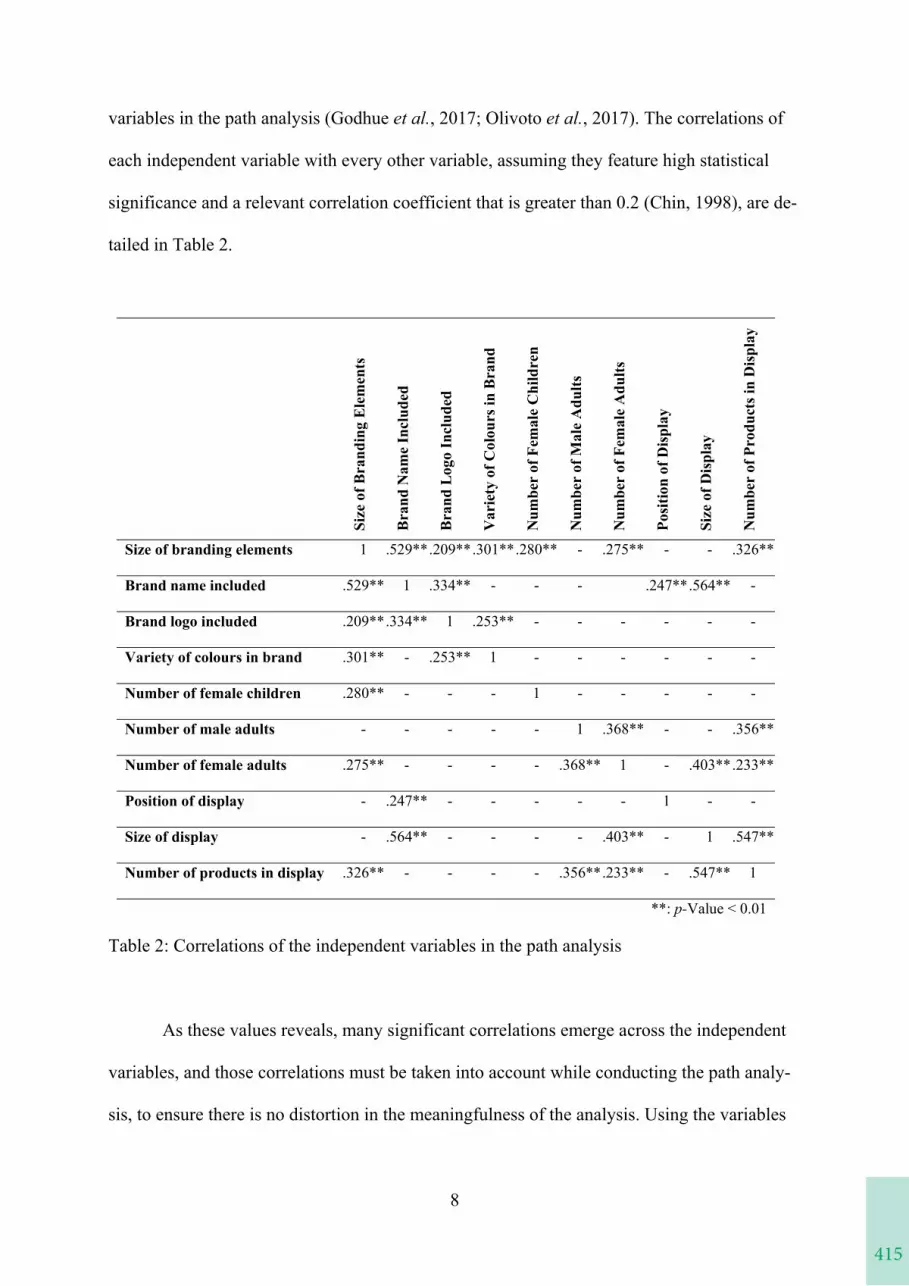
415
8
variables in the path analysis (Godhue et al., 2017; Olivoto et al., 2017). The correlations of
each independent variable with every other variable, assuming they feature high statistical
significance and a relevant correlation coefficient that is greater than 0.2 (Chin, 1998), are de-
tailed in Table 2.
Size
of B
rand
ing
Elem
ents
Bran
d N
ame
Incl
uded
Bran
d Lo
go In
clud
ed
Var
iety
of C
olou
rs in
Bra
nd
Num
ber o
f Fem
ale C
hild
ren
Num
ber o
f Mal
e A
dults
Num
ber o
f Fem
ale A
dults
Posit
ion
of D
ispla
y
Size
of D
ispla
y
Num
ber o
f Pro
duct
s in
Disp
lay
Size of branding elements 1 .529** .209** .301** .280** - .275** - - .326**
Brand name included .529** 1 .334** - - - .247** .564** -
Brand logo included .209** .334** 1 .253** - - - - - -
Variety of colours in brand .301** - .253** 1 - - - - - -
Number of female children .280** - - - 1 - - - - -
Number of male adults - - - - - 1 .368** - - .356**
Number of female adults .275** - - - - .368** 1 - .403** .233**
Position of display - .247** - - - - - 1 - -
Size of display - .564** - - - - .403** - 1 .547**
Number of products in display .326** - - - - .356** .233** - .547** 1
**: p-Value < 0.01
Table 2: Correlations of the independent variables in the path analysis
As these values reveals, many significant correlations emerge across the independent
variables, and those correlations must be taken into account while conducting the path analy-
sis, to ensure there is no distortion in the meaningfulness of the analysis. Using the variables
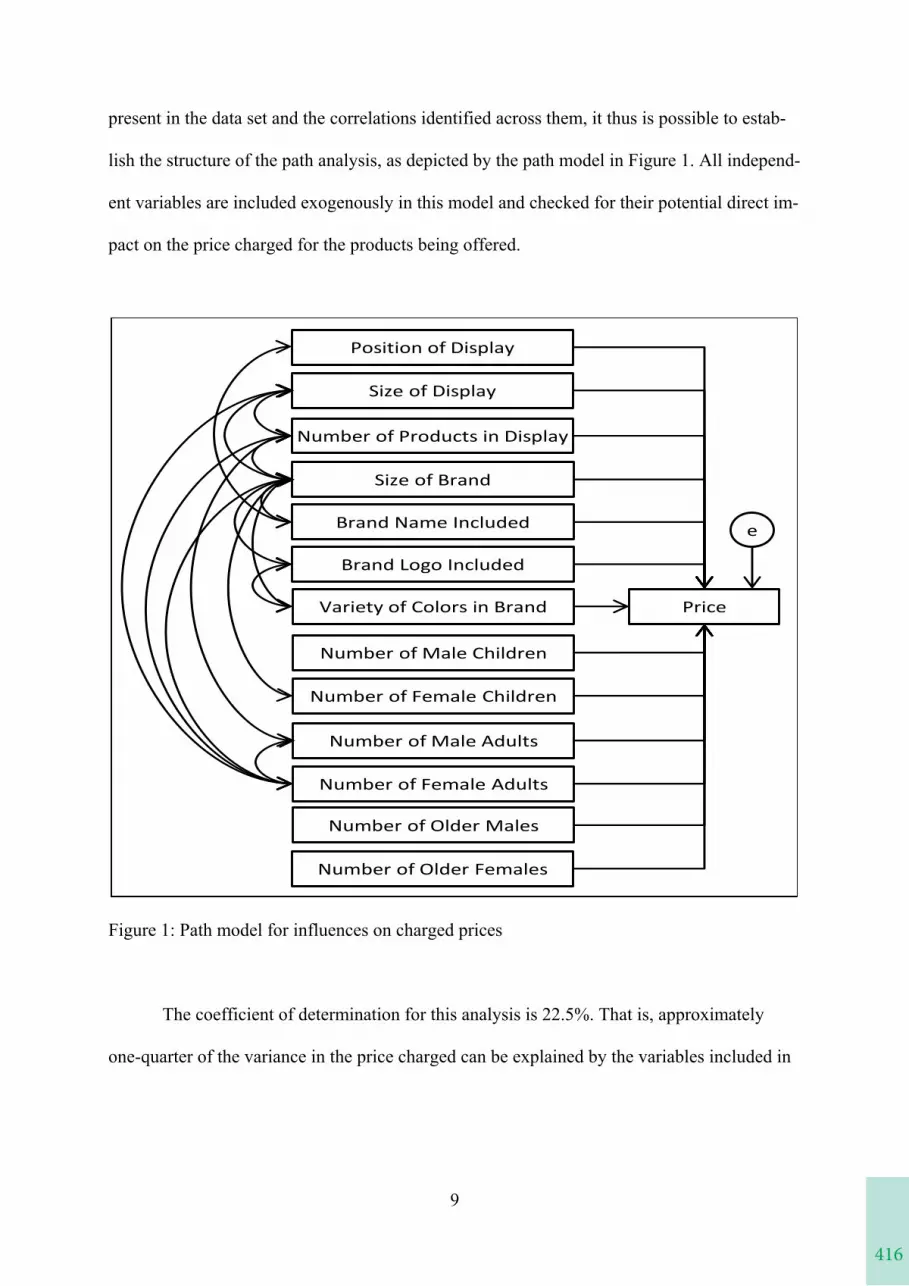
416
9
present in the data set and the correlations identified across them, it thus is possible to estab-
lish the structure of the path analysis, as depicted by the path model in Figure 1. All independ-
ent variables are included exogenously in this model and checked for their potential direct im-
pact on the price charged for the products being offered.
Figure 1: Path model for influences on charged prices
The coefficient of determination for this analysis is 22.5%. That is, approximately
one-quarter of the variance in the price charged can be explained by the variables included in
Number of Female Children
Number of Male Adults
Number of Female Adults
Number of Older Males
Number of Male Children
Number of Older Females
Size of Brand
Price
Brand Name Included
Brand Logo Included
Variety of Colors in Brand
Position of Display
Number of Products in Display
Size of Display
e

417
10
the proposed model. The standardized path coefficients, which reflect the effect of these vari-
ables on the charged price, are listed in Table 3, which also contains the standard deviations,
the value of the critical ratios, and significance values.
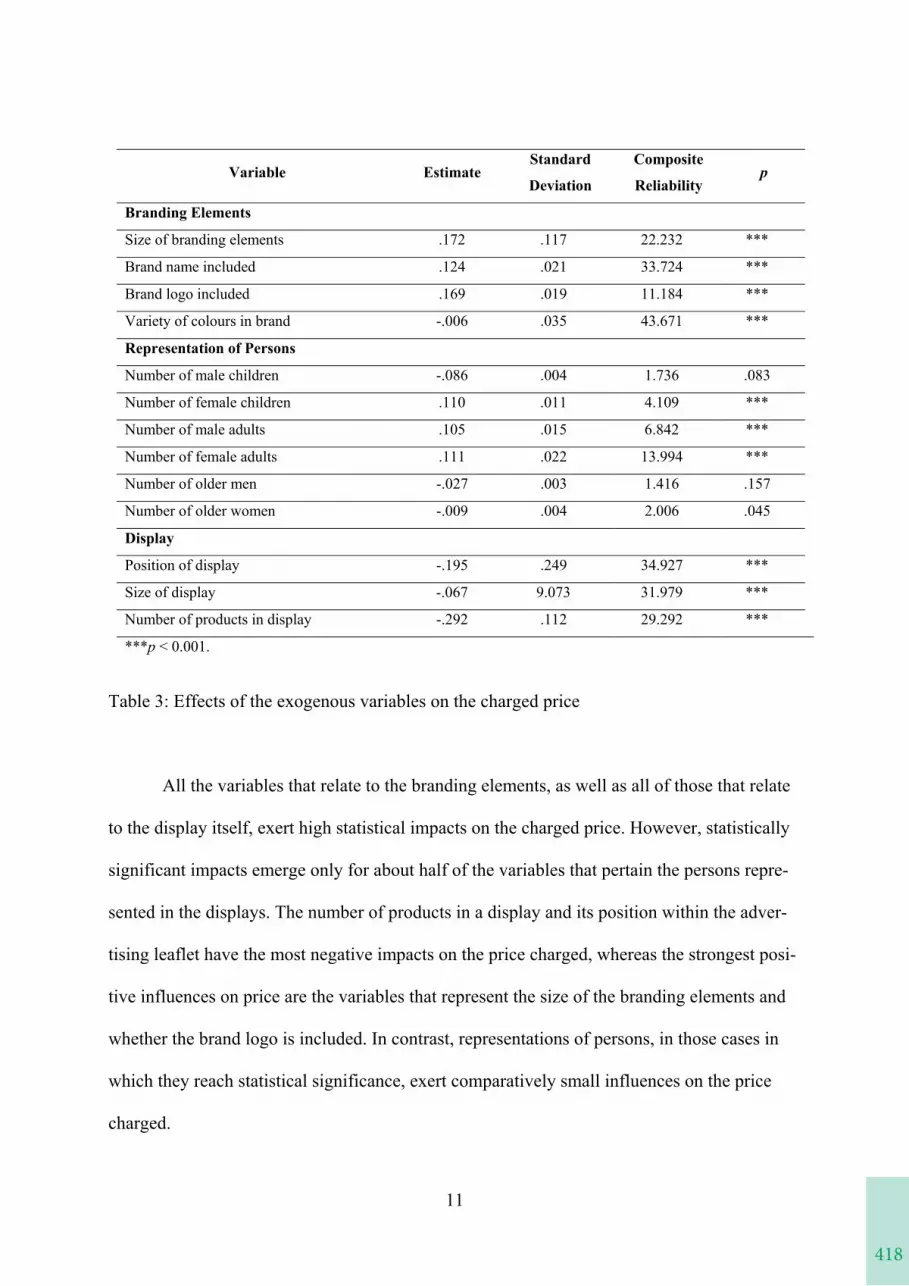
418
11
Variable Estimate Standard Deviation
Composite Reliability
p
Branding Elements
Size of branding elements .172 .117 22.232 ***
Brand name included .124 .021 33.724 ***
Brand logo included .169 .019 11.184 ***
Variety of colours in brand -.006 .035 43.671 ***
Representation of Persons
Number of male children -.086 .004 1.736 .083
Number of female children .110 .011 4.109 ***
Number of male adults .105 .015 6.842 ***
Number of female adults .111 .022 13.994 ***
Number of older men -.027 .003 1.416 .157
Number of older women -.009 .004 2.006 .045
Display
Position of display -.195 .249 34.927 ***
Size of display -.067 9.073 31.979 ***
Number of products in display -.292 .112 29.292 ***
***p < 0.001.
Table 3: Effects of the exogenous variables on the charged price
All the variables that relate to the branding elements, as well as all of those that relate
to the display itself, exert high statistical impacts on the charged price. However, statistically
significant impacts emerge only for about half of the variables that pertain the persons repre-
sented in the displays. The number of products in a display and its position within the adver-
tising leaflet have the most negative impacts on the price charged, whereas the strongest posi-
tive influences on price are the variables that represent the size of the branding elements and
whether the brand logo is included. In contrast, representations of persons, in those cases in
which they reach statistical significance, exert comparatively small influences on the price
charged.
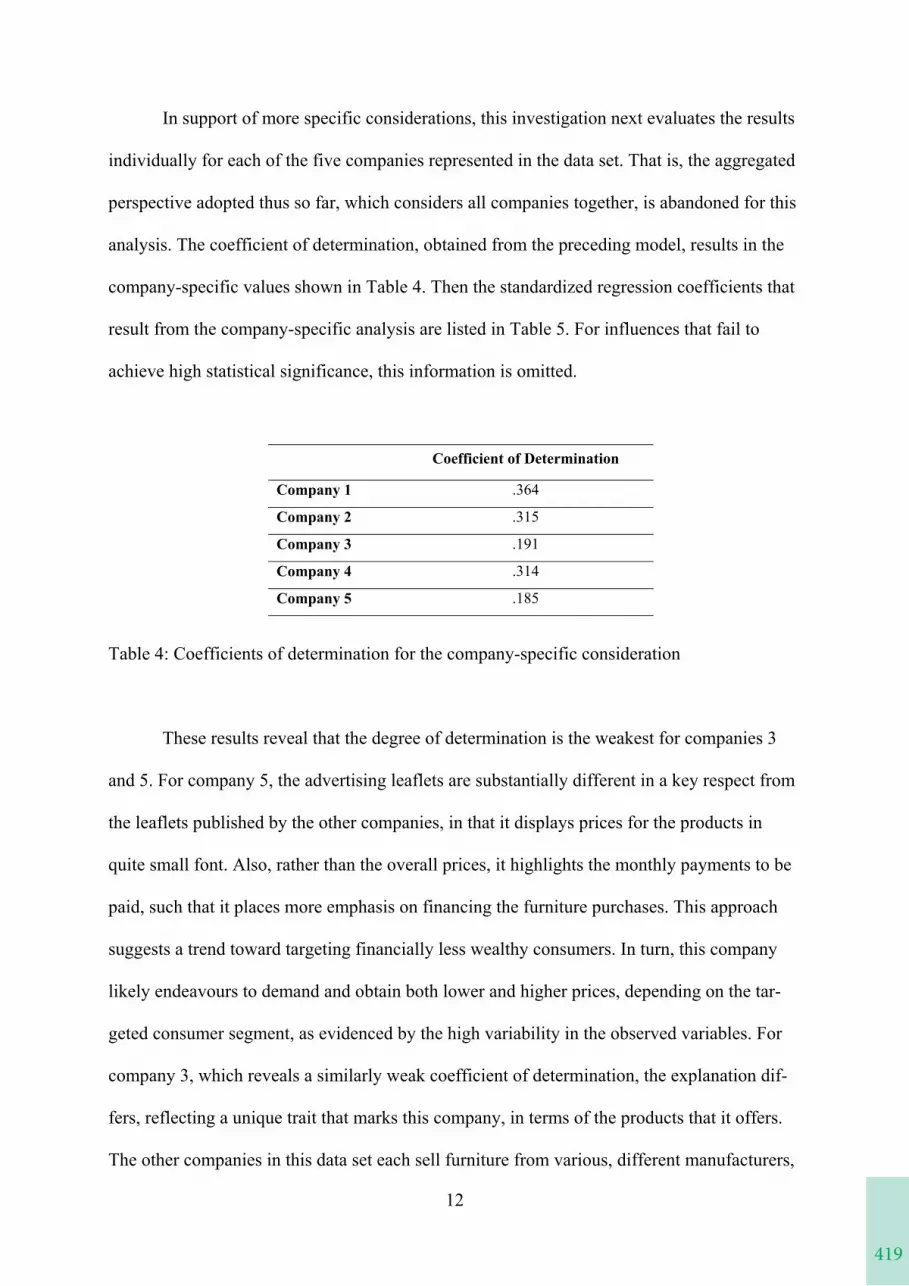
419
12
In support of more specific considerations, this investigation next evaluates the results
individually for each of the five companies represented in the data set. That is, the aggregated
perspective adopted thus so far, which considers all companies together, is abandoned for this
analysis. The coefficient of determination, obtained from the preceding model, results in the
company-specific values shown in Table 4. Then the standardized regression coefficients that
result from the company-specific analysis are listed in Table 5. For influences that fail to
achieve high statistical significance, this information is omitted.
Coefficient of Determination
Company 1 .364
Company 2 .315
Company 3 .191
Company 4 .314
Company 5 .185
Table 4: Coefficients of determination for the company-specific consideration
These results reveal that the degree of determination is the weakest for companies 3
and 5. For company 5, the advertising leaflets are substantially different in a key respect from
the leaflets published by the other companies, in that it displays prices for the products in
quite small font. Also, rather than the overall prices, it highlights the monthly payments to be
paid, such that it places more emphasis on financing the furniture purchases. This approach
suggests a trend toward targeting financially less wealthy consumers. In turn, this company
likely endeavours to demand and obtain both lower and higher prices, depending on the tar-
geted consumer segment, as evidenced by the high variability in the observed variables. For
company 3, which reveals a similarly weak coefficient of determination, the explanation dif-
fers, reflecting a unique trait that marks this company, in terms of the products that it offers.
The other companies in this data set each sell furniture from various, different manufacturers,
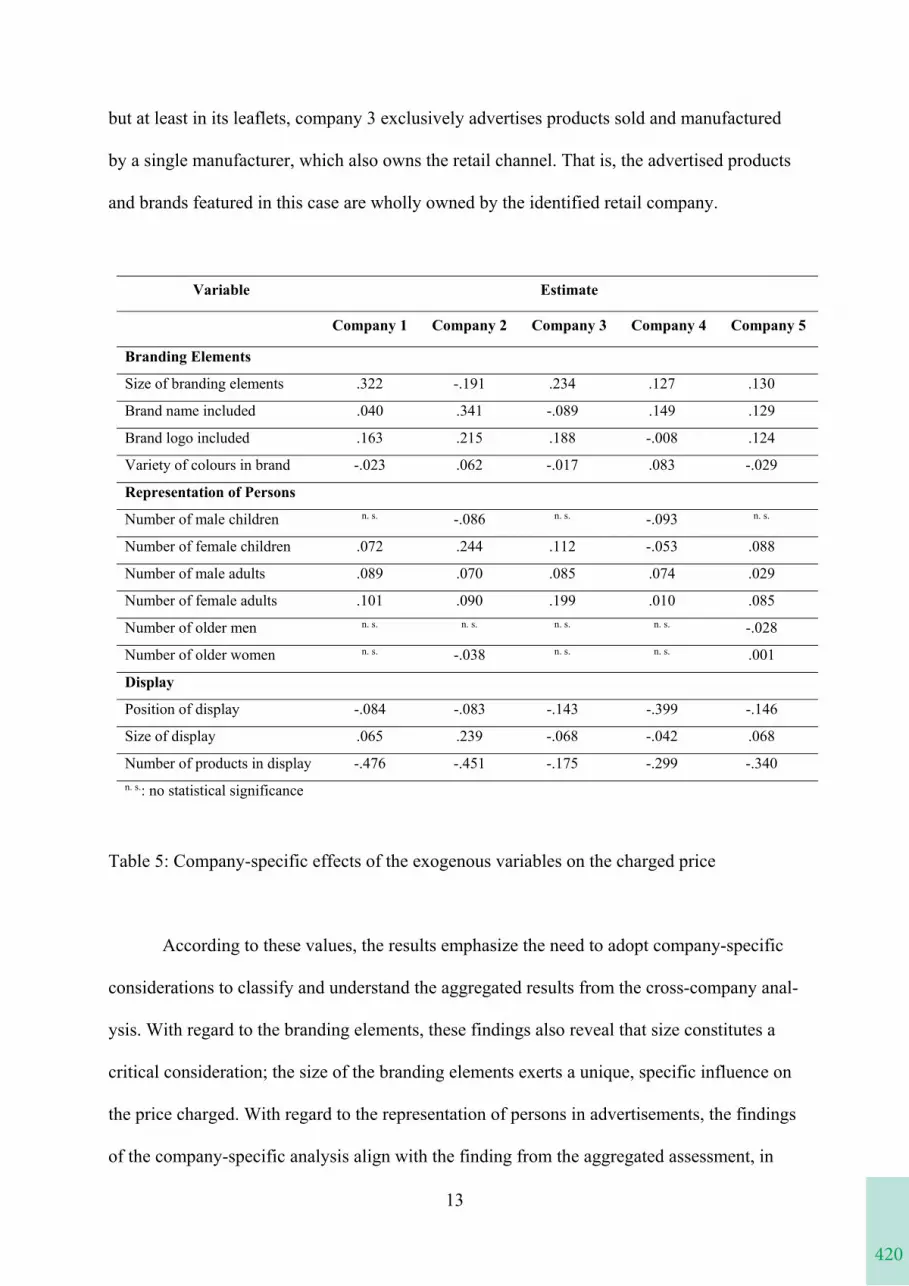
420
13
but at least in its leaflets, company 3 exclusively advertises products sold and manufactured
by a single manufacturer, which also owns the retail channel. That is, the advertised products
and brands featured in this case are wholly owned by the identified retail company.
Variable Estimate
Company 1 Company 2 Company 3 Company 4 Company 5
Branding Elements
Size of branding elements .322 -.191 .234 .127 .130
Brand name included .040 .341 -.089 .149 .129
Brand logo included .163 .215 .188 -.008 .124
Variety of colours in brand -.023 .062 -.017 .083 -.029
Representation of Persons
Number of male children n. s. -.086 n. s. -.093 n. s.
Number of female children .072 .244 .112 -.053 .088
Number of male adults .089 .070 .085 .074 .029
Number of female adults .101 .090 .199 .010 .085
Number of older men n. s. n. s. n. s. n. s. -.028
Number of older women n. s. -.038 n. s. n. s. .001
Display
Position of display -.084 -.083 -.143 -.399 -.146
Size of display .065 .239 -.068 -.042 .068
Number of products in display -.476 -.451 -.175 -.299 -.340 n. s.: no statistical significance
Table 5: Company-specific effects of the exogenous variables on the charged price
According to these values, the results emphasize the need to adopt company-specific
considerations to classify and understand the aggregated results from the cross-company anal-
ysis. With regard to the branding elements, these findings also reveal that size constitutes a
critical consideration; the size of the branding elements exerts a unique, specific influence on
the price charged. With regard to the representation of persons in advertisements, the findings
of the company-specific analysis align with the finding from the aggregated assessment, in
421
14
that it does not exert a significant influence on the price charged. Finally, for the displays
themselves, the results reveal that the number of products being offered simultaneously by the
presentation of the ad has a significant and negative impact on the price charged for that prod-
uct.
Implications for Manufacturers and Retailers
This study suggests valuable approaches to assessing brand strategies when they involve the
use of advertising leaflets, which are common marketing channels for various firms in con-
sumer goods industries, such as the furniture industry. Both retailers and manufacturers can
take valuable insights from these findings, regarding how they should design their advertise-
ments, both in collaboration and separately. Manufacturers should provide retailers with pro-
motional material that matches the price level that the retailer charges for their products. In
turn, retailers should design advertising leaflets in such a way that they appeal to and address
target and potential customers appropriately.
The empirical investigations reported herein indicate that the provided operationaliza-
tion of advertising leaflets is suitable for identifying dependencies between the use of brand-
ing elements and the charged price level. Depending on the price to be charged, companies
can use this operationalization to design their advertising leaflets. In particular, they should
adopt comparatively large branding elements to advertise products for which they charge high
prices. Both brand names and brand logos should be included in the displays. However, it ap-
pears to be irrelevant, with regard to the appropriateness of charging lower or higher prices,
whether the branding elements feature one, two, or more colours.
Moreover, the advertising can dispense with representations of people using the furni-
ture, because their presence or absence, as well as the number, ages, and genders of the people
being displayed, do not have sufficient influence on the prices of the advertised products to
422
15
justify the additional expense of hiring models to appear in the advertising. If the manufac-
turer insists on including people in the advertising, it is advisable to charge higher prices
when the display features female children or adult women.
Regarding the displays themselves, high prices are associated with fewer products fea-
tured within a single display. The position of the advertisement in the leaflet also should be as
close to the front as possible, if the retailer hopes to charge high prices for the advertised
product.
Limitations and Further Research
A weakness of this study arises because the investigated panel offers a limited representation
of, with limited insights into, the consumer goods industry. Even if just considering the furni-
ture industry, this study purposefully excludes discount chain stores, which usually feature
lower priced product ranges and also account for a significant portion of the market. Further
investigations thus should expand the market coverage, to help manufacturers determine how
they might tailor their branding strategies appropriately to achieve more market coverage.
Another limitation results from the analytical focus solely on advertising leaflets. To
gain insights into broader advertising implications, it may be worthwhile to include online of-
fers by retailers in related evaluations. To increase the representativeness of the study, another
worthwhile research extension might explicitly compare and highlight the differences be-
tween advertising in leaflets and advertising through in online offers. These differences might
make it possible for a retailer to target different groups, perhaps segmented according to their
willingness to pay, more accurately. The manufacturer then could differentiate its offer too
and provide retailers with different products that it knows will appeal to distinct target groups.
Finally, this analysis does not measure or account for the success of the advertise-
ments. Thus the results cannot specify which products sold more often, at which prices, due to
423
16
the advertising effects of the leaflets. Integrating such values in further investigations could
reveal which prices are more widely accepted by customers—and which ones are rejected.
References
Aktepe, A., Ersöz, S. and Toklu, B. (2015), “Customer satisfaction and loyalty analysis with
classification algorithms and Structural Equation Modeling”, Computers & Industrial Engi-
neering, Vol. 86 No. 1, pp. 95-106.
Babita, M., Gaur, A. and Ghalawat, S. (2012), “A Study of Factors Influencing Branded
Wears”, Globsyn Management Journal, Vol. 6 No. 1/2, pp. 31-39.
Baltas, G., Kokkinaki, F. and Loukopoulou, A. (2016), “Does variety seeking vary between
hedonic and utilitarian products? The role of attribute type”, Journal of Consumer Behav-
iour, Vol. 16 No. 6, pp. e1-e12.
Brexendorf, T.O., Bayus, B. and Keller, K.L. (2015), “Understanding the interplay between
brand and innovation management: findings and future research directions”, Journal of the
Academy of Marketing Science, Vol. 43 No. 5, pp. 548-557.
Chevtchouk, Y., Veloutsou, C. and Paton R. (2018), “The Process of Brand Experience: An
Interdisciplinary Perspective: An Abstract”, in Krey, N. and Rossi, P., Back to the Future:
Using Marketing Basics to Provide Customer Value proceedings of the Academy of Market-
ing Science Annual Conference in Coronado Island, USA, 2017, Springer, Cham, pp. 499-
500.
Chin, W.W. (1998), “Issues and opinion on structural equation modeling”, Management Infor-
mation Systems Quarterly, Vol. 22 No. 1, pp. 7-16.
Davcik, N.S. and Sharma, P. (2015), “Impact of product differentiation, marketing investments
and brand equity on pricing strategies: A brand level investigation”, European Journal of
Marketing, Vol. 49 No. 5/6, pp. 760-781.
424
17
David, M.E., Bearden, W.O. and Haws, K.L. (2017), “Priced just for me: The role of interper-
sonal attachment style on consumer responses to customized pricing”, Journal of Consumer
Behaviour, Vol. 16 No. 6, pp. e26-e37.
Geyskens, I., Keller, K.O., Dekimpe, M.G. and de Jong, K. (2018), “How to brand your private
labels”, Business Horizons, Vol. 61 No. 3, pp. 487-496.
Godhue, D.L., Lewis, W. and Thompson, R. (2017), “A Multicollinearity and Measurement
Error Statistical Blind Spot: Correcting for Excessive False Positives in Regression and
PLS”, MIS Quarterly, Vol. 41 No. 3, pp. 667-684.
Gutsatz, M. and Heine, K. (2018), “Is luxury expensive?”, Journal of Brand Management, Vol.
25 No. 5, pp. 411-423.
Han, J., Shen, Y. and Popkowski Leszczyc, P.T.L. (2017), “Short- and Long-run Competition
of Retailer Pricing Strategies”, International Journal of Business, Vol. 22 No. 2, pp. 125-
142.
Jeong, H.G. and Drolet, A. (2016), “Variety-seeking as an emotional coping strategy for chron-
ically indecisive consumers”, Marketing Letters, Vol. 27 No. 1, pp. 55-62.
Kimmel, A.J. (2018), Psychological Foundations of Marketing: The Keys to Consumer Behav-
ior (Second Edition), Taylor & Francis, New York, NY.
Lamb, C.W., Hair, J.F. and McDaniel, C. (2017), MKTG: Principles of Marketing, Cengage
Learning, Boston, MA.
Lindenbeck, B. and Olbrich, R. (2018), “Improving Targeting by Taking Long-Term Relation-
ships into Account”, in Rossi, P., Finding New Ways to Engage and Satisfy Global Custom-
ers proceedings of the Academy of Marketing Science World Marketing Congress in Porto,
Portugal, 2017, Springer, Cham, pp. 55-67.
425
18
Ly, P.T.M. and Loc, L.T. (2017), “The Relationship between Brand Experience, Brand Person-
ality and Customer Loyalty”, International Journal of Business and Economics, Vol. 16 No.
2, pp. 109-126.
Malysheva, T., Shinkevich, A., Kharisova, G., Nuretdinova, Y., Khasyanov, O., Nuretdinov, I.,
Zaitseva, N. and Kudryavtseva, S. (2016), “The Sustainable Development of Competitive
Enterprises through the Implementation of Innovative Development Strategy”, International
Journal of Economics and Financial Issues, Vol. 6 No. 1, pp. 185-191.
Ngobo, P.V. (2011), “Private label share, branding strategy and store loyalty”, Journal of Re-
tailing and Consumer Services, Vol. 18 No. 4, pp. 259-270.
Olbrich, R., Jansen, H.C. and Hundt, M. (2017), “Effects of pricing strategies and product qual-
ity on private label and national brand performance”, Journal of Retailing and Consumer
Services, Vol. 34 No. 1, pp. 294-301.
Olivoto, T., de Souza, V.Q., Nardino, M., Carvalho, I.R., Ferrari, M., de Pelegrin, A.J.,
Szareski, V.J. and Schmid, D. (2017), “Multicollinearity in Path Analysis: A Simple Method
to Reduce Its Effects”, Agronomy Journal, Vol. 109 No. 1, pp. 131-142.
Pepe, M.S., Abratt, R. and Dion, P. (2012), “Competitive advantage, private-label brands, and
category profitability”, Journal of Marketing Management, Vol. 28 No. 1/2, pp. 154-172.
Rubio, N., Villaseñor, N. and Yagüe, M.J. (2019), “Customer’s loyalty and trial intentions
within the retailer: the moderating role of variety-seeking tendency”, Journal of Consumer
Marketing, Vol. 36 No. 5, pp. 620-632.
Schoell, W.F., Guiltinan, J.P., Pritchett, B.M.L. and Pritchett, T.K. (1990), Marketing: contem-
porary concepts and practices, Allyn and Bacon, Boston, MA.
426
19
Schöning, F. (2015), “Resale Price Maintenance for On-line Businesses: The Hard Position of
the Federal Cartel Office (Germany)”, Journal of European Competition Law & Practice,
Vol. 6 No. 9, pp. 659-663.
Statista (2018a), “Ranking of the most popular furniture retailers (purchase in the last two years)
in Germany from 2015 to 2018” available at: https://www.statista.com/statis-
tics/503268/most-popular-furniture-retailers-in-germany/ (accessed 06 November 2019).
Statista (2018b), “Turnover of the furniture manufacturing industry in Germany from 2008 to
2016 (in million euros)” available at: https://www.statista.com/statistics/415159/turnover-
manufacturing-furniture-germany/ (accessed 06 November 2019).
Szwajca, D. (2016), “Corporate Reputation and Customer Loyalty as the Measures of Compet-
itive Enterprise Position – Empirical Analyses on the Example of Polish Banking Sector”,
Oeconomia Copernicana, Vol. 7 No. 1, pp. 91-106.
ter Braak, A., Dekimpe, M.G. and Geyskens, I. (2013), “Retailer Private-Label Margins: The
Role of Supplier and Quality-Tier Differentiation”, Journal of Marketing, Vol. 77 No. 4, pp.
86-103.
Thaichon, P. and Quach, T.N. (2015), “From MarketingCommunications to Brand Manage-
ment: Factors Influencing Relationship Qualityand Customer Retention”, Journal of Rela-
tionship Marketing, Vol. 14 No.3, pp.197-219.
Wright, S. (1921), “Correlation and causation”, Journal of Agricultural Research, Vol. XX No.
7, pp. 557-585.
Yanine, F., Cordova, F.M., Valenzuela, L. and Isla, P. (2019), “A Fresh Look at an Old Prob-
lem: Saturation in the Retail Market and How it Affects Both Retailers and Consumers”,
Indian Journal of Science and Technology, Vol. 12 No. 18, pp. 334-344.

427
20
Zaki, M., Theodoulidis, B., Shapira, P., Neely, A. and Tepe, M.F. (2019), “Redistributed Man-
ufacturing and the Impact of Big Data: A Consumer GoodsPerspective”, Production Plan-
ning & Control, Vol. 30 No. 7, pp. 568-581.
Zheng, J.H., Chiu, C.H. and Choi, T.M. (2012), “Optimal Advertising and Pricing Strategies
for Luxury Fashion Brands With Social Influences”, IEEE Transactions on Systems Man
and Cybernetics - Part A Systems and Humans, Vol. 42 No. 4, pp. 827-837.

Related Documents