Bonobo Conservation Assessment November 21-22, 1999 Kyoto University Primate Research Institute Inuyama, Japan Workshop Report Sally Coxe, Norm Rosen, Philip Miller and Ulysses Seal, editors A Contribution of the Workshop Participants and The Conservation Breeding Specialist Group (IUCN / SSC)

Welcome message from author
This document is posted to help you gain knowledge. Please leave a comment to let me know what you think about it! Share it to your friends and learn new things together.
Transcript
Bonobo Conservation Assessment
November 21-22, 1999 Kyoto University Primate Research Institute
Inuyama, Japan
Workshop Report
Sally Coxe, Norm Rosen, Philip Miller and Ulysses Seal, editors
A Contribution of the Workshop Participants and The Conservation Breeding Specialist Group (IUCN / SSC)
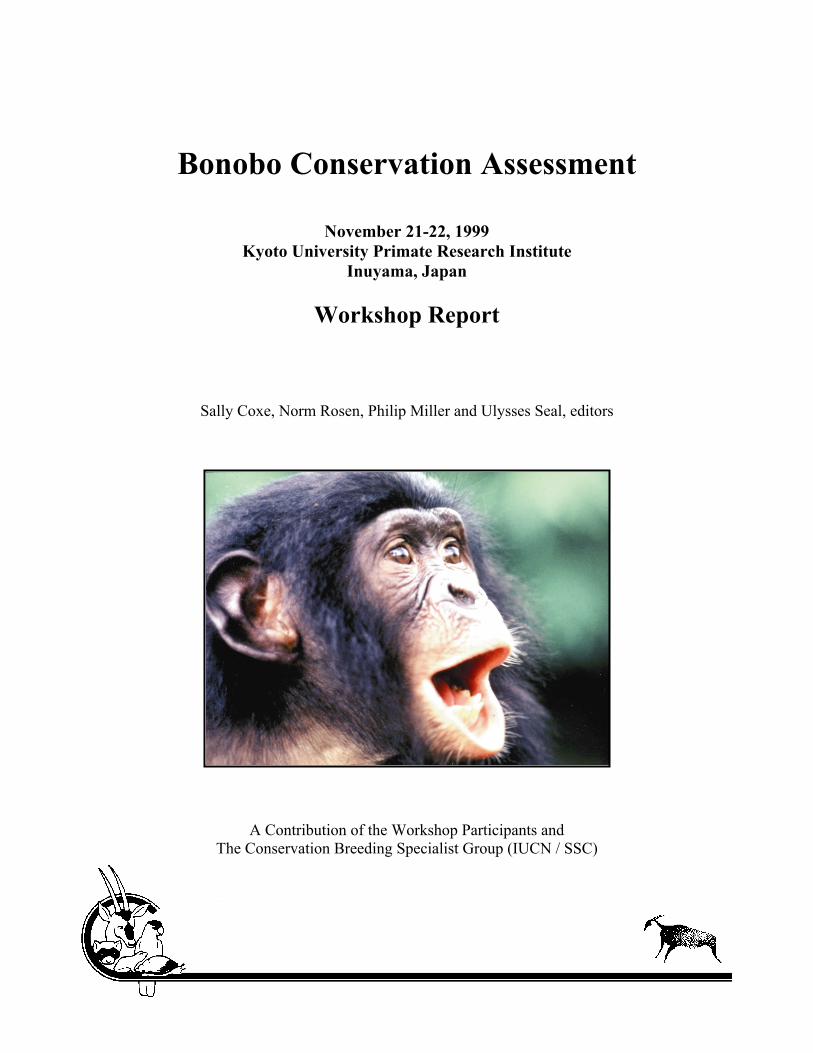
A contribution of the workshop participants and the IUCN / SSC Conservation Breeding Specialist Group. Cover photo ©Frans Lanting Section divider photos:
Sections I, V courtesy of Sally Coxe Sections II – IV, VI ©Frans Lanting
Coxe, S., N. Rosen, P.S. Miller, and U.S. Seal. 2000. Bonobo Conservation Assessment Workshop Final Report.
Apple Valley, MN: Conservation Breeding Specialist Group (SSC/IUCN). Additional copies of the publication can be ordered through the IUCN / SSC Conservation Breeding Specialist Group, 12101 Johnny Cake Ridge Road, Apple Valley, MN 55124 USA. Fax: 612-432-2757. Send checks for US$35 (for printing and shipping costs) payable to CBSG; checks must be drawn on a US bank.
The CBSG Conservation Council These generous contributors make the work of CBSG possible
$50,000 and above
Chicago Zoological Society -Chairman Sponsor SeaWorld/Busch Gardens $20,000 and above
Evenson Design Group Minnesota Zoological Garden -Office Sponsor Omaha’s Henry Doorly Zoo Toronto Zoo Zoological Society of London $15,000 and above
Columbus Zoo & Aquarium - The WILDS
Disney’s Animal Kingdom Saint Louis Zoo Wildlife Conservation Society World Association of Zoos and
Aquariums (WAZA) $10,000 and above
Nan Schaffer San Diego Zoo White Oak Conservation Center $5,000 and above
Al Ain Zoo Australian Regional Association of
Zoological Parks and Aquaria (ARAZPA)
Cleveland Zoological Society Linda Malek Point Defiance Zoo & Aquarium Toledo Zoo $1,000 and above
African Safari Wildlife Park Albuquerque Biological Park Alice D. Andrews Allwetterzoo Münster Association of Zoos and Aquariums
(AZA) Auckland Zoological Park Audubon Zoo Bristol Zoo Gardens British and Irish Association of Zoos and
Aquariums (BIAZA) Calgary Zoological Society Central Zoo Authority, India Chester Zoo Cincinnati Zoo Colchester Zoo Conservatoire pour la Protection des
Primates Copenhagen Zoo Cotswold Wildlife Park Detroit Zoological Society Dickerson Park Zoo Durrell Wildlife Conservation Trust El Paso Zoo Everland Zoo Fort Wayne Children’s Zoo Fort Worth Zoo Fota Wildlife Park
Gladys Porter Zoo Hong Kong Zoological and Botanical Gardens Japanese Association of Zoological
Gardens and Aquariums (JAZA) Kansas City Zoo Laurie Bingaman Lackey Los Angeles Zoo Madrid Zoo-Parques Reunidos Marwell Zoological Park Milwaukee County Zoo Nancy & Pete Killilea North Carolina Zoological Park Ocean Park Conservation Foundation Paignton Zoo Palm Beach Zoo at Dreher Park Parco Natura Viva Perth Zoo Philadelphia Zoo Phoenix Zoo Pittsburgh Zoo & PPG Aquarium Prudence P. Perry Ringling Bros., Barnum & Bailey Robert Lacy Rotterdam Zoo Royal Zoological Society Antwerp Royal Zoological Society Scotland –
Edinburgh Zoo Saitama Children’s Zoo San Antonio Zoo San Francisco Zoo Schönbrunner Tiergarten – Zoo Vienna Sedgwick County Zoo Swedish Association of Zoos & Aquaria Taipei Zoo The Living Desert Thrigby Hall Wildlife Gardens Twycross Zoo Union of German Zoo Directors Utah’s Hogle Zoo Wassenaar Wildlife Breeding Centre Wilhelma Zoo Woodland Park Zoo Zoo Frankfurt Zoo Zürich Zoological Society of Wales – Welsh
Mountain Zoo Zoologischer Garten Köln Zoologischer Garten Rostock Zoos South Australia $500 and above
Aalborg Zoo Akron Zoological Park Banham Zoo and Sanctuary Fairchild Tropical Botanic Garden Friends of the Rosamond Gifford Zoo Givskud Zoo Jacksonville Zoo and Gardens Katey & Mike Pelican Kerzner International North America, Inc. Knuthenborg Park & Safari Lincoln Park Zoo Lisbon Zoo Little Rock Zoo Nordens Ark Odense Zoo Oregon Zoo
Ouwehands Dierenpark Riverbanks Zoological Park Wellington Zoo Wildlife World Zoo Zoo de Granby Zoo de la Palmyre $250 and above
Alice Springs Desert Park Apenheul Zoo Arizona-Sonora Desert Museum Bramble Park Zoo Brandywine Zoo David Traylor Zoo of Emporia Ed Asper Edward & Marie Plotka Lee Richardson Zoo Mark Barone Racine Zoological Gardens Roger Williams Park Zoo Rolling Hills Wildlife Adventure Sacramento Zoo Tautphaus Park Zoo Tokyo Zoological Park Society Topeka Zoological Park $100 and above
African Safari – France Aquarium of the Bay Chahinkapa Zoo International Centre for Birds of Prey Lincoln Children’s Zoo Lion Country Safari, Inc. Miami Metrozoo Safari de Peaugres – France Steinhart Aquarium Steven J. Olson $50 and above
Alameda Park Zoo Casey Schwarzkopf Darmstadt Zoo Elaine Douglass Miller Park Zoo Oglebay's Good Children's Zoo Stiftung Natur-und Artenschutz in den
Tropen Touroparc – France
Thank you for your support! 28 February 2009

Bonobo Conservation Assessment Page v
Bonobo Conservation Assessment
November 21-22, 1999 Kyoto University Primate Research Institute
Inuyama, Japan
Workshop Report
CONTENTS Section I: Executive Summary and Recommendations 3 Section II: Distribution, Threats and Activities 11 Section III: Life History and Modeling 17 Section IV: References 29 Section V: List of Participants 33 Section VI: Appendices
Appendix I: Bonobo Distribution Maps 37 Appendix II: Update of status of pending survey of the Salonga National Park 45 Appendix III: T. Furuichi and C. Hashimoto Post-Workshop Modeling Report 47

Page vi Bonobo Conservation Assessment
Bonobo Conservation Assessment
Workshop Report
Section I Executive Summary
and Recommendations

Bonobo Conservation Assessment: Executive Summary Page 3
Bonobo Conservation Assessment Workshop Executive Summary Introduction Endangered, the bonobo (Pan paniscus) is found only in the central Congo Basin of the war-torn Democratic Republic of Congo (former Zaire). The current wild population is unknown, but definitely decreasing. Restricted in distribution, bonobos have disappeared from areas where they were abundant ten to fifteen years ago. Habitat loss, fragmentation and the catastrophic effects of the civil war in the Congo pose serious threats. Bonobos are being hunted with greater frequency for meat and profit in the commercial bushmeat trade. Traditional taboos that have protected bonobos in the past are breaking down in the face of civil war, human population pressure, and desperate economic circumstances. At this time, there is no enforced protection for the bonobo. Conservation efforts to date have been hampered largely by political unrest, which has intensified since 1991. The intermittent presence of field researchers has provided some protection for bonobos in isolated pockets of their fragmented habitat. However, scientists have not been able to return to their study sites for one to four years, due to back-to-back civil wars that began in 1996. The frontline of the war has moved into the central part of the bonobo range, posing even more danger to the remaining bonobo population. Bonobo study groups are at particular risk because they are habituated to humans. There has been a sharp increase in the number of bonobo orphans entering the capital city, Kinshasa, and reports state that armed soldiers are hunting the apes. On November 21-22, 1999, CBSG conducted a two-day conservation assessment workshop, hosted by the Kyoto University Primate Research Institute in Inuyama, Japan. The workshop was organized by Norman Rosen and facilitated by Dr. Ulysses Seal of CBSG. This was a satellite meeting held after the “Committee on Excellence” Symposium: Evolution of the Apes and the Origin of Human Beings. The workshop was held in preparation for a full-scale Population and Habitat Viability Analysis (PHVA) to be conducted in the Democratic Republic of Congo. The objective was to identify current threats to wild bonobo communities and set priorities for action. Because PHVA workshops are not usually conducted outside of the range country and no Congolese were present, the meeting focused on sharing data, producing a first draft of a population modeling exercise using the simulation modeling package VORTEX, and synthesizing available information on the status of research, protected areas, and conservation activities. The Action Plan for Pan paniscus: Report on Free-Ranging Populations and Proposals for their Preservation, published in 1995 by the Zoological Society of Milwaukee County (Thompson-Handler et al. 1995), was used as one source of baseline information. Twenty-two participants from five countries attended the 2-day workshop, including representatives from the active field research teams. (See List of Participants, Section V).
Page 4 Bonobo Conservation Assessment: Executive Summary
Background The bonobo, also called “pygmy chimpanzee,” is registered as highly vulnerable to extinction in the IUCN/SSC Action Plan for African Primate Conservation (IUCN 1996a) and as endangered in the IUCN Red Data Book (IUCN 1996b). Bonobos are theoretically protected by Congolese and international laws. They are listed in Appendix 1 of CITES (Convention on International Trade in Endangered Species), which bans international trade of the species and any of its parts. They are also classified as endangered by the U.S. Fish and Wildlife Service. Bonobos have been studied in the wild since the mid-1970s. Long-term study sites include Wamba, founded by Takayoshi Kano of Kyoto University in 1974 and Lomako, established in the same year by Noel and Alison Badrian. Three research projects have been conducted in the Lomako area: the Lomako Forest Pygmy Chimpanzee Project, initiated in 1980 by Randall Susman, State University of New York at Stony Brook, USA; Project Pan, established in 1990 at Isamondje by Gottfried Hohmann and Barbara Fruth of the Max-Planck Institute, Germany; and Bonobo in Situ, initiated in 1995 at Iyema and coordinated by Jef Dupain of the Royal Zoological Society of Antwerp, Belgium. Jo Thompson established the Lukuru site in 1992 in the southern portion of the bonobo range. In addition, Jordi Sabater-Pi and Vea of the University of Barcelona, Spain, conducted a brief study from 1988-1990 at the Lilungu site. Research sites that have remained active in recent years include Isamondje and Iyema in the Lomako area, Wamba, and Lukuru. (See Appendix I). None of the field study sites falls within the boundaries of a national park. The 188 km2 Luo Reserve surrounding the Wamba site was designated as an official protected area with the Centre de Recherche en Sciences Naturelles (CRSN) in 1987, and its expansion to the south is proposed. Similarly, a proposal exists for the Lomako Reserve, a 3800 km2 forest block between the Yekokora and Lomako Rivers. The proposal was submitted by WWF-International to the Institut Congolais pour la Conservation de la Nature (ICCN) in 1990 and reached the ministry level in 1991, but has not yet been approved. The Salonga National Park was originally established in 1970, in part to provide protection for bonobos, but it has never been determined if a sustainable population exists there. In cooperation with the ICCN and Zoo Atlanta’s Africa Biodiversity Program, the Zoological Society of Milwaukee launched a plan for a regional survey in 1997. Preliminary reconnaissance conducted in 1998 verified the existence of bonobos within the Salonga’s north sector, as well as evidence of poaching. A full survey of the park is pending. Research and conservation efforts have been increasingly difficult since civil unrest began to escalate in 1991, coupled with economic collapse. In 1996, civil war broke out as forces led by Laurent Desiré Kabila challenged long-entrenched dictator Mobutu Sese Seko. In May 1997, Kabila took power and changed the name of the country from Zaire to Democratic Republic of Congo (DRC). In the summer of 1998, a second civil war erupted, spurred by rebel factions backed by Rwanda and Uganda. Troops, primarily from Zimbabwe and Angola, have supported Kabila. The conflict continues, despite the ceasefire agreed upon by all warring factions in the Lusaka Peace Accord of July, 1999. The United Nations plans to send a peacekeeping force, but their strategy remains unclear, due to the enormous complexities of the situation.
Bonobo Conservation Assessment: Executive Summary Page 5
The Workshop Norm Rosen opened the Inuyama workshop, emphasizing the importance of keeping a positive attitude, despite the war in DRC. He cited the success of CBSG workshops in developing a viable strategy for the mountain gorilla in the midst of civil unrest. Norm introduced Takayoshi Kano, the pioneer of bonobo field research, and asked him to comment. Kano emphasized the fact that bonobos are hunted for meat throughout most of their distribution and now face the most extreme difficulty in their history. With the war now in the central part of the bonobo habitat, Kano said, “villagers have probably fled into the forest. They must be hungry. They must be hunting wild animals, including Pan paniscus, much more heavily than they used to. Soldiers, too, must hunt them for meat. Nobody knows when this confusion will settle down. This is the worst problem. Please, let us discuss what we can do to save Pan paniscus in the wild.” Each participant stated goals for the workshop. The primary concerns were: “What can we do to protect wild bonobos while the war continues? How can we prepare for concerted action when conditions improve?” In addition, participants suggested the following needs:
• Increase pride in bonobos among Congolese • Coordinate conservation activities among various parties • Assess risk of population extinction • Establish clear goals for bonobo conservation • Help end the war in DRC • Maintain reserves; strengthen intervention on the local level • Gain support of park rangers/guards • Share perspectives on conservation • Share information for use in bonobo conservation • Promote public education • Assess what has been done for bonobos • Prepare to go back to study sites • Focus international attention on the Congo • Mobilize people and governments to help • Increase awareness through media • Collaborate with the University of Kinshasa • Prepare for the future; be ready to act when chaos ends
Working Groups Participants were divided into two working groups: Distribution, Threats and Activities, and Life History and Population Modeling. Discussion focused on the sites active in recent years: Wamba, Isamondje, Iyema and Lukuru sites. (Note: Because Barbara Fruth of the Isamondje site participated in the Modeling group, much of the discussion on threats and distribution lacked her input. Gay Reinartz sent a fax outlining the status of the Salonga survey; this document can be seen in Appendix II [page 43].)
Page 6 Bonobo Conservation Assessment: Executive Summary
Summary of Recommendations A key recommendation was for field researchers to return to their sites as soon as possible, with Wamba as the top priority. In addition, participants agreed to conduct coordinated surveys using GPS/GIS and to synchronize methodology for the collection of comparable data. The group felt it was important to survey key areas of the bonobo habitat, including the area east of Lomako, between the Lopori and Tshuapa Rivers, following the Bolombo River, and the Wamba/Luo Reserve area, between the Maringa and Tshuapa Rivers. Areas in the eastern part of the bonobo range south of Kisangani were also designated for survey. It was also agreed to hold a complete PHVA workshop as soon as possible to unify Congolese stakeholders, field researchers, zoos, conservationists, and others working for bonobos. The group agreed that Kinshasa would be the most desirable place to hold a meeting, but if this is not possible, given political circumstances in DRC, Antwerp, Belgium was recommended as an alternate venue, provided that Congolese representatives are present. Raising local and international public awareness of bonobos and their plight was also deemed to be of utmost importance. Conservation Priorities and Action Responsibilities Following the reports from each working group, all participants tried to identify the information most needed, who will gather it, and actions to be taken. Focus was placed on what needs participants can take responsibility for, concentrating on actions with measurable outcomes. General Goals And Ideas: Assess the situation for bonobos as a whole. Coordinate bonobo surveys with other pertinent information, such as biodiversity, human demographics, land use patterns, and threats. Get satellite imagery to help determine a baseline from which to evaluate habitat status and changes over time (roads, agricultural encroachment, villages, logging). Explore possibility of using infrared photography to find bonobos in nests and coordinate with ground surveys. Specific Recommendations: 1. Return to Wamba. Survey Luo Reserve. 2. All research teams return to their sites. Go back equipped with GPS/GIS and coordinate methodology for collection of comparable data. 3. Survey other areas (See maps, Appendix I [page 37]).
a) East of Lomako, between Lopori and Tshuapa Rivers, following the Bolombo River (Survey Area 12) • Wamba area, between Maringa and Tshuapa Rivers (Survey Area 11) • Area between Maringa and Lopori Rivers (Survey Area 3)
b) From western limit of south block, La Salonga to Lac Mai-Ndombe (Survey Area 9)
Bonobo Conservation Assessment: Executive Summary Page 7
c) Areas south of Kisangani in the eastern section of potential range (Survey Areas 5, 1A, 1B).
d) Area between Mbandaka, Boende and Basankusu (Survey Area 13) 4. Mapping (linked to human population/impact) 5. Find out where logging concessions are already assigned and for how much money. Is selective logging or clear-cutting planned? Are contracts signed and approved? Explore ways to influence logging strategy and recommend strategies that will have the least impact on bonobos. Look toward adding eco-tourism onto the logging infrastructure. 6. Support the Great Ape Conservation Act pending in U.S. Congress. 7. Support UN Resolution for Great Apes, proposed by Richard Wrangham at COE Symposium, with a strong message for peace in the Congo. 8. Have a meeting of the entire bonobo community to unify field researchers, zoos, conservationists, and others working with bonobos. Set goals based on this meeting. Suggested venue: Antwerp in 2000. Plan PHVA in Kinshasa as soon as possible. 9. Get more publicity; raise public awareness of bonobos. Conclusion: The bonobo community mobilizes! Commitments Before the meeting adjourned, participants briefly discussed what they could commit to doing to move the process forward. Barbara Fruth: Recommend methodology for coordinated survey. Jef Dupain: Investigate logging concessions. Sally Coxe: Establish an e-mail discussion group to facilitate on-going communication and cooperative planning. Sue Savage-Rumbaugh: Investigate satellite maps. Find out more about what Congolese already know about where bonobos are at certain sites. Get publicity. Japanese team: Conduct research on the impact of research. Jo Thompson: Investigate how to stop hunting of apes vs. other bushmeat. Linda Van Elsacker: Work on public education. Try to gain support of Belgian government. Because the discussion was cut short due to lack of time, participants agreed that we need to determine what else needs to be done and who will take responsibility.

Page 8 Bonobo Conservation Assessment: Executive Summary
Bonobo Conservation Assessment
Workshop Report
Section II Distribution,
Threats and Activities

Bonobo Conservation Assessment: Distribution, Threats and Activities Page 11
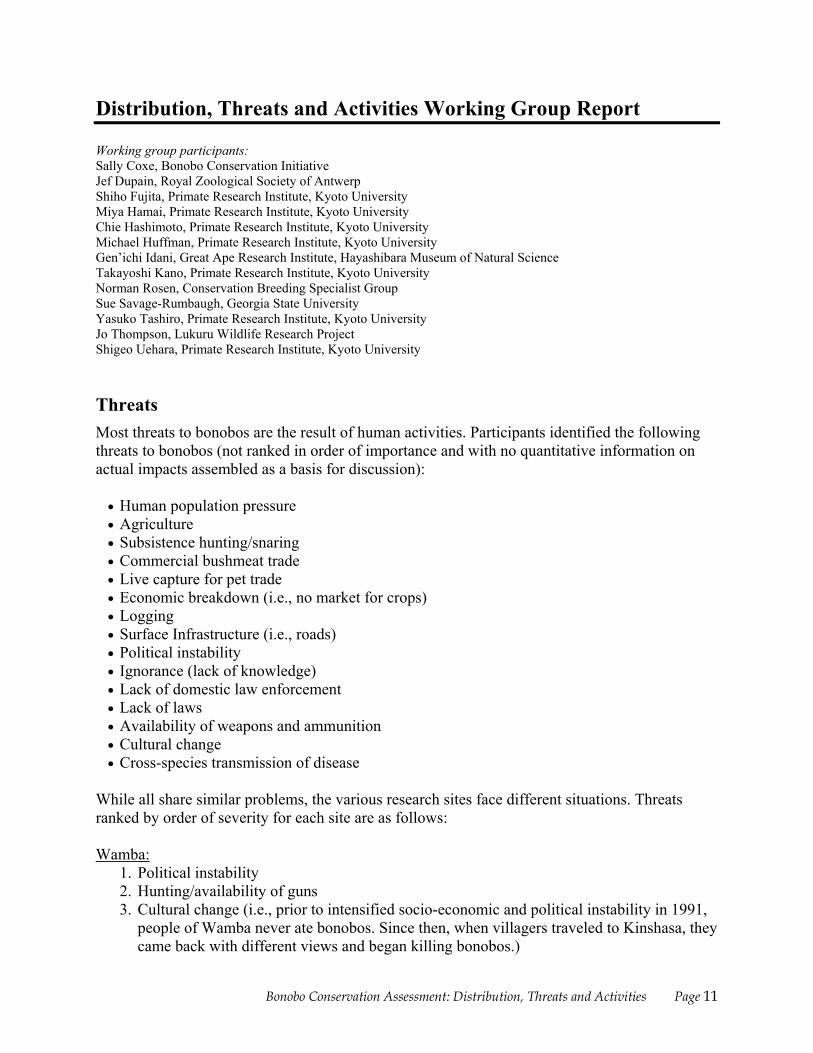
Distribution, Threats and Activities Working Group Report Working group participants: Sally Coxe, Bonobo Conservation Initiative Jef Dupain, Royal Zoological Society of Antwerp Shiho Fujita, Primate Research Institute, Kyoto University Miya Hamai, Primate Research Institute, Kyoto University Chie Hashimoto, Primate Research Institute, Kyoto University Michael Huffman, Primate Research Institute, Kyoto University Gen’ichi Idani, Great Ape Research Institute, Hayashibara Museum of Natural Science Takayoshi Kano, Primate Research Institute, Kyoto University Norman Rosen, Conservation Breeding Specialist Group Sue Savage-Rumbaugh, Georgia State University Yasuko Tashiro, Primate Research Institute, Kyoto University Jo Thompson, Lukuru Wildlife Research Project Shigeo Uehara, Primate Research Institute, Kyoto University Threats Most threats to bonobos are the result of human activities. Participants identified the following threats to bonobos (not ranked in order of importance and with no quantitative information on actual impacts assembled as a basis for discussion):
• Human population pressure • Agriculture • Subsistence hunting/snaring • Commercial bushmeat trade • Live capture for pet trade • Economic breakdown (i.e., no market for crops) • Logging • Surface Infrastructure (i.e., roads) • Political instability • Ignorance (lack of knowledge) • Lack of domestic law enforcement • Lack of laws • Availability of weapons and ammunition • Cultural change • Cross-species transmission of disease
While all share similar problems, the various research sites face different situations. Threats ranked by order of severity for each site are as follows: Wamba:
1. Political instability 2. Hunting/availability of guns 3. Cultural change (i.e., prior to intensified socio-economic and political instability in 1991,
people of Wamba never ate bonobos. Since then, when villagers traveled to Kinshasa, they came back with different views and began killing bonobos.)
Page 12 Bonobo Conservation Assessment: Distribution, Threats and Activities
4. Lack of law enforcement (i.e., local authorities eat bonobos, although it is against the law) 5. Agriculture/human population increase (destroying habitat) 6. Live capture for pets
Iyema:
1. Bushmeat trade 2. Economic breakdown (i.e., no market for crops) 3. Logging 4. Political instability 5. Surface infrastructure 6. Lack of domestic law enforcement 7. Laws 8. Availability of guns and ammunition 9. Human population pressure Threats of equal impact: ignorance, culture change, agriculture, hunting, disease.
Isamondje:
1. Lack of research presence (due to war) 2. Agriculture/ population increase 3. Subsistence hunting (snaring for local consumption) 4. Logging Not a problem: ignorance, lack of law enforcement, need to strengthen laws, immigration, culture change, x-species transmission
Lukuru:
1. Human population increase 2. Agriculture 3. Culture change 4. Political instability 5. Laws (lack of laws and enforcement) 6. Availability of guns and ammunition 7. Hunting
Distribution Bonobos are found only in the area to the south of the Congo River. (See map, Appendix I) The distribution may extend as far east as the Lualaba River, and is bound in the south by the Kasai-Sankuru rivers. Considering these boundaries, the potential bonobo range covers an area of approximately 840,400 km2. (Dupain et al. 2000; Thompson-Handler et al. 1995) Participants discussed, in plenary session, what is now known about bonobo distribution, and extrapolated a population estimate of 60,000 to 120,000. However these estimates, built upon a systematic analysis of distribution and plausible density estimates, were so different from previous impressions that they were considered to be overly optimistic. The bonobo population is fragmented, and bonobos are known to have disappeared from several areas where they were once common (these areas were not included in the above estimates). Catastrophic threats, such

Bonobo Conservation Assessment: Distribution, Threats and Activities Page 13
as increased hunting for the bushmeat trade and the effects of war and displaced people are also taking a toll, the extent of which is not known. Participants reviewed the Action Plan for Pan (1995), noting that the situation has probably changed significantly since that report was published five years ago. Given the uncertainty of the data, the estimates in the Action Plan (which were based on estimates from the then available data) were preferred by the editors as perhaps the best estimates to use at present: 10,000 to 20,000, and possibly as few as 5,400 total bonobos. Status The current status (1999) of bonobos at Wamba, Lukuru, and Lomako is not known, due to the continuing civil war. Based on information available, participants evaluated two issues: the impact of habitat destruction or modification and site management. (Note: No data were collected for the Isamondje site.) 1. Impact of habitat destruction / modification
Wamba: Human population has doubled since research began in the mid-1970s. Agriculture has increased, but bonobos can eat secondary vegetation.
Iyema:
Permanent habitation of the Lomako forest was formerly forbidden by law. Local people used the forest as a temporary hunting area. However, in the past 10 years, the forest has become a permanent home for more people. The law did not change, but local officials allow people to live there. Before, people went in to gather and subsistence hunt, then went back to the village. Human population pressure poses an increasing threat, resulting in the introduction of permanent agriculture next to research sites.
Lukuru:
Same as Wamba with an increase in human population and agriculture. 2. Site management
Wamba: Researchers have not been able to visit Wamba since 1996. Research assistants formerly served as guards. Now, there is no means to send salaries to them. Also, the people of Wamba may not be able to stay in the village now, due to the war and intruding soldiers, so they have probably dispersed into the forest. It is likely that the research assistants cannot continue their work. In 1998, Japanese researchers sent some money via missionaries. This was the last time salaries could be sent to the workers.
Lukuru:
As of 1998, rangers in the southern sector of the Salonga National Park had not been paid in 5 years. In fact, the conservateur was paying park guards to track for meat. In the summer of 1998, Jo Thompson purchased 8,401 acres south of the park through traditional local barter.
Page 14 Bonobo Conservation Assessment: Distribution, Threats and Activities
Named the Lukuru Reserve, this land located between the Lukenie and Sankuru rivers is being protected by the local people. It is in their control.
Iyema:
The research team led by Jef Dupain was last in Iyema in the autumn of 1998. It has been possible to get salaries to workers, thanks to missionaries in Basankusu. But, recently, people don’t dare come out of the forest to get their money, due to the war. It appears that bonobos remain untouched in forest. However, recent reports confirm that soldiers have come into the forest, but it is not known if they are hunting bonobos. The bonobos are habituated, so the risk of being shot is great.
Recommendations Try to make quantitative identification of factors threatening bonobos, to assist better estimates of habitat and demographic impacts and rates of change. Points to consider: • Threats making a direct impact on demography / population. (Estimate frequency and effect.) • Rate of habitat loss. • Specify parameters of carrying capacity to assist estimates of reductions occurring. • Information obtainable through satellite maps may assist estimates of habitat and its loss. • Human population growth in the context of land use patterns and their projected changes over the next 25 years. (Examine reduction of habitat and its carrying capacity and forest degradation, specify measurable parameters using mapping techniques.) • Bonobo population fragmentation with identification of barriers to movement. • Issue regarding Lomako: Isamondje and Iyema researchers have two differing perceptions of the problem. Need to clarify.
Bonobo Conservation Assessment
Workshop Report
Section III Life History and
Population Modeling

Bonobo Conservation Assessment: Population Biology and Modeling Page 17
Life History and Population Modeling Working Group Report Working group participants: Barbara Fruth, Project Pan, Max-Planck Institute Takeshi Furuichi, Meiji-Gakuin University, Wamba Research Team Paul Raffaele, Reader’s Digest, Australia (observer) Ulie Seal, Conservation Breeding Specialist Group Linda Van Elsacker, Bonobo Project-in-Situ, Royal Zoological Society of Antwerp Richard Wrangham, Harvard University Introduction A primary goal of this workshop was the assembly, collation, and analysis of available demographic data on bonobo populations across the Democratic Republic of Congo. VORTEX, a simulation software package written for population viability analysis, was used as the primary tool to study the interaction of a number of bonobo life history and population parameters treated stochastically, and perhaps to explore which demographic parameters may be the most sensitive to threats and alternative management practices. This goal was only partially achieved since much of the field data was either unavailable or not in a form allowing systematic analysis. The VORTEX package is a computer simulation of the effects of deterministic factors as well as stochastic demographic, environmental, and genetic events on wild populations. VORTEX models population dynamics as discrete sequential events (e.g., births, deaths, sex ratios among offspring, catastrophes, etc.) that occur according to defined probabilities. The probabilities of events are modeled as constants or variables that follow specified random distributions. The package simulates a population by stepping through the series of events that describe the typical life cycles of sexually reproducing organisms. For a more detailed explanation of VORTEX and its use in population viability analysis, refer to Miller and Lacy (1999). VORTEX is not intended to give absolute answers, since it is projecting stochastically the interactions of the many parameters used as input to the model and because of the random processes involved in nature. Interpretation of the output depends upon our knowledge of bonobo biology, the environmental conditions affecting the species, and possible future changes in these conditions. The working group decided to consider the central region within the current bonobo range in the Democratic Republic of Congo (Lomako, Wamba) and in Lukuru and Salonga separately in the demographic modeling process for the following reasons:
Wamba – Lomako • Known demographic data • Threats from human population growth In our development of the bonobo demography, we treated only the known geographic
areas and extrapolated from these models later to include the unknown areas.
Page 18 Bonobo Conservation Assessment: Population Biology and Modeling
Lukuru • Small • Threats from human population growth • Fringe seasonal
The Salonga region was not explicitly modeled in this workshop but was simply treated as a larger variant of the first population. Input Parameters for Simulations Inbreeding Depression: In the current set of simulations, inbreeding depression was not included as the extent of occurrence of bonobos in the region is quite large. However, information presented at the workshop by Jo Thompson suggests that bonobo populations within this area now may be highly fragmented and, therefore, become susceptible to inbreeding by random drift and its deleterious consequences. Working group participants identified this issue as uncertain and requiring further deliberation and analysis. Concordance in environmental variability between survival and female fecundity: The group assumed that covariance between these processes does not exist because of a significant reproductive buffering that compensates for reproductive losses in a given year and the dissociation of environmental effects on survival and reproduction. Catastrophes: Catastrophes are singular environmental events that are outside the bounds of annual environmental variation affecting reproduction and/or survival. Natural catastrophes can be tornadoes, floods, droughts, disease, or similar events. These events are modeled in VORTEX by assigning an annual probability of occurrence and a pair of severity factors describing their impact on mortality (across all age-sex classes) and the proportion of females successfully breeding in a given year. These factors range from 0.0 (maximum or absolute effect) to 1.0 (no effect), and are imposed during the single year of the catastrophe, after which time the demographic rates are returned to their baseline values. The group identified the following as potential catastrophic events:
• War and subsequent refugee problems Lomako [only secondary effects]
Wamba [serious effects] • Disease • Logging
The specific characteristics of disease and logging were not quantified so they were not included in these demographic models. Additional analysis with use of information from other primate – especially chimpanzee - populations necessary in order to provide a more complete picture of these events and their potential impacts on bonobo populations. Disease events were modeled for the mountain gorilla (Werikhe et al. 1998) and their omission here makes it likely that the impact of this threat to the bonobo populations is being underestimated and their risk of extinction underestimated. Logging effects on habitat may be modeled by changes in K.
Bonobo Conservation Assessment: Population Biology and Modeling Page 19
Ultimately, the group derived two catastrophic events to use in this modeling exercise, with the following characteristics:
• Excessive hunting: 3% annual probability of occurrence, leading to 75 percent mortality in local areas.
• Large-scale human civil disorder: 14.4% annual probability of occurrence, leading to 15 percent mortality over more extended areas.
Note: disorder mortality was excluded from the annual average adult female mortality estimates.
Breeding System: Polygynous. Age of First Reproduction: VORTEX precisely defines reproduction as the time at which offspring are born, not the age of sexual maturity. In addition, the program uses the mean age rather than the earliest recorded age of offspring production. Field data indicate that bonobos begin breeding on average at age 15. Age of Reproductive Senescence: VORTEX assumes that animals can reproduce (at the normal rate) throughout their adult life. Observations suggest that bonobos will not reproduce beyond about 40 years of age. This value was used in all of the models. Density-Dependent Reproduction: Density dependence in reproduction (proportion of females breeding in a given year) is modeled in VORTEX according to the following equation:
in which P(N) is the percent of females that breed when the population size is N, P(K) is the percent that breed when the population is at carrying capacity (K, to be entered later), and P(0) is the percent of females breeding when the population is close to 0 (in the absence of any Allee effect). B can be any positive number. The exponent B determines the shape of the curve relating percent breeding to population size, as population size gets large. If B is 1, the percent breeding changes linearly with population size. If B is 2, P(N) is a quadratic function of N. The term A in the density-dependence equation defines the Allee effect, in which reproduction can be reduced in a low-density population simply because of difficulty in finding suitable mates across the landscape. One can think of A as the population size at which the percent of females breeding falls to half of its value in the absence of an Allee effect (Akçakaya 1997). The group agreed that, at carrying capacity, an average of 21.7% of adult females breed annually. This is derived directly from estimates of interbirth intervals from wild population studies. Moreover, as many as 25% of adult females breed annually when the population is far below carrying capacity, regardless of age-specific survival rates (see discussion below on mortality). In order to simulate the desired functional relationship, exponential steepness is equal to 2. The group concluded that bonobos would not suffer from Allee effects at low population densities. Therefore, P(0) = 25%, P(K) = 21.7%, B = 2, and A = 0.
ANN
KNKPPPNP B
+
−−= )))(()0(()0()(
Page 20 Bonobo Conservation Assessment: Population Biology and Modeling
Annual variation in female reproduction is modeled in VORTEX by specifying a standard deviation (SD) for the proportion of adult females that reproduce within a given year. The group derived a standard deviation in this parameter of 4%; this level of annual variability translates in a range of female breeding success from one year to the next from roughly 17% to 33% over time (when the population is below carrying capacity). Mortality: Field data from Wamba indicate the following simplified mortality schedule over the age ranges indicated with no differences between the sexes:
Age % Mortality 0 – 1 4.0 1 – 7 4.0 8 – 14 4.6 15 – 40 4.0 (Adults)
A working group member suggested that these mortality estimates for Wamba are optimistic, particularly with respect to infant survival and suggested some factors to consider:
• Provisioning [1-2 months/year] helps bonobos which may affect infant survival during the first year. But note that mortality in Lomako was not higher either.
• Perhaps the lack of infanticide in bonobos as compared to chimpanzees results in lower rates. • Researchers probably aid survival of bonobos
Values of 4, 6, and 8% for infant mortality were analyzed in a sensitivity analysis for this parameter. Values of 2, 4, and 7% for adult mortality were simulated in a sensitivity analysis for this parameter. Results of Simulations Reported Results and Their Interpretation The scenario simulation reports include values for deterministic population growth rates, generation time, and the initial population age and sex structure. The results, reported here, of the simulations at specified time intervals included stochastic population growth rates with standard deviations (SD), mean extant population size with SD, probability of extinction, and age and sex structure of the population. Other information in the reports, not included here, is provided on the loss of heterozygosity and allelic losses over the time interval of the simulation. The population growth rate (‘r’) provides a measure of the rate of growth of the population under the specified values of the parameters in the simulation scenario remembering they will vary stochastically from year to year as a result of intrinsic and environmental variation. A positive value of 1% (r ~ 0.01) yields a population doubling time of about 70 years. It is a mean over the time interval (100 years in these simulations) of the rate calculated for each year. A standard deviation is also calculated to provide an indication of the dispersion of the values given that they will vary from year to year because of the stochastic variation in the parameter values form year to year. An approximately stable population will have an r = 0.000. Declining populations will be indicated by negative values and growing populations by positive values. A
Bonobo Conservation Assessment: Population Biology and Modeling Page 21
negative r value if sustained will always lead eventually to the extinction of the population being simulated. Recommended management actions are intended to reverse negative values. The time interval required for the final extinction of the last population may be quite long depending upon the value of r, the size of the initial population, and the life expectancy of the species. The probability of extinction, P(E), is a measure of the extinction risk (or the probability of survival) over the specified time interval, in the case of this report this is 100 years. A value of zero may be obtained in the face of declining populations simply because the negative growth rate is relatively low, the bonobos have a relatively long life expectancy, and the initial population size is relatively large. Thus starting populations of 3,000 will survive for much longer time intervals than starting populations of 300 or 30 at the same rate of decline. The challenge posed for detecting these declines is that census and survey methodologies have relatively large confidence limits. Thus detecting a 1% rate of decline (or increase) with annual fluctuations with methods that have 20% margins of error may require many years and relatively large sample sizes and consistent methods with known accuracy and precision – conditions rarely met. These considerations are of importance for the bonobo because of the low rates of increase (1 –2%) that appear possible even under optimal conditions. Depleted populations with available habitat will take a long time to recover by manager time scales. Mean population numbers (N) provide a useful indicator of the direction and rate of change of simulated populations overt time. In this case with 100 time intervals it is possible to see that a under a given set of conditions populations are either unstable or declining. Small population sizes greatly increase the risk of extinction because of the variations that occur from year to year and the risk that several years of bad luck or a single catastrophic event may result in extinction. This is readily seen in these scenarios with comparisons of starting population sizes of 30 with those of 300 or 3,000 under the same set of starting conditions. Base Scenario A base scenario was built from information collected in the plenary session and then developed further in the working group. However, it must be emphasized that much field distribution and demographic information was not available or had not been prepared properly for analysis in this workshop. The field studies have not had the collection of demographic information as a primary or even intended purpose. This means that observational data need to be examined in detail with demographic questions in mind. Means need to be recalculated as annual rates with standard deviations to provide estimates of environmental (and methodological) variation and to allow examination for unusual event years that may reflect catastrophic events. This kind of analysis has not been done for any of the bonobo data and we were able to make only crude estimates during the workshop. It is our impression that there are substantial observational data potentially available that might contribute to such an analysis and that this analysis needs to be a priority. The base scenario developed had the following global and local parameter values: The simulations were for 100 years with 200 repetitions; inbreeding depressions was not included; the maximum age of reproduction was 40 years; a single population was modeled (no metapopulations); density dependence was included with values of 25% and 21.7% for proportion of females breeding; litter size = 1; sex ratio at birth = 1:1; K was set at 3,000 in all
Page 22 Bonobo Conservation Assessment: Population Biology and Modeling
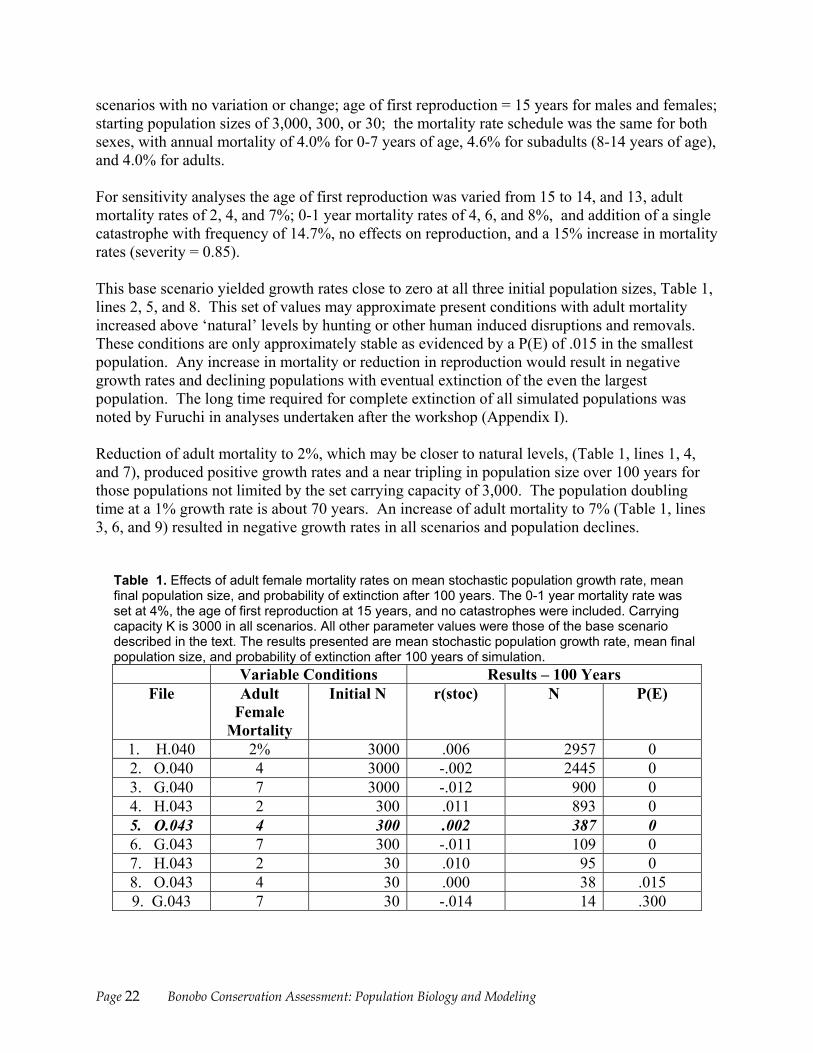
scenarios with no variation or change; age of first reproduction = 15 years for males and females; starting population sizes of 3,000, 300, or 30; the mortality rate schedule was the same for both sexes, with annual mortality of 4.0% for 0-7 years of age, 4.6% for subadults (8-14 years of age), and 4.0% for adults. For sensitivity analyses the age of first reproduction was varied from 15 to 14, and 13, adult mortality rates of 2, 4, and 7%; 0-1 year mortality rates of 4, 6, and 8%, and addition of a single catastrophe with frequency of 14.7%, no effects on reproduction, and a 15% increase in mortality rates (severity = 0.85). This base scenario yielded growth rates close to zero at all three initial population sizes, Table 1, lines 2, 5, and 8. This set of values may approximate present conditions with adult mortality increased above ‘natural’ levels by hunting or other human induced disruptions and removals. These conditions are only approximately stable as evidenced by a P(E) of .015 in the smallest population. Any increase in mortality or reduction in reproduction would result in negative growth rates and declining populations with eventual extinction of the even the largest population. The long time required for complete extinction of all simulated populations was noted by Furuchi in analyses undertaken after the workshop (Appendix I). Reduction of adult mortality to 2%, which may be closer to natural levels, (Table 1, lines 1, 4, and 7), produced positive growth rates and a near tripling in population size over 100 years for those populations not limited by the set carrying capacity of 3,000. The population doubling time at a 1% growth rate is about 70 years. An increase of adult mortality to 7% (Table 1, lines 3, 6, and 9) resulted in negative growth rates in all scenarios and population declines.
Table 1. Effects of adult female mortality rates on mean stochastic population growth rate, mean final population size, and probability of extinction after 100 years. The 0-1 year mortality rate was set at 4%, the age of first reproduction at 15 years, and no catastrophes were included. Carrying capacity K is 3000 in all scenarios. All other parameter values were those of the base scenario described in the text. The results presented are mean stochastic population growth rate, mean final population size, and probability of extinction after 100 years of simulation.
Variable Conditions Results – 100 Years File Adult
Female Mortality
Initial N r(stoc) N P(E)
1. H.040 2% 3000 .006 2957 0 2. O.040 4 3000 -.002 2445 0 3. G.040 7 3000 -.012 900 0 4. H.043 2 300 .011 893 0 5. O.043 4 300 .002 387 0 6. G.043 7 300 -.011 109 0 7. H.043 2 30 .010 95 0 8. O.043 4 30 .000 38 .015 9. G.043 7 30 -.014 14 .300
Bonobo Conservation Assessment: Population Biology and Modeling Page 23
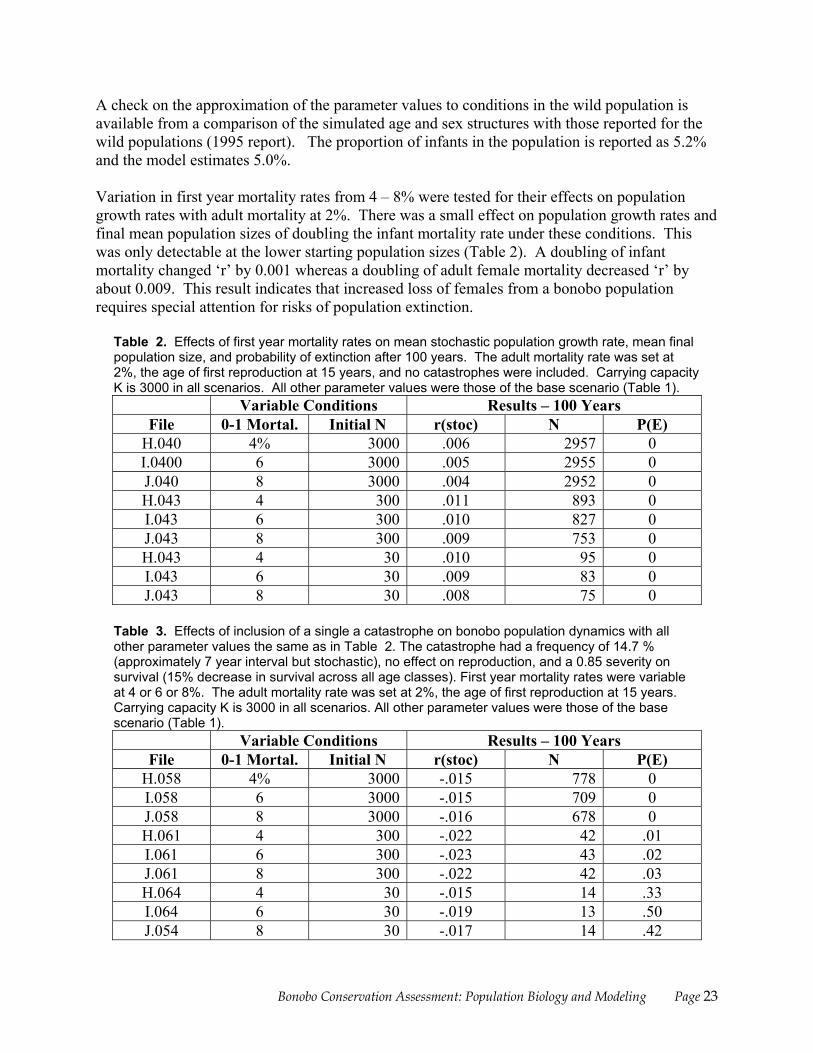
A check on the approximation of the parameter values to conditions in the wild population is available from a comparison of the simulated age and sex structures with those reported for the wild populations (1995 report). The proportion of infants in the population is reported as 5.2% and the model estimates 5.0%. Variation in first year mortality rates from 4 – 8% were tested for their effects on population growth rates with adult mortality at 2%. There was a small effect on population growth rates and final mean population sizes of doubling the infant mortality rate under these conditions. This was only detectable at the lower starting population sizes (Table 2). A doubling of infant mortality changed ‘r’ by 0.001 whereas a doubling of adult female mortality decreased ‘r’ by about 0.009. This result indicates that increased loss of females from a bonobo population requires special attention for risks of population extinction.
Table 2. Effects of first year mortality rates on mean stochastic population growth rate, mean final population size, and probability of extinction after 100 years. The adult mortality rate was set at 2%, the age of first reproduction at 15 years, and no catastrophes were included. Carrying capacity K is 3000 in all scenarios. All other parameter values were those of the base scenario (Table 1).
Variable Conditions Results – 100 Years File 0-1 Mortal. Initial N r(stoc) N P(E)
H.040 4% 3000 .006 2957 0 I.0400 6 3000 .005 2955 0 J.040 8 3000 .004 2952 0 H.043 4 300 .011 893 0 I.043 6 300 .010 827 0 J.043 8 300 .009 753 0 H.043 4 30 .010 95 0 I.043 6 30 .009 83 0 J.043 8 30 .008 75 0
Table 3. Effects of inclusion of a single a catastrophe on bonobo population dynamics with all other parameter values the same as in Table 2. The catastrophe had a frequency of 14.7 % (approximately 7 year interval but stochastic), no effect on reproduction, and a 0.85 severity on survival (15% decrease in survival across all age classes). First year mortality rates were variable at 4 or 6 or 8%. The adult mortality rate was set at 2%, the age of first reproduction at 15 years. Carrying capacity K is 3000 in all scenarios. All other parameter values were those of the base scenario (Table 1).
Variable Conditions Results – 100 Years File 0-1 Mortal. Initial N r(stoc) N P(E)
H.058 4% 3000 -.015 778 0 I.058 6 3000 -.015 709 0 J.058 8 3000 -.016 678 0 H.061 4 300 -.022 42 .01 I.061 6 300 -.023 43 .02 J.061 8 300 -.022 42 .03 H.064 4 30 -.015 14 .33 I.064 6 30 -.019 13 .50 J.054 8 30 -.017 14 .42
Page 24 Bonobo Conservation Assessment: Population Biology and Modeling
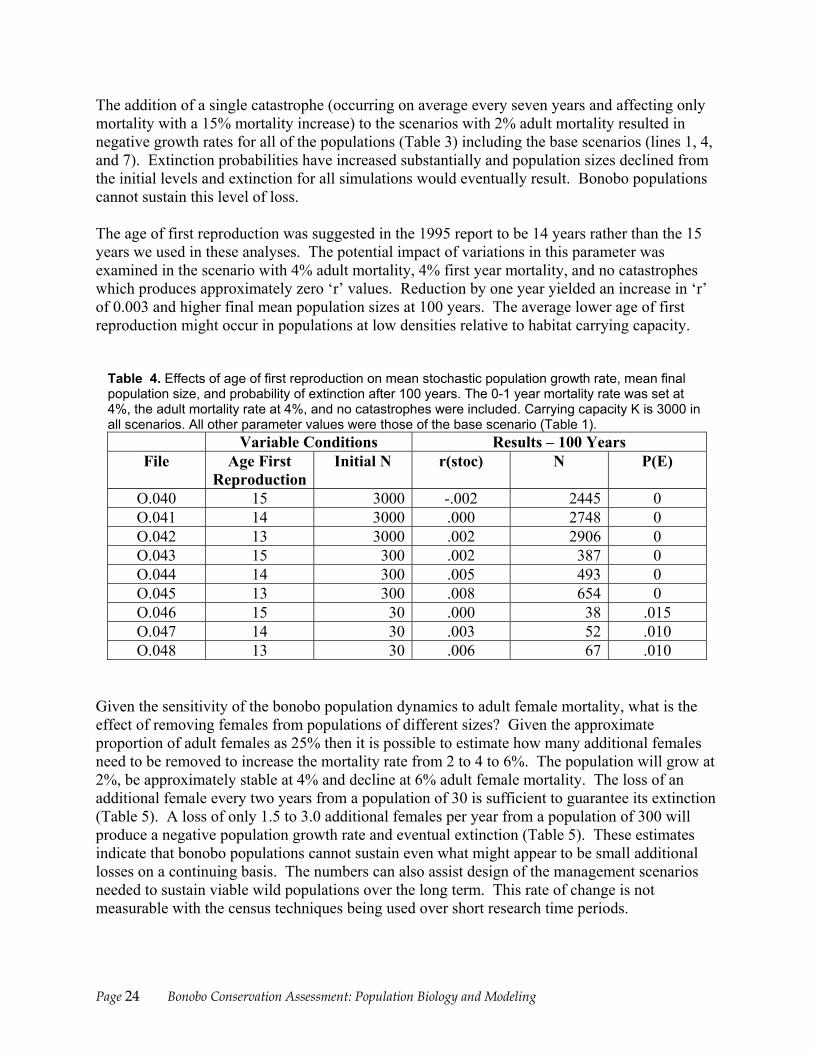
The addition of a single catastrophe (occurring on average every seven years and affecting only mortality with a 15% mortality increase) to the scenarios with 2% adult mortality resulted in negative growth rates for all of the populations (Table 3) including the base scenarios (lines 1, 4, and 7). Extinction probabilities have increased substantially and population sizes declined from the initial levels and extinction for all simulations would eventually result. Bonobo populations cannot sustain this level of loss. The age of first reproduction was suggested in the 1995 report to be 14 years rather than the 15 years we used in these analyses. The potential impact of variations in this parameter was examined in the scenario with 4% adult mortality, 4% first year mortality, and no catastrophes which produces approximately zero ‘r’ values. Reduction by one year yielded an increase in ‘r’ of 0.003 and higher final mean population sizes at 100 years. The average lower age of first reproduction might occur in populations at low densities relative to habitat carrying capacity.
Table 4. Effects of age of first reproduction on mean stochastic population growth rate, mean final population size, and probability of extinction after 100 years. The 0-1 year mortality rate was set at 4%, the adult mortality rate at 4%, and no catastrophes were included. Carrying capacity K is 3000 in all scenarios. All other parameter values were those of the base scenario (Table 1).
Variable Conditions Results – 100 Years File Age First
Reproduction Initial N r(stoc) N P(E)
O.040 15 3000 -.002 2445 0 O.041 14 3000 .000 2748 0 O.042 13 3000 .002 2906 0 O.043 15 300 .002 387 0 O.044 14 300 .005 493 0 O.045 13 300 .008 654 0 O.046 15 30 .000 38 .015 O.047 14 30 .003 52 .010 O.048 13 30 .006 67 .010
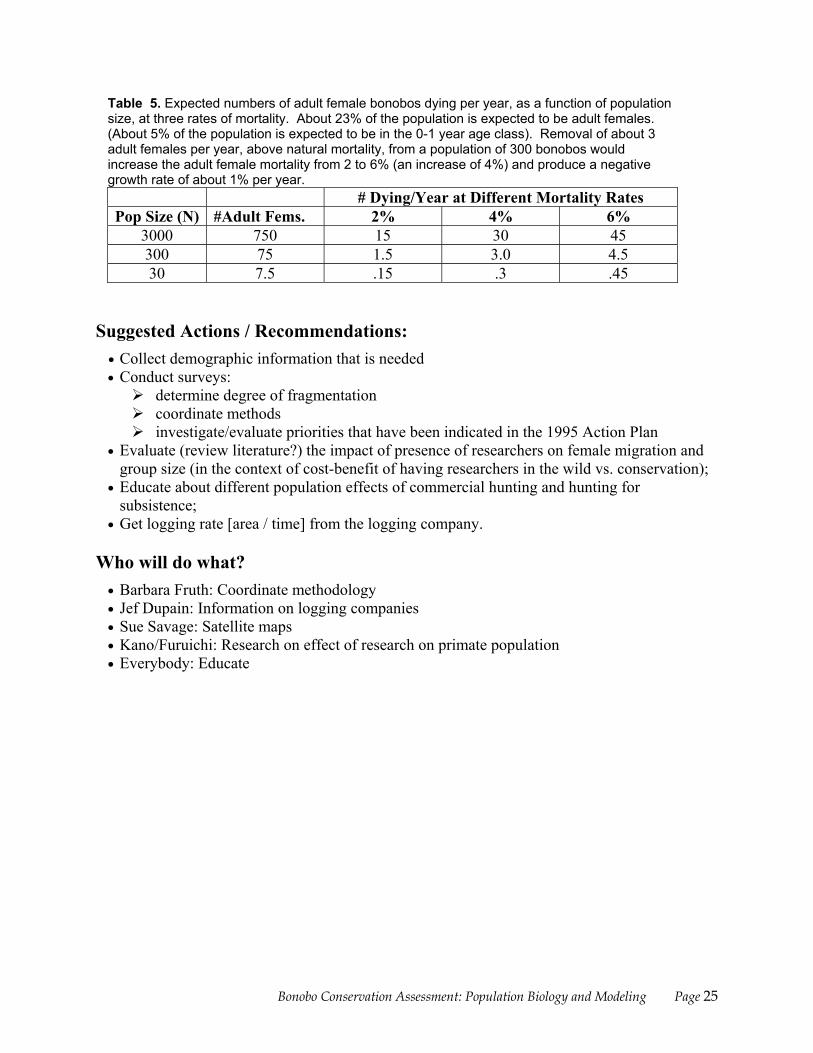
Given the sensitivity of the bonobo population dynamics to adult female mortality, what is the effect of removing females from populations of different sizes? Given the approximate proportion of adult females as 25% then it is possible to estimate how many additional females need to be removed to increase the mortality rate from 2 to 4 to 6%. The population will grow at 2%, be approximately stable at 4% and decline at 6% adult female mortality. The loss of an additional female every two years from a population of 30 is sufficient to guarantee its extinction (Table 5). A loss of only 1.5 to 3.0 additional females per year from a population of 300 will produce a negative population growth rate and eventual extinction (Table 5). These estimates indicate that bonobo populations cannot sustain even what might appear to be small additional losses on a continuing basis. The numbers can also assist design of the management scenarios needed to sustain viable wild populations over the long term. This rate of change is not measurable with the census techniques being used over short research time periods.
Bonobo Conservation Assessment: Population Biology and Modeling Page 25
Table 5. Expected numbers of adult female bonobos dying per year, as a function of population size, at three rates of mortality. About 23% of the population is expected to be adult females. (About 5% of the population is expected to be in the 0-1 year age class). Removal of about 3 adult females per year, above natural mortality, from a population of 300 bonobos would increase the adult female mortality from 2 to 6% (an increase of 4%) and produce a negative growth rate of about 1% per year. # Dying/Year at Different Mortality Rates Pop Size (N) #Adult Fems. 2% 4% 6%
3000 750 15 30 45 300 75 1.5 3.0 4.5 30 7.5 .15 .3 .45
Suggested Actions / Recommendations:
• Collect demographic information that is needed • Conduct surveys:
determine degree of fragmentation coordinate methods investigate/evaluate priorities that have been indicated in the 1995 Action Plan
• Evaluate (review literature?) the impact of presence of researchers on female migration and group size (in the context of cost-benefit of having researchers in the wild vs. conservation);
• Educate about different population effects of commercial hunting and hunting for subsistence;
• Get logging rate [area / time] from the logging company. Who will do what?
• Barbara Fruth: Coordinate methodology • Jef Dupain: Information on logging companies • Sue Savage: Satellite maps • Kano/Furuichi: Research on effect of research on primate population • Everybody: Educate

Page 26 Bonobo Conservation Assessment: Population Biology and Modeling
Bonobo Conservation Assessment
Workshop Report
Section IV References

Bonobo Conservation Assessment: References Page 29
References Akçakaya, H.R. 1997. RAMAS Metapop: Viability Analysis for Stage-Structured Metapopulations
(Version 2). Setauket, NY: Applied Biomathematics.
Baillie, J. and B. Groombridge (editors). 1996. IUCN Red List of Threatened Animals. Gland, International Union for the Conservation of Nature.
Dupain, J., E. Van Krunkelsven, L. Van Elsacker, and R.F. Verheyen. 2000. Current status of the Bonobo (Pan paniscus) in the Proposed Lomako Reserve (Democratic Republic of Congo). Biological Conservation 94:265-272.
IUCN. 1996a. African Primates. Status Survey and Conservation Action Plan. Revised Edition. IUCN, Gland, Switzerland, 88pp.
IUCN. 1996b. 1996 IUCN Red List of Threatened Animals. IUCN, Gland, Switzerland.
Miller, P.S., and R.C. Lacy. 1999. VORTEX: A Stochastic Simulation of the Extinction Process. Version 8 User’s Manual. Apple Valley, MN: Conservation Breeding Specialist Group (SSC/IUCN).
Thompson-Handler, N. R. K. Malenky, and G.E. Reinartz (editors). 1995. Action Plan for Pan Paniscus: Report on Free-Ranging Populations and Proposals for their Preservation. Milwaukee, Wisconsin: Zoological Society of Milwaukee County.
Werikhe, S., L. Macfie, N. Rosen, and P.S. Miller (editors). 1998. Can the Mountain Gorilla Survive? Population and Habitat Viability Assessment for Gorilla gorilla beringei. Apple Valley, MN: Conservation Breeding Specialist Group (SSC/IUCN).

Page 30 Bonobo Conservation Assessment: References
Bonobo Conservation Assessment
Workshop Report
Section V Workshop
Participants

Bonobo Conservation Assessment: Workshop Participants Page 33
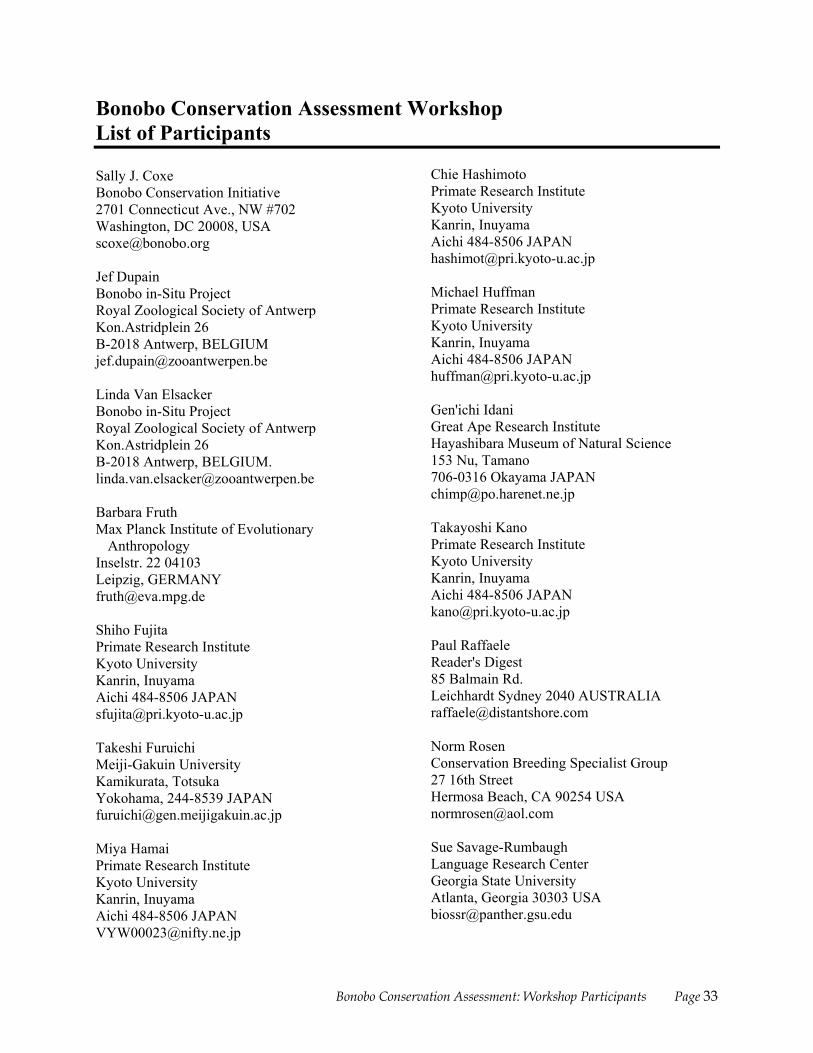
Bonobo Conservation Assessment Workshop List of Participants Sally J. Coxe Bonobo Conservation Initiative 2701 Connecticut Ave., NW #702 Washington, DC 20008, USA [email protected] Jef Dupain Bonobo in-Situ Project Royal Zoological Society of Antwerp Kon.Astridplein 26 B-2018 Antwerp, BELGIUM [email protected] Linda Van Elsacker Bonobo in-Situ Project Royal Zoological Society of Antwerp Kon.Astridplein 26 B-2018 Antwerp, BELGIUM. [email protected] Barbara Fruth Max Planck Institute of Evolutionary
Anthropology Inselstr. 22 04103 Leipzig, GERMANY [email protected] Shiho Fujita Primate Research Institute Kyoto University Kanrin, Inuyama Aichi 484-8506 JAPAN [email protected] Takeshi Furuichi Meiji-Gakuin University Kamikurata, Totsuka Yokohama, 244-8539 JAPAN [email protected]
Miya Hamai Primate Research Institute Kyoto University Kanrin, Inuyama Aichi 484-8506 JAPAN [email protected]
Chie Hashimoto Primate Research Institute Kyoto University Kanrin, Inuyama Aichi 484-8506 JAPAN [email protected] Michael Huffman Primate Research Institute Kyoto University Kanrin, Inuyama Aichi 484-8506 JAPAN [email protected] Gen'ichi Idani Great Ape Research Institute Hayashibara Museum of Natural Science 153 Nu, Tamano 706-0316 Okayama JAPAN [email protected]
Takayoshi Kano Primate Research Institute Kyoto University Kanrin, Inuyama Aichi 484-8506 JAPAN [email protected] Paul Raffaele Reader's Digest 85 Balmain Rd. Leichhardt Sydney 2040 AUSTRALIA [email protected] Norm Rosen Conservation Breeding Specialist Group 27 16th Street Hermosa Beach, CA 90254 USA [email protected]
Sue Savage-Rumbaugh Language Research Center Georgia State University Atlanta, Georgia 30303 USA [email protected]
Page 34 Bonobo Conservation Assessment: Workshop Participants
Ulie Seal Conservation Breeding Specialist Group 12101 Johnny Cake Ridge Road Apple Valley MN 55124-8151 USA [email protected] Yasuko Tashiro Primate Research Institute, Kyoto University Kanrin, Inuyama, Aichi 484-8506 JAPAN [email protected] Jo Thompson Lukuru Wildlife Research Project P.O.Box 5064 Snowmass Village, Colorado, 81615-5064 USA [email protected]
Shigeo Uehara Primate Research Institute Kyoto University Kanrin, Inuyama Aichi 484-8506 JAPAN [email protected] Richard Wrangham Peabody Museum Harvard University 11 Divinity Avenue, Cambridge, MA 02138 USA [email protected]
Bonobo Conservation Assessment
Workshop Report
Section VI Appendices


37

38

39

Page 40 Bonobo Conservation Assessment: Appendices

Bonobo Conservation Assessment: Appendices Page 41

Page 42 Bonobo Conservation Assessment: Appendices

Bonobo Conservation Assessment: Appendices Page 43

Page 44 Bonobo Conservation Assessment: Appendices
Bonobo Conservation Assessment: Appendices Page 45
Appendix II: Update of status of pending survey of the Salonga National Park (Fax transmission sent to Inuyama by Project Coordinator Gay Reinartz) I have some bonobo sighting data for the Salonga’s north sector taken during a preliminary reconnaissance to the park – please note that these data are so few, that no statistically valid density estimates can be obtained (contrary to unauthorized reports). Nevertheless, we are preparing the data into a preliminary note for publication. For purposes of the workshop, I can say from our analyses of encounter rates taken by Inogwabini Bila Isia that signs of poaching along access routes in Salonga are as numerous as sings of large mammals. Bonobo nest sights were encountered, thus confirming a resident population in the northeast portion of the northern sector- density appears to be low, but we refrain from actual estimates. Our future plans: Zoological Society of Milwaukee Programs in Congo (as announced at IPS Congress 1996): (1) Survey of Pan paniscus: The most urgent conservation need for the bonobo is to obtain critical information on the distribution and size of wild bonobo populations - only then will it be possible to develop an effective conservation strategy to protect the species. Therefore, in 1997 in collaboration with the Institut Congolais pour la Conservation de la Nature (ICCN) and Zoo Atlanta’s Africa Biodiversity Program, the ZSM launched the first regional quantitative survey to determine the status of bonobos in the Salonga National Park, Democratic Republic of Congo. The Salonga, the only federally protected area for the bonobo, was created in 1970 specifically to protect bonobos, but it has never been determined whether a sustainable population actually lives there. The Salonga represents one of Africa’s most important regions of biodiversity and harbors many species of conservation concern. Preservation of bonobos in the Salonga and elsewhere in Congo means protection of a broad range of rare, endemic or threatened species. The first phase of this project, a reconnaissance of the Salonga’s northern sector completed in 1998, verified the existence of bonobos within the Salonga north sector and the feasibility of a comprehensive survey. The next phase, the full-scale survey, will span approximately 12-18 months and will use the latest techniques in wildlife surveys to estimate bonobo density throughout sectors of the park. The survey will lay groundwork for regional bonobo population monitoring and will serve as a model for future surveys needed throughout the bonobo’s range. Delayed by the civil war, the fieldwork will resume as soon as possible when peace returns to the region. In the meantime, we continue fundraising efforts to ensure as early a start date as possible. (2) Training Field Biologists: In order for the Congolese to lead bonobo conservation efforts and make informed decisions, they must be given technical training in biological inventory and wildlife surveys. Therefore, in tandem with the survey, up to 20 Congolese trainees, 9 or more will be chosen to conduct the survey. Such skills are the basis for and effective wildlife-monitoring program and can be transferred to other species and conservation sites. Support and collaboration with ICCN: The ZSM currently supplies direct technical and financial assistance to the ICCN central office with oversight by the German Technical Cooperation and provides information relevant to conservation and the Salonga National Park Moreover, as an ICCN partner we are providing direct field expertise to survey elephants during the bonobo survey as part of the international program, Monitoring of Illegal Killing of Elephants (CITES/IUCN). (3) Habitat Protection: The Salonga National Park is currently receiving little or no financial support because of the war currently underway in the Congo. The ZSM is exploring means to help support approximately 50 park guards for one year and pay an equivalent of their annual salary. Remote Sensing
Page 46 Bonobo Conservation Assessment: Appendices
Study: As part of the survey, the ZSM is collaboration with the University of Maryland to conduct a vegetation analyses of satellite images of the Salonga region. From these studies, we develop a tool to identify the forest types in which bonobos and other large mammals most likely occur. Once forest types are verified over the course of the field survey, we will be able to extrapolate these findings to predict the occurrence of species throughout their range. The satellite images are also important to monitor forest degradation and human impact. At the moment, war is escalating and there is heavy fighting reported in the region of Basankusu, Boende, and the east. The Salonga appears to be nearly surrounded by the rebel advance. Gay Reinartz Zoological Society of Milwaukee
Bonobo Conservation Assessment: Appendices Page 47
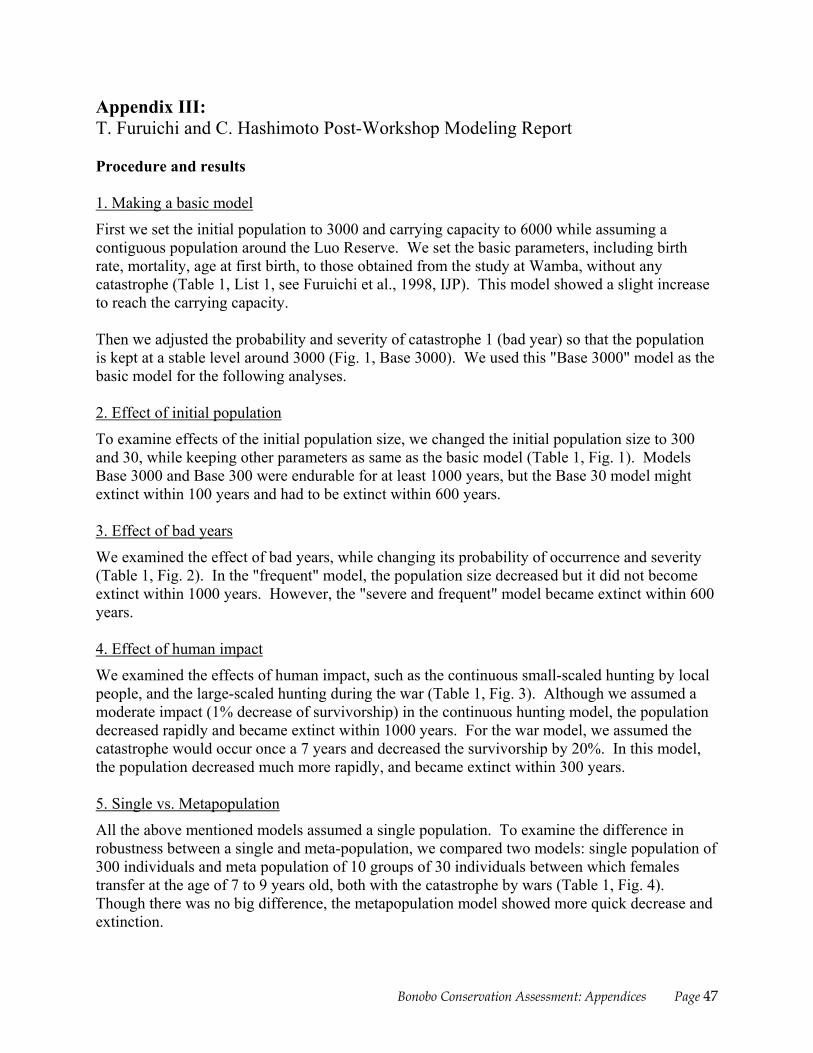
Appendix III: T. Furuichi and C. Hashimoto Post-Workshop Modeling Report Procedure and results 1. Making a basic model
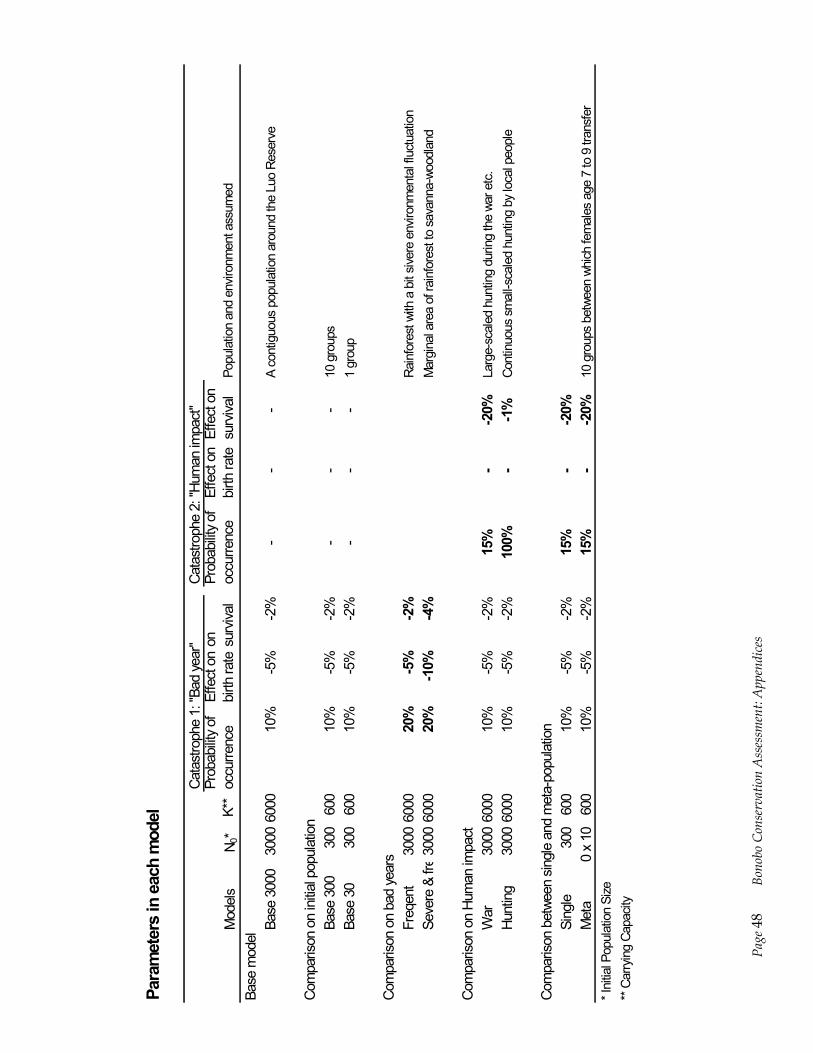
First we set the initial population to 3000 and carrying capacity to 6000 while assuming a contiguous population around the Luo Reserve. We set the basic parameters, including birth rate, mortality, age at first birth, to those obtained from the study at Wamba, without any catastrophe (Table 1, List 1, see Furuichi et al., 1998, IJP). This model showed a slight increase to reach the carrying capacity. Then we adjusted the probability and severity of catastrophe 1 (bad year) so that the population is kept at a stable level around 3000 (Fig. 1, Base 3000). We used this "Base 3000" model as the basic model for the following analyses. 2. Effect of initial population
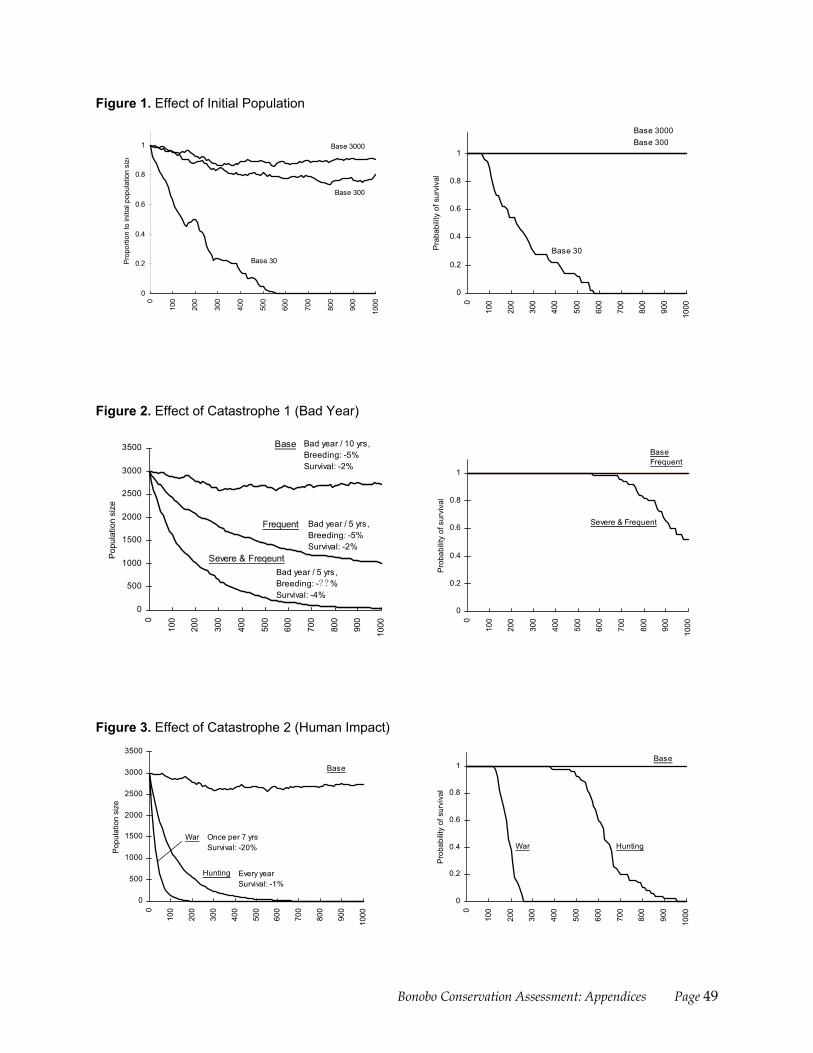
To examine effects of the initial population size, we changed the initial population size to 300 and 30, while keeping other parameters as same as the basic model (Table 1, Fig. 1). Models Base 3000 and Base 300 were endurable for at least 1000 years, but the Base 30 model might extinct within 100 years and had to be extinct within 600 years.
3. Effect of bad years
We examined the effect of bad years, while changing its probability of occurrence and severity (Table 1, Fig. 2). In the "frequent" model, the population size decreased but it did not become extinct within 1000 years. However, the "severe and frequent" model became extinct within 600 years. 4. Effect of human impact
We examined the effects of human impact, such as the continuous small-scaled hunting by local people, and the large-scaled hunting during the war (Table 1, Fig. 3). Although we assumed a moderate impact (1% decrease of survivorship) in the continuous hunting model, the population decreased rapidly and became extinct within 1000 years. For the war model, we assumed the catastrophe would occur once a 7 years and decreased the survivorship by 20%. In this model, the population decreased much more rapidly, and became extinct within 300 years. 5. Single vs. Metapopulation
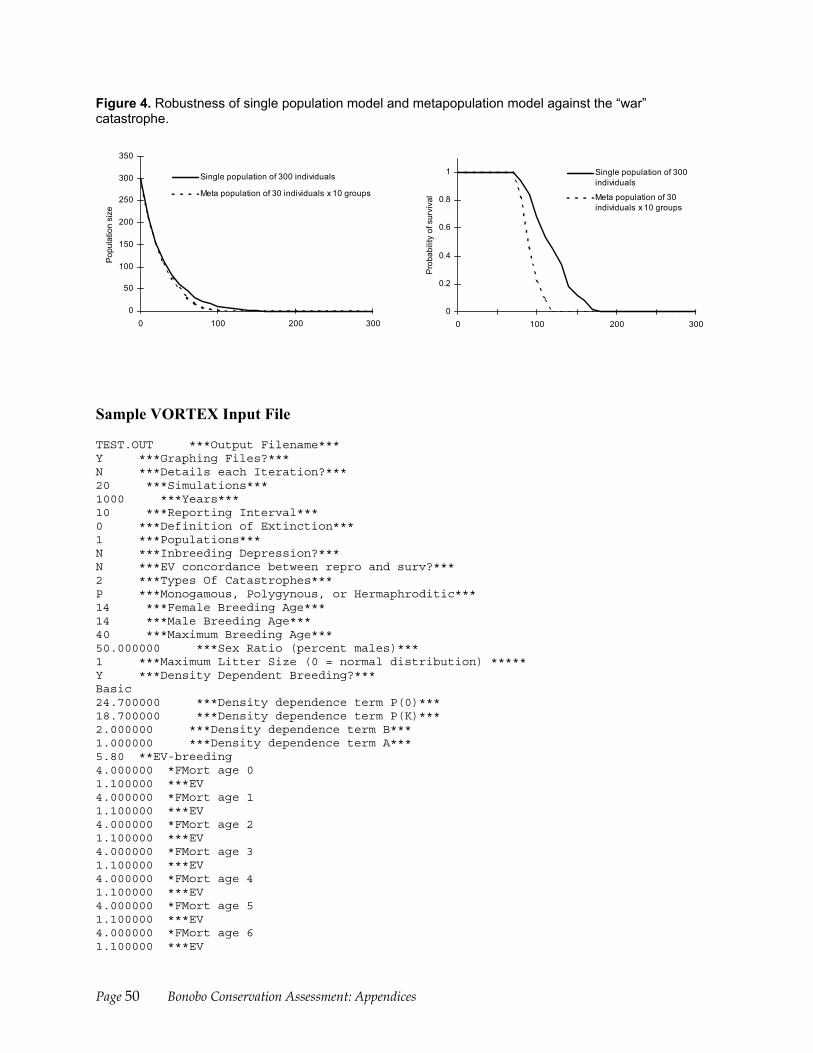
All the above mentioned models assumed a single population. To examine the difference in robustness between a single and meta-population, we compared two models: single population of 300 individuals and meta population of 10 groups of 30 individuals between which females transfer at the age of 7 to 9 years old, both with the catastrophe by wars (Table 1, Fig. 4). Though there was no big difference, the metapopulation model showed more quick decrease and extinction.
Page
48
Bono
bo C
onse
rvat
ion
Ass
essm
ent:
App
endi
ces
Para
met
ers
in e
ach
mod
el
Cata
stro
phe
1: "B
ad ye
ar"
Cata
stro
phe
2: "H
uman
impa
ct"
Mod
els
N 0*
K**
Prob
abilit
y of
occu
rrenc
eEf
fect
on
birth
rate
on
surv
ival
Prob
abilit
y of
occu
rrenc
eEf
fect
on
birth
rate
Effe
ct o
n su
rviva
lPo
pula
tion
and
envir
onm
ent a
ssum
ed
Base
mod
elBa
se 3
000
3000
6000
10%
-5%
-2%
--
-A
cont
iguo
us p
opul
atio
n ar
ound
the
Luo
Rese
rve
Com
paris
on o
n in
itial p
opul
atio
nBa
se 3
0030
060
010
%-5
%-2
%-
--
10 g
roup
sBa
se 3
030
060
010
%-5
%-2
%-
--
1 gr
oup
Com
paris
on o
n ba
d ye
ars
Freq
ent
3000
6000
20%
-5%
-2%
Rain
fore
st w
ith a
bit
siver
e en
viron
men
tal f
luct
uatio
nSe
vere
& fr
e30
0060
0020
%-1
0%-4
%M
argi
nal a
rea
of ra
info
rest
to s
avan
na-w
oodl
and
Com
paris
on o
n Hu
man
impa
ctW
ar30
0060
0010
%-5
%-2
%15
%-
-20%
Larg
e-sc
aled
hun
ting
durin
g th
e wa
r etc
.Hu
ntin
g30
0060
0010
%-5
%-2
%10
0%-
-1%
Cont
inuo
us s
mal
l-sca
led
hunt
ing
by lo
cal p
eopl
e
Com
paris
on b
etwe
en s
ingl
e an
d m
eta-
popu
latio
nSi
ngle
300
600
10%
-5%
-2%
15%
--2
0%M
eta
0 x
1060
010
%-5
%-2
%15
%-
-20%
10 g
roup
s be
twee
n wh
ich fe
mal
es a
ge 7
to 9
tran
sfer
* Ini
tial P
opul
atio
n Si
ze**
Car
ryin
g Ca
pacit
y
Bonobo Conservation Assessment: Appendices Page 49
Figure 1. Effect of Initial Population
Figure 2. Effect of Catastrophe 1 (Bad Year)
Figure 3. Effect of Catastrophe 2 (Human Impact)
0
0.2
0.4
0.6
0.8
10
100
200
300
400
500
600
700
800
900
1000
Prop
ortio
n to
initi
al p
opul
atio
n si
ze
Base 3000
Base 300
Base 30
0
0.2
0.4
0.6
0.8
1
0
100
200
300
400
500
600
700
800
900
1000
Prab
abilit
y of
sur
viva
l
Base 3000Base 300
Base 30
0
500
1000
1500
2000
2500
3000
3500
0
100
200
300
400
500
600
700
800
900
1000
Popu
latio
n si
ze
Bad year / 10 yrs, Breeding: -5% Survival: -2%
Bad year / 5 yrs, Breeding: -5%Survival: -2%
Bad year / 5 yrs, Breeding: -? ?%Survival: -4%
Base
Frequent
Severe & Freqeunt
0
0.2
0.4
0.6
0.8
10
100
200
300
400
500
600
700
800
900
1000
Prob
abilit
y of
sur
viva
lBaseFrequent
Severe & Frequent
0
500
1000
1500
2000
2500
3000
3500
0
100
200
300
400
500
600
700
800
900
1000
Popu
latio
n si
ze
Base
War
Hunting
Once per 7 yrsSurvival: -20%
Every yearSurvival: -1%
0
0.2
0.4
0.6
0.8
1
0
100
200
300
400
500
600
700
800
900
1000
Prob
abilit
y of
sur
viva
l
Base
War Hunting
Page 50 Bonobo Conservation Assessment: Appendices
Figure 4. Robustness of single population model and metapopulation model against the “war” catastrophe.
Sample VORTEX Input File TEST.OUT ***Output Filename***Y ***Graphing Files?***N ***Details each Iteration?***20 ***Simulations***1000 ***Years***10 ***Reporting Interval***0 ***Definition of Extinction***1 ***Populations***N ***Inbreeding Depression?***N ***EV concordance between repro and surv?***2 ***Types Of Catastrophes***P ***Monogamous, Polygynous, or Hermaphroditic***14 ***Female Breeding Age***14 ***Male Breeding Age***40 ***Maximum Breeding Age***50.000000 ***Sex Ratio (percent males)***1 ***Maximum Litter Size (0 = normal distribution) *****Y ***Density Dependent Breeding?***Basic24.700000 ***Density dependence term P(0)***18.700000 ***Density dependence term P(K)***2.000000 ***Density dependence term B***1.000000 ***Density dependence term A***5.80 **EV-breeding4.000000 *FMort age 01.100000 ***EV4.000000 *FMort age 11.100000 ***EV4.000000 *FMort age 21.100000 ***EV4.000000 *FMort age 31.100000 ***EV4.000000 *FMort age 41.100000 ***EV4.000000 *FMort age 51.100000 ***EV4.000000 *FMort age 61.100000 ***EV
0
50
100
150
200
250
300
350
0 100 200 300
Popu
latio
n si
ze
Single population of 300 individuals
Meta population of 30 individuals x 10 groups
0
0.2
0.4
0.6
0.8
1
0 100 200 300
Prob
abilit
y of
sur
viva
l
Single population of 300individuals
Meta population of 30individuals x 10 groups
Bonobo Conservation Assessment: Appendices Page 51
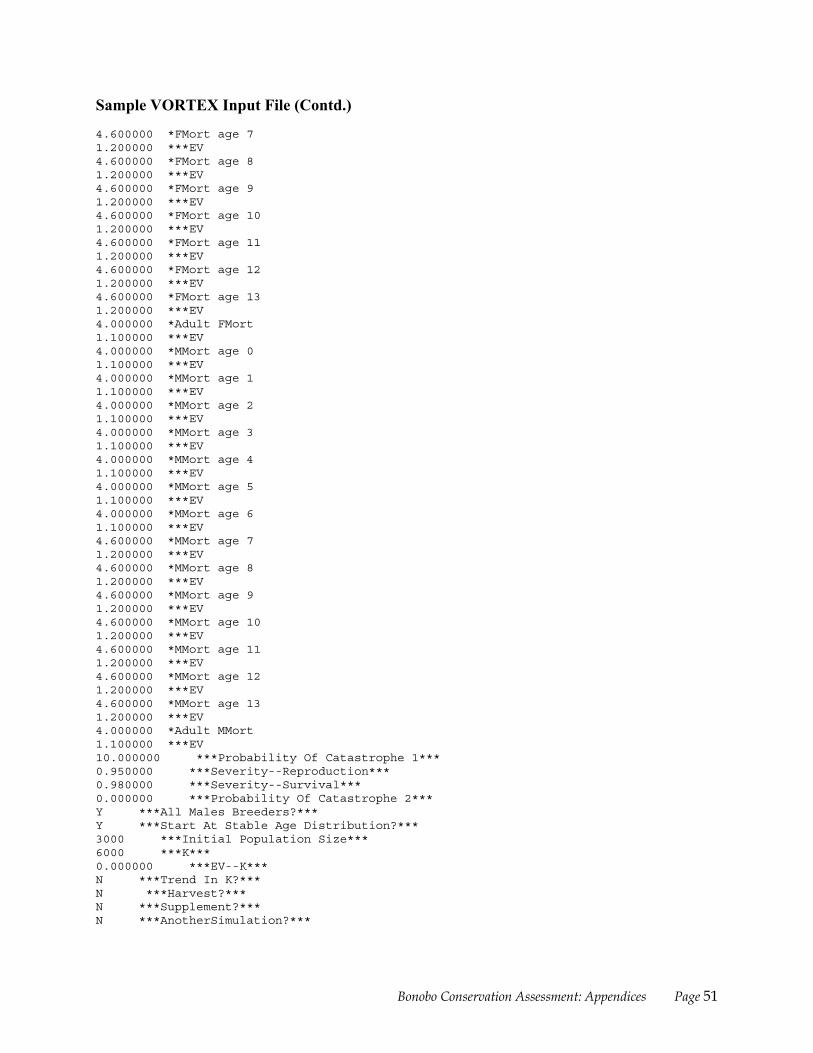
Sample VORTEX Input File (Contd.)
4.600000 *FMort age 71.200000 ***EV4.600000 *FMort age 81.200000 ***EV4.600000 *FMort age 91.200000 ***EV4.600000 *FMort age 101.200000 ***EV4.600000 *FMort age 111.200000 ***EV4.600000 *FMort age 121.200000 ***EV4.600000 *FMort age 131.200000 ***EV4.000000 *Adult FMort1.100000 ***EV4.000000 *MMort age 01.100000 ***EV4.000000 *MMort age 11.100000 ***EV4.000000 *MMort age 21.100000 ***EV4.000000 *MMort age 31.100000 ***EV4.000000 *MMort age 41.100000 ***EV4.000000 *MMort age 51.100000 ***EV4.000000 *MMort age 61.100000 ***EV4.600000 *MMort age 71.200000 ***EV4.600000 *MMort age 81.200000 ***EV4.600000 *MMort age 91.200000 ***EV4.600000 *MMort age 101.200000 ***EV4.600000 *MMort age 111.200000 ***EV4.600000 *MMort age 121.200000 ***EV4.600000 *MMort age 131.200000 ***EV4.000000 *Adult MMort1.100000 ***EV10.000000 ***Probability Of Catastrophe 1***0.950000 ***Severity--Reproduction***0.980000 ***Severity--Survival***0.000000 ***Probability Of Catastrophe 2***Y ***All Males Breeders?***Y ***Start At Stable Age Distribution?***3000 ***Initial Population Size***6000 ***K***0.000000 ***EV--K***N ***Trend In K?***N ***Harvest?***N ***Supplement?***N ***AnotherSimulation?***
Related Documents