May 2020 Edition Bloomberg Crypto Outlook Bloomberg Crypto Outlook Bitcoin Demand Exceeding Supply Bitcoin Supported by Favorable Supply, Demand and Macroeconomics Bitcoin Becoming More Gold-Like vs. the Forest of Crypto Assets Bitcoin Surpassing $8,000 Inflection Point vs. 3,000 S&P 500 Record Bitcoin Futures, GBTC Interest and Increasing Adoption On-Chain Indicators -- More Adoption, Price Appreciation May 2020 Edition Bloomberg Galaxy Crypto Index (BGCI) 1

Welcome message from author
This document is posted to help you gain knowledge. Please leave a comment to let me know what you think about it! Share it to your friends and learn new things together.
Transcript
May 2020 Edition Bloomberg Crypto Outlook
Bloomberg Crypto Outlook
Bitcoin Demand Exceeding Supply
Bitcoin Supported by Favorable Supply, Demand and Macroeconomics
Bitcoin Becoming More Gold-Like vs. the Forest of Crypto Assets
Bitcoin Surpassing $8,000 Inflection Point vs. 3,000 S&P 500
Record Bitcoin Futures, GBTC Interest and Increasing Adoption
On-Chain Indicators -- More Adoption, Price Appreciation
May 2020 Edition Bloomberg Galaxy Crypto Index (BGCI)
1

May 2020 Edition Bloomberg Crypto Outlook
CONTENTS
3 Overview 3 Macro Bitcoin Vs. Crowded Forest 3 Bitcoin Gaining Vs. Equities
4 Brightening Bitcoin Futures
5 Onchain Metrics March Upward
2
May 2020 Edition Bloomberg Crypto Outlook
Data and outlook as of May 4, 2020
Mike McGlone – BI Senior Commodity Strategist
BI COMD (the commodity dashboard)
Note ‐ Click on graphics to get to the Bloomberg termina
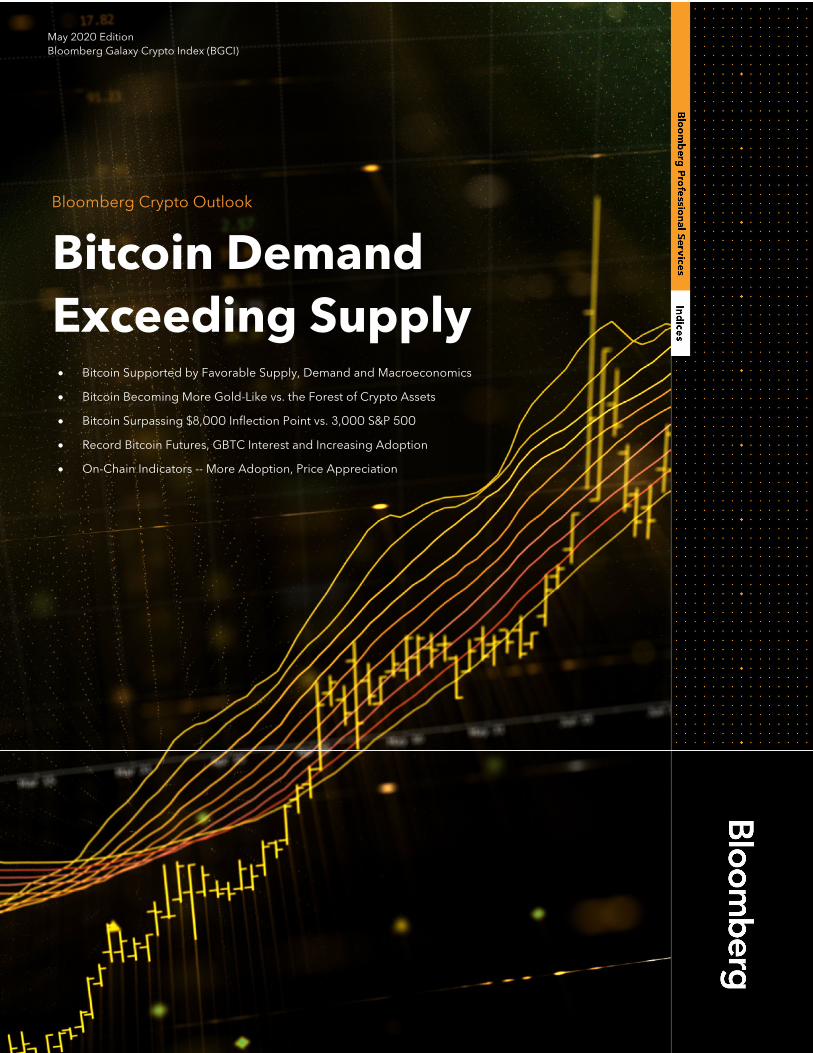
Bitcoin Supported by Favorable Supply, Demand and Macroeconomics Performance: Bloomberg Galaxy Cypto Index (BGCI) April +36%, 2020 to May 4 +32%, One-year +9% Bitcoin April +36%, 2020 +25%, One-year +57% (Bloomberg Intelligence) -- Diminishing supply, increasing demand and a favorable macroeconomic backdrop sustain our favorable view of Bitcoin's price outlook. In May, the daily production of new coins will drop by half, and unlike quasi-currency brethren gold, higher prices won't be an incentive for more supply. Perceptions of Bitcoin will continue to transition toward a gold-like store of value and away from a risk asset. The first-born crypto's volatility is in decline vs. rising for equities. Restricted supply means adoption is the metric that matters, and most indications remain positive in an unprecedented environment where virtually every central bank is aggressively adding liquidity. We expect the broad crypto market, as measured by the Bloomberg Galaxy Crypto Index, to continue to follow Bitcoin's lead. Macro Bitcoin Vs. Crowded Forest Bitcoin Becoming More Gold-Like vs. the Forest of Crypto Assets. Accounting for almost 70% of all crypto-asset market capitalization, Bitcoin has attained the gold standard, which will endure, in our view. A favorable macroeconomic environment and increasing adoption should sustain the first-born crypto's outperformance vs. its brethren. One-Year Performance Trends Gaining Endurance
Previous Reset Firms Bitcoin Foundation. Bitcoin's outperformance vs. most assets on a one-year basis is a trend we expect to endure. The swift recovery from the March risk-off swoon, which dropped the crypto from about unchanged since the start of May 2019, to almost a 70% gain to May 4 is indicative of Bitcoin's pattern for most of its history. In an unprecedented year due to the coronavirus, we see gold and Bitcoin sustaining the upper hand on the back of unparalleled central-bank monetary stimulus. Representing the mostly oversupplied crypto market, the Bloomberg Galaxy Crypto Index should continue underperforming the first born, which is becoming more like gold. More central-bank support is likely if equities stumble, thus supporting Bitcoin and gold.
Bitcoin Gaining Vs. Equities
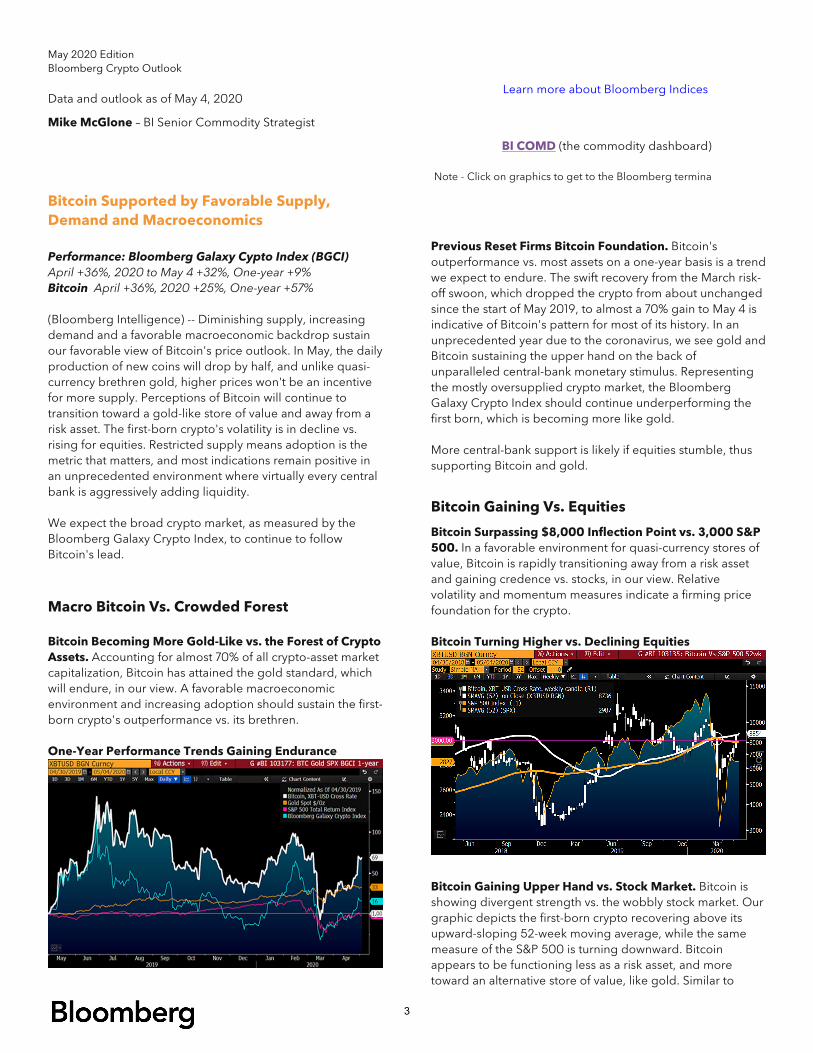
Bitcoin Surpassing $8,000 Inflection Point vs. 3,000 S&P 500. In a favorable environment for quasi-currency stores of value, Bitcoin is rapidly transitioning away from a risk asset and gaining credence vs. stocks, in our view. Relative volatility and momentum measures indicate a firming price foundation for the crypto. Bitcoin Turning Higher vs. Declining Equities
Bitcoin Gaining Upper Hand vs. Stock Market. Bitcoin is showing divergent strength vs. the wobbly stock market. Our graphic depicts the first-born crypto recovering above its upward-sloping 52-week moving average, while the same measure of the S&P 500 is turning downward. Bitcoin appears to be functioning less as a risk asset, and more toward an alternative store of value, like gold. Similar to
Learn more about Bloomberg Indices
3
May 2020 Edition Bloomberg Crypto Outlook
about 3,000 on the benchmark stock index, $8,000 has been a key pivot point for much of the past year in the crypto. Bitcoin sustaining above $8,000 is a sign of increasing momentum and detachment from the stock market beta-pull, notably when it drops rapidly like in March. Just under 3,000 is the approximate 2019 S&P 500 mean, median and mode. Sustaining above this level is necessary to indicate strength. New Lows in Bitcoin Risk vs. Equities. Bitcoin volatility has never been lower vs. the stock market, favoring price appreciation in the crypto, if history is a guide. Our graphic shows the ratio of Bitcoin's 180-day volatility vs. the same gauge on the S&P 500 dropping to a new low. The previous nadir in this relative-risk metric came in 2015-16, as the ratio of the Bitcoin price-to-S&P 500 began a rapid acceleration to 7 from about 0.2 in 2017. Near 3 since, the drop to new lows in the relative-volatility ratio indicates a firming Bitcoin price foundation vs. the stock market. Bitcoin Relative-Risk Measure Is Plunging
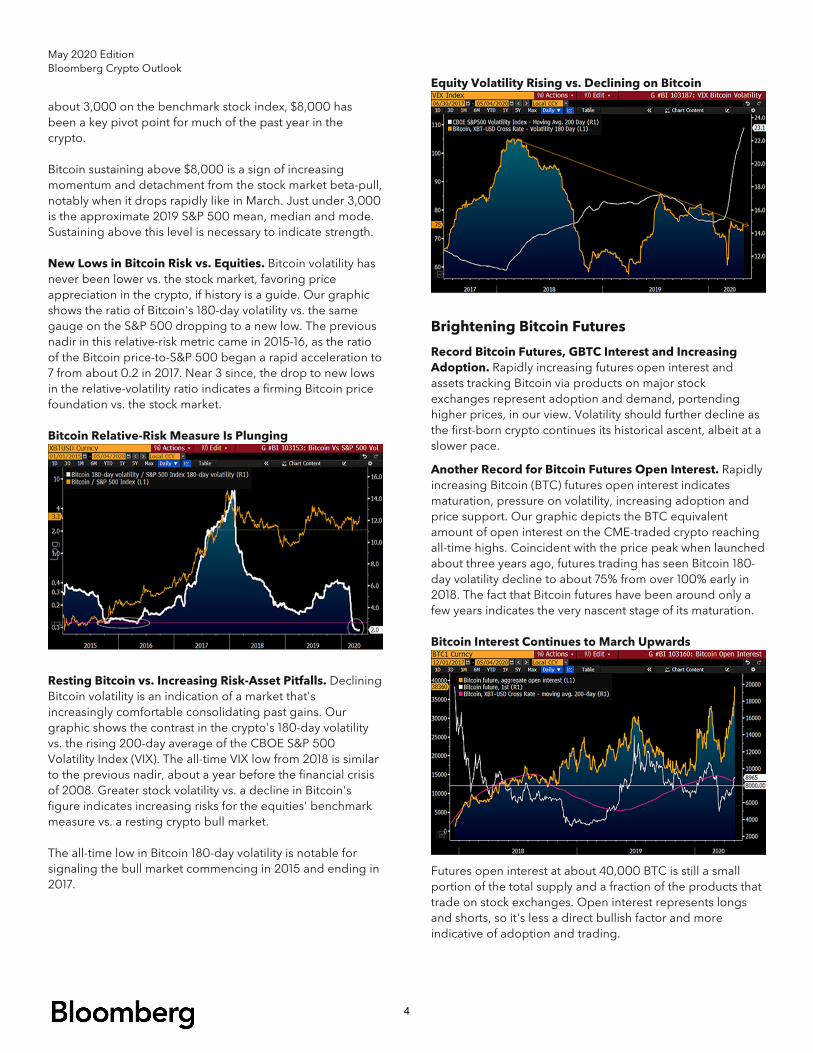
Resting Bitcoin vs. Increasing Risk-Asset Pitfalls. Declining Bitcoin volatility is an indication of a market that's increasingly comfortable consolidating past gains. Our graphic shows the contrast in the crypto's 180-day volatility vs. the rising 200-day average of the CBOE S&P 500 Volatility Index (VIX). The all-time VIX low from 2018 is similar to the previous nadir, about a year before the financial crisis of 2008. Greater stock volatility vs. a decline in Bitcoin's figure indicates increasing risks for the equities' benchmark measure vs. a resting crypto bull market. The all-time low in Bitcoin 180-day volatility is notable for signaling the bull market commencing in 2015 and ending in 2017.
Equity Volatility Rising vs. Declining on Bitcoin
Brightening Bitcoin Futures
Record Bitcoin Futures, GBTC Interest and Increasing Adoption. Rapidly increasing futures open interest and assets tracking Bitcoin via products on major stock exchanges represent adoption and demand, portending higher prices, in our view. Volatility should further decline as the first-born crypto continues its historical ascent, albeit at a slower pace.
Another Record for Bitcoin Futures Open Interest. Rapidly increasing Bitcoin (BTC) futures open interest indicates maturation, pressure on volatility, increasing adoption and price support. Our graphic depicts the BTC equivalent amount of open interest on the CME-traded crypto reaching all-time highs. Coincident with the price peak when launched about three years ago, futures trading has seen Bitcoin 180-day volatility decline to about 75% from over 100% early in 2018. The fact that Bitcoin futures have been around only a few years indicates the very nascent stage of its maturation. Bitcoin Interest Continues to March Upwards
Futures open interest at about 40,000 BTC is still a small portion of the total supply and a fraction of the products that trade on stock exchanges. Open interest represents longs and shorts, so it's less a direct bullish factor and more indicative of adoption and trading.
4
May 2020 Edition Bloomberg Crypto Outlook
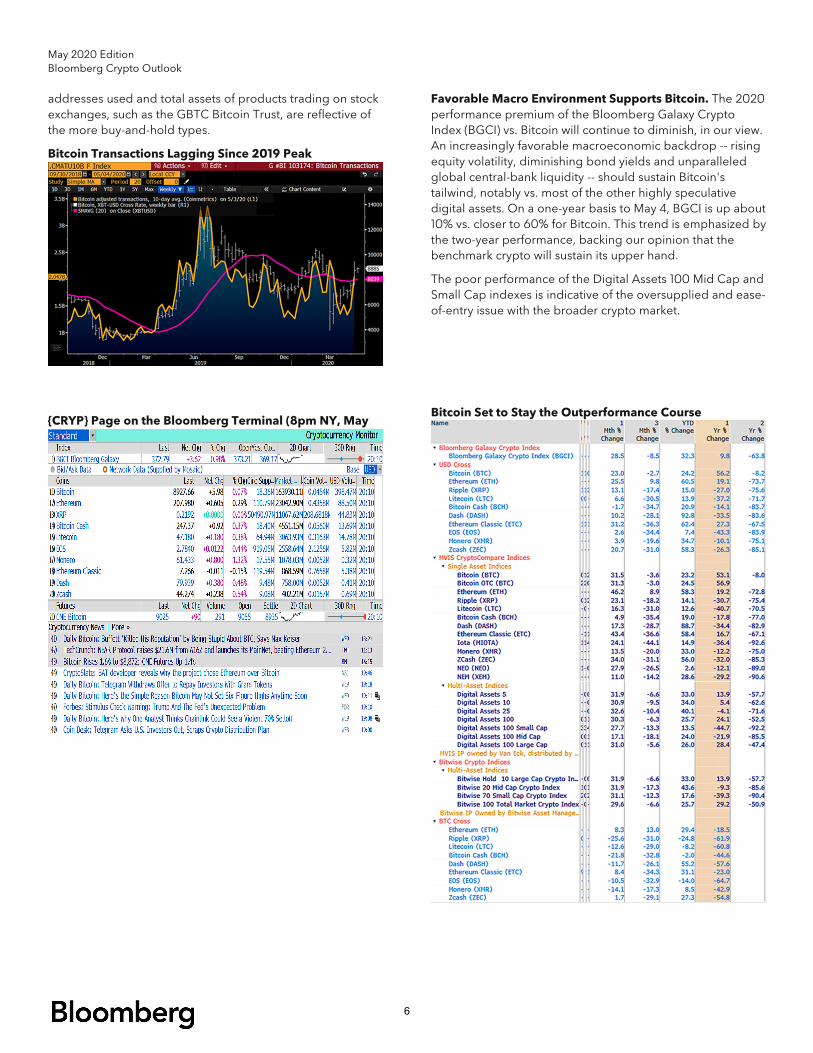
Increasing Bitcoin and Buy-and-Hold Types. Indicating dip buyers, assets under management (AUM) of the Grayscale Bitcoin Trust (GBTC) continue to advance. Our graphic depicts recent new highs and the accelerating AUM of the largest crypto-asset exchange traded instrument. What's notable is the recent record high in this demand metric occurred on the back of the March swoon in Bitcoin's price, as the stock market plunged. It's an indication of support below Bitcoin -- investors have been responsive buyers on price declines. At about 330,000 Bitcoin equivalents at the beginning of May, GBTC represents about 2% of supply. GBTC Total Assets Now About 2% of Bitcoin Supply
Just over two years ago, when Bitcoin (BTC) was about the same $9,000 price as May 4, GBTC AUM represented almost 1% of supply. The trust trades with a premium, which somewhat overstates the BTC equivalents, but also emphasizes demand.
Onchain Metrics March Upward
Bitcoin On-Chain Indicators -- More Adoption, Price Appreciation. On-chain metrics point toward a firming Bitcoin price foundation. Addresses used are nearing last year's high, when the crypto peaked at about $14,000, and the advancing hash rate (notably vs. next-in-line Ethereum), indicate the digital-gold attributes of Bitcoin vs. the broader market.
Bitcoin Addresses Approaching 2019 Highs. The Bitcoin price inclination is to continue advancing, if based on increasing addresses used. Reflecting greater adoption, the 10-day average of unique addresses from Coinmetrics is nearing last year's high. In 2019, when this metric exceeded the previous peak, it preceded the recovery in the Bitcoin price. The breakout higher about a year ago initially stopped at about $5,000, which was the approximate low-close in the March swoon. What was resistance has transitioned to support.
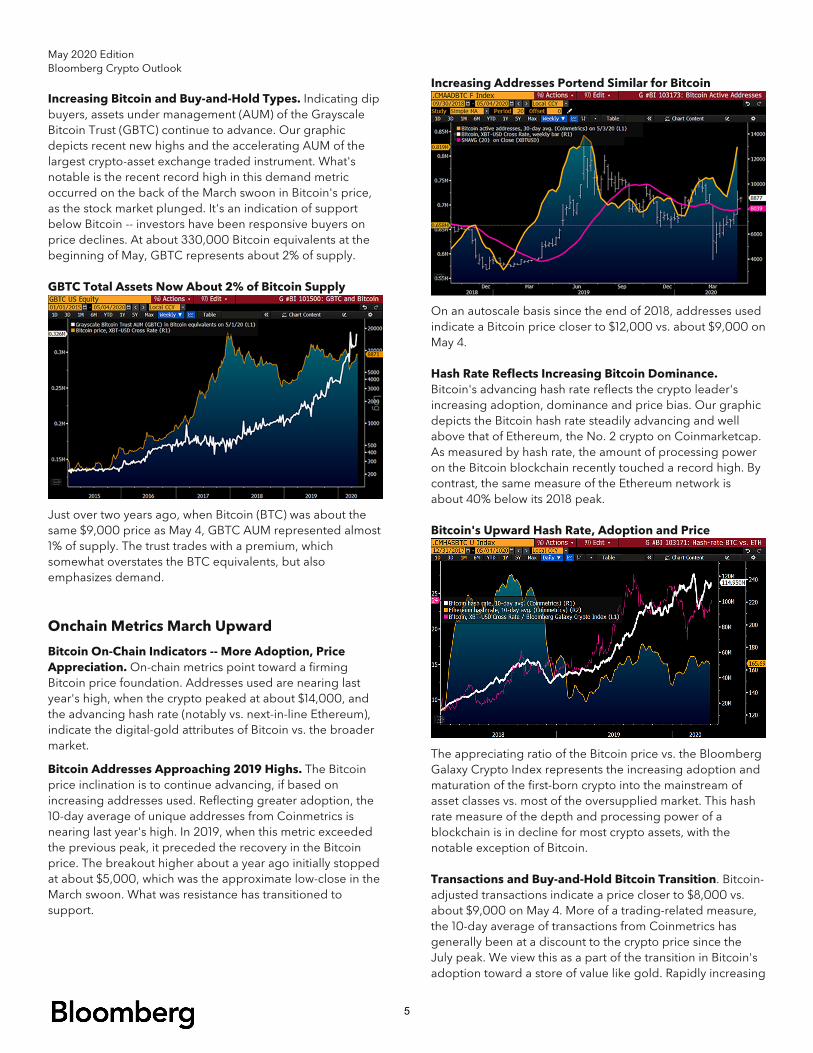
Increasing Addresses Portend Similar for Bitcoin
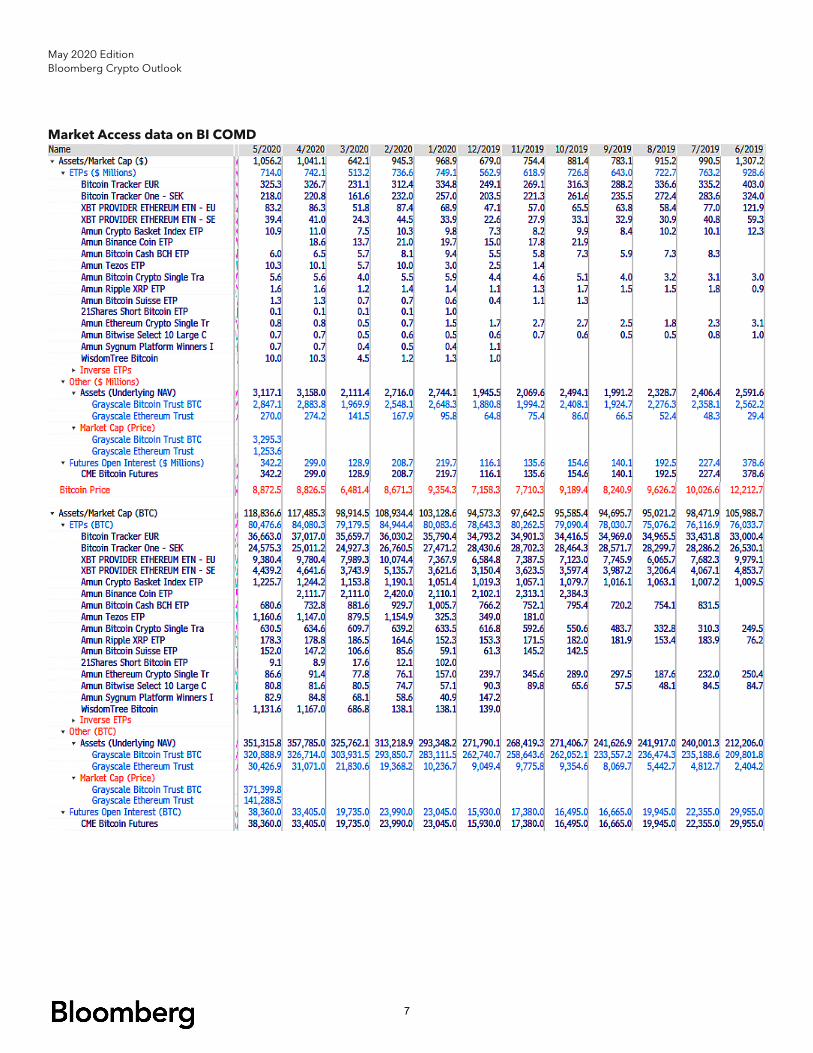
On an autoscale basis since the end of 2018, addresses used indicate a Bitcoin price closer to $12,000 vs. about $9,000 on May 4. Hash Rate Reflects Increasing Bitcoin Dominance. Bitcoin's advancing hash rate reflects the crypto leader's increasing adoption, dominance and price bias. Our graphic depicts the Bitcoin hash rate steadily advancing and well above that of Ethereum, the No. 2 crypto on Coinmarketcap. As measured by hash rate, the amount of processing power on the Bitcoin blockchain recently touched a record high. By contrast, the same measure of the Ethereum network is about 40% below its 2018 peak. Bitcoin's Upward Hash Rate, Adoption and Price
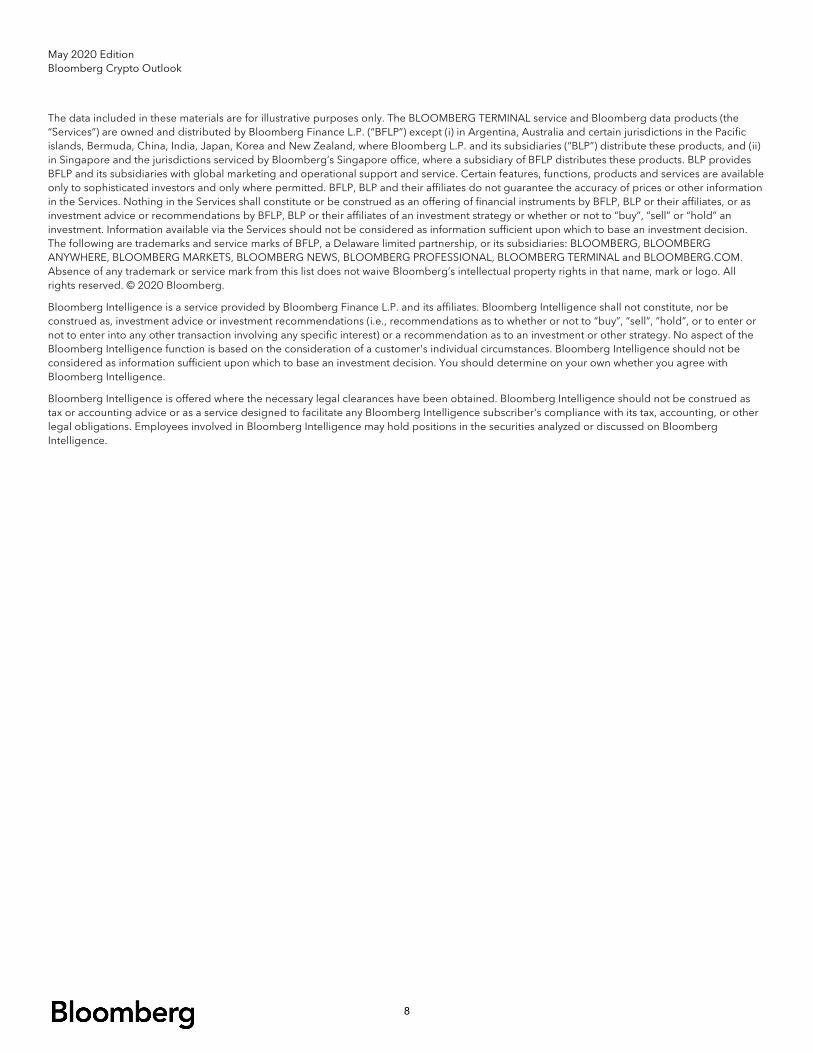
The appreciating ratio of the Bitcoin price vs. the Bloomberg Galaxy Crypto Index represents the increasing adoption and maturation of the first-born crypto into the mainstream of asset classes vs. most of the oversupplied market. This hash rate measure of the depth and processing power of a blockchain is in decline for most crypto assets, with the notable exception of Bitcoin. Transactions and Buy-and-Hold Bitcoin Transition. Bitcoin-adjusted transactions indicate a price closer to $8,000 vs. about $9,000 on May 4. More of a trading-related measure, the 10-day average of transactions from Coinmetrics has generally been at a discount to the crypto price since the July peak. We view this as a part of the transition in Bitcoin's adoption toward a store of value like gold. Rapidly increasing
5
May 2020 Edition Bloomberg Crypto Outlook
addresses used and total assets of products trading on stock exchanges, such as the GBTC Bitcoin Trust, are reflective of the more buy-and-hold types.
Bitcoin Transactions Lagging Since 2019 Peak
{CRYP} Page on the Bloomberg Terminal (8pm NY, May
Favorable Macro Environment Supports Bitcoin. The 2020 performance premium of the Bloomberg Galaxy Crypto Index (BGCI) vs. Bitcoin will continue to diminish, in our view. An increasingly favorable macroeconomic backdrop -- rising equity volatility, diminishing bond yields and unparalleled global central-bank liquidity -- should sustain Bitcoin's tailwind, notably vs. most of the other highly speculative digital assets. On a one-year basis to May 4, BGCI is up about 10% vs. closer to 60% for Bitcoin. This trend is emphasized by the two-year performance, backing our opinion that the benchmark crypto will sustain its upper hand.
The poor performance of the Digital Assets 100 Mid Cap and Small Cap indexes is indicative of the oversupplied and ease-of-entry issue with the broader crypto market.
Bitcoin Set to Stay the Outperformance Course
6
May 2020 Edition Bloomberg Crypto Outlook
Market Access data on BI COMD
7
May 2020 Edition Bloomberg Crypto Outlook
The data included in these materials are for illustrative purposes only. The BLOOMBERG TERMINAL service and Bloomberg data products (the “Services”) are owned and distributed by Bloomberg Finance L.P. (“BFLP”) except (i) in Argentina, Australia and certain jurisdictions in the Pacific islands, Bermuda, China, India, Japan, Korea and New Zealand, where Bloomberg L.P. and its subsidiaries (“BLP”) distribute these products, and (ii) in Singapore and the jurisdictions serviced by Bloomberg’s Singapore office, where a subsidiary of BFLP distributes these products. BLP provides BFLP and its subsidiaries with global marketing and operational support and service. Certain features, functions, products and services are available only to sophisticated investors and only where permitted. BFLP, BLP and their affiliates do not guarantee the accuracy of prices or other information in the Services. Nothing in the Services shall constitute or be construed as an offering of financial instruments by BFLP, BLP or their affiliates, or as investment advice or recommendations by BFLP, BLP or their affiliates of an investment strategy or whether or not to “buy”, “sell” or “hold” an investment. Information available via the Services should not be considered as information sufficient upon which to base an investment decision. The following are trademarks and service marks of BFLP, a Delaware limited partnership, or its subsidiaries: BLOOMBERG, BLOOMBERG ANYWHERE, BLOOMBERG MARKETS, BLOOMBERG NEWS, BLOOMBERG PROFESSIONAL, BLOOMBERG TERMINAL and BLOOMBERG.COM. Absence of any trademark or service mark from this list does not waive Bloomberg’s intellectual property rights in that name, mark or logo. All rights reserved. © 2020 Bloomberg.
Bloomberg Intelligence is a service provided by Bloomberg Finance L.P. and its affiliates. Bloomberg Intelligence shall not constitute, nor be construed as, investment advice or investment recommendations (i.e., recommendations as to whether or not to “buy”, “sell”, “hold”, or to enter or not to enter into any other transaction involving any specific interest) or a recommendation as to an investment or other strategy. No aspect of the Bloomberg Intelligence function is based on the consideration of a customer's individual circumstances. Bloomberg Intelligence should not be considered as information sufficient upon which to base an investment decision. You should determine on your own whether you agree with Bloomberg Intelligence.
Bloomberg Intelligence is offered where the necessary legal clearances have been obtained. Bloomberg Intelligence should not be construed as tax or accounting advice or as a service designed to facilitate any Bloomberg Intelligence subscriber's compliance with its tax, accounting, or other legal obligations. Employees involved in Bloomberg Intelligence may hold positions in the securities analyzed or discussed on Bloomberg Intelligence.
8
Related Documents