Bloomberg Commodity Outlook – October 2018 Edition Bloomberg Commodity Index (BCOM) Bull Market Discount - Back to support, commodities are ripe to revisit resistance - Energy's dominance set to trickle up - Copper to lead metals' bull-market mission of discount reduction - Corn, soybeans and wheat among the ags longing for brighter days - Commodities' divergent strength vs. the dollar, EM Data and outlook as of September 28 Mike McGlone – BI Senior Commodity Strategist BI COMD (the commodity dashboard Discounts Could Prod Broad Commodities Into Bull Market Mode Performance: Sept. +1.9%, YTD -2.0%, Spot -1.1%. (Returns are total return (TR) unless noted) (Bloomberg Intelligence) -- Commodities appear to be a bull market beginning to respond favorably to discounted prices. Energy is the primary sector at a premium, which should give way some to metals, at a discount. Agriculture remains the weakest sector, but with limited downside as it shows divergent strength despite a near perfect storm for lower prices this year. All storms pass. Looking a year ahead, broad commodities should be higher, though a stronger U.S. dollar and declining China growth are key risk factors. Trade tension fears should subside, while the 23% drawdown in copper is an indication that the correction has gone a bit too far. Crude oil did the same a year ago, setting the stage for recovery. Commodities Showing Divergent Strength to Dollar Back to Support, Commodities Are Ripe to Revisit Resistance. A little too hot in 2Q, then too cold in 3Q, broad commodities should have a just-right 4Q to get back the bull. Pressure from dollar strength and trade tensions should dissipate, allowing the remaining sectors to play some catch-up to strong energy. Commodity Dip Pivoting to Recovery. Absent sustained U.S. dollar strength, the broad commodity market is poised to resume its upward march. Early in 2016, the commodity bottom preceded the dollar peak later that year. Greenback strength this year has coincided with a 10% Bloomberg Commodity Spot Index correction -- about the same as last year's drawdown. We see a similar outcome this time around. Trade tensions are at the forefront, with coincident weakness in China's yuan. Looking to a year from now, some mean reversion and resolution is more likely. The Bloomberg Commodity Spot Index has initially backed away from the halfway mark of the range established from the 2008 low to 2011 peak. Following the correction back into upward trending support, commodities are poised for a sustained recovery toward the upper end of the range. Favorable Futures Trends Support Commodities Broad Market Outlook 1 Energy 4 Metals 7 Agriculture 11 DATA PERFORMANCE: 14 Overview, Commodity TR, Prices, Volatility CURVE ANALYSIS: 17 Contango/Backwardation, Roll Yields, Forwards/Forecasts MARKET FLOWS: 24 Open Interest, Volume, COT, ETFs PERFORMANCE 27 Note ‐ Click on graphics to get to the Bloomberg terminal

Welcome message from author
This document is posted to help you gain knowledge. Please leave a comment to let me know what you think about it! Share it to your friends and learn new things together.
Transcript
Bloomberg Commodity Outlook – October 2018 Edition Bloomberg Commodity Index (BCOM)
Bull Market Discount - Back to support, commodities are ripe to revisit resistance- Energy's dominance set to trickle up- Copper to lead metals' bull-market mission of discount reduction- Corn, soybeans and wheat among the ags longing for brighter days- Commodities' divergent strength vs. the dollar, EM
Data and outlook as of September 28
Mike McGlone – BI Senior Commodity Strategist BI COMD (the commodity dashboard
Discounts Could Prod Broad Commodities Into Bull Market ModePerformance: Sept. +1.9%, YTD -2.0%, Spot -1.1%. (Returns are total return (TR) unless noted)
(Bloomberg Intelligence) -- Commodities appear to be a bull market beginning to respond favorably to discounted prices. Energy is the primary sector at a premium, which should give way some to metals, at a discount. Agriculture remains the weakest sector, but with limited downside as it shows divergent strength despite a near perfect storm for lower prices this year. All storms pass. Looking a year ahead, broad commodities should be higher, though a stronger U.S. dollar and declining China growth are key risk factors.
Trade tension fears should subside, while the 23% drawdown in copper is an indication that the correction has gone a bit too far. Crude oil did the same a year ago, setting the stage for recovery.
Commodities Showing Divergent Strength to Dollar
Back to Support, Commodities Are Ripe to Revisit Resistance. A little too hot in 2Q, then too cold in 3Q,
broad commodities should have a just-right 4Q to get back the bull. Pressure from dollar strength and trade tensions should dissipate, allowing the remaining sectors to play some catch-up to strong energy.
Commodity Dip Pivoting to Recovery. Absent sustained U.S. dollar strength, the broad commodity market is poised to resume its upward march. Early in 2016, the commodity bottom preceded the dollar peak later that year. Greenback strength this year has coincided with a 10% Bloomberg Commodity Spot Index correction -- about the same as last year's drawdown. We see a similar outcome this time around. Trade tensions are at the forefront, with coincident weakness in China's yuan. Looking to a year from now, some mean reversion and resolution is more likely.
The Bloomberg Commodity Spot Index has initially backed away from the halfway mark of the range established from the 2008 low to 2011 peak. Following the correction back into upward trending support, commodities are poised for a sustained recovery toward the upper end of the range.
Favorable Futures Trends Support Commodities
Broad Market Outlook 1 Energy 4 Metals 7 Agriculture 11
DATAPERFORMANCE: 14 Overview, Commodity TR, Prices, Volatility CURVE ANALYSIS: 17 Contango/Backwardation, Roll Yields, Forwards/Forecasts MARKET FLOWS: 24 Open Interest, Volume, COT, ETFs PERFORMANCE 27
Note ‐ Click on graphics to get to the Bloomberg terminal
Bloomberg Commodity Outlook – October 2018 Edition Bloomberg Commodity Index (BCOM)
Futures Indicate Commodities Poised for Recovery. Speculative net longs that are near their lowest levels in this bull market, along with favorable trends (increasing open interest and flattening futures curves), indicate that the commodity market's correction is about complete. Pointing to increasing participation, open interest continues to climb, yet the managed-money net position (speculators) percentage is near 2017's low. A sign of favorable demand vs. supply conditions, the weighted average of one-year futures curves for Bloomberg Commodity Index constituents continues to gravitate toward backwardation.
Contrast this with the VIX Volatility Index, which is at its lowest-for-longest levels in its three-decade history. Indications from futures favor commodities vs. stocks.
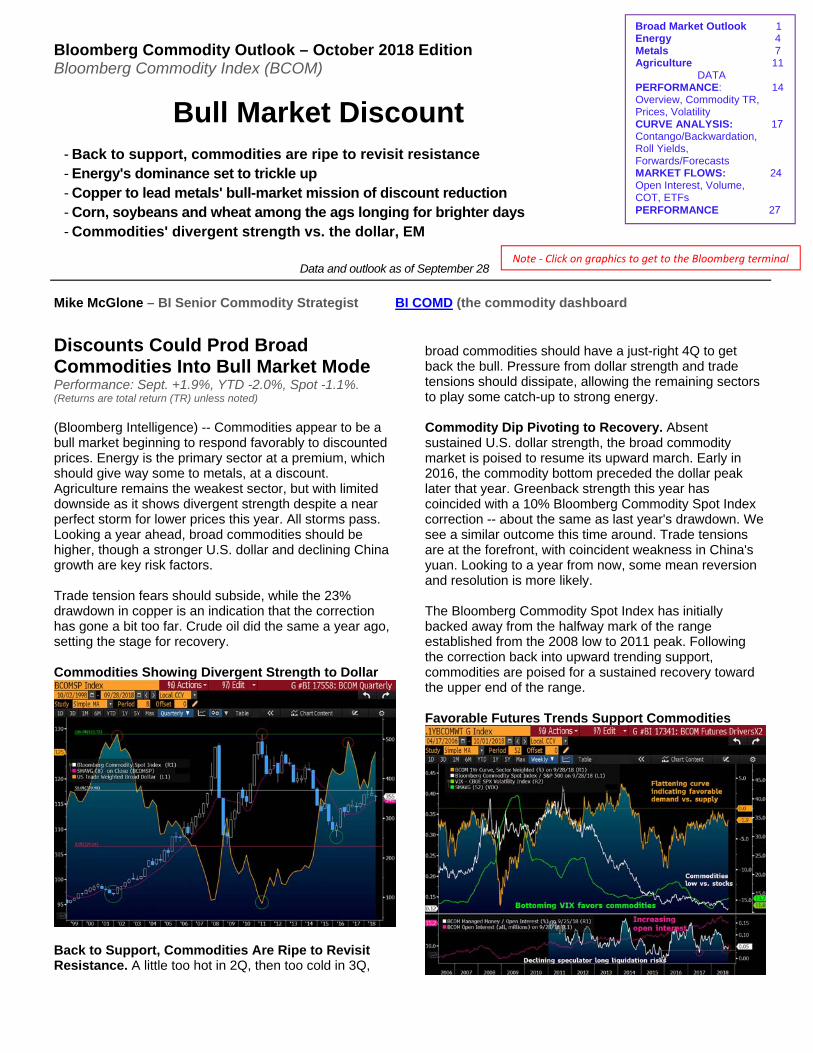
Copper vs. Gold, Elevated Shorts Support Bonds. Record net-short positions in Treasury futures appear too extreme for further bond-yield advances, particularly with commodities in decline. At about 16% of open interest in Treasuries and 10- and five-year futures, managed-money net shorts are the greatest since 1995. A 10% level in this measure has marked past extremes. It's rare for yields to increase when commodities are in decline. Since May, when the Bloomberg Commodity Spot Index reached a four-year high coincident with a seven-year peak in the 10-year Treasury, commodities have corrected 10%.
Futures Shorts, Copper/Gold Indicate Lower Yields
Perhaps more significant is the sharp decline in the copper-to-gold spread, a primary bond-yield companion. The copper-to-gold ratio has returned to unchanged from a year ago, when the 10-year yield was about 100 bps lower.
MACRO PERFORMANCE
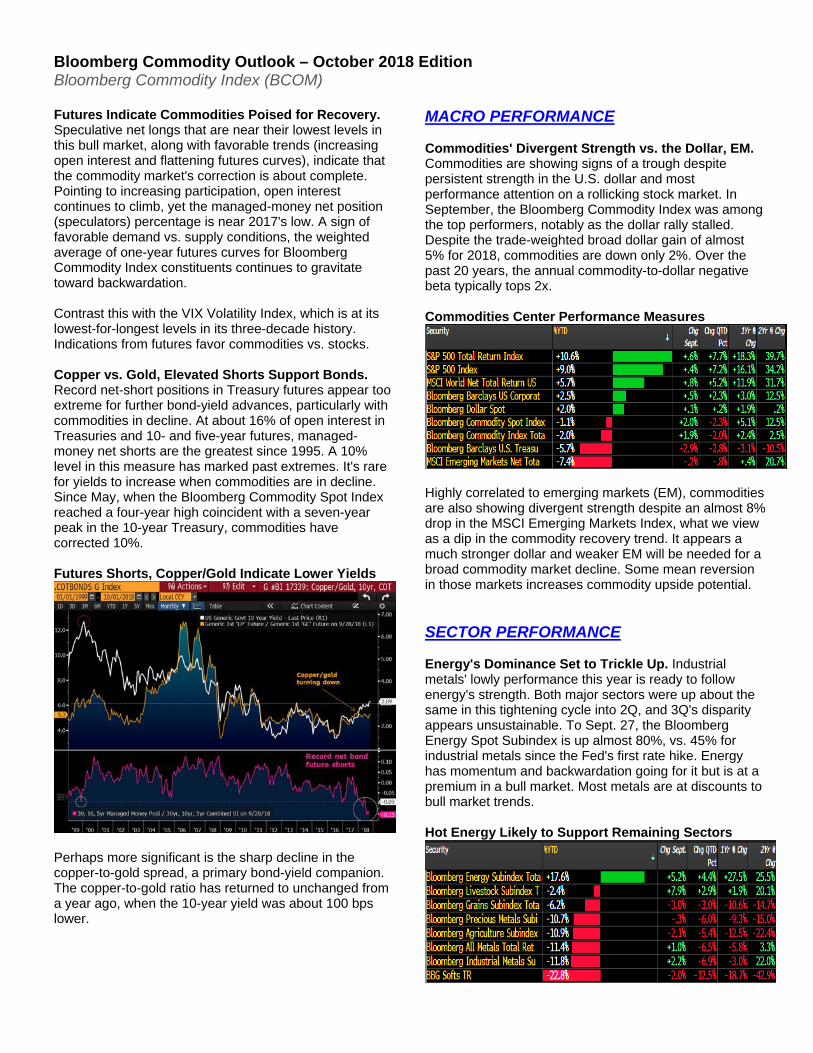
Commodities' Divergent Strength vs. the Dollar, EM. Commodities are showing signs of a trough despite persistent strength in the U.S. dollar and most performance attention on a rollicking stock market. In September, the Bloomberg Commodity Index was among the top performers, notably as the dollar rally stalled. Despite the trade-weighted broad dollar gain of almost 5% for 2018, commodities are down only 2%. Over the past 20 years, the annual commodity-to-dollar negative beta typically tops 2x.
Commodities Center Performance Measures
Highly correlated to emerging markets (EM), commodities are also showing divergent strength despite an almost 8% drop in the MSCI Emerging Markets Index, what we view as a dip in the commodity recovery trend. It appears a much stronger dollar and weaker EM will be needed for a broad commodity market decline. Some mean reversion in those markets increases commodity upside potential.
SECTOR PERFORMANCE
Energy's Dominance Set to Trickle Up. Industrial metals' lowly performance this year is ready to follow energy's strength. Both major sectors were up about the same in this tightening cycle into 2Q, and 3Q's disparity appears unsustainable. To Sept. 27, the Bloomberg Energy Spot Subindex is up almost 80%, vs. 45% for industrial metals since the Fed's first rate hike. Energy has momentum and backwardation going for it but is at a premium in a bull market. Most metals are at discounts to bull market trends.
Hot Energy Likely to Support Remaining Sectors
Bloomberg Commodity Outlook – October 2018 Edition Bloomberg Commodity Index (BCOM)
A 5% drop in grains' total return reflects steep contango as the spot index is up about 3% despite trade tensions, an exceptional Corn Belt growing season and Brazil's plunging real. We see a bottom for grains. Led by sugar and coffee, softs reflect the weak real, but a year from now, most of the bearish forces should be alleviated.
ATTRIBUTION
Strong Energy Contribution May Gain Companions. Energy being the sole contributor to broad commodity returns in 2018 may be a risk, but the sector is more likely to gain some partners. Base metals and agriculture appear the most likely to follow the 420 bps of index total returns attributable from energy through Sept. 27. Agriculture, notably pressured by trade tensions and new lows in the Brazil real vs. the U.S. dollar, is effectively offsetting energy, subtracting about 360 bps of total returns. The strong dollar pressure is notably evident in metals. Precious metals have subtracted almost 190 bps from total returns on the back of a 230-bp pull from base metals.
BCOM Index Attribution by Sector - 2018 YTD
Hurricane Florence helped livestock recover from being a drag on total returns, a boost that appears set to begin contributing in 4Q.
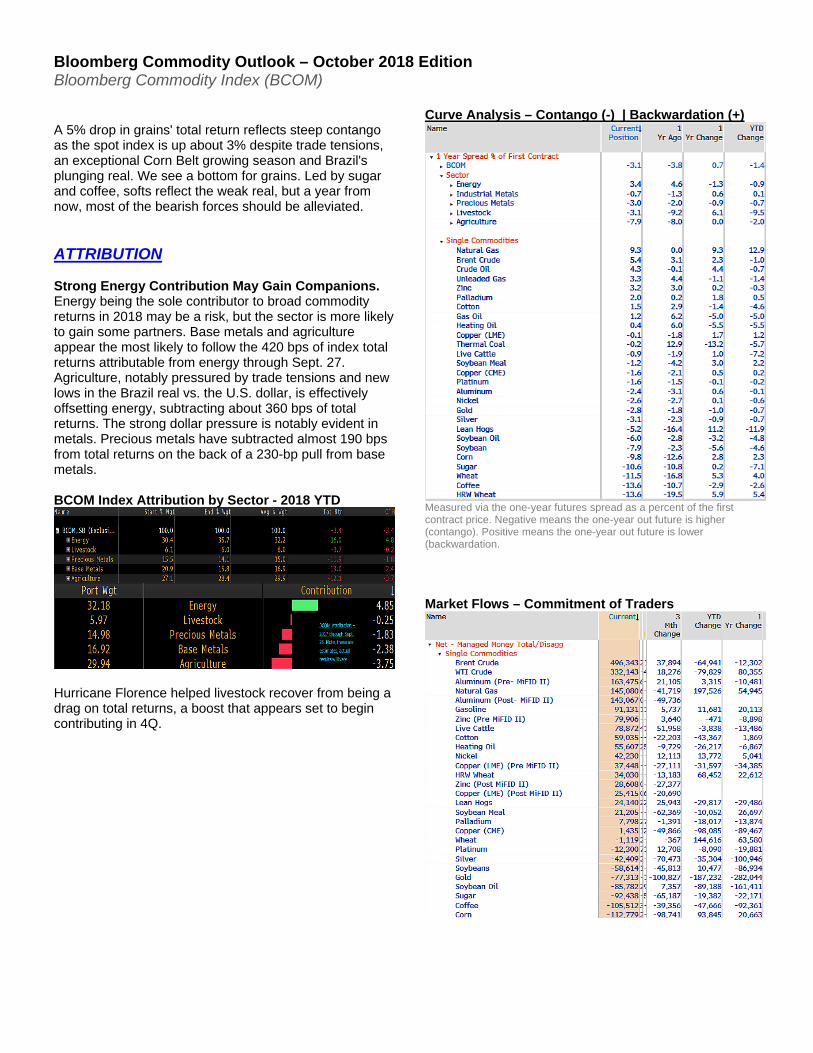
Curve Analysis – Contango (-) | Backwardation (+)
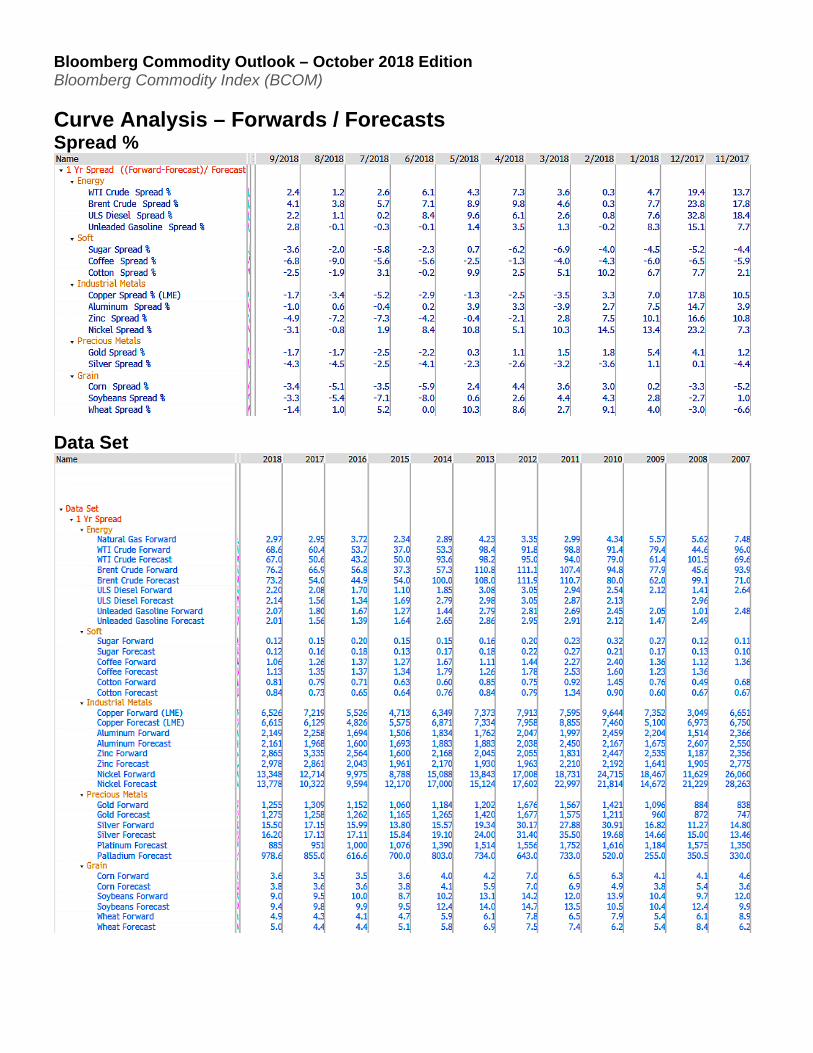
Measured via the one-year futures spread as a percent of the first contract price. Negative means the one-year out future is higher (contango). Positive means the one-year out future is lower (backwardation.
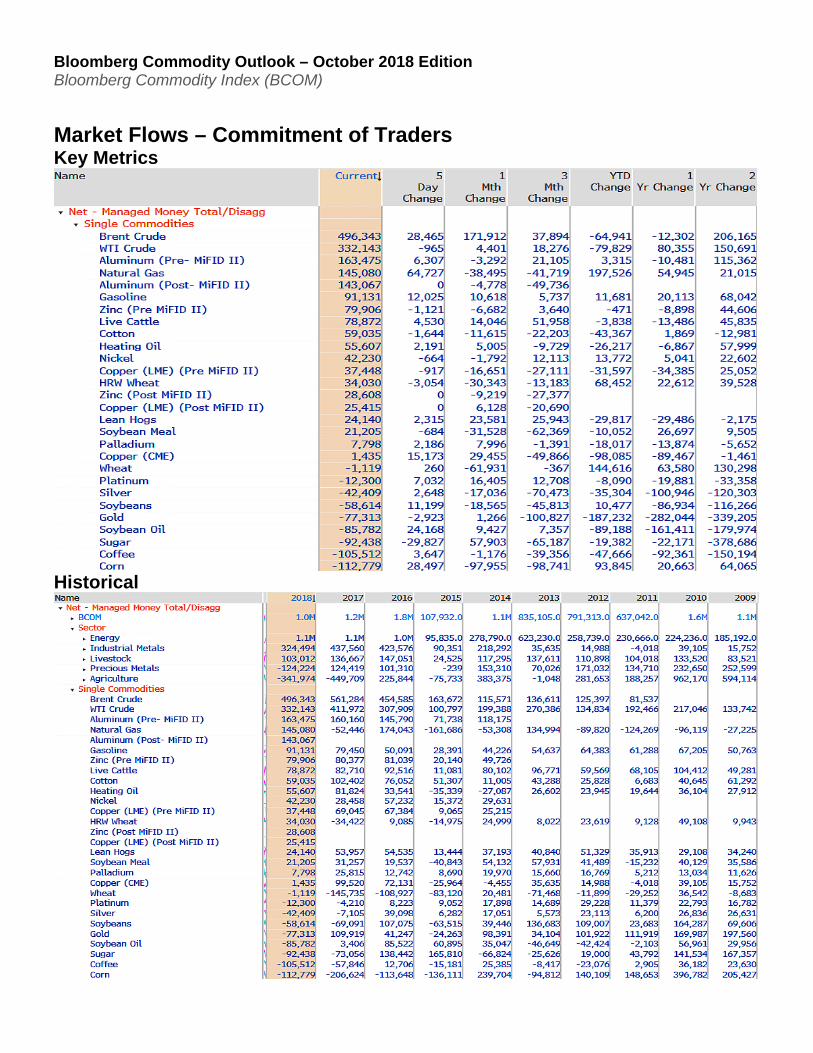
Market Flows – Commitment of Traders
Bloomberg Commodity Outlook – October 2018 Edition Bloomberg Commodity Index (BCOM)
Energy (Index weight: 29% of BCOM)Performance: Sept. +5.2%, YTD +17.6, Spot +15.7% *Note index weights are the YTD average.
Crude Oil Bull Ripe for Gas
Crude-Oil Bull Near Extremes May Be Passing Baton to Natural Gas. Crude oil is likely entering an extended range trade. The rally is stretched, with bull-market drivers nearing exhaustion. Recent calls for $100-a-barrel Brent are indicative of excessive exuberance,contrasting with bear-market fear last year in the midst ofa 20%-plus drawdown. The copper bull market has adiscount on its side. Crude oil doesn't, but it's gotmomentum, backwardation and positive carry, though thetrend in the one-year futures curve has reached amultiyear peak. Positive demand vs. supply and stocks-to-use trends also appear extended. Iran's productiondeclines are typically offset by Saudi Arabia.
Natural gas is caged within its most compressed and extended range in futures history, with positive drivers. Upside-breakout potential outweighs downside risks.
Caged Crude Oil
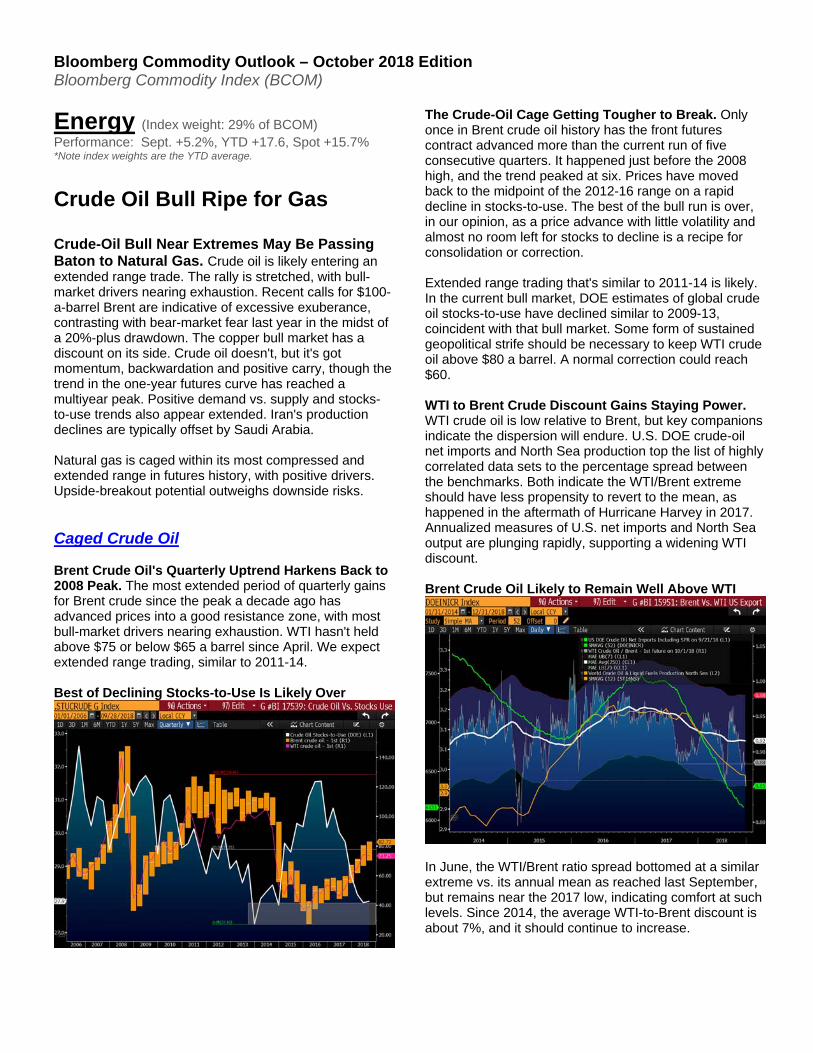
Brent Crude Oil's Quarterly Uptrend Harkens Back to 2008 Peak. The most extended period of quarterly gains for Brent crude since the peak a decade ago has advanced prices into a good resistance zone, with most bull-market drivers nearing exhaustion. WTI hasn't held above $75 or below $65 a barrel since April. We expect extended range trading, similar to 2011-14.
Best of Declining Stocks-to-Use Is Likely Over
The Crude-Oil Cage Getting Tougher to Break. Only once in Brent crude oil history has the front futures contract advanced more than the current run of five consecutive quarters. It happened just before the 2008 high, and the trend peaked at six. Prices have moved back to the midpoint of the 2012-16 range on a rapid decline in stocks-to-use. The best of the bull run is over, in our opinion, as a price advance with little volatility and almost no room left for stocks to decline is a recipe for consolidation or correction.
Extended range trading that's similar to 2011-14 is likely. In the current bull market, DOE estimates of global crude oil stocks-to-use have declined similar to 2009-13, coincident with that bull market. Some form of sustained geopolitical strife should be necessary to keep WTI crude oil above $80 a barrel. A normal correction could reach $60.
WTI to Brent Crude Discount Gains Staying Power. WTI crude oil is low relative to Brent, but key companions indicate the dispersion will endure. U.S. DOE crude-oil net imports and North Sea production top the list of highly correlated data sets to the percentage spread between the benchmarks. Both indicate the WTI/Brent extreme should have less propensity to revert to the mean, as happened in the aftermath of Hurricane Harvey in 2017. Annualized measures of U.S. net imports and North Sea output are plunging rapidly, supporting a widening WTI discount.
Brent Crude Oil Likely to Remain Well Above WTI
In June, the WTI/Brent ratio spread bottomed at a similar extreme vs. its annual mean as reached last September, but remains near the 2017 low, indicating comfort at such levels. Since 2014, the average WTI-to-Brent discount is about 7%, and it should continue to increase.
Bloomberg Commodity Outlook – October 2018 Edition Bloomberg Commodity Index (BCOM)
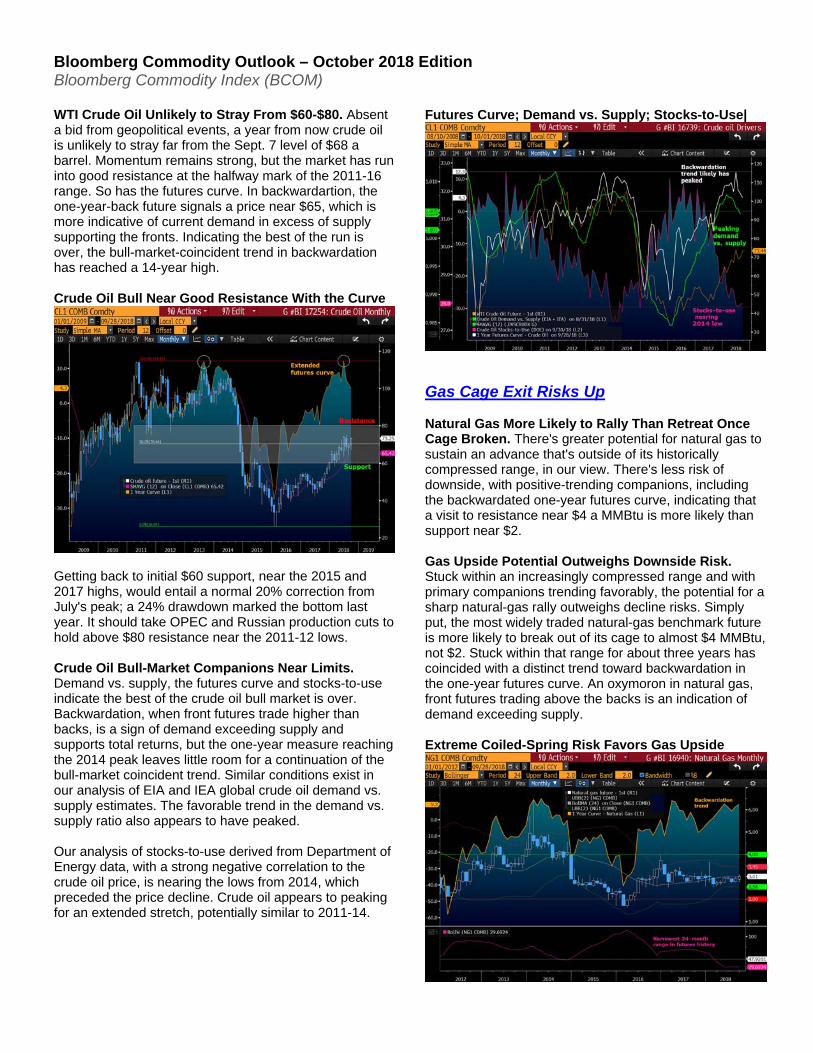
WTI Crude Oil Unlikely to Stray From $60-$80. Absent a bid from geopolitical events, a year from now crude oil is unlikely to stray far from the Sept. 7 level of $68 a barrel. Momentum remains strong, but the market has run into good resistance at the halfway mark of the 2011-16 range. So has the futures curve. In backwardartion, the one-year-back future signals a price near $65, which is more indicative of current demand in excess of supply supporting the fronts. Indicating the best of the run is over, the bull-market-coincident trend in backwardation has reached a 14-year high.
Crude Oil Bull Near Good Resistance With the Curve
Getting back to initial $60 support, near the 2015 and 2017 highs, would entail a normal 20% correction from July's peak; a 24% drawdown marked the bottom last year. It should take OPEC and Russian production cuts to hold above $80 resistance near the 2011-12 lows.
Crude Oil Bull-Market Companions Near Limits. Demand vs. supply, the futures curve and stocks-to-use indicate the best of the crude oil bull market is over. Backwardation, when front futures trade higher than backs, is a sign of demand exceeding supply and supports total returns, but the one-year measure reaching the 2014 peak leaves little room for a continuation of the bull-market coincident trend. Similar conditions exist in our analysis of EIA and IEA global crude oil demand vs. supply estimates. The favorable trend in the demand vs. supply ratio also appears to have peaked.
Our analysis of stocks-to-use derived from Department of Energy data, with a strong negative correlation to the crude oil price, is nearing the lows from 2014, which preceded the price decline. Crude oil appears to peaking for an extended stretch, potentially similar to 2011-14.
Futures Curve; Demand vs. Supply; Stocks-to-Use|
Gas Cage Exit Risks Up
Natural Gas More Likely to Rally Than Retreat Once Cage Broken. There's greater potential for natural gas to sustain an advance that's outside of its historically compressed range, in our view. There's less risk of downside, with positive-trending companions, including the backwardated one-year futures curve, indicating that a visit to resistance near $4 a MMBtu is more likely than support near $2.
Gas Upside Potential Outweighs Downside Risk. Stuck within an increasingly compressed range and with primary companions trending favorably, the potential for a sharp natural-gas rally outweighs decline risks. Simply put, the most widely traded natural-gas benchmark future is more likely to break out of its cage to almost $4 MMBtu, not $2. Stuck within that range for about three years has coincided with a distinct trend toward backwardation in the one-year futures curve. An oxymoron in natural gas, front futures trading above the backs is an indication of demand exceeding supply.
Extreme Coiled-Spring Risk Favors Gas Upside
Bloomberg Commodity Outlook – October 2018 Edition Bloomberg Commodity Index (BCOM)
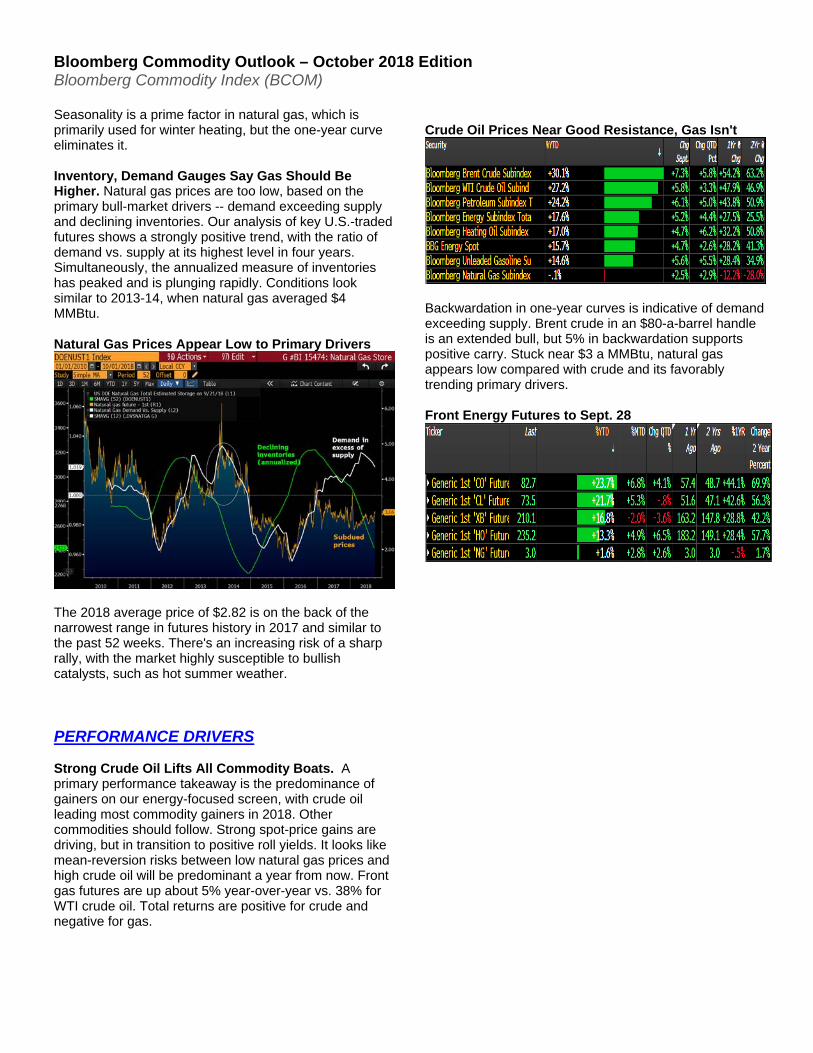
Seasonality is a prime factor in natural gas, which is primarily used for winter heating, but the one-year curve eliminates it. Inventory, Demand Gauges Say Gas Should Be Higher. Natural gas prices are too low, based on the primary bull-market drivers -- demand exceeding supply and declining inventories. Our analysis of key U.S.-traded futures shows a strongly positive trend, with the ratio of demand vs. supply at its highest level in four years. Simultaneously, the annualized measure of inventories has peaked and is plunging rapidly. Conditions look similar to 2013-14, when natural gas averaged $4 MMBtu. Natural Gas Prices Appear Low to Primary Drivers
The 2018 average price of $2.82 is on the back of the narrowest range in futures history in 2017 and similar to the past 52 weeks. There's an increasing risk of a sharp rally, with the market highly susceptible to bullish catalysts, such as hot summer weather. PERFORMANCE DRIVERS Strong Crude Oil Lifts All Commodity Boats. A primary performance takeaway is the predominance of gainers on our energy-focused screen, with crude oil leading most commodity gainers in 2018. Other commodities should follow. Strong spot-price gains are driving, but in transition to positive roll yields. It looks like mean-reversion risks between low natural gas prices and high crude oil will be predominant a year from now. Front gas futures are up about 5% year-over-year vs. 38% for WTI crude oil. Total returns are positive for crude and negative for gas.
Crude Oil Prices Near Good Resistance, Gas Isn't
Backwardation in one-year curves is indicative of demand exceeding supply. Brent crude in an $80-a-barrel handle is an extended bull, but 5% in backwardation supports positive carry. Stuck near $3 a MMBtu, natural gas appears low compared with crude and its favorably trending primary drivers. Front Energy Futures to Sept. 28
Bloomberg Commodity Outlook – October 2018 Edition Bloomberg Commodity Index (BCOM)
Metals
All (Index weight: 35% of BCOM)Performance: Sept. +1.0%, YTD -11.4%
Industrial (Index weight: 19.0% of BCOM.Performance: Sept. +2.2%, YTD -11.8, Spot -12.3%)
Precious (Index weight: 16.1% of BCOM.Performance: Sept. -0.3%, YTD -10.7, Spot -9.9%)
Responding to the Discount
Copper to Lead Metals' Bull-Market Mission of Discount Reduction. The metals' September price recovery tells us that it's going to take a much stronger dollar and global disinflation to restrain copper from leading the charge in the year ahead. Prices have rebounded despite continued greenback gains and escalating trade tension, though the Bloomberg All Metals Total Return Index is on track to end 3Q down 11%. The correction's adequate, in our view, with sufficient economic growth to stimulate a recovery in key decliners copper, silver and zinc. The red metal will be a leader, in our view, as the implications would be significant if it fails to extend a recovery.
Unless China rolls over, copper is more likely to continue toward $3.50-a-pound resistance. Driven by the declining yuan, the trade-weighted broad dollar, about 2% from its 2016 peak, has little room for more appreciation.
All Metals Warming Up
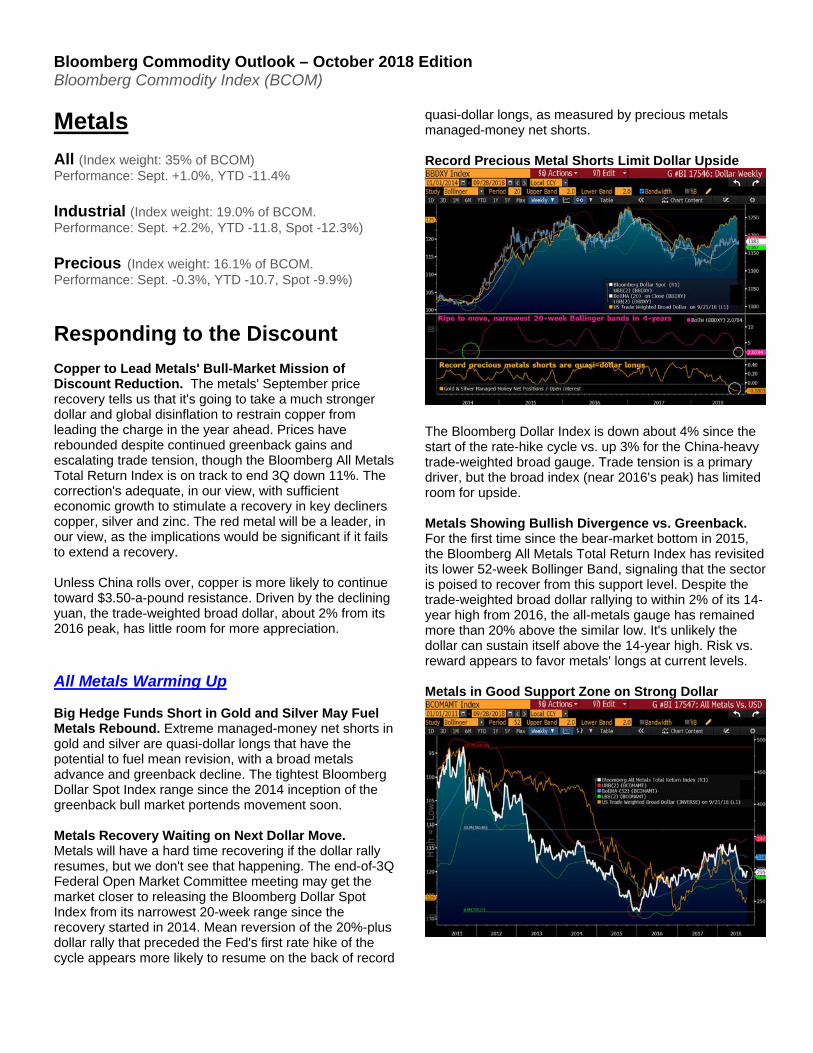
Big Hedge Funds Short in Gold and Silver May Fuel Metals Rebound. Extreme managed-money net shorts in gold and silver are quasi-dollar longs that have the potential to fuel mean revision, with a broad metals advance and greenback decline. The tightest Bloomberg Dollar Spot Index range since the 2014 inception of the greenback bull market portends movement soon.
Metals Recovery Waiting on Next Dollar Move. Metals will have a hard time recovering if the dollar rally resumes, but we don't see that happening. The end-of-3Q Federal Open Market Committee meeting may get the market closer to releasing the Bloomberg Dollar Spot Index from its narrowest 20-week range since the recovery started in 2014. Mean reversion of the 20%-plus dollar rally that preceded the Fed's first rate hike of the cycle appears more likely to resume on the back of record
quasi-dollar longs, as measured by precious metals managed-money net shorts.
Record Precious Metal Shorts Limit Dollar Upside
The Bloomberg Dollar Index is down about 4% since the start of the rate-hike cycle vs. up 3% for the China-heavy trade-weighted broad gauge. Trade tension is a primary driver, but the broad index (near 2016's peak) has limited room for upside.
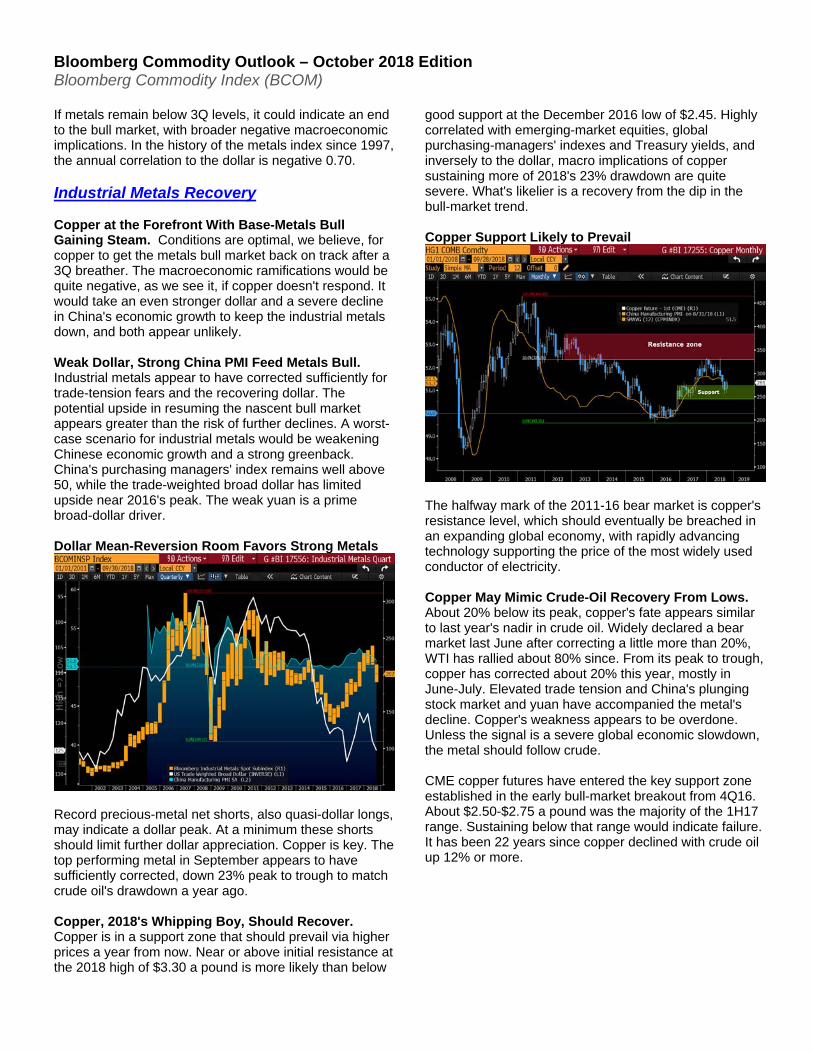
Metals Showing Bullish Divergence vs. Greenback. For the first time since the bear-market bottom in 2015, the Bloomberg All Metals Total Return Index has revisited its lower 52-week Bollinger Band, signaling that the sector is poised to recover from this support level. Despite the trade-weighted broad dollar rallying to within 2% of its 14-year high from 2016, the all-metals gauge has remained more than 20% above the similar low. It's unlikely the dollar can sustain itself above the 14-year high. Risk vs. reward appears to favor metals' longs at current levels.
Metals in Good Support Zone on Strong Dollar
Bloomberg Commodity Outlook – October 2018 Edition Bloomberg Commodity Index (BCOM)
If metals remain below 3Q levels, it could indicate an end to the bull market, with broader negative macroeconomic implications. In the history of the metals index since 1997, the annual correlation to the dollar is negative 0.70.
Industrial Metals Recovery
Copper at the Forefront With Base-Metals Bull Gaining Steam. Conditions are optimal, we believe, for copper to get the metals bull market back on track after a 3Q breather. The macroeconomic ramifications would be quite negative, as we see it, if copper doesn't respond. It would take an even stronger dollar and a severe decline in China's economic growth to keep the industrial metals down, and both appear unlikely.
Weak Dollar, Strong China PMI Feed Metals Bull. Industrial metals appear to have corrected sufficiently for trade-tension fears and the recovering dollar. The potential upside in resuming the nascent bull market appears greater than the risk of further declines. A worst-case scenario for industrial metals would be weakening Chinese economic growth and a strong greenback. China's purchasing managers' index remains well above 50, while the trade-weighted broad dollar has limited upside near 2016's peak. The weak yuan is a prime broad-dollar driver.
Dollar Mean-Reversion Room Favors Strong Metals
Record precious-metal net shorts, also quasi-dollar longs, may indicate a dollar peak. At a minimum these shorts should limit further dollar appreciation. Copper is key. The top performing metal in September appears to have sufficiently corrected, down 23% peak to trough to match crude oil's drawdown a year ago.
Copper, 2018's Whipping Boy, Should Recover. Copper is in a support zone that should prevail via higher prices a year from now. Near or above initial resistance at the 2018 high of $3.30 a pound is more likely than below
good support at the December 2016 low of $2.45. Highly correlated with emerging-market equities, global purchasing-managers' indexes and Treasury yields, and inversely to the dollar, macro implications of copper sustaining more of 2018's 23% drawdown are quite severe. What's likelier is a recovery from the dip in the bull-market trend.
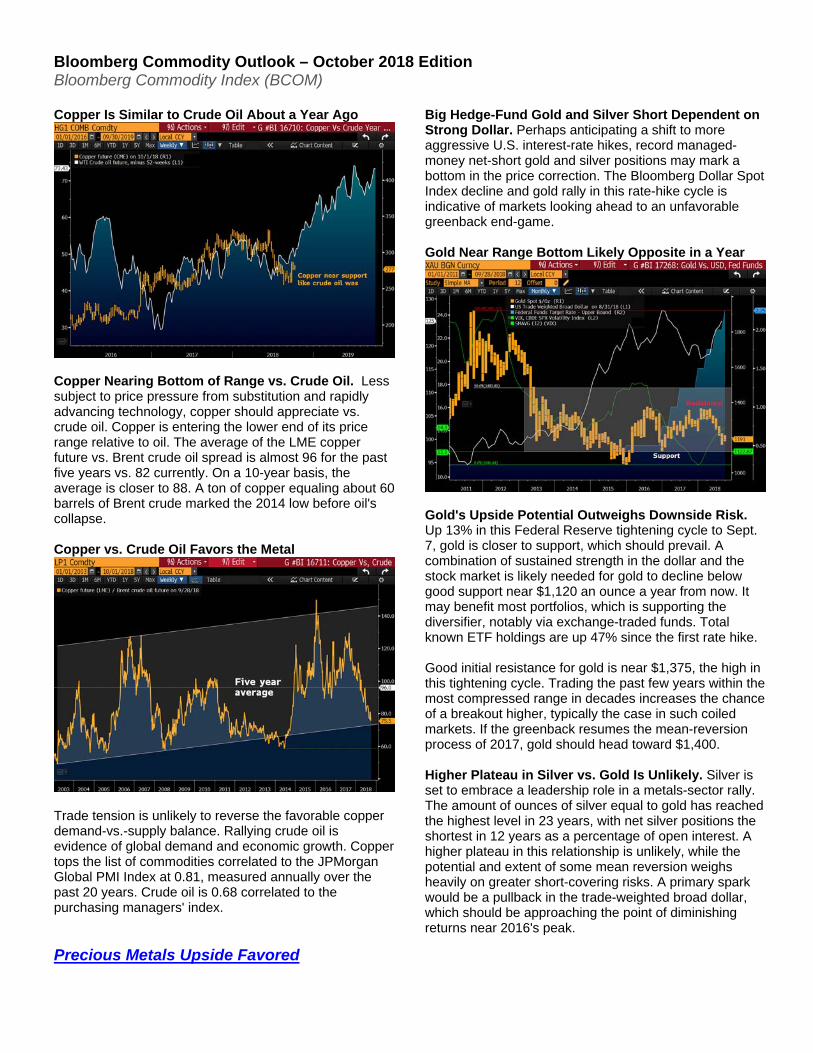
Copper Support Likely to Prevail
The halfway mark of the 2011-16 bear market is copper's resistance level, which should eventually be breached in an expanding global economy, with rapidly advancing technology supporting the price of the most widely used conductor of electricity.
Copper May Mimic Crude-Oil Recovery From Lows. About 20% below its peak, copper's fate appears similar to last year's nadir in crude oil. Widely declared a bear market last June after correcting a little more than 20%, WTI has rallied about 80% since. From its peak to trough, copper has corrected about 20% this year, mostly in June-July. Elevated trade tension and China's plunging stock market and yuan have accompanied the metal's decline. Copper's weakness appears to be overdone. Unless the signal is a severe global economic slowdown, the metal should follow crude.
CME copper futures have entered the key support zone established in the early bull-market breakout from 4Q16. About $2.50-$2.75 a pound was the majority of the 1H17 range. Sustaining below that range would indicate failure. It has been 22 years since copper declined with crude oil up 12% or more.
Bloomberg Commodity Outlook – October 2018 Edition Bloomberg Commodity Index (BCOM)
Copper Is Similar to Crude Oil About a Year Ago
Copper Nearing Bottom of Range vs. Crude Oil. Less subject to price pressure from substitution and rapidly advancing technology, copper should appreciate vs. crude oil. Copper is entering the lower end of its price range relative to oil. The average of the LME copper future vs. Brent crude oil spread is almost 96 for the past five years vs. 82 currently. On a 10-year basis, the average is closer to 88. A ton of copper equaling about 60 barrels of Brent crude marked the 2014 low before oil's collapse.
Copper vs. Crude Oil Favors the Metal
Trade tension is unlikely to reverse the favorable copper demand-vs.-supply balance. Rallying crude oil is evidence of global demand and economic growth. Copper tops the list of commodities correlated to the JPMorgan Global PMI Index at 0.81, measured annually over the past 20 years. Crude oil is 0.68 correlated to the purchasing managers' index.
Precious Metals Upside Favored
Big Hedge-Fund Gold and Silver Short Dependent on Strong Dollar. Perhaps anticipating a shift to more aggressive U.S. interest-rate hikes, record managed-money net-short gold and silver positions may mark a bottom in the price correction. The Bloomberg Dollar Spot Index decline and gold rally in this rate-hike cycle is indicative of markets looking ahead to an unfavorable greenback end-game.
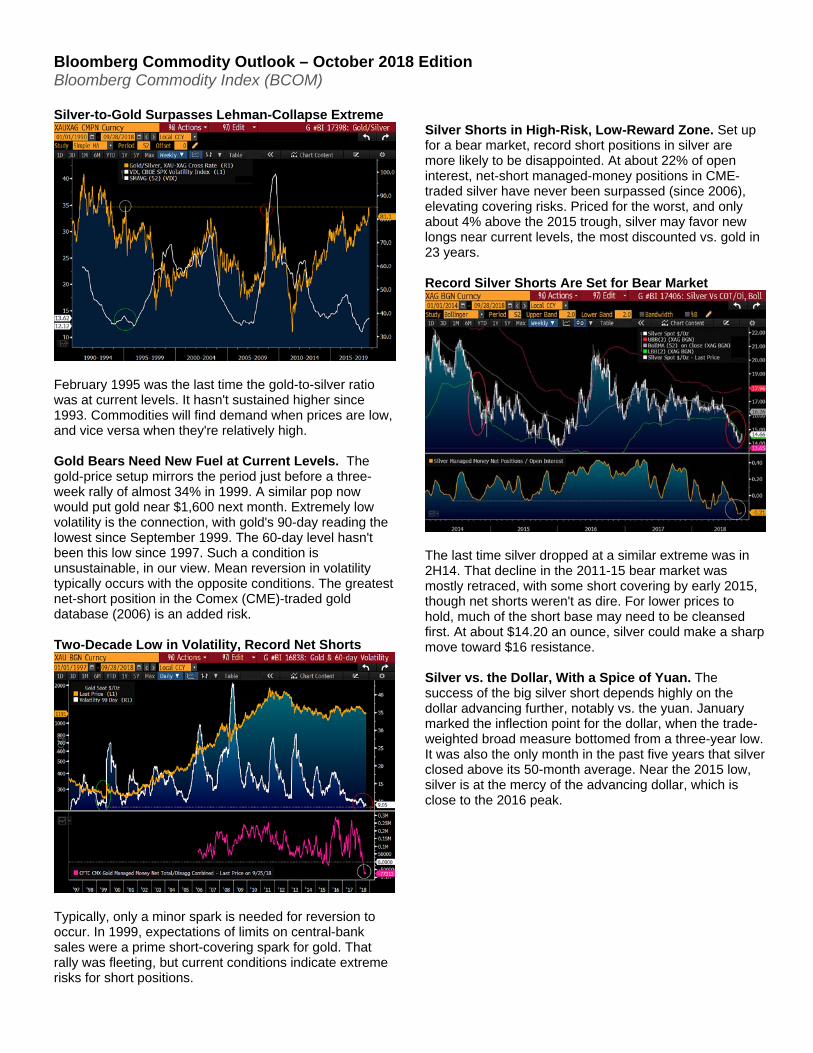
Gold Near Range Bottom Likely Opposite in a Year
Gold's Upside Potential Outweighs Downside Risk. Up 13% in this Federal Reserve tightening cycle to Sept. 7, gold is closer to support, which should prevail. A combination of sustained strength in the dollar and the stock market is likely needed for gold to decline below good support near $1,120 an ounce a year from now. It may benefit most portfolios, which is supporting the diversifier, notably via exchange-traded funds. Total known ETF holdings are up 47% since the first rate hike.
Good initial resistance for gold is near $1,375, the high in this tightening cycle. Trading the past few years within the most compressed range in decades increases the chance of a breakout higher, typically the case in such coiled markets. If the greenback resumes the mean-reversion process of 2017, gold should head toward $1,400.
Higher Plateau in Silver vs. Gold Is Unlikely. Silver is set to embrace a leadership role in a metals-sector rally. The amount of ounces of silver equal to gold has reached the highest level in 23 years, with net silver positions the shortest in 12 years as a percentage of open interest. A higher plateau in this relationship is unlikely, while the potential and extent of some mean reversion weighs heavily on greater short-covering risks. A primary spark would be a pullback in the trade-weighted broad dollar, which should be approaching the point of diminishing returns near 2016's peak.
Bloomberg Commodity Outlook – October 2018 Edition Bloomberg Commodity Index (BCOM)
Silver-to-Gold Surpasses Lehman-Collapse Extreme
February 1995 was the last time the gold-to-silver ratio was at current levels. It hasn't sustained higher since 1993. Commodities will find demand when prices are low, and vice versa when they're relatively high.
Gold Bears Need New Fuel at Current Levels. The gold-price setup mirrors the period just before a three-week rally of almost 34% in 1999. A similar pop now would put gold near $1,600 next month. Extremely low volatility is the connection, with gold's 90-day reading the lowest since September 1999. The 60-day level hasn't been this low since 1997. Such a condition is unsustainable, in our view. Mean reversion in volatility typically occurs with the opposite conditions. The greatest net-short position in the Comex (CME)-traded gold database (2006) is an added risk.
Two-Decade Low in Volatility, Record Net Shorts
Typically, only a minor spark is needed for reversion to occur. In 1999, expectations of limits on central-bank sales were a prime short-covering spark for gold. That rally was fleeting, but current conditions indicate extreme risks for short positions.
Silver Shorts in High-Risk, Low-Reward Zone. Set up for a bear market, record short positions in silver are more likely to be disappointed. At about 22% of open interest, net-short managed-money positions in CME-traded silver have never been surpassed (since 2006), elevating covering risks. Priced for the worst, and only about 4% above the 2015 trough, silver may favor new longs near current levels, the most discounted vs. gold in 23 years.
Record Silver Shorts Are Set for Bear Market
The last time silver dropped at a similar extreme was in 2H14. That decline in the 2011-15 bear market was mostly retraced, with some short covering by early 2015, though net shorts weren't as dire. For lower prices to hold, much of the short base may need to be cleansed first. At about $14.20 an ounce, silver could make a sharp move toward $16 resistance.
Silver vs. the Dollar, With a Spice of Yuan. The success of the big silver short depends highly on the dollar advancing further, notably vs. the yuan. January marked the inflection point for the dollar, when the trade-weighted broad measure bottomed from a three-year low. It was also the only month in the past five years that silver closed above its 50-month average. Near the 2015 low, silver is at the mercy of the advancing dollar, which is close to the 2016 peak.
Bloomberg Commodity Outlook – October 2018 Edition Bloomberg Commodity Index (BCOM)
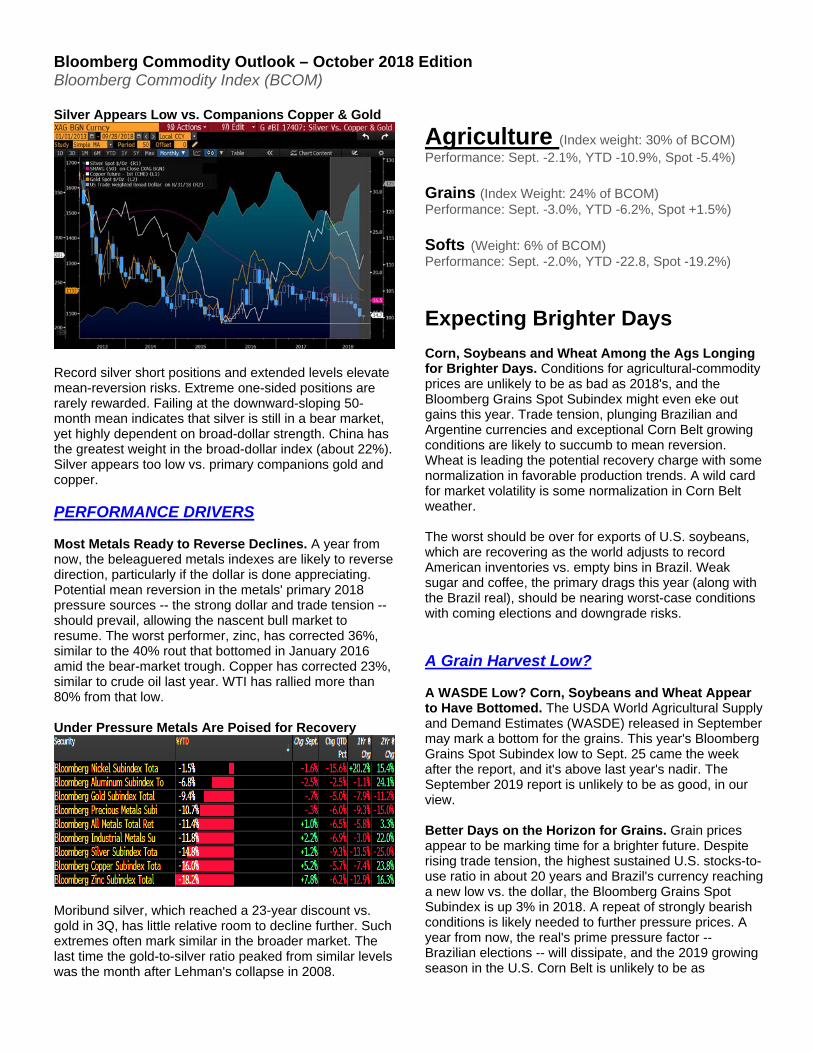
Silver Appears Low vs. Companions Copper & Gold
Record silver short positions and extended levels elevate mean-reversion risks. Extreme one-sided positions are rarely rewarded. Failing at the downward-sloping 50-month mean indicates that silver is still in a bear market, yet highly dependent on broad-dollar strength. China has the greatest weight in the broad-dollar index (about 22%). Silver appears too low vs. primary companions gold and copper.
PERFORMANCE DRIVERS
Most Metals Ready to Reverse Declines. A year from now, the beleaguered metals indexes are likely to reverse direction, particularly if the dollar is done appreciating. Potential mean reversion in the metals' primary 2018 pressure sources -- the strong dollar and trade tension -- should prevail, allowing the nascent bull market to resume. The worst performer, zinc, has corrected 36%, similar to the 40% rout that bottomed in January 2016 amid the bear-market trough. Copper has corrected 23%, similar to crude oil last year. WTI has rallied more than 80% from that low.
Under Pressure Metals Are Poised for Recovery
Moribund silver, which reached a 23-year discount vs. gold in 3Q, has little relative room to decline further. Such extremes often mark similar in the broader market. The last time the gold-to-silver ratio peaked from similar levels was the month after Lehman's collapse in 2008.
Agriculture (Index weight: 30% of BCOM)Performance: Sept. -2.1%, YTD -10.9%, Spot -5.4%)
Grains (Index Weight: 24% of BCOM)Performance: Sept. -3.0%, YTD -6.2%, Spot +1.5%)
Softs (Weight: 6% of BCOM)Performance: Sept. -2.0%, YTD -22.8, Spot -19.2%)
Expecting Brighter Days
Corn, Soybeans and Wheat Among the Ags Longing for Brighter Days. Conditions for agricultural-commodity prices are unlikely to be as bad as 2018's, and the Bloomberg Grains Spot Subindex might even eke out gains this year. Trade tension, plunging Brazilian and Argentine currencies and exceptional Corn Belt growing conditions are likely to succumb to mean reversion. Wheat is leading the potential recovery charge with some normalization in favorable production trends. A wild card for market volatility is some normalization in Corn Belt weather.
The worst should be over for exports of U.S. soybeans, which are recovering as the world adjusts to record American inventories vs. empty bins in Brazil. Weak sugar and coffee, the primary drags this year (along with the Brazil real), should be nearing worst-case conditions with coming elections and downgrade risks.
A Grain Harvest Low?
A WASDE Low? Corn, Soybeans and Wheat Appear to Have Bottomed. The USDA World Agricultural Supply and Demand Estimates (WASDE) released in September may mark a bottom for the grains. This year's Bloomberg Grains Spot Subindex low to Sept. 25 came the week after the report, and it's above last year's nadir. The September 2019 report is unlikely to be as good, in our view.
Better Days on the Horizon for Grains. Grain prices appear to be marking time for a brighter future. Despite rising trade tension, the highest sustained U.S. stocks-to-use ratio in about 20 years and Brazil's currency reaching a new low vs. the dollar, the Bloomberg Grains Spot Subindex is up 3% in 2018. A repeat of strongly bearish conditions is likely needed to further pressure prices. A year from now, the real's prime pressure factor -- Brazilian elections -- will dissipate, and the 2019 growing season in the U.S. Corn Belt is unlikely to be as
Bloomberg Commodity Outlook – October 2018 Edition Bloomberg Commodity Index (BCOM)
exceptional as this year's. Some alleviation of trade tensions would support prices.
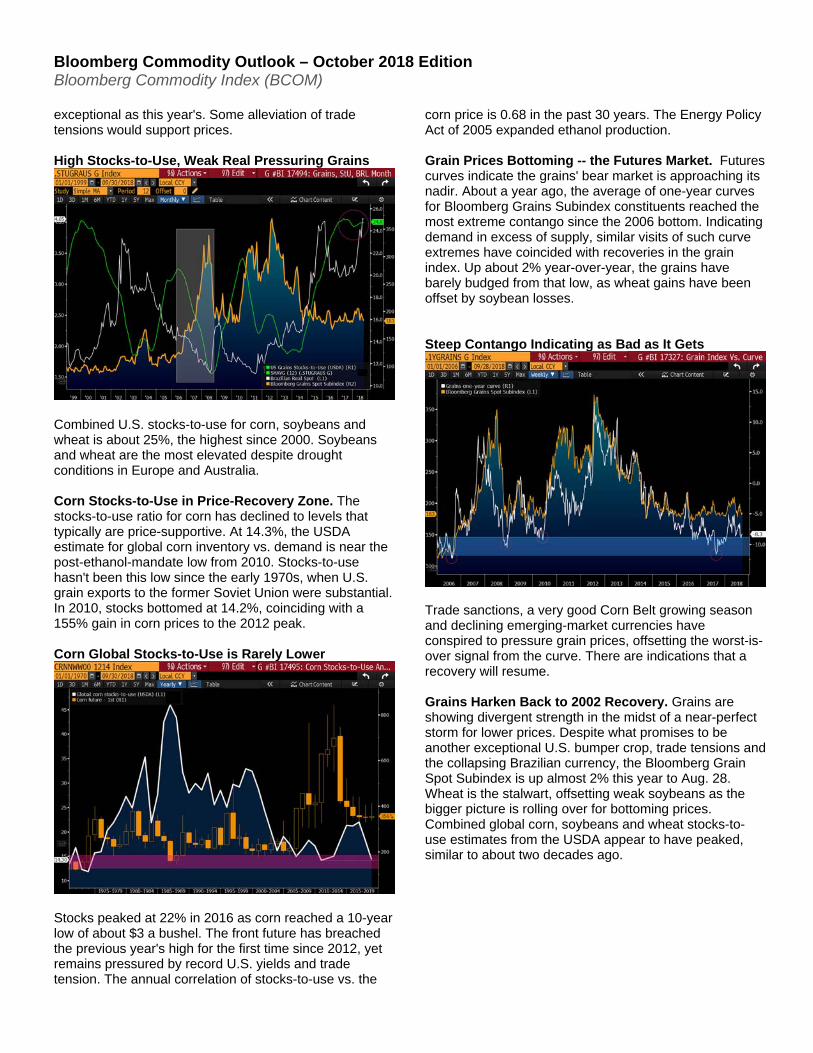
High Stocks-to-Use, Weak Real Pressuring Grains
Combined U.S. stocks-to-use for corn, soybeans and wheat is about 25%, the highest since 2000. Soybeans and wheat are the most elevated despite drought conditions in Europe and Australia.
Corn Stocks-to-Use in Price-Recovery Zone. The stocks-to-use ratio for corn has declined to levels that typically are price-supportive. At 14.3%, the USDA estimate for global corn inventory vs. demand is near the post-ethanol-mandate low from 2010. Stocks-to-use hasn't been this low since the early 1970s, when U.S. grain exports to the former Soviet Union were substantial. In 2010, stocks bottomed at 14.2%, coinciding with a 155% gain in corn prices to the 2012 peak.
Corn Global Stocks-to-Use is Rarely Lower
Stocks peaked at 22% in 2016 as corn reached a 10-year low of about $3 a bushel. The front future has breached the previous year's high for the first time since 2012, yet remains pressured by record U.S. yields and trade tension. The annual correlation of stocks-to-use vs. the
corn price is 0.68 in the past 30 years. The Energy Policy Act of 2005 expanded ethanol production.
Grain Prices Bottoming -- the Futures Market. Futures curves indicate the grains' bear market is approaching its nadir. About a year ago, the average of one-year curves for Bloomberg Grains Subindex constituents reached the most extreme contango since the 2006 bottom. Indicating demand in excess of supply, similar visits of such curve extremes have coincided with recoveries in the grain index. Up about 2% year-over-year, the grains have barely budged from that low, as wheat gains have been offset by soybean losses.
Steep Contango Indicating as Bad as It Gets
Trade sanctions, a very good Corn Belt growing season and declining emerging-market currencies have conspired to pressure grain prices, offsetting the worst-is-over signal from the curve. There are indications that a recovery will resume.
Grains Harken Back to 2002 Recovery. Grains are showing divergent strength in the midst of a near-perfect storm for lower prices. Despite what promises to be another exceptional U.S. bumper crop, trade tensions and the collapsing Brazilian currency, the Bloomberg Grain Spot Subindex is up almost 2% this year to Aug. 28. Wheat is the stalwart, offsetting weak soybeans as the bigger picture is rolling over for bottoming prices. Combined global corn, soybeans and wheat stocks-to-use estimates from the USDA appear to have peaked, similar to about two decades ago.
Bloomberg Commodity Outlook – October 2018 Edition Bloomberg Commodity Index (BCOM)
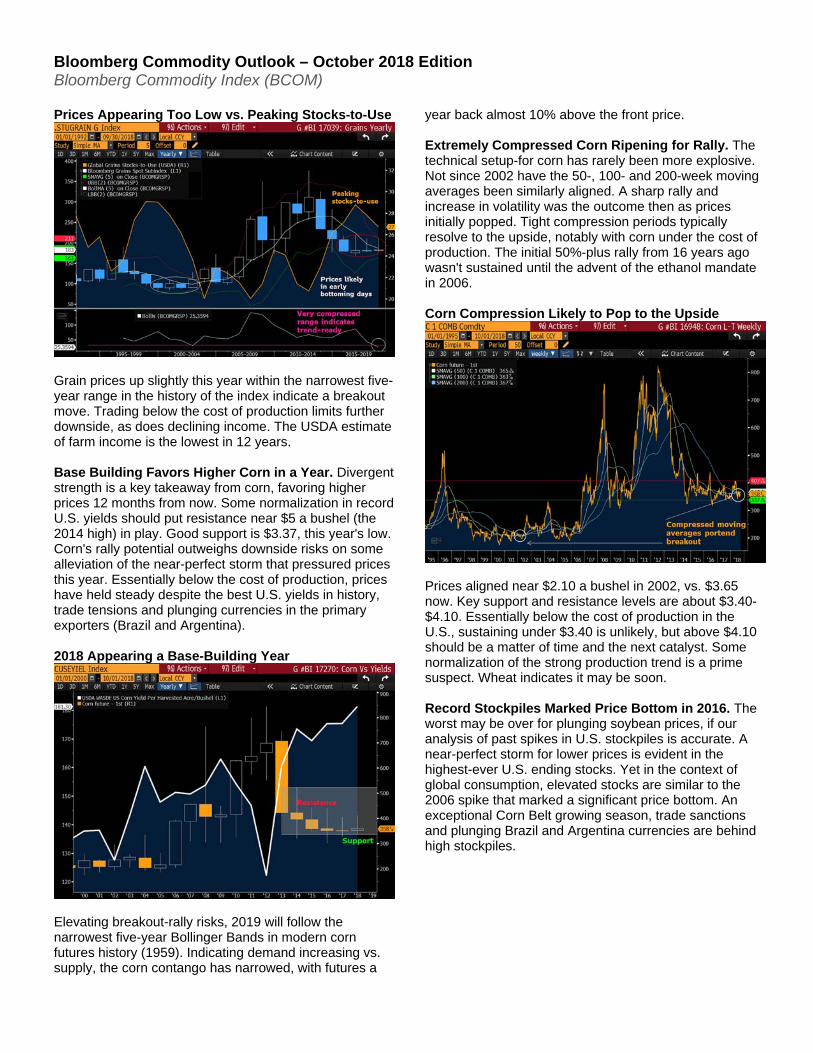
Prices Appearing Too Low vs. Peaking Stocks-to-Use
Grain prices up slightly this year within the narrowest five-year range in the history of the index indicate a breakout move. Trading below the cost of production limits further downside, as does declining income. The USDA estimate of farm income is the lowest in 12 years.
Base Building Favors Higher Corn in a Year. Divergent strength is a key takeaway from corn, favoring higher prices 12 months from now. Some normalization in record U.S. yields should put resistance near $5 a bushel (the 2014 high) in play. Good support is $3.37, this year's low. Corn's rally potential outweighs downside risks on some alleviation of the near-perfect storm that pressured prices this year. Essentially below the cost of production, prices have held steady despite the best U.S. yields in history, trade tensions and plunging currencies in the primary exporters (Brazil and Argentina).
2018 Appearing a Base-Building Year
Elevating breakout-rally risks, 2019 will follow the narrowest five-year Bollinger Bands in modern corn futures history (1959). Indicating demand increasing vs. supply, the corn contango has narrowed, with futures a
year back almost 10% above the front price.
Extremely Compressed Corn Ripening for Rally. The technical setup-for corn has rarely been more explosive. Not since 2002 have the 50-, 100- and 200-week moving averages been similarly aligned. A sharp rally and increase in volatility was the outcome then as prices initially popped. Tight compression periods typically resolve to the upside, notably with corn under the cost of production. The initial 50%-plus rally from 16 years ago wasn't sustained until the advent of the ethanol mandate in 2006.
Corn Compression Likely to Pop to the Upside
Prices aligned near $2.10 a bushel in 2002, vs. $3.65 now. Key support and resistance levels are about $3.40-$4.10. Essentially below the cost of production in the U.S., sustaining under $3.40 is unlikely, but above $4.10should be a matter of time and the next catalyst. Somenormalization of the strong production trend is a primesuspect. Wheat indicates it may be soon.
Record Stockpiles Marked Price Bottom in 2016. The worst may be over for plunging soybean prices, if our analysis of past spikes in U.S. stockpiles is accurate. A near-perfect storm for lower prices is evident in the highest-ever U.S. ending stocks. Yet in the context of global consumption, elevated stocks are similar to the 2006 spike that marked a significant price bottom. An exceptional Corn Belt growing season, trade sanctions and plunging Brazil and Argentina currencies are behind high stockpiles.
Bloomberg Commodity Outlook – October 2018 Edition Bloomberg Commodity Index (BCOM)
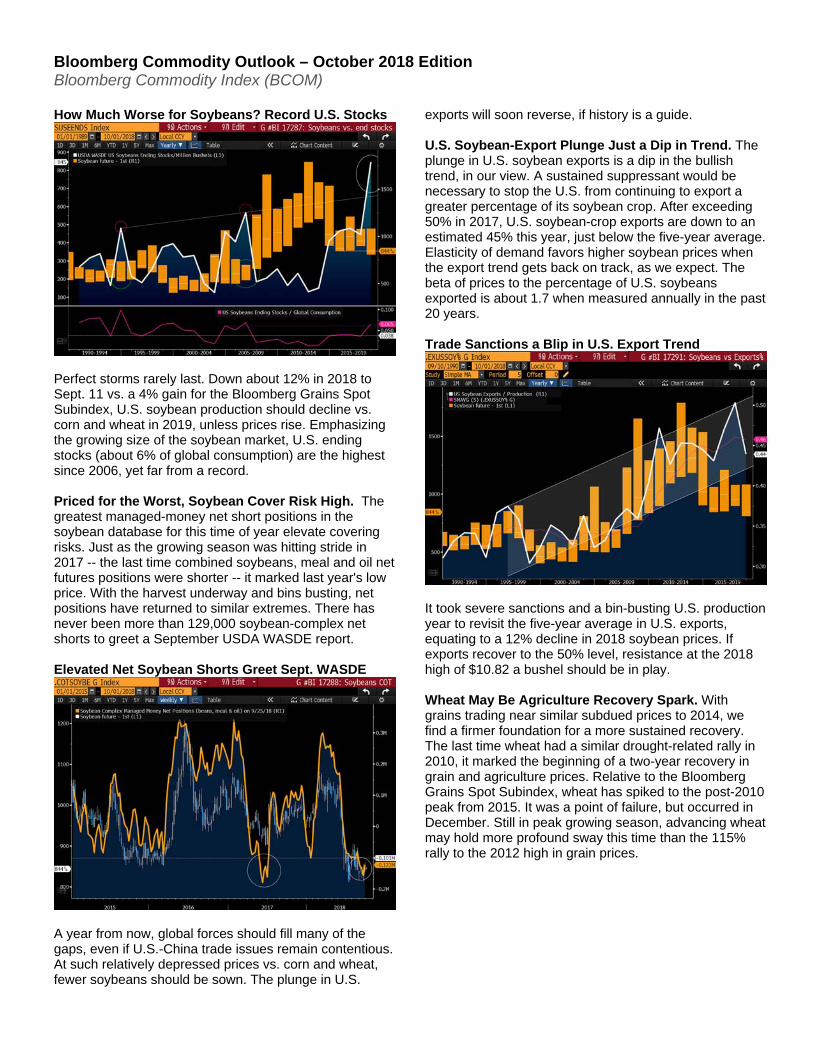
How Much Worse for Soybeans? Record U.S. Stocks
Perfect storms rarely last. Down about 12% in 2018 to Sept. 11 vs. a 4% gain for the Bloomberg Grains Spot Subindex, U.S. soybean production should decline vs. corn and wheat in 2019, unless prices rise. Emphasizing the growing size of the soybean market, U.S. ending stocks (about 6% of global consumption) are the highest since 2006, yet far from a record.
Priced for the Worst, Soybean Cover Risk High. The greatest managed-money net short positions in the soybean database for this time of year elevate covering risks. Just as the growing season was hitting stride in 2017 -- the last time combined soybeans, meal and oil net futures positions were shorter -- it marked last year's low price. With the harvest underway and bins busting, net positions have returned to similar extremes. There has never been more than 129,000 soybean-complex net shorts to greet a September USDA WASDE report.
Elevated Net Soybean Shorts Greet Sept. WASDE
A year from now, global forces should fill many of the gaps, even if U.S.-China trade issues remain contentious. At such relatively depressed prices vs. corn and wheat, fewer soybeans should be sown. The plunge in U.S.
exports will soon reverse, if history is a guide.
U.S. Soybean-Export Plunge Just a Dip in Trend. The plunge in U.S. soybean exports is a dip in the bullish trend, in our view. A sustained suppressant would be necessary to stop the U.S. from continuing to export a greater percentage of its soybean crop. After exceeding 50% in 2017, U.S. soybean-crop exports are down to an estimated 45% this year, just below the five-year average. Elasticity of demand favors higher soybean prices when the export trend gets back on track, as we expect. The beta of prices to the percentage of U.S. soybeans exported is about 1.7 when measured annually in the past 20 years.
Trade Sanctions a Blip in U.S. Export Trend
It took severe sanctions and a bin-busting U.S. production year to revisit the five-year average in U.S. exports, equating to a 12% decline in 2018 soybean prices. If exports recover to the 50% level, resistance at the 2018 high of $10.82 a bushel should be in play.
Wheat May Be Agriculture Recovery Spark. With grains trading near similar subdued prices to 2014, we find a firmer foundation for a more sustained recovery. The last time wheat had a similar drought-related rally in 2010, it marked the beginning of a two-year recovery in grain and agriculture prices. Relative to the Bloomberg Grains Spot Subindex, wheat has spiked to the post-2010 peak from 2015. It was a point of failure, but occurred in December. Still in peak growing season, advancing wheat may hold more profound sway this time than the 115% rally to the 2012 high in grain prices.
Bloomberg Commodity Outlook – October 2018 Edition Bloomberg Commodity Index (BCOM)
Rallying Wheat May Mark Agriculture Bottom
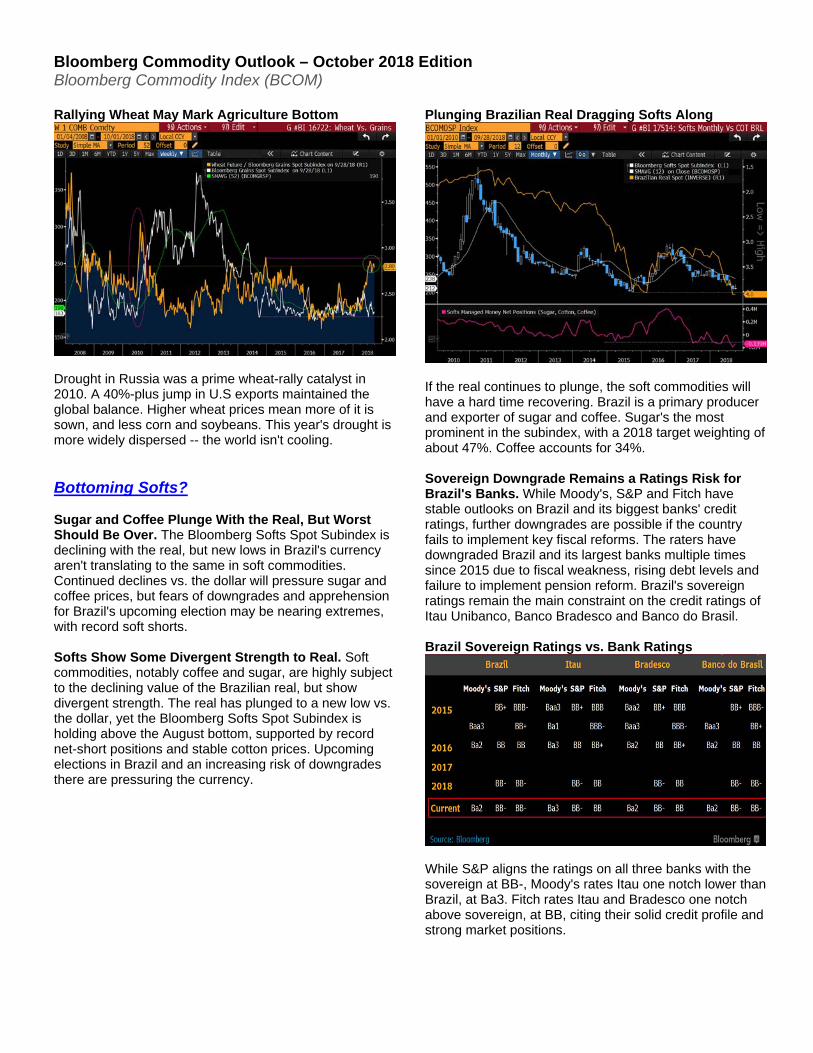
Drought in Russia was a prime wheat-rally catalyst in 2010. A 40%-plus jump in U.S exports maintained the global balance. Higher wheat prices mean more of it is sown, and less corn and soybeans. This year's drought is more widely dispersed -- the world isn't cooling.
Bottoming Softs?
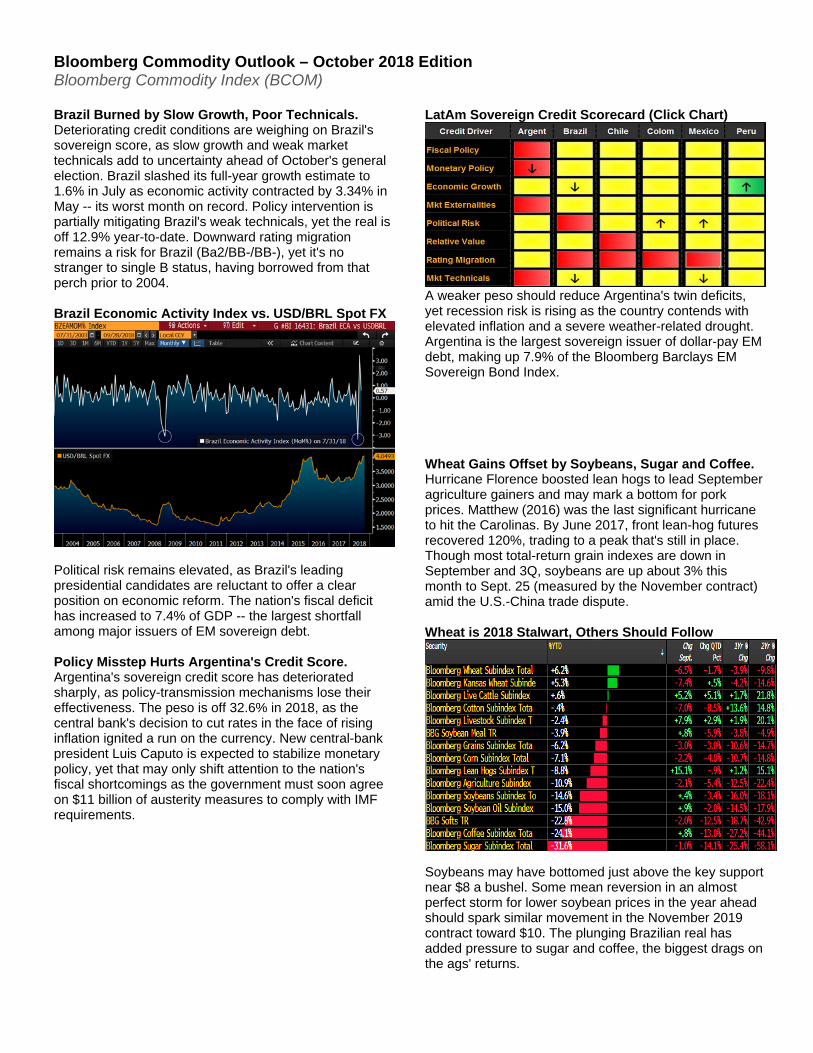
Sugar and Coffee Plunge With the Real, But Worst Should Be Over. The Bloomberg Softs Spot Subindex is declining with the real, but new lows in Brazil's currency aren't translating to the same in soft commodities. Continued declines vs. the dollar will pressure sugar and coffee prices, but fears of downgrades and apprehension for Brazil's upcoming election may be nearing extremes, with record soft shorts.
Softs Show Some Divergent Strength to Real. Soft commodities, notably coffee and sugar, are highly subject to the declining value of the Brazilian real, but show divergent strength. The real has plunged to a new low vs. the dollar, yet the Bloomberg Softs Spot Subindex is holding above the August bottom, supported by record net-short positions and stable cotton prices. Upcoming elections in Brazil and an increasing risk of downgrades there are pressuring the currency.
Plunging Brazilian Real Dragging Softs Along
If the real continues to plunge, the soft commodities will have a hard time recovering. Brazil is a primary producer and exporter of sugar and coffee. Sugar's the most prominent in the subindex, with a 2018 target weighting of about 47%. Coffee accounts for 34%.
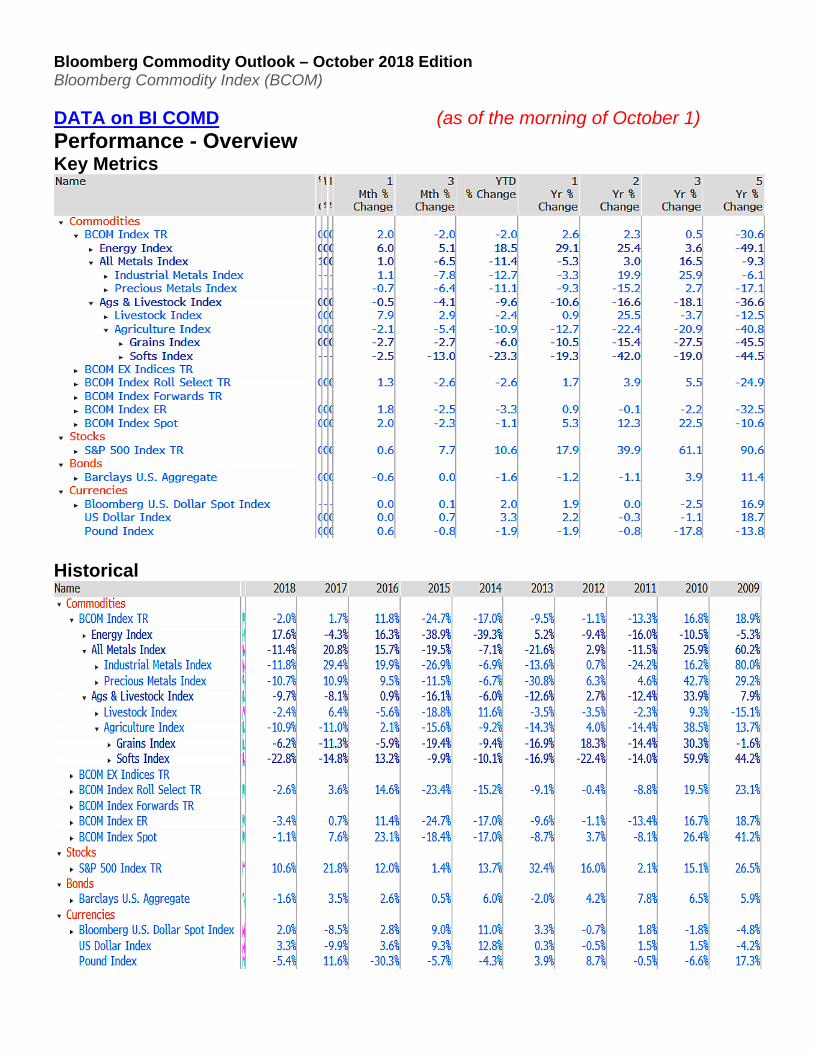
Sovereign Downgrade Remains a Ratings Risk for Brazil's Banks. While Moody's, S&P and Fitch have stable outlooks on Brazil and its biggest banks' credit ratings, further downgrades are possible if the country fails to implement key fiscal reforms. The raters have downgraded Brazil and its largest banks multiple times since 2015 due to fiscal weakness, rising debt levels and failure to implement pension reform. Brazil's sovereign ratings remain the main constraint on the credit ratings of Itau Unibanco, Banco Bradesco and Banco do Brasil.
Brazil Sovereign Ratings vs. Bank Ratings
While S&P aligns the ratings on all three banks with the sovereign at BB-, Moody's rates Itau one notch lower than Brazil, at Ba3. Fitch rates Itau and Bradesco one notch above sovereign, at BB, citing their solid credit profile and strong market positions.
Bloomberg Commodity Outlook – October 2018 Edition Bloomberg Commodity Index (BCOM)
Brazil Burned by Slow Growth, Poor Technicals. Deteriorating credit conditions are weighing on Brazil's sovereign score, as slow growth and weak market technicals add to uncertainty ahead of October's general election. Brazil slashed its full-year growth estimate to 1.6% in July as economic activity contracted by 3.34% in May -- its worst month on record. Policy intervention is partially mitigating Brazil's weak technicals, yet the real is off 12.9% year-to-date. Downward rating migration remains a risk for Brazil (Ba2/BB-/BB-), yet it's no stranger to single B status, having borrowed from that perch prior to 2004.
Brazil Economic Activity Index vs. USD/BRL Spot FX
Political risk remains elevated, as Brazil's leading presidential candidates are reluctant to offer a clear position on economic reform. The nation's fiscal deficit has increased to 7.4% of GDP -- the largest shortfall among major issuers of EM sovereign debt.
Policy Misstep Hurts Argentina's Credit Score. Argentina's sovereign credit score has deteriorated sharply, as policy-transmission mechanisms lose their effectiveness. The peso is off 32.6% in 2018, as the central bank's decision to cut rates in the face of rising inflation ignited a run on the currency. New central-bank president Luis Caputo is expected to stabilize monetary policy, yet that may only shift attention to the nation's fiscal shortcomings as the government must soon agree on $11 billion of austerity measures to comply with IMF requirements.
LatAm Sovereign Credit Scorecard (Click Chart)
A weaker peso should reduce Argentina's twin deficits, yet recession risk is rising as the country contends with elevated inflation and a severe weather-related drought. Argentina is the largest sovereign issuer of dollar-pay EM debt, making up 7.9% of the Bloomberg Barclays EM Sovereign Bond Index.
Wheat Gains Offset by Soybeans, Sugar and Coffee. Hurricane Florence boosted lean hogs to lead September agriculture gainers and may mark a bottom for pork prices. Matthew (2016) was the last significant hurricane to hit the Carolinas. By June 2017, front lean-hog futures recovered 120%, trading to a peak that's still in place. Though most total-return grain indexes are down in September and 3Q, soybeans are up about 3% this month to Sept. 25 (measured by the November contract) amid the U.S.-China trade dispute.
Wheat is 2018 Stalwart, Others Should Follow
Soybeans may have bottomed just above the key support near $8 a bushel. Some mean reversion in an almost perfect storm for lower soybean prices in the year ahead should spark similar movement in the November 2019 contract toward $10. The plunging Brazilian real has added pressure to sugar and coffee, the biggest drags on the ags' returns.
Bloomberg Commodity Outlook – October 2018 Edition Bloomberg Commodity Index (BCOM)
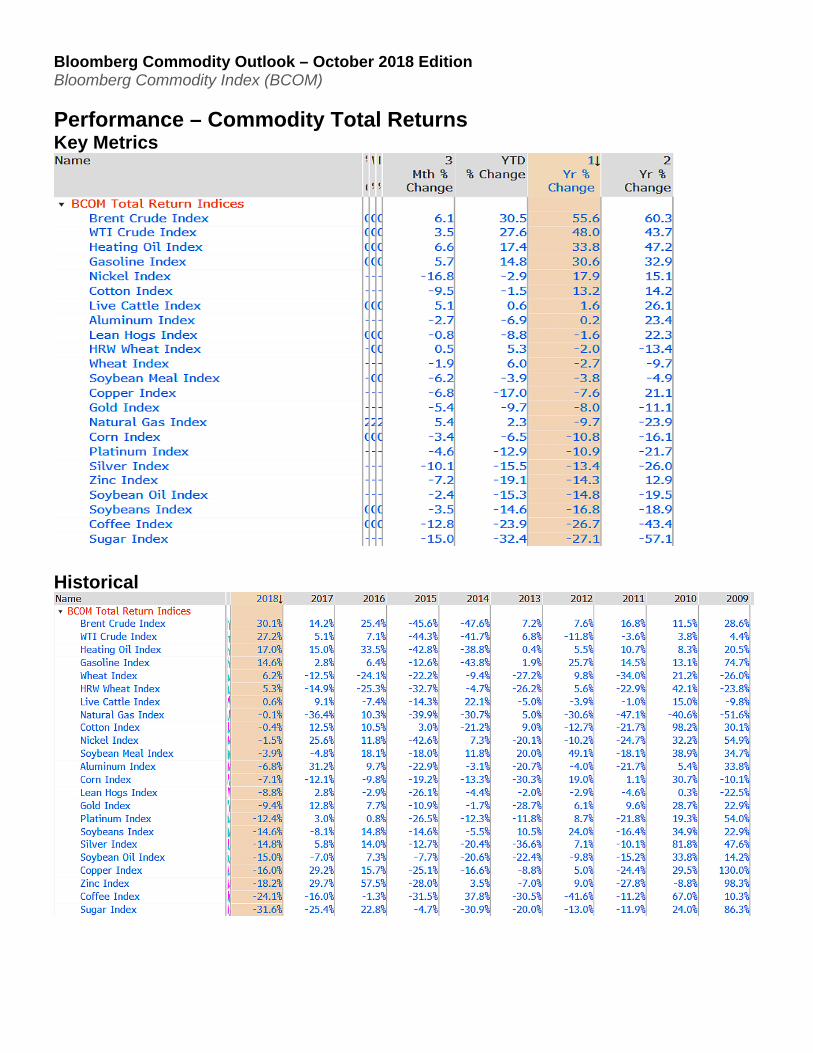
DATA on BI COMD (as of the morning of October 1) Performance - Overview Key Metrics
Historical
Bloomberg Commodity Outlook – October 2018 Edition Bloomberg Commodity Index (BCOM)
Performance – Commodity Total Returns Key Metrics
Historical
Bloomberg Commodity Outlook – October 2018 Edition Bloomberg Commodity Index (BCOM)
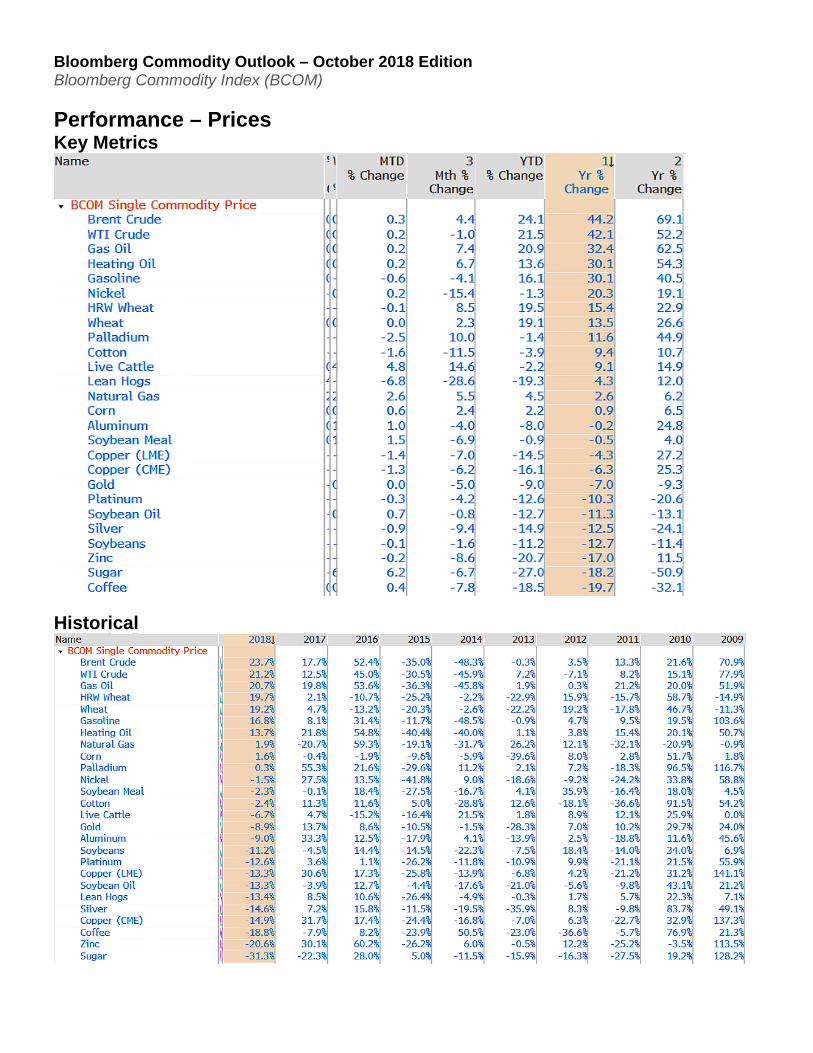
Performance – Prices Key Metrics
Historical
Bloomberg Commodity Outlook – October 2018 Edition Bloomberg Commodity Index (BCOM)
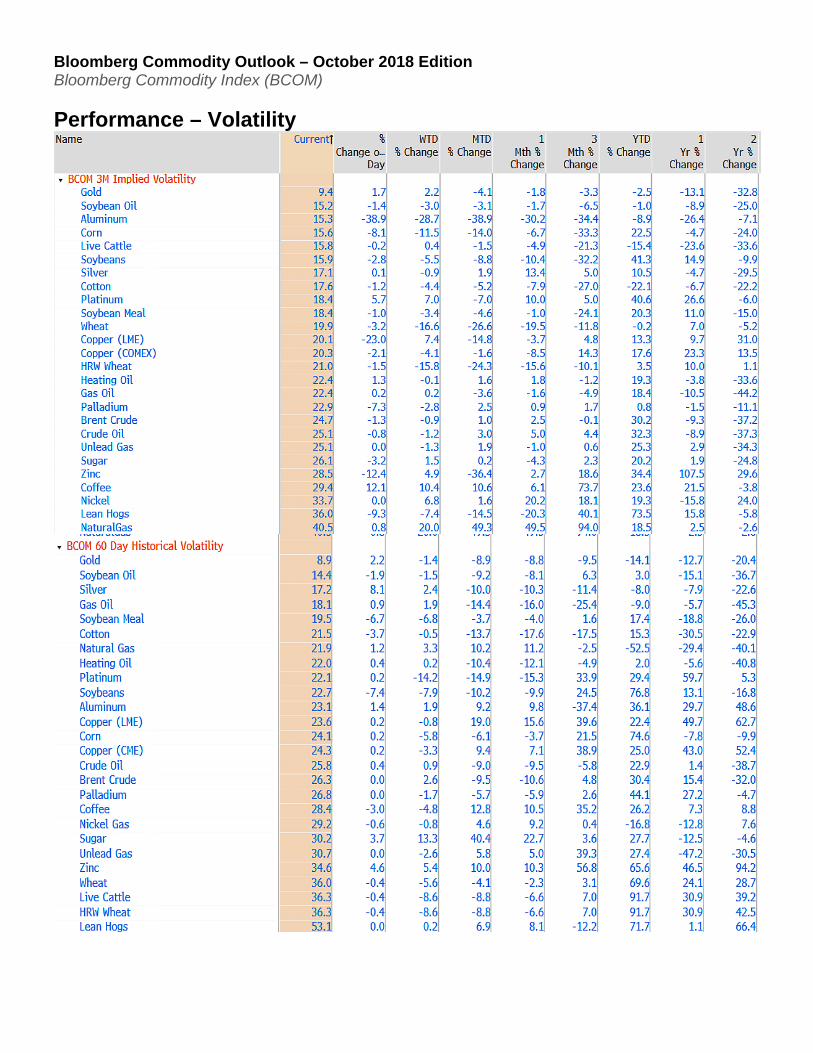
Performance – Volatility
Bloomberg Commodity Outlook – October 2018 Edition Bloomberg Commodity Index (BCOM)
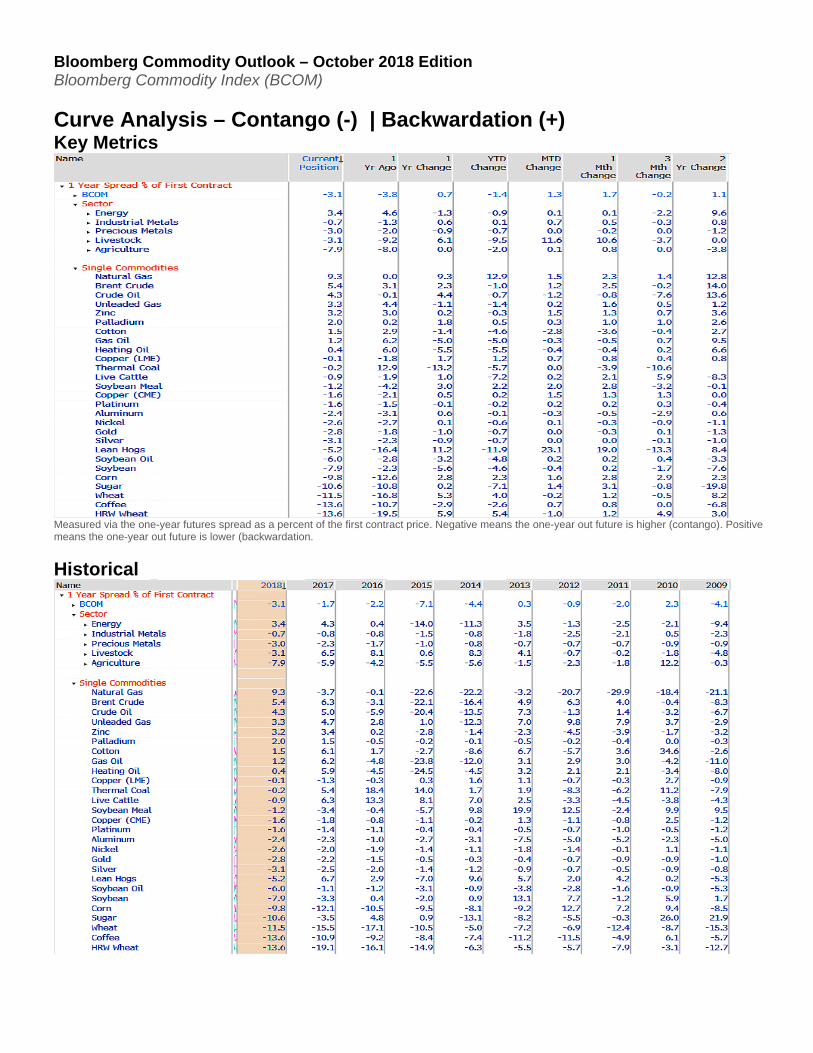
Curve Analysis – Contango (-) | Backwardation (+) Key Metrics
Measured via the one-year futures spread as a percent of the first contract price. Negative means the one-year out future is higher (contango). Positive means the one-year out future is lower (backwardation.
Historical
Bloomberg Commodity Outlook – October 2018 Edition Bloomberg Commodity Index (BCOM)
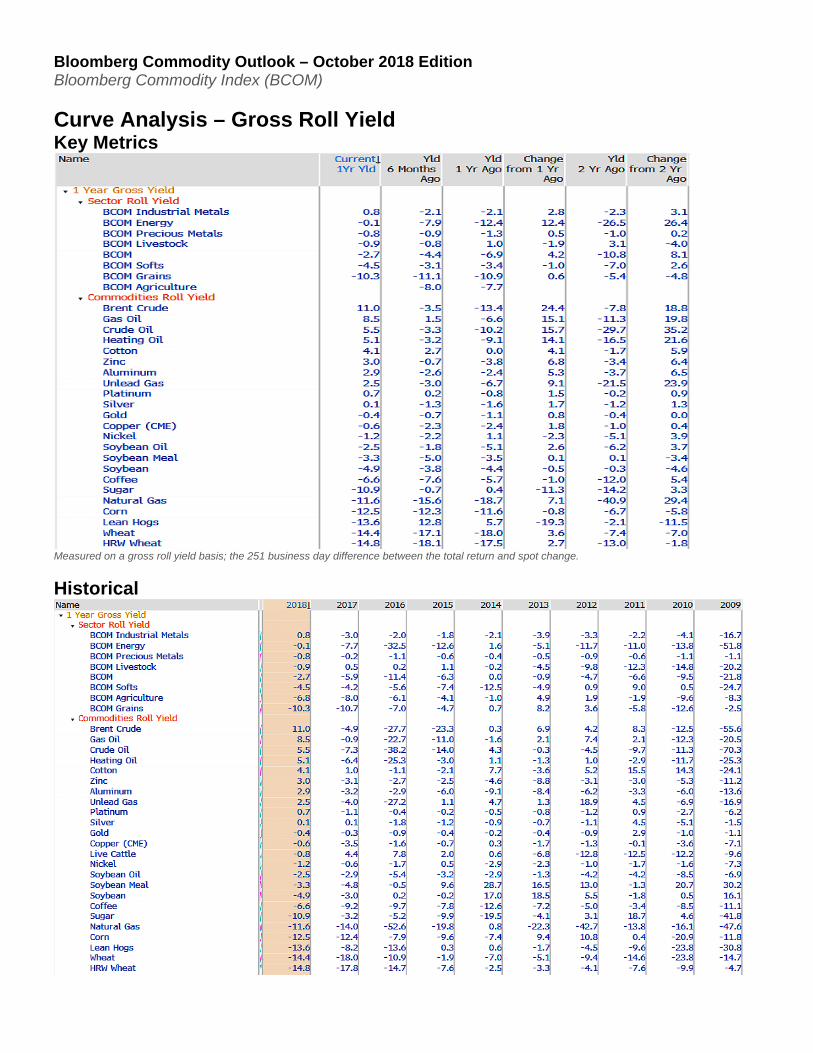
Curve Analysis – Gross Roll Yield Key Metrics
Measured on a gross roll yield basis; the 251 business day difference between the total return and spot change.
Historical
Bloomberg Commodity Outlook – October 2018 Edition Bloomberg Commodity Index (BCOM)
Curve Analysis – Forwards / Forecasts Spread %
Data Set
Bloomberg Commodity Outlook – October 2018 Edition Bloomberg Commodity Index (BCOM)
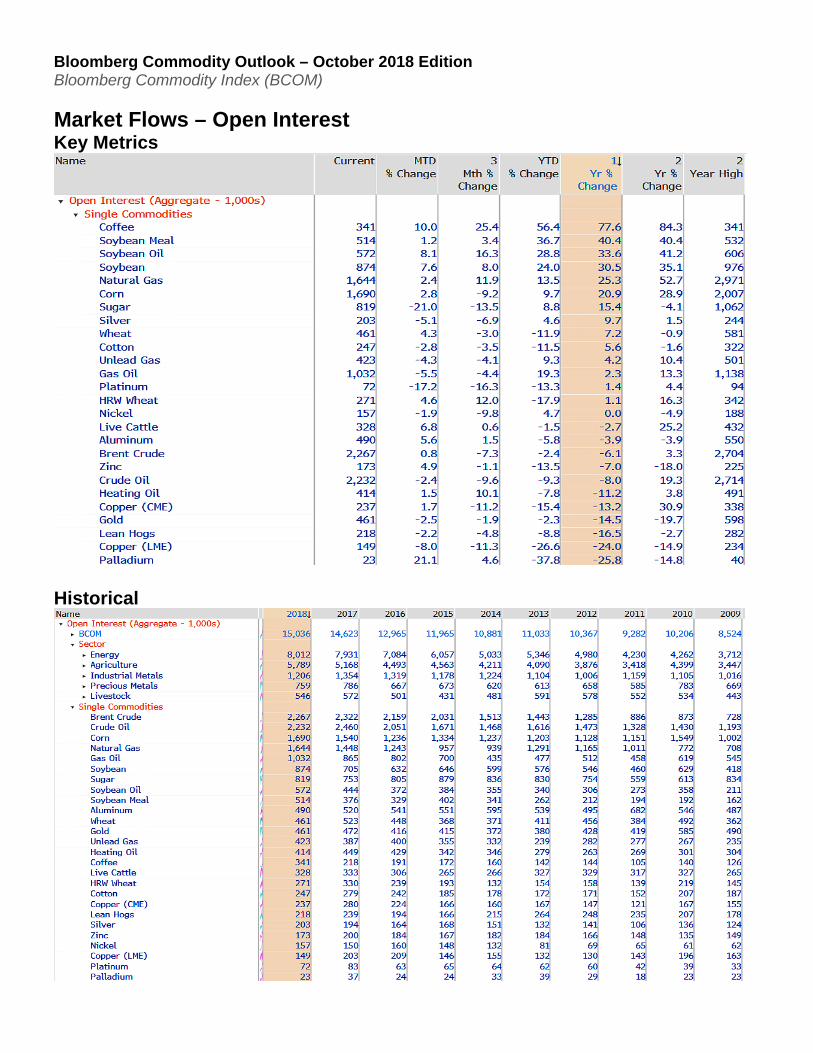
Market Flows – Open Interest Key Metrics
Historical
Bloomberg Commodity Outlook – October 2018 Edition Bloomberg Commodity Index (BCOM)
Market Flows – Commitment of Traders Key Metrics
Historical
Bloomberg Commodity Outlook – October 2018 Edition Bloomberg Commodity Index (BCOM)
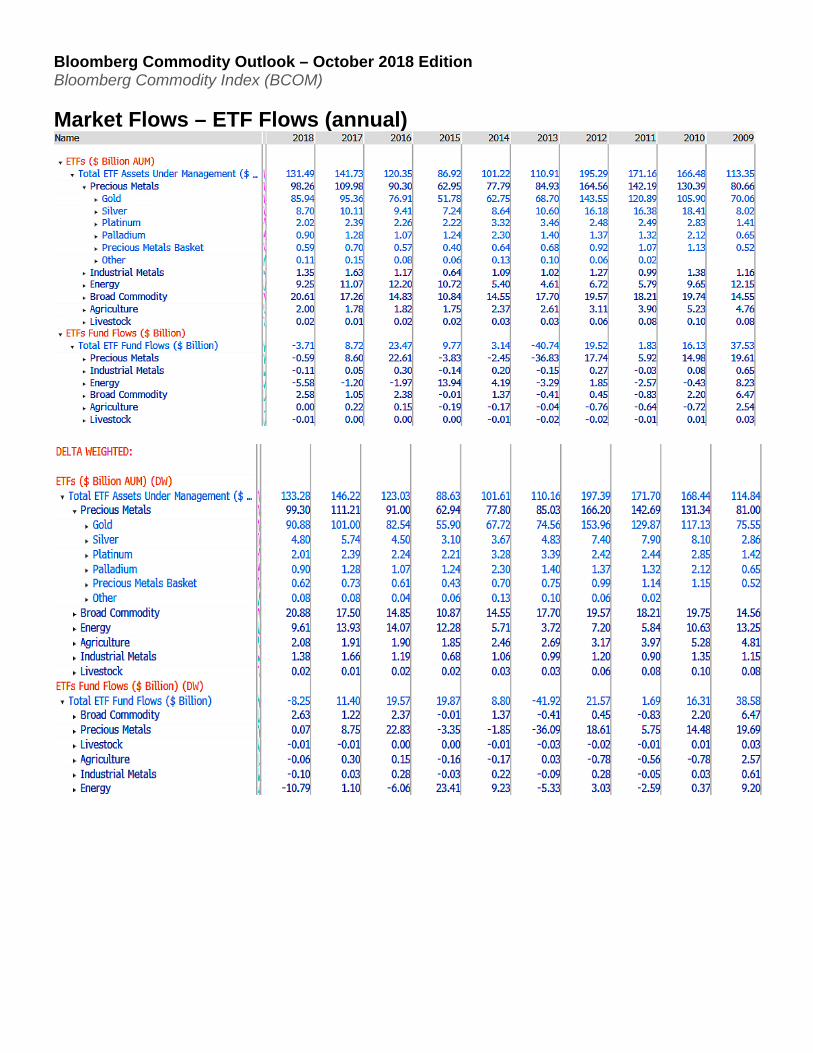
Market Flows – ETF Flows (annual)
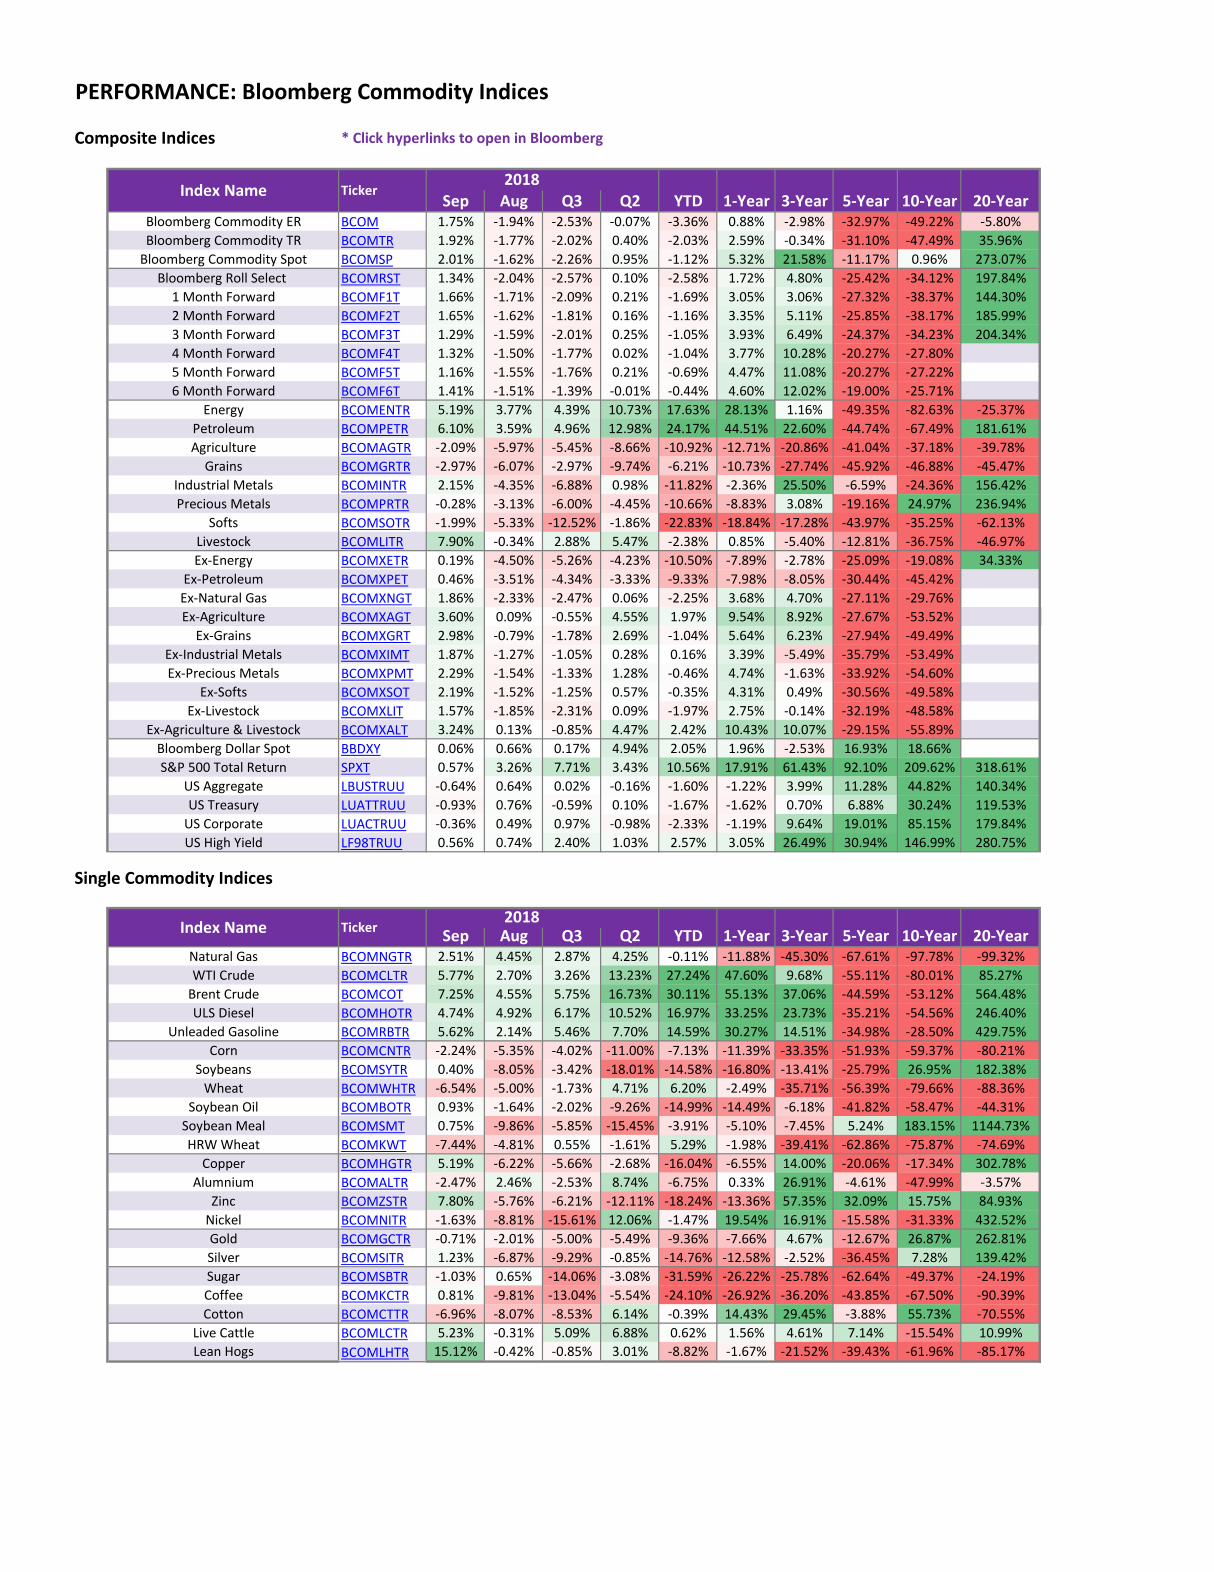
Composite Indices * Click hyperlinks to open in Bloomberg
2018Sep Aug Q3 Q2 YTD 1-Year 3-Year 5-Year 10-Year 20-Year
Bloomberg Commodity ER BCOM 1.75% -1.94% -2.53% -0.07% -3.36% 0.88% -2.98% -32.97% -49.22% -5.80%Bloomberg Commodity TR BCOMTR 1.92% -1.77% -2.02% 0.40% -2.03% 2.59% -0.34% -31.10% -47.49% 35.96%
Bloomberg Commodity Spot BCOMSP 2.01% -1.62% -2.26% 0.95% -1.12% 5.32% 21.58% -11.17% 0.96% 273.07%Bloomberg Roll Select BCOMRST 1.34% -2.04% -2.57% 0.10% -2.58% 1.72% 4.80% -25.42% -34.12% 197.84%
1 Month Forward BCOMF1T 1.66% -1.71% -2.09% 0.21% -1.69% 3.05% 3.06% -27.32% -38.37% 144.30% 2 Month Forward BCOMF2T 1.65% -1.62% -1.81% 0.16% -1.16% 3.35% 5.11% -25.85% -38.17% 185.99% 3 Month Forward BCOMF3T 1.29% -1.59% -2.01% 0.25% -1.05% 3.93% 6.49% -24.37% -34.23% 204.34% 4 Month Forward BCOMF4T 1.32% -1.50% -1.77% 0.02% -1.04% 3.77% 10.28% -20.27% -27.80% 5 Month Forward BCOMF5T 1.16% -1.55% -1.76% 0.21% -0.69% 4.47% 11.08% -20.27% -27.22% 6 Month Forward BCOMF6T 1.41% -1.51% -1.39% -0.01% -0.44% 4.60% 12.02% -19.00% -25.71%
Energy BCOMENTR 5.19% 3.77% 4.39% 10.73% 17.63% 28.13% 1.16% -49.35% -82.63% -25.37%Petroleum BCOMPETR 6.10% 3.59% 4.96% 12.98% 24.17% 44.51% 22.60% -44.74% -67.49% 181.61%Agriculture BCOMAGTR -2.09% -5.97% -5.45% -8.66% -10.92% -12.71% -20.86% -41.04% -37.18% -39.78%
Grains BCOMGRTR -2.97% -6.07% -2.97% -9.74% -6.21% -10.73% -27.74% -45.92% -46.88% -45.47%Industrial Metals BCOMINTR 2.15% -4.35% -6.88% 0.98% -11.82% -2.36% 25.50% -6.59% -24.36% 156.42%Precious Metals BCOMPRTR -0.28% -3.13% -6.00% -4.45% -10.66% -8.83% 3.08% -19.16% 24.97% 236.94%
Softs BCOMSOTR -1.99% -5.33% -12.52% -1.86% -22.83% -18.84% -17.28% -43.97% -35.25% -62.13%Livestock BCOMLITR 7.90% -0.34% 2.88% 5.47% -2.38% 0.85% -5.40% -12.81% -36.75% -46.97%Ex-Energy BCOMXETR 0.19% -4.50% -5.26% -4.23% -10.50% -7.89% -2.78% -25.09% -19.08% 34.33%
Ex-Petroleum BCOMXPET 0.46% -3.51% -4.34% -3.33% -9.33% -7.98% -8.05% -30.44% -45.42%Ex-Natural Gas BCOMXNGT 1.86% -2.33% -2.47% 0.06% -2.25% 3.68% 4.70% -27.11% -29.76%Ex-Agriculture BCOMXAGT 3.60% 0.09% -0.55% 4.55% 1.97% 9.54% 8.92% -27.67% -53.52%
Ex-Grains BCOMXGRT 2.98% -0.79% -1.78% 2.69% -1.04% 5.64% 6.23% -27.94% -49.49%Ex-Industrial Metals BCOMXIMT 1.87% -1.27% -1.05% 0.28% 0.16% 3.39% -5.49% -35.79% -53.49%Ex-Precious Metals BCOMXPMT 2.29% -1.54% -1.33% 1.28% -0.46% 4.74% -1.63% -33.92% -54.60%
Ex-Softs BCOMXSOT 2.19% -1.52% -1.25% 0.57% -0.35% 4.31% 0.49% -30.56% -49.58%Ex-Livestock BCOMXLIT 1.57% -1.85% -2.31% 0.09% -1.97% 2.75% -0.14% -32.19% -48.58%
Ex-Agriculture & Livestock BCOMXALT 3.24% 0.13% -0.85% 4.47% 2.42% 10.43% 10.07% -29.15% -55.89%Bloomberg Dollar Spot BBDXY 0.06% 0.66% 0.17% 4.94% 2.05% 1.96% -2.53% 16.93% 18.66%S&P 500 Total Return SPXT 0.57% 3.26% 7.71% 3.43% 10.56% 17.91% 61.43% 92.10% 209.62% 318.61%
US Aggregate LBUSTRUU -0.64% 0.64% 0.02% -0.16% -1.60% -1.22% 3.99% 11.28% 44.82% 140.34%US Treasury LUATTRUU -0.93% 0.76% -0.59% 0.10% -1.67% -1.62% 0.70% 6.88% 30.24% 119.53%
US Corporate LUACTRUU -0.36% 0.49% 0.97% -0.98% -2.33% -1.19% 9.64% 19.01% 85.15% 179.84%US High Yield LF98TRUU 0.56% 0.74% 2.40% 1.03% 2.57% 3.05% 26.49% 30.94% 146.99% 280.75%
Single Commodity Indices
2018Sep Aug Q3 Q2 YTD 1-Year 3-Year 5-Year 10-Year 20-Year
Natural Gas BCOMNGTR 2.51% 4.45% 2.87% 4.25% -0.11% -11.88% -45.30% -67.61% -97.78% -99.32%WTI Crude BCOMCLTR 5.77% 2.70% 3.26% 13.23% 27.24% 47.60% 9.68% -55.11% -80.01% 85.27%
Brent Crude BCOMCOT 7.25% 4.55% 5.75% 16.73% 30.11% 55.13% 37.06% -44.59% -53.12% 564.48%ULS Diesel BCOMHOTR 4.74% 4.92% 6.17% 10.52% 16.97% 33.25% 23.73% -35.21% -54.56% 246.40%
Unleaded Gasoline BCOMRBTR 5.62% 2.14% 5.46% 7.70% 14.59% 30.27% 14.51% -34.98% -28.50% 429.75%Corn BCOMCNTR -2.24% -5.35% -4.02% -11.00% -7.13% -11.39% -33.35% -51.93% -59.37% -80.21%
Soybeans BCOMSYTR 0.40% -8.05% -3.42% -18.01% -14.58% -16.80% -13.41% -25.79% 26.95% 182.38%Wheat BCOMWHTR -6.54% -5.00% -1.73% 4.71% 6.20% -2.49% -35.71% -56.39% -79.66% -88.36%
Soybean Oil BCOMBOTR 0.93% -1.64% -2.02% -9.26% -14.99% -14.49% -6.18% -41.82% -58.47% -44.31%Soybean Meal BCOMSMT 0.75% -9.86% -5.85% -15.45% -3.91% -5.10% -7.45% 5.24% 183.15% 1144.73%HRW Wheat BCOMKWT -7.44% -4.81% 0.55% -1.61% 5.29% -1.98% -39.41% -62.86% -75.87% -74.69%
Copper BCOMHGTR 5.19% -6.22% -5.66% -2.68% -16.04% -6.55% 14.00% -20.06% -17.34% 302.78%Alumnium BCOMALTR -2.47% 2.46% -2.53% 8.74% -6.75% 0.33% 26.91% -4.61% -47.99% -3.57%
Zinc BCOMZSTR 7.80% -5.76% -6.21% -12.11% -18.24% -13.36% 57.35% 32.09% 15.75% 84.93%Nickel BCOMNITR -1.63% -8.81% -15.61% 12.06% -1.47% 19.54% 16.91% -15.58% -31.33% 432.52%Gold BCOMGCTR -0.71% -2.01% -5.00% -5.49% -9.36% -7.66% 4.67% -12.67% 26.87% 262.81%Silver BCOMSITR 1.23% -6.87% -9.29% -0.85% -14.76% -12.58% -2.52% -36.45% 7.28% 139.42%Sugar BCOMSBTR -1.03% 0.65% -14.06% -3.08% -31.59% -26.22% -25.78% -62.64% -49.37% -24.19%Coffee BCOMKCTR 0.81% -9.81% -13.04% -5.54% -24.10% -26.92% -36.20% -43.85% -67.50% -90.39%Cotton BCOMCTTR -6.96% -8.07% -8.53% 6.14% -0.39% 14.43% 29.45% -3.88% 55.73% -70.55%
Live Cattle BCOMLCTR 5.23% -0.31% 5.09% 6.88% 0.62% 1.56% 4.61% 7.14% -15.54% 10.99%Lean Hogs BCOMLHTR 15.12% -0.42% -0.85% 3.01% -8.82% -1.67% -21.52% -39.43% -61.96% -85.17%
Index Name Ticker
Index Name Ticker
PERFORMANCE: Bloomberg Commodity Indices
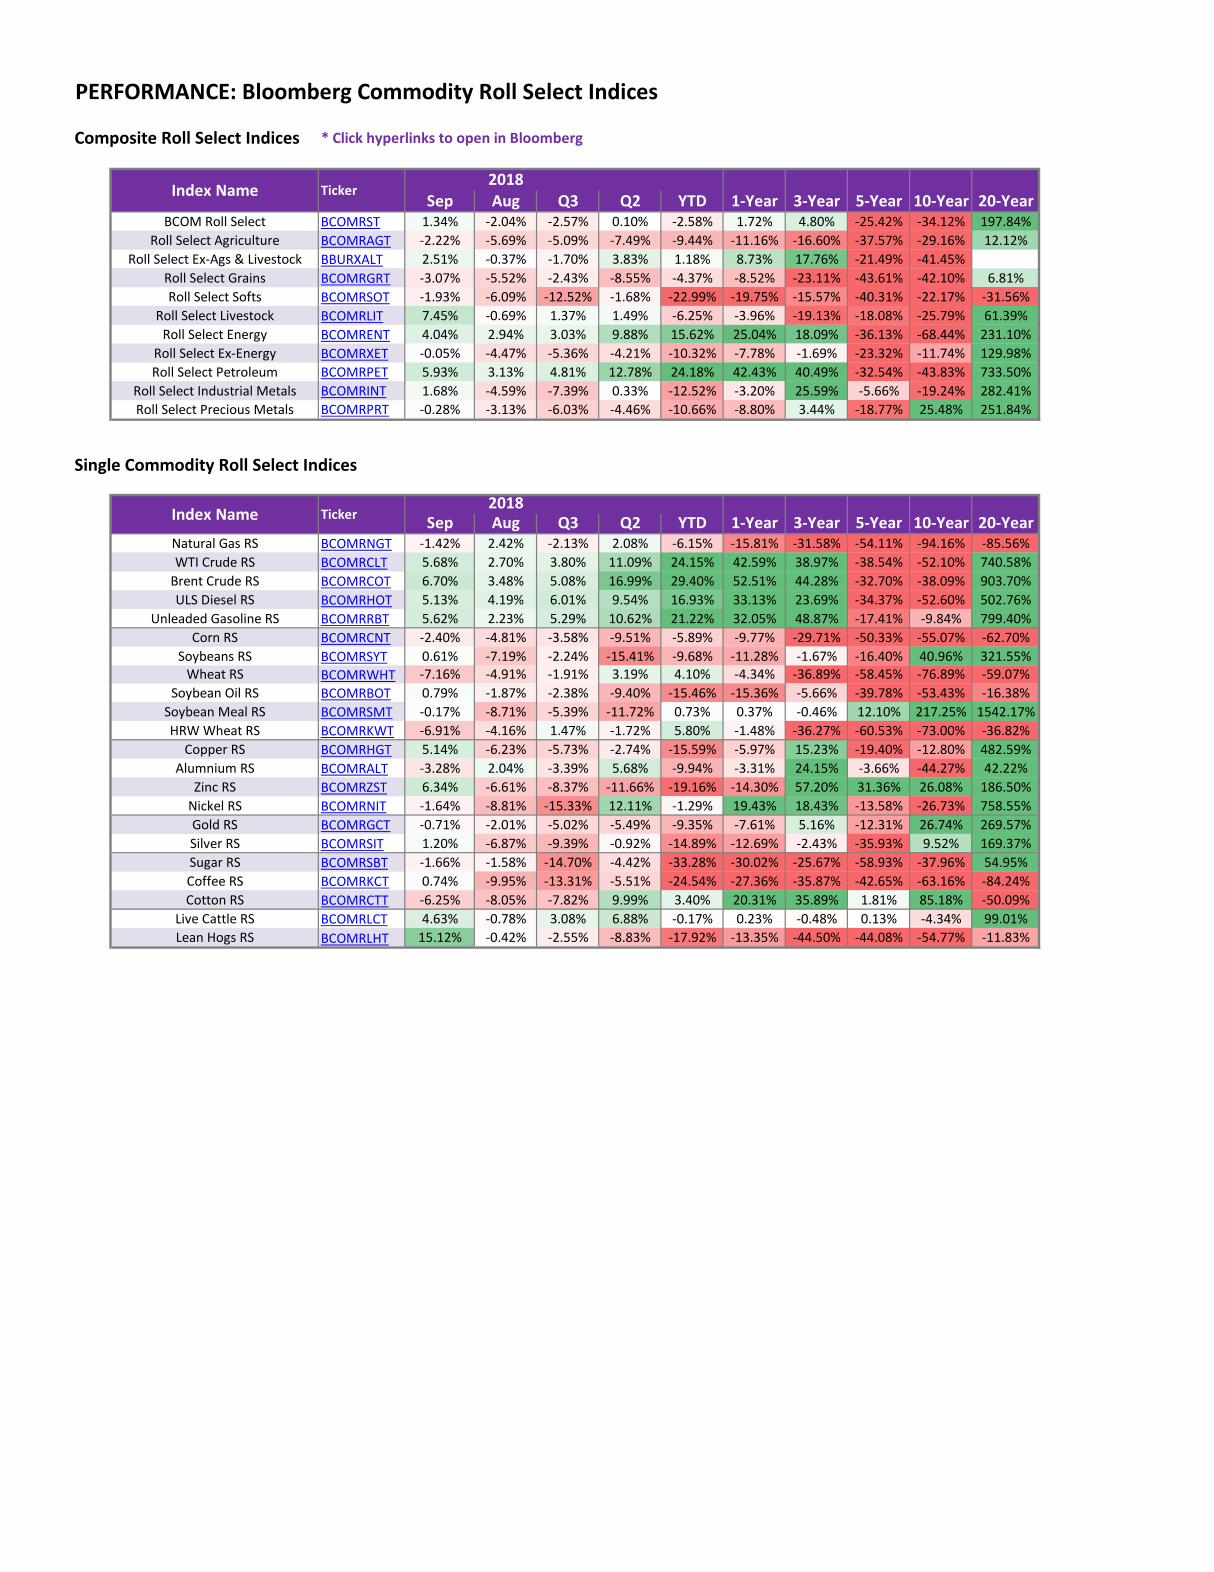
Composite Roll Select Indices * Click hyperlinks to open in Bloomberg
2018Sep Aug Q3 Q2 YTD 1-Year 3-Year 5-Year 10-Year 20-Year
BCOM Roll Select BCOMRST 1.34% -2.04% -2.57% 0.10% -2.58% 1.72% 4.80% -25.42% -34.12% 197.84%Roll Select Agriculture BCOMRAGT -2.22% -5.69% -5.09% -7.49% -9.44% -11.16% -16.60% -37.57% -29.16% 12.12%
Roll Select Ex-Ags & Livestock BBURXALT 2.51% -0.37% -1.70% 3.83% 1.18% 8.73% 17.76% -21.49% -41.45%Roll Select Grains BCOMRGRT -3.07% -5.52% -2.43% -8.55% -4.37% -8.52% -23.11% -43.61% -42.10% 6.81%Roll Select Softs BCOMRSOT -1.93% -6.09% -12.52% -1.68% -22.99% -19.75% -15.57% -40.31% -22.17% -31.56%
Roll Select Livestock BCOMRLIT 7.45% -0.69% 1.37% 1.49% -6.25% -3.96% -19.13% -18.08% -25.79% 61.39%Roll Select Energy BCOMRENT 4.04% 2.94% 3.03% 9.88% 15.62% 25.04% 18.09% -36.13% -68.44% 231.10%
Roll Select Ex-Energy BCOMRXET -0.05% -4.47% -5.36% -4.21% -10.32% -7.78% -1.69% -23.32% -11.74% 129.98%Roll Select Petroleum BCOMRPET 5.93% 3.13% 4.81% 12.78% 24.18% 42.43% 40.49% -32.54% -43.83% 733.50%
Roll Select Industrial Metals BCOMRINT 1.68% -4.59% -7.39% 0.33% -12.52% -3.20% 25.59% -5.66% -19.24% 282.41%Roll Select Precious Metals BCOMRPRT -0.28% -3.13% -6.03% -4.46% -10.66% -8.80% 3.44% -18.77% 25.48% 251.84%
Single Commodity Roll Select Indices
2018Sep Aug Q3 Q2 YTD 1-Year 3-Year 5-Year 10-Year 20-Year
Natural Gas RS BCOMRNGT -1.42% 2.42% -2.13% 2.08% -6.15% -15.81% -31.58% -54.11% -94.16% -85.56%WTI Crude RS BCOMRCLT 5.68% 2.70% 3.80% 11.09% 24.15% 42.59% 38.97% -38.54% -52.10% 740.58%
Brent Crude RS BCOMRCOT 6.70% 3.48% 5.08% 16.99% 29.40% 52.51% 44.28% -32.70% -38.09% 903.70%ULS Diesel RS BCOMRHOT 5.13% 4.19% 6.01% 9.54% 16.93% 33.13% 23.69% -34.37% -52.60% 502.76%
Unleaded Gasoline RS BCOMRRBT 5.62% 2.23% 5.29% 10.62% 21.22% 32.05% 48.87% -17.41% -9.84% 799.40%Corn RS BCOMRCNT -2.40% -4.81% -3.58% -9.51% -5.89% -9.77% -29.71% -50.33% -55.07% -62.70%
Soybeans RS BCOMRSYT 0.61% -7.19% -2.24% -15.41% -9.68% -11.28% -1.67% -16.40% 40.96% 321.55%Wheat RS BCOMRWHT -7.16% -4.91% -1.91% 3.19% 4.10% -4.34% -36.89% -58.45% -76.89% -59.07%
Soybean Oil RS BCOMRBOT 0.79% -1.87% -2.38% -9.40% -15.46% -15.36% -5.66% -39.78% -53.43% -16.38%Soybean Meal RS BCOMRSMT -0.17% -8.71% -5.39% -11.72% 0.73% 0.37% -0.46% 12.10% 217.25% 1542.17%HRW Wheat RS BCOMRKWT -6.91% -4.16% 1.47% -1.72% 5.80% -1.48% -36.27% -60.53% -73.00% -36.82%
Copper RS BCOMRHGT 5.14% -6.23% -5.73% -2.74% -15.59% -5.97% 15.23% -19.40% -12.80% 482.59%Alumnium RS BCOMRALT -3.28% 2.04% -3.39% 5.68% -9.94% -3.31% 24.15% -3.66% -44.27% 42.22%
Zinc RS BCOMRZST 6.34% -6.61% -8.37% -11.66% -19.16% -14.30% 57.20% 31.36% 26.08% 186.50%Nickel RS BCOMRNIT -1.64% -8.81% -15.33% 12.11% -1.29% 19.43% 18.43% -13.58% -26.73% 758.55%Gold RS BCOMRGCT -0.71% -2.01% -5.02% -5.49% -9.35% -7.61% 5.16% -12.31% 26.74% 269.57%Silver RS BCOMRSIT 1.20% -6.87% -9.39% -0.92% -14.89% -12.69% -2.43% -35.93% 9.52% 169.37%Sugar RS BCOMRSBT -1.66% -1.58% -14.70% -4.42% -33.28% -30.02% -25.67% -58.93% -37.96% 54.95%Coffee RS BCOMRKCT 0.74% -9.95% -13.31% -5.51% -24.54% -27.36% -35.87% -42.65% -63.16% -84.24%Cotton RS BCOMRCTT -6.25% -8.05% -7.82% 9.99% 3.40% 20.31% 35.89% 1.81% 85.18% -50.09%
Live Cattle RS BCOMRLCT 4.63% -0.78% 3.08% 6.88% -0.17% 0.23% -0.48% 0.13% -4.34% 99.01%Lean Hogs RS BCOMRLHT 15.12% -0.42% -2.55% -8.83% -17.92% -13.35% -44.50% -44.08% -54.77% -11.83%
PERFORMANCE: Bloomberg Commodity Roll Select Indices
Index Name Ticker
Index Name Ticker
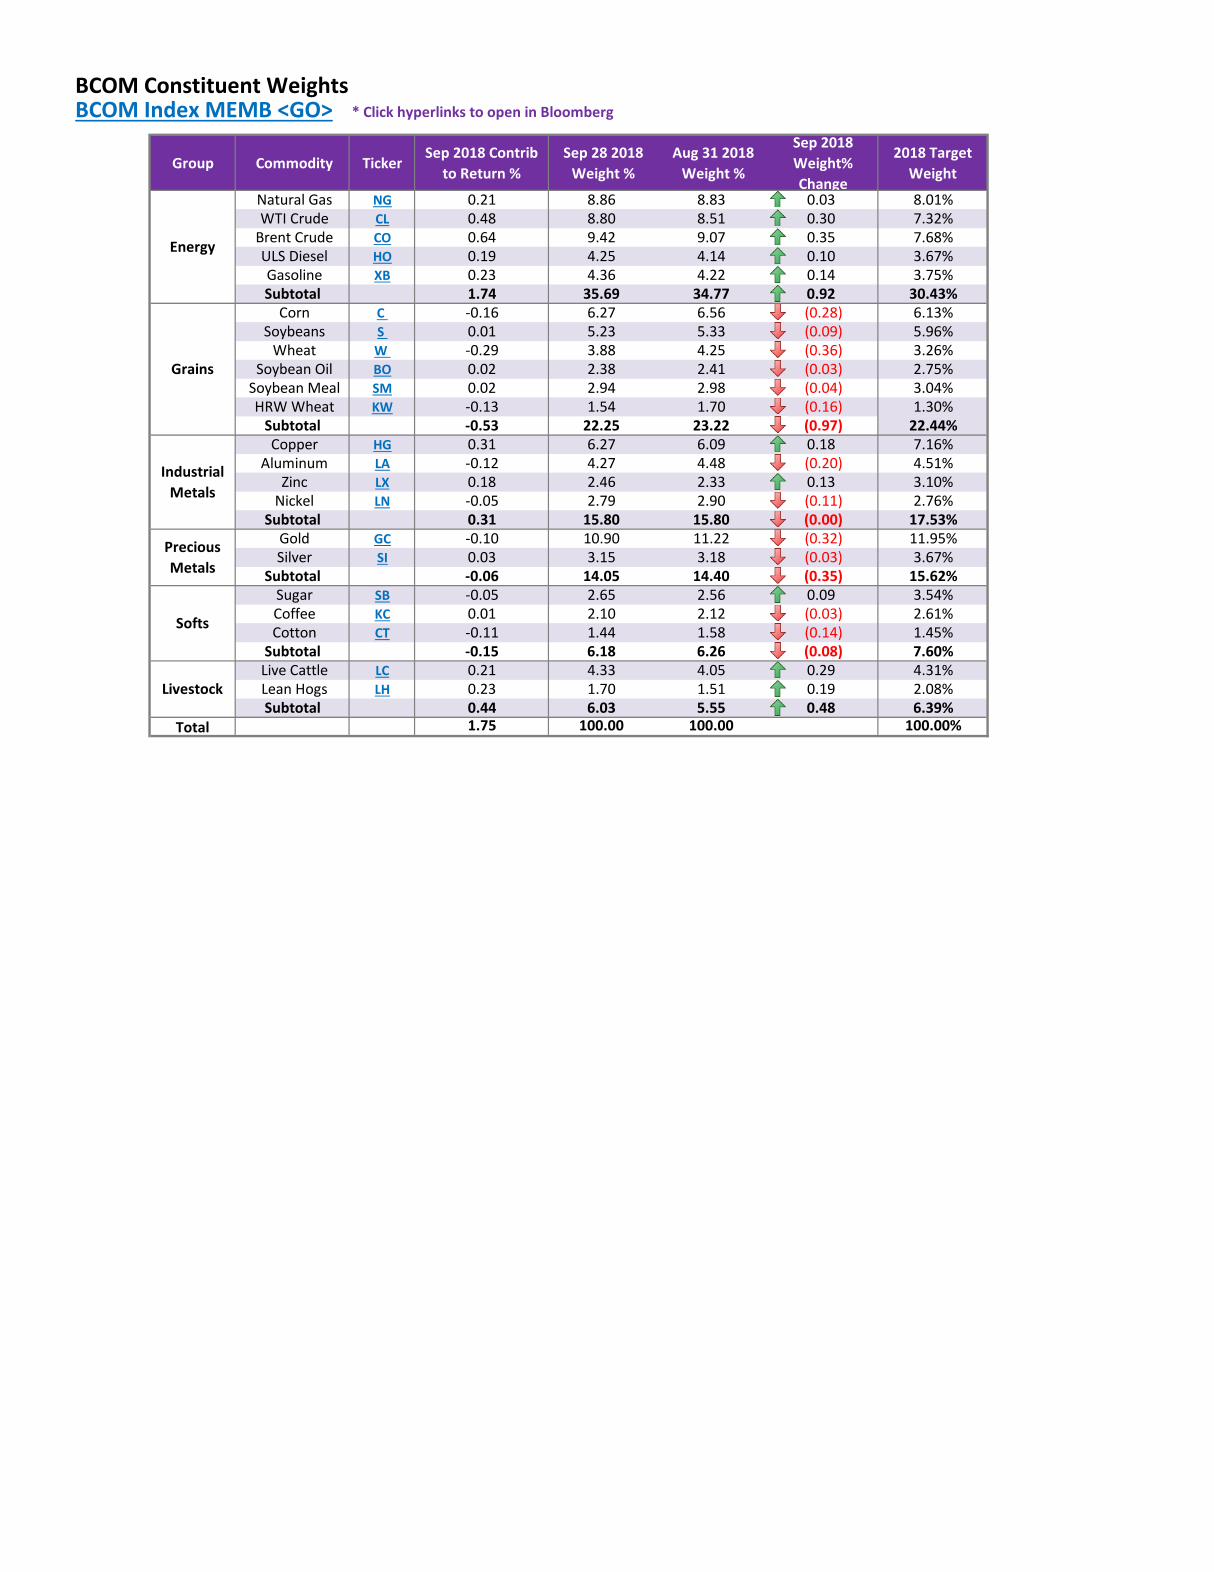
BCOM Constituent Weights BCOM Index MEMB <GO> * Click hyperlinks to open in Bloomberg
Group Commodity TickerSep 2018 Contrib
to Return %Sep 28 2018
Weight %Aug 31 2018
Weight %
Sep 2018 Weight% Change
2018 Target Weight
Natural Gas NG 0.21 8.86 8.83 0.03 8.01% WTI Crude CL 0.48 8.80 8.51 0.30 7.32%
Brent Crude CO 0.64 9.42 9.07 0.35 7.68% ULS Diesel HO 0.19 4.25 4.14 0.10 3.67% Gasoline XB 0.23 4.36 4.22 0.14 3.75%Subtotal 1.74 35.69 34.77 0.92 30.43%
Corn C -0.16 6.27 6.56 (0.28) 6.13% Soybeans S 0.01 5.23 5.33 (0.09) 5.96%
Wheat W -0.29 3.88 4.25 (0.36) 3.26% Soybean Oil BO 0.02 2.38 2.41 (0.03) 2.75%
Soybean Meal SM 0.02 2.94 2.98 (0.04) 3.04% HRW Wheat KW -0.13 1.54 1.70 (0.16) 1.30%
Subtotal -0.53 22.25 23.22 (0.97) 22.44% Copper HG 0.31 6.27 6.09 0.18 7.16%
Aluminum LA -0.12 4.27 4.48 (0.20) 4.51% Zinc LX 0.18 2.46 2.33 0.13 3.10%
Nickel LN -0.05 2.79 2.90 (0.11) 2.76%Subtotal 0.31 15.80 15.80 (0.00) 17.53%
Gold GC -0.10 10.90 11.22 (0.32) 11.95% Silver SI 0.03 3.15 3.18 (0.03) 3.67%
Subtotal -0.06 14.05 14.40 (0.35) 15.62% Sugar SB -0.05 2.65 2.56 0.09 3.54% Coffee KC 0.01 2.10 2.12 (0.03) 2.61% Cotton CT -0.11 1.44 1.58 (0.14) 1.45%
Subtotal -0.15 6.18 6.26 (0.08) 7.60% Live Cattle LC 0.21 4.33 4.05 0.29 4.31% Lean Hogs LH 0.23 1.70 1.51 0.19 2.08%Subtotal 0.44 6.03 5.55 0.48 6.39%
Total 1.75 100.00 100.00 100.00%
Energy
Livestock
Softs
Precious Metals
Industrial Metals
Grains
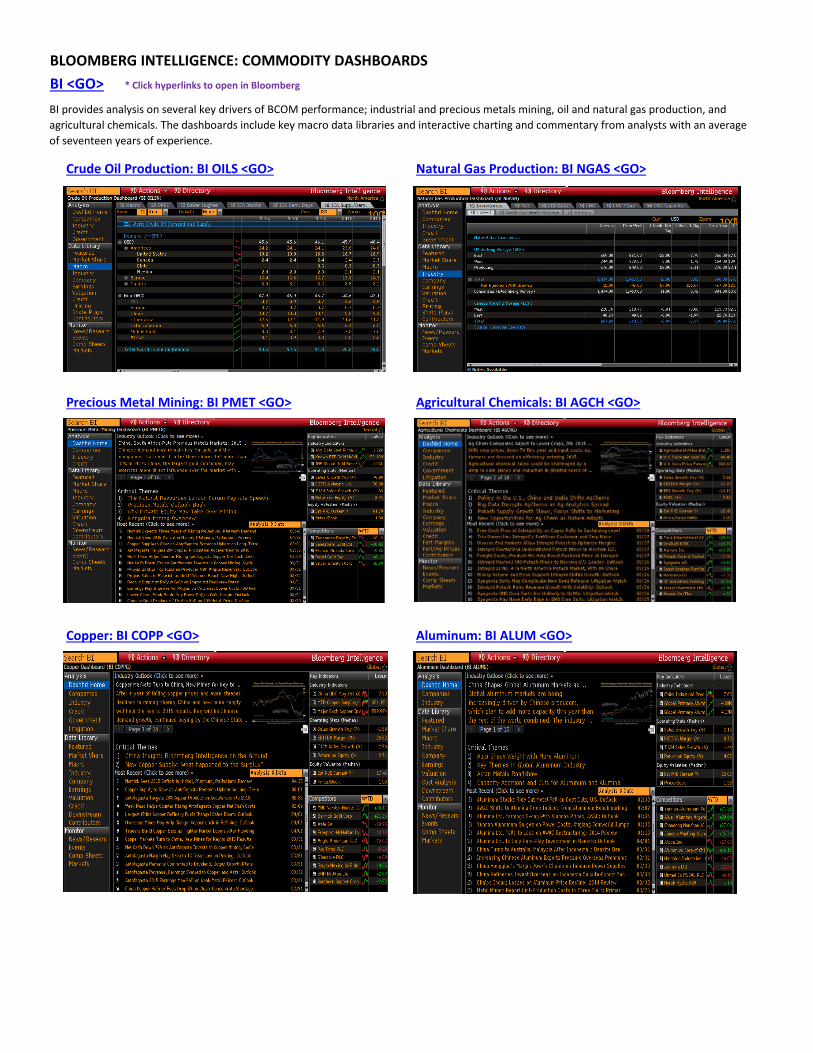
BLOOMBERG INTELLIGENCE: COMMODITY DASHBOARDS BI <GO> * Click hyperlinks to open in Bloomberg
Crude Oil Production: BI OILS <GO> Natural Gas Production: BI NGAS <GO>
Precious Metal Mining: BI PMET <GO> Agricultural Chemicals: BI AGCH <GO>
Copper: BI COPP <GO> Aluminum: BI ALUM <GO>
BI provides analysis on several key drivers of BCOM performance; industrial and precious metals mining, oil and natural gas production, and agricultural chemicals. The dashboards include key macro data libraries and interactive charting and commentary from analysts with an average of seventeen years of experience.
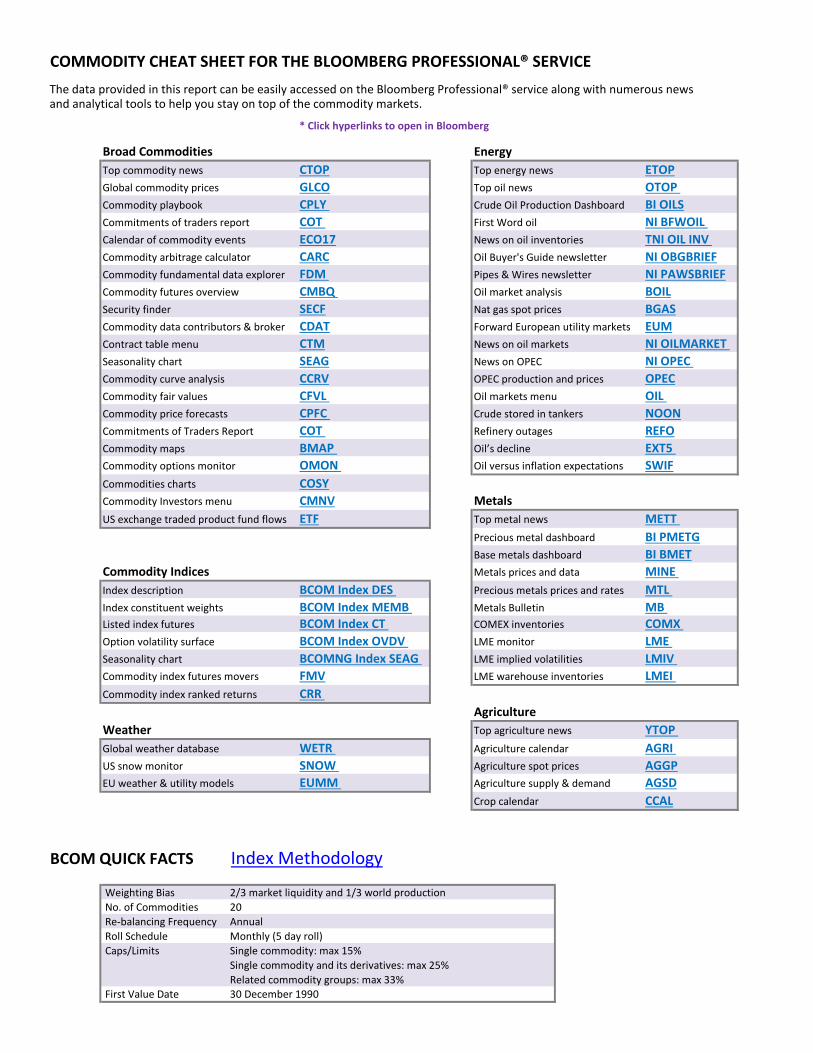
COMMODITY CHEAT SHEET FOR THE BLOOMBERG PROFESSIONAL® SERVICE
* Click hyperlinks to open in Bloomberg
Broad Commodities EnergyTop commodity news CTOP Top energy news ETOPGlobal commodity prices GLCO Top oil news OTOP Commodity playbook CPLY Crude Oil Production Dashboard BI OILSCommitments of traders report COT First Word oil NI BFWOIL Calendar of commodity events ECO17 News on oil inventories TNI OIL INV Commodity arbitrage calculator CARC Oil Buyer's Guide newsletter NI OBGBRIEFCommodity fundamental data explorer FDM Pipes & Wires newsletter NI PAWSBRIEFCommodity futures overview CMBQ Oil market analysis BOILSecurity finder SECF Nat gas spot prices BGASCommodity data contributors & broker CDAT Forward European utility markets EUMContract table menu CTM News on oil markets NI OILMARKET Seasonality chart SEAG News on OPEC NI OPEC Commodity curve analysis CCRV OPEC production and prices OPECCommodity fair values CFVL Oil markets menu OIL Commodity price forecasts CPFC Crude stored in tankers NOONCommitments of Traders Report COT Refinery outages REFOCommodity maps BMAP Oil’s decline EXT5 Commodity options monitor OMON Oil versus inflation expectations SWIFCommodities charts COSYCommodity Investors menu CMNV MetalsUS exchange traded product fund flows ETF Top metal news METT
Precious metal dashboard BI PMETGBase metals dashboard BI BMET
Commodity Indices Metals prices and data MINE Index description BCOM Index DES Precious metals prices and rates MTL Index constituent weights BCOM Index MEMB Metals Bulletin MB Listed index futures BCOM Index CT COMEX inventories COMX Option volatility surface BCOM Index OVDV LME monitor LME Seasonality chart BCOMNG Index SEAG LME implied volatilities LMIV Commodity index futures movers FMV LME warehouse inventories LMEI Commodity index ranked returns CRR
AgricultureWeather Top agriculture news YTOP Global weather database WETR Agriculture calendar AGRI US snow monitor SNOW Agriculture spot prices AGGPEU weather & utility models EUMM Agriculture supply & demand AGSD
Crop calendar CCAL
BCOM QUICK FACTS Index Methodology
Weighting Bias 2/3 market liquidity and 1/3 world production No. of Commodities 20 Re-balancing Frequency Annual Roll Schedule Monthly (5 day roll) Caps/Limits Single commodity: max 15%
Single commodity and its derivatives: max 25%Related commodity groups: max 33%
First Value Date 30 December 1990
The data provided in this report can be easily accessed on the Bloomberg Professional® service along with numerous news and analytical tools to help you stay on top of the commodity markets.
BLOOMBERG, BLOOMBERG INDICES and BCOM are trademarks or service marks of Bloomberg Finance L.P.
Bloomberg Finance L.P. and its affiliates ("collectively, "Bloomberg") or Bloomberg's licensors own all proprietary
right in the BLOOMBERG INDICES or BCOM. Bloomberg does not guarantee the timeliness, accuracy or
completeness of any data or information relating to BLOOMBERG INDICES or BCOM. Bloomberg makes no
warranty, express or implied, as to the BLOOMBERG INDICES or BCOM or any data or values relating thereto or
results to be obtained therefrom, and expressly disclaims all warranties of merchantability and fitness for a particular
purpose with respect thereto. It is not possible to invest directly in an index. Back-tested performance is not actual
performance. Past performance is not an indication of future results. To the maximum extent allowed by law,
Bloomberg, its licensors, and its and their respective employees, contractors, agents, suppliers and vendors shall
have no liability or responsibility whatsoever for any injury or damages - whether direct, indirect, consequential,
incidental, punitive or otherwise - arising in connection with BLOOMBERG INDICES or BCOM or any data or
values relating thereto - whether arising from their negligence or otherwise. This document constitutes the provision
of factual information, rather than financial product advice. Nothing in the BLOOMBERG INDICES or BCOM
shall constitute or be construed as an offering of financial instruments or as investment advice or investment
recommendations (i.e., recommendations as to whether or not to “buy”, “sell”, “hold”, or to enter or not to enter into
any other transaction involving any specific interest or interests) by Bloomberg or its affiliates or a recommendation
as to an investment or other strategy by Bloomberg or its affiliates. Data and other information available via the
BLOOMBERG INDICES or BCOM should not be considered as information sufficient upon which to base an
investment decision. All information provided by the BLOOMBERG INDICES or BCOM is impersonal and not
tailored to the needs of any person, entity or group of persons. Bloomberg and its affiliates do not express an opinion
on the future or expected value of any security or other interest and do not explicitly or implicitly recommend or
suggest an investment strategy of any kind. Customers should consider obtaining independent advice before making
any financial decisions. © 2016 Bloomberg Finance L.P. All rights reserved. This document and its contents may
not be forwarded or redistributed without the prior consent of Bloomberg.
The BLOOMBERG PROFESSIONAL® service and BLOOMBERG Data (the “Services”) are owned and
distributed by Bloomberg Finance L.P. (“BFLP”) in all jurisdictions other than Argentina, Bermuda, China, India,
Japan, and Korea (the “BLP Countries”). BFLP is a wholly owned subsidiary of Bloomberg L.P. (“BLP”). BLP
provides BFLP with global marketing and operational support and service for the Services and distributes the
Services either directly or through a non-BFLP subsidiary in the BLP Countries. Certain functionalities distributed
via the Services are available only to sophisticated institutional investors and only where the necessary legal
clearance has been obtained. BFLP, BLP and their affiliates do not guarantee the accuracy of prices or information
in the Services. Nothing in the Services shall constitute or be construed as an offering of financial instruments by
BFLP, BLP or their affiliates, or as investment advice or recommendations by BFLP, BLP or their affiliates of an
investment strategy or whether or not to “buy”, “sell” or “hold” an investment. Information available via the
Services should not be considered as information sufficient upon which to base an investment decision.
BLOOMBERG, BLOOMBERG PROFESSIONAL, BLOOMBERG MARKETS, BLOOMBERG NEWS,
BLOOMBERG ANYWHERE, BLOOMBERG TRADEBOOK, BLOOMBERG TELEVISION, BLOOMBERG
RADIO, BLOOMBERG PRESS and BLOOMBERG.COM are trademarks and service marks of BFLP, a Delaware
limited partnership, or its subsidiaries. © 2016 Bloomberg Finance L.P. All rights reserved. This document and its
contents may not be forwarded or redistributed without the prior consent of Bloomberg.
Bloomberg Intelligence is a service provided by Bloomberg Finance L.P. and its affiliates. Bloomberg Intelligence
shall not constitute, nor be construed as, investment advice or investment recommendations (i.e., recommendations
as to whether or not to “buy”, “sell”, “hold”, or to enter or not to enter into any other transaction involving any
specific interest) or a recommendation as to an investment or other strategy. No aspect of the Bloomberg
Intelligence function is based on the consideration of a customer's individual circumstances. Bloomberg Intelligence
should not be considered as information sufficient upon which to base an investment decision. You should
determine on your own whether you agree with Bloomberg Intelligence.
Bloomberg Intelligence is offered where the necessary legal clearances have been obtained. Bloomberg Intelligence
should not be construed as tax or accounting advice or as a service designed to facilitate any Bloomberg Intelligence
subscriber's compliance with its tax, accounting, or other legal obligations. Employees involved in Bloomberg
Intelligence may hold positions in the securities analyzed or discussed on Bloomberg Intelligence.
Related Documents