BlogMyData A Virtual Research Environment for collaborative visualization of environmental data Andrew Milsted, Jeremy Frey Department of Chemistry, University of Southampton Jon Blower, Adit Santokhee Reading e-Science Centre, University of Reading

BlogMyData A Virtual Research Environment for collaborative visualization of environmental data Andrew Milsted, Jeremy Frey Department of Chemistry, University.
Dec 16, 2015
Welcome message from author
This document is posted to help you gain knowledge. Please leave a comment to let me know what you think about it! Share it to your friends and learn new things together.
Transcript
BlogMyDataA Virtual Research Environment for collaborative visualization of environmental data
Andrew Milsted, Jeremy FreyDepartment of Chemistry, University of Southampton
Jon Blower, Adit SantokheeReading e-Science Centre, University of Reading
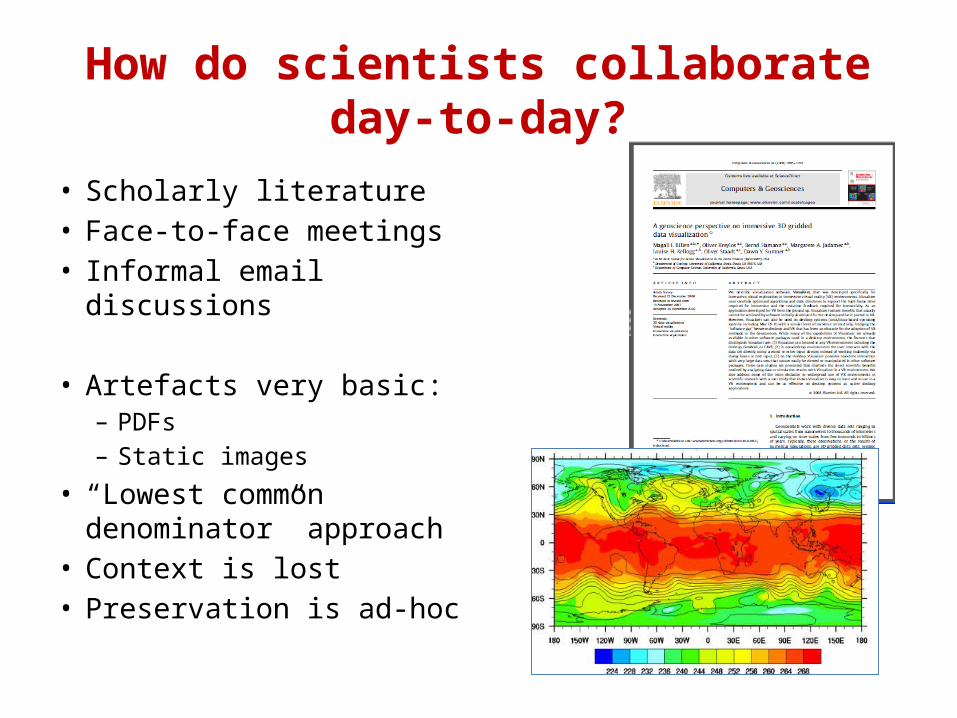
How do scientists collaborateday-to-day?
• Scholarly literature• Face-to-face meetings• Informal email discussions
• Artefacts very basic:– PDFs– Static images
• “Lowest common denominator” approach
• Context is lost• Preservation is ad-hoc
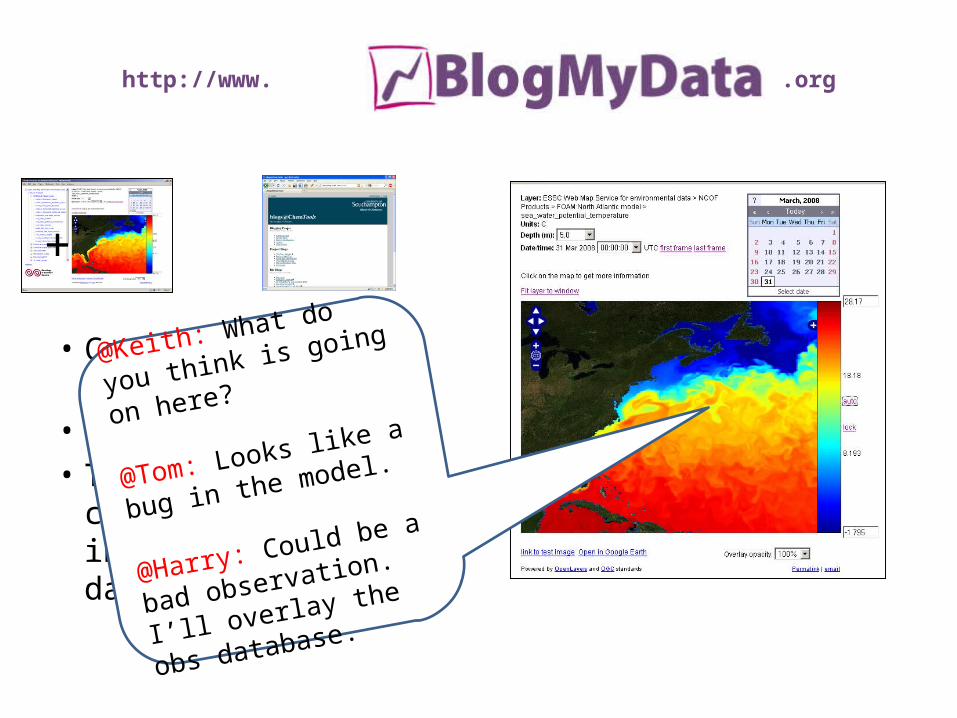
http://www. .org
• Combines web-based visualization…
• With a blog engine…• To create a VRE for
collaborative interpretation of data
www.rdg.ac.uk/godiva2
+ =blogs.chem.soton.ac.uk
@Keith: What do you think
is going on here?
@Tom: Looks like a bug in
the model.
@Harry: Could be a bad
observation. I’ll overlay
the obs database.
4
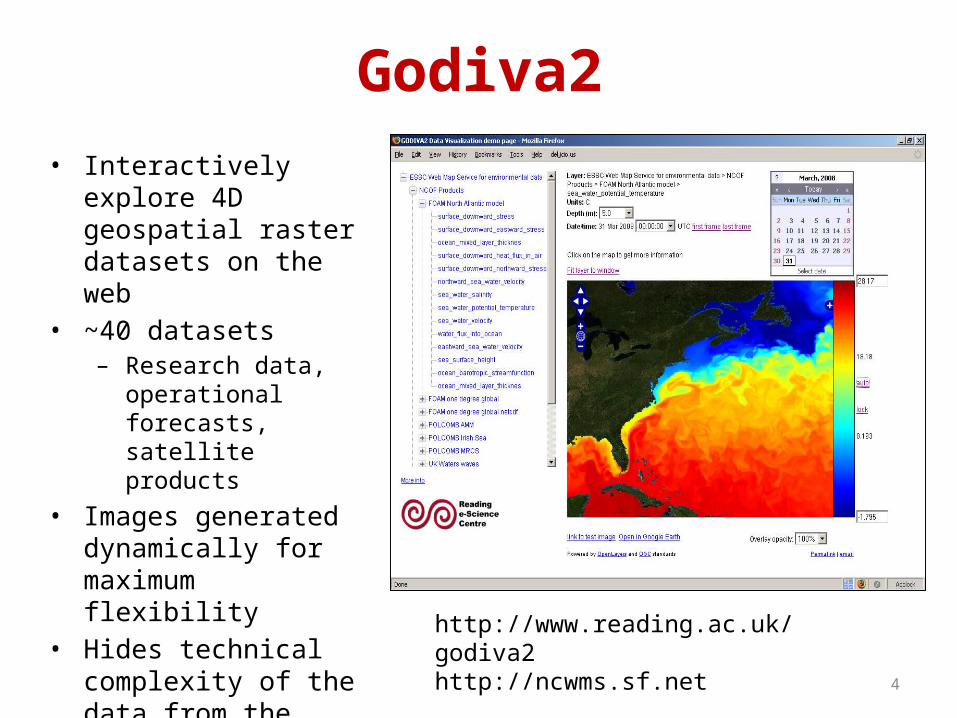
Godiva2• Interactively explore 4D
geospatial raster datasets on the web
• ~40 datasets– Research data,
operational forecasts, satellite products
• Images generated dynamically for maximum flexibility
• Hides technical complexity of the data from the users
http://www.reading.ac.uk/godiva2http://ncwms.sf.net
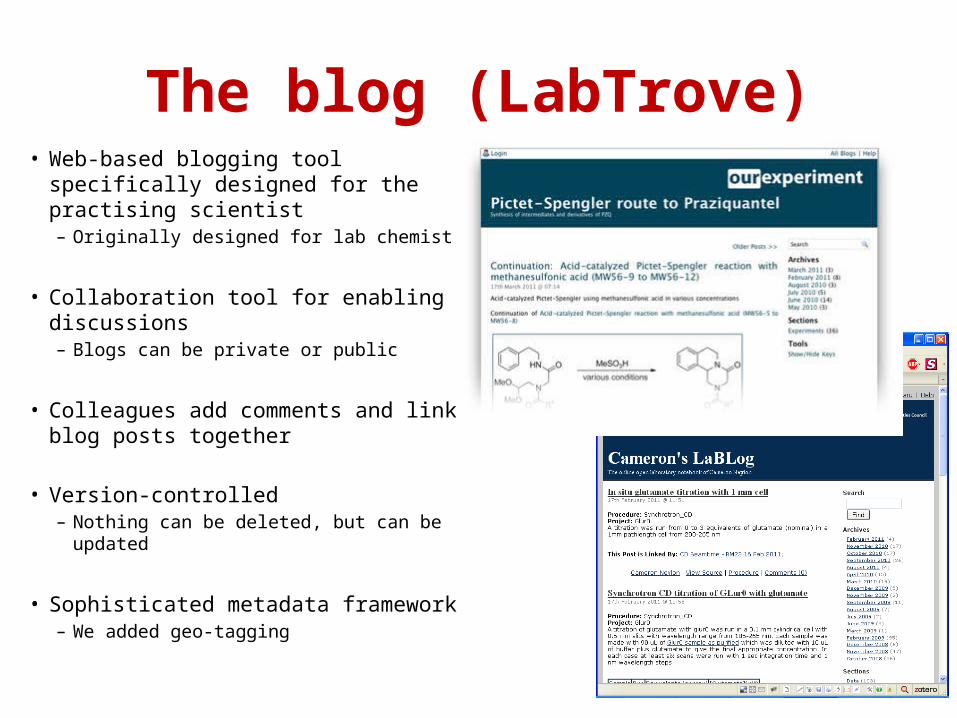
The blog (LabTrove)• Web-based blogging tool specifically
designed for the practising scientist– Originally designed for lab chemist
• Collaboration tool for enabling discussions– Blogs can be private or public
• Colleagues add comments and link blog posts together
• Version-controlled– Nothing can be deleted, but can be
updated
• Sophisticated metadata framework– We added geo-tagging
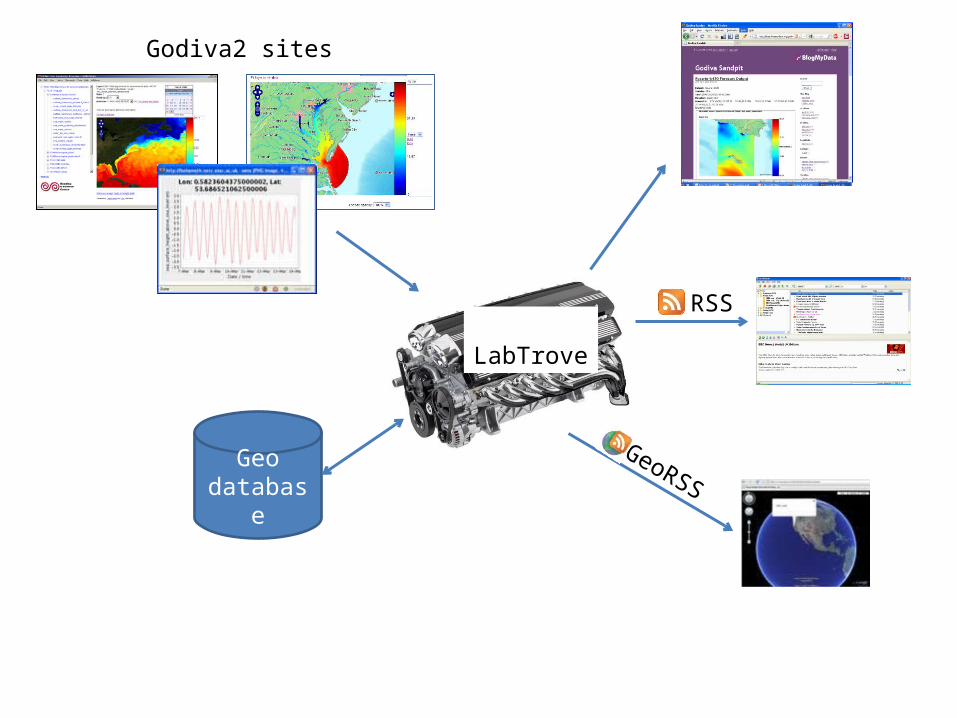
LabTrove
Geodatabase
Godiva2 sites
RSS
GeoRSS

Illustrative use cases
• Postdoc/PhD student:– Discover an interesting feature in a dataset– Post a blog entry asking a question
• Colleague at a different institute– Discovers others working on same dataset and/or same
geographic area– Discovers blog entry, posts explanatory comment
• PI/Manager:– Views “hot topics” feed (most active discussions)
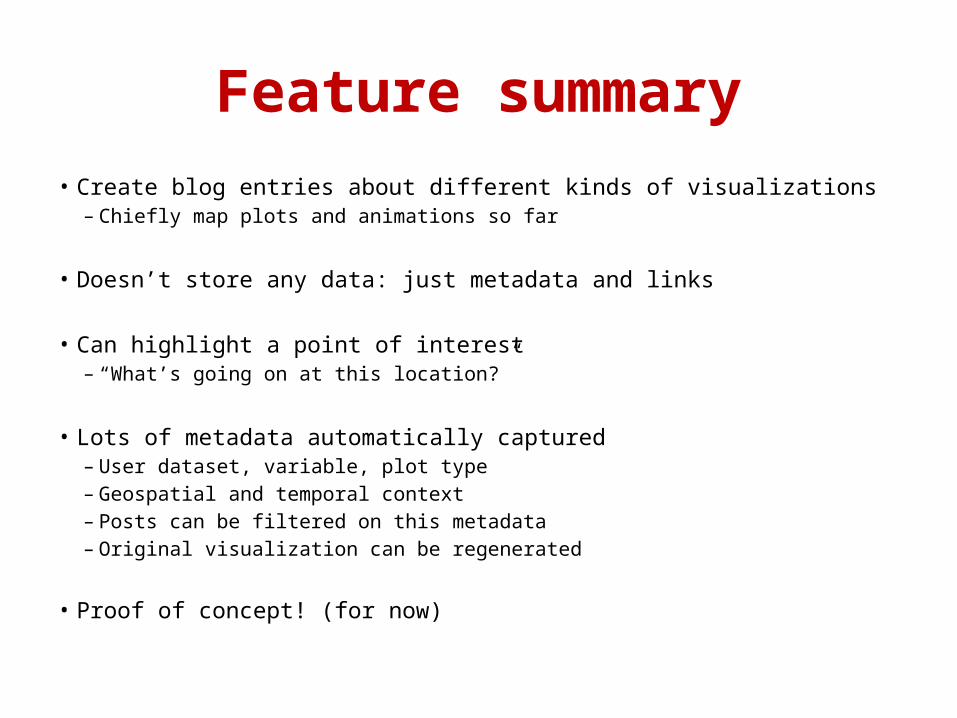
Feature summary• Create blog entries about different kinds of visualizations
– Chiefly map plots and animations so far
• Doesn’t store any data: just metadata and links
• Can highlight a point of interest– “What’s going on at this location?”
• Lots of metadata automatically captured– User dataset, variable, plot type– Geospatial and temporal context– Posts can be filtered on this metadata– Original visualization can be regenerated
• Proof of concept! (for now)
• Demo video: see http://blogs.blogmydata.org/projectblog/398/New_demonstration_video.html
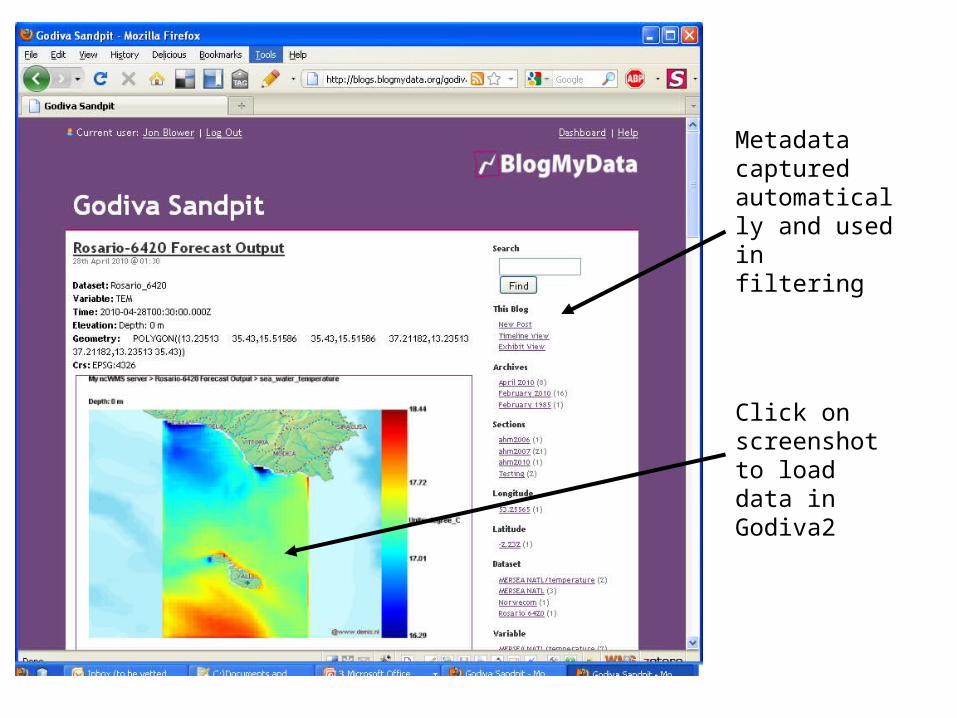
Metadata captured automatically and used in filtering
Click on screenshot to load data in Godiva2
User feedback guided development
• Privacy controls essential– We could give even more control in future
• “Content is king”– Prototype system needs to contain interesting
data!
• Animations difficult to handle but big attraction for users
13
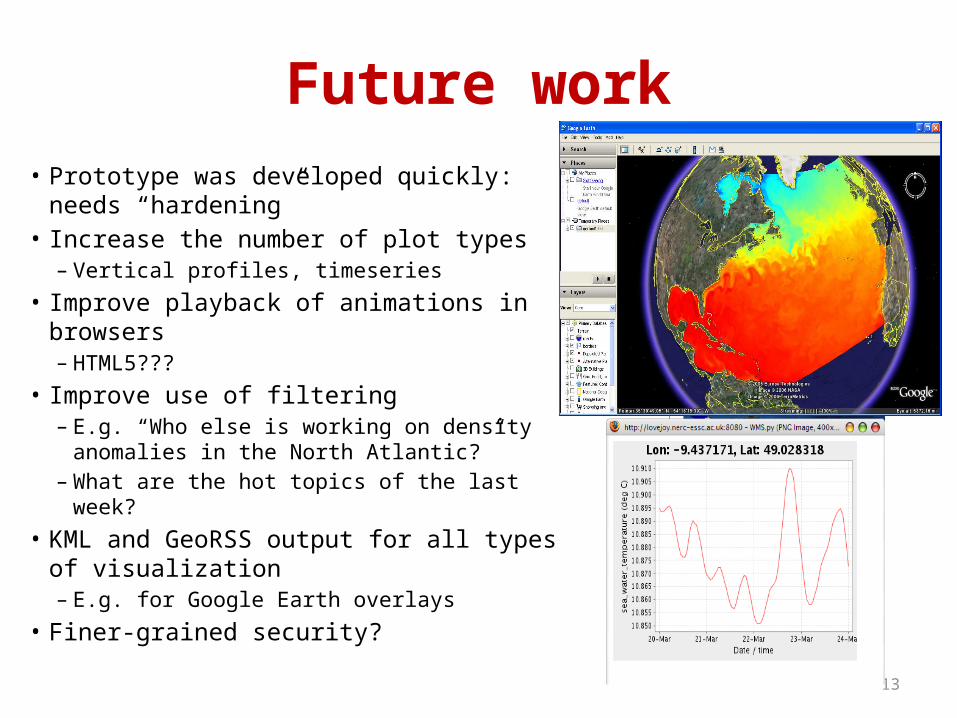
Future work• Prototype was developed quickly: needs
“hardening”• Increase the number of plot types
– Vertical profiles, timeseries• Improve playback of animations in browsers
– HTML5???• Improve use of filtering
– E.g. “Who else is working on density anomalies in the North Atlantic?”
– What are the hot topics of the last week?• KML and GeoRSS output for all types of
visualization– E.g. for Google Earth overlays
• Finer-grained security?
Related Documents