To link to this article: DOI:10.1016/j.scitotenv.2003.10.014 http://dx.doi.org/10.1016/j.scitotenv.2003.10.014 This is an author-deposited version published in: http://oatao.univ-toulouse.fr/ Eprints ID : 5742 To cite this version: Gauthier, Laury and Tardy, Emmanuelle and Mouchet, Florence and Marty, Josette Biomonitoring of the genotoxic potential (micronucleus assay) and detoxifying activity (EROD induction) in the River Dadou (France), using the amphibian Xenopus laevis. (2004) Science of the Total Environment, vol. 323 (n°1-3). ISSN 0048-9697 Open Archive Toulouse Archive Ouverte (OATAO) OATAO is an open access repository that collects the work of Toulouse researchers and makes it freely available over the web where possible. Any correspondence concerning this service should be sent to the repository administrator: [email protected] brought to you by CORE View metadata, citation and similar papers at core.ac.uk provided by Open Archive Toulouse Archive Ouverte

Welcome message from author
This document is posted to help you gain knowledge. Please leave a comment to let me know what you think about it! Share it to your friends and learn new things together.
Transcript
To link to this article: DOI:10.1016/j.scitotenv.2003.10.014 http://dx.doi.org/10.1016/j.scitotenv.2003.10.014
This is an author-deposited version published in: http://oatao.univ-toulouse.fr/ Eprints ID: 5742
To cite this version: Gauthier, Laury and Tardy, Emmanuelle and Mouchet, Florence and Marty, Josette Biomonitoring of the genotoxic potential (micronucleus assay) and detoxifying activity (EROD induction) in the River Dadou (France), using the amphibian Xenopus laevis. (2004) Science of the Total Environment, vol. 323 (n°1-3). ISSN 0048-9697
Open Archive Toulouse Archive Ouverte (OATAO) OATAO is an open access repository that collects the work of Toulouse researchers and makes it freely available over the web where possible.
Any correspondence concerning this service should be sent to the repository administrator: [email protected]
brought to you by COREView metadata, citation and similar papers at core.ac.uk
provided by Open Archive Toulouse Archive Ouverte
Biomonitoring of the genotoxic potential(micronucleus assay)anddetoxifying activity(EROD induction)in the River Dadou
(France), using the amphibianXenopus laevis
Laury Gauthier *, Emmanuelle Tardy , Florence Mouchet , Josette Martya, b a b
Laboratoire d’Ecologie des Hydrosystemes—LEH, FRE CNRS UPS 2630,a `Centre Universitaire de formation et de Recherche Jean-Francois Champollion, campus d’Albi, place de Verdun,¸
81012 Albi Cedex 9, FranceCentre de Biologie du Developpement, UMR 5547 du CNRS, affiliee a l’INSERM, Universite Paul Sabatier,b ´ ´ ` ´
118 route de Narbonne, 31062 Toulouse Cedex, France
Abstract
Within the framework of a general survey of the water quality of the river Dadou(Tarn, France), different physico-chemical parameters were measured and an inventory of the fish population was made along the water course, aroundthe Rassisse dam. With the aim of monitoring the potential genotoxic effects and the detoxifying activities inducedin organisms exposed to the river water, two in vivo bioassays were performed in laboratory experiments, usinglarvae of the amphibianXenopus laevis. The first was the micronucleus test, using red blood cells, and the secondthe assay of ethoxyresorufin-O-deethylase(EROD) induction in the liver of exposed animals. Eight water sampleswere taken from the river and at outlet points from the two major industrial activities of the studied section of thewater course: a spar-fluor mine and a water treatment plant. Genotoxic impact and EROD induction were measuredin the larvae. The effluent of the filter-washing process from the water treatment plant was found to be particularlygenotoxic, even after dilution in pure reconstituted water, but no particular genotoxicity was found, either in Dadouriver water, or in the effluents from the mine. On the other hand, most of the water samples tested produced a clearinduction of EROD activity compared to the level of enzymatic activity found in the liver of larvae reared in theriver water sampled upstream of the industrial activities. These results were interpreted taking into account(i) thehigh concentrations of pollutants(fluorine and manganese)measured in the river water,(ii) the very low populationlevels inventoried in the downstream section of the river and(iii ) the possible interactions between the substancespresent in the river water, particularly the classical EROD inducers PAHs and PCBs.
Keywords: Genotoxicity testing; Micronucleus assay; EROD activity; Amphibian;Xenopus; River water quality
*Corresponding author. Tel.:q33-5-62-26-99-96; fax:q33-5-63-48-17-98.E-mail address: [email protected](L. Gauthier).
1. Introduction
Increased environmental pollution can be attrib-uted to a variety of factors resulting from newindustrial and agricultural technologies, togetherwith changes in our way of life. In addition, thenature of the pollution itself has become morediverse. Regardless of its origin, pollution tends tofind its way into the aquatic environment. Geno-toxic pollutants affect the aquatic ecosystems andtheir presence in water can also have repercussionson non-aquatic species, via food chains, or simplyas a result of drinking the water. One shouldtherefore be aware of the hidden risks stemmingfrom potential genotoxic substances in the aquaticenvironment. Moreover, a considerable time mayelapse between the action of the mutagenic agentand the outward signs of its effects. The relation-ship between cause and effect may thus becomeobscure.
The mutagenic risk is particularly apparent inprokaryotes, and is readily discernible in plantsand animals with a rapid rate of reproduction,although it is often not very perceptible in plantsand animals(including humans) with a slowerreproduction rate. The mutagenicity of an unknownsubstance is usually evaluated by placing it incontact with a living system, which is then exam-ined for genetic damage. A number of tests havebeen developed, using either plants or aquaticanimals (see the reviews of Jaylet et al., 1990;Jaylet and Zoll, 1990; Zoll et al., 1990; Godet etal., 1993), which can potentially be used to assessthe genotoxic potency of water samples. The testscan be carried out with intact animals, taking intoaccount uptake and elimination, internal transportand metabolism. An example is the use of amphib-ians, which have proved to be valuable biomarkersand a sensitive model for environmental studies.Larvae can be reared, not only in containers filledwith unconcentrated water samples(laboratoryconditions)but also in running water of varioussources (factory effluents, surface water, riverwaters,«).
We decided to use the amphibianXenopus laevisto monitor the long-term effects of exposure toriver water. Two genotoxic endpoints were ana-lysed in larvae of these animals: the induction of
micronucleated erythrocytes in the circulatingblood and the induction of 7-ethoxyresorufin-O-deethylase(EROD) activities in the liver.
In amphibian larvae, as in most eukaryotes,genome mutations may result in the formation ofmicronuclei, which is the consequence of chro-mosome fragmentation or malfunction of themitotic apparatus. Thus, clastogenic compoundsand spindle poisons both lead to an increase in thenumber of micronucleated cells. Induction ofmicronuclei has been widely used for genotoxicitytesting. In aquatic vertebrates, the micronucleustest has been carried out on different species offish (Das and Nanda, 1986; Metcalfe, 1988; Car-rasco et al., 1990). Amphibians have also provedto be valuable biological models for micronucleusinduction(Jaylet et al., 1986; Krauter et al., 1987).
In aquatic organisms, EROD activities havebeen measured mainly in fishes, both marine(Bur-geot et al., 1994) and continental species(Vindi-mian et al., 1993; Anderson et al., 1995; Collieret al., 1995). Cytochrome P4501A synthesis ismainly induced in aquatic organisms exposed tochemical contaminants, such as polycyclic aromat-ic hydrocarbons(PAHs), polychlorinated biphen-yls (PCBs) and dioxins. Many authors havedescribed significant induction of cytochromeP4501A correlated with various types of pollutionin fresh water, mainly in fishes(Vindimian andGarric, 1989; Masfaraud et al., 1990). Of thedifferent monooxygenase activities, EROD activi-ties were found to be the most sensitive to monitorsof pollution in the aquatic environment(Monod etal., 1988). Relatively few studies have reportedthe use of amphibians to monitor the induction ofcytochrome P4501A activities in response to envi-ronmental pollution. Aryl hydrocarbon hydroxyla-se activities were measured inAmbystoma tigrinum(Busbee et al., 1975) andPleurodeles waltl (Martyet al., 1989). Hepatic microsomal mixed-functionoxidases were studied in anuran species:Ranatemporaria (Harri, 1980), Rana catesbeiana, Rananigromaculata, Bufo bufo japonicus and Xenopuslaevis (Noshiro and Omura, 1984). In our labora-tory, Bekaert(1999)measured EROD activity inthe liver of xenopus larvae exposed to ben-zo(a)pyrene and she extended the application of
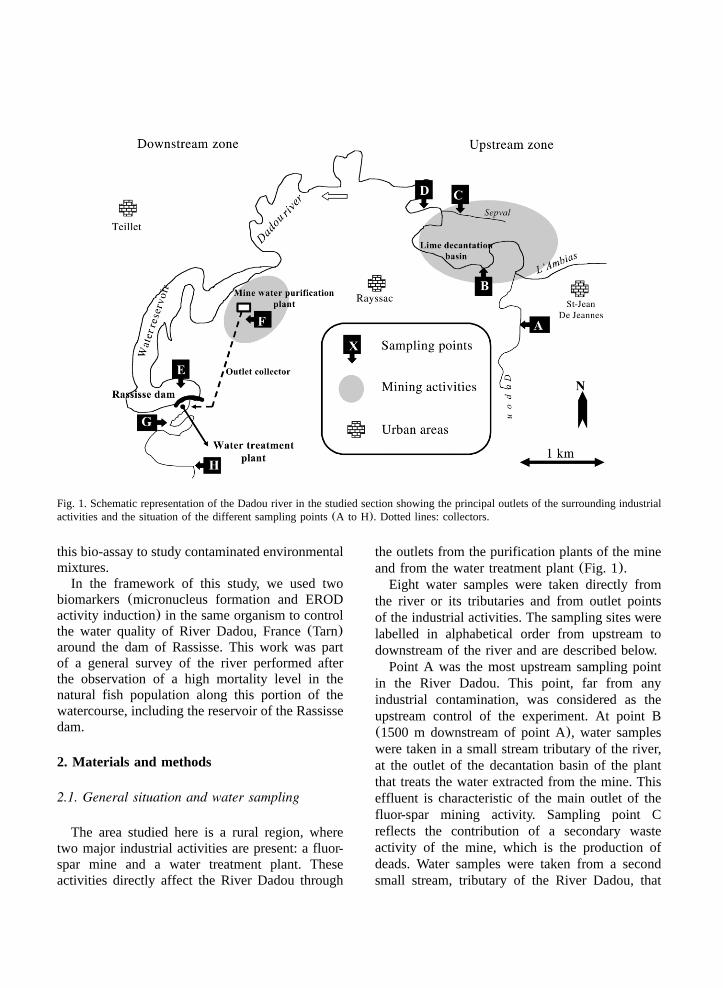
Fig. 1. Schematic representation of the Dadou river in the studied section showing the principal outlets of the surrounding industrialactivities and the situation of the different sampling points(A to H). Dotted lines: collectors.
this bio-assay to study contaminated environmentalmixtures.
In the framework of this study, we used twobiomarkers(micronucleus formation and ERODactivity induction) in the same organism to controlthe water quality of River Dadou, France(Tarn)around the dam of Rassisse. This work was partof a general survey of the river performed afterthe observation of a high mortality level in thenatural fish population along this portion of thewatercourse, including the reservoir of the Rassissedam.
2. Materials and methods
2.1. General situation and water sampling
The area studied here is a rural region, wheretwo major industrial activities are present: a fluor-spar mine and a water treatment plant. Theseactivities directly affect the River Dadou through
the outlets from the purification plants of the mineand from the water treatment plant(Fig. 1).
Eight water samples were taken directly fromthe river or its tributaries and from outlet pointsof the industrial activities. The sampling sites werelabelled in alphabetical order from upstream todownstream of the river and are described below.
Point A was the most upstream sampling pointin the River Dadou. This point, far from anyindustrial contamination, was considered as theupstream control of the experiment. At point B(1500 m downstream of point A), water sampleswere taken in a small stream tributary of the river,at the outlet of the decantation basin of the plantthat treats the water extracted from the mine. Thiseffluent is characteristic of the main outlet of thefluor-spar mining activity. Sampling point Creflects the contribution of a secondary wasteactivity of the mine, which is the production ofdeads. Water samples were taken from a secondsmall stream, tributary of the River Dadou, that
collects running water through the deads of themine. At point D, water was sampled in the river,downstream of points A(4 km), B and C, andupstream of the Rassisse reservoir. This pointenabled the global impact of the mining activityon the river to be analysed. Sampling point E issituated in the Rassisse reservoir and correspondsto the intake of the water treatment plant(;14km downstream of point A). At point F, water wassampled at the outlet of the general purificationplant of the mine. A collector carries the effluentto the river, downstream of the Rassisse dam.Water samples were also taken at point G, at theoutlet of the water treatment plant(;400 mdownstream of point E). The effluent here corre-sponds to the water from the washing of the sandfilters of the plant. A collector brings the effluentto the river. Point H—located approximately 16km downstream of point A—was the most down-stream site of the River Dadou sampled in thiswork.
For each water sample, 40 l was collected in10-l plastic containers for subsequent laboratorytests with amphibian larvae. Water samples weremaintained at 48C in the dark before testing.Physical parameters(pH and dissolved oxygen)were measured in water samples using a pH 96WTW pH meter and an oxi 96 WTW oxy meter.These two properties were followed throughoutthe exposure of the animals to the water. Electricalfishing was also performed to evaluate the popu-lation level in the river at sampling sites A, D andH. Physico-chemical analyses were also performedat the water sampling sites. These included pH,conductivity(measured at 208C), redox potential,TH (8F), Al, Cu, Mn and Fl levels.
2.2. The amphibian micronucleus assay using Xen-opus larvae
Originally, the test procedure was established inour laboratory on the anuranXenopus laevis (theSouth African clawed frog or common platanna;family Pipidae) by Van Hummelen et al.(1989)and Zoll et al. (1990). The test is particularlysuitable for evaluating promutagens and genotoxicagents with a direct action, as well as complexenvironmental mixtures, such as urban and indus-
trial effluents (Zoll-Moreux, 1991; Zoll-Moreuxand Ferrier, 1999). Furthermore, their abundantegg-laying, the availability of larvae throughoutthe year and their consumption of standardizeddehydrated food confer certain advantages onXen-opus over the urodeles(Gauthier, 1996).
The test procedure used in this study wasdescribed in the French Standard NF T 90-325(AFNOR, 2000), which is the French NationalOrganization for quality regulations. Briefly, itconsists in the evaluation of the number of micron-ucleated red blood cells(RBCs) in larvae exposedfor 12 days at 22"0.5 8C under a normal light–dark cycle. The larvae are exposed by groups of20 animals in 5-l glass flasks containing 2 l ofwater(100 ml per larva). The test begins on larvaeat stage 50 of the development table ofXenopus(Nieuwkoop and Faber, 1956). Throughout theperiod of exposure, water and food are reneweddaily. Positive and negative controls were includedin each experiment described here. The negativecontrol was filtered over sand and active charcoal,supplemented with mineral salts. The positivecontrol was a 20 mgyl solution of cyclophospham-ide monohydrate. After exposure, blood sampleswere taken from each larva by cardiac punctureand a single smear was prepared per animal. Afterfixing in methanol and staining with hematoxylin,the smears were screened under the microscope(oil immersion lens,=1500). The number ofRBCs that contained one or more micronuclei wasdetermined in a total sample of 1000 erythrocytesper larva. For each animal, the mitotic index(number of mitotic erythrocytes per 1000) wasevaluated by scoring the dividing cells of thecirculating blood on the smears. For each groupof animals, the results(number of micronucleatedRBCs per 1000)obtained for the individual larvaewere arranged in increasing order of magnitudeand the medians and quartiles calculated. Thestatistical method used to compare the medianswas based on the recommendations of Mac Gill etal. (1978) and consists in determining the theor-etical medians of samples of sizen (wheren07)and their 95% confidence limits expressed byM"1.57=IQRy6n, where M is the median andIQR is the Inter-Quartile Range. Under these con-ditions, the difference between the theoretical
medians of the test groups and the theoreticalmedian of the control group is significant to within95% certainty if there is no overlap. The result isthen positive.
2.3. EROD activities in the larvae of the amphib-ian Xenopus laevis
After exposure of theXenopus larvae for 12consecutive days to the water to be tested andafter cardiac puncture, the livers of the larvae weretaken. After removal of the gall bladder, the liversof each treated group were pooled. They were thenhomogenized with a potter(1200 rpm) in thehomogenization buffer(phosphate NayK, 50 mM;KCl, 1.15 %; PMSF, 1 mM; Aprotinine, 14 Uyml).
Protein was assayed in homogenate samples bythe Bradford method(Bradford, 1976), using abovine serum albumin solution(BSA Sigma) asstandard.
The EROD activity of the homogenate wasmeasured in an incubation buffer(phosphate buf-fer, 100 mM; NADP, 0.5 mM; G6P, 5 mM). Beforeprotein assay, 10 U of G6PDH(Boehringer) wasadded to 10 ml of the buffer. The incubationconditions were as follows: incubation buffer(500ml), water (240 ml), liver homogenate(250 ml),substrate, 7-ethoxyresorufin(10 ml). After incu-bation for 2 min at 208C, the reaction was stoppedby adding 2 ml of acetone. The resorufin fluores-cence emitted during the incubation period wasmeasured using a Jobin-Yvon spectrofluorimeteron a 2-ml sample after centrifugation(5 min at10 000 rpm). The quantity of resorufin in thesamples was evaluated by comparison with a pre-established standard curve.
EROD activities are expressed as pmoles ofresorufin formed per minute per milligram ofprotein in the liver homogenate and per milligramof fresh liver. The level of induction is expressedas the ratio of the activity of treated larvaeyactivityof control larvae.
In order to analyse more fully the resultsobtained,Xenopus larvae were subjected to fourconcentrations(4, 40, 100 and 200 ppb) of a PAH,benzo(a)pyrene(BwaxP), and EROD activity andmicronucleus formation were analysed. In this way,
it was possible to compare the EROD activitiesmeasured in the river water with those inductedby known concentrations of B(a)P in the rearingmedium of the animals and to compare it with theinduction level of micronucleated RBCs in theexposed larvae. In these experiments, B(a)P wasdissolved in dimethyl sulfoxide(DMSO) beforeaddition to the water to be tested. A solvant controlcontaining the same concentration of DMSO(0.1%) was tested in parallel.
3. Results
The physical parameters(pH, dissolved oxygenand temperature) measured in the water samplesbefore testing on amphibian larvae showed thatthe characteristics of the effluents were compatiblewith normal rearing of the amphibians under theconditions of the test (6-pH-9; dissolvedO 060%; temperature from 21.5 to 22.58C),2
except for the water sampled at point C, whichhad a very low pH(3.95). This acidic effluentrequired neutralization before the amphibian larvaewere exposed to it.
Before genotoxicity testing, preliminary toxicityassays were performed(10 Xenopus larvae perliter of water) to evaluate the feasibility of the testunder non-lethal conditions. We observed no par-ticular toxicity to the larvae reared for 6 days inwater samples A, D, E and H. On the other hand,all the Xenopus larvae reared in water samples B,C, F and G displayed consequences of severeintoxication (reduced size, asphyxia, diminishedfood intake, death); for these effluents, preliminarydilutions with pure water were required beforetesting for micronucleus induction over a periodof 12 days.
3.1. The micronucleus assay using Xenopus larvae
The results obtained with diluted and undilutedeffluents are presented in Table 1 and Fig. 2. Thewater sampled at points A, E and H, correspondingto the water taken far from any industrial outletpoints, gave clearly negative responses. The larvaereared in water samples taken from the points B,C, D and F produced more micronuclei than thenegative control, although the increase was not
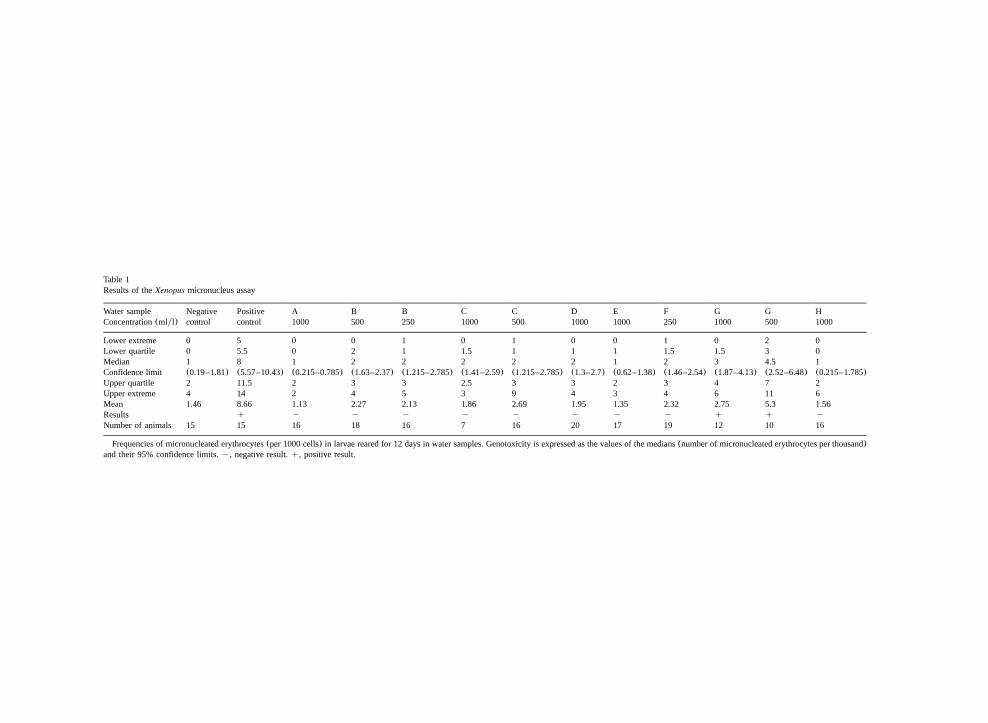
Table 1Results of theXenopus micronucleus assay
Water sample Negative Positive A B B C C D E F G G HConcentration(mlyl) control control 1000 500 250 1000 500 1000 1000 250 1000 500 1000
Lower extreme 0 5 0 0 1 0 1 0 0 1 0 2 0Lower quartile 0 5.5 0 2 1 1.5 1 1 1 1.5 1.5 3 0Median 1 8 1 2 2 2 2 2 1 2 3 4.5 1Confidence limit (0.19–1.81) (5.57–10.43) (0.215–0.785) (1.63–2.37) (1.215–2.785) (1.41–2.59) (1.215–2.785) (1.3–2.7) (0.62–1.38) (1.46–2.54) (1.87–4.13) (2.52–6.48) (0.215–1.785)Upper quartile 2 11.5 2 3 3 2.5 3 3 2 3 4 7 2Upper extreme 4 14 2 4 5 3 9 4 3 4 6 11 6Mean 1.46 8.66 1.13 2.27 2.13 1.86 2.69 1.95 1.35 2.32 2.75 5.3 1.56Results q y y y y y y y y q q yNumber of animals 15 15 16 18 16 7 16 20 17 19 12 10 16
Frequencies of micronucleated erythrocytes(per 1000 cells) in larvae reared for 12 days in water samples. Genotoxicity is expressed as the values of the medians(number of micronucleated erythrocytes per thousand)and their 95% confidence limits.y, negative result.q, positive result.

Fig. 2. Results of theXenopus micronucleus assay(frequencies of micronucleated erythrocytes—per 1000 cells—in larvae rearedfor 12 days in water samples from the River Dadou) and of the EROD activities(EROD induction protein) measured in their liver.
statistically significant. In these cases, the testresponse was considered to be negative. All thesesamples were effluents from mining activities. Itshould be noted that because of the highly toxiceffects previously detected with effluents B, C andF, the highest effluent concentrations tested withthe corresponding water samples were, respective-ly, 500, 1000 and 250 mlyl. In the case of effluentC, the micronucleus assay was only performed onthe seven larvae that survived after 12 days ofexposure to the undiluted water samples. Larvaereared in effluent F diluted to 250 mlyl survivedand consequently the micronucleus assay could beperformed on all of them. Water sample G induceda significant increase of micronucleated RBCs inthe larvae exposed to the raw and to the dilutedeffluents(500 mlyl). This latter water sample ledto the highest induction of micronucleated eryth-rocytes observed in our experiments.
3.2. EROD activities in the larvae of the amphib-ian Xenopus laevis
The measured EROD activities are expressedboth in terms of the liver homogenate proteinconcentration and of the whole liver(Table 2).They represent the quantity(pmole)of resorufine
produced per minute in the incubation medium.We observed a substantial fluctuation in theweights of the liver taken from the treated larvae.The EROD activities expressed in terms of thefresh weights of the livers take into account thephysiological condition of the larvae, compared tothe classical enzymatic activity expressed per mil-ligram protein. In both cases, the results revealedthe same overall variations and appeared coherent.Compared to those of the larvae exposed to theother water samples, the liver homogenates of theamphibians reared in the water from site C con-tained significantly lower EROD activity. More-over, the larvae reared for 12 days in effluent Cdiluted twofold(500 mlyl) expressed higher enzy-matic activities than the larvae exposed to theundiluted effluent. The animals reared in the waterfrom sample C had very small, hemolysed livers.These physiological problems probably contributedto the observed alterations of the enzymatic activ-ities in the livers of these animals. Liver freshweights of larvae reared in diluted effluent C werenormal compared to those of larvae raised in theundiluted effluent(Table 2); accordingly, only theenzymatic activities measured in the diluted efflu-ent (500 mlyl) were considered for interpretation.
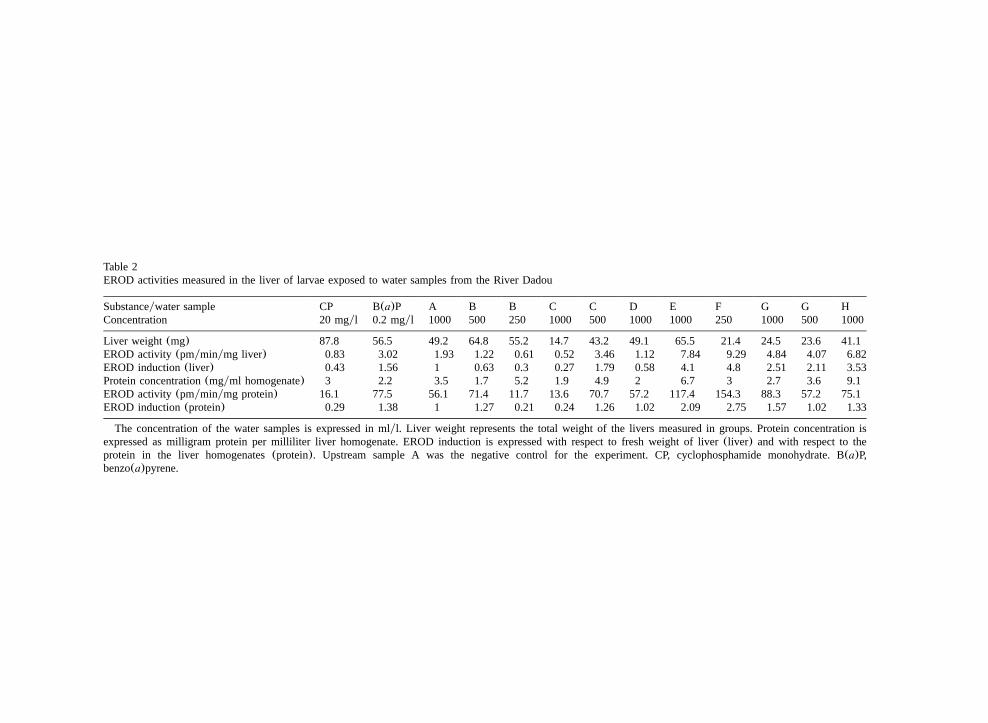
Table 2EROD activities measured in the liver of larvae exposed to water samples from the River Dadou
Substanceywater sample CP B(a)P A B B C C D E F G G HConcentration 20 mgyl 0.2 mgyl 1000 500 250 1000 500 1000 1000 250 1000 500 1000
Liver weight (mg) 87.8 56.5 49.2 64.8 55.2 14.7 43.2 49.1 65.5 21.4 24.5 23.6 41.1EROD activity(pmyminymg liver) 0.83 3.02 1.93 1.22 0.61 0.52 3.46 1.12 7.84 9.29 4.84 4.07 6.82EROD induction(liver) 0.43 1.56 1 0.63 0.3 0.27 1.79 0.58 4.1 4.8 2.51 2.11 3.53Protein concentration(mgyml homogenate) 3 2.2 3.5 1.7 5.2 1.9 4.9 2 6.7 3 2.7 3.6 9.1EROD activity(pmyminymg protein) 16.1 77.5 56.1 71.4 11.7 13.6 70.7 57.2 117.4 154.3 88.3 57.2 75.1EROD induction(protein) 0.29 1.38 1 1.27 0.21 0.24 1.26 1.02 2.09 2.75 1.57 1.02 1.33
The concentration of the water samples is expressed in mlyl. Liver weight represents the total weight of the livers measured in groups. Protein concentration isexpressed as milligram protein per milliliter liver homogenate. EROD induction is expressed with respect to fresh weight of liver(liver) and with respect to theprotein in the liver homogenates(protein). Upstream sample A was the negative control for the experiment. CP, cyclophosphamide monohydrate. B(a)P,benzo(a)pyrene.
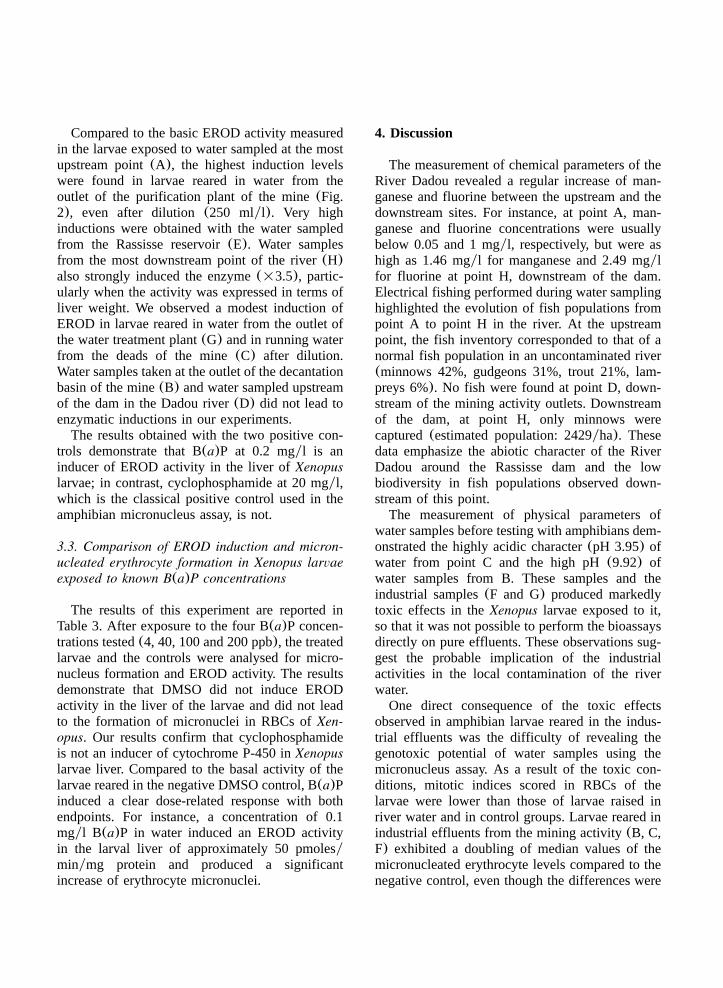
Compared to the basic EROD activity measuredin the larvae exposed to water sampled at the mostupstream point(A), the highest induction levelswere found in larvae reared in water from theoutlet of the purification plant of the mine(Fig.2), even after dilution(250 mlyl). Very highinductions were obtained with the water sampledfrom the Rassisse reservoir(E). Water samplesfrom the most downstream point of the river(H)also strongly induced the enzyme(=3.5), partic-ularly when the activity was expressed in terms ofliver weight. We observed a modest induction ofEROD in larvae reared in water from the outlet ofthe water treatment plant(G) and in running waterfrom the deads of the mine(C) after dilution.Water samples taken at the outlet of the decantationbasin of the mine(B) and water sampled upstreamof the dam in the Dadou river(D) did not lead toenzymatic inductions in our experiments.
The results obtained with the two positive con-trols demonstrate that B(a)P at 0.2 mgyl is aninducer of EROD activity in the liver ofXenopuslarvae; in contrast, cyclophosphamide at 20 mgyl,which is the classical positive control used in theamphibian micronucleus assay, is not.
3.3. Comparison of EROD induction and micron-ucleated erythrocyte formation in Xenopus larvaeexposed to known B(a)P concentrations
The results of this experiment are reported inTable 3. After exposure to the four B(a)P concen-trations tested(4, 40, 100 and 200 ppb), the treatedlarvae and the controls were analysed for micro-nucleus formation and EROD activity. The resultsdemonstrate that DMSO did not induce ERODactivity in the liver of the larvae and did not leadto the formation of micronuclei in RBCs ofXen-opus. Our results confirm that cyclophosphamideis not an inducer of cytochrome P-450 inXenopuslarvae liver. Compared to the basal activity of thelarvae reared in the negative DMSO control, B(a)Pinduced a clear dose-related response with bothendpoints. For instance, a concentration of 0.1mgyl B(a)P in water induced an EROD activityin the larval liver of approximately 50 pmolesyminymg protein and produced a significantincrease of erythrocyte micronuclei.
4. Discussion
The measurement of chemical parameters of theRiver Dadou revealed a regular increase of man-ganese and fluorine between the upstream and thedownstream sites. For instance, at point A, man-ganese and fluorine concentrations were usuallybelow 0.05 and 1 mgyl, respectively, but were ashigh as 1.46 mgyl for manganese and 2.49 mgylfor fluorine at point H, downstream of the dam.Electrical fishing performed during water samplinghighlighted the evolution of fish populations frompoint A to point H in the river. At the upstreampoint, the fish inventory corresponded to that of anormal fish population in an uncontaminated river(minnows 42%, gudgeons 31%, trout 21%, lam-preys 6%). No fish were found at point D, down-stream of the mining activity outlets. Downstreamof the dam, at point H, only minnows werecaptured(estimated population: 2429yha). Thesedata emphasize the abiotic character of the RiverDadou around the Rassisse dam and the lowbiodiversity in fish populations observed down-stream of this point.
The measurement of physical parameters ofwater samples before testing with amphibians dem-onstrated the highly acidic character(pH 3.95) ofwater from point C and the high pH(9.92) ofwater samples from B. These samples and theindustrial samples(F and G) produced markedlytoxic effects in theXenopus larvae exposed to it,so that it was not possible to perform the bioassaysdirectly on pure effluents. These observations sug-gest the probable implication of the industrialactivities in the local contamination of the riverwater.
One direct consequence of the toxic effectsobserved in amphibian larvae reared in the indus-trial effluents was the difficulty of revealing thegenotoxic potential of water samples using themicronucleus assay. As a result of the toxic con-ditions, mitotic indices scored in RBCs of thelarvae were lower than those of larvae raised inriver water and in control groups. Larvae reared inindustrial effluents from the mining activity(B, C,F) exhibited a doubling of median values of themicronucleated erythrocyte levels compared to thenegative control, even though the differences were
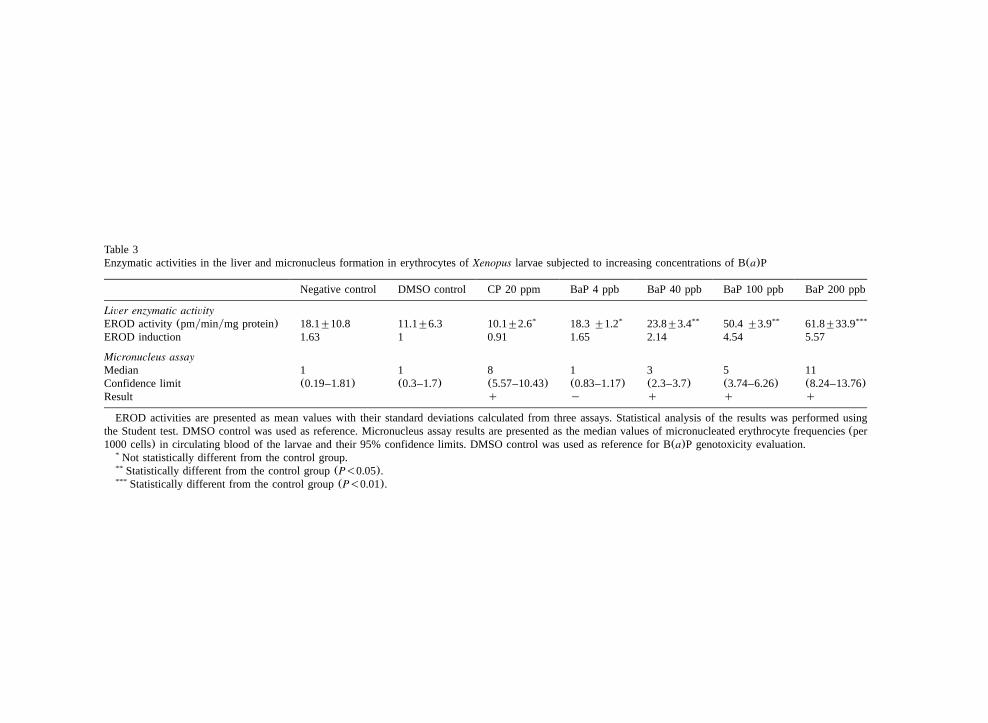
Table 3Enzymatic activities in the liver and micronucleus formation in erythrocytes ofXenopus larvae subjected to increasing concentrations of B(a)P
Negative control DMSO control CP 20 ppm BaP 4 ppb BaP 40 ppb BaP 100 ppb BaP 200 ppb
Liver enzymatic activityEROD activity(pmyminymg protein) 18.1"10.8 11.1"6.3 10.1"2.6* 18.3"1.2* 23.8"3.4** 50.4"3.9** 61.8"33.9***
EROD induction 1.63 1 0.91 1.65 2.14 4.54 5.57
Micronucleus assayMedian 1 1 8 1 3 5 11Confidence limit (0.19–1.81) (0.3–1.7) (5.57–10.43) (0.83–1.17) (2.3–3.7) (3.74–6.26) (8.24–13.76)Result q y q q q
EROD activities are presented as mean values with their standard deviations calculated from three assays. Statistical analysis of the results was performed usingthe Student test. DMSO control was used as reference. Micronucleus assay results are presented as the median values of micronucleated erythrocyte frequencies(per1000 cells) in circulating blood of the larvae and their 95% confidence limits. DMSO control was used as reference for B(a)P genotoxicity evaluation.
Not statistically different from the control group.*
Statistically different from the control group(P-0.05).**
Statistically different from the control group(P-0.01).***
not statistically significant. The genotoxic potentialwas probably masked by effluent toxicity, via thereduction of cell divisions in anaemic animals.Given the dilution required for the tests, the realgenotoxic impacts of raw effluents were clearlyunderestimated.
Larvae reared in water sampled at the outlet ofthe filter-washing process of the plant(G) gaveclearly positive responses in the amphibian micro-nucleus assay. This effluent was enriched in floc-culated sludge but, since it was found not to be astoxic as the effluents from the mine, was testeddirectly. The positive responses obtained werecorroborated by the detoxifying activities measuredin the liver of the larvae, suggesting the presenceof inducing substances(PAHs, PCBs,«) in thewater or in the sludge. These potential contami-nants are generally poorly soluble substances,mainly adsorbed on particulate matter in the rawwater. They are thereby rendered less available forthe larvae, which is no doubt a partial explanationfor the low toxicity observed in the animals. Thislow toxicity, in turn, could probably partly accountfor the significant induction of micronucleatederythrocytes observed in the larvae reared in thefilter-washing water of the plant.
Most of the water samples taken along the RiverDadou and at outlets from industrial sourcesinduced detoxifying activity in the liver of thelarvae, except for samples B and D. In both cases,the negative results observed could be attributed(B) to the dilution of the effluent before testingand(D) to the dilution of the effluent in the river.The highest induction level was measured in larvaereared in the effluent of the mine purification plant(F), after dilution (250 mlyl). Considering thedilution level of the tested effluent and its hightoxicity towardsXenopus larvae, it can be consid-ered as one of the most biologically active samplesin our experiments and may contribute to explain-ing the very low diversity in fish populationsobserved downstream of the outlet of the waterpurification plant of the mine. The high level ofEROD induction measured suggests the presenceof inducing pollutants in the water samples tested.The presence of PAHs in effluent F could beattributed to products of the extraction process atthe mine(fuel from the extracting machines, oil,
waste from the boring wells). The purificationplant also treats washing waters from the miningsite and from the surrounding soils, which areliable to be contaminated with PCBs. Similarly,high EROD activities were measured in amphibianlarvae reared in water sampled in the Rassissereservoir, receiving water from the River Dadouand from the upstream outlets of the mine(B, C).In this case, the measured induction could probablybe attributed to the pollutant concentration in thewater and sediments of the reservoir. In the ruralenvironment studied, the principal sources of watercontamination likely to induce EROD activitiesare pesticides and other chemicals applied to thesurrounding fields. Other potential sources ofEROD-inducing contaminants are forest or fieldfires, which release PAHs into the air. Indeed, dryand wet atmospheric fallout may also lead to thetransfer of pyrolytic hydrocarbon contaminants tothe water, either directly or indirectly via soilleaching or run-off in the river.
With the aim of estimating the possible equiv-alent concentration of these organic contaminantsin the river water, experiments to compare ERODactivities in Xenopus larvae exposed to variousB(a)P concentrations were carried out. We showedthat river water samples(A, D, H) led to enzy-matic activities equivalent to those measured inlarvae exposed to a B(a)P concentration of 0.1mgyl. Likewise, the highly toxic effluent F led toenzymatic activities equivalent to those found inlarvae exposed to B(a)P concentrations above 0.2mgyl. These results have to be considered verycircumspectly. Indeed, the hypothetical presence ofEROD activities inducers in the water cannot bedirectly correlated with the detoxifying activitiesobserved in animals exposed to a single substancesuch as B(a)P. In river water, potential contami-nants interact with natural and anthropogenic sub-stances as a whole. In such complex mixtures,synergistic andyor antagonistic interactionsbetween substances lead to biological effects thatare not easily predictable. For example, Van DerOost et al.(1994)could not directly correlate thelevel of EROD activity in fishes with the concen-tration of potential inducers of these activities(PCBs, HAPs, organochlorinated substances) inthe river water studied. Monod(1997)demonstrat-
ed the inhibition of monooxygenase activities inthe presence of high concentrations of hepatotoxicinductors and organic or metallic inhibitors. Bia-gianti-Risbourg(1997)suggested that some appar-ent enzymatic inhibitions measured in the livers ofexposed organisms may be correlated with thetoxicity of the tissue sampled. In the same way,we observed a correlation between relatively lowEROD induction levels and small haemolytic liversin larvae exposed to effluent C. Vindimian andGarric(1989), Lindstrom-Seppa and Oikari(1990)¨and Adams et al.(1992) demonstrated that com-plex interactions between substances in water maylead to higher EROD activities in fish sampleddownstream of the outlet points, compared to thosemeasured in fish directly sampled at the pollutionsite. We observed the same type of result usingthe amphibian model in the water reservoir and atdownstream point H. Other authors have concludedthat the presence of inhibitory substances in theindustrial effluent could explain the differences ininduction levels observed in fishes exposed to apulp mill effluent (Huuskonen and Lindstrom-¨Seppa, 1995). Similarly, we postulate the presenceof antagonistic effects in river water to explain theresults observed with the micronucleus assay andthe EROD induction test, both in the River Dadouand in laboratory experiments with B(a)P. Indeed,at the highest concentrations tested, B(a)P inducedboth a high level of EROD activity and a highlevel of micronucleated erythrocytes in the larvae.However, for an equivalent EROD induction levelmeasured in the larvae reared in river water sam-ples, the micronucleus assay generally gave nega-tive responses. This apparent contradiction can beexplained by the simultaneous presence in theriver water of substances that produce antagonisticbiological effects. Thus, the presence of highconcentrations of contaminants(manganese andfluorine) at the downstream point H, associatedwith high induction of EROD activities inXenopuslivers (probable concomitant presence of organicinductors in river water), could contribute to theobserved inhibition of genotoxic effects in theexposed animals. Furthermore, the simultaneouspresence of these contaminants in river water couldexplain the toxic effects observed inXenopuslarvae, notably, reduced cell division in circulating
blood, leading to negative responses in the micro-nucleus assay. The same physiological effects mayhave contributed to the observation of low popu-lation levels of fish in the watercourse sectionstudied.
Factors other than the level of chemical contam-inants may affect EROD activity in tested organ-isms. Indeed, in in situ studies, some authors havedemonstrated the modulatory influence of biotic(sex, species)and abiotic (temperature, season)factors on the levels of cytochrome P4501A andyor associated enzymatic activities(Andersson andForlin, 1992; Monod, 1997). In our study, the¨standardized protocol used involved selected andhomogeneous groups of amphibian larvae, so thatsome of the factors of potential variability wereeliminated. For instance, Ankley and Blazer(1988)demonstrated in laboratory experiments theinfluence of food on the monooxygenase activitiesand their levels of induction in fish. In our study,all amphibian larvae, including the controls, werefed with standardized dehydrated fish food. Like-wise, water temperature was constant during expo-sure of the animals(22"0.5 8C), so that theinfluence of the variations of this parameter(Andersson and Forlin, 1992) on EROD activities¨was abolished. Directly related to temperaturevariations, seasonal changes have been shown toinfluence EROD activities in numerous in situstudies using different fish species(Jimenez andStegemen, 1990; Vindimian et al., 1991; Anders-son and Forlin, 1992). The sex and age of the¨animals may also influence the induction of theenzyme(Masfaraud et al., 1990). Some studies onmonooxygenase activities in the fishCyprinuscarpio demonstrated that juveniles were more sen-sitive than mature adults(Singh et al., 1985).Consequently, some authors recommend the use ofjuveniles to measure detoxifying activities, as ameans of eliminating variations of activities linkedto the sex of the exposed animals(Collier et al.,1995). In our study, youngXenopus larvae (15days old, before metamorphosis) were used atstage 50 of the developmental table of Nieuwkoopand Faber(1956). Other authors have suggestedthe use of caging experiments with fishes to studyriver waters(Haasch et al., 1993). This test pro-cedure enables biomarkers to be used in biologi-
cally homogeneous groups of animals, therebylimiting the source of variability due to movement,and allows some of the parameters previouslydescribed to be better controlled. In the presentstudy, amphibian larvae were exposed to watersamples according to a standardized procedure.Under these conditions, most of the parameterspotentially capable of introducing variability in theresponse levels were under control. Potential vari-ations introduced by the sex of the animals(uncon-trolled parameter) in the protocol performed isprobably limited by the use of young larval stages,where enzymatic induction levels are less sex-dependent than that in mature organisms(Singh etal., 1985).
5. Conclusion
At the different sampling sites along the riverstudied here, we observed global toxic effects onXenopus larvae exposed to water samples of indus-trial origin. Fish inventories performed at the samepoints demonstrated a general decrease in thepopulation diversity downstream of the miningactivity, correlated with the presence of high con-centrations of manganese and fluorine in the water.In previous studies, these two substances were notfound to be genotoxic using in vivo(Fernandez etal., 1993) and in vitro test systems(Li et al., 1988;Ashby and Tennant, 1991). UsingXenopus larvae,we did not find any particular genotoxic effects,except in animals exposed to water from the filter-washing process of the water treatment plant. Inmost cases, the high toxicity of industrial effluentsmasked the potential genotoxic effects, since dilut-ed effluents were needed to perform the tests.Concerning the effluent from the water treatmentplant, the high concentration of flocculated sludgeat the outlet point of the effluent in the river,associated with the observed genotoxic effects,suggests the presence of genotoxic contaminantsadsorbed on the particulate matter of the waste.
A supplementary level of information was pro-vided by the EROD activity measured in the liversof Xenopus larvae exposed to the tested waters.Thus, most of the water samples induced highlevels of detoxifying activities in the experimentallarvae, compared to those reared in water sampled
upstream of industrial activities in the RiverDadou. This observation suggests that potentiallyinducing substances were present in the river water.Classical inductors of the cyt P450IA1 detoxifyingsystems, commonly found in the environment,include the polyaromatic hydrocarbons, polychlorobiphenyls and dioxins. Such substances may beproduced by the local industrial activities orimported from the surrounding areas by atmos-pheric pollution or by the river via contaminatedsoils (PCBs, pesticides, chlordane).
To date, due to the characteristics of the indus-trial activity, only potentially metallic contaminants(Al, Cu, F, Mn) have been measured in the waterof the River Dadou. The results obtained in thisstudy suggests that it is important to monitorsupplementary parameters, such as PAHs andPCBs, considering, respectively, the potentialrelease from the mining activity and the generalrural situation of the studied region.
Acknowledgments
The authors wish to thank the personnel of theJean-Francois Champollion University, Albi,¸France, for their helpful assistance and the person-nel of the Developmental Biology Center of Tou-louse, France, where part of the work was done.We are very grateful to Mr Bourdon from theDirection Departementale de l’Agriculture et de la´Foret du Tarn, France, Mr Bonmati from theˆSOGEREM and Mr Maynadier from the BrigadeDepartementale du Conseil Superieur de la Peche´ ˆdu Tarn, France, for their valuable help. We arealso very indebted to M. Alquier and Mr Andrieufrom the Conseil General du Tarn. Thanks to Julian´ ´Smith for reviewing the manuscript.
References
Adams SM, Crumby WD, Greeley MS, Ryon MG, SchillingEM. Relationships between physiological and fish popula-tion responses in a contaminated stream. Environ ToxicolChem 1992;11:1549–1557.
AFNOR NF. T90-325 Qualite de l’eau—Evaluation de la´genotoxicite au moyen de larves d’amphibiens(Xenopus´ ´laevis, Pleurodeles waltl) 2000.
Andersson T, Forlin L. Regulation of the cytochrome P450¨enzyme system in fish. Aquat Toxicol 1992;24:1–20.
AndersonJW, Rossi SS, Tukey RH, Vu T, Quattrochi LC. Abiomarker, P450 RGS, for assessing the induction potentialof environmental samples. Environ Toxicol Chem1995;14:1159–1169.
Ankley GA, Blazer VS. Effect of diet on PCB-induced changein xenobiotic metabolism in the liver of channel catfish.Can J Fish Aquat Sci 1988;45:132–137.
Ashby J, Tennant RW. Definitive relationships among chemicalstructure, carcinogenicity and mutagenicity for 301 chemi-cals tested by the US NTP. Mutat Res 1991;257:229–303.
Bekaert C. Impact ecotoxicologique de sols pollues et de´dechets sur le compartiment aquatique. Toulouse, France:´These de l’Universite Paul Sabatier; 1999.` ´
Biagianti-Risbourg S. Les perturbations(ultra) structurales dufoie des poissons utilisees comme biomarqueurs de la qualite´ ´sanitaire des milieux aquatiques. In: Lagadic L, Caquet T,Amiard JC, Ramade F, editors. Biomarqueurs en ecotoxi-´cologie: aspects fondamentaux. Paris: Masson, 1997. p.355–391.
Bradford MM. A rapid and sensitive method for the quantita-tion of microgram quantities of protein utilizing the principleof protein-dye binding. Analyt Biochem 1976;72:248–254.
Burgeot T, Bocquene G, Pingray G, Godefroy D, Legrand J,´Dimeet J, Marco F, Vincent F, Henocque Y, Jeanneret HO,Galgani F. Monitoring biological effects of contaminationin marine fish along French coasts by measurement ofethoxyresorufin-O-deethylase activity. Ecotoxicol EnvironSaf 1994;29:131–147.
Busbee D, Colvin D, Muijson I, Rose F, Cantrell E. Inductionof aryl hydrocarbon hydroxylase inAmbystoma tigrinum.Comp Biochem Physiol, Part C 1975;50:33–36.
Carrasco KR, Tilbury KL, Myers MS. Assessment of thepiscine micronucleus test as an in situ biological indicatorof chemical contaminants effects. Can J Fish Aquat Sci1990;47:2123–2136.
Collier TK, Anulacion BF, Stein JE, Goksoyr A, Varanasi U.A field evaluation of cytochrome P4501A as a biomarkerof contaminant exposure in three species of flatfish. EnvironToxicol Chem 1995;14:143–152.
Das RK, Nanda NK. Induction of micronuclei in peripheralerythrocytes of fishheteropneustes fossilis by mitomycin Cand paper mill effluent. Mutat Res 1986;75:65–71.
Fernandez M, L’Haridon J, Gauthier L, Zoll-Moreux C.Amphibian micronucleus test(s): a simple and reliablemethod for evaluating in vivo genotoxic effects of freshwater pollutants and radiations: initial assessment. MutatRes 1993;292:83–99.
Gauthier L. The amphibian micronucleus test, a model for invivo monitoring of genotoxic aquatic pollution. Int JBatrachol 1996;14(2):53–84.
Godet F, Vasseur P, Babut M. Essais de genotoxicite in vivo´ ´et in vitro applicables a l’environnement hydrique. Revue`des Sciences de l’eau 1993;6:285–314.
Haasch ML, Prince R, Weijksnora PJ, Cooper KR, Lech JJ.Caged and wild fish: induction of hepatic cytochrome P-450 (CYP1A1) as an environmental biomonitor. EnvironToxicol Chem 1993;12:885–895.
Harri MNE. Hepatic mixed function oxidase(MFO) activitiesduring the seasonal life cycle of the frogRana temporaria.Comp Biochem Physiol, Part C 1980;67:75–78.
Huuskonen S, Lindstrom-Seppa P. Hepatic cytochrome¨P4501A and other biotransformation activities in perch(Perca fluviatilis): the effects of unbleached pulp milleffluents. Aquat Toxicol 1995;31:27–41.
Jaylet A, Deparis P, Ferrier V, Grinfeld S, Siboulet R. A newmicronucleus test using peripheral blood erythrocytes of thenewt Pleurodeles waltl to detect mutagens in fresh-water.Mutat Res 1986;164:245–257.
Jaylet A, Zoll C. Tests for detection of genotoxins in fresh-water. Aquat Sci 1990;2(2):151–166.
Jaylet A, Gauthier L, Zoll C. Micronucleus test using periph-eral red blood cells of amphibian larvae for detection ofgenotoxic agents in freshwater pollution. In: Sandhu , et al,editor. In situ evaluations of biological hazards of environ-mental pollutants. New York: Plenum Press, 1990. p. 71–80.
Jimenez BD, Stegemen JJ. Detoxication enzymes as indicatorof environmental stress on fish. Am Fish Soc Symp1990;8:67–79.
Krauter PW, Anderson SL, Harisson FL. Radiation-inducedmicronuclei in peripheral erythrocytes of Rana catesbeiana:an aquatic animal model for in vivo genotoxicity studies.Environ Molec Mutagen 1987;10:285–291.
Li Y, Dunipace AJ, Stookey GK. Genotoxic effects of fluoride:a controversial issue. Mutat Res 1988;195:127–136.
Lindstrom-Seppa P, Oikari A. Biotransformation activities of¨feral fish in waters receiving bleached pulp mill effluents.Environ Toxicol Chem 1990;9:1415–1424.
Mac Gill R, Tuckey J, Larsen W. Variations of box plots. AmStatist 1978;32:12–16.
Marty J, Lesca P, Jaylet A, Ardourel C, Riviere JL. In vivo`and in vitro metabolism of benzo(a)pyrene by the larva ofthe newtPleurodeles waltl. Comp Biochem Physiol, Part C1989;93:213–219.
Masfaraud JF, Monod G, Devaux A. Use of the fish cyto-chrome P450 dependent 7-ethoxyresorufinO-deethylaseactivity as a biochemical indicator of water pollution. Studyof the liver and the kidney of male and female nase(Chondrostoma nasus) from the river Rhone. Sci TotalˆEnviron 1990;97y98:729–738.
Metcalfe CD. Induction of micronuclei and nuclear abnormal-ities in the erythrocytes of mudminnows(umbra limi) andbrown bullheads(Ictalurus nebulosus). Bull Environ Con-tam Toxicol 1988;40:489–495.
Monod G. L’induction du cytochrome P4501A1 chez lespoisons. In: Lagadic L, Caquet T, Amiard JC, Ramade F,editors. Biomarqueurs en ecotoxicologie: aspects fondamen-´taux. Paris: Masson, 1997. p. 33–54.
Monod G, Devaux A, Riviere JL. Effects of chemical pollution`on the activities of hepatic xenobiotic metabolizing enzymesin fish from the river Rhone. Sci Total Environˆ1988;73:189–201.
Nieuwkoop P, Faber J. Normal table ofXenopus laevis.Amsterdam: Daudin, 1956.
Noshiro M, Omura T. Microsomal monooxygenase system infrog livers. Comp Biochem Physiol, Part B 1984;77:761–767.
Singh H, Pavgi-Singh S, Kezic N, Kurelec B. Xenobiotic andendobiotic induction of mixed function monooxygenase incarp Cyprinus carpio. Sci Total Environ 1985;44:123–133.
Van Der Oost R, Van Gastel L, Worst D, Hanraads M,Satumalay K, Van Schooten FJ, Heida H, Vermeulen NPE.Biochemical markers in feral roach(Rutilus rutilus) inrelation to the bioaccumulation of organic trace pollutants.Chemosphere 1994;29:801–817.
Van Hummelen P, Zoll C, Paulussen J, Kirsch-Volders M,Jaylet A. The micronucleus test inXenopus: a new andsimple ‘in vivo’ technique for detection of mutagens infresh water. Mutagenesis 1989;4(1):12–16.
Vindimian E, Garric J. Freshwater fish cytochrome P450dependent enzymatic activities: a chemical pollution indi-cator. Ecotoxicol Environ Saf 1989;18:277–285.
Vindimian E, Namour P, Migeon B, Garric J. In situ pollutioninduced cytochrome P450 activity of freshwater fish: barbel
(Barbus barbus), chub (Leuciscus cephalus) and nase(Chondrostoma nasus). Aquat Toxicol 1991;21:255–266.
Vindimian E, Namour P, Munoz JF, Gril JN, Migeon B, GarricJ. Ethoxyresorufin-O-deethylase induction in fish from awatershed exposed to a non point source pollution ofagricultural origin. Water Res 1993;27:449–455.
Zoll C, Ferrier V, Gauthier L. Use of aquatic animals formonitoring genotoxicity in unconcentrated water samples.In: Kappas A, editor. Mechanisms of environmental muta-genesis–cargenesis. New York: Plenum Press, 1990. p. 233–244.
Zoll-Moreux C. Consequences de la contamination du milieu´hydrique par les sels de mercure, du benzo(a)pyrene ou des`pesticides organochlores, chez deux amphibiensPleurodeles´waltl et Xenopus laevis. Toulouse, France: These de`l’Universite Paul Sabatier; 1991.´
Zoll-Moreux C, Ferrier V. The Jaylet-Test(newt micronucleustest) and the micronucleus test inxenopus: two in vivo testson amphibian. I. Evaluation of the genotoxicity of fiveenvironmental pollutants. II. Evaluation of the genotoxicityof five effluents. Water Res 1999;33:2301–2314.
Related Documents