Biased Perceptions of Income Inequality and Redistribution Carina Engelhardt Andreas Wagener CESIFO WORKING PAPER NO. 4838 CATEGORY 1: PUBLIC FINANCE JUNE 2014 An electronic version of the paper may be downloaded • from the SSRN website: www.SSRN.com • from the RePEc website: www.RePEc.org • from the CESifo website: www.CESifo-group.org/wp

Welcome message from author
This document is posted to help you gain knowledge. Please leave a comment to let me know what you think about it! Share it to your friends and learn new things together.
Transcript
Biased Perceptions of Income Inequality and Redistribution
Carina Engelhardt Andreas Wagener
CESIFO WORKING PAPER NO. 4838 CATEGORY 1: PUBLIC FINANCE
JUNE 2014
An electronic version of the paper may be downloaded • from the SSRN website: www.SSRN.com • from the RePEc website: www.RePEc.org
• from the CESifo website: Twww.CESifo-group.org/wp T
CESifo Working Paper No. 4838
Biased Perceptions of Income Inequality and Redistribution
Abstract When based on perceived rather than on objective income distributions, the Meltzer-Richards hypothesis and the POUM hypothesis work quite well empirically: there exists a positive link between perceived inequality or perceived upward mobility and the extent of redistribution in democratic regimes – though such a link does not exist when objective measures of inequality and social mobility are used. These observations highlight that political preferences and choices might depend more on perceptions than on factual data.
JEL-Code: H530, D720, D310.
Keywords: biased perception, majority voting, redistribution.
Carina Engelhardt
Leibniz University of Hannover School of Economics and Management
Koenigsworther Platz 1 Germany – 30167 Hannover
Andreas Wagener Leibniz University of Hannover
School of Economics and Management Koenigsworther Platz 1
Germany – 30167 Hannover [email protected]
May 27, 2014
1 Introduction
The relationship between income inequality and redistribution in democracies is quite puz-zling (Persson and Tabellini, 2000, p. 52). One seminal answer from a political-economyperspective is provided by Meltzer and Richard (1981) and Romer (1975), predicting thatgreater inequality of gross incomes leads to higher levels of redistribution in a majority-voting equilibrium. Higher levels of inequality – measured by the ratio between mean andmedian gross incomes – imply that the politically decisive agent can gain more from, andconsequently will demand for, more redistribution.
While theoretically convincing, the empirical performance of this prediction is mixed at best(see Section 2). This need not be surprising given that the Meltzer-Richard (henceforth: MR)model entails quite a long chain of logical steps from the ex-ante inequality in incomes to theextent of redistribution in a political equilibrium. The steps encompass, among others, thevalidity of the median voter hypothesis (actual policies are identical to the median voter’smost preferred policy), the identity of median voter and median income earner, a purelymaterialistic and selfish attitude towards redistribution in a static framework, a direct linkfrom voter preferences to policies etc.
This paper suggests a complementary explanation why empirical tests of the MR hypothesisoften appear to be inconclusive or negative: they use objective income distributions ratherthan perceived ones. “Objective” refers to official statistics, which are meant to give an ac-curate decsription of a country’s income distribution; “perceived” refers to how individualsview the income distribution and their position in it. There is ample of evidence (and weprovide some, too) that individuals hold erroneous beliefs about income inequality, typi-cally underestimate its extent and consider themselves to be relatively richer than they reallyare. If preferences for redistribution are based on perceived income inequality then less re-distribution should emerge in a majority voting equilibrium, compared to the equilibriumpredicted with the true income distribution. This follows from the comparative statics of theMR model. Moreover, since misperceptions of income inequality might differ across coun-tries, the inequality ranking of countries based on perceived distributions may differ fromthat based on true data.
The idea that perceptions rather than facts and data drive redistributive politics is not re-stricted to the MR hypothesis but can also be applied to other theories. One particularlyfruitful extension of the MR framework is provided by the Prospect of Upward Mobility(POUM) hypothesis. It posits that people with below average incomes today might not sup-port redistribution because they believe that they or their children might move upward on theeconomic ladder in the future where progressive taxation will hurt them (Benabou and Ok,2001). It is well established that citizens hold distorted (generally: too optimistic) expecta-tions of (their) upward social mobility (Bjoernskov et al., 2013). Political preferences andpolicies formulated on the ground of these expectations will then differ from those based onfactual data.
In this paper we first assess the MR hypothesis when based on perceptions of inequality. Weuse survey data from various waves of the International Social Survey Programme (ISSP)where individuals are asked to locate their own incomes on a range between 1 (poorest)
1
and 10 (richest). From these self-assessments of incomes we construct a perceived distri-bution of incomes with an attending mean-to-median ratio. It turns out that these perceivedratios are, for all countries and years in our sample, considerably below their true values,indicating a widespread underestimation of income inequality. Employing these perceivedinequality measures as explanatory variables for social expenditure, the MR hypothesis ac-tually works quite fine empirically: a larger degree of perceived inequality indeed leads toa greater amount of redistribution. This observation survives all robustness checks to whichwe took it. Moreover, the stronger the misjudgement, i.e., the more benign the inequalitysituation is viewed relative to the objective one, the lesser are social expenditures.
In a second part, we also test a “perceived version” of the POUM hypothesis. We rely onthe ISSP question that asks individuals how important (on a range from 1 to 5) they findhard work to get ahead. In line with the literature we interpret the assignment of a greaterimportance to hard work as an indicator for a greater perceived social mobility. As a factualmeasure of upward social mobility we use the share of people in the ISSP who report thatthey actually are in a higher occupation than their fathers. Regressing social expenditure onperceived and actual upward mobility, the former performs much better than the latter, bothwith respect to the sign of the effect and its statistical significance.
Section 2 embeds our study into the extant literature. Section 3 presents our work on the MRhypothesis, describing data and methodology, results, and robustness checks. Section 4 doesthe same for the POUM hypothesis. Section 5 concludes. The Appendix collects informationon data sources, variable definitions and supplementary regressions and further robustneeschecks.
2 Related observations
Previous research by economists and political scientists tried to confirm the Meltzer andRichard (1981) model empirically, but the resulting evidence is mixed. Some studies findthe hypothesized positive link between inequality and redistribution (see, e.g., Borge andRattsoe, 2004; Finseraas, 2009; Mahler, 2008; Meltzer and Richard, 1983; Milanovic, 2000),while others suggest a negative relationship (e.g., Georgiadis and Manning, 2012; Rodrìguez,1999) or no significant link at all (e.g., Gouveia and Masia, 1998; Kenworthy and McCall,2008; Pontusson and Rueda, 2010; Scervini, 2012).
These studies differ in what they use as their measure of incomce inequality (the ratio ofmean to median income, the Gini coefficient, the income share of the 1% richest etc.). How-ever, they all evaluate their inequality measures with “objective” data from statistical offices,OECD, LIS, or tax authorities. These data and the picture of inequality they portray need notcoincide with how citizens and voters themselves perceive the income distribution.
There are good reasons to assume that citizens hold distorted views on inequality. Experi-ments show that respondents fail to determine their own position in the income scale (Cruceset al., 2013). Furthermore, they underestimate income inequality per se. Norton and Ariely(2011) observe considerable discrepancies between actual and perceived levels of inequality
2
in wealth in the U.S.: citizens view the wealth distribution vastly more equal than it actuallyis. Similarly, Osberg and Smeeding (2006) show that estimated disparities between the earn-ings of different occupational groups are much smaller than actual differences, suggestingagain an underestimation of income inequality. Bartels (2005, 2008) argues that knowledgeabout inequality in the U.S. is not only low but also shaped by political ideology, with con-servatives [liberals] being less [more] aware of the rising inequality, even after controllingfor their level of general political knowledge.
Sociologists have since long estabished that individuals systematically underestimate the realextent of inequality. This oocurs mainly due to the failure to locate their own position in theincome distribution. Several reasons may account for this phenomenon, ranging from limitedavailability of social comparisons – which leads individuals to falsely believe that they areclose to the average income earner (Evans and Kelley, 2004; Runciman, 1966) – to so-calledself-enhancement biases – individuals are inclined to see their own (income) position rosierand relatively better than it actually is (generally see, e.g., Guenther and Alicke, 2010). Thesemisperceptions generally invoke an underestimation of (income) inequality. Inequality is notthe only economically relevant variable that is subject to biased perceptions. Substantialevidence, both empirical and experimental, shows that individuals hold distorted perceptionsof risks, tax burdens and rates – and of social mobility (Bjoernskov et al., 2013). This latteraspect is relevant especially for the POUM hypothesis.
In that spirit, political and social scientists have recently started to substitute actual by per-ceived inequality in their studies. But their measures of perceived inequality so far are ques-tionable. E.g., the frequently used measure of perceived wage inequality from the ISSP en-tails a personal evaluation of the degree of inequality but does not take into account potentialbiases from incorrect self-positioning, which we just assume to be an important factor.
Rather than actual redistributive policies (typically measured by social expenditure in percentof GDP etc.), one can also correlate individual preferences (“demand”) for redistribution withincome inequality. For the MR hypothesis, the performance of such studies is typically betterthan of social quota-studies, indicating that individuals in more unequal societies would optfor more redistribution through the state. However, preference for redistribution might beregarded as a mere cheap-talk, individual statement of inequality aversion; the link fromvoter preferences to actual policies is still lacking (and, at least for the MR hypothesis, seemsto be broken). A direct test of the MR hypothesis should use policy outcomes as dependentvariables.
Bredemeier (2014) theoretically discusses those determinants of rising inequality that canaccount for a lower demand for redistribution. The paper argues that when the income of thepoor increases, the perceived inequality decreases (even though the mean-to-median ratiomight actually increase) and the demand for redistribution goes down. This supports ourhypothesis that political outcomes based on expectations will differ from those based onfactual data.
The POUM hypothesis has mainly been tested with respect to preferences for redistribution.For both the degrees of perceived social mobility (based on the hard-work question) andof experienced social mobility (based on the comparison to one’s father’s job) Corneoand Grüner (2002) show that they weaken support for the statement that governments
3
should reduce inequalities. However, this is again more a statement on inequality aversionthan on political outcomes. The dependent variable in Alesina and La Ferrara (2005) ismore specific (agreement with the statement that “the government should reduce incomedifferences between the rich and the poor”). Interestingly, in this study all measures of“perceived” social mobility are negatively correlated with the support of more redistribution– while most measures of experienced upward mobility show no association with the desirefor larger social spending. In Section 4 we will show that this also holds for actual (ratherthan desired) redistribution.
3 The MR hypothesis and perceived inequality
3.1 Data and descriptive statistics
The ISSP provides the best available comparative data on public opinion regarding inequalityand redistribution (Brooks and Manza, 2006; Kenworthy and McCall, 2008; Lübker, 2006;Osberg and Smeeding, 2006). Using the ISSP, we design a measure of perceived inequalityin the income distribution. This measure is based on the following survey question:
“In our society there are groups which tend to be towards the top and groupswhich tend to be toward the bottom. Below is a scale that runs from top tobottom (horizontal scale (10 top - 1 bottom)). Where would you put yourselfnow on this scale?”
Data on the answers are available for the years 1987, 1992, 1999 and 2006-2009 for 26OECD countries covered on the ISSP.1 Because we assume inequality to have an influenceon social expenditures, 5 waves were defined in such a way that inequality measures andslightly delayed social expenditures are merged2.
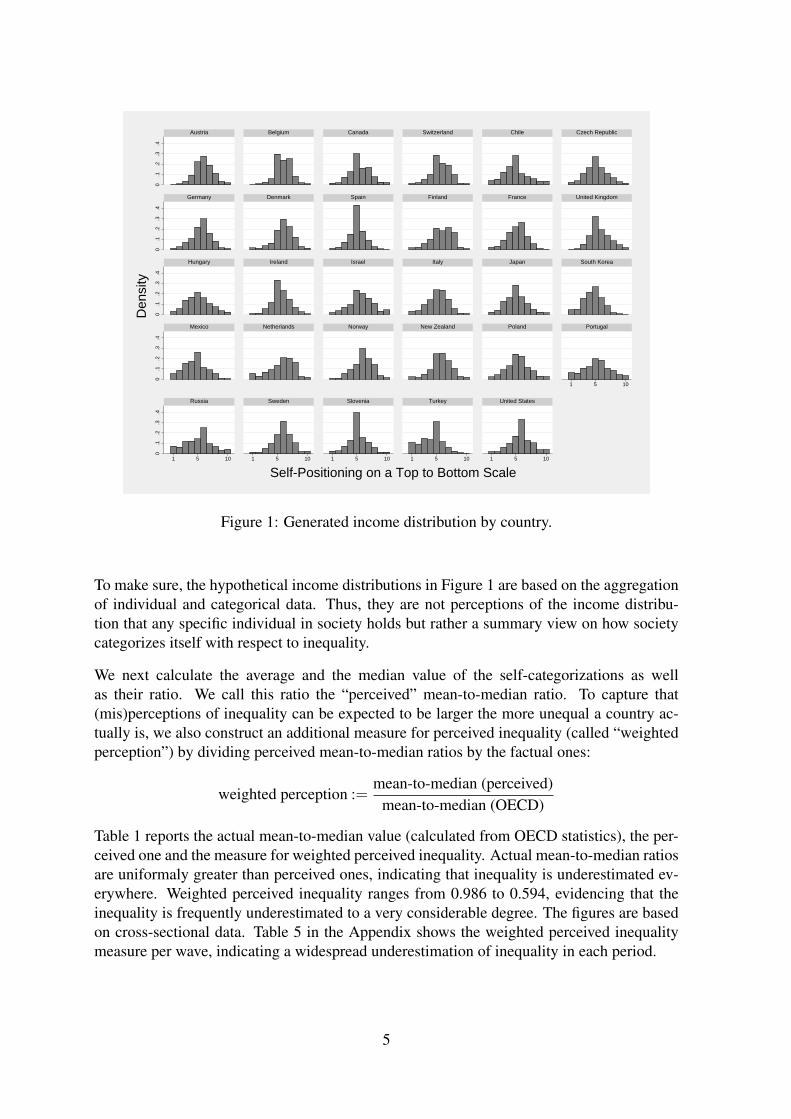
We assume that self-assessments are mainly made in terms of income, and thus, provide anapproximation of the perceived position in the income distribution. The histograms (relativefrequencies) for the average answers to the question above are depicted country-by-countryin Figure 1.
The distributions in Figure 1 exhibit a remarkable degree of symmetry (sometimes even left-skewedness). Compared to the stark right-skewedness of actual income distributions thisindicates that the inequality situation might be misperceived by the public. This is in linewith two common results from studies on inequality perception: that individuals tend to seethemselves farther to the right of the income distribution than they actually are and that theyconceive the distribution as more bell-shaped than it actually is.
1These are: Austria, Belgium, Canada, Switzerland, Chile, Czech Republic, Germany, Denmark, Spain,Finland, France, UK, Ireland, Italy, Japan, South Korea, Mexico, the Netherlands, Norway, New Zealand,Poland, Portugal, Sweden, Slovenia, Turkey, and the US.
2We do so in section 4, too.
4
0.1
.2.3
.40
.1.2
.3.4
0.1
.2.3
.40
.1.2
.3.4
0.1
.2.3
.4
1 5 10
1 5 10 1 5 10 1 5 10 1 5 10 1 5 10
Austria Belgium Canada Switzerland Chile Czech Republic
Germany Denmark Spain Finland France United Kingdom
Hungary Ireland Israel Italy Japan South Korea
Mexico Netherlands Norway New Zealand Poland Portugal
Russia Sweden Slovenia Turkey United States
Den
sity
Self-Positioning on a Top to Bottom Scale
Figure 1: Generated income distribution by country.
To make sure, the hypothetical income distributions in Figure 1 are based on the aggregationof individual and categorical data. Thus, they are not perceptions of the income distribu-tion that any specific individual in society holds but rather a summary view on how societycategorizes itself with respect to inequality.
We next calculate the average and the median value of the self-categorizations as wellas their ratio. We call this ratio the “perceived” mean-to-median ratio. To capture that(mis)perceptions of inequality can be expected to be larger the more unequal a country ac-tually is, we also construct an additional measure for perceived inequality (called “weightedperception”) by dividing perceived mean-to-median ratios by the factual ones:
weighted perception :=mean-to-median (perceived)
mean-to-median (OECD)
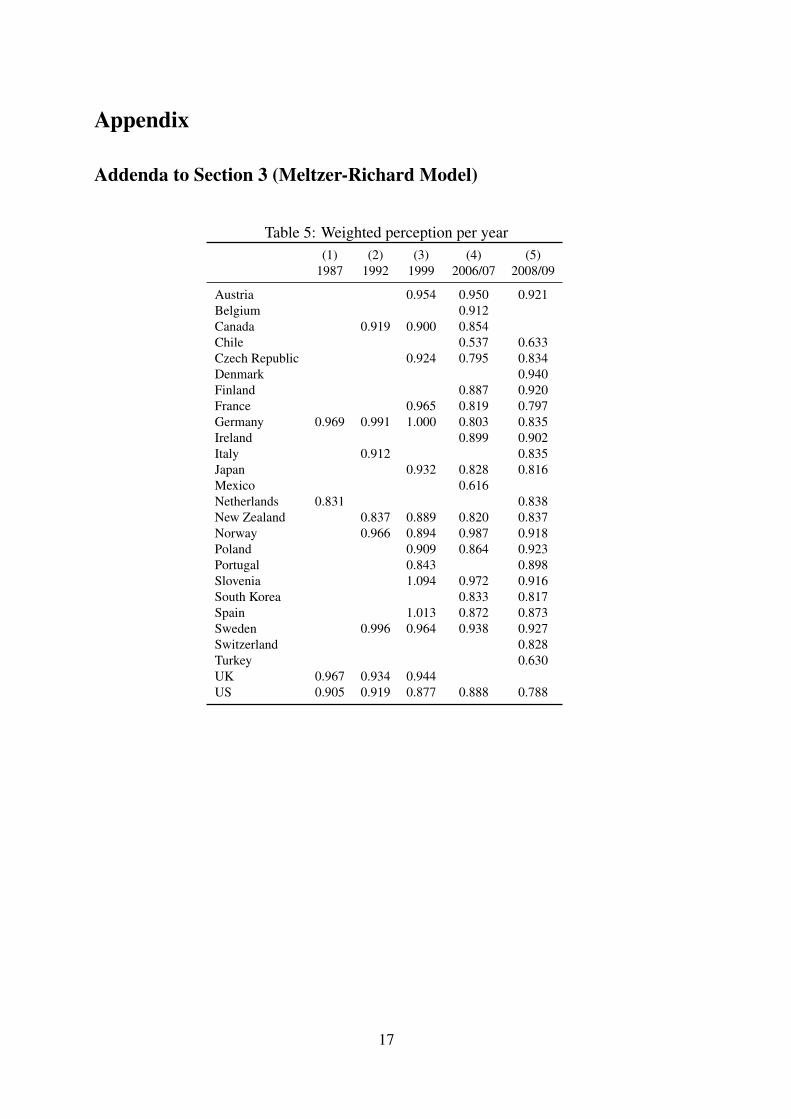
Table 1 reports the actual mean-to-median value (calculated from OECD statistics), the per-ceived one and the measure for weighted perceived inequality. Actual mean-to-median ratiosare uniformaly greater than perceived ones, indicating that inequality is underestimated ev-erywhere. Weighted perceived inequality ranges from 0.986 to 0.594, evidencing that theinequality is frequently underestimated to a very considerable degree. The figures are basedon cross-sectional data. Table 5 in the Appendix shows the weighted perceived inequalitymeasure per wave, indicating a widespread underestimation of inequality in each period.
5
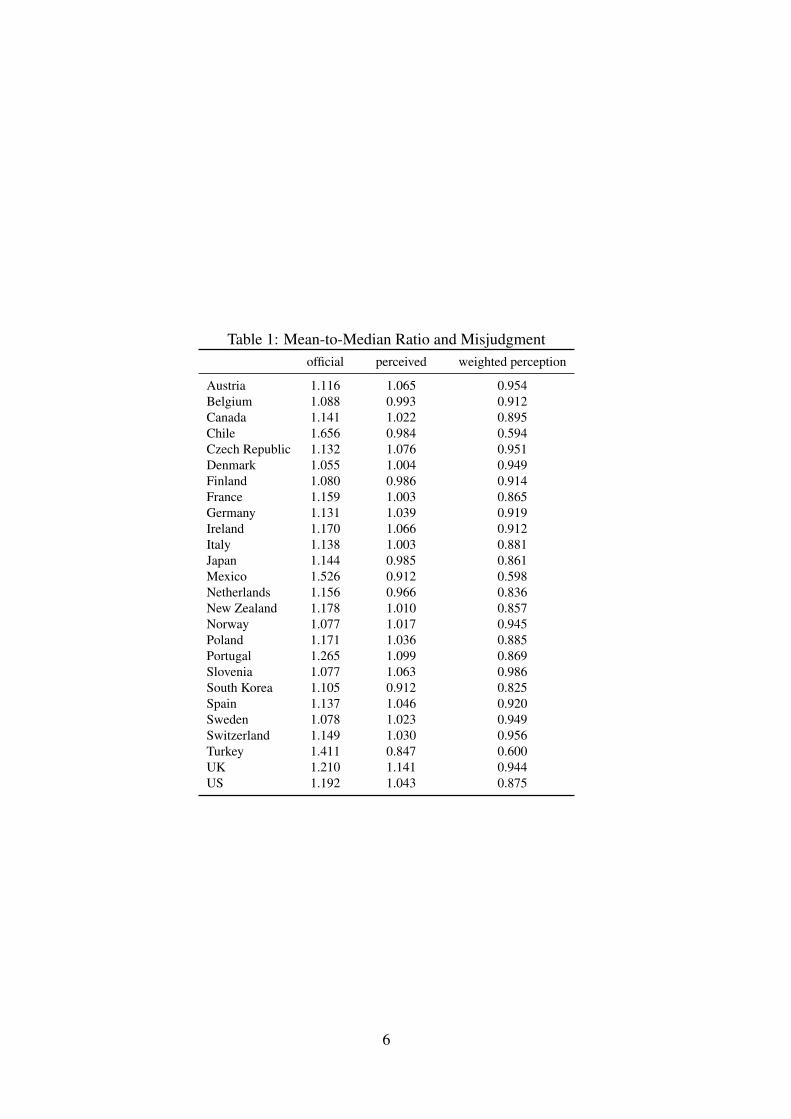
Table 1: Mean-to-Median Ratio and Misjudgmentofficial perceived weighted perception
Austria 1.116 1.065 0.954Belgium 1.088 0.993 0.912Canada 1.141 1.022 0.895Chile 1.656 0.984 0.594Czech Republic 1.132 1.076 0.951Denmark 1.055 1.004 0.949Finland 1.080 0.986 0.914France 1.159 1.003 0.865Germany 1.131 1.039 0.919Ireland 1.170 1.066 0.912Italy 1.138 1.003 0.881Japan 1.144 0.985 0.861Mexico 1.526 0.912 0.598Netherlands 1.156 0.966 0.836New Zealand 1.178 1.010 0.857Norway 1.077 1.017 0.945Poland 1.171 1.036 0.885Portugal 1.265 1.099 0.869Slovenia 1.077 1.063 0.986South Korea 1.105 0.912 0.825Spain 1.137 1.046 0.920Sweden 1.078 1.023 0.949Switzerland 1.149 1.030 0.956Turkey 1.411 0.847 0.600UK 1.210 1.141 0.944US 1.192 1.043 0.875
6
3.2 Empirical results
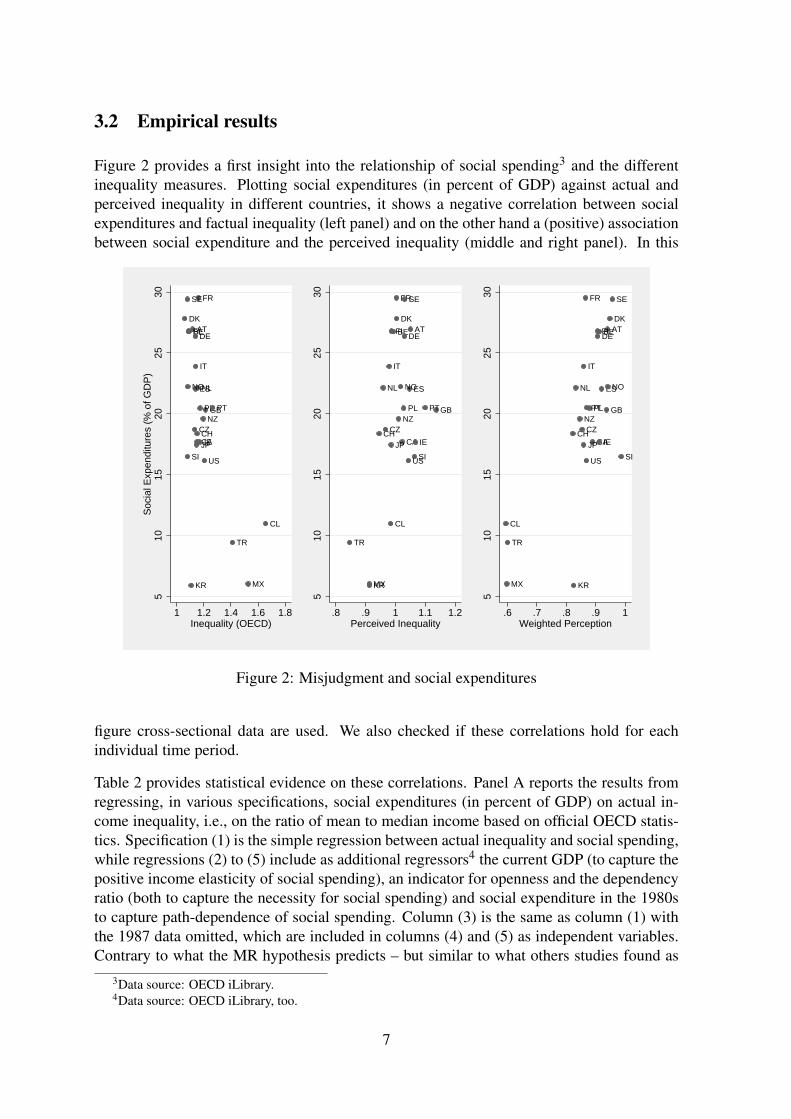
Figure 2 provides a first insight into the relationship of social spending3 and the differentinequality measures. Plotting social expenditures (in percent of GDP) against actual andperceived inequality in different countries, it shows a negative correlation between socialexpenditures and factual inequality (left panel) and on the other hand a (positive) associationbetween social expenditure and the perceived inequality (middle and right panel). In this
ATBE
CACH
CL
CZ
DE
DK
ES
FI
FR
GB
IE
IT
JP
KR MX
NLNO
NZPL PT
SE
SI
TR
US
510
1520
2530
Soc
ial E
xpen
ditu
res
(% o
f GD
P)
1 1.2 1.4 1.6 1.8Inequality (OECD)
ATBE
CACH
CL
CZ
DE
DK
ES
FI
FR
GB
IE
IT
JP
KRMX
NL NO
NZPL PT
SE
SI
TR
US
510
1520
2530
.8 .9 1 1.1 1.2Perceived Inequality
ATBE
CACH
CL
CZ
DE
DK
ES
FI
FR
GB
IE
IT
JP
KRMX
NL NO
NZPLPT
SE
SI
TR
US
510
1520
2530
.6 .7 .8 .9 1Weighted Perception
Figure 2: Misjudgment and social expenditures
figure cross-sectional data are used. We also checked if these correlations hold for eachindividual time period.
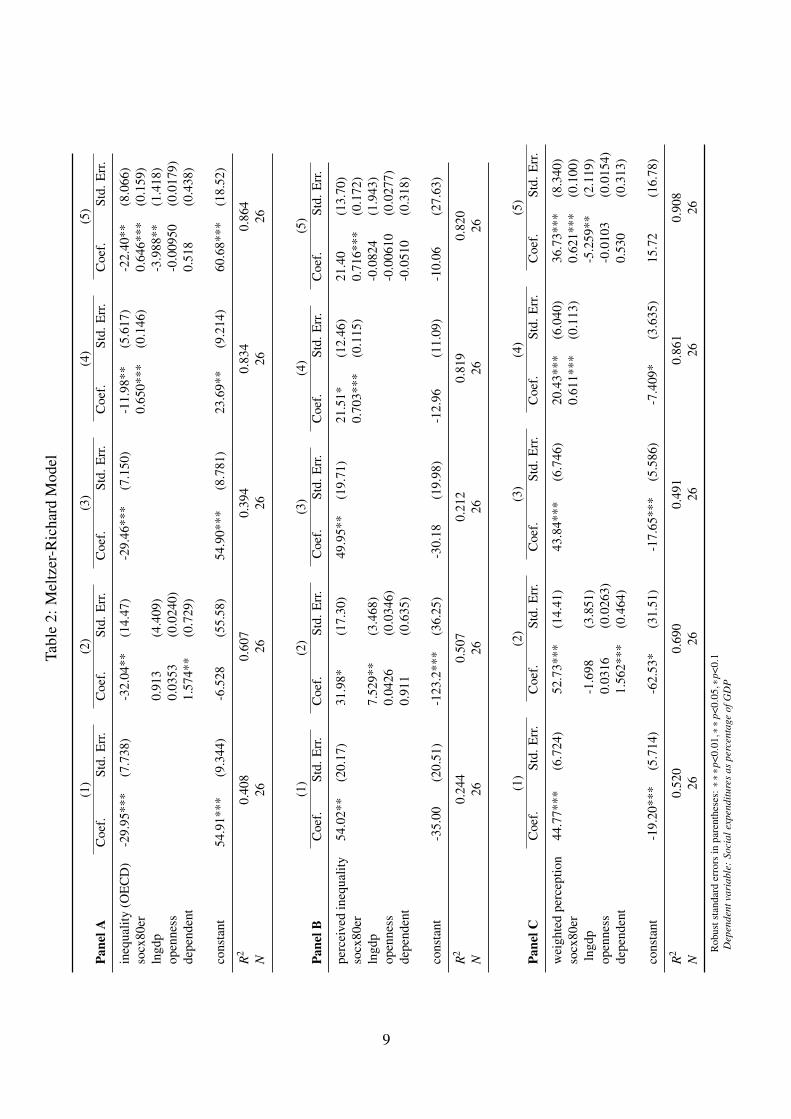
Table 2 provides statistical evidence on these correlations. Panel A reports the results fromregressing, in various specifications, social expenditures (in percent of GDP) on actual in-come inequality, i.e., on the ratio of mean to median income based on official OECD statis-tics. Specification (1) is the simple regression between actual inequality and social spending,while regressions (2) to (5) include as additional regressors4 the current GDP (to capture thepositive income elasticity of social spending), an indicator for openness and the dependencyratio (both to capture the necessity for social spending) and social expenditure in the 1980sto capture path-dependence of social spending. Column (3) is the same as column (1) withthe 1987 data omitted, which are included in columns (4) and (5) as independent variables.Contrary to what the MR hypothesis predicts – but similar to what others studies found as
3Data source: OECD iLibrary.4Data source: OECD iLibrary, too.
7
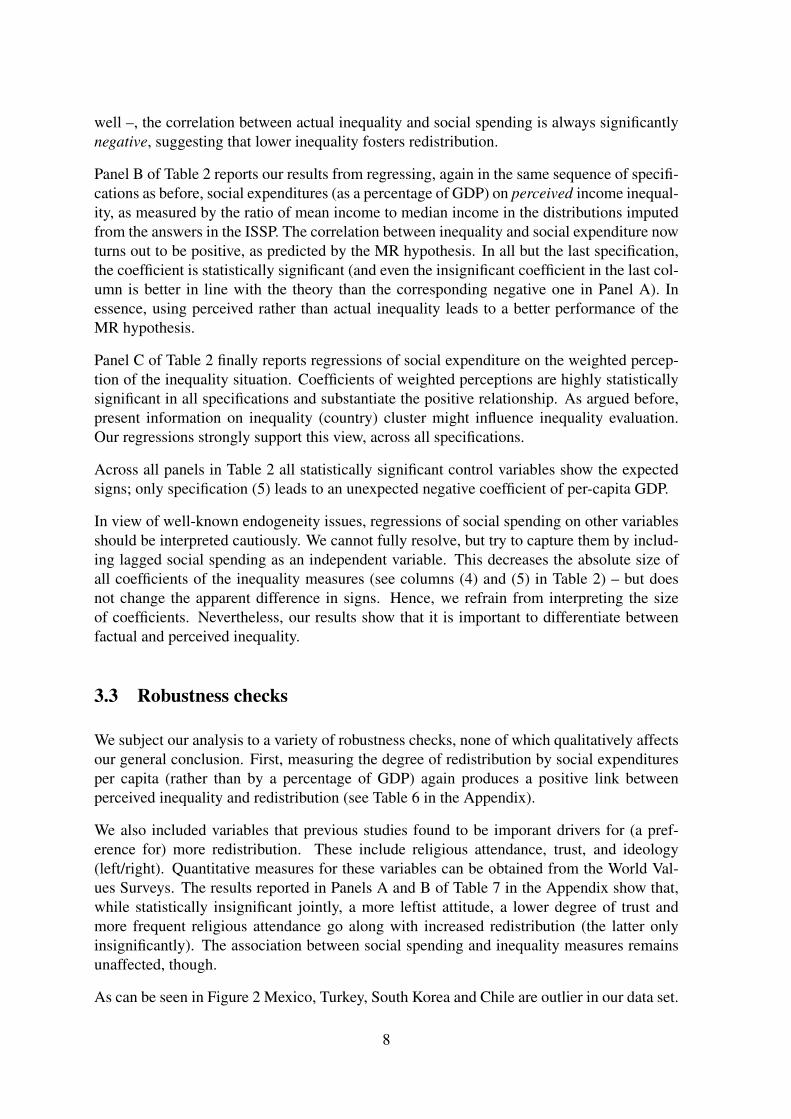
well –, the correlation between actual inequality and social spending is always significantlynegative, suggesting that lower inequality fosters redistribution.
Panel B of Table 2 reports our results from regressing, again in the same sequence of specifi-cations as before, social expenditures (as a percentage of GDP) on perceived income inequal-ity, as measured by the ratio of mean income to median income in the distributions imputedfrom the answers in the ISSP. The correlation between inequality and social expenditure nowturns out to be positive, as predicted by the MR hypothesis. In all but the last specification,the coefficient is statistically significant (and even the insignificant coefficient in the last col-umn is better in line with the theory than the corresponding negative one in Panel A). Inessence, using perceived rather than actual inequality leads to a better performance of theMR hypothesis.
Panel C of Table 2 finally reports regressions of social expenditure on the weighted percep-tion of the inequality situation. Coefficients of weighted perceptions are highly statisticallysignificant in all specifications and substantiate the positive relationship. As argued before,present information on inequality (country) cluster might influence inequality evaluation.Our regressions strongly support this view, across all specifications.
Across all panels in Table 2 all statistically significant control variables show the expectedsigns; only specification (5) leads to an unexpected negative coefficient of per-capita GDP.
In view of well-known endogeneity issues, regressions of social spending on other variablesshould be interpreted cautiously. We cannot fully resolve, but try to capture them by includ-ing lagged social spending as an independent variable. This decreases the absolute size ofall coefficients of the inequality measures (see columns (4) and (5) in Table 2) – but doesnot change the apparent difference in signs. Hence, we refrain from interpreting the sizeof coefficients. Nevertheless, our results show that it is important to differentiate betweenfactual and perceived inequality.
3.3 Robustness checks
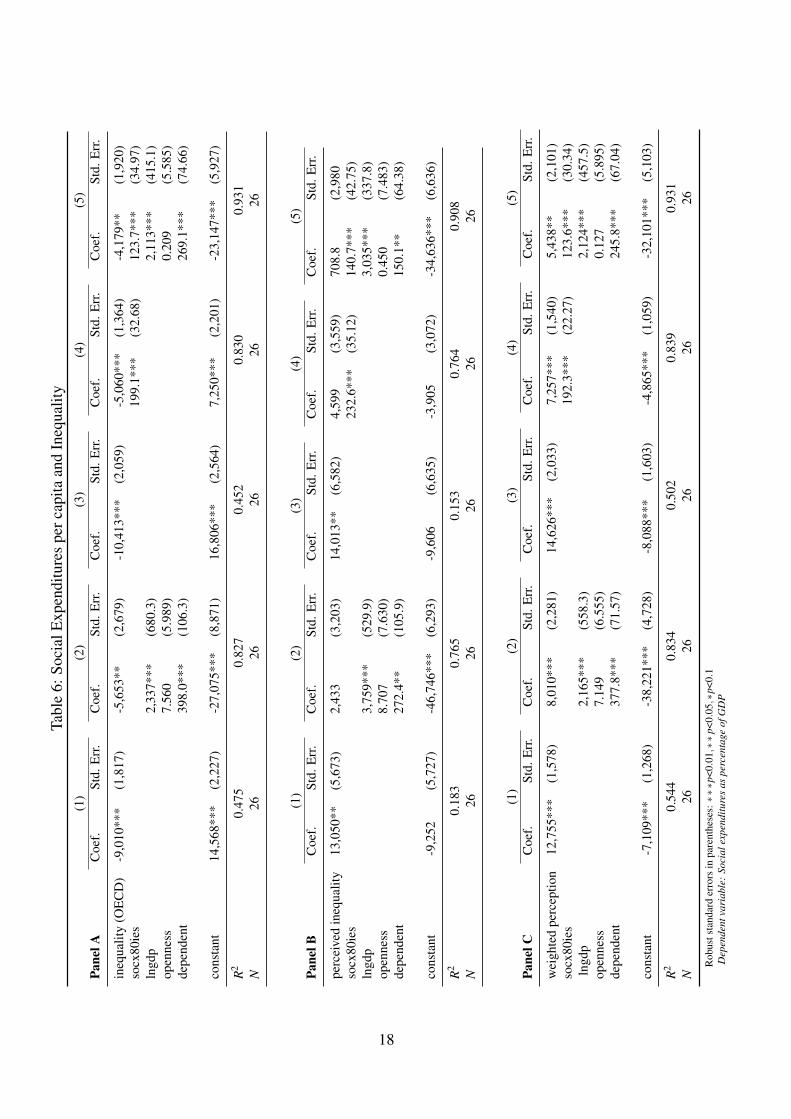
We subject our analysis to a variety of robustness checks, none of which qualitatively affectsour general conclusion. First, measuring the degree of redistribution by social expendituresper capita (rather than by a percentage of GDP) again produces a positive link betweenperceived inequality and redistribution (see Table 6 in the Appendix).
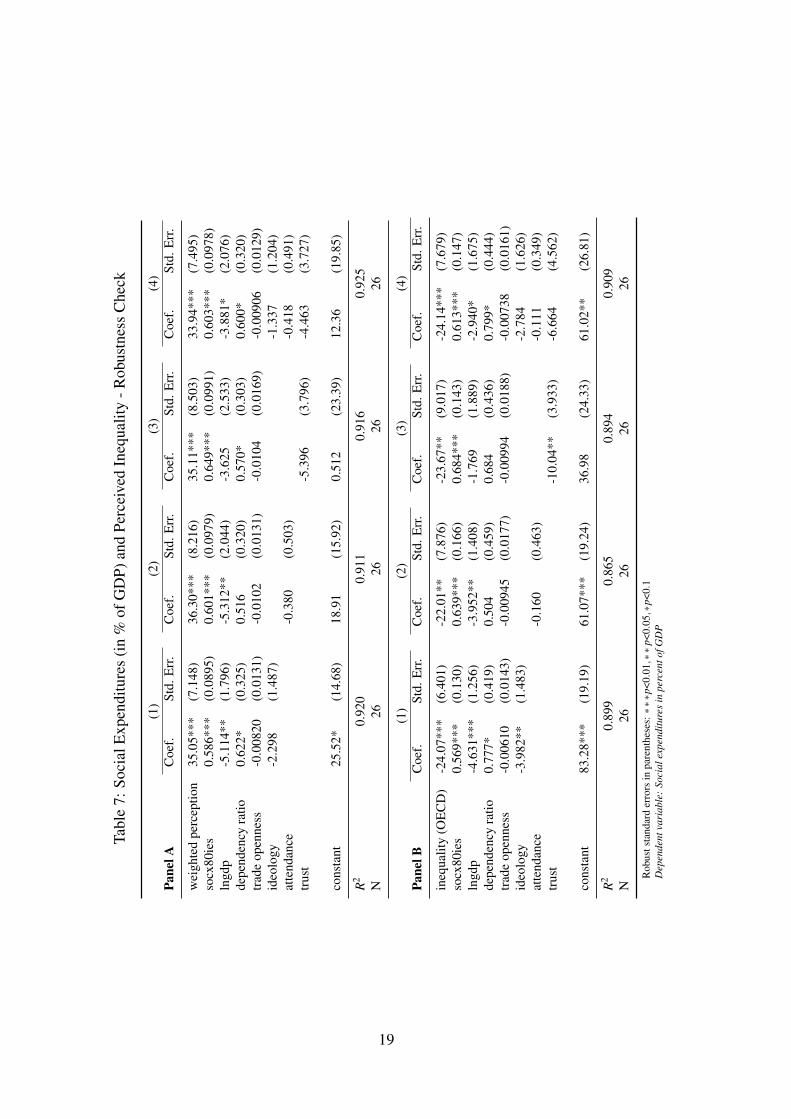
We also included variables that previous studies found to be imporant drivers for (a pref-erence for) more redistribution. These include religious attendance, trust, and ideology(left/right). Quantitative measures for these variables can be obtained from the World Val-ues Surveys. The results reported in Panels A and B of Table 7 in the Appendix show that,while statistically insignificant jointly, a more leftist attitude, a lower degree of trust andmore frequent religious attendance go along with increased redistribution (the latter onlyinsignificantly). The association between social spending and inequality measures remainsunaffected, though.
As can be seen in Figure 2 Mexico, Turkey, South Korea and Chile are outlier in our data set.
8
Tabl
e2:
Mel
tzer
-Ric
hard
Mod
el
(1)
(2)
(3)
(4)
(5)
Pane
lAC
oef.
Std.
Err
.C
oef.
Std.
Err
.C
oef.
Std.
Err
.C
oef.
Std.
Err
.C
oef.
Std.
Err
.
ineq
ualit
y(O
EC
D)
-29.
95**
*(7
.738
)-3
2.04
**(1
4.47
)-2
9.46
***
(7.1
50)
-11.
98**
(5.6
17)
-22.
40**
(8.0
66)
socx
80er
0.65
0***
(0.1
46)
0.64
6***
(0.1
59)
lngd
p0.
913
(4.4
09)
-3.9
88**
(1.4
18)
open
ness
0.03
53(0
.024
0)-0
.009
50(0
.017
9)de
pend
ent
1.57
4**
(0.7
29)
0.51
8(0
.438
)
cons
tant
54.9
1***
(9.3
44)
-6.5
28(5
5.58
)54
.90*
**(8
.781
)23
.69*
*(9
.214
)60
.68*
**(1
8.52
)
R2
0.40
80.
607
0.39
40.
834
0.86
4N
2626
2626
26
(1)
(2)
(3)
(4)
(5)
Pane
lBC
oef.
Std.
Err
.C
oef.
Std.
Err
.C
oef.
Std.
Err
.C
oef.
Std.
Err
.C
oef.
Std.
Err
.
perc
eive
din
equa
lity
54.0
2**
(20.
17)
31.9
8*(1
7.30
)49
.95*
*(1
9.71
)21
.51*
(12.
46)
21.4
0(1
3.70
)so
cx80
er0.
703*
**(0
.115
)0.
716*
**(0
.172
)ln
gdp
7.52
9**
(3.4
68)
-0.0
824
(1.9
43)
open
ness
0.04
26(0
.034
6)-0
.006
10(0
.027
7)de
pend
ent
0.91
1(0
.635
)-0
.051
0(0
.318
)
cons
tant
-35.
00(2
0.51
)-1
23.2
***
(36.
25)
-30.
18(1
9.98
)-1
2.96
(11.
09)
-10.
06(2
7.63
)
R2
0.24
40.
507
0.21
20.
819
0.82
0N
2626
2626
26
(1)
(2)
(3)
(4)
(5)
Pane
lCC
oef.
Std.
Err
.C
oef.
Std.
Err
.C
oef.
Std.
Err
.C
oef.
Std.
Err
.C
oef.
Std.
Err
.
wei
ghte
dpe
rcep
tion
44.7
7***
(6.7
24)
52.7
3***
(14.
41)
43.8
4***
(6.7
46)
20.4
3***
(6.0
40)
36.7
3***
(8.3
40)
socx
80er
0.61
1***
(0.1
13)
0.62
1***
(0.1
00)
lngd
p-1
.698
(3.8
51)
-5.2
59**
(2.1
19)
open
ness
0.03
16(0
.026
3)-0
.010
3(0
.015
4)de
pend
ent
1.56
2***
(0.4
64)
0.53
0(0
.313
)
cons
tant
-19.
20**
*(5
.714
)-6
2.53
*(3
1.51
)-1
7.65
***
(5.5
86)
-7.4
09*
(3.6
35)
15.7
2(1
6.78
)
R2
0.52
00.
690
0.49
10.
861
0.90
8N
2626
2626
26
Rob
usts
tand
ard
erro
rsin
pare
nthe
ses:∗∗
∗p<0
.01,∗∗
p<0.
05,∗
p<0.
1D
epen
dent
vari
able
:So
cial
expe
nditu
res
aspe
rcen
tage
ofG
DP
9
To rule out that statistical significance is driven by these countries, we run regressions againand exclude them. This does not alter statistical significance in a remarkable degree5.
4 The POUM hypothesis and perceived social mobility
4.1 Perceived vs. experienced social mobility
The POUM hypothesis posits that redistribution by the government is lower in democraciesthe higher is the degree of upward moility. As for the MR hypothesis in the previous sec-tion, we again argue that distinguishing between perceived and actual mobility is of crucialimportance.
The ISSP provides data that can be used to measure experienced (= actual) as well as per-ceived social upward mobility. A widely used measure of experienced mobility is based onthe following survey question:
“Please think about your present job (or your last one if you don’t have onenow). If you compare this job to the job your father had when you were14,15,16, would you say that the level of status of your job is (or was)... 1.Much lower than your father’s, 2. Lower, 3. About equal, 4. Higher or 5. Muchhigher than your father’s?”
The share of respondents who give answers 4 or 5 (i.e., the fraction of people who think theymoved ahead of their fathers in their occupations) can serve as a measure of experiencedmobility in a society can be calculated as the share in a higher occupation as one’s father.6
A common measure of expected or perceived upward mobility is based on the hard-workquestion:
“Please tick one box to show how important you think hard work is for gettingahead in life (1 – not important at all; 5 – essential).”
Higher numbers indicate a stronger perception that social structures are permeable and allowfor upward mobility. For sake of comparability, we normalized this measure to the unitinterval, measuring the average importance of hard work for getting ahead.
Table 3 reports the average values of experienced and expected mobility in our sample. Thesample covers the years in 1992, 1999 and 2009 for 24 OECD countries covered in the ISSP.7
5Essentially, regressions using the simple perceived inequality measure lose statistical significance.6We exclude all people who have never had a job or who do not know what their father did, never knew
their father or whose father never had a job.7These are: Austria, Canada, Chile, Czech Republic, Denmark, Finland, France, Germany, Hungary, Italy,
Israel, Japan, New Zealand, Norway, Poland, Portugal, Sweden, Slovenia, South Korea, Spain, Switzerland,Turkey, UK, and the US.
10
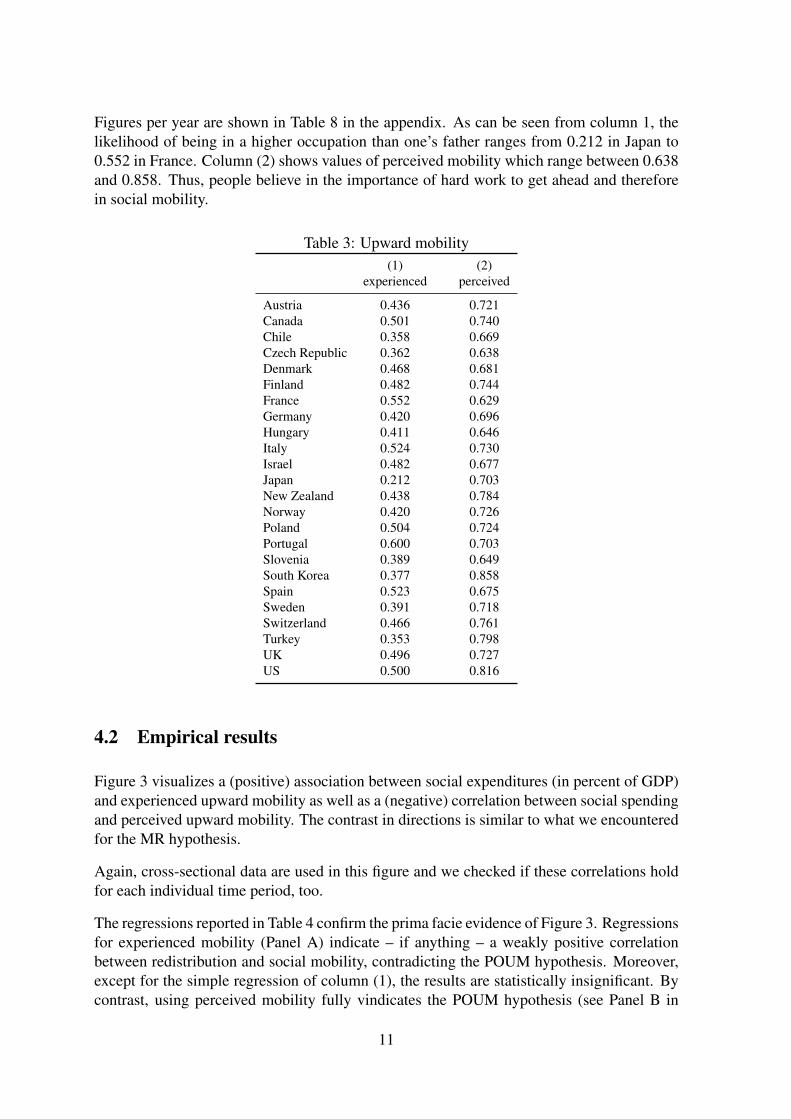
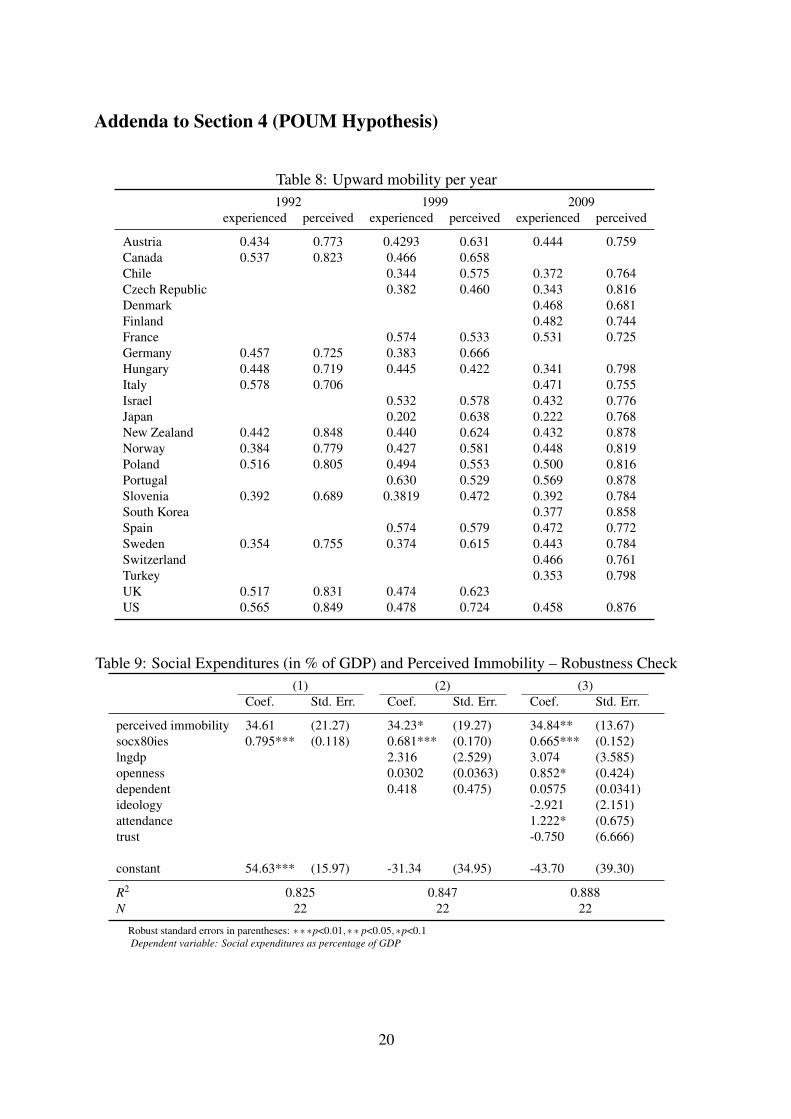
Figures per year are shown in Table 8 in the appendix. As can be seen from column 1, thelikelihood of being in a higher occupation than one’s father ranges from 0.212 in Japan to0.552 in France. Column (2) shows values of perceived mobility which range between 0.638and 0.858. Thus, people believe in the importance of hard work to get ahead and thereforein social mobility.
Table 3: Upward mobility(1) (2)
experienced perceived
Austria 0.436 0.721Canada 0.501 0.740Chile 0.358 0.669Czech Republic 0.362 0.638Denmark 0.468 0.681Finland 0.482 0.744France 0.552 0.629Germany 0.420 0.696Hungary 0.411 0.646Italy 0.524 0.730Israel 0.482 0.677Japan 0.212 0.703New Zealand 0.438 0.784Norway 0.420 0.726Poland 0.504 0.724Portugal 0.600 0.703Slovenia 0.389 0.649South Korea 0.377 0.858Spain 0.523 0.675Sweden 0.391 0.718Switzerland 0.466 0.761Turkey 0.353 0.798UK 0.496 0.727US 0.500 0.816
4.2 Empirical results
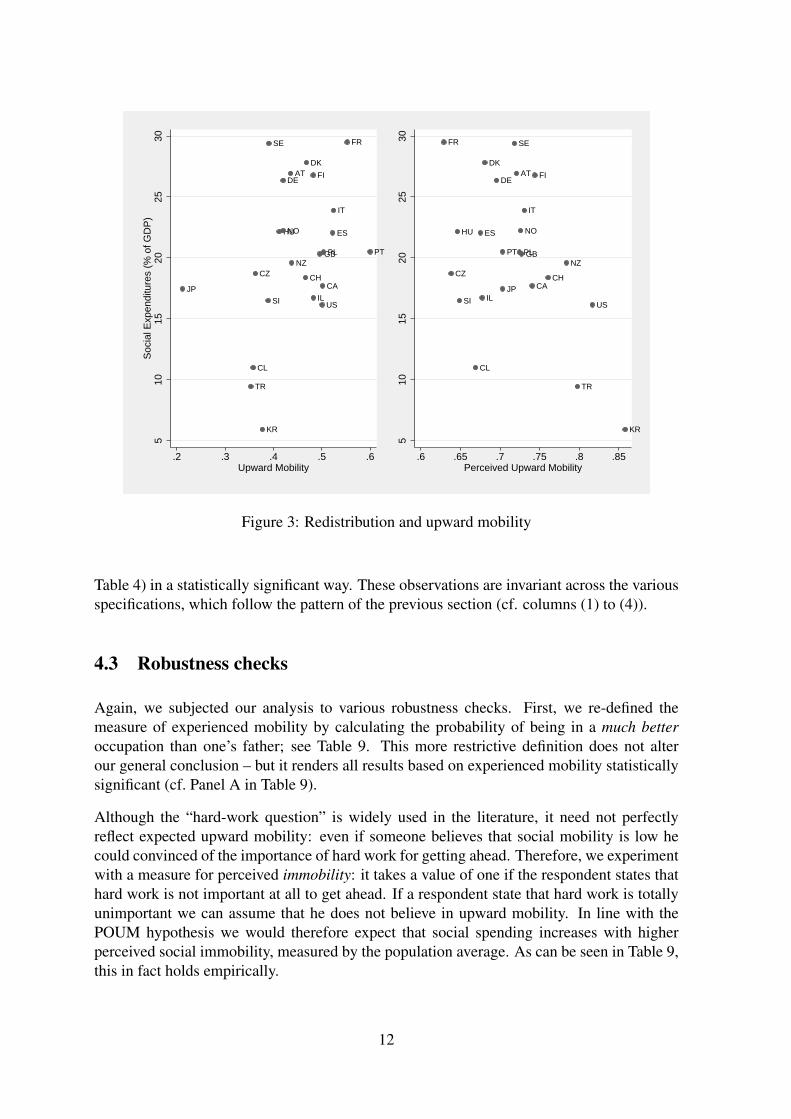
Figure 3 visualizes a (positive) association between social expenditures (in percent of GDP)and experienced upward mobility as well as a (negative) correlation between social spendingand perceived upward mobility. The contrast in directions is similar to what we encounteredfor the MR hypothesis.
Again, cross-sectional data are used in this figure and we checked if these correlations holdfor each individual time period, too.
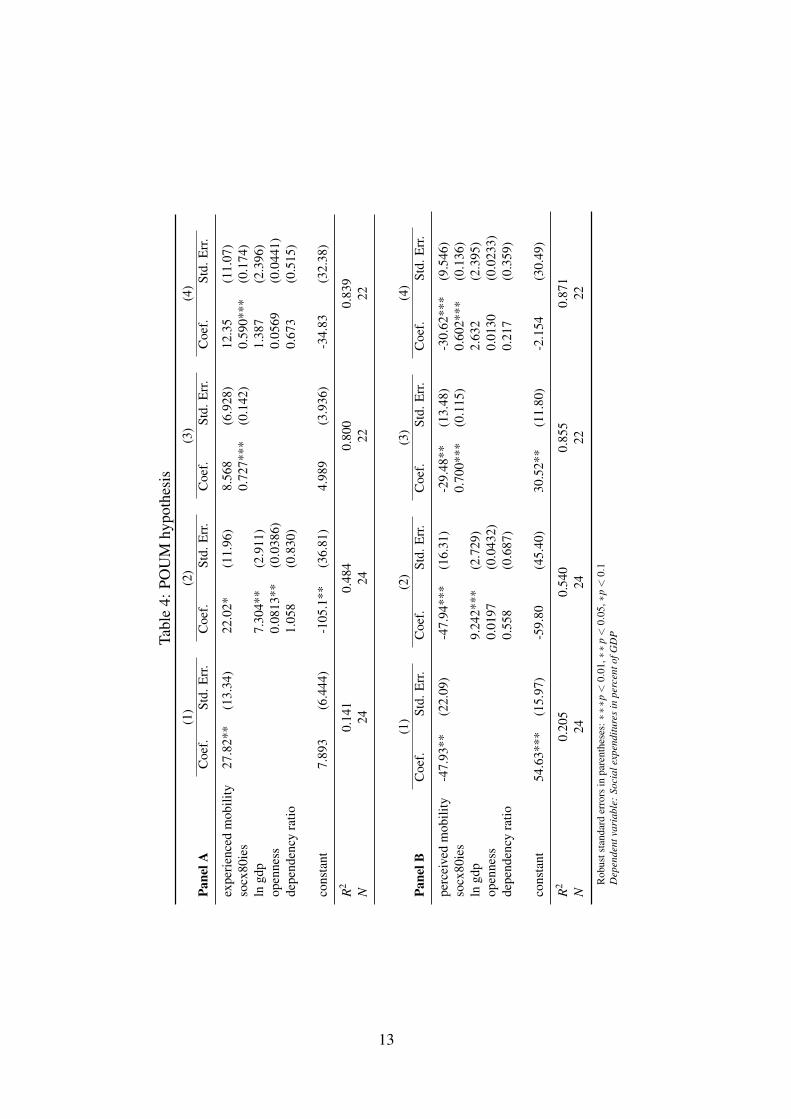
The regressions reported in Table 4 confirm the prima facie evidence of Figure 3. Regressionsfor experienced mobility (Panel A) indicate – if anything – a weakly positive correlationbetween redistribution and social mobility, contradicting the POUM hypothesis. Moreover,except for the simple regression of column (1), the results are statistically insignificant. Bycontrast, using perceived mobility fully vindicates the POUM hypothesis (see Panel B in
11
AT
CACH
CL
CZ
DE
DK
ES
FI
FR
GB
HU
IL
IT
JP
KR
NO
NZPL PT
SE
SI
TR
US
510
1520
2530
Soc
ial E
xpen
ditu
res
(% o
f GD
P)
.2 .3 .4 .5 .6Upward Mobility
AT
CACH
CL
CZ
DE
DK
ES
FI
FR
GB
HU
IL
IT
JP
KR
NO
NZPLPT
SE
SI
TR
US
510
1520
2530
.6 .65 .7 .75 .8 .85Perceived Upward Mobility
Figure 3: Redistribution and upward mobility
Table 4) in a statistically significant way. These observations are invariant across the variousspecifications, which follow the pattern of the previous section (cf. columns (1) to (4)).
4.3 Robustness checks
Again, we subjected our analysis to various robustness checks. First, we re-defined themeasure of experienced mobility by calculating the probability of being in a much betteroccupation than one’s father; see Table 9. This more restrictive definition does not alterour general conclusion – but it renders all results based on experienced mobility statisticallysignificant (cf. Panel A in Table 9).
Although the “hard-work question” is widely used in the literature, it need not perfectlyreflect expected upward mobility: even if someone believes that social mobility is low hecould convinced of the importance of hard work for getting ahead. Therefore, we experimentwith a measure for perceived immobility: it takes a value of one if the respondent states thathard work is not important at all to get ahead. If a respondent state that hard work is totallyunimportant we can assume that he does not believe in upward mobility. In line with thePOUM hypothesis we would therefore expect that social spending increases with higherperceived social immobility, measured by the population average. As can be seen in Table 9,this in fact holds empirically.
12
Tabl
e4:
POU
Mhy
poth
esis
(1)
(2)
(3)
(4)
Pane
lAC
oef.
Std.
Err
.C
oef.
Std.
Err
.C
oef.
Std.
Err
.C
oef.
Std.
Err
.
expe
rien
ced
mob
ility
27.8
2**
(13.
34)
22.0
2*(1
1.96
)8.
568
(6.9
28)
12.3
5(1
1.07
)so
cx80
ies
0.72
7***
(0.1
42)
0.59
0***
(0.1
74)
lngd
p7.
304*
*(2
.911
)1.
387
(2.3
96)
open
ness
0.08
13**
(0.0
386)
0.05
69(0
.044
1)de
pend
ency
ratio
1.05
8(0
.830
)0.
673
(0.5
15)
cons
tant
7.89
3(6
.444
)-1
05.1
**(3
6.81
)4.
989
(3.9
36)
-34.
83(3
2.38
)
R2
0.14
10.
484
0.80
00.
839
N24
2422
22
(1)
(2)
(3)
(4)
Pane
lBC
oef.
Std.
Err
.C
oef.
Std.
Err
.C
oef.
Std.
Err
.C
oef.
Std.
Err
.
perc
eive
dm
obili
ty-4
7.93
**(2
2.09
)-4
7.94
***
(16.
31)
-29.
48**
(13.
48)
-30.
62**
*(9
.546
)so
cx80
ies
0.70
0***
(0.1
15)
0.60
2***
(0.1
36)
lngd
p9.
242*
**(2
.729
)2.
632
(2.3
95)
open
ness
0.01
97(0
.043
2)0.
0130
(0.0
233)
depe
nden
cyra
tio0.
558
(0.6
87)
0.21
7(0
.359
)
cons
tant
54.6
3***
(15.
97)
-59.
80(4
5.40
)30
.52*
*(1
1.80
)-2
.154
(30.
49)
R2
0.20
50.
540
0.85
50.
871
N24
2422
22
Rob
usts
tand
ard
erro
rsin
pare
nthe
ses:∗∗
∗p<
0.01
,∗∗
p<
0.05
,∗p<
0.1
Dep
ende
ntva
riab
le:
Soci
alex
pend
iture
sin
perc
ento
fGD
P
13
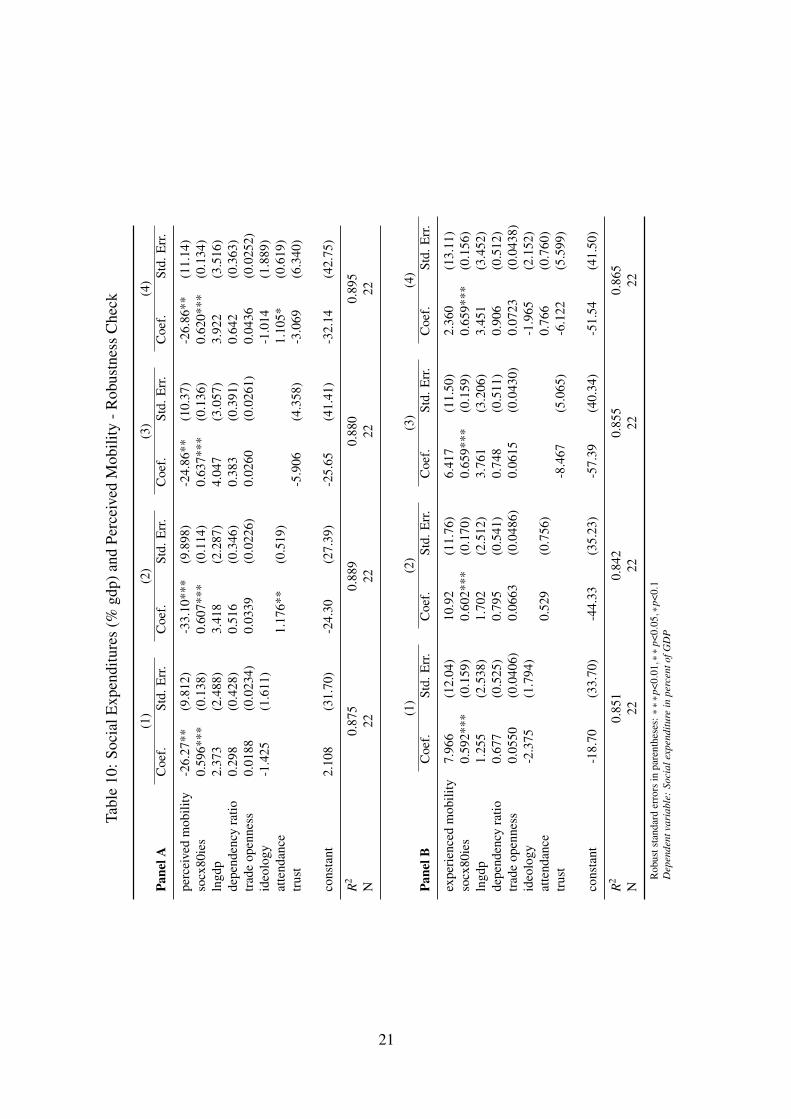
Table 10 in the Appendix demonstrates that controlling for political and religious attitudescorroborates our findings: Panel A confirms that redistribution is lower the higher is actualsocial mobility (thus, questioning the POUM hypothesis) while Panel B evidences a negativecorrelation between perceived mobility and social expenditure.
5 Concluding remarks
In democratic political systems, the perceptions of the electorate on issues matter. In fact,perceptions might matter more than objective data. If citizen-voters see an issue, politics hasto respond – even if there is no issue; conversely, if a (real) problem is not salient with voters,it will probably not be pursued forcefully.
This idea can be applied to “populist” politics of progressive tax-transfer problems. Ourstudy suggests that perceived inequality and expected upwards mobility are good predic-tors of social policy, sometimes even better ones than objective, offical or factual measures.As a first attempt to trace social expenditures back to perceptions of inequality, our resultsare preliminary but open directions for future research. First, to check the stability of ouroberservation it will be interesting to repeat some of the empirical studies that test the MR orthe POUM hypothesis with official measures for inequality or social mobility with perceivedmeasures. Second, changing the dependent variable from actual social spending to prefer-ences for redistribution will show whether perceptions also matter for voters’ wishes. Third,while our study takes perceptions as exogenous, one could study how these perceptions areshaped. This could then give rise to a more complete understanding of political choicesin democracies. Finally, the discrepancies between perceptions and actual data might alsomatter for policy areas other than social spending.
14
ReferencesAlesina, A., La Ferrara, E., 2005. Preferences for redistribution in the land of opportunities.
Journal of Public Economics 89, 897–931.
Bartels, L. M., 2005. Homer gets a tax cut: Inequality and public policy in the Americanmind. Perspectives on Politics 3, 15–31.
Bartels, L. M., 2008. Unequal Democracy: The Political Economy of the New Gilded Age.Princeton University Press, Princeton, NJ.
Benabou, R., Ok, E. A., 2001. Social mobility and the demand for redistribution: The POUMhypothesis. Quarterly Journal of Economics 116, 447–487.
Bjoernskov, C., Dreher, A., Fischer, J. A., Schnellenbach, J., Gehring, K., 2013. Inequal-ity and happiness: When perceived social mobility and economic reality do not match.Journal of Economic Behavior and Organization 91, 75–92.
Borge, L.-E., Rattsoe, J., 2004. Income distribution and tax structure: Empirical test of theMeltzer-Richard hypothesis. European Economic Review 48, 805–826.
Bredemeier, C., 2014. Imperfect information and the Meltzer-Richard hypothesis. PublicChoice (forthcoming).
Brooks, C., Manza, J., 2006. Social policy responsiveness in developed democracies. Amer-ican Sociological Review 71, 474–494.
Corneo, G., Grüner, H.-P., 2002. Individual preferences for political redistribution. Journalof Public Economics 83, 83–107.
Cruces, G., Perez-Truglia, R., Tetaz, M., 2013. Biased perception of income distributionand preferences for redistribution: Evidence from a survey experiment. Journal of PublicEconomics 98, 100–112.
Evans, M., Kelley, J., 2004. Subjective social location: Data from 21 nations. InternationalJournal of Public Opinion Research 16, 3–38.
Finseraas, H., 2009. Income inequality and demand for redistribution: A multilevel analysisof European public opinion. Scandinavian Political Studies 32 (1), 94–119.
Georgiadis, A., Manning, A., 2012. Spend it like Beckham? Inequality and redistribution inthe UK, 1983-2004. Public Choice 151, 537–563.
Gouveia, M., Masia, N. A., 1998. Does the median voter model explain the size of govern-ment? evidence from the States. Public Choice 97, 159–177.
Guenther, C. L., Alicke, M. D., 2010. Deconstructing the Better-than-Average effect. Journalof Personality and Social Psychology 99, 755–770.
Kenworthy, L., McCall, L., 2008. Inequality, public opinion and redistribution. Socio-Economic Review 6, 35–68.
15
Lübker, M., 2006. Inequality and the demand for redistribution: Are assumptions of the newgrowth theory valid? Socio-Economic Review 5, 117–148.
Mahler, V. A., 2008. Electoral turnout and income redistribution by the state: A cross-national analysis of developed democracies. European Journal of Political Research 47,161–183.
Meltzer, A. H., Richard, S. F., 1981. A rational theory of the size of government. The Journalof Political Economy 89 (5), 914–927.
Meltzer, A. H., Richard, S. F., 1983. Tests of a rational theory of the size of government.Public Choice 41 (3), 403–418.
Milanovic, B., 2000. The median-voter hypothesis, income inequality, and income redistri-bution: An empirical test with the required data. European Journal of Political Economy16 (3), 367–410.
Norton, M. I., Ariely, D., 2011. Building a better America – one wealth quintile at a time.Perspectives on Psychological Science 6, 9–12.
Osberg, L., Smeeding, T., 2006. “Fair” inequality? attitudes toward pay differentials: TheUnited States in comparative perspective. American Sociological Review 71, 450–473.
Persson, T., Tabellini, G., 2000. Political Economics: Explaining Economic Policy. The MITPress, Cambridge, MA.
Pontusson, J., Rueda, D., 2010. The politics of inequality: Voter mobilization and left partiesin advances industrial states. Comparative Political Studies 43, 675–705.
Rodrìguez, F. C., 1999. Does distributional skewness lead to redistribution? evidence fromthe United States. Economics and Politics 11 (2), 171–199.
Romer, T., 1975. Individual welfare, majority voting and the properties of a linear incometax. Journal of Public Economics 4 (2), 163–185.
Runciman, W. G., 1966. Relative Deprivation and Social Justice: A Study of Attitudes toSocial Inequality in Twentieth-Century England. Routledge Kegan Paul, London.
Scervini, F., 2012. Empirics of the median voter: Democracy, redistribution and the role ofthe middle class. Journal of Economic Inequality 10, 529–550.
16
Appendix
Addenda to Section 3 (Meltzer-Richard Model)
Table 5: Weighted perception per year(1) (2) (3) (4) (5)
1987 1992 1999 2006/07 2008/09
Austria 0.954 0.950 0.921Belgium 0.912Canada 0.919 0.900 0.854Chile 0.537 0.633Czech Republic 0.924 0.795 0.834Denmark 0.940Finland 0.887 0.920France 0.965 0.819 0.797Germany 0.969 0.991 1.000 0.803 0.835Ireland 0.899 0.902Italy 0.912 0.835Japan 0.932 0.828 0.816Mexico 0.616Netherlands 0.831 0.838New Zealand 0.837 0.889 0.820 0.837Norway 0.966 0.894 0.987 0.918Poland 0.909 0.864 0.923Portugal 0.843 0.898Slovenia 1.094 0.972 0.916South Korea 0.833 0.817Spain 1.013 0.872 0.873Sweden 0.996 0.964 0.938 0.927Switzerland 0.828Turkey 0.630UK 0.967 0.934 0.944US 0.905 0.919 0.877 0.888 0.788
17
Tabl
e6:
Soci
alE
xpen
ditu
res
perc
apita
and
Ineq
ualit
y(1
)(2
)(3
)(4
)(5
)Pa
nelA
Coe
f.St
d.E
rr.
Coe
f.St
d.E
rr.
Coe
f.St
d.E
rr.
Coe
f.St
d.E
rr.
Coe
f.St
d.E
rr.
ineq
ualit
y(O
EC
D)
-9,0
10**
*(1
,817
)-5
,653
**(2
,679
)-1
0,41
3***
(2,0
59)
-5,0
60**
*(1
,364
)-4
,179
**(1
,920
)so
cx80
ies
199.
1***
(32.
68)
123.
7***
(34.
97)
lngd
p2,
337*
**(6
80.3
)2,
113*
**(4
15.1
)op
enne
ss7.
560
(5.9
89)
0.20
9(5
.585
)de
pend
ent
398.
0***
(106
.3)
269.
1***
(74.
66)
cons
tant
14,5
68**
*(2
,227
)-2
7,07
5***
(8,8
71)
16,8
06**
*(2
,564
)7,
250*
**(2
,201
)-2
3,14
7***
(5,9
27)
R2
0.47
50.
827
0.45
20.
830
0.93
1N
2626
2626
26
(1)
(2)
(3)
(4)
(5)
Pane
lBC
oef.
Std.
Err
.C
oef.
Std.
Err
.C
oef.
Std.
Err
.C
oef.
Std.
Err
.C
oef.
Std.
Err
.
perc
eive
din
equa
lity
13,0
50**
(5,6
73)
2,43
3(3
,203
)14
,013
**(6
,582
)4,
599
(3,5
59)
708.
8(2
,980
socx
80ie
s23
2.6*
**(3
5.12
)14
0.7*
**(4
2.75
)ln
gdp
3,75
9***
(529
.9)
3,03
5***
(337
.8)
open
ness
8.70
7(7
.630
)0.
450
(7.4
83)
depe
nden
t27
2.4*
*(1
05.9
)15
0.1*
*(6
4.38
)
cons
tant
-9,2
52(5
,727
)-4
6,74
6***
(6,2
93)
-9,6
06(6
,635
)-3
,905
(3,0
72)
-34,
636*
**(6
,636
)
R2
0.18
30.
765
0.15
30.
764
0.90
8N
2626
2626
26
(1)
(2)
(3)
(4)
(5)
Pane
lCC
oef.
Std.
Err
.C
oef.
Std.
Err
.C
oef.
Std.
Err
.C
oef.
Std.
Err
.C
oef.
Std.
Err
.
wei
ghte
dpe
rcep
tion
12,7
55**
*(1
,578
)8,
010*
**(2
,281
)14
,626
***
(2,0
33)
7,25
7***
(1,5
40)
5,43
8**
(2,1
01)
socx
80ie
s19
2.3*
**(2
2.27
)12
3.6*
**(3
0.34
)ln
gdp
2,16
5***
(558
.3)
2,12
4***
(457
.5)
open
ness
7.14
9(6
.555
)0.
127
(5.8
95)
depe
nden
t37
7.8*
**(7
1.57
)24
5.8*
**(6
7.04
)
cons
tant
-7,1
09**
*(1
,268
)-3
8,22
1***
(4,7
28)
-8,0
88**
*(1
,603
)-4
,865
***
(1,0
59)
-32,
101*
**(5
,103
)
R2
0.54
40.
834
0.50
20.
839
0.93
1N
2626
2626
26
Rob
usts
tand
ard
erro
rsin
pare
nthe
ses:∗∗
∗p<0
.01,∗∗
p<0.
05,∗
p<0.
1D
epen
dent
vari
able
:So
cial
expe
nditu
res
aspe
rcen
tage
ofG
DP
18
Tabl
e7:
Soci
alE
xpen
ditu
res
(in
%of
GD
P)an
dPe
rcei
ved
Ineq
ualit
y-R
obus
tnes
sC
heck
(1)
(2)
(3)
(4)
Pane
lAC
oef.
Std.
Err
.C
oef.
Std.
Err
.C
oef.
Std.
Err
.C
oef.
Std.
Err
.
wei
ghte
dpe
rcep
tion
35.0
5***
(7.1
48)
36.3
0***
(8.2
16)
35.1
1***
(8.5
03)
33.9
4***
(7.4
95)
socx
80ie
s0.
586*
**(0
.089
5)0.
601*
**(0
.097
9)0.
649*
**(0
.099
1)0.
603*
**(0
.097
8)ln
gdp
-5.1
14**
(1.7
96)
-5.3
12**
(2.0
44)
-3.6
25(2
.533
)-3
.881
*(2
.076
)de
pend
ency
ratio
0.62
2*(0
.325
)0.
516
(0.3
20)
0.57
0*(0
.303
)0.
600*
(0.3
20)
trad
eop
enne
ss-0
.008
20(0
.013
1)-0
.010
2(0
.013
1)-0
.010
4(0
.016
9)-0
.009
06(0
.012
9)id
eolo
gy-2
.298
(1.4
87)
-1.3
37(1
.204
)at
tend
ance
-0.3
80(0
.503
)-0
.418
(0.4
91)
trus
t-5
.396
(3.7
96)
-4.4
63(3
.727
)
cons
tant
25.5
2*(1
4.68
)18
.91
(15.
92)
0.51
2(2
3.39
)12
.36
(19.
85)
R2
0.92
00.
911
0.91
60.
925
N26
2626
26
(1)
(2)
(3)
(4)
Pane
lBC
oef.
Std.
Err
.C
oef.
Std.
Err
.C
oef.
Std.
Err
.C
oef.
Std.
Err
.
ineq
ualit
y(O
EC
D)
-24.
07**
*(6
.401
)-2
2.01
**(7
.876
)-2
3.67
**(9
.017
)-2
4.14
***
(7.6
79)
socx
80ie
s0.
569*
**(0
.130
)0.
639*
**(0
.166
)0.
684*
**(0
.143
)0.
613*
**(0
.147
)ln
gdp
-4.6
31**
*(1
.256
)-3
.952
**(1
.408
)-1
.769
(1.8
89)
-2.9
40*
(1.6
75)
depe
nden
cyra
tio0.
777*
(0.4
19)
0.50
4(0
.459
)0.
684
(0.4
36)
0.79
9*(0
.444
)tr
ade
open
ness
-0.0
0610
(0.0
143)
-0.0
0945
(0.0
177)
-0.0
0994
(0.0
188)
-0.0
0738
(0.0
161)
ideo
logy
-3.9
82**
(1.4
83)
-2.7
84(1
.626
)at
tend
ance
-0.1
60(0
.463
)-0
.111
(0.3
49)
trus
t-1
0.04
**(3
.933
)-6
.664
(4.5
62)
cons
tant
83.2
8***
(19.
19)
61.0
7***
(19.
24)
36.9
8(2
4.33
)61
.02*
*(2
6.81
)
R2
0.89
90.
865
0.89
40.
909
N26
2626
26
Rob
usts
tand
ard
erro
rsin
pare
nthe
ses:∗∗
∗p<0
.01,∗∗
p<0.
05,∗
p<0.
1D
epen
dent
vari
able
:So
cial
expe
nditu
res
inpe
rcen
tofG
DP
19
Addenda to Section 4 (POUM Hypothesis)
Table 8: Upward mobility per year1992 1999 2009
experienced perceived experienced perceived experienced perceived
Austria 0.434 0.773 0.4293 0.631 0.444 0.759Canada 0.537 0.823 0.466 0.658Chile 0.344 0.575 0.372 0.764Czech Republic 0.382 0.460 0.343 0.816Denmark 0.468 0.681Finland 0.482 0.744France 0.574 0.533 0.531 0.725Germany 0.457 0.725 0.383 0.666Hungary 0.448 0.719 0.445 0.422 0.341 0.798Italy 0.578 0.706 0.471 0.755Israel 0.532 0.578 0.432 0.776Japan 0.202 0.638 0.222 0.768New Zealand 0.442 0.848 0.440 0.624 0.432 0.878Norway 0.384 0.779 0.427 0.581 0.448 0.819Poland 0.516 0.805 0.494 0.553 0.500 0.816Portugal 0.630 0.529 0.569 0.878Slovenia 0.392 0.689 0.3819 0.472 0.392 0.784South Korea 0.377 0.858Spain 0.574 0.579 0.472 0.772Sweden 0.354 0.755 0.374 0.615 0.443 0.784Switzerland 0.466 0.761Turkey 0.353 0.798UK 0.517 0.831 0.474 0.623US 0.565 0.849 0.478 0.724 0.458 0.876
Table 9: Social Expenditures (in % of GDP) and Perceived Immobility – Robustness Check(1) (2) (3)
Coef. Std. Err. Coef. Std. Err. Coef. Std. Err.
perceived immobility 34.61 (21.27) 34.23* (19.27) 34.84** (13.67)socx80ies 0.795*** (0.118) 0.681*** (0.170) 0.665*** (0.152)lngdp 2.316 (2.529) 3.074 (3.585)openness 0.0302 (0.0363) 0.852* (0.424)dependent 0.418 (0.475) 0.0575 (0.0341)ideology -2.921 (2.151)attendance 1.222* (0.675)trust -0.750 (6.666)
constant 54.63*** (15.97) -31.34 (34.95) -43.70 (39.30)
R2 0.825 0.847 0.888N 22 22 22
Robust standard errors in parentheses: ∗∗∗p<0.01,∗∗ p<0.05,∗p<0.1Dependent variable: Social expenditures as percentage of GDP
20
Tabl
e10
:Soc
ialE
xpen
ditu
res
(%gd
p)an
dPe
rcei
ved
Mob
ility
-Rob
ustn
ess
Che
ck
(1)
(2)
(3)
(4)
Pane
lAC
oef.
Std.
Err
.C
oef.
Std.
Err
.C
oef.
Std.
Err
.C
oef.
Std.
Err
.
perc
eive
dm
obili
ty-2
6.27
**(9
.812
)-3
3.10
***
(9.8
98)
-24.
86**
(10.
37)
-26.
86**
(11.
14)
socx
80ie
s0.
596*
**(0
.138
)0.
607*
**(0
.114
)0.
637*
**(0
.136
)0.
620*
**(0
.134
)ln
gdp
2.37
3(2
.488
)3.
418
(2.2
87)
4.04
7(3
.057
)3.
922
(3.5
16)
depe
nden
cyra
tio0.
298
(0.4
28)
0.51
6(0
.346
)0.
383
(0.3
91)
0.64
2(0
.363
)tr
ade
open
ness
0.01
88(0
.023
4)0.
0339
(0.0
226)
0.02
60(0
.026
1)0.
0436
(0.0
252)
ideo
logy
-1.4
25(1
.611
)-1
.014
(1.8
89)
atte
ndan
ce1.
176*
*(0
.519
)1.
105*
(0.6
19)
trus
t-5
.906
(4.3
58)
-3.0
69(6
.340
)
cons
tant
2.10
8(3
1.70
)-2
4.30
(27.
39)
-25.
65(4
1.41
)-3
2.14
(42.
75)
R2
0.87
50.
889
0.88
00.
895
N22
2222
22
(1)
(2)
(3)
(4)
Pane
lBC
oef.
Std.
Err
.C
oef.
Std.
Err
.C
oef.
Std.
Err
.C
oef.
Std.
Err
.
expe
rien
ced
mob
ility
7.96
6(1
2.04
)10
.92
(11.
76)
6.41
7(1
1.50
)2.
360
(13.
11)
socx
80ie
s0.
592*
**(0
.159
)0.
602*
**(0
.170
)0.
659*
**(0
.159
)0.
659*
**(0
.156
)ln
gdp
1.25
5(2
.538
)1.
702
(2.5
12)
3.76
1(3
.206
)3.
451
(3.4
52)
depe
nden
cyra
tio0.
677
(0.5
25)
0.79
5(0
.541
)0.
748
(0.5
11)
0.90
6(0
.512
)tr
ade
open
ness
0.05
50(0
.040
6)0.
0663
(0.0
486)
0.06
15(0
.043
0)0.
0723
(0.0
438)
ideo
logy
-2.3
75(1
.794
)-1
.965
(2.1
52)
atte
ndan
ce0.
529
(0.7
56)
0.76
6(0
.760
)tr
ust
-8.4
67(5
.065
)-6
.122
(5.5
99)
cons
tant
-18.
70(3
3.70
)-4
4.33
(35.
23)
-57.
39(4
0.34
)-5
1.54
(41.
50)
R2
0.85
10.
842
0.85
50.
865
N22
2222
22
Rob
usts
tand
ard
erro
rsin
pare
nthe
ses:∗∗
∗p<0
.01,∗∗
p<0.
05,∗
p<0.
1D
epen
dent
vari
able
:So
cial
expe
nditu
rein
perc
ento
fGD
P
21
Related Documents