REPUBLIC OF INDIA BANGALORE WATER SUPPLY AND SEWERAGE BOARD BENGALURU WATER SUPPLY AND SEWERAGE PROJECT (PHASE 3) IN THE STATE OF KARNATAKA, INDIA FINAL REPORT (Main Report) NOVEMBER 2017 JAPAN INTERNATIONAL COOPERATION AGENCY (JICA) NJS CONSULTANTS CO., LTD. (NJS) 4R JR(先) 17-063

Welcome message from author
This document is posted to help you gain knowledge. Please leave a comment to let me know what you think about it! Share it to your friends and learn new things together.
Transcript
REPUBLIC OF INDIA
BANGALORE WATER SUPPLY AND SEWERAGE BOARD
BENGALURU WATER SUPPLY AND SEWERAGE PROJECT (PHASE 3)
IN
THE STATE OF KARNATAKA, INDIA
FINAL REPORT (Main Report)
NOVEMBER 2017
JAPAN INTERNATIONAL COOPERATION AGENCY (JICA)
NJS CONSULTANTS CO., LTD. (NJS) 4R
JR(先) 17-063

1 USD = 112 Yen
1 INR = 1.74 Yen
(As of June 2017)
Bengaluru Water Supply and Sewerage Project (Phase 3)
Final Report
NJS Consultants Co., Ltd i
Table of Contents
ABBREVIATIONS
LOCATION MAP
EXECUTIVE SUMMARY
CHAPTER 1 BACKGROUND AND OUTLINE OF THE PROJECT ............................................... 1-1
1.1 INTRODUCTION ................................................................................................................................. 1-1
1.2 OBJECTIVES OF THE PROJECT AND PREPARATORY SURVEY ............................................................. 1-1
1.3 SURVEY AREA AND DESIGN YEAR .................................................................................................... 1-1
1.3.1 Outline of the Proposed Work ................................................................................................... 1-2
CHAPTER 2 GENERAL DESCRIPTION ON THE PROJECT AREA ............................................ 2-1
2.1 NATURAL CONDITIONS ..................................................................................................................... 2-1
2.1.1 Location and Topographic Conditions ...................................................................................... 2-1
2.1.2 Meteorological Conditions ........................................................................................................ 2-1
2.1.3 Hydrological and Hydrogeological Conditions ...................................................................... 2-13
2.1.4 Geological Conditions ............................................................................................................ 2-19
2.2 LEGISLATIVE CONDITIONS ............................................................................................................. 2-21
2.2.1 National/State/City Water Policy ............................................................................................ 2-21
2.2.2 Legal Framework .................................................................................................................... 2-28
2.2.3 Relevant Organizations to the Sectors .................................................................................... 2-37
2.2.4 Water Quality and Sewage Discharge Standards in India ....................................................... 2-40
2.3 SOCIO-ECONOMIC PROFILE ............................................................................................................ 2-43
2.3.1 Population, Income and Housing ............................................................................................ 2-43
2.3.2 Education ................................................................................................................................ 2-46
2.3.3 Culture and Religion ............................................................................................................... 2-47
2.3.4 Slums ...................................................................................................................................... 2-47
2.3.5 Economy in Bengaluru Urban District .................................................................................... 2-49
2.3.6 Social Services ........................................................................................................................ 2-49
2.3.7 Administrative Divisions ........................................................................................................ 2-54
2.4 EXISTING AND FUTURE LAND USE ................................................................................................. 2-55
2.4.1 Existing Land Use ................................................................................................................... 2-55
2.4.2 Future Land Use ...................................................................................................................... 2-56
Bengaluru Water Supply and Sewerage Project (Phase 3)
Final Report
NJS Consultants Co., Ltd ii
CHAPTER 3 EXISTING WATER SUPPLY AND ON-GOING/PLANNED WATER SUPPLY
PROJECTS ..................................................................................................................... 3-1
3.1 EXISTING AND ON-GOING WATER SUPPLY ....................................................................................... 3-1
3.1.1 General Conditions on Water Supply in Bruhat Bengaluru Mahanagara Palike ....................... 3-1
3.1.2 Population Coverage and Access to Water Services ................................................................. 3-3
3.2 EXISTING WATER SUPPLY FACILITIES ............................................................................................... 3-5
3.2.1 Intake and Conveyance Facilities ............................................................................................. 3-5
3.2.2 Water Treatment Plant ............................................................................................................... 3-8
3.2.3 Water Transmission Facilities ................................................................................................. 3-15
3.2.4 Water Distribution Facilities ................................................................................................... 3-20
3.3 ON-GOING WATER SUPPLY PROJECT .............................................................................................. 3-37
3.3.1 Water Supply and Sewerage Master Plan ............................................................................... 3-37
3.3.2 New 300 MLD WTP Project (In Lieu of Existing Stage I and II WTPs) ............................... 3-39
3.3.3 On-going UFW Project ........................................................................................................... 3-40
3.4 EXISTING SCADA SYSTEM ............................................................................................................ 3-47
3.4.1 General .................................................................................................................................... 3-47
3.4.2 Water Treatment and Distribution Network Monitoring ......................................................... 3-48
3.4.3 Centralized SCADA Center at Shimsha Bhavan .................................................................... 3-51
3.4.4 Sewerage SCADA System ...................................................................................................... 3-56
CHAPTER 4 EXISTING SEWERAGE FACILITIES AND ON-GOING/ PLANNED SEWERAGE
PROJECTS ..................................................................................................................... 4-1
4.1 PRESENT SEWERAGE SERVICES ........................................................................................................ 4-1
4.1.1 Sewerage Services by District ................................................................................................... 4-1
4.2 SEWER SYSTEM ................................................................................................................................ 4-5
4.2.1 Core Area .................................................................................................................................. 4-5
4.2.2 ULB Area .................................................................................................................................. 4-6
4.3 INTERMEDIATE SEWAGE PUMP STATIONS (ISPS) ............................................................................. 4-6
4.3.1 Summary of Existing ISPSs ...................................................................................................... 4-6
4.3.2 Present Situation of Agaram 65 MLD ISPSs ............................................................................ 4-7
4.4 SEWAGE TREATMENT FACILITIES (INCLUDING ON-SITE SEWAGE TREATMENT FACILITIES) .............. 4-8
4.4.1 Overview of Existing STPs in Core and ULB Area .................................................................. 4-8
4.5 REUSE OF TREATED SEWAGE FROM BWSSB STPS ........................................................................ 4-10
4.5.1 Utilization ratio of Existing STPs in Core and ULB Areas .................................................... 4-11
4.5.2 Effluent Quality of Existing STPs in Core and ULB Areas .................................................... 4-12
4.5.3 New Effluent Standards .......................................................................................................... 4-14
4.5.4 Present Situation of Existing STPs in Core and ULB Areas ................................................... 4-14
4.5.5 Present Situation in 110 Villages ............................................................................................ 4-19
4.5.6 Tertiary Treated Sewage Utilization ........................................................................................ 4-19
Bengaluru Water Supply and Sewerage Project (Phase 3)
Final Report
NJS Consultants Co., Ltd iii
4.6 TARIFF FOR WATER SUPPLY AND SEWERAGE SERVICES, AND COST RECOVERY ............................ 4-21
4.6.1 Present Practice for Water and Sewerage Tariff ...................................................................... 4-21
4.7 ON-GOING SEWERAGE PROJECT ..................................................................................................... 4-21
4.7.1 Water Supply and Sewerage Master Plan ............................................................................... 4-21
4.7.2 On-going Sewerage Construction Work ................................................................................. 4-23
4.8 RE-USE OF EFFLUENT AFTER SEWAGE TREATMENT ....................................................................... 4-26
4.8.1 Needs Survey .......................................................................................................................... 4-26
4.8.2 Management Methods ............................................................................................................. 4-26
4.8.3 Practical Re-use of the Effluent .............................................................................................. 4-27
CHAPTER 5 WATER DEMAND PROJECTION FOR THE THREE AREAS BY TARGET YEAR
.......................................................................................................................................... 5-1
5.1 POPULATION PROJECTION BY AREA ................................................................................................. 5-1
5.1.1 Manner of Population Projection .............................................................................................. 5-1
5.1.2 Decade Population Records in Bengaluru City ......................................................................... 5-1
5.1.3 Population Growth in the Past Decade ..................................................................................... 5-2
5.1.4 Existing Population Projections for Bengaluru City ................................................................. 5-3
5.1.5 Projection of Population in the BBMP for the Water Balance Study ........................................ 5-7
5.2 WATER USE BY DIFFERENT TYPES OF USERS ................................................................................. 5-11
5.3 UNIT WATER CONSUMPTION RATE ................................................................................................. 5-12
5.3.1 Present Unit Water Consumption Rate.................................................................................... 5-12
5.3.2 Domestic Water ....................................................................................................................... 5-13
5.3.3 Non-Domestic Water ............................................................................................................... 5-13
5.4 PROJECTION OF UFW PERCENTAGES BY TARGET YEAR BY AREA ................................................. 5-14
5.4.1 Core and ULB Areas ............................................................................................................... 5-14
5.4.2 110 Villages Area .................................................................................................................... 5-16
5.5 GROUNDWATER USER AND WATER CONSUMPTION ........................................................................ 5-16
5.6 WATER DEMAND PROJECTION BY AREA......................................................................................... 5-16
5.6.1 Water Demand Projection ....................................................................................................... 5-16
CHAPTER 6 PROJECTION OF POTENTIAL WATER SUPPLY AMOUNT BY TYPE OF WATER
SOURCE AND DISTRIBUTION TO THE 3 AREAS BY TARGET YEAR ............ 6-1
6.1 WATER SOURCES AVAILABLE AS OF JUNE, 2016 ............................................................................... 6-1
6.2 WATER ALLOCATION OF CAUVERY FOR BWSSB ............................................................................. 6-1
6.2.1 Cauvery Basin Outline .............................................................................................................. 6-1
6.2.2 Karnataka Allocation ................................................................................................................ 6-1
6.2.3 Flow Control in Karnataka Policy ............................................................................................ 6-2
6.2.4 BWSSB Allocation for CWSS Stage I to Stage IV................................................................... 6-3
Bengaluru Water Supply and Sewerage Project (Phase 3)
Final Report
NJS Consultants Co., Ltd iv
6.2.5 CWSS Stage V .......................................................................................................................... 6-4
6.2.6 Present Flow Condition ............................................................................................................. 6-5
6.3 PLANNED AND POTENTIAL WATER SOURCES WITH AMOUNT .......................................................... 6-9
6.3.1 Surface Water ............................................................................................................................ 6-9
6.3.2 Groundwater ........................................................................................................................... 6-11
6.3.3 Re-use of Treated Sewage ....................................................................................................... 6-12
6.3.4 Rainwater Use ......................................................................................................................... 6-15
6.3.5 Saving by the Reduction of UFW ........................................................................................... 6-15
6.4 WATER DISTRIBUTION TO THREE AREAS CONSIDERING WATER DEMAND AND PRESENT ISSUES . 6-16
6.4.1 Assumptions/ Conditions for Water Balance Study ................................................................ 6-16
6.4.2 Population to be Served by the BWSSB Water Supply .......................................................... 6-16
6.4.3 Water Demand and Supply ...................................................................................................... 6-17
6.4.4 Water Balance Study ............................................................................................................... 6-17
CHAPTER 7 PRESENT SEWAGE VOLUME IN THE THREE AREAS AND PROJECTION OF
SEWAGE GENERATION VOLUME FOR THE PROJECT AREA ........................ 7-1
7.1 PRESENT AND PLANNED SEWAGE GENERATION VOLUME BY AREA ................................................ 7-1
7.1.1 Per Capita Sewage Generation Volume .................................................................................... 7-1
7.1.2 Sewage Generation in Core Area .............................................................................................. 7-1
7.1.3 Sewage Generation in ULB Area .............................................................................................. 7-2
7.1.4 Sewage Generation in 110 Villages Area .................................................................................. 7-3
7.1.5 Overall Sewage Generation Volume ......................................................................................... 7-3
7.2 COMPARISON BETWEEN PROJECTED SEWAGE VOLUME AND CAPACITY OF SEWERAGE SYSTEMS .. 7-4
7.2.1 Capacity of STPs ....................................................................................................................... 7-4
7.2.2 Reuse of Treated Sewage from BWSSB Tertiary Treatment Plants ......................................... 7-4
7.2.3 STPs under Construction and Proposed by Existing DPR ........................................................ 7-5
7.2.4 Comparison between Sewage Generation Volume and Integrated STP Capacity ..................... 7-6
CHAPTER 8 WATER POLLUTION STATUS IN PUBLIC WATER BODIES ................................ 8-1
8.1 DRAINAGE BASINS IN BBMP ............................................................................................................ 8-1
8.2 ANNUAL AND SEASONAL FLUCTUATIONS IN WATER QUALITY ......................................................... 8-2
8.2.1 Outline of Master Plan for the Improvement of Storm Water Drainage .................................... 8-2
8.2.2 Water Quality in Lakes ............................................................................................................... 8-5
8.2.3 Water Quality in the Existing Drainages .................................................................................... 8-7
8.3 WATER POLLUTION STATUS AND THE NEED OF SEWERAGE SYSTEMS ............................................ 8-13
8.3.1 Existing Sewerage Services ..................................................................................................... 8-13
8.3.2 Analysis on Present Water Pollution and Sewerage Services .................................................. 8-13
Bengaluru Water Supply and Sewerage Project (Phase 3)
Final Report
NJS Consultants Co., Ltd v
CHAPTER 9 PROJECT NEEDS AND IMPLEMENTATION ARRANGEMENTS FOR
PROPOSED PROJECTS .............................................................................................. 9-1
9.1 PROJECT NEEDS AND EXPECTED BENEFITS ...................................................................................... 9-1
9.2 IMPLEMENTATION ARRANGEMENTS FOR PROPOSED PROJECTS ....................................................... 9-2
CHAPTER 10 SCOPE OF WORK FOR JICA SURVEY PROJECTS ............................................ 10-1
10.1 CWSS STAGE V PROJECT ............................................................................................................. 10-1
10.1.1 Planned Water Supply Facilities and Their Respective Design Flow ................................... 10-1
10.1.2 Study on the Configuration of Major Facilities in Bengaluru City with Reference to Water
Distribution to 110 Villages and Core/ULBs ....................................................................... 10-2
10.1.3 Water Intake Facility and Conveyance Line ....................................................................... 10-10
10.1.4 Water Treatment Plant (WTP) ............................................................................................. 10-12
10.1.5 Transmission Pipeline and Pump Station with Water Hammer Countermeasures .............. 10-18
10.1.6 City Trunk Mains and GLRs ............................................................................................... 10-28
10.1.7 SCADA System .................................................................................................................. 10-30
10.1.8 Recommended Scope of Work ............................................................................................ 10-39
10.2 CONSTRUCTION OF MAJOR SEWERAGE FACILITIES FOR 110 VILLAGES .................................... 10-41
10.2.1 Projection of Population for 110 Villages and ULBs by Zone ............................................ 10-41
10.2.2 Projection of Sewage Volume for Target Years for 110 Villages and ULBs by Zone ......... 10-46
10.2.3 Establishment of Sewerage Systems for 110 Villages by Zone Together with Locations of
STPs ................................................................................................................................... 10-51
10.2.4 Plan of Main Sewers ........................................................................................................... 10-77
10.2.5 Sewage Treatment Plant ...................................................................................................... 10-86
10.2.6 ISPS .................................................................................................................................. 10-114
CHAPTER 11 THE PROJECTS TO BE IMPLEMENTED BY INDIAN SIDE ............................. 11-1
11.1 GENERAL ...................................................................................................................................... 11-1
11.2 110 VILLAGES WATER SUPPLY PROJECT AND UFW REDUCTION PROJECT FOR CORE AREA ....... 11-1
11.2.1 Review Results on Original DPR and On-going Project for 110 Villages Water Supply ..... 11-2
11.2.2 Permanent Distribution Facilities for 110 Villages Water Supply ......................................... 11-8
11.2.3 UFW Reduction and Distribution Network Improvement Project ...................................... 11-23
11.3 110 VILLAGES SEWERAGE PROJECT (LATERAL & HOUSE CONNECTIONS) ................................ 11-29
11.4 CONVEYANCE AND TRANSMISSION FACILITIES RELATED TO STAGE V PROJECT ....................... 11-34
11.4.1 Conveyance Pipeline from Valve Chamber to TK Halli WTP ............................................ 11-34
11.4.2 Transmission pipeline to Share water from Stage V to Core and ULB Area in the Medium Term
(Branch Feeding Pipes) .................................................................................................................. 11-36
CAPTER 12 PRELIMINARY DESIGN OF WATER SUPPLY AND SEWERAGE FACILITIES
12.1 CW
12.1.
12.1.
12.1.
12.1.
12.2 110
12.2.
12.2.
CHAPTE
GE13.1
WA13.2
13.2.
13.2.
13.2.
13.2.
13.2.
SE13.3
13.3.
13.3.
13.3.
13.3.
13.3.
13.3.
13.3.
13.3.
CHAPTE
14.1 PR
14.1.
14.1.
14.1.
14.2 EN
14.2.
14.3 LE
14.3.
FOR J
WSS STAGE V
1 Water Trea
2 Transmissi
3 Transmissi
4 City Trunk
0 VILLAGES
1 Main Sew
2 Sewage Tr
ER 13 OPER
FACIL
ENERAL ........
ATER SUPPLY
O&M of th1
O&M Cos2
O&M for 3
O&M Cos4
Organizati5
EWERAGE FAC
General ....1
Sewers .....2
STP and IS3
Monitoring4
Additional5
Water Qua6
O&M Cos7
Organizati8
ER 14 ENVI
ROJECT COMP
1 Stage V W
2 Sewerage
3 Projects to
NVIRONMENT
1 Current St
EGAL AND INS
1 Environme
JICA SURV
V PROJECT ..
atment Plant
ion and Pum
ion Pipeline
k Mains and
SEWERAGE P
ers and Inter
reatment Plan
RATION AN
LITIES ......
....................
Y ..................
he Facilities
st for the Fac
110 Village W
st for the Fac
ional Structu
CILITIES ......
....................
....................
SPS .............
g by SCADA
l Facilities fo
ality Examina
st for Sewera
ional Structu
IRONMENT
PONENTS FOR
Water Supply
Project for 1
o be Impleme
TAL AND SOC
tatus on Envi
STITUTIONAL
ental Clearan
VEY PROJE
....................
(WTP) ........
mping Faciliti
....................
GLRs ..........
PROJECT ......
rmediate Sew
nts (STPs) ...
ND MAINTE
....................
....................
....................
to be Provid
cilities Provid
Water Distrib
cilities Relate
ure for O&M
....................
....................
....................
....................
A System .....
or Effluent R
ation for Infl
age Facilities
ure and Techn
TAL AND SO
R ENVIRONM
Project (JICA
10 Villages .
ented by Loc
CIAL BASELIN
ironment ......
L FRAMEWOR
nce ...............
Bengalu
vi
ECT ............
....................
....................
ies ...............
....................
....................
....................
wage Pumpin
....................
ENANCE O
....................
....................
....................
ded by Stage
ded by Stage
bution and R
ed to Stage V
M of Water Su
....................
....................
....................
....................
....................
Reuse at STPs
flow Sewage
s for the 110
nical Capacit
OCIAL CO
MENTAL AND
A Survey Pr
....................
cal Fund .......
NE IN THE PR
....................
RK FOR ENV
....................
uru Water Sup
....................
....................
....................
....................
....................
....................
....................
ng Stations (I
....................
OF WATER S
....................
....................
....................
V Project ....
e V Project ...
Revenue Coll
V and 110 Vil
upply Faciliti
....................
....................
....................
....................
....................
s ..................
and Effluent
Villages .......
ty Needs for
NSIDERAT
SOCIAL CON
roject) ...........
....................
....................
ROJECT SITES
....................
IRONMENTAL
....................
pply and Sew
N
....................
....................
....................
....................
....................
....................
....................
ISPSs) .........
....................
SUPPLY AN
....................
....................
....................
....................
....................
lection .........
llages Distrib
ies ................
....................
....................
....................
....................
....................
....................
t at STP .......
....................
BWSSB .....
TIONS .........
NSIDERATION
....................
....................
....................
S ..................
....................
L AND SOCIA
....................
werage Projec
F
NJS Consulta
....................
....................
....................
....................
....................
....................
....................
....................
....................
ND SEWER
....................
....................
....................
....................
....................
....................
bution Syste
....................
....................
....................
....................
....................
....................
....................
....................
....................
....................
....................
NS ................
....................
....................
....................
....................
....................
AL CONSIDER
....................
ct (Phase 3)
Final Report
ants Co., Ltd
.......... 12-1
........... 12-1
........... 12-1
......... 12-27
......... 12-37
......... 12-45
........ 12-62
........ 12-62
........ 12-95
RAGE
.......... 13-1
.......... 13-1
.......... 13-1
.......... 13-1
.......... 13-4
.......... 13-5
ms ..... 13-7
.......... 13-7
.......... 13-9
.......... 13-9
.......... 13-9
........ 13-11
........ 13-16
........ 13-17
........ 13-18
........ 13-20
........ 13-21
.......... 14-1
........... 14-1
........... 14-1
........... 14-3
........... 14-5
........... 14-5
........... 14-5
RATIONS14-3
......... 14-37
37
14.3.
14.3.
14.4 PR
14.4.
14.4.
14.5 SC
14.5.
14.5.
14.5.
14.6 TO
14.6.
14.6.
14.7 ES
14.7.
14.7.
14.8 RE
14.8.
14.8.
14.8.
14.9 EN
14.9.
14.9.
14.9.
14.10 L
14.10
14.10
14.10
14.10
14.10
14.10
14.11 E
14.12 S
CHAPTE
CHAPTE
16.1 FIN
2 Relevant C
3 Legislative
ROJECT ALTER
1 Stage V W
2 Sewerage
COPING .........
1 Stage V W
2 Sewerage
3 Projects to
OR FOR ENVI
1 Stage V W
2 Sewerage
STIMATION OF
1 Estimation
2 Summary
ECOMMENDE
1 Stage V W
2 Sewerage
3 Projects to
NVIRONMENT
1 Implement
2 Environme
3 Environme
LAND ACQUIS
0.1 Necessity
0.2 Legal Fra
0.3 Scope of
0.4 Implemen
0.5 Cost and
0.6 Current S
ENVIRONMEN
TAKEHOLDE
ER 15 IMPL
ER 16 FINAN
NANCIAL CA
Clearance / P
e Framework
RNATIVE STU
Water Supply
Project for 1
....................
Water Supply
Project for 1
o be Impleme
IRONMENTAL
Water Supply
Project for 1
F ENVIRONM
n of Potential
of Assessme
ED MITIGATIO
Water Supply
Project for 1
o be Impleme
TAL MONITOR
ting Structur
ental Monito
ental Monito
SITION AND R
y on Land Ac
amework on
f Land Acqui
ntation Struc
Budgeting f
Status / Futur
NTAL CHECKL
ERS’ MEETING
LEMENTAT
NCIAL AND
APABILITY OF
Permissions o
k for Environ
UDY .............
Project ........
10 Villages .
....................
Project ........
10 Villages .
ented Using L
L AND SOCIA
Project ........
10 Villages .
MENTAL AND
l Adverse Im
ent Results at
ON MEASURE
Project ........
10 Villages .
ented by Loc
RING PLAN ..
re on Environ
oring Plan .....
oring Cost ....
RESETTLEME
cquisition an
Land Acquis
sition ...........
cture for Lan
for Land Acq
re Schedule o
LIST .............
G ..................
TION PLAN
D ECONOM
CONCERNED
Con
Bengalu
vii
other than En
nmental and
....................
....................
....................
....................
....................
....................
Local Funds
AL CONSIDER
....................
....................
SOCIAL IMPA
mpacts at IEE
t Scoping an
ES ................
....................
....................
cal Fund .......
....................
nmental Mon
....................
....................
ENT PLAN ....
nd Resettlem
sition ..........
....................
nd Acquisitio
quisition .......
of Land Acq
....................
....................
N AND CON
MIC CONSI
D AGENCIES
nfidenti
uru Water Sup
nvironmental
Social Cons
....................
....................
....................
....................
....................
....................
s ...................
RATIONS AT IE
....................
....................
ACTS ............
E Level .........
nd IEE Exam
....................
....................
....................
....................
....................
nitoring ........
....................
....................
....................
ent ...............
....................
....................
on .................
....................
quisition ........
....................
....................
NSTRUCTIO
IDERATION
....................
ial
pply and Sew
N
l Clearance .
iderations ...
....................
....................
....................
....................
....................
....................
....................
EE LEVEL ....
....................
....................
....................
....................
ination ........
....................
....................
....................
....................
....................
....................
....................
....................
....................
....................
....................
....................
....................
....................
....................
....................
....................
ON COST E
NS ..............
....................
werage Projec
F
NJS Consulta
....................
....................
....................
....................
....................
....................
....................
....................
....................
....................
....................
....................
....................
....................
....................
....................
....................
....................
....................
....................
....................
....................
....................
....................
....................
....................
....................
....................
....................
....................
....................
....................
ESTIMATES
....................
....................
ct (Phase 3)
Final Report
ants Co., Ltd
......... 14-41
......... 14-43
......... 14-48
......... 14-48
......... 14-49
......... 14-50
......... 14-50
......... 14-53
......... 14-55
......... 14-55
......... 14-55
......... 14-57
......... 14-58
......... 14-58
......... 14-66
......... 14-73
......... 14-73
......... 14-76
......... 14-81
......... 14-81
......... 14-81
......... 14-81
......... 14-85
......... 14-87
......... 14-87
......... 14-89
......... 14-90
......... 14-91
......... 14-91
......... 14-92
......... 14-92
....... 14-100
S
.......... 16-1
........... 16-1
Bengaluru Water Supply and Sewerage Project (Phase 3)
Final Report
NJS Consultants Co., Ltd viii
16.1.1 Financial Capability of the BWSSB ...................................................................................... 16-1
16.1.2 Financial Capability of the Government of Karnataka .......................................................... 16-9
16.2 BUDGETARY ARRANGEMENT FOR THE PROJECT ......................................................................... 16-11
16.2.1 General ................................................................................................................................. 16-11
16.2.2 Capital Budget ..................................................................................................................... 16-11
16.2.3 Operation and Maintenance Budget ..................................................................................... 16-12
16.3 PRESENT PRACTICE FOR WATER AND SEWERAGE TARIFF ........................................................... 16-12
16.3.1 Study on Present Water and Sewerage Tariff ....................................................................... 16-13
16.3.2 Bill Collection Method and its Efficiency ........................................................................... 16-16
16.3.3 Issues and Problems and Required Countermeasures .......................................................... 16-18
16.4 STUDY ON WATER AND SEWERAGE TARIFF ................................................................................. 16-21
16.4.1 General ................................................................................................................................. 16-21
16.4.2 Projection of Operation and Maintenance Cost ................................................................... 16-24
16.4.3 Study for the Number of Beneficiaries ................................................................................ 16-26
16.4.4 Calculation of Average Monthly Charge Required per Household in 2034 and
Recommendations on Progressive Charge Systems ....................................................................... 16-28
16.4.5 Willingness to Pay for Water Supply and Sewerage ............................................................ 16-31
16.4.6 Affordability to Pay for Water Supply and Sewerage .......................................................... 16-32
16.5 FINANCIAL ANALYSIS AND CONSIDERATION ON THE PROPOSED PROJECT ................................. 16-33
16.5.1 General ................................................................................................................................. 16-33
16.5.2 Assumption for Financial Analysis ...................................................................................... 16-33
16.5.3 Cash Flow Analysis and FIRR ............................................................................................. 16-34
16.5.4 Financial Sensitivity Analysis .............................................................................................. 16-36
16.6 ECONOMIC ANALYSIS AND CONSIDERATIONS ON THE PROPOSED PROJECT ............................... 16-36
16.6.1 General ................................................................................................................................. 16-36
16.6.2 Assumption for Economic Analysis ..................................................................................... 16-36
16.6.3 Factors for Economic Analysis ............................................................................................ 16-37
16.6.4 Economic Analysis and EIRR .............................................................................................. 16-39
16.6.5 Economic Sensitivity Analysis ............................................................................................. 16-40
16.7 RECOMMENDATIONS ................................................................................................................... 16-41
16.7.1 Operation Deficit on the BWSSB ........................................................................................ 16-41
16.7.2 Debt Servicing ..................................................................................................................... 16-41
16.7.3 Inefficient Budgeting Procedure .......................................................................................... 16-41
16.7.4 Water Tariff Revision ........................................................................................................... 16-41
16.7.5 Investigation of Water Meters .............................................................................................. 16-42
16.7.6 Installation of Water Meters to Poor .................................................................................... 16-42
16.7.7 Billing of Public Taps and Fountains ................................................................................... 16-42
16.7.8 Financial Arrangement with the GoK .................................................................................. 16-42
16.7.9 Financial Arrangement by PPP ............................................................................................ 16-43
Bengaluru Water Supply and Sewerage Project (Phase 3)
Final Report
NJS Consultants Co., Ltd ix
CHAPTER 17 INSTITUTIONAL DEVELOPMENT ........................................................................ 17-1
17.1 PRESENT ORGANIZATIONAL SITUATION OF BWSSB .................................................................... 17-1
17.1.1 Mandate of BWSSB .............................................................................................................. 17-1
17.1.2 Governance ........................................................................................................................... 17-2
17.1.3 Organizational Structure ....................................................................................................... 17-2
17.1.4 Management System ............................................................................................................. 17-8
17.1.5 Human Resource Planning and Training ............................................................................ 17-10
17.1.6 Financial Position of the Board ........................................................................................... 17-11
17.2 APPROACH AND FRAMEWORK FOR INSTITUTIONAL DEVELOPMENT ......................................... 17-12
17.2.1 Justification ......................................................................................................................... 17-12
17.2.2 Objectives of Institutional Development ............................................................................ 17-12
17.2.3 Approach to Organizational and Institutional Development of BWSSB ............................ 17-12
17.2.4 Situation Analysis (AS IS) of BWSSB ............................................................................... 17-13
17.2.5 TO BE State of BWSSB ..................................................................................................... 17-16
17.2.6 Technical Cooperation Needs ............................................................................................. 17-16
17.2.7 Gap Identification and Strategy Development .................................................................... 17-18
17.3 INSTITUTIONAL DEVELOPMENT ................................................................................................. 17-19
17.3.1 Improved Vision and Mission ............................................................................................. 17-19
17.3.2 Self-Sustainable Management by BWSSB ......................................................................... 17-22
17.3.3 Preparation of Long-term and Annual Business Plan ......................................................... 17-24
17.3.4 Asset Management Records/Ledgers .................................................................................. 17-28
17.3.5 Improvement of Information Management System (IMS) ................................................. 17-29
17.3.6 Preparation and Analysis of Financial Statements .............................................................. 17-31
17.3.7 Human Resources Management .......................................................................................... 17-37
17.3.8 HR Action Plan Focused on Training and Capacity Development ..................................... 17-39
17.4 PROJECT MANAGEMENT AND ORGANIZATIONAL RESTRUCTURING ........................................... 17-43
17.4.1 Key Project Stakeholders .................................................................................................... 17-43
17.4.2 Project Management Experience of BWSSB ...................................................................... 17-49
17.4.3 Project Implementation Framework .................................................................................... 17-49
17.4.4 Post Project Organizational Restructuring of BWSSB ....................................................... 17-51
Bengaluru Water Supply and Sewerage Project (Phase 3)
Final Report
NJS Consultants Co., Ltd x
List of Tables
Table 1.3.1 Survey Area and Design Year .......................................................................................... 1-2
Table 1.3.2 Outline of Proposed Work ............................................................................................... 1-2
Table 2.1.1 Monthly Lowest, Highest and Average, and Annual Average Temperatures in Last 41
Years (1976 - 2016) in BBMP.......................................................................................... 2-4
Table 2.1.2 Monthly Rainfall in BBMP from 1963 to 2016 .............................................................. 2-5
Table 2.1.3 Annual Rainfall at Water Source of Cauvery River in the Last 10 Years ........................ 2-7
Table 2.1.4 Past Trend of Rainfall and Precipitation in Bengaluru .................................................... 2-8
Table 2.1.5 Annual Mean Lowest Temperature, Coefficient Variation and Seasonal Mean Lowest
Temperature for 1901 to 2002 in BBMP ........................................................................ 2-9
Table 2.1.6 Annual Mean Highest Temperature, Coefficient Variation and Seasonal Mean Highest
Temperature for 1901 to 2002 in BBMP ........................................................................ 2-9
Table 2.1.7 Projected Change in Annual Ave., Min and Max Temperature in BBMP ..................... 2-10
Table 2.1.8 Projected Change in Annual and Seasonal Rainfall for BBMP .................................... 2-10
Table 2.1.9 Zone Wise Water Supply and Groundwater Withdrawal (as of Year 2013) .................. 2-16
Table 2.1.10 Aquifer System with Characteristics ........................................................................... 2-16
Table 2.1.11 Groundwater Quality Examination Results in Bengaluru Urban District. .................. 2-16
Table 2.1.12 Geographical Distribution in BBMP Area (Bengaluru Urban District) ...................... 2-19
Table 2.2.1 Key Sanitation Issues .................................................................................................... 2-22
Table 2.2.2 Specific Goal ................................................................................................................. 2-23
Table 2.2.3 Indicative Objective Rating Chart for Sanitation in Cities (Draft)................................ 2-24
Table 2.2.4 Ratings and Categorization of Cities as per New NUSP ............................................... 2-25
Table 2.2.5 Provisions on Water Right in Indian Constitution ......................................................... 2-28
Table 2.2.6 Classification of Surface Waters based on Designated Best Use prescribed by Central
Pollution Control Board ............................................................................................... 2-34
Table 2.2.7 Key Indicators of Inland Surface Water Quality under Revised Criteria by CPCB ...... 2-35
Table 2.2.8 Effluent Standards for Different Receiving Water Bodies ............................................ 2-36
Table 2.2.9 National Ambient Air Quality Standards ...................................................................... 2-36
Table 2.2.10 Ambient Noise Standard.............................................................................................. 2-37
Table 2.2.11 Present Number of BWSSB Permanent Staff ............................................................. 2-38
Table 2.2.12 Indian Drinking Water Standard (BIS 10500: 2012) ................................................... 2-40
Table 2.2.13 Effluent Discharge Standards for Sewage Treatment Plant ......................................... 2-42
Table 2.2.14 Direction by Karnataka State regarding Reuse of Treated Sewage ............................. 2-42
Table 2.2.15 List of Activities to Need Installation of STPs for Ensuring Reuse of Treated Water 2-43
Table 2.3.1 Trend of Population in BBMP ....................................................................................... 2-44
Table 2.3.2 Ranking of Per Capita Income in Karnataka State ........................................................ 2-44
Table 2.3.3 Current Status on Housing Condition ........................................................................... 2-45
Table 2.3.4 Population by Religion .................................................................................................. 2-47
Bengaluru Water Supply and Sewerage Project (Phase 3)
Final Report
NJS Consultants Co., Ltd xi
Table 2.3.5 Profile of Slums in BBMP ............................................................................................ 2-47
Table 2.3.6 Implementation Bodies relating to Power Electricity in Karnataka State ..................... 2-49
Table 2.3.7 Source-wise Installed Capacity ..................................................................................... 2-49
Table 2.3.8 Status on Traffic Congestion in Major Roads ............................................................... 2-53
Table 2.4.1 Existing Land Use Pattern in BBMP and its Surrounding Area .................................... 2-55
Table 3.1.1 Design Capacity of Water Supply Facilities by Stage ..................................................... 3-2
Table 3.1.2 Salient Features of BWSSB ............................................................................................ 3-3
Table 3.2.1 Water Source and Capacity of WTP by Stage ................................................................. 3-7
Table 3.2.2 Details of Existing Conveyance Pipelines ...................................................................... 3-7
Table 3.2.3 Details of Existing Water Treatment Plants at TK Halli ................................................. 3-8
Table 3.2.4 Details of DAF .............................................................................................................. 3-11
Table 3.2.5 Details of Filter ............................................................................................................. 3-11
Table 3.2.6 Inflow Rate at WTP (Stage IV Phase 2, 500 MLD) ...................................................... 3-12
Table 3.2.7 Peak Turbidity of Raw Water in 2015 (Stage IV Phase 2) ............................................ 3-12
Table 3.2.8 Seasonal Turbidity of Treated Water Quality at Different Stage WTPs ........................ 3-12
Table 3.2.9 Water Quality Analysis Report (JUN/2016) .................................................................. 3-13
Table 3.2.10 Elevations at Pump Stations ........................................................................................ 3-15
Table 3.2.11 Specification of Air Vessels ......................................................................................... 3-16
Table 3.2.12 Specification of Surge Tanks ....................................................................................... 3-16
Table 3.2.13 Details of Transmission Pump Station by Stage ......................................................... 3-18
Table 3.2.14 Detail of Existing Treated Water Transmission Pipeline ............................................. 3-20
Table 3.2.15 Outline of City Trunk Main Pipe ................................................................................. 3-23
Table 3.2.16 Details of Existing GLRs in BBMP ............................................................................ 3-26
Table 3.2.17 Details of OHTs in BBMP .......................................................................................... 3-29
Table 3.2.18 Breakdown of Existing Distribution Pipe Length by Material .................................... 3-30
Table 3.2.19 Sub-division and Connection ...................................................................................... 3-31
Table 3.2.20 Definition of UFW and NRW in IWA ......................................................................... 3-33
Table 3.2.21 Water Supply and Consumption .................................................................................. 3-33
Table 3.2.22 NRW Estimation by Sub-divisions.............................................................................. 3-34
Table 3.2.23 Leak Source ................................................................................................................. 3-36
Table 3.3.1 Discussion Results with M/P Consultants on Basic Conditions for Planning Purpose . 3-37
Table 3.3.2 Comparison of Water Demand and Supply Balance between JICA Survey and M/P ... 3-39
Table 3.3.3 Outline of Contracts for UFW Reduction and Distribution Improvement .................... 3-41
Table 3.3.4 Outline of Work Volume for UFW Reduction and Distribution Improvement ............. 3-43
Table 3.3.5 UFW Performance Level on Completed DMAs ........................................................... 3-46
Table 3.3.6 UFW Performance Level on Completed DMAs ........................................................... 3-46
Table 4.1.1 Sanitation /Sewerage Services ........................................................................................ 4-1
Table 4.1.2 Number and Percentage of Households by Type of Drainage Connectivity for Sewage
Outlet .............................................................................................................................. 4-2
Table 4.1.3 Number and Percentage of Households by Type of Toilet Facility ................................. 4-4
Bengaluru Water Supply and Sewerage Project (Phase 3)
Final Report
NJS Consultants Co., Ltd xii
Table 4.2.1 Sewerage Service Area in the Core Area......................................................................... 4-5
Table 4.2.2 Sewer Length by Diameter in the Core Area .................................................................. 4-5
Table 4.3.1 Existing ISPSs ................................................................................................................. 4-7
Table 4.4.1 Information on Existing Sewage Treatment Plants ......................................................... 4-9
Table 4.4.2 Capacity of Private STPs ................................................................................................ 4-9
Table 4.5.1 Present Reuse of Treated Sewage in Bengaluru ............................................................ 4-11
Table 4.5.2 Utilization Ratio of Existing Sewage Treatment Plants ................................................ 4-11
Table 4.5.3 Effluent Water Quality (BOD, COD, TSS) at Existing STPs ........................................ 4-12
Table 4.5.4 Nitrogen in the Effluent at Existing STPs ..................................................................... 4-13
Table 4.5.5 Comparison of Existing and New Effluent Standards at STPs ..................................... 4-14
Table 4.5.6 Major Facilities at K &C Valley 218 MLD STP ........................................................... 4-15
Table 4.5.7 Major Facilities at Mailasandra 75 MLD STP .............................................................. 4-18
Table 4.5.8 Tertiary Treatment Plants .............................................................................................. 4-19
Table 4.5.9 Tertiary Treated Water Utilization ................................................................................. 4-19
Table 4.7.1 Sewage Generation Rate Comparison between JICA Survey and Master Plan ............ 4-22
Table 4.7.2 Inflow Sewage Quality .................................................................................................. 4-22
Table 4.7.3 Treated Sewage Quality ................................................................................................ 4-22
Table 4.7.4 On-going ISPSs ............................................................................................................. 4-23
Table 4.7.5 On-going STPs in Bengaluru ........................................................................................ 4-24
Table 4.8.1 Comparison Methods for the Management of Effluent Re-use from STPs .................. 4-26
Table 5.1.1 Census Population in BBMP ........................................................................................... 5-1
Table 5.1.2 Population Growth Rate (%) in Major Cities in India: 1981-2011 ................................. 5-2
Table 5.1.3 Population Growth Rate (%) in Major Urban Agglomeration in India: 1981-2011 ........ 5-3
Table 5.1.4 Authorities/ Information Sources on Existing Population Projection ............................. 5-3
Table 5.1.5 Existing Population Projection by Different Authorities/ Information Sources .............. 5-5
Table 5.1.6 Population density by Different Authority/ Information Source ..................................... 5-5
Table 5.1.7 Basic Information on Subject Areas for Population Projection....................................... 5-7
Table 5.1.8 Revised Population for Hemigepura and Sompura in R.R. Nagar .................................. 5-8
Table 5.1.9 Revised Population Projections in 110 Villages Area ..................................................... 5-8
Table 5.1.10 Population Projection (High growth) ............................................................................ 5-9
Table 5.1.11 Population Projection (medium growth) ....................................................................... 5-9
Table 5.1.12 Population Projection (low growth) .............................................................................. 5-9
Table 5.1.13 Population Projection (high growth) ........................................................................... 5-10
Table 5.1.14 Population Projection (medium growth) ..................................................................... 5-10
Table 5.1.15 Population Projection (low growth) ............................................................................ 5-10
Table 5.1.16 Net Population Density by Catalyst by Projected Year ............................................... 5-11
Table 5.2.1 Breakdown of Water Connection and Consumption by Use ......................................... 5-11
Table 5.3.1 Unit Water Consumption Rate at Present (Water Source: Surface and Groundwater) .. 5-12
Table 5.3.2 Recommended per capita Water Supply Levels as per CPHEEO Manual .................... 5-13
Table 5.3.3 Category-wise Water Consumption ............................................................................... 5-13
Bengaluru Water Supply and Sewerage Project (Phase 3)
Final Report
NJS Consultants Co., Ltd xiii
Table 5.4.1 Area-wise Consumption Record in 2015 ...................................................................... 5-14
Table 5.4.2 Average UFW Reduction Performed by on-going Project ............................................ 5-14
Table 5.4.3 Proposed UFW Ratio by Area ....................................................................................... 5-16
Table 5.5.1 Water Consumer and Water Loss .................................................................................. 5-16
Table 5.6.1 Water Demand by Study Area in BBMP for Target Year (1) ......................................... 5-17
Table 5.6.2 Water Demand by Study Area in BBMP for Target Year (2) ......................................... 5-17
Table 5.6.3 Water Demand by Study Area in BBMP for Target Year (3) ......................................... 5-18
Table 5.6.4 Water Demand by Study Area in BBMP for Target Year (4) ......................................... 5-19
Table 6.2.1 Water Allocation for Concerned States ........................................................................... 6-1
Table 6.2.2 Reserved Flow of Cauvery .............................................................................................. 6-2
Table 6.2.3 Organization of Water Resources Department of Karnataka .......................................... 6-3
Table 6.2.4 Allocation for CWSS Stage I to IV ................................................................................. 6-4
Table 6.2.5 Cauvery Flow from 1972 to 2016 at Kollegal ................................................................. 6-6
Table 6.2.6 Capacity of Dams Upstream of Water Intake .................................................................. 6-9
Table 6.3.1 Outline of Expert Committee ........................................................................................ 6-10
Table 6.3.2 Existing Secondary Sewage Treatment Plants in BBMP .............................................. 6-13
Table 6.3.3 Outline of Existing Tertiary Treatment Plants (1) ......................................................... 6-13
Table 6.3.4 Outline of existing Tertiary Treatment Plants (2) .......................................................... 6-14
Table 6.3.5 Planned UFW % by Subject Year for Core & ULB and 110 Villages Area .................. 6-16
Table 6.4.1 Water Demand and Supply at Present and Target Years ................................................ 6-17
Table 6.4.2 Comparison on Water Balance between those by BWSSB and JICA Survey Result ... 6-19
Table 6.4.3 Demand and Supply of CWSS and Allocation to Three Areas ..................................... 6-20
Table 7.1.1 Projected Population for Core Area ................................................................................ 7-1
Table 7.1.2 Sewage Generation Volume in Core Area ....................................................................... 7-1
Table 7.1.3 Population projections for ULB Areas ............................................................................ 7-2
Table 7.1.4 Sewage Generation in ULBs ........................................................................................... 7-2
Table 7.1.5 Projected Population for Five Zones by Target Year ....................................................... 7-3
Table 7.1.6 Sewage Generation in 110 Villages ................................................................................. 7-3
Table 7.1.7 Sewage Generation in Bengaluru in the Planning Years ................................................. 7-4
Table 7.2.1 Existing STPs in Bengaluru (up to secondary treatment) ............................................... 7-4
Table 7.2.2 Current Reuse of Treated Sewage in Bengaluru ............................................................. 7-5
Table 7.2.3 Under Construction and Proposed STPs in Bengaluru ................................................... 7-5
Table 7.2.4 Sewage Generation in Bengaluru in the Planning Years ................................................. 7-7
Table 8.2.1 Cost required for Improvement of SWD in 2010 ............................................................. 8-4
Table 8.2.2 Water Examination Results at 21 Points at Existing Drainages ....................................... 8-9
Table 8.3.1 Present Served Population by Concerned ULB ............................................................. 8-13
Table 8.3.2 Generated Sewage Volume at Present and Overall Treatment Capacity of the Existing
STPs in Core and ULB Area ........................................................................................... 8-14
Table 9.2.1 Sorted Reasons for Project Implementation .................................................................... 9-4
Table 10.1.1 Water Demand and Water Balance by Target Year for 110 Villages ........................... 10-1
Bengaluru Water Supply and Sewerage Project (Phase 3)
Final Report
NJS Consultants Co., Ltd xiv
Table 10.1.2 Design Criteria and Flow for Major Facilities for Stage V Project ............................. 10-2
Table 10.1.3 Comparison of Water Demand between the Two Plans by Existing and Proposed GLRs
................................................................................................................................................. 10-3
Table 10.1.4 Population and Water Demand for Each GLRs ........................................................... 10-6
Table 10.1.5 On-going and Existing Conveyance Pipelines (Excluding JICA Survey Project Scope)
............................................................................................................................................... 10-12
Table 10.1.6 Raw Water Quality Criteria ....................................................................................... 10-14
Table 10.1.7 Guidelines for Drinking Water in CPHEEO ............................................................. 10-15
Table 10.1.8 Treated Water Quality Criteria .................................................................................. 10-16
Table 10.1.9 C Value of Hazen Williams Formula ......................................................................... 10-18
Table 10.1.10 Length of Transmission Pipeline ............................................................................. 10-20
Table 10.1.11 Design flow and pipe length for Pumping Station Design ...................................... 10-20
Table 10.1.12 Capacity of Clear Water Reservoir and Planned Water Level ................................. 10-20
Table 10.1.13 Comparison of Total Head of CW Pumps ............................................................... 10-21
Table 10.1.14 Comparison of Unit Cost of Transmission Pumps .................................................. 10-22
Table 10.1.15 Electrical Power Consumption Cost of CW Pumps ................................................ 10-22
Table 10.1.16 Surge Protection of the PSs (DPR) .......................................................................... 10-23
Table 10.1.17 Water Hammer Countermeasures ............................................................................ 10-24
Table 10.1.18 Proposed Surge Protection (revised from the DPR) ................................................ 10-28
Table 10.1.19 Specifications City Trunk Main Pipes ..................................................................... 10-28
Table 10.1.20 Proposed Reservoir Capacities ................................................................................ 10-29
Table 10.1.21 Typical Data from Water Treatment Plants at TK Halli .......................................... 10-31
Table 10.1.22 Typical Data Collection from PSs (TK Halli, Tataguni, and Harohalli) ................. 10-32
Table 10.1.23 Typical Data from GLR & OHT ............................................................................. 10-32
Table 10.1.24 Typical Data from Sewage Treatment Plants .......................................................... 10-33
Table 10.1.25 Summary of Communication Networks .................................................................. 10-33
Table 10.1.26 Recommended Scope of Work for Water Supply Facilities (Stage V) .................... 10-39
Table 10.2.1 Projection of Population for 110 Villages and ULBs by Zone .................................. 10-41
Table 10.2.2 Population Projection for Bytrayanapura Zone ......................................................... 10-42
Table 10.2.3 Population Projection for Mahadevpura Zone .......................................................... 10-43
Table 10.2.4 Population Projection for Bommanahalli Zone ......................................................... 10-44
Table 10.2.5 Population Projection for R.R. Nagar Zone .............................................................. 10-45
Table 10.2.6 Population Projection for Dasarahalli Zone .............................................................. 10-46
Table 10.2.7 Projection of Sewage Volume for Target Years by Zone ........................................... 10-46
Table 10.2.8 Projection of Sewage Volume for Bytrayanapura Zone ............................................ 10-47
Table 10.2.9 Projection of Sewage Volume for Mahadevpura Zone .............................................. 10-48
Table 10.2.10 Projection of Sewage Volume for Bommanahalli Zone .......................................... 10-49
Table 10.2.11 Projection of Sewage Volume for R.R. Nagar Zone ................................................ 10-50
Table 10.2.12 Projection of Sewage Volume for Dasarahalli Zone ............................................... 10-50
Table 10.2.13 Existing/On-going/Proposed STPs by Zone in the Project Area ............................. 10-51
Bengaluru Water Supply and Sewerage Project (Phase 3)
Final Report
NJS Consultants Co., Ltd xv
Table 10.2.14 List of Proposed Sewerage Systems ......................................................................... 10-71
Table 10.2.15 Projected Average Sewage Flow for Planned STPs by Target Year ......................... 10-74
Table 10.2.16 Projected Sewage Flow for ISPSs by Target Year .................................................... 10-75
Table 10.2.17 Connection of Main Sewers and Population by Target Year by Village: Bytrayanapura
Zone (Sample Table) .............................................................................................. 10-76
Table 10.2.18 Peak Factor to be Adopted for Calculation of Sewage Flow.................................... 10-77
Table 10.2.19 Main Sewer Length by Diameter for the Five (5) Zones ......................................... 10-79
Table 10.2.20 Main Sewer Length in Bytrayanapura Zone ............................................................ 10-81
Table 10.2.21 Main Sewer Length in Mahadevpura Zone .............................................................. 10-82
Table 10.2.22 Main Sewer Length in Bommanahalli Zone ............................................................ 10-83
Table 10.2.23 Main Sewer Length of R.R. Nagar Zone ................................................................. 10-84
Table 10.2.24 Main Sewer Length of Dasarahalli Zone ................................................................. 10-85
Table 10.2.25 Required Conditions for Design of STPs ................................................................. 10-86
Table 10.2.26 Comparative Study Results on Design Inflow Sewage Quality ............................... 10-91
Table 10.2.27 Target Effluent Quality (Recommended by CPHEEO) ............................................ 10-91
Table 10.2.28 History of Effluent Standards from STP in India ..................................................... 10-92
Table 10.2.29 Summary of Treatment Process Applied in BWSSB ............................................... 10-92
Table 10.2.30 Secondary Sewage Treatment Experience in Japan ................................................. 10-95
Table 10.2.31 STPs in Japan Achieved the Effluent Quality Standards of India (2013) ................ 10-96
Table 10.2.32 Evaluation of Sewage Treatment Processes ........................................................... 10-101
Table 10.2.33 Assumptions for Comparison of Biological Treatment Processes ......................... 10-103
Table 10.2.34 Comparison of Biological Treatment ..................................................................... 10-103
Table 10.2.35 Comparison of Disinfection Methods .................................................................... 10-104
Table 10.2.36 Sludge Generation at Existing STPs ...................................................................... 10-105
Table 10.2.37 Comparison of Sludge Thickening Equipment ...................................................... 10-107
Table 10.2.38 Comparison of Dewatering Equipment .................................................................. 10-111
Table 10.2.39 Treatment Method for Planned STPs ..................................................................... 10-113
Table 10.2.40 Design Sewage Flow for Planned ISPSs ................................................................ 10-114
Table 10.2.41 Peak Factor for Contributory population ............................................................... 10-114
Table 10.2.42 Land Area for Existing/On-going ISPSs ................................................................ 10-117
Table 10.2.43 Land Area for Planned ISPSs ................................................................................. 10-117
Table 11.2.4 Design Criteria for Distribution Facilities .................................................................... 11-8
Table 11.2.5 Scope of Work for Distribution Facilities in 110 Villages ............................................ 11-9
Table 11.2.6 Length of Feeder Main by Diameter and GLR Service Area (1/2) ............................ 11-10
Table 11.2.7 Length of Feeder Main by Diameter and GLR Service Area (2/2) ............................ 11-10
Table 11.2.8 OHTs’ Specifications under Chokkanahalli GLR ...................................................... 11-16
Table 11.2.9 OHTs’ Specifications under GKVK GLR .................................................................. 11-17
Table 11.2.10 OHTs’ Specifications under Vasudevapura GLR ..................................................... 11-17
Table 11.2.11 OHTs’ Specifications under Doddakannahalli GLR ................................................. 11-18
Table 11.2.12 OHTs’ Specifications under Gottigere GLR ............................................................. 11-19
Bengaluru Water Supply and Sewerage Project (Phase 3)
Final Report
NJS Consultants Co., Ltd xvi
Table 11.2.13 OHTs’ Specifications under Hegganahalli-2 GLR ................................................... 11-20
Table 11.2.14 OHTs’ Specifications under Lingaderanahalli GLR ................................................. 11-20
Table 11.2.15 OHTs’ Specifications under Singapura GLR ............................................................ 11-21
Table 11.2.16 OHTs’ Specifications under Kadugodi GLR ............................................................ 11-21
Table 11.2.17 OHTs’ Specifications under OMBR GLR ................................................................ 11-22
Table 11.2.18 OHTs’ Specifications under BSK 6th GLR .............................................................. 11-23
Table 11.2.22 Existing Pipe Details and Proposed Replacement .................................................... 11-25
Table 11.3.1 Scope of Work for Lateral Sewers .............................................................................. 11-29
Table 11.3.2 Nos. of Households .................................................................................................... 11-29
Table 11.4.1 Length of River Crossing ........................................................................................... 11-34
Table 11.4.2 Water Balance in Core and ULB Areas ...................................................................... 11-36
Table 11.4.3 Present Pump Unites Installed for Stage I to III and Planned Pump Units for Water 11-38
Table 11.4.4 Existing GLRs by Stage for Augmentation of Water Supply to Core Area ................ 11-39
Table 11.4.5 Scope of Work to Share Water of Stage V to Core/ULBs .......................................... 11-40
Table 11.4.6 Existing GLRs to be Used by Stage with Related Information .................................. 11-40
Table 12.1.1 Monthly Average Turbidity of Raw Water ................................................................... 12-1
Table 12.1.2 Velocity in the Conveyance Pipe .................................................................................. 12-5
Table 12.1.3 Velocity of Parallel Series of Pipe ................................................................................ 12-6
Table 12.1.4 Dimension and Measurable Range ............................................................................... 12-7
Table 12.1.5 Sedimentation Method Selection ................................................................................. 12-9
Table 12.1.6 Comparison of Rapid Sand Filter Criteria .................................................................. 12-10
Table 12.1.7 Comparison of Chemicals .......................................................................................... 12-11
Table 12.1.8 Present Alum Dosing Rate at TK Halli WTP (Stage IV Ph. 2) in 2015 ..................... 12-13
Table 12.1.9 Design Alum Dosing Rate .......................................................................................... 12-13
Table 12.1.10 Present Chlorine Dosing Rate at TK Halli WTP (StageIV Ph.2) in 2015 ................ 12-14
Table 12.1.11 Design Chlorine Dosing Rate ................................................................................... 12-14
Table 12.1.12 Design Flow for each Sludge Treatment Facilities .................................................. 12-16
Table 12.1.13 Dimension of Major Facilities .................................................................................. 12-22
Table 12.1.14 Specifications of Major Facilities ............................................................................ 12-23
Table 12.1.15 Specifications for Major Equipment at TK Halli ..................................................... 12-31
Table 12.1.16 Specifications for Major Equipment at Harohalli .................................................... 12-32
Table 12.1.17 Specifications for Major Equipment at Tataguni ...................................................... 12-34
Table 12.1.18 Length of Connection Pipe and Branch Pipe ........................................................... 12-35
Table 12.1.19 Specifications of Surge Tank at JK Doddi ............................................................... 12-37
Table 12.1.20 Design Considerations and Criteria in the DPR ....................................................... 12-38
Table 12.1.21 Details of Clear Water Transmission Pipelines ........................................................ 12-40
Table 12.1.22 Major River Crossings in Stages I, II, III, IV (Pha 1 & Pha 2) and V Pipeline ........ 12-44
Table 12.1.23 Summary of City Trunk Main .................................................................................. 12-45
Table 12.1.24 Trenchless Crossing Locations at City Trunk Main Eastern Route .......................... 12-48
Table 12.1.25 Trenchless Crossing Locations at City Trunk Main Western Route ......................... 12-49
Bengaluru Water Supply and Sewerage Project (Phase 3)
Final Report
NJS Consultants Co., Ltd xvii
Table 12.1.26 Summary of GLR Structure and Detention Time ..................................................... 12-51
Table 12.1.27 Summary of Disinfection Facility of GLR ............................................................... 12-51
Table 12.1.28 Information of Existing GLRs to be Connected ....................................................... 12-60
Table 12.2.1 Design Fundamentals for Sewer Systems and ISPSs ................................................ 12-62
Table 12.2.2 Summary of Main Sewer........................................................................................... 12-70
Table 12.2.3 Summary of Main Sewer in Bytrayanapura Zone ..................................................... 12-70
Table 12.2.4 Summary of Main Sewer in Mahadevpura Zone ...................................................... 12-71
Table 12.2.5 Summary of Main Sewer in Bommanahalli Zone ..................................................... 12-71
Table 12.2.6 Summary of Main Sewer in R.R. Nagar Zone .......................................................... 12-72
Table 12.2.7 Summary of Main Sewer in Dasarahalli Zone .......................................................... 12-72
Table 12.2.8 Design Flow for ISPSs .............................................................................................. 12-73
Table 12.2.9 Diameter and Velocity of Proposed Pressure Main ................................................... 12-73
Table 12.2.10 Major Equipment List for Belahalli ISPS ............................................................... 12-76
Table 12.2.11 Major Equipment List for Hagadur ISPS ................................................................ 12-79
Table 12.2.12 Major Equipment List for Naganathapura ISPS ...................................................... 12-82
Table 12.2.13 Major Equipment List for Arehalli ISPS ................................................................. 12-85
Table 12.2.14 Major Equipment List for Hemigepura ISPS .......................................................... 12-88
Table 12.2.15 Major Equipment List for Herohalli ISPS ............................................................... 12-91
Table 12.2.16 Major Equipment List for Doddabidarakallu ISPS ................................................. 12-94
Table 12.2.17 Design Flow of Proposed STPs ............................................................................... 12-95
Table 12.2.18 Soil Conditions and Required Measures for the Construction of STPs .................. 12-95
Table 12.2.19 Design Conditions for STPs .................................................................................... 12-96
Table 12.2.20 Specifications for Major Equipment (Jakkur STP) ............................................... 12-103
Table 12.2.21 Specifications for Major Equipment (Yelahankakere STP) .................................. 12-108
Table 12.2.22 Specifications for Major Equipment (Doddabettahalli STP) ................................ 12-113
Table 12.2.23 Specifications for Major Equipment (Bilishivalli STP) ........................................ 12-118
Table 12.2.24 Specifications for Major Equipment (Varthur STP) .............................................. 12-123
Table 12.2.25 Specifications for Major Equipment (Pillaganahalli STP) .................................... 12-128
Table 12.2.26 Specifications for Major Equipment (Talaghattapura STP) .................................. 12-133
Table 12.2.27 Specifications for Major Equipment (Somapura STP) .......................................... 12-138
Table 12.2.28 Specifications for Major Equipment (Hemigepura STP) ...................................... 12-143
Table 12.2.29 Specifications for Major Equipment (Nagasandra STP) ....................................... 12-148
Table 12.2.30 Specifications for Major Equipment (Kariovobanahalli STP) .............................. 12-153
Table 12.2.31 Specifications for Major Equipment (Herohalli STP) ........................................... 12-158
Table 12.2.32 Specifications for Major Equipment (Hosahalli STP) .......................................... 12-163
Table 12.2.33 Specifications for Major Equipment (Chikkabanavara-2 STP) ............................. 12-168
Table 13.2.1 Number of O&M Staff at the WTP ............................................................................. 13-4
Table 13.2.2 Number of O&M Staff at a Pump Station ................................................................... 13-4
Table 13.2.3 Number of O&M Staff for a GLR ............................................................................... 13-5
Table 13.2.4 Number of O&M Staff for City Trunk Main ............................................................... 13-5
Bengaluru Water Supply and Sewerage Project (Phase 3)
Final Report
NJS Consultants Co., Ltd xviii
Table 13.2.5 O&M Cost for the Facilities Related to Stage V and 110 Villages Distribution Systems
................................................................................................................................................. 13-7
Table 13.3.1 Recommended Contractor’s Obligations for O&M of ISPS and STP ...................... 13-12
Table 13.3.2 Minimum Staff and Qualifications Requirements for STP during O&M Period ...... 13-15
Table 13.3.3 Minimum Staff and Qualification Requirements for ISPS during O&M Period ...... 13-16
Table 13.3.4 Water Quality Permissible Limit for Construction Use............................................. 13-17
Table 13.3.5 Demand Assessment for Tertiary Treated Sewage .................................................... 13-18
Table 13.3.6 Recommended Sampling/Analysis Locations and Frequencies ................................ 13-18
Table 13.3.7 Estimated O&M Cost ................................................................................................ 13-21
Table 14.1.1 Components of Stage V Water Supply Project ............................................................ 14-1
Table 14.1.2 Project Components of Sewerage Project for 110 Villages .......................................... 14-3
Table 14.2.1 Meteorological Trend of Bengaluru City (2006 to 2015) ............................................. 14-5
Table 14.2.2 List of Monitoring Stations for Water Quality of Cauvery River ................................. 14-8
Table 14.2.3 Monitoring Results of Water Quality at Kollegal Station ............................................ 14-9
Table 14.2.4 List of Wells for Monitoring Groundwater Quality.................................................... 14-10
Table 14.2.5 Results of Water Quality Examination of Groundwater in BBMP ............................ 14-11
Table 14.2.6 List of Lakes for Monitoring in BBMP ...................................................................... 14-12
Table 14.2.7 Results of Water Quality of Lakes in BBMP Area ..................................................... 14-13
Table 14.2.8 Classification of Water by Type of Water Use ........................................................... 14-14
Table 14.2.9 Major Cause of Water Pollution of Lakes .................................................................. 14-14
Table 14.2.10 List of Monitoring Stations for Air Quality Examination ........................................ 14-15
Table 14.2.11 Results of Monitoring of Air Quality in BBMP Area (Measured in 2015) .............. 14-17
Table 14.2.12 List of Monitoring Stations for Ambient Noise........................................................ 14-18
Table 14.2.13 Results of Noise Level Monitoring Stations in BBMP Area for the year 2015-16 .. 14-19
Table 14.2.14 Summary of Samples Surveyed in Social Condition Survey ................................... 14-22
Table 14.2.15 Number of Floors in Households Surveyed ............................................................. 14-23
Table 14.2.16 Source of Water Supply ............................................................................................ 14-23
Table 14.2.17 Monthly Water Consumption and Expenditure ........................................................ 14-24
Table 14.2.18 Overall Satisfaction toward BWSSB’s Service ........................................................ 14-24
Table 14.2.19 Irregularity of Water Supply ..................................................................................... 14-24
Table 14.2.20 Frequency of Water Supply ...................................................................................... 14-25
Table 14.2.21 Duration of Water Supply ......................................................................................... 14-25
Table 14.2.22 Pressure of Water Supply ......................................................................................... 14-25
Table 14.2.23 Site Situation of Proposed GLR Sites ...................................................................... 14-31
Table 14.2.24 Site Situation of Proposed City Trunk Main ............................................................ 14-32
Table 14.2.25 Site Situation of Proposed STP Sites........................................................................ 14-33
Table 14.2.26 Site Situation of Proposed ISPS Sites ...................................................................... 14-34
Table 14.2.27 Site Situation of Proposed Main Sewers .................................................................. 14-35
Table 14.3.1 Comparison between India EIA System and JICA Guideline .................................... 14-39
Table 14.3.2 Relevant Clearance / Permissions other than Environmental Clearance .................... 14-41
Bengaluru Water Supply and Sewerage Project (Phase 3)
Final Report
NJS Consultants Co., Ltd xix
Table 14.3.3 Laws and Regulations for Environmental and Social Considerations ....................... 14-44
Table 14.3.4 National Ambient Air Quality Standards ................................................................... 14-47
Table 14.3.5 Ambient Noise Standard............................................................................................. 14-47
Table 14.4.1 Selection of Treatment Method .................................................................................. 14-48
Table 14.5.1 Scoping Results for Stage V Water Supply Project .................................................... 14-50
Table 14.5.2 Scoping Results for Sewerage Project for 110 Villages ............................................. 14-53
Table 14.6.1 TOR for Stage V Water Supply Project ...................................................................... 14-56
Table 14.6.2 TOR for Sewerage Projects for 110 Villages ............................................................. 14-57
Table 14.7.1 Potential Adverse Impacts by Stage V Water Supply Project .................................... 14-58
Table 14.7.2 Potential Adverse Impacts by Sewerage Project for 110 Villages .............................. 14-61
Table 14.7.3 Comparison Table of Assessment at Scoping and IEE ............................................... 14-66
Table 14.7.4 Comparison Table of Assessment at Scoping and IEE ............................................... 14-70
Table 14.8.1 Mitigation Measures for Potential Adverse Impacts .................................................. 14-73
Table 14.8.2 Mitigation Measures for Potential Adverse Impacts .................................................. 14-76
Table 14.9.1 Environmental Monitoring Plan ................................................................................. 14-82
Table 14.9.2 Environmental Monitoring Plan ................................................................................. 14-83
Table 14.9.3 Estimated Cost for Environmental Monitoring .......................................................... 14-85
Table 14.9.4 Estimated Cost for Environmental Monitoring .......................................................... 14-86
Table 14.10.1 Land Acquisition Required for the Project ............................................................... 14-88
Table 14.10.2 Tentative Schedule of Land Acquisition................................................................... 14-92
Table 14.11.1 Environmental Checklist for Stage V Water Supply Project .................................... 14-92
Table 14.11.2 Environmental Checklist for Sewerage Project for 110 Villages ............................. 14-96
Table 16.1.1 Income and Expenditure Statement in FY2013-2015 .................................................. 16-2
Table 16.1.2 Expenditure Component Ratio ..................................................................................... 16-3
Table 16.1.3 Balance Sheet of BWSSB in FY2013 - 15 ................................................................... 16-5
Table 16.1.4 BWSSB’s Outstanding Loans as of end March, 2015 .................................................. 16-6
Table 16.1.5 Outstanding Grants and Contributions as of end March, 2015 .................................... 16-7
Table 16.1.6 Budget and Performance in Government of Karnataka in FY2014-15 ........................ 16-9
Table 16.2.1 Total Capital Cost ....................................................................................................... 16-11
Table 16.2.2 Funding Pattern and Amount of Capital Budget ........................................................ 16-11
Table 16.2.3 Price Escalations ........................................................................................................ 16-12
Table 16.3.1 Water Revenue and O&M Costs in the Past ............................................................... 16-12
Table 16.3.2 Tariff for Domestic Water Charges ............................................................................. 16-13
Table 16.3.3 Tariff for Non-Domestic Water Charges .................................................................... 16-15
Table 16.3.4 Tariff for Bulk Water Charges .................................................................................... 16-15
Table 16.3.5 Comparison between Previous Water Tariff and Revised Water Tariff ...................... 16-19
Table 16.3.6 Current Water and Sewerage Tariff per Household per Month .................................. 16-20
Table 16.3.7 Current Percentage of Water and Sewerage Tariff per Household ............................. 16-20
Table 16.4.1 O&M Cost for the Facilities to be Provided by the JICA Survey Project .................. 16-24
Table 16.4.2 O&M Cost in the Entire BBMP after the JICA Project .............................................. 16-25
Bengaluru Water Supply and Sewerage Project (Phase 3)
Final Report
NJS Consultants Co., Ltd xx
Table 16.4.3 Sewerage to be Treated / Assumed Volume to be Treated .......................................... 16-25
Table 16.4.4 Beneficiary in 110 Villages Served by the JICA Survey Project ................................ 16-26
Table 16.4.5 Beneficiary in Core/ULB served by the JICA Survey Project ................................... 16-26
Table 16.4.6 Total Beneficiary in the entire BBMP after the JICA Project .................................... 16-27
Table 16.4.7 Average Monthly HH Charge for Water Supply in 110 Villages ................................ 16-28
Table 16.4.8 Average Monthly HH Charge for Water Supply in Core/ULB ................................... 16-28
Table 16.4.9 Average Monthly HH Charge for Sewerage in 110 Villages ...................................... 16-28
Table 16.4.10 Average Monthly HH Charge for Water Supply in the Entire BBMP ...................... 16-29
Table 16.4.11 Average Monthly HH Charge for Sewerage in the Entire BBMP ............................ 16-29
Table 16.4.12 Percentage of Sewerage to Water for O&M Cost in the Entire BBMP .................... 16-29
Table 16.4.13 Proposed Water Tariff for the Entire BBMP ............................................................ 16-31
Table 16.4.14 Willingness to Pay for Water Supply ........................................................................ 16-32
Table 16.4.15 Willingness to Pay for Sewerage .............................................................................. 16-32
Table 16.4.16 Affordability to Pay for Water and Sewerage Monthly per Household .................... 16-32
Table 16.5.1 Assumptions and Conditions for Financial Analysis .................................................. 16-33
Table 16.5.2 Cash Flow Analysis (FIRR) ....................................................................................... 16-35
Table 16.5.3 Sensitivity Analysis .................................................................................................... 16-36
Table 16.6.1 Assumptions and Conditions for Economic Analysis ................................................ 16-36
Table 16.6.2 Economic Benefit for this project .............................................................................. 16-37
Table 16.6.3 Annual Medical Cost per HH Caused By Waterborne Disease .................................. 16-38
Table 16.6.4 Economic Analysis (EIRR) ........................................................................................ 16-40
Table 16.6.5 Economic Sensitivity Analysis ................................................................................... 16-41
Table 17.1.1 Status of Human Resources of BWSSB (as of 25 Jan 2017) .................................... 17-11
Table 17.2.1 Summary Matrix of Situational Analysis of BWSSB ............................................... 17-14
Table 17.3.1 Strategies for Organizational Development From “AS IS” State to “TO BE” State . 17-21
Table 17.3.2 Required Activities to Achieve the Strategy of Sustainable Business Planning ....... 17-22
Table 17.3.3 Action Plan for Preparation of Long-term and Annual Business Plan ...................... 17-27
Table 17.3.4 Action Plan for Development of Asset Records and Management System (AMS) .. 17-28
Table 17.3.5 Action Plan for Development of Information Management System (IMS) .............. 17-32
Table 17.3.6 Action Plan for Preparation of Financial Statements ................................................ 17-35
Table 17.3.7 Action Plan for HRD ................................................................................................. 17-41
Table 17.3.8 Proposed Brochure for Performance Appraisal in BWSSB ...................................... 17-42
Table 17.4.1 Action Plan for Human Resource Planning ............................................................... 17-45
Table 17.4.2 Roles of Various Project Entities in Project Implementation .................................... 17-49
Bengaluru Water Supply and Sewerage Project (Phase 3)
Final Report
NJS Consultants Co., Ltd xxi
List of Figures
Figure 2.1.1 Locations of Various Areas: Bengaluru Metropolitan Region, Urban District, Rural
District, Taluks, BBMP and Administrative Zones in BBMP (1) ................................ 2-2
Figure 2.1.2 Locations of Various Areas (2) ...................................................................................... 2-3
Figure 2.1.3 Monthly Temperatures in Last 41 Years (1976 - 2016) in BBMP ................................. 2-4
Figure 2.1.4 Annual Rainfall in BBMP from 1963 to 2016 ............................................................... 2-7
Figure 2.1.5 Annual Rainfall at Water Source of Cauvery River in the Last 10 Years ...................... 2-7
Figure 2.1.6 Projected Increase in Drought Incidences in Future (Blue: Decrease, Red: Increase) 2-10
Figure 2.1.7 Map of Cauvery Basin ................................................................................................. 2-12
Figure 2.1.8 Percentage in Precipitation, Evaporation and Runoff in Cauvery Basin ..................... 2-13
Figure 2.1.9 Location of Lake Series in BBMP ............................................................................... 2-13
Figure 2.1.10 Lake Series in BBMP ................................................................................................ 2-14
Figure 2.1.11 Groundwater Monitoring Network in BBMP Area .................................................... 2-15
Figure 2.1.12 Area Vulnerable for Groundwater Contamination by Fluoride ................................. 2-18
Figure 2.1.13 Traditional Soil Group of Karnataka and their Geographic Distribution .................. 2-20
Figure 2.3.1 Grid Map in Karnataka State ....................................................................................... 2-51
Figure 2.3.2 Road Network of BBMP Area ..................................................................................... 2-52
Figure 2.3.3 Administrative Map with Area Size of BBMP ............................................................ 2-54
Figure 2.4.1 Existing Land Use Pattern in BBMP and its Surrounding Area .................................. 2-56
Figure 2.4.2 Proposed Land Use Map .............................................................................................. 2-57
Figure 3.1.1 Location Map of BWSSB Water Supply Facilities ........................................................ 3-1
Figure 3.1.2 Increase of Water Supply Capacity to BBMP Area in the Last Half a Century ............. 3-2
Figure 3.1.3 Overall Water Supply Service Area in the BBMP Area ................................................. 3-3
Figure 3.2.1 Location of Intake and Conveyance Facilities ............................................................... 3-5
Figure 3.2.2 Schematic View of Water Conveyance in a Series of Projects by CWSS Stage ........... 3-6
Figure 3.2.3 Ground Levels at Different Locations ........................................................................... 3-6
Figure 3.2.4 Section of Clariflocculator ............................................................................................. 3-9
Figure 3.2.5 Water Flow of Pulsator .................................................................................................. 3-9
Figure 3.2.6 Treatment Flow of DAF .............................................................................................. 3-10
Figure 3.2.7 Water Flow of DAF ..................................................................................................... 3-11
Figure 3.2.8 Treatment Flow at TK Halli WTP (Stage IV, Phase 2) ................................................ 3-14
Figure 3.2.9 Location of Transmission Facilities ............................................................................. 3-15
Figure 3.2.10 Schematic View of Transmission Facilities ............................................................... 3-17
Figure 3.2.11 Location of Transmission and Distribution Facilities in the BBMP .......................... 3-19
Figure 3.2.12 GLRs and Their Water Source ................................................................................... 3-22
Figure 3.2.13 Coverage by Each Stage ............................................................................................ 3-23
Figure 3.2.14 Percentage of Pipe Length in Material and Diameter ................................................ 3-30
Figure 3.2.15 Location Map of Sub-divisions ................................................................................. 3-32
Bengaluru Water Supply and Sewerage Project (Phase 3)
Final Report
NJS Consultants Co., Ltd xxii
Figure 3.2.16 Trend of Water Supply, Billed Consumption and NRW ............................................ 3-34
Figure 3.3.1 Basic Policy for Water Supply ..................................................................................... 3-38
Figure 3.3.2 UFW Reduction Project Area (1a, 2a and 2b are on-going) ........................................ 3-41
Figure 3.3.3 UFW Improvement in Contract 2b .............................................................................. 3-44
Figure 3.3.4 DMA Boundary ........................................................................................................... 3-44
Figure 3.3.5 Example of Pipe Layout and DMA Flowmeter Installation ........................................ 3-45
Figure 3.3.6 Example of Valve Installation ...................................................................................... 3-45
Figure 3.4.1 SCADA Control System Configuration at TK Halli WTP .......................................... 3-49
Figure 3.4.2 System Architecture at Pumping Stations .................................................................... 3-50
Figure 3.4.3 System Architecture for Data Communication at Remote Stations ............................. 3-51
Figure 3.4.4 System Architecture at Centralized SCADA Center (CSC) ........................................ 3-53
Figure 3.4.5 UFW SCADA System Architecture (Typical for each Contract) ................................ 3-54
Figure 3.4.6 Water SCADA Network Diagram ................................................................................ 3-55
Figure 3.4.7 Sewerage SCADA Data Transmission Network Diagram ........................................... 3-56
Figure 3.4.8 Typical Control System Architecture at STP ............................................................... 3-57
Figure 3.4.9 Typical Control System Architecture at STP –Phase-1 ............................................... 3-58
Figure 4.1.1 Sub-district of Bengaluru ............................................................................................... 4-3
Figure 4.2.1 Sewerage Service Area by Valley in Core Area ............................................................. 4-6
Figure 4.4.1 Locations of Existing STPs ......................................................................................... 4-10
Figure 4.5.1 Schematic of Treatment for Reuse in Bengaluru ......................................................... 4-20
Figure 4.7.1 Existing and On-going Sewerage Systems (Core Area and 8 ULBs) .......................... 4-25
Figure 5.1.1 Population Trend in BBMP ........................................................................................... 5-2
Figure 5.1.2 Existing Population Projection by different Authorities/ Information Sources ............. 5-6
Figure 5.4.1 Analysis of Present Water Consumption and UFW for Core and ULB Areas ............. 5-15
Figure 6.2.1 Location of Shiva Anicut for Power Channel and Pipe Intake ...................................... 6-5
Figure 6.2.2 Locations of Dams, Water Intake and Flow Gauging Point along Cauvery River ........ 6-6
Figure 6.2.3 Intake Requirement and 355th Flow of Cauvery at Kollegal Point ................................ 6-8
Figure 6.2.4 Intake Requirement and Daily Flow of Cauvery in 2012 at Kollegal Point .................. 6-9
Figure 6.3.1 Location of Proposed Water Sources ........................................................................... 6-11
Figure 6.4.1 Population Trends for the Three (3) Areas .................................................................. 6-17
Figure 6.4.2 Water Balance in BBMP .............................................................................................. 6-18
Figure 6.4.3 Allocation of 775 MLD, Stage V Project to the Two Areas ........................................ 6-21
Figure 8.1.1 Drainage Area in BBMP Area ........................................................................................ 8-1
Figure 8.2.1 The Study Area of Master Plan for SWD ....................................................................... 8-3
Figure 8.2.2 Sampling Frequency in Lakes ........................................................................................ 8-5
Figure 8.2.3 Lake Water Quality in Major Valleys ............................................................................. 8-6
Figure 8.2.4 Lake Classification as per CPCB Criteria ...................................................................... 8-7
Figure 8.2.5 Locations of Water Sampling Points ............................................................................ 8-12
Figure 8.2.6 Results for BOD Concentration at Sampling Points ..................................................... 8-12
Figure 8.3.1 Present Sewage Treatment Percentage in the Existing Sewerage Service Area ........... 8-15
Bengaluru Water Supply and Sewerage Project (Phase 3)
Final Report
NJS Consultants Co., Ltd xxiii
Figure 9.1.1 Location of Industrial Estates in Bengaluru Metropolitan Region ................................ 9-1
Figure 10.1.1 Locations of GLRs in DPR for Stage V Project ........................................................ 10-4
Figure 10.1.2 Locations of GLRs in DPR for 110 Villages ............................................................. 10-4
Figure 10.1.3 Locations of GLRs to be Applied for 110 Villages Water Supply ............................. 10-5
Figure 10.1.4 Hydraulic Profile of City Trunk Main in the West Route .......................................... 10-8
Figure 10.1.5 Hydraulic Profile of City Trunk Main in the East Route ........................................... 10-9
Figure 10.1.6 On-going and Proposed Conveyance Pipelines ....................................................... 10-10
Figure 10.1.7 Location of Conveyance Pipeline from Intake to WTP ........................................... 10-11
Figure 10.1.8 Raw Water Turbidity Variation from 2009 to 2014 ................................................. 10-13
Figure 10.1.9 Raw Water Turbidity in 2015................................................................................... 10-14
Figure 10.1.10 Raw Water pH in 2015 .......................................................................................... 10-14
Figure 10.1.11 Typical Treatment Flow in CPHEEO Manual ....................................................... 10-17
Figure 10.1.12 Proposed Conventional Water Treatment Process ................................................. 10-17
Figure 10.1.13 Hydraulic Profile of Transmission Pipeline from TK Halli PS to Harohalli ......... 10-25
Figure 10.1.14 Section of One-way Surge Tank in DPR ............................................................... 10-25
Figure 10.1.15 Transient Phenomenon after Power Failure (TK Halli) ......................................... 10-26
Figure 10.1.16 Transient Phenomenon after Power Failure (Harohalli) ........................................ 10-26
Figure 10.1.17 Transient Phenomenon (from Tatagini PS to Chokkanahalli GLR) ...................... 10-27
Figure 10.1.18 Transient Phenomenon (from Tatagini PS to Gottigere GLR) ............................... 10-27
Figure 10.1.19 Additional Firewall ................................................................................................ 10-38
Figure 10.1.20 Outline of JICA Survey Project ............................................................................. 10-40
Figure 10.2.1 Sewerage Systems for 110 Villages Including Part of ULBs .................................. 10-53
Figure 10.2.2 Proposed Sewerage Systems in Bytrayanapura Zone .............................................. 10-54
Figure 10.2.3 Proposed Sewerage Systems in Mahadevpura Zone ............................................... 10-58
Figure 10.2.4 Proposed Sewerage Systems in Bommanahalli Zone .............................................. 10-60
Figure 10.2.5 Proposed Sewerage Systems in R.R. Nagar Zone ................................................... 10-63
Figure 10.2.6 Proposed Sewerage Systems in Dasarahalli Zone ................................................... 10-67
Figure 10.2.7 Planned Sewerage Systems, and Locations of Planned STPs and ISPSs ................ 10-73
Figure 10.2.8 Layout Plan of Main Sewer Lines for All Zones ..................................................... 10-80
Figure 10.2.9 Layout Plan of Main Sewer Lines in Bytrayanapura Zone ..................................... 10-81
Figure 10.2.10 Layout Plan of Main Sewer Lines in Mahadevpura Zone ..................................... 10-82
Figure 10.2.11 Layout Plan of Main Sewer Lines in Bommanahalli Zone .................................... 10-83
Figure 10.2.12 Layout Plan of Main Sewer Lines in R.R. Nagar Zone ......................................... 10-84
Figure 10.2.13 Layout Plan of Main Sewer Lines in Dasarahalli Zone ......................................... 10-85
Figure 10.2.14 Average Inflow Sewage Quality in 2015 at 12 Existing STPs ............................... 10-87
Figure 10.2.15 Yearly Fluctuation of BOD at Existing STPs ........................................................ 10-88
Figure 10.2.16 Monthly Fluctuation of BOD and SS at 3 Existing STPs ...................................... 10-89
Figure 10.2.17 Monthly Fluctuation of COD, T-N and T-P at the three STPs ............................... 10-90
Figure 10.2.18 Average Effluent Quality in 2015 at Existing STPs Operated by BWSSB ........... 10-94
Figure 10.2.19 Relationship between Effluent BOD and SRT ...................................................... 10-95
Bengaluru Water Supply and Sewerage Project (Phase 3)
Final Report
NJS Consultants Co., Ltd xxiv
Figure 10.2.20 Relationship between BOD and SS ....................................................................... 10-96
Figure 10.2.21 Process Flow of OD ............................................................................................... 10-97
Figure 10.2.22 Process Flow of SBR ............................................................................................. 10-98
Figure 10.2.23 Process Flow of EA ............................................................................................... 10-98
Figure 10.2.24 Process Flow of MBBR ......................................................................................... 10-99
Figure 10.2.25 Process Flow of A2O ............................................................................................. 10-99
Figure 10.2.26 Process Flow of MBR .......................................................................................... 10-100
Figure 10.2.27 EA Process with Enhanced Nitrogen and Phosphorus Removal ......................... 10-102
Figure 10.2.28 SBR Process with Enhanced Nitrogen and Phosphorus Removal ....................... 10-102
Figure 10.2.29 Typical Image of Belt Press ................................................................................. 10-109
Figure 10.2.30 Typical Image of Centrifuge ................................................................................ 10-109
Figure 10.2.31 Typical Image of Screw Press .............................................................................. 10-110
Figure 10.2.32 Typical Image of Volute Dewatering Press .......................................................... 10-110
Figure 10.2.33 Economical Study on Necessity of Gravity Thickener ........................................ 10-112
Figure 10.2.34 Location of ISPSs ................................................................................................ 10-115
Figure 10.2.35 Plan of Standard Pumping Station in India .......................................................... 10-116
Figure 11.2.1 Typical Distribution Arrangements ............................................................................ 11-4
Figure 11.2.2 Comparison of Capacity of Pipe and Pump via OHTs and Direct from GLRs.......... 11-5
Figure 11.2.3 Negative Impact when Pump Operation Stopped ...................................................... 11-6
Figure 11.2.4 Alternative for Doddakanahalli Distribution ............................................................. 11-6
Figure 11.2.5 OHTs’ Location in Bommanahalli Zone (Gottigere GLR) ...................................... 11-11
Figure 11.2.6 OHTs’ Location in Bommanahalli Zone (Doddakanahalli GLR) ............................ 11-11
Figure 11.2.7 OHTs’ Location in Bytrayanapura Zone (Chokkanahalli GLR) .............................. 11-12
Figure 11.2.8 OHTs’ Location in Bytrayanapura Zone (GKVK GLR) .......................................... 11-12
Figure 11.2.9 OHTs’ Location in Bytrayanapura Zone (Vasudevapura GLR) ............................... 11-13
Figure 11.2.10 OHTs’ Location in Dasarahalli Zone (Hegganahalli-2 GLR) ................................ 11-13
Figure 11.2.11 OHTs’ Location in Dasarahalli Zone (Lingaderanahalli GLR) .............................. 11-14
Figure 11.2.12 OHTs’ Location in Dasarahalli Zone (Singapura GLR) ........................................ 11-14
Figure 11.2.13 OHTs’ Location in Mahadevpura Zone (Kadugodi GLR) ..................................... 11-15
Figure 11.2.14 OHTs’ Location in Mahadevpura Zone (OMBR GLR) ......................................... 11-15
Figure 11.2.15 OHTs’ Location in R.R. Nagar Zone (GLRs under BDA) ..................................... 11-22
Figure 11.2.16 Project Area for UFW Reduction and Distribution Improvement ......................... 11-23
Figure 11.3.1 Standard Drawing of Connection Manholes ............................................................ 11-30
Figure 11.3.2 Typical House Connection to Connect Directly to Lateral Sewer ........................... 11-31
Figure 11.4.1 Schematic Diagram of Conveyance Pipeline for CWSS Stage V ........................... 11-34
Figure 11.4.2 Plan of Conveyance Pipeline ................................................................................... 11-35
Figure 11.4.3 Profile of Conveyance Pipeline ............................................................................... 11-35
Figure 11.4.4 Water Balance in Core Area ..................................................................................... 11-37
Figure 11.4.5 Branch Feeding Pipes from Stage V City Trunk Main ............................................ 11-39
Figure 12.1.1 Daily Fluctuations of Raw Water Turbidity in 2013 .................................................. 12-2
Bengaluru Water Supply and Sewerage Project (Phase 3)
Final Report
NJS Consultants Co., Ltd xxv
Figure 12.1.2 Daily Fluctuations of Raw Water Turbidity in 2014 ................................................... 12-2
Figure 12.1.3 Daily Fluctuations of Raw Water Turbidity in 2015 ................................................... 12-2
Figure 12.1.4 Process Flow of WTP ................................................................................................. 12-4
Figure 12.1.5 Water Conveyance Pipe, Cascade Aerator and Parshall Flume .................................. 12-5
Figure 12.1.6 Dimension of Parshall Flume ..................................................................................... 12-7
Figure 12.1.7 Relation with Dosing Rate and Raw Water Turbidity .............................................. 12-13
Figure 12.1.8 Layout Plan of WTP ................................................................................................. 12-20
Figure 12.1.9 Hydraulic Profile ...................................................................................................... 12-21
Figure 12.1.10 Typical Plan of Pump House .................................................................................. 12-28
Figure 12.1.11 Typical Section of Pump House .............................................................................. 12-28
Figure 12.1.12 Typical Plan of Clear Water Reservoir ................................................................... 12-29
Figure 12.1.13 Typical Section of Clear Water Reservoir............................................................... 12-29
Figure 12.1.14 Typical Air Vessels ................................................................................................. 12-30
Figure 12.1.15 Layout Plan of Harohalli Pumping Station and Clear Water Reservoir ................. 12-33
Figure 12.1.16 Plan of Tataguni Pumping Station and Clear Water Reservoir ............................... 12-35
Figure 12.1.17 Arrangement of Diverting Water among Existing Stages and Proposed Stage V ... 12-36
Figure 12.1.18 Surge Analysis from TK Halli to Harohalli ............................................................ 12-36
Figure 12.1.19 Plan and Section of Surge Tank at JK Doddi .......................................................... 12-37
Figure 12.1.20 Topographic Survey Drawing of Transmission Pipeline (Sample Section) ............ 12-41
Figure 12.1.21 Typical Cross Section of Transmission pipeline ..................................................... 12-42
Figure 12.1.22 Profile of TK Halli to Harohalli .............................................................................. 12-43
Figure 12.1.23 Profile of Harohalli to Tataguni .............................................................................. 12-43
Figure 12.1.24 Layout of City Trunk Main and GLRs ................................................................... 12-46
Figure 12.1.25 Schematic Diagram of City Trunk Main and GLRs ............................................... 12-46
Figure 12.1.26 Profile of Trunk Mains in West Route (Pressured System) .................................... 12-47
Figure 12.1.27 Profile of Eastern Route (Pressured System) .......................................................... 12-47
Figure 12.1.28 Profile of Eastern Route (Gravity System) ............................................................. 12-48
Figure 12.1.29 Trenchless Crossing Locations at City Trunk Main ............................................... 12-49
Figure 12.1.30 Location of GLRs of CWSS Stage V ..................................................................... 12-50
Figure 12.1.31 Outline of Gottigere GLR on the Topography Map ............................................... 12-53
Figure 12.1.32 Outline of Doddakanahalli GLR on Topographic Map .......................................... 12-54
Figure 12.1.33 Outline of Kadugodi GLR on Topographic Map .................................................... 12-55
Figure 12.1.34 Outline of Chokkanahalli GLR on Topographic Map ............................................ 12-56
Figure 12.1.35 Outline of Vasudevapura GLR on Topographic Map ............................................. 12-57
Figure 12.1.36 Outline of Singapura GLR on Topographic Map ................................................... 12-58
Figure 12.1.37 Outline of Lingaderanahalli GLR on Topographic Map......................................... 12-59
Figure 12.2.1 Pipe Ramming Method ............................................................................................ 12-66
Figure 12.2.2 Pipe Jacking Method ............................................................................................... 12-67
Figure 12.2.3 Horizontal Drilling Method ..................................................................................... 12-68
Figure 12.2.4 Auger Boring Method .............................................................................................. 12-68
Bengaluru Water Supply and Sewerage Project (Phase 3)
Final Report
NJS Consultants Co., Ltd xxvi
Figure 12.2.5 Micro Tunneling Method ......................................................................................... 12-69
Figure 12.2.6 Tunneling Method.................................................................................................... 12-70
Figure 12.2.7 Plan and Section of Belahalli ISPS .......................................................................... 12-74
Figure 12.2.8 Layout of Belahalli ISPS ......................................................................................... 12-75
Figure 12.2.9 Plan and Section of Hagadur ISPS .......................................................................... 12-77
Figure 12.2.10 Layout of Hagadur ISPS ........................................................................................ 12-78
Figure 12.2.11 Plan and Section of Naganathapura ISPS .............................................................. 12-80
Figure 12.2.12 Layout of Naganathapura ISPS ............................................................................. 12-81
Figure 12.2.13 Plan and Section of Arehalli 1 ISPS ...................................................................... 12-83
Figure 12.2.14 Layout of Arehalli 1 ISPS ...................................................................................... 12-84
Figure 12.2.15 Plan and Section of Hemigepura ISPS .................................................................. 12-86
Figure 12.2.16 Layout of Hemigepura ISPS .................................................................................. 12-87
Figure 12.2.17 Plan and Section of Herohalli ISPS ....................................................................... 12-89
Figure 12.2.18 Layout of Herohalli ISPS ...................................................................................... 12-90
Figure 12.2.19 Plan and Section of Doddabidarakallu ISPS ......................................................... 12-92
Figure 12.2.20 Layout of Doddabidarakallu ISPS ......................................................................... 12-93
Figure 12.2.21 Process Flow for STP Capacity Less than 10 MLD .............................................. 12-98
Figure 12.2.22 Process Flow for STP with a Capacity of More than 10MLD ............................. 12-100
Figure 12.2.23 Layout plan of Jakkur STP .................................................................................. 12-101
Figure 12.2.24 Process Flow Diagram with Hydraulic Profile .................................................... 12-102
Figure 12.2.25 Layout plan of Yelahankakere STP ..................................................................... 12-106
Figure 12.2.26 Process Flow Diagram with Hydraulic Profile .................................................... 12-107
Figure 12.2.27 Layout Plan of Doddabittahalli STP .................................................................... 12-111
Figure 12.2.28 Process Flow Diagram with Hydraulic Profile .................................................... 12-112
Figure 12.2.29 Layout plan of Bilishivalli STP ........................................................................... 12-116
Figure 12.2.30 Process Flow Diagram with Hydraulic Profile .................................................... 12-117
Figure 12.2.31 Layout plan of Varthur (Stage V) STP ................................................................. 12-121
Figure 12.2.32 Process Flow Diagram with Hydraulic Profile .................................................... 12-122
Figure 12.2.33 Layout plan of Pillaganahalli STP ....................................................................... 12-126
Figure 12.2.34 Process Flow Diagram with Hydraulic Profile .................................................... 12-127
Figure 12.2.35 Layout plan of Talaghattapura STP ..................................................................... 12-131
Figure 12.2.36 Process Flow Diagram with Hydraulic Profile .................................................... 12-132
Figure 12.2.37 Layout plan of Somapura STP ............................................................................. 12-136
Figure 12.2.38 Process Flow Diagram with Hydraulic Profile .................................................... 12-137
Figure 12.2.39 Layout plan of Hemigepura STP ......................................................................... 12-141
Figure 12.2.40 Process Flow Diagram with Hydraulic Profile .................................................... 12-142
Figure 12.2.41 Layout Plan of Nagasandra (Stage V) STP ......................................................... 12-146
Figure 12.2.42 Process Flow Diagram with Hydraulic Profile .................................................... 12-147
Figure 12.2.43 Layout plan of Kairovobanahalli STP ................................................................. 12-151
Figure 12.2.44 Process Flow Diagram with Hydraulic Profile .................................................... 12-152
Bengaluru Water Supply and Sewerage Project (Phase 3)
Final Report
NJS Consultants Co., Ltd xxvii
Figure 12.2.45 Layout plan of Herohalli STP .............................................................................. 12-156
Figure 12.2.46 Process Flow Diagram with Hydraulic Profile .................................................... 12-157
Figure 12.2.47 Layout plan of Hosahalli STP ............................................................................. 12-161
Figure 12.2.48 Process Flow Diagram with Hydraulic Profile .................................................... 12-162
Figure 12.2.49 Layout plan of Chikkabanavara-2 STP ................................................................ 12-166
Figure 12.2.50 Process Flow Diagram with Hydraulic Profile .................................................... 12-167
Figure 13.2.1 Organizational Structure for Water Supply ............................................................... 13-8
Figure 13.3.1 Images of TV Camera Investigation Car and Sewer Cleaning Car ......................... 13-10
Figure 13.3.2 Images of Pipe Razer and Sewer Cleaning Car ....................................................... 13-11
Figure 13.3.3 Proposed Organizational Structure for O&M of STP, ISPS and Main Sewers ....... 13-23
Figure 13.3.4 Proposed Organizational Structure for O&M of Lateral Sewers and House Connections
............................................................................................................................................... 13-24
Figure 14.1.1 Location Map of Proposed Stage V Water Supply Project (JICA Survey Project) ..... 14-2
Figure 14.1.2 Location Map of Sewerage Facilities ......................................................................... 14-4
Figure 14.2.1 Location Map of National Park (Bannerghatta) near Facility Sites ............................ 14-6
Figure 14.2.2 Geological Map of Karnataka State ............................................................................ 14-7
Figure 14.2.3 Location Map of Monitoring Stations for Water Quality of Cauvery River ............... 14-8
Figure 14.2.4 Locations of Monitoring Stations for Groundwater and Proposed GLRs ................ 14-10
Figure 14.2.5 Location Map of Monitoring Stations for Lakes in BBMP Area .............................. 14-12
Figure 14.2.6 Locations of Air Quality Monitoring Stations in BBMP Area ................................. 14-16
Figure 14.2.7 Location Map of Monitoring Stations for Ambient Noise ........................................ 14-18
Figure 14.2.8 Occurrence of Waterborne Diseases in Karnataka State and Bengaluru City .......... 14-20
Figure 14.2.9 Status of Waterborne Communicable Diseases in Bengaluru ................................... 14-20
Figure 14.2.10 Frequency of Waterborne Diseases Occurrence in Bengaluru Urban .................... 14-21
Figure 14.2.11 Location Map of Historical and Cultural Assets ..................................................... 14-21
Figure 14.3.1 Environmental Clearance Flow for Category B Projects .......................................... 14-38
Figure 14.9.1 Monitoring Structure for Environmental Monitoring ............................................... 14-81
Figure 14.10.1 Simplified Process Flow of Land Transfer/Acquisition ......................................... 14-91
Figure 14.10.2 Implementation Structure for Land Acquisition ..................................................... 14-91
Figure 16.1.1 Expenditure Structure in FY2010-14 (in 10 Million INR) ......................................... 16-4
Figure 16.1.2 Budgetary Process in Karnataka State ........................................................................ 16-8
Figure 16.1.3 Relational Structure of Budget ................................................................................... 16-9
Figure 16.3.1 Collected Amount by Channel in FY2013-15 .......................................................... 16-17
Figure 16.3.2 Billed and Collected Amount of Water Charge and Collection Rate ........................ 16-18
Figure 16.3.3 Billed and Collected Amount of New Connection and Collection Rate ................... 16-18
Figure 16.4.1 Flow Chart for the Study of Water Supply and Sewerage Tariff .............................. 16-23
Figure 17.1.1 Organization Chart of BWSSB .................................................................................. 17-4
Figure 17.4.1 Organizational Structure .......................................................................................... 17-52
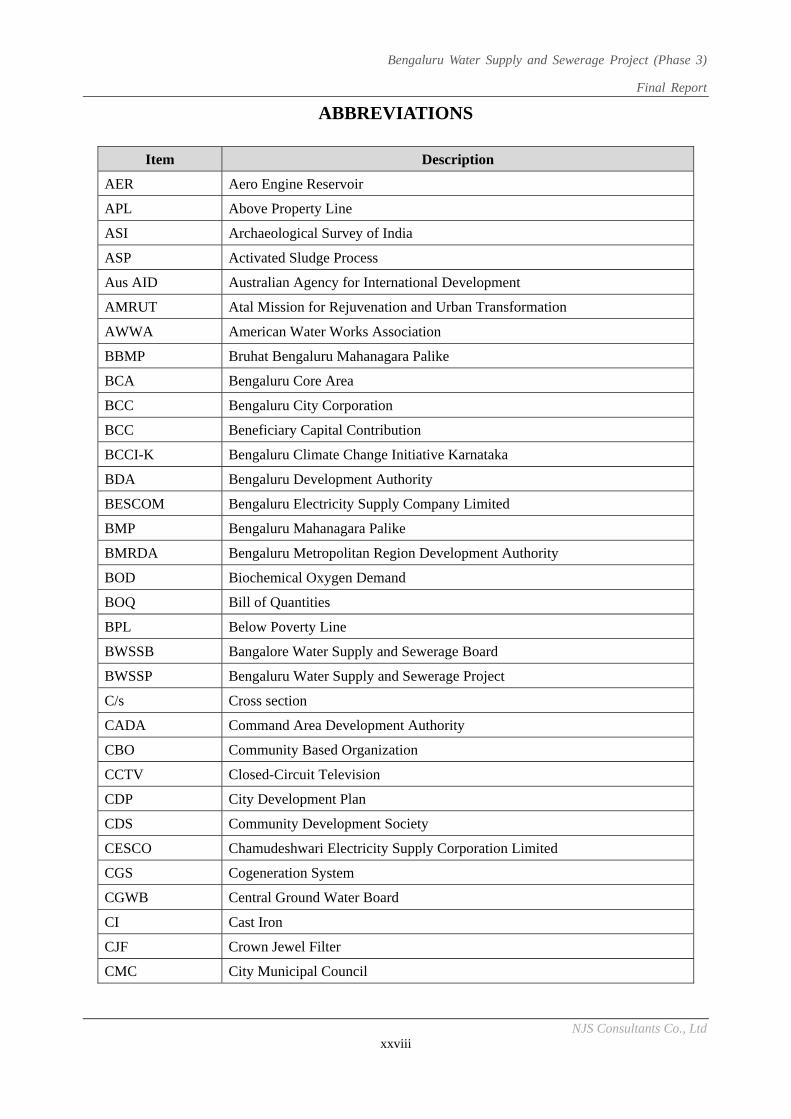
Bengaluru Water Supply and Sewerage Project (Phase 3)
Final Report
NJS Consultants Co., Ltd xxviii
ABBREVIATIONS
Item Description
AER Aero Engine Reservoir
APL Above Property Line
ASI Archaeological Survey of India
ASP Activated Sludge Process
Aus AID Australian Agency for International Development
AMRUT Atal Mission for Rejuvenation and Urban Transformation
AWWA American Water Works Association
BBMP Bruhat Bengaluru Mahanagara Palike
BCA Bengaluru Core Area
BCC Bengaluru City Corporation
BCC Beneficiary Capital Contribution
BCCI-K Bengaluru Climate Change Initiative Karnataka
BDA Bengaluru Development Authority
BESCOM Bengaluru Electricity Supply Company Limited
BMP Bengaluru Mahanagara Palike
BMRDA Bengaluru Metropolitan Region Development Authority
BOD Biochemical Oxygen Demand
BOQ Bill of Quantities
BPL Below Poverty Line
BWSSB Bangalore Water Supply and Sewerage Board
BWSSP Bengaluru Water Supply and Sewerage Project
C/s Cross section
CADA Command Area Development Authority
CBO Community Based Organization
CCTV Closed-Circuit Television
CDP City Development Plan
CDS Community Development Society
CESCO Chamudeshwari Electricity Supply Corporation Limited
CGS Cogeneration System
CGWB Central Ground Water Board
CI Cast Iron
CJF Crown Jewel Filter
CMC City Municipal Council
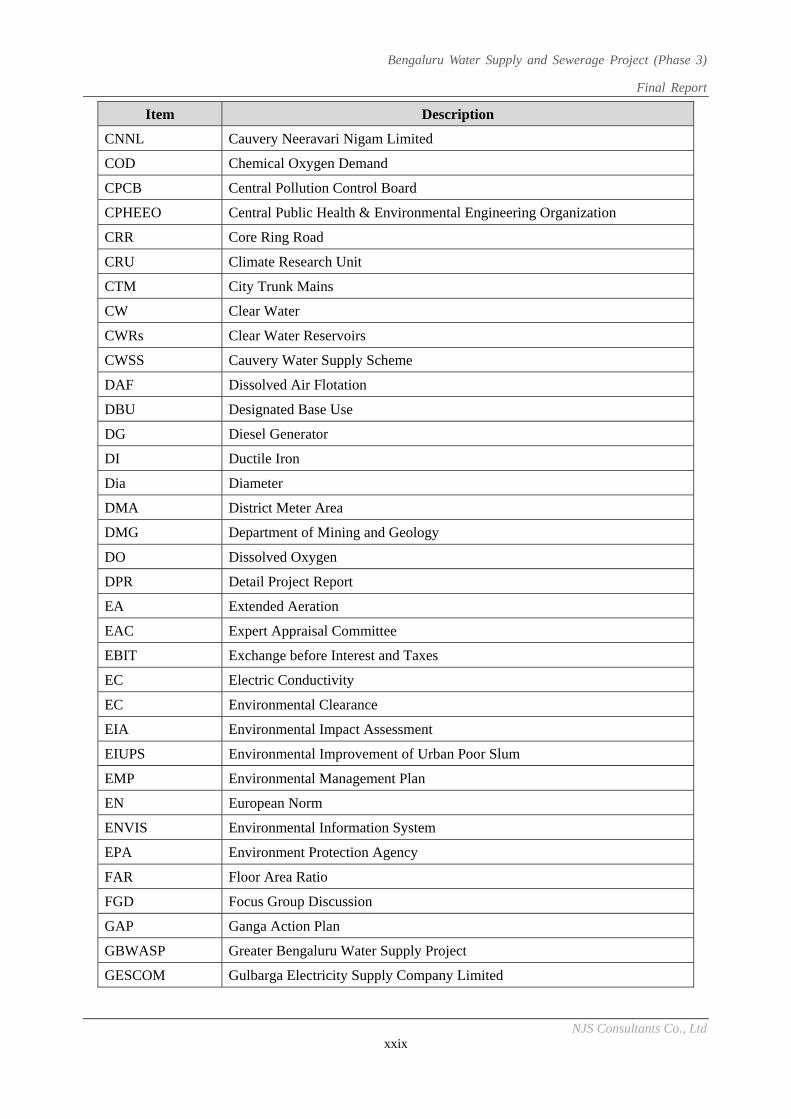
Bengaluru Water Supply and Sewerage Project (Phase 3)
Final Report
NJS Consultants Co., Ltd xxix
Item Description
CNNL Cauvery Neeravari Nigam Limited
COD Chemical Oxygen Demand
CPCB Central Pollution Control Board
CPHEEO Central Public Health & Environmental Engineering Organization
CRR Core Ring Road
CRU Climate Research Unit
CTM City Trunk Mains
CW Clear Water
CWRs Clear Water Reservoirs
CWSS Cauvery Water Supply Scheme
DAF Dissolved Air Flotation
DBU Designated Base Use
DG Diesel Generator
DI Ductile Iron
Dia Diameter
DMA District Meter Area
DMG Department of Mining and Geology
DO Dissolved Oxygen
DPR Detail Project Report
EA Extended Aeration
EAC Expert Appraisal Committee
EBIT Exchange before Interest and Taxes
EC Electric Conductivity
EC Environmental Clearance
EIA Environmental Impact Assessment
EIUPS Environmental Improvement of Urban Poor Slum
EMP Environmental Management Plan
EN European Norm
ENVIS Environmental Information System
EPA Environment Protection Agency
FAR Floor Area Ratio
FGD Focus Group Discussion
GAP Ganga Action Plan
GBWASP Greater Bengaluru Water Supply Project
GESCOM Gulbarga Electricity Supply Company Limited
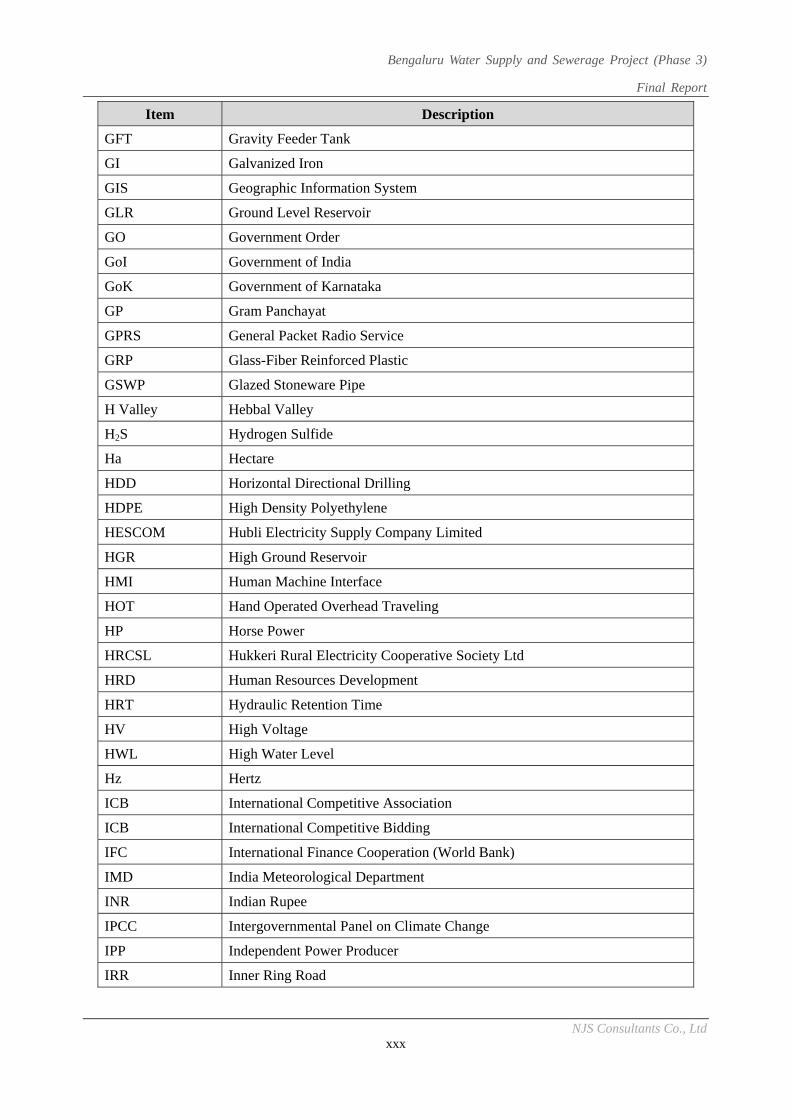
Bengaluru Water Supply and Sewerage Project (Phase 3)
Final Report
NJS Consultants Co., Ltd xxx
Item Description
GFT Gravity Feeder Tank
GI Galvanized Iron
GIS Geographic Information System
GLR Ground Level Reservoir
GO Government Order
GoI Government of India
GoK Government of Karnataka
GP Gram Panchayat
GPRS General Packet Radio Service
GRP Glass-Fiber Reinforced Plastic
GSWP Glazed Stoneware Pipe
H Valley Hebbal Valley
H2S Hydrogen Sulfide
Ha Hectare
HDD Horizontal Directional Drilling
HDPE High Density Polyethylene
HESCOM Hubli Electricity Supply Company Limited
HGR High Ground Reservoir
HMI Human Machine Interface
HOT Hand Operated Overhead Traveling
HP Horse Power
HRCSL Hukkeri Rural Electricity Cooperative Society Ltd
HRD Human Resources Development
HRT Hydraulic Retention Time
HV High Voltage
HWL High Water Level
Hz Hertz
ICB International Competitive Association
ICB International Competitive Bidding
IFC International Finance Cooperation (World Bank)
IMD India Meteorological Department
INR Indian Rupee
IPCC Intergovernmental Panel on Climate Change
IPP Independent Power Producer
IRR Inner Ring Road
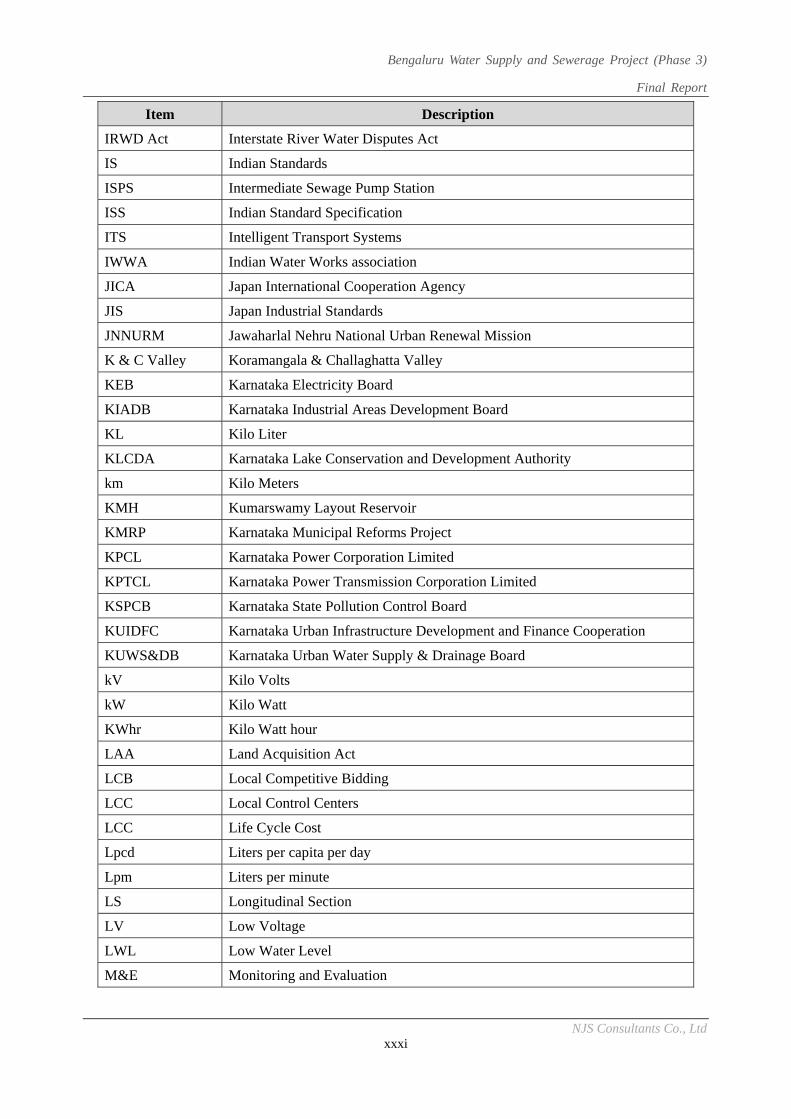
Bengaluru Water Supply and Sewerage Project (Phase 3)
Final Report
NJS Consultants Co., Ltd xxxi
Item Description
IRWD Act Interstate River Water Disputes Act
IS Indian Standards
ISPS Intermediate Sewage Pump Station
ISS Indian Standard Specification
ITS Intelligent Transport Systems
IWWA Indian Water Works association
JICA Japan International Cooperation Agency
JIS Japan Industrial Standards
JNNURM Jawaharlal Nehru National Urban Renewal Mission
K & C Valley Koramangala & Challaghatta Valley
KEB Karnataka Electricity Board
KIADB Karnataka Industrial Areas Development Board
KL Kilo Liter
KLCDA Karnataka Lake Conservation and Development Authority
km Kilo Meters
KMH Kumarswamy Layout Reservoir
KMRP Karnataka Municipal Reforms Project
KPCL Karnataka Power Corporation Limited
KPTCL Karnataka Power Transmission Corporation Limited
KSPCB Karnataka State Pollution Control Board
KUIDFC Karnataka Urban Infrastructure Development and Finance Cooperation
KUWS&DB Karnataka Urban Water Supply & Drainage Board
kV Kilo Volts
kW Kilo Watt
KWhr Kilo Watt hour
LAA Land Acquisition Act
LCB Local Competitive Bidding
LCC Local Control Centers
LCC Life Cycle Cost
Lpcd Liters per capita per day
Lpm Liters per minute
LS Longitudinal Section
LV Low Voltage
LWL Low Water Level
M&E Monitoring and Evaluation
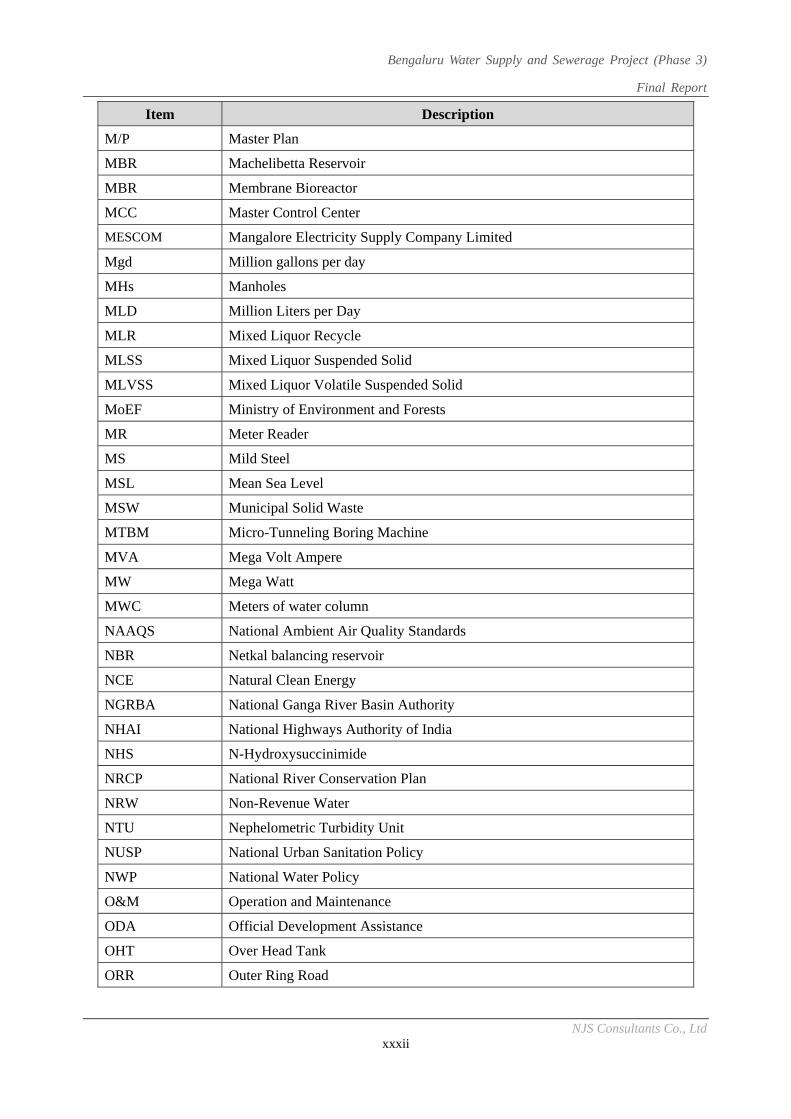
Bengaluru Water Supply and Sewerage Project (Phase 3)
Final Report
NJS Consultants Co., Ltd xxxii
Item Description
M/P Master Plan
MBR Machelibetta Reservoir
MBR Membrane Bioreactor
MCC Master Control Center
MESCOM Mangalore Electricity Supply Company Limited
Mgd Million gallons per day
MHs Manholes
MLD Million Liters per Day
MLR Mixed Liquor Recycle
MLSS Mixed Liquor Suspended Solid
MLVSS Mixed Liquor Volatile Suspended Solid
MoEF Ministry of Environment and Forests
MR Meter Reader
MS Mild Steel
MSL Mean Sea Level
MSW Municipal Solid Waste
MTBM Micro-Tunneling Boring Machine
MVA Mega Volt Ampere
MW Mega Watt
MWC Meters of water column
NAAQS National Ambient Air Quality Standards
NBR Netkal balancing reservoir
NCE Natural Clean Energy
NGRBA National Ganga River Basin Authority
NHAI National Highways Authority of India
NHS N-Hydroxysuccinimide
NRCP National River Conservation Plan
NRW Non-Revenue Water
NTU Nephelometric Turbidity Unit
NUSP National Urban Sanitation Policy
NWP National Water Policy
O&M Operation and Maintenance
ODA Official Development Assistance
OHT Over Head Tank
ORR Outer Ring Road
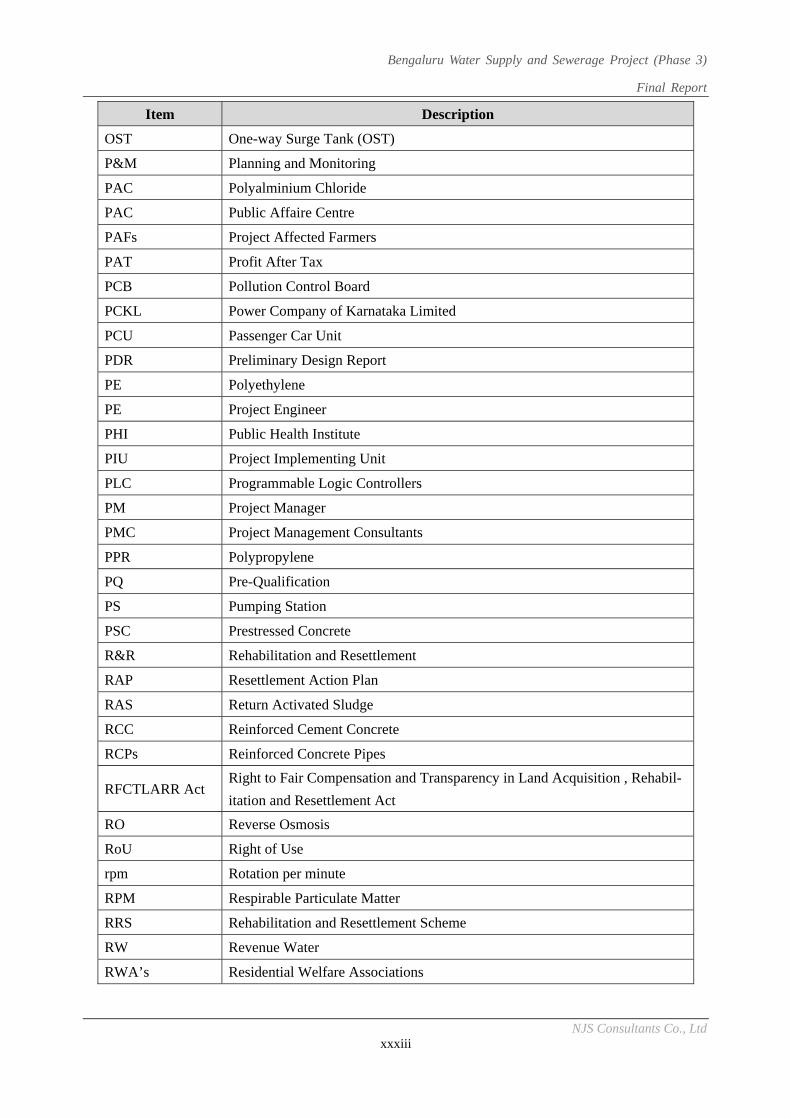
Bengaluru Water Supply and Sewerage Project (Phase 3)
Final Report
NJS Consultants Co., Ltd xxxiii
Item Description
OST One-way Surge Tank (OST)
P&M Planning and Monitoring
PAC Polyalminium Chloride
PAC Public Affaire Centre
PAFs Project Affected Farmers
PAT Profit After Tax
PCB Pollution Control Board
PCKL Power Company of Karnataka Limited
PCU Passenger Car Unit
PDR Preliminary Design Report
PE Polyethylene
PE Project Engineer
PHI Public Health Institute
PIU Project Implementing Unit
PLC Programmable Logic Controllers
PM Project Manager
PMC Project Management Consultants
PPR Polypropylene
PQ Pre-Qualification
PS Pumping Station
PSC Prestressed Concrete
R&R Rehabilitation and Resettlement
RAP Resettlement Action Plan
RAS Return Activated Sludge
RCC Reinforced Cement Concrete
RCPs Reinforced Concrete Pipes
RFCTLARR Act Right to Fair Compensation and Transparency in Land Acquisition , Rehabil-
itation and Resettlement Act
RO Reverse Osmosis
RoU Right of Use
rpm Rotation per minute
RPM Respirable Particulate Matter
RRS Rehabilitation and Resettlement Scheme
RW Revenue Water
RWA’s Residential Welfare Associations
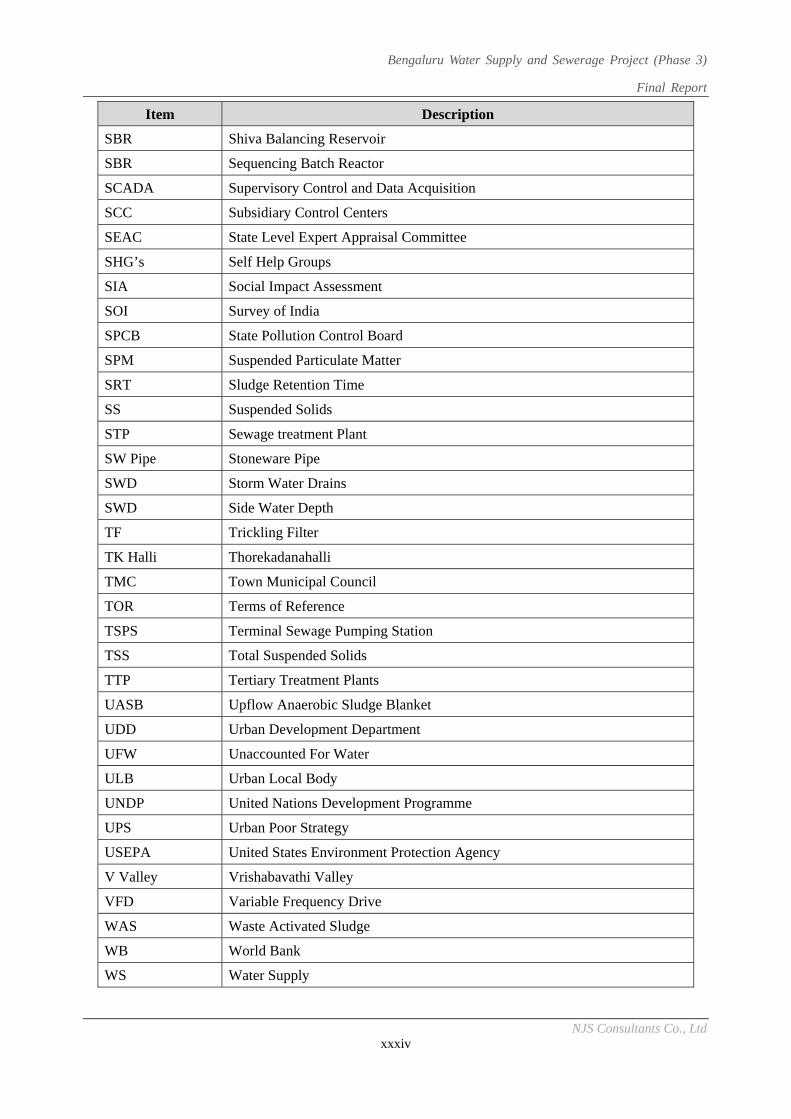
Bengaluru Water Supply and Sewerage Project (Phase 3)
Final Report
NJS Consultants Co., Ltd xxxiv
Item Description
SBR Shiva Balancing Reservoir
SBR Sequencing Batch Reactor
SCADA Supervisory Control and Data Acquisition
SCC Subsidiary Control Centers
SEAC State Level Expert Appraisal Committee
SHG’s Self Help Groups
SIA Social Impact Assessment
SOI Survey of India
SPCB State Pollution Control Board
SPM Suspended Particulate Matter
SRT Sludge Retention Time
SS Suspended Solids
STP Sewage treatment Plant
SW Pipe Stoneware Pipe
SWD Storm Water Drains
SWD Side Water Depth
TF Trickling Filter
TK Halli Thorekadanahalli
TMC Town Municipal Council
TOR Terms of Reference
TSPS Terminal Sewage Pumping Station
TSS Total Suspended Solids
TTP Tertiary Treatment Plants
UASB Upflow Anaerobic Sludge Blanket
UDD Urban Development Department
UFW Unaccounted For Water
ULB Urban Local Body
UNDP United Nations Development Programme
UPS Urban Poor Strategy
USEPA United States Environment Protection Agency
V Valley Vrishabavathi Valley
VFD Variable Frequency Drive
WAS Waste Activated Sludge
WB World Bank
WS Water Supply
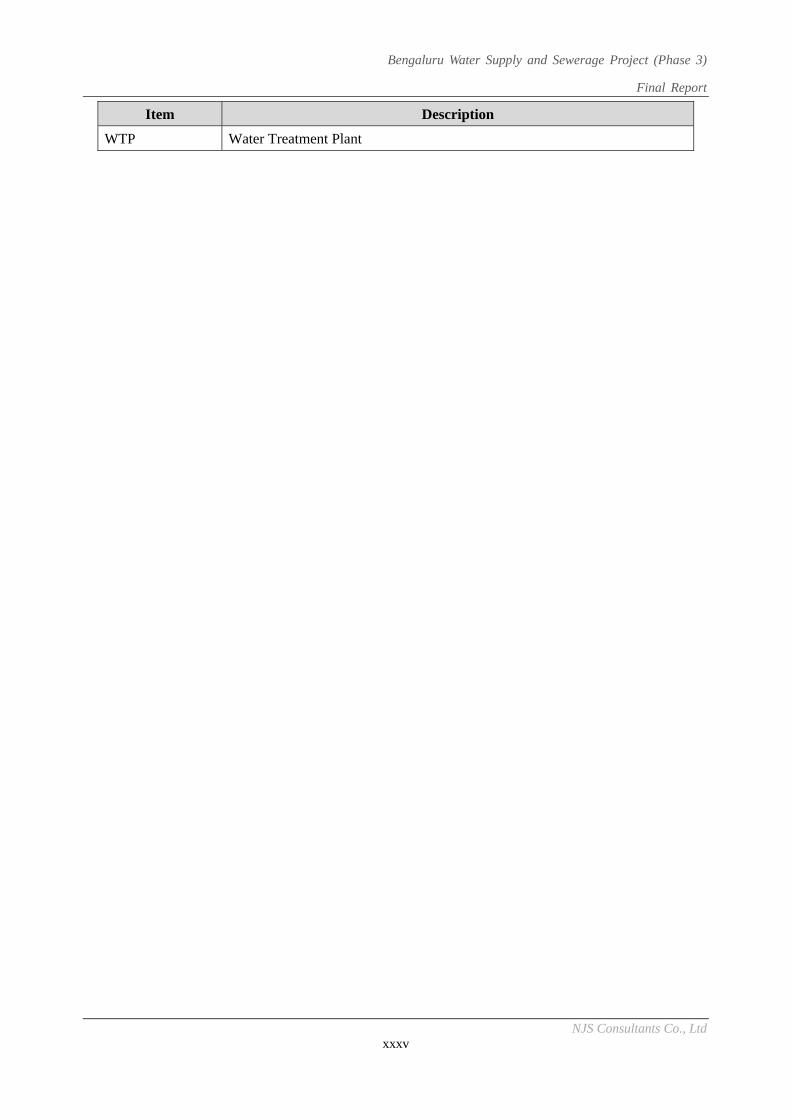
Bengaluru Water Supply and Sewerage Project (Phase 3)
Final Report
NJS Consultants Co., Ltd xxxv
Item Description
WTP Water Treatment Plant
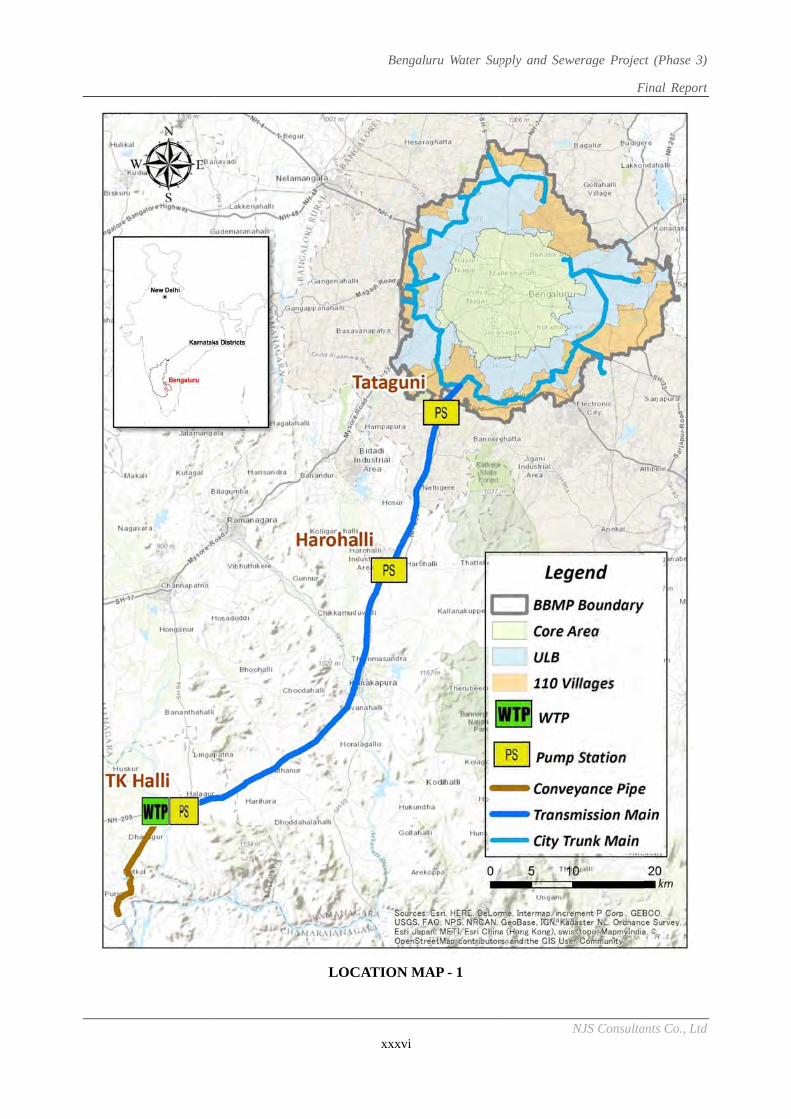
LOC
Bengalu
xxxvi
CATION MA
uru Water Sup
AP - 1
pply and Sew
N
werage Projec
F
NJS Consulta
ct (Phase 3)
Final Report
ants Co., Ltd
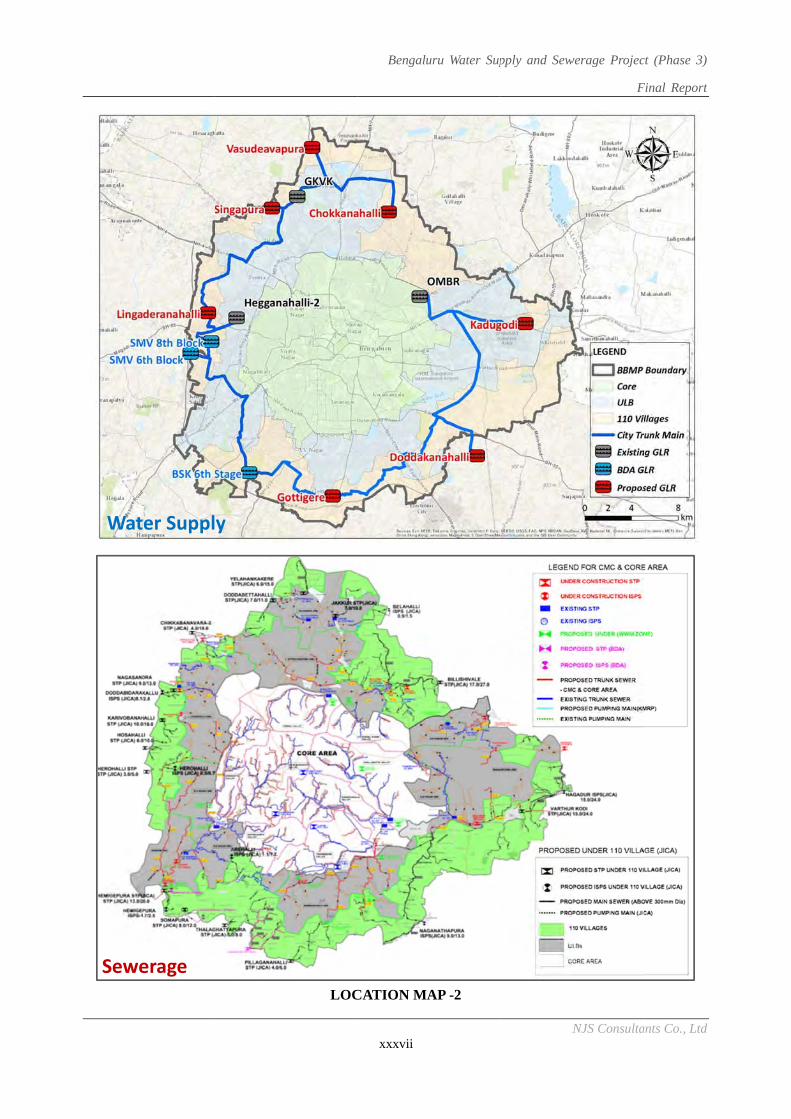
Wat
Sewe
er Suppl
erage
y
LOC
Bengalu
xxxvii
CATION MA
uru Water Sup
AP -2
pply and Sew
N
werage Projec
F
NJS Consulta
ct (Phase 3)
Final Report
ants Co., Ltd
REPUBLIC OF INDIA
BANGALORE WATER SUPPLY AND SEWERAGE BOARD (BWSSB)
BENGALURU WATER SUPPLY AND SEWERAGE PROJECT (PHASE 3)
IN
THE STATE OF KARNATAKA, INDIA
FINAL REPORT
(Executive Summary)
NOVEMBER 2017
JAPAN INTERNATIONAL COOPERATION AGENCY (JICA)
NJS CONSULTANTS CO., LTD. (NJS)
Bengaluru Water Supply and Sewerage Project (Phase 3)
Final Report Executive Summary
NJS Consultants Co., Ltd S-1
EXECUTIVE SUMMARY
1 Introduction
The field work in Bengaluru, India for Preparatory Survey on “Bengaluru Water Supply and Sewerage
Project (Phase 3)’’ had been conducted intermittently six (6) times from June, 2016 to August, 2017.
Based on the findings and discussions with Bengaluru Water Supply and Sewerage Board (BWSSB),
Final Report was prepared by the beginning of November, 2017.
This preparatory survey report covers existing conditions on water supply and sewerage sectors in the
Bruhat Bengaluru Mahanagara Palike (BBMP) area. Feasibility study results on the water balance in the
BBMP area with priority projects are presented before establishment of the scope of work for JICA Sur-
vey Project. Then, preliminary design of facilities for the JICA Survey Project is presented, followed by
operation and maintenance (O&M) of the facilities, Environmental and Social Considerations, Imple-
mentation Plan, Financial and Economic Considerations and Organizational and Institutional Improve-
ment. Updated information and some preliminary studies on the projects to be financed by local funds
are also incorporated to come up with overall requirements for the proposed all project components.
The objective of the Project is to provide residents in BBMP area with safe and stable water supply, and
sewerage services to meet increasing water demand and the need of environmental improvement and to
contribute to the promotion of industry. The location of the survey area is presented in the location map,
which covers the jurisdiction of the BWSSB including Core area, eight (8) ULBs (Urban Local Bodies)
and 110 villages, and pipeline routes from the water intake at the Cauvery River to the entrance of
BBMP.
The main objective of the Preparatory Survey is to prepare required information for feasibility evaluation
of the proposed projects, as a Japanese Government ODA loan project. Among others, such information
includes the outline of the project, project cost estimates, economic and financial viability of the project,
project implementation schedule, manner of procurement and construction, organization of project im-
plementation, O&M arrangements, and social and environmental considerations. The prepared report and
additional components suggested in the Preparatory Survey would be considered as addendum to the
DPRs for the project.
Target years for the Project are established according to the recommendations stated in the Revised
Manual by the Central Public Health Environmental Engineering Organization (CPHEEO), in applica-
tion of the planning base year 2019. The outline of the proposed work is summarized in Table 1.1.
Table 1.1 Outline of the Proposed Work
Proposed Work Outline Major Facilities (based on DPR)
Conveyance & Transmission lines
from the Cauvery River to BBMP
A total of about 80 km pipeline
and WTP for 775 MLD
- Conveyance line: 10 km
- WTP: (775 MLD)
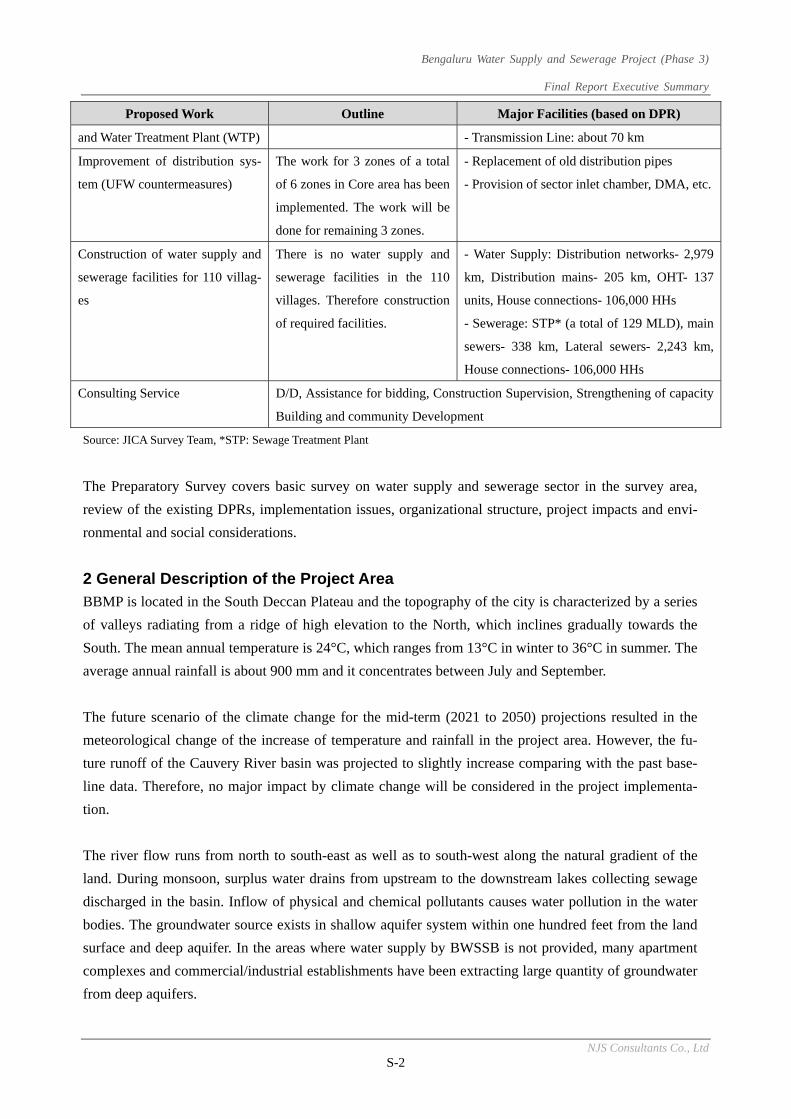
Bengaluru Water Supply and Sewerage Project (Phase 3)
Final Report Executive Summary
NJS Consultants Co., Ltd S-2
Proposed Work Outline Major Facilities (based on DPR)
and Water Treatment Plant (WTP) - Transmission Line: about 70 km
Improvement of distribution sys-
tem (UFW countermeasures)
The work for 3 zones of a total
of 6 zones in Core area has been
implemented. The work will be
done for remaining 3 zones.
- Replacement of old distribution pipes
- Provision of sector inlet chamber, DMA, etc.
Construction of water supply and
sewerage facilities for 110 villag-
es
There is no water supply and
sewerage facilities in the 110
villages. Therefore construction
of required facilities.
- Water Supply: Distribution networks- 2,979
km, Distribution mains- 205 km, OHT- 137
units, House connections- 106,000 HHs
- Sewerage: STP* (a total of 129 MLD), main
sewers- 338 km, Lateral sewers- 2,243 km,
House connections- 106,000 HHs
Consulting Service D/D, Assistance for bidding, Construction Supervision, Strengthening of capacity
Building and community Development
Source: JICA Survey Team, *STP: Sewage Treatment Plant
The Preparatory Survey covers basic survey on water supply and sewerage sector in the survey area,
review of the existing DPRs, implementation issues, organizational structure, project impacts and envi-
ronmental and social considerations.
2 General Description of the Project Area
BBMP is located in the South Deccan Plateau and the topography of the city is characterized by a series
of valleys radiating from a ridge of high elevation to the North, which inclines gradually towards the
South. The mean annual temperature is 24°C, which ranges from 13°C in winter to 36°C in summer. The
average annual rainfall is about 900 mm and it concentrates between July and September.
The future scenario of the climate change for the mid-term (2021 to 2050) projections resulted in the
meteorological change of the increase of temperature and rainfall in the project area. However, the fu-
ture runoff of the Cauvery River basin was projected to slightly increase comparing with the past base-
line data. Therefore, no major impact by climate change will be considered in the project implementa-
tion.
The river flow runs from north to south-east as well as to south-west along the natural gradient of the
land. During monsoon, surplus water drains from upstream to the downstream lakes collecting sewage
discharged in the basin. Inflow of physical and chemical pollutants causes water pollution in the water
bodies. The groundwater source exists in shallow aquifer system within one hundred feet from the land
surface and deep aquifer. In the areas where water supply by BWSSB is not provided, many apartment
complexes and commercial/industrial establishments have been extracting large quantity of groundwater
from deep aquifers.
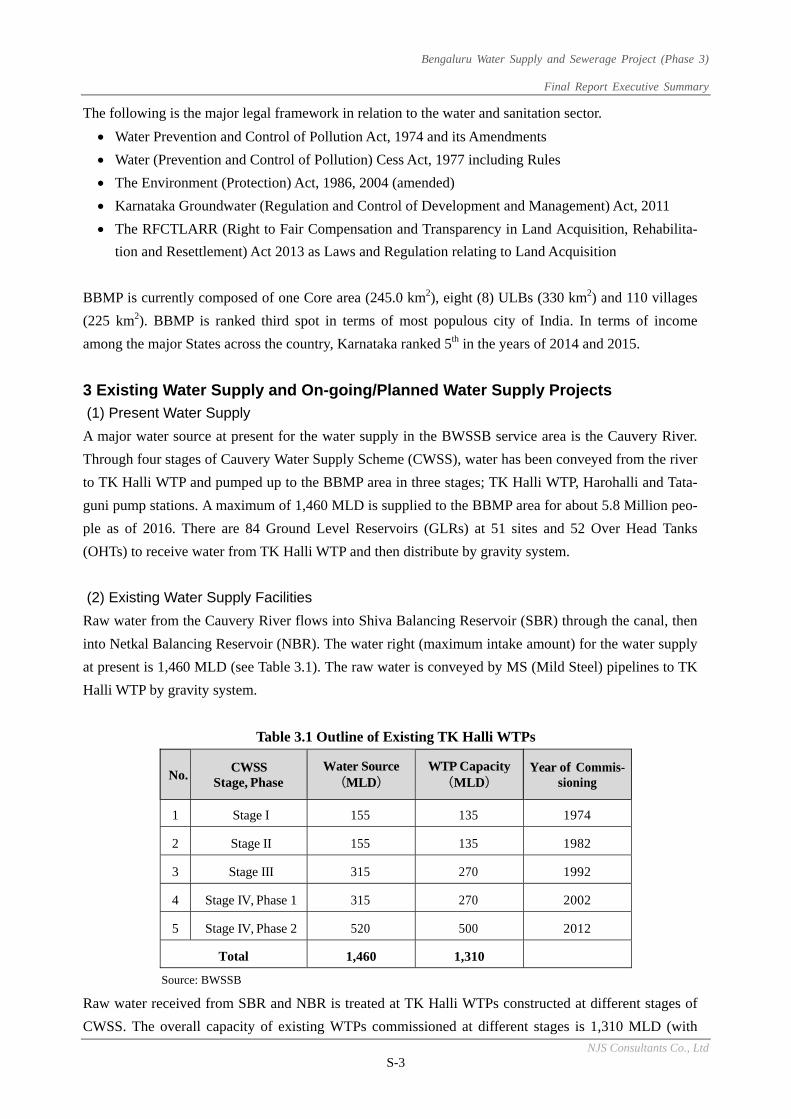
Bengaluru Water Supply and Sewerage Project (Phase 3)
Final Report Executive Summary
NJS Consultants Co., Ltd S-3
The following is the major legal framework in relation to the water and sanitation sector.
Water Prevention and Control of Pollution Act, 1974 and its Amendments
Water (Prevention and Control of Pollution) Cess Act, 1977 including Rules
The Environment (Protection) Act, 1986, 2004 (amended)
Karnataka Groundwater (Regulation and Control of Development and Management) Act, 2011
The RFCTLARR (Right to Fair Compensation and Transparency in Land Acquisition, Rehabilita-
tion and Resettlement) Act 2013 as Laws and Regulation relating to Land Acquisition
BBMP is currently composed of one Core area (245.0 km2), eight (8) ULBs (330 km2) and 110 villages
(225 km2). BBMP is ranked third spot in terms of most populous city of India. In terms of income
among the major States across the country, Karnataka ranked 5th in the years of 2014 and 2015.
3 Existing Water Supply and On-going/Planned Water Supply Projects
(1) Present Water Supply
A major water source at present for the water supply in the BWSSB service area is the Cauvery River.
Through four stages of Cauvery Water Supply Scheme (CWSS), water has been conveyed from the river
to TK Halli WTP and pumped up to the BBMP area in three stages; TK Halli WTP, Harohalli and Tata-
guni pump stations. A maximum of 1,460 MLD is supplied to the BBMP area for about 5.8 Million peo-
ple as of 2016. There are 84 Ground Level Reservoirs (GLRs) at 51 sites and 52 Over Head Tanks
(OHTs) to receive water from TK Halli WTP and then distribute by gravity system.
(2) Existing Water Supply Facilities
Raw water from the Cauvery River flows into Shiva Balancing Reservoir (SBR) through the canal, then
into Netkal Balancing Reservoir (NBR). The water right (maximum intake amount) for the water supply
at present is 1,460 MLD (see Table 3.1). The raw water is conveyed by MS (Mild Steel) pipelines to TK
Halli WTP by gravity system.
Table 3.1 Outline of Existing TK Halli WTPs
No. CWSS
Stage, Phase Water Source (MLD)
WTP Capacity (MLD)
Year of Commis-sioning
1 Stage I 155 135 1974
2 Stage II 155 135 1982
3 Stage III 315 270 1992
4 Stage IV, Phase 1 315 270 2002
5 Stage IV, Phase 2 520 500 2012
Total 1,460 1,310
Source: BWSSB
Raw water received from SBR and NBR is treated at TK Halli WTPs constructed at different stages of
CWSS. The overall capacity of existing WTPs commissioned at different stages is 1,310 MLD (with
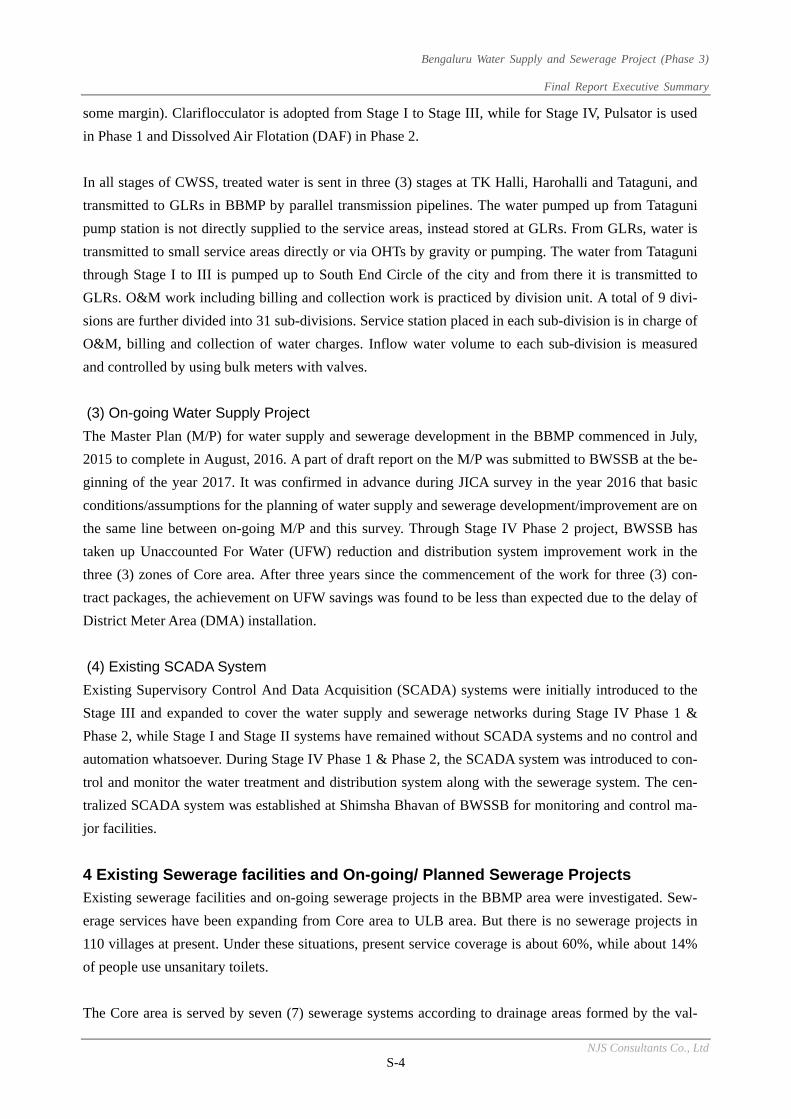
Bengaluru Water Supply and Sewerage Project (Phase 3)
Final Report Executive Summary
NJS Consultants Co., Ltd S-4
some margin). Clariflocculator is adopted from Stage I to Stage III, while for Stage IV, Pulsator is used
in Phase 1 and Dissolved Air Flotation (DAF) in Phase 2.
In all stages of CWSS, treated water is sent in three (3) stages at TK Halli, Harohalli and Tataguni, and
transmitted to GLRs in BBMP by parallel transmission pipelines. The water pumped up from Tataguni
pump station is not directly supplied to the service areas, instead stored at GLRs. From GLRs, water is
transmitted to small service areas directly or via OHTs by gravity or pumping. The water from Tataguni
through Stage I to III is pumped up to South End Circle of the city and from there it is transmitted to
GLRs. O&M work including billing and collection work is practiced by division unit. A total of 9 divi-
sions are further divided into 31 sub-divisions. Service station placed in each sub-division is in charge of
O&M, billing and collection of water charges. Inflow water volume to each sub-division is measured
and controlled by using bulk meters with valves.
(3) On-going Water Supply Project
The Master Plan (M/P) for water supply and sewerage development in the BBMP commenced in July,
2015 to complete in August, 2016. A part of draft report on the M/P was submitted to BWSSB at the be-
ginning of the year 2017. It was confirmed in advance during JICA survey in the year 2016 that basic
conditions/assumptions for the planning of water supply and sewerage development/improvement are on
the same line between on-going M/P and this survey. Through Stage IV Phase 2 project, BWSSB has
taken up Unaccounted For Water (UFW) reduction and distribution system improvement work in the
three (3) zones of Core area. After three years since the commencement of the work for three (3) con-
tract packages, the achievement on UFW savings was found to be less than expected due to the delay of
District Meter Area (DMA) installation.
(4) Existing SCADA System
Existing Supervisory Control And Data Acquisition (SCADA) systems were initially introduced to the
Stage III and expanded to cover the water supply and sewerage networks during Stage IV Phase 1 &
Phase 2, while Stage I and Stage II systems have remained without SCADA systems and no control and
automation whatsoever. During Stage IV Phase 1 & Phase 2, the SCADA system was introduced to con-
trol and monitor the water treatment and distribution system along with the sewerage system. The cen-
tralized SCADA system was established at Shimsha Bhavan of BWSSB for monitoring and control ma-
jor facilities.
4 Existing Sewerage facilities and On-going/ Planned Sewerage Projects
Existing sewerage facilities and on-going sewerage projects in the BBMP area were investigated. Sew-
erage services have been expanding from Core area to ULB area. But there is no sewerage projects in
110 villages at present. Under these situations, present service coverage is about 60%, while about 14%
of people use unsanitary toilets.
The Core area is served by seven (7) sewerage systems according to drainage areas formed by the val-
Bengaluru Water Supply and Sewerage Project (Phase 3)
Final Report Executive Summary
NJS Consultants Co., Ltd S-5
leys and part of five (5) ULBs is also served. Currently 14 STPs have been operating in the Core area,
majority of which adopt secondary treatment method, but tertiary treated water is used by some
large-size consumers.
Table 4.1 Outline of Existing STPs
STP Name Area Project Capacity
(MLD) Treatment Method
1 K&C Valley Core Area Before Stage IV 218 Activated Sludge Process (ASP)
K&C Valley Core Area Stage IV, phase 1 30 Extended Aeration (EA)
2 V(Vrishabhavathi)
Valley
Core Area Before Stage IV 180 Trickling Filter (TF)
Tertiary Plant (A Part)
3 Hebbal Core Area Before Stage IV 60 ASP
4 Raja Canal Core Area Stage IV, phase 1 40 EA
5 Madivara Core Area Before Stage IV 4 Upflow Anaerobic Sludge Blanket (UASB)+ Oxidation Pond (OP)
+Constructed wetlands
6 Cubbon Park Core Area Before Stage IV 1.5 Membrane Bio-Reactor (MBR)
Tertiary Plant
7 Labaugh Core Area Before Stage IV 1.5 EA
8 Kempbudhi
(Iti Colony)
Core Area Before Stage IV 1 EA
9 Mailasandra R.R. Nagar CMC
Dasarahalli CMC
Stage IV, phase 1 75 EA
10
Kadabesanahalli Mahadevpura CMC
K.R. Purum CMC
Stage IV, phase 1 50 EA
11 Nagasandra Dasarahalli CMC Stage IV, phase 1 20 EA
12 K.R. Purum K.R. Purum CMC Stage IV, phase 1 20 UASB
13 Yelahanka
(Allasandara)
Yelahanka CMC Stage IV, phase 1 10 ASP + Filtration(Sand Filter)
Tertiary Plant
14 Jakkur Yelahanka CMC Stage IV, phase 1 10 UASB+EA
Source: BWSSB
The part of draft sewerage M/P was submitted at the beginning of year 2017. Unit sewage generation
rate was a little bit different between the M/P study and this Survey, though both plans use a same
methodology. The final figure was decided through discussions with BWSSB referring to National
guideline, CPHEEO.
5 Water Demand Projection for the Three Areas by Target Year
(1) Population Projection
The population growth in Bengaluru city in the past is shown in Figure 5.1. From the year 1971 the
growth rate was very high. The BBMP was created in 2007 extended from Bengaluru City to surround-
ing areas including eight (8) ULBs and 110 villages.
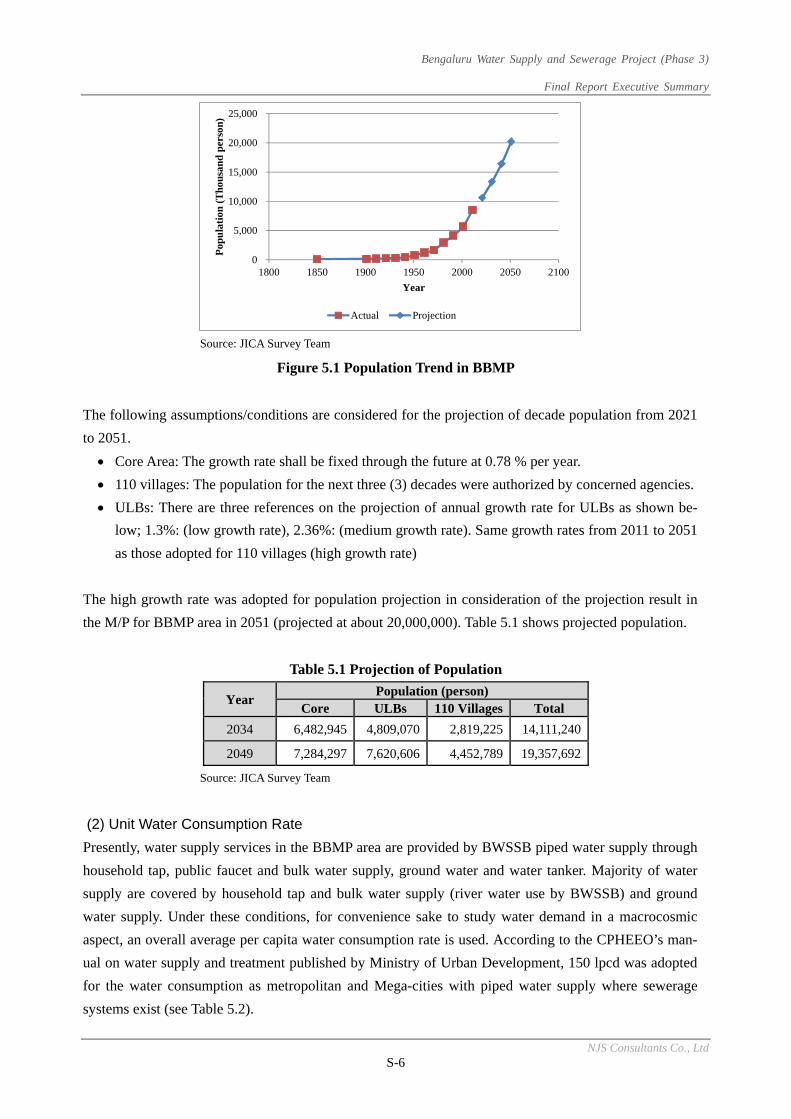
Bengaluru Water Supply and Sewerage Project (Phase 3)
Final Report Executive Summary
NJS Consultants Co., Ltd S-6
Source: JICA Survey Team
Figure 5.1 Population Trend in BBMP
The following assumptions/conditions are considered for the projection of decade population from 2021
to 2051.
Core Area: The growth rate shall be fixed through the future at 0.78 % per year.
110 villages: The population for the next three (3) decades were authorized by concerned agencies.
ULBs: There are three references on the projection of annual growth rate for ULBs as shown be-
low; 1.3%: (low growth rate), 2.36%: (medium growth rate). Same growth rates from 2011 to 2051
as those adopted for 110 villages (high growth rate)
The high growth rate was adopted for population projection in consideration of the projection result in
the M/P for BBMP area in 2051 (projected at about 20,000,000). Table 5.1 shows projected population.
Table 5.1 Projection of Population
Year Population (person)
Core ULBs 110 Villages Total
2034 6,482,945 4,809,070 2,819,225 14,111,240
2049 7,284,297 7,620,606 4,452,789 19,357,692
Source: JICA Survey Team
(2) Unit Water Consumption Rate
Presently, water supply services in the BBMP area are provided by BWSSB piped water supply through
household tap, public faucet and bulk water supply, ground water and water tanker. Majority of water
supply are covered by household tap and bulk water supply (river water use by BWSSB) and ground
water supply. Under these conditions, for convenience sake to study water demand in a macrocosmic
aspect, an overall average per capita water consumption rate is used. According to the CPHEEO’s man-
ual on water supply and treatment published by Ministry of Urban Development, 150 lpcd was adopted
for the water consumption as metropolitan and Mega-cities with piped water supply where sewerage
systems exist (see Table 5.2).
0
5,000
10,000
15,000
20,000
25,000
1800 1850 1900 1950 2000 2050 2100
Pop
ula
tion
(T
hous
and
per
son)
Year
Actual Projection
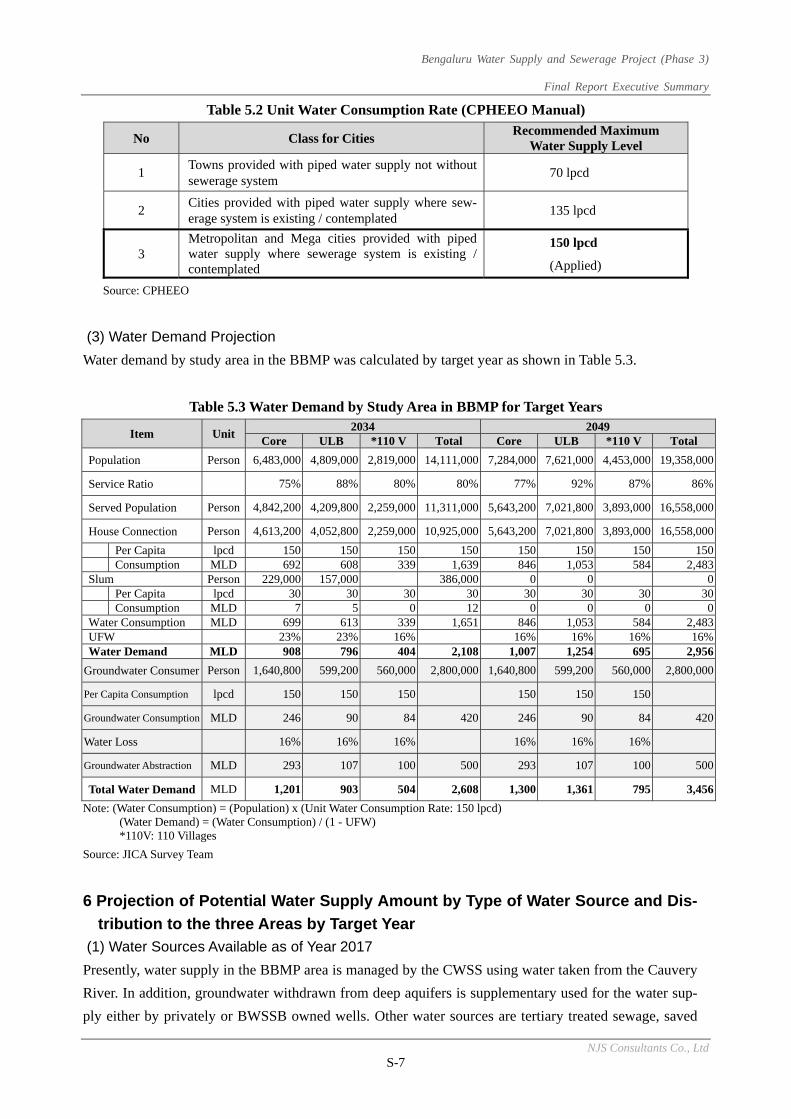
Bengaluru Water Supply and Sewerage Project (Phase 3)
Final Report Executive Summary
NJS Consultants Co., Ltd S-7
Table 5.2 Unit Water Consumption Rate (CPHEEO Manual)
No Class for Cities Recommended Maximum
Water Supply Level
1 Towns provided with piped water supply not without sewerage system
70 lpcd
2 Cities provided with piped water supply where sew-erage system is existing / contemplated
135 lpcd
3 Metropolitan and Mega cities provided with piped water supply where sewerage system is existing / contemplated
150 lpcd
(Applied)
Source: CPHEEO
(3) Water Demand Projection
Water demand by study area in the BBMP was calculated by target year as shown in Table 5.3.
Table 5.3 Water Demand by Study Area in BBMP for Target Years
Item Unit2034 2049
Core ULB *110 V Total Core ULB *110 V Total
Population Person 6,483,000 4,809,000 2,819,000 14,111,000 7,284,000 7,621,000 4,453,000 19,358,000
Service Ratio 75% 88% 80% 80% 77% 92% 87% 86%
Served Population Person 4,842,200 4,209,800 2,259,000 11,311,000 5,643,200 7,021,800 3,893,000 16,558,000
House Connection Person 4,613,200 4,052,800 2,259,000 10,925,000 5,643,200 7,021,800 3,893,000 16,558,000
Per Capita lpcd 150 150 150 150 150 150 150 150 Consumption MLD 692 608 339 1,639 846 1,053 584 2,483Slum Person 229,000 157,000 386,000 0 0 0 Per Capita lpcd 30 30 30 30 30 30 30 30 Consumption MLD 7 5 0 12 0 0 0 0Water Consumption MLD 699 613 339 1,651 846 1,053 584 2,483UFW 23% 23% 16% 16% 16% 16% 16%Water Demand MLD 908 796 404 2,108 1,007 1,254 695 2,956
Groundwater Consumer Person 1,640,800 599,200 560,000 2,800,000 1,640,800 599,200 560,000 2,800,000
Per Capita Consumption lpcd 150 150 150 150 150 150
Groundwater Consumption MLD 246 90 84 420 246 90 84 420
Water Loss 16% 16% 16% 16% 16% 16%
Groundwater Abstraction MLD 293 107 100 500 293 107 100 500
Total Water Demand MLD 1,201 903 504 2,608 1,300 1,361 795 3,456
Note: (Water Consumption) = (Population) x (Unit Water Consumption Rate: 150 lpcd) (Water Demand) = (Water Consumption) / (1 - UFW) *110V: 110 Villages
Source: JICA Survey Team
6 Projection of Potential Water Supply Amount by Type of Water Source and Dis-
tribution to the three Areas by Target Year
(1) Water Sources Available as of Year 2017
Presently, water supply in the BBMP area is managed by the CWSS using water taken from the Cauvery
River. In addition, groundwater withdrawn from deep aquifers is supplementary used for the water sup-
ply either by privately or BWSSB owned wells. Other water sources are tertiary treated sewage, saved
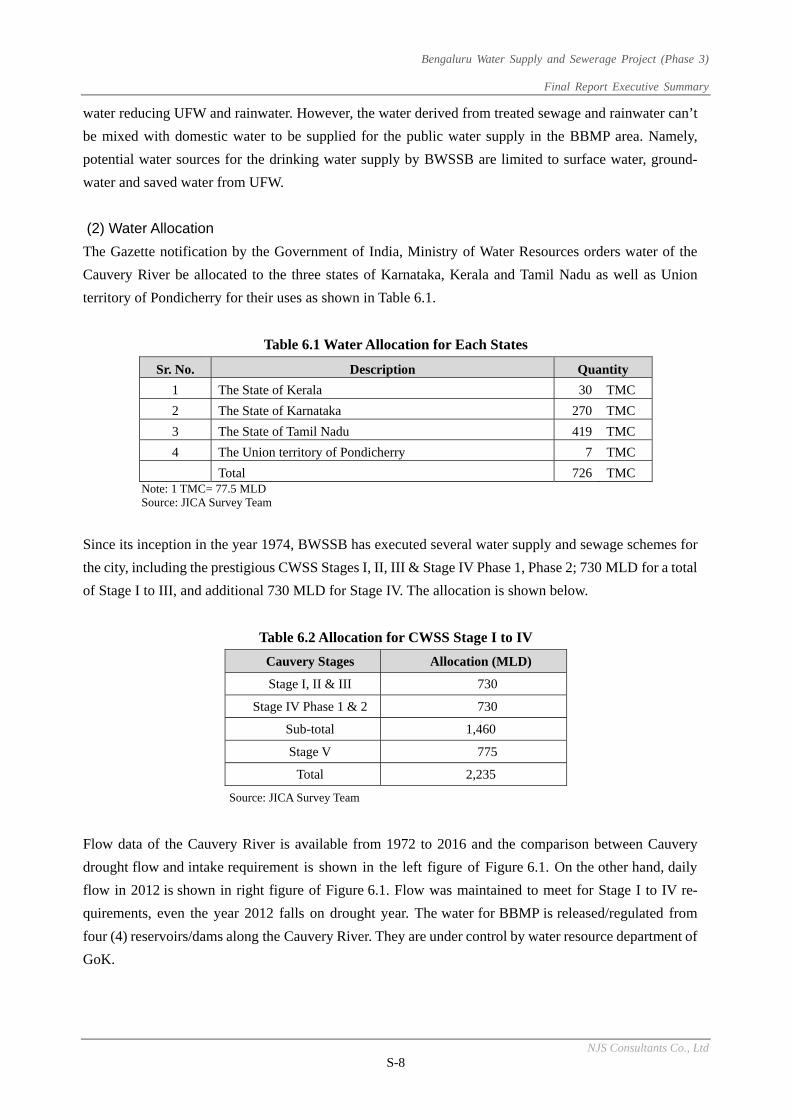
Bengaluru Water Supply and Sewerage Project (Phase 3)
Final Report Executive Summary
NJS Consultants Co., Ltd S-8
water reducing UFW and rainwater. However, the water derived from treated sewage and rainwater can’t
be mixed with domestic water to be supplied for the public water supply in the BBMP area. Namely,
potential water sources for the drinking water supply by BWSSB are limited to surface water, ground-
water and saved water from UFW.
(2) Water Allocation
The Gazette notification by the Government of India, Ministry of Water Resources orders water of the
Cauvery River be allocated to the three states of Karnataka, Kerala and Tamil Nadu as well as Union
territory of Pondicherry for their uses as shown in Table 6.1.
Table 6.1 Water Allocation for Each States
Sr. No. Description Quantity
1 The State of Kerala 30 TMC
2 The State of Karnataka 270 TMC
3 The State of Tamil Nadu 419 TMC
4 The Union territory of Pondicherry 7 TMC
Total 726 TMC Note: 1 TMC= 77.5 MLD
Source: JICA Survey Team
Since its inception in the year 1974, BWSSB has executed several water supply and sewage schemes for
the city, including the prestigious CWSS Stages I, II, III & Stage IV Phase 1, Phase 2; 730 MLD for a total
of Stage I to III, and additional 730 MLD for Stage IV. The allocation is shown below.
Table 6.2 Allocation for CWSS Stage I to IV
Cauvery Stages Allocation (MLD)
Stage I, II & III 730
Stage IV Phase 1 & 2 730
Sub-total 1,460
Stage V 775
Total 2,235
Source: JICA Survey Team
Flow data of the Cauvery River is available from 1972 to 2016 and the comparison between Cauvery
drought flow and intake requirement is shown in the left figure of Figure 6.1. On the other hand, daily
flow in 2012 is shown in right figure of Figure 6.1. Flow was maintained to meet for Stage I to IV re-
quirements, even the year 2012 falls on drought year. The water for BBMP is released/regulated from
four (4) reservoirs/dams along the Cauvery River. They are under control by water resource department of
GoK.
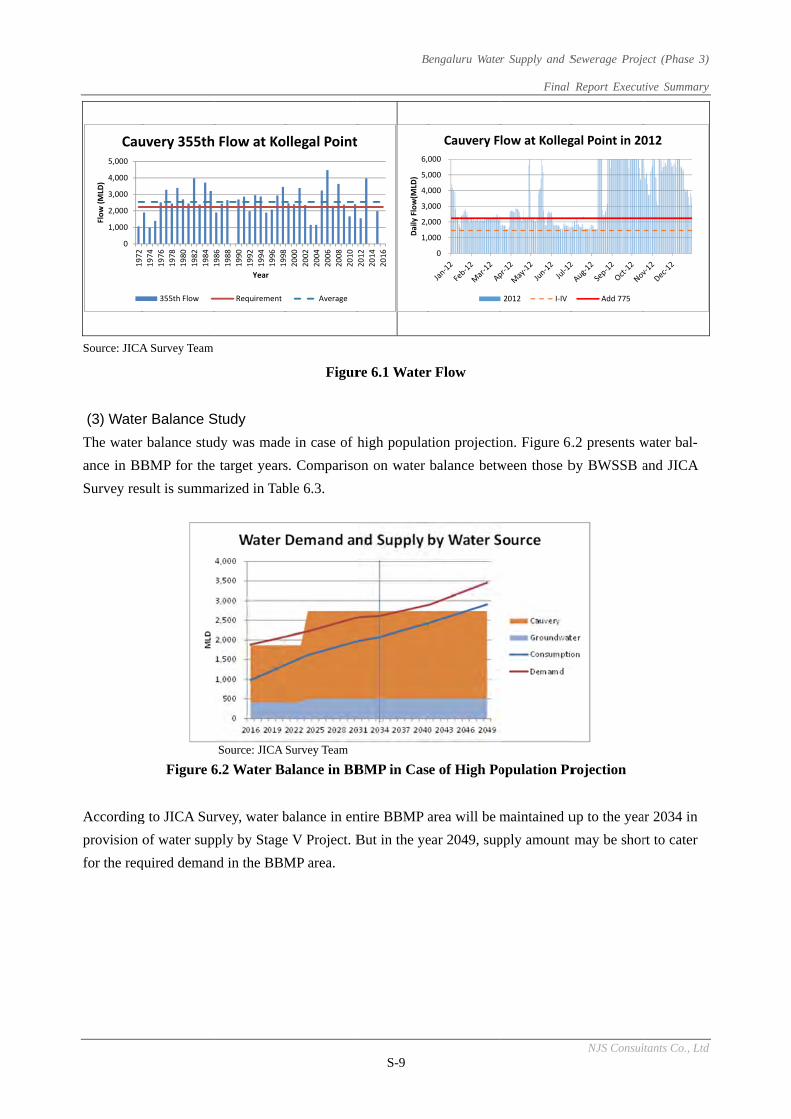
Source: JICA
(3) Wate
The water
ance in BB
Survey res
According
provision o
for the req
0
1,000
2,000
3,000
4,000
5,000
1972
Flow (MLD
)
Cau
A Survey Team
r Balance S
balance stud
BMP for the
sult is summa
Figure 6
g to JICA Sur
of water sup
quired deman
1974
1976
1978
1980
1982
1984
1986
uvery 355th
355th Flow
Study
dy was made
e target years
arized in Tab
Source: JICA
6.2 Water Ba
rvey, water b
ply by Stage
nd in the BBM
1986
1988
1990
1992
1994
1996
1998
Year
Flow at Ko
Requirement
Figur
e in case of h
s. Compariso
ble 6.3.
Survey Team
alance in BB
balance in en
e V Project. B
MP area.
998
2000
2002
2004
2006
2008
2010
llegal Point
Average
B
S-9
re 6.1 Water
high populat
on on water
BMP in Cas
ntire BBMP a
But in the ye
2012
2014
2016
1,0
2,0
3,0
4,0
5,0
6,0
Daily Flow(M
LD)
engaluru Wate
r Flow
tion projectio
balance betw
e of High Po
area will be m
ear 2049, sup
0
000
000
000
000
000
000
Cauvery F
r Supply and S
Final
on. Figure 6.
ween those b
opulation Pr
maintained u
pply amount
low at Kolleg
2012 I‐IV
Sewerage Proje
Report Execut
NJS Consul
.2 presents w
by BWSSB a
rojection
up to the yea
may be shor
gal Point in 20
Add 775
ect (Phase 3)
tive Summary
ltants Co., Ltd
water bal-
and JICA
ar 2034 in
rt to cater
012
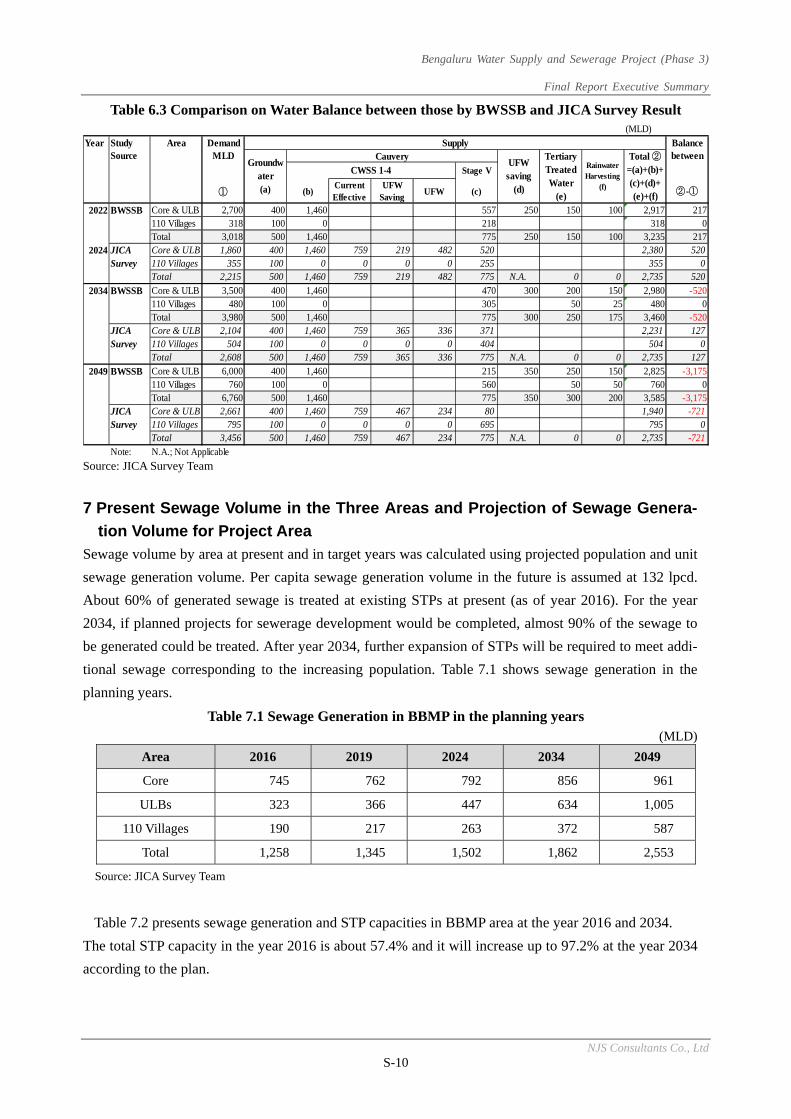
Bengaluru Water Supply and Sewerage Project (Phase 3)
Final Report Executive Summary
NJS Consultants Co., Ltd S-10
Table 6.3 Comparison on Water Balance between those by BWSSB and JICA Survey Result
Source: JICA Survey Team
7 Present Sewage Volume in the Three Areas and Projection of Sewage Genera-
tion Volume for Project Area
Sewage volume by area at present and in target years was calculated using projected population and unit
sewage generation volume. Per capita sewage generation volume in the future is assumed at 132 lpcd.
About 60% of generated sewage is treated at existing STPs at present (as of year 2016). For the year
2034, if planned projects for sewerage development would be completed, almost 90% of the sewage to
be generated could be treated. After year 2034, further expansion of STPs will be required to meet addi-
tional sewage corresponding to the increasing population. Table 7.1 shows sewage generation in the
planning years.
Table 7.1 Sewage Generation in BBMP in the planning years (MLD)
Source: JICA Survey Team
Table 7.2 presents sewage generation and STP capacities in BBMP area at the year 2016 and 2034.
The total STP capacity in the year 2016 is about 57.4% and it will increase up to 97.2% at the year 2034
according to the plan.
(MLD)
Year Study Area Demand Supply BalanceSource MLD Cauvery between
CWSS 1-4 Stage V
① (b)CurrentEffective
UFWSaving
UFW (c) ②-①
2022 BWSSB Core & ULB 2,700 400 1,460 557 250 150 100 2,917 217110 Villages 318 100 0 218 318 0Total 3,018 500 1,460 775 250 150 100 3,235 217
2024 JICA Core & ULB 1,860 400 1,460 759 219 482 520 2,380 520Survey 110 Villages 355 100 0 0 0 0 255 355 0
Total 2,215 500 1,460 759 219 482 775 N.A. 0 0 2,735 520
2034 BWSSB Core & ULB 3,500 400 1,460 470 300 200 150 2,980 -520110 Villages 480 100 0 305 50 25 480 0Total 3,980 500 1,460 775 300 250 175 3,460 -520
JICA Core & ULB 2,104 400 1,460 759 365 336 371 2,231 127Survey 110 Villages 504 100 0 0 0 0 404 504 0
Total 2,608 500 1,460 759 365 336 775 N.A. 0 0 2,735 127
2049 BWSSB Core & ULB 6,000 400 1,460 215 350 250 150 2,825 -3,175110 Villages 760 100 0 560 50 50 760 0Total 6,760 500 1,460 775 350 300 200 3,585 -3,175
JICA Core & ULB 2,661 400 1,460 759 467 234 80 1,940 -721Survey 110 Villages 795 100 0 0 0 0 695 795 0
Total 3,456 500 1,460 759 467 234 775 N.A. 0 0 2,735 -721Note: N.A.; Not Applicable
Groundwater(a)
UFWsaving
(d)
TertiaryTreatedWater
(e)
RainwaterHarvesting
(f)
Total ②=(a)+(b)+(c)+(d)+(e)+(f)
Area 2016 2019 2024 2034 2049
Core 745 762 792 856 961
ULBs 323 366 447 634 1,005
110 Villages 190 217 263 372 587
Total 1,258 1,345 1,502 1,862 2,553
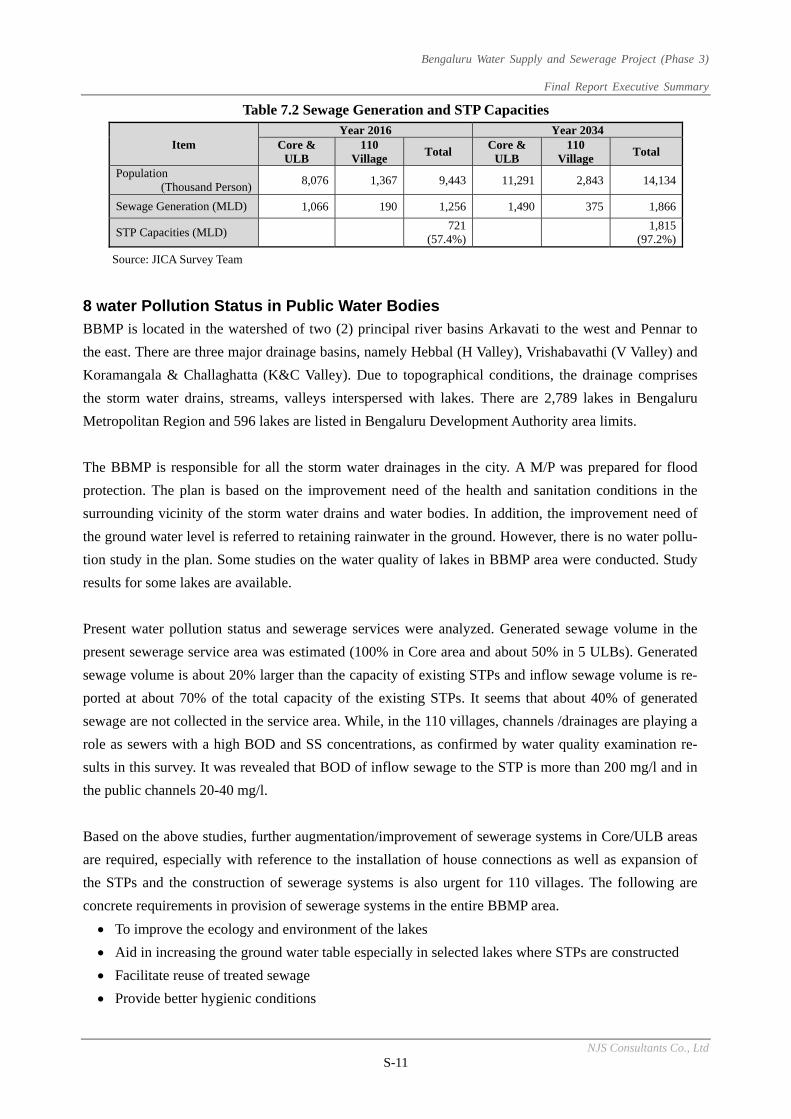
Bengaluru Water Supply and Sewerage Project (Phase 3)
Final Report Executive Summary
NJS Consultants Co., Ltd S-11
Table 7.2 Sewage Generation and STP Capacities
Item Year 2016 Year 2034
Core & ULB
110 Village
Total Core &
ULB 110
Village Total
Population (Thousand Person)
8,076 1,367 9,443 11,291 2,843 14,134
Sewage Generation (MLD) 1,066 190 1,256 1,490 375 1,866
STP Capacities (MLD) 721
(57.4%) 1,815
(97.2%)
Source: JICA Survey Team
8 Water Pollution Status in Public Water Bodies
BBMP is located in the watershed of two (2) principal river basins Arkavati to the west and Pennar to
the east. There are three major drainage basins, namely Hebbal (H Valley), Vrishabavathi (V Valley) and
Koramangala & Challaghatta (K&C Valley). Due to topographical conditions, the drainage comprises
the storm water drains, streams, valleys interspersed with lakes. There are 2,789 lakes in Bengaluru
Metropolitan Region and 596 lakes are listed in Bengaluru Development Authority area limits.
The BBMP is responsible for all the storm water drainages in the city. A M/P was prepared for flood
protection. The plan is based on the improvement need of the health and sanitation conditions in the
surrounding vicinity of the storm water drains and water bodies. In addition, the improvement need of
the ground water level is referred to retaining rainwater in the ground. However, there is no water pollu-
tion study in the plan. Some studies on the water quality of lakes in BBMP area were conducted. Study
results for some lakes are available.
Present water pollution status and sewerage services were analyzed. Generated sewage volume in the
present sewerage service area was estimated (100% in Core area and about 50% in 5 ULBs). Generated
sewage volume is about 20% larger than the capacity of existing STPs and inflow sewage volume is re-
ported at about 70% of the total capacity of the existing STPs. It seems that about 40% of generated
sewage are not collected in the service area. While, in the 110 villages, channels /drainages are playing a
role as sewers with a high BOD and SS concentrations, as confirmed by water quality examination re-
sults in this survey. It was revealed that BOD of inflow sewage to the STP is more than 200 mg/l and in
the public channels 20-40 mg/l.
Based on the above studies, further augmentation/improvement of sewerage systems in Core/ULB areas
are required, especially with reference to the installation of house connections as well as expansion of
the STPs and the construction of sewerage systems is also urgent for 110 villages. The following are
concrete requirements in provision of sewerage systems in the entire BBMP area.
To improve the ecology and environment of the lakes
Aid in increasing the ground water table especially in selected lakes where STPs are constructed
Facilitate reuse of treated sewage
Provide better hygienic conditions
Bengaluru Water Supply and Sewerage Project (Phase 3)
Final Report Executive Summary
NJS Consultants Co., Ltd S-12
9 Project Needs and Implementation Arrangements for Proposed Projects
(1) Project Needs and Expected Benefits
Bengaluru city has expanded rapidly with establishment of job generating industries. The changes in
land use have resulted in the increase of water demand and need of sanitation improvement such as
sewerage services. Currently, water supply for the BBMP area is provided using surface water from
Cauvery River and groundwater. Due to limited groundwater source available, effective use of it has
become important day by day requiring the increase of the water supply from the Cauvery River.
A lot of foreign companies have been investing in the overall India. There are a total of 451 Japanese
establishments in Karnataka as of October, 2016 (information from JETRO India), which is about three
(3) times of that in 2010. There are nine (9) major industrial areas in Bengaluru metropolitan area.
Under current land development in the BBMP area, the industrial areas operated by foreign companies
are no more in the Core/ULB areas, located beyond 110 villages areas. The water supply in the 110 vil-
lages from where the employees commute to the industrial areas and their surrounding areas where for-
eign enterprises are located, is presently provided by individual groundwater sources. The sewerage ser-
vices in the areas are also quite limited. The improvement of water supply and sanitation sector in the
above mentioned areas are urgently required. Specific needs/benefits are as follows:
Uniform water supply and sewerage services can be provided in the BBMP area.
In provision of Stage V Project, water demand and supply amount can be balanced up to year
2034, which allows for 24/7 (24 hours 7 days) water supply in the BBMP area.
Development in 110 villages can be accelerated and mitigation in the Core area is expected.
Profile of the City with environmental soundness can be enhanced.
(2) Implementation Arrangements for Proposed Projects
BWSSB proposed three major projects as shown below.
110 Villages Water Supply and Sewerage Project
CWSS Stage V Project
UFW Reduction Project (Majority of UFW is assumed to be caused by leakage based on the ex-
perience in the on-going UFW reduction project)
The proposed projects were sorted into two groups; one for those to prepare preliminary design of facili-
ties by JICA Survey and another to be undertaken by Indian side utilizing local funds, as shown below.
Table 9.1 summarizes the reasons of the sorting proposed projects into two groups.
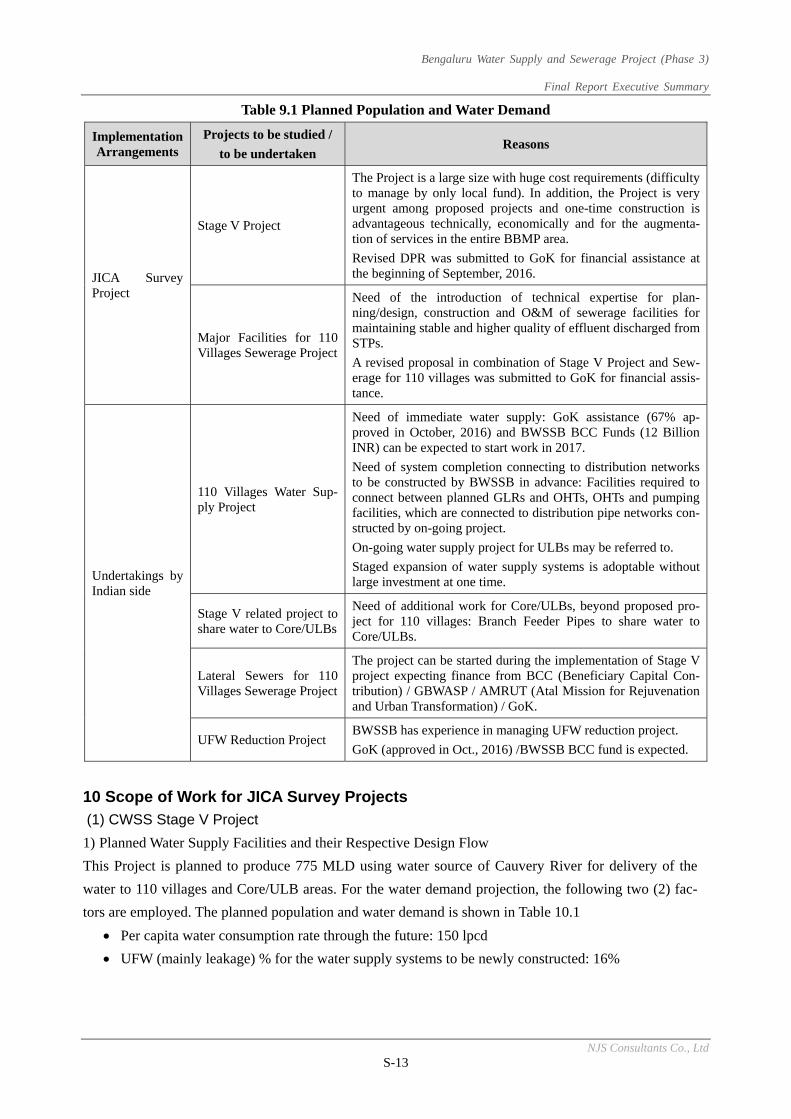
Bengaluru Water Supply and Sewerage Project (Phase 3)
Final Report Executive Summary
NJS Consultants Co., Ltd S-13
Table 9.1 Planned Population and Water Demand
Implementation Arrangements
Projects to be studied /
to be undertaken Reasons
JICA Survey Project
Stage V Project
The Project is a large size with huge cost requirements (difficulty to manage by only local fund). In addition, the Project is very urgent among proposed projects and one-time construction is advantageous technically, economically and for the augmenta-tion of services in the entire BBMP area.
Revised DPR was submitted to GoK for financial assistance at the beginning of September, 2016.
Major Facilities for 110 Villages Sewerage Project
Need of the introduction of technical expertise for plan-ning/design, construction and O&M of sewerage facilities for maintaining stable and higher quality of effluent discharged from STPs.
A revised proposal in combination of Stage V Project and Sew-erage for 110 villages was submitted to GoK for financial assis-tance.
Undertakings by Indian side
110 Villages Water Sup-ply Project
Need of immediate water supply: GoK assistance (67% ap-proved in October, 2016) and BWSSB BCC Funds (12 Billion INR) can be expected to start work in 2017.
Need of system completion connecting to distribution networks to be constructed by BWSSB in advance: Facilities required to connect between planned GLRs and OHTs, OHTs and pumping facilities, which are connected to distribution pipe networks con-structed by on-going project.
On-going water supply project for ULBs may be referred to.
Staged expansion of water supply systems is adoptable without large investment at one time.
Stage V related project to share water to Core/ULBs
Need of additional work for Core/ULBs, beyond proposed pro-ject for 110 villages: Branch Feeder Pipes to share water to Core/ULBs.
Lateral Sewers for 110 Villages Sewerage Project
The project can be started during the implementation of Stage V project expecting finance from BCC (Beneficiary Capital Con-tribution) / GBWASP / AMRUT (Atal Mission for Rejuvenation and Urban Transformation) / GoK.
UFW Reduction Project BWSSB has experience in managing UFW reduction project.
GoK (approved in Oct., 2016) /BWSSB BCC fund is expected.
10 Scope of Work for JICA Survey Projects
(1) CWSS Stage V Project
1) Planned Water Supply Facilities and their Respective Design Flow
This Project is planned to produce 775 MLD using water source of Cauvery River for delivery of the
water to 110 villages and Core/ULB areas. For the water demand projection, the following two (2) fac-
tors are employed. The planned population and water demand is shown in Table 10.1
Per capita water consumption rate through the future: 150 lpcd
UFW (mainly leakage) % for the water supply systems to be newly constructed: 16%
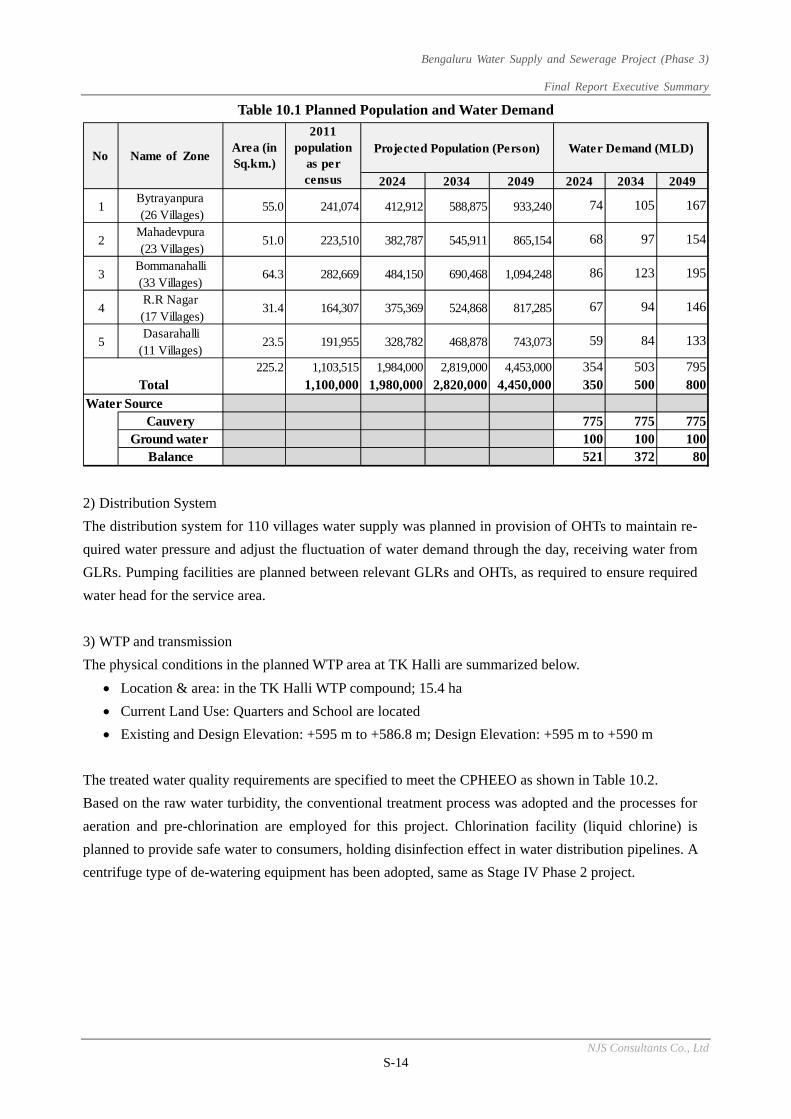
Bengaluru Water Supply and Sewerage Project (Phase 3)
Final Report Executive Summary
NJS Consultants Co., Ltd S-14
Table 10.1 Planned Population and Water Demand
2) Distribution System
The distribution system for 110 villages water supply was planned in provision of OHTs to maintain re-
quired water pressure and adjust the fluctuation of water demand through the day, receiving water from
GLRs. Pumping facilities are planned between relevant GLRs and OHTs, as required to ensure required
water head for the service area.
3) WTP and transmission
The physical conditions in the planned WTP area at TK Halli are summarized below.
Location & area: in the TK Halli WTP compound; 15.4 ha
Current Land Use: Quarters and School are located
Existing and Design Elevation: +595 m to +586.8 m; Design Elevation: +595 m to +590 m
The treated water quality requirements are specified to meet the CPHEEO as shown in Table 10.2.
Based on the raw water turbidity, the conventional treatment process was adopted and the processes for
aeration and pre-chlorination are employed for this project. Chlorination facility (liquid chlorine) is
planned to provide safe water to consumers, holding disinfection effect in water distribution pipelines. A
centrifuge type of de-watering equipment has been adopted, same as Stage IV Phase 2 project.
Projected Population (Person) Water Demand (MLD)
2024 2034 2049 2024 2034 2049
1Bytrayanpura (26 Villages)
55.0 241,074 412,912 588,875 933,240 74 105 167
2Mahadevpura (23 Villages)
51.0 223,510 382,787 545,911 865,154 68 97 154
3Bommanahalli(33 Villages)
64.3 282,669 484,150 690,468 1,094,248 86 123 195
4R.R Nagar
(17 Villages)31.4 164,307 375,369 524,868 817,285 67 94 146
5Dasarahalli
(11 Villages)23.5 191,955 328,782 468,878 743,073 59 84 133
225.2 1,103,515 1,984,000 2,819,000 4,453,000 354 503 7951,100,000 1,980,000 2,820,000 4,450,000 350 500 800
Water SourceCauvery 775 775 775
Ground water 100 100 100Balance 521 372 80
No Name of ZoneArea (inSq.km.)
2011population
as percensus
Total
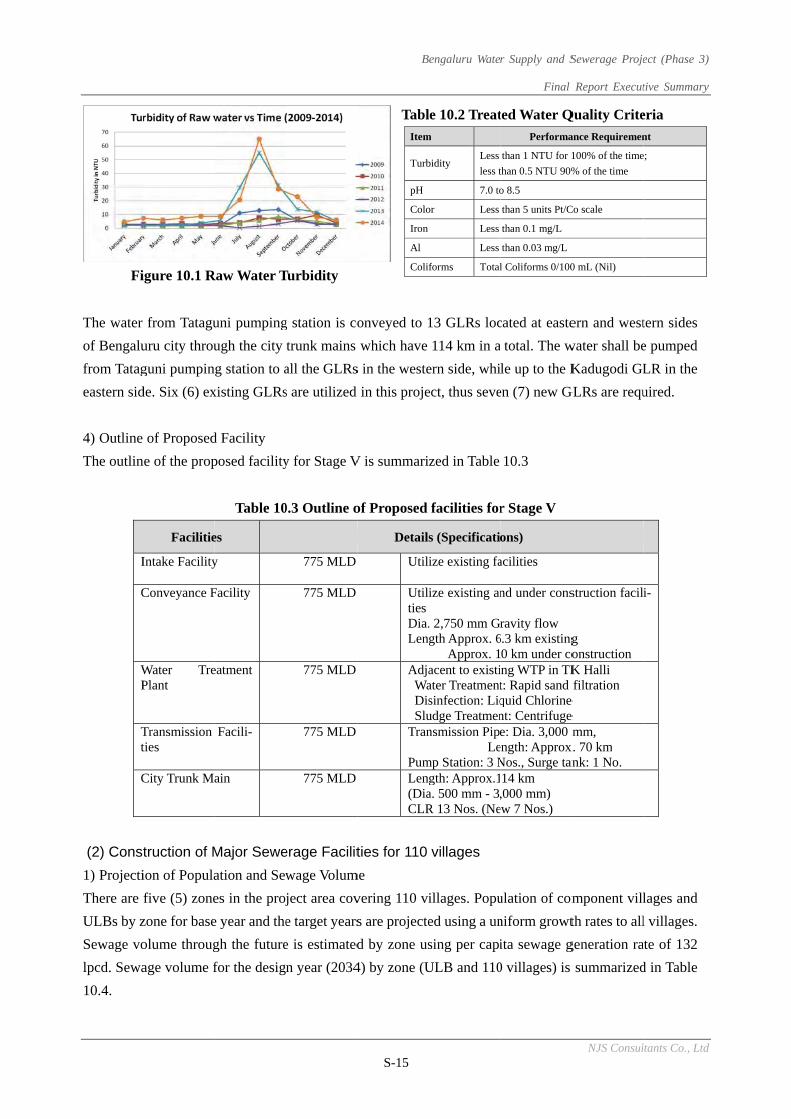
Fi
The water
of Bengalu
from Tatag
eastern sid
4) Outline
The outlin
I
C
WP
Tt
C
(2) Cons
1) Projecti
There are
ULBs by z
Sewage vo
lpcd. Sewa
10.4.
igure 10.1 R
from Tatagu
uru city throu
guni pumpin
de. Six (6) ex
of Proposed
ne of the prop
Facilitie
Intake Facility
Conveyance F
Water TrePlant
Transmission ties
City Trunk Ma
truction of M
ion of Popula
five (5) zone
zone for base
olume throug
age volume f
Raw Water T
uni pumping
ugh the city
g station to a
xisting GLRs
d Facility
posed facility
Table 10
es
y
Facility
eatment
Facili-
ain
Major Sewe
ation and Sew
es in the proj
e year and the
gh the future
for the desig
Turbidity
g station is co
trunk mains
all the GLRs
s are utilized
y for Stage V
0.3 Outline o
775 MLD
775 MLD
775 MLD
775 MLD
775 MLD
erage Facilit
wage Volum
ject area cov
e target years
e is estimated
n year (2034
B
S-15
Tabl
onveyed to 1
which have
s in the weste
in this proje
V is summari
of Proposed
Details
Utili UtilitiesDia.Leng
Adja Wa Dis SluTran
PumLeng(DiaCLR
ties for 110
me
vering 110 vi
s are projecte
d by zone us
4) by zone (U
Item
Turb
pH
Colo
Iron
Al
Colif
engaluru Wate
le 10.2 Treat
13 GLRs loc
114 km in a
ern side, whi
ect, thus seve
zed in Table
facilities for
s (Specificati
ize existing fa
ize existing an
. 2,750 mm Ggth Approx. 6 Approx. 1
acent to existiater Treatmentsinfection: Liqudge Treatmennsmission Pip
Lemp Station: 3 Ngth: Approx.1a. 500 mm - 3,R 13 Nos. (Ne
villages
illages. Popu
ed using a un
sing per capi
ULB and 110
m
bidity Less
less t
7.0 to
or Less
Less
Less
forms Total
r Supply and S
Final
ted Water Q
cated at easte
total. The w
le up to the K
en (7) new G
10.3
r Stage V
ons)
acilities
nd under cons
ravity flow 6.3 km existing0 km under co
ing WTP in TKt: Rapid sand quid Chlorine nt: Centrifuge e: Dia. 3,000 m
ength: ApproxNos., Surge tan14 km ,000 mm)
ew 7 Nos.)
ulation of com
niform growt
ita sewage g
0 villages) is
Performa
than 1 NTU for 1
than 0.5 NTU 90%
o 8.5
than 5 units Pt/C
than 0.1 mg/L
than 0.03 mg/L
l Coliforms 0/100
Sewerage Proje
Report Execut
NJS Consul
Quality Crite
ern and west
water shall be
Kadugodi GL
GLRs are requ
struction facil
g onstruction K Halli filtration
e e mm,
x. 70 km ank: 1 No.
mponent vill
th rates to all
generation ra
summarized
ance Requiremen
100% of the time
% of the time
Co scale
0 mL (Nil)
ect (Phase 3)
tive Summary
ltants Co., Ltd
eria
tern sides
e pumped
LR in the
uired.
i-
lages and
l villages.
ate of 132
d in Table
nt
e;
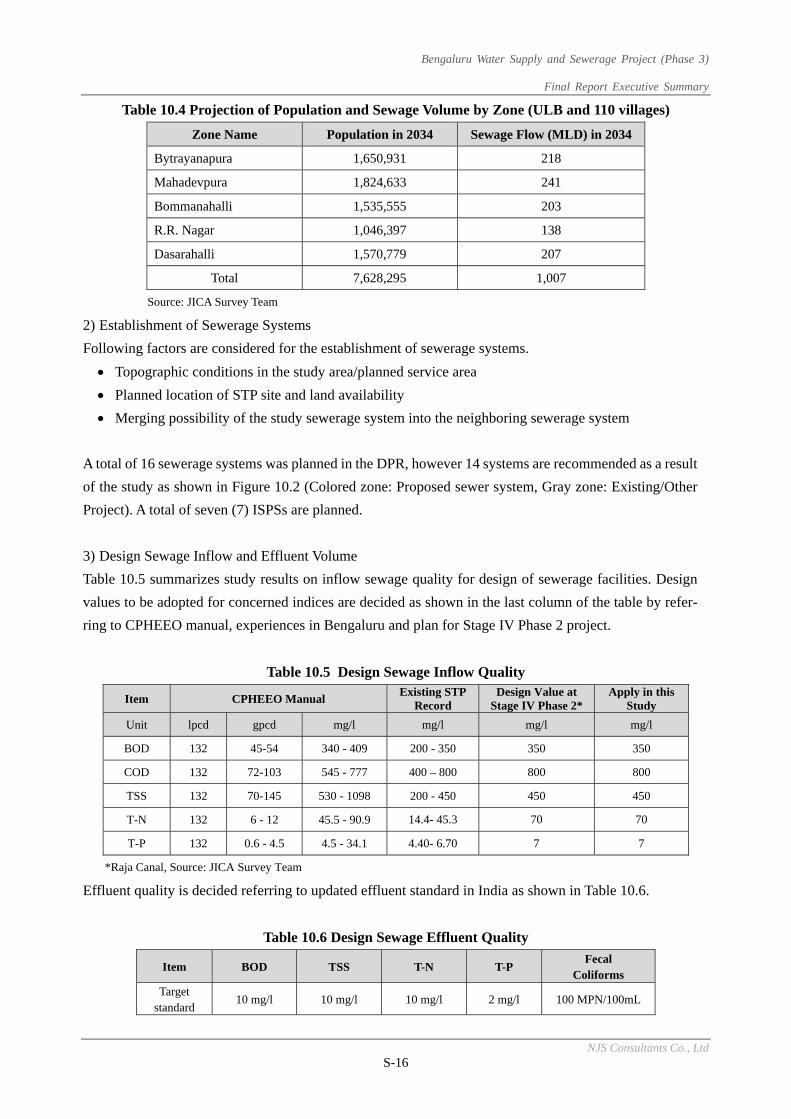
Bengaluru Water Supply and Sewerage Project (Phase 3)
Final Report Executive Summary
NJS Consultants Co., Ltd S-16
Table 10.4 Projection of Population and Sewage Volume by Zone (ULB and 110 villages)
Zone Name Population in 2034 Sewage Flow (MLD) in 2034
Bytrayanapura 1,650,931 218
Mahadevpura 1,824,633 241
Bommanahalli 1,535,555 203
R.R. Nagar 1,046,397 138
Dasarahalli 1,570,779 207
Total 7,628,295 1,007
Source: JICA Survey Team
2) Establishment of Sewerage Systems
Following factors are considered for the establishment of sewerage systems.
Topographic conditions in the study area/planned service area
Planned location of STP site and land availability
Merging possibility of the study sewerage system into the neighboring sewerage system
A total of 16 sewerage systems was planned in the DPR, however 14 systems are recommended as a result
of the study as shown in Figure 10.2 (Colored zone: Proposed sewer system, Gray zone: Existing/Other
Project). A total of seven (7) ISPSs are planned.
3) Design Sewage Inflow and Effluent Volume
Table 10.5 summarizes study results on inflow sewage quality for design of sewerage facilities. Design
values to be adopted for concerned indices are decided as shown in the last column of the table by refer-
ring to CPHEEO manual, experiences in Bengaluru and plan for Stage IV Phase 2 project.
Table 10.5 Design Sewage Inflow Quality
Item CPHEEO Manual Existing STP
Record Design Value at
Stage IV Phase 2* Apply in this
Study
Unit lpcd gpcd mg/l mg/l mg/l mg/l
BOD 132 45-54 340 - 409 200 - 350 350 350
COD 132 72-103 545 - 777 400 – 800 800 800
TSS 132 70-145 530 - 1098 200 - 450 450 450
T-N 132 6 - 12 45.5 - 90.9 14.4- 45.3 70 70
T-P 132 0.6 - 4.5 4.5 - 34.1 4.40- 6.70 7 7
*Raja Canal, Source: JICA Survey Team
Effluent quality is decided referring to updated effluent standard in India as shown in Table 10.6.
Table 10.6 Design Sewage Effluent Quality
Item BOD TSS T-N T-P Fecal
Coliforms
Target standard
10 mg/l 10 mg/l 10 mg/l 2 mg/l 100 MPN/100mL
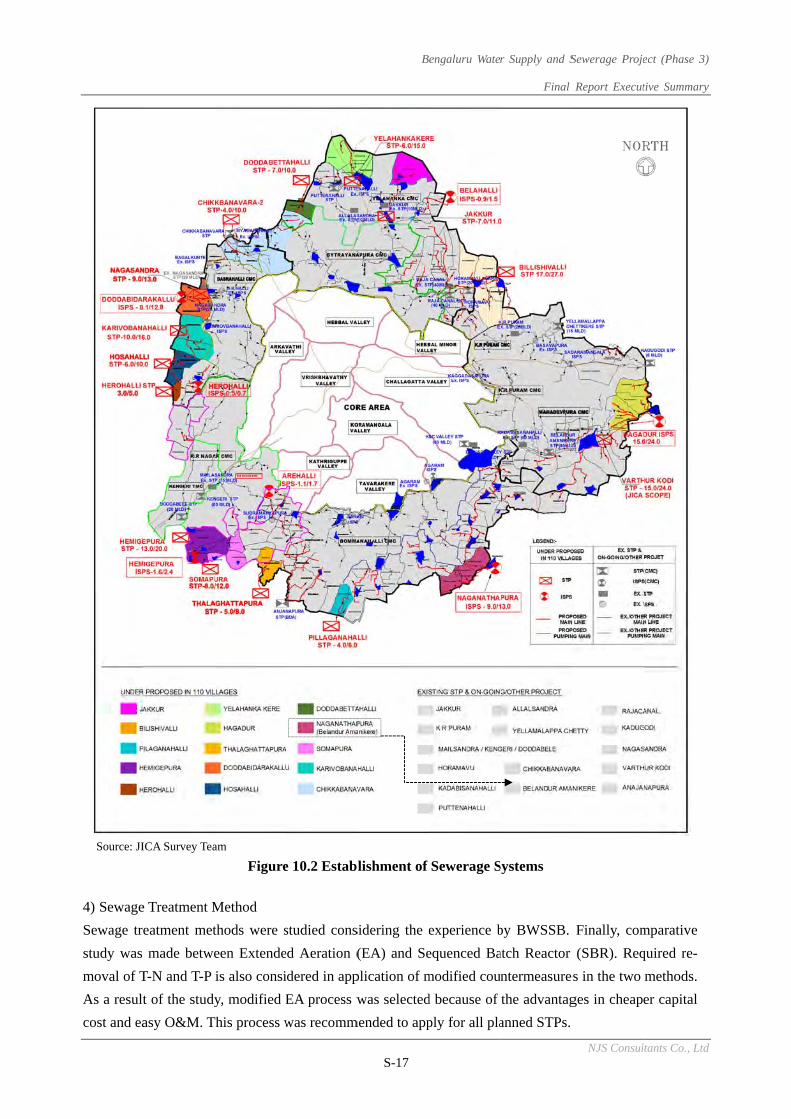
Source: JI
4) Sewage
Sewage tr
study was
moval of T
As a result
cost and ea
ICA Survey Tea
e Treatment M
eatment met
made betwe
T-N and T-P
t of the study
asy O&M. T
am
Figure
Method
thods were s
een Extende
is also consi
y, modified E
This process w
e 10.2 Establ
studied cons
ed Aeration (
idered in app
EA process w
was recomm
B
S-17
lishment of
sidering the e
(EA) and Se
plication of m
was selected
mended to app
engaluru Wate
Sewerage S
experience b
equenced Ba
modified cou
d because of
ply for all pla
r Supply and S
Final
Systems
by BWSSB.
atch Reactor
ntermeasure
the advantag
anned STPs.
Sewerage Proje
Report Execut
NJS Consul
Finally, com
(SBR). Req
es in the two
ges in cheap
ect (Phase 3)
tive Summary
ltants Co., Ltd
mparative
quired re-
methods.
er capital
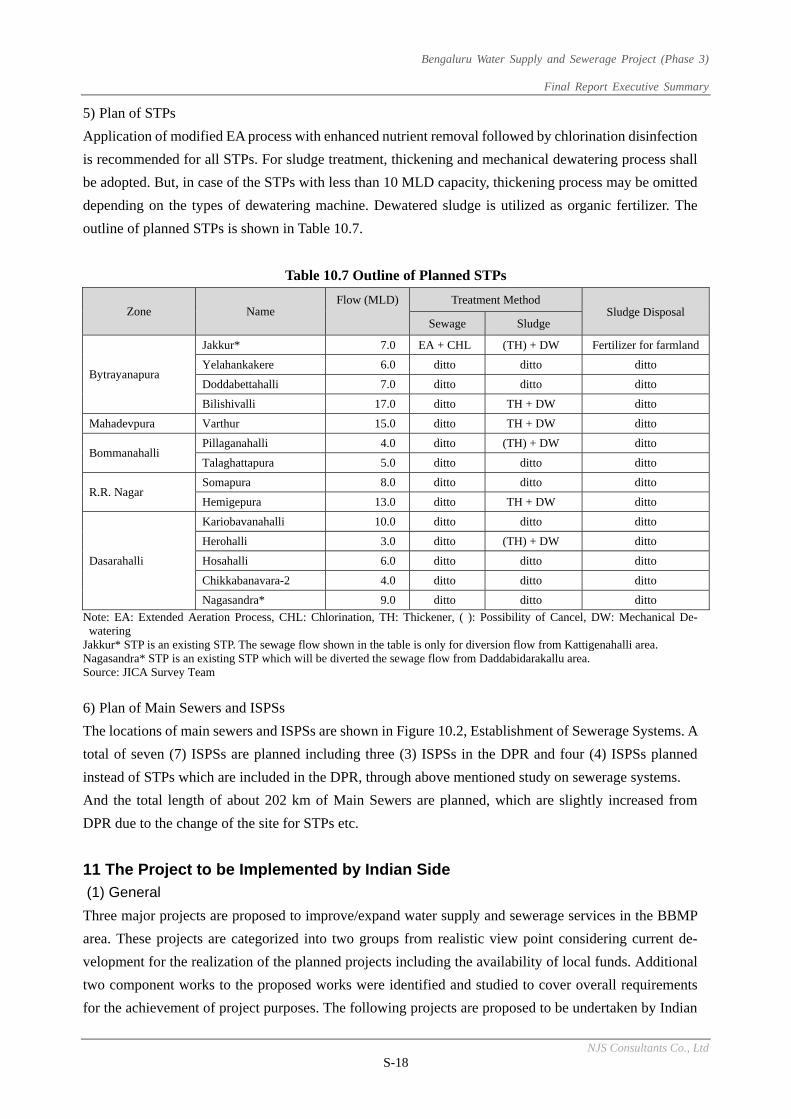
Bengaluru Water Supply and Sewerage Project (Phase 3)
Final Report Executive Summary
NJS Consultants Co., Ltd S-18
5) Plan of STPs
Application of modified EA process with enhanced nutrient removal followed by chlorination disinfection
is recommended for all STPs. For sludge treatment, thickening and mechanical dewatering process shall
be adopted. But, in case of the STPs with less than 10 MLD capacity, thickening process may be omitted
depending on the types of dewatering machine. Dewatered sludge is utilized as organic fertilizer. The
outline of planned STPs is shown in Table 10.7.
Table 10.7 Outline of Planned STPs
Zone Name Flow (MLD) Treatment Method
Sludge Disposal Sewage Sludge
Bytrayanapura
Jakkur* 7.0 EA + CHL (TH) + DW Fertilizer for farmland
Yelahankakere 6.0 ditto ditto ditto
Doddabettahalli 7.0 ditto ditto ditto
Bilishivalli 17.0 ditto TH + DW ditto
Mahadevpura Varthur 15.0 ditto TH + DW ditto
Bommanahalli Pillaganahalli 4.0 ditto (TH) + DW ditto
Talaghattapura 5.0 ditto ditto ditto
R.R. Nagar Somapura 8.0 ditto ditto ditto
Hemigepura 13.0 ditto TH + DW ditto
Dasarahalli
Kariobavanahalli 10.0 ditto ditto ditto
Herohalli 3.0 ditto (TH) + DW ditto
Hosahalli 6.0 ditto ditto ditto
Chikkabanavara-2 4.0 ditto ditto ditto
Nagasandra* 9.0 ditto ditto ditto
Note: EA: Extended Aeration Process, CHL: Chlorination, TH: Thickener, ( ): Possibility of Cancel, DW: Mechanical De-watering
Jakkur* STP is an existing STP. The sewage flow shown in the table is only for diversion flow from Kattigenahalli area. Nagasandra* STP is an existing STP which will be diverted the sewage flow from Daddabidarakallu area. Source: JICA Survey Team
6) Plan of Main Sewers and ISPSs
The locations of main sewers and ISPSs are shown in Figure 10.2, Establishment of Sewerage Systems. A
total of seven (7) ISPSs are planned including three (3) ISPSs in the DPR and four (4) ISPSs planned
instead of STPs which are included in the DPR, through above mentioned study on sewerage systems.
And the total length of about 202 km of Main Sewers are planned, which are slightly increased from
DPR due to the change of the site for STPs etc.
11 The Project to be Implemented by Indian Side
(1) General
Three major projects are proposed to improve/expand water supply and sewerage services in the BBMP
area. These projects are categorized into two groups from realistic view point considering current de-
velopment for the realization of the planned projects including the availability of local funds. Additional
two component works to the proposed works were identified and studied to cover overall requirements
for the achievement of project purposes. The following projects are proposed to be undertaken by Indian
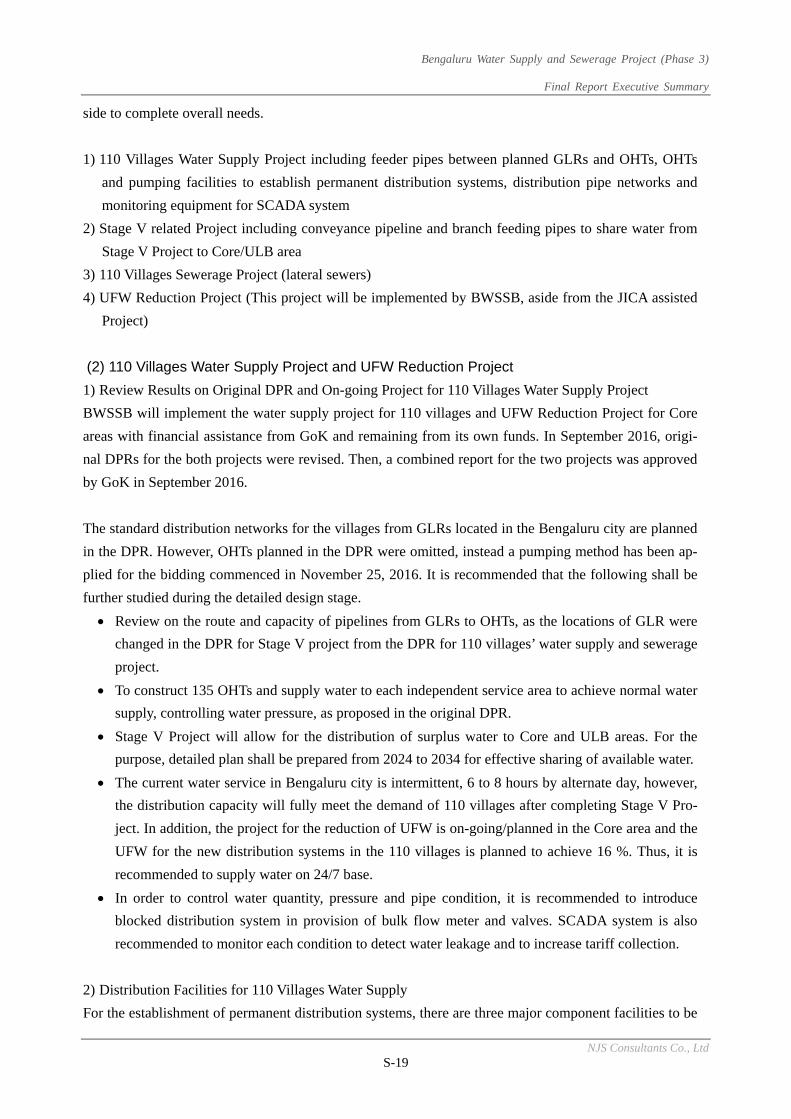
Bengaluru Water Supply and Sewerage Project (Phase 3)
Final Report Executive Summary
NJS Consultants Co., Ltd S-19
side to complete overall needs.
1) 110 Villages Water Supply Project including feeder pipes between planned GLRs and OHTs, OHTs
and pumping facilities to establish permanent distribution systems, distribution pipe networks and
monitoring equipment for SCADA system
2) Stage V related Project including conveyance pipeline and branch feeding pipes to share water from
Stage V Project to Core/ULB area
3) 110 Villages Sewerage Project (lateral sewers)
4) UFW Reduction Project (This project will be implemented by BWSSB, aside from the JICA assisted
Project)
(2) 110 Villages Water Supply Project and UFW Reduction Project
1) Review Results on Original DPR and On-going Project for 110 Villages Water Supply Project
BWSSB will implement the water supply project for 110 villages and UFW Reduction Project for Core
areas with financial assistance from GoK and remaining from its own funds. In September 2016, origi-
nal DPRs for the both projects were revised. Then, a combined report for the two projects was approved
by GoK in September 2016.
The standard distribution networks for the villages from GLRs located in the Bengaluru city are planned
in the DPR. However, OHTs planned in the DPR were omitted, instead a pumping method has been ap-
plied for the bidding commenced in November 25, 2016. It is recommended that the following shall be
further studied during the detailed design stage.
Review on the route and capacity of pipelines from GLRs to OHTs, as the locations of GLR were
changed in the DPR for Stage V project from the DPR for 110 villages’ water supply and sewerage
project.
To construct 135 OHTs and supply water to each independent service area to achieve normal water
supply, controlling water pressure, as proposed in the original DPR.
Stage V Project will allow for the distribution of surplus water to Core and ULB areas. For the
purpose, detailed plan shall be prepared from 2024 to 2034 for effective sharing of available water.
The current water service in Bengaluru city is intermittent, 6 to 8 hours by alternate day, however,
the distribution capacity will fully meet the demand of 110 villages after completing Stage V Pro-
ject. In addition, the project for the reduction of UFW is on-going/planned in the Core area and the
UFW for the new distribution systems in the 110 villages is planned to achieve 16 %. Thus, it is
recommended to supply water on 24/7 base.
In order to control water quantity, pressure and pipe condition, it is recommended to introduce
blocked distribution system in provision of bulk flow meter and valves. SCADA system is also
recommended to monitor each condition to detect water leakage and to increase tariff collection.
2) Distribution Facilities for 110 Villages Water Supply
For the establishment of permanent distribution systems, there are three major component facilities to be
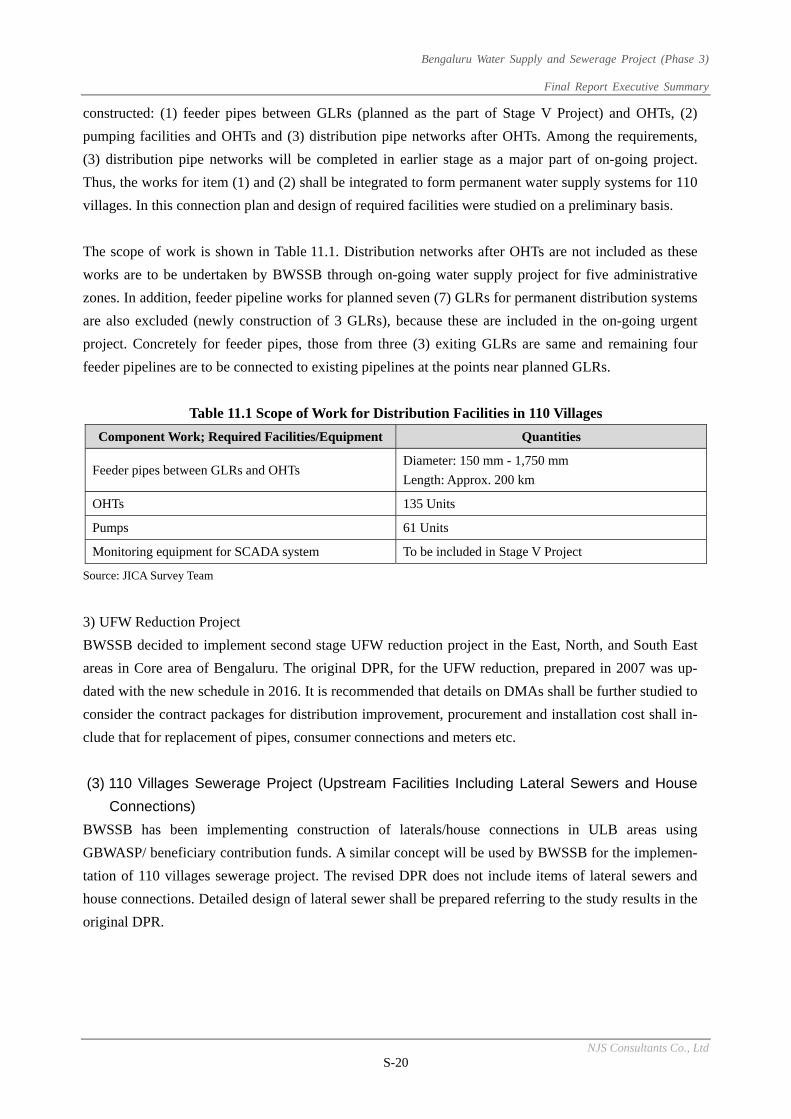
Bengaluru Water Supply and Sewerage Project (Phase 3)
Final Report Executive Summary
NJS Consultants Co., Ltd S-20
constructed: (1) feeder pipes between GLRs (planned as the part of Stage V Project) and OHTs, (2)
pumping facilities and OHTs and (3) distribution pipe networks after OHTs. Among the requirements,
(3) distribution pipe networks will be completed in earlier stage as a major part of on-going project.
Thus, the works for item (1) and (2) shall be integrated to form permanent water supply systems for 110
villages. In this connection plan and design of required facilities were studied on a preliminary basis.
The scope of work is shown in Table 11.1. Distribution networks after OHTs are not included as these
works are to be undertaken by BWSSB through on-going water supply project for five administrative
zones. In addition, feeder pipeline works for planned seven (7) GLRs for permanent distribution systems
are also excluded (newly construction of 3 GLRs), because these are included in the on-going urgent
project. Concretely for feeder pipes, those from three (3) exiting GLRs are same and remaining four
feeder pipelines are to be connected to existing pipelines at the points near planned GLRs.
Table 11.1 Scope of Work for Distribution Facilities in 110 Villages
Component Work; Required Facilities/Equipment Quantities
Feeder pipes between GLRs and OHTs Diameter: 150 mm - 1,750 mm
Length: Approx. 200 km
OHTs 135 Units
Pumps 61 Units
Monitoring equipment for SCADA system To be included in Stage V Project
Source: JICA Survey Team
3) UFW Reduction Project
BWSSB decided to implement second stage UFW reduction project in the East, North, and South East
areas in Core area of Bengaluru. The original DPR, for the UFW reduction, prepared in 2007 was up-
dated with the new schedule in 2016. It is recommended that details on DMAs shall be further studied to
consider the contract packages for distribution improvement, procurement and installation cost shall in-
clude that for replacement of pipes, consumer connections and meters etc.
(3) 110 Villages Sewerage Project (Upstream Facilities Including Lateral Sewers and House
Connections)
BWSSB has been implementing construction of laterals/house connections in ULB areas using
GBWASP/ beneficiary contribution funds. A similar concept will be used by BWSSB for the implemen-
tation of 110 villages sewerage project. The revised DPR does not include items of lateral sewers and
house connections. Detailed design of lateral sewer shall be prepared referring to the study results in the
original DPR.
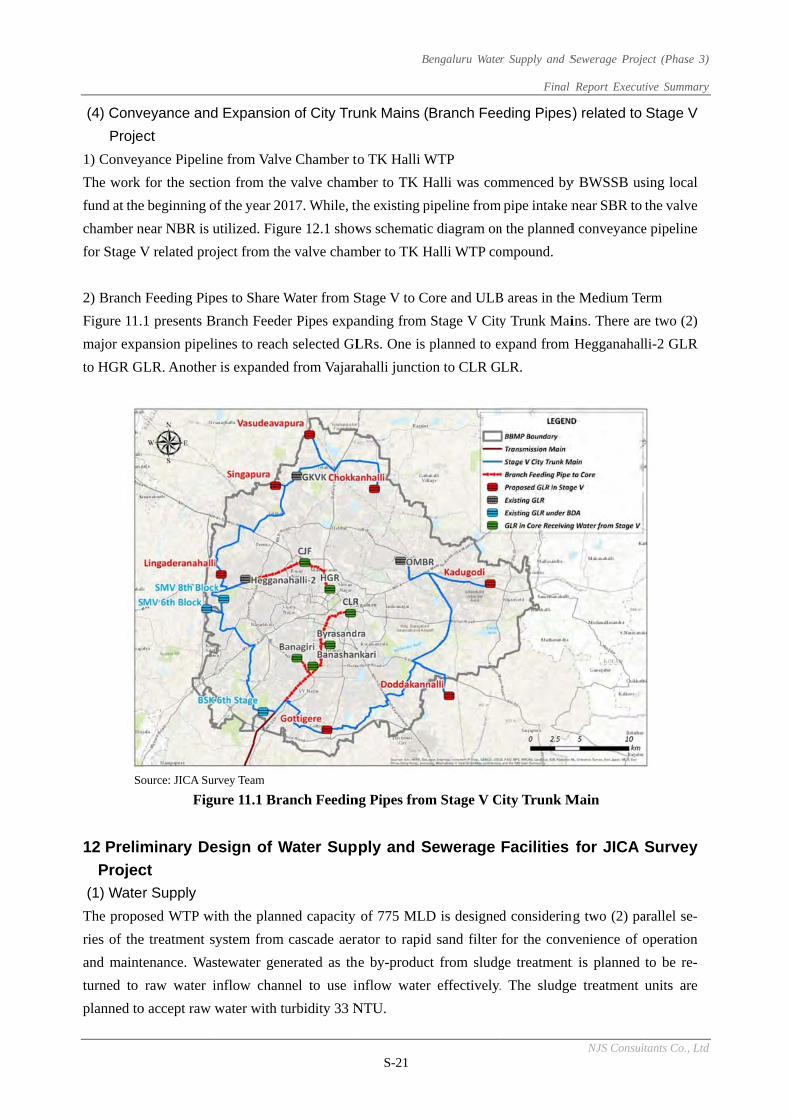
(4) Conv
Proje
1) Convey
The work
fund at the
chamber n
for Stage V
2) Branch
Figure 11.
major expa
to HGR G
So
12 Prelim
Projec
(1) Wate
The propo
ries of the
and maint
turned to
planned to
eyance and
ct
yance Pipelin
for the secti
e beginning o
near NBR is u
V related pro
Feeding Pip
1 presents B
ansion pipeli
LR. Another
ource: JICA Sur
Figu
minary De
ct
r Supply
osed WTP wi
e treatment s
enance. Was
raw water i
o accept raw
d Expansion
ne from Valv
ion from the
of the year 20
utilized. Figu
oject from the
pes to Share W
Branch Feede
ines to reach
r is expanded
rvey Team
ure 11.1 Bra
esign of W
ith the plann
system from
stewater gen
inflow chann
water with tu
n of City Tru
e Chamber to
valve cham
017. While, th
ure 12.1 show
e valve cham
Water from S
er Pipes expa
h selected GL
d from Vajara
anch Feedin
Water Sup
ned capacity
cascade aera
nerated as th
nel to use in
urbidity 33 N
B
S-21
unk Mains (
o TK Halli W
mber to TK H
he existing p
ws schematic
mber to TK H
Stage V to Co
anding from
LRs. One is
ahalli junctio
ng Pipes from
ply and S
of 775 MLD
ator to rapid
he by-produc
nflow water
NTU.
engaluru Wate
Branch Fee
WTP
Halli was com
pipeline from
c diagram on
Halli WTP co
ore and ULB
Stage V City
planned to e
on to CLR G
m Stage V C
Sewerage
D is designed
d sand filter
ct from sludg
r effectively.
r Supply and S
Final
eding Pipes
mmenced by
pipe intake n
n the planned
ompound.
B areas in the
y Trunk Mai
expand from
LR.
City Trunk M
Facilities
d considerin
for the conv
ge treatment
. The sludge
Sewerage Proje
Report Execut
NJS Consul
) related to
y BWSSB us
near SBR to
d conveyance
e Medium Te
ins. There ar
Hegganahal
Main
for JICA
ng two (2) pa
venience of o
t is planned
e treatment
ect (Phase 3)
tive Summary
ltants Co., Ltd
Stage V
sing local
the valve
e pipeline
erm
re two (2)
lli-2 GLR
Survey
arallel se-
operation
to be re-
units are
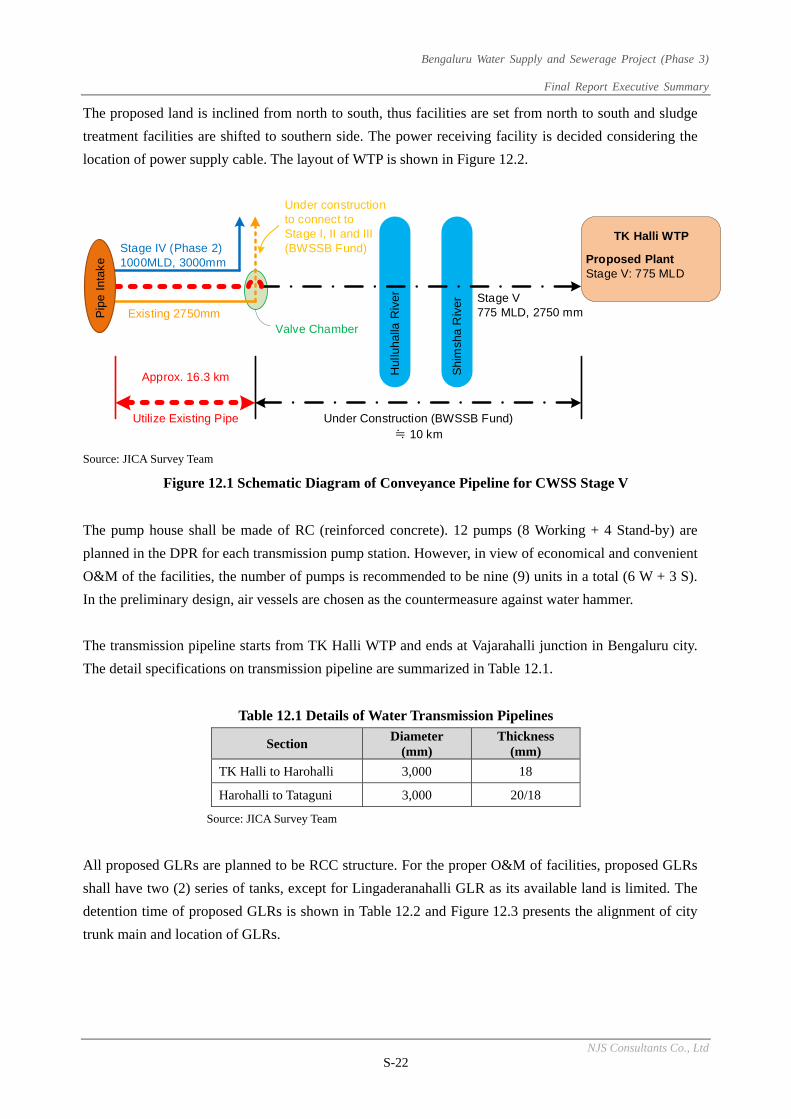
Bengaluru Water Supply and Sewerage Project (Phase 3)
Final Report Executive Summary
NJS Consultants Co., Ltd S-22
The proposed land is inclined from north to south, thus facilities are set from north to south and sludge
treatment facilities are shifted to southern side. The power receiving facility is decided considering the
location of power supply cable. The layout of WTP is shown in Figure 12.2.
Source: JICA Survey Team
Figure 12.1 Schematic Diagram of Conveyance Pipeline for CWSS Stage V
The pump house shall be made of RC (reinforced concrete). 12 pumps (8 Working + 4 Stand-by) are
planned in the DPR for each transmission pump station. However, in view of economical and convenient
O&M of the facilities, the number of pumps is recommended to be nine (9) units in a total (6 W + 3 S).
In the preliminary design, air vessels are chosen as the countermeasure against water hammer.
The transmission pipeline starts from TK Halli WTP and ends at Vajarahalli junction in Bengaluru city.
The detail specifications on transmission pipeline are summarized in Table 12.1.
Table 12.1 Details of Water Transmission Pipelines
Section Diameter
(mm) Thickness
(mm)
TK Halli to Harohalli 3,000 18
Harohalli to Tataguni 3,000 20/18
Source: JICA Survey Team
All proposed GLRs are planned to be RCC structure. For the proper O&M of facilities, proposed GLRs
shall have two (2) series of tanks, except for Lingaderanahalli GLR as its available land is limited. The
detention time of proposed GLRs is shown in Table 12.2 and Figure 12.3 presents the alignment of city
trunk main and location of GLRs.
H
ullu
halla
Riv
er
S
him
sha
Riv
er
TK Halli WTP
Proposed PlantStage V: 775 MLD
Stage IV (Phase 2)1000MLD, 3000mm
Existing 2750mmValve Chamber
Stage V775 MLD, 2750 mm
Under Construction (BWSSB Fund)
Approx. 16.3 km
≒ 10 kmUtilize Existing Pipe
Under constructionto connect to Stage I, II and III(BWSSB Fund)
Pip
e In
tak
e
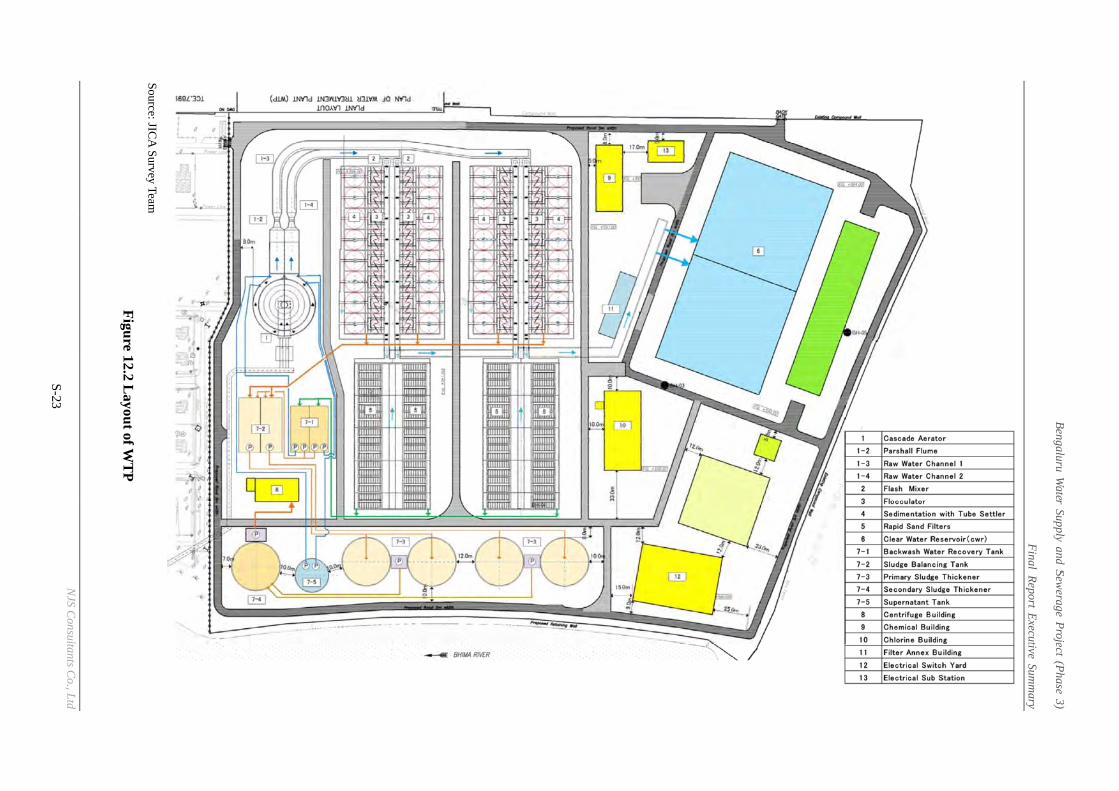
Source: JIC
A
A Survey Team
Figu
re 1
B
S-23
12.2 Layou
t engaluru Wate
t of WT
P
r Supply and S
Final Sew
erage Proje
Report E
xecut
NJS C
onsul ect (Phase 3)
tive Summ
ary
ltants Co., L
td
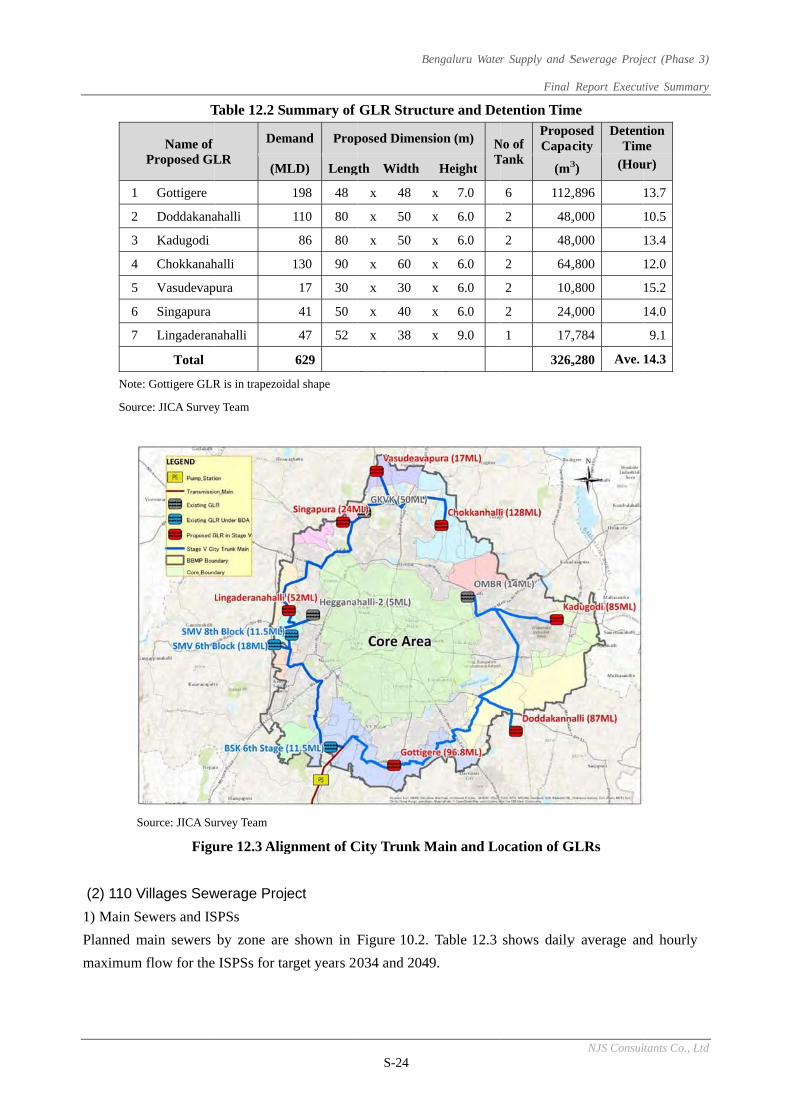
1
2
3
4
5
6
7
Note
Sourc
S
(2) 110 V
1) Main Se
Planned m
maximum
T
Name of Proposed GL
Gottigere
Doddakana
Kadugodi
Chokkanah
Vasudevap
Singapura
Lingaderan
Total
: Gottigere GLR
ce: JICA Survey
ource: JICA Su
Figu
Villages Sew
ewers and IS
main sewers
flow for the
Table 12.2 S
LR
Dem
(M
ahalli
halli
pura
nahalli
R is in trapezoid
y Team
urvey Team
ure 12.3 Alig
werage Proj
SPSs
by zone are
e ISPSs for ta
ummary of
mand Prop
MLD) Leng
198 48
110 80
86 80
130 90
17 30
41 50
47 52
629
dal shape
gnment of C
ect
e shown in F
arget years 20
B
S-24
GLR Struct
posed Dimens
gth Width
x 48
x 50
x 50
x 60
x 30
x 40
x 38
City Trunk M
Figure 10.2.
034 and 204
engaluru Wate
ture and De
sion (m) NT
Height
x 7.0
x 6.0
x 6.0
x 6.0
x 6.0
x 6.0
x 9.0
Main and Lo
Table 12.3
9.
r Supply and S
Final
etention Tim
No ofTank
PropoCapac
(m3
6 112,
2 48,
2 48,
2 64,
2 10,
2 24,
1 17,
326,
ocation of G
shows daily
Sewerage Proje
Report Execut
NJS Consul
me
osed acity
DetentTim
3) (Hou
,896
,000
,000
,800
,800
,000
,784
,280 Ave.
GLRs
y average an
ect (Phase 3)
tive Summary
ltants Co., Ltd
tionme ur)
13.7
10.5
13.4
12.0
15.2
14.0
9.1
14.3
nd hourly
Bengaluru Water Supply and Sewerage Project (Phase 3)
Final Report Executive Summary
NJS Consultants Co., Ltd S-25
Table 12.3 Design Flow for ISPSs
Zone
ISPS Design Flow (MLD)
No Name 2034 2049
Daily Average Hourly Max. Daily Average Hourly Max.
Bytrayanapura A-1 Bellahalli 0.9 2.7 1.5 4.5
Mahadevpura B-1 Hagadur 15.0 33.8 24.0 54.0
Bommanahalli C-1 Naganathapura 9.0 20.3 13.0 29.3
R.R. Nagar D-1 Arehalli 1 1.1 3.3 1.7 5.1
D-2 Hemigepura 1.6 4.8 2.4 7.2
Dasarahalli E-1 Herohalli 0.5 1.5 0.7 2.1
E-2 Doddabidarakallu 8.1 18.2 12.8 28.8
Source: JICA Survey Team
Table 12.4 shows the diameter and velocity of proposed pressure main.
Table 12.4 Diameter and Velocity of Proposed Pressure Main
Zone ISPS Diameter Length
Total Head
*V2034 *V2049
No Name mm m m m/s m/s
Bytrayanapura A-1 Bellahalli 250 1,380 37 0.71 1.06
Mahadevpura B-1 Hagadur 800 5,300 29 0.78 1.25
Bommanahalli C-1 Naganathapura 600 3,000 36 0.83 1.20
R.R. Nagar D-1 Arehalli 1 250 730 24 0.78 1.13
D-2 Hemigepura 400 1,500 25 0.61 0.90
Dasarahalli E-1 Herohalli 200
1100
(60m: Trenchless)15 0.56 0.89
E-2 Doddabidarakallu 600 2,300 33 0.75 1.20
Note: *V2034 is velocity at the year 2034. *V2049 is velocity at the year in 2049. Source: JICA Survey Team
2) STP
Process flow of sewage treatment plant is shown in Figure 12.4. For small size STPs with less than 10
MLD, sludge thickener which is circled by red break line in the flow is omitted, because direct sludge
dewatering method is applied to reduce the number of mechanical equipment.
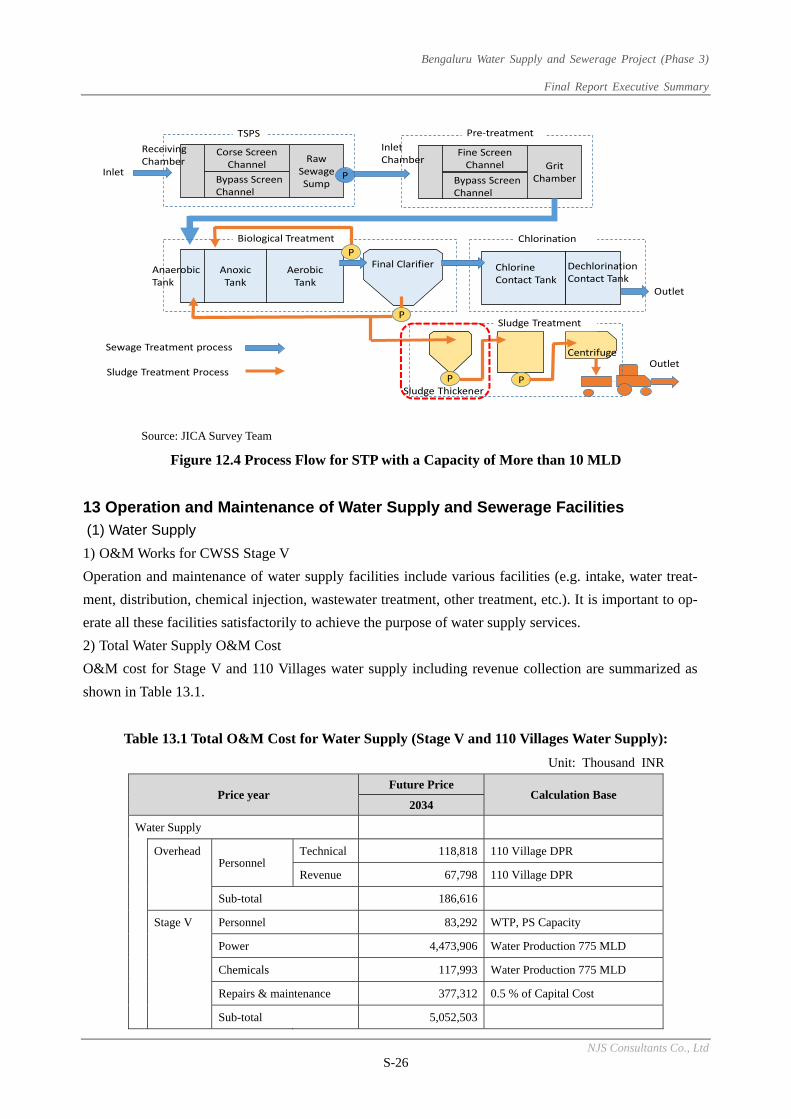
Bengaluru Water Supply and Sewerage Project (Phase 3)
Final Report Executive Summary
NJS Consultants Co., Ltd S-26
Source: JICA Survey Team
Figure 12.4 Process Flow for STP with a Capacity of More than 10 MLD
13 Operation and Maintenance of Water Supply and Sewerage Facilities
(1) Water Supply
1) O&M Works for CWSS Stage V
Operation and maintenance of water supply facilities include various facilities (e.g. intake, water treat-
ment, distribution, chemical injection, wastewater treatment, other treatment, etc.). It is important to op-
erate all these facilities satisfactorily to achieve the purpose of water supply services.
2) Total Water Supply O&M Cost
O&M cost for Stage V and 110 Villages water supply including revenue collection are summarized as
shown in Table 13.1.
Table 13.1 Total O&M Cost for Water Supply (Stage V and 110 Villages Water Supply):
Unit: Thousand INR
Price year Future Price
Calculation Base 2034
Water Supply
Overhead Personnel
Technical 118,818 110 Village DPR
Revenue 67,798 110 Village DPR
Sub-total 186,616
Stage V Personnel 83,292 WTP, PS Capacity
Power 4,473,906 Water Production 775 MLD
Chemicals 117,993 Water Production 775 MLD
Repairs & maintenance 377,312 0.5 % of Capital Cost
Sub-total 5,052,503
Corse ScreenChannel
Raw Sewage SumpBypass Screen
Channel
ReceivingChamber
TSPS
Fine ScreenChannel Grit
ChamberBypass ScreenChannel
InletChamber
Pre‐treatment
P
AnoxicTank
AerobicTank
AnaerobicTank
Biological Treatment
Final Clarifier ChlorineContact Tank
Chlorination
DechlorinationContact Tank
P
P
Inlet
Outlet
Sludge ThickenerP P
OutletCentrifuge
Sludge Treatment
Sewage Treatment process
Sludge Treatment Process
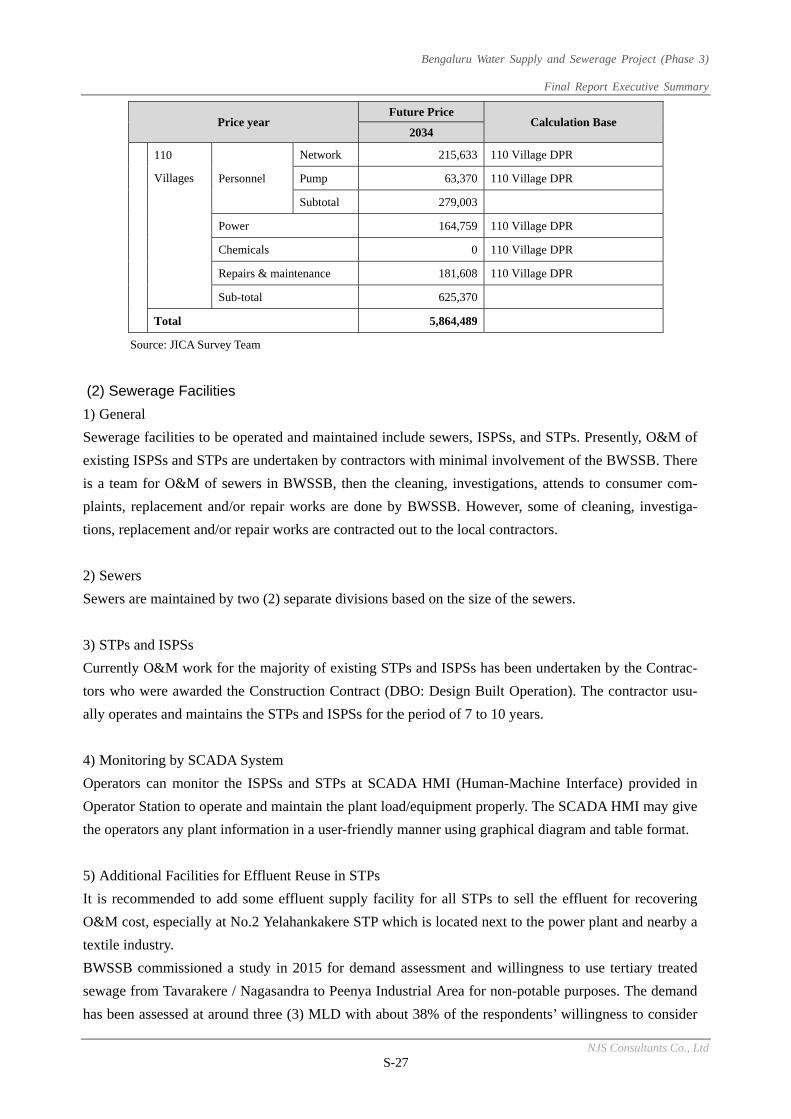
Bengaluru Water Supply and Sewerage Project (Phase 3)
Final Report Executive Summary
NJS Consultants Co., Ltd S-27
Price year Future Price
Calculation Base 2034
110
Villages Personnel
Network 215,633 110 Village DPR
Pump 63,370 110 Village DPR
Subtotal 279,003
Power 164,759 110 Village DPR
Chemicals 0 110 Village DPR
Repairs & maintenance 181,608 110 Village DPR
Sub-total 625,370
Total 5,864,489
Source: JICA Survey Team
(2) Sewerage Facilities
1) General
Sewerage facilities to be operated and maintained include sewers, ISPSs, and STPs. Presently, O&M of
existing ISPSs and STPs are undertaken by contractors with minimal involvement of the BWSSB. There
is a team for O&M of sewers in BWSSB, then the cleaning, investigations, attends to consumer com-
plaints, replacement and/or repair works are done by BWSSB. However, some of cleaning, investiga-
tions, replacement and/or repair works are contracted out to the local contractors.
2) Sewers
Sewers are maintained by two (2) separate divisions based on the size of the sewers.
3) STPs and ISPSs
Currently O&M work for the majority of existing STPs and ISPSs has been undertaken by the Contrac-
tors who were awarded the Construction Contract (DBO: Design Built Operation). The contractor usu-
ally operates and maintains the STPs and ISPSs for the period of 7 to 10 years.
4) Monitoring by SCADA System
Operators can monitor the ISPSs and STPs at SCADA HMI (Human-Machine Interface) provided in
Operator Station to operate and maintain the plant load/equipment properly. The SCADA HMI may give
the operators any plant information in a user-friendly manner using graphical diagram and table format.
5) Additional Facilities for Effluent Reuse in STPs
It is recommended to add some effluent supply facility for all STPs to sell the effluent for recovering
O&M cost, especially at No.2 Yelahankakere STP which is located next to the power plant and nearby a
textile industry.
BWSSB commissioned a study in 2015 for demand assessment and willingness to use tertiary treated
sewage from Tavarakere / Nagasandra to Peenya Industrial Area for non-potable purposes. The demand
has been assessed at around three (3) MLD with about 38% of the respondents’ willingness to consider
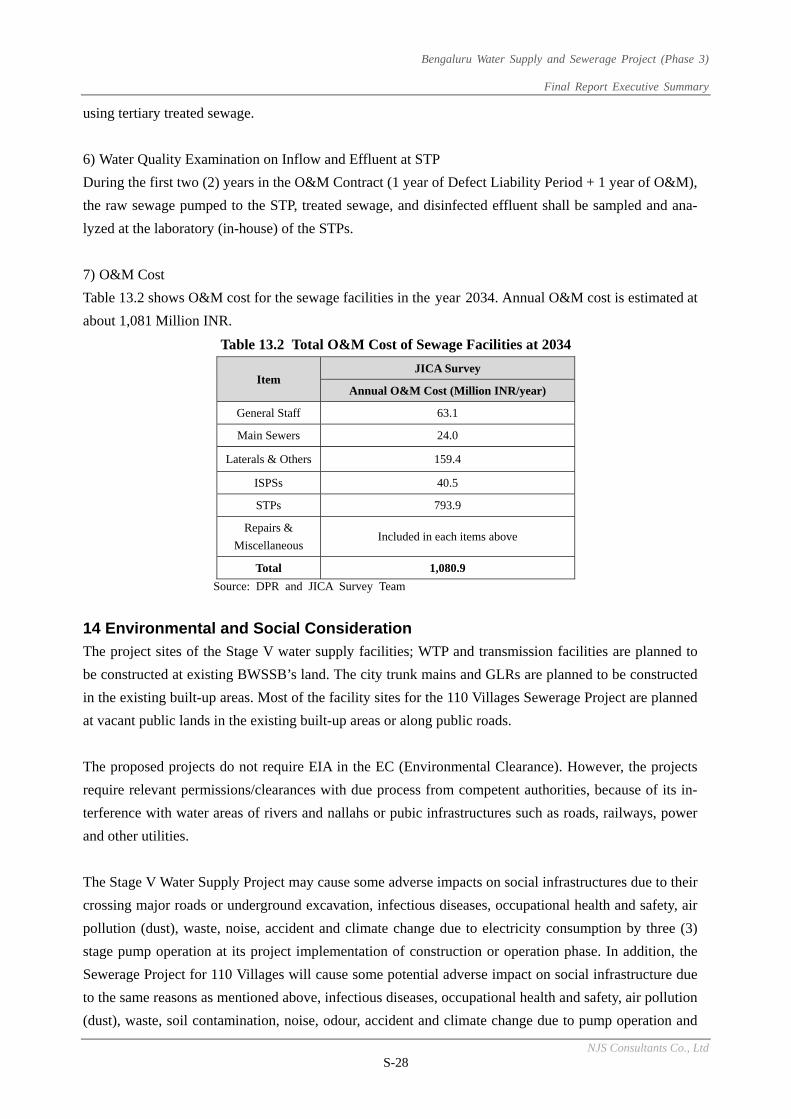
Bengaluru Water Supply and Sewerage Project (Phase 3)
Final Report Executive Summary
NJS Consultants Co., Ltd S-28
using tertiary treated sewage.
6) Water Quality Examination on Inflow and Effluent at STP
During the first two (2) years in the O&M Contract (1 year of Defect Liability Period + 1 year of O&M),
the raw sewage pumped to the STP, treated sewage, and disinfected effluent shall be sampled and ana-
lyzed at the laboratory (in-house) of the STPs.
7) O&M Cost
Table 13.2 shows O&M cost for the sewage facilities in the year 2034. Annual O&M cost is estimated at
about 1,081 Million INR.
Table 13.2 Total O&M Cost of Sewage Facilities at 2034
Item JICA Survey
Annual O&M Cost (Million INR/year)
General Staff 63.1
Main Sewers 24.0
Laterals & Others 159.4
ISPSs 40.5
STPs 793.9
Repairs &
Miscellaneous Included in each items above
Total 1,080.9
Source: DPR and JICA Survey Team
14 Environmental and Social Consideration
The project sites of the Stage V water supply facilities; WTP and transmission facilities are planned to
be constructed at existing BWSSB’s land. The city trunk mains and GLRs are planned to be constructed
in the existing built-up areas. Most of the facility sites for the 110 Villages Sewerage Project are planned
at vacant public lands in the existing built-up areas or along public roads.
The proposed projects do not require EIA in the EC (Environmental Clearance). However, the projects
require relevant permissions/clearances with due process from competent authorities, because of its in-
terference with water areas of rivers and nallahs or pubic infrastructures such as roads, railways, power
and other utilities.
The Stage V Water Supply Project may cause some adverse impacts on social infrastructures due to their
crossing major roads or underground excavation, infectious diseases, occupational health and safety, air
pollution (dust), waste, noise, accident and climate change due to electricity consumption by three (3)
stage pump operation at its project implementation of construction or operation phase. In addition, the
Sewerage Project for 110 Villages will cause some potential adverse impact on social infrastructure due
to the same reasons as mentioned above, infectious diseases, occupational health and safety, air pollution
(dust), waste, soil contamination, noise, odour, accident and climate change due to pump operation and
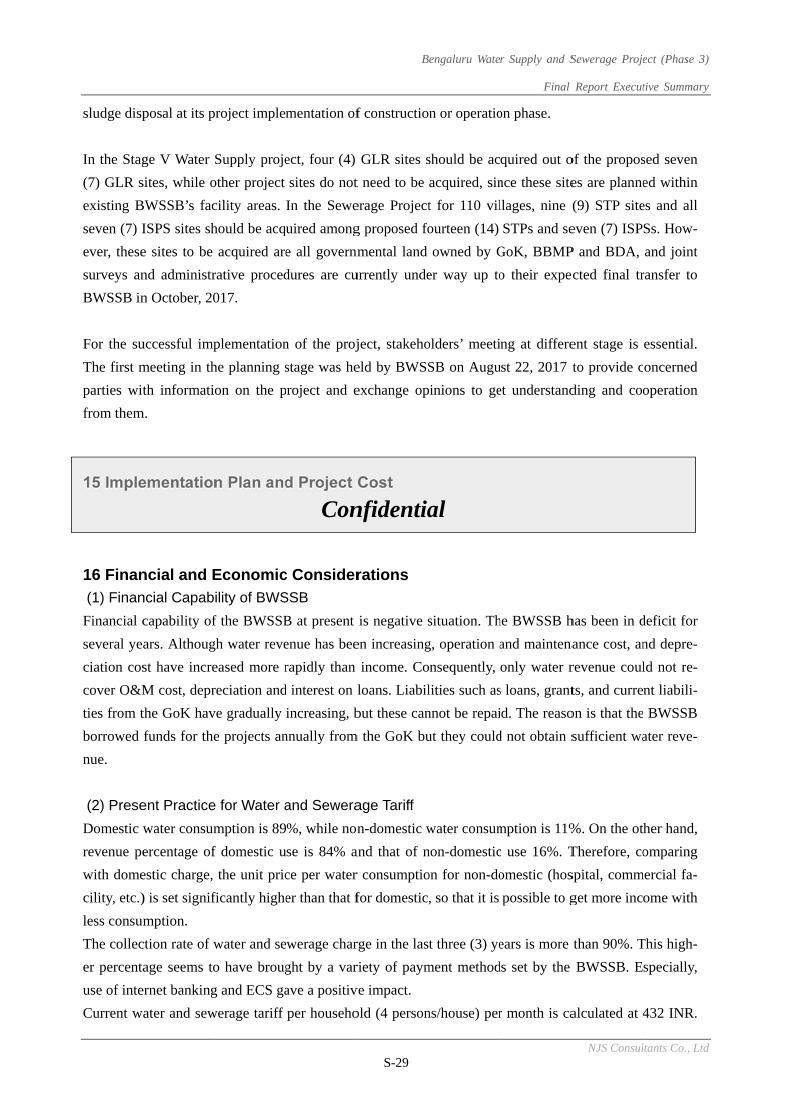
sludge disp
In the Stag
(7) GLR s
existing B
seven (7) I
ever, these
surveys an
BWSSB in
For the su
The first m
parties wit
from them
15 Imple
16 Finan
(1) Finan
Financial c
several ye
ciation cos
cover O&M
ties from t
borrowed
nue.
(2) Prese
Domestic w
revenue pe
with dome
cility, etc.)
less consum
The collec
er percenta
use of inte
Current w
posal at its p
ge V Water
sites, while o
BWSSB’s fac
ISPS sites sh
e sites to be
nd administr
n October, 20
uccessful imp
meeting in th
th informati
m.
ementatio
ncial and E
ncial Capab
capability of
ars. Althoug
st have incre
M cost, depr
the GoK hav
funds for the
ent Practice
water consum
ercentage of
estic charge,
) is set signif
mption.
ction rate of w
age seems to
ernet banking
ater and sew
project implem
Supply proje
other project
cility areas.
hould be acq
acquired are
rative proced
017.
plementation
he planning s
on on the p
n Plan and
Economic
ility of BWS
f the BWSSB
gh water reve
eased more r
reciation and
ve gradually
e projects an
e for Water a
mption is 89
f domestic u
the unit pric
ficantly highe
water and se
o have broug
g and ECS ga
werage tariff
mentation of
ect, four (4)
sites do not
In the Sewe
uired among
e all governm
dures are cu
n of the proj
stage was he
project and e
d Project
c Consider
SSB
B at present
enue has bee
rapidly than
d interest on l
increasing, b
nnually from
and Sewera
%, while non
use is 84% a
ce per water
er than that f
ewerage char
ght by a var
ave a positiv
per househo
Con
B
S-29
f constructio
GLR sites s
t need to be
erage Project
g proposed fo
mental land
urrently unde
ject, stakeho
eld by BWSS
exchange op
Cost
rations
is negative s
en increasing
income. Co
loans. Liabil
but these can
m the GoK bu
age Tariff
n-domestic w
and that of n
r consumptio
for domestic,
rge in the las
riety of paym
ve impact.
old (4 person
nfidentia
engaluru Wate
n or operatio
should be ac
acquired, sin
t for 110 vil
ourteen (14)
owned by G
er way up to
olders’ meeti
SB on Augu
inions to ge
situation. Th
g, operation a
nsequently,
lities such as
nnot be repai
ut they could
water consum
non-domestic
on for non-do
, so that it is
t three (3) ye
ment method
ns/house) per
al
r Supply and S
Final
on phase.
quired out o
nce these site
llages, nine (
STPs and se
GoK, BBMP
o their expe
ng at differe
ust 22, 2017 t
et understand
he BWSSB h
and maintena
only water r
s loans, grant
d. The reaso
d not obtain s
mption is 11%
c use 16%. T
omestic (hos
possible to g
ears is more
ds set by the
r month is ca
Sewerage Proje
Report Execut
NJS Consul
of the propos
es are planne
(9) STP site
even (7) ISP
P and BDA,
ected final tr
ent stage is
to provide c
ding and coo
has been in d
ance cost, an
revenue coul
ts, and curre
on is that the
sufficient wa
%. On the ot
Therefore, co
spital, comm
get more inc
than 90%. T
BWSSB. E
alculated at 4
ect (Phase 3)
tive Summary
ltants Co., Ltd
sed seven
ed within
es and all
Ss. How-
and joint
ransfer to
essential.
oncerned
operation
deficit for
nd depre-
ld not re-
nt liabili-
BWSSB
ater reve-
her hand,
omparing
mercial fa-
ome with
This high-
specially,
432 INR.
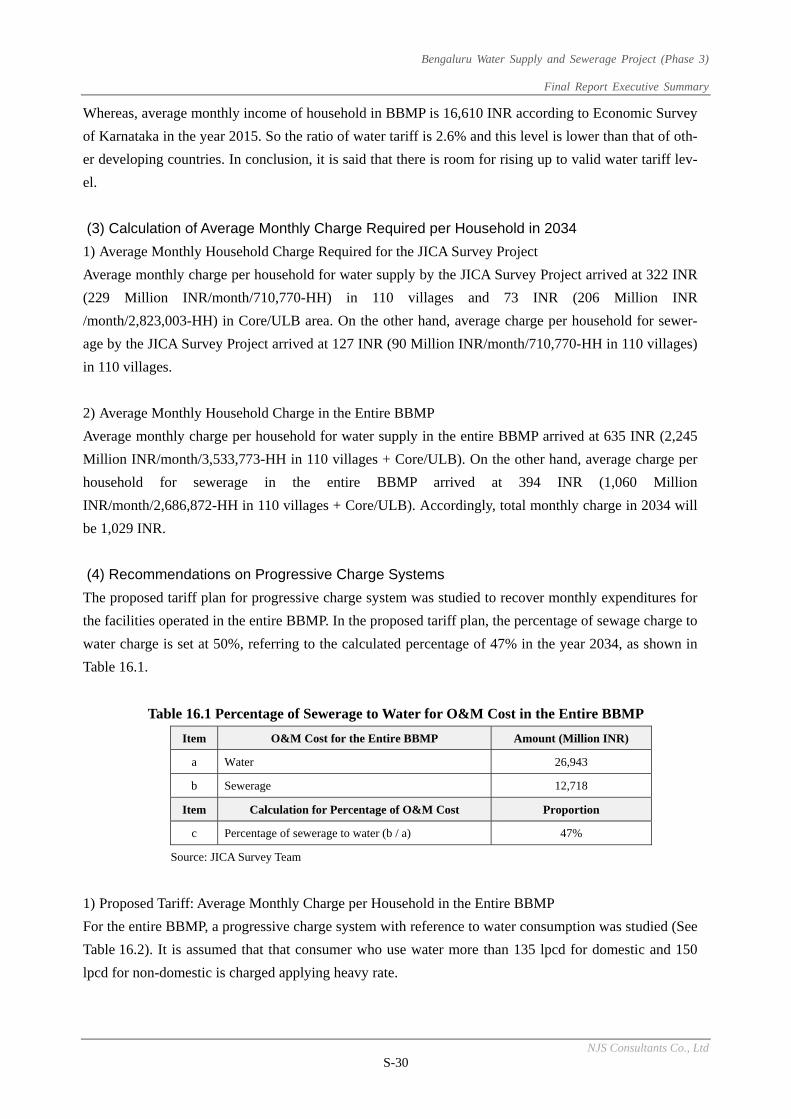
Bengaluru Water Supply and Sewerage Project (Phase 3)
Final Report Executive Summary
NJS Consultants Co., Ltd S-30
Whereas, average monthly income of household in BBMP is 16,610 INR according to Economic Survey
of Karnataka in the year 2015. So the ratio of water tariff is 2.6% and this level is lower than that of oth-
er developing countries. In conclusion, it is said that there is room for rising up to valid water tariff lev-
el.
(3) Calculation of Average Monthly Charge Required per Household in 2034
1) Average Monthly Household Charge Required for the JICA Survey Project
Average monthly charge per household for water supply by the JICA Survey Project arrived at 322 INR
(229 Million INR/month/710,770-HH) in 110 villages and 73 INR (206 Million INR
/month/2,823,003-HH) in Core/ULB area. On the other hand, average charge per household for sewer-
age by the JICA Survey Project arrived at 127 INR (90 Million INR/month/710,770-HH in 110 villages)
in 110 villages.
2) Average Monthly Household Charge in the Entire BBMP
Average monthly charge per household for water supply in the entire BBMP arrived at 635 INR (2,245
Million INR/month/3,533,773-HH in 110 villages + Core/ULB). On the other hand, average charge per
household for sewerage in the entire BBMP arrived at 394 INR (1,060 Million
INR/month/2,686,872-HH in 110 villages + Core/ULB). Accordingly, total monthly charge in 2034 will
be 1,029 INR.
(4) Recommendations on Progressive Charge Systems
The proposed tariff plan for progressive charge system was studied to recover monthly expenditures for
the facilities operated in the entire BBMP. In the proposed tariff plan, the percentage of sewage charge to
water charge is set at 50%, referring to the calculated percentage of 47% in the year 2034, as shown in
Table 16.1.
Table 16.1 Percentage of Sewerage to Water for O&M Cost in the Entire BBMP
Item O&M Cost for the Entire BBMP Amount (Million INR)
a Water 26,943
b Sewerage 12,718
Item Calculation for Percentage of O&M Cost Proportion
c Percentage of sewerage to water (b / a) 47%
Source: JICA Survey Team
1) Proposed Tariff: Average Monthly Charge per Household in the Entire BBMP
For the entire BBMP, a progressive charge system with reference to water consumption was studied (See
Table 16.2). It is assumed that that consumer who use water more than 135 lpcd for domestic and 150
lpcd for non-domestic is charged applying heavy rate.
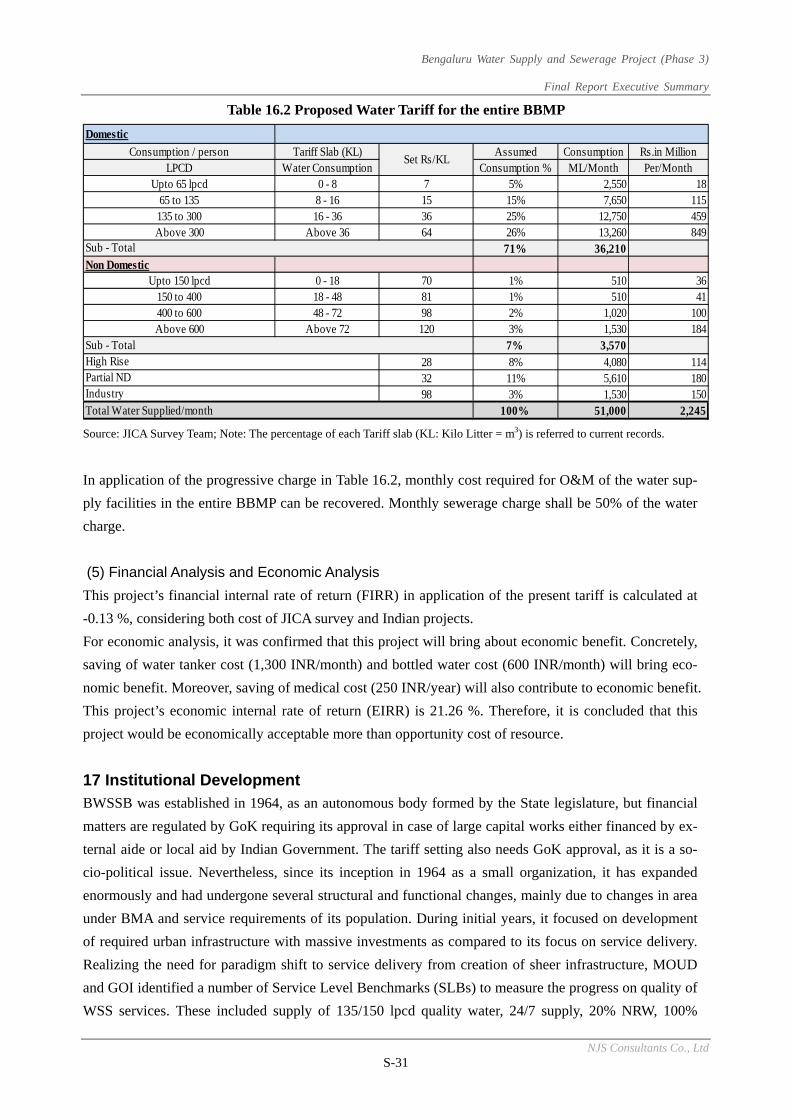
Bengaluru Water Supply and Sewerage Project (Phase 3)
Final Report Executive Summary
NJS Consultants Co., Ltd S-31
Table 16.2 Proposed Water Tariff for the entire BBMP
Source: JICA Survey Team; Note: The percentage of each Tariff slab (KL: Kilo Litter = m3) is referred to current records.
In application of the progressive charge in Table 16.2, monthly cost required for O&M of the water sup-
ply facilities in the entire BBMP can be recovered. Monthly sewerage charge shall be 50% of the water
charge.
(5) Financial Analysis and Economic Analysis
This project’s financial internal rate of return (FIRR) in application of the present tariff is calculated at
-0.13 %, considering both cost of JICA survey and Indian projects.
For economic analysis, it was confirmed that this project will bring about economic benefit. Concretely,
saving of water tanker cost (1,300 INR/month) and bottled water cost (600 INR/month) will bring eco-
nomic benefit. Moreover, saving of medical cost (250 INR/year) will also contribute to economic benefit.
This project’s economic internal rate of return (EIRR) is 21.26 %. Therefore, it is concluded that this
project would be economically acceptable more than opportunity cost of resource.
17 Institutional Development
BWSSB was established in 1964, as an autonomous body formed by the State legislature, but financial
matters are regulated by GoK requiring its approval in case of large capital works either financed by ex-
ternal aide or local aid by Indian Government. The tariff setting also needs GoK approval, as it is a so-
cio-political issue. Nevertheless, since its inception in 1964 as a small organization, it has expanded
enormously and had undergone several structural and functional changes, mainly due to changes in area
under BMA and service requirements of its population. During initial years, it focused on development
of required urban infrastructure with massive investments as compared to its focus on service delivery.
Realizing the need for paradigm shift to service delivery from creation of sheer infrastructure, MOUD
and GOI identified a number of Service Level Benchmarks (SLBs) to measure the progress on quality of
WSS services. These included supply of 135/150 lpcd quality water, 24/7 supply, 20% NRW, 100%
Domestic
Consumption / person Tariff Slab (KL) Assumed Consumption Rs.in MillionLPCD Water Consumption Consumption % ML/Month Per/Month
Upto 65 lpcd 0 - 8 7 5% 2,550 1865 to 135 8 - 16 15 15% 7,650 115135 to 300 16 - 36 36 25% 12,750 459Above 300 Above 36 64 26% 13,260 849
71% 36,210Non Domestic
Upto 150 lpcd 0 - 18 70 1% 510 36150 to 400 18 - 48 81 1% 510 41400 to 600 48 - 72 98 2% 1,020 100Above 600 Above 72 120 3% 1,530 184
7% 3,57028 8% 4,080 11432 11% 5,610 18098 3% 1,530 150
100% 51,000 2,245
Sub - Total
Sub - TotalHigh RisePartial NDIndustry
Total Water Supplied/month
Set Rs/KL
Bengaluru Water Supply and Sewerage Project (Phase 3)
Final Report Executive Summary
NJS Consultants Co., Ltd S-32
coverage, high revenue billing and recoveries, and a tariff structure to generate revenues enough to at
least meet current O&M costs etc. Similar SLBs have also been defined for sewerage services.
Realizing the needs, BWSSB has also slowly shifted towards quality of WSS service delivery. BWSSB
as an organization has an existing vision and mandate to provide quality WSS services to the residents
(about 8.5 Million in 2011) in 800 km2 of BBMP area. To discharge the mandate, BWSSB has been
functionally re-organized (Sept. 2016) into seven (7) Zones namely Maintenance, Waste Water Man-
agement, Projects, Kaveri, MIS+HRD+Design zone besides Administrative and Finance Zones. Most of
the senior officials of various zones function from the headquarter located at Cauvery Bhavan, However,
engineering zones with involvement in O&M, maintenance, etc. have a large number of field offices
(divisional office, sub-divisional office). The field office (Division level) is generally headed by an Ex-
ecutive Engineer, whereas a sub-divisional filed office is headed by an AEE/AE. To undertake various
activities, BWSSB has employed 2,200 regular employees (as of 25 Jan 2017) and has also engaged the
services of + 2,100 staff on outsourcing basis to support operationalization of various services (mostly
non-core services like data entry, dispatch, security, house-keeping, support services etc.).
Based on review and analysis of available documents, reports etc. coupled with discussions with senior
officials, a situational analysis of BWSSB was undertaken. The positives include its legal authority,
technical expertise, functional organizational structure, rich asset base, high billing, high collection effi-
ciency, current revenues (mainly water tariff) meeting current (mainly O&M) expenditures (recently
only) etc., whereas its challenges (areas needing improvements) include its Vision, Strategic and Busi-
ness Planning, Reduction of UFW and NRW, Duration of Water Supply, Geographical Coverage, Tariff
Policy, Decision Making Process and Delegation, financial dependency limiting its autonomy and sus-
tainability, HRM and Personnel Policies and Practices etc. The analysis resulted in identifying external
drivers like emerging technologies, public demand for higher SLBs (including need for 24/7 water sup-
ply), rising economic activity and immigration of professionals etc., which are putting pressure on
BWSSB to improve its services.
The need to provide WSS services of 110 villages (added under BBMP areas) has been considered as an
emerging challenge, to be responded by BWSSB. The need to improve inherent limitations and to re-
spond to emerging challenges, BWSSB needs to adopt a number of organizational improvement
measures.
From institutional perspective, these should include strategic visioning with focus on service delivery,
business planning with self-sustainable management systems, reduction of UFW and NRW (policies and
systems for leakage control, volumetric metering and reduction of pubic faucets), sound tariff policy,
improved connectivity to WSS services, improved billing and collection system, sound human resource
management (including personnel and training) practices, scientific asset records and management sys-
tem, information management system, organizational restructuring, improved decision making systems
etc. The report provides various strategies and an action plan for implementation in short, medium and

Bengaluru Water Supply and Sewerage Project (Phase 3)
Final Report Executive Summary
NJS Consultants Co., Ltd S-33
long term so as to meet the “TO BE” state of BWSSB. The suggested institutional improvements have
been considered necessary to transform BWSSB not only as a self-sustaining organization providing
quality WSS services with high SLBs, but also as a competent and capable organization to meet upcom-
ing challenges.
The major stakeholders of BWSSB include Ministry of Urban Development at GOI level and Depart-
ments of Urban Development, Water Resources, Finance and Law at GoK level, BBMP and Public at
local level besides regulator like Karnataka State Pollution Control Board. For its daily operations, it
follows various codes and procedures laid by GoK. It is felt that each one of them would have a distinct
role during project financing and implementation. Considering these and by visualizing possible imple-
mentation challenges during the period of JICA loan and using past experience of BWSSB and other
similar agencies, a Project Management Structure has been suggested.
The suggested Institutional Improvement Strategies, respective Action Plans, proposed Project Imple-
mentation Structure and post-implementation Project Management Structure have been presented and
discussed with BWSSB officials at various forums.
Bengaluru Water Supply and Sewerage Project (Phase 3)
Final Report
NJS Consultants Co., Ltd 1-1
Chapter 1 Background and Outline of the Project
1.1 Introduction The field work in Bengaluru, India for Preparatory Survey on Bengaluru Water Supply and Sewerage
Project (Phase 3) had been conducted intermittently six (6) times from June, 2016 to August, 2017. Based
on the findings and discussions with BWSSB, Final Report was prepared by November, 2017.
This report covers existing conditions on water supply and sewerage services in the study area. Project
needs and implementation arrangements for the proposed projects with reference to Japanese ODA loan
are presented before establishment of the scope of work for JICA Survey Project. Then, preliminary de-
sign of facilities are presented for the JICA Survey Project, followed by O&M of the facilities, Environ-
mental and Social Considerations, Implementation Plan, Financial and Economic Considerations and Or-
ganizational and Institutional Improvement. In addition, updated information on the projects to be fi-
nanced by local funds are also incorporated in Chapter 11 as well as in other related chapters to come up
with overall requirements for the management by BWSSB. Preliminary design was also prepared for ad-
ditional City Trunk Mains to share water of Stage V Project to Core/ULBs, and distribution facilities in-
cluding feeder pipes between planned GLRs and OHTs, and pumping facilities and OHTs to complete
permanent distribution systems for 110 Villages.
1.2 Objectives of the Project and Preparatory Survey The objective of the Project is to provide residents in BBMP (Bruhat Bengaluru Mahanagara Palike) area
with safe and stable water supply, and sewerage facilities to meet increasing water demand. The Project is
expected to improve sanitary environment in the subject area and contribute to the promotion of industry.
The location of project area is presented in the location map, which covers the jurisdiction of the BWSSB
including Core area (Bengaluru city), eight (8) ULBs and 110 Villages, and pipeline routes from water
intake to the entrance of BBMP.
The main objective of the Preparatory Survey is to prepare required information for feasibility evaluation of
the proposed Project, as a Japanese ODA loan project. Among others, such information includes the outline
of the Project, project cost estimates, economic and financial viability of the Project, the Project imple-
mentation schedule, manner of procurement and construction, organization of project implementation,
operation and maintenance (O&M) arrangements, and social and environmental considerations. The pre-
pared report and additional components suggested in the Preparatory Survey would be considered as ad-
dendum to the DPR (Detail Project Report) for the Project.
1.3 Survey Area and Design Year The water supply services for the Core area (Bengaluru city) commenced from the year 1889 and ex-
panded to ULBs through Cauvery Water Supply Scheme (CWSS) from the year 1974. Upon inclusion of
110 Villages into BBMP in 2007, BWSSB are responsible for the water supply and sewerage services
covering entire BBMP. The Preparatory Survey covers current jurisdiction of BWSSB (BBMP area) for
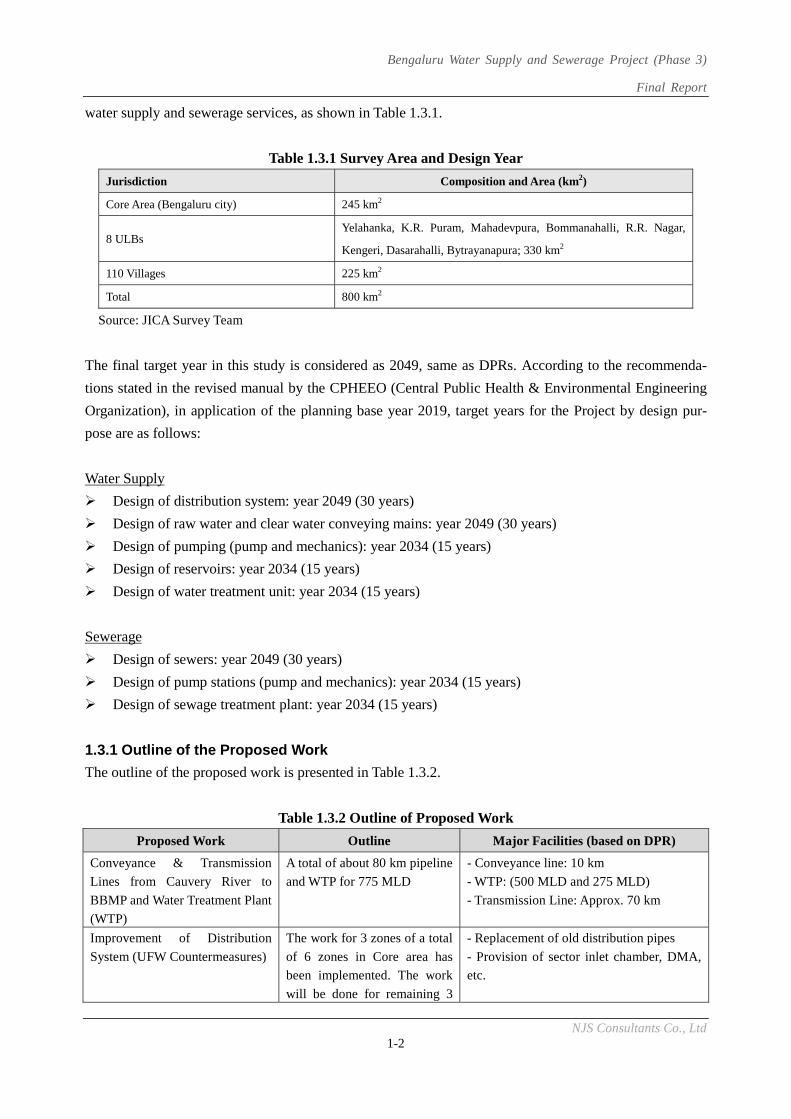
Bengaluru Water Supply and Sewerage Project (Phase 3)
Final Report
NJS Consultants Co., Ltd 1-2
water supply and sewerage services, as shown in Table 1.3.1.
Table 1.3.1 Survey Area and Design Year
Jurisdiction Composition and Area (km2)
Core Area (Bengaluru city) 245 km2
8 ULBs Yelahanka, K.R. Puram, Mahadevpura, Bommanahalli, R.R. Nagar,
Kengeri, Dasarahalli, Bytrayanapura; 330 km2
110 Villages 225 km2
Total 800 km2
Source: JICA Survey Team
The final target year in this study is considered as 2049, same as DPRs. According to the recommenda-
tions stated in the revised manual by the CPHEEO (Central Public Health & Environmental Engineering
Organization), in application of the planning base year 2019, target years for the Project by design pur-
pose are as follows:
Water Supply
Design of distribution system: year 2049 (30 years)
Design of raw water and clear water conveying mains: year 2049 (30 years)
Design of pumping (pump and mechanics): year 2034 (15 years)
Design of reservoirs: year 2034 (15 years)
Design of water treatment unit: year 2034 (15 years)
Sewerage
Design of sewers: year 2049 (30 years)
Design of pump stations (pump and mechanics): year 2034 (15 years)
Design of sewage treatment plant: year 2034 (15 years)
1.3.1 Outline of the Proposed Work
The outline of the proposed work is presented in Table 1.3.2.
Table 1.3.2 Outline of Proposed Work
Proposed Work Outline Major Facilities (based on DPR)
Conveyance & Transmission
Lines from Cauvery River to
BBMP and Water Treatment Plant
(WTP)
A total of about 80 km pipeline
and WTP for 775 MLD
- Conveyance line: 10 km
- WTP: (500 MLD and 275 MLD)
- Transmission Line: Approx. 70 km
Improvement of Distribution
System (UFW Countermeasures)
The work for 3 zones of a total
of 6 zones in Core area has
been implemented. The work
will be done for remaining 3
- Replacement of old distribution pipes
- Provision of sector inlet chamber, DMA,
etc.
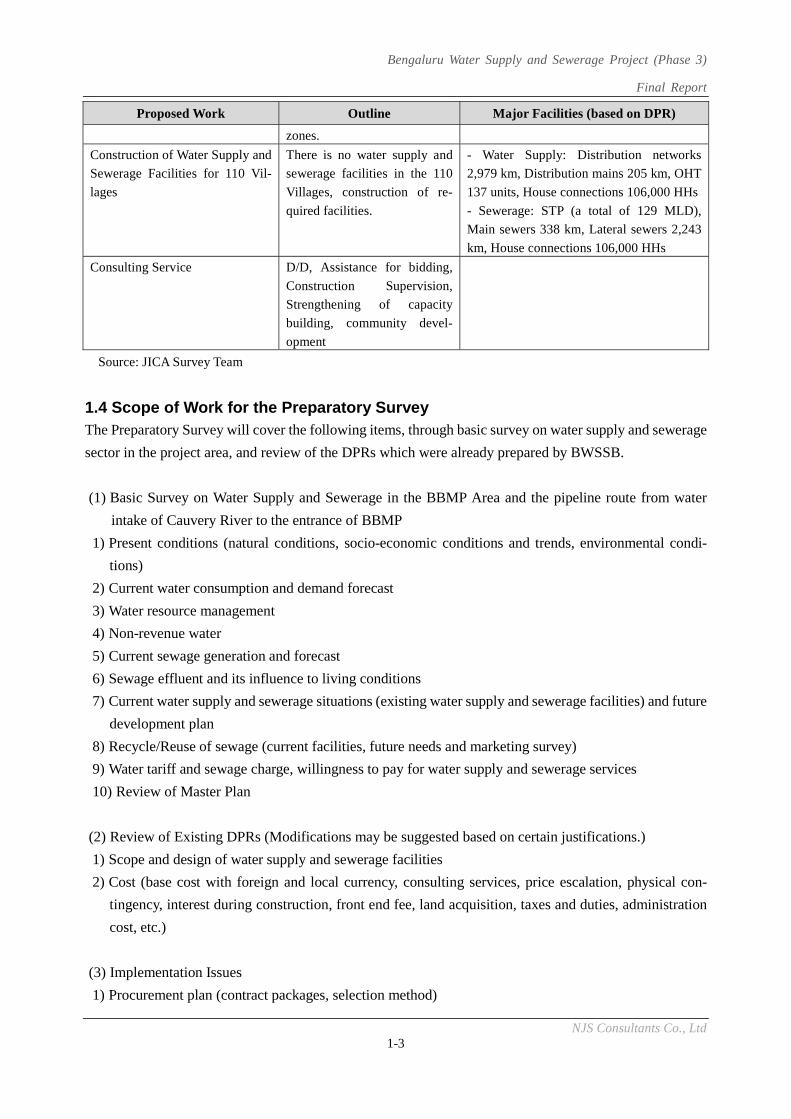
Bengaluru Water Supply and Sewerage Project (Phase 3)
Final Report
NJS Consultants Co., Ltd 1-3
Proposed Work Outline Major Facilities (based on DPR)
zones.
Construction of Water Supply and
Sewerage Facilities for 110 Vil-
lages
There is no water supply and
sewerage facilities in the 110
Villages, construction of re-
quired facilities.
- Water Supply: Distribution networks
2,979 km, Distribution mains 205 km, OHT
137 units, House connections 106,000 HHs
- Sewerage: STP (a total of 129 MLD),
Main sewers 338 km, Lateral sewers 2,243
km, House connections 106,000 HHs
Consulting Service D/D, Assistance for bidding,
Construction Supervision,
Strengthening of capacity
building, community devel-
opment
Source: JICA Survey Team
1.4 Scope of Work for the Preparatory Survey The Preparatory Survey will cover the following items, through basic survey on water supply and sewerage
sector in the project area, and review of the DPRs which were already prepared by BWSSB.
(1) Basic Survey on Water Supply and Sewerage in the BBMP Area and the pipeline route from water
intake of Cauvery River to the entrance of BBMP
1) Present conditions (natural conditions, socio-economic conditions and trends, environmental condi-
tions)
2) Current water consumption and demand forecast
3) Water resource management
4) Non-revenue water
5) Current sewage generation and forecast
6) Sewage effluent and its influence to living conditions
7) Current water supply and sewerage situations (existing water supply and sewerage facilities) and future
development plan
8) Recycle/Reuse of sewage (current facilities, future needs and marketing survey)
9) Water tariff and sewage charge, willingness to pay for water supply and sewerage services
10) Review of Master Plan
(2) Review of Existing DPRs (Modifications may be suggested based on certain justifications.)
1) Scope and design of water supply and sewerage facilities
2) Cost (base cost with foreign and local currency, consulting services, price escalation, physical con-
tingency, interest during construction, front end fee, land acquisition, taxes and duties, administration
cost, etc.)
(3) Implementation Issues
1) Procurement plan (contract packages, selection method)
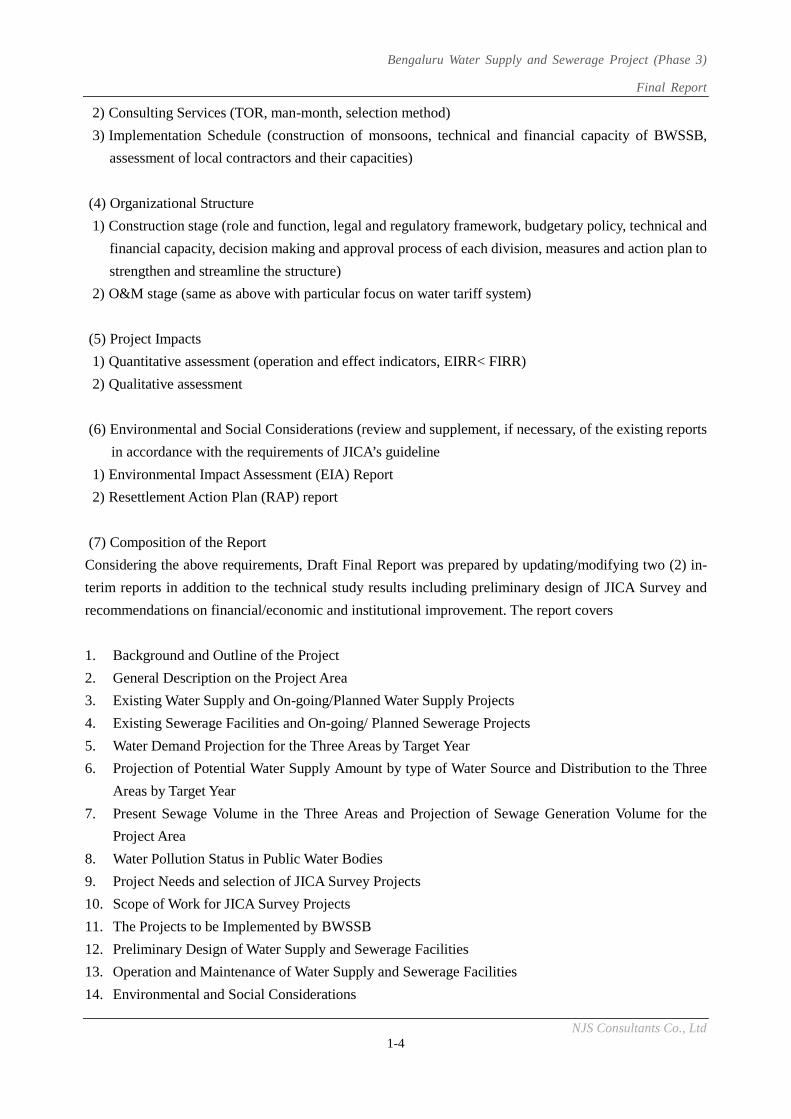
Bengaluru Water Supply and Sewerage Project (Phase 3)
Final Report
NJS Consultants Co., Ltd 1-4
2) Consulting Services (TOR, man-month, selection method)
3) Implementation Schedule (construction of monsoons, technical and financial capacity of BWSSB,
assessment of local contractors and their capacities)
(4) Organizational Structure
1) Construction stage (role and function, legal and regulatory framework, budgetary policy, technical and
financial capacity, decision making and approval process of each division, measures and action plan to
strengthen and streamline the structure)
2) O&M stage (same as above with particular focus on water tariff system)
(5) Project Impacts
1) Quantitative assessment (operation and effect indicators, EIRR< FIRR)
2) Qualitative assessment
(6) Environmental and Social Considerations (review and supplement, if necessary, of the existing reports
in accordance with the requirements of JICA’s guideline
1) Environmental Impact Assessment (EIA) Report
2) Resettlement Action Plan (RAP) report
(7) Composition of the Report
Considering the above requirements, Draft Final Report was prepared by updating/modifying two (2) in-
terim reports in addition to the technical study results including preliminary design of JICA Survey and
recommendations on financial/economic and institutional improvement. The report covers
1. Background and Outline of the Project
2. General Description on the Project Area
3. Existing Water Supply and On-going/Planned Water Supply Projects
4. Existing Sewerage Facilities and On-going/ Planned Sewerage Projects
5. Water Demand Projection for the Three Areas by Target Year
6. Projection of Potential Water Supply Amount by type of Water Source and Distribution to the Three
Areas by Target Year
7. Present Sewage Volume in the Three Areas and Projection of Sewage Generation Volume for the
Project Area
8. Water Pollution Status in Public Water Bodies
9. Project Needs and selection of JICA Survey Projects
10. Scope of Work for JICA Survey Projects
11. The Projects to be Implemented by BWSSB
12. Preliminary Design of Water Supply and Sewerage Facilities
13. Operation and Maintenance of Water Supply and Sewerage Facilities
14. Environmental and Social Considerations
Bengaluru Water Supply and Sewerage Project (Phase 3)
Final Report
NJS Consultants Co., Ltd 1-5
15. Implementation Plan and Construction Cost Estimates
16. Financial and Economic Considerations
17. Institutional Development
This report also includes Supporting Report and Data Report.
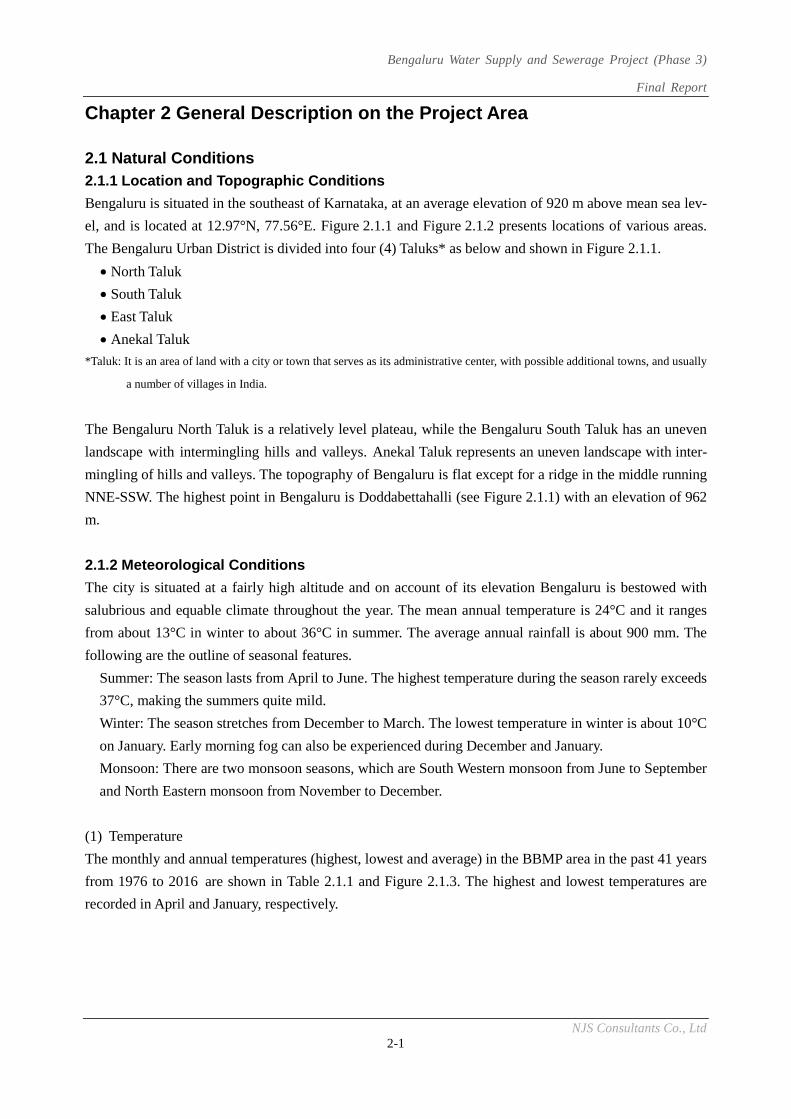
Bengaluru Water Supply and Sewerage Project (Phase 3)
Final Report
NJS Consultants Co., Ltd 2-1
Chapter 2 General Description on the Project Area
2.1 Natural Conditions 2.1.1 Location and Topographic Conditions
Bengaluru is situated in the southeast of Karnataka, at an average elevation of 920 m above mean sea lev-
el, and is located at 12.97°N, 77.56°E. Figure 2.1.1 and Figure 2.1.2 presents locations of various areas.
The Bengaluru Urban District is divided into four (4) Taluks* as below and shown in Figure 2.1.1.
North Taluk
South Taluk
East Taluk
Anekal Taluk
*Taluk: It is an area of land with a city or town that serves as its administrative center, with possible additional towns, and usually
a number of villages in India.
The Bengaluru North Taluk is a relatively level plateau, while the Bengaluru South Taluk has an uneven
landscape with intermingling hills and valleys. Anekal Taluk represents an uneven landscape with inter-
mingling of hills and valleys. The topography of Bengaluru is flat except for a ridge in the middle running
NNE-SSW. The highest point in Bengaluru is Doddabettahalli (see Figure 2.1.1) with an elevation of 962
m.
2.1.2 Meteorological Conditions
The city is situated at a fairly high altitude and on account of its elevation Bengaluru is bestowed with
salubrious and equable climate throughout the year. The mean annual temperature is 24°C and it ranges
from about 13°C in winter to about 36°C in summer. The average annual rainfall is about 900 mm. The
following are the outline of seasonal features.
Summer: The season lasts from April to June. The highest temperature during the season rarely exceeds
37°C, making the summers quite mild.
Winter: The season stretches from December to March. The lowest temperature in winter is about 10°C
on January. Early morning fog can also be experienced during December and January.
Monsoon: There are two monsoon seasons, which are South Western monsoon from June to September
and North Eastern monsoon from November to December.
(1) Temperature
The monthly and annual temperatures (highest, lowest and average) in the BBMP area in the past 41 years
from 1976 to 2016 are shown in Table 2.1.1 and Figure 2.1.3. The highest and lowest temperatures are
recorded in April and January, respectively.
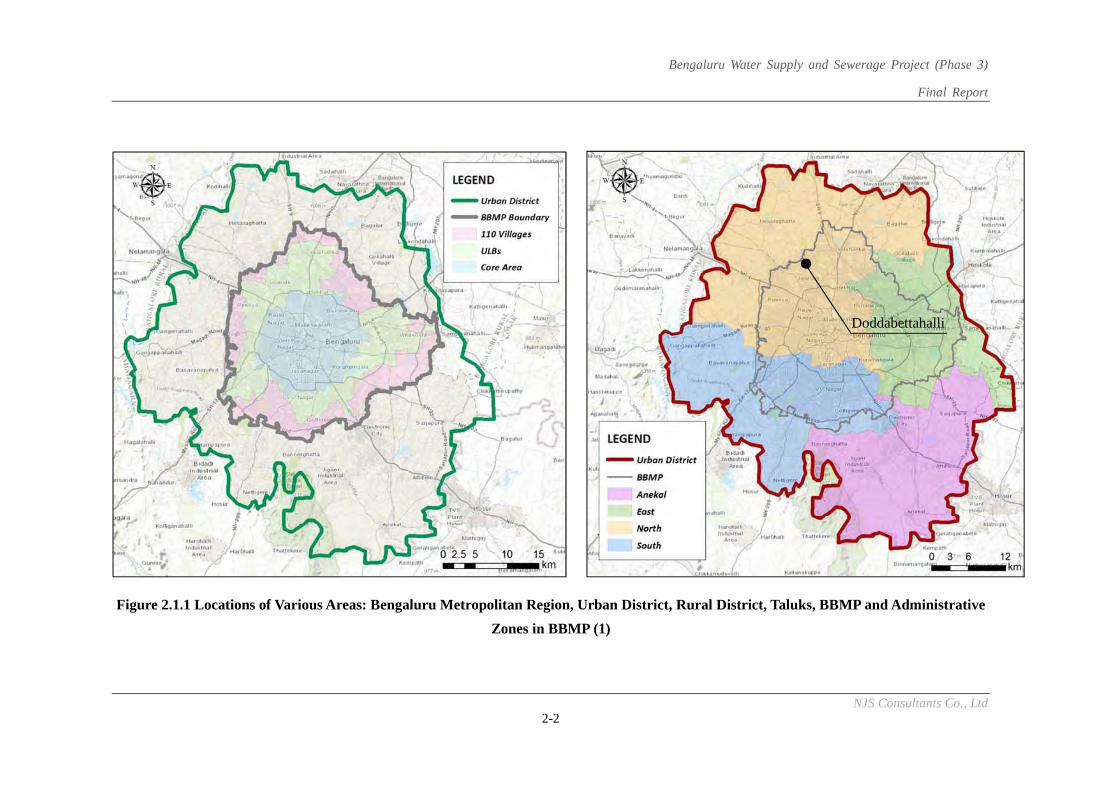
Bengaluru Water Supply and Sewerage Project (Phase 3)
Final Report
NJS Consultants Co., Ltd 2-2
Figure 2.1.1 Locations of Various Areas: Bengaluru Metropolitan Region, Urban District, Rural District, Taluks, BBMP and Administrative
Zones in BBMP (1)
Doddabettahalli
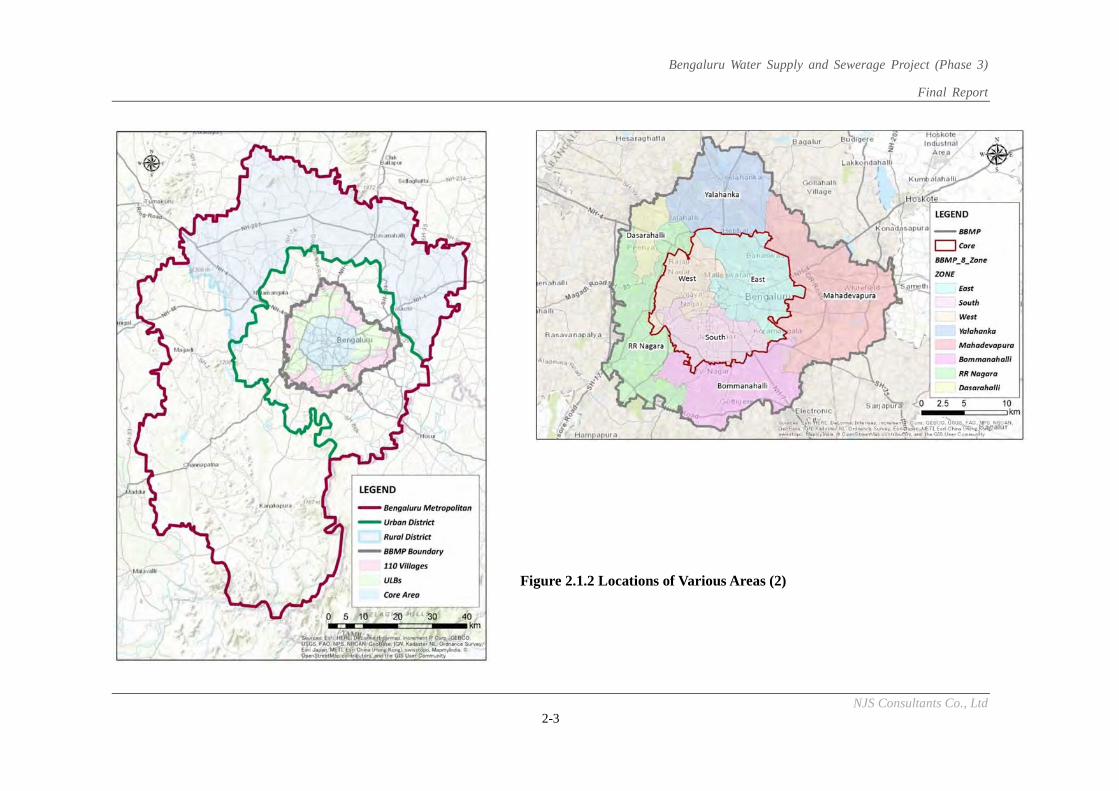
Bengaluru Water Supply and Sewerage Project (Phase 3)
Final Report
NJS Consultants Co., Ltd 2-3
Figure 2.1.2 Locations of Various Areas (2)
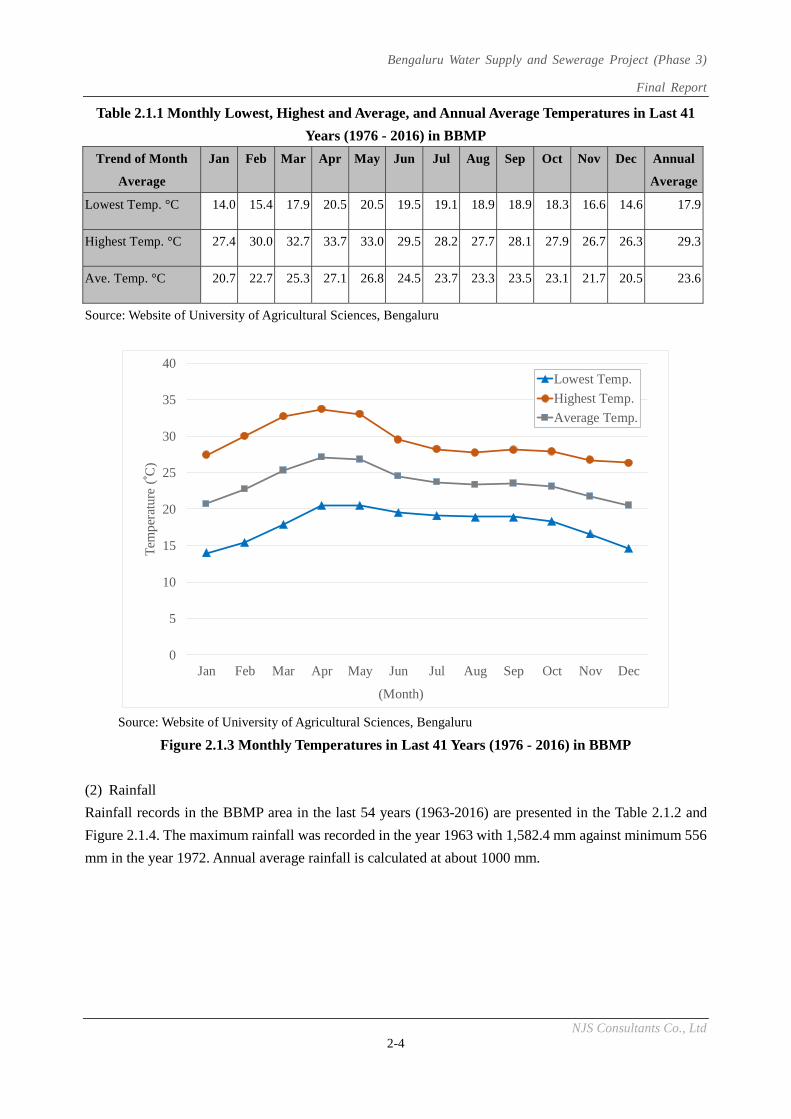
Bengaluru Water Supply and Sewerage Project (Phase 3)
Final Report
NJS Consultants Co., Ltd 2-4
Table 2.1.1 Monthly Lowest, Highest and Average, and Annual Average Temperatures in Last 41
Years (1976 - 2016) in BBMP
Trend of Month
Average
Jan Feb Mar Apr May Jun Jul Aug Sep Oct Nov Dec Annual
Average
Lowest Temp. °C 14.0 15.4 17.9 20.5 20.5 19.5 19.1 18.9 18.9 18.3 16.6 14.6 17.9
Highest Temp. °C 27.4 30.0 32.7 33.7 33.0 29.5 28.2 27.7 28.1 27.9 26.7 26.3 29.3
Ave. Temp. °C 20.7 22.7 25.3 27.1 26.8 24.5 23.7 23.3 23.5 23.1 21.7 20.5 23.6
Source: Website of University of Agricultural Sciences, Bengaluru
Source: Website of University of Agricultural Sciences, Bengaluru
Figure 2.1.3 Monthly Temperatures in Last 41 Years (1976 - 2016) in BBMP
(2) Rainfall
Rainfall records in the BBMP area in the last 54 years (1963-2016) are presented in the Table 2.1.2 and
Figure 2.1.4. The maximum rainfall was recorded in the year 1963 with 1,582.4 mm against minimum 556
mm in the year 1972. Annual average rainfall is calculated at about 1000 mm.
0
5
10
15
20
25
30
35
40
Jan Feb Mar Apr May Jun Jul Aug Sep Oct Nov Dec
Tem
pera
ture
(°C
)
(Month)
Lowest Temp.
Highest Temp.
Average Temp.
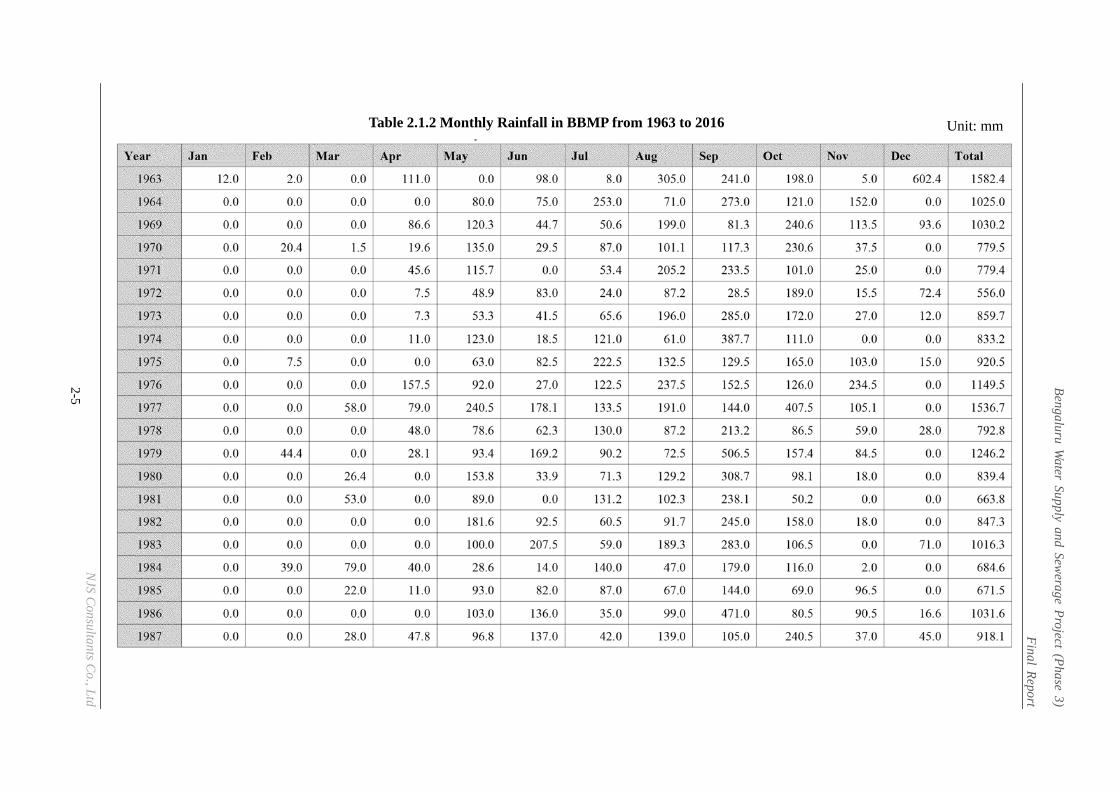
Bengaluru Water Supply and Sewerage Project (Phase 3)
Final Report
NJS Consultants Co., Ltd 2-5
Table 2.1.2 Monthly Rainfall in BBMP from 1963 to 2016 Unit: mm
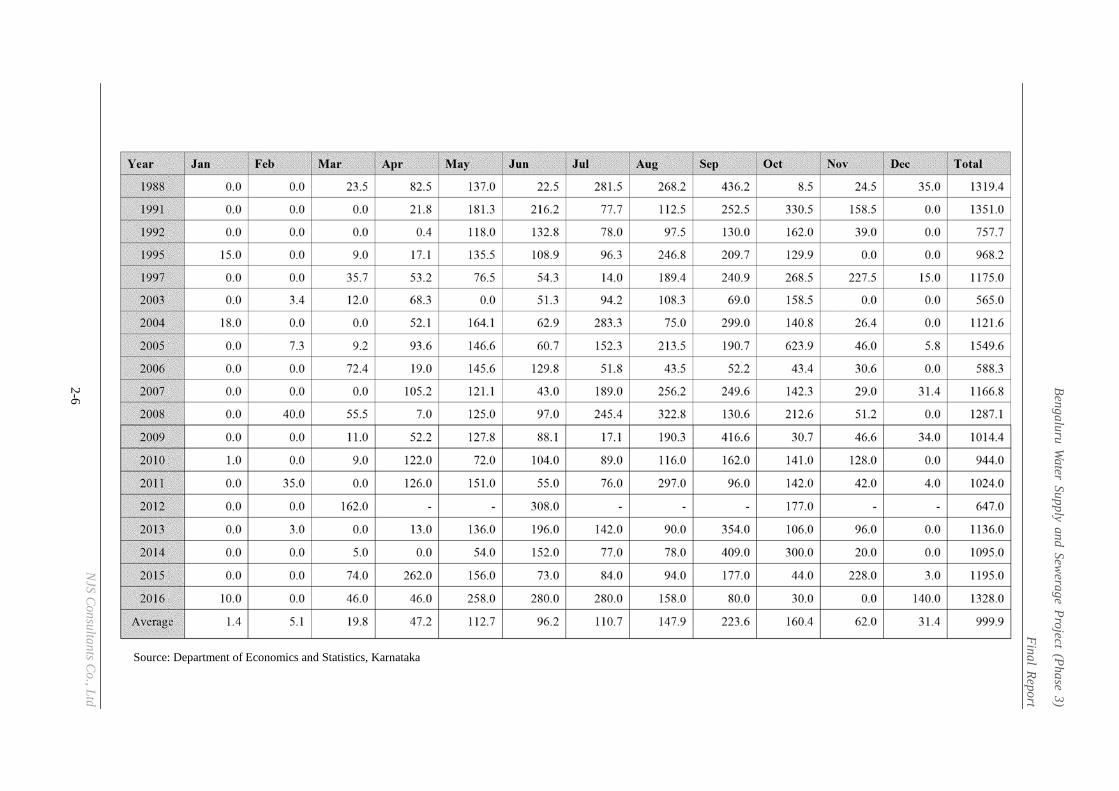
Bengaluru Water Supply and Sewerage Project (Phase 3)
Final Report
NJS Consultants Co., Ltd 2-6
Source: Department of Economics and Statistics, Karnataka
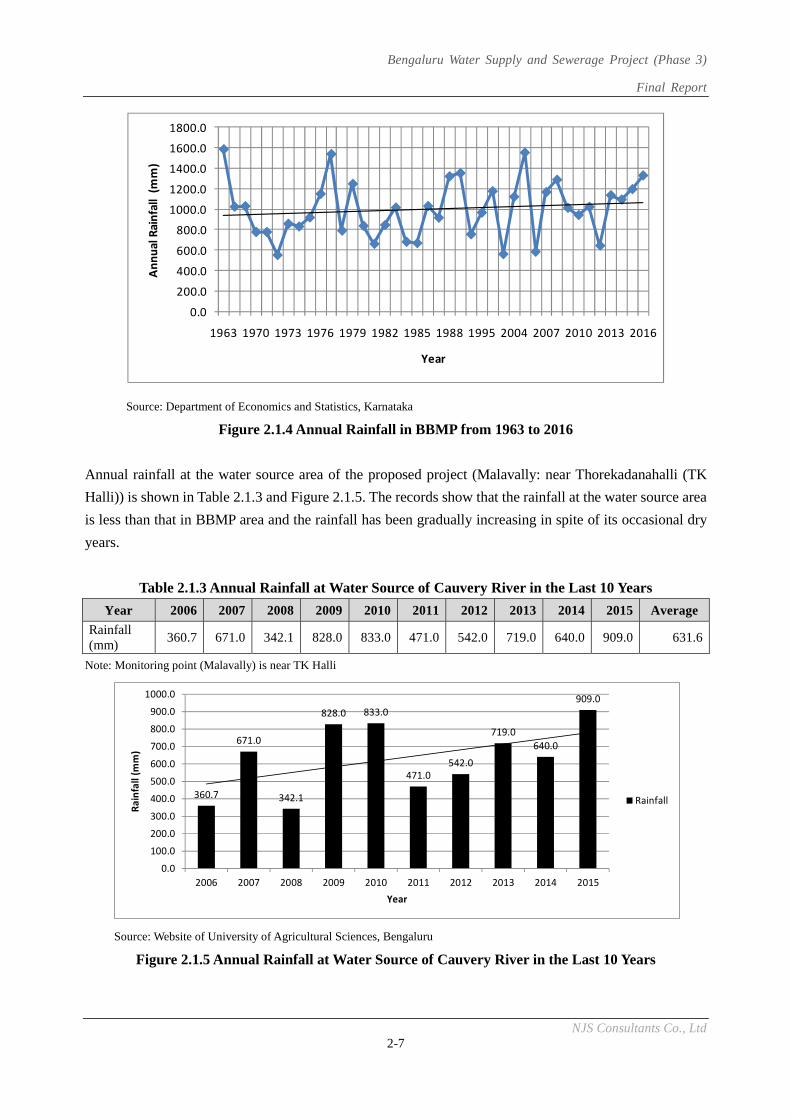
Bengaluru Water Supply and Sewerage Project (Phase 3)
Final Report
NJS Consultants Co., Ltd 2-7
Source: Department of Economics and Statistics, Karnataka
Figure 2.1.4 Annual Rainfall in BBMP from 1963 to 2016
Annual rainfall at the water source area of the proposed project (Malavally: near Thorekadanahalli (TK
Halli)) is shown in Table 2.1.3 and Figure 2.1.5. The records show that the rainfall at the water source area
is less than that in BBMP area and the rainfall has been gradually increasing in spite of its occasional dry
years.
Table 2.1.3 Annual Rainfall at Water Source of Cauvery River in the Last 10 Years
Year 2006 2007 2008 2009 2010 2011 2012 2013 2014 2015 Average
Rainfall (mm)
360.7 671.0 342.1 828.0 833.0 471.0 542.0 719.0 640.0 909.0 631.6
Note: Monitoring point (Malavally) is near TK Halli
Source: Website of University of Agricultural Sciences, Bengaluru
Figure 2.1.5 Annual Rainfall at Water Source of Cauvery River in the Last 10 Years
0.0
200.0
400.0
600.0
800.0
1000.0
1200.0
1400.0
1600.0
1800.0
1963 1970 1973 1976 1979 1982 1985 1988 1995 2004 2007 2010 2013 2016
Annu
al R
ainf
all
(mm
)
Year
360.7
671.0
342.1
828.0 833.0
471.0542.0
719.0640.0
909.0
0.0
100.0
200.0
300.0
400.0
500.0
600.0
700.0
800.0
900.0
1000.0
2006 2007 2008 2009 2010 2011 2012 2013 2014 2015
Rain
fall
(mm
)
Year
Rainfall
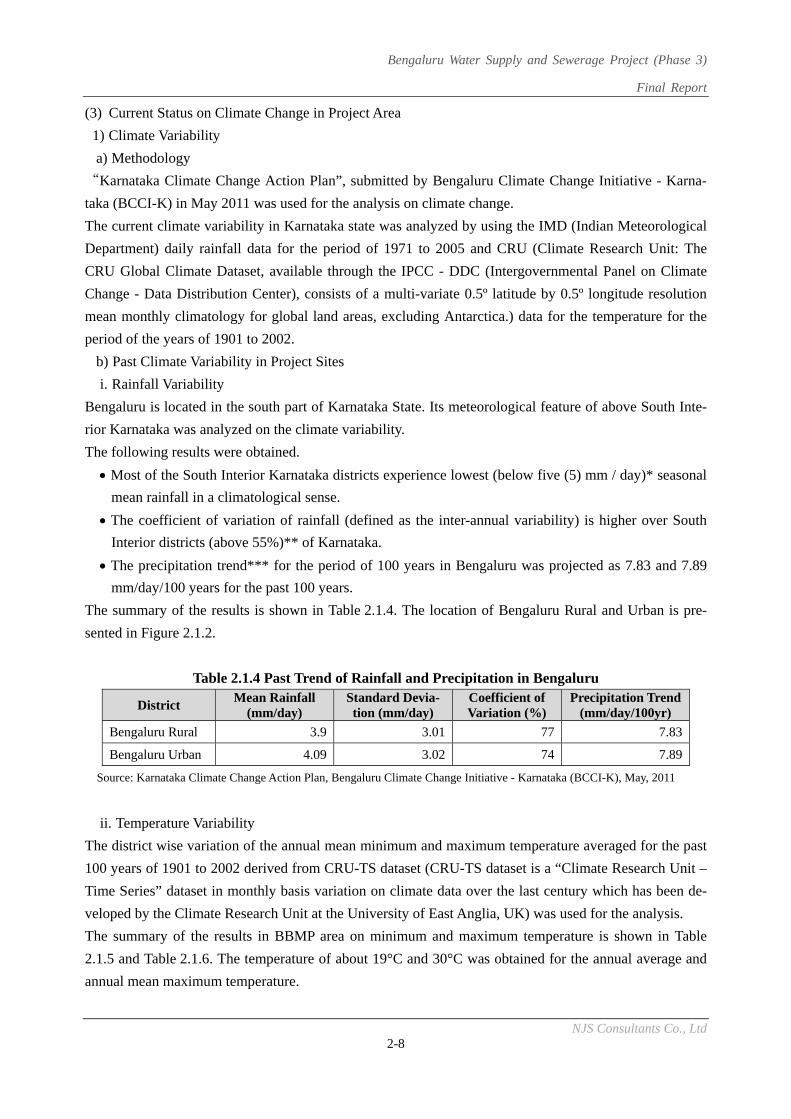
Bengaluru Water Supply and Sewerage Project (Phase 3)
Final Report
NJS Consultants Co., Ltd 2-8
(3) Current Status on Climate Change in Project Area
1) Climate Variability
a) Methodology
“Karnataka Climate Change Action Plan”, submitted by Bengaluru Climate Change Initiative - Karna-
taka (BCCI-K) in May 2011 was used for the analysis on climate change.
The current climate variability in Karnataka state was analyzed by using the IMD (Indian Meteorological
Department) daily rainfall data for the period of 1971 to 2005 and CRU (Climate Research Unit: The
CRU Global Climate Dataset, available through the IPCC - DDC (Intergovernmental Panel on Climate
Change - Data Distribution Center), consists of a multi-variate 0.5º latitude by 0.5º longitude resolution
mean monthly climatology for global land areas, excluding Antarctica.) data for the temperature for the
period of the years of 1901 to 2002.
b) Past Climate Variability in Project Sites
i. Rainfall Variability
Bengaluru is located in the south part of Karnataka State. Its meteorological feature of above South Inte-
rior Karnataka was analyzed on the climate variability.
The following results were obtained.
Most of the South Interior Karnataka districts experience lowest (below five (5) mm / day)* seasonal
mean rainfall in a climatological sense.
The coefficient of variation of rainfall (defined as the inter-annual variability) is higher over South
Interior districts (above 55%)** of Karnataka.
The precipitation trend*** for the period of 100 years in Bengaluru was projected as 7.83 and 7.89
mm/day/100 years for the past 100 years.
The summary of the results is shown in Table 2.1.4. The location of Bengaluru Rural and Urban is pre-
sented in Figure 2.1.2.
Table 2.1.4 Past Trend of Rainfall and Precipitation in Bengaluru
District Mean Rainfall
(mm/day) Standard Devia-tion (mm/day)
Coefficient of Variation (%)
Precipitation Trend (mm/day/100yr)
Bengaluru Rural 3.9 3.01 77 7.83
Bengaluru Urban 4.09 3.02 74 7.89
Source: Karnataka Climate Change Action Plan, Bengaluru Climate Change Initiative - Karnataka (BCCI-K), May, 2011
ii. Temperature Variability
The district wise variation of the annual mean minimum and maximum temperature averaged for the past
100 years of 1901 to 2002 derived from CRU-TS dataset (CRU-TS dataset is a “Climate Research Unit –
Time Series” dataset in monthly basis variation on climate data over the last century which has been de-
veloped by the Climate Research Unit at the University of East Anglia, UK) was used for the analysis.
The summary of the results in BBMP area on minimum and maximum temperature is shown in Table
2.1.5 and Table 2.1.6. The temperature of about 19°C and 30°C was obtained for the annual average and
annual mean maximum temperature.
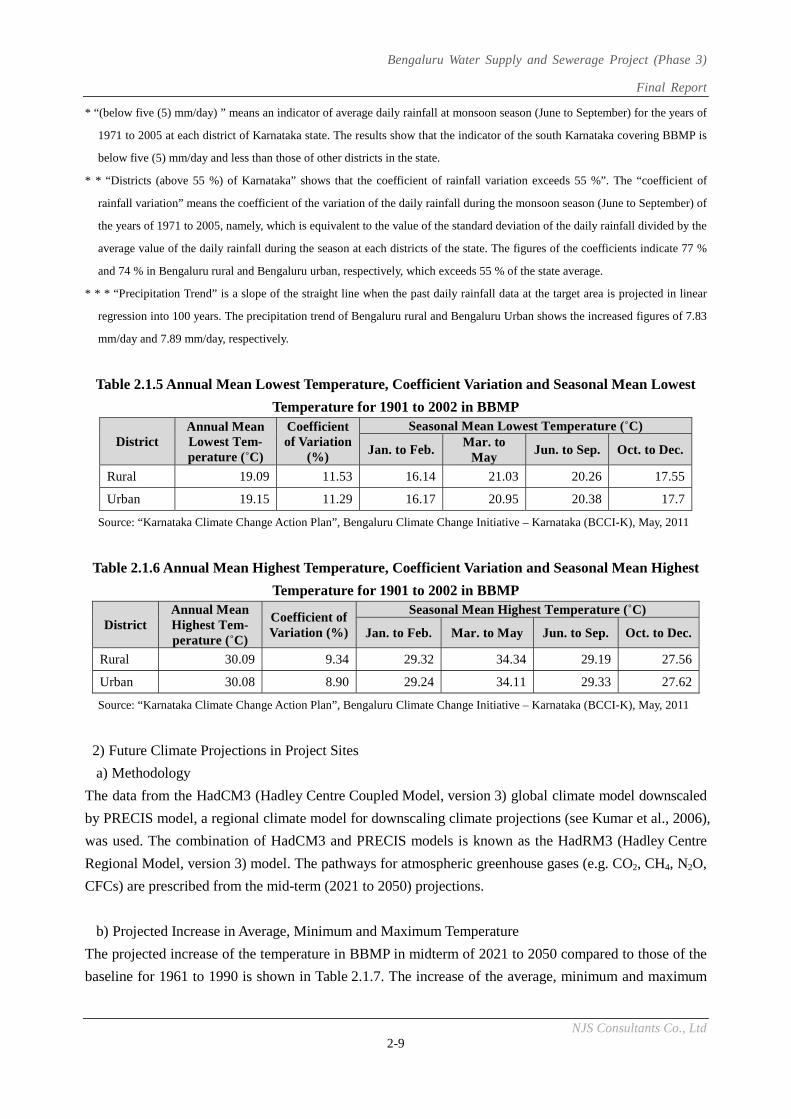
Bengaluru Water Supply and Sewerage Project (Phase 3)
Final Report
NJS Consultants Co., Ltd 2-9
* “(below five (5) mm/day) ” means an indicator of average daily rainfall at monsoon season (June to September) for the years of
1971 to 2005 at each district of Karnataka state. The results show that the indicator of the south Karnataka covering BBMP is
below five (5) mm/day and less than those of other districts in the state.
* * “Districts (above 55 %) of Karnataka” shows that the coefficient of rainfall variation exceeds 55 %”. The “coefficient of
rainfall variation” means the coefficient of the variation of the daily rainfall during the monsoon season (June to September) of
the years of 1971 to 2005, namely, which is equivalent to the value of the standard deviation of the daily rainfall divided by the
average value of the daily rainfall during the season at each districts of the state. The figures of the coefficients indicate 77 %
and 74 % in Bengaluru rural and Bengaluru urban, respectively, which exceeds 55 % of the state average.
* * * “Precipitation Trend” is a slope of the straight line when the past daily rainfall data at the target area is projected in linear
regression into 100 years. The precipitation trend of Bengaluru rural and Bengaluru Urban shows the increased figures of 7.83
mm/day and 7.89 mm/day, respectively.
Table 2.1.5 Annual Mean Lowest Temperature, Coefficient Variation and Seasonal Mean Lowest
Temperature for 1901 to 2002 in BBMP
District Annual Mean Lowest Tem-perature ( C)
Coefficient of Variation
(%)
Seasonal Mean Lowest Temperature ( C)
Jan. to Feb.Mar. to
May Jun. to Sep. Oct. to Dec.
Rural 19.09 11.53 16.14 21.03 20.26 17.55
Urban 19.15 11.29 16.17 20.95 20.38 17.7
Source: “Karnataka Climate Change Action Plan”, Bengaluru Climate Change Initiative – Karnataka (BCCI-K), May, 2011
Table 2.1.6 Annual Mean Highest Temperature, Coefficient Variation and Seasonal Mean Highest
Temperature for 1901 to 2002 in BBMP
District Annual Mean Highest Tem-perature ( C)
Coefficient of Variation (%)
Seasonal Mean Highest Temperature ( C)
Jan. to Feb. Mar. to May Jun. to Sep. Oct. to Dec.
Rural 30.09 9.34 29.32 34.34 29.19 27.56
Urban 30.08 8.90 29.24 34.11 29.33 27.62
Source: “Karnataka Climate Change Action Plan”, Bengaluru Climate Change Initiative – Karnataka (BCCI-K), May, 2011
2) Future Climate Projections in Project Sites
a) Methodology
The data from the HadCM3 (Hadley Centre Coupled Model, version 3) global climate model downscaled
by PRECIS model, a regional climate model for downscaling climate projections (see Kumar et al., 2006),
was used. The combination of HadCM3 and PRECIS models is known as the HadRM3 (Hadley Centre
Regional Model, version 3) model. The pathways for atmospheric greenhouse gases (e.g. CO2, CH4, N2O,
CFCs) are prescribed from the mid-term (2021 to 2050) projections.
b) Projected Increase in Average, Minimum and Maximum Temperature
The projected increase of the temperature in BBMP in midterm of 2021 to 2050 compared to those of the
baseline for 1961 to 1990 is shown in Table 2.1.7. The increase of the average, minimum and maximum
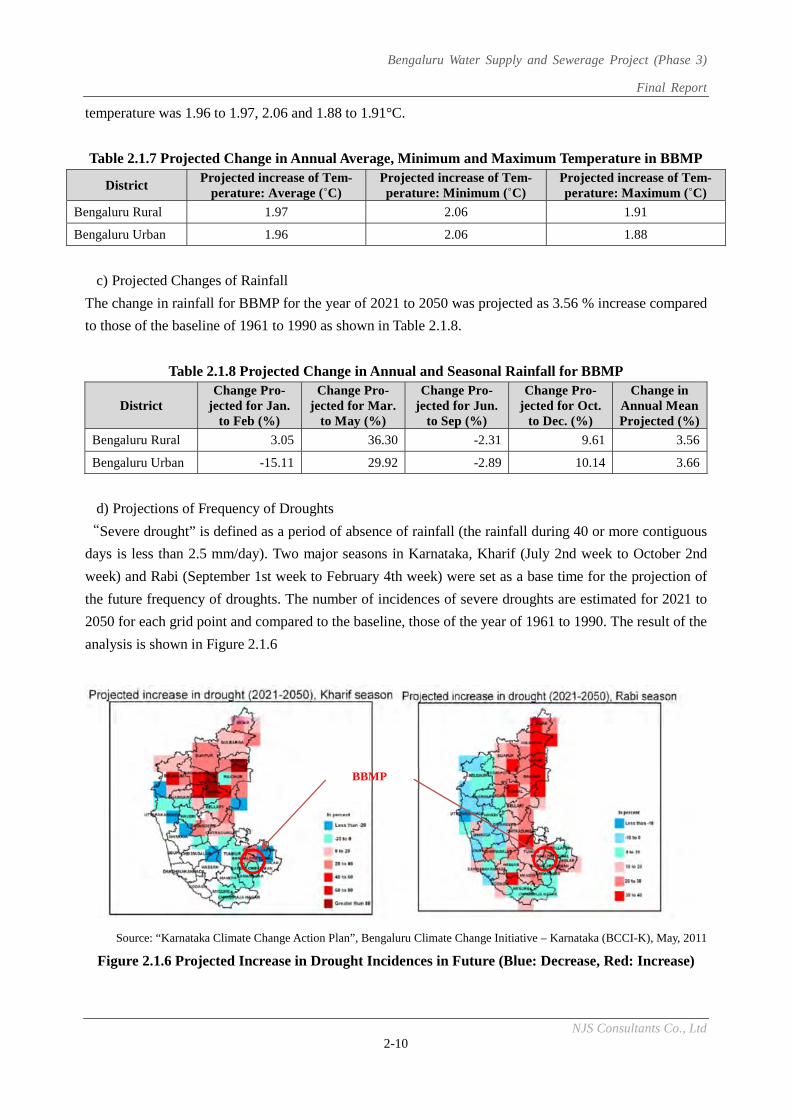
Bengaluru Water Supply and Sewerage Project (Phase 3)
Final Report
NJS Consultants Co., Ltd 2-10
temperature was 1.96 to 1.97, 2.06 and 1.88 to 1.91°C.
Table 2.1.7 Projected Change in Annual Average, Minimum and Maximum Temperature in BBMP
District Projected increase of Tem-
perature: Average ( C) Projected increase of Tem-perature: Minimum ( C)
Projected increase of Tem-perature: Maximum ( C)
Bengaluru Rural 1.97 2.06 1.91
Bengaluru Urban 1.96 2.06 1.88
c) Projected Changes of Rainfall
The change in rainfall for BBMP for the year of 2021 to 2050 was projected as 3.56 % increase compared
to those of the baseline of 1961 to 1990 as shown in Table 2.1.8.
Table 2.1.8 Projected Change in Annual and Seasonal Rainfall for BBMP
District Change Pro-
jected for Jan. to Feb (%)
Change Pro-jected for Mar.
to May (%)
Change Pro-jected for Jun.
to Sep (%)
Change Pro-jected for Oct.
to Dec. (%)
Change in Annual Mean Projected (%)
Bengaluru Rural 3.05 36.30 -2.31 9.61 3.56
Bengaluru Urban -15.11 29.92 -2.89 10.14 3.66
d) Projections of Frequency of Droughts
“Severe drought” is defined as a period of absence of rainfall (the rainfall during 40 or more contiguous
days is less than 2.5 mm/day). Two major seasons in Karnataka, Kharif (July 2nd week to October 2nd
week) and Rabi (September 1st week to February 4th week) were set as a base time for the projection of
the future frequency of droughts. The number of incidences of severe droughts are estimated for 2021 to
2050 for each grid point and compared to the baseline, those of the year of 1961 to 1990. The result of the
analysis is shown in Figure 2.1.6
Source: “Karnataka Climate Change Action Plan”, Bengaluru Climate Change Initiative – Karnataka (BCCI-K), May, 2011
Figure 2.1.6 Projected Increase in Drought Incidences in Future (Blue: Decrease, Red: Increase)
BBMP
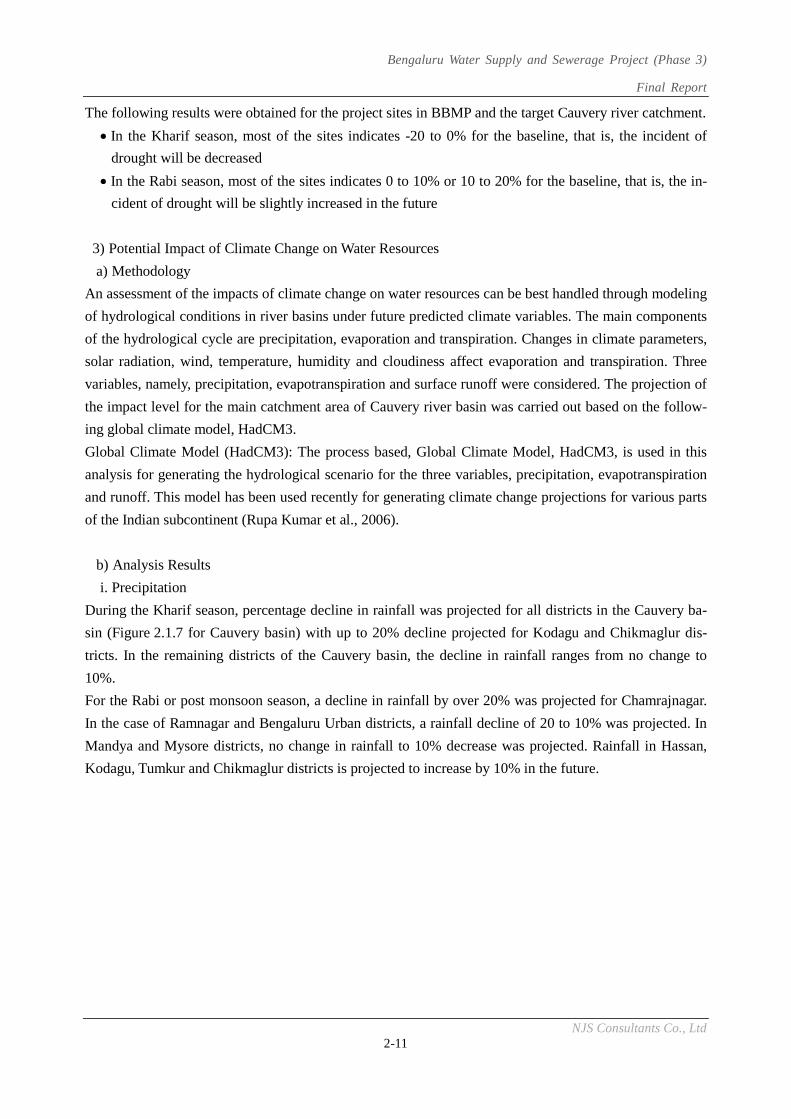
Bengaluru Water Supply and Sewerage Project (Phase 3)
Final Report
NJS Consultants Co., Ltd 2-11
The following results were obtained for the project sites in BBMP and the target Cauvery river catchment.
In the Kharif season, most of the sites indicates -20 to 0% for the baseline, that is, the incident of
drought will be decreased
In the Rabi season, most of the sites indicates 0 to 10% or 10 to 20% for the baseline, that is, the in-
cident of drought will be slightly increased in the future
3) Potential Impact of Climate Change on Water Resources
a) Methodology
An assessment of the impacts of climate change on water resources can be best handled through modeling
of hydrological conditions in river basins under future predicted climate variables. The main components
of the hydrological cycle are precipitation, evaporation and transpiration. Changes in climate parameters,
solar radiation, wind, temperature, humidity and cloudiness affect evaporation and transpiration. Three
variables, namely, precipitation, evapotranspiration and surface runoff were considered. The projection of
the impact level for the main catchment area of Cauvery river basin was carried out based on the follow-
ing global climate model, HadCM3.
Global Climate Model (HadCM3): The process based, Global Climate Model, HadCM3, is used in this
analysis for generating the hydrological scenario for the three variables, precipitation, evapotranspiration
and runoff. This model has been used recently for generating climate change projections for various parts
of the Indian subcontinent (Rupa Kumar et al., 2006).
b) Analysis Results
i. Precipitation
During the Kharif season, percentage decline in rainfall was projected for all districts in the Cauvery ba-
sin (Figure 2.1.7 for Cauvery basin) with up to 20% decline projected for Kodagu and Chikmaglur dis-
tricts. In the remaining districts of the Cauvery basin, the decline in rainfall ranges from no change to
10%.
For the Rabi or post monsoon season, a decline in rainfall by over 20% was projected for Chamrajnagar.
In the case of Ramnagar and Bengaluru Urban districts, a rainfall decline of 20 to 10% was projected. In
Mandya and Mysore districts, no change in rainfall to 10% decrease was projected. Rainfall in Hassan,
Kodagu, Tumkur and Chikmaglur districts is projected to increase by 10% in the future.
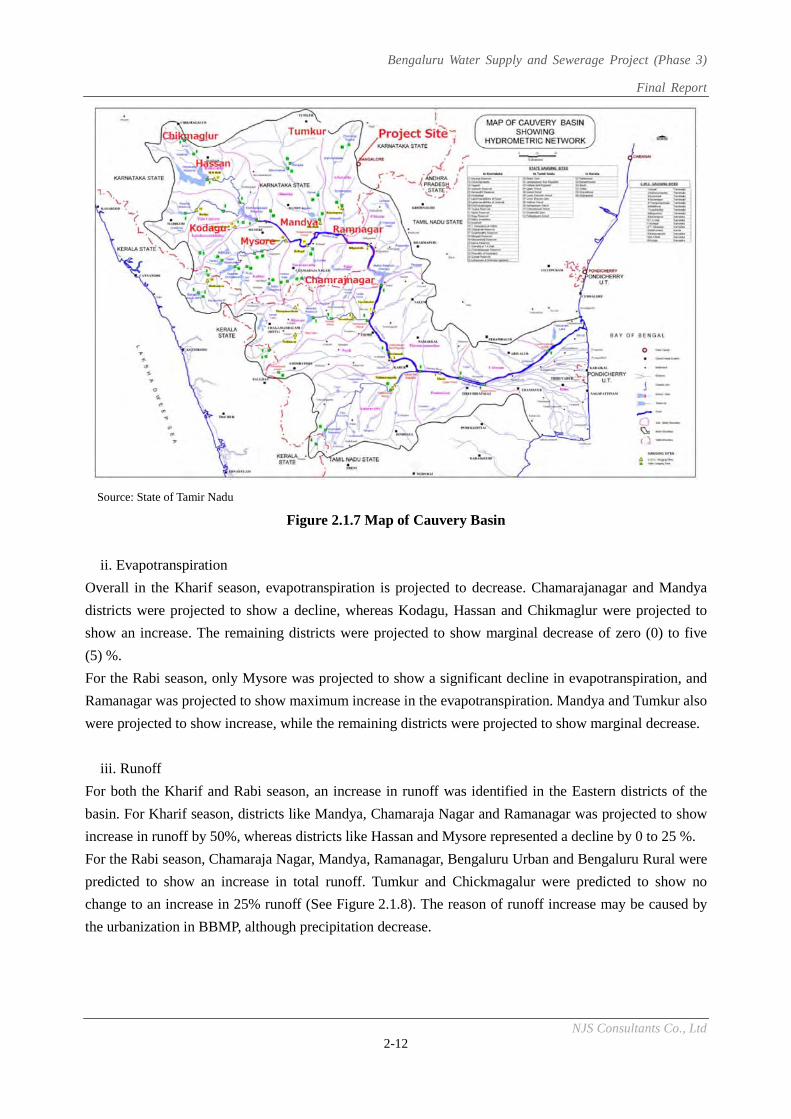
Bengaluru Water Supply and Sewerage Project (Phase 3)
Final Report
NJS Consultants Co., Ltd 2-12
Source: State of Tamir Nadu
Figure 2.1.7 Map of Cauvery Basin
ii. Evapotranspiration
Overall in the Kharif season, evapotranspiration is projected to decrease. Chamarajanagar and Mandya
districts were projected to show a decline, whereas Kodagu, Hassan and Chikmaglur were projected to
show an increase. The remaining districts were projected to show marginal decrease of zero (0) to five
(5) %.
For the Rabi season, only Mysore was projected to show a significant decline in evapotranspiration, and
Ramanagar was projected to show maximum increase in the evapotranspiration. Mandya and Tumkur also
were projected to show increase, while the remaining districts were projected to show marginal decrease.
iii. Runoff
For both the Kharif and Rabi season, an increase in runoff was identified in the Eastern districts of the
basin. For Kharif season, districts like Mandya, Chamaraja Nagar and Ramanagar was projected to show
increase in runoff by 50%, whereas districts like Hassan and Mysore represented a decline by 0 to 25 %.
For the Rabi season, Chamaraja Nagar, Mandya, Ramanagar, Bengaluru Urban and Bengaluru Rural were
predicted to show an increase in total runoff. Tumkur and Chickmagalur were predicted to show no
change to an increase in 25% runoff (See Figure 2.1.8). The reason of runoff increase may be caused by
the urbanization in BBMP, although precipitation decrease.
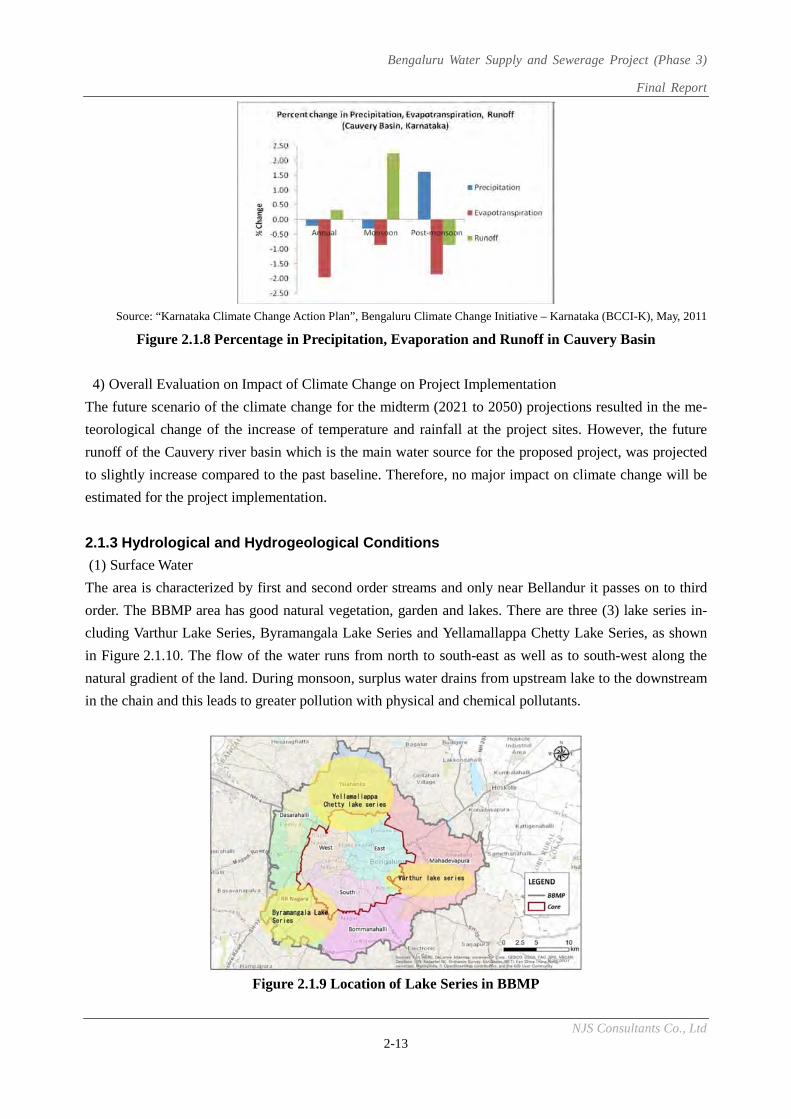
Bengaluru Water Supply and Sewerage Project (Phase 3)
Final Report
NJS Consultants Co., Ltd 2-13
Source: “Karnataka Climate Change Action Plan”, Bengaluru Climate Change Initiative – Karnataka (BCCI-K), May, 2011
Figure 2.1.8 Percentage in Precipitation, Evaporation and Runoff in Cauvery Basin
4) Overall Evaluation on Impact of Climate Change on Project Implementation
The future scenario of the climate change for the midterm (2021 to 2050) projections resulted in the me-
teorological change of the increase of temperature and rainfall at the project sites. However, the future
runoff of the Cauvery river basin which is the main water source for the proposed project, was projected
to slightly increase compared to the past baseline. Therefore, no major impact on climate change will be
estimated for the project implementation.
2.1.3 Hydrological and Hydrogeological Conditions
(1) Surface Water
The area is characterized by first and second order streams and only near Bellandur it passes on to third
order. The BBMP area has good natural vegetation, garden and lakes. There are three (3) lake series in-
cluding Varthur Lake Series, Byramangala Lake Series and Yellamallappa Chetty Lake Series, as shown
in Figure 2.1.10. The flow of the water runs from north to south-east as well as to south-west along the
natural gradient of the land. During monsoon, surplus water drains from upstream lake to the downstream
in the chain and this leads to greater pollution with physical and chemical pollutants.
Figure 2.1.9 Location of Lake Series in BBMP
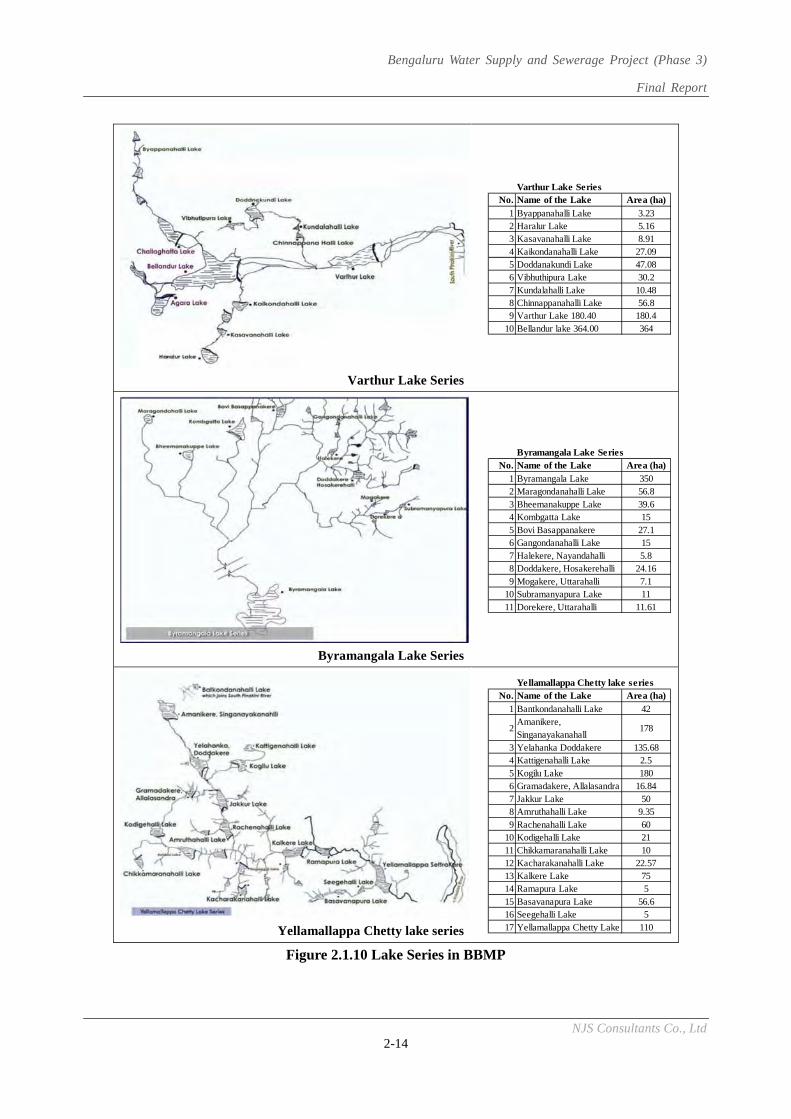
Bengaluru Water Supply and Sewerage Project (Phase 3)
Final Report
NJS Consultants Co., Ltd 2-14
Varthur Lake Series
Byramangala Lake Series
Yellamallappa Chetty lake series Figure 2.1.10 Lake Series in BBMP
Varthur Lake SeriesNo. Name of the Lake Area (ha)
1 Byappanahalli Lake 3.232 Haralur Lake 5.163 Kasavanahalli Lake 8.914 Kaikondanahalli Lake 27.095 Doddanakundi Lake 47.086 Vibhuthipura Lake 30.27 Kundalahalli Lake 10.488 Chinnappanahalli Lake 56.89 Varthur Lake 180.40 180.4
10 Bellandur lake 364.00 364
Byramangala Lake SeriesNo. Name of the Lake Area (ha)
1 Byramangala Lake 3502 Maragondanahalli Lake 56.83 Bheemanakuppe Lake 39.64 Kombgatta Lake 155 Bovi Basappanakere 27.16 Gangondanahalli Lake 157 Halekere, Nayandahalli 5.88 Doddakere, Hosakerehalli 24.169 Mogakere, Uttarahalli 7.1
10 Subramanyapura Lake 1111 Dorekere, Uttarahalli 11.61
Yellamallappa Chetty lake seriesNo. Name of the Lake Area (ha)
1 Bantkondanahalli Lake 42
2Amanikere,Singanayakanahall
178
3 Yelahanka Doddakere 135.684 Kattigenahalli Lake 2.55 Kogilu Lake 1806 Gramadakere, Allalasandra 16.847 Jakkur Lake 508 Amruthahalli Lake 9.359 Rachenahalli Lake 60
10 Kodigehalli Lake 2111 Chikkamaranahalli Lake 1012 Kacharakanahalli Lake 22.5713 Kalkere Lake 7514 Ramapura Lake 515 Basavanapura Lake 56.616 Seegehalli Lake 517 Yellamallappa Chetty Lake 110
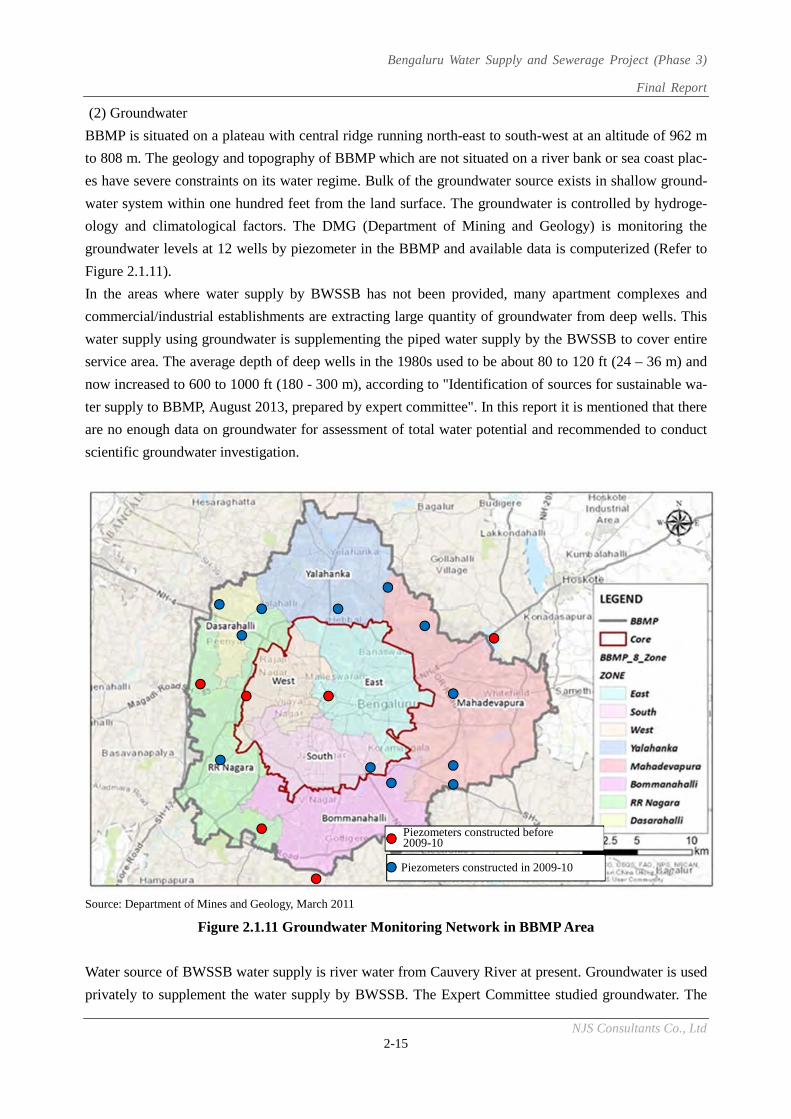
Bengaluru Water Supply and Sewerage Project (Phase 3)
Final Report
NJS Consultants Co., Ltd 2-15
(2) Groundwater
BBMP is situated on a plateau with central ridge running north-east to south-west at an altitude of 962 m
to 808 m. The geology and topography of BBMP which are not situated on a river bank or sea coast plac-
es have severe constraints on its water regime. Bulk of the groundwater source exists in shallow ground-
water system within one hundred feet from the land surface. The groundwater is controlled by hydroge-
ology and climatological factors. The DMG (Department of Mining and Geology) is monitoring the
groundwater levels at 12 wells by piezometer in the BBMP and available data is computerized (Refer to
Figure 2.1.11).
In the areas where water supply by BWSSB has not been provided, many apartment complexes and
commercial/industrial establishments are extracting large quantity of groundwater from deep wells. This
water supply using groundwater is supplementing the piped water supply by the BWSSB to cover entire
service area. The average depth of deep wells in the 1980s used to be about 80 to 120 ft (24 – 36 m) and
now increased to 600 to 1000 ft (180 - 300 m), according to "Identification of sources for sustainable wa-
ter supply to BBMP, August 2013, prepared by expert committee". In this report it is mentioned that there
are no enough data on groundwater for assessment of total water potential and recommended to conduct
scientific groundwater investigation.
Source: Department of Mines and Geology, March 2011
Figure 2.1.11 Groundwater Monitoring Network in BBMP Area
Water source of BWSSB water supply is river water from Cauvery River at present. Groundwater is used
privately to supplement the water supply by BWSSB. The Expert Committee studied groundwater. The
Piezometers constructed in 2009-10
Piezometers constructed before 2009-10
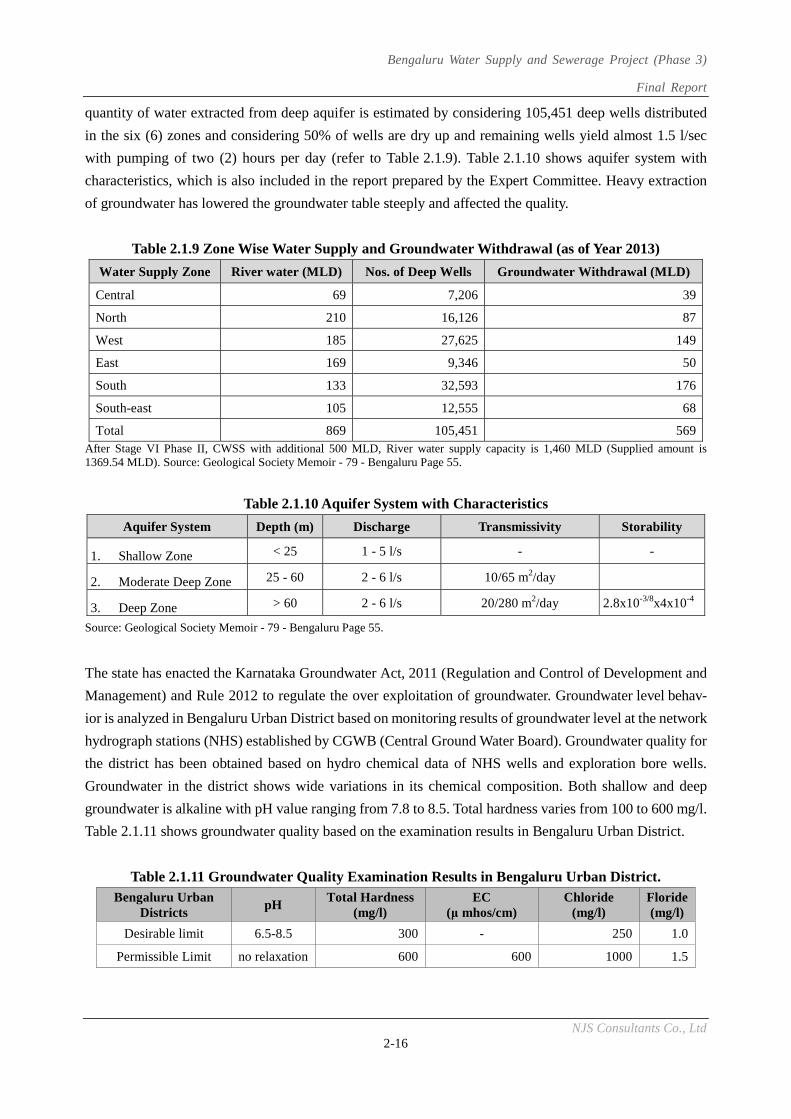
Bengaluru Water Supply and Sewerage Project (Phase 3)
Final Report
NJS Consultants Co., Ltd 2-16
quantity of water extracted from deep aquifer is estimated by considering 105,451 deep wells distributed
in the six (6) zones and considering 50% of wells are dry up and remaining wells yield almost 1.5 l/sec
with pumping of two (2) hours per day (refer to Table 2.1.9). Table 2.1.10 shows aquifer system with
characteristics, which is also included in the report prepared by the Expert Committee. Heavy extraction
of groundwater has lowered the groundwater table steeply and affected the quality.
Table 2.1.9 Zone Wise Water Supply and Groundwater Withdrawal (as of Year 2013)
Water Supply Zone River water (MLD) Nos. of Deep Wells Groundwater Withdrawal (MLD)
Central 69 7,206 39
North 210 16,126 87
West 185 27,625 149
East 169 9,346 50
South 133 32,593 176
South-east 105 12,555 68
Total 869 105,451 569After Stage VI Phase II, CWSS with additional 500 MLD, River water supply capacity is 1,460 MLD (Supplied amount is 1369.54 MLD). Source: Geological Society Memoir - 79 - Bengaluru Page 55.
Table 2.1.10 Aquifer System with Characteristics
Aquifer System Depth (m) Discharge Transmissivity Storability
1. Shallow Zone < 25 1 - 5 l/s - -
2. Moderate Deep Zone 25 - 60 2 - 6 l/s 10/65 m2/day
3. Deep Zone > 60 2 - 6 l/s 20/280 m2/day 2.8x10⁻³/8x4x10-4
Source: Geological Society Memoir - 79 - Bengaluru Page 55.
The state has enacted the Karnataka Groundwater Act, 2011 (Regulation and Control of Development and
Management) and Rule 2012 to regulate the over exploitation of groundwater. Groundwater level behav-
ior is analyzed in Bengaluru Urban District based on monitoring results of groundwater level at the network
hydrograph stations (NHS) established by CGWB (Central Ground Water Board). Groundwater quality for
the district has been obtained based on hydro chemical data of NHS wells and exploration bore wells.
Groundwater in the district shows wide variations in its chemical composition. Both shallow and deep
groundwater is alkaline with pH value ranging from 7.8 to 8.5. Total hardness varies from 100 to 600 mg/l.
Table 2.1.11 shows groundwater quality based on the examination results in Bengaluru Urban District.
Table 2.1.11 Groundwater Quality Examination Results in Bengaluru Urban District. Bengaluru Urban
Districts pH
Total Hardness (mg/l)
EC (μ mhos/cm)
Chloride (mg/l)
Floride(mg/l)
Desirable limit 6.5-8.5 300 - 250 1.0
Permissible Limit no relaxation 600 600 1000 1.5
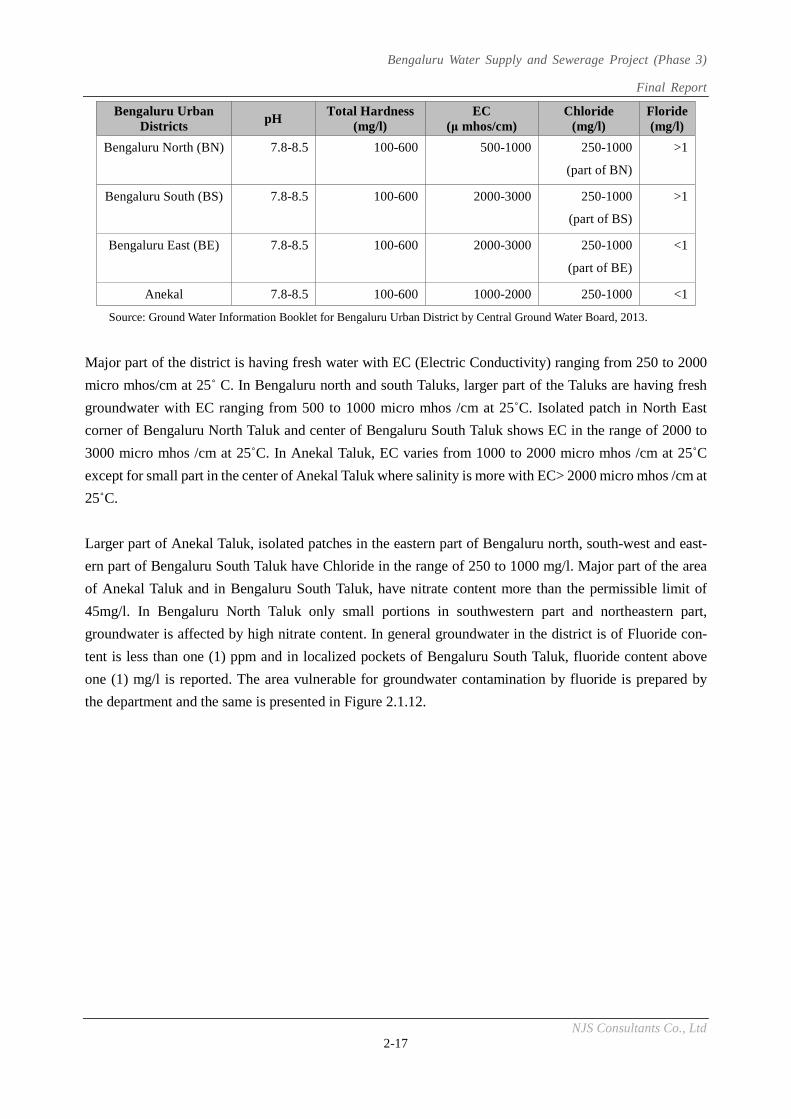
Bengaluru Water Supply and Sewerage Project (Phase 3)
Final Report
NJS Consultants Co., Ltd 2-17
Bengaluru Urban Districts
pH Total Hardness
(mg/l) EC
(μ mhos/cm) Chloride
(mg/l) Floride(mg/l)
Bengaluru North (BN) 7.8-8.5 100-600 500-1000 250-1000
(part of BN)
>1
Bengaluru South (BS) 7.8-8.5 100-600 2000-3000 250-1000
(part of BS)
>1
Bengaluru East (BE) 7.8-8.5 100-600 2000-3000 250-1000
(part of BE)
<1
Anekal 7.8-8.5 100-600 1000-2000 250-1000 <1
Source: Ground Water Information Booklet for Bengaluru Urban District by Central Ground Water Board, 2013.
Major part of the district is having fresh water with EC (Electric Conductivity) ranging from 250 to 2000
micro mhos/cm at 25 C. In Bengaluru north and south Taluks, larger part of the Taluks are having fresh
groundwater with EC ranging from 500 to 1000 micro mhos /cm at 25 C. Isolated patch in North East
corner of Bengaluru North Taluk and center of Bengaluru South Taluk shows EC in the range of 2000 to
3000 micro mhos /cm at 25 C. In Anekal Taluk, EC varies from 1000 to 2000 micro mhos /cm at 25 C
except for small part in the center of Anekal Taluk where salinity is more with EC> 2000 micro mhos /cm at
25 C.
Larger part of Anekal Taluk, isolated patches in the eastern part of Bengaluru north, south-west and east-
ern part of Bengaluru South Taluk have Chloride in the range of 250 to 1000 mg/l. Major part of the area
of Anekal Taluk and in Bengaluru South Taluk, have nitrate content more than the permissible limit of
45mg/l. In Bengaluru North Taluk only small portions in southwestern part and northeastern part,
groundwater is affected by high nitrate content. In general groundwater in the district is of Fluoride con-
tent is less than one (1) ppm and in localized pockets of Bengaluru South Taluk, fluoride content above
one (1) mg/l is reported. The area vulnerable for groundwater contamination by fluoride is prepared by
the department and the same is presented in Figure 2.1.12.
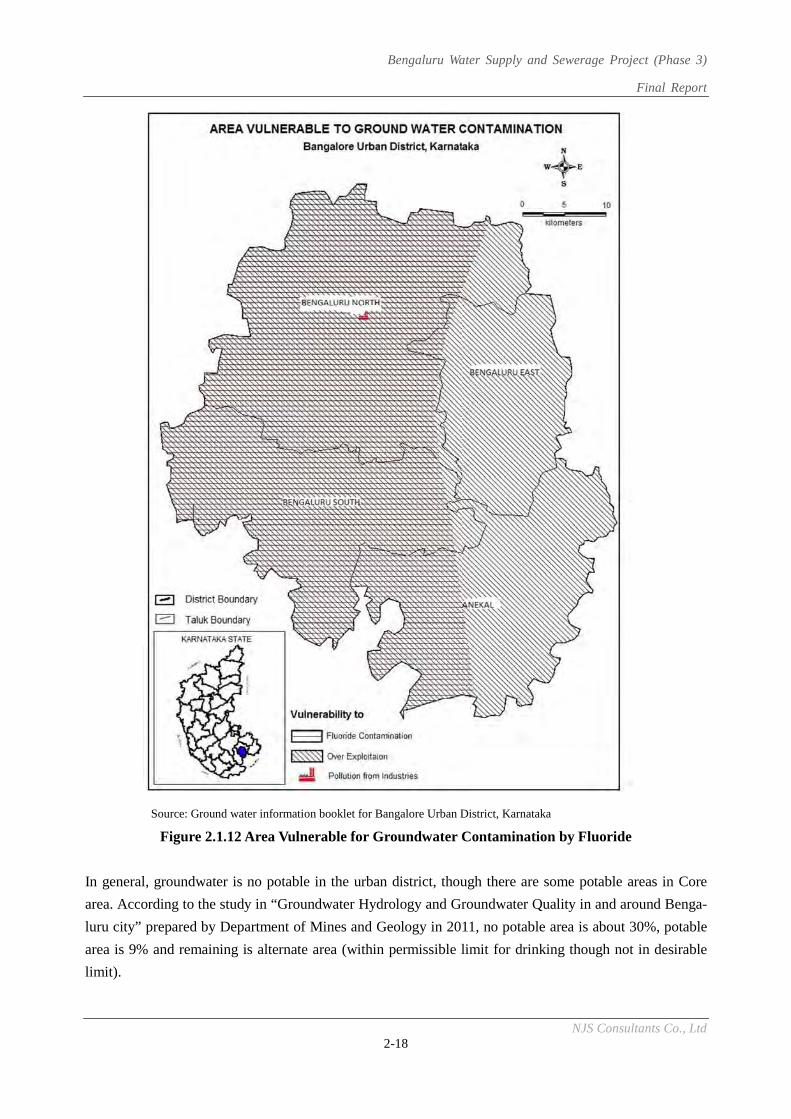
Bengaluru Water Supply and Sewerage Project (Phase 3)
Final Report
NJS Consultants Co., Ltd 2-18
Source: Ground water information booklet for Bangalore Urban District, Karnataka
Figure 2.1.12 Area Vulnerable for Groundwater Contamination by Fluoride
In general, groundwater is no potable in the urban district, though there are some potable areas in Core
area. According to the study in “Groundwater Hydrology and Groundwater Quality in and around Benga-
luru city” prepared by Department of Mines and Geology in 2011, no potable area is about 30%, potable
area is 9% and remaining is alternate area (within permissible limit for drinking though not in desirable
limit).
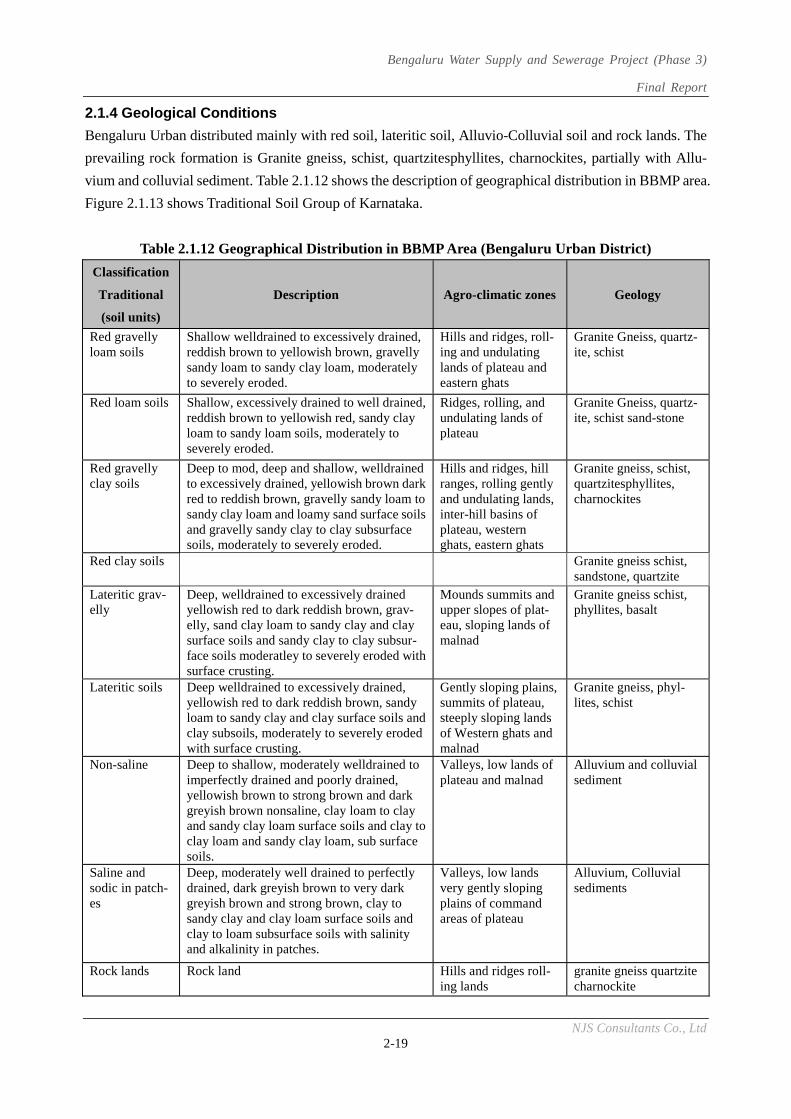
Bengaluru Water Supply and Sewerage Project (Phase 3)
Final Report
NJS Consultants Co., Ltd 2-19
2.1.4 Geological Conditions
Bengaluru Urban distributed mainly with red soil, lateritic soil, Alluvio-Colluvial soil and rock lands. The
prevailing rock formation is Granite gneiss, schist, quartzitesphyllites, charnockites, partially with Allu-
vium and colluvial sediment. Table 2.1.12 shows the description of geographical distribution in BBMP area.
Figure 2.1.13 shows Traditional Soil Group of Karnataka.
Table 2.1.12 Geographical Distribution in BBMP Area (Bengaluru Urban District)
Classification
Traditional
(soil units)
Description Agro-climatic zones Geology
Red gravelly loam soils
Shallow welldrained to excessively drained, reddish brown to yellowish brown, gravelly sandy loam to sandy clay loam, moderately to severely eroded.
Hills and ridges, roll-ing and undulating lands of plateau and eastern ghats
Granite Gneiss, quartz-ite, schist
Red loam soils Shallow, excessively drained to well drained, reddish brown to yellowish red, sandy clay loam to sandy loam soils, moderately to severely eroded.
Ridges, rolling, and undulating lands of plateau
Granite Gneiss, quartz-ite, schist sand-stone
Red gravelly clay soils
Deep to mod, deep and shallow, welldrained to excessively drained, yellowish brown dark red to reddish brown, gravelly sandy loam to sandy clay loam and loamy sand surface soils and gravelly sandy clay to clay subsurface soils, moderately to severely eroded.
Hills and ridges, hill ranges, rolling gently and undulating lands, inter-hill basins of plateau, western ghats, eastern ghats
Granite gneiss, schist, quartzitesphyllites, charnockites
Red clay soils Granite gneiss schist, sandstone, quartzite
Lateritic grav-elly
Deep, welldrained to excessively drained yellowish red to dark reddish brown, grav-elly, sand clay loam to sandy clay and clay surface soils and sandy clay to clay subsur-face soils moderatley to severely eroded with surface crusting.
Mounds summits and upper slopes of plat-eau, sloping lands of malnad
Granite gneiss schist, phyllites, basalt
Lateritic soils Deep welldrained to excessively drained, yellowish red to dark reddish brown, sandy loam to sandy clay and clay surface soils and clay subsoils, moderately to severely eroded with surface crusting.
Gently sloping plains, summits of plateau, steeply sloping lands of Western ghats and malnad
Granite gneiss, phyl-lites, schist
Non-saline Deep to shallow, moderately welldrained to imperfectly drained and poorly drained, yellowish brown to strong brown and dark greyish brown nonsaline, clay loam to clay and sandy clay loam surface soils and clay to clay loam and sandy clay loam, sub surface soils.
Valleys, low lands of plateau and malnad
Alluvium and colluvial sediment
Saline and sodic in patch-es
Deep, moderately well drained to perfectly drained, dark greyish brown to very dark greyish brown and strong brown, clay to sandy clay and clay loam surface soils and clay to loam subsurface soils with salinity and alkalinity in patches.
Valleys, low lands very gently sloping plains of command areas of plateau
Alluvium, Colluvial sediments
Rock lands Rock land Hills and ridges roll-ing lands
granite gneiss quartzite charnockite
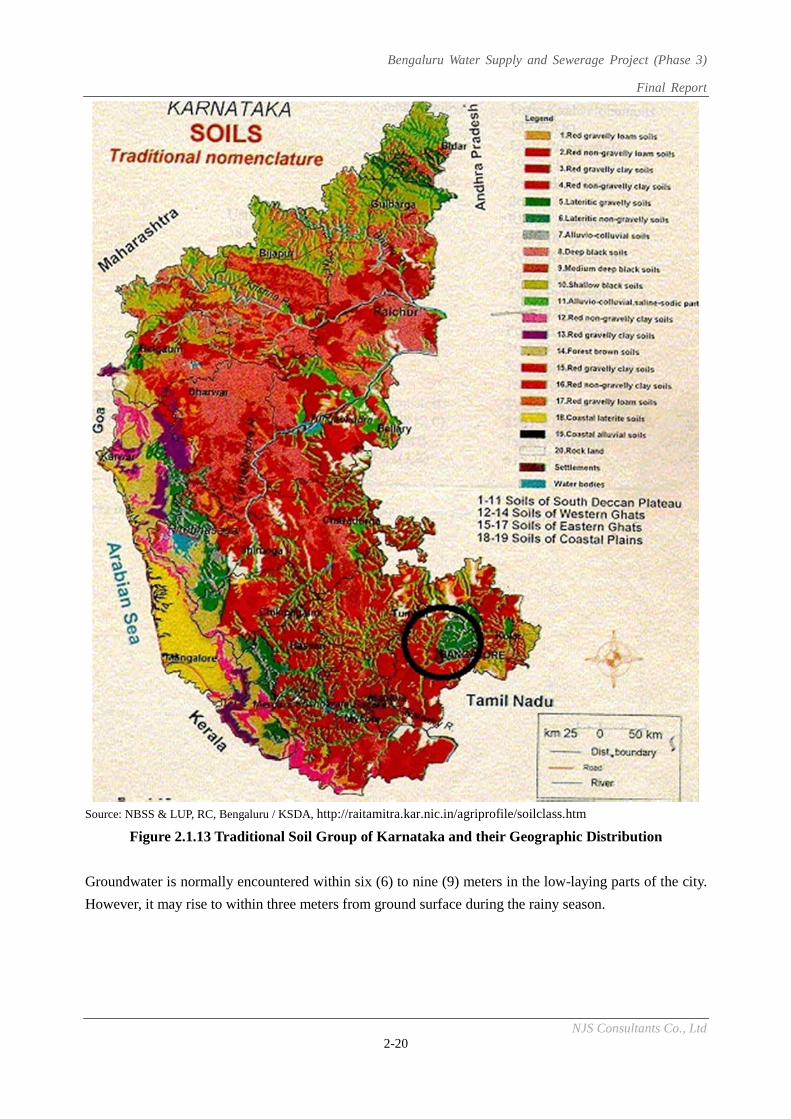
Bengaluru Water Supply and Sewerage Project (Phase 3)
Final Report
NJS Consultants Co., Ltd 2-20
Source: NBSS & LUP, RC, Bengaluru / KSDA, http://raitamitra.kar.nic.in/agriprofile/soilclass.htm
Figure 2.1.13 Traditional Soil Group of Karnataka and their Geographic Distribution
Groundwater is normally encountered within six (6) to nine (9) meters in the low-laying parts of the city.
However, it may rise to within three meters from ground surface during the rainy season.
Bengaluru Water Supply and Sewerage Project (Phase 3)
Final Report
NJS Consultants Co., Ltd 2-21
2.2 Legislative Conditions 2.2.1 National/State/City Water Policy
(1) National Policy
1) National Water Policy
A first National Water Policy of the Government of India was established in 1987. The national policy for
priority principle for water use is as follows:
Drinking Water
Irrigation
Hydro-power
Navigation
Industrial and other uses
The National Water Policy (NWP 2002) was subsequently introduced in relation to the rapidly changing
scenario in the domain of water to address the emerging issues and provide critical policy inputs. NWP
2002 gave emphasis to ecological and environmental aspects for water allocation as a first time.
The NWP 2012 calls for a common integrated perspective to govern the planning and management of water
resources. This perspective considers local, regional and national contexts and environmentally soundness.
The guiding principles stated in the NWP 2012 include;
A principle of equity and social justice must inform the use and allocation of water resources.
Planning, development, and management of water resources need to be governed by common inte-
grated perspectives considering local, regional and national context, having an environmentally
sound basis, keeping in view the human, social and economic needs.
Safe drinking water and water for sanitation should be considered as preemptive needs, followed by
high priority allocation for other basic domestic needs, supporting agriculture for food security and
minimum ecosystem needs.
Given the limits on enhancing utilizable water resources coupled with climate change impacts, meet-
ing the future needs of water will depend more on demand management.
Water-using activities need to be regulated keeping in mind the local geo-climatic and hydrological
situations.
2) National River Conservation Policy
The river conservation programme in the country was initiated with the launching of the Ganga Action
Plan (GAP) in 1985. The Ganga Action Plan was expanded to cover other rivers under National River
Conservation Plan (NRCP) in the year 1995. NRCP, excluding the GAP-I, GAP-II and National Ganga
River Basin Authority (NGRBA) programme presently covers polluted stretches of 40 rivers in 121 towns
spread over 18 States.
The NRCP aims at preventing pollution of rivers and improving water quality through construction of
Sewage Treatment Plants (STPs) including riverfront development and low cost sanitation and afforesta-
tion. Users can access to the information on specific action plans for various rivers, details of sewage
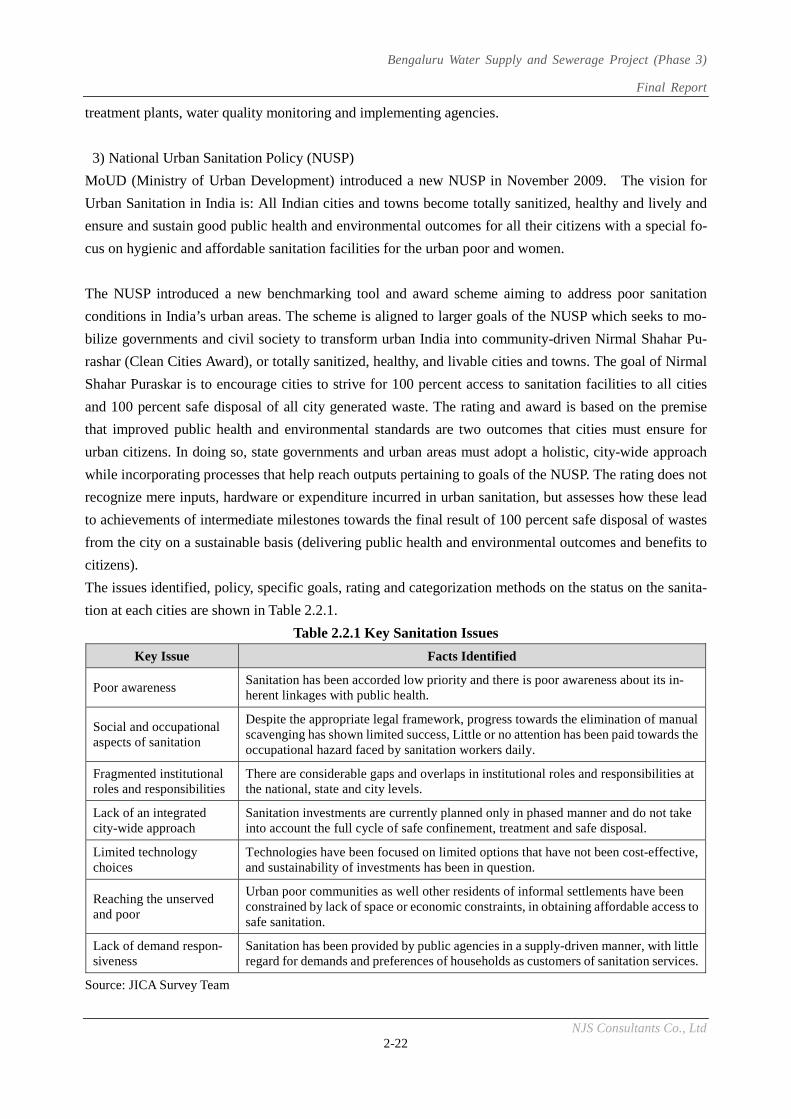
Bengaluru Water Supply and Sewerage Project (Phase 3)
Final Report
NJS Consultants Co., Ltd 2-22
treatment plants, water quality monitoring and implementing agencies.
3) National Urban Sanitation Policy (NUSP)
MoUD (Ministry of Urban Development) introduced a new NUSP in November 2009. The vision for
Urban Sanitation in India is: All Indian cities and towns become totally sanitized, healthy and lively and
ensure and sustain good public health and environmental outcomes for all their citizens with a special fo-
cus on hygienic and affordable sanitation facilities for the urban poor and women.
The NUSP introduced a new benchmarking tool and award scheme aiming to address poor sanitation
conditions in India’s urban areas. The scheme is aligned to larger goals of the NUSP which seeks to mo-
bilize governments and civil society to transform urban India into community-driven Nirmal Shahar Pu-
rashar (Clean Cities Award), or totally sanitized, healthy, and livable cities and towns. The goal of Nirmal
Shahar Puraskar is to encourage cities to strive for 100 percent access to sanitation facilities to all cities
and 100 percent safe disposal of all city generated waste. The rating and award is based on the premise
that improved public health and environmental standards are two outcomes that cities must ensure for
urban citizens. In doing so, state governments and urban areas must adopt a holistic, city-wide approach
while incorporating processes that help reach outputs pertaining to goals of the NUSP. The rating does not
recognize mere inputs, hardware or expenditure incurred in urban sanitation, but assesses how these lead
to achievements of intermediate milestones towards the final result of 100 percent safe disposal of wastes
from the city on a sustainable basis (delivering public health and environmental outcomes and benefits to
citizens).
The issues identified, policy, specific goals, rating and categorization methods on the status on the sanita-
tion at each cities are shown in Table 2.2.1.
Table 2.2.1 Key Sanitation Issues
Key Issue Facts Identified
Poor awareness Sanitation has been accorded low priority and there is poor awareness about its in-herent linkages with public health.
Social and occupational aspects of sanitation
Despite the appropriate legal framework, progress towards the elimination of manual scavenging has shown limited success, Little or no attention has been paid towards the occupational hazard faced by sanitation workers daily.
Fragmented institutional roles and responsibilities
There are considerable gaps and overlaps in institutional roles and responsibilities at the national, state and city levels.
Lack of an integrated city-wide approach
Sanitation investments are currently planned only in phased manner and do not take into account the full cycle of safe confinement, treatment and safe disposal.
Limited technology choices
Technologies have been focused on limited options that have not been cost-effective, and sustainability of investments has been in question.
Reaching the unserved and poor
Urban poor communities as well other residents of informal settlements have been constrained by lack of space or economic constraints, in obtaining affordable access to safe sanitation.
Lack of demand respon-siveness
Sanitation has been provided by public agencies in a supply-driven manner, with little regard for demands and preferences of households as customers of sanitation services.
Source: JICA Survey Team
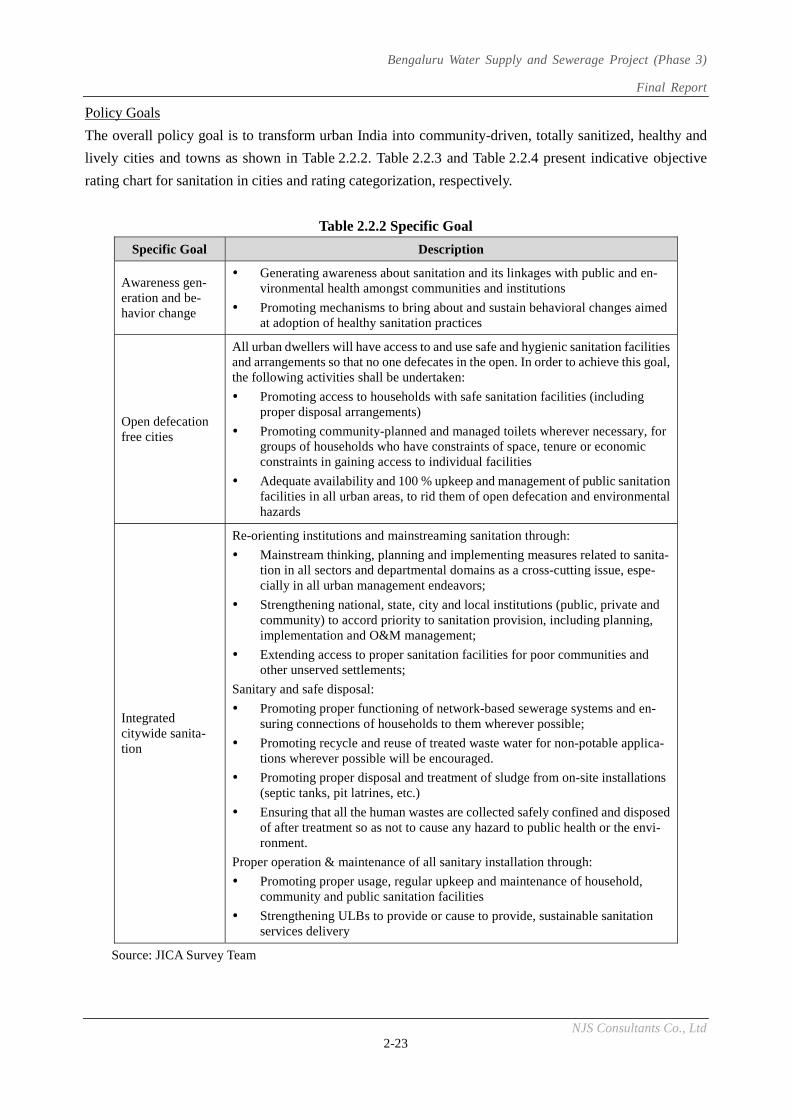
Bengaluru Water Supply and Sewerage Project (Phase 3)
Final Report
NJS Consultants Co., Ltd 2-23
Policy Goals
The overall policy goal is to transform urban India into community-driven, totally sanitized, healthy and
lively cities and towns as shown in Table 2.2.2. Table 2.2.3 and Table 2.2.4 present indicative objective
rating chart for sanitation in cities and rating categorization, respectively.
Table 2.2.2 Specific Goal
Specific Goal Description
Awareness gen-eration and be-havior change
Generating awareness about sanitation and its linkages with public and en-vironmental health amongst communities and institutions
Promoting mechanisms to bring about and sustain behavioral changes aimed at adoption of healthy sanitation practices
Open defecation free cities
All urban dwellers will have access to and use safe and hygienic sanitation facilities and arrangements so that no one defecates in the open. In order to achieve this goal, the following activities shall be undertaken:
Promoting access to households with safe sanitation facilities (including proper disposal arrangements)
Promoting community-planned and managed toilets wherever necessary, for groups of households who have constraints of space, tenure or economic constraints in gaining access to individual facilities
Adequate availability and 100 % upkeep and management of public sanitation facilities in all urban areas, to rid them of open defecation and environmental hazards
Integrated citywide sanita-tion
Re-orienting institutions and mainstreaming sanitation through:
Mainstream thinking, planning and implementing measures related to sanita-tion in all sectors and departmental domains as a cross-cutting issue, espe-cially in all urban management endeavors;
Strengthening national, state, city and local institutions (public, private and community) to accord priority to sanitation provision, including planning, implementation and O&M management;
Extending access to proper sanitation facilities for poor communities and other unserved settlements;
Sanitary and safe disposal:
Promoting proper functioning of network-based sewerage systems and en-suring connections of households to them wherever possible;
Promoting recycle and reuse of treated waste water for non-potable applica-tions wherever possible will be encouraged.
Promoting proper disposal and treatment of sludge from on-site installations (septic tanks, pit latrines, etc.)
Ensuring that all the human wastes are collected safely confined and disposed of after treatment so as not to cause any hazard to public health or the envi-ronment.
Proper operation & maintenance of all sanitary installation through:
Promoting proper usage, regular upkeep and maintenance of household, community and public sanitation facilities
Strengthening ULBs to provide or cause to provide, sustainable sanitation services delivery
Source: JICA Survey Team
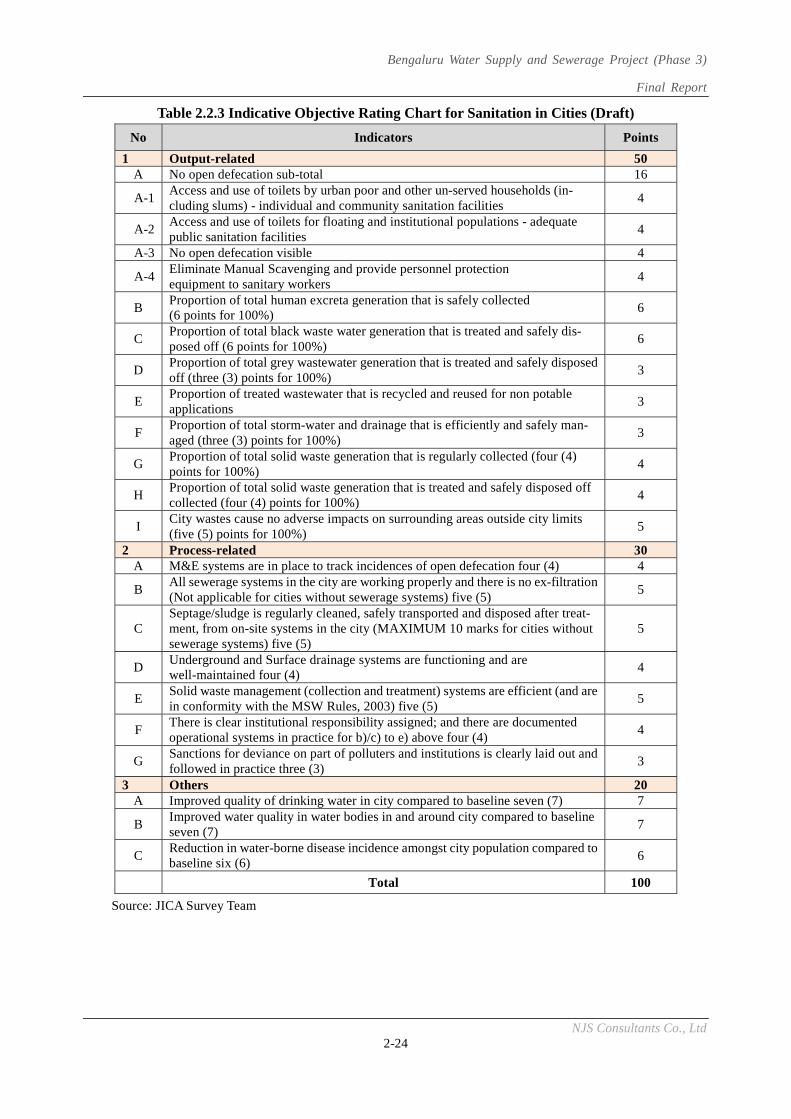
Bengaluru Water Supply and Sewerage Project (Phase 3)
Final Report
NJS Consultants Co., Ltd 2-24
Table 2.2.3 Indicative Objective Rating Chart for Sanitation in Cities (Draft)
No Indicators Points
1 Output-related 50 A No open defecation sub-total 16
A-1 Access and use of toilets by urban poor and other un-served households (in-cluding slums) - individual and community sanitation facilities
4
A-2 Access and use of toilets for floating and institutional populations - adequate public sanitation facilities
4
A-3 No open defecation visible 4
A-4 Eliminate Manual Scavenging and provide personnel protection equipment to sanitary workers
4
B Proportion of total human excreta generation that is safely collected (6 points for 100%)
6
C Proportion of total black waste water generation that is treated and safely dis-posed off (6 points for 100%)
6
D Proportion of total grey wastewater generation that is treated and safely disposed off (three (3) points for 100%)
3
E Proportion of treated wastewater that is recycled and reused for non potable applications
3
F Proportion of total storm-water and drainage that is efficiently and safely man-aged (three (3) points for 100%)
3
G Proportion of total solid waste generation that is regularly collected (four (4) points for 100%)
4
H Proportion of total solid waste generation that is treated and safely disposed off collected (four (4) points for 100%)
4
I City wastes cause no adverse impacts on surrounding areas outside city limits (five (5) points for 100%)
5
2 Process-related 30 A M&E systems are in place to track incidences of open defecation four (4) 4
B All sewerage systems in the city are working properly and there is no ex-filtration (Not applicable for cities without sewerage systems) five (5)
5
C Septage/sludge is regularly cleaned, safely transported and disposed after treat-ment, from on-site systems in the city (MAXIMUM 10 marks for cities without sewerage systems) five (5)
5
D Underground and Surface drainage systems are functioning and are well-maintained four (4)
4
E Solid waste management (collection and treatment) systems are efficient (and are in conformity with the MSW Rules, 2003) five (5)
5
F There is clear institutional responsibility assigned; and there are documented operational systems in practice for b)/c) to e) above four (4)
4
G Sanctions for deviance on part of polluters and institutions is clearly laid out and followed in practice three (3)
3
3 Others 20 A Improved quality of drinking water in city compared to baseline seven (7) 7
B Improved water quality in water bodies in and around city compared to baseline seven (7)
7
C Reduction in water-borne disease incidence amongst city population compared to baseline six (6)
6
Total 100
Source: JICA Survey Team
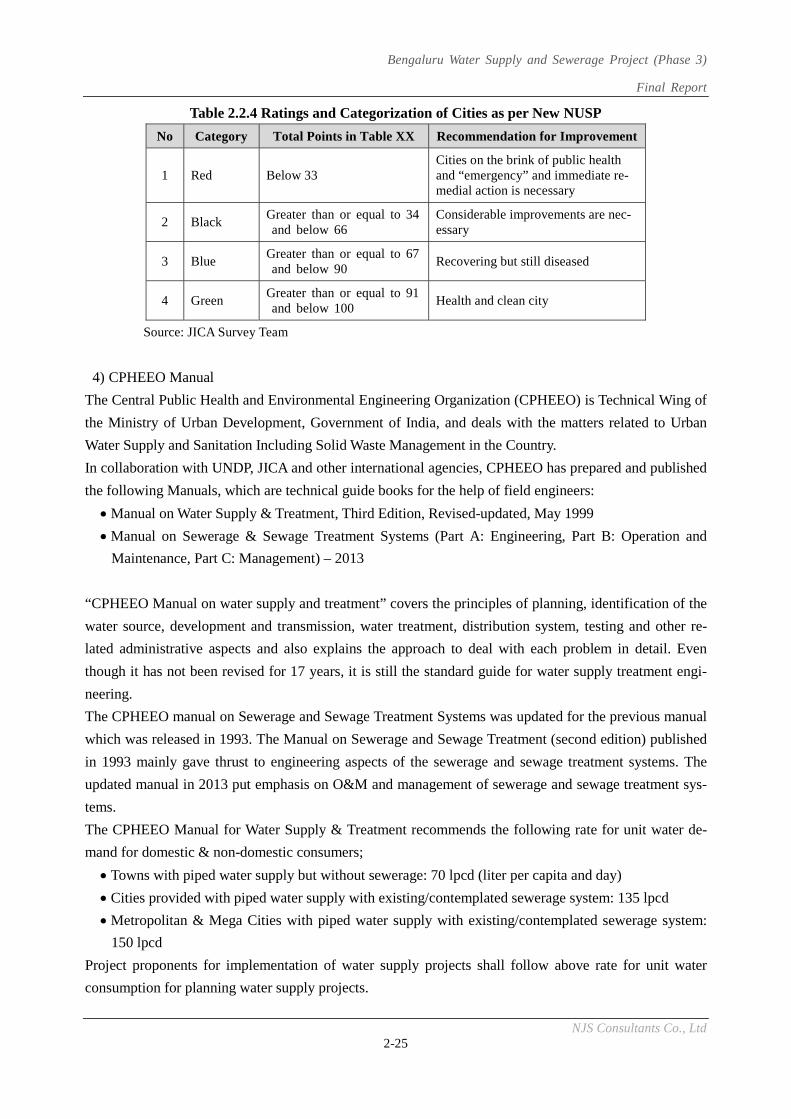
Bengaluru Water Supply and Sewerage Project (Phase 3)
Final Report
NJS Consultants Co., Ltd 2-25
Table 2.2.4 Ratings and Categorization of Cities as per New NUSP
No Category Total Points in Table XX Recommendation for Improvement
1 Red Below 33 Cities on the brink of public health and “emergency” and immediate re-medial action is necessary
2 Black Greater than or equal to 34 and below 66
Considerable improvements are nec-essary
3 Blue Greater than or equal to 67 and below 90
Recovering but still diseased
4 Green Greater than or equal to 91 and below 100
Health and clean city
Source: JICA Survey Team
4) CPHEEO Manual
The Central Public Health and Environmental Engineering Organization (CPHEEO) is Technical Wing of
the Ministry of Urban Development, Government of India, and deals with the matters related to Urban
Water Supply and Sanitation Including Solid Waste Management in the Country.
In collaboration with UNDP, JICA and other international agencies, CPHEEO has prepared and published
the following Manuals, which are technical guide books for the help of field engineers:
Manual on Water Supply & Treatment, Third Edition, Revised-updated, May 1999
Manual on Sewerage & Sewage Treatment Systems (Part A: Engineering, Part B: Operation and
Maintenance, Part C: Management) – 2013
“CPHEEO Manual on water supply and treatment” covers the principles of planning, identification of the
water source, development and transmission, water treatment, distribution system, testing and other re-
lated administrative aspects and also explains the approach to deal with each problem in detail. Even
though it has not been revised for 17 years, it is still the standard guide for water supply treatment engi-
neering.
The CPHEEO manual on Sewerage and Sewage Treatment Systems was updated for the previous manual
which was released in 1993. The Manual on Sewerage and Sewage Treatment (second edition) published
in 1993 mainly gave thrust to engineering aspects of the sewerage and sewage treatment systems. The
updated manual in 2013 put emphasis on O&M and management of sewerage and sewage treatment sys-
tems.
The CPHEEO Manual for Water Supply & Treatment recommends the following rate for unit water de-
mand for domestic & non-domestic consumers;
Towns with piped water supply but without sewerage: 70 lpcd (liter per capita and day)
Cities provided with piped water supply with existing/contemplated sewerage system: 135 lpcd
Metropolitan & Mega Cities with piped water supply with existing/contemplated sewerage system:
150 lpcd
Project proponents for implementation of water supply projects shall follow above rate for unit water
consumption for planning water supply projects.
Bengaluru Water Supply and Sewerage Project (Phase 3)
Final Report
NJS Consultants Co., Ltd 2-26
(2) State’s Water Policy
Karnataka’s State Water Policy 2002 aims to achieve:
1) Providing drinking water of 55 lpcd in rural areas, 70 lpcd in towns, 100 lpcd in the city municipal
council areas and 135 lpcd in city corporation areas
2) Creating an ultimate irrigation potential of 4,500,000 ha under major, medium and minor irrigation
projects facilitating the creation of an additional irrigation potential of 1,600,000 ha
3) Improving the performance of all water resources projects
4) Improving productivity of irrigated agriculture by involving users in irrigation management
5) Harnessing the hydropower potential in the state
6) Providing a legislative, administrative and infrastructure framework to ensure fair and equitable dis-
tribution and utilization of water resources
BWSSB has adopted per capita water supply rate of 150 lpcd for the proposed project for metropolitan
areas such as BBMP as per the Manual on Water Supply and Treatment of CPHEEO.
Karnataka state also has announced the Urban Drinking Water and Sanitation Policy as shown below:
1) To ensure universal coverage of water and sanitation services that people are willing to pay for
2) To provide such services in a manner that preserves the sustainability of the precious water resources of
the State, protects and enhances the commercial and economic sustainability of the operations at the
same time
3) To ensure a minimum level of service to all citizens
4) To achieve these objectives, the state would:
Continue to formulate policies, set the standards for provision of water services
Provide resources for capacity creation, regulate, monitor and evaluate the efficiency of the
operations
Prepare a demand driven urban water action plan for making capital investments based on the
principles of optimal utilization of water, water systems and financial sources
Propose a new tariff structure that would help recover O&M expenses, debt servicing, and
ensure a reasonable return on capital
Encourage private sector participation to achieve the sector goals, promote economic and
commercial viability of water sector services, allowing the ULBs the choice of providing the
services directly through public bodies or through such appropriate private sector participation
arrangements
(3) City’s Water Policy
Bengaluru City (BDA) prepared the policy for sanitation and water supply. The following are the sum-
mary by sanitation and water supply.
1) Sanitation
The city emphasized combined improvement among sanitation, solid waste and drainage and particularly
pronounced in surface and groundwater pollution and unsafe waste disposal with adverse health impacts.
Bengaluru Water Supply and Sewerage Project (Phase 3)
Final Report
NJS Consultants Co., Ltd 2-27
The following are summary of present status by item.
Sewerage: The problem of sewage, linked with problem of access to potable water is a major
concern for the city.
Solid Waste Disposal: The collection of the waste is carried out regularly by the city, but waste
treatment is an issue of concern. New dump sites and landfill sites shall be identified and de-
veloped.
Drainage: The flooding of drains during each monsoon exposes its poor state and their inadequate
capacity, and impacts the city’s overall infrastructure. To control floods, it is important to remove
silt and widen these storm water drains to maintain the chain flow and avoid water from stag-
nating at one point.
Safe sanitation and solid waste management are key challenges for the city. In this regard, the BBMP au-
thority and BWSSB shall be working towards the following strategic outlook:
Safe sanitation facilities are accessible by all citizens and municipal waste management covers
the entire city.
Public awareness is increased of safe sanitary practice and of citizen’s responsibilities to achieve
and maintain hygienic environment.
Municipal waste management practices conforming to the Municipal Solid waste Management
Rules.
Appropriate options for wastewater recycling and reuse are introduced to supplement water for
non-domestic usage.
Storm water runoff is appropriately collected and discharged into natural drainage channels
Encroachments are relocated to safe areas thereby ensuring that aspects of health and safety are
adequately addressed.
2) Water Supply
Water supply is a key concern when it comes to the problem of the city’s infrastructure. There are major
disparities regarding access to potable water in the city. The Bengaluru Core area is generally well served,
however, the villages have quite limited services and majority of households have recourse to the wells and
collective water supply because of absence of water supply systems. It is imperative to improve access to
potable water for households and improve the sanitary conditions. Irregular water supply and the need to
store it cause problems of hygiene. These risks are high in the poorest residential areas and in the slums.
The BWSSB provides water supply and sewerage services in the BBMP area. The following are require-
ments to be achieved by BWSSB.
Ensuring that water is accessible to all citizens on a continuous basis, every day,
Ensuring that the quality and quantity of water available to citizens conforms to the Central Public
Health and Environmental Engineering Organization (CPHEEO) standards, and
Ensuring that full cost of water service shall be achieved using funds for long-term asset
strengthening and management.
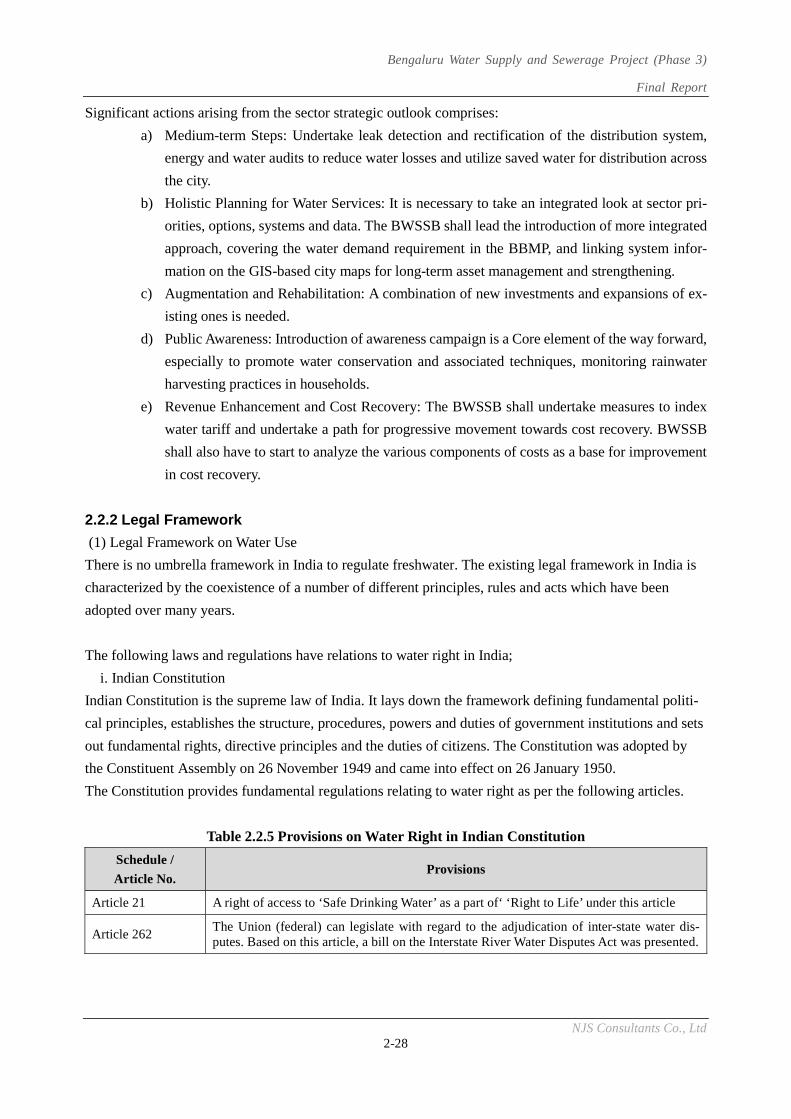
Bengaluru Water Supply and Sewerage Project (Phase 3)
Final Report
NJS Consultants Co., Ltd 2-28
Significant actions arising from the sector strategic outlook comprises:
a) Medium-term Steps: Undertake leak detection and rectification of the distribution system,
energy and water audits to reduce water losses and utilize saved water for distribution across
the city.
b) Holistic Planning for Water Services: It is necessary to take an integrated look at sector pri-
orities, options, systems and data. The BWSSB shall lead the introduction of more integrated
approach, covering the water demand requirement in the BBMP, and linking system infor-
mation on the GIS-based city maps for long-term asset management and strengthening.
c) Augmentation and Rehabilitation: A combination of new investments and expansions of ex-
isting ones is needed.
d) Public Awareness: Introduction of awareness campaign is a Core element of the way forward,
especially to promote water conservation and associated techniques, monitoring rainwater
harvesting practices in households.
e) Revenue Enhancement and Cost Recovery: The BWSSB shall undertake measures to index
water tariff and undertake a path for progressive movement towards cost recovery. BWSSB
shall also have to start to analyze the various components of costs as a base for improvement
in cost recovery.
2.2.2 Legal Framework
(1) Legal Framework on Water Use
There is no umbrella framework in India to regulate freshwater. The existing legal framework in India is
characterized by the coexistence of a number of different principles, rules and acts which have been
adopted over many years.
The following laws and regulations have relations to water right in India;
i. Indian Constitution
Indian Constitution is the supreme law of India. It lays down the framework defining fundamental politi-
cal principles, establishes the structure, procedures, powers and duties of government institutions and sets
out fundamental rights, directive principles and the duties of citizens. The Constitution was adopted by
the Constituent Assembly on 26 November 1949 and came into effect on 26 January 1950.
The Constitution provides fundamental regulations relating to water right as per the following articles.
Table 2.2.5 Provisions on Water Right in Indian Constitution
Schedule /
Article No. Provisions
Article 21 A right of access to ‘Safe Drinking Water’ as a part of‘ ‘Right to Life’ under this article
Article 262 The Union (federal) can legislate with regard to the adjudication of inter-state water dis-putes. Based on this article, a bill on the Interstate River Water Disputes Act was presented.
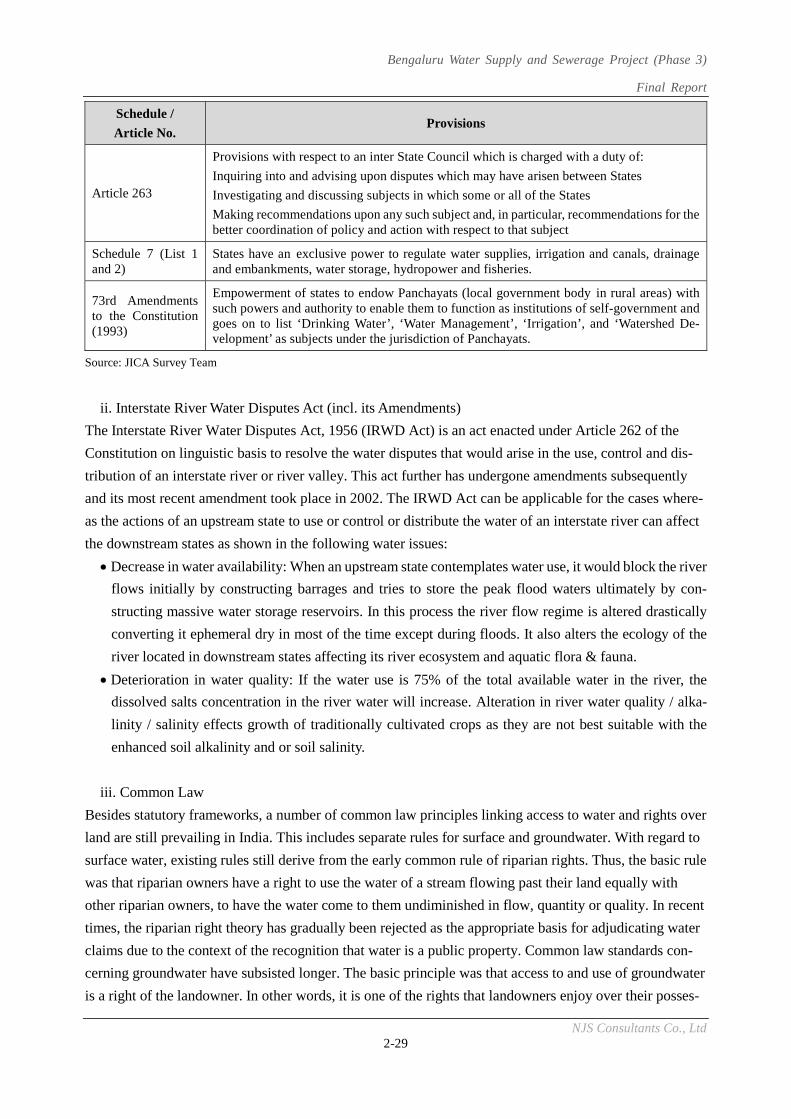
Bengaluru Water Supply and Sewerage Project (Phase 3)
Final Report
NJS Consultants Co., Ltd 2-29
Schedule /
Article No. Provisions
Article 263
Provisions with respect to an inter State Council which is charged with a duty of:
Inquiring into and advising upon disputes which may have arisen between States
Investigating and discussing subjects in which some or all of the States
Making recommendations upon any such subject and, in particular, recommendations for the better coordination of policy and action with respect to that subject
Schedule 7 (List 1 and 2)
States have an exclusive power to regulate water supplies, irrigation and canals, drainage and embankments, water storage, hydropower and fisheries.
73rd Amendments to the Constitution (1993)
Empowerment of states to endow Panchayats (local government body in rural areas) with such powers and authority to enable them to function as institutions of self-government and goes on to list ‘Drinking Water’, ‘Water Management’, ‘Irrigation’, and ‘Watershed De-velopment’ as subjects under the jurisdiction of Panchayats.
Source: JICA Survey Team
ii. Interstate River Water Disputes Act (incl. its Amendments)
The Interstate River Water Disputes Act, 1956 (IRWD Act) is an act enacted under Article 262 of the
Constitution on linguistic basis to resolve the water disputes that would arise in the use, control and dis-
tribution of an interstate river or river valley. This act further has undergone amendments subsequently
and its most recent amendment took place in 2002. The IRWD Act can be applicable for the cases where-
as the actions of an upstream state to use or control or distribute the water of an interstate river can affect
the downstream states as shown in the following water issues:
Decrease in water availability: When an upstream state contemplates water use, it would block the river
flows initially by constructing barrages and tries to store the peak flood waters ultimately by con-
structing massive water storage reservoirs. In this process the river flow regime is altered drastically
converting it ephemeral dry in most of the time except during floods. It also alters the ecology of the
river located in downstream states affecting its river ecosystem and aquatic flora & fauna.
Deterioration in water quality: If the water use is 75% of the total available water in the river, the
dissolved salts concentration in the river water will increase. Alteration in river water quality / alka-
linity / salinity effects growth of traditionally cultivated crops as they are not best suitable with the
enhanced soil alkalinity and or soil salinity.
iii. Common Law
Besides statutory frameworks, a number of common law principles linking access to water and rights over
land are still prevailing in India. This includes separate rules for surface and groundwater. With regard to
surface water, existing rules still derive from the early common rule of riparian rights. Thus, the basic rule
was that riparian owners have a right to use the water of a stream flowing past their land equally with
other riparian owners, to have the water come to them undiminished in flow, quantity or quality. In recent
times, the riparian right theory has gradually been rejected as the appropriate basis for adjudicating water
claims due to the context of the recognition that water is a public property. Common law standards con-
cerning groundwater have subsisted longer. The basic principle was that access to and use of groundwater
is a right of the landowner. In other words, it is one of the rights that landowners enjoy over their posses-
Bengaluru Water Supply and Sewerage Project (Phase 3)
Final Report
NJS Consultants Co., Ltd 2-30
sions. The inappropriateness of this legal principle has been rapidly challenged during the second half of
the 20th century with new technological options permitting individual owners to appropriate not only
water under their land but also the groundwater found under neighbor’s lands. However, the rapid lower-
ing of water table in most regions of the country has called in question legal principles giving unrestricted
rights to landowners over groundwater. As a result of the rapid expansion of groundwater use, the central
government has tried to persuade states to adopt groundwater legislation since the 1970s.
(2) Water Prevention and Control of Pollution Act, 1974 and its Amendments
The Water (Prevention and Control of Pollution) Act and the Environment Protection Act promulgated in
1974 and 1986, respectively deal with the prevention and control of water pollution. The latter is consid-
ered as an umbrella act covering all aspects of the environment, under which the central government can
take appropriate measures for;
Protecting and improving the quality of the environment, and
Preventing, controlling and abating environmental pollution.
The Pollution Control Board (PCB) was established under this act both at the Central Government called
as Central Pollution Control Board (CPCB) and also at the State Government level for each state.
The Act vests regulatory authority on the State Pollution Control Board and empowers them to establish
and enforce effluent standards for industries and local authorities discharging effluents.
The followings are the important provisions under this Act:
Provide the State Pollution Control Board (SPCB) any information which is sought for preventing or
controlling pollution of water regarding the construction, installations, operation or the treatment and
disposal system of an industrial establishments
Not to discharge, knowingly of any effluent into the stream, sewers or on land of quality which is not
conforming to the standards prescribed by SPCB
Furnish information to SPCB and other designated agencies of any accident or unforeseen event, in
which effluents not conforming to the prescribed standards are being discharged or likely to be dis-
charged in to a stream or sewer or on land
Comply with the directions issued in writing by SPCB, within the specified time.
Comply with the condition as prescribed in the “Consent to Establish” or “Consent to Operate” for
discharge of effluent in to stream or sewers or on land.
The responsibilities pursuant to this law is as follows;
To obtain “Consent to Establish”, prior to taking any steps to establish any industry or any treatment
and disposal system which is likely to discharge effluents.
To obtain “Consent to Operate”, prior to commencing operation of any industry or any treatment
and disposal system which is likely to discharge effluents.
To apply for renewal of the “Consent to Operate”: before the expiry of validity period along with
the prescribed fee.
Bengaluru Water Supply and Sewerage Project (Phase 3)
Final Report
NJS Consultants Co., Ltd 2-31
(3) Water (Prevention and Control of Pollution) Cess Act, 1977 including Rules
The act provides the levy and collection of a cess on water consumed by persons carrying on certain in-
dustries and by local authorities to augment resources for PCB.
As per the provision of Section three (3), all specified industries under the Water (Prevention and Control
of Pollution) Cess Act, 1977 are liable to pay cess in the prescribed rate made under the statute. It is pro-
vided under Section five (5) that every specified industry or local authority is liable to furnish cess to re-
spective authorities. Also all specified industries and local authorities for the purpose of measuring the
quantity of water consumption shall install suitable meters.
To encourage capital investment in pollution control, the Act gives a polluter a 70% rebate of the applica-
ble cess upon installing an effluent treatment plant.
(4) The Environment (Protection) Act, 1986, 2004 (amended)
The Environment (Protection) Act was conceived as an “umbrella legislation” seeking to supplement the
existing laws on the control of pollution (the water Act and the Air Act) by enacting a general legislation
for environment protection and to fill the gaps in regulation of major environmental hazards.
Section 3 (1) of the Act (with respect to the power of central government) empowers the Centre to
“take all such measures as it deems necessary or expedient for the purpose of protecting and improving
the quality of the environment and preventing, controlling and abating environmental pollution”.
It also authorizes the government to make rules on any aspect related to environment protection.
No industries can discharge any solid, liquid or gaseous substances beyond the permissible limit as laid
down by the Central Government on its behalf.
Comply with the directions issued in writing by the Central Government within a specified time as
mentioned in the order.
Furnish information to the prescribed agencies of any accident or unforeseen event, in which envi-
ronmental pollutants occurred in excess of the prescribed standards are being discharged, of are likely
to be discharged in the environment.
The following is the provisions regarding the responsibilities pursuant to the law;
Obtain prior “Environmental Clearance” from MoEF (Ministry of Environment and Forests) in case of
a new project or for modernization/expansion of the existing project and in respect of projects falling
under EIA notification
(5) Karnataka Groundwater (Regulation and Control of Development and Management) Act, 2011
The rising concerns about diminishing groundwater resources prompted the legislation of the Karnataka
Groundwater (Regulation and Control of Development and Management) Act, 2011. The act seeks to reg-
ulate access and exploitation of groundwater. Permissions are required for operating existing bore wells,
drilling new bore wells and drawing water for water- intensive crops in certain notified areas. These can be
refused if stipulated conditions are not met. The act also stipulates watershed management, rainwater
harvesting and groundwater recharge in ‘worthy’ areas to be notified.
Bengaluru Water Supply and Sewerage Project (Phase 3)
Final Report
NJS Consultants Co., Ltd 2-32
(6) Laws and Regulation relating to River Minimum Maintenance Flow
The latest National Water Policy (NWP 2002) gives fourth priority to ecology after drinking water, irriga-
tion and hydropower. However, the policy does not say what this priority would mean. The section under
Water Quality in the NWP 2002 has some relevant provisions for rivers including maintaining minimum
river flow shown as:
Minimum flow should be ensured in the perennial streams for maintaining ecology and social con-
siderations.
However, the legislation for keeping a minimum river flow has not been established.
(7) Laws and Regulation relating to Land Acquisition
In India, the Land Acquisition Act (LAA) 1894 had served as the basis for all government acquisition of
land for public purposes. The first land acquisition law was enacted during the British Raj in 1824, which
underwent several modifications and was finally replaced by the LAA, 1894. The GoI (Government of
India) in 1947 adopted the LAA 1894. Since then, several amendments have been made due to its weak
framework such as lack of clear definition of “Public Purpose”, complete absence of a statutory absence of
R & R (Rehabilitation and Resettlement) for affected persons and inadequate protection of the interests of
the land owners. In addition, various State Governments also amended the Act in order to respond to the
local demands, like in the case of Land Acquisition (Amendment and Validation) Act of 1967 by the state of
Karnataka. Afterwards, two (2) bills, “The Land Acquisition (Amendment) Bill, 2007” and “The Rehabil-
itation and Resettlement Bill, 2007” were introduced in Lok Sabha (the lower house of India's Bicamer-
al-Parliament). Through discussions based on these two (2) bills, the Right to Fair Compensation and
Transparency in Land Acquisition, Rehabilitation and Resettlement Act, 2013 (RFCTLARR Act) was en-
acted and an ordinance of the amendment of the RFCTLARR act was promulgated.
Key features of the RFCTLARR Act are;
Social Impact Assessment (SIA) : Whenever a project proponent intends to acquire land for a public
purpose, the proponent shall carry out a SIA study.
Public Purpose: The Act defines the public purpose as 1) the provision of land for strategic purposes
relating to naval, military, air force, and armed forces of the Union or any work vital to national se-
curity or defense of India or State Policy, 2) infrastructural projects under the Department of Economic
Affairs, projects involving agricultural infrastructure, industrial corridors or mining activities, water
harvesting and water conservation projects, government aided educational and research institutions,
projects for sports, healthcare and tourism etc.
Affected term: Affected term shall include both the land losers and livelihood losers.
Rehabilitation and Resettlement: Various R&R package are provided for PAFs (Project Affected
Farmers)
Institutional mechanism for R&R in the form of institutions of Administrator for Rehabilitation and
Resettlement, Commissioner for Rehabilitation and Resettlement, Rehabilitation and Resettlement
Committee at project level, the Land Acquisition, Rehabilitation & Resettlement Authority at State
level and National Monitoring Committee at Central level.
Compensation: The Act provides the compensation of four times the market price in rural areas and
Bengaluru Water Supply and Sewerage Project (Phase 3)
Final Report
NJS Consultants Co., Ltd 2-33
twice the market price in urban areas. This shall include a solatium of 100 percent of the compensation.
Apart from this value of assets attached to the land shall also be part of the compensation package.
Consent: For land proposed to be acquired in any area for public purpose as part of a public-private
partnership project, the prior consent of 70 percent of the affected land owners is required and in case
of private company, prior consent of 80 percent of the affected land owners is required.
(8) Classification of Inland Water Bodies
As of now only criteria available for classification of water bodies are as per the “Designated Best Use”
(DBU) prescribed by Bureau of Indian Standards and CPCB prepared way back in 1981. The concept sets
out of various purposes for which the water body is used and taken as the benchmark and classified as
“Designated Best Use”. According to these criteria water bodies are divided into five categories as follows:
Class A: Drinking water source without conventional treatment with chlorination
Class B: Outdoor bathing
Class C: Drinking water source with conventional treatment
Class D: Propagation of wildlife and fisheries
Class E: Irrigation, industrial cooling and controlled waste disposal
Table 2.2.6 shows above criteria lay down for the parameters of pH, Dissolved Oxygen (DO), Biochemical
Oxygen Demand (BOD5), coliform, etc.
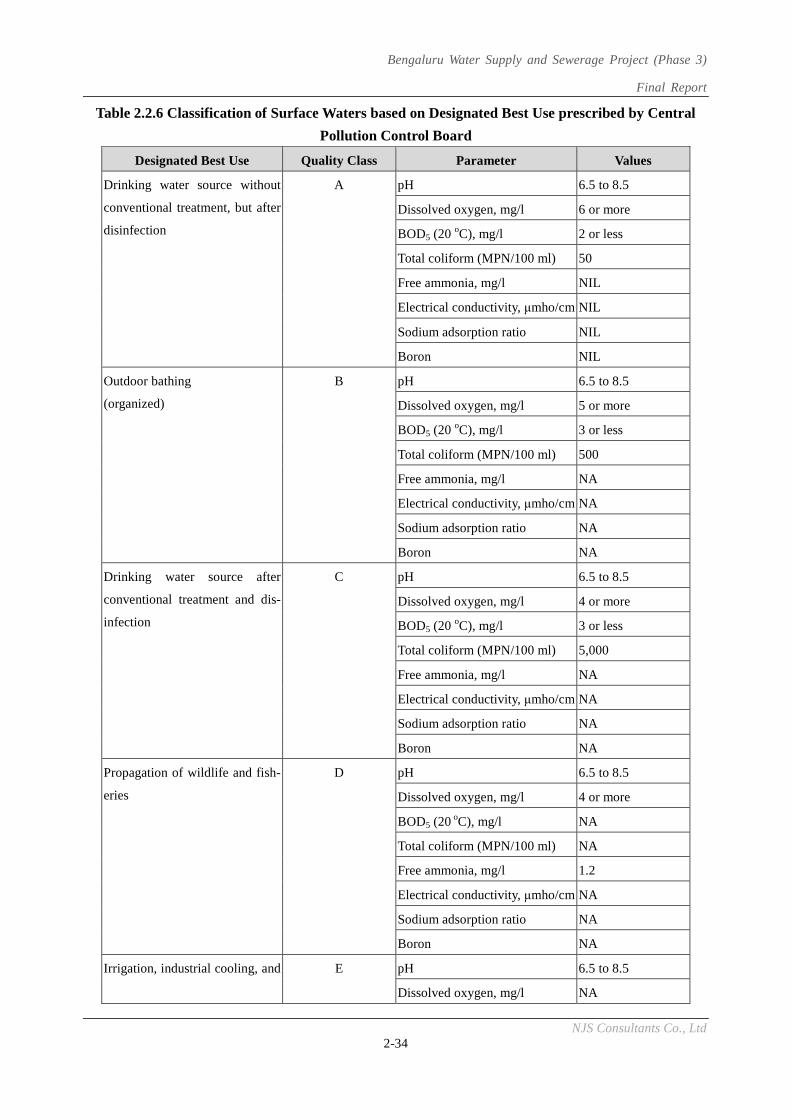
Bengaluru Water Supply and Sewerage Project (Phase 3)
Final Report
NJS Consultants Co., Ltd 2-34
Table 2.2.6 Classification of Surface Waters based on Designated Best Use prescribed by Central
Pollution Control Board
Designated Best Use Quality Class Parameter Values
Drinking water source without
conventional treatment, but after
disinfection
A
pH 6.5 to 8.5
Dissolved oxygen, mg/l 6 or more
BOD5 (20 oC), mg/l 2 or less
Total coliform (MPN/100 ml) 50
Free ammonia, mg/l NIL
Electrical conductivity, μmho/cm NIL
Sodium adsorption ratio NIL
Boron NIL
Outdoor bathing
(organized)
B
pH 6.5 to 8.5
Dissolved oxygen, mg/l 5 or more
BOD5 (20 oC), mg/l 3 or less
Total coliform (MPN/100 ml) 500
Free ammonia, mg/l NA
Electrical conductivity, μmho/cm NA
Sodium adsorption ratio NA
Boron NA
Drinking water source after
conventional treatment and dis-
infection
C
pH 6.5 to 8.5
Dissolved oxygen, mg/l 4 or more
BOD5 (20 oC), mg/l 3 or less
Total coliform (MPN/100 ml) 5,000
Free ammonia, mg/l NA
Electrical conductivity, μmho/cm NA
Sodium adsorption ratio NA
Boron NA
Propagation of wildlife and fish-
eries
D
pH 6.5 to 8.5
Dissolved oxygen, mg/l 4 or more
BOD5 (20 oC), mg/l NA
Total coliform (MPN/100 ml) NA
Free ammonia, mg/l 1.2
Electrical conductivity, μmho/cm NA
Sodium adsorption ratio NA
Boron NA
Irrigation, industrial cooling, and E pH 6.5 to 8.5
Dissolved oxygen, mg/l NA
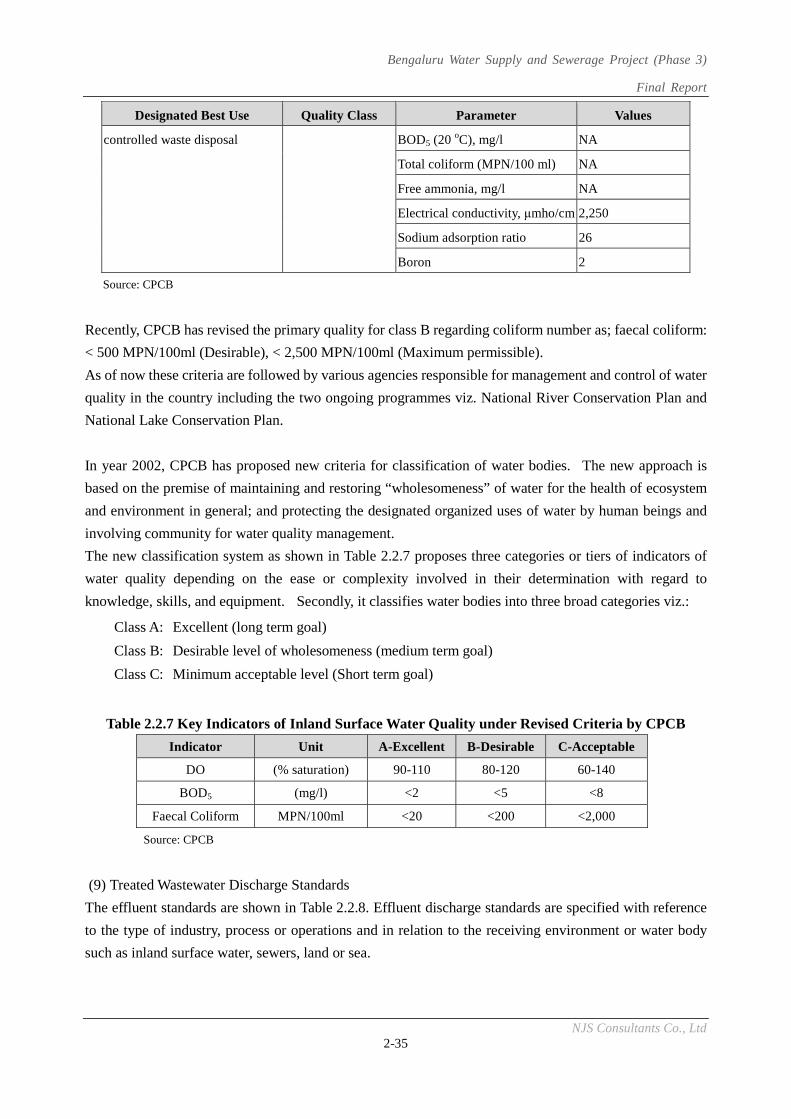
Bengaluru Water Supply and Sewerage Project (Phase 3)
Final Report
NJS Consultants Co., Ltd 2-35
Designated Best Use Quality Class Parameter Values
controlled waste disposal BOD5 (20 oC), mg/l NA
Total coliform (MPN/100 ml) NA
Free ammonia, mg/l NA
Electrical conductivity, μmho/cm 2,250
Sodium adsorption ratio 26
Boron 2
Source: CPCB
Recently, CPCB has revised the primary quality for class B regarding coliform number as; faecal coliform:
< 500 MPN/100ml (Desirable), < 2,500 MPN/100ml (Maximum permissible).
As of now these criteria are followed by various agencies responsible for management and control of water
quality in the country including the two ongoing programmes viz. National River Conservation Plan and
National Lake Conservation Plan.
In year 2002, CPCB has proposed new criteria for classification of water bodies. The new approach is
based on the premise of maintaining and restoring “wholesomeness” of water for the health of ecosystem
and environment in general; and protecting the designated organized uses of water by human beings and
involving community for water quality management.
The new classification system as shown in Table 2.2.7 proposes three categories or tiers of indicators of
water quality depending on the ease or complexity involved in their determination with regard to
knowledge, skills, and equipment. Secondly, it classifies water bodies into three broad categories viz.:
Class A: Excellent (long term goal)
Class B: Desirable level of wholesomeness (medium term goal)
Class C: Minimum acceptable level (Short term goal)
Table 2.2.7 Key Indicators of Inland Surface Water Quality under Revised Criteria by CPCB
Indicator Unit A-Excellent B-Desirable C-Acceptable
DO (% saturation) 90-110 80-120 60-140
BOD5 (mg/l) <2 <5 <8
Faecal Coliform MPN/100ml <20 <200 <2,000
Source: CPCB
(9) Treated Wastewater Discharge Standards
The effluent standards are shown in Table 2.2.8. Effluent discharge standards are specified with reference
to the type of industry, process or operations and in relation to the receiving environment or water body
such as inland surface water, sewers, land or sea.
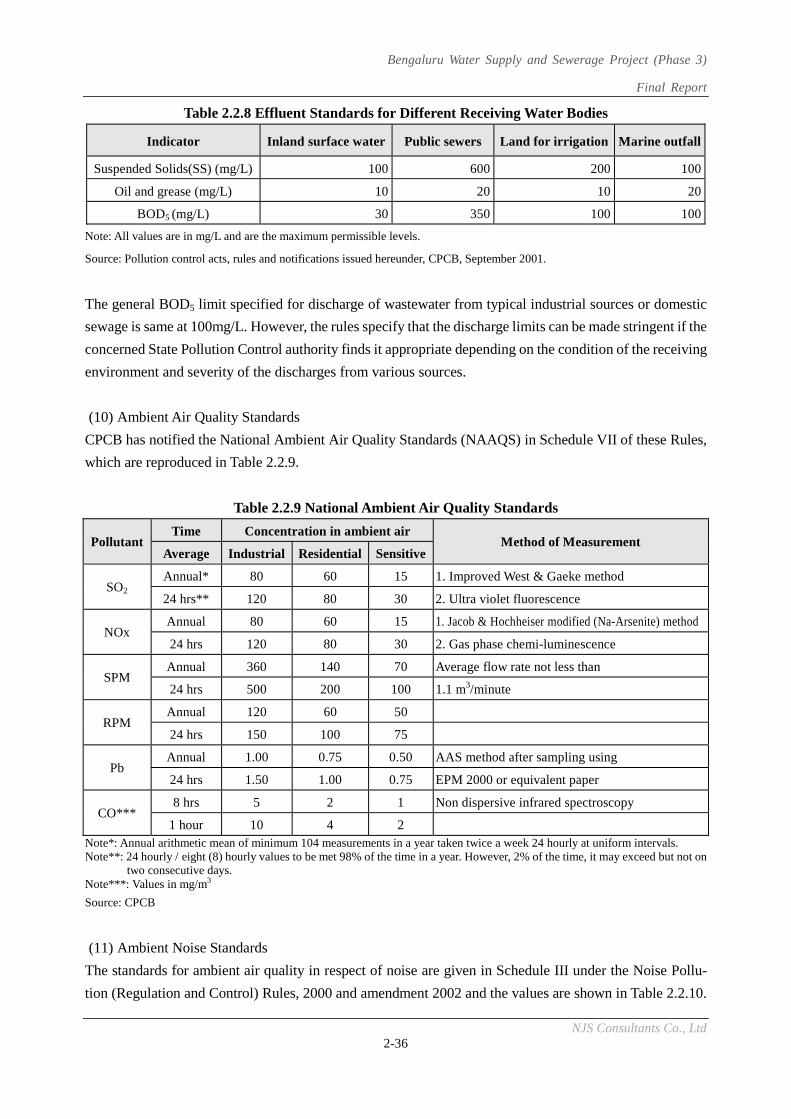
Bengaluru Water Supply and Sewerage Project (Phase 3)
Final Report
NJS Consultants Co., Ltd 2-36
Table 2.2.8 Effluent Standards for Different Receiving Water Bodies
Indicator Inland surface water Public sewers Land for irrigation Marine outfall
Suspended Solids(SS) (mg/L) 100 600 200 100
Oil and grease (mg/L) 10 20 10 20
BOD5 (mg/L) 30 350 100 100
Note: All values are in mg/L and are the maximum permissible levels.
Source: Pollution control acts, rules and notifications issued hereunder, CPCB, September 2001.
The general BOD5 limit specified for discharge of wastewater from typical industrial sources or domestic
sewage is same at 100mg/L. However, the rules specify that the discharge limits can be made stringent if the
concerned State Pollution Control authority finds it appropriate depending on the condition of the receiving
environment and severity of the discharges from various sources.
(10) Ambient Air Quality Standards
CPCB has notified the National Ambient Air Quality Standards (NAAQS) in Schedule VII of these Rules,
which are reproduced in Table 2.2.9.
Table 2.2.9 National Ambient Air Quality Standards
Pollutant Time Concentration in ambient air
Method of Measurement Average Industrial Residential Sensitive
SO2 Annual* 80 60 15 1. Improved West & Gaeke method
24 hrs** 120 80 30 2. Ultra violet fluorescence
NOx
Annual 80 60 15 1. Jacob & Hochheiser modified (Na-Arsenite) method
24 hrs 120 80 30 2. Gas phase chemi-luminescence
SPM Annual 360 140 70 Average flow rate not less than
24 hrs 500 200 100 1.1 m3/minute
RPM Annual 120 60 50
24 hrs 150 100 75
Pb Annual 1.00 0.75 0.50 AAS method after sampling using
24 hrs 1.50 1.00 0.75 EPM 2000 or equivalent paper
CO*** 8 hrs 5 2 1 Non dispersive infrared spectroscopy
1 hour 10 4 2 Note*: Annual arithmetic mean of minimum 104 measurements in a year taken twice a week 24 hourly at uniform intervals. Note**: 24 hourly / eight (8) hourly values to be met 98% of the time in a year. However, 2% of the time, it may exceed but not on
two consecutive days. Note***: Values in mg/m3
Source: CPCB
(11) Ambient Noise Standards
The standards for ambient air quality in respect of noise are given in Schedule III under the Noise Pollu-
tion (Regulation and Control) Rules, 2000 and amendment 2002 and the values are shown in Table 2.2.10.
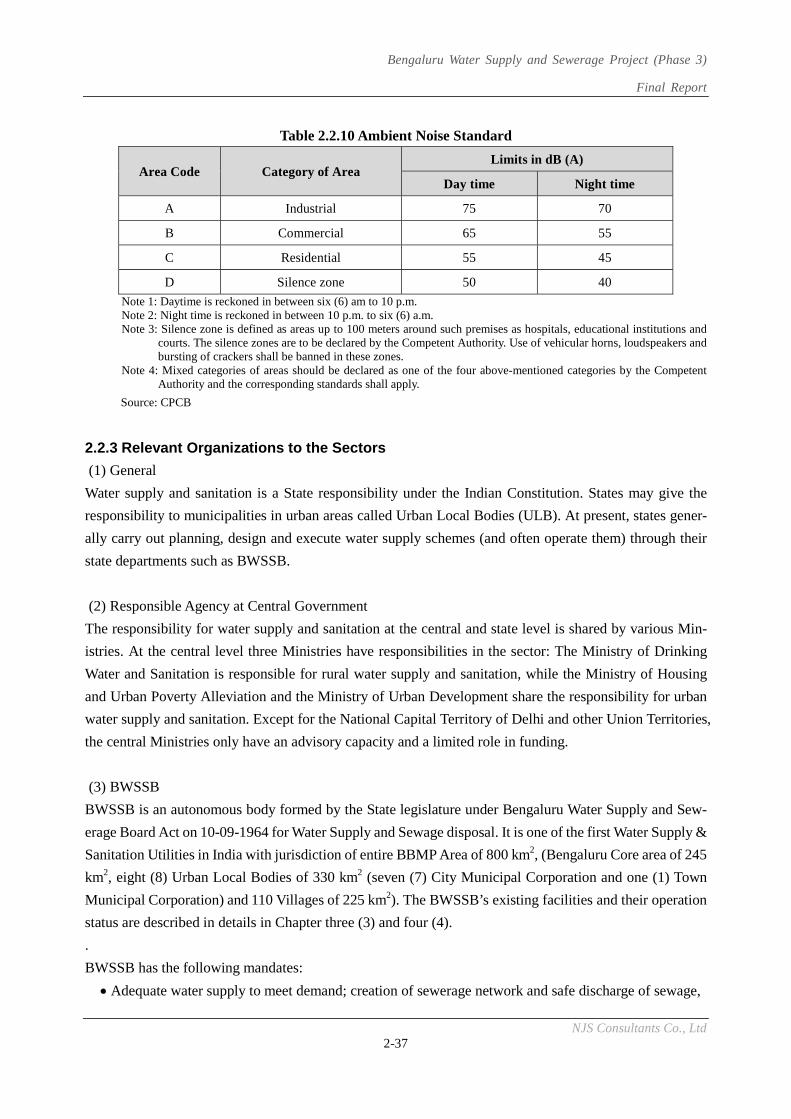
Bengaluru Water Supply and Sewerage Project (Phase 3)
Final Report
NJS Consultants Co., Ltd 2-37
Table 2.2.10 Ambient Noise Standard
Area Code Category of Area Limits in dB (A)
Day time Night time
A Industrial 75 70
B Commercial 65 55
C Residential 55 45
D Silence zone 50 40
Note 1: Daytime is reckoned in between six (6) am to 10 p.m. Note 2: Night time is reckoned in between 10 p.m. to six (6) a.m. Note 3: Silence zone is defined as areas up to 100 meters around such premises as hospitals, educational institutions and
courts. The silence zones are to be declared by the Competent Authority. Use of vehicular horns, loudspeakers and bursting of crackers shall be banned in these zones.
Note 4: Mixed categories of areas should be declared as one of the four above-mentioned categories by the Competent Authority and the corresponding standards shall apply.
Source: CPCB
2.2.3 Relevant Organizations to the Sectors
(1) General
Water supply and sanitation is a State responsibility under the Indian Constitution. States may give the
responsibility to municipalities in urban areas called Urban Local Bodies (ULB). At present, states gener-
ally carry out planning, design and execute water supply schemes (and often operate them) through their
state departments such as BWSSB.
(2) Responsible Agency at Central Government
The responsibility for water supply and sanitation at the central and state level is shared by various Min-
istries. At the central level three Ministries have responsibilities in the sector: The Ministry of Drinking
Water and Sanitation is responsible for rural water supply and sanitation, while the Ministry of Housing
and Urban Poverty Alleviation and the Ministry of Urban Development share the responsibility for urban
water supply and sanitation. Except for the National Capital Territory of Delhi and other Union Territories,
the central Ministries only have an advisory capacity and a limited role in funding.
(3) BWSSB
BWSSB is an autonomous body formed by the State legislature under Bengaluru Water Supply and Sew-
erage Board Act on 10-09-1964 for Water Supply and Sewage disposal. It is one of the first Water Supply &
Sanitation Utilities in India with jurisdiction of entire BBMP Area of 800 km2, (Bengaluru Core area of 245
km2, eight (8) Urban Local Bodies of 330 km2 (seven (7) City Municipal Corporation and one (1) Town
Municipal Corporation) and 110 Villages of 225 km2). The BWSSB’s existing facilities and their operation
status are described in details in Chapter three (3) and four (4).
.
BWSSB has the following mandates:
Adequate water supply to meet demand; creation of sewerage network and safe discharge of sewage,
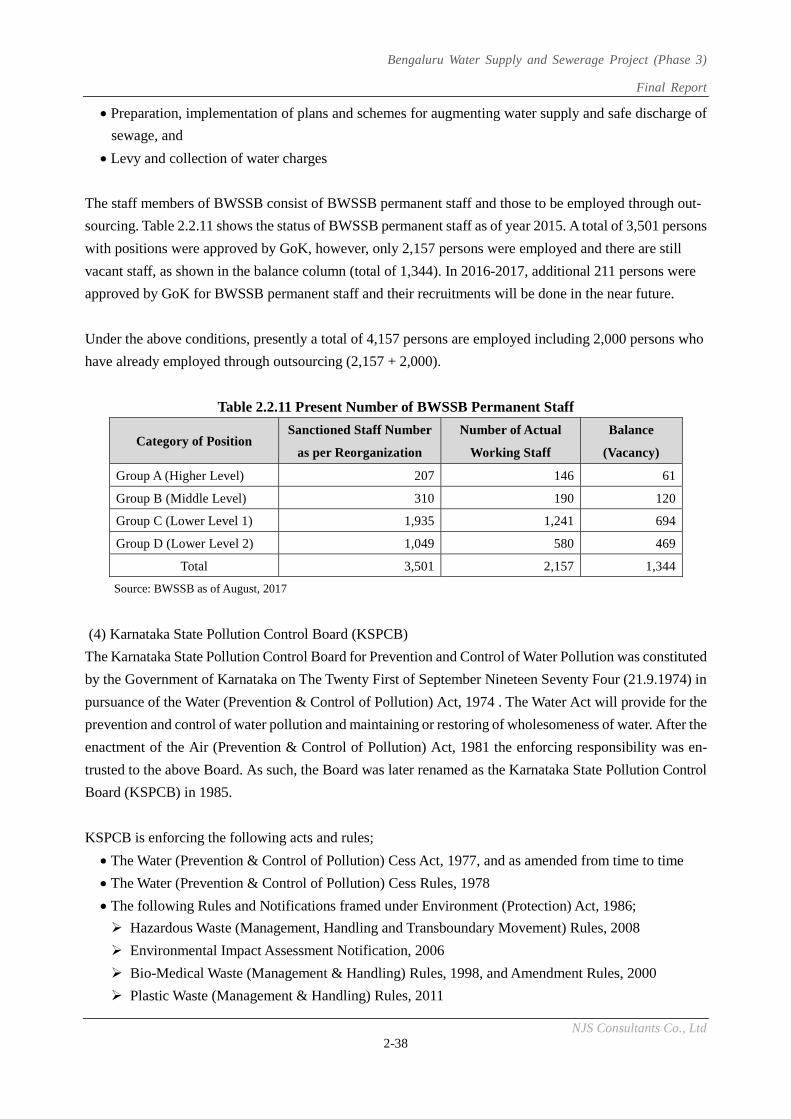
Bengaluru Water Supply and Sewerage Project (Phase 3)
Final Report
NJS Consultants Co., Ltd 2-38
Preparation, implementation of plans and schemes for augmenting water supply and safe discharge of
sewage, and
Levy and collection of water charges
The staff members of BWSSB consist of BWSSB permanent staff and those to be employed through out-
sourcing. Table 2.2.11 shows the status of BWSSB permanent staff as of year 2015. A total of 3,501 persons
with positions were approved by GoK, however, only 2,157 persons were employed and there are still
vacant staff, as shown in the balance column (total of 1,344). In 2016-2017, additional 211 persons were
approved by GoK for BWSSB permanent staff and their recruitments will be done in the near future.
Under the above conditions, presently a total of 4,157 persons are employed including 2,000 persons who
have already employed through outsourcing (2,157 + 2,000).
Table 2.2.11 Present Number of BWSSB Permanent Staff
Category of Position Sanctioned Staff Number
as per Reorganization
Number of Actual
Working Staff
Balance
(Vacancy)
Group A (Higher Level) 207 146 61
Group B (Middle Level) 310 190 120
Group C (Lower Level 1) 1,935 1,241 694
Group D (Lower Level 2) 1,049 580 469
Total 3,501 2,157 1,344
Source: BWSSB as of August, 2017
(4) Karnataka State Pollution Control Board (KSPCB)
The Karnataka State Pollution Control Board for Prevention and Control of Water Pollution was constituted
by the Government of Karnataka on The Twenty First of September Nineteen Seventy Four (21.9.1974) in
pursuance of the Water (Prevention & Control of Pollution) Act, 1974 . The Water Act will provide for the
prevention and control of water pollution and maintaining or restoring of wholesomeness of water. After the
enactment of the Air (Prevention & Control of Pollution) Act, 1981 the enforcing responsibility was en-
trusted to the above Board. As such, the Board was later renamed as the Karnataka State Pollution Control
Board (KSPCB) in 1985.
KSPCB is enforcing the following acts and rules;
The Water (Prevention & Control of Pollution) Cess Act, 1977, and as amended from time to time
The Water (Prevention & Control of Pollution) Cess Rules, 1978
The following Rules and Notifications framed under Environment (Protection) Act, 1986;
Hazardous Waste (Management, Handling and Transboundary Movement) Rules, 2008
Environmental Impact Assessment Notification, 2006
Bio-Medical Waste (Management & Handling) Rules, 1998, and Amendment Rules, 2000
Plastic Waste (Management & Handling) Rules, 2011
Bengaluru Water Supply and Sewerage Project (Phase 3)
Final Report
NJS Consultants Co., Ltd 2-39
The Noise Pollution (Regulation & Control) Rules, 2000
Municipal Solid Wastes (Management & Handling) Rules, 2000
E-waste (Management and Handling) Rules 2011
Batteries (Management and Handling) Rules, 2001
The Public Liability Insurance Act, 1991
(5) BBMP
BBMP is one of Municipal Corporation, it is responsible for infrastructural assets of the Greater Banga-
lore Metropolitan area.
BBMP comprises of Core area with three administrative zones i.e., East, West & Central, and eight (8)
ULBs (Urban Local Bodies) consisted of seven (7) CMC (Bytrayanapura, Yelahanka, K.R. Puram, Ma-
hadevpura, Bommanahalli, R.R. Nagar and Dasarahalli) and one (1) TMC i.e., Kengeri, and 110 Villages.
The total area of BBMP is 800 km2. While, Bengaluru Metropolitan Region under the responsibility of
Bengaluru Metropolitan Region Development Authority (BMRDA) comprises Bengaluru Urban district,
Bengaluru Rural district and Ramanagara District. Since 2007 BMRDA covers an area of 8,005 km2 (refer
to Figure 2.1.2).
(6) Karnataka Lake Conservation and Development Authority (KLCDA)
Karnataka Lake Conservation and Development Authority Act 2014 has been constituted vide Gazette
Notification No. SAMVYASHAE 07 SHASANA 2012, Bengaluru dated March 7th, 2015 for Lake Con-
servation and Development.
The Karnataka Lake Conservation and Development Authority Rules has come into existence on March 5th,
2016.
As per the KLCDA Act 2014, the jurisdiction of authority applies to all the lakes in the Karnataka State
located within the limits of all Municipal Corporations and Bengaluru Development Authority or any other
water bodies or lakes notified by the Government from time to time.
The functions of KLCDA:
To exercise regulatory control over all the lakes within its jurisdictions including prevention and re-
moval of encroachment of lake;
To protect, conserve, reclaim, regenerate and restore lakes to facilitate recharge of depleting ground-
water by promoting integrated approach with the assistance of concerned Government departments,
local and other authorities;
To take up environmental impact assessment studies for any or all lakes;
To take up environmental planning and mapping of lakes and their surrounding areas with the help of
geographical information system and prepare database and atlas of lakes and their catchments;
To prepare a plan for integrated development of lakes;
To improve and also create habitat (wetlands) for aquatic biodiversity, water birds and aquatic plants
for reducing wastewater and non-point sewage impacts;
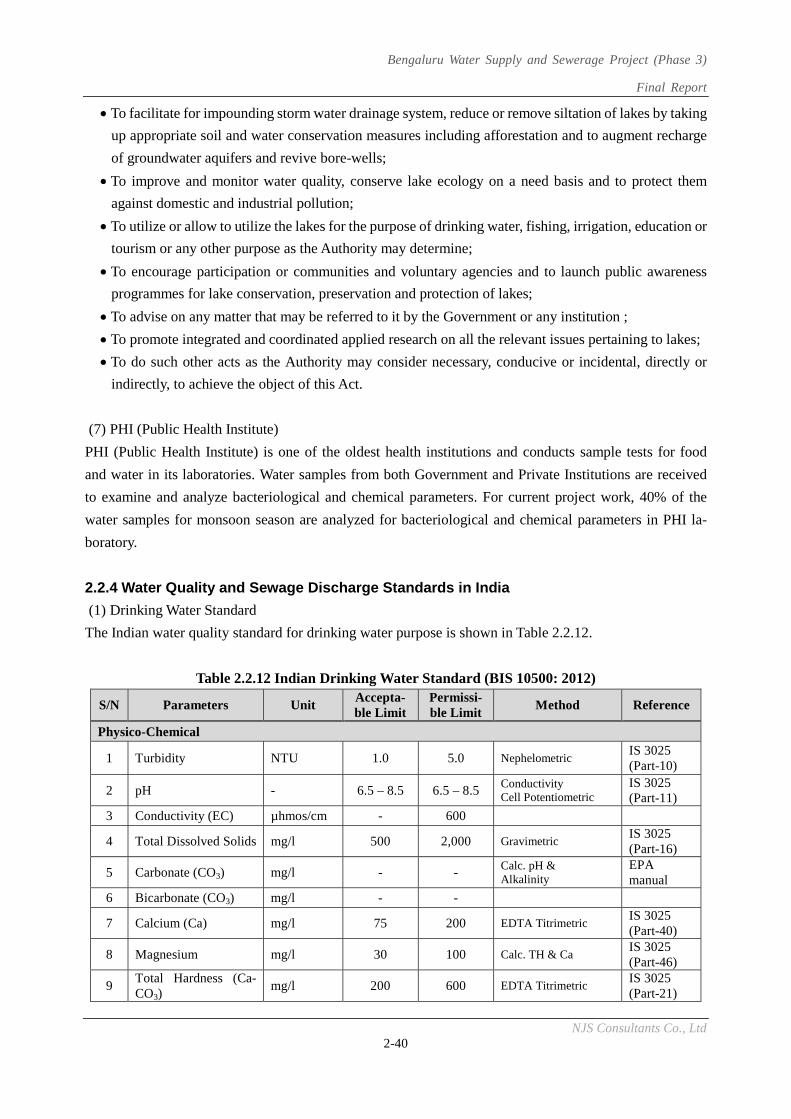
Bengaluru Water Supply and Sewerage Project (Phase 3)
Final Report
NJS Consultants Co., Ltd 2-40
To facilitate for impounding storm water drainage system, reduce or remove siltation of lakes by taking
up appropriate soil and water conservation measures including afforestation and to augment recharge
of groundwater aquifers and revive bore-wells;
To improve and monitor water quality, conserve lake ecology on a need basis and to protect them
against domestic and industrial pollution;
To utilize or allow to utilize the lakes for the purpose of drinking water, fishing, irrigation, education or
tourism or any other purpose as the Authority may determine;
To encourage participation or communities and voluntary agencies and to launch public awareness
programmes for lake conservation, preservation and protection of lakes;
To advise on any matter that may be referred to it by the Government or any institution ;
To promote integrated and coordinated applied research on all the relevant issues pertaining to lakes;
To do such other acts as the Authority may consider necessary, conducive or incidental, directly or
indirectly, to achieve the object of this Act.
(7) PHI (Public Health Institute)
PHI (Public Health Institute) is one of the oldest health institutions and conducts sample tests for food
and water in its laboratories. Water samples from both Government and Private Institutions are received
to examine and analyze bacteriological and chemical parameters. For current project work, 40% of the
water samples for monsoon season are analyzed for bacteriological and chemical parameters in PHI la-
boratory.
2.2.4 Water Quality and Sewage Discharge Standards in India
(1) Drinking Water Standard
The Indian water quality standard for drinking water purpose is shown in Table 2.2.12.
Table 2.2.12 Indian Drinking Water Standard (BIS 10500: 2012)
S/N Parameters Unit Accepta-ble Limit
Permissi-ble Limit
Method Reference
Physico-Chemical
1 Turbidity NTU 1.0 5.0 Nephelometric IS 3025 (Part-10)
2 pH - 6.5 – 8.5 6.5 – 8.5 Conductivity Cell Potentiometric
IS 3025 (Part-11)
3 Conductivity (EC) µhmos/cm - 600
4 Total Dissolved Solids mg/l 500 2,000 Gravimetric IS 3025 (Part-16)
5 Carbonate (CO3) mg/l - - Calc. pH & Alkalinity
EPA manual
6 Bicarbonate (CO3) mg/l - -
7 Calcium (Ca) mg/l 75 200 EDTA Titrimetric IS 3025 (Part-40)
8 Magnesium mg/l 30 100 Calc. TH & Ca IS 3025 (Part-46)
9 Total Hardness (Ca-CO3)
mg/l 200 600 EDTA Titrimetric IS 3025 (Part-21)
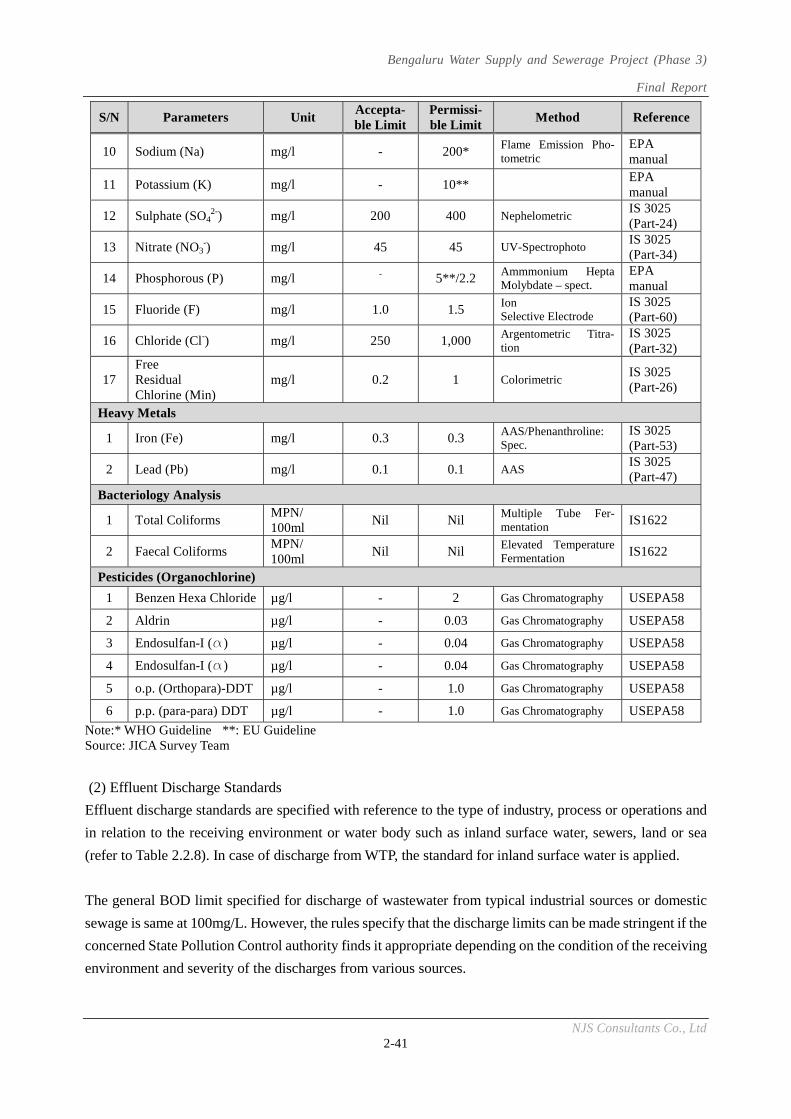
Bengaluru Water Supply and Sewerage Project (Phase 3)
Final Report
NJS Consultants Co., Ltd 2-41
S/N Parameters Unit Accepta-ble Limit
Permissi-ble Limit
Method Reference
10 Sodium (Na) mg/l - 200* Flame Emission Pho-tometric
EPA manual
11 Potassium (K) mg/l - 10** EPA manual
12 Sulphate (SO42-) mg/l 200 400 Nephelometric
IS 3025 (Part-24)
13 Nitrate (NO3-) mg/l 45 45 UV-Spectrophoto
IS 3025 (Part-34)
14 Phosphorous (P) mg/l - 5**/2.2 Ammmonium Hepta Molybdate – spect.
EPA manual
15 Fluoride (F) mg/l 1.0 1.5 Ion Selective Electrode
IS 3025 (Part-60)
16 Chloride (Cl-) mg/l 250 1,000 Argentometric Titra-tion
IS 3025 (Part-32)
17 Free Residual Chlorine (Min)
mg/l 0.2 1 Colorimetric IS 3025 (Part-26)
Heavy Metals
1 Iron (Fe) mg/l 0.3 0.3 AAS/Phenanthroline: Spec.
IS 3025 (Part-53)
2 Lead (Pb) mg/l 0.1 0.1 AAS IS 3025 (Part-47)
Bacteriology Analysis
1 Total Coliforms MPN/ 100ml
Nil Nil Multiple Tube Fer-mentation IS1622
2 Faecal Coliforms MPN/ 100ml
Nil Nil Elevated Temperature Fermentation IS1622
Pesticides (Organochlorine)
1 Benzen Hexa Chloride µg/l - 2 Gas Chromatography USEPA58
2 Aldrin µg/l - 0.03 Gas Chromatography USEPA58
3 Endosulfan-I (α) µg/l - 0.04 Gas Chromatography USEPA58
4 Endosulfan-I (α) µg/l - 0.04 Gas Chromatography USEPA58
5 o.p. (Orthopara)-DDT µg/l - 1.0 Gas Chromatography USEPA58
6 p.p. (para-para) DDT µg/l - 1.0 Gas Chromatography USEPA58
Note:* WHO Guideline **: EU Guideline Source: JICA Survey Team
(2) Effluent Discharge Standards
Effluent discharge standards are specified with reference to the type of industry, process or operations and
in relation to the receiving environment or water body such as inland surface water, sewers, land or sea
(refer to Table 2.2.8). In case of discharge from WTP, the standard for inland surface water is applied.
The general BOD limit specified for discharge of wastewater from typical industrial sources or domestic
sewage is same at 100mg/L. However, the rules specify that the discharge limits can be made stringent if the
concerned State Pollution Control authority finds it appropriate depending on the condition of the receiving
environment and severity of the discharges from various sources.
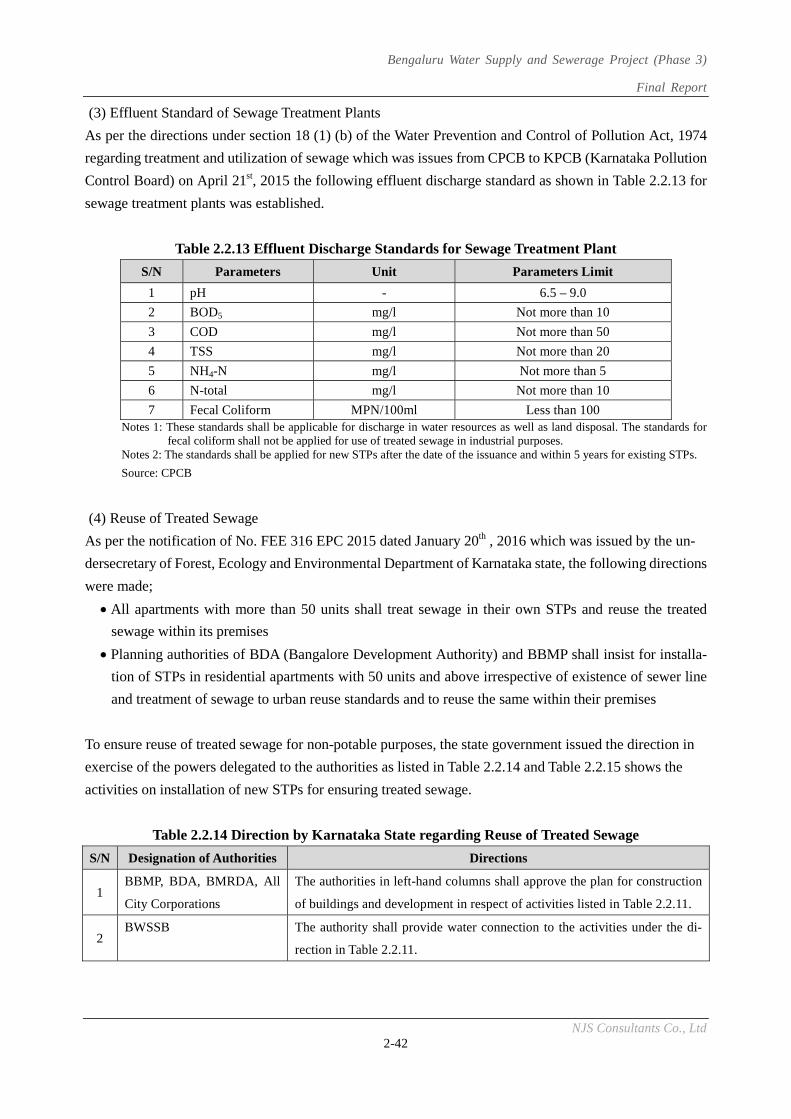
Bengaluru Water Supply and Sewerage Project (Phase 3)
Final Report
NJS Consultants Co., Ltd 2-42
(3) Effluent Standard of Sewage Treatment Plants
As per the directions under section 18 (1) (b) of the Water Prevention and Control of Pollution Act, 1974
regarding treatment and utilization of sewage which was issues from CPCB to KPCB (Karnataka Pollution
Control Board) on April 21st, 2015 the following effluent discharge standard as shown in Table 2.2.13 for
sewage treatment plants was established.
Table 2.2.13 Effluent Discharge Standards for Sewage Treatment Plant
S/N Parameters Unit Parameters Limit
1 pH - 6.5 – 9.0
2 BOD5 mg/l Not more than 10
3 COD mg/l Not more than 50
4 TSS mg/l Not more than 20
5 NH4-N mg/l Not more than 5
6 N-total mg/l Not more than 10
7 Fecal Coliform MPN/100ml Less than 100 Notes 1: These standards shall be applicable for discharge in water resources as well as land disposal. The standards for
fecal coliform shall not be applied for use of treated sewage in industrial purposes. Notes 2: The standards shall be applied for new STPs after the date of the issuance and within 5 years for existing STPs.
Source: CPCB
(4) Reuse of Treated Sewage
As per the notification of No. FEE 316 EPC 2015 dated January 20th , 2016 which was issued by the un-
dersecretary of Forest, Ecology and Environmental Department of Karnataka state, the following directions
were made;
All apartments with more than 50 units shall treat sewage in their own STPs and reuse the treated
sewage within its premises
Planning authorities of BDA (Bangalore Development Authority) and BBMP shall insist for installa-
tion of STPs in residential apartments with 50 units and above irrespective of existence of sewer line
and treatment of sewage to urban reuse standards and to reuse the same within their premises
To ensure reuse of treated sewage for non-potable purposes, the state government issued the direction in
exercise of the powers delegated to the authorities as listed in Table 2.2.14 and Table 2.2.15 shows the
activities on installation of new STPs for ensuring treated sewage.
Table 2.2.14 Direction by Karnataka State regarding Reuse of Treated Sewage
S/N Designation of Authorities Directions
1 BBMP, BDA, BMRDA, All
City Corporations
The authorities in left-hand columns shall approve the plan for construction
of buildings and development in respect of activities listed in Table 2.2.11.
2 BWSSB The authority shall provide water connection to the activities under the di-
rection in Table 2.2.11.
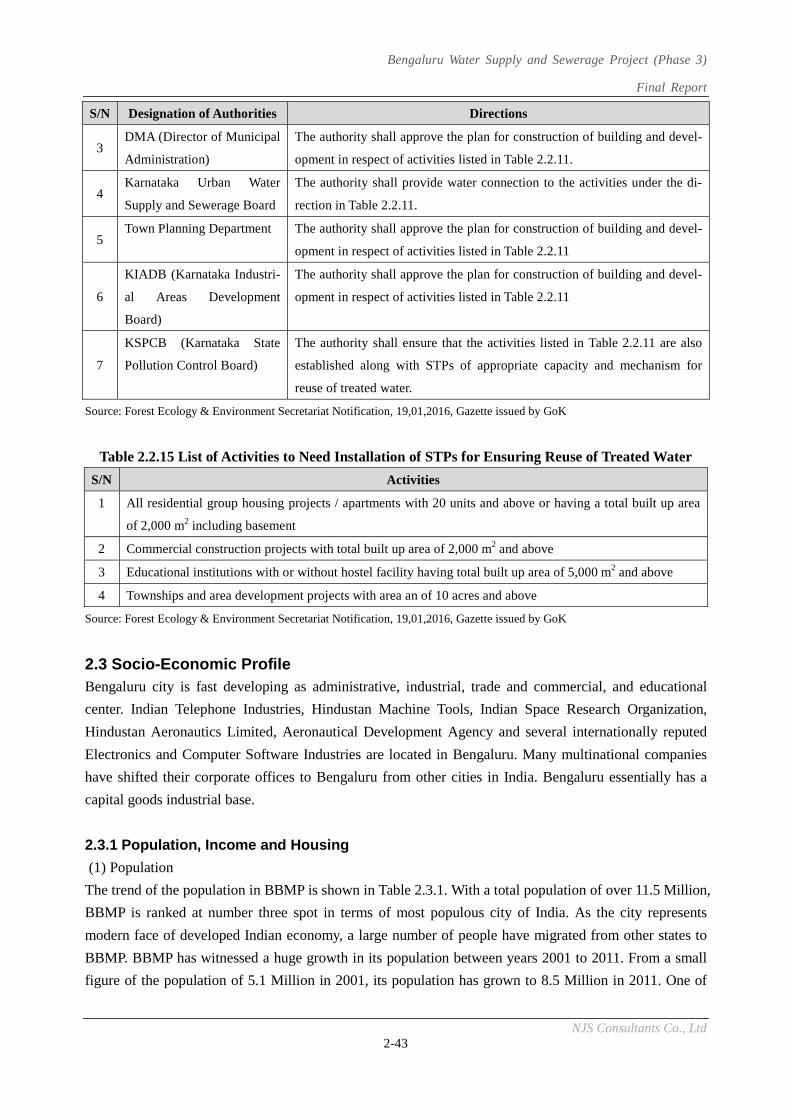
Bengaluru Water Supply and Sewerage Project (Phase 3)
Final Report
NJS Consultants Co., Ltd 2-43
S/N Designation of Authorities Directions
3 DMA (Director of Municipal
Administration)
The authority shall approve the plan for construction of building and devel-
opment in respect of activities listed in Table 2.2.11.
4 Karnataka Urban Water
Supply and Sewerage Board
The authority shall provide water connection to the activities under the di-
rection in Table 2.2.11.
5 Town Planning Department The authority shall approve the plan for construction of building and devel-
opment in respect of activities listed in Table 2.2.11
6
KIADB (Karnataka Industri-
al Areas Development
Board)
The authority shall approve the plan for construction of building and devel-
opment in respect of activities listed in Table 2.2.11
7
KSPCB (Karnataka State
Pollution Control Board)
The authority shall ensure that the activities listed in Table 2.2.11 are also
established along with STPs of appropriate capacity and mechanism for
reuse of treated water.
Source: Forest Ecology & Environment Secretariat Notification, 19,01,2016, Gazette issued by GoK
Table 2.2.15 List of Activities to Need Installation of STPs for Ensuring Reuse of Treated Water
S/N Activities
1 All residential group housing projects / apartments with 20 units and above or having a total built up area
of 2,000 m2 including basement
2 Commercial construction projects with total built up area of 2,000 m2 and above
3 Educational institutions with or without hostel facility having total built up area of 5,000 m2 and above
4 Townships and area development projects with area an of 10 acres and above
Source: Forest Ecology & Environment Secretariat Notification, 19,01,2016, Gazette issued by GoK
2.3 Socio-Economic Profile Bengaluru city is fast developing as administrative, industrial, trade and commercial, and educational
center. Indian Telephone Industries, Hindustan Machine Tools, Indian Space Research Organization,
Hindustan Aeronautics Limited, Aeronautical Development Agency and several internationally reputed
Electronics and Computer Software Industries are located in Bengaluru. Many multinational companies
have shifted their corporate offices to Bengaluru from other cities in India. Bengaluru essentially has a
capital goods industrial base.
2.3.1 Population, Income and Housing
(1) Population
The trend of the population in BBMP is shown in Table 2.3.1. With a total population of over 11.5 Million,
BBMP is ranked at number three spot in terms of most populous city of India. As the city represents
modern face of developed Indian economy, a large number of people have migrated from other states to
BBMP. BBMP has witnessed a huge growth in its population between years 2001 to 2011. From a small
figure of the population of 5.1 Million in 2001, its population has grown to 8.5 Million in 2011. One of
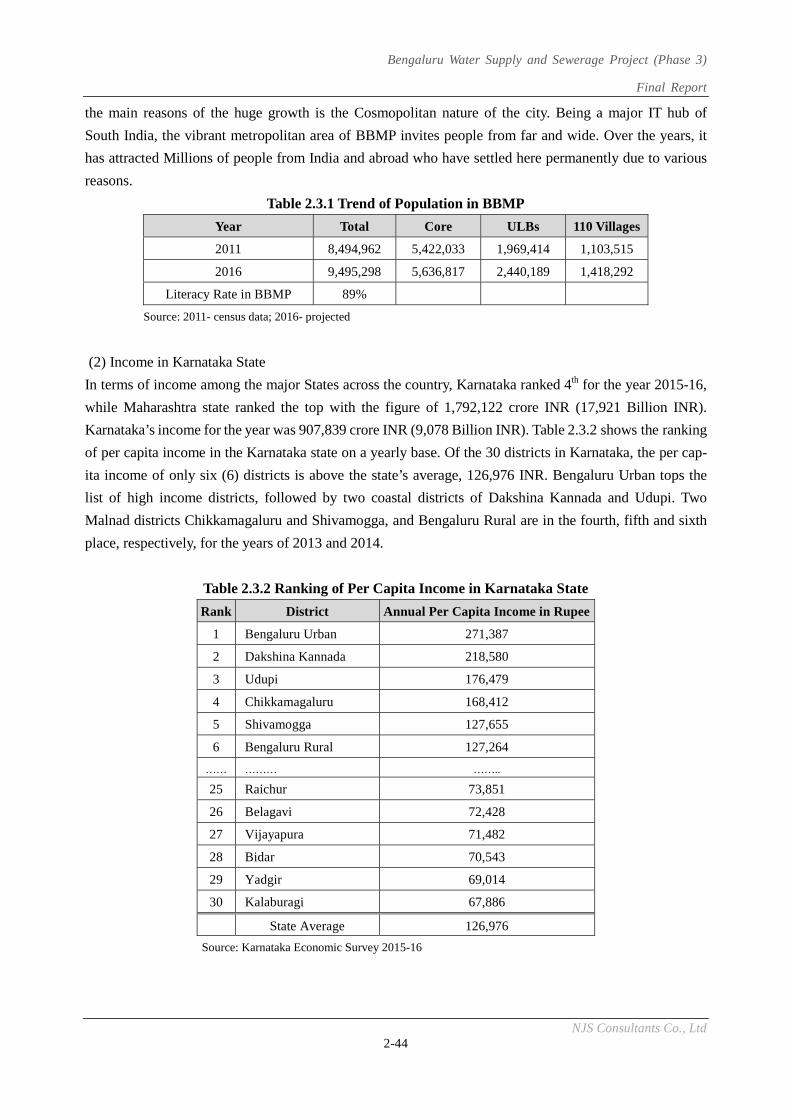
Bengaluru Water Supply and Sewerage Project (Phase 3)
Final Report
NJS Consultants Co., Ltd 2-44
the main reasons of the huge growth is the Cosmopolitan nature of the city. Being a major IT hub of
South India, the vibrant metropolitan area of BBMP invites people from far and wide. Over the years, it
has attracted Millions of people from India and abroad who have settled here permanently due to various
reasons.
Table 2.3.1 Trend of Population in BBMP
Year Total Core ULBs 110 Villages
2011 8,494,962 5,422,033 1,969,414 1,103,515
2016 9,495,298 5,636,817 2,440,189 1,418,292
Literacy Rate in BBMP 89%
Source: 2011- census data; 2016- projected
(2) Income in Karnataka State
In terms of income among the major States across the country, Karnataka ranked 4th for the year 2015-16,
while Maharashtra state ranked the top with the figure of 1,792,122 crore INR (17,921 Billion INR).
Karnataka’s income for the year was 907,839 crore INR (9,078 Billion INR). Table 2.3.2 shows the ranking
of per capita income in the Karnataka state on a yearly base. Of the 30 districts in Karnataka, the per cap-
ita income of only six (6) districts is above the state’s average, 126,976 INR. Bengaluru Urban tops the
list of high income districts, followed by two coastal districts of Dakshina Kannada and Udupi. Two
Malnad districts Chikkamagaluru and Shivamogga, and Bengaluru Rural are in the fourth, fifth and sixth
place, respectively, for the years of 2013 and 2014.
Table 2.3.2 Ranking of Per Capita Income in Karnataka State
Rank District Annual Per Capita Income in Rupee
1 Bengaluru Urban 271,387
2 Dakshina Kannada 218,580
3 Udupi 176,479
4 Chikkamagaluru 168,412
5 Shivamogga 127,655
6 Bengaluru Rural 127,264
…… ……… ……..
25 Raichur 73,851
26 Belagavi 72,428
27 Vijayapura 71,482
28 Bidar 70,543
29 Yadgir 69,014
30 Kalaburagi 67,886
State Average 126,976
Source: Karnataka Economic Survey 2015-16
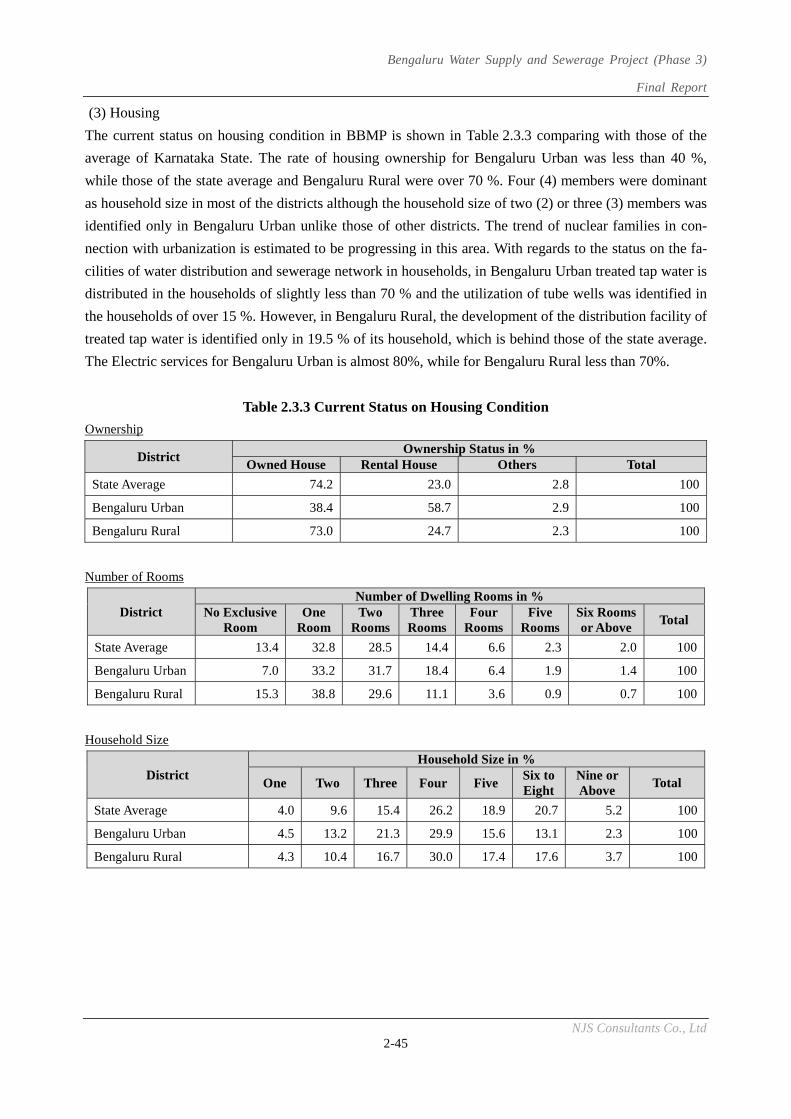
Bengaluru Water Supply and Sewerage Project (Phase 3)
Final Report
NJS Consultants Co., Ltd 2-45
(3) Housing
The current status on housing condition in BBMP is shown in Table 2.3.3 comparing with those of the
average of Karnataka State. The rate of housing ownership for Bengaluru Urban was less than 40 %,
while those of the state average and Bengaluru Rural were over 70 %. Four (4) members were dominant
as household size in most of the districts although the household size of two (2) or three (3) members was
identified only in Bengaluru Urban unlike those of other districts. The trend of nuclear families in con-
nection with urbanization is estimated to be progressing in this area. With regards to the status on the fa-
cilities of water distribution and sewerage network in households, in Bengaluru Urban treated tap water is
distributed in the households of slightly less than 70 % and the utilization of tube wells was identified in
the households of over 15 %. However, in Bengaluru Rural, the development of the distribution facility of
treated tap water is identified only in 19.5 % of its household, which is behind those of the state average.
The Electric services for Bengaluru Urban is almost 80%, while for Bengaluru Rural less than 70%.
Table 2.3.3 Current Status on Housing Condition
Ownership
District Ownership Status in %
Owned House Rental House Others Total
State Average 74.2 23.0 2.8 100
Bengaluru Urban 38.4 58.7 2.9 100
Bengaluru Rural 73.0 24.7 2.3 100
Number of Rooms
District Number of Dwelling Rooms in %
No Exclusive Room
One Room
Two Rooms
Three Rooms
Four Rooms
Five Rooms
Six Rooms or Above
Total
State Average 13.4 32.8 28.5 14.4 6.6 2.3 2.0 100
Bengaluru Urban 7.0 33.2 31.7 18.4 6.4 1.9 1.4 100
Bengaluru Rural 15.3 38.8 29.6 11.1 3.6 0.9 0.7 100
Household Size
District Household Size in %
One Two Three Four Five Six to Eight
Nine or Above
Total
State Average 4.0 9.6 15.4 26.2 18.9 20.7 5.2 100
Bengaluru Urban 4.5 13.2 21.3 29.9 15.6 13.1 2.3 100
Bengaluru Rural 4.3 10.4 16.7 30.0 17.4 17.6 3.7 100
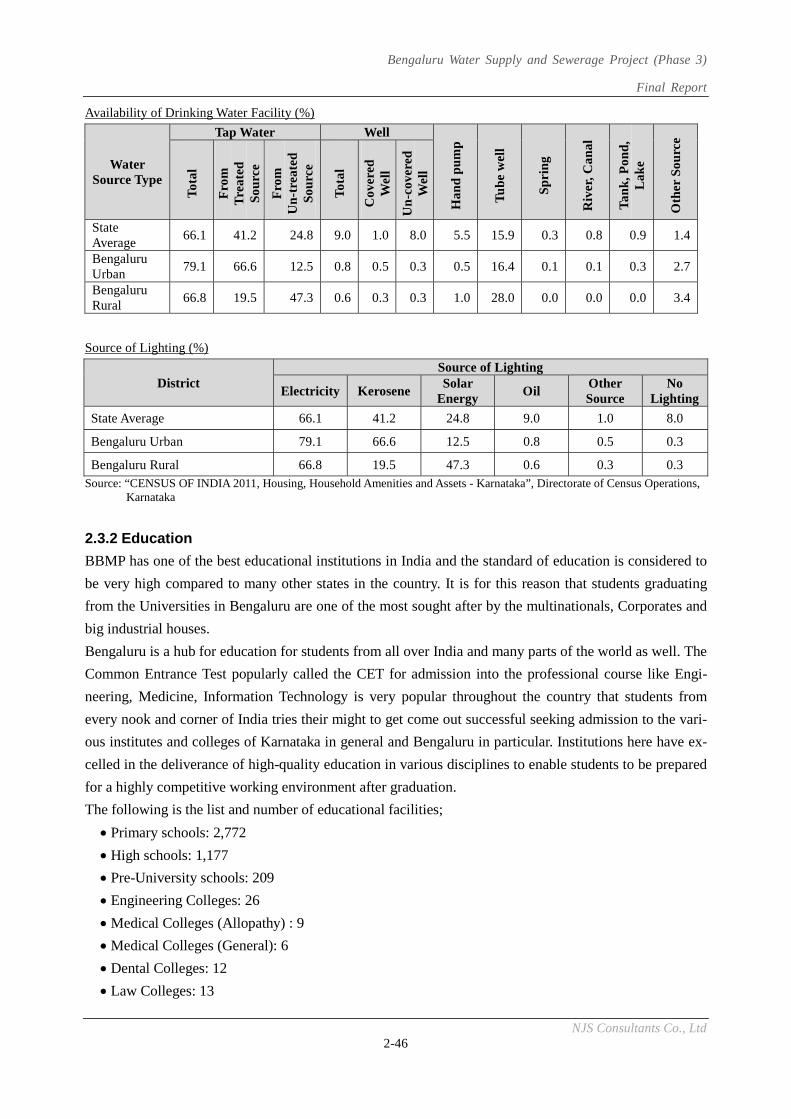
Bengaluru Water Supply and Sewerage Project (Phase 3)
Final Report
NJS Consultants Co., Ltd 2-46
Availability of Drinking Water Facility (%)
Water Source Type
Tap Water Well
Han
d p
um
p
Tu
be
wel
l
Sp
rin
g
Riv
er, C
anal
Tan
k, P
ond
, L
ake
Oth
er S
ourc
e
Tot
al
Fro
m
Tre
ated
S
ourc
e
Fro
m
Un
-tre
ated
S
ourc
e
Tot
al
Cov
ered
W
ell
Un
-cov
ered
W
ell
State Average
66.1 41.2 24.8 9.0 1.0 8.0 5.5 15.9 0.3 0.8 0.9 1.4
Bengaluru Urban
79.1 66.6 12.5 0.8 0.5 0.3 0.5 16.4 0.1 0.1 0.3 2.7
Bengaluru Rural
66.8 19.5 47.3 0.6 0.3 0.3 1.0 28.0 0.0 0.0 0.0 3.4
Source of Lighting (%)
District Source of Lighting
Electricity KeroseneSolar
Energy Oil
Other Source
No Lighting
State Average 66.1 41.2 24.8 9.0 1.0 8.0
Bengaluru Urban 79.1 66.6 12.5 0.8 0.5 0.3
Bengaluru Rural 66.8 19.5 47.3 0.6 0.3 0.3 Source: “CENSUS OF INDIA 2011, Housing, Household Amenities and Assets - Karnataka”, Directorate of Census Operations, Karnataka
2.3.2 Education
BBMP has one of the best educational institutions in India and the standard of education is considered to
be very high compared to many other states in the country. It is for this reason that students graduating
from the Universities in Bengaluru are one of the most sought after by the multinationals, Corporates and
big industrial houses.
Bengaluru is a hub for education for students from all over India and many parts of the world as well. The
Common Entrance Test popularly called the CET for admission into the professional course like Engi-
neering, Medicine, Information Technology is very popular throughout the country that students from
every nook and corner of India tries their might to get come out successful seeking admission to the vari-
ous institutes and colleges of Karnataka in general and Bengaluru in particular. Institutions here have ex-
celled in the deliverance of high-quality education in various disciplines to enable students to be prepared
for a highly competitive working environment after graduation.
The following is the list and number of educational facilities;
Primary schools: 2,772
High schools: 1,177
Pre-University schools: 209
Engineering Colleges: 26
Medical Colleges (Allopathy) : 9
Medical Colleges (General): 6
Dental Colleges: 12
Law Colleges: 13
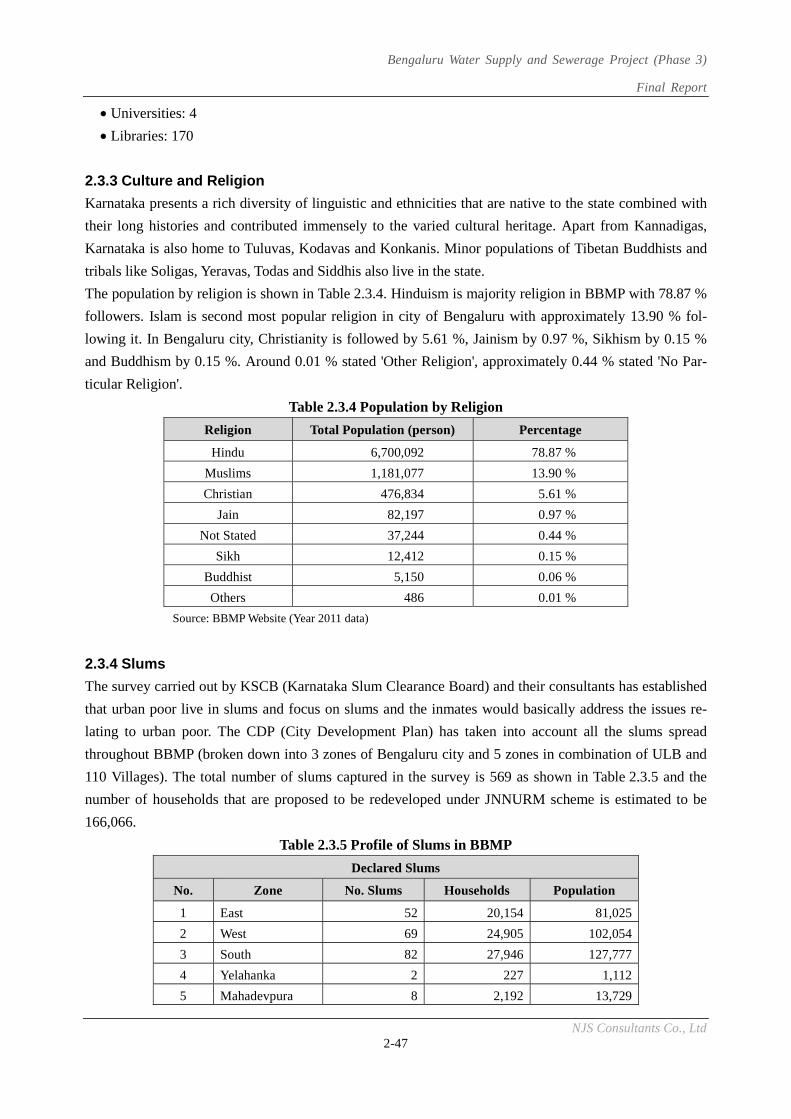
Bengaluru Water Supply and Sewerage Project (Phase 3)
Final Report
NJS Consultants Co., Ltd 2-47
Universities: 4
Libraries: 170
2.3.3 Culture and Religion
Karnataka presents a rich diversity of linguistic and ethnicities that are native to the state combined with
their long histories and contributed immensely to the varied cultural heritage. Apart from Kannadigas,
Karnataka is also home to Tuluvas, Kodavas and Konkanis. Minor populations of Tibetan Buddhists and
tribals like Soligas, Yeravas, Todas and Siddhis also live in the state.
The population by religion is shown in Table 2.3.4. Hinduism is majority religion in BBMP with 78.87 %
followers. Islam is second most popular religion in city of Bengaluru with approximately 13.90 % fol-
lowing it. In Bengaluru city, Christianity is followed by 5.61 %, Jainism by 0.97 %, Sikhism by 0.15 %
and Buddhism by 0.15 %. Around 0.01 % stated 'Other Religion', approximately 0.44 % stated 'No Par-
ticular Religion'.
Table 2.3.4 Population by Religion
Religion Total Population (person) Percentage
Hindu 6,700,092 78.87 %
Muslims 1,181,077 13.90 %
Christian 476,834 5.61 %
Jain 82,197 0.97 %
Not Stated 37,244 0.44 %
Sikh 12,412 0.15 %
Buddhist 5,150 0.06 %
Others 486 0.01 %
Source: BBMP Website (Year 2011 data)
2.3.4 Slums
The survey carried out by KSCB (Karnataka Slum Clearance Board) and their consultants has established
that urban poor live in slums and focus on slums and the inmates would basically address the issues re-
lating to urban poor. The CDP (City Development Plan) has taken into account all the slums spread
throughout BBMP (broken down into 3 zones of Bengaluru city and 5 zones in combination of ULB and
110 Villages). The total number of slums captured in the survey is 569 as shown in Table 2.3.5 and the
number of households that are proposed to be redeveloped under JNNURM scheme is estimated to be
166,066.
Table 2.3.5 Profile of Slums in BBMP
Declared Slums
No. Zone No. Slums Households Population
1 East 52 20,154 81,025
2 West 69 24,905 102,054
3 South 82 27,946 127,777
4 Yelahanka 2 227 1,112
5 Mahadevpura 8 2,192 13,729
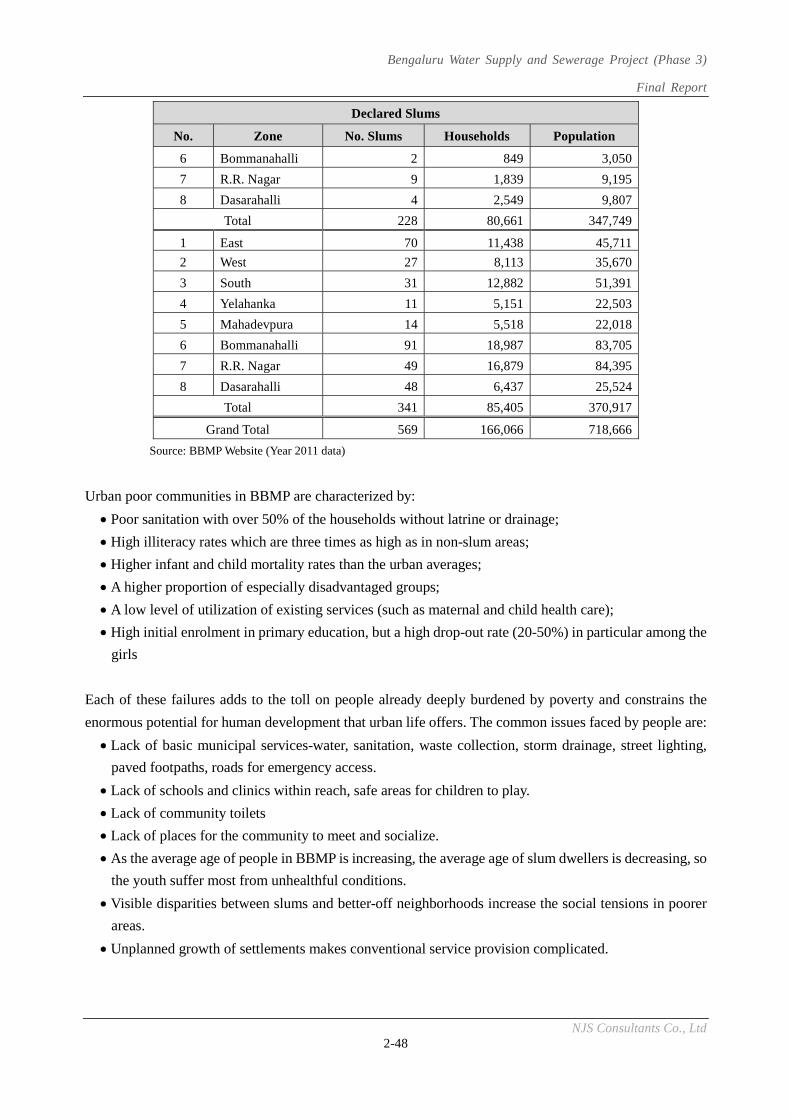
Bengaluru Water Supply and Sewerage Project (Phase 3)
Final Report
NJS Consultants Co., Ltd 2-48
Declared Slums
No. Zone No. Slums Households Population
6 Bommanahalli 2 849 3,050
7 R.R. Nagar 9 1,839 9,195
8 Dasarahalli 4 2,549 9,807
Total 228 80,661 347,749
1 East 70 11,438 45,711
2 West 27 8,113 35,670
3 South 31 12,882 51,391
4 Yelahanka 11 5,151 22,503
5 Mahadevpura 14 5,518 22,018
6 Bommanahalli 91 18,987 83,705
7 R.R. Nagar 49 16,879 84,395
8 Dasarahalli 48 6,437 25,524
Total 341 85,405 370,917
Grand Total 569 166,066 718,666
Source: BBMP Website (Year 2011 data)
Urban poor communities in BBMP are characterized by:
Poor sanitation with over 50% of the households without latrine or drainage;
High illiteracy rates which are three times as high as in non-slum areas;
Higher infant and child mortality rates than the urban averages;
A higher proportion of especially disadvantaged groups;
A low level of utilization of existing services (such as maternal and child health care);
High initial enrolment in primary education, but a high drop-out rate (20-50%) in particular among the
girls
Each of these failures adds to the toll on people already deeply burdened by poverty and constrains the
enormous potential for human development that urban life offers. The common issues faced by people are:
Lack of basic municipal services-water, sanitation, waste collection, storm drainage, street lighting,
paved footpaths, roads for emergency access.
Lack of schools and clinics within reach, safe areas for children to play.
Lack of community toilets
Lack of places for the community to meet and socialize.
As the average age of people in BBMP is increasing, the average age of slum dwellers is decreasing, so
the youth suffer most from unhealthful conditions.
Visible disparities between slums and better-off neighborhoods increase the social tensions in poorer
areas.
Unplanned growth of settlements makes conventional service provision complicated.
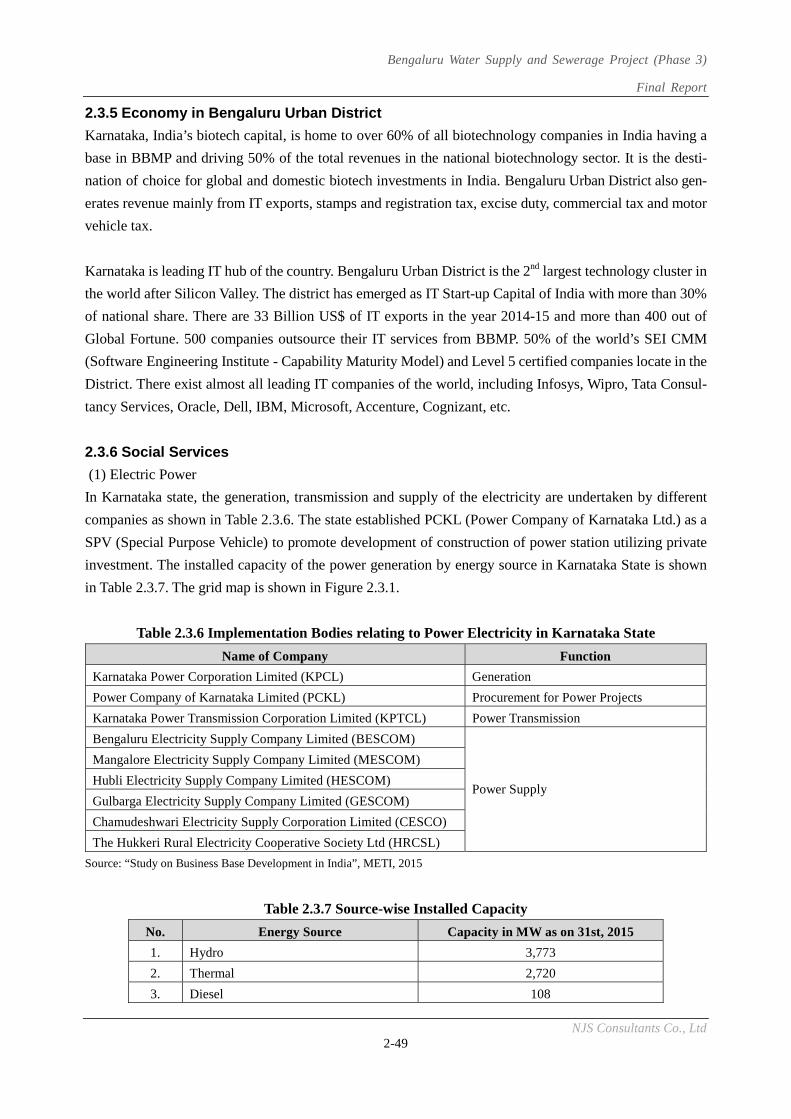
Bengaluru Water Supply and Sewerage Project (Phase 3)
Final Report
NJS Consultants Co., Ltd 2-49
2.3.5 Economy in Bengaluru Urban District
Karnataka, India’s biotech capital, is home to over 60% of all biotechnology companies in India having a
base in BBMP and driving 50% of the total revenues in the national biotechnology sector. It is the desti-
nation of choice for global and domestic biotech investments in India. Bengaluru Urban District also gen-
erates revenue mainly from IT exports, stamps and registration tax, excise duty, commercial tax and motor
vehicle tax.
Karnataka is leading IT hub of the country. Bengaluru Urban District is the 2nd largest technology cluster in
the world after Silicon Valley. The district has emerged as IT Start-up Capital of India with more than 30%
of national share. There are 33 Billion US$ of IT exports in the year 2014-15 and more than 400 out of
Global Fortune. 500 companies outsource their IT services from BBMP. 50% of the world’s SEI CMM
(Software Engineering Institute - Capability Maturity Model) and Level 5 certified companies locate in the
District. There exist almost all leading IT companies of the world, including Infosys, Wipro, Tata Consul-
tancy Services, Oracle, Dell, IBM, Microsoft, Accenture, Cognizant, etc.
2.3.6 Social Services
(1) Electric Power
In Karnataka state, the generation, transmission and supply of the electricity are undertaken by different
companies as shown in Table 2.3.6. The state established PCKL (Power Company of Karnataka Ltd.) as a
SPV (Special Purpose Vehicle) to promote development of construction of power station utilizing private
investment. The installed capacity of the power generation by energy source in Karnataka State is shown
in Table 2.3.7. The grid map is shown in Figure 2.3.1.
Table 2.3.6 Implementation Bodies relating to Power Electricity in Karnataka State
Name of Company Function
Karnataka Power Corporation Limited (KPCL) Generation
Power Company of Karnataka Limited (PCKL) Procurement for Power Projects
Karnataka Power Transmission Corporation Limited (KPTCL) Power Transmission
Bengaluru Electricity Supply Company Limited (BESCOM)
Power Supply
Mangalore Electricity Supply Company Limited (MESCOM)
Hubli Electricity Supply Company Limited (HESCOM)
Gulbarga Electricity Supply Company Limited (GESCOM)
Chamudeshwari Electricity Supply Corporation Limited (CESCO)
The Hukkeri Rural Electricity Cooperative Society Ltd (HRCSL)
Source: “Study on Business Base Development in India”, METI, 2015
Table 2.3.7 Source-wise Installed Capacity
No. Energy Source Capacity in MW as on 31st, 2015
1. Hydro 3,773
2. Thermal 2,720
3. Diesel 108
Bengaluru Water Supply and Sewerage Project (Phase 3)
Final Report
NJS Consultants Co., Ltd 2-50
No. Energy Source Capacity in MW as on 31st, 2015
4. CGS (Cogeneration System) 2,169
5. NCE (Natural Clean Energy) Source 5,082
6. IPP (Independent Power Producer) 1,200
Total 15,052
Source: Energy Department of Karnataka State Website
The following are discussions on the electric supply with reference to existing conditions and re-
quirements for the planned project.
1) There is an existing 220/66 kV KPTCL substation within the BWSSB premises, which is currently
providing power supply to the existing CWSS Stage I, II, III, IV – Phase 2 & 2. Power supply to
proposed Stage V also can be tapped from the existing 220/66 kV substation by adding 1 unit. of
220/66kV, 100 MVA transformer. This substation has provisions for receiving 4 nos. of incoming
220kV lines from Hootagally, Somanahalli, Kollegal-1 & 2 and under this arrangement power supply
reliability is maintained in case of any incoming line failure/shutdown/maintenance.
Power required for CWSS Stage V works at TK Halli is roughly estimated at 16.5MW. Power supply
arrangement with respect to the Stage v works has been described to Executive Engineer, KPTCL
220kV substation, TK Halli under letter no. BWSSB/EE(K-3)/AEE (K-3)-2/AE/577/2015-16 dated
30-09-2015.
2) There is an existing 220/66kV substation within the Harohalli BWSSB remises. Power supply to the
existing Stage I, II, III and IV Phase 1 & Phase 2 have been provided from this substation. 220 kV
supply at this substation has been tapped with Loop-in Loop-out arrangement (LILO) at Harohalli from
the 220 kV between TK Halli and Somanahalli. This substation has provision for receiving 2 nos. of
incoming 220 kV lines from TK Halli and Somanahalli and under this arrangement, power supply re-
liability is maintained in case of any incoming line failure/shutdown/maintenance.
Estimated total power required for Stage V works at Harohalli is 17.2 MW. Power supply to proposed
Stage V also can be tapped from the existing 220/66kV substation by adding 1 unit. of 220/66kV, 50
MVA transformer. This substation is operated and maintained by BWSSB, thus clearance and permis-
sions from KPTCL is not necessary.
3) There is an existing 220/66kV substation within the Tataguni. BWSSB premises and is currently
maintained by BWSSB. Power supply to the existing Stage I, II, III & IV Phase 1 & 2 has been pro-
vided from this substation. This substation has provision for receiving 2 nos. of incoming 220kV lines
from Peenya and Somanahalli and under this arrangement power supply reliability is maintained in
case of any incoming line failure/shutdown/maintenance.
Estimated total power required for CWSS Stage V works at Tataguni is 17.0 MW. Power supply to pro-
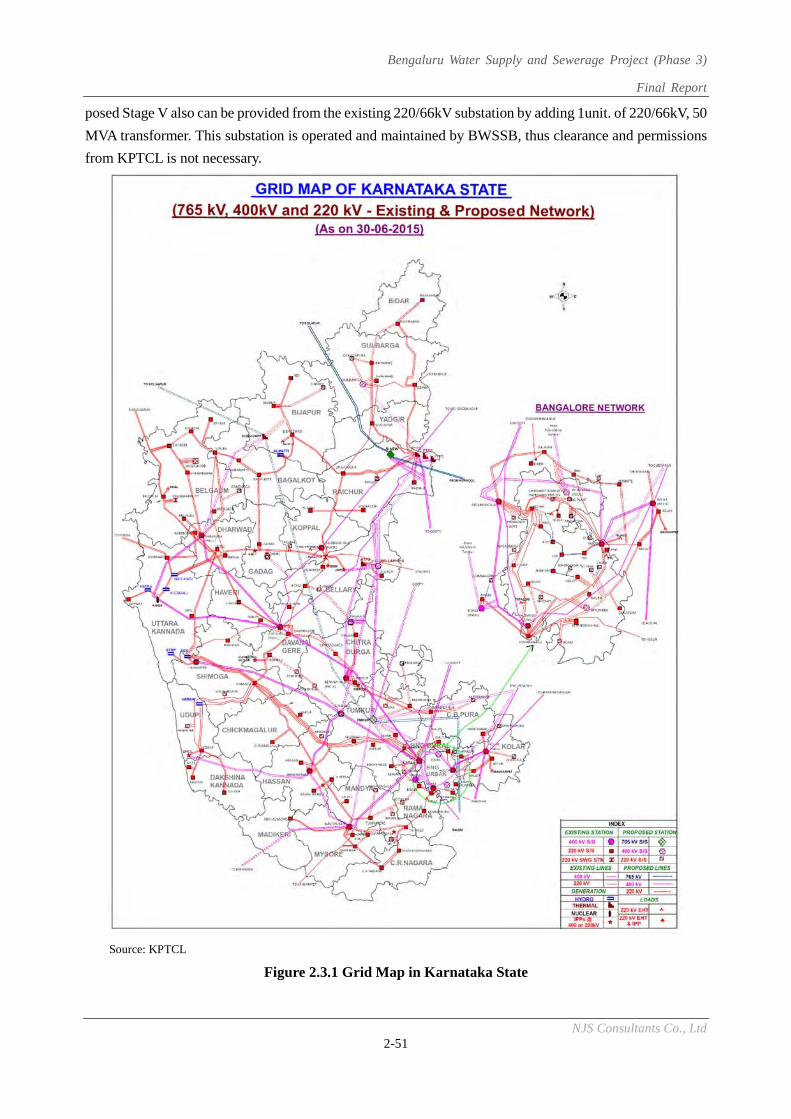
Bengaluru Water Supply and Sewerage Project (Phase 3)
Final Report
NJS Consultants Co., Ltd 2-51
posed Stage V also can be provided from the existing 220/66kV substation by adding 1unit. of 220/66kV, 50
MVA transformer. This substation is operated and maintained by BWSSB, thus clearance and permissions
from KPTCL is not necessary.
Source: KPTCL
Figure 2.3.1 Grid Map in Karnataka State
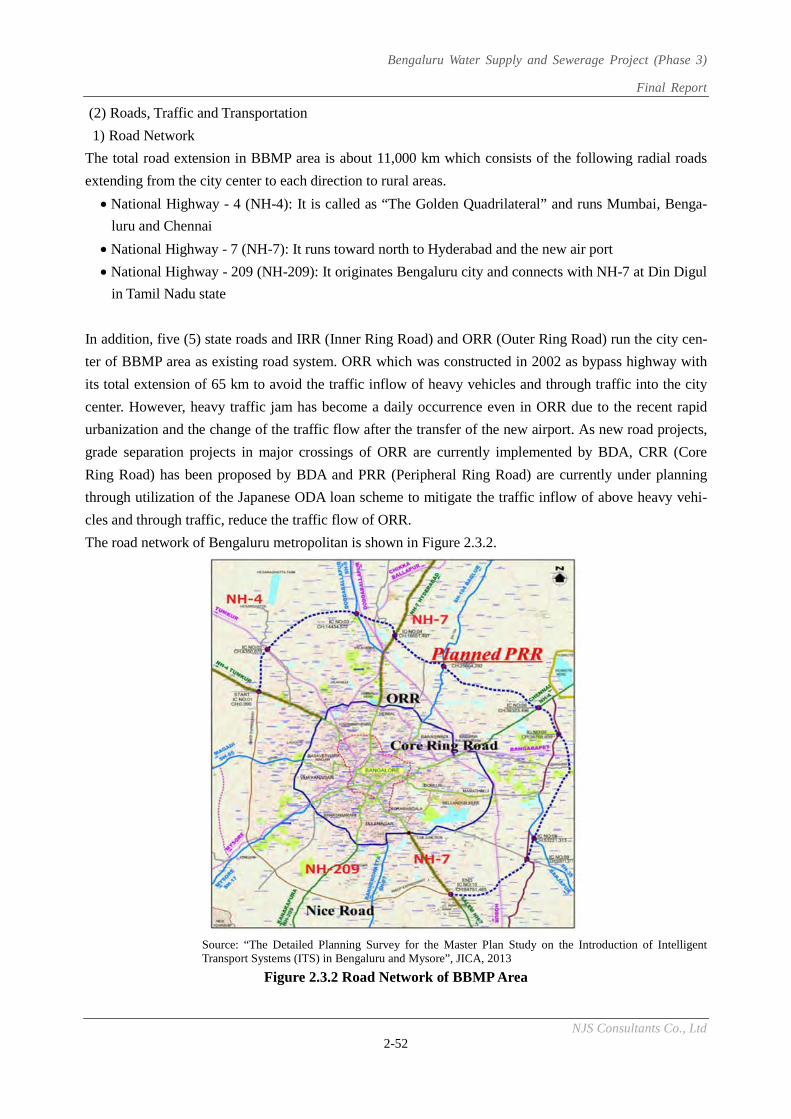
Bengaluru Water Supply and Sewerage Project (Phase 3)
Final Report
NJS Consultants Co., Ltd 2-52
(2) Roads, Traffic and Transportation
1) Road Network
The total road extension in BBMP area is about 11,000 km which consists of the following radial roads
extending from the city center to each direction to rural areas.
National Highway - 4 (NH-4): It is called as “The Golden Quadrilateral” and runs Mumbai, Benga-
luru and Chennai
National Highway - 7 (NH-7): It runs toward north to Hyderabad and the new air port
National Highway - 209 (NH-209): It originates Bengaluru city and connects with NH-7 at Din Digul
in Tamil Nadu state
In addition, five (5) state roads and IRR (Inner Ring Road) and ORR (Outer Ring Road) run the city cen-
ter of BBMP area as existing road system. ORR which was constructed in 2002 as bypass highway with
its total extension of 65 km to avoid the traffic inflow of heavy vehicles and through traffic into the city
center. However, heavy traffic jam has become a daily occurrence even in ORR due to the recent rapid
urbanization and the change of the traffic flow after the transfer of the new airport. As new road projects,
grade separation projects in major crossings of ORR are currently implemented by BDA, CRR (Core
Ring Road) has been proposed by BDA and PRR (Peripheral Ring Road) are currently under planning
through utilization of the Japanese ODA loan scheme to mitigate the traffic inflow of above heavy vehi-
cles and through traffic, reduce the traffic flow of ORR.
The road network of Bengaluru metropolitan is shown in Figure 2.3.2.
Source: “The Detailed Planning Survey for the Master Plan Study on the Introduction of Intelligent Transport Systems (ITS) in Bengaluru and Mysore”, JICA, 2013
Figure 2.3.2 Road Network of BBMP Area
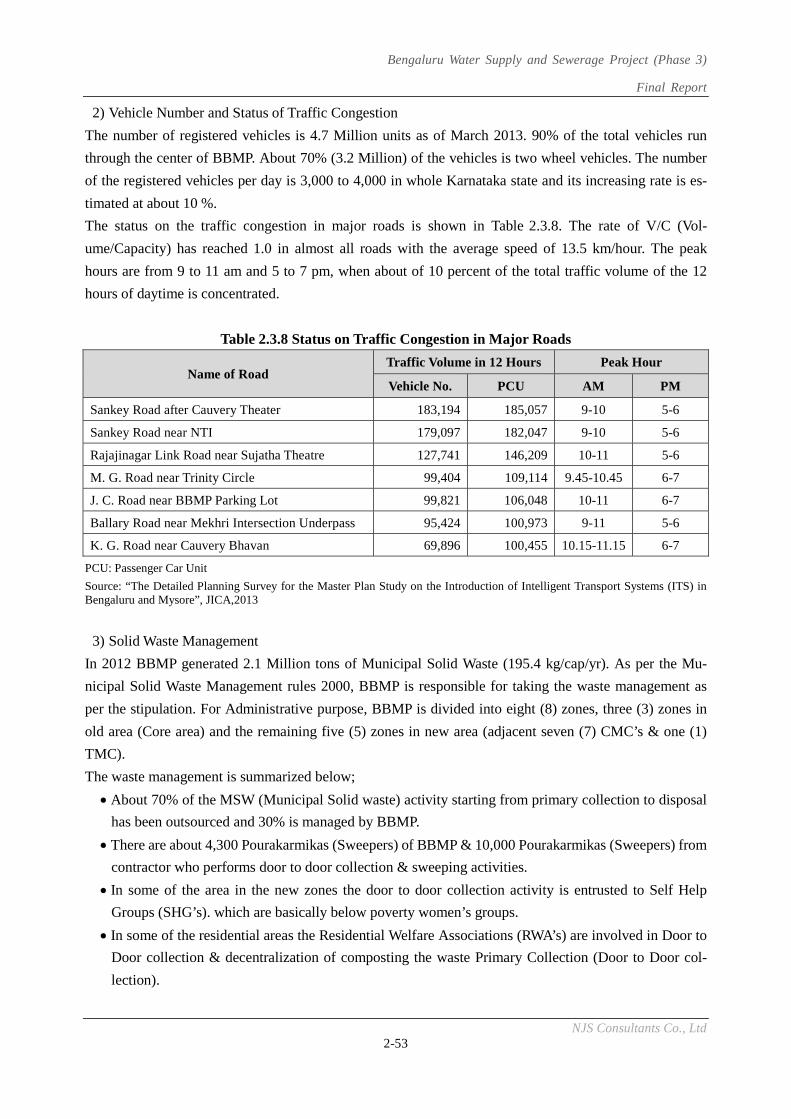
Bengaluru Water Supply and Sewerage Project (Phase 3)
Final Report
NJS Consultants Co., Ltd 2-53
2) Vehicle Number and Status of Traffic Congestion
The number of registered vehicles is 4.7 Million units as of March 2013. 90% of the total vehicles run
through the center of BBMP. About 70% (3.2 Million) of the vehicles is two wheel vehicles. The number
of the registered vehicles per day is 3,000 to 4,000 in whole Karnataka state and its increasing rate is es-
timated at about 10 %.
The status on the traffic congestion in major roads is shown in Table 2.3.8. The rate of V/C (Vol-
ume/Capacity) has reached 1.0 in almost all roads with the average speed of 13.5 km/hour. The peak
hours are from 9 to 11 am and 5 to 7 pm, when about of 10 percent of the total traffic volume of the 12
hours of daytime is concentrated.
Table 2.3.8 Status on Traffic Congestion in Major Roads
Name of Road Traffic Volume in 12 Hours Peak Hour
Vehicle No. PCU AM PM
Sankey Road after Cauvery Theater 183,194 185,057 9-10 5-6
Sankey Road near NTI 179,097 182,047 9-10 5-6
Rajajinagar Link Road near Sujatha Theatre 127,741 146,209 10-11 5-6
M. G. Road near Trinity Circle 99,404 109,114 9.45-10.45 6-7
J. C. Road near BBMP Parking Lot 99,821 106,048 10-11 6-7
Ballary Road near Mekhri Intersection Underpass 95,424 100,973 9-11 5-6
K. G. Road near Cauvery Bhavan 69,896 100,455 10.15-11.15 6-7
PCU: Passenger Car Unit
Source: “The Detailed Planning Survey for the Master Plan Study on the Introduction of Intelligent Transport Systems (ITS) in Bengaluru and Mysore”, JICA,2013
3) Solid Waste Management
In 2012 BBMP generated 2.1 Million tons of Municipal Solid Waste (195.4 kg/cap/yr). As per the Mu-
nicipal Solid Waste Management rules 2000, BBMP is responsible for taking the waste management as
per the stipulation. For Administrative purpose, BBMP is divided into eight (8) zones, three (3) zones in
old area (Core area) and the remaining five (5) zones in new area (adjacent seven (7) CMC’s & one (1)
TMC).
The waste management is summarized below;
About 70% of the MSW (Municipal Solid waste) activity starting from primary collection to disposal
has been outsourced and 30% is managed by BBMP.
There are about 4,300 Pourakarmikas (Sweepers) of BBMP & 10,000 Pourakarmikas (Sweepers) from
contractor who performs door to door collection & sweeping activities.
In some of the area in the new zones the door to door collection activity is entrusted to Self Help
Groups (SHG’s). which are basically below poverty women’s groups.
In some of the residential areas the Residential Welfare Associations (RWA’s) are involved in Door to
Door collection & decentralization of composting the waste Primary Collection (Door to Door col-
lection).
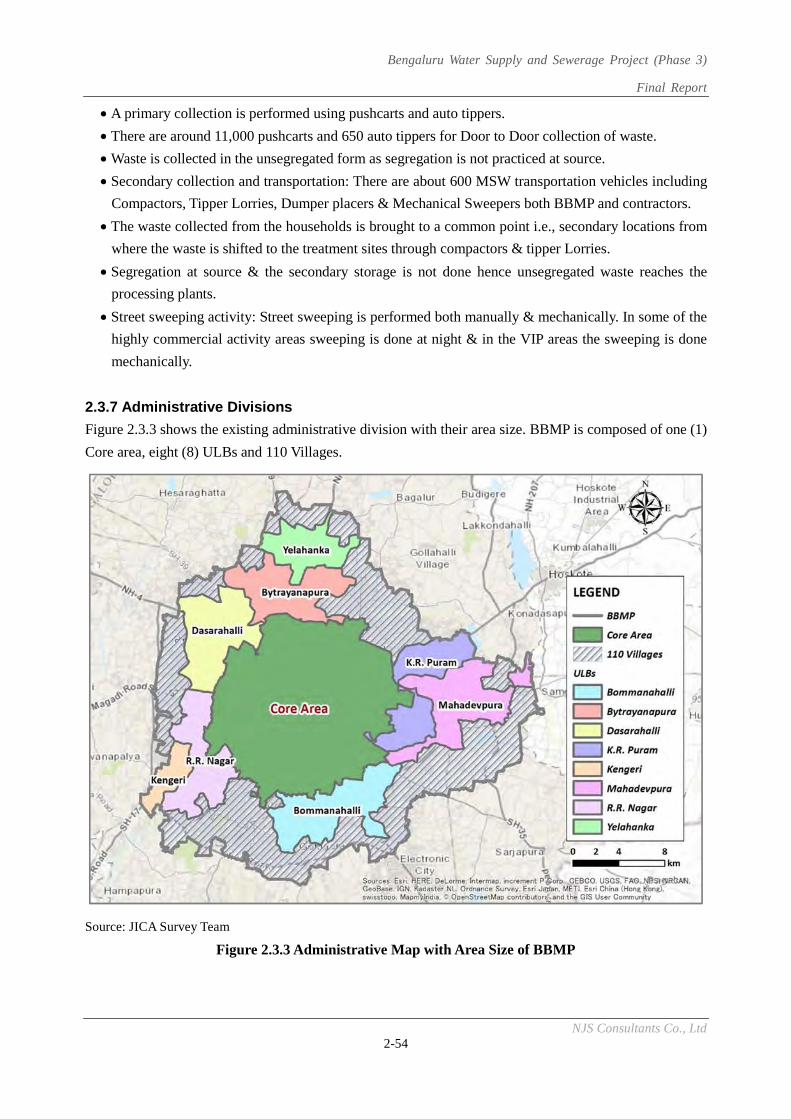
Bengaluru Water Supply and Sewerage Project (Phase 3)
Final Report
NJS Consultants Co., Ltd 2-54
A primary collection is performed using pushcarts and auto tippers.
There are around 11,000 pushcarts and 650 auto tippers for Door to Door collection of waste.
Waste is collected in the unsegregated form as segregation is not practiced at source.
Secondary collection and transportation: There are about 600 MSW transportation vehicles including
Compactors, Tipper Lorries, Dumper placers & Mechanical Sweepers both BBMP and contractors.
The waste collected from the households is brought to a common point i.e., secondary locations from
where the waste is shifted to the treatment sites through compactors & tipper Lorries.
Segregation at source & the secondary storage is not done hence unsegregated waste reaches the
processing plants.
Street sweeping activity: Street sweeping is performed both manually & mechanically. In some of the
highly commercial activity areas sweeping is done at night & in the VIP areas the sweeping is done
mechanically.
2.3.7 Administrative Divisions
Figure 2.3.3 shows the existing administrative division with their area size. BBMP is composed of one (1)
Core area, eight (8) ULBs and 110 Villages.
Source: JICA Survey Team
Figure 2.3.3 Administrative Map with Area Size of BBMP
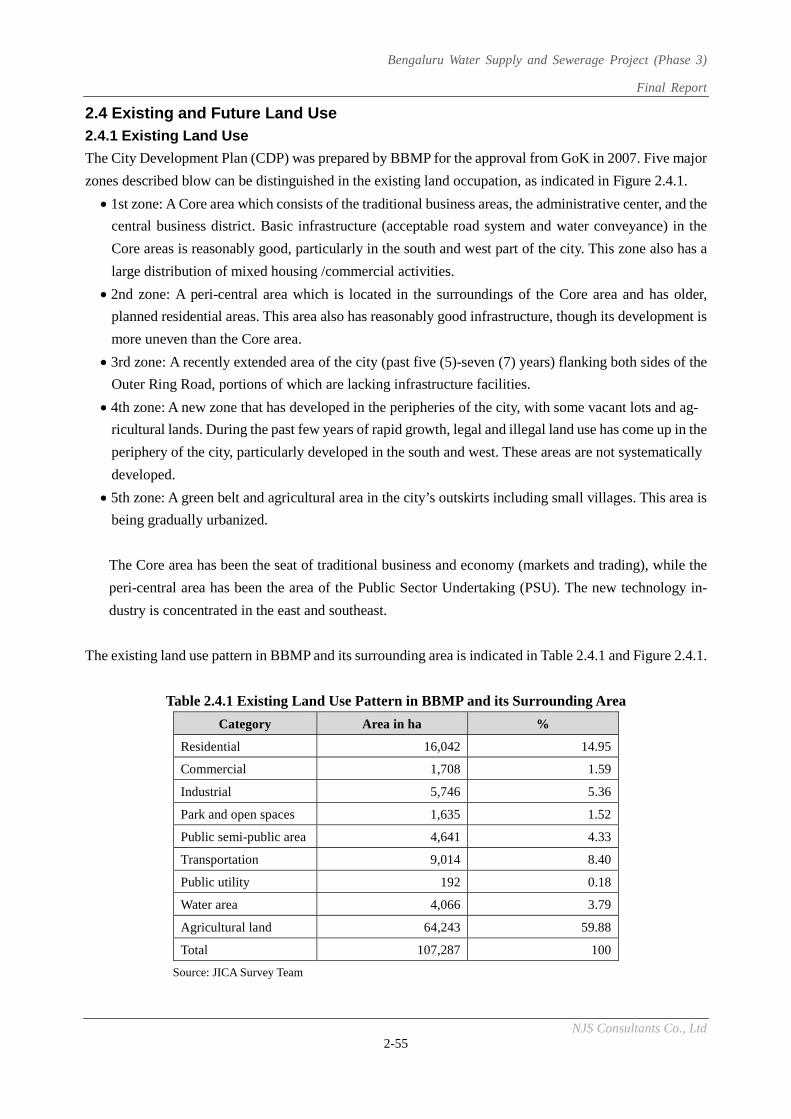
Bengaluru Water Supply and Sewerage Project (Phase 3)
Final Report
NJS Consultants Co., Ltd 2-55
2.4 Existing and Future Land Use 2.4.1 Existing Land Use
The City Development Plan (CDP) was prepared by BBMP for the approval from GoK in 2007. Five major
zones described blow can be distinguished in the existing land occupation, as indicated in Figure 2.4.1.
1st zone: A Core area which consists of the traditional business areas, the administrative center, and the
central business district. Basic infrastructure (acceptable road system and water conveyance) in the
Core areas is reasonably good, particularly in the south and west part of the city. This zone also has a
large distribution of mixed housing /commercial activities.
2nd zone: A peri-central area which is located in the surroundings of the Core area and has older,
planned residential areas. This area also has reasonably good infrastructure, though its development is
more uneven than the Core area.
3rd zone: A recently extended area of the city (past five (5)-seven (7) years) flanking both sides of the
Outer Ring Road, portions of which are lacking infrastructure facilities.
4th zone: A new zone that has developed in the peripheries of the city, with some vacant lots and ag-
ricultural lands. During the past few years of rapid growth, legal and illegal land use has come up in the
periphery of the city, particularly developed in the south and west. These areas are not systematically
developed.
5th zone: A green belt and agricultural area in the city’s outskirts including small villages. This area is
being gradually urbanized.
The Core area has been the seat of traditional business and economy (markets and trading), while the
peri-central area has been the area of the Public Sector Undertaking (PSU). The new technology in-
dustry is concentrated in the east and southeast.
The existing land use pattern in BBMP and its surrounding area is indicated in Table 2.4.1 and Figure 2.4.1.
Table 2.4.1 Existing Land Use Pattern in BBMP and its Surrounding Area
Category Area in ha %
Residential 16,042 14.95
Commercial 1,708 1.59
Industrial 5,746 5.36
Park and open spaces 1,635 1.52
Public semi-public area 4,641 4.33
Transportation 9,014 8.40
Public utility 192 0.18
Water area 4,066 3.79
Agricultural land 64,243 59.88
Total 107,287 100
Source: JICA Survey Team
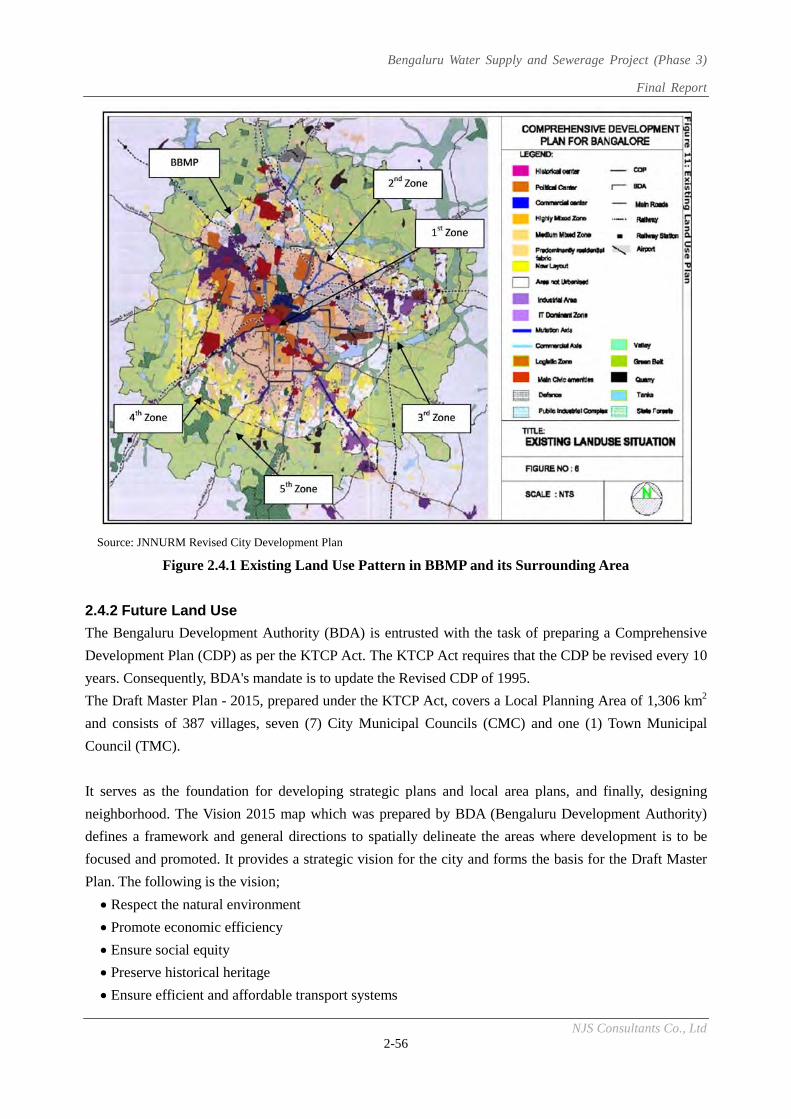
Bengaluru Water Supply and Sewerage Project (Phase 3)
Final Report
NJS Consultants Co., Ltd 2-56
Source: JNNURM Revised City Development Plan
Figure 2.4.1 Existing Land Use Pattern in BBMP and its Surrounding Area
2.4.2 Future Land Use
The Bengaluru Development Authority (BDA) is entrusted with the task of preparing a Comprehensive
Development Plan (CDP) as per the KTCP Act. The KTCP Act requires that the CDP be revised every 10
years. Consequently, BDA's mandate is to update the Revised CDP of 1995.
The Draft Master Plan - 2015, prepared under the KTCP Act, covers a Local Planning Area of 1,306 km2
and consists of 387 villages, seven (7) City Municipal Councils (CMC) and one (1) Town Municipal
Council (TMC).
It serves as the foundation for developing strategic plans and local area plans, and finally, designing
neighborhood. The Vision 2015 map which was prepared by BDA (Bengaluru Development Authority)
defines a framework and general directions to spatially delineate the areas where development is to be
focused and promoted. It provides a strategic vision for the city and forms the basis for the Draft Master
Plan. The following is the vision;
Respect the natural environment
Promote economic efficiency
Ensure social equity
Preserve historical heritage
Ensure efficient and affordable transport systems
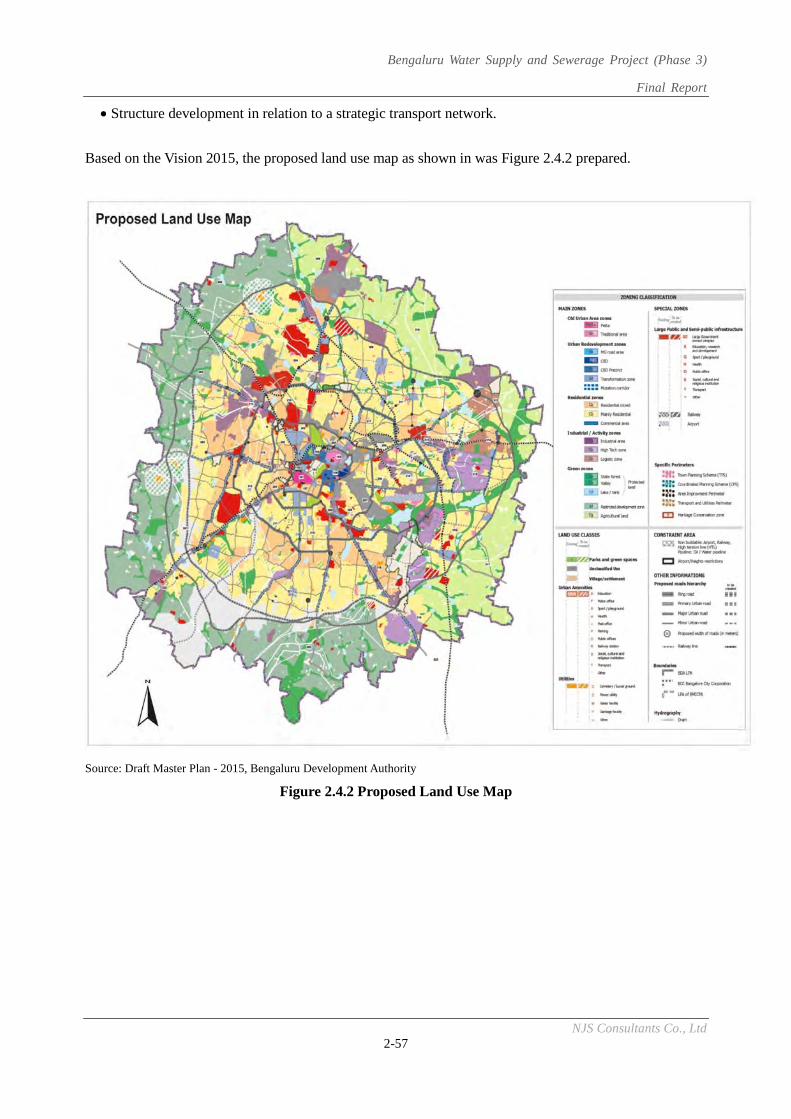
Bengaluru Water Supply and Sewerage Project (Phase 3)
Final Report
NJS Consultants Co., Ltd 2-57
Structure development in relation to a strategic transport network.
Based on the Vision 2015, the proposed land use map as shown in was Figure 2.4.2 prepared.
Source: Draft Master Plan - 2015, Bengaluru Development Authority
Figure 2.4.2 Proposed Land Use Map
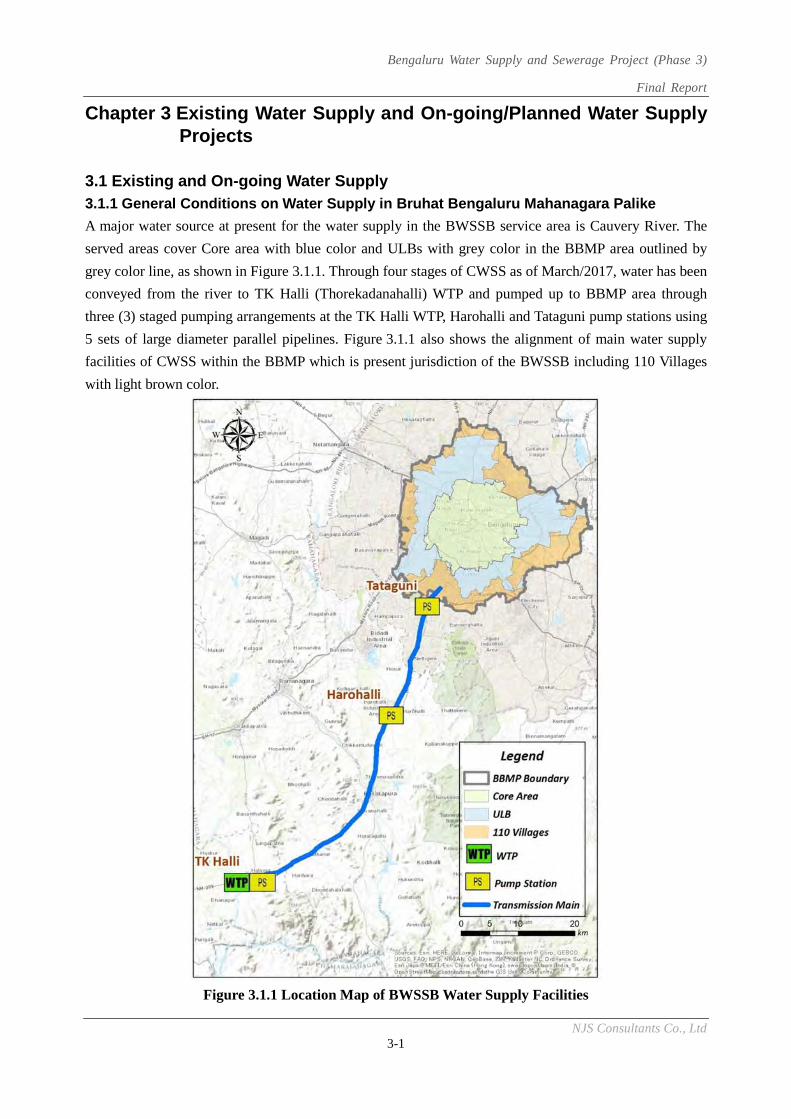
Bengaluru Water Supply and Sewerage Project (Phase 3)
Final Report
NJS Consultants Co., Ltd 3-1
Chapter 3 Existing Water Supply and On-going/Planned Water Supply Projects
3.1 Existing and On-going Water Supply 3.1.1 General Conditions on Water Supply in Bruhat Bengaluru Mahanagara Palike
A major water source at present for the water supply in the BWSSB service area is Cauvery River. The
served areas cover Core area with blue color and ULBs with grey color in the BBMP area outlined by
grey color line, as shown in Figure 3.1.1. Through four stages of CWSS as of March/2017, water has been
conveyed from the river to TK Halli (Thorekadanahalli) WTP and pumped up to BBMP area through
three (3) staged pumping arrangements at the TK Halli WTP, Harohalli and Tataguni pump stations using
5 sets of large diameter parallel pipelines. Figure 3.1.1 also shows the alignment of main water supply
facilities of CWSS within the BBMP which is present jurisdiction of the BWSSB including 110 Villages
with light brown color.
Figure 3.1.1 Location Map of BWSSB Water Supply Facilities
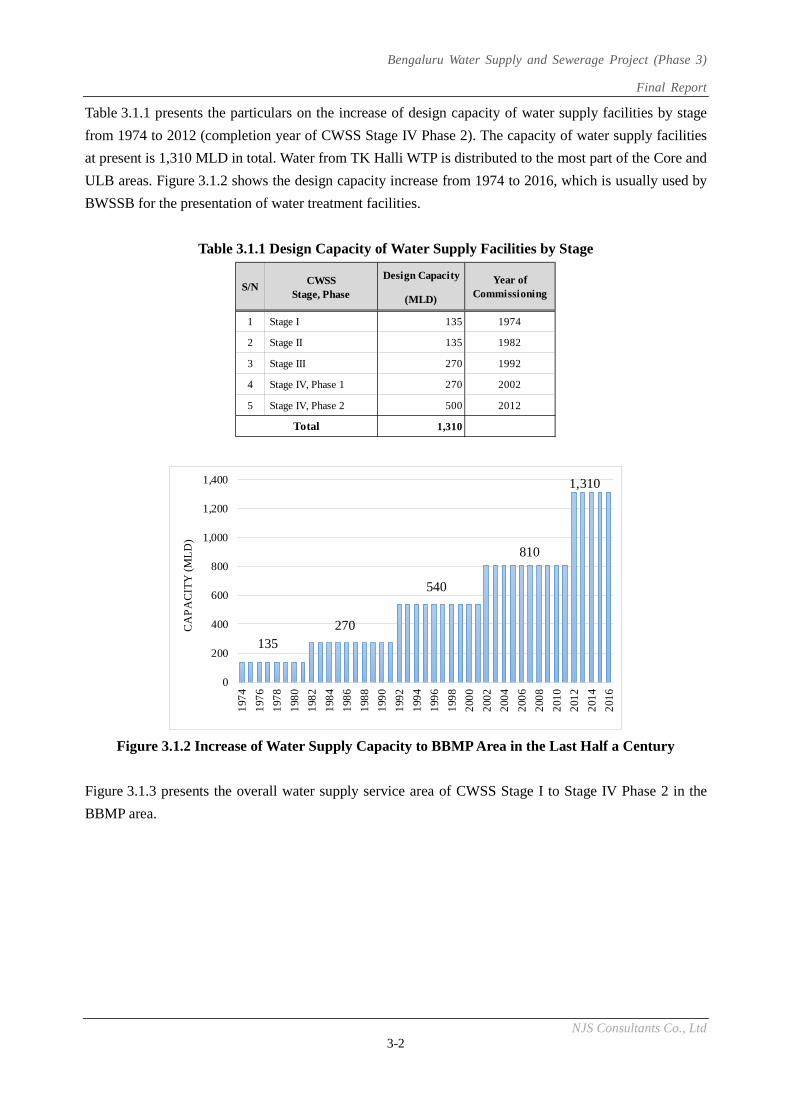
Bengaluru Water Supply and Sewerage Project (Phase 3)
Final Report
NJS Consultants Co., Ltd 3-2
Table 3.1.1 presents the particulars on the increase of design capacity of water supply facilities by stage
from 1974 to 2012 (completion year of CWSS Stage IV Phase 2). The capacity of water supply facilities
at present is 1,310 MLD in total. Water from TK Halli WTP is distributed to the most part of the Core and
ULB areas. Figure 3.1.2 shows the design capacity increase from 1974 to 2016, which is usually used by
BWSSB for the presentation of water treatment facilities.
Table 3.1.1 Design Capacity of Water Supply Facilities by Stage
Figure 3.1.2 Increase of Water Supply Capacity to BBMP Area in the Last Half a Century
Figure 3.1.3 presents the overall water supply service area of CWSS Stage I to Stage IV Phase 2 in the
BBMP area.
CWSS Design Capacity
Stage, Phase (MLD)
1 Stage I 135 1974
2 Stage II 135 1982
3 Stage III 270 1992
4 Stage IV, Phase 1 270 2002
5 Stage IV, Phase 2 500 2012
1,310 Total
S/NYear of
Commissioning
0
200
400
600
800
1,000
1,200
1,400
1974
1976
1978
1980
1982
1984
1986
1988
1990
1992
1994
1996
1998
2000
2002
2004
2006
2008
2010
2012
2014
2016
CA
PA
CIT
Y (M
LD
)
270
540
135
810
1,310
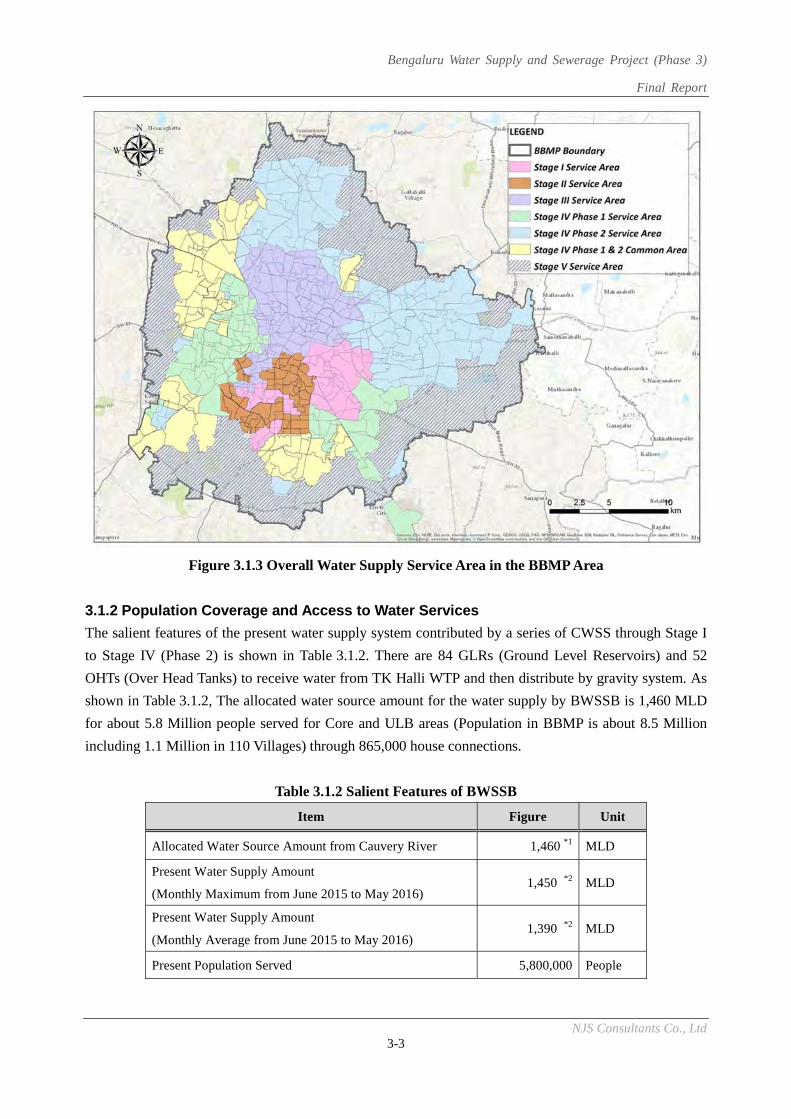
Bengaluru Water Supply and Sewerage Project (Phase 3)
Final Report
NJS Consultants Co., Ltd 3-3
Figure 3.1.3 Overall Water Supply Service Area in the BBMP Area
3.1.2 Population Coverage and Access to Water Services
The salient features of the present water supply system contributed by a series of CWSS through Stage I
to Stage IV (Phase 2) is shown in Table 3.1.2. There are 84 GLRs (Ground Level Reservoirs) and 52
OHTs (Over Head Tanks) to receive water from TK Halli WTP and then distribute by gravity system. As
shown in Table 3.1.2, The allocated water source amount for the water supply by BWSSB is 1,460 MLD
for about 5.8 Million people served for Core and ULB areas (Population in BBMP is about 8.5 Million
including 1.1 Million in 110 Villages) through 865,000 house connections.
Table 3.1.2 Salient Features of BWSSB
Item Figure Unit
Allocated Water Source Amount from Cauvery River 1,460 *1 MLD
Present Water Supply Amount
(Monthly Maximum from June 2015 to May 2016) 1,450 *2 MLD
Present Water Supply Amount
(Monthly Average from June 2015 to May 2016) 1,390 *2 MLD
Present Population Served 5,800,000 People
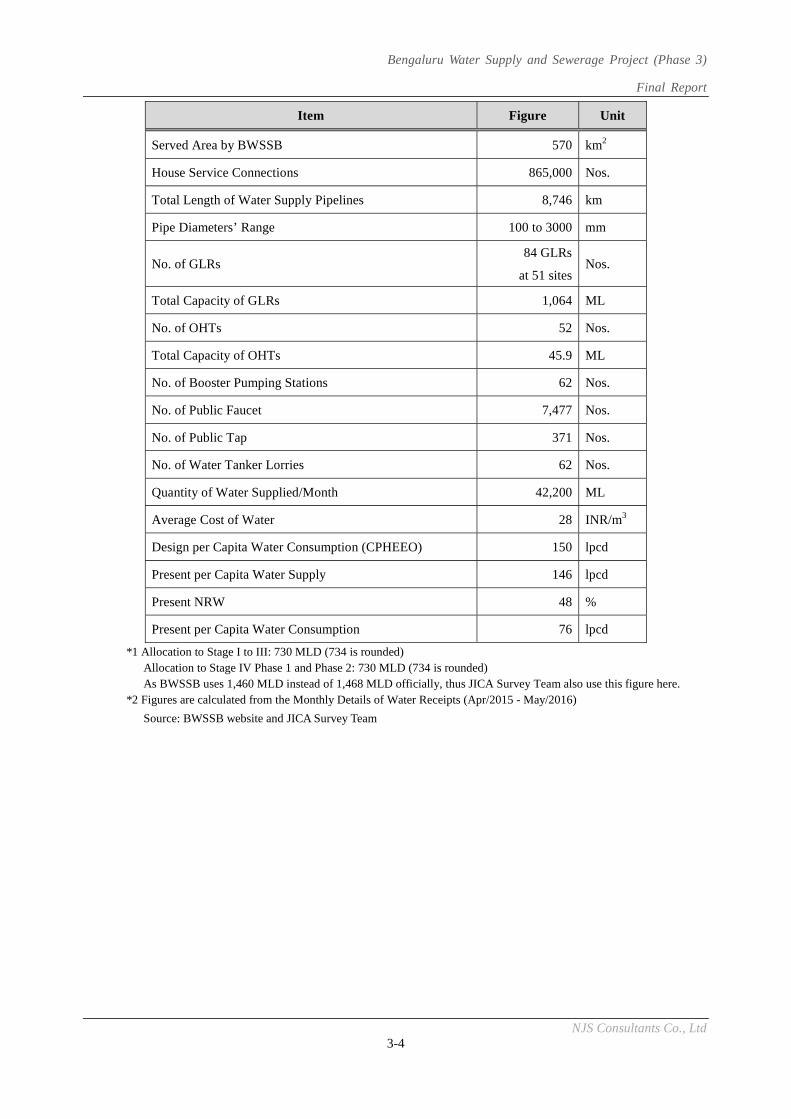
Bengaluru Water Supply and Sewerage Project (Phase 3)
Final Report
NJS Consultants Co., Ltd 3-4
Item Figure Unit
Served Area by BWSSB 570 km2
House Service Connections 865,000 Nos.
Total Length of Water Supply Pipelines 8,746 km
Pipe Diameters’ Range 100 to 3000 mm
No. of GLRs 84 GLRs
at 51 sites Nos.
Total Capacity of GLRs 1,064 ML
No. of OHTs 52 Nos.
Total Capacity of OHTs 45.9 ML
No. of Booster Pumping Stations 62 Nos.
No. of Public Faucet 7,477 Nos.
No. of Public Tap 371 Nos.
No. of Water Tanker Lorries 62 Nos.
Quantity of Water Supplied/Month 42,200 ML
Average Cost of Water 28 INR/m3
Design per Capita Water Consumption (CPHEEO) 150 lpcd
Present per Capita Water Supply 146 lpcd
Present NRW 48 %
Present per Capita Water Consumption 76 lpcd
*1 Allocation to Stage I to III: 730 MLD (734 is rounded) Allocation to Stage IV Phase 1 and Phase 2: 730 MLD (734 is rounded) As BWSSB uses 1,460 MLD instead of 1,468 MLD officially, thus JICA Survey Team also use this figure here. *2 Figures are calculated from the Monthly Details of Water Receipts (Apr/2015 - May/2016)
Source: BWSSB website and JICA Survey Team
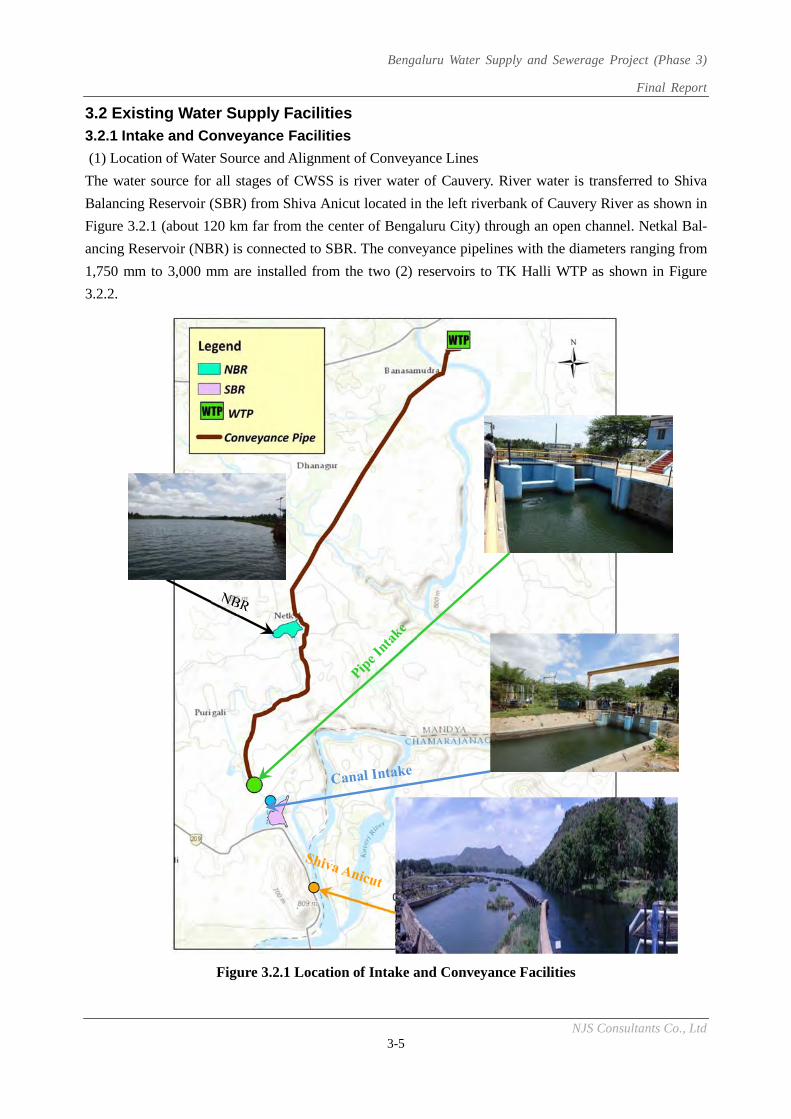
Bengaluru Water Supply and Sewerage Project (Phase 3)
Final Report
NJS Consultants Co., Ltd 3-5
3.2 Existing Water Supply Facilities 3.2.1 Intake and Conveyance Facilities
(1) Location of Water Source and Alignment of Conveyance Lines
The water source for all stages of CWSS is river water of Cauvery. River water is transferred to Shiva
Balancing Reservoir (SBR) from Shiva Anicut located in the left riverbank of Cauvery River as shown in
Figure 3.2.1 (about 120 km far from the center of Bengaluru City) through an open channel. Netkal Bal-
ancing Reservoir (NBR) is connected to SBR. The conveyance pipelines with the diameters ranging from
1,750 mm to 3,000 mm are installed from the two (2) reservoirs to TK Halli WTP as shown in Figure
3.2.2.
Figure 3.2.1 Location of Intake and Conveyance Facilities
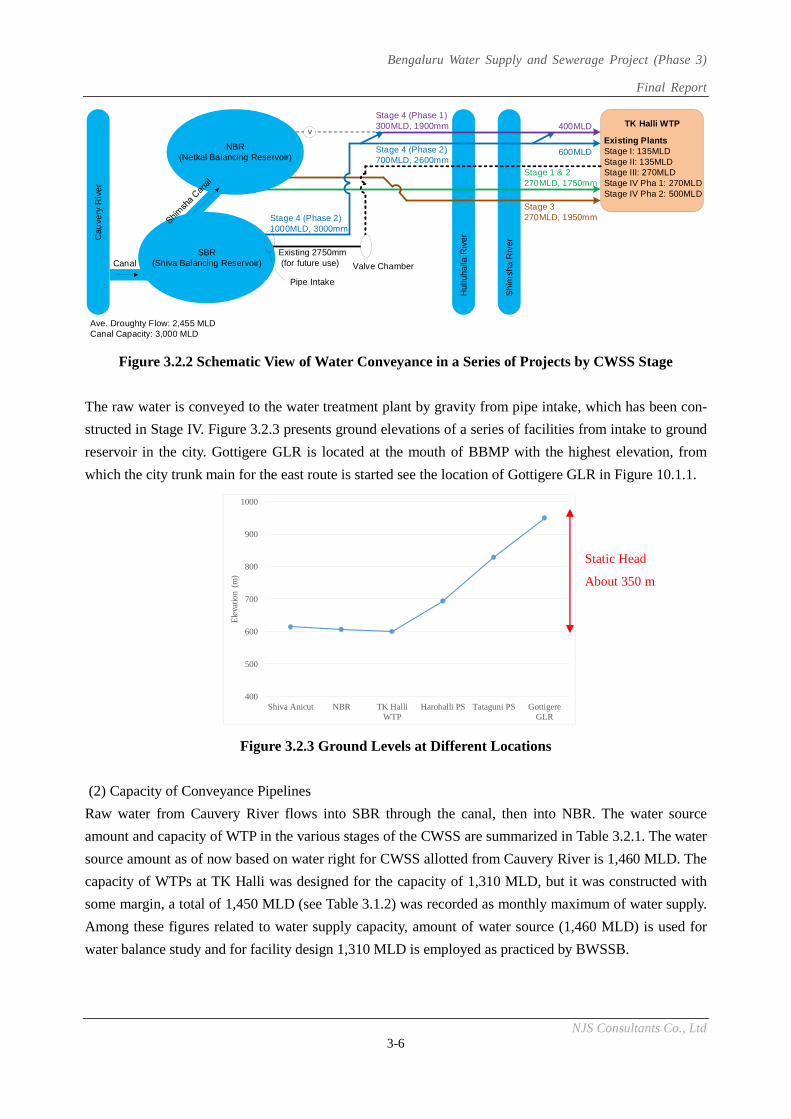
Bengaluru Water Supply and Sewerage Project (Phase 3)
Final Report
NJS Consultants Co., Ltd 3-6
Figure 3.2.2 Schematic View of Water Conveyance in a Series of Projects by CWSS Stage
The raw water is conveyed to the water treatment plant by gravity from pipe intake, which has been con-
structed in Stage IV. Figure 3.2.3 presents ground elevations of a series of facilities from intake to ground
reservoir in the city. Gottigere GLR is located at the mouth of BBMP with the highest elevation, from
which the city trunk main for the east route is started see the location of Gottigere GLR in Figure 10.1.1.
Figure 3.2.3 Ground Levels at Different Locations
(2) Capacity of Conveyance Pipelines
Raw water from Cauvery River flows into SBR through the canal, then into NBR. The water source
amount and capacity of WTP in the various stages of the CWSS are summarized in Table 3.2.1. The water
source amount as of now based on water right for CWSS allotted from Cauvery River is 1,460 MLD. The
capacity of WTPs at TK Halli was designed for the capacity of 1,310 MLD, but it was constructed with
some margin, a total of 1,450 MLD (see Table 3.1.2) was recorded as monthly maximum of water supply.
Among these figures related to water supply capacity, amount of water source (1,460 MLD) is used for
water balance study and for facility design 1,310 MLD is employed as practiced by BWSSB.
Cau
very
Riv
er
Canal
Hul
luha
lla R
iver
Shi
msh
a R
iver
TK Halli WTP
SBR(Shiva Balancing Reservoir)
Stage 3270MLD, 1950mm
Stage 4 (Phase 1)300MLD, 1900mm
V400MLD
Existing PlantsStage I: 135MLDStage II: 135MLDStage III: 270MLDStage IV Pha 1: 270MLDStage IV Pha 2: 500MLD
600MLDStage 4 (Phase 2)700MLD, 2600mm
Stage 4 (Phase 2)1000MLD, 3000mm
Stage 1 & 2270MLD, 1750mm
NBR(Netkal Balancing Reservoir)
Existing 2750mm (for future use) Valve Chamber
Pipe Intake
Ave. Droughty Flow: 2,455 MLDCanal Capacity: 3,000 MLD
400
500
600
700
800
900
1000
Shiva Anicut NBR TK HalliWTP
Harohalli PS Tataguni PS GottigereGLR
Ele
vatio
n (m
)
Static Head
About 350 m
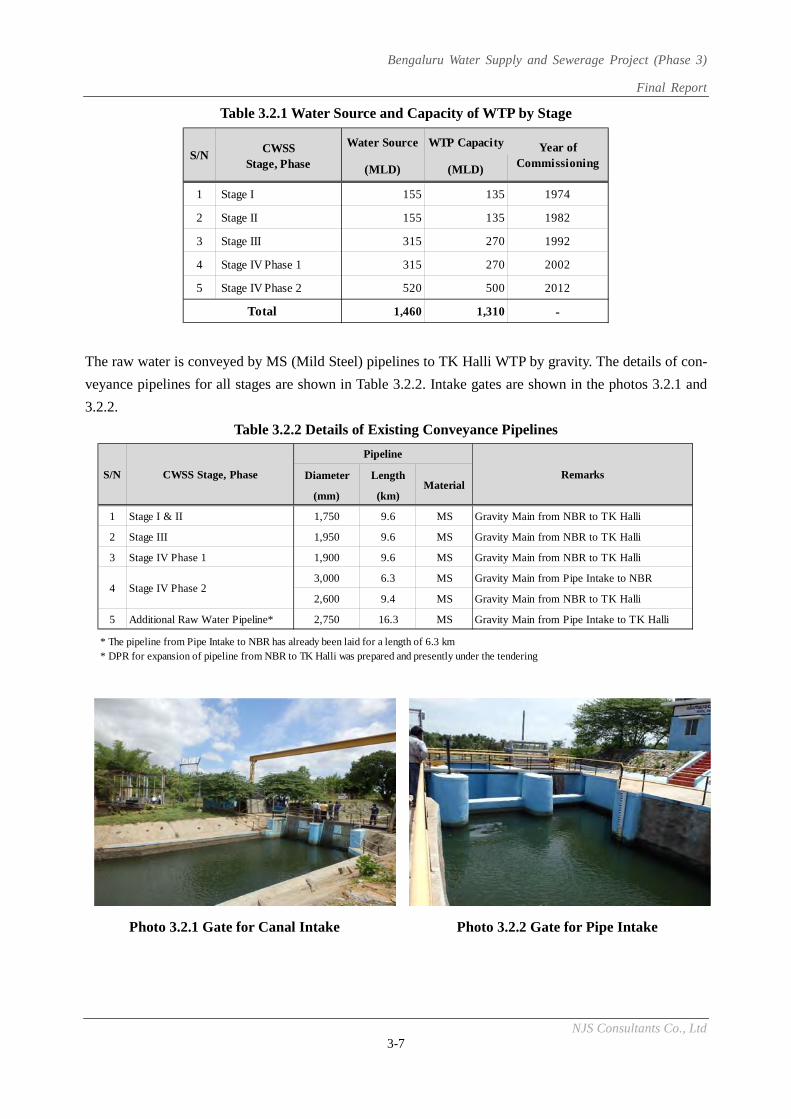
Bengaluru Water Supply and Sewerage Project (Phase 3)
Final Report
NJS Consultants Co., Ltd 3-7
Table 3.2.1 Water Source and Capacity of WTP by Stage
The raw water is conveyed by MS (Mild Steel) pipelines to TK Halli WTP by gravity. The details of con-
veyance pipelines for all stages are shown in Table 3.2.2. Intake gates are shown in the photos 3.2.1 and
3.2.2.
Table 3.2.2 Details of Existing Conveyance Pipelines
Photo 3.2.1 Gate for Canal Intake Photo 3.2.2 Gate for Pipe Intake
CWSS Water Source WTP Capacity
Stage, Phase (MLD) (MLD)
1 Stage I 155 135 1974
2 Stage II 155 135 1982
3 Stage III 315 270 1992
4 Stage IV Phase 1 315 270 2002
5 Stage IV Phase 2 520 500 2012
1,460 1,310 -Total
S/NYear of
Commissioning
Diameter Length
(mm) (km)
1 Stage I & II 1,750 9.6 MS Gravity Main from NBR to TK Halli
2 Stage III 1,950 9.6 MS Gravity Main from NBR to TK Halli
3 Stage IV Phase 1 1,900 9.6 MS Gravity Main from NBR to TK Halli
3,000 6.3 MS Gravity Main from Pipe Intake to NBR
2,600 9.4 MS Gravity Main from NBR to TK Halli
5 Additional Raw Water Pipeline* 2,750 16.3 MS Gravity Main from Pipe Intake to TK Halli
* The pipeline from Pipe Intake to NBR has already been laid for a length of 6.3 km* DPR for expansion of pipeline from NBR to TK Halli was prepared and presently under the tendering
4 Stage IV Phase 2
CWSS Stage, PhaseS/N Remarks
Pipeline
Material
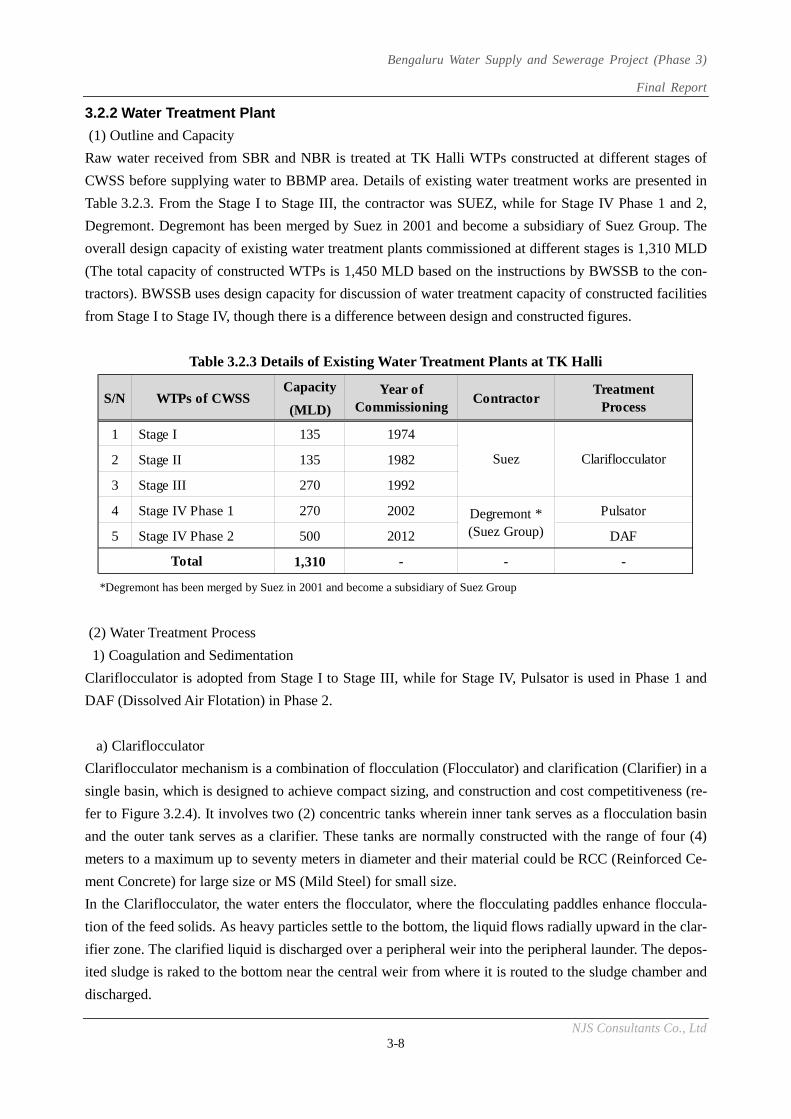
Bengaluru Water Supply and Sewerage Project (Phase 3)
Final Report
NJS Consultants Co., Ltd 3-8
3.2.2 Water Treatment Plant
(1) Outline and Capacity
Raw water received from SBR and NBR is treated at TK Halli WTPs constructed at different stages of
CWSS before supplying water to BBMP area. Details of existing water treatment works are presented in
Table 3.2.3. From the Stage I to Stage III, the contractor was SUEZ, while for Stage IV Phase 1 and 2,
Degremont. Degremont has been merged by Suez in 2001 and become a subsidiary of Suez Group. The
overall design capacity of existing water treatment plants commissioned at different stages is 1,310 MLD
(The total capacity of constructed WTPs is 1,450 MLD based on the instructions by BWSSB to the con-
tractors). BWSSB uses design capacity for discussion of water treatment capacity of constructed facilities
from Stage I to Stage IV, though there is a difference between design and constructed figures.
Table 3.2.3 Details of Existing Water Treatment Plants at TK Halli
*Degremont has been merged by Suez in 2001 and become a subsidiary of Suez Group
(2) Water Treatment Process
1) Coagulation and Sedimentation
Clariflocculator is adopted from Stage I to Stage III, while for Stage IV, Pulsator is used in Phase 1 and
DAF (Dissolved Air Flotation) in Phase 2.
a) Clariflocculator
Clariflocculator mechanism is a combination of flocculation (Flocculator) and clarification (Clarifier) in a
single basin, which is designed to achieve compact sizing, and construction and cost competitiveness (re-
fer to Figure 3.2.4). It involves two (2) concentric tanks wherein inner tank serves as a flocculation basin
and the outer tank serves as a clarifier. These tanks are normally constructed with the range of four (4)
meters to a maximum up to seventy meters in diameter and their material could be RCC (Reinforced Ce-
ment Concrete) for large size or MS (Mild Steel) for small size.
In the Clariflocculator, the water enters the flocculator, where the flocculating paddles enhance floccula-
tion of the feed solids. As heavy particles settle to the bottom, the liquid flows radially upward in the clar-
ifier zone. The clarified liquid is discharged over a peripheral weir into the peripheral launder. The depos-
ited sludge is raked to the bottom near the central weir from where it is routed to the sludge chamber and
discharged.
Capacity
(MLD)
1 Stage I 135 1974
2 Stage II 135 1982
3 Stage III 270 1992
4 Stage IV Phase 1 270 2002 Pulsator
5 Stage IV Phase 2 500 2012 DAF
1,310 - - -Total
ClariflocculatorSuez
Degremont *(Suez Group)
WTPs of CWSSS/NYear of
CommissioningContractor
TreatmentProcess
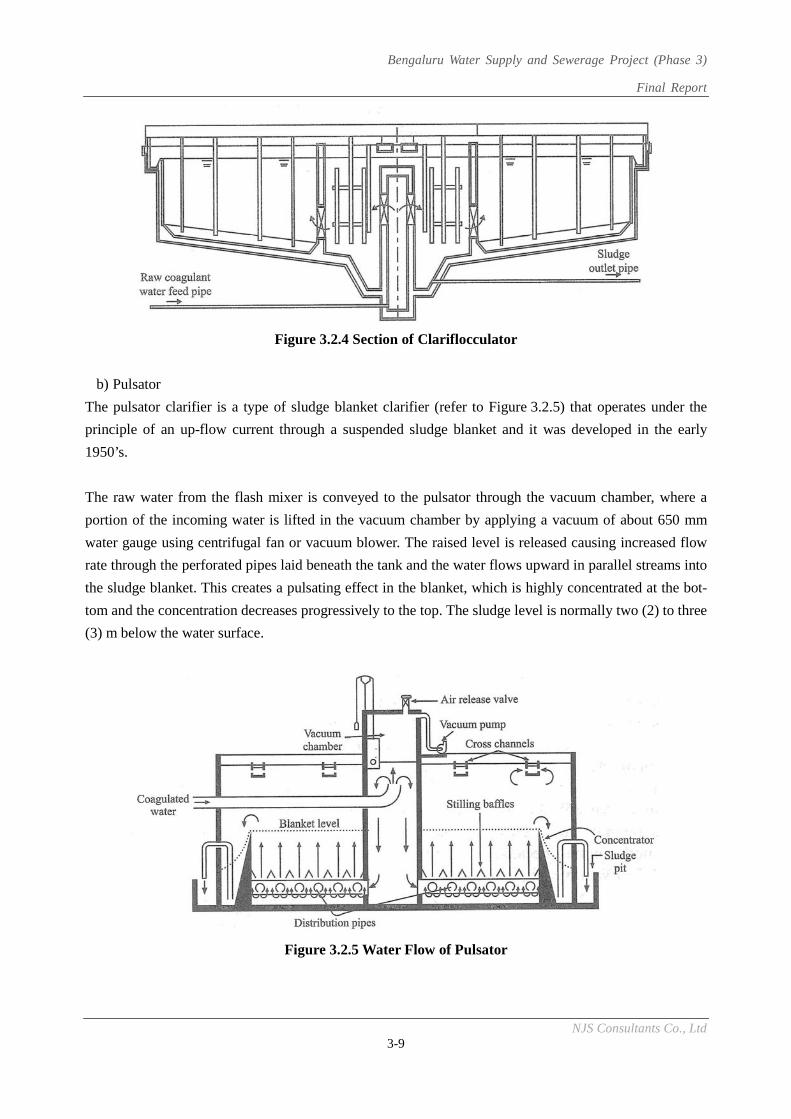
Bengaluru Water Supply and Sewerage Project (Phase 3)
Final Report
NJS Consultants Co., Ltd 3-9
Figure 3.2.4 Section of Clariflocculator
b) Pulsator
The pulsator clarifier is a type of sludge blanket clarifier (refer to Figure 3.2.5) that operates under the
principle of an up-flow current through a suspended sludge blanket and it was developed in the early
1950’s.
The raw water from the flash mixer is conveyed to the pulsator through the vacuum chamber, where a
portion of the incoming water is lifted in the vacuum chamber by applying a vacuum of about 650 mm
water gauge using centrifugal fan or vacuum blower. The raised level is released causing increased flow
rate through the perforated pipes laid beneath the tank and the water flows upward in parallel streams into
the sludge blanket. This creates a pulsating effect in the blanket, which is highly concentrated at the bot-
tom and the concentration decreases progressively to the top. The sludge level is normally two (2) to three
(3) m below the water surface.
Figure 3.2.5 Water Flow of Pulsator
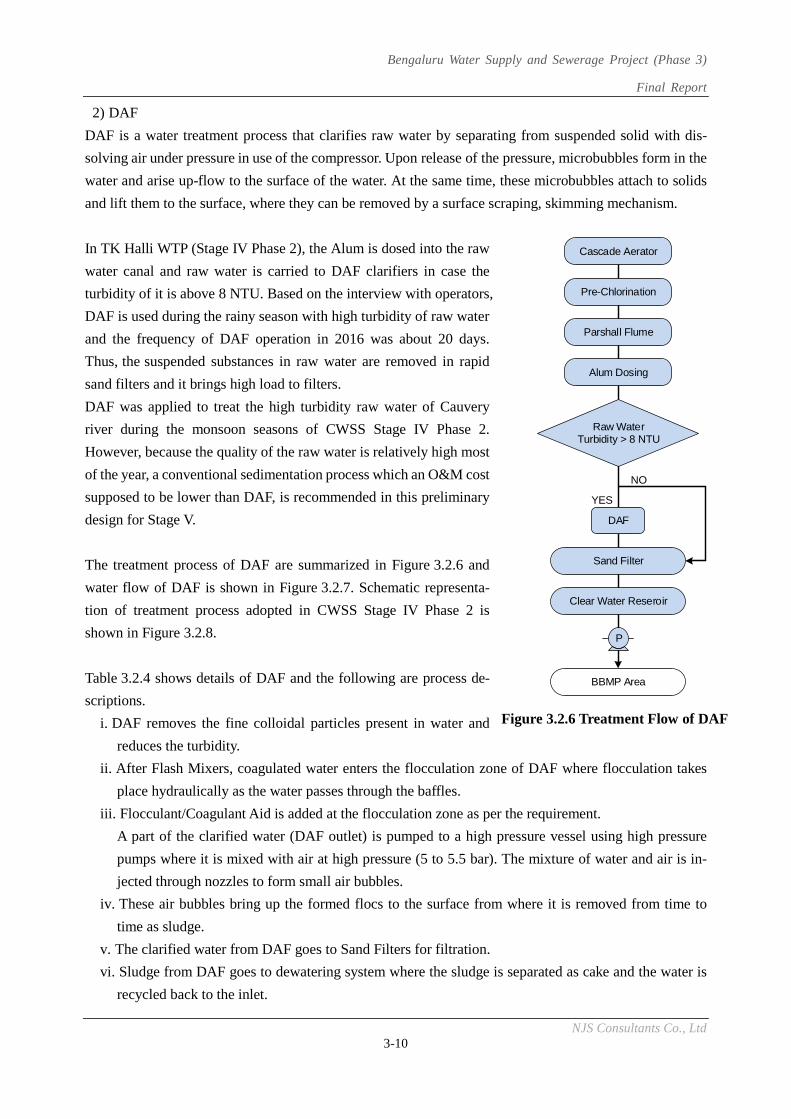
Bengaluru Water Supply and Sewerage Project (Phase 3)
Final Report
NJS Consultants Co., Ltd 3-10
2) DAF
DAF is a water treatment process that clarifies raw water by separating from suspended solid with dis-
solving air under pressure in use of the compressor. Upon release of the pressure, microbubbles form in the
water and arise up-flow to the surface of the water. At the same time, these microbubbles attach to solids
and lift them to the surface, where they can be removed by a surface scraping, skimming mechanism.
In TK Halli WTP (Stage IV Phase 2), the Alum is dosed into the raw
water canal and raw water is carried to DAF clarifiers in case the
turbidity of it is above 8 NTU. Based on the interview with operators,
DAF is used during the rainy season with high turbidity of raw water
and the frequency of DAF operation in 2016 was about 20 days.
Thus, the suspended substances in raw water are removed in rapid
sand filters and it brings high load to filters.
DAF was applied to treat the high turbidity raw water of Cauvery
river during the monsoon seasons of CWSS Stage IV Phase 2.
However, because the quality of the raw water is relatively high most
of the year, a conventional sedimentation process which an O&M cost
supposed to be lower than DAF, is recommended in this preliminary
design for Stage V.
The treatment process of DAF are summarized in Figure 3.2.6 and
water flow of DAF is shown in Figure 3.2.7. Schematic representa-
tion of treatment process adopted in CWSS Stage IV Phase 2 is
shown in Figure 3.2.8.
Table 3.2.4 shows details of DAF and the following are process de-
scriptions.
i. DAF removes the fine colloidal particles present in water and
reduces the turbidity.
ii. After Flash Mixers, coagulated water enters the flocculation zone of DAF where flocculation takes
place hydraulically as the water passes through the baffles.
iii. Flocculant/Coagulant Aid is added at the flocculation zone as per the requirement.
A part of the clarified water (DAF outlet) is pumped to a high pressure vessel using high pressure
pumps where it is mixed with air at high pressure (5 to 5.5 bar). The mixture of water and air is in-
jected through nozzles to form small air bubbles.
iv. These air bubbles bring up the formed flocs to the surface from where it is removed from time to
time as sludge.
v. The clarified water from DAF goes to Sand Filters for filtration.
vi. Sludge from DAF goes to dewatering system where the sludge is separated as cake and the water is
recycled back to the inlet.
BBMP Area
Parshall Flume
Alum Dosing
Pre-Chlorination
Cascade Aerator
Raw WaterTurbidity > 8 NTU
DAF
Sand Filter
YES
NO
Clear Water Reseroir
P
Figure 3.2.6 Treatment Flow of DAF
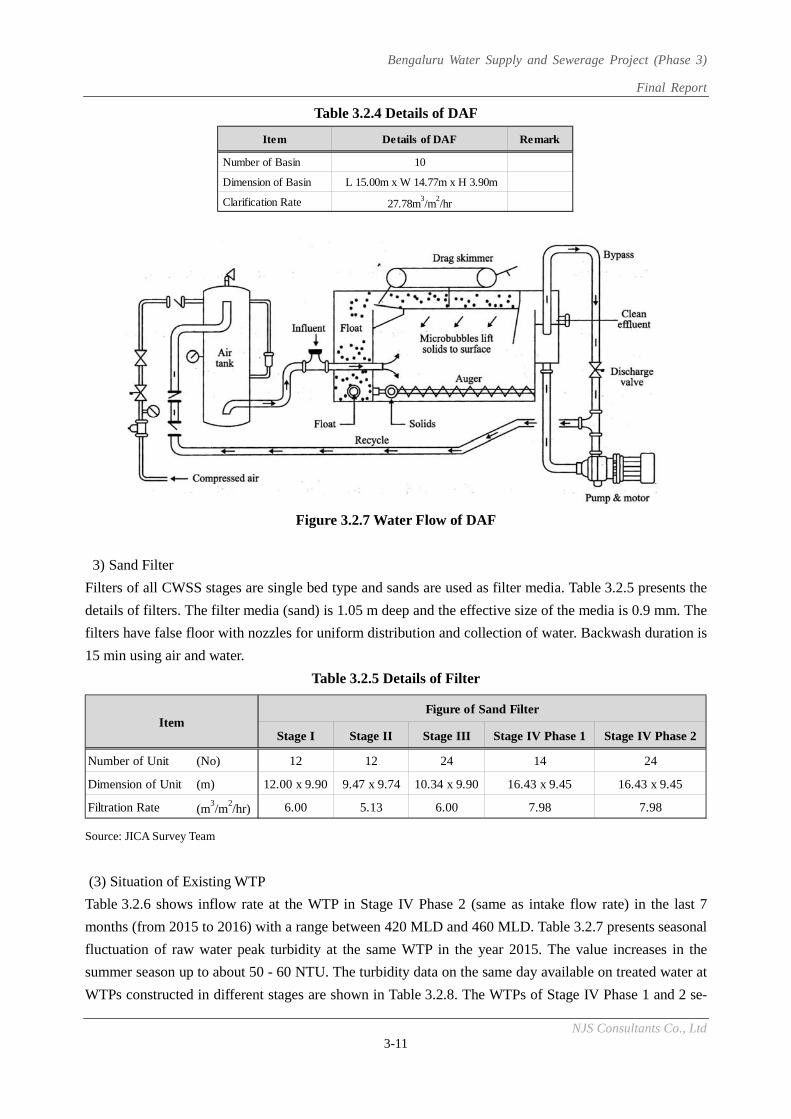
Bengaluru Water Supply and Sewerage Project (Phase 3)
Final Report
NJS Consultants Co., Ltd 3-11
Table 3.2.4 Details of DAF
Figure 3.2.7 Water Flow of DAF
3) Sand Filter
Filters of all CWSS stages are single bed type and sands are used as filter media. Table 3.2.5 presents the
details of filters. The filter media (sand) is 1.05 m deep and the effective size of the media is 0.9 mm. The
filters have false floor with nozzles for uniform distribution and collection of water. Backwash duration is
15 min using air and water.
Table 3.2.5 Details of Filter
Source: JICA Survey Team
(3) Situation of Existing WTP
Table 3.2.6 shows inflow rate at the WTP in Stage IV Phase 2 (same as intake flow rate) in the last 7
months (from 2015 to 2016) with a range between 420 MLD and 460 MLD. Table 3.2.7 presents seasonal
fluctuation of raw water peak turbidity at the same WTP in the year 2015. The value increases in the
summer season up to about 50 - 60 NTU. The turbidity data on the same day available on treated water at
WTPs constructed in different stages are shown in Table 3.2.8. The WTPs of Stage IV Phase 1 and 2 se-
Item Details of DAF Remark
Number of Basin 10
Dimension of Basin L 15.00m x W 14.77m x H 3.90m
Clarification Rate 27.78m3/m
2/hr
Stage I Stage II Stage III Stage IV Phase 1 Stage IV Phase 2
Number of Unit (No) 12 12 24 14 24
Dimension of Unit (m) 12.00 x 9.90 9.47 x 9.74 10.34 x 9.90 16.43 x 9.45 16.43 x 9.45
Filtration Rate (m3/m
2/hr) 6.00 5.13 6.00 7.98 7.98
Figure of Sand FilterItem
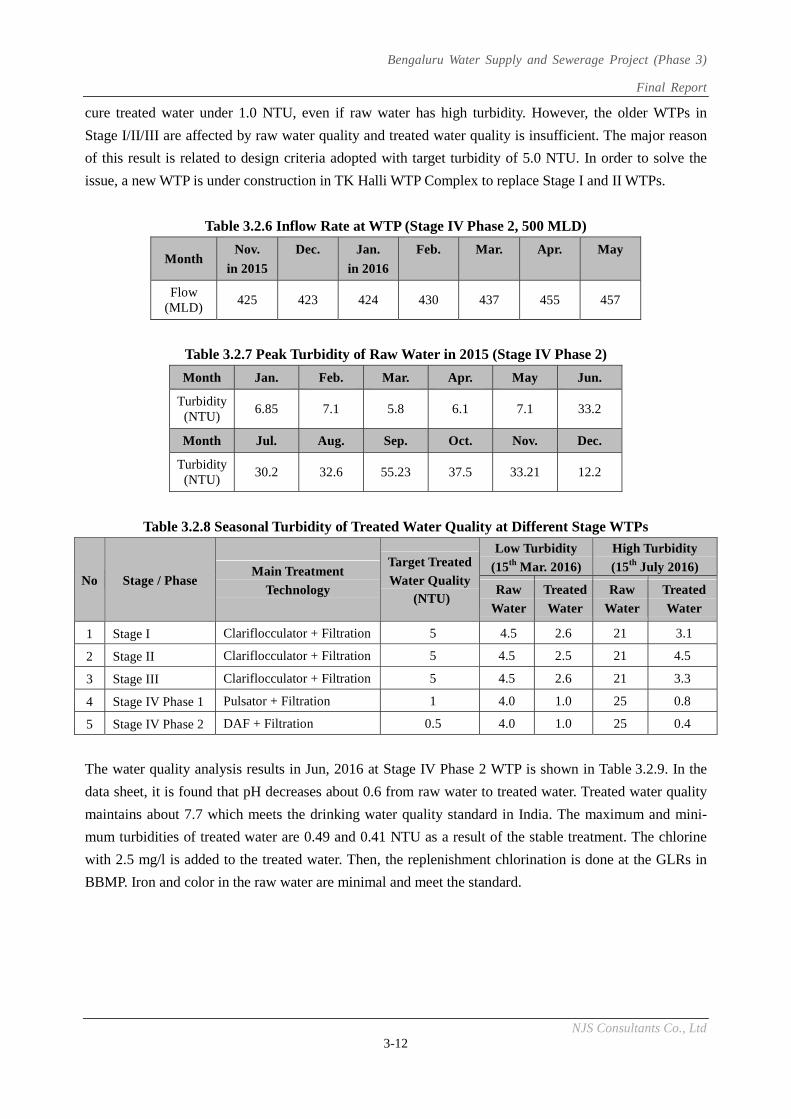
Bengaluru Water Supply and Sewerage Project (Phase 3)
Final Report
NJS Consultants Co., Ltd 3-12
cure treated water under 1.0 NTU, even if raw water has high turbidity. However, the older WTPs in
Stage I/II/III are affected by raw water quality and treated water quality is insufficient. The major reason
of this result is related to design criteria adopted with target turbidity of 5.0 NTU. In order to solve the
issue, a new WTP is under construction in TK Halli WTP Complex to replace Stage I and II WTPs.
Table 3.2.6 Inflow Rate at WTP (Stage IV Phase 2, 500 MLD)
Month Nov.
in 2015
Dec. Jan.
in 2016
Feb. Mar. Apr. May
Flow (MLD)
425 423 424 430 437 455 457
Table 3.2.7 Peak Turbidity of Raw Water in 2015 (Stage IV Phase 2)
Month Jan. Feb. Mar. Apr. May Jun.
Turbidity (NTU)
6.85 7.1 5.8 6.1 7.1 33.2
Month Jul. Aug. Sep. Oct. Nov. Dec.
Turbidity (NTU)
30.2 32.6 55.23 37.5 33.21 12.2
Table 3.2.8 Seasonal Turbidity of Treated Water Quality at Different Stage WTPs
No Stage / Phase Main Treatment
Technology
Target Treated
Water Quality(NTU)
Low Turbidity
(15th Mar. 2016)
High Turbidity
(15th July 2016)
Raw
Water
Treated
Water
Raw
Water
Treated
Water
1 Stage I Clariflocculator + Filtration 5 4.5 2.6 21 3.1
2 Stage II Clariflocculator + Filtration 5 4.5 2.5 21 4.5
3 Stage III Clariflocculator + Filtration 5 4.5 2.6 21 3.3
4 Stage IV Phase 1 Pulsator + Filtration 1 4.0 1.0 25 0.8
5 Stage IV Phase 2 DAF + Filtration 0.5 4.0 1.0 25 0.4
The water quality analysis results in Jun, 2016 at Stage IV Phase 2 WTP is shown in Table 3.2.9. In the
data sheet, it is found that pH decreases about 0.6 from raw water to treated water. Treated water quality
maintains about 7.7 which meets the drinking water quality standard in India. The maximum and mini-
mum turbidities of treated water are 0.49 and 0.41 NTU as a result of the stable treatment. The chlorine
with 2.5 mg/l is added to the treated water. Then, the replenishment chlorination is done at the GLRs in
BBMP. Iron and color in the raw water are minimal and meet the standard.
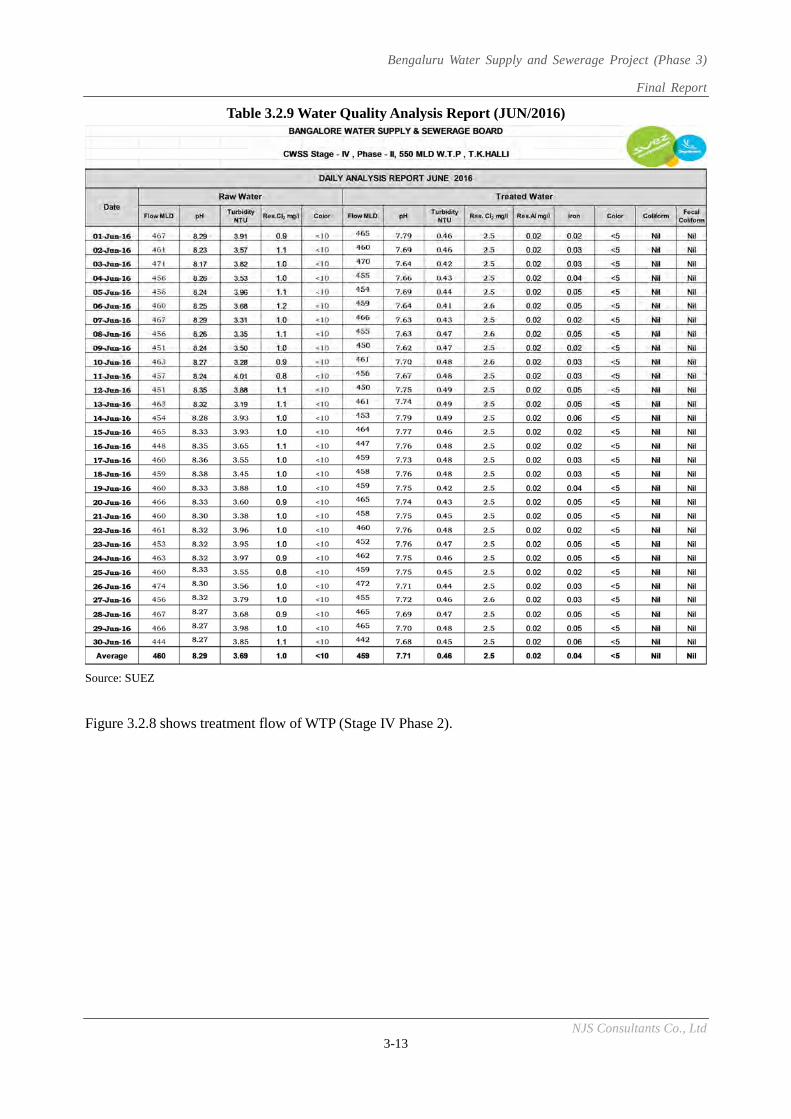
Bengaluru Water Supply and Sewerage Project (Phase 3)
Final Report
NJS Consultants Co., Ltd 3-13
Table 3.2.9 Water Quality Analysis Report (JUN/2016)
Source: SUEZ
Figure 3.2.8 shows treatment flow of WTP (Stage IV Phase 2).
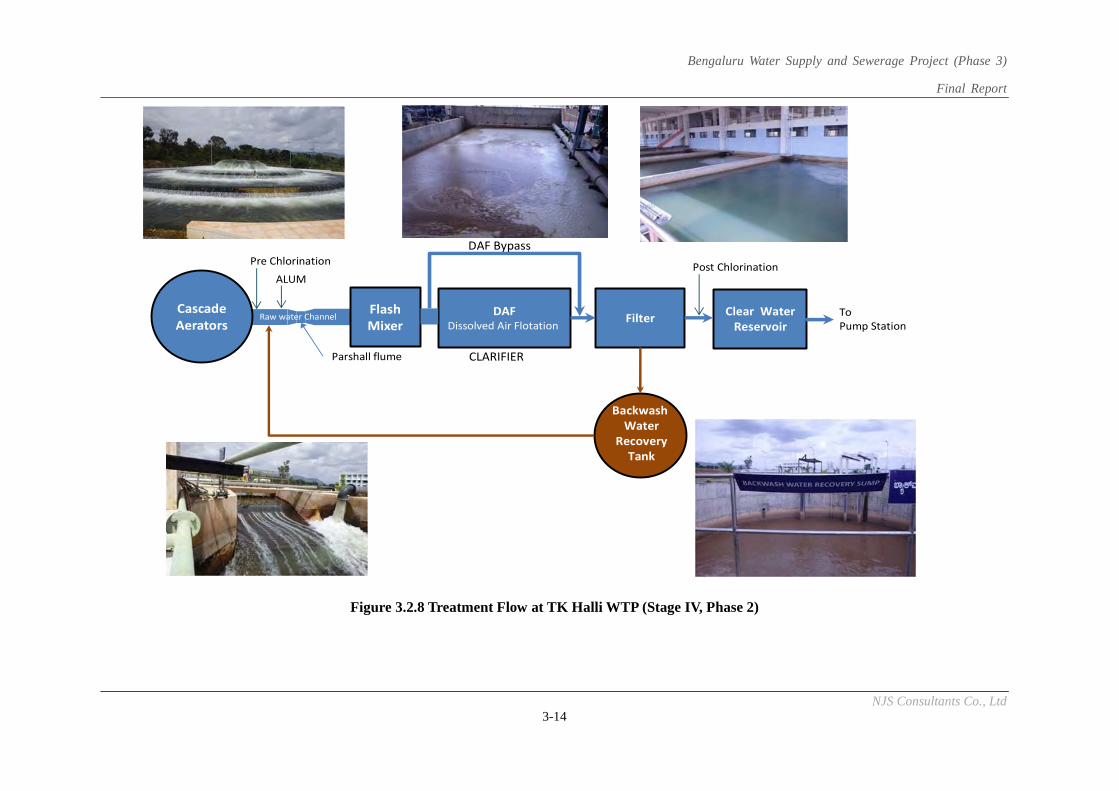
Bengaluru Water Supply and Sewerage Project (Phase 3)
Final Report
NJS Consultants Co., Ltd 3-14
Figure 3.2.8 Treatment Flow at TK Halli WTP (Stage IV, Phase 2)
Parshall flume
Cascade Aerators
Raw water ChannelFlashMixer
DAFDissolved Air Flotation
CLARIFIER
Filter Clear WaterReservoir
BackwashWater
RecoveryTank
ALUMPre Chlorination
ToPump Station
Post Chlorination
DAF Bypass
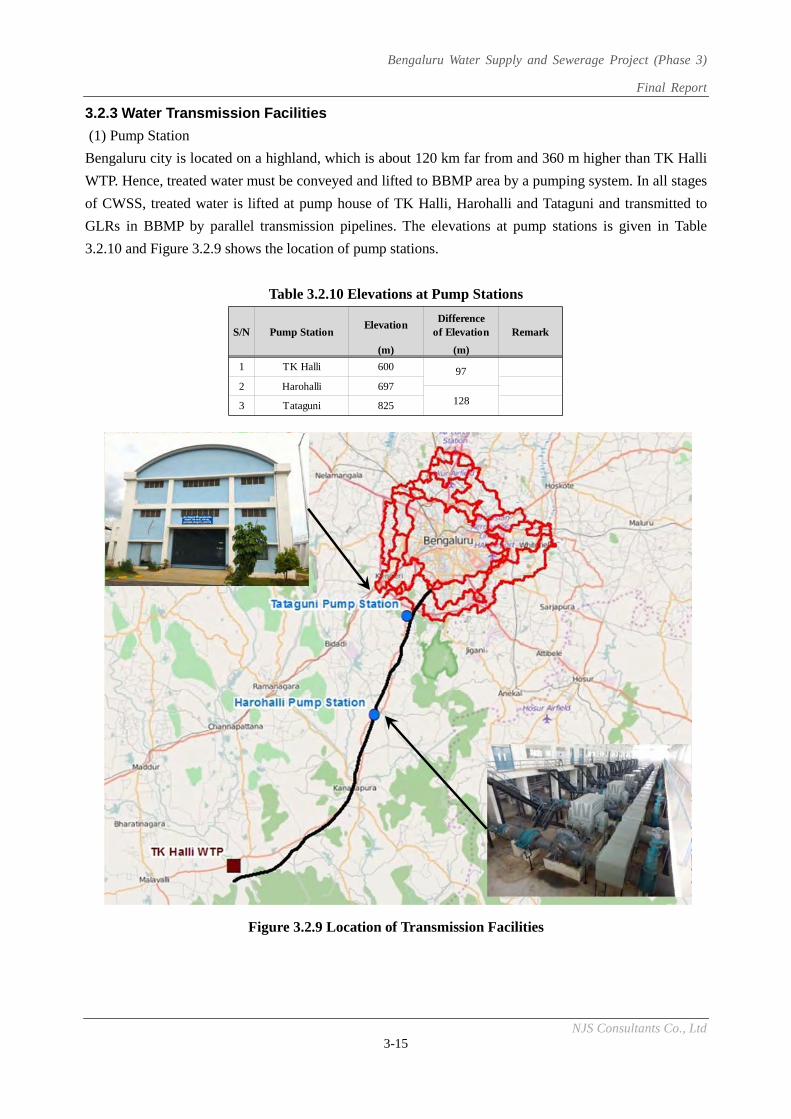
Bengaluru Water Supply and Sewerage Project (Phase 3)
Final Report
NJS Consultants Co., Ltd 3-15
3.2.3 Water Transmission Facilities
(1) Pump Station
Bengaluru city is located on a highland, which is about 120 km far from and 360 m higher than TK Halli
WTP. Hence, treated water must be conveyed and lifted to BBMP area by a pumping system. In all stages
of CWSS, treated water is lifted at pump house of TK Halli, Harohalli and Tataguni and transmitted to
GLRs in BBMP by parallel transmission pipelines. The elevations at pump stations is given in Table
3.2.10 and Figure 3.2.9 shows the location of pump stations.
Table 3.2.10 Elevations at Pump Stations
Figure 3.2.9 Location of Transmission Facilities
ElevationDifference
of Elevation
(m) (m)
825Tataguni3 128
972 Harohalli 697
S/N Pump Station Remark
1 TK Halli 600
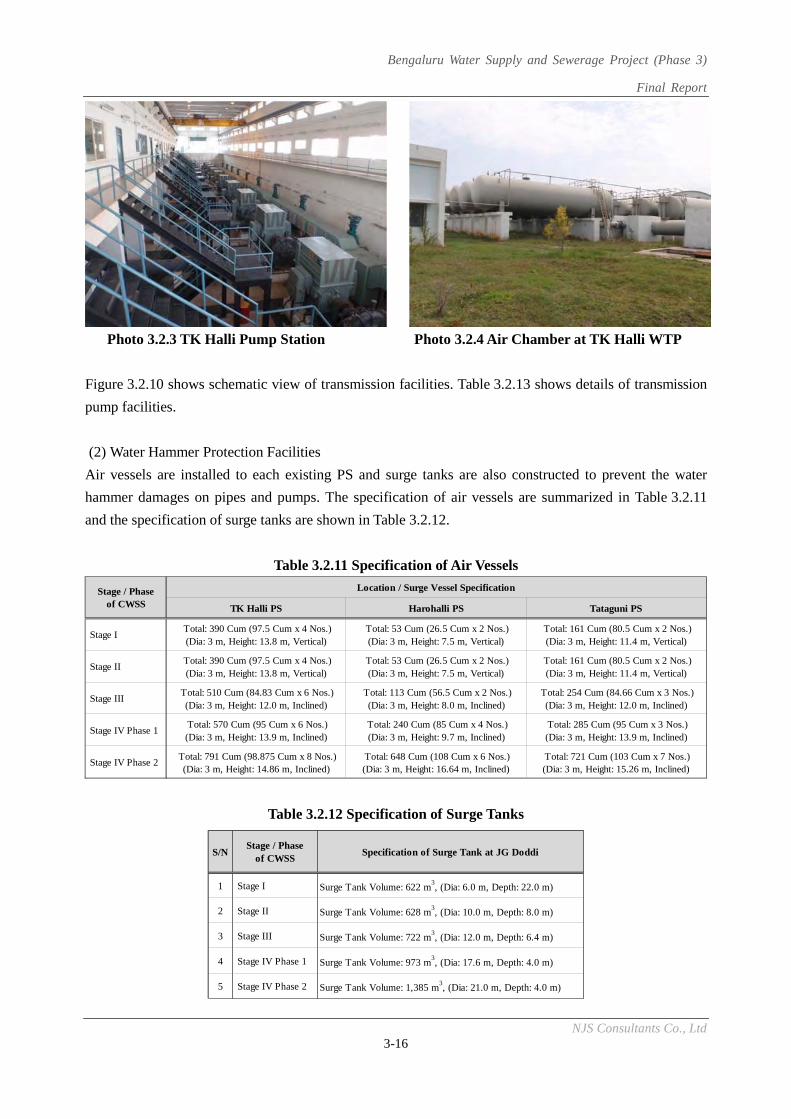
Bengaluru Water Supply and Sewerage Project (Phase 3)
Final Report
NJS Consultants Co., Ltd 3-16
Photo 3.2.3 TK Halli Pump Station Photo 3.2.4 Air Chamber at TK Halli WTP
Figure 3.2.10 shows schematic view of transmission facilities. Table 3.2.13 shows details of transmission
pump facilities.
(2) Water Hammer Protection Facilities
Air vessels are installed to each existing PS and surge tanks are also constructed to prevent the water
hammer damages on pipes and pumps. The specification of air vessels are summarized in Table 3.2.11
and the specification of surge tanks are shown in Table 3.2.12.
Table 3.2.11 Specification of Air Vessels
Table 3.2.12 Specification of Surge Tanks
TK Halli PS Harohalli PS Tataguni PS
Stage I Total: 390 Cum (97.5 Cum x 4 Nos.)
(Dia: 3 m, Height: 13.8 m, Vertical) Total: 53 Cum (26.5 Cum x 2 Nos.)(Dia: 3 m, Height: 7.5 m, Vertical)
Total: 161 Cum (80.5 Cum x 2 Nos.)(Dia: 3 m, Height: 11.4 m, Vertical)
Stage II Total: 390 Cum (97.5 Cum x 4 Nos.)
(Dia: 3 m, Height: 13.8 m, Vertical) Total: 53 Cum (26.5 Cum x 2 Nos.)(Dia: 3 m, Height: 7.5 m, Vertical)
Total: 161 Cum (80.5 Cum x 2 Nos.)(Dia: 3 m, Height: 11.4 m, Vertical)
Stage III Total: 510 Cum (84.83 Cum x 6 Nos.)
(Dia: 3 m, Height: 12.0 m, Inclined) Total: 113 Cum (56.5 Cum x 2 Nos.)
(Dia: 3 m, Height: 8.0 m, Inclined) Total: 254 Cum (84.66 Cum x 3 Nos.)
(Dia: 3 m, Height: 12.0 m, Inclined)
Stage IV Phase 1 Total: 570 Cum (95 Cum x 6 Nos.)(Dia: 3 m, Height: 13.9 m, Inclined)
Total: 240 Cum (85 Cum x 4 Nos.)(Dia: 3 m, Height: 9.7 m, Inclined)
Total: 285 Cum (95 Cum x 3 Nos.)(Dia: 3 m, Height: 13.9 m, Inclined)
Stage IV Phase 2 Total: 791 Cum (98.875 Cum x 8 Nos.)
(Dia: 3 m, Height: 14.86 m, Inclined) Total: 648 Cum (108 Cum x 6 Nos.)(Dia: 3 m, Height: 16.64 m, Inclined)
Total: 721 Cum (103 Cum x 7 Nos.)(Dia: 3 m, Height: 15.26 m, Inclined)
Stage / Phaseof CWSS
Location / Surge Vessel Specification
1 Stage I Surge Tank Volume: 622 m3, (Dia: 6.0 m, Depth: 22.0 m)
2 Stage II Surge Tank Volume: 628 m3, (Dia: 10.0 m, Depth: 8.0 m)
3 Stage III Surge Tank Volume: 722 m3, (Dia: 12.0 m, Depth: 6.4 m)
4 Stage IV Phase 1 Surge Tank Volume: 973 m3, (Dia: 17.6 m, Depth: 4.0 m)
5 Stage IV Phase 2 Surge Tank Volume: 1,385 m3, (Dia: 21.0 m, Depth: 4.0 m)
S/NStage / Phase
of CWSSSpecification of Surge Tank at JG Doddi
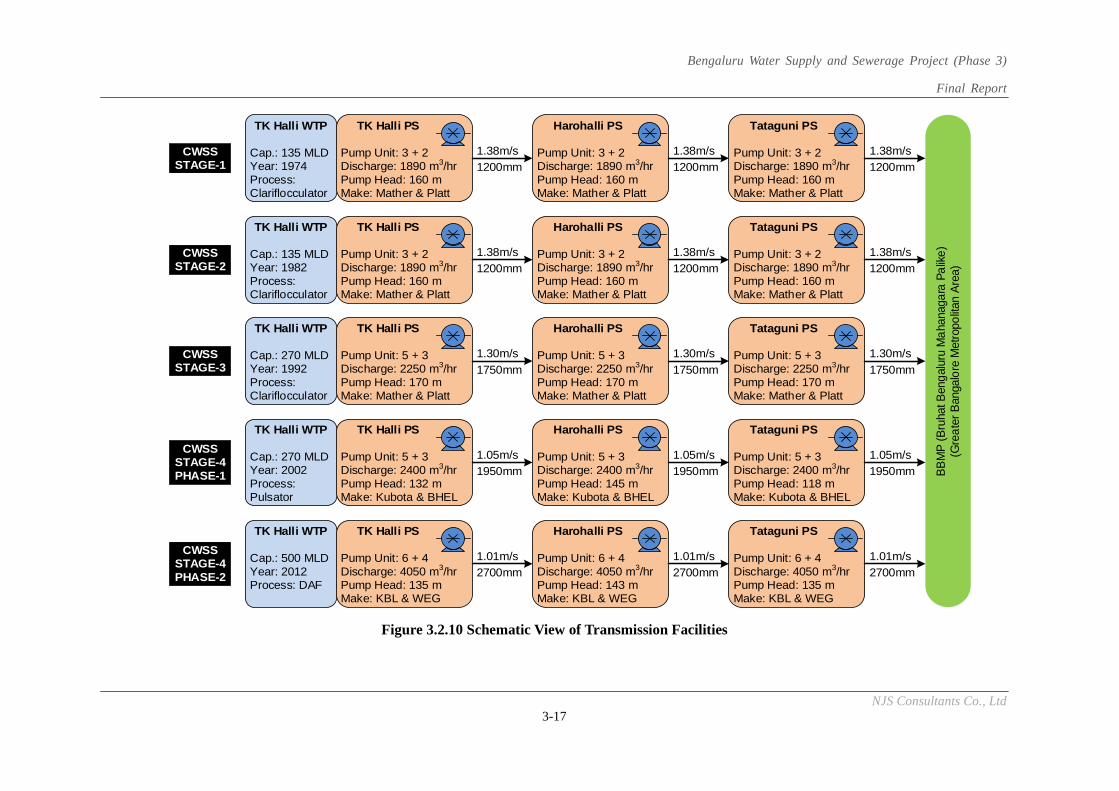
Bengaluru Water Supply and Sewerage Project (Phase 3)
Final Report
NJS Consultants Co., Ltd 3-17
Figure 3.2.10 Schematic View of Transmission Facilities
CWSSSTAGE-1
TK Halli WTP
Cap.: 135 MLDYear: 1974Process:Clariflocculator
TK Halli PS
Pump Unit: 3 + 2Discharge: 1890 m3/hrPump Head: 160 mMake: Mather & Platt
Harohalli PS
Pump Unit: 3 + 2Discharge: 1890 m3/hrPump Head: 160 mMake: Mather & Platt
Tataguni PS
Pump Unit: 3 + 2Discharge: 1890 m3/hrPump Head: 160 mMake: Mather & Platt
BBM
P (B
ruha
t Ben
galu
ru M
ahan
agar
a Pa
like)
(Gre
ater
Ban
galo
re M
etro
polita
n Ar
ea)
CWSSSTAGE-2
CWSSSTAGE-3
CWSSSTAGE-4PHASE-1
CWSSSTAGE-4PHASE-2
TK Halli WTP
Cap.: 135 MLDYear: 1982Process:Clariflocculator
TK Halli PS
Pump Unit: 3 + 2Discharge: 1890 m3/hrPump Head: 160 mMake: Mather & Platt
Harohalli PS
Pump Unit: 3 + 2Discharge: 1890 m3/hrPump Head: 160 mMake: Mather & Platt
Tataguni PS
Pump Unit: 3 + 2Discharge: 1890 m3/hrPump Head: 160 mMake: Mather & Platt
TK Halli WTP
Cap.: 270 MLDYear: 1992Process:Clariflocculator
TK Halli PS
Pump Unit: 5 + 3Discharge: 2250 m3/hrPump Head: 170 mMake: Mather & Platt
Harohalli PS
Pump Unit: 5 + 3Discharge: 2250 m3/hrPump Head: 170 mMake: Mather & Platt
Tataguni PS
Pump Unit: 5 + 3Discharge: 2250 m3/hrPump Head: 170 mMake: Mather & Platt
TK Halli WTP
Cap.: 270 MLDYear: 2002Process:Pulsator
TK Halli PS
Pump Unit: 5 + 3Discharge: 2400 m3/hrPump Head: 132 mMake: Kubota & BHEL
Harohalli PS
Pump Unit: 5 + 3Discharge: 2400 m3/hrPump Head: 145 mMake: Kubota & BHEL
Tataguni PS
Pump Unit: 5 + 3Discharge: 2400 m3/hrPump Head: 118 mMake: Kubota & BHEL
TK Halli WTP
Cap.: 500 MLDYear: 2012Process: DAF
TK Halli PS
Pump Unit: 6 + 4Discharge: 4050 m3/hrPump Head: 135 mMake: KBL & WEG
Harohalli PS
Pump Unit: 6 + 4Discharge: 4050 m3/hrPump Head: 143 mMake: KBL & WEG
Tataguni PS
Pump Unit: 6 + 4Discharge: 4050 m3/hrPump Head: 135 mMake: KBL & WEG
1.38m/s1200mm
1.38m/s1200mm
1.38m/s1200mm
1.38m/s1200mm
1.38m/s1200mm
1.38m/s1200mm
1.30m/s1750mm
1.30m/s1750mm
1.30m/s1750mm
1.05m/s1950mm
1.05m/s1950mm
1.05m/s1950mm
1.01m/s2700mm
1.01m/s2700mm
1.01m/s2700mm
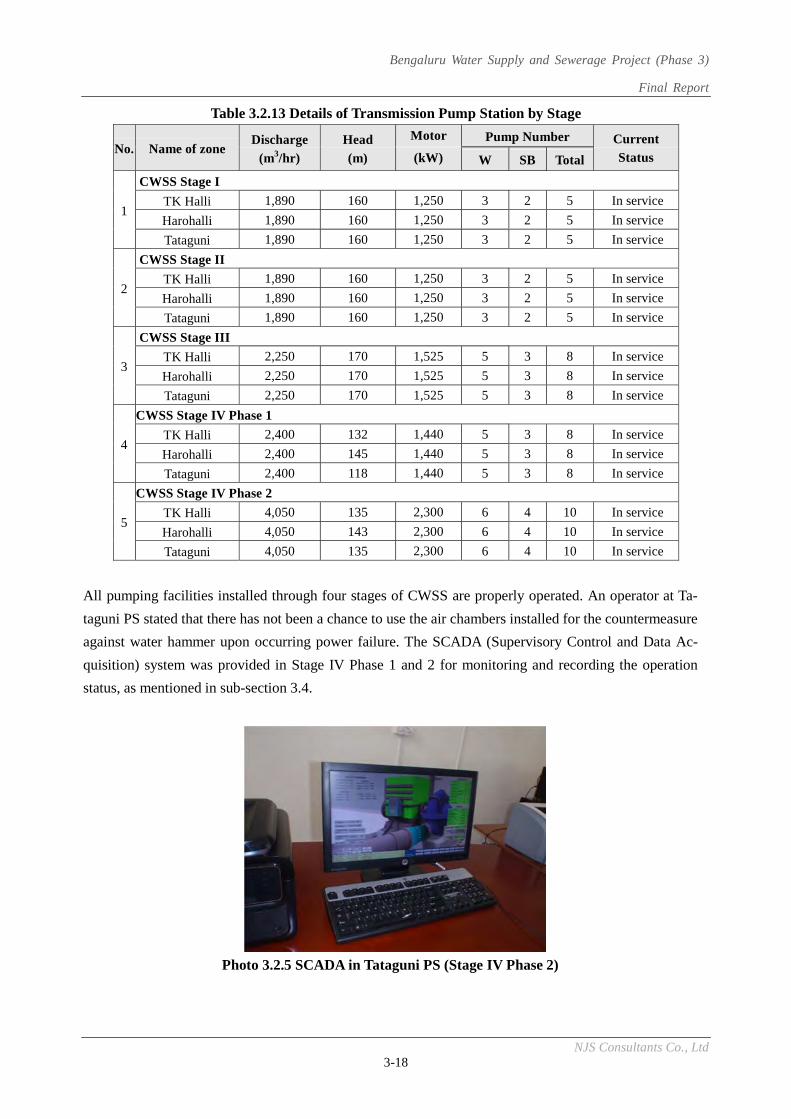
Bengaluru Water Supply and Sewerage Project (Phase 3)
Final Report
NJS Consultants Co., Ltd 3-18
Table 3.2.13 Details of Transmission Pump Station by Stage
No. Name of zone Discharge
(m3/hr)
Head
(m)
Motor Pump Number Current
Status (kW) W SB Total
1
CWSS Stage I
TK Halli 1,890 160 1,250 3 2 5 In service
Harohalli 1,890 160 1,250 3 2 5 In service
Tataguni 1,890 160 1,250 3 2 5 In service
2
CWSS Stage II
TK Halli 1,890 160 1,250 3 2 5 In service
Harohalli 1,890 160 1,250 3 2 5 In service
Tataguni 1,890 160 1,250 3 2 5 In service
3
CWSS Stage III
TK Halli 2,250 170 1,525 5 3 8 In service
Harohalli 2,250 170 1,525 5 3 8 In service
Tataguni 2,250 170 1,525 5 3 8 In service
4
CWSS Stage IV Phase 1
TK Halli 2,400 132 1,440 5 3 8 In service
Harohalli 2,400 145 1,440 5 3 8 In service
Tataguni 2,400 118 1,440 5 3 8 In service
5
CWSS Stage IV Phase 2
TK Halli 4,050 135 2,300 6 4 10 In service
Harohalli 4,050 143 2,300 6 4 10 In service
Tataguni 4,050 135 2,300 6 4 10 In service
All pumping facilities installed through four stages of CWSS are properly operated. An operator at Ta-
taguni PS stated that there has not been a chance to use the air chambers installed for the countermeasure
against water hammer upon occurring power failure. The SCADA (Supervisory Control and Data Ac-
quisition) system was provided in Stage IV Phase 1 and 2 for monitoring and recording the operation
status, as mentioned in sub-section 3.4.
Photo 3.2.5 SCADA in Tataguni PS (Stage IV Phase 2)
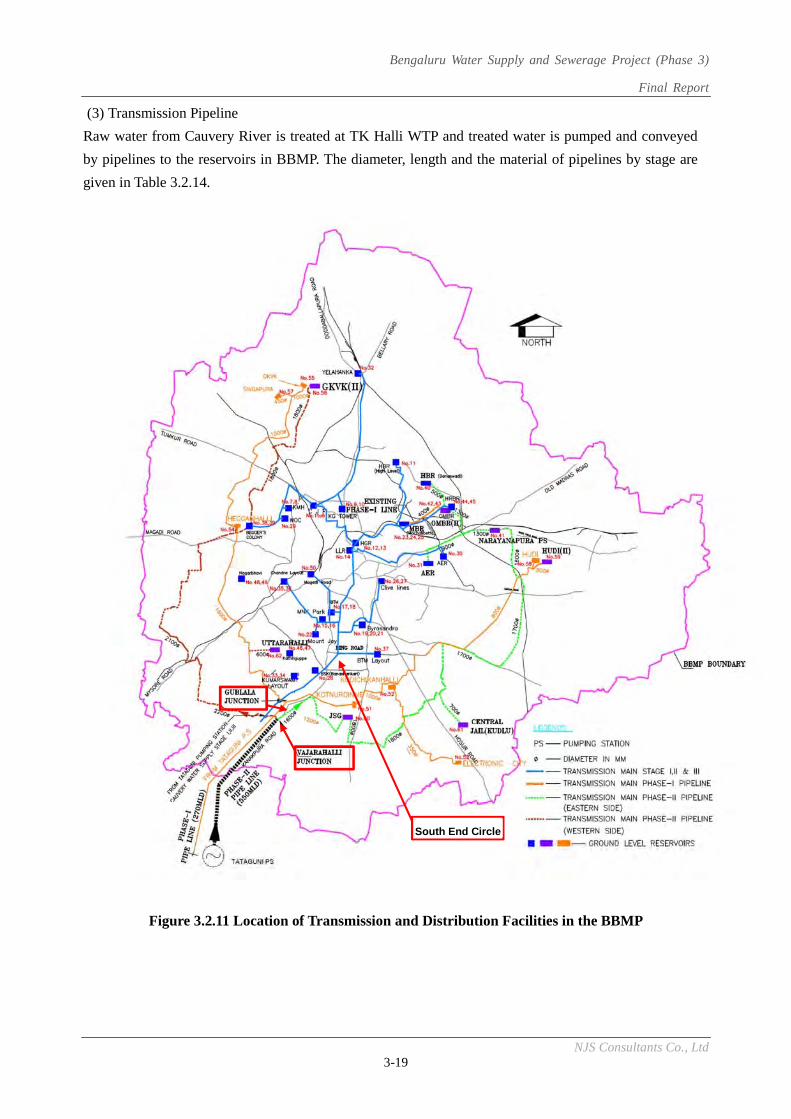
Bengaluru Water Supply and Sewerage Project (Phase 3)
Final Report
NJS Consultants Co., Ltd 3-19
(3) Transmission Pipeline
Raw water from Cauvery River is treated at TK Halli WTP and treated water is pumped and conveyed
by pipelines to the reservoirs in BBMP. The diameter, length and the material of pipelines by stage are
given in Table 3.2.14.
Figure 3.2.11 Location of Transmission and Distribution Facilities in the BBMP
South End Circle
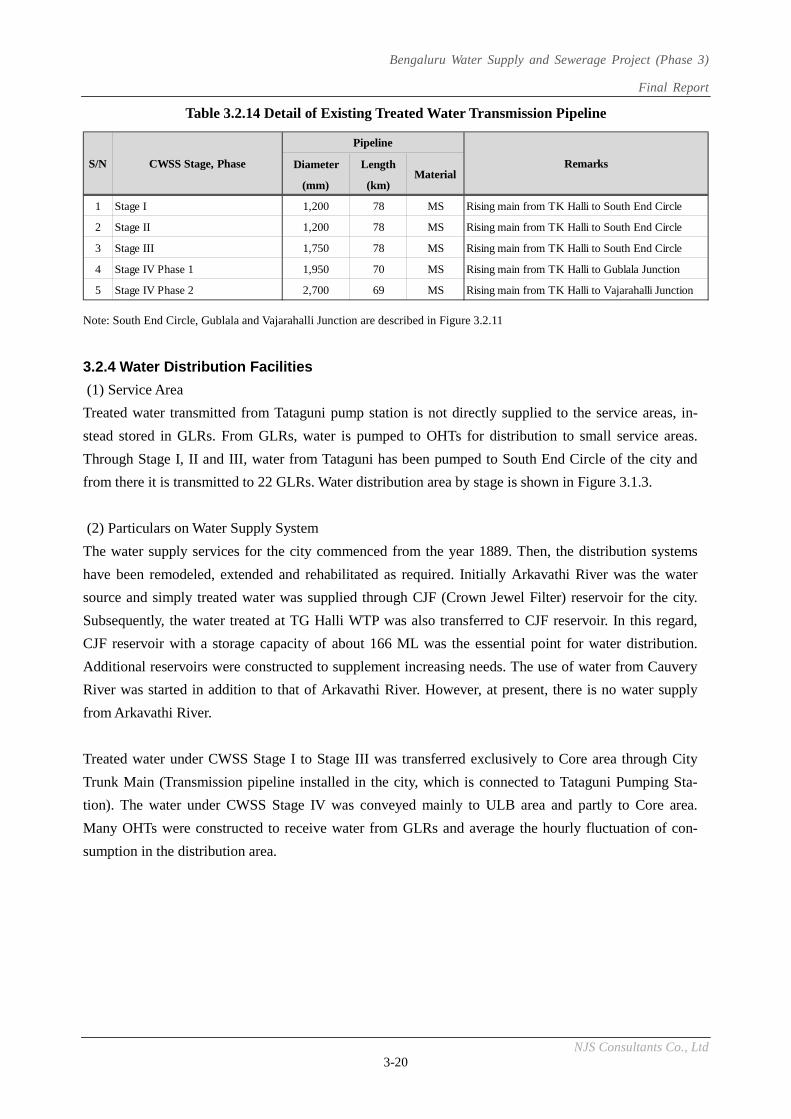
Bengaluru Water Supply and Sewerage Project (Phase 3)
Final Report
NJS Consultants Co., Ltd 3-20
Table 3.2.14 Detail of Existing Treated Water Transmission Pipeline
Note: South End Circle, Gublala and Vajarahalli Junction are described in Figure 3.2.11
3.2.4 Water Distribution Facilities
(1) Service Area
Treated water transmitted from Tataguni pump station is not directly supplied to the service areas, in-
stead stored in GLRs. From GLRs, water is pumped to OHTs for distribution to small service areas.
Through Stage I, II and III, water from Tataguni has been pumped to South End Circle of the city and
from there it is transmitted to 22 GLRs. Water distribution area by stage is shown in Figure 3.1.3.
(2) Particulars on Water Supply System
The water supply services for the city commenced from the year 1889. Then, the distribution systems
have been remodeled, extended and rehabilitated as required. Initially Arkavathi River was the water
source and simply treated water was supplied through CJF (Crown Jewel Filter) reservoir for the city.
Subsequently, the water treated at TG Halli WTP was also transferred to CJF reservoir. In this regard,
CJF reservoir with a storage capacity of about 166 ML was the essential point for water distribution.
Additional reservoirs were constructed to supplement increasing needs. The use of water from Cauvery
River was started in addition to that of Arkavathi River. However, at present, there is no water supply
from Arkavathi River.
Treated water under CWSS Stage I to Stage III was transferred exclusively to Core area through City
Trunk Main (Transmission pipeline installed in the city, which is connected to Tataguni Pumping Sta-
tion). The water under CWSS Stage IV was conveyed mainly to ULB area and partly to Core area.
Many OHTs were constructed to receive water from GLRs and average the hourly fluctuation of con-
sumption in the distribution area.
Diameter Length
(mm) (km)
1 Stage I 1,200 78 MS Rising main from TK Halli to South End Circle
2 Stage II 1,200 78 MS Rising main from TK Halli to South End Circle
3 Stage III 1,750 78 MS Rising main from TK Halli to South End Circle
4 Stage IV Phase 1 1,950 70 MS Rising main from TK Halli to Gublala Junction
5 Stage IV Phase 2 2,700 69 MS Rising main from TK Halli to Vajarahalli Junction
S/N CWSS Stage, Phase
Pipeline
RemarksMaterial
Bengaluru Water Supply and Sewerage Project (Phase 3)
Final Report
NJS Consultants Co., Ltd 3-21
(3) Existing Allocation System of Water Source to Servicing GLR
Under historical expansion of water supply systems in Core area, it is necessary to distribute water ef-
fectively through GLRs constructed in different stages. In this connection, areas served by each GLR are
identified with served population and supply amount in this study (on-going M/P (Master Plan) also re-
fers to this information).
Future distribution plan shall be prepared for the Core area considering existing GLR condi-
tions/limitations on storage capacities and distribution networks in full use of limited available water.
The following are relevant information collected in this study.
Treated water in each stage/phase of CWSS is being transmitted through City Trunk Main to GLRs con-
structed under corresponding Stage/Phase. After CWSS Stage III, however, part of transmitted treated
water is distributed to the GLR constructed in previous stage/phase. Some old reservoirs, like CJF, pre-
viously fed by Arkavathi River are now being supplied with the water under CWSS. Schematic water
flow to main GLR by stage is shown in Figure 3.2.13.
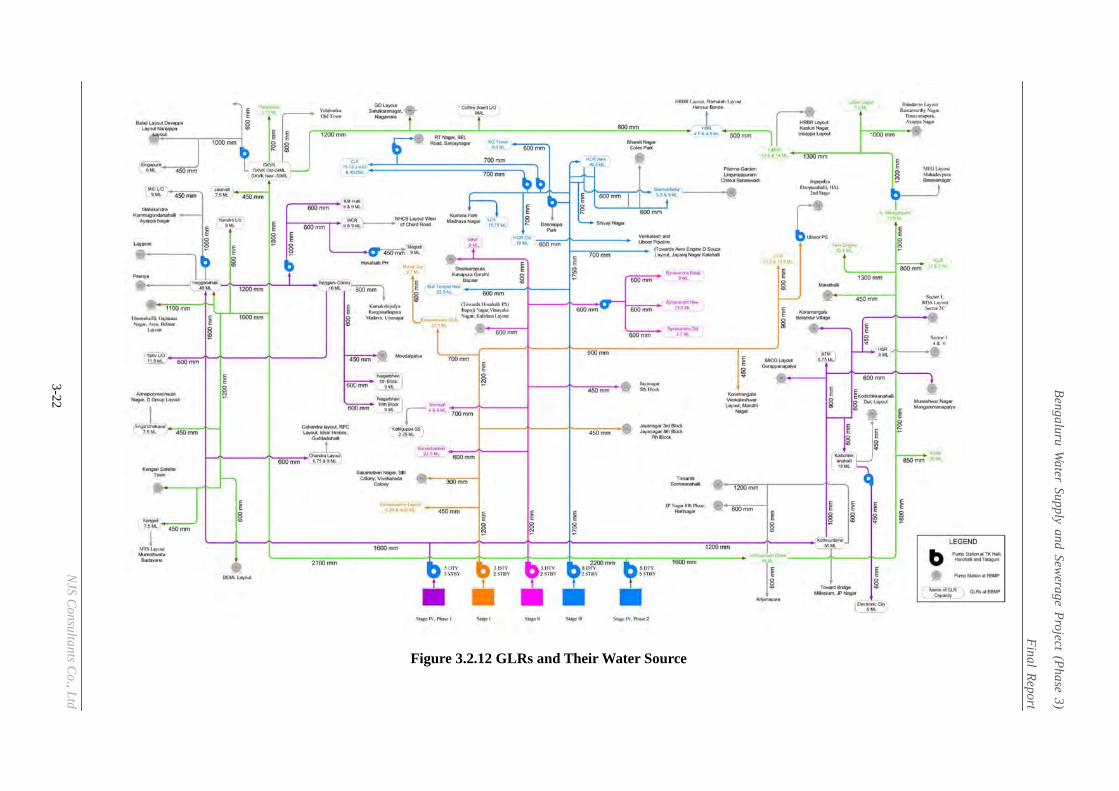
Bengaluru Water Supply and Sewerage Project (Phase 3)
Final Report
NJS Consultants Co., Ltd 3-22
Figure 3.2.12 GLRs and Their Water Source
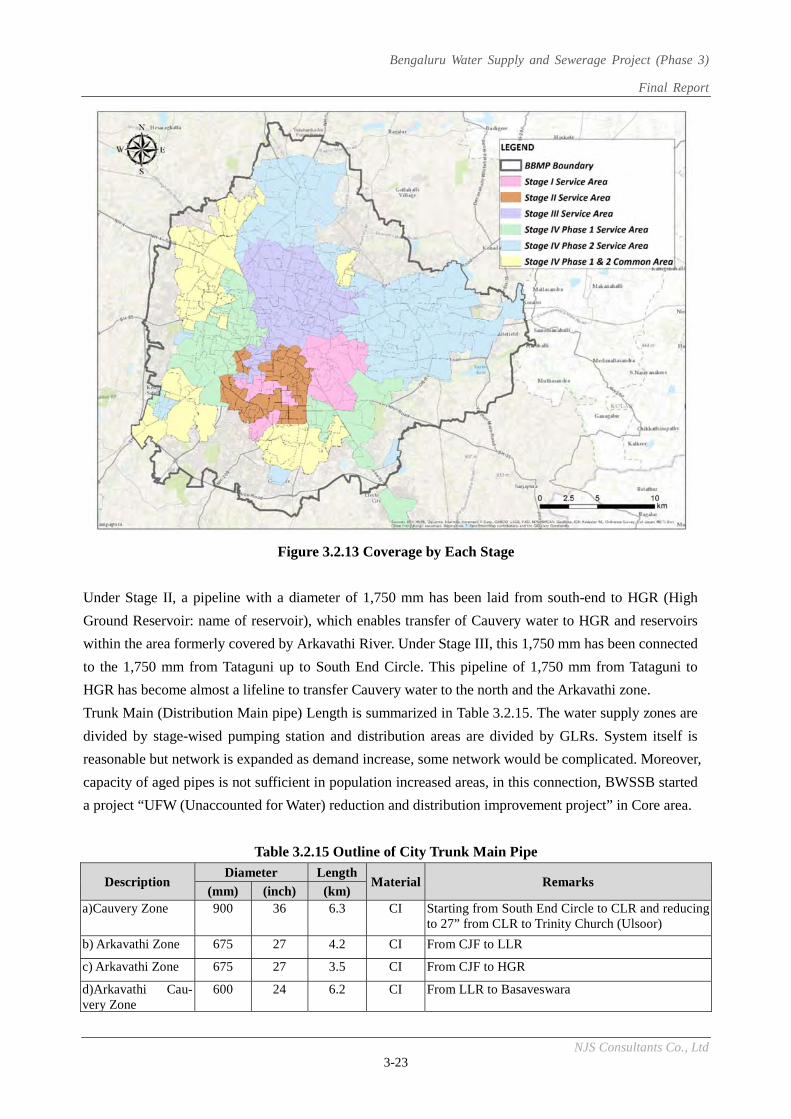
Bengaluru Water Supply and Sewerage Project (Phase 3)
Final Report
NJS Consultants Co., Ltd 3-23
Figure 3.2.13 Coverage by Each Stage
Under Stage II, a pipeline with a diameter of 1,750 mm has been laid from south-end to HGR (High
Ground Reservoir: name of reservoir), which enables transfer of Cauvery water to HGR and reservoirs
within the area formerly covered by Arkavathi River. Under Stage III, this 1,750 mm has been connected
to the 1,750 mm from Tataguni up to South End Circle. This pipeline of 1,750 mm from Tataguni to
HGR has become almost a lifeline to transfer Cauvery water to the north and the Arkavathi zone.
Trunk Main (Distribution Main pipe) Length is summarized in Table 3.2.15. The water supply zones are
divided by stage-wised pumping station and distribution areas are divided by GLRs. System itself is
reasonable but network is expanded as demand increase, some network would be complicated. Moreover,
capacity of aged pipes is not sufficient in population increased areas, in this connection, BWSSB started
a project “UFW (Unaccounted for Water) reduction and distribution improvement project” in Core area.
Table 3.2.15 Outline of City Trunk Main Pipe
Description Diameter Length
Material Remarks (mm) (inch) (km)
a)Cauvery Zone 900 36 6.3 CI Starting from South End Circle to CLR and reducing to 27” from CLR to Trinity Church (Ulsoor)
b) Arkavathi Zone 675 27 4.2 CI From CJF to LLR
c) Arkavathi Zone 675 27 3.5 CI From CJF to HGR
d)Arkavathi Cau-very Zone
600 24 6.2 CI From LLR to Basaveswara
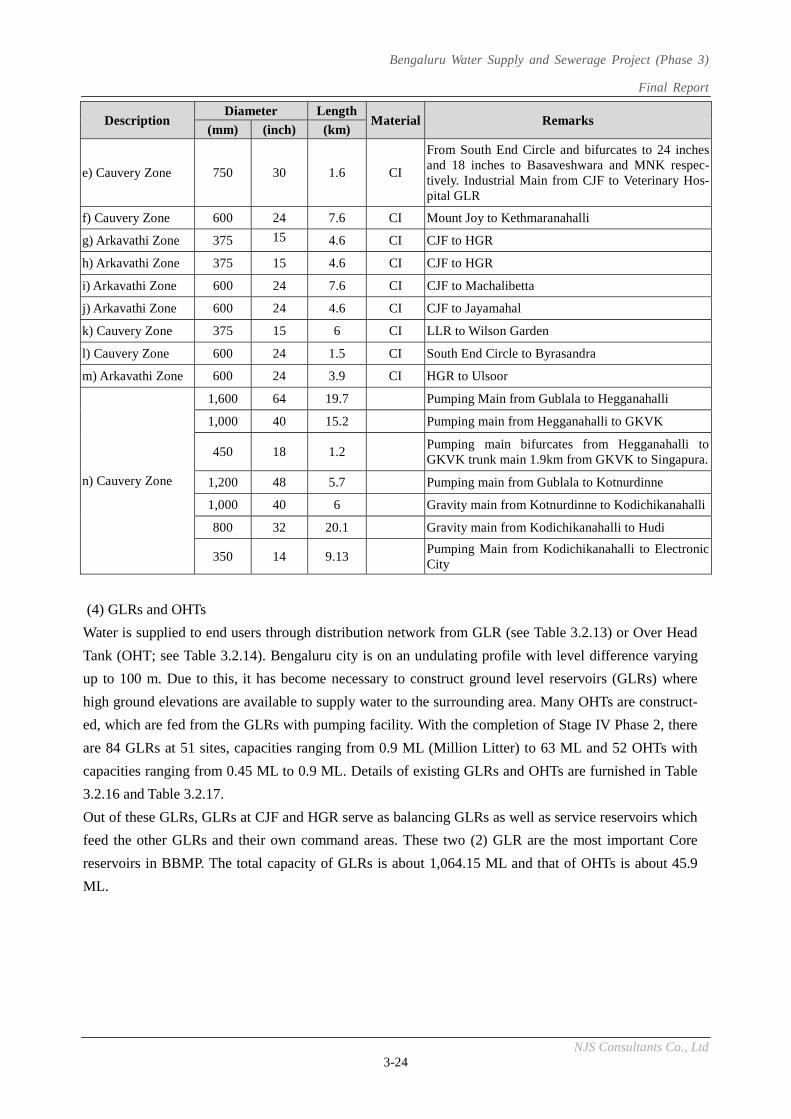
Bengaluru Water Supply and Sewerage Project (Phase 3)
Final Report
NJS Consultants Co., Ltd 3-24
Description Diameter Length
Material Remarks (mm) (inch) (km)
e) Cauvery Zone 750 30 1.6 CI
From South End Circle and bifurcates to 24 inches and 18 inches to Basaveshwara and MNK respec-tively. Industrial Main from CJF to Veterinary Hos-pital GLR
f) Cauvery Zone 600 24 7.6 CI Mount Joy to Kethmaranahalli
g) Arkavathi Zone 375 15 4.6 CI CJF to HGR
h) Arkavathi Zone 375 15 4.6 CI CJF to HGR
i) Arkavathi Zone 600 24 7.6 CI CJF to Machalibetta
j) Arkavathi Zone 600 24 4.6 CI CJF to Jayamahal
k) Cauvery Zone 375 15 6 CI LLR to Wilson Garden
l) Cauvery Zone 600 24 1.5 CI South End Circle to Byrasandra
m) Arkavathi Zone 600 24 3.9 CI HGR to Ulsoor
n) Cauvery Zone
1,600 64 19.7 Pumping Main from Gublala to Hegganahalli
1,000 40 15.2 Pumping main from Hegganahalli to GKVK
450 18 1.2 Pumping main bifurcates from Hegganahalli to GKVK trunk main 1.9km from GKVK to Singapura.
1,200 48 5.7 Pumping main from Gublala to Kotnurdinne
1,000 40 6 Gravity main from Kotnurdinne to Kodichikanahalli
800 32 20.1 Gravity main from Kodichikanahalli to Hudi
350 14 9.13 Pumping Main from Kodichikanahalli to Electronic City
(4) GLRs and OHTs
Water is supplied to end users through distribution network from GLR (see Table 3.2.13) or Over Head
Tank (OHT; see Table 3.2.14). Bengaluru city is on an undulating profile with level difference varying
up to 100 m. Due to this, it has become necessary to construct ground level reservoirs (GLRs) where
high ground elevations are available to supply water to the surrounding area. Many OHTs are construct-
ed, which are fed from the GLRs with pumping facility. With the completion of Stage IV Phase 2, there
are 84 GLRs at 51 sites, capacities ranging from 0.9 ML (Million Litter) to 63 ML and 52 OHTs with
capacities ranging from 0.45 ML to 0.9 ML. Details of existing GLRs and OHTs are furnished in Table
3.2.16 and Table 3.2.17.
Out of these GLRs, GLRs at CJF and HGR serve as balancing GLRs as well as service reservoirs which
feed the other GLRs and their own command areas. These two (2) GLR are the most important Core
reservoirs in BBMP. The total capacity of GLRs is about 1,064.15 ML and that of OHTs is about 45.9
ML.
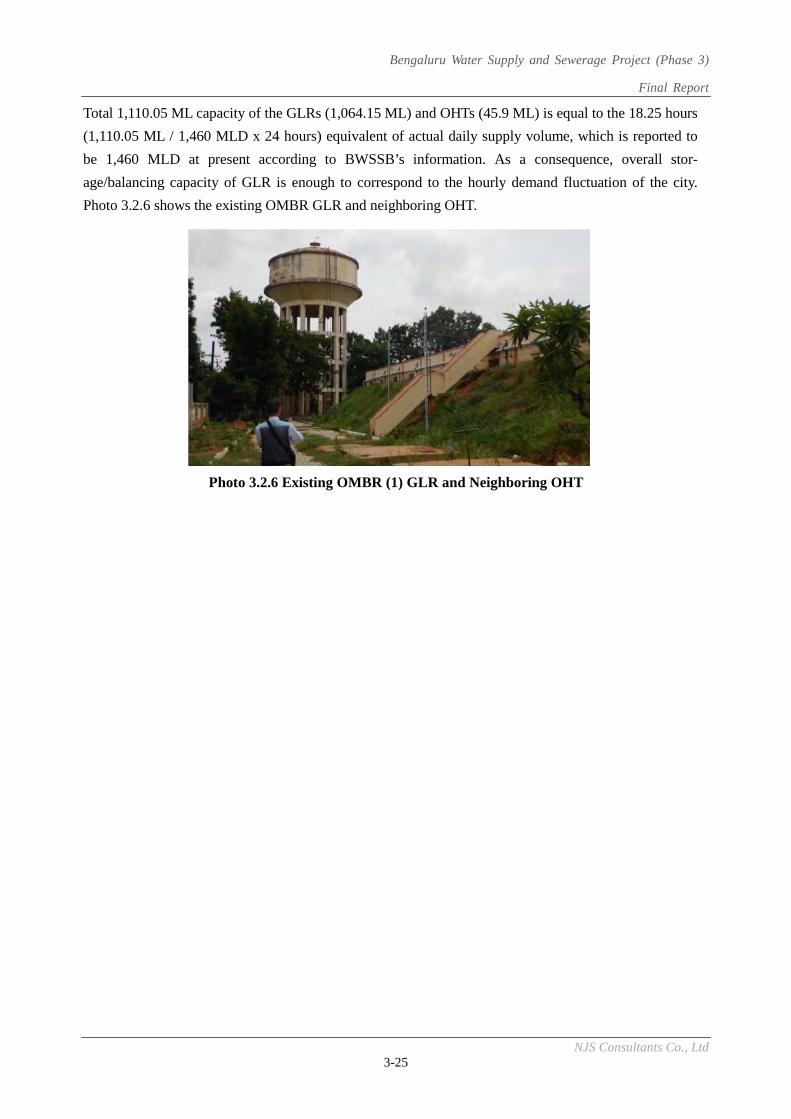
Bengaluru Water Supply and Sewerage Project (Phase 3)
Final Report
NJS Consultants Co., Ltd 3-25
Total 1,110.05 ML capacity of the GLRs (1,064.15 ML) and OHTs (45.9 ML) is equal to the 18.25 hours
(1,110.05 ML / 1,460 MLD x 24 hours) equivalent of actual daily supply volume, which is reported to
be 1,460 MLD at present according to BWSSB’s information. As a consequence, overall stor-
age/balancing capacity of GLR is enough to correspond to the hourly demand fluctuation of the city.
Photo 3.2.6 shows the existing OMBR GLR and neighboring OHT.
Photo 3.2.6 Existing OMBR (1) GLR and Neighboring OHT
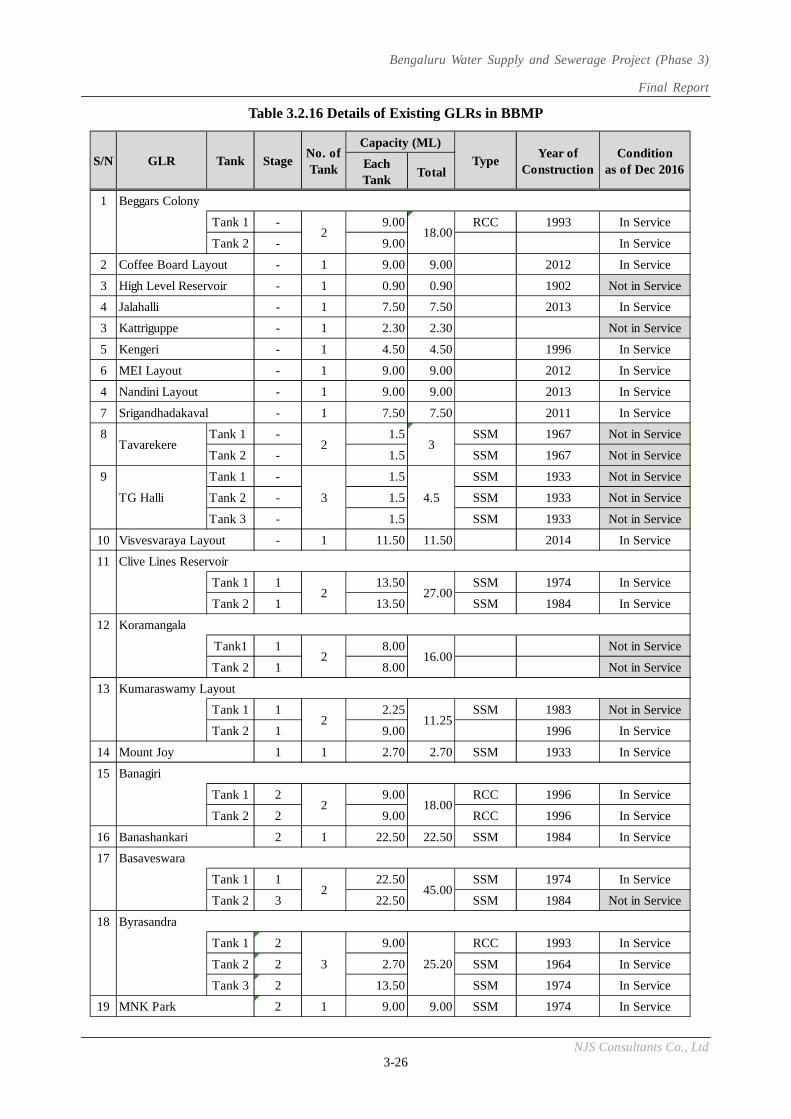
Bengaluru Water Supply and Sewerage Project (Phase 3)
Final Report
NJS Consultants Co., Ltd 3-26
Table 3.2.16 Details of Existing GLRs in BBMP
EachTank
Total
1 Beggars Colony
Tank 1 - 9.00 RCC 1993 In Service
Tank 2 - 9.00 In Service
2 Coffee Board Layout - 1 9.00 9.00 2012 In Service
3 High Level Reservoir - 1 0.90 0.90 1902 Not in Service
4 Jalahalli - 1 7.50 7.50 2013 In Service
3 Kattriguppe - 1 2.30 2.30 Not in Service
5 Kengeri - 1 4.50 4.50 1996 In Service
6 MEI Layout - 1 9.00 9.00 2012 In Service
4 Nandini Layout - 1 9.00 9.00 2013 In Service
7 Srigandhadakaval - 1 7.50 7.50 2011 In Service
8 Tank 1 - 1.5 SSM 1967 Not in Service
Tank 2 - 1.5 SSM 1967 Not in Service
9 Tank 1 - 1.5 SSM 1933 Not in Service
Tank 2 - 1.5 SSM 1933 Not in Service
Tank 3 - 1.5 SSM 1933 Not in Service
10 Visvesvaraya Layout - 1 11.50 11.50 2014 In Service
11 Clive Lines Reservoir
Tank 1 1 13.50 SSM 1974 In Service
Tank 2 1 13.50 SSM 1984 In Service
12 Koramangala
Tank1 1 8.00 Not in Service
Tank 2 1 8.00 Not in Service
13 Kumaraswamy Layout
Tank 1 1 2.25 SSM 1983 Not in Service
Tank 2 1 9.00 1996 In Service
14 Mount Joy 1 1 2.70 2.70 SSM 1933 In Service
15 Banagiri
Tank 1 2 9.00 RCC 1996 In Service
Tank 2 2 9.00 RCC 1996 In Service
16 Banashankari 2 1 22.50 22.50 SSM 1984 In Service
17 Basaveswara
Tank 1 1 22.50 SSM 1974 In Service
Tank 2 3 22.50 SSM 1984 Not in Service
18 Byrasandra
Tank 1 2 9.00 RCC 1993 In Service
Tank 2 2 2.70 SSM 1964 In Service
Tank 3 2 13.50 SSM 1974 In Service
19 MNK Park 2 1 9.00 9.00 SSM 1974 In Service
2
45.002
3 4.5
2
3
18.00
16.00
11.25
3
TG Halli
Tavarekere
S/N TankGLR Stage
2
25.20
27.002
18.002
2
Conditionas of Dec 2016
Year ofConstruction
Type
Capacity (ML)No. ofTank
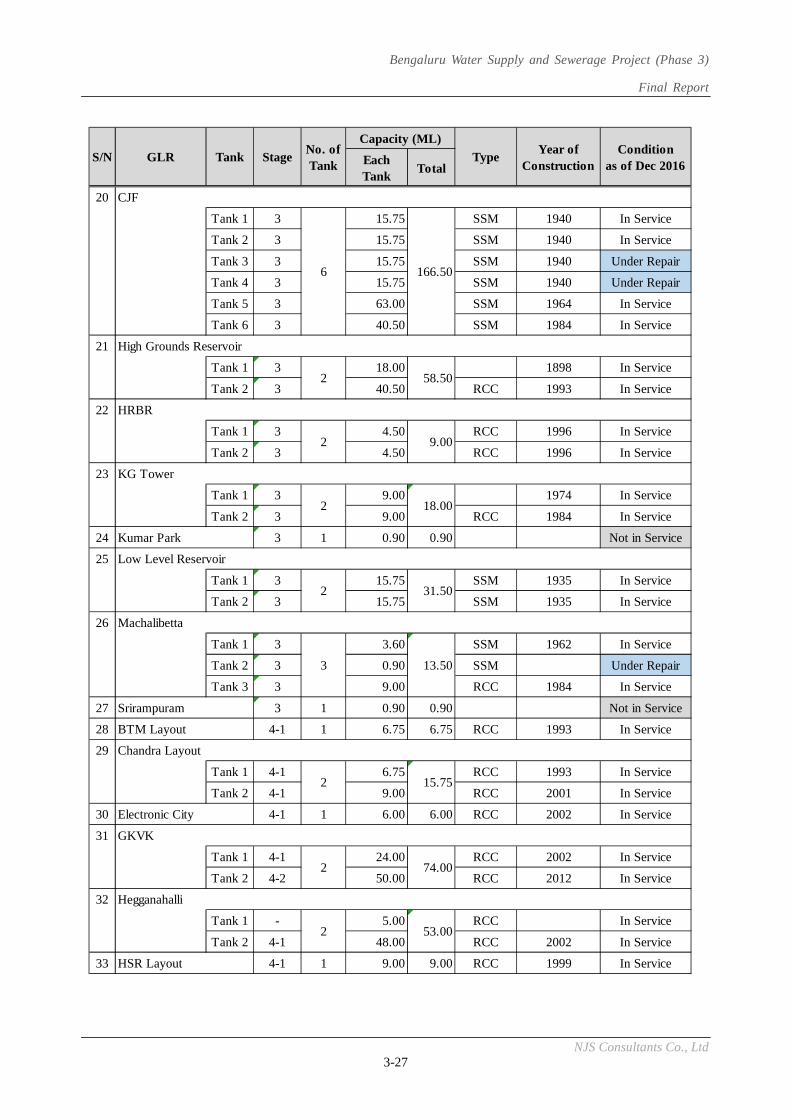
Bengaluru Water Supply and Sewerage Project (Phase 3)
Final Report
NJS Consultants Co., Ltd 3-27
EachTank
Total
20 CJF
Tank 1 3 15.75 SSM 1940 In Service
Tank 2 3 15.75 SSM 1940 In Service
Tank 3 3 15.75 SSM 1940 Under Repair
Tank 4 3 15.75 SSM 1940 Under Repair
Tank 5 3 63.00 SSM 1964 In Service
Tank 6 3 40.50 SSM 1984 In Service
21 High Grounds Reservoir
Tank 1 3 18.00 1898 In Service
Tank 2 3 40.50 RCC 1993 In Service
22 HRBR
Tank 1 3 4.50 RCC 1996 In Service
Tank 2 3 4.50 RCC 1996 In Service
23 KG Tower
Tank 1 3 9.00 1974 In Service
Tank 2 3 9.00 RCC 1984 In Service
24 Kumar Park 3 1 0.90 0.90 Not in Service
25
Tank 1 3 15.75 SSM 1935 In Service
Tank 2 3 15.75 SSM 1935 In Service
26 Machalibetta
Tank 1 3 3.60 SSM 1962 In Service
Tank 2 3 0.90 SSM Under Repair
Tank 3 3 9.00 RCC 1984 In Service
27 Srirampuram 3 1 0.90 0.90 Not in Service
28 BTM Layout 4-1 1 6.75 6.75 RCC 1993 In Service
29 Chandra Layout
Tank 1 4-1 6.75 RCC 1993 In Service
Tank 2 4-1 9.00 RCC 2001 In Service
30 Electronic City 4-1 1 6.00 6.00 RCC 2002 In Service
31 GKVK
Tank 1 4-1 24.00 RCC 2002 In Service
Tank 2 4-2 50.00 RCC 2012 In Service
32 Hegganahalli
Tank 1 - 5.00 RCC In Service
Tank 2 4-1 48.00 RCC 2002 In Service
33 HSR Layout 4-1 1 9.00 9.00 RCC 1999 In Service
6 166.50
2 18.00
2 58.50
13.50
2
9.002
2
3
2 74.00
31.50
2 53.00
15.75
S/N
Low Level Reservoir
TankGLR StageCondition
as of Dec 2016Year of
ConstructionType
Capacity (ML)No. ofTank
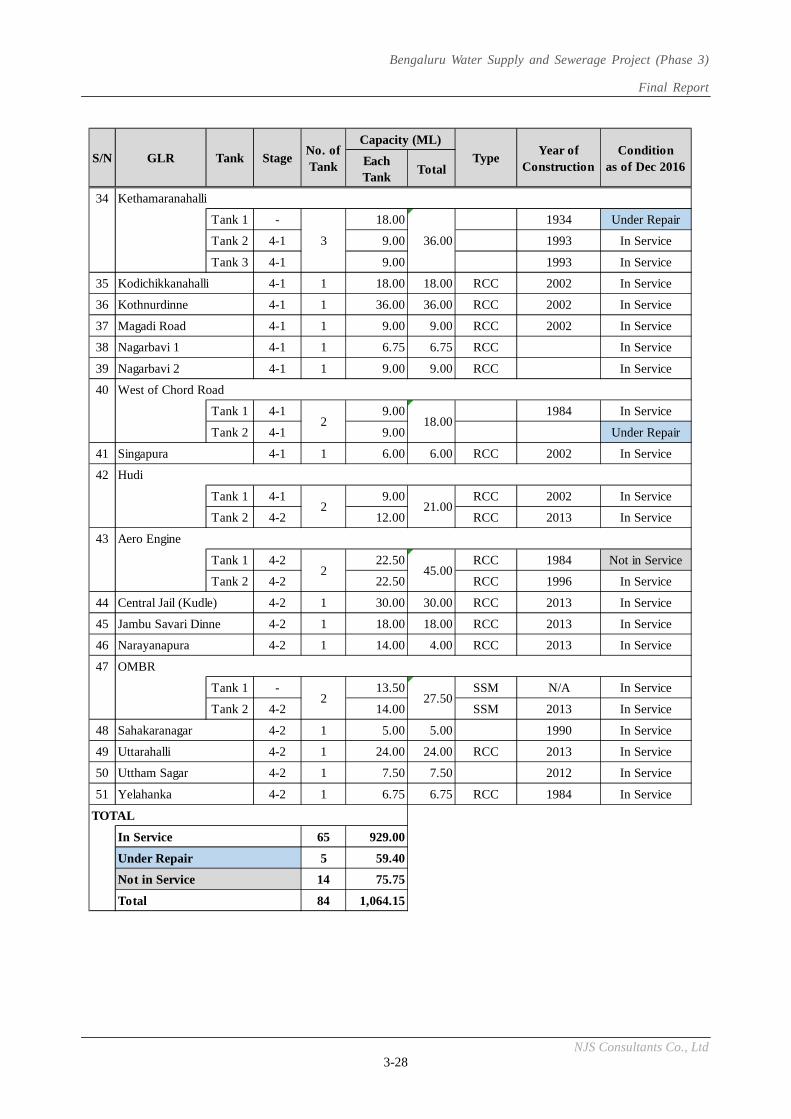
Bengaluru Water Supply and Sewerage Project (Phase 3)
Final Report
NJS Consultants Co., Ltd 3-28
EachTank
Total
34 Kethamaranahalli
Tank 1 - 18.00 1934 Under Repair
Tank 2 4-1 9.00 1993 In Service
Tank 3 4-1 9.00 1993 In Service
35 Kodichikkanahalli 4-1 1 18.00 18.00 RCC 2002 In Service
36 Kothnurdinne 4-1 1 36.00 36.00 RCC 2002 In Service
37 Magadi Road 4-1 1 9.00 9.00 RCC 2002 In Service
38 Nagarbavi 1 4-1 1 6.75 6.75 RCC In Service
39 Nagarbavi 2 4-1 1 9.00 9.00 RCC In Service
40 West of Chord Road
Tank 1 4-1 9.00 Precast 1984 In Service
Tank 2 4-1 9.00 Under Repair
41 Singapura 4-1 1 6.00 6.00 RCC 2002 In Service
42 Hudi
Tank 1 4-1 9.00 RCC 2002 In Service
Tank 2 4-2 12.00 RCC 2013 In Service
43 Aero Engine
Tank 1 4-2 22.50 RCC 1984 Not in Service
Tank 2 4-2 22.50 RCC 1996 In Service
44 Central Jail (Kudle) 4-2 1 30.00 30.00 RCC 2013 In Service
45 Jambu Savari Dinne 4-2 1 18.00 18.00 RCC 2013 In Service
46 Narayanapura 4-2 1 14.00 4.00 RCC 2013 In Service
47 OMBR
Tank 1 - 13.50 SSM N/A In Service
Tank 2 4-2 14.00 SSM 2013 In Service
48 Sahakaranagar 4-2 1 5.00 5.00 1990 In Service
49 Uttarahalli 4-2 1 24.00 24.00 RCC 2013 In Service
50 Uttham Sagar 4-2 1 7.50 7.50 2012 In Service
51 Yelahanka 4-2 1 6.75 6.75 RCC 1984 In Service
TOTAL
In Service 65 929.00
Under Repair 5 59.40
Not in Service 14 75.75
Total 84 1,064.15
2
3 36.00
27.502
18.00
45.00
2
2 21.00
S/N TankGLR StageCondition
as of Dec 2016Year of
ConstructionType
Capacity (ML)No. ofTank
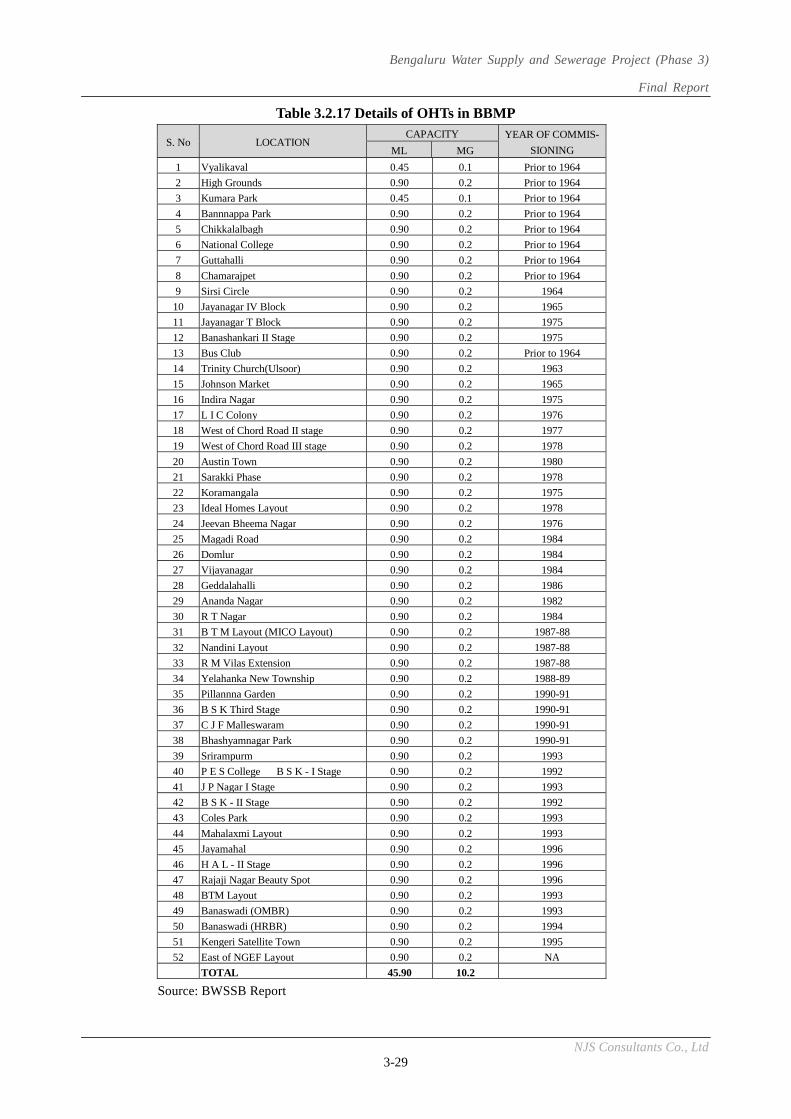
Bengaluru Water Supply and Sewerage Project (Phase 3)
Final Report
NJS Consultants Co., Ltd 3-29
Table 3.2.17 Details of OHTs in BBMP
S. No LOCATION CAPACITY YEAR OF COMMIS-
SIONING ML MG
1 Vyalikaval 0.45 0.1 Prior to 1964
2 High Grounds 0.90 0.2 Prior to 1964
3 Kumara Park 0.45 0.1 Prior to 1964
4 Bannnappa Park 0.90 0.2 Prior to 1964
5 Chikkalalbagh 0.90 0.2 Prior to 1964
6 National College 0.90 0.2 Prior to 1964
7 Guttahalli 0.90 0.2 Prior to 1964
8 Chamarajpet 0.90 0.2 Prior to 1964
9 Sirsi Circle 0.90 0.2 1964
10 Jayanagar IV Block 0.90 0.2 1965
11 Jayanagar T Block 0.90 0.2 1975
12 Banashankari II Stage 0.90 0.2 1975
13 Bus Club 0.90 0.2 Prior to 1964
14 Trinity Church(Ulsoor) 0.90 0.2 1963
15 Johnson Market 0.90 0.2 1965
16 Indira Nagar 0.90 0.2 1975
17 L I C Colony 0.90 0.2 1976
18 West of Chord Road II stage 0.90 0.2 1977
19 West of Chord Road III stage 0.90 0.2 1978
20 Austin Town 0.90 0.2 1980
21 Sarakki Phase 0.90 0.2 1978
22 Koramangala 0.90 0.2 1975
23 Ideal Homes Layout 0.90 0.2 1978
24 Jeevan Bheema Nagar 0.90 0.2 1976
25 Magadi Road 0.90 0.2 1984
26 Domlur 0.90 0.2 1984
27 Vijayanagar 0.90 0.2 1984
28 Geddalahalli 0.90 0.2 1986
29 Ananda Nagar 0.90 0.2 1982
30 R T Nagar 0.90 0.2 1984
31 B T M Layout (MICO Layout) 0.90 0.2 1987-88
32 Nandini Layout 0.90 0.2 1987-88
33 R M Vilas Extension 0.90 0.2 1987-88
34 Yelahanka New Township 0.90 0.2 1988-89
35 Pillannna Garden 0.90 0.2 1990-91
36 B S K Third Stage 0.90 0.2 1990-91
37 C J F Malleswaram 0.90 0.2 1990-91
38 Bhashyamnagar Park 0.90 0.2 1990-91
39 Srirampurm 0.90 0.2 1993
40 P E S College B S K - I Stage 0.90 0.2 1992
41 J P Nagar I Stage 0.90 0.2 1993
42 B S K - II Stage 0.90 0.2 1992
43 Coles Park 0.90 0.2 1993
44 Mahalaxmi Layout 0.90 0.2 1993
45 Jayamahal 0.90 0.2 1996
46 H A L - II Stage 0.90 0.2 1996
47 Rajaji Nagar Beauty Spot 0.90 0.2 1996
48 BTM Layout 0.90 0.2 1993
49 Banaswadi (OMBR) 0.90 0.2 1993
50 Banaswadi (HRBR) 0.90 0.2 1994
51 Kengeri Satellite Town 0.90 0.2 1995
52 East of NGEF Layout 0.90 0.2 NA
TOTAL 45.90 10.2
Source: BWSSB Report
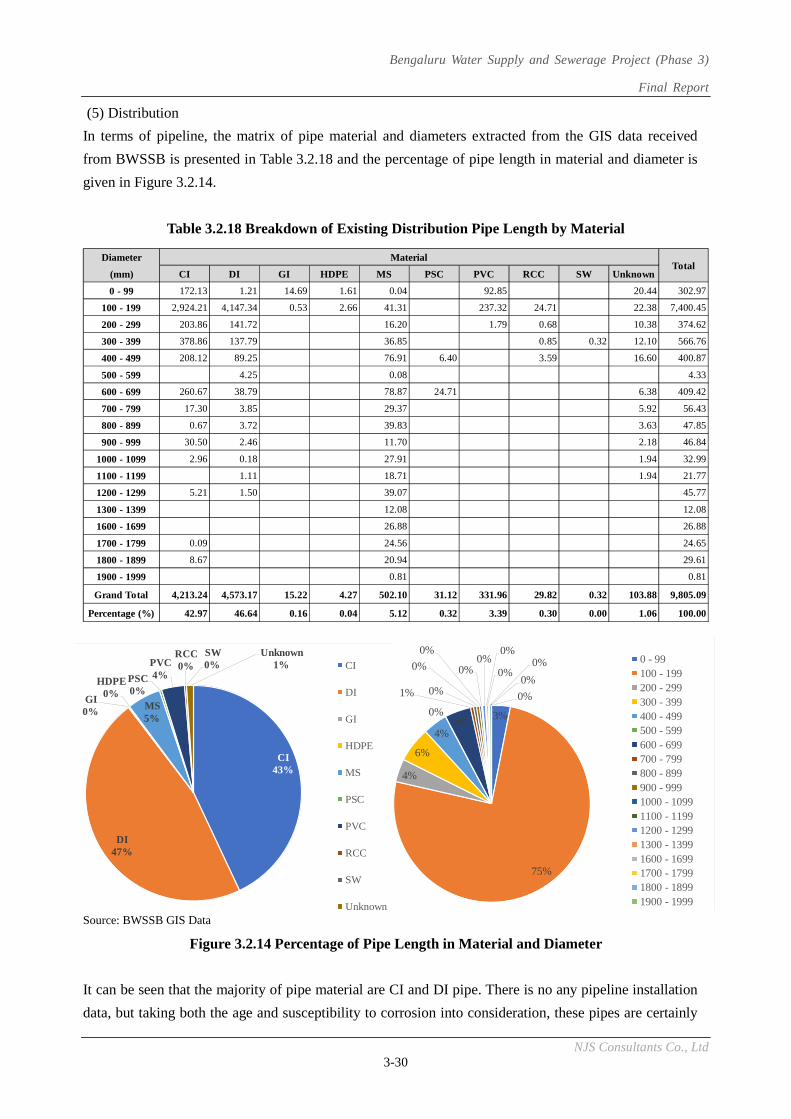
Bengaluru Water Supply and Sewerage Project (Phase 3)
Final Report
NJS Consultants Co., Ltd 3-30
(5) Distribution
In terms of pipeline, the matrix of pipe material and diameters extracted from the GIS data received
from BWSSB is presented in Table 3.2.18 and the percentage of pipe length in material and diameter is
given in Figure 3.2.14.
Table 3.2.18 Breakdown of Existing Distribution Pipe Length by Material
Source: BWSSB GIS Data
Figure 3.2.14 Percentage of Pipe Length in Material and Diameter
It can be seen that the majority of pipe material are CI and DI pipe. There is no any pipeline installation
data, but taking both the age and susceptibility to corrosion into consideration, these pipes are certainly
Diameter
(mm) CI DI GI HDPE MS PSC PVC RCC SW Unknown
0 - 99 172.13 1.21 14.69 1.61 0.04 92.85 20.44 302.97
100 - 199 2,924.21 4,147.34 0.53 2.66 41.31 237.32 24.71 22.38 7,400.45
200 - 299 203.86 141.72 16.20 1.79 0.68 10.38 374.62
300 - 399 378.86 137.79 36.85 0.85 0.32 12.10 566.76
400 - 499 208.12 89.25 76.91 6.40 3.59 16.60 400.87
500 - 599 4.25 0.08 4.33
600 - 699 260.67 38.79 78.87 24.71 6.38 409.42
700 - 799 17.30 3.85 29.37 5.92 56.43
800 - 899 0.67 3.72 39.83 3.63 47.85
900 - 999 30.50 2.46 11.70 2.18 46.84
1000 - 1099 2.96 0.18 27.91 1.94 32.99
1100 - 1199 1.11 18.71 1.94 21.77
1200 - 1299 5.21 1.50 39.07 45.77
1300 - 1399 12.08 12.08
1600 - 1699 26.88 26.88
1700 - 1799 0.09 24.56 24.65
1800 - 1899 8.67 20.94 29.61
1900 - 1999 0.81 0.81
Grand Total 4,213.24 4,573.17 15.22 4.27 502.10 31.12 331.96 29.82 0.32 103.88 9,805.09
Percentage (%) 42.97 46.64 0.16 0.04 5.12 0.32 3.39 0.30 0.00 1.06 100.00
TotalMaterial
3%
75%
4%
6%
4%
0%4%
1% 0%
0%
0%
0%0%
0%
0%0%
0%
0%
0 - 99100 - 199200 - 299300 - 399400 - 499500 - 599600 - 699700 - 799800 - 899900 - 9991000 - 10991100 - 11991200 - 12991300 - 13991600 - 16991700 - 17991800 - 18991900 - 1999
CI43%
DI47%
GI0%
HDPE0%
MS5%
PSC0%
PVC4%
RCC0%
SW0%
Unknown1% CI
DI
GI
HDPE
MS
PSC
PVC
RCC
SW
Unknown
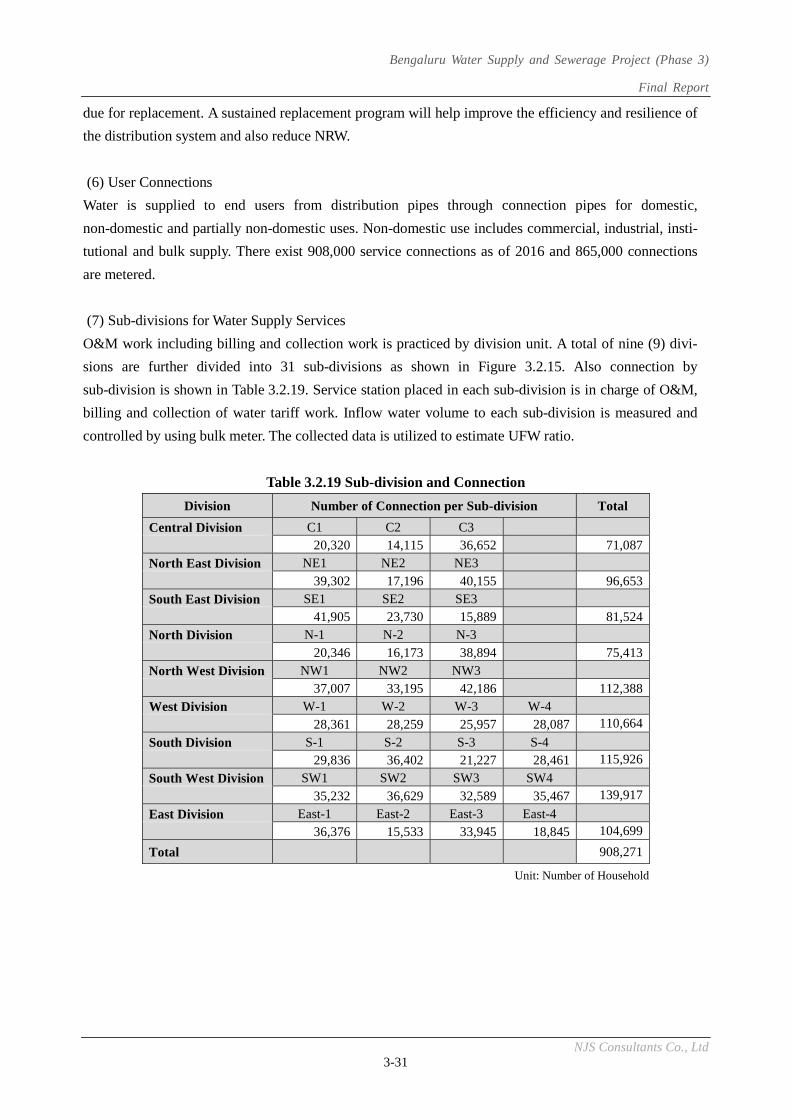
Bengaluru Water Supply and Sewerage Project (Phase 3)
Final Report
NJS Consultants Co., Ltd 3-31
due for replacement. A sustained replacement program will help improve the efficiency and resilience of
the distribution system and also reduce NRW.
(6) User Connections
Water is supplied to end users from distribution pipes through connection pipes for domestic,
non-domestic and partially non-domestic uses. Non-domestic use includes commercial, industrial, insti-
tutional and bulk supply. There exist 908,000 service connections as of 2016 and 865,000 connections
are metered.
(7) Sub-divisions for Water Supply Services
O&M work including billing and collection work is practiced by division unit. A total of nine (9) divi-
sions are further divided into 31 sub-divisions as shown in Figure 3.2.15. Also connection by
sub-division is shown in Table 3.2.19. Service station placed in each sub-division is in charge of O&M,
billing and collection of water tariff work. Inflow water volume to each sub-division is measured and
controlled by using bulk meter. The collected data is utilized to estimate UFW ratio.
Table 3.2.19 Sub-division and Connection
Division Number of Connection per Sub-division Total
Central Division C1 C2 C3
20,320 14,115 36,652 71,087North East Division NE1 NE2 NE3
39,302 17,196 40,155 96,653South East Division SE1 SE2 SE3
41,905 23,730 15,889 81,524North Division N-1 N-2 N-3
20,346 16,173 38,894 75,413North West Division NW1 NW2 NW3
37,007 33,195 42,186 112,388West Division W-1 W-2 W-3 W-4
28,361 28,259 25,957 28,087 110,664
South Division S-1 S-2 S-3 S-4
29,836 36,402 21,227 28,461 115,926
South West Division SW1 SW2 SW3 SW4
35,232 36,629 32,589 35,467 139,917
East Division East-1 East-2 East-3 East-4
36,376 15,533 33,945 18,845 104,699
Total 908,271
Unit: Number of Household
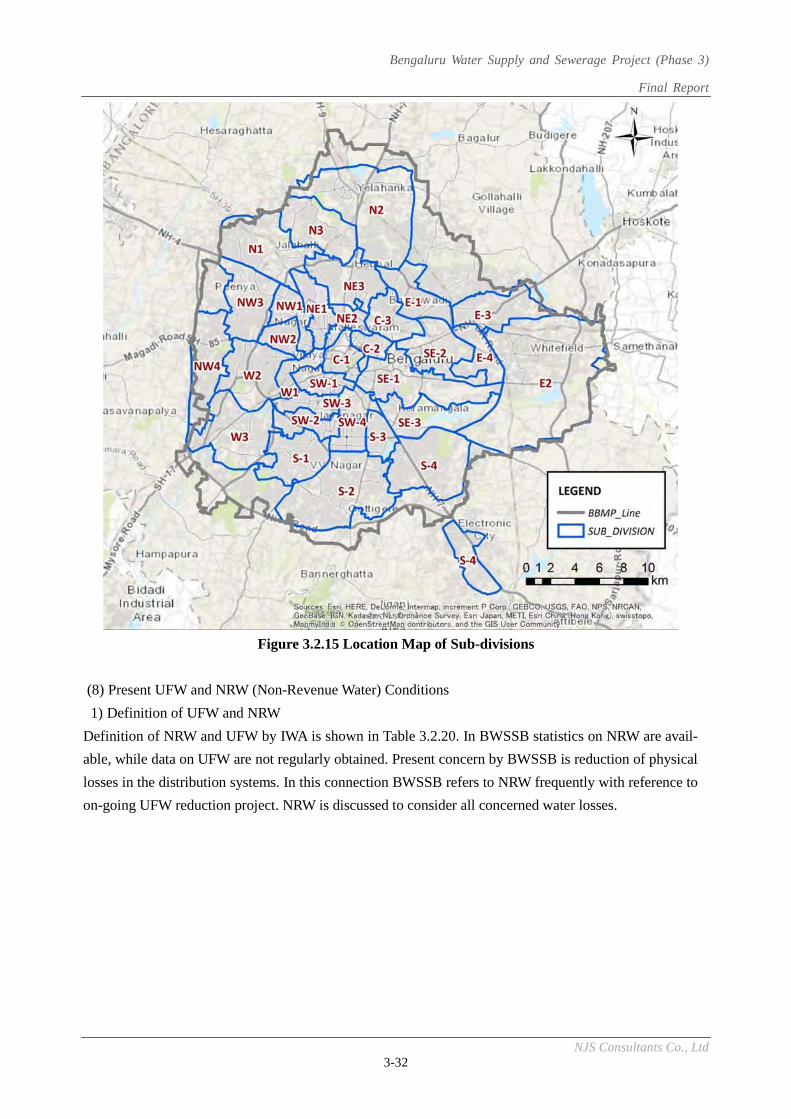
Bengaluru Water Supply and Sewerage Project (Phase 3)
Final Report
NJS Consultants Co., Ltd 3-32
Figure 3.2.15 Location Map of Sub-divisions
(8) Present UFW and NRW (Non-Revenue Water) Conditions
1) Definition of UFW and NRW
Definition of NRW and UFW by IWA is shown in Table 3.2.20. In BWSSB statistics on NRW are avail-
able, while data on UFW are not regularly obtained. Present concern by BWSSB is reduction of physical
losses in the distribution systems. In this connection BWSSB refers to NRW frequently with reference to
on-going UFW reduction project. NRW is discussed to consider all concerned water losses.
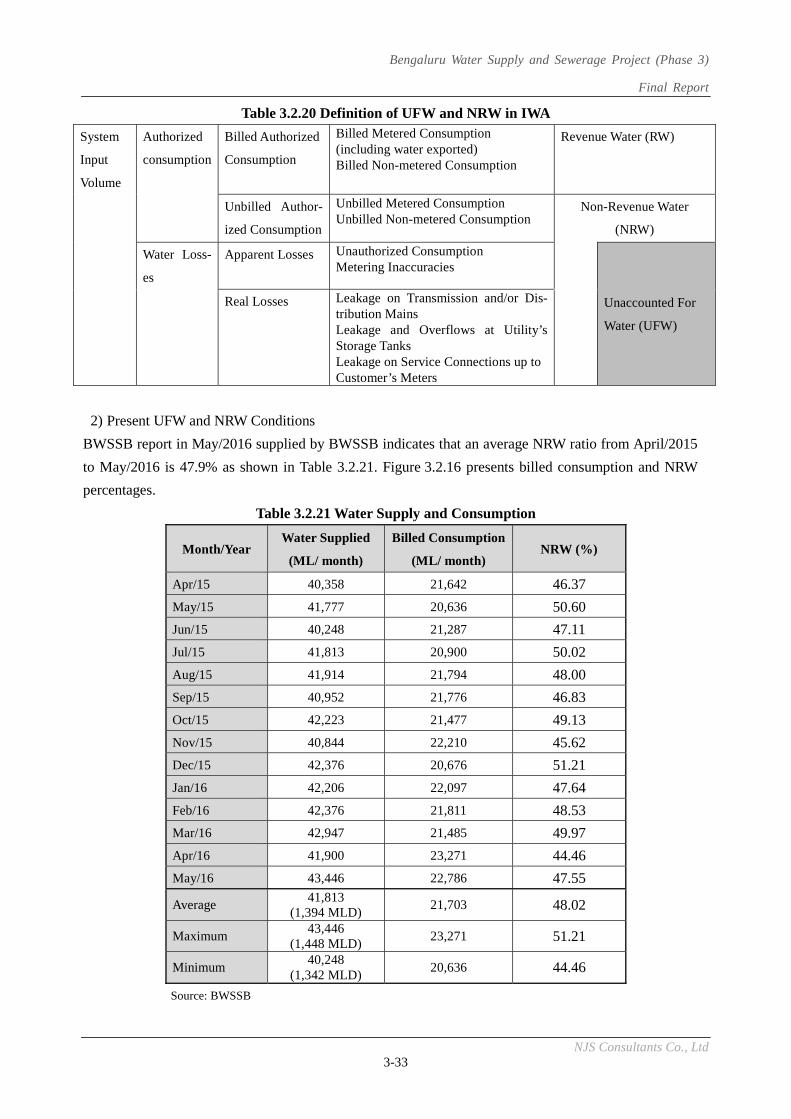
Bengaluru Water Supply and Sewerage Project (Phase 3)
Final Report
NJS Consultants Co., Ltd 3-33
Table 3.2.20 Definition of UFW and NRW in IWA
System
Input
Volume
Authorized
consumption
Billed Authorized
Consumption
Billed Metered Consumption (including water exported) Billed Non-metered Consumption
Revenue Water (RW)
Unbilled Author-
ized Consumption
Unbilled Metered Consumption Unbilled Non-metered Consumption
Non-Revenue Water
(NRW)
Water Loss-
es
Apparent Losses
Unauthorized Consumption Metering Inaccuracies
Unaccounted For
Water (UFW)
Real Losses Leakage on Transmission and/or Dis-tribution Mains Leakage and Overflows at Utility’s Storage Tanks Leakage on Service Connections up to Customer’s Meters
2) Present UFW and NRW Conditions
BWSSB report in May/2016 supplied by BWSSB indicates that an average NRW ratio from April/2015
to May/2016 is 47.9% as shown in Table 3.2.21. Figure 3.2.16 presents billed consumption and NRW
percentages.
Table 3.2.21 Water Supply and Consumption
Month/Year Water Supplied
(ML/ month)
Billed Consumption
(ML/ month) NRW (%)
Apr/15 40,358 21,642 46.37
May/15 41,777 20,636 50.60
Jun/15 40,248 21,287 47.11
Jul/15 41,813 20,900 50.02
Aug/15 41,914 21,794 48.00
Sep/15 40,952 21,776 46.83
Oct/15 42,223 21,477 49.13
Nov/15 40,844 22,210 45.62
Dec/15 42,376 20,676 51.21
Jan/16 42,206 22,097 47.64
Feb/16 42,376 21,811 48.53
Mar/16 42,947 21,485 49.97
Apr/16 41,900 23,271 44.46
May/16 43,446 22,786 47.55
Average 41,813
(1,394 MLD) 21,703 48.02
Maximum 43,446
(1,448 MLD) 23,271 51.21
Minimum 40,248
(1,342 MLD) 20,636 44.46
Source: BWSSB
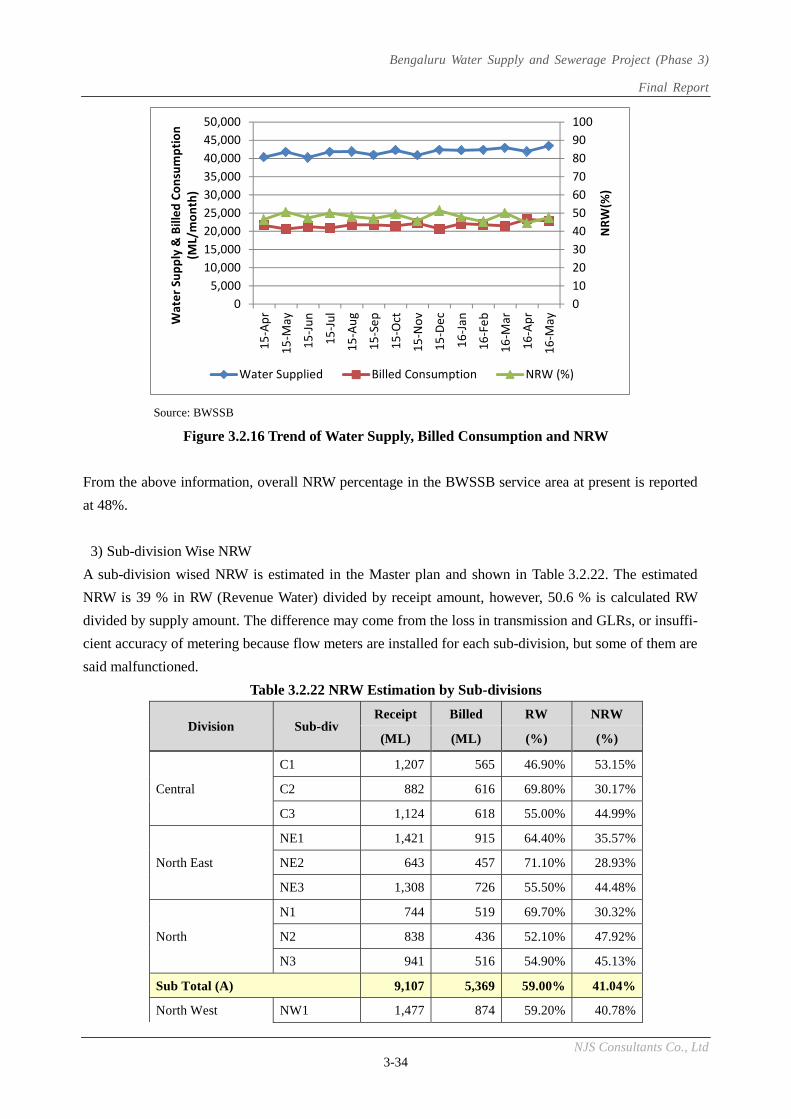
Bengaluru Water Supply and Sewerage Project (Phase 3)
Final Report
NJS Consultants Co., Ltd 3-34
Source: BWSSB
Figure 3.2.16 Trend of Water Supply, Billed Consumption and NRW
From the above information, overall NRW percentage in the BWSSB service area at present is reported
at 48%.
3) Sub-division Wise NRW
A sub-division wised NRW is estimated in the Master plan and shown in Table 3.2.22. The estimated
NRW is 39 % in RW (Revenue Water) divided by receipt amount, however, 50.6 % is calculated RW
divided by supply amount. The difference may come from the loss in transmission and GLRs, or insuffi-
cient accuracy of metering because flow meters are installed for each sub-division, but some of them are
said malfunctioned.
Table 3.2.22 NRW Estimation by Sub-divisions
Division Sub-div Receipt Billed RW NRW
(ML) (ML) (%) (%)
Central
C1 1,207 565 46.90% 53.15%
C2 882 616 69.80% 30.17%
C3 1,124 618 55.00% 44.99%
North East
NE1 1,421 915 64.40% 35.57%
NE2 643 457 71.10% 28.93%
NE3 1,308 726 55.50% 44.48%
North
N1 744 519 69.70% 30.32%
N2 838 436 52.10% 47.92%
N3 941 516 54.90% 45.13%
Sub Total (A) 9,107 5,369 59.00% 41.04%
North West NW1 1,477 874 59.20% 40.78%
0102030405060708090100
05,000
10,00015,00020,00025,00030,00035,00040,00045,00050,000
15-A
pr
15-M
ay
15-Ju
n
15-Ju
l
15-A
ug
15-S
ep
15-O
ct
15-N
ov
15-D
ec
16-Ja
n
16-F
eb
16-M
ar
16-A
pr
16-M
ay
NRW
(%)
Wat
er S
uppl
y &
Bill
ed C
onsu
mpt
ion
(ML/
mon
th)
Water Supplied Billed Consumption NRW (%)
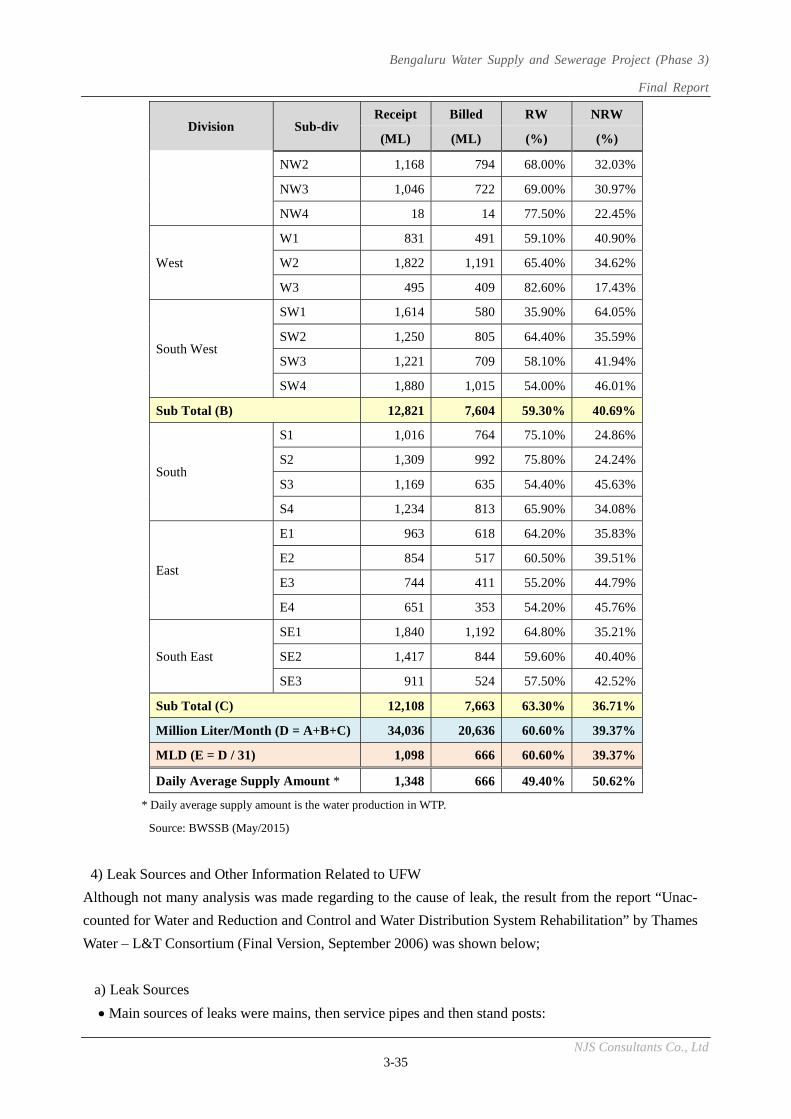
Bengaluru Water Supply and Sewerage Project (Phase 3)
Final Report
NJS Consultants Co., Ltd 3-35
Division Sub-div Receipt Billed RW NRW
(ML) (ML) (%) (%)
NW2 1,168 794 68.00% 32.03%
NW3 1,046 722 69.00% 30.97%
NW4 18 14 77.50% 22.45%
West
W1 831 491 59.10% 40.90%
W2 1,822 1,191 65.40% 34.62%
W3 495 409 82.60% 17.43%
South West
SW1 1,614 580 35.90% 64.05%
SW2 1,250 805 64.40% 35.59%
SW3 1,221 709 58.10% 41.94%
SW4 1,880 1,015 54.00% 46.01%
Sub Total (B) 12,821 7,604 59.30% 40.69%
South
S1 1,016 764 75.10% 24.86%
S2 1,309 992 75.80% 24.24%
S3 1,169 635 54.40% 45.63%
S4 1,234 813 65.90% 34.08%
East
E1 963 618 64.20% 35.83%
E2 854 517 60.50% 39.51%
E3 744 411 55.20% 44.79%
E4 651 353 54.20% 45.76%
South East
SE1 1,840 1,192 64.80% 35.21%
SE2 1,417 844 59.60% 40.40%
SE3 911 524 57.50% 42.52%
Sub Total (C) 12,108 7,663 63.30% 36.71%
Million Liter/Month (D = A+B+C) 34,036 20,636 60.60% 39.37%
MLD (E = D / 31) 1,098 666 60.60% 39.37%
Daily Average Supply Amount * 1,348 666 49.40% 50.62%
* Daily average supply amount is the water production in WTP.
Source: BWSSB (May/2015)
4) Leak Sources and Other Information Related to UFW
Although not many analysis was made regarding to the cause of leak, the result from the report “Unac-
counted for Water and Reduction and Control and Water Distribution System Rehabilitation” by Thames
Water – L&T Consortium (Final Version, September 2006) was shown below;
a) Leak Sources
Main sources of leaks were mains, then service pipes and then stand posts:
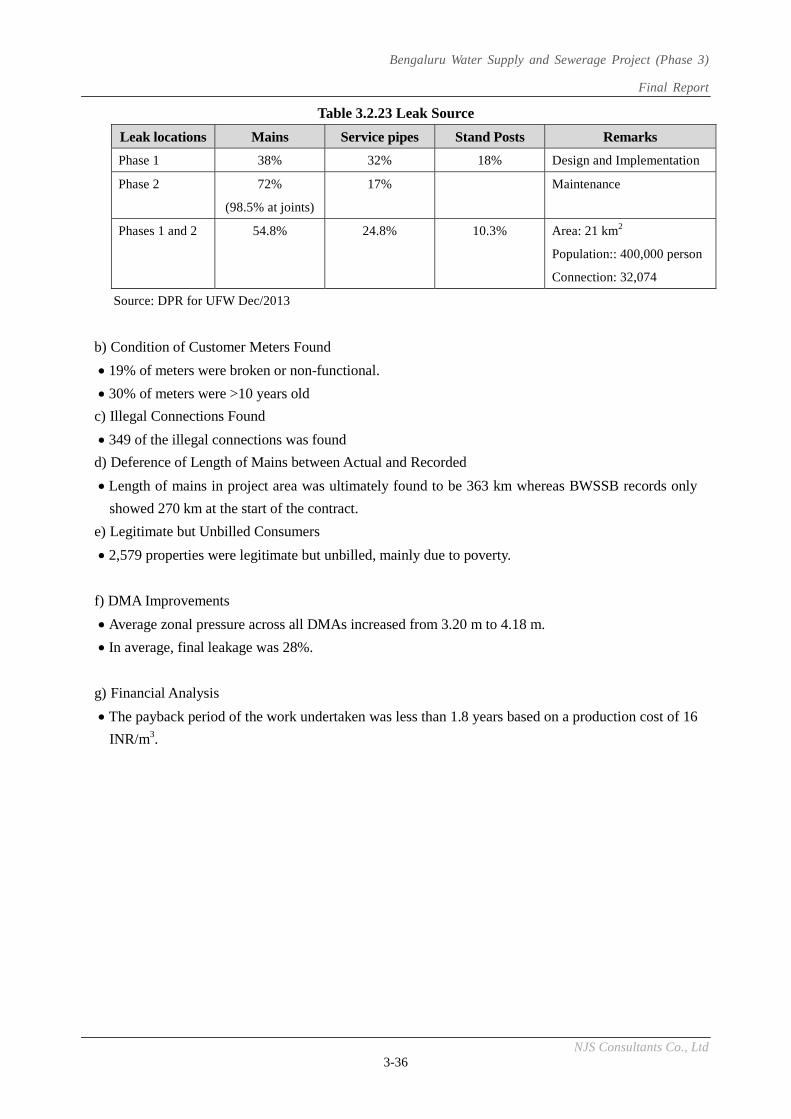
Bengaluru Water Supply and Sewerage Project (Phase 3)
Final Report
NJS Consultants Co., Ltd 3-36
Table 3.2.23 Leak Source
Leak locations Mains Service pipes Stand Posts Remarks
Phase 1 38% 32% 18% Design and Implementation
Phase 2 72%
(98.5% at joints)
17% Maintenance
Phases 1 and 2 54.8% 24.8% 10.3% Area: 21 km2
Population:: 400,000 person
Connection: 32,074
Source: DPR for UFW Dec/2013
b) Condition of Customer Meters Found
19% of meters were broken or non-functional.
30% of meters were >10 years old
c) Illegal Connections Found
349 of the illegal connections was found
d) Deference of Length of Mains between Actual and Recorded
Length of mains in project area was ultimately found to be 363 km whereas BWSSB records only
showed 270 km at the start of the contract.
e) Legitimate but Unbilled Consumers
2,579 properties were legitimate but unbilled, mainly due to poverty.
f) DMA Improvements
Average zonal pressure across all DMAs increased from 3.20 m to 4.18 m.
In average, final leakage was 28%.
g) Financial Analysis
The payback period of the work undertaken was less than 1.8 years based on a production cost of 16
INR/m3.
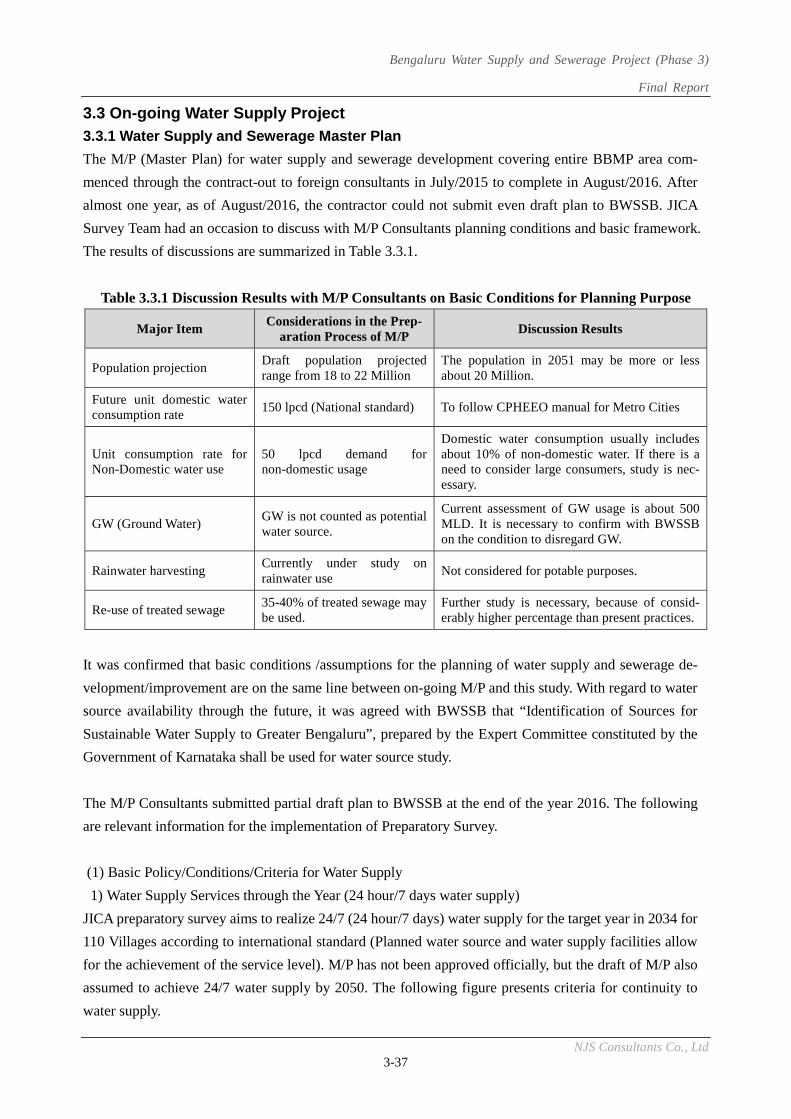
Bengaluru Water Supply and Sewerage Project (Phase 3)
Final Report
NJS Consultants Co., Ltd 3-37
3.3 On-going Water Supply Project
3.3.1 Water Supply and Sewerage Master Plan
The M/P (Master Plan) for water supply and sewerage development covering entire BBMP area com-
menced through the contract-out to foreign consultants in July/2015 to complete in August/2016. After
almost one year, as of August/2016, the contractor could not submit even draft plan to BWSSB. JICA
Survey Team had an occasion to discuss with M/P Consultants planning conditions and basic framework.
The results of discussions are summarized in Table 3.3.1.
Table 3.3.1 Discussion Results with M/P Consultants on Basic Conditions for Planning Purpose
Major Item Considerations in the Prep-
aration Process of M/P Discussion Results
Population projection Draft population projected range from 18 to 22 Million
The population in 2051 may be more or less about 20 Million.
Future unit domestic water consumption rate
150 lpcd (National standard) To follow CPHEEO manual for Metro Cities
Unit consumption rate for Non-Domestic water use
50 lpcd demand for non-domestic usage
Domestic water consumption usually includes about 10% of non-domestic water. If there is a need to consider large consumers, study is nec-essary.
GW (Ground Water) GW is not counted as potential water source.
Current assessment of GW usage is about 500 MLD. It is necessary to confirm with BWSSB on the condition to disregard GW.
Rainwater harvesting Currently under study on rainwater use
Not considered for potable purposes.
Re-use of treated sewage 35-40% of treated sewage may be used.
Further study is necessary, because of consid-erably higher percentage than present practices.
It was confirmed that basic conditions /assumptions for the planning of water supply and sewerage de-
velopment/improvement are on the same line between on-going M/P and this study. With regard to water
source availability through the future, it was agreed with BWSSB that “Identification of Sources for
Sustainable Water Supply to Greater Bengaluru”, prepared by the Expert Committee constituted by the
Government of Karnataka shall be used for water source study.
The M/P Consultants submitted partial draft plan to BWSSB at the end of the year 2016. The following
are relevant information for the implementation of Preparatory Survey.
(1) Basic Policy/Conditions/Criteria for Water Supply
1) Water Supply Services through the Year (24 hour/7 days water supply)
JICA preparatory survey aims to realize 24/7 (24 hour/7 days) water supply for the target year in 2034 for
110 Villages according to international standard (Planned water source and water supply facilities allow
for the achievement of the service level). M/P has not been approved officially, but the draft of M/P also
assumed to achieve 24/7 water supply by 2050. The following figure presents criteria for continuity to
water supply.
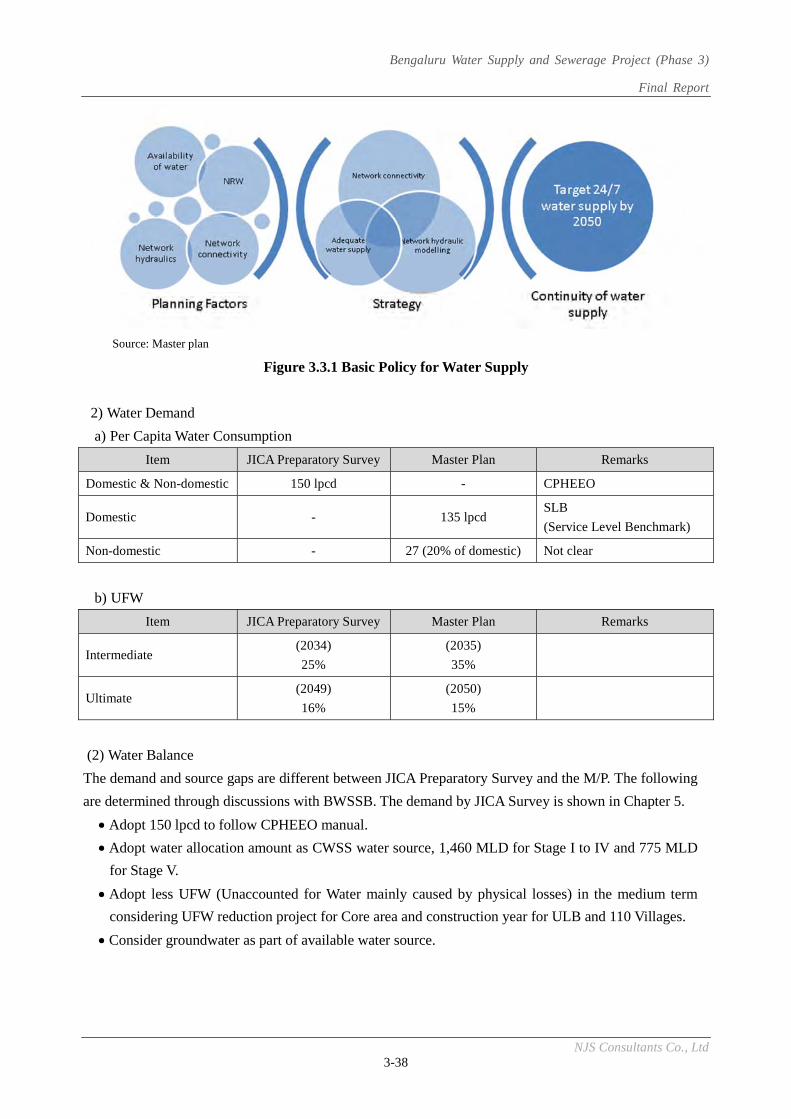
Bengaluru Water Supply and Sewerage Project (Phase 3)
Final Report
NJS Consultants Co., Ltd 3-38
Source: Master plan
Figure 3.3.1 Basic Policy for Water Supply
2) Water Demand
a) Per Capita Water Consumption
Item JICA Preparatory Survey Master Plan Remarks
Domestic & Non-domestic 150 lpcd - CPHEEO
Domestic - 135 lpcd SLB
(Service Level Benchmark)
Non-domestic - 27 (20% of domestic) Not clear
b) UFW
Item JICA Preparatory Survey Master Plan Remarks
Intermediate (2034)
25%
(2035)
35%
Ultimate (2049)
16%
(2050)
15%
(2) Water Balance
The demand and source gaps are different between JICA Preparatory Survey and the M/P. The following
are determined through discussions with BWSSB. The demand by JICA Survey is shown in Chapter 5.
Adopt 150 lpcd to follow CPHEEO manual.
Adopt water allocation amount as CWSS water source, 1,460 MLD for Stage I to IV and 775 MLD
for Stage V.
Adopt less UFW (Unaccounted for Water mainly caused by physical losses) in the medium term
considering UFW reduction project for Core area and construction year for ULB and 110 Villages.
Consider groundwater as part of available water source.
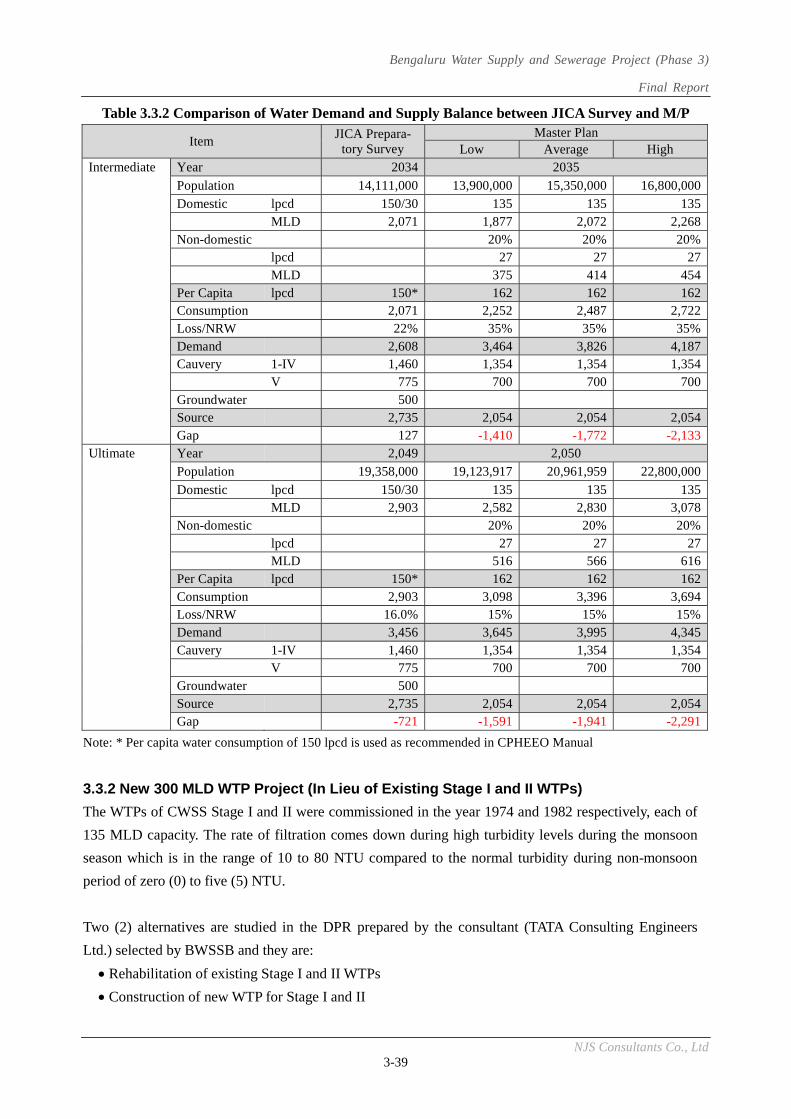
Bengaluru Water Supply and Sewerage Project (Phase 3)
Final Report
NJS Consultants Co., Ltd 3-39
Table 3.3.2 Comparison of Water Demand and Supply Balance between JICA Survey and M/P
Item JICA Prepara-
tory Survey Master Plan
Low Average High Intermediate Year 2034 2035
Population 14,111,000 13,900,000 15,350,000 16,800,000 Domestic lpcd 150/30 135 135 135 MLD 2,071 1,877 2,072 2,268 Non-domestic 20% 20% 20% lpcd 27 27 27 MLD 375 414 454 Per Capita lpcd 150* 162 162 162 Consumption 2,071 2,252 2,487 2,722 Loss/NRW 22% 35% 35% 35% Demand 2,608 3,464 3,826 4,187 Cauvery 1-IV 1,460 1,354 1,354 1,354 V 775 700 700 700 Groundwater 500 Source 2,735 2,054 2,054 2,054 Gap 127 -1,410 -1,772 -2,133Ultimate Year 2,049 2,050 Population 19,358,000 19,123,917 20,961,959 22,800,000
Domestic lpcd 150/30 135 135 135 MLD 2,903 2,582 2,830 3,078 Non-domestic 20% 20% 20% lpcd 27 27 27 MLD 516 566 616 Per Capita lpcd 150* 162 162 162 Consumption 2,903 3,098 3,396 3,694 Loss/NRW 16.0% 15% 15% 15% Demand 3,456 3,645 3,995 4,345 Cauvery 1-IV 1,460 1,354 1,354 1,354 V 775 700 700 700 Groundwater 500 Source 2,735 2,054 2,054 2,054 Gap -721 -1,591 -1,941 -2,291
Note: * Per capita water consumption of 150 lpcd is used as recommended in CPHEEO Manual
3.3.2 New 300 MLD WTP Project (In Lieu of Existing Stage I and II WTPs)
The WTPs of CWSS Stage I and II were commissioned in the year 1974 and 1982 respectively, each of
135 MLD capacity. The rate of filtration comes down during high turbidity levels during the monsoon
season which is in the range of 10 to 80 NTU compared to the normal turbidity during non-monsoon
period of zero (0) to five (5) NTU.
Two (2) alternatives are studied in the DPR prepared by the consultant (TATA Consulting Engineers
Ltd.) selected by BWSSB and they are:
Rehabilitation of existing Stage I and II WTPs
Construction of new WTP for Stage I and II
Bengaluru Water Supply and Sewerage Project (Phase 3)
Final Report
NJS Consultants Co., Ltd 3-40
The estimate for the rehabilitation of the existing Stage I and II WTPs would be 1,290 Million INR. On
the other hand, the construction of new 300 MLD for Stage I and II WTPs was estimated at 1,200 Mil-
lion INR. Based on above, it was recommended to construct new 300 MLD WTP.
The water source is from existing conveyance pipe (Stage I and II) and water is planned to be pumped
by existing PS (Stage I and II). The new 300 MLD WTP is expected to be completed in AUG/2018 and
the fund is from JNNURM (Jawaharlal Nehru National Urban Renewal Mission) and KUIDFC (Karna-
taka Urban Infrastructure Development and Finance Cooperation).
3.3.3 On-going UFW Project
Through Stage IV Phase 2 project, BWSSB has taken up “UFW reduction and distribution system im-
provement works in the Core area of Bengaluru” covering 3 water supply zones: South, West and Cen-
tral catering to 400,000 consumer connections (almost 60% of the total consumer connections of Ben-
galuru, which are 650,000). These contracts were arranged in the similar lines based on the results ob-
tained from the UFW Pilot Project implemented by BWSSB in the Central Business District (CBD) with
the area of 16 km2 in the year 2003-2005. The project focuses on only physical losses including leakage
and illegal connections (UFW), which is less than Non-Revenue Water (NRW).
(1) Details of Existing Contracts for “Improvement to Water Distribution System, Reduction UFW &
Leakage Control in Central Division, West Division and South Division”
Though the contract period of almost three (3) years have passed in all of the three (3) contract packages,
the results in terms of UFW savings are found to be less than expected. The major reason of the delay to
achieve target UFW 16% is caused by the delay of DMA installation (as shown in (2) Contract status of
the packages: 20%-40%). The scope of work of the contracts is same for all the packages and the sum-
mary of the scope of work and other contract features are summarized in Table 3.3.3. Location map of
the area is shown in Figure 3.3.2. The definition of UFW is as shown below in the contract document.
This Project is a component of “Bangalore Water Supply and Sewerage Project (Phase2)” funded by
JICA. The contractors are “Larsen & Turbro Ltd” and “JV of Suez Environment and SPML” and the
supervise consultant is “JV of Nippon Jogesuido Sekkei Co., Ltd., Mott MacDonald Ltd., TATA Con-
sulting Engineers Limited”.
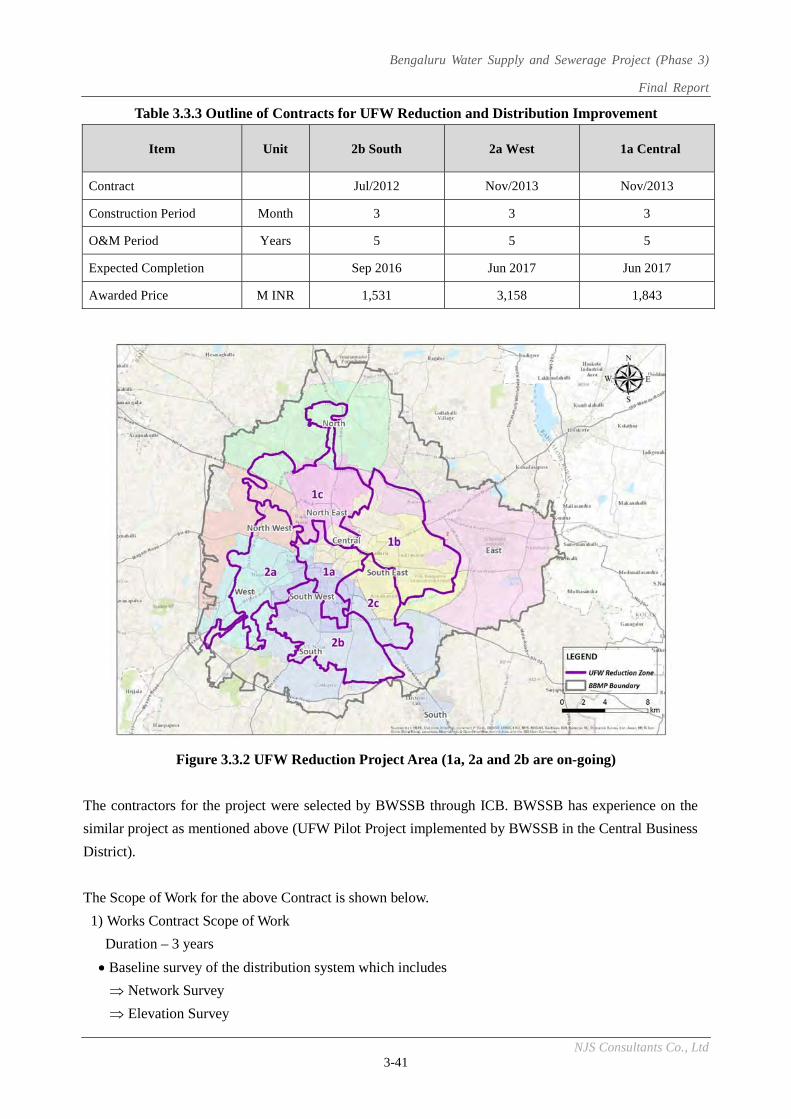
Bengaluru Water Supply and Sewerage Project (Phase 3)
Final Report
NJS Consultants Co., Ltd 3-41
Table 3.3.3 Outline of Contracts for UFW Reduction and Distribution Improvement
Item Unit 2b South 2a West 1a Central
Contract Jul/2012 Nov/2013 Nov/2013
Construction Period Month 3 3 3
O&M Period Years 5 5 5
Expected Completion Sep 2016 Jun 2017 Jun 2017
Awarded Price M INR 1,531 3,158 1,843
Figure 3.3.2 UFW Reduction Project Area (1a, 2a and 2b are on-going)
The contractors for the project were selected by BWSSB through ICB. BWSSB has experience on the
similar project as mentioned above (UFW Pilot Project implemented by BWSSB in the Central Business
District).
The Scope of Work for the above Contract is shown below.
1) Works Contract Scope of Work
Duration – 3 years
Baseline survey of the distribution system which includes
Network Survey
Elevation Survey
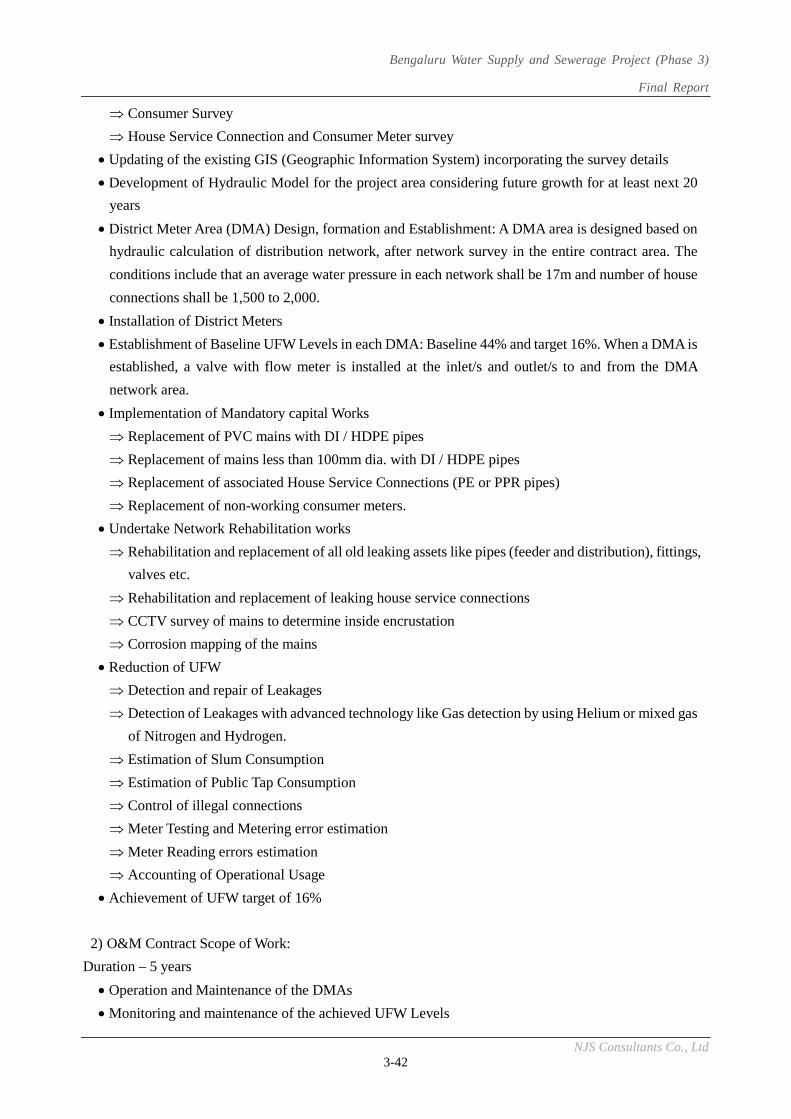
Bengaluru Water Supply and Sewerage Project (Phase 3)
Final Report
NJS Consultants Co., Ltd 3-42
Consumer Survey
House Service Connection and Consumer Meter survey
Updating of the existing GIS (Geographic Information System) incorporating the survey details
Development of Hydraulic Model for the project area considering future growth for at least next 20
years
District Meter Area (DMA) Design, formation and Establishment: A DMA area is designed based on
hydraulic calculation of distribution network, after network survey in the entire contract area. The
conditions include that an average water pressure in each network shall be 17m and number of house
connections shall be 1,500 to 2,000.
Installation of District Meters
Establishment of Baseline UFW Levels in each DMA: Baseline 44% and target 16%. When a DMA is
established, a valve with flow meter is installed at the inlet/s and outlet/s to and from the DMA
network area.
Implementation of Mandatory capital Works
Replacement of PVC mains with DI / HDPE pipes
Replacement of mains less than 100mm dia. with DI / HDPE pipes
Replacement of associated House Service Connections (PE or PPR pipes)
Replacement of non-working consumer meters.
Undertake Network Rehabilitation works
Rehabilitation and replacement of all old leaking assets like pipes (feeder and distribution), fittings,
valves etc.
Rehabilitation and replacement of leaking house service connections
CCTV survey of mains to determine inside encrustation
Corrosion mapping of the mains
Reduction of UFW
Detection and repair of Leakages
Detection of Leakages with advanced technology like Gas detection by using Helium or mixed gas
of Nitrogen and Hydrogen.
Estimation of Slum Consumption
Estimation of Public Tap Consumption
Control of illegal connections
Meter Testing and Metering error estimation
Meter Reading errors estimation
Accounting of Operational Usage
Achievement of UFW target of 16%
2) O&M Contract Scope of Work:
Duration – 5 years
Operation and Maintenance of the DMAs
Monitoring and maintenance of the achieved UFW Levels
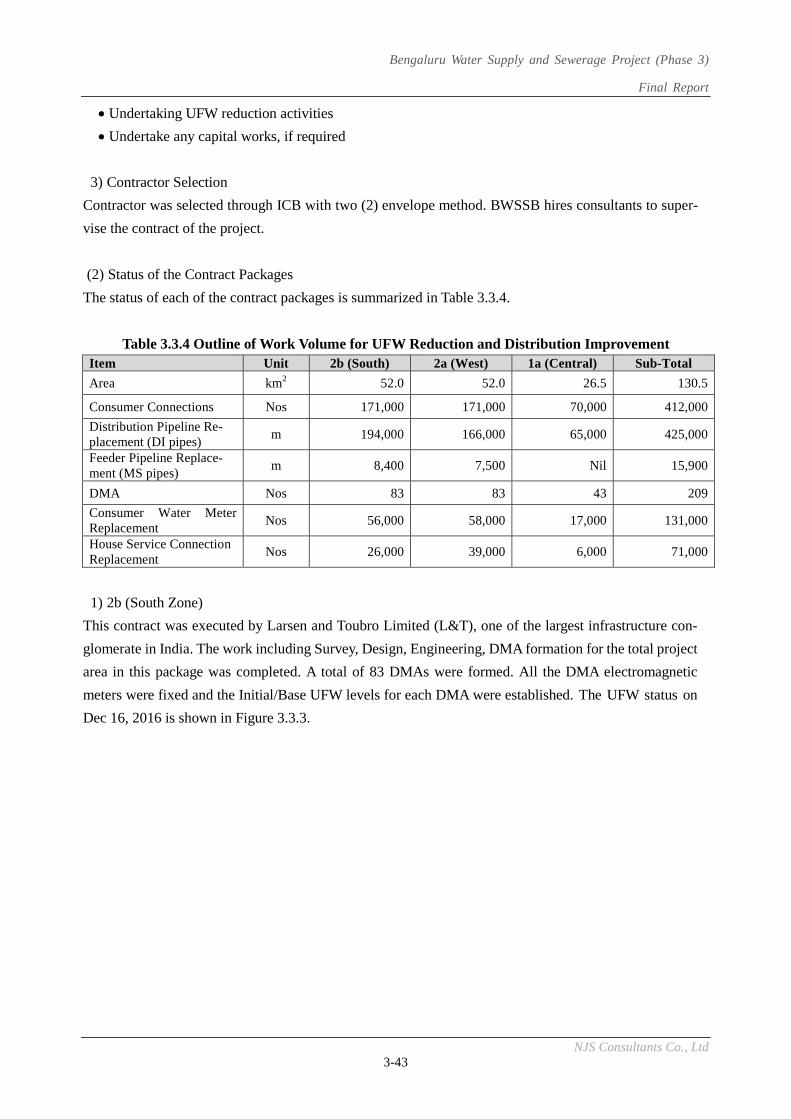
Bengaluru Water Supply and Sewerage Project (Phase 3)
Final Report
NJS Consultants Co., Ltd 3-43
Undertaking UFW reduction activities
Undertake any capital works, if required
3) Contractor Selection
Contractor was selected through ICB with two (2) envelope method. BWSSB hires consultants to super-
vise the contract of the project.
(2) Status of the Contract Packages
The status of each of the contract packages is summarized in Table 3.3.4.
Table 3.3.4 Outline of Work Volume for UFW Reduction and Distribution Improvement Item Unit 2b (South) 2a (West) 1a (Central) Sub-Total
Area km2 52.0 52.0 26.5 130.5
Consumer Connections Nos 171,000 171,000 70,000 412,000
Distribution Pipeline Re-placement (DI pipes)
m 194,000 166,000 65,000 425,000
Feeder Pipeline Replace-ment (MS pipes)
m 8,400 7,500 Nil 15,900
DMA Nos 83 83 43 209
Consumer Water Meter Replacement
Nos 56,000 58,000 17,000 131,000
House Service Connection Replacement
Nos 26,000 39,000 6,000 71,000
1) 2b (South Zone)
This contract was executed by Larsen and Toubro Limited (L&T), one of the largest infrastructure con-
glomerate in India. The work including Survey, Design, Engineering, DMA formation for the total project
area in this package was completed. A total of 83 DMAs were formed. All the DMA electromagnetic
meters were fixed and the Initial/Base UFW levels for each DMA were established. The UFW status on
Dec 16, 2016 is shown in Figure 3.3.3.
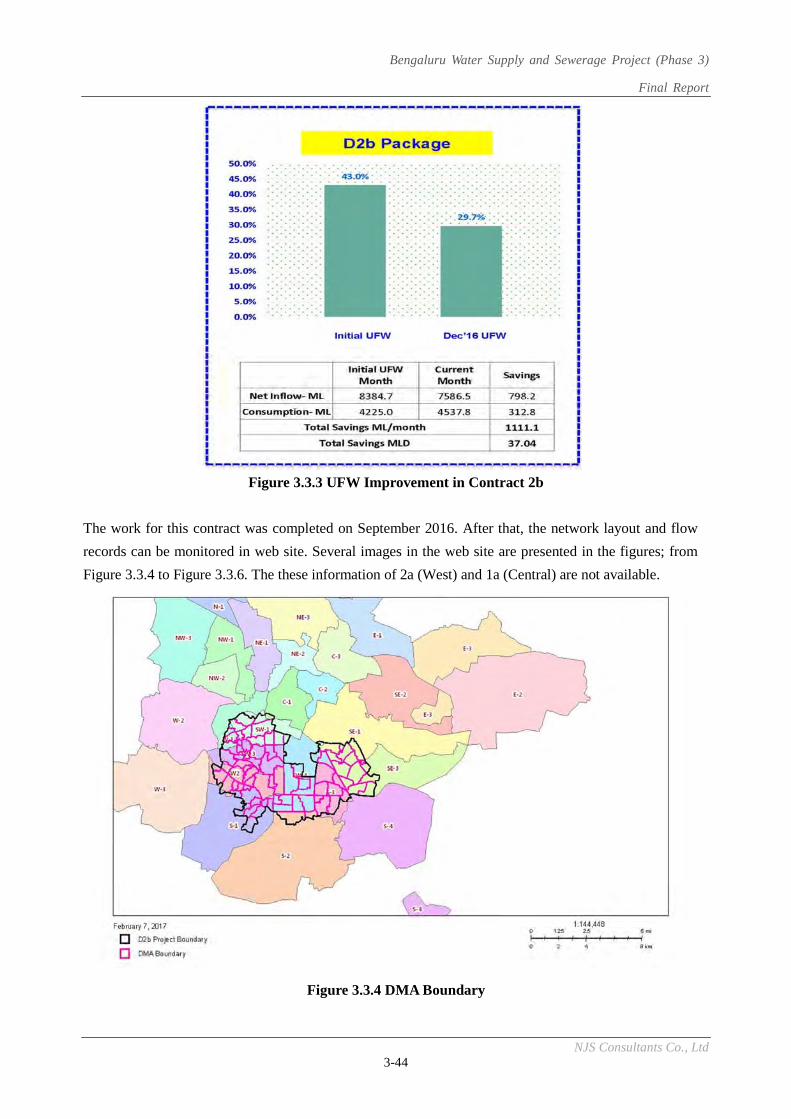
Bengaluru Water Supply and Sewerage Project (Phase 3)
Final Report
NJS Consultants Co., Ltd 3-44
Figure 3.3.3 UFW Improvement in Contract 2b
The work for this contract was completed on September 2016. After that, the network layout and flow
records can be monitored in web site. Several images in the web site are presented in the figures; from
Figure 3.3.4 to Figure 3.3.6. The these information of 2a (West) and 1a (Central) are not available.
Figure 3.3.4 DMA Boundary
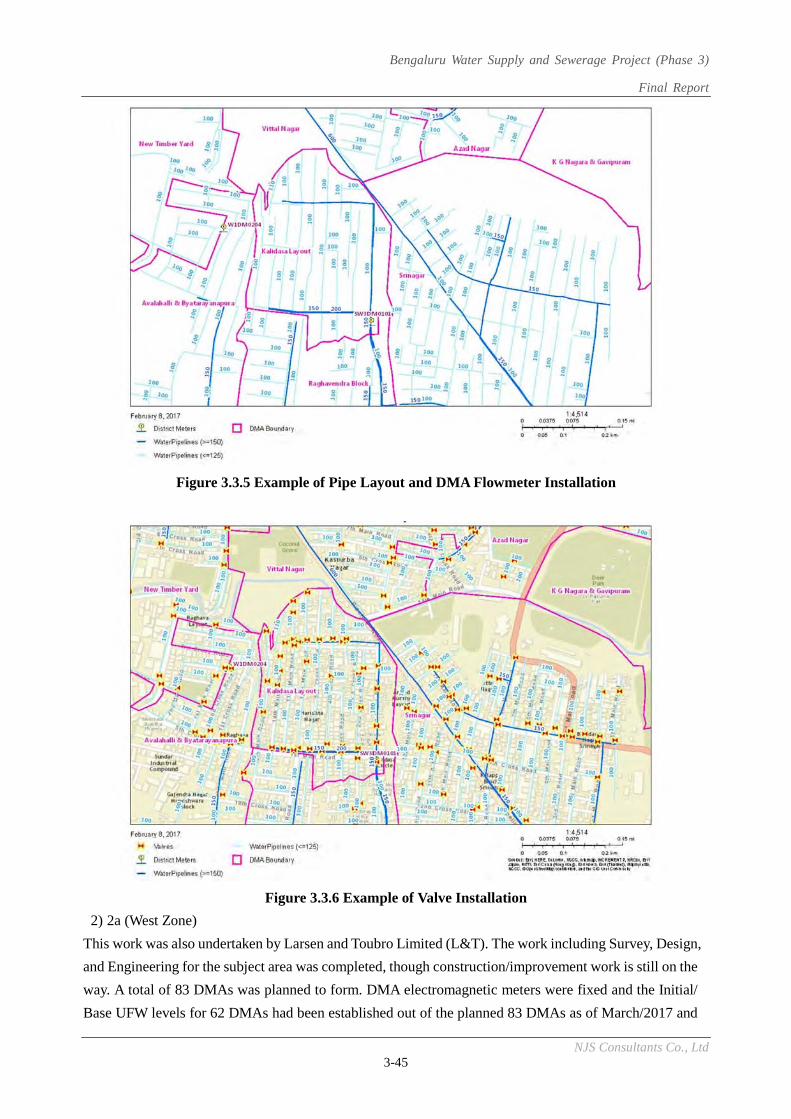
Bengaluru Water Supply and Sewerage Project (Phase 3)
Final Report
NJS Consultants Co., Ltd 3-45
Figure 3.3.5 Example of Pipe Layout and DMA Flowmeter Installation
Figure 3.3.6 Example of Valve Installation
2) 2a (West Zone)
This work was also undertaken by Larsen and Toubro Limited (L&T). The work including Survey, Design,
and Engineering for the subject area was completed, though construction/improvement work is still on the
way. A total of 83 DMAs was planned to form. DMA electromagnetic meters were fixed and the Initial/
Base UFW levels for 62 DMAs had been established out of the planned 83 DMAs as of March/2017 and
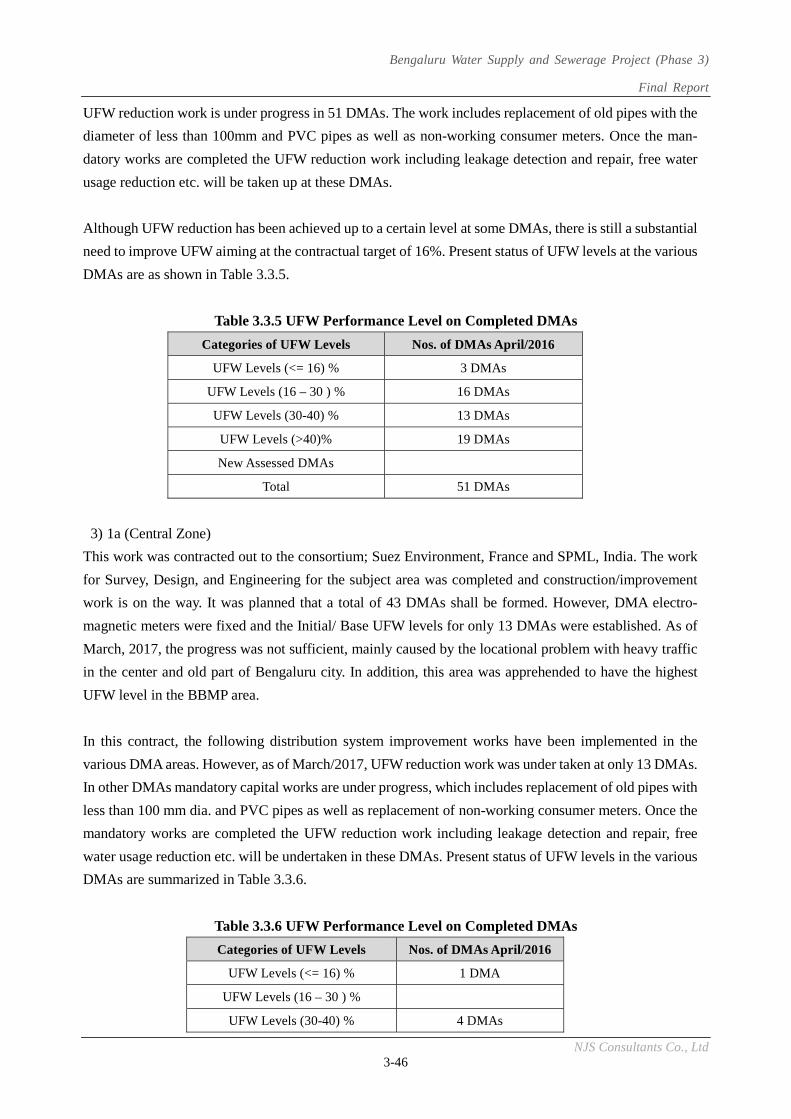
Bengaluru Water Supply and Sewerage Project (Phase 3)
Final Report
NJS Consultants Co., Ltd 3-46
UFW reduction work is under progress in 51 DMAs. The work includes replacement of old pipes with the
diameter of less than 100mm and PVC pipes as well as non-working consumer meters. Once the man-
datory works are completed the UFW reduction work including leakage detection and repair, free water
usage reduction etc. will be taken up at these DMAs.
Although UFW reduction has been achieved up to a certain level at some DMAs, there is still a substantial
need to improve UFW aiming at the contractual target of 16%. Present status of UFW levels at the various
DMAs are as shown in Table 3.3.5.
Table 3.3.5 UFW Performance Level on Completed DMAs
Categories of UFW Levels Nos. of DMAs April/2016
UFW Levels (<= 16) % 3 DMAs
UFW Levels (16 – 30 ) % 16 DMAs
UFW Levels (30-40) % 13 DMAs
UFW Levels (>40)% 19 DMAs
New Assessed DMAs
Total 51 DMAs
3) 1a (Central Zone)
This work was contracted out to the consortium; Suez Environment, France and SPML, India. The work
for Survey, Design, and Engineering for the subject area was completed and construction/improvement
work is on the way. It was planned that a total of 43 DMAs shall be formed. However, DMA electro-
magnetic meters were fixed and the Initial/ Base UFW levels for only 13 DMAs were established. As of
March, 2017, the progress was not sufficient, mainly caused by the locational problem with heavy traffic
in the center and old part of Bengaluru city. In addition, this area was apprehended to have the highest
UFW level in the BBMP area.
In this contract, the following distribution system improvement works have been implemented in the
various DMA areas. However, as of March/2017, UFW reduction work was under taken at only 13 DMAs.
In other DMAs mandatory capital works are under progress, which includes replacement of old pipes with
less than 100 mm dia. and PVC pipes as well as replacement of non-working consumer meters. Once the
mandatory works are completed the UFW reduction work including leakage detection and repair, free
water usage reduction etc. will be undertaken in these DMAs. Present status of UFW levels in the various
DMAs are summarized in Table 3.3.6.
Table 3.3.6 UFW Performance Level on Completed DMAs
Categories of UFW Levels Nos. of DMAs April/2016
UFW Levels (<= 16) % 1 DMA
UFW Levels (16 – 30 ) %
UFW Levels (30-40) % 4 DMAs
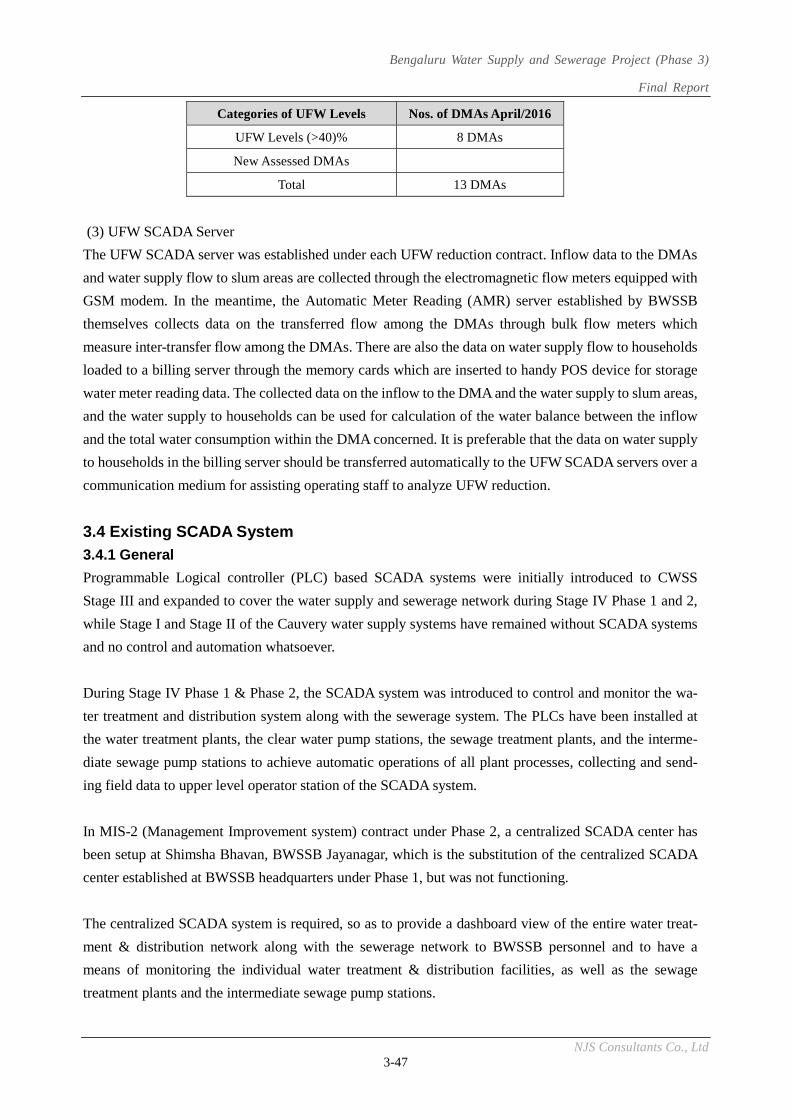
Bengaluru Water Supply and Sewerage Project (Phase 3)
Final Report
NJS Consultants Co., Ltd 3-47
Categories of UFW Levels Nos. of DMAs April/2016
UFW Levels (>40)% 8 DMAs
New Assessed DMAs
Total 13 DMAs
(3) UFW SCADA Server
The UFW SCADA server was established under each UFW reduction contract. Inflow data to the DMAs
and water supply flow to slum areas are collected through the electromagnetic flow meters equipped with
GSM modem. In the meantime, the Automatic Meter Reading (AMR) server established by BWSSB
themselves collects data on the transferred flow among the DMAs through bulk flow meters which
measure inter-transfer flow among the DMAs. There are also the data on water supply flow to households
loaded to a billing server through the memory cards which are inserted to handy POS device for storage
water meter reading data. The collected data on the inflow to the DMA and the water supply to slum areas,
and the water supply to households can be used for calculation of the water balance between the inflow
and the total water consumption within the DMA concerned. It is preferable that the data on water supply
to households in the billing server should be transferred automatically to the UFW SCADA servers over a
communication medium for assisting operating staff to analyze UFW reduction.
3.4 Existing SCADA System
3.4.1 General
Programmable Logical controller (PLC) based SCADA systems were initially introduced to CWSS
Stage III and expanded to cover the water supply and sewerage network during Stage IV Phase 1 and 2,
while Stage I and Stage II of the Cauvery water supply systems have remained without SCADA systems
and no control and automation whatsoever.
During Stage IV Phase 1 & Phase 2, the SCADA system was introduced to control and monitor the wa-
ter treatment and distribution system along with the sewerage system. The PLCs have been installed at
the water treatment plants, the clear water pump stations, the sewage treatment plants, and the interme-
diate sewage pump stations to achieve automatic operations of all plant processes, collecting and send-
ing field data to upper level operator station of the SCADA system.
In MIS-2 (Management Improvement system) contract under Phase 2, a centralized SCADA center has
been setup at Shimsha Bhavan, BWSSB Jayanagar, which is the substitution of the centralized SCADA
center established at BWSSB headquarters under Phase 1, but was not functioning.
The centralized SCADA system is required, so as to provide a dashboard view of the entire water treat-
ment & distribution network along with the sewerage network to BWSSB personnel and to have a
means of monitoring the individual water treatment & distribution facilities, as well as the sewage
treatment plants and the intermediate sewage pump stations.
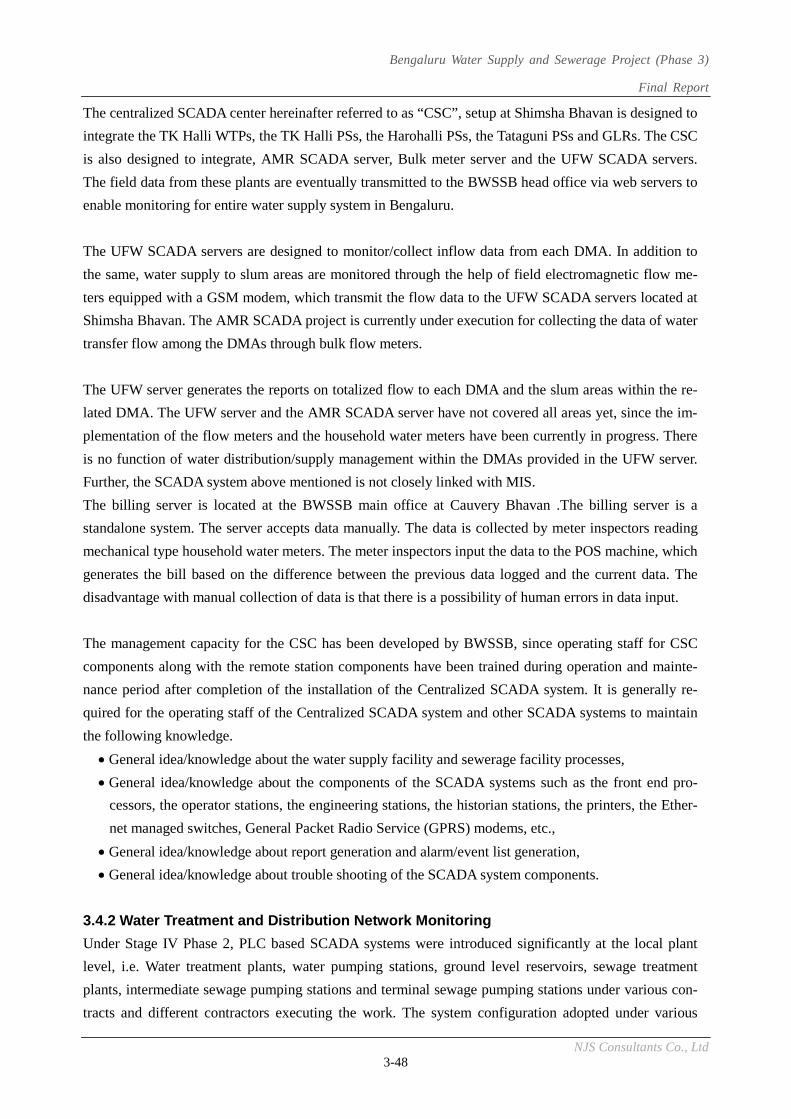
Bengaluru Water Supply and Sewerage Project (Phase 3)
Final Report
NJS Consultants Co., Ltd 3-48
The centralized SCADA center hereinafter referred to as “CSC”, setup at Shimsha Bhavan is designed to
integrate the TK Halli WTPs, the TK Halli PSs, the Harohalli PSs, the Tataguni PSs and GLRs. The CSC
is also designed to integrate, AMR SCADA server, Bulk meter server and the UFW SCADA servers.
The field data from these plants are eventually transmitted to the BWSSB head office via web servers to
enable monitoring for entire water supply system in Bengaluru.
The UFW SCADA servers are designed to monitor/collect inflow data from each DMA. In addition to
the same, water supply to slum areas are monitored through the help of field electromagnetic flow me-
ters equipped with a GSM modem, which transmit the flow data to the UFW SCADA servers located at
Shimsha Bhavan. The AMR SCADA project is currently under execution for collecting the data of water
transfer flow among the DMAs through bulk flow meters.
The UFW server generates the reports on totalized flow to each DMA and the slum areas within the re-
lated DMA. The UFW server and the AMR SCADA server have not covered all areas yet, since the im-
plementation of the flow meters and the household water meters have been currently in progress. There
is no function of water distribution/supply management within the DMAs provided in the UFW server.
Further, the SCADA system above mentioned is not closely linked with MIS.
The billing server is located at the BWSSB main office at Cauvery Bhavan .The billing server is a
standalone system. The server accepts data manually. The data is collected by meter inspectors reading
mechanical type household water meters. The meter inspectors input the data to the POS machine, which
generates the bill based on the difference between the previous data logged and the current data. The
disadvantage with manual collection of data is that there is a possibility of human errors in data input.
The management capacity for the CSC has been developed by BWSSB, since operating staff for CSC
components along with the remote station components have been trained during operation and mainte-
nance period after completion of the installation of the Centralized SCADA system. It is generally re-
quired for the operating staff of the Centralized SCADA system and other SCADA systems to maintain
the following knowledge.
General idea/knowledge about the water supply facility and sewerage facility processes,
General idea/knowledge about the components of the SCADA systems such as the front end pro-
cessors, the operator stations, the engineering stations, the historian stations, the printers, the Ether-
net managed switches, General Packet Radio Service (GPRS) modems, etc.,
General idea/knowledge about report generation and alarm/event list generation,
General idea/knowledge about trouble shooting of the SCADA system components.
3.4.2 Water Treatment and Distribution Network Monitoring
Under Stage IV Phase 2, PLC based SCADA systems were introduced significantly at the local plant
level, i.e. Water treatment plants, water pumping stations, ground level reservoirs, sewage treatment
plants, intermediate sewage pumping stations and terminal sewage pumping stations under various con-
tracts and different contractors executing the work. The system configuration adopted under various
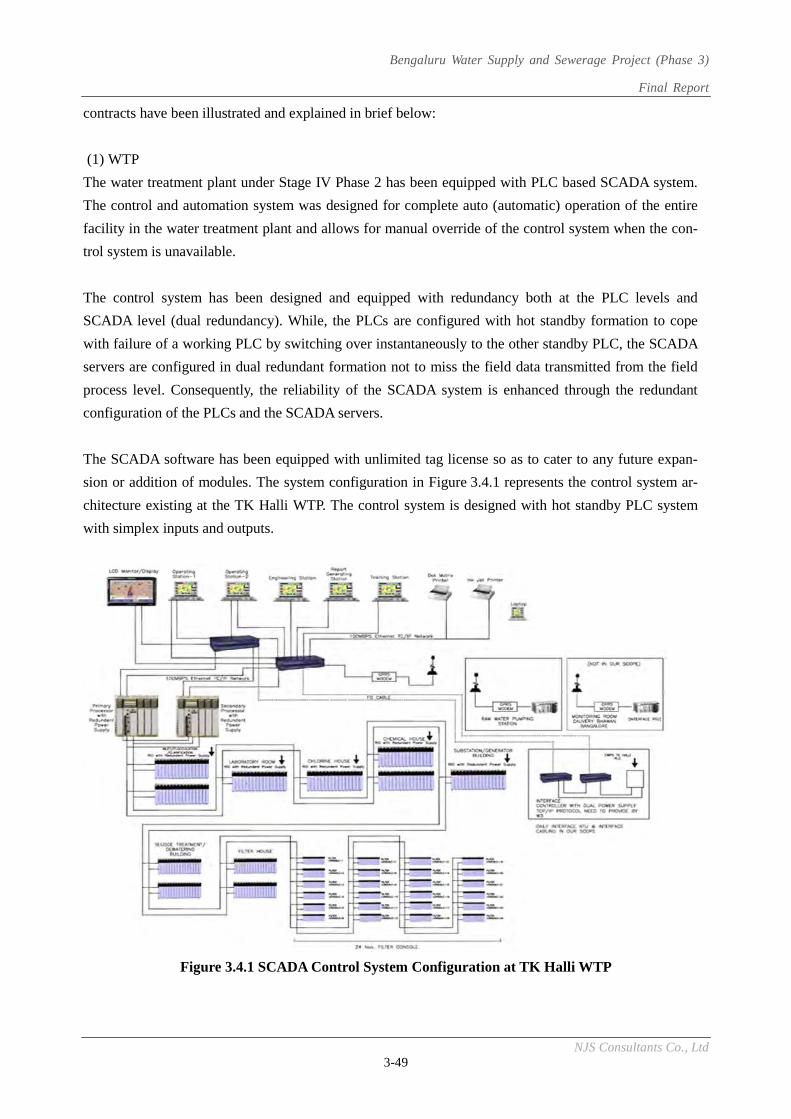
Bengaluru Water Supply and Sewerage Project (Phase 3)
Final Report
NJS Consultants Co., Ltd 3-49
contracts have been illustrated and explained in brief below:
(1) WTP
The water treatment plant under Stage IV Phase 2 has been equipped with PLC based SCADA system.
The control and automation system was designed for complete auto (automatic) operation of the entire
facility in the water treatment plant and allows for manual override of the control system when the con-
trol system is unavailable.
The control system has been designed and equipped with redundancy both at the PLC levels and
SCADA level (dual redundancy). While, the PLCs are configured with hot standby formation to cope
with failure of a working PLC by switching over instantaneously to the other standby PLC, the SCADA
servers are configured in dual redundant formation not to miss the field data transmitted from the field
process level. Consequently, the reliability of the SCADA system is enhanced through the redundant
configuration of the PLCs and the SCADA servers.
The SCADA software has been equipped with unlimited tag license so as to cater to any future expan-
sion or addition of modules. The system configuration in Figure 3.4.1 represents the control system ar-
chitecture existing at the TK Halli WTP. The control system is designed with hot standby PLC system
with simplex inputs and outputs.
Figure 3.4.1 SCADA Control System Configuration at TK Halli WTP
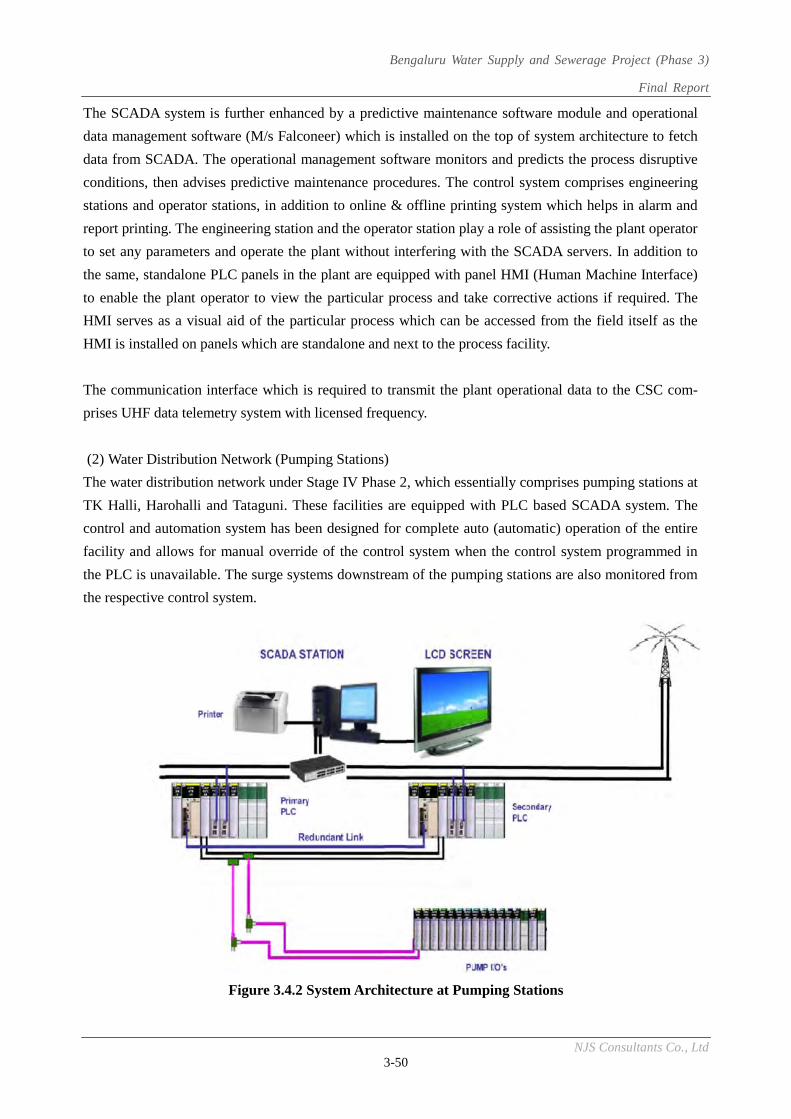
Bengaluru Water Supply and Sewerage Project (Phase 3)
Final Report
NJS Consultants Co., Ltd 3-50
The SCADA system is further enhanced by a predictive maintenance software module and operational
data management software (M/s Falconeer) which is installed on the top of system architecture to fetch
data from SCADA. The operational management software monitors and predicts the process disruptive
conditions, then advises predictive maintenance procedures. The control system comprises engineering
stations and operator stations, in addition to online & offline printing system which helps in alarm and
report printing. The engineering station and the operator station play a role of assisting the plant operator
to set any parameters and operate the plant without interfering with the SCADA servers. In addition to
the same, standalone PLC panels in the plant are equipped with panel HMI (Human Machine Interface)
to enable the plant operator to view the particular process and take corrective actions if required. The
HMI serves as a visual aid of the particular process which can be accessed from the field itself as the
HMI is installed on panels which are standalone and next to the process facility.
The communication interface which is required to transmit the plant operational data to the CSC com-
prises UHF data telemetry system with licensed frequency.
(2) Water Distribution Network (Pumping Stations)
The water distribution network under Stage IV Phase 2, which essentially comprises pumping stations at
TK Halli, Harohalli and Tataguni. These facilities are equipped with PLC based SCADA system. The
control and automation system has been designed for complete auto (automatic) operation of the entire
facility and allows for manual override of the control system when the control system programmed in
the PLC is unavailable. The surge systems downstream of the pumping stations are also monitored from
the respective control system.
Figure 3.4.2 System Architecture at Pumping Stations
Bengaluru Water Supply and Sewerage Project (Phase 3)
Final Report
NJS Consultants Co., Ltd 3-51
The control system has been designed and equipped with redundancy both at the PLC levels and
SCADA level (dual redundancy). The SCADA software has been equipped with unlimited tag license.
The communication system interface consists of UHF telemetry network, through which the pumping
station operational data is transmitted in real time to the CSC, installed at Shimsha Bhavan.
The ground level reservoirs (6 Nos) which were constructed during Phase-II are equipped with remote
telemetry unit (RTU) with GPRS to transmit the level data to the CSC in real time.
The pumped water to the OHTs and/or the GLRs in Bengaluru city is gravitated to the distribution net-
work. The operating staff (from the contractor) for the water supply facilities are generally with suffi-
cient experience of water supply system and basic knowledge about the SCADA system. The inlet and
outlet valves at the GLRs are manually operated by the operating staff when required by referring to the
water levels of the GLRs, which are monitored and transmitted to the CSC.
Figure 3.4.3 System Architecture for Data Communication at Remote Stations
3.4.3 Centralized SCADA Center at Shimsha Bhavan
A centralized SCADA system has been setup at BWSSB office at Shimsha Bhavan. The CSC has been
designed for integration of current water treatment & distribution facilities along with the sewerage fa-
cilities. The CSC has been sized to accommodate any future expansion of the water treatment & distri-
bution facilities along with the sewerage facilities. The CSC is currently integrated with the water treat-
Bengaluru Water Supply and Sewerage Project (Phase 3)
Final Report
NJS Consultants Co., Ltd 3-52
ment plant of Stage IV, pumping stations and the ground level reservoirs. The sewage treatment plants
which are currently under construction shall be integrated with the CSC in due course of time when the
data is made available before final commissioning stage.
Under the contract, the CSC contractor is to operate and maintain the CSC for a period of seven (7)
years after completion of the installation works. The CSC contractor under the operation and mainte-
nance period is required to integrate any plant/station which is commissioned during these seven years.
There may be a SCADA system maintenance service contracted to the original contractor for the
SCADA system through a mutual agreement reasonably acceptable by the both parties after the comple-
tion of the operation and maintenance for the seven (7) year period.
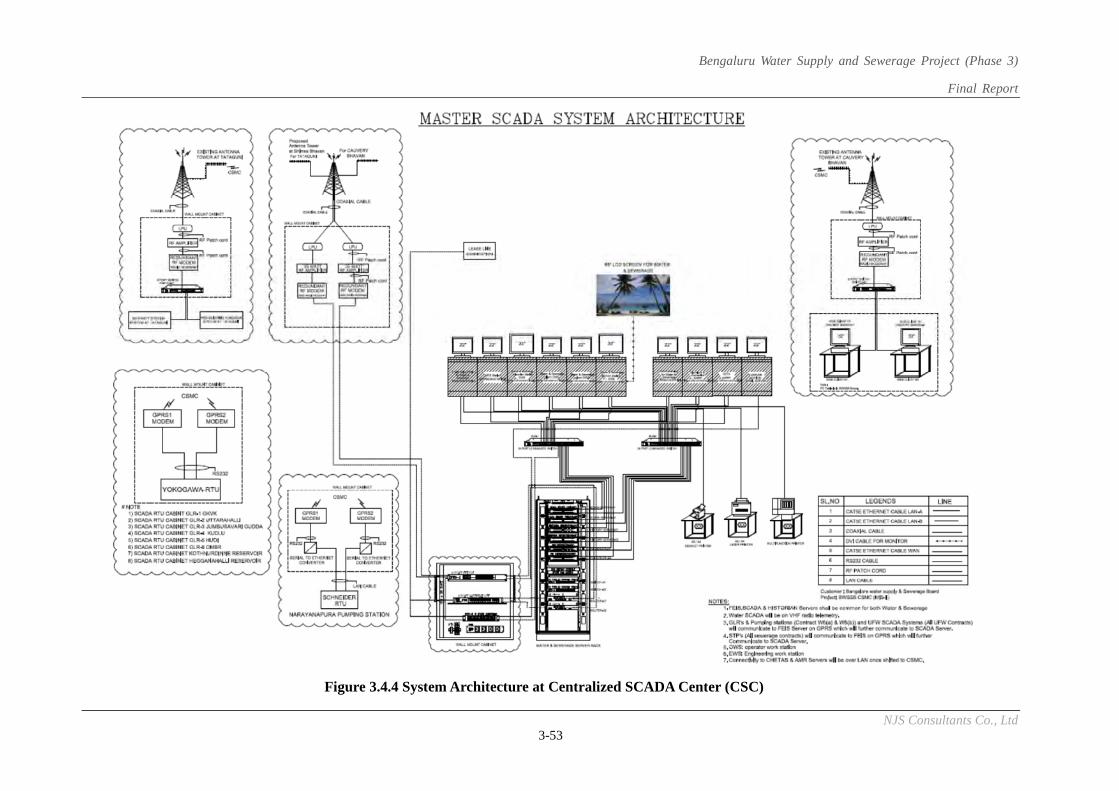
Bengaluru Water Supply and Sewerage Project (Phase 3)
Final Report
NJS Consultants Co., Ltd 3-53
Figure 3.4.4 System Architecture at Centralized SCADA Center (CSC)
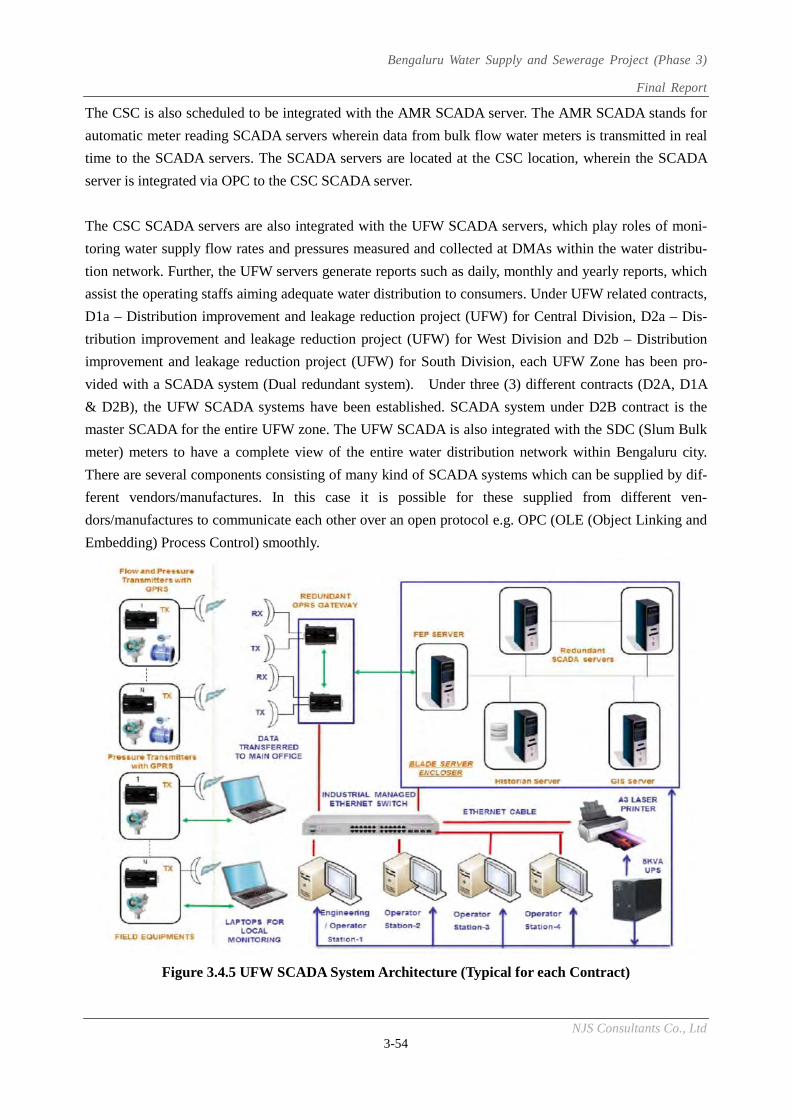
Bengaluru Water Supply and Sewerage Project (Phase 3)
Final Report
NJS Consultants Co., Ltd 3-54
The CSC is also scheduled to be integrated with the AMR SCADA server. The AMR SCADA stands for
automatic meter reading SCADA servers wherein data from bulk flow water meters is transmitted in real
time to the SCADA servers. The SCADA servers are located at the CSC location, wherein the SCADA
server is integrated via OPC to the CSC SCADA server.
The CSC SCADA servers are also integrated with the UFW SCADA servers, which play roles of moni-
toring water supply flow rates and pressures measured and collected at DMAs within the water distribu-
tion network. Further, the UFW servers generate reports such as daily, monthly and yearly reports, which
assist the operating staffs aiming adequate water distribution to consumers. Under UFW related contracts,
D1a – Distribution improvement and leakage reduction project (UFW) for Central Division, D2a – Dis-
tribution improvement and leakage reduction project (UFW) for West Division and D2b – Distribution
improvement and leakage reduction project (UFW) for South Division, each UFW Zone has been pro-
vided with a SCADA system (Dual redundant system). Under three (3) different contracts (D2A, D1A
& D2B), the UFW SCADA systems have been established. SCADA system under D2B contract is the
master SCADA for the entire UFW zone. The UFW SCADA is also integrated with the SDC (Slum Bulk
meter) meters to have a complete view of the entire water distribution network within Bengaluru city.
There are several components consisting of many kind of SCADA systems which can be supplied by dif-
ferent vendors/manufactures. In this case it is possible for these supplied from different ven-
dors/manufactures to communicate each other over an open protocol e.g. OPC (OLE (Object Linking and
Embedding) Process Control) smoothly.
Figure 3.4.5 UFW SCADA System Architecture (Typical for each Contract)
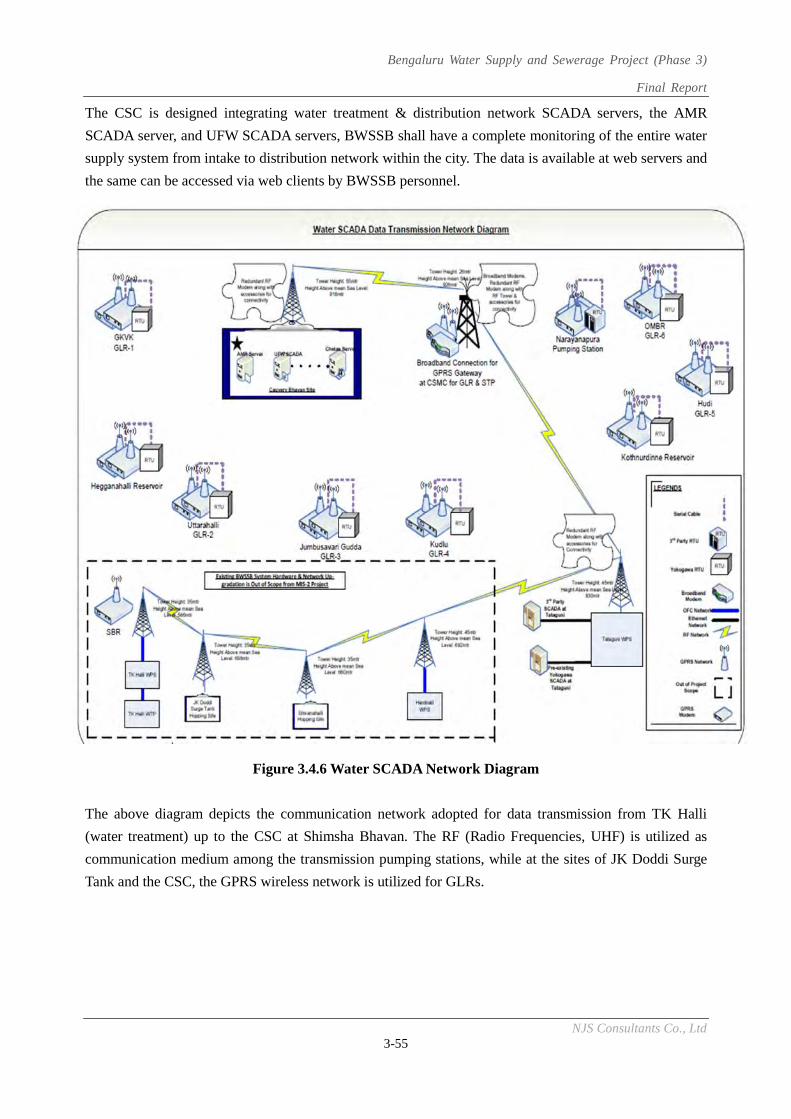
Bengaluru Water Supply and Sewerage Project (Phase 3)
Final Report
NJS Consultants Co., Ltd 3-55
The CSC is designed integrating water treatment & distribution network SCADA servers, the AMR
SCADA server, and UFW SCADA servers, BWSSB shall have a complete monitoring of the entire water
supply system from intake to distribution network within the city. The data is available at web servers and
the same can be accessed via web clients by BWSSB personnel.
Figure 3.4.6 Water SCADA Network Diagram
The above diagram depicts the communication network adopted for data transmission from TK Halli
(water treatment) up to the CSC at Shimsha Bhavan. The RF (Radio Frequencies, UHF) is utilized as
communication medium among the transmission pumping stations, while at the sites of JK Doddi Surge
Tank and the CSC, the GPRS wireless network is utilized for GLRs.
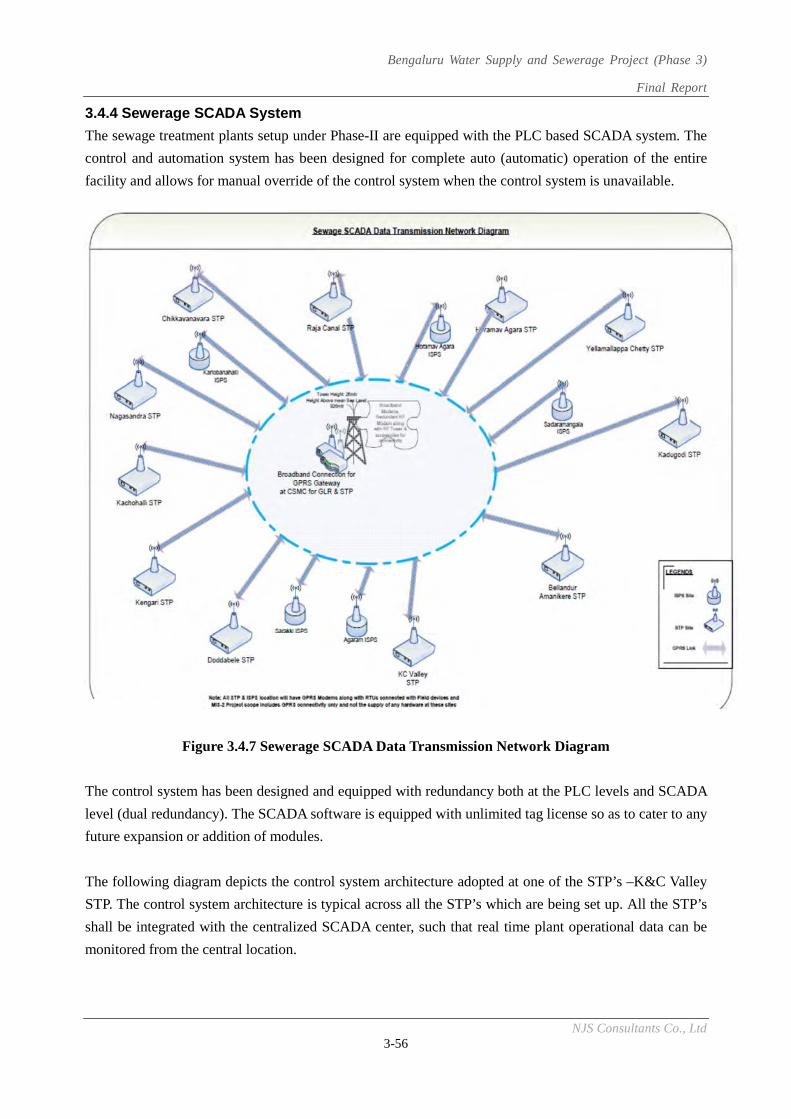
Bengaluru Water Supply and Sewerage Project (Phase 3)
Final Report
NJS Consultants Co., Ltd 3-56
3.4.4 Sewerage SCADA System
The sewage treatment plants setup under Phase-II are equipped with the PLC based SCADA system. The
control and automation system has been designed for complete auto (automatic) operation of the entire
facility and allows for manual override of the control system when the control system is unavailable.
Figure 3.4.7 Sewerage SCADA Data Transmission Network Diagram
The control system has been designed and equipped with redundancy both at the PLC levels and SCADA
level (dual redundancy). The SCADA software is equipped with unlimited tag license so as to cater to any
future expansion or addition of modules.
The following diagram depicts the control system architecture adopted at one of the STP’s –K&C Valley
STP. The control system architecture is typical across all the STP’s which are being set up. All the STP’s
shall be integrated with the centralized SCADA center, such that real time plant operational data can be
monitored from the central location.
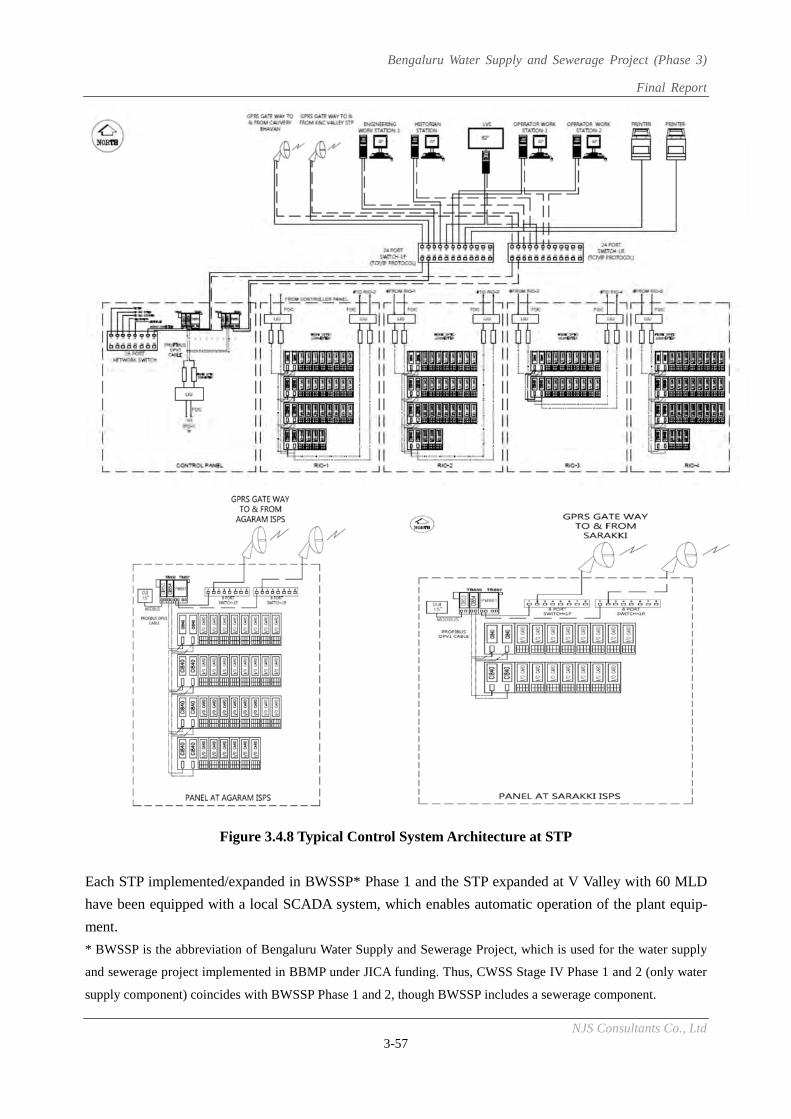
Bengaluru Water Supply and Sewerage Project (Phase 3)
Final Report
NJS Consultants Co., Ltd 3-57
Figure 3.4.8 Typical Control System Architecture at STP
Each STP implemented/expanded in BWSSP* Phase 1 and the STP expanded at V Valley with 60 MLD
have been equipped with a local SCADA system, which enables automatic operation of the plant equip-
ment.
* BWSSP is the abbreviation of Bengaluru Water Supply and Sewerage Project, which is used for the water supply
and sewerage project implemented in BBMP under JICA funding. Thus, CWSS Stage IV Phase 1 and 2 (only water
supply component) coincides with BWSSP Phase 1 and 2, though BWSSP includes a sewerage component.
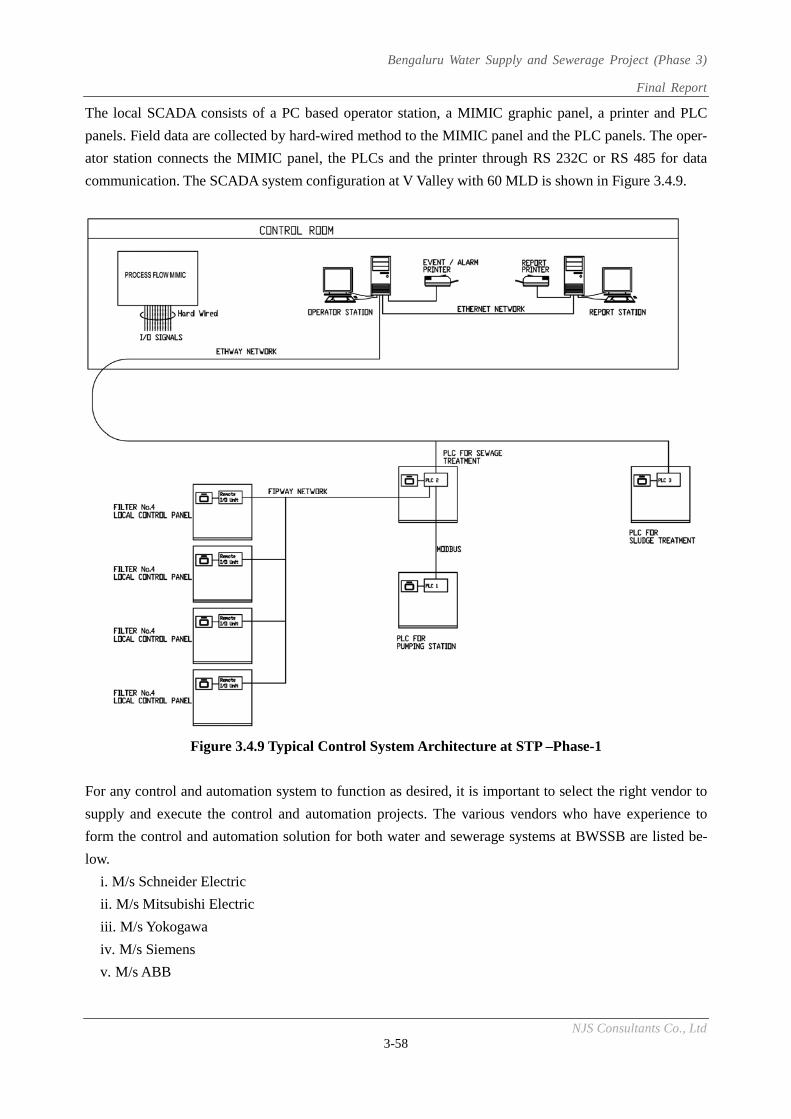
Bengaluru Water Supply and Sewerage Project (Phase 3)
Final Report
NJS Consultants Co., Ltd 3-58
The local SCADA consists of a PC based operator station, a MIMIC graphic panel, a printer and PLC
panels. Field data are collected by hard-wired method to the MIMIC panel and the PLC panels. The oper-
ator station connects the MIMIC panel, the PLCs and the printer through RS 232C or RS 485 for data
communication. The SCADA system configuration at V Valley with 60 MLD is shown in Figure 3.4.9.
Figure 3.4.9 Typical Control System Architecture at STP –Phase-1
For any control and automation system to function as desired, it is important to select the right vendor to
supply and execute the control and automation projects. The various vendors who have experience to
form the control and automation solution for both water and sewerage systems at BWSSB are listed be-
low.
i. M/s Schneider Electric
ii. M/s Mitsubishi Electric
iii. M/s Yokogawa
iv. M/s Siemens
v. M/s ABB
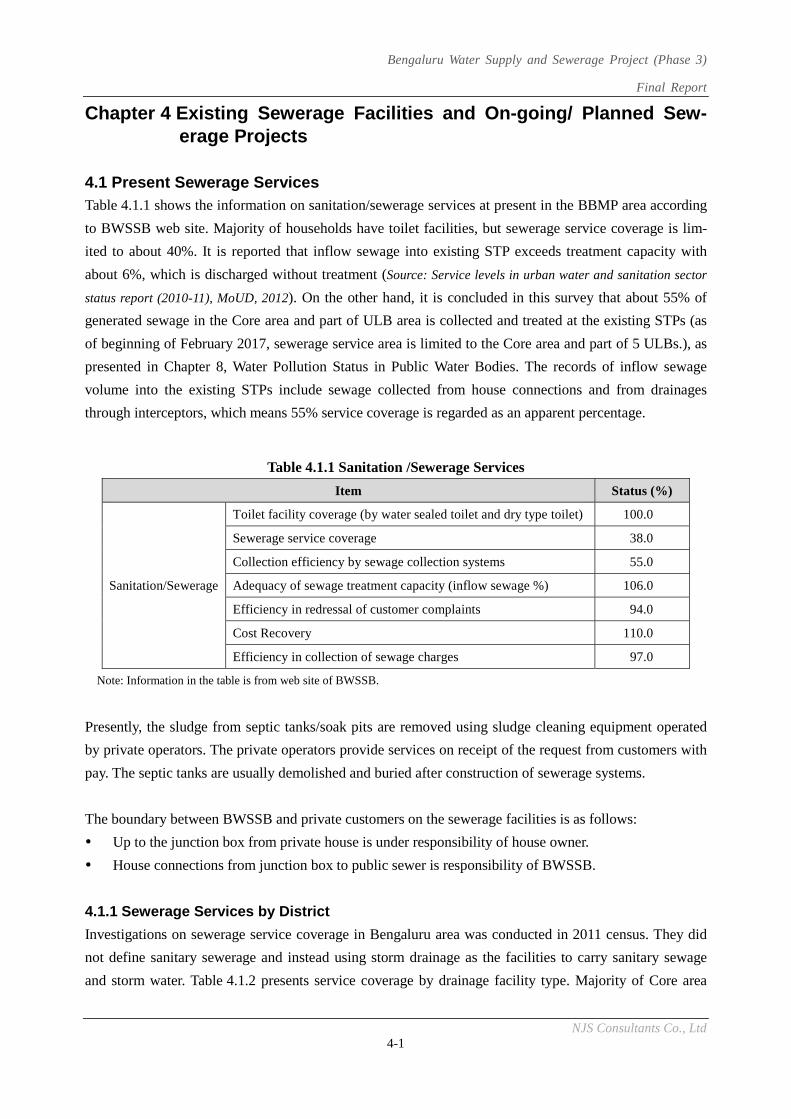
Bengaluru Water Supply and Sewerage Project (Phase 3)
Final Report
NJS Consultants Co., Ltd 4-1
Chapter 4 Existing Sewerage Facilities and On-going/ Planned Sew-erage Projects
4.1 Present Sewerage Services Table 4.1.1 shows the information on sanitation/sewerage services at present in the BBMP area according
to BWSSB web site. Majority of households have toilet facilities, but sewerage service coverage is lim-
ited to about 40%. It is reported that inflow sewage into existing STP exceeds treatment capacity with
about 6%, which is discharged without treatment (Source: Service levels in urban water and sanitation sector
status report (2010-11), MoUD, 2012). On the other hand, it is concluded in this survey that about 55% of
generated sewage in the Core area and part of ULB area is collected and treated at the existing STPs (as
of beginning of February 2017, sewerage service area is limited to the Core area and part of 5 ULBs.), as
presented in Chapter 8, Water Pollution Status in Public Water Bodies. The records of inflow sewage
volume into the existing STPs include sewage collected from house connections and from drainages
through interceptors, which means 55% service coverage is regarded as an apparent percentage.
Table 4.1.1 Sanitation /Sewerage Services
Item Status (%)
Sanitation/Sewerage
Toilet facility coverage (by water sealed toilet and dry type toilet) 100.0
Sewerage service coverage 38.0
Collection efficiency by sewage collection systems 55.0
Adequacy of sewage treatment capacity (inflow sewage %) 106.0
Efficiency in redressal of customer complaints 94.0
Cost Recovery 110.0
Efficiency in collection of sewage charges 97.0
Note: Information in the table is from web site of BWSSB.
Presently, the sludge from septic tanks/soak pits are removed using sludge cleaning equipment operated
by private operators. The private operators provide services on receipt of the request from customers with
pay. The septic tanks are usually demolished and buried after construction of sewerage systems.
The boundary between BWSSB and private customers on the sewerage facilities is as follows:
Up to the junction box from private house is under responsibility of house owner.
House connections from junction box to public sewer is responsibility of BWSSB.
4.1.1 Sewerage Services by District
Investigations on sewerage service coverage in Bengaluru area was conducted in 2011 census. They did
not define sanitary sewerage and instead using storm drainage as the facilities to carry sanitary sewage
and storm water. Table 4.1.2 presents service coverage by drainage facility type. Majority of Core area
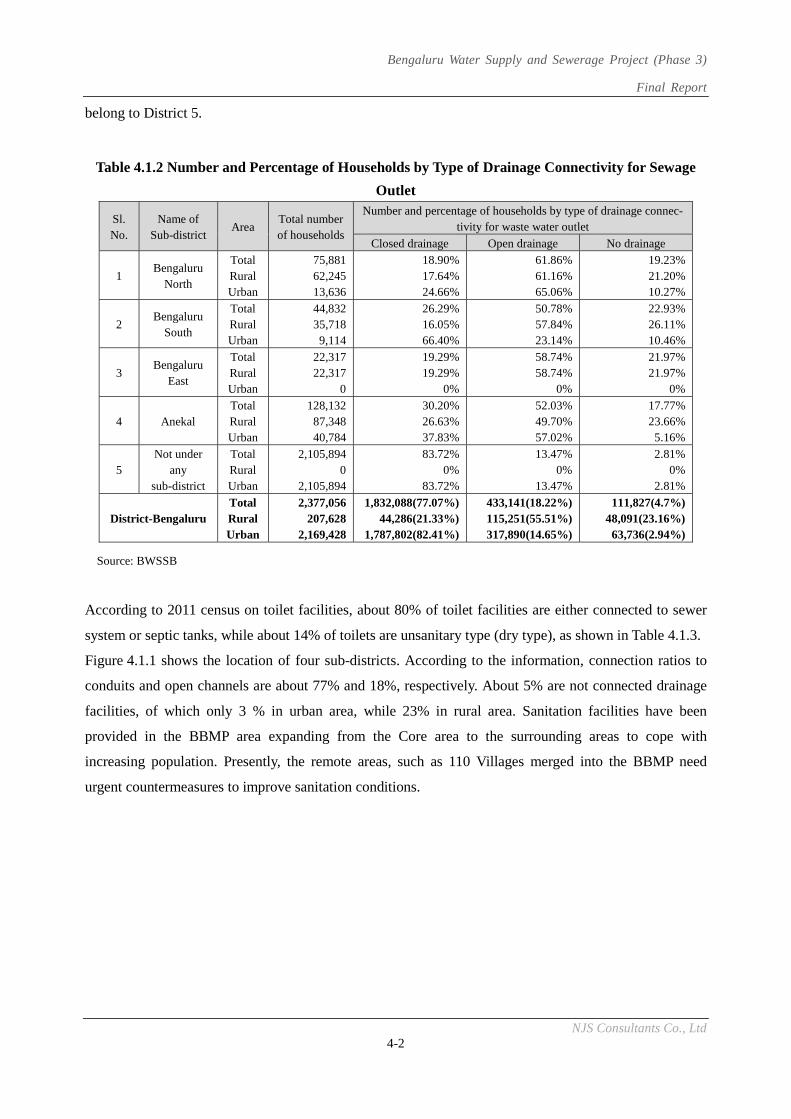
Bengaluru Water Supply and Sewerage Project (Phase 3)
Final Report
NJS Consultants Co., Ltd 4-2
belong to District 5.
Table 4.1.2 Number and Percentage of Households by Type of Drainage Connectivity for Sewage
Outlet
Sl. No.
Name of Sub-district
Area Total number of households
Number and percentage of households by type of drainage connec-tivity for waste water outlet
Closed drainage Open drainage No drainage
1 Bengaluru
North
Total RuralUrban
75,88162,24513,636
18.90% 17.64% 24.66%
61.86% 61.16% 65.06%
19.23%21.20%10.27%
2 Bengaluru
South
Total RuralUrban
44,83235,7189,114
26.29% 16.05%66.40%
50.78% 57.84% 23.14%
22.93%26.11%10.46%
3 Bengaluru
East
Total RuralUrban
22,31722,317
0
19.29%19.29%
0%
58.74% 58.74%
0%
21.97%21.97%
0%
4 Anekal Total RuralUrban
128,13287,34840,784
30.20%26.63%37.83%
52.03% 49.70% 57.02%
17.77%23.66%5.16%
5 Not under
any sub-district
Total RuralUrban
2,105,8940
2,105,894
83.72%0%
83.72%
13.47% 0%
13.47%
2.81%0%
2.81%
District-BengaluruTotalRuralUrban
2,377,056207,628
2,169,428
1,832,088(77.07%) 44,286(21.33%)
1,787,802(82.41%)
433,141(18.22%) 115,251(55.51%) 317,890(14.65%)
111,827(4.7%)48,091(23.16%)
63,736(2.94%)
Source: BWSSB
According to 2011 census on toilet facilities, about 80% of toilet facilities are either connected to sewer
system or septic tanks, while about 14% of toilets are unsanitary type (dry type), as shown in Table 4.1.3.
Figure 4.1.1 shows the location of four sub-districts. According to the information, connection ratios to
conduits and open channels are about 77% and 18%, respectively. About 5% are not connected drainage
facilities, of which only 3 % in urban area, while 23% in rural area. Sanitation facilities have been
provided in the BBMP area expanding from the Core area to the surrounding areas to cope with
increasing population. Presently, the remote areas, such as 110 Villages merged into the BBMP need
urgent countermeasures to improve sanitation conditions.
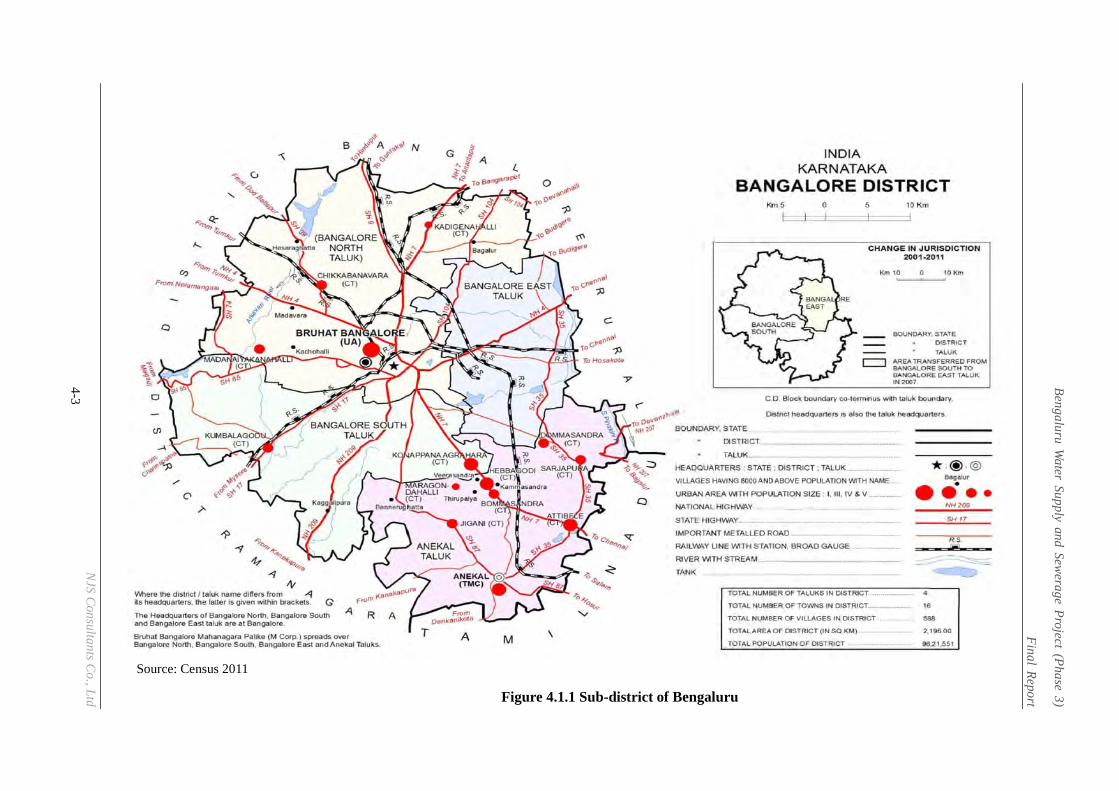
Bengaluru Water Supply and Sewerage Project (Phase 3)
Final Report
NJS Consultants Co., Ltd 4-3
Figure 4.1.1 Sub-district of Bengaluru
Source: Census 2011
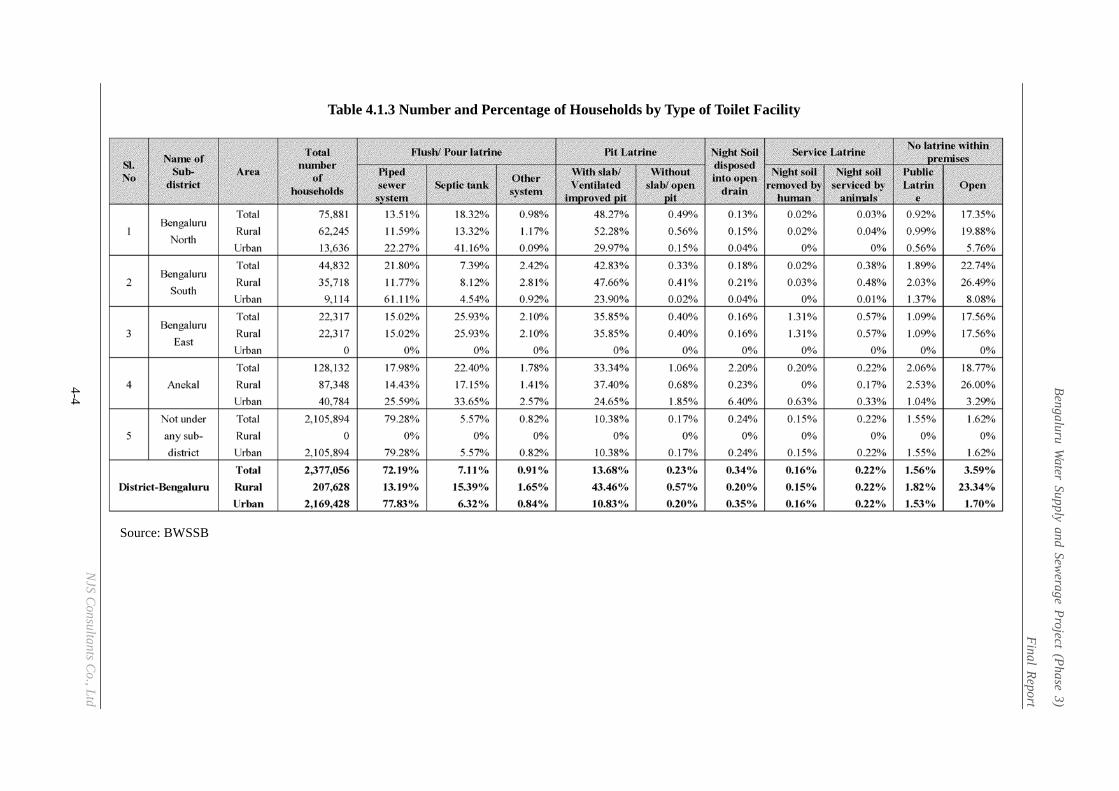
Bengaluru Water Supply and Sewerage Project (Phase 3)
Final Report
NJS Consultants Co., Ltd 4-4
Table 4.1.3 Number and Percentage of Households by Type of Toilet Facility
Source: BWSSB
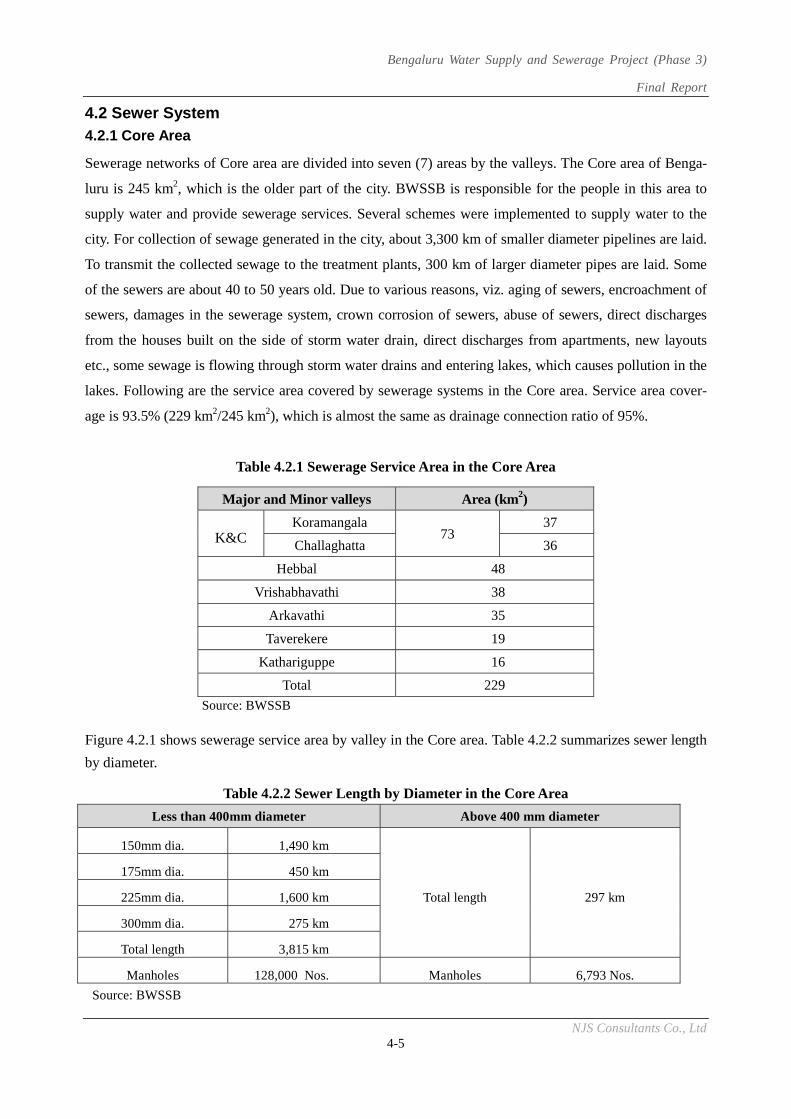
Bengaluru Water Supply and Sewerage Project (Phase 3)
Final Report
NJS Consultants Co., Ltd 4-5
4.2 Sewer System 4.2.1 Core Area
Sewerage networks of Core area are divided into seven (7) areas by the valleys. The Core area of Benga-
luru is 245 km2, which is the older part of the city. BWSSB is responsible for the people in this area to
supply water and provide sewerage services. Several schemes were implemented to supply water to the
city. For collection of sewage generated in the city, about 3,300 km of smaller diameter pipelines are laid.
To transmit the collected sewage to the treatment plants, 300 km of larger diameter pipes are laid. Some
of the sewers are about 40 to 50 years old. Due to various reasons, viz. aging of sewers, encroachment of
sewers, damages in the sewerage system, crown corrosion of sewers, abuse of sewers, direct discharges
from the houses built on the side of storm water drain, direct discharges from apartments, new layouts
etc., some sewage is flowing through storm water drains and entering lakes, which causes pollution in the
lakes. Following are the service area covered by sewerage systems in the Core area. Service area cover-
age is 93.5% (229 km2/245 km2), which is almost the same as drainage connection ratio of 95%.
Table 4.2.1 Sewerage Service Area in the Core Area
Source: BWSSB
Figure 4.2.1 shows sewerage service area by valley in the Core area. Table 4.2.2 summarizes sewer length
by diameter.
Table 4.2.2 Sewer Length by Diameter in the Core Area
Less than 400mm diameter Above 400 mm diameter
150mm dia. 1,490 km
Total length 297 km
175mm dia. 450 km
225mm dia. 1,600 km
300mm dia. 275 km
Total length 3,815 km
Manholes 128,000 Nos. Manholes 6,793 Nos.
Source: BWSSB
Major and Minor valleys Area (km2)
K&C Koramangala
73 37
Challaghatta 36
Hebbal 48
Vrishabhavathi 38
Arkavathi 35
Taverekere 19
Kathariguppe 16
Total 229
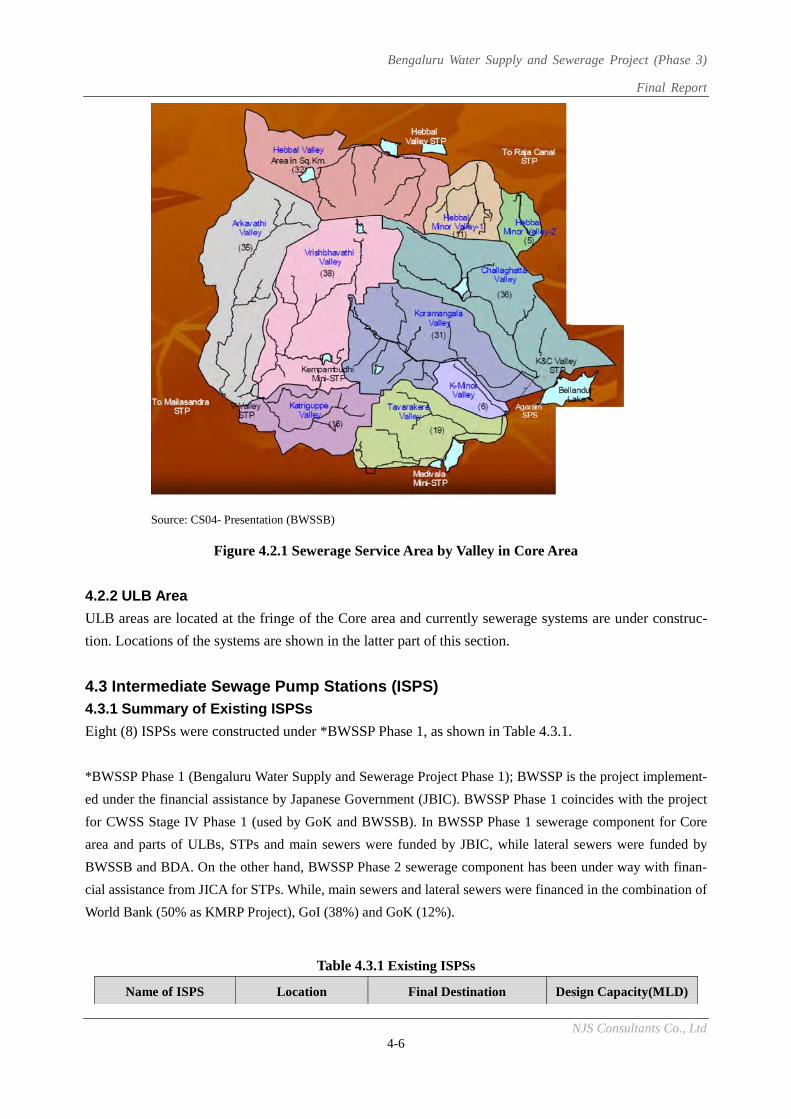
Bengaluru Water Supply and Sewerage Project (Phase 3)
Final Report
NJS Consultants Co., Ltd 4-6
Source: CS04- Presentation (BWSSB)
Figure 4.2.1 Sewerage Service Area by Valley in Core Area
4.2.2 ULB Area
ULB areas are located at the fringe of the Core area and currently sewerage systems are under construc-
tion. Locations of the systems are shown in the latter part of this section.
4.3 Intermediate Sewage Pump Stations (ISPS) 4.3.1 Summary of Existing ISPSs
Eight (8) ISPSs were constructed under *BWSSP Phase 1, as shown in Table 4.3.1.
*BWSSP Phase 1 (Bengaluru Water Supply and Sewerage Project Phase 1); BWSSP is the project implement-
ed under the financial assistance by Japanese Government (JBIC). BWSSP Phase 1 coincides with the project
for CWSS Stage IV Phase 1 (used by GoK and BWSSB). In BWSSP Phase 1 sewerage component for Core
area and parts of ULBs, STPs and main sewers were funded by JBIC, while lateral sewers were funded by
BWSSB and BDA. On the other hand, BWSSP Phase 2 sewerage component has been under way with finan-
cial assistance from JICA for STPs. While, main sewers and lateral sewers were financed in the combination of
World Bank (50% as KMRP Project), GoI (38%) and GoK (12%).
Table 4.3.1 Existing ISPSs
Name of ISPS Location Final Destination Design Capacity(MLD)
Bengaluru Water Supply and Sewerage Project (Phase 3)
Final Report
NJS Consultants Co., Ltd 4-7
Name of ISPS Location Final Destination Design Capacity(MLD)
1 Agaram Core Area K&C Valley 30MLD STP 65
2 Subramanya Pura R.R. Nagar Zone Mailasandra 75MLD STP 50
3 Bagalkunte Dasarahalli Zone Nagasandra 20MLD STP 30
4 Kaggadasapura K.R. Puram CMC Kadabeesanahalli 50MLD STP 30
5 Horamavu Bytrayanapura zone Raja Canal 40MLD STP 30
6 N.K.Halli Dasrahalli CMC Nagasandra 20MLD STP 25
7 Basavapura K.R. Puram CMC K.R. Puram 20MLD STP 20
8 Myadarahalli Dasarahalli Zone Bagalkunte ISPS 15
Source: JICA Survey Team
4.3.2 Present Situation of Agaram 65 MLD ISPSs
Information on Agaram ISPS, which is the largest ISPS among the 8 ISPSs of BWSSP Phase 1, is as fol-
lows:
(1) Year of Commissioning: 2004
(2) Flow Diagram
The ISPS comprises a raw sewage chamber, two coarse screen channels that have automatic coarse
screens, two wet wells, and two dry wells that have 4 nos. sewage pumps.
(3) Major Equipment
Sluice Gates: 5 Nos.
Coarse Screens: Automatic Climber Type, Opening 50mm; 2 Nos.
Sewage Pumps: 1000 m3/h, 132kW, 4 Nos. (3w+1S)
Hoist: 5ton; 1 Nos.
Diesel Generator (D.G.): 500kVA, 1 Nos.
Transformer: 500kVA, 2 Nos.
UPS system: 4 hours backup capacity for instrument control panel
PLC: Equipped with battery backed EEPROM and redundant power supply system to avoid down
time during power failure
Level Switch: float type
(4) State of Equipment
Presently, the ISPS is running with full capacity. The equipment is operated without any problem.
Screenings caught at the coarse screens are removed with a full of two (2) ton container per day, which
include many plastic materials. Photo 4.3.1 to Photo 4.3.3 presents concerned facilities. Power failures
occur about 10-20 times per month and DG (Diesel Generator) is operated for about 7-12 hours per
Inlet Raw Sewage
Chamber
Coarse Screen
Channels Wet Wells
Dry Wells
(Sewage Pumps) To STP
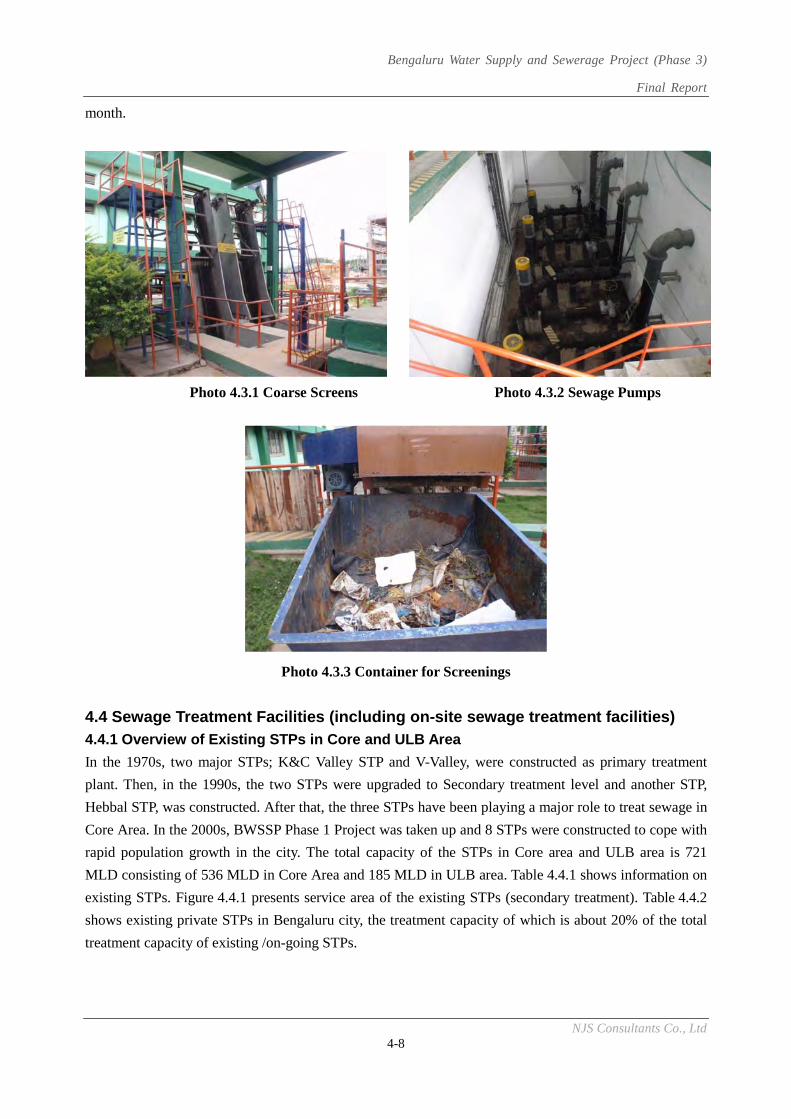
Bengaluru Water Supply and Sewerage Project (Phase 3)
Final Report
NJS Consultants Co., Ltd 4-8
month.
Photo 4.3.1 Coarse Screens Photo 4.3.2 Sewage Pumps
Photo 4.3.3 Container for Screenings
4.4 Sewage Treatment Facilities (including on-site sewage treatment facilities) 4.4.1 Overview of Existing STPs in Core and ULB Area
In the 1970s, two major STPs; K&C Valley STP and V-Valley, were constructed as primary treatment
plant. Then, in the 1990s, the two STPs were upgraded to Secondary treatment level and another STP,
Hebbal STP, was constructed. After that, the three STPs have been playing a major role to treat sewage in
Core Area. In the 2000s, BWSSP Phase 1 Project was taken up and 8 STPs were constructed to cope with
rapid population growth in the city. The total capacity of the STPs in Core area and ULB area is 721
MLD consisting of 536 MLD in Core Area and 185 MLD in ULB area. Table 4.4.1 shows information on
existing STPs. Figure 4.4.1 presents service area of the existing STPs (secondary treatment). Table 4.4.2
shows existing private STPs in Bengaluru city, the treatment capacity of which is about 20% of the total
treatment capacity of existing /on-going STPs.
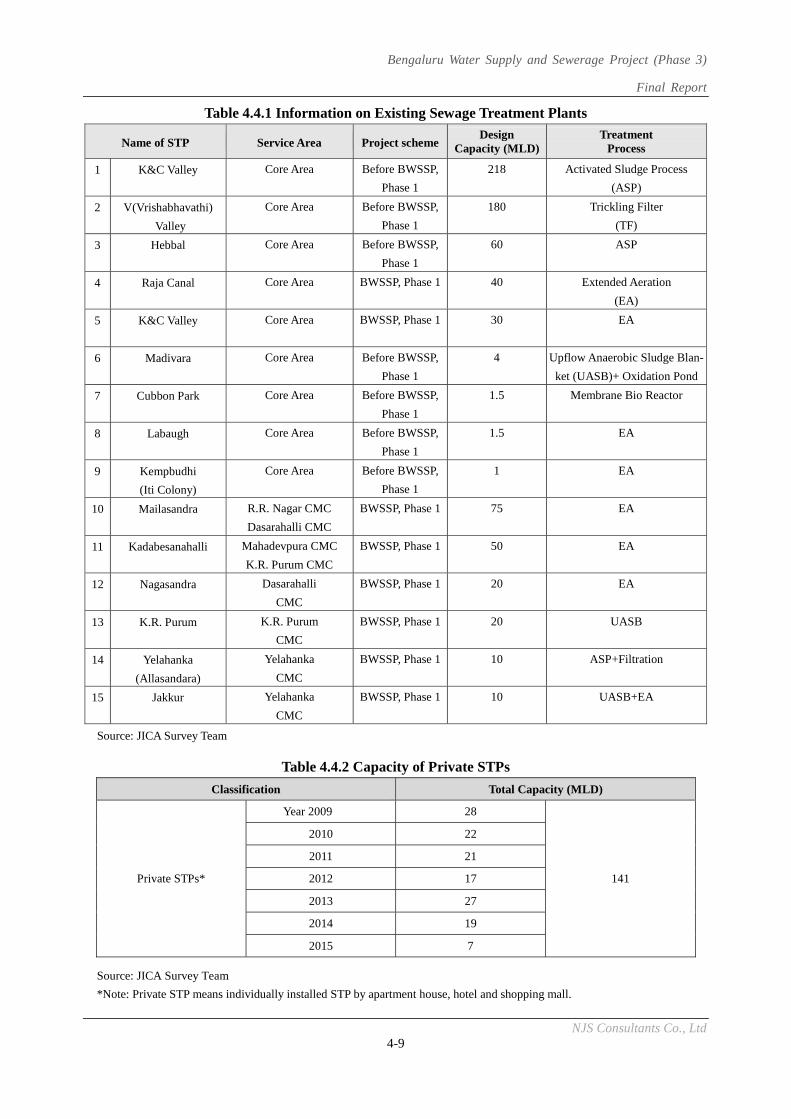
Bengaluru Water Supply and Sewerage Project (Phase 3)
Final Report
NJS Consultants Co., Ltd 4-9
Table 4.4.1 Information on Existing Sewage Treatment Plants
Name of STP Service Area Project schemeDesign
Capacity (MLD)Treatment
Process
1 K&C Valley Core Area Before BWSSP,
Phase 1
218 Activated Sludge Process
(ASP)
2 V(Vrishabhavathi)
Valley
Core Area Before BWSSP,
Phase 1
180 Trickling Filter
(TF)
3 Hebbal Core Area Before BWSSP,
Phase 1
60 ASP
4 Raja Canal Core Area
BWSSP, Phase 1 40 Extended Aeration
(EA)
5 K&C Valley Core Area BWSSP, Phase 1 30 EA
6 Madivara Core Area Before BWSSP,
Phase 1
4 Upflow Anaerobic Sludge Blan-
ket (UASB)+ Oxidation Pond
7 Cubbon Park Core Area Before BWSSP,
Phase 1
1.5 Membrane Bio Reactor
8 Labaugh Core Area Before BWSSP,
Phase 1
1.5 EA
9 Kempbudhi
(Iti Colony)
Core Area Before BWSSP,
Phase 1
1 EA
10 Mailasandra R.R. Nagar CMC
Dasarahalli CMC
BWSSP, Phase 1 75 EA
11 Kadabesanahalli Mahadevpura CMC
K.R. Purum CMC
BWSSP, Phase 1 50 EA
12 Nagasandra Dasarahalli
CMC
BWSSP, Phase 1 20 EA
13 K.R. Purum K.R. Purum
CMC
BWSSP, Phase 1 20 UASB
14 Yelahanka
(Allasandara)
Yelahanka
CMC
BWSSP, Phase 1 10 ASP+Filtration
15 Jakkur Yelahanka
CMC
BWSSP, Phase 1 10 UASB+EA
Source: JICA Survey Team
Table 4.4.2 Capacity of Private STPs
Classification Total Capacity (MLD)
Private STPs*
Year 2009 28
141
2010 22
2011 21
2012 17
2013 27
2014 19
2015 7
Source: JICA Survey Team
*Note: Private STP means individually installed STP by apartment house, hotel and shopping mall.
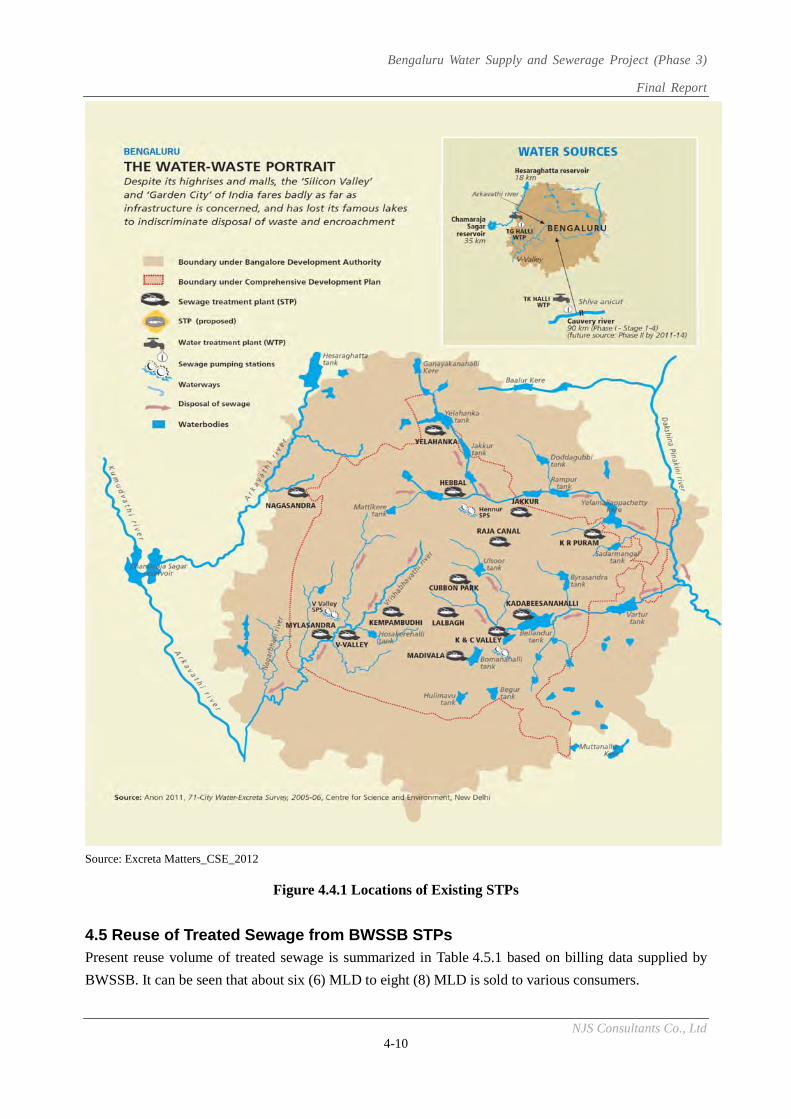
Bengaluru Water Supply and Sewerage Project (Phase 3)
Final Report
NJS Consultants Co., Ltd 4-10
Source: Excreta Matters_CSE_2012
Figure 4.4.1 Locations of Existing STPs
4.5 Reuse of Treated Sewage from BWSSB STPs Present reuse volume of treated sewage is summarized in Table 4.5.1 based on billing data supplied by
BWSSB. It can be seen that about six (6) MLD to eight (8) MLD is sold to various consumers.
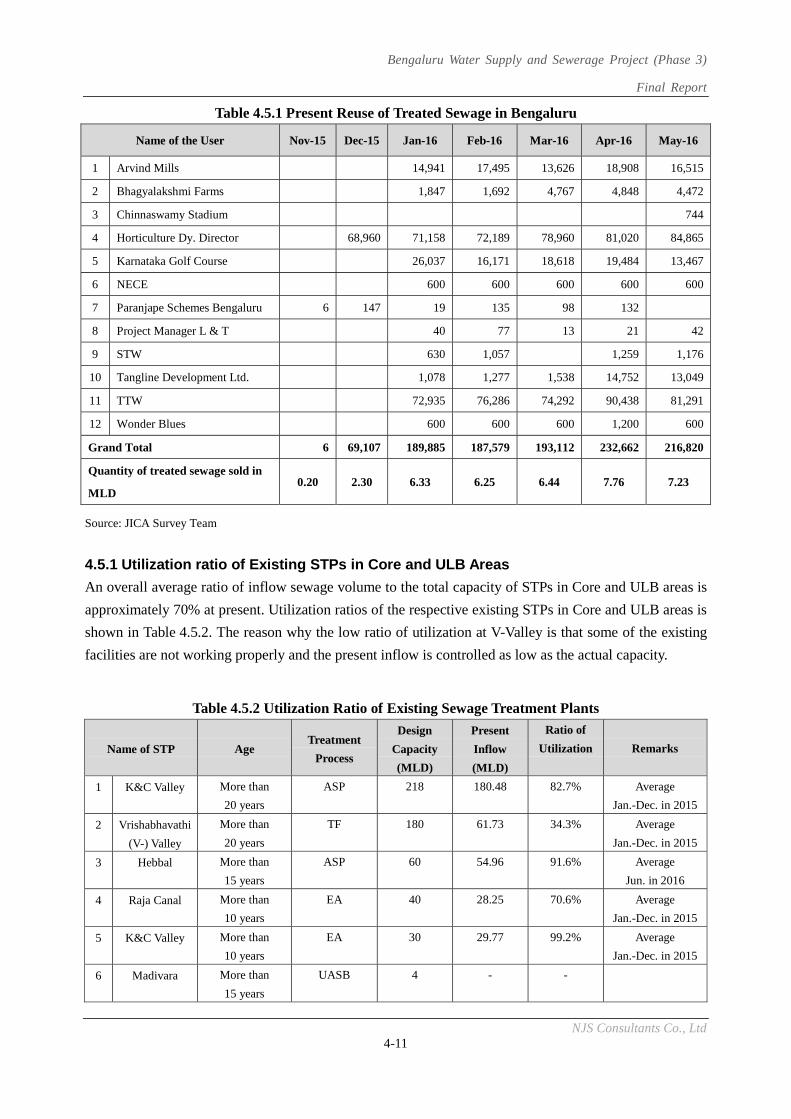
Bengaluru Water Supply and Sewerage Project (Phase 3)
Final Report
NJS Consultants Co., Ltd 4-11
Table 4.5.1 Present Reuse of Treated Sewage in Bengaluru
Name of the User Nov-15 Dec-15 Jan-16 Feb-16 Mar-16 Apr-16 May-16
1 Arvind Mills 14,941 17,495 13,626 18,908 16,515
2 Bhagyalakshmi Farms 1,847 1,692 4,767 4,848 4,472
3 Chinnaswamy Stadium 744
4 Horticulture Dy. Director 68,960 71,158 72,189 78,960 81,020 84,865
5 Karnataka Golf Course 26,037 16,171 18,618 19,484 13,467
6 NECE 600 600 600 600 600
7 Paranjape Schemes Bengaluru 6 147 19 135 98 132
8 Project Manager L & T 40 77 13 21 42
9 STW 630 1,057 1,259 1,176
10 Tangline Development Ltd. 1,078 1,277 1,538 14,752 13,049
11 TTW 72,935 76,286 74,292 90,438 81,291
12 Wonder Blues 600 600 600 1,200 600
Grand Total 6 69,107 189,885 187,579 193,112 232,662 216,820
Quantity of treated sewage sold in
MLD 0.20 2.30 6.33 6.25 6.44 7.76 7.23
Source: JICA Survey Team
4.5.1 Utilization ratio of Existing STPs in Core and ULB Areas
An overall average ratio of inflow sewage volume to the total capacity of STPs in Core and ULB areas is
approximately 70% at present. Utilization ratios of the respective existing STPs in Core and ULB areas is
shown in Table 4.5.2. The reason why the low ratio of utilization at V-Valley is that some of the existing
facilities are not working properly and the present inflow is controlled as low as the actual capacity.
Table 4.5.2 Utilization Ratio of Existing Sewage Treatment Plants
Name of STP Age Treatment
Process
Design
Capacity
(MLD)
Present
Inflow
(MLD)
Ratio of
Utilization Remarks
1 K&C Valley More than
20 years
ASP 218 180.48
82.7% Average
Jan.-Dec. in 2015
2 Vrishabhavathi
(V-) Valley
More than
20 years
TF 180 61.73
34.3% Average
Jan.-Dec. in 2015
3 Hebbal More than
15 years
ASP 60 54.96 91.6% Average
Jun. in 2016
4 Raja Canal More than
10 years
EA 40 28.25 70.6% Average
Jan.-Dec. in 2015
5 K&C Valley More than
10 years
EA 30 29.77 99.2% Average
Jan.-Dec. in 2015
6 Madivara More than
15 years
UASB 4 - -
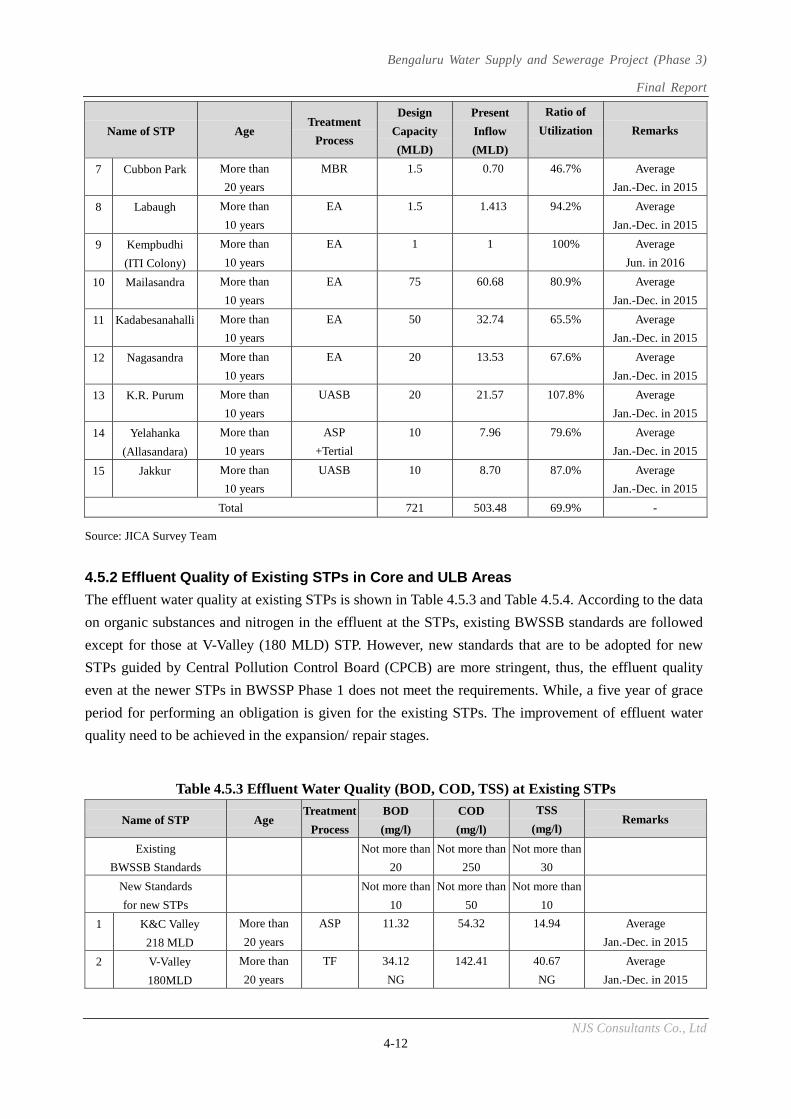
Bengaluru Water Supply and Sewerage Project (Phase 3)
Final Report
NJS Consultants Co., Ltd 4-12
Name of STP Age Treatment
Process
Design
Capacity
(MLD)
Present
Inflow
(MLD)
Ratio of
Utilization Remarks
7 Cubbon Park More than
20 years
MBR 1.5 0.70
46.7% Average
Jan.-Dec. in 2015
8 Labaugh More than
10 years
EA 1.5 1.413
94.2% Average
Jan.-Dec. in 2015
9 Kempbudhi
(ITI Colony)
More than
10 years
EA 1 1 100% Average
Jun. in 2016
10 Mailasandra More than
10 years
EA 75 60.68
80.9% Average
Jan.-Dec. in 2015
11 Kadabesanahalli More than
10 years
EA 50 32.74
65.5% Average
Jan.-Dec. in 2015
12 Nagasandra More than
10 years
EA 20 13.53
67.6% Average
Jan.-Dec. in 2015
13 K.R. Purum More than
10 years
UASB 20 21.57 107.8% Average
Jan.-Dec. in 2015
14 Yelahanka
(Allasandara)
More than
10 years
ASP
+Tertial
10 7.96 79.6% Average
Jan.-Dec. in 2015
15 Jakkur More than
10 years
UASB 10 8.70 87.0% Average
Jan.-Dec. in 2015
Total 721 503.48 69.9% -
Source: JICA Survey Team
4.5.2 Effluent Quality of Existing STPs in Core and ULB Areas
The effluent water quality at existing STPs is shown in Table 4.5.3 and Table 4.5.4. According to the data
on organic substances and nitrogen in the effluent at the STPs, existing BWSSB standards are followed
except for those at V-Valley (180 MLD) STP. However, new standards that are to be adopted for new
STPs guided by Central Pollution Control Board (CPCB) are more stringent, thus, the effluent quality
even at the newer STPs in BWSSP Phase 1 does not meet the requirements. While, a five year of grace
period for performing an obligation is given for the existing STPs. The improvement of effluent water
quality need to be achieved in the expansion/ repair stages.
Table 4.5.3 Effluent Water Quality (BOD, COD, TSS) at Existing STPs
Name of STP Age Treatment
Process
BOD
(mg/l)
COD
(mg/l)
TSS
(mg/l) Remarks
Existing
BWSSB Standards
Not more than
20
Not more than
250
Not more than
30
New Standards
for new STPs
Not more than
10
Not more than
50
Not more than
10
1 K&C Valley
218 MLD
More than
20 years
ASP 11.32
54.32
14.94
Average
Jan.-Dec. in 2015
2 V-Valley
180MLD
More than
20 years
TF 34.12
NG
142.41
40.67
NG
Average
Jan.-Dec. in 2015
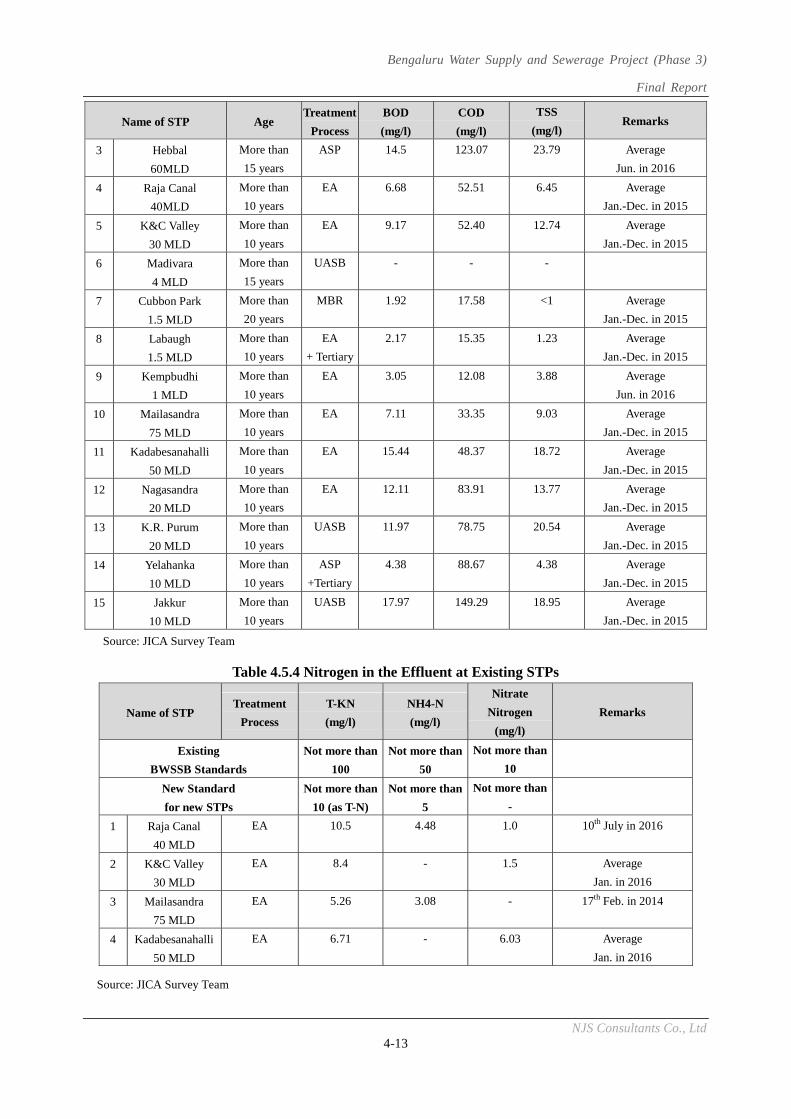
Bengaluru Water Supply and Sewerage Project (Phase 3)
Final Report
NJS Consultants Co., Ltd 4-13
Name of STP Age Treatment
Process
BOD
(mg/l)
COD
(mg/l)
TSS
(mg/l) Remarks
3 Hebbal
60MLD
More than
15 years
ASP 14.5
123.07
23.79
Average
Jun. in 2016
4 Raja Canal
40MLD
More than
10 years
EA 6.68
52.51
6.45 Average
Jan.-Dec. in 2015
5 K&C Valley
30 MLD
More than
10 years
EA 9.17 52.40 12.74 Average
Jan.-Dec. in 2015
6 Madivara
4 MLD
More than
15 years
UASB - - -
7 Cubbon Park
1.5 MLD
More than
20 years
MBR 1.92 17.58 <1 Average
Jan.-Dec. in 2015
8 Labaugh
1.5 MLD
More than
10 years
EA
+ Tertiary
2.17 15.35 1.23 Average
Jan.-Dec. in 2015
9 Kempbudhi
1 MLD
More than
10 years
EA
3.05 12.08 3.88 Average
Jun. in 2016
10 Mailasandra
75 MLD
More than
10 years
EA 7.11 33.35 9.03 Average
Jan.-Dec. in 2015
11 Kadabesanahalli
50 MLD
More than
10 years
EA 15.44 48.37 18.72 Average
Jan.-Dec. in 2015
12 Nagasandra
20 MLD
More than
10 years
EA 12.11 83.91 13.77 Average
Jan.-Dec. in 2015
13 K.R. Purum
20 MLD
More than
10 years
UASB 11.97 78.75 20.54 Average
Jan.-Dec. in 2015
14 Yelahanka
10 MLD
More than
10 years
ASP
+Tertiary
4.38 88.67 4.38 Average
Jan.-Dec. in 2015
15 Jakkur
10 MLD
More than
10 years
UASB 17.97 149.29 18.95 Average
Jan.-Dec. in 2015
Source: JICA Survey Team
Table 4.5.4 Nitrogen in the Effluent at Existing STPs
Name of STP Treatment
Process
T-KN
(mg/l)
NH4-N
(mg/l)
Nitrate
Nitrogen
(mg/l)
Remarks
Existing
BWSSB Standards
Not more than
100
Not more than
50
Not more than
10
New Standard
for new STPs
Not more than
10 (as T-N)
Not more than
5
Not more than
-
1 Raja Canal
40 MLD
EA 10.5
4.48
1.0 10th July in 2016
2 K&C Valley
30 MLD
EA 8.4 - 1.5 Average
Jan. in 2016
3 Mailasandra
75 MLD
EA 5.26 3.08 - 17th Feb. in 2014
4 Kadabesanahalli
50 MLD
EA 6.71 - 6.03 Average
Jan. in 2016
Source: JICA Survey Team
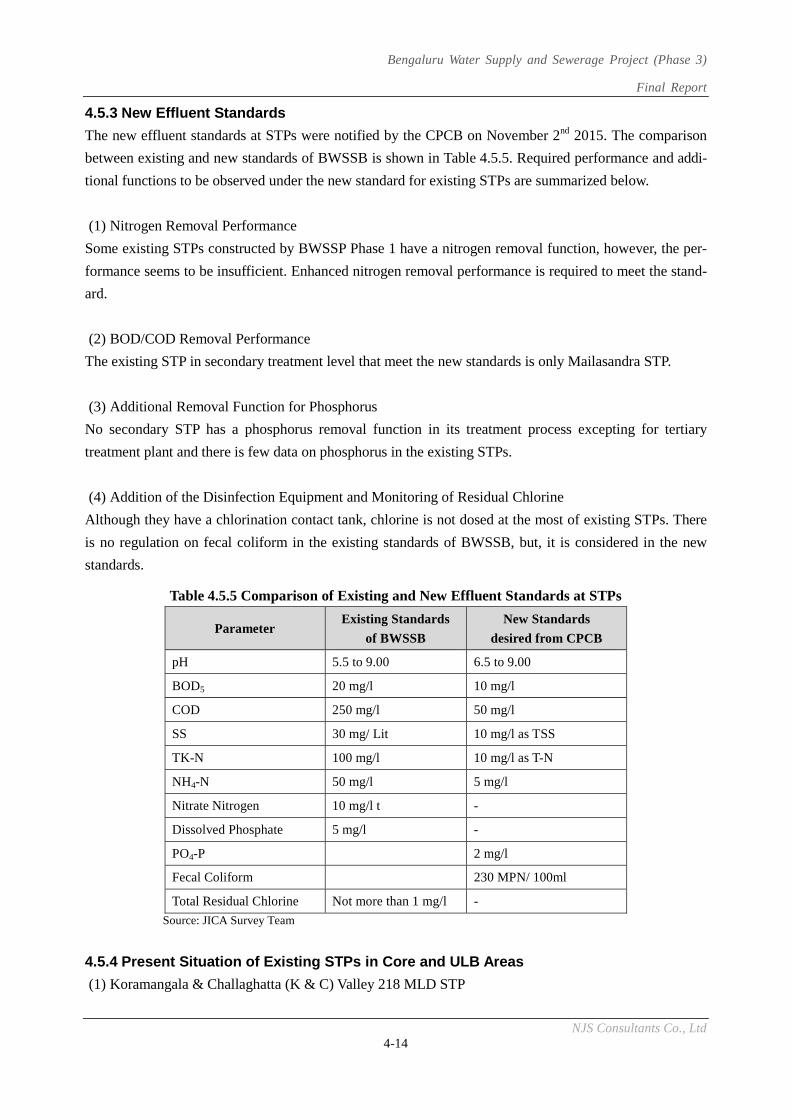
Bengaluru Water Supply and Sewerage Project (Phase 3)
Final Report
NJS Consultants Co., Ltd 4-14
4.5.3 New Effluent Standards
The new effluent standards at STPs were notified by the CPCB on November 2nd 2015. The comparison
between existing and new standards of BWSSB is shown in Table 4.5.5. Required performance and addi-
tional functions to be observed under the new standard for existing STPs are summarized below.
(1) Nitrogen Removal Performance
Some existing STPs constructed by BWSSP Phase 1 have a nitrogen removal function, however, the per-
formance seems to be insufficient. Enhanced nitrogen removal performance is required to meet the stand-
ard.
(2) BOD/COD Removal Performance
The existing STP in secondary treatment level that meet the new standards is only Mailasandra STP.
(3) Additional Removal Function for Phosphorus
No secondary STP has a phosphorus removal function in its treatment process excepting for tertiary
treatment plant and there is few data on phosphorus in the existing STPs.
(4) Addition of the Disinfection Equipment and Monitoring of Residual Chlorine
Although they have a chlorination contact tank, chlorine is not dosed at the most of existing STPs. There
is no regulation on fecal coliform in the existing standards of BWSSB, but, it is considered in the new
standards.
Table 4.5.5 Comparison of Existing and New Effluent Standards at STPs
Parameter Existing Standards
of BWSSB
New Standards
desired from CPCB
pH 5.5 to 9.00 6.5 to 9.00
BOD5 20 mg/l 10 mg/l
COD 250 mg/l 50 mg/l
SS 30 mg/ Lit 10 mg/l as TSS
TK-N 100 mg/l 10 mg/l as T-N
NH4-N 50 mg/l 5 mg/l
Nitrate Nitrogen 10 mg/l t -
Dissolved Phosphate 5 mg/l -
PO4-P 2 mg/l
Fecal Coliform 230 MPN/ 100ml
Total Residual Chlorine Not more than 1 mg/l -
Source: JICA Survey Team
4.5.4 Present Situation of Existing STPs in Core and ULB Areas
(1) Koramangala & Challaghatta (K & C) Valley 218 MLD STP
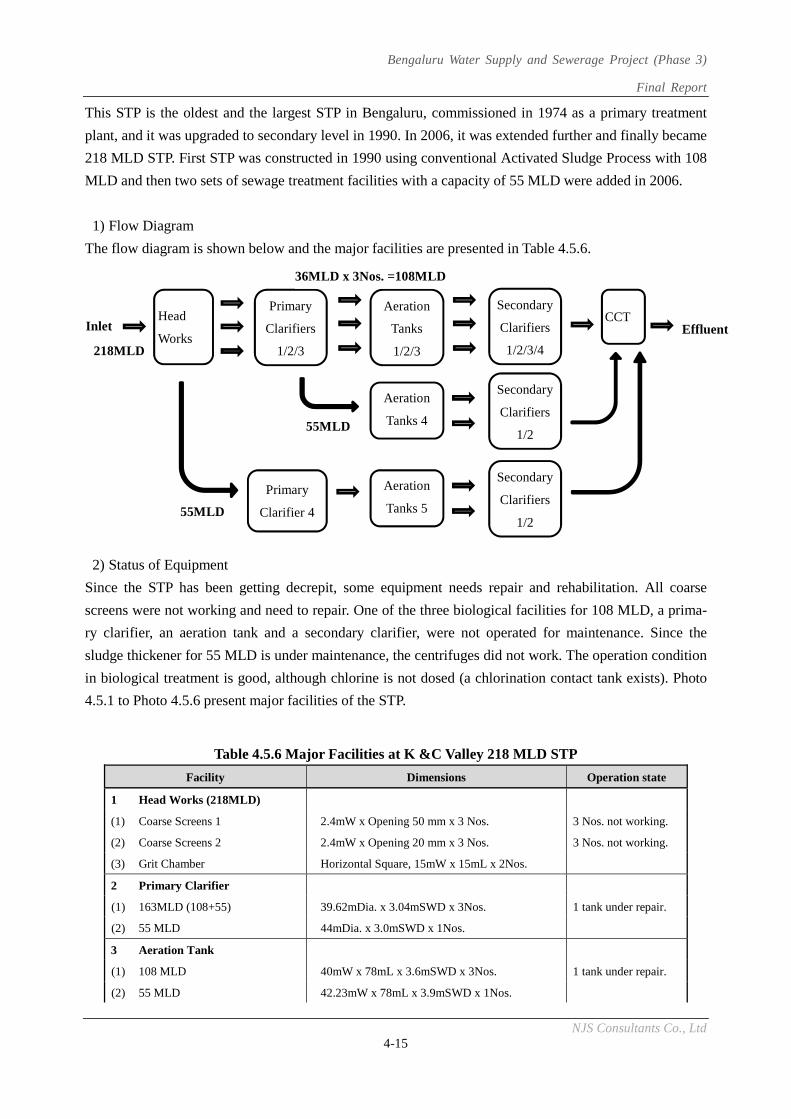
Bengaluru Water Supply and Sewerage Project (Phase 3)
Final Report
NJS Consultants Co., Ltd 4-15
This STP is the oldest and the largest STP in Bengaluru, commissioned in 1974 as a primary treatment
plant, and it was upgraded to secondary level in 1990. In 2006, it was extended further and finally became
218 MLD STP. First STP was constructed in 1990 using conventional Activated Sludge Process with 108
MLD and then two sets of sewage treatment facilities with a capacity of 55 MLD were added in 2006.
1) Flow Diagram
The flow diagram is shown below and the major facilities are presented in Table 4.5.6.
2) Status of Equipment
Since the STP has been getting decrepit, some equipment needs repair and rehabilitation. All coarse
screens were not working and need to repair. One of the three biological facilities for 108 MLD, a prima-
ry clarifier, an aeration tank and a secondary clarifier, were not operated for maintenance. Since the
sludge thickener for 55 MLD is under maintenance, the centrifuges did not work. The operation condition
in biological treatment is good, although chlorine is not dosed (a chlorination contact tank exists). Photo
4.5.1 to Photo 4.5.6 present major facilities of the STP.
Table 4.5.6 Major Facilities at K &C Valley 218 MLD STP
Facility Dimensions Operation state
1 Head Works (218MLD)
(1) Coarse Screens 1 2.4mW x Opening 50 mm x 3 Nos. 3 Nos. not working.
(2) Coarse Screens 2 2.4mW x Opening 20 mm x 3 Nos. 3 Nos. not working.
(3) Grit Chamber Horizontal Square, 15mW x 15mL x 2Nos.
2 Primary Clarifier
(1) 163MLD (108+55) 39.62mDia. x 3.04mSWD x 3Nos. 1 tank under repair.
(2) 55 MLD 44mDia. x 3.0mSWD x 1Nos.
3 Aeration Tank
(1) 108 MLD 40mW x 78mL x 3.6mSWD x 3Nos. 1 tank under repair.
(2) 55 MLD 42.23mW x 78mL x 3.9mSWD x 1Nos.
Inlet Head
Works
Primary
Clarifiers
1/2/3
Aeration
Tanks
1/2/3
Effluent
Secondary
Clarifiers
1/2/3/4
CCT
Aeration
Tanks 4
Secondary
Clarifiers
1/2
Primary
Clarifier 4
Aeration
Tanks 5
Secondary
Clarifiers
1/2 55MLD
55MLD
36MLD x 3Nos. =108MLD
218MLD
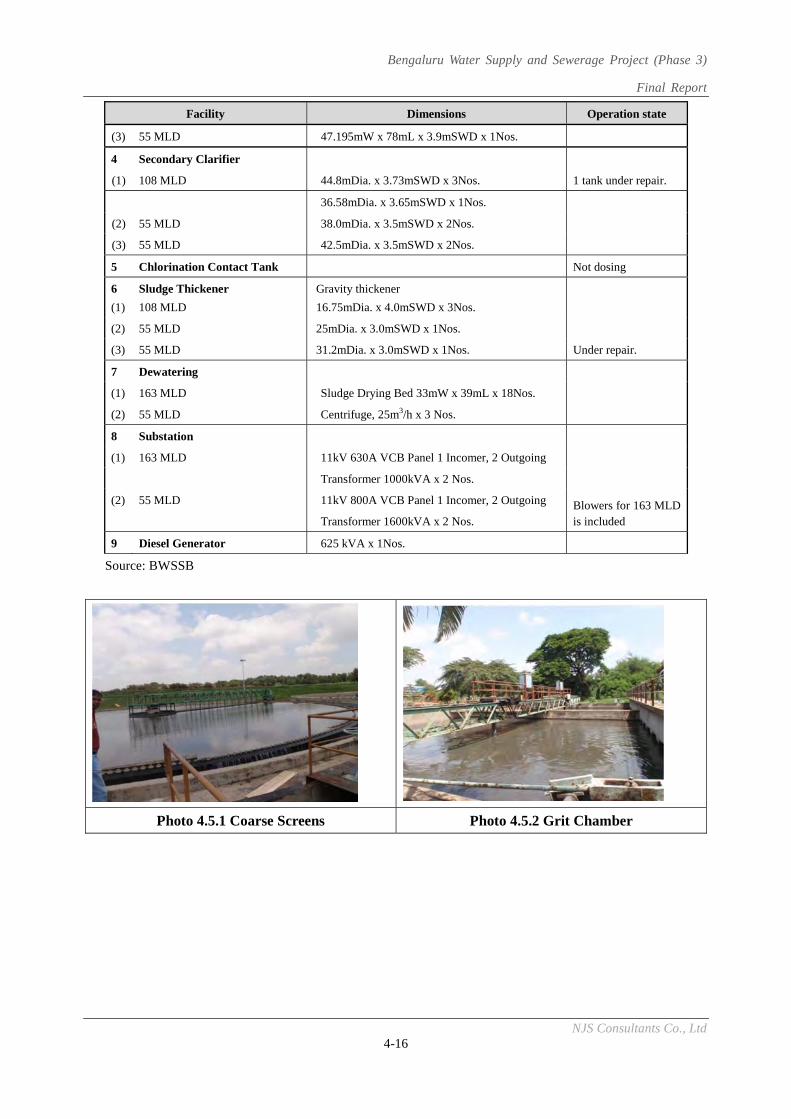
Bengaluru Water Supply and Sewerage Project (Phase 3)
Final Report
NJS Consultants Co., Ltd 4-16
Facility Dimensions Operation state
(3) 55 MLD 47.195mW x 78mL x 3.9mSWD x 1Nos.
4 Secondary Clarifier
(1) 108 MLD 44.8mDia. x 3.73mSWD x 3Nos. 1 tank under repair.
36.58mDia. x 3.65mSWD x 1Nos.
(2) 55 MLD 38.0mDia. x 3.5mSWD x 2Nos.
(3) 55 MLD 42.5mDia. x 3.5mSWD x 2Nos.
5 Chlorination Contact Tank Not dosing
6
(1)
Sludge Thickener
108 MLD
Gravity thickener
16.75mDia. x 4.0mSWD x 3Nos.
(2) 55 MLD 25mDia. x 3.0mSWD x 1Nos.
(3) 55 MLD 31.2mDia. x 3.0mSWD x 1Nos. Under repair.
7 Dewatering
(1) 163 MLD Sludge Drying Bed 33mW x 39mL x 18Nos.
(2) 55 MLD Centrifuge, 25m3/h x 3 Nos.
8 Substation
(1) 163 MLD 11kV 630A VCB Panel 1 Incomer, 2 Outgoing
Transformer 1000kVA x 2 Nos.
(2) 55 MLD 11kV 800A VCB Panel 1 Incomer, 2 Outgoing Blowers for 163 MLD is included Transformer 1600kVA x 2 Nos.
9 Diesel Generator 625 kVA x 1Nos.
Source: BWSSB
Photo 4.5.1 Coarse Screens Photo 4.5.2 Grit Chamber
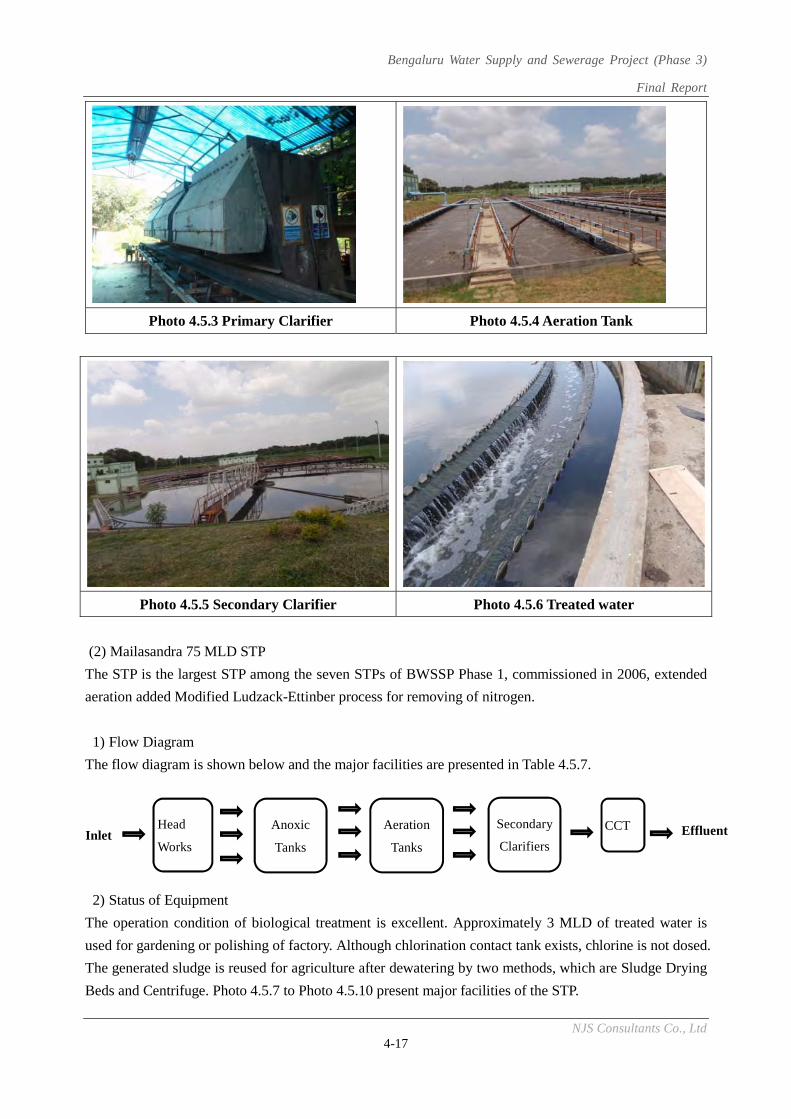
Bengaluru Water Supply and Sewerage Project (Phase 3)
Final Report
NJS Consultants Co., Ltd 4-17
Photo 4.5.3 Primary Clarifier Photo 4.5.4 Aeration Tank
Photo 4.5.5 Secondary Clarifier Photo 4.5.6 Treated water
(2) Mailasandra 75 MLD STP
The STP is the largest STP among the seven STPs of BWSSP Phase 1, commissioned in 2006, extended
aeration added Modified Ludzack-Ettinber process for removing of nitrogen.
1) Flow Diagram
The flow diagram is shown below and the major facilities are presented in Table 4.5.7.
2) Status of Equipment
The operation condition of biological treatment is excellent. Approximately 3 MLD of treated water is
used for gardening or polishing of factory. Although chlorination contact tank exists, chlorine is not dosed.
The generated sludge is reused for agriculture after dewatering by two methods, which are Sludge Drying
Beds and Centrifuge. Photo 4.5.7 to Photo 4.5.10 present major facilities of the STP.
Head
Works
Anoxic
Tanks
Aeration
Tanks Inlet EffluentSecondary
Clarifiers
CCT
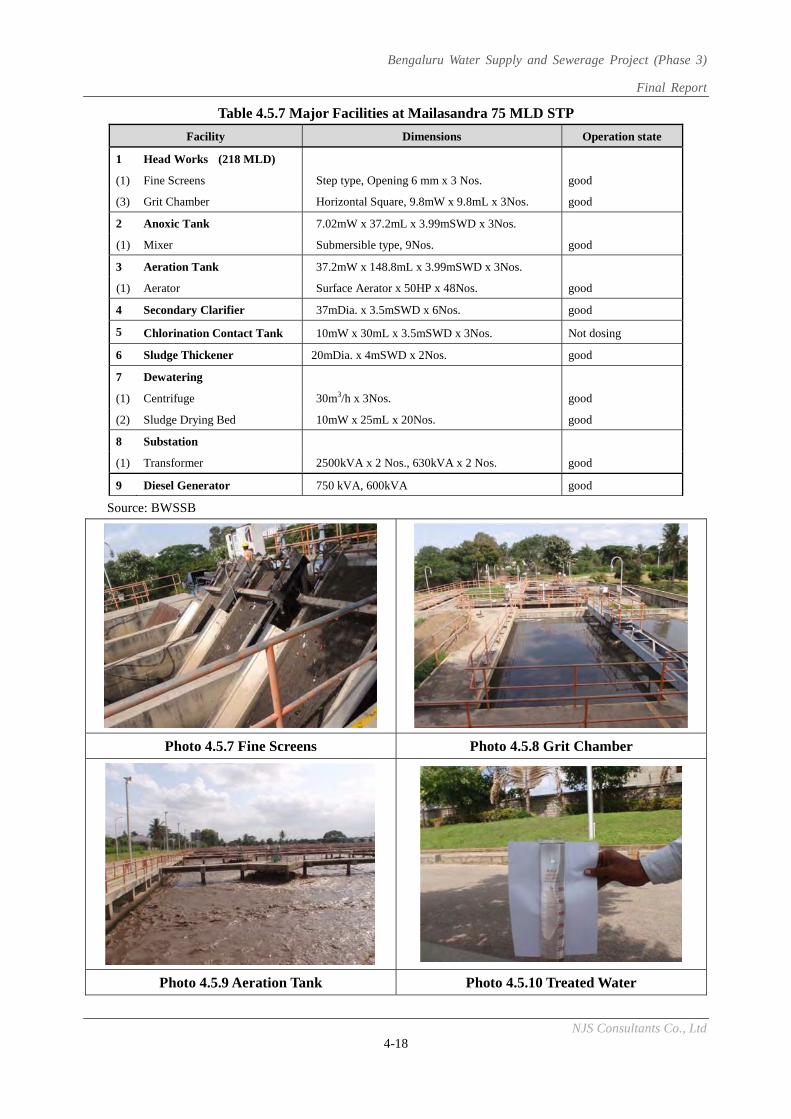
Bengaluru Water Supply and Sewerage Project (Phase 3)
Final Report
NJS Consultants Co., Ltd 4-18
Table 4.5.7 Major Facilities at Mailasandra 75 MLD STP
Facility Dimensions Operation state
1 Head Works (218 MLD)
(1) Fine Screens Step type, Opening 6 mm x 3 Nos. good
(3) Grit Chamber Horizontal Square, 9.8mW x 9.8mL x 3Nos. good
2 Anoxic Tank 7.02mW x 37.2mL x 3.99mSWD x 3Nos.
(1) Mixer Submersible type, 9Nos. good
3 Aeration Tank 37.2mW x 148.8mL x 3.99mSWD x 3Nos.
(1) Aerator Surface Aerator x 50HP x 48Nos. good
4 Secondary Clarifier 37mDia. x 3.5mSWD x 6Nos. good
5 Chlorination Contact Tank 10mW x 30mL x 3.5mSWD x 3Nos. Not dosing
6 Sludge Thickener 20mDia. x 4mSWD x 2Nos. good
7 Dewatering
(1) Centrifuge 30m3/h x 3Nos. good
(2) Sludge Drying Bed 10mW x 25mL x 20Nos. good
8 Substation
(1) Transformer 2500kVA x 2 Nos., 630kVA x 2 Nos. good
9 Diesel Generator 750 kVA, 600kVA good
Source: BWSSB
Photo 4.5.7 Fine Screens Photo 4.5.8 Grit Chamber
Photo 4.5.9 Aeration Tank Photo 4.5.10 Treated Water
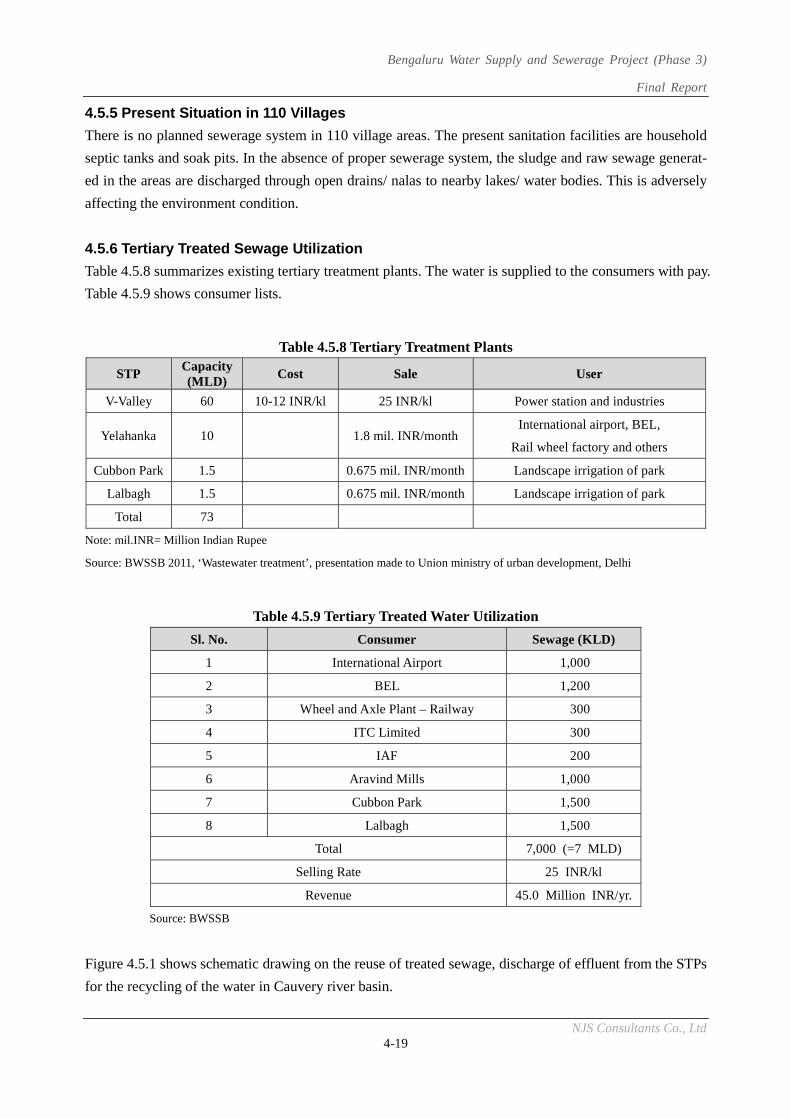
Bengaluru Water Supply and Sewerage Project (Phase 3)
Final Report
NJS Consultants Co., Ltd 4-19
4.5.5 Present Situation in 110 Villages
There is no planned sewerage system in 110 village areas. The present sanitation facilities are household
septic tanks and soak pits. In the absence of proper sewerage system, the sludge and raw sewage generat-
ed in the areas are discharged through open drains/ nalas to nearby lakes/ water bodies. This is adversely
affecting the environment condition.
4.5.6 Tertiary Treated Sewage Utilization
Table 4.5.8 summarizes existing tertiary treatment plants. The water is supplied to the consumers with pay.
Table 4.5.9 shows consumer lists.
Table 4.5.8 Tertiary Treatment Plants
STP Capacity (MLD)
Cost Sale User
V-Valley 60 10-12 INR/kl 25 INR/kl Power station and industries
Yelahanka 10 1.8 mil. INR/month International airport, BEL,
Rail wheel factory and others
Cubbon Park 1.5 0.675 mil. INR/month Landscape irrigation of park
Lalbagh 1.5 0.675 mil. INR/month Landscape irrigation of park
Total 73
Note: mil.INR= Million Indian Rupee
Source: BWSSB 2011, ‘Wastewater treatment’, presentation made to Union ministry of urban development, Delhi
Table 4.5.9 Tertiary Treated Water Utilization
Sl. No. Consumer Sewage (KLD)
1 International Airport 1,000
2 BEL 1,200
3 Wheel and Axle Plant – Railway 300
4 ITC Limited 300
5 IAF 200
6 Aravind Mills 1,000
7 Cubbon Park 1,500
8 Lalbagh 1,500
Total 7,000 (=7 MLD)
Selling Rate 25 INR/kl
Revenue 45.0 Million INR/yr.
Source: BWSSB
Figure 4.5.1 shows schematic drawing on the reuse of treated sewage, discharge of effluent from the STPs
for the recycling of the water in Cauvery river basin.
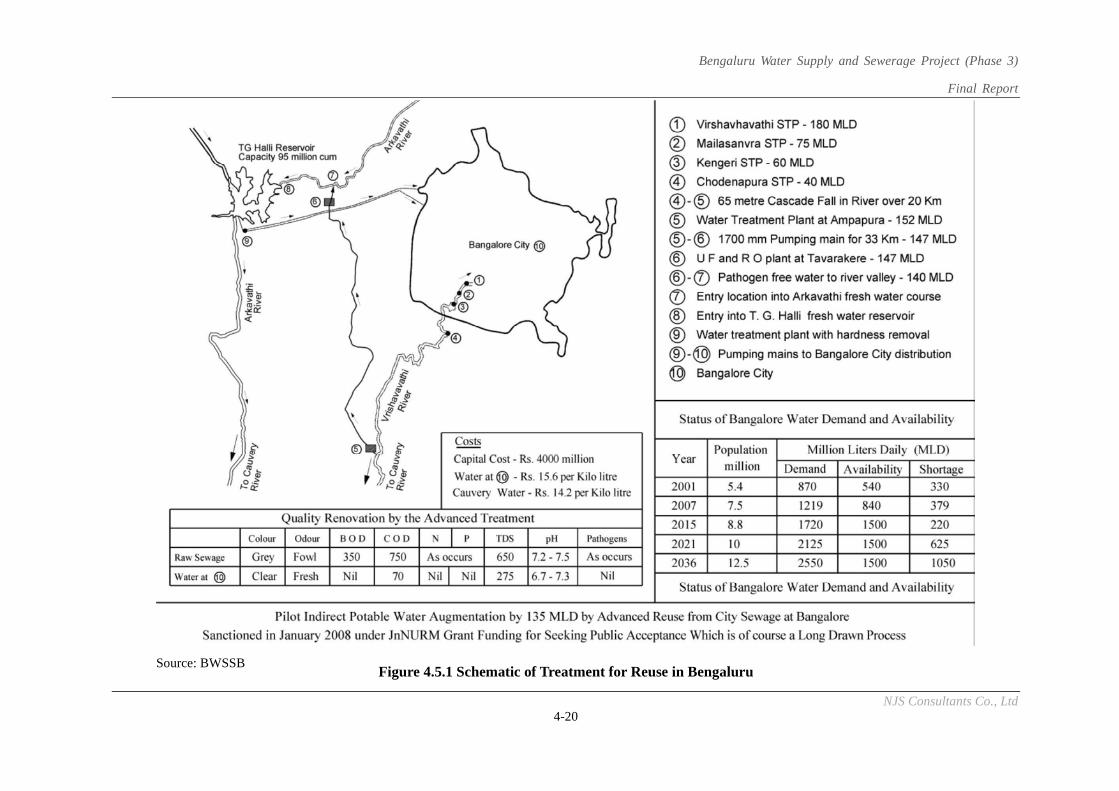
Bengaluru Water Supply and Sewerage Project (Phase 3)
Final Report
NJS Consultants Co., Ltd 4-20
Figure 4.5.1 Schematic of Treatment for Reuse in Bengaluru Source: BWSSB
Bengaluru Water Supply and Sewerage Project (Phase 3)
Final Report
NJS Consultants Co., Ltd 4-21
4.6 Tariff for Water Supply and Sewerage Services, and Cost Recovery
4.6.1 Present Practice for Water and Sewerage Tariff
The tariff has revised two times in 2005 and 2014, but these revisions were not enough to cover O&M
cost, depreciation and interest on loans in the past. In 2015, total income and expenditures are 11.41 Bil-
lion INR and 14.90 Billion INR, respectively. The following are present arrangements for different cus-
tomers.
(1) Domestic Water Use
Tariff is established using a progressive charge system. Sewerage tariff is set as sanitary charge adding to
the water charge and with a uniform rate of 25% to water charge. Domestic consumers are categorized
into 6 income groups by monthly water consumption; slum, poor, low income, middle income, higher
than the middle income and the highest income groups. The current monthly average water charge per
household is 100 INR, which is about 0.6% of average monthly household income (16.610 INR).
(2) Non-Domestic Water Use
Revenue percentage of non-domestic water use is 16% of the total income of BWSSB, while
non-domestic water consumption is 11% of the total water consumption. Tariff is established using a pro-
gressive charge system depending on the amount of water consumption. Sewerage tariff is set as sanitary
charge adding to the water charge with a uniform rate of 25%. The unit price per water consumption for
non-domestic water use is set significantly higher than that for domestic water use.
(3) Other Special Arrangements
1) Bulk Water Use
Bulk water supply is provided both for domestic and non-domestic uses. Large facilities including
schools, swimming pool. etc. are consumers with larger water consumption. A fixed charge system is
adopted for this water supply, regardless to the amount of water consumption. The sanitary charge is
practiced in the same manner as domestic water use with 25% to water charge.
2) Other Charges
There are other several charges such as special sanitary charge and new connection charge. However,
these charges are only less than 5% of domestic and non-domestic charges. In case of having supple-
mentary water supply by deep well or water tanks in addition to water connections, BWSSB levies ad-
ditional charge as special sanitary charge. New connection charge is imposed on the consumers one
time in newly connecting water supply or sewerage pipes.
4.7 On-going Sewerage Project
4.7.1 Water Supply and Sewerage Master Plan
As of February, 2017, Sewerage System Modelling Report and Master Planning Criteria Report were
submitted as a part of the draft M/P by M/P Consultants. The following are relevant condi-
tions/assumptions for the implementation of Preparatory Survey.
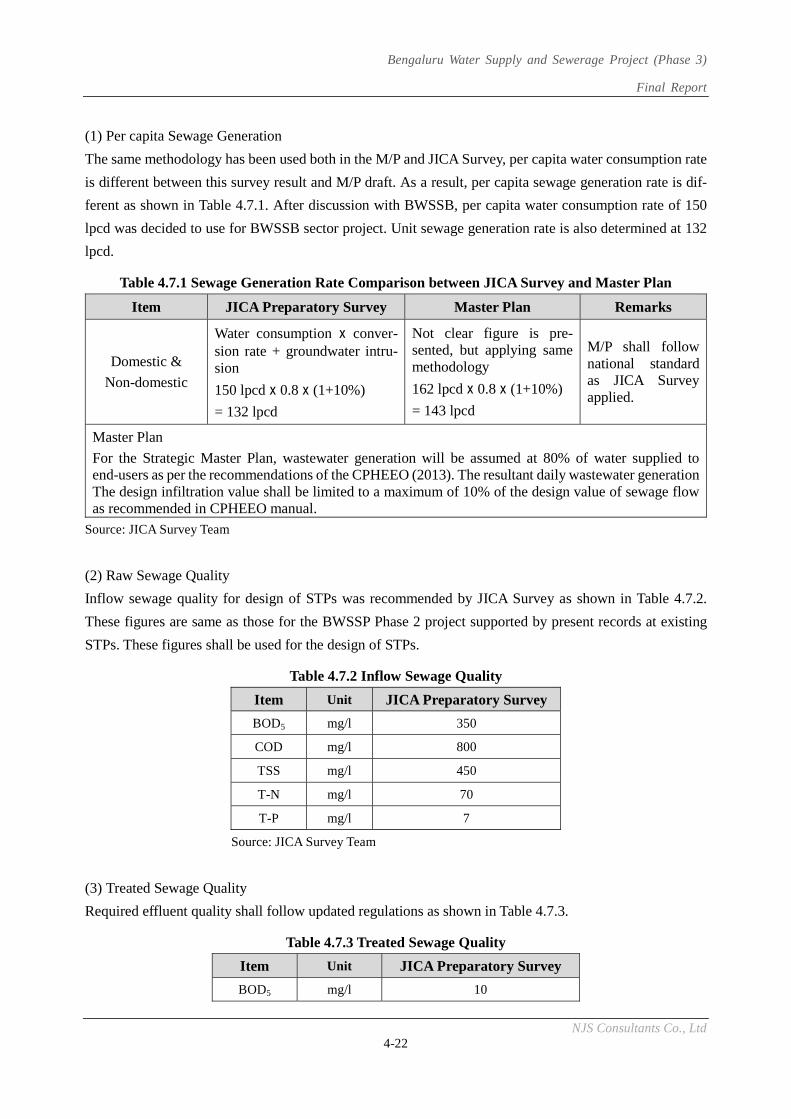
Bengaluru Water Supply and Sewerage Project (Phase 3)
Final Report
NJS Consultants Co., Ltd 4-22
(1) Per capita Sewage Generation
The same methodology has been used both in the M/P and JICA Survey, per capita water consumption rate
is different between this survey result and M/P draft. As a result, per capita sewage generation rate is dif-
ferent as shown in Table 4.7.1. After discussion with BWSSB, per capita water consumption rate of 150
lpcd was decided to use for BWSSB sector project. Unit sewage generation rate is also determined at 132
lpcd.
Table 4.7.1 Sewage Generation Rate Comparison between JICA Survey and Master Plan
Item JICA Preparatory Survey Master Plan Remarks
Domestic &
Non-domestic
Water consumption x conver-sion rate + groundwater intru-sion
150 lpcd x 0.8 x (1+10%)
= 132 lpcd
Not clear figure is pre-sented, but applying same methodology
162 lpcd x 0.8 x (1+10%)
= 143 lpcd
M/P shall follow national standard as JICA Survey applied.
Master Plan
For the Strategic Master Plan, wastewater generation will be assumed at 80% of water supplied to end-users as per the recommendations of the CPHEEO (2013). The resultant daily wastewater generationThe design infiltration value shall be limited to a maximum of 10% of the design value of sewage flow as recommended in CPHEEO manual.
Source: JICA Survey Team
(2) Raw Sewage Quality
Inflow sewage quality for design of STPs was recommended by JICA Survey as shown in Table 4.7.2.
These figures are same as those for the BWSSP Phase 2 project supported by present records at existing
STPs. These figures shall be used for the design of STPs.
Table 4.7.2 Inflow Sewage Quality
Item Unit JICA Preparatory Survey
BOD5 mg/l 350
COD mg/l 800
TSS mg/l 450
T-N mg/l 70
T-P mg/l 7
Source: JICA Survey Team
(3) Treated Sewage Quality
Required effluent quality shall follow updated regulations as shown in Table 4.7.3.
Table 4.7.3 Treated Sewage Quality
Item Unit JICA Preparatory Survey
BOD5 mg/l 10
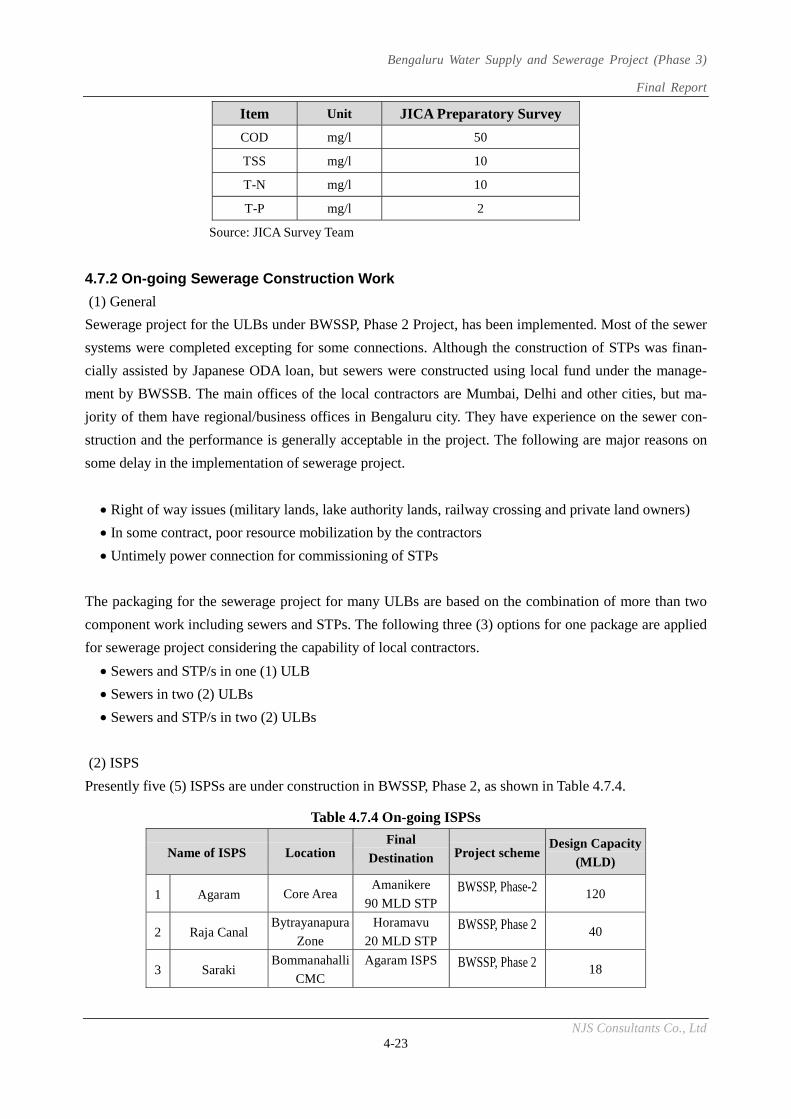
Bengaluru Water Supply and Sewerage Project (Phase 3)
Final Report
NJS Consultants Co., Ltd 4-23
Item Unit JICA Preparatory Survey
COD mg/l 50
TSS mg/l 10
T-N mg/l 10
T-P mg/l 2
Source: JICA Survey Team
4.7.2 On-going Sewerage Construction Work
(1) General
Sewerage project for the ULBs under BWSSP, Phase 2 Project, has been implemented. Most of the sewer
systems were completed excepting for some connections. Although the construction of STPs was finan-
cially assisted by Japanese ODA loan, but sewers were constructed using local fund under the manage-
ment by BWSSB. The main offices of the local contractors are Mumbai, Delhi and other cities, but ma-
jority of them have regional/business offices in Bengaluru city. They have experience on the sewer con-
struction and the performance is generally acceptable in the project. The following are major reasons on
some delay in the implementation of sewerage project.
Right of way issues (military lands, lake authority lands, railway crossing and private land owners)
In some contract, poor resource mobilization by the contractors
Untimely power connection for commissioning of STPs
The packaging for the sewerage project for many ULBs are based on the combination of more than two
component work including sewers and STPs. The following three (3) options for one package are applied
for sewerage project considering the capability of local contractors.
Sewers and STP/s in one (1) ULB
Sewers in two (2) ULBs
Sewers and STP/s in two (2) ULBs
(2) ISPS
Presently five (5) ISPSs are under construction in BWSSP, Phase 2, as shown in Table 4.7.4.
Table 4.7.4 On-going ISPSs
Name of ISPS Location Final
Destination Project schemeDesign Capacity
(MLD)
1 Agaram Core Area Amanikere
90 MLD STPBWSSP, Phase-2 120
2 Raja Canal Bytrayanapura
Zone
Horamavu
20 MLD STPBWSSP, Phase 2 40
3 Saraki Bommanahalli
CMC
Agaram ISPS BWSSP, Phase 2 18
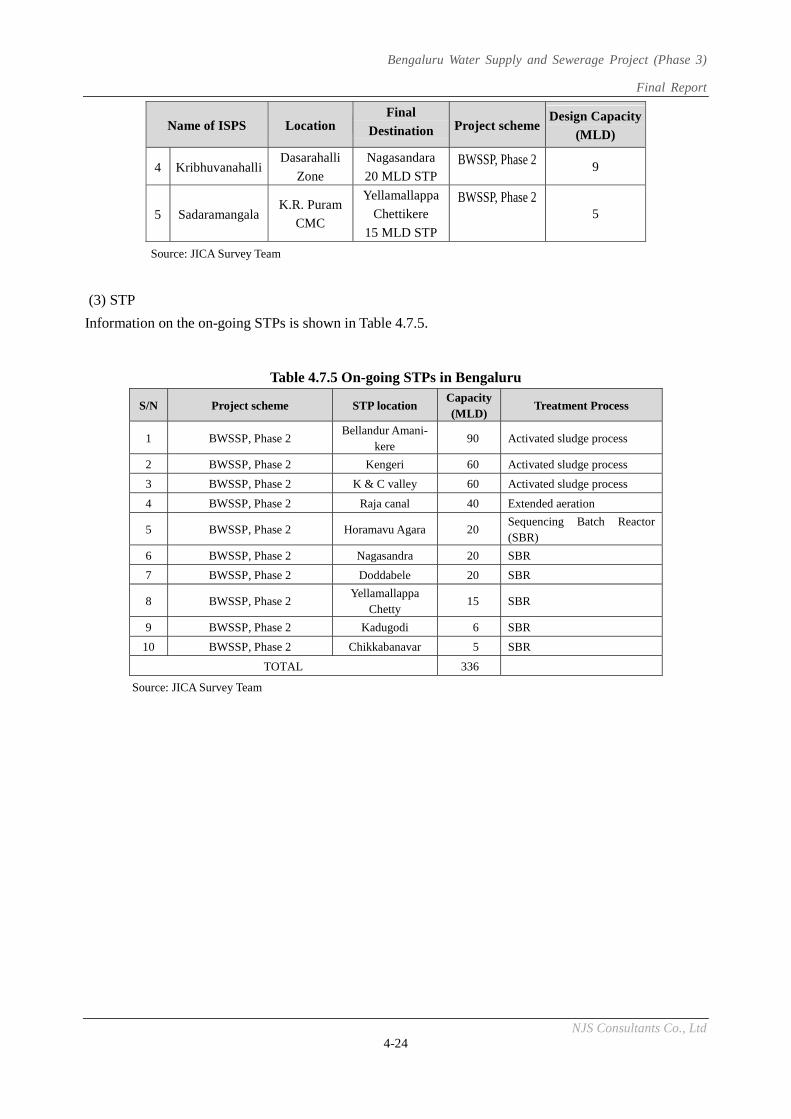
Bengaluru Water Supply and Sewerage Project (Phase 3)
Final Report
NJS Consultants Co., Ltd 4-24
Name of ISPS Location Final
Destination Project schemeDesign Capacity
(MLD)
4 KribhuvanahalliDasarahalli
Zone
Nagasandara
20 MLD STP BWSSP, Phase 2 9
5 SadaramangalaK.R. Puram
CMC
Yellamallappa
Chettikere
15 MLD STP
BWSSP, Phase 2 5
Source: JICA Survey Team
(3) STP
Information on the on-going STPs is shown in Table 4.7.5.
Table 4.7.5 On-going STPs in Bengaluru
S/N Project scheme STP location Capacity (MLD)
Treatment Process
1 BWSSP, Phase 2 Bellandur Amani-
kere 90 Activated sludge process
2 BWSSP, Phase 2 Kengeri 60 Activated sludge process
3 BWSSP, Phase 2 K & C valley 60 Activated sludge process
4 BWSSP, Phase 2 Raja canal 40 Extended aeration
5 BWSSP, Phase 2 Horamavu Agara 20 Sequencing Batch Reactor (SBR)
6 BWSSP, Phase 2 Nagasandra 20 SBR
7 BWSSP, Phase 2 Doddabele 20 SBR
8 BWSSP, Phase 2 Yellamallappa
Chetty 15 SBR
9 BWSSP, Phase 2 Kadugodi 6 SBR
10 BWSSP, Phase 2 Chikkabanavar 5 SBR
TOTAL 336
Source: JICA Survey Team
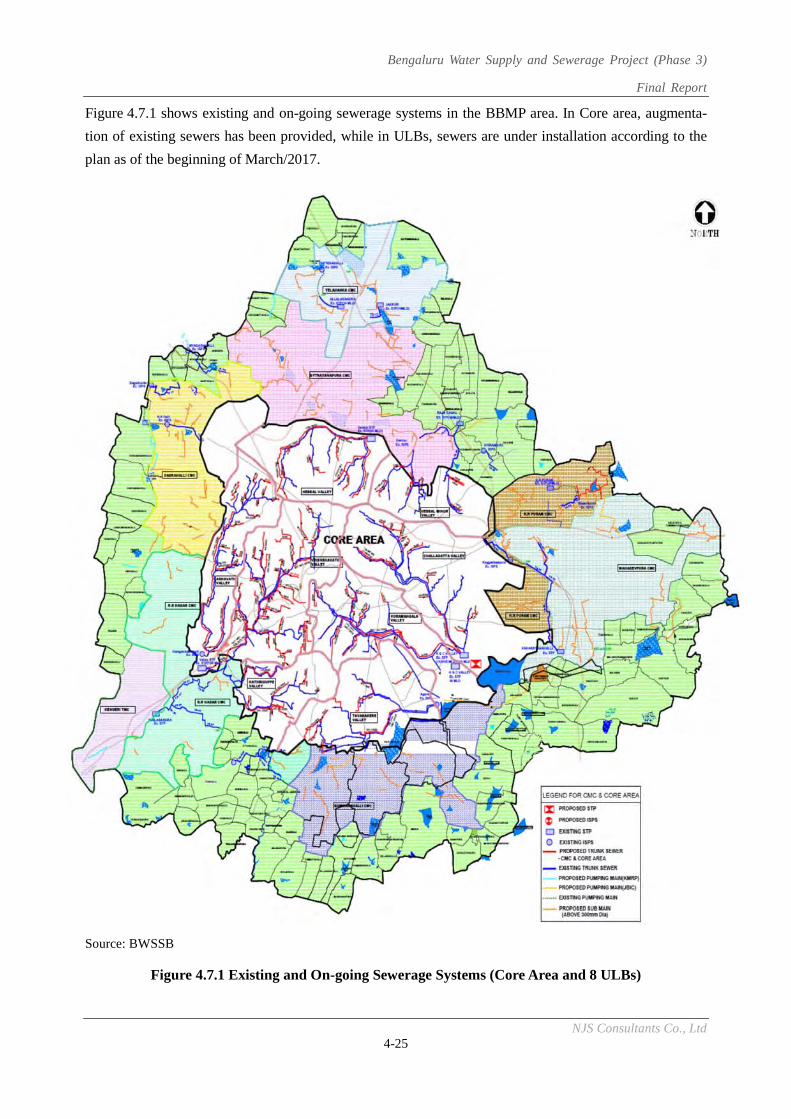
Bengaluru Water Supply and Sewerage Project (Phase 3)
Final Report
NJS Consultants Co., Ltd 4-25
Figure 4.7.1 shows existing and on-going sewerage systems in the BBMP area. In Core area, augmenta-
tion of existing sewers has been provided, while in ULBs, sewers are under installation according to the
plan as of the beginning of March/2017.
Source: BWSSB
Figure 4.7.1 Existing and On-going Sewerage Systems (Core Area and 8 ULBs)
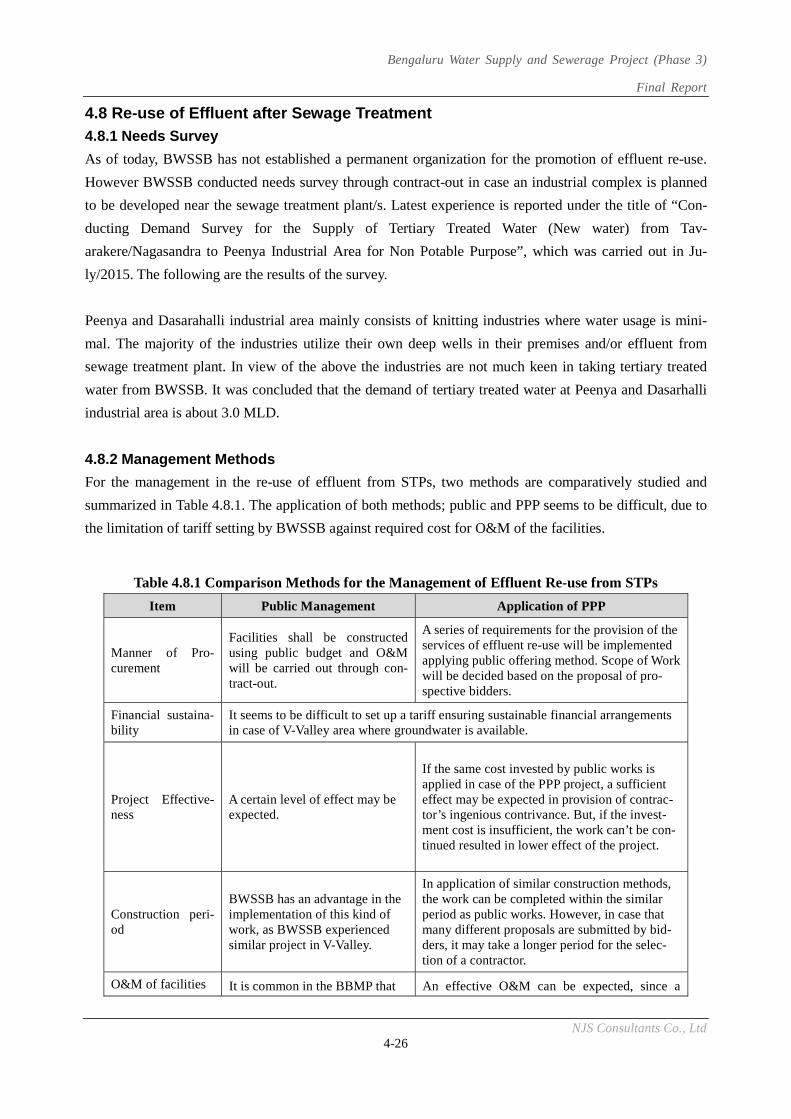
Bengaluru Water Supply and Sewerage Project (Phase 3)
Final Report
NJS Consultants Co., Ltd 4-26
4.8 Re-use of Effluent after Sewage Treatment
4.8.1 Needs Survey
As of today, BWSSB has not established a permanent organization for the promotion of effluent re-use.
However BWSSB conducted needs survey through contract-out in case an industrial complex is planned
to be developed near the sewage treatment plant/s. Latest experience is reported under the title of “Con-
ducting Demand Survey for the Supply of Tertiary Treated Water (New water) from Tav-
arakere/Nagasandra to Peenya Industrial Area for Non Potable Purpose”, which was carried out in Ju-
ly/2015. The following are the results of the survey.
Peenya and Dasarahalli industrial area mainly consists of knitting industries where water usage is mini-
mal. The majority of the industries utilize their own deep wells in their premises and/or effluent from
sewage treatment plant. In view of the above the industries are not much keen in taking tertiary treated
water from BWSSB. It was concluded that the demand of tertiary treated water at Peenya and Dasarhalli
industrial area is about 3.0 MLD.
4.8.2 Management Methods
For the management in the re-use of effluent from STPs, two methods are comparatively studied and
summarized in Table 4.8.1. The application of both methods; public and PPP seems to be difficult, due to
the limitation of tariff setting by BWSSB against required cost for O&M of the facilities.
Table 4.8.1 Comparison Methods for the Management of Effluent Re-use from STPs
Item Public Management Application of PPP
Manner of Pro-curement
Facilities shall be constructed using public budget and O&M will be carried out through con-tract-out.
A series of requirements for the provision of the services of effluent re-use will be implemented applying public offering method. Scope of Work will be decided based on the proposal of pro-spective bidders.
Financial sustaina-bility
It seems to be difficult to set up a tariff ensuring sustainable financial arrangements in case of V-Valley area where groundwater is available.
Project Effective-ness
A certain level of effect may be expected.
If the same cost invested by public works is applied in case of the PPP project, a sufficient effect may be expected in provision of contrac-tor’s ingenious contrivance. But, if the invest-ment cost is insufficient, the work can’t be con-tinued resulted in lower effect of the project.
Construction peri-od
BWSSB has an advantage in the implementation of this kind of work, as BWSSB experienced similar project in V-Valley.
In application of similar construction methods, the work can be completed within the similar period as public works. However, in case that many different proposals are submitted by bid-ders, it may take a longer period for the selec-tion of a contractor.
O&M of facilities It is common in the BBMP that An effective O&M can be expected, since a
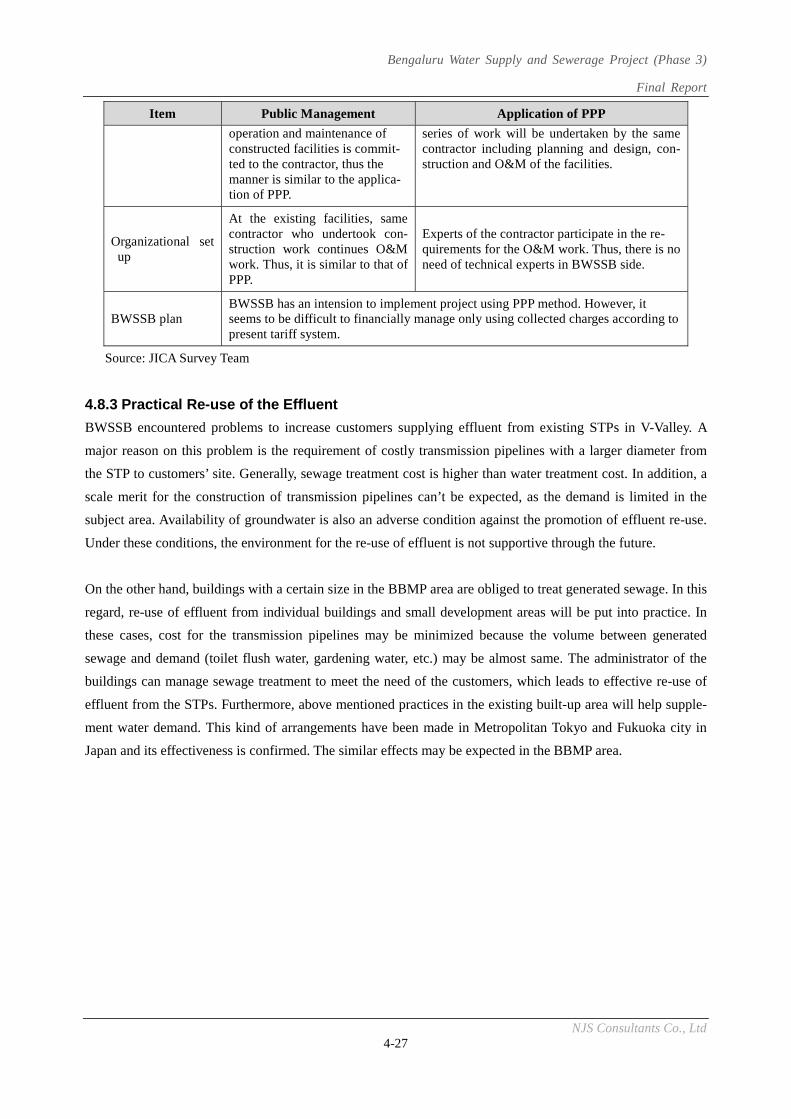
Bengaluru Water Supply and Sewerage Project (Phase 3)
Final Report
NJS Consultants Co., Ltd 4-27
Item Public Management Application of PPP
operation and maintenance of constructed facilities is commit-ted to the contractor, thus the manner is similar to the applica-tion of PPP.
series of work will be undertaken by the same contractor including planning and design, con-struction and O&M of the facilities.
Organizational set up
At the existing facilities, same contractor who undertook con-struction work continues O&M work. Thus, it is similar to that of PPP.
Experts of the contractor participate in the re-quirements for the O&M work. Thus, there is no need of technical experts in BWSSB side.
BWSSB plan BWSSB has an intension to implement project using PPP method. However, it seems to be difficult to financially manage only using collected charges according to present tariff system.
Source: JICA Survey Team
4.8.3 Practical Re-use of the Effluent
BWSSB encountered problems to increase customers supplying effluent from existing STPs in V-Valley. A
major reason on this problem is the requirement of costly transmission pipelines with a larger diameter from
the STP to customers’ site. Generally, sewage treatment cost is higher than water treatment cost. In addition, a
scale merit for the construction of transmission pipelines can’t be expected, as the demand is limited in the
subject area. Availability of groundwater is also an adverse condition against the promotion of effluent re-use.
Under these conditions, the environment for the re-use of effluent is not supportive through the future.
On the other hand, buildings with a certain size in the BBMP area are obliged to treat generated sewage. In this
regard, re-use of effluent from individual buildings and small development areas will be put into practice. In
these cases, cost for the transmission pipelines may be minimized because the volume between generated
sewage and demand (toilet flush water, gardening water, etc.) may be almost same. The administrator of the
buildings can manage sewage treatment to meet the need of the customers, which leads to effective re-use of
effluent from the STPs. Furthermore, above mentioned practices in the existing built-up area will help supple-
ment water demand. This kind of arrangements have been made in Metropolitan Tokyo and Fukuoka city in
Japan and its effectiveness is confirmed. The similar effects may be expected in the BBMP area.
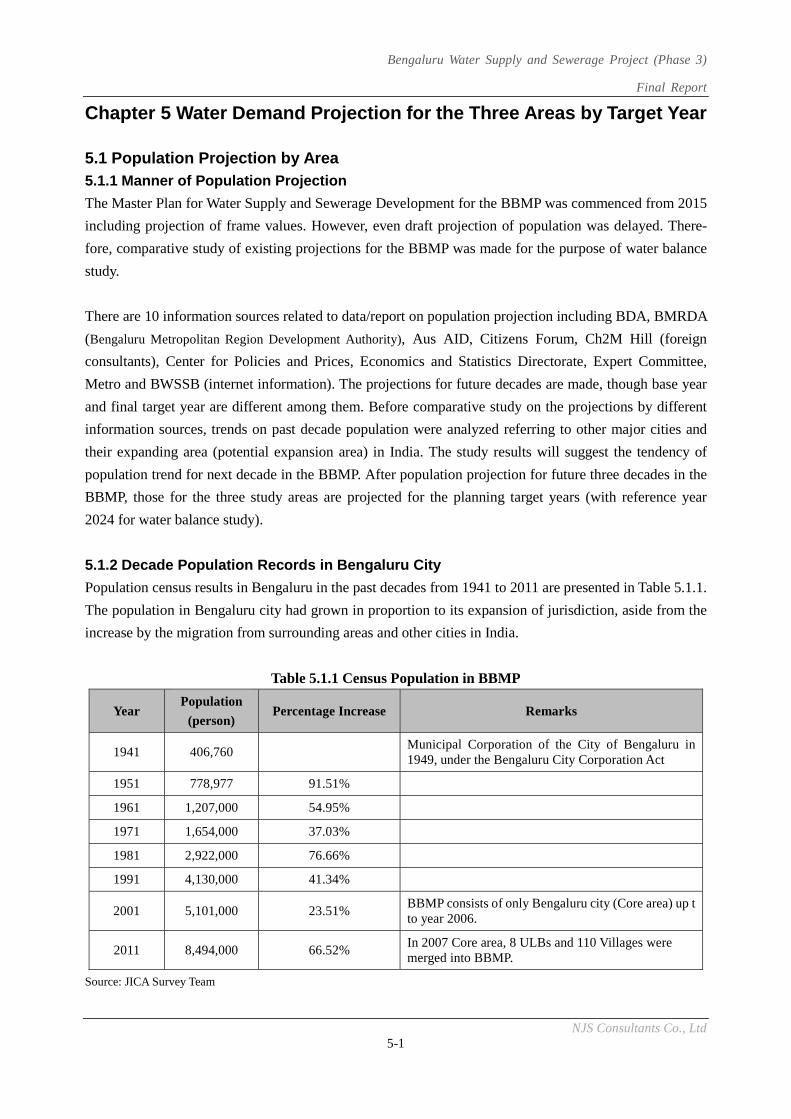
Bengaluru Water Supply and Sewerage Project (Phase 3)
Final Report
NJS Consultants Co., Ltd 5-1
Chapter 5 Water Demand Projection for the Three Areas by Target Year
5.1 Population Projection by Area 5.1.1 Manner of Population Projection
The Master Plan for Water Supply and Sewerage Development for the BBMP was commenced from 2015
including projection of frame values. However, even draft projection of population was delayed. There-
fore, comparative study of existing projections for the BBMP was made for the purpose of water balance
study.
There are 10 information sources related to data/report on population projection including BDA, BMRDA
(Bengaluru Metropolitan Region Development Authority), Aus AID, Citizens Forum, Ch2M Hill (foreign
consultants), Center for Policies and Prices, Economics and Statistics Directorate, Expert Committee,
Metro and BWSSB (internet information). The projections for future decades are made, though base year
and final target year are different among them. Before comparative study on the projections by different
information sources, trends on past decade population were analyzed referring to other major cities and
their expanding area (potential expansion area) in India. The study results will suggest the tendency of
population trend for next decade in the BBMP. After population projection for future three decades in the
BBMP, those for the three study areas are projected for the planning target years (with reference year
2024 for water balance study).
5.1.2 Decade Population Records in Bengaluru City
Population census results in Bengaluru in the past decades from 1941 to 2011 are presented in Table 5.1.1.
The population in Bengaluru city had grown in proportion to its expansion of jurisdiction, aside from the
increase by the migration from surrounding areas and other cities in India.
Table 5.1.1 Census Population in BBMP
Year Population
(person) Percentage Increase Remarks
1941 406,760 Municipal Corporation of the City of Bengaluru in 1949, under the Bengaluru City Corporation Act
1951 778,977 91.51%
1961 1,207,000 54.95%
1971 1,654,000 37.03%
1981 2,922,000 76.66%
1991 4,130,000 41.34%
2001 5,101,000 23.51% BBMP consists of only Bengaluru city (Core area) up t to year 2006.
2011 8,494,000 66.52% In 2007 Core area, 8 ULBs and 110 Villages were merged into BBMP.
Source: JICA Survey Team
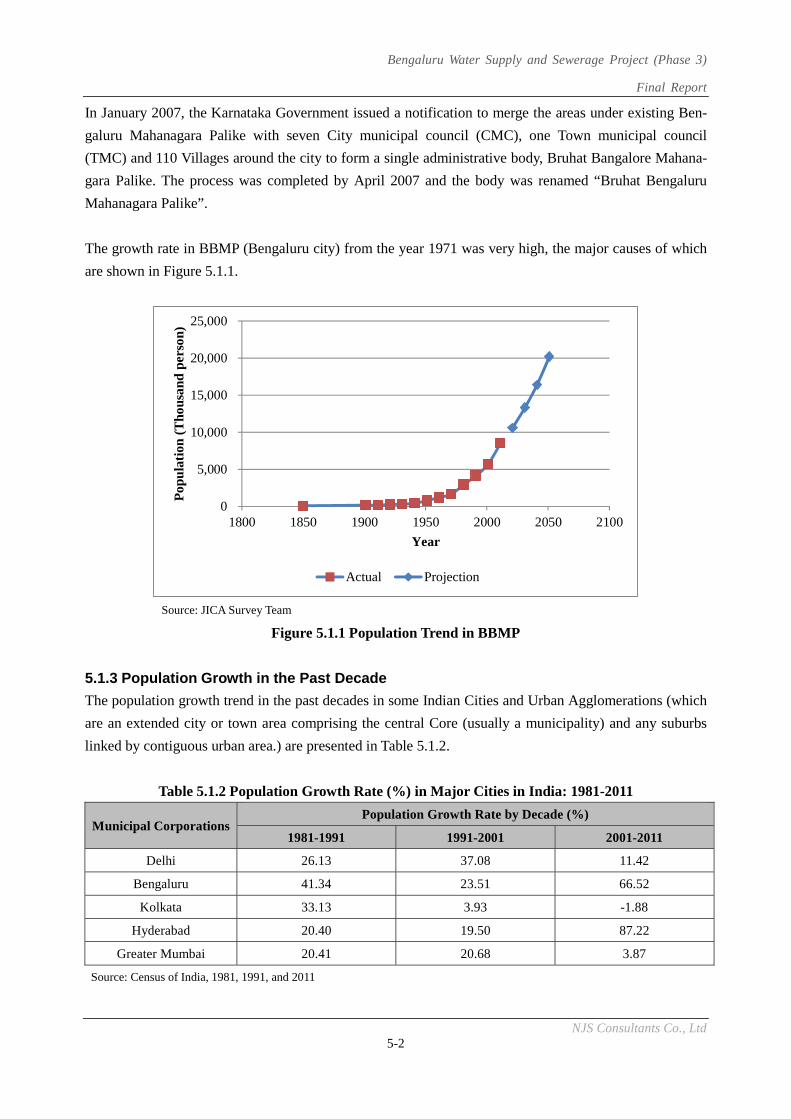
Bengaluru Water Supply and Sewerage Project (Phase 3)
Final Report
NJS Consultants Co., Ltd 5-2
In January 2007, the Karnataka Government issued a notification to merge the areas under existing Ben-
galuru Mahanagara Palike with seven City municipal council (CMC), one Town municipal council
(TMC) and 110 Villages around the city to form a single administrative body, Bruhat Bangalore Mahana-
gara Palike. The process was completed by April 2007 and the body was renamed “Bruhat Bengaluru
Mahanagara Palike”.
The growth rate in BBMP (Bengaluru city) from the year 1971 was very high, the major causes of which
are shown in Figure 5.1.1.
Source: JICA Survey Team
Figure 5.1.1 Population Trend in BBMP
5.1.3 Population Growth in the Past Decade
The population growth trend in the past decades in some Indian Cities and Urban Agglomerations (which
are an extended city or town area comprising the central Core (usually a municipality) and any suburbs
linked by contiguous urban area.) are presented in Table 5.1.2.
Table 5.1.2 Population Growth Rate (%) in Major Cities in India: 1981-2011
Municipal CorporationsPopulation Growth Rate by Decade (%)
1981-1991 1991-2001 2001-2011
Delhi 26.13 37.08 11.42
Bengaluru 41.34 23.51 66.52
Kolkata 33.13 3.93 -1.88
Hyderabad 20.40 19.50 87.22
Greater Mumbai 20.41 20.68 3.87
Source: Census of India, 1981, 1991, and 2011
0
5,000
10,000
15,000
20,000
25,000
1800 1850 1900 1950 2000 2050 2100
Pop
ula
tion
(T
hous
and
per
son)
Year
Actual Projection
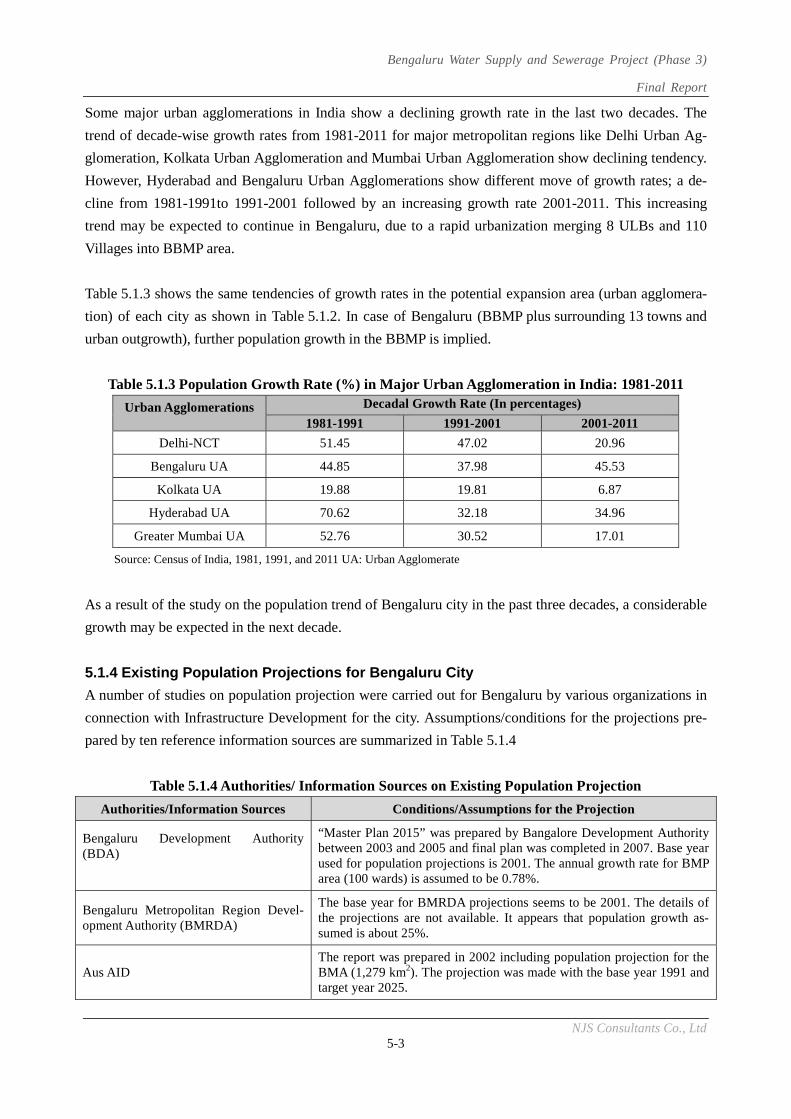
Bengaluru Water Supply and Sewerage Project (Phase 3)
Final Report
NJS Consultants Co., Ltd 5-3
Some major urban agglomerations in India show a declining growth rate in the last two decades. The
trend of decade-wise growth rates from 1981-2011 for major metropolitan regions like Delhi Urban Ag-
glomeration, Kolkata Urban Agglomeration and Mumbai Urban Agglomeration show declining tendency.
However, Hyderabad and Bengaluru Urban Agglomerations show different move of growth rates; a de-
cline from 1981-1991to 1991-2001 followed by an increasing growth rate 2001-2011. This increasing
trend may be expected to continue in Bengaluru, due to a rapid urbanization merging 8 ULBs and 110
Villages into BBMP area.
Table 5.1.3 shows the same tendencies of growth rates in the potential expansion area (urban agglomera-
tion) of each city as shown in Table 5.1.2. In case of Bengaluru (BBMP plus surrounding 13 towns and
urban outgrowth), further population growth in the BBMP is implied.
Table 5.1.3 Population Growth Rate (%) in Major Urban Agglomeration in India: 1981-2011
Urban Agglomerations Decadal Growth Rate (In percentages)
1981-1991 1991-2001 2001-2011
Delhi-NCT 51.45 47.02 20.96
Bengaluru UA 44.85 37.98 45.53
Kolkata UA 19.88 19.81 6.87
Hyderabad UA 70.62 32.18 34.96
Greater Mumbai UA 52.76 30.52 17.01
Source: Census of India, 1981, 1991, and 2011 UA: Urban Agglomerate
As a result of the study on the population trend of Bengaluru city in the past three decades, a considerable
growth may be expected in the next decade.
5.1.4 Existing Population Projections for Bengaluru City
A number of studies on population projection were carried out for Bengaluru by various organizations in
connection with Infrastructure Development for the city. Assumptions/conditions for the projections pre-
pared by ten reference information sources are summarized in Table 5.1.4
Table 5.1.4 Authorities/ Information Sources on Existing Population Projection
Authorities/Information Sources Conditions/Assumptions for the Projection
Bengaluru Development Authority (BDA)
“Master Plan 2015” was prepared by Bangalore Development Authority between 2003 and 2005 and final plan was completed in 2007. Base year used for population projections is 2001. The annual growth rate for BMP area (100 wards) is assumed to be 0.78%.
Bengaluru Metropolitan Region Devel-opment Authority (BMRDA)
The base year for BMRDA projections seems to be 2001. The details of the projections are not available. It appears that population growth as-sumed is about 25%.
Aus AID The report was prepared in 2002 including population projection for the BMA (1,279 km2). The projection was made with the base year 1991 and target year 2025.
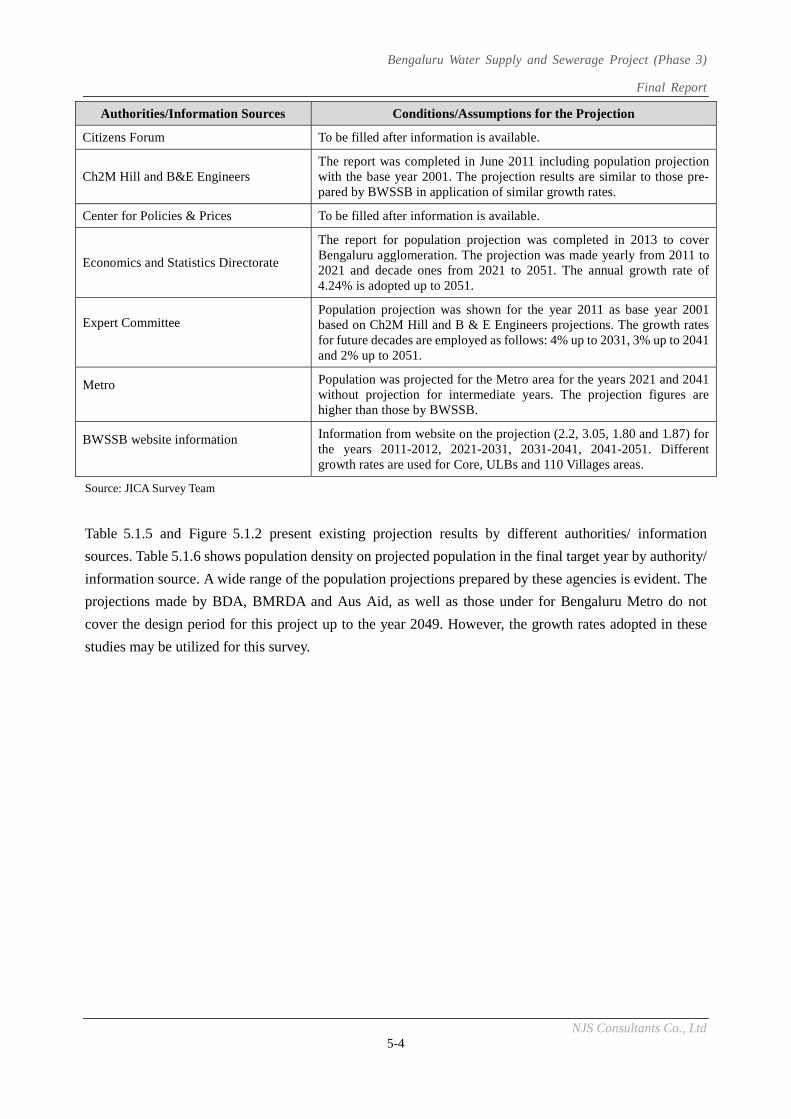
Bengaluru Water Supply and Sewerage Project (Phase 3)
Final Report
NJS Consultants Co., Ltd 5-4
Authorities/Information Sources Conditions/Assumptions for the Projection
Citizens Forum To be filled after information is available.
Ch2M Hill and B&E Engineers The report was completed in June 2011 including population projection with the base year 2001. The projection results are similar to those pre-pared by BWSSB in application of similar growth rates.
Center for Policies & Prices To be filled after information is available.
Economics and Statistics Directorate
The report for population projection was completed in 2013 to cover Bengaluru agglomeration. The projection was made yearly from 2011 to 2021 and decade ones from 2021 to 2051. The annual growth rate of 4.24% is adopted up to 2051.
Expert Committee
Population projection was shown for the year 2011 as base year 2001 based on Ch2M Hill and B & E Engineers projections. The growth rates for future decades are employed as follows: 4% up to 2031, 3% up to 2041 and 2% up to 2051.
Metro
Population was projected for the Metro area for the years 2021 and 2041 without projection for intermediate years. The projection figures are higher than those by BWSSB.
BWSSB website information
Information from website on the projection (2.2, 3.05, 1.80 and 1.87) for the years 2011-2012, 2021-2031, 2031-2041, 2041-2051. Different growth rates are used for Core, ULBs and 110 Villages areas.
Source: JICA Survey Team
Table 5.1.5 and Figure 5.1.2 present existing projection results by different authorities/ information
sources. Table 5.1.6 shows population density on projected population in the final target year by authority/
information source. A wide range of the population projections prepared by these agencies is evident. The
projections made by BDA, BMRDA and Aus Aid, as well as those under for Bengaluru Metro do not
cover the design period for this project up to the year 2049. However, the growth rates adopted in these
studies may be utilized for this survey.
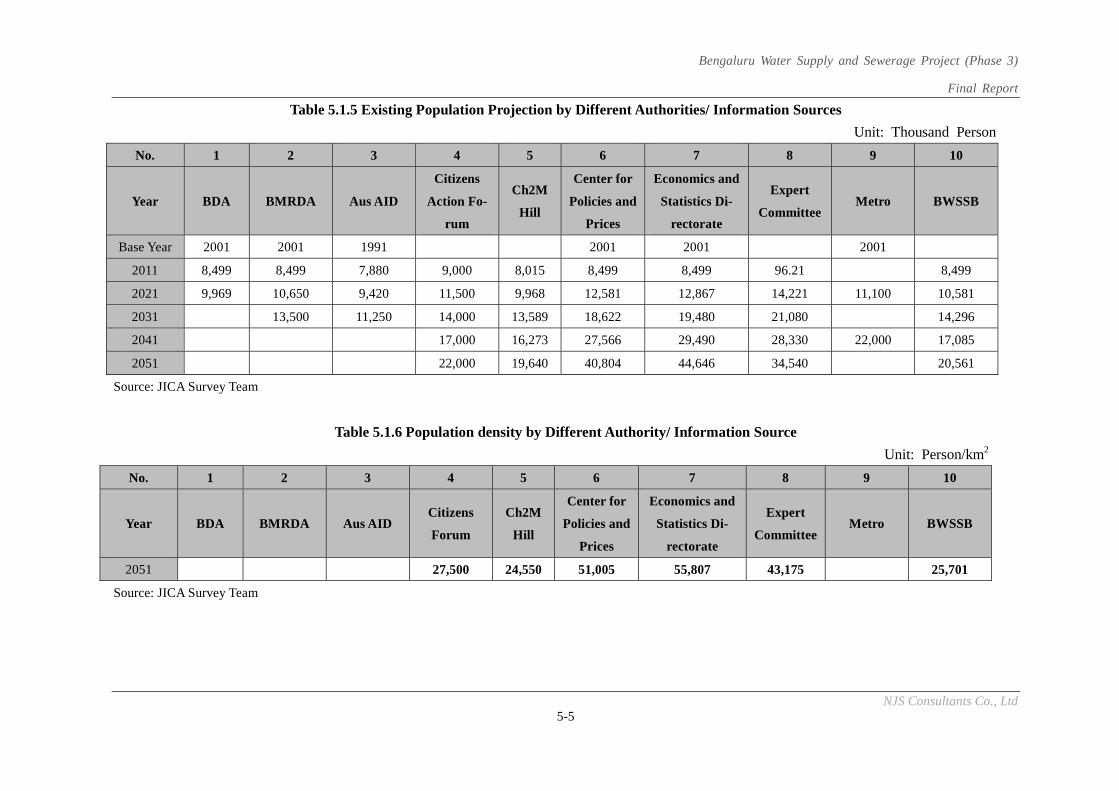
Bengaluru Water Supply and Sewerage Project (Phase 3)
Final Report
NJS Consultants Co., Ltd 5-5
Table 5.1.5 Existing Population Projection by Different Authorities/ Information Sources
Unit: Thousand Person
No. 1 2 3 4 5 6 7 8 9 10
Year BDA BMRDA Aus AID
Citizens
Action Fo-
rum
Ch2M
Hill
Center for
Policies and
Prices
Economics and
Statistics Di-
rectorate
Expert
Committee Metro BWSSB
Base Year 2001 2001 1991 2001 2001 2001
2011 8,499 8,499 7,880 9,000 8,015 8,499 8,499 96.21 8,499
2021 9,969 10,650 9,420 11,500 9,968 12,581 12,867 14,221 11,100 10,581
2031 13,500 11,250 14,000 13,589 18,622 19,480 21,080 14,296
2041 17,000 16,273 27,566 29,490 28,330 22,000 17,085
2051 22,000 19,640 40,804 44,646 34,540 20,561
Source: JICA Survey Team
Table 5.1.6 Population density by Different Authority/ Information Source
Unit: Person/km2
No. 1 2 3 4 5 6 7 8 9 10
Year BDA BMRDA Aus AID Citizens
Forum
Ch2M
Hill
Center for
Policies and
Prices
Economics and
Statistics Di-
rectorate
Expert
Committee Metro BWSSB
2051 27,500 24,550 51,005 55,807 43,175 25,701
Source: JICA Survey Team
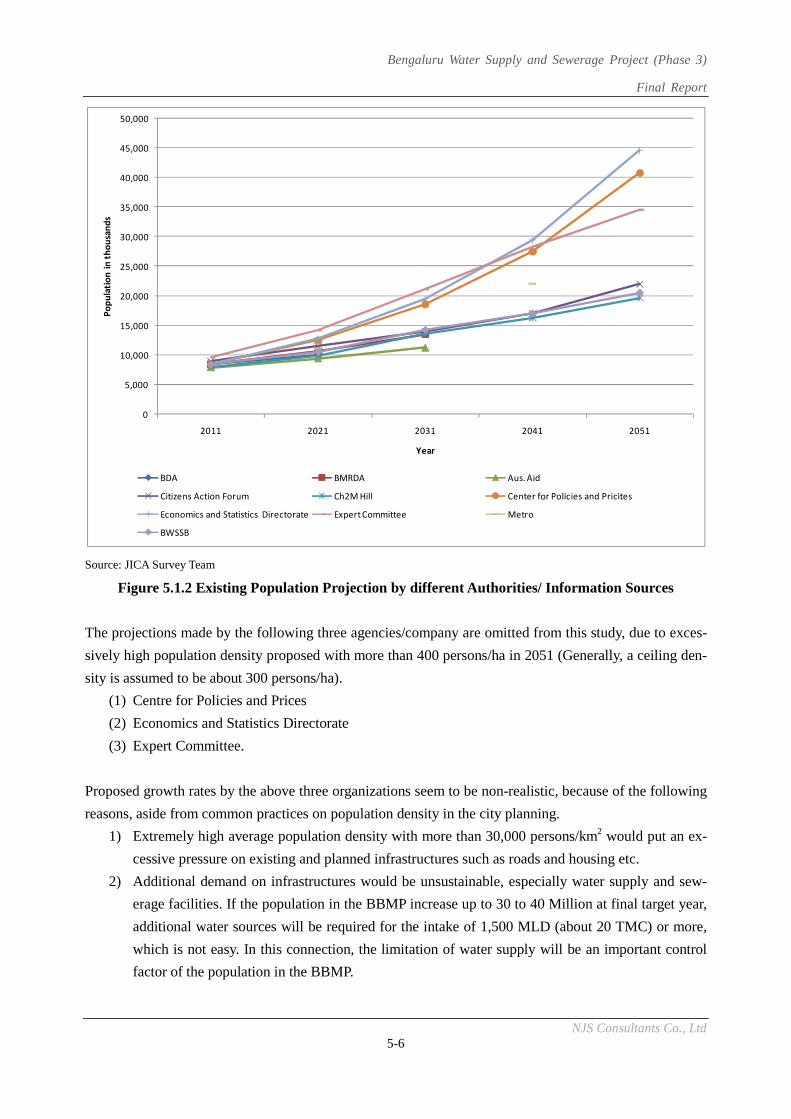
Bengaluru Water Supply and Sewerage Project (Phase 3)
Final Report
NJS Consultants Co., Ltd 5-6
Source: JICA Survey Team
Figure 5.1.2 Existing Population Projection by different Authorities/ Information Sources
The projections made by the following three agencies/company are omitted from this study, due to exces-
sively high population density proposed with more than 400 persons/ha in 2051 (Generally, a ceiling den-
sity is assumed to be about 300 persons/ha).
(1) Centre for Policies and Prices
(2) Economics and Statistics Directorate
(3) Expert Committee.
Proposed growth rates by the above three organizations seem to be non-realistic, because of the following
reasons, aside from common practices on population density in the city planning.
1) Extremely high average population density with more than 30,000 persons/km2 would put an ex-
cessive pressure on existing and planned infrastructures such as roads and housing etc.
2) Additional demand on infrastructures would be unsustainable, especially water supply and sew-
erage facilities. If the population in the BBMP increase up to 30 to 40 Million at final target year,
additional water sources will be required for the intake of 1,500 MLD (about 20 TMC) or more,
which is not easy. In this connection, the limitation of water supply will be an important control
factor of the population in the BBMP.
0
5,000
10,000
15,000
20,000
25,000
30,000
35,000
40,000
45,000
50,000
2011 2021 2031 2041 2051
Popu
latio
n in
thou
sand
s
Year
BDA BMRDA Aus. Aid
Citizens Action Forum Ch2M Hill Center for Policies and Pricites
Economics and Statistics Directorate Expert Committee Metro
BWSSB
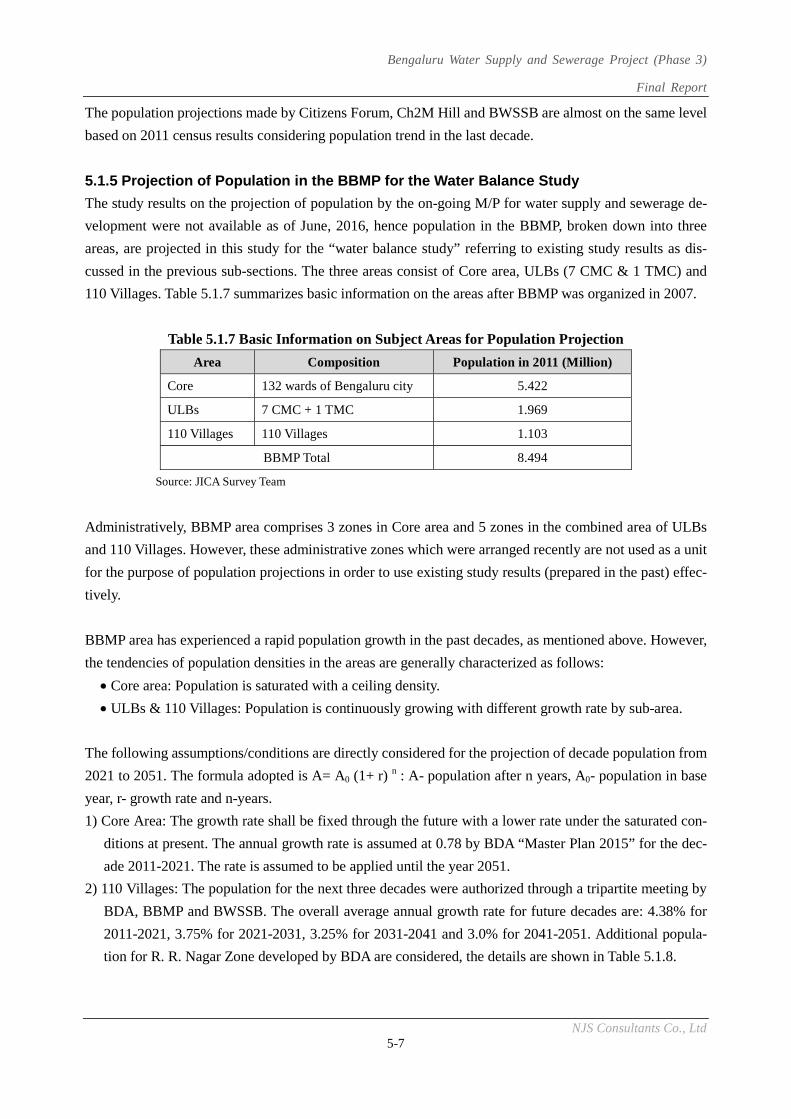
Bengaluru Water Supply and Sewerage Project (Phase 3)
Final Report
NJS Consultants Co., Ltd 5-7
The population projections made by Citizens Forum, Ch2M Hill and BWSSB are almost on the same level
based on 2011 census results considering population trend in the last decade.
5.1.5 Projection of Population in the BBMP for the Water Balance Study
The study results on the projection of population by the on-going M/P for water supply and sewerage de-
velopment were not available as of June, 2016, hence population in the BBMP, broken down into three
areas, are projected in this study for the “water balance study” referring to existing study results as dis-
cussed in the previous sub-sections. The three areas consist of Core area, ULBs (7 CMC & 1 TMC) and
110 Villages. Table 5.1.7 summarizes basic information on the areas after BBMP was organized in 2007.
Table 5.1.7 Basic Information on Subject Areas for Population Projection
Area Composition Population in 2011 (Million)
Core 132 wards of Bengaluru city 5.422
ULBs 7 CMC + 1 TMC 1.969
110 Villages 110 Villages 1.103
BBMP Total 8.494
Source: JICA Survey Team
Administratively, BBMP area comprises 3 zones in Core area and 5 zones in the combined area of ULBs
and 110 Villages. However, these administrative zones which were arranged recently are not used as a unit
for the purpose of population projections in order to use existing study results (prepared in the past) effec-
tively.
BBMP area has experienced a rapid population growth in the past decades, as mentioned above. However,
the tendencies of population densities in the areas are generally characterized as follows:
Core area: Population is saturated with a ceiling density.
ULBs & 110 Villages: Population is continuously growing with different growth rate by sub-area.
The following assumptions/conditions are directly considered for the projection of decade population from
2021 to 2051. The formula adopted is A= A0 (1+ r) n : A- population after n years, A0- population in base
year, r- growth rate and n-years.
1) Core Area: The growth rate shall be fixed through the future with a lower rate under the saturated con-
ditions at present. The annual growth rate is assumed at 0.78 by BDA “Master Plan 2015” for the dec-
ade 2011-2021. The rate is assumed to be applied until the year 2051.
2) 110 Villages: The population for the next three decades were authorized through a tripartite meeting by
BDA, BBMP and BWSSB. The overall average annual growth rate for future decades are: 4.38% for
2011-2021, 3.75% for 2021-2031, 3.25% for 2031-2041 and 3.0% for 2041-2051. Additional popula-
tion for R. R. Nagar Zone developed by BDA are considered, the details are shown in Table 5.1.8.
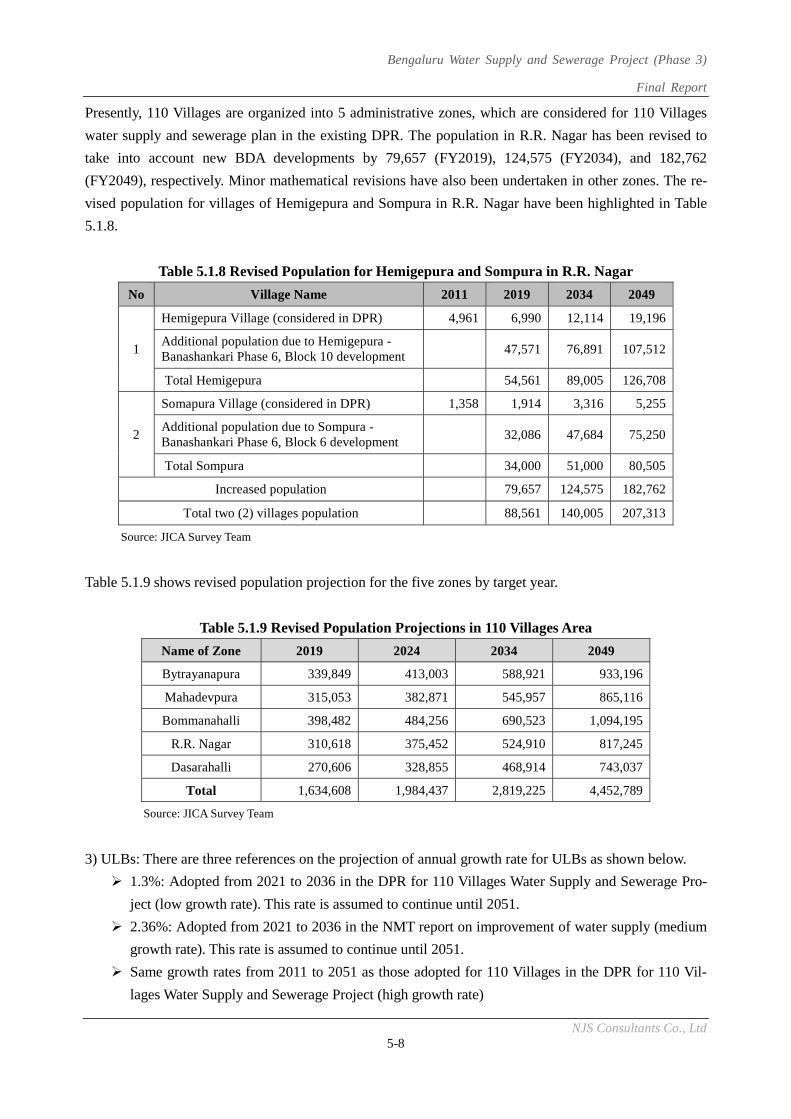
Bengaluru Water Supply and Sewerage Project (Phase 3)
Final Report
NJS Consultants Co., Ltd 5-8
Presently, 110 Villages are organized into 5 administrative zones, which are considered for 110 Villages
water supply and sewerage plan in the existing DPR. The population in R.R. Nagar has been revised to
take into account new BDA developments by 79,657 (FY2019), 124,575 (FY2034), and 182,762
(FY2049), respectively. Minor mathematical revisions have also been undertaken in other zones. The re-
vised population for villages of Hemigepura and Sompura in R.R. Nagar have been highlighted in Table
5.1.8.
Table 5.1.8 Revised Population for Hemigepura and Sompura in R.R. Nagar
No Village Name 2011 2019 2034 2049
1
Hemigepura Village (considered in DPR) 4,961 6,990 12,114 19,196
Additional population due to Hemigepura - Banashankari Phase 6, Block 10 development
47,571 76,891 107,512
Total Hemigepura 54,561 89,005 126,708
2
Somapura Village (considered in DPR) 1,358 1,914 3,316 5,255
Additional population due to Sompura - Banashankari Phase 6, Block 6 development
32,086 47,684 75,250
Total Sompura 34,000 51,000 80,505
Increased population 79,657 124,575 182,762
Total two (2) villages population 88,561 140,005 207,313
Source: JICA Survey Team
Table 5.1.9 shows revised population projection for the five zones by target year.
Table 5.1.9 Revised Population Projections in 110 Villages Area
Name of Zone 2019 2024 2034 2049
Bytrayanapura 339,849 413,003 588,921 933,196
Mahadevpura 315,053 382,871 545,957 865,116
Bommanahalli 398,482 484,256 690,523 1,094,195
R.R. Nagar 310,618 375,452 524,910 817,245
Dasarahalli 270,606 328,855 468,914 743,037
Total 1,634,608 1,984,437 2,819,225 4,452,789
Source: JICA Survey Team
3) ULBs: There are three references on the projection of annual growth rate for ULBs as shown below.
1.3%: Adopted from 2021 to 2036 in the DPR for 110 Villages Water Supply and Sewerage Pro-
ject (low growth rate). This rate is assumed to continue until 2051.
2.36%: Adopted from 2021 to 2036 in the NMT report on improvement of water supply (medium
growth rate). This rate is assumed to continue until 2051.
Same growth rates from 2011 to 2051 as those adopted for 110 Villages in the DPR for 110 Vil-
lages Water Supply and Sewerage Project (high growth rate)
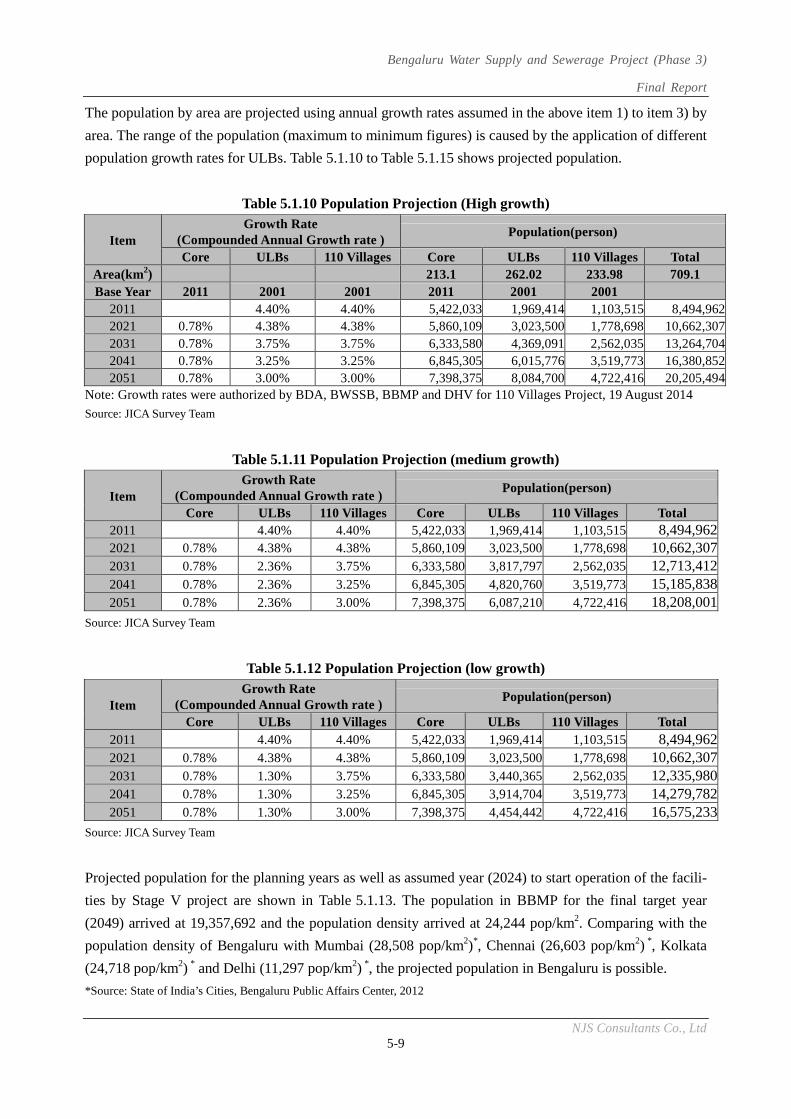
Bengaluru Water Supply and Sewerage Project (Phase 3)
Final Report
NJS Consultants Co., Ltd 5-9
The population by area are projected using annual growth rates assumed in the above item 1) to item 3) by
area. The range of the population (maximum to minimum figures) is caused by the application of different
population growth rates for ULBs. Table 5.1.10 to Table 5.1.15 shows projected population.
Table 5.1.10 Population Projection (High growth)
Item Growth Rate
(Compounded Annual Growth rate ) Population(person)
Core ULBs 110 Villages Core ULBs 110 Villages Total Area(km2) 213.1 262.02 233.98 709.1 Base Year 2011 2001 2001 2011 2001 2001
2011 4.40% 4.40% 5,422,033 1,969,414 1,103,515 8,494,9622021 0.78% 4.38% 4.38% 5,860,109 3,023,500 1,778,698 10,662,3072031 0.78% 3.75% 3.75% 6,333,580 4,369,091 2,562,035 13,264,7042041 0.78% 3.25% 3.25% 6,845,305 6,015,776 3,519,773 16,380,8522051 0.78% 3.00% 3.00% 7,398,375 8,084,700 4,722,416 20,205,494
Note: Growth rates were authorized by BDA, BWSSB, BBMP and DHV for 110 Villages Project, 19 August 2014
Source: JICA Survey Team
Table 5.1.11 Population Projection (medium growth)
Item Growth Rate
(Compounded Annual Growth rate ) Population(person)
Core ULBs 110 Villages Core ULBs 110 Villages Total 2011 4.40% 4.40% 5,422,033 1,969,414 1,103,515 8,494,9622021 0.78% 4.38% 4.38% 5,860,109 3,023,500 1,778,698 10,662,3072031 0.78% 2.36% 3.75% 6,333,580 3,817,797 2,562,035 12,713,4122041 0.78% 2.36% 3.25% 6,845,305 4,820,760 3,519,773 15,185,8382051 0.78% 2.36% 3.00% 7,398,375 6,087,210 4,722,416 18,208,001
Source: JICA Survey Team
Table 5.1.12 Population Projection (low growth)
Item Growth Rate
(Compounded Annual Growth rate ) Population(person)
Core ULBs 110 Villages Core ULBs 110 Villages Total 2011 4.40% 4.40% 5,422,033 1,969,414 1,103,515 8,494,9622021 0.78% 4.38% 4.38% 5,860,109 3,023,500 1,778,698 10,662,3072031 0.78% 1.30% 3.75% 6,333,580 3,440,365 2,562,035 12,335,9802041 0.78% 1.30% 3.25% 6,845,305 3,914,704 3,519,773 14,279,7822051 0.78% 1.30% 3.00% 7,398,375 4,454,442 4,722,416 16,575,233
Source: JICA Survey Team
Projected population for the planning years as well as assumed year (2024) to start operation of the facili-
ties by Stage V project are shown in Table 5.1.13. The population in BBMP for the final target year
(2049) arrived at 19,357,692 and the population density arrived at 24,244 pop/km2. Comparing with the
population density of Bengaluru with Mumbai (28,508 pop/km2)*, Chennai (26,603 pop/km2) *, Kolkata
(24,718 pop/km2) * and Delhi (11,297 pop/km2) *, the projected population in Bengaluru is possible.
*Source: State of India’s Cities, Bengaluru Public Affairs Center, 2012
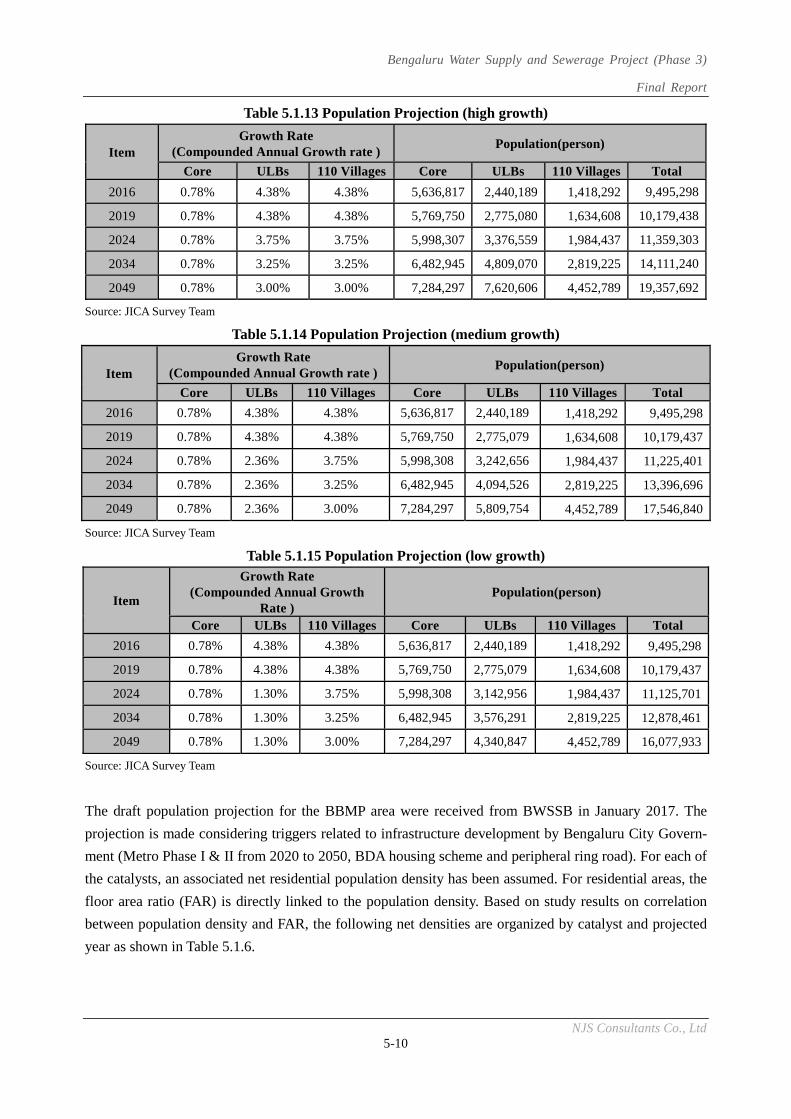
Bengaluru Water Supply and Sewerage Project (Phase 3)
Final Report
NJS Consultants Co., Ltd 5-10
Table 5.1.13 Population Projection (high growth)
Item Growth Rate
(Compounded Annual Growth rate ) Population(person)
Core ULBs 110 Villages Core ULBs 110 Villages Total
2016 0.78% 4.38% 4.38% 5,636,817 2,440,189 1,418,292 9,495,298
2019 0.78% 4.38% 4.38% 5,769,750 2,775,080 1,634,608 10,179,438
2024 0.78% 3.75% 3.75% 5,998,307 3,376,559 1,984,437 11,359,303
2034 0.78% 3.25% 3.25% 6,482,945 4,809,070 2,819,225 14,111,240
2049 0.78% 3.00% 3.00% 7,284,297 7,620,606 4,452,789 19,357,692
Source: JICA Survey Team
Table 5.1.14 Population Projection (medium growth)
Item Growth Rate
(Compounded Annual Growth rate )Population(person)
Core ULBs 110 Villages Core ULBs 110 Villages Total
2016 0.78% 4.38% 4.38% 5,636,817 2,440,189 1,418,292 9,495,298
2019 0.78% 4.38% 4.38% 5,769,750 2,775,079 1,634,608 10,179,437
2024 0.78% 2.36% 3.75% 5,998,308 3,242,656 1,984,437 11,225,401
2034 0.78% 2.36% 3.25% 6,482,945 4,094,526 2,819,225 13,396,696
2049 0.78% 2.36% 3.00% 7,284,297 5,809,754 4,452,789 17,546,840
Source: JICA Survey Team
Table 5.1.15 Population Projection (low growth)
Item
Growth Rate (Compounded Annual Growth
Rate ) Population(person)
Core ULBs 110 Villages Core ULBs 110 Villages Total
2016 0.78% 4.38% 4.38% 5,636,817 2,440,189 1,418,292 9,495,298
2019 0.78% 4.38% 4.38% 5,769,750 2,775,079 1,634,608 10,179,437
2024 0.78% 1.30% 3.75% 5,998,308 3,142,956 1,984,437 11,125,701
2034 0.78% 1.30% 3.25% 6,482,945 3,576,291 2,819,225 12,878,461
2049 0.78% 1.30% 3.00% 7,284,297 4,340,847 4,452,789 16,077,933
Source: JICA Survey Team
The draft population projection for the BBMP area were received from BWSSB in January 2017. The
projection is made considering triggers related to infrastructure development by Bengaluru City Govern-
ment (Metro Phase I & II from 2020 to 2050, BDA housing scheme and peripheral ring road). For each of
the catalysts, an associated net residential population density has been assumed. For residential areas, the
floor area ratio (FAR) is directly linked to the population density. Based on study results on correlation
between population density and FAR, the following net densities are organized by catalyst and projected
year as shown in Table 5.1.6.
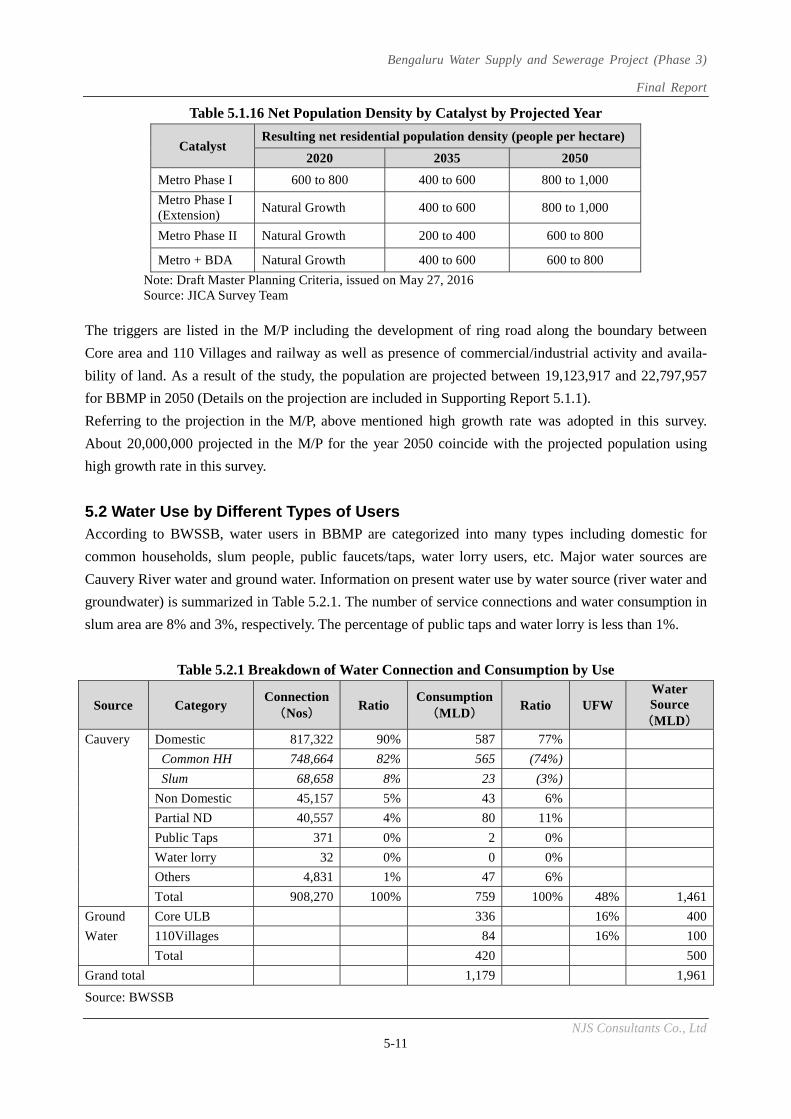
Bengaluru Water Supply and Sewerage Project (Phase 3)
Final Report
NJS Consultants Co., Ltd 5-11
Table 5.1.16 Net Population Density by Catalyst by Projected Year
Catalyst Resulting net residential population density (people per hectare)
2020 2035 2050
Metro Phase I 600 to 800 400 to 600 800 to 1,000
Metro Phase I (Extension)
Natural Growth 400 to 600 800 to 1,000
Metro Phase II Natural Growth 200 to 400 600 to 800
Metro + BDA Natural Growth 400 to 600 600 to 800
Note: Draft Master Planning Criteria, issued on May 27, 2016 Source: JICA Survey Team
The triggers are listed in the M/P including the development of ring road along the boundary between
Core area and 110 Villages and railway as well as presence of commercial/industrial activity and availa-
bility of land. As a result of the study, the population are projected between 19,123,917 and 22,797,957
for BBMP in 2050 (Details on the projection are included in Supporting Report 5.1.1).
Referring to the projection in the M/P, above mentioned high growth rate was adopted in this survey.
About 20,000,000 projected in the M/P for the year 2050 coincide with the projected population using
high growth rate in this survey.
5.2 Water Use by Different Types of Users According to BWSSB, water users in BBMP are categorized into many types including domestic for
common households, slum people, public faucets/taps, water lorry users, etc. Major water sources are
Cauvery River water and ground water. Information on present water use by water source (river water and
groundwater) is summarized in Table 5.2.1. The number of service connections and water consumption in
slum area are 8% and 3%, respectively. The percentage of public taps and water lorry is less than 1%.
Table 5.2.1 Breakdown of Water Connection and Consumption by Use
Source Category Connection
(Nos) Ratio
Consumption(MLD)
Ratio UFW Water Source(MLD)
Cauvery Domestic 817,322 90% 587 77%
Common HH 748,664 82% 565 (74%)
Slum 68,658 8% 23 (3%)
Non Domestic 45,157 5% 43 6%
Partial ND 40,557 4% 80 11%
Public Taps 371 0% 2 0%
Water lorry 32 0% 0 0%
Others 4,831 1% 47 6%
Total 908,270 100% 759 100% 48% 1,461
Ground Core ULB 336 16% 400
Water 110Villages 84 16% 100
Total 420 500
Grand total 1,179 1,961
Source: BWSSB
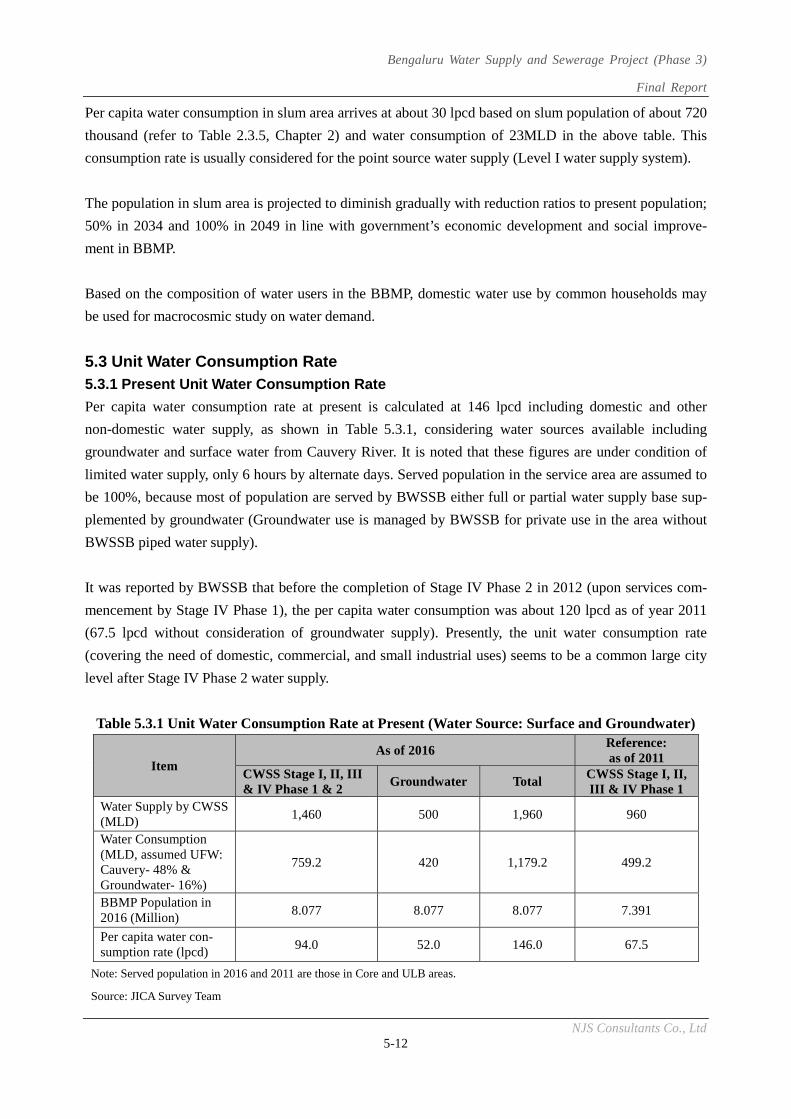
Bengaluru Water Supply and Sewerage Project (Phase 3)
Final Report
NJS Consultants Co., Ltd 5-12
Per capita water consumption in slum area arrives at about 30 lpcd based on slum population of about 720
thousand (refer to Table 2.3.5, Chapter 2) and water consumption of 23MLD in the above table. This
consumption rate is usually considered for the point source water supply (Level I water supply system).
The population in slum area is projected to diminish gradually with reduction ratios to present population;
50% in 2034 and 100% in 2049 in line with government’s economic development and social improve-
ment in BBMP.
Based on the composition of water users in the BBMP, domestic water use by common households may
be used for macrocosmic study on water demand.
5.3 Unit Water Consumption Rate 5.3.1 Present Unit Water Consumption Rate
Per capita water consumption rate at present is calculated at 146 lpcd including domestic and other
non-domestic water supply, as shown in Table 5.3.1, considering water sources available including
groundwater and surface water from Cauvery River. It is noted that these figures are under condition of
limited water supply, only 6 hours by alternate days. Served population in the service area are assumed to
be 100%, because most of population are served by BWSSB either full or partial water supply base sup-
plemented by groundwater (Groundwater use is managed by BWSSB for private use in the area without
BWSSB piped water supply).
It was reported by BWSSB that before the completion of Stage IV Phase 2 in 2012 (upon services com-
mencement by Stage IV Phase 1), the per capita water consumption was about 120 lpcd as of year 2011
(67.5 lpcd without consideration of groundwater supply). Presently, the unit water consumption rate
(covering the need of domestic, commercial, and small industrial uses) seems to be a common large city
level after Stage IV Phase 2 water supply.
Table 5.3.1 Unit Water Consumption Rate at Present (Water Source: Surface and Groundwater)
Item As of 2016
Reference: as of 2011
CWSS Stage I, II, III & IV Phase 1 & 2
Groundwater Total CWSS Stage I, II, III & IV Phase 1
Water Supply by CWSS (MLD)
1,460 500 1,960 960
Water Consumption (MLD, assumed UFW: Cauvery- 48% & Groundwater- 16%)
759.2 420 1,179.2 499.2
BBMP Population in 2016 (Million)
8.077 8.077 8.077 7.391
Per capita water con-sumption rate (lpcd)
94.0 52.0 146.0 67.5
Note: Served population in 2016 and 2011 are those in Core and ULB areas.
Source: JICA Survey Team
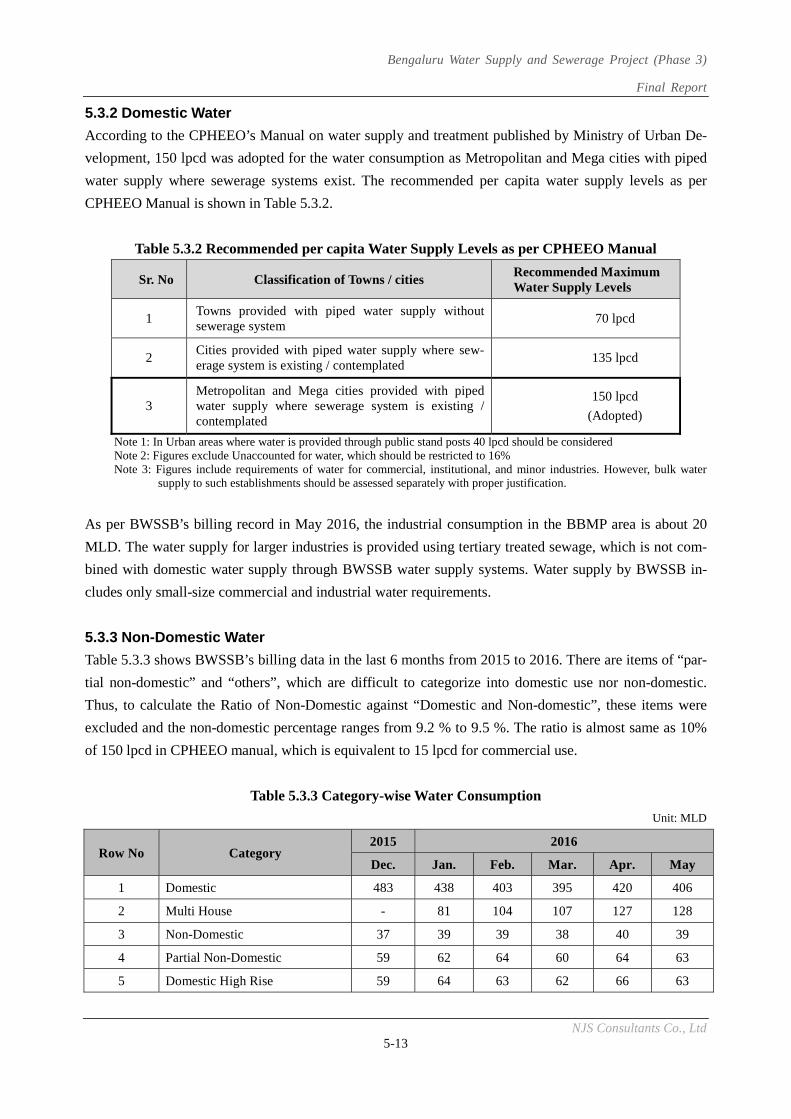
Bengaluru Water Supply and Sewerage Project (Phase 3)
Final Report
NJS Consultants Co., Ltd 5-13
5.3.2 Domestic Water
According to the CPHEEO’s Manual on water supply and treatment published by Ministry of Urban De-
velopment, 150 lpcd was adopted for the water consumption as Metropolitan and Mega cities with piped
water supply where sewerage systems exist. The recommended per capita water supply levels as per
CPHEEO Manual is shown in Table 5.3.2.
Table 5.3.2 Recommended per capita Water Supply Levels as per CPHEEO Manual
Sr. No Classification of Towns / cities Recommended Maximum Water Supply Levels
1 Towns provided with piped water supply without sewerage system
70 lpcd
2 Cities provided with piped water supply where sew-erage system is existing / contemplated
135 lpcd
3 Metropolitan and Mega cities provided with piped water supply where sewerage system is existing / contemplated
150 lpcd
(Adopted)
Note 1: In Urban areas where water is provided through public stand posts 40 lpcd should be considered Note 2: Figures exclude Unaccounted for water, which should be restricted to 16% Note 3: Figures include requirements of water for commercial, institutional, and minor industries. However, bulk water
supply to such establishments should be assessed separately with proper justification.
As per BWSSB’s billing record in May 2016, the industrial consumption in the BBMP area is about 20
MLD. The water supply for larger industries is provided using tertiary treated sewage, which is not com-
bined with domestic water supply through BWSSB water supply systems. Water supply by BWSSB in-
cludes only small-size commercial and industrial water requirements.
5.3.3 Non-Domestic Water
Table 5.3.3 shows BWSSB’s billing data in the last 6 months from 2015 to 2016. There are items of “par-
tial non-domestic” and “others”, which are difficult to categorize into domestic use nor non-domestic.
Thus, to calculate the Ratio of Non-Domestic against “Domestic and Non-domestic”, these items were
excluded and the non-domestic percentage ranges from 9.2 % to 9.5 %. The ratio is almost same as 10%
of 150 lpcd in CPHEEO manual, which is equivalent to 15 lpcd for commercial use.
Table 5.3.3 Category-wise Water Consumption
Unit: MLD
Row No Category 2015 2016
Dec. Jan. Feb. Mar. Apr. May
1 Domestic 483 438 403 395 420 406
2 Multi House - 81 104 107 127 128
3 Non-Domestic 37 39 39 38 40 39
4 Partial Non-Domestic 59 62 64 60 64 63
5 Domestic High Rise 59 64 63 62 66 63
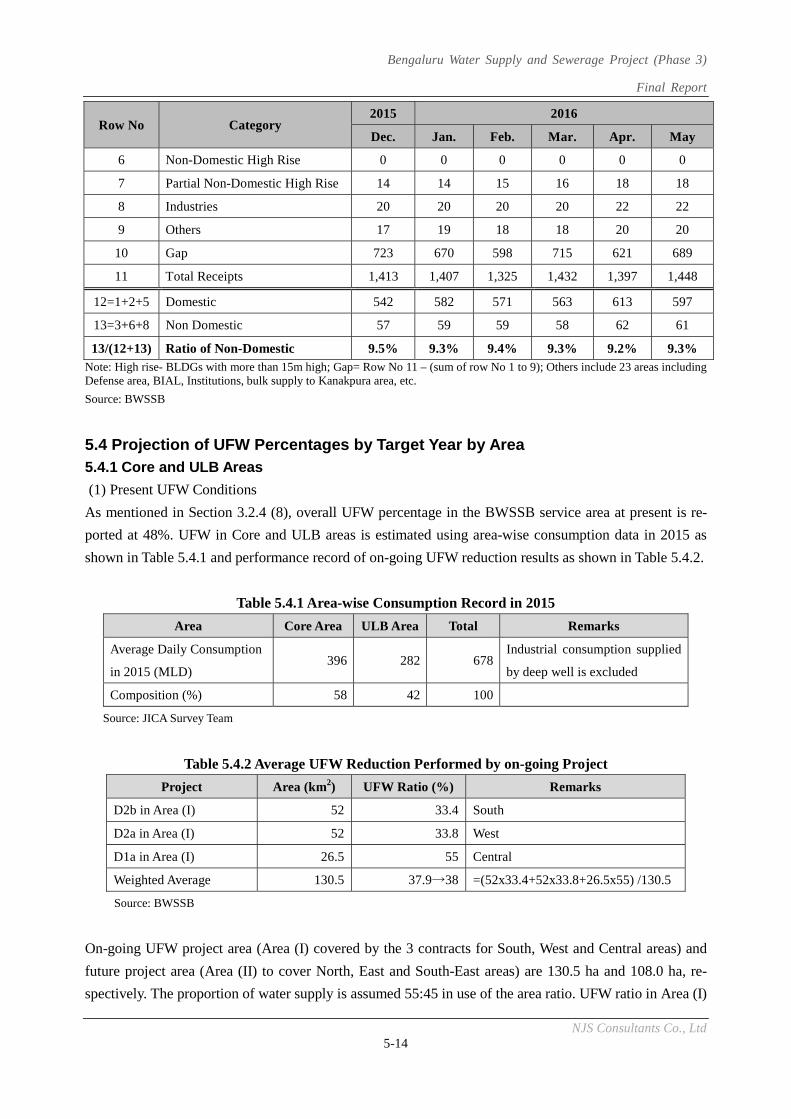
Bengaluru Water Supply and Sewerage Project (Phase 3)
Final Report
NJS Consultants Co., Ltd 5-14
Row No Category 2015 2016
Dec. Jan. Feb. Mar. Apr. May
6 Non-Domestic High Rise 0 0 0 0 0 0
7 Partial Non-Domestic High Rise 14 14 15 16 18 18
8 Industries 20 20 20 20 22 22
9 Others 17 19 18 18 20 20
10 Gap 723 670 598 715 621 689
11 Total Receipts 1,413 1,407 1,325 1,432 1,397 1,448
12=1+2+5 Domestic 542 582 571 563 613 597
13=3+6+8 Non Domestic 57 59 59 58 62 61
13/(12+13) Ratio of Non-Domestic 9.5% 9.3% 9.4% 9.3% 9.2% 9.3% Note: High rise- BLDGs with more than 15m high; Gap= Row No 11 – (sum of row No 1 to 9); Others include 23 areas including Defense area, BIAL, Institutions, bulk supply to Kanakpura area, etc.
Source: BWSSB
5.4 Projection of UFW Percentages by Target Year by Area 5.4.1 Core and ULB Areas
(1) Present UFW Conditions
As mentioned in Section 3.2.4 (8), overall UFW percentage in the BWSSB service area at present is re-
ported at 48%. UFW in Core and ULB areas is estimated using area-wise consumption data in 2015 as
shown in Table 5.4.1 and performance record of on-going UFW reduction results as shown in Table 5.4.2.
Table 5.4.1 Area-wise Consumption Record in 2015
Area Core Area ULB Area Total Remarks
Average Daily Consumption
in 2015 (MLD) 396 282 678
Industrial consumption supplied
by deep well is excluded
Composition (%) 58 42 100
Source: JICA Survey Team
Table 5.4.2 Average UFW Reduction Performed by on-going Project
Project Area (km2) UFW Ratio (%) Remarks
D2b in Area (I) 52 33.4 South
D2a in Area (I) 52 33.8 West
D1a in Area (I) 26.5 55 Central
Weighted Average 130.5 37.9→38 =(52x33.4+52x33.8+26.5x55) /130.5
Source: BWSSB
On-going UFW project area (Area (I) covered by the 3 contracts for South, West and Central areas) and
future project area (Area (II) to cover North, East and South-East areas) are 130.5 ha and 108.0 ha, re-
spectively. The proportion of water supply is assumed 55:45 in use of the area ratio. UFW ratio in Area (I)
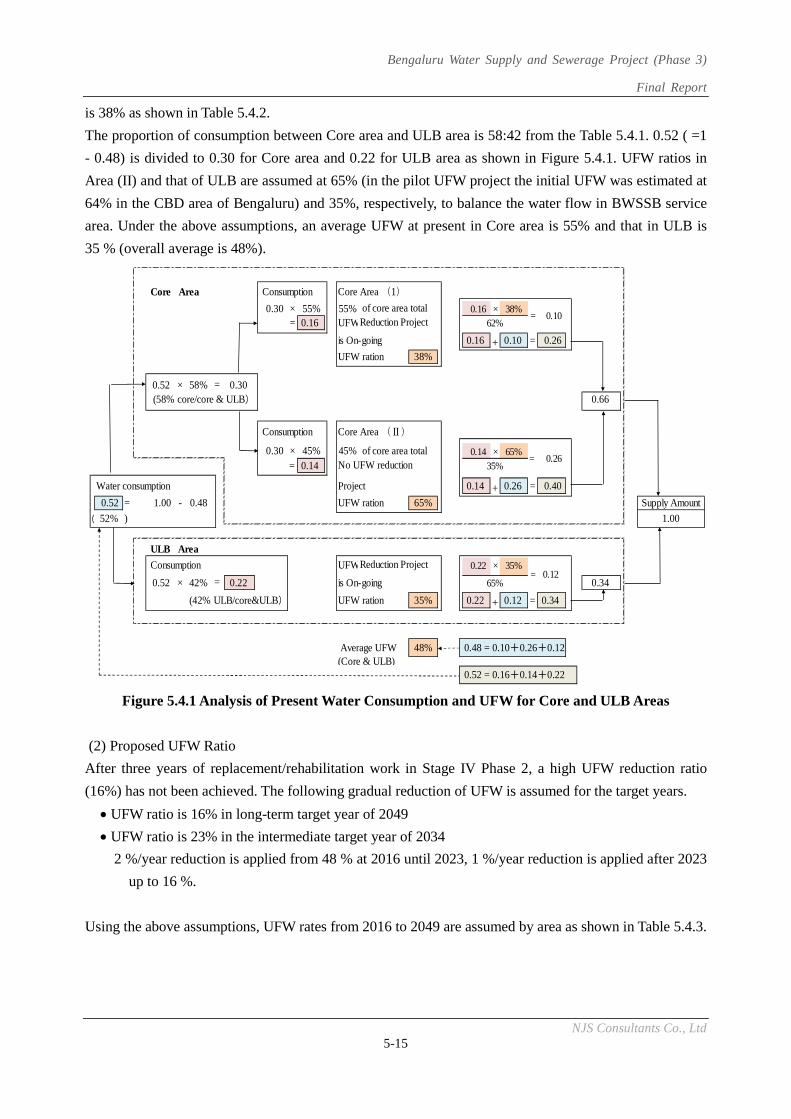
Bengaluru Water Supply and Sewerage Project (Phase 3)
Final Report
NJS Consultants Co., Ltd 5-15
is 38% as shown in Table 5.4.2.
The proportion of consumption between Core area and ULB area is 58:42 from the Table 5.4.1. 0.52 ( =1
- 0.48) is divided to 0.30 for Core area and 0.22 for ULB area as shown in Figure 5.4.1. UFW ratios in
Area (II) and that of ULB are assumed at 65% (in the pilot UFW project the initial UFW was estimated at
64% in the CBD area of Bengaluru) and 35%, respectively, to balance the water flow in BWSSB service
area. Under the above assumptions, an average UFW at present in Core area is 55% and that in ULB is
35 % (overall average is 48%).
Figure 5.4.1 Analysis of Present Water Consumption and UFW for Core and ULB Areas
(2) Proposed UFW Ratio
After three years of replacement/rehabilitation work in Stage IV Phase 2, a high UFW reduction ratio
(16%) has not been achieved. The following gradual reduction of UFW is assumed for the target years.
UFW ratio is 16% in long-term target year of 2049
UFW ratio is 23% in the intermediate target year of 2034
2 %/year reduction is applied from 48 % at 2016 until 2023, 1 %/year reduction is applied after 2023
up to 16 %.
Using the above assumptions, UFW rates from 2016 to 2049 are assumed by area as shown in Table 5.4.3.
Core Area Consumption Core Area (1)
0.30 × 55% 55% 0.16 × 38%= 0.16 UFW
is On-going 0.16 + 0.10 = 0.26
UFW ration 38%
0.52 × 58% 0.30(58% core/core & ULB) 0.66
Consumption Core Area (Ⅱ)
0.30 × 45% 45% 0.14 × 65%= 0.14
Water consumption Project 0.14 + 0.26 = 0.40
0.52 1.00 - 0.48 UFW ration 65% Supply Amount
( 52% )
ULB Area
Consumption UFW 0.22 × 35%
0.52 × 42% 0.22 is On-going 0.34
(42% ULB/core&ULB) UFW ration 35% 0.22 + 0.12 = 0.34
Average UFW 48% 0.48 = 0.10+0.26+0.12(Core & ULB)
0.52 = 0.16+0.14+0.22
=
= 0.12Reduction Project
65%=
=
1.00
= 0.10 of core area total
62%Reduction Project
= 0.26 of core area total
35%No UFW reduction
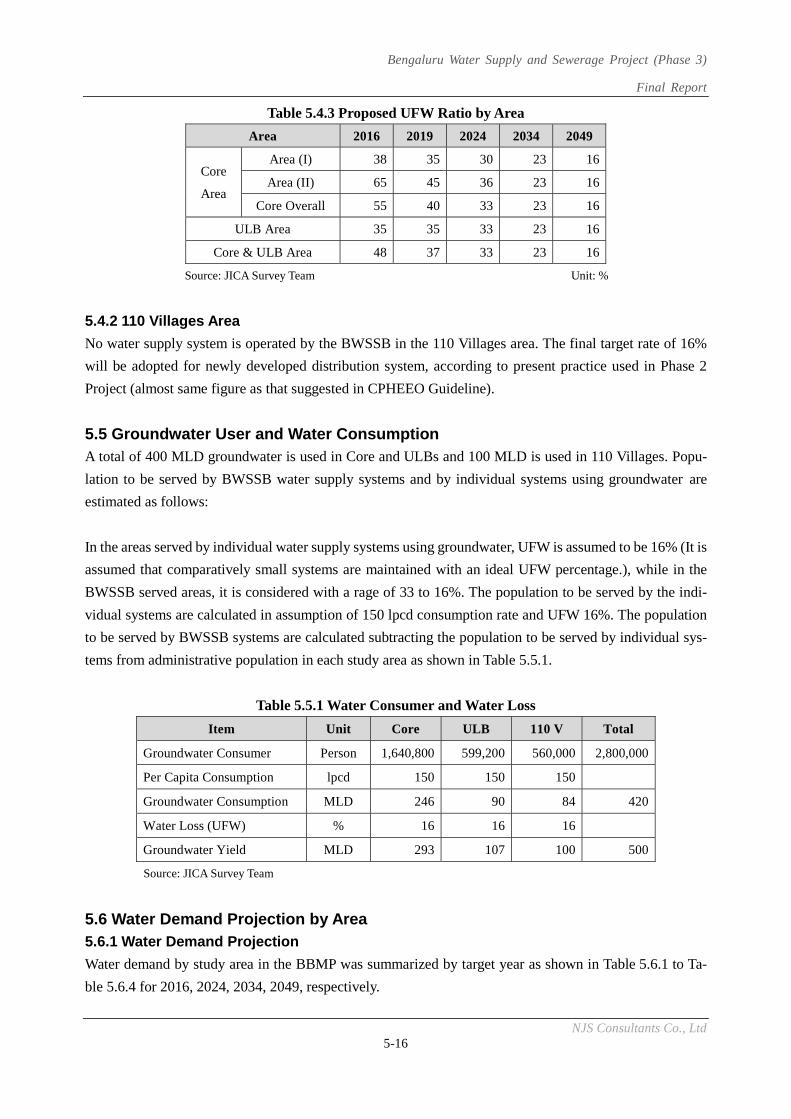
Bengaluru Water Supply and Sewerage Project (Phase 3)
Final Report
NJS Consultants Co., Ltd 5-16
Table 5.4.3 Proposed UFW Ratio by Area
Area 2016 2019 2024 2034 2049
Core
Area
Area (I) 38 35 30 23 16
Area (II) 65 45 36 23 16
Core Overall 55 40 33 23 16
ULB Area 35 35 33 23 16
Core & ULB Area 48 37 33 23 16
Source: JICA Survey Team Unit: %
5.4.2 110 Villages Area
No water supply system is operated by the BWSSB in the 110 Villages area. The final target rate of 16%
will be adopted for newly developed distribution system, according to present practice used in Phase 2
Project (almost same figure as that suggested in CPHEEO Guideline).
5.5 Groundwater User and Water Consumption A total of 400 MLD groundwater is used in Core and ULBs and 100 MLD is used in 110 Villages. Popu-
lation to be served by BWSSB water supply systems and by individual systems using groundwater are
estimated as follows:
In the areas served by individual water supply systems using groundwater, UFW is assumed to be 16% (It is
assumed that comparatively small systems are maintained with an ideal UFW percentage.), while in the
BWSSB served areas, it is considered with a rage of 33 to 16%. The population to be served by the indi-
vidual systems are calculated in assumption of 150 lpcd consumption rate and UFW 16%. The population
to be served by BWSSB systems are calculated subtracting the population to be served by individual sys-
tems from administrative population in each study area as shown in Table 5.5.1.
Table 5.5.1 Water Consumer and Water Loss
Item Unit Core ULB 110 V Total
Groundwater Consumer Person 1,640,800 599,200 560,000 2,800,000
Per Capita Consumption lpcd 150 150 150
Groundwater Consumption MLD 246 90 84 420
Water Loss (UFW) % 16 16 16
Groundwater Yield MLD 293 107 100 500
Source: JICA Survey Team
5.6 Water Demand Projection by Area 5.6.1 Water Demand Projection
Water demand by study area in the BBMP was summarized by target year as shown in Table 5.6.1 to Ta-
ble 5.6.4 for 2016, 2024, 2034, 2049, respectively.
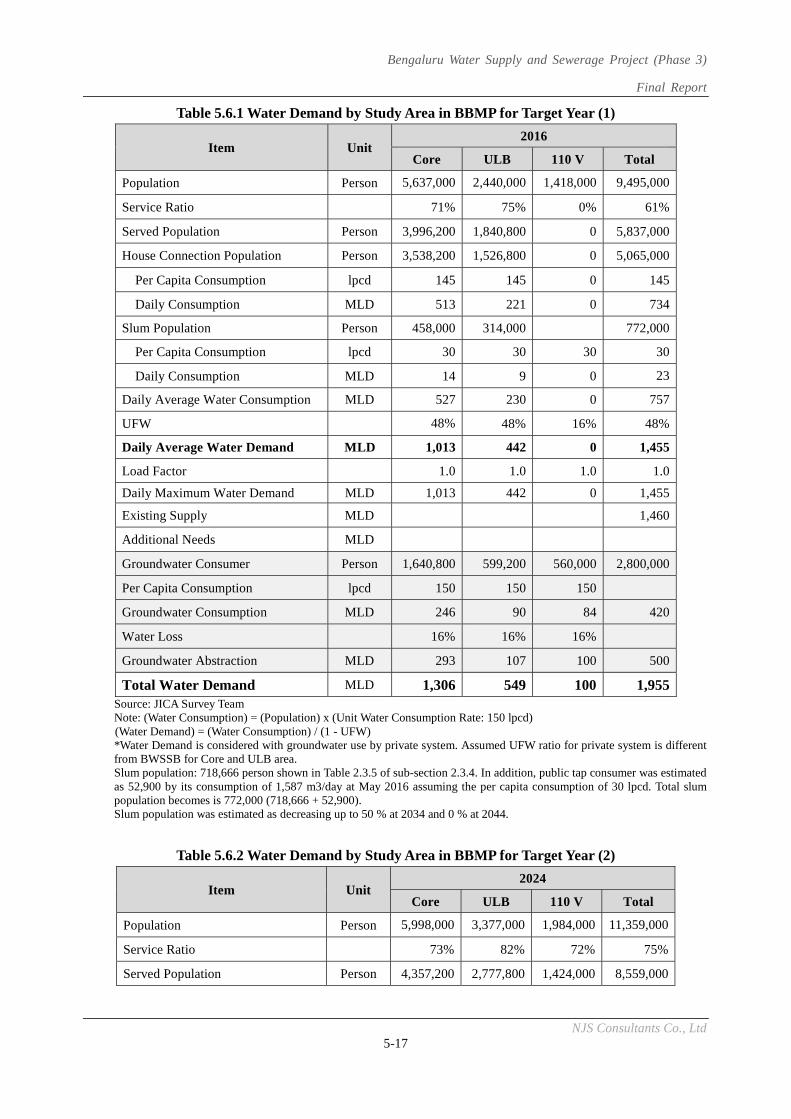
Bengaluru Water Supply and Sewerage Project (Phase 3)
Final Report
NJS Consultants Co., Ltd 5-17
Table 5.6.1 Water Demand by Study Area in BBMP for Target Year (1)
Item Unit 2016
Core ULB 110 V Total
Population Person 5,637,000 2,440,000 1,418,000 9,495,000
Service Ratio 71% 75% 0% 61%
Served Population Person 3,996,200 1,840,800 0 5,837,000
House Connection Population Person 3,538,200 1,526,800 0 5,065,000
Per Capita Consumption lpcd 145 145 0 145
Daily Consumption MLD 513 221 0 734
Slum Population Person 458,000 314,000 772,000
Per Capita Consumption lpcd 30 30 30 30
Daily Consumption MLD 14 9 0 23
Daily Average Water Consumption MLD 527 230 0 757
UFW 48% 48% 16% 48%
Daily Average Water Demand MLD 1,013 442 0 1,455
Load Factor 1.0 1.0 1.0 1.0
Daily Maximum Water Demand MLD 1,013 442 0 1,455
Existing Supply MLD 1,460
Additional Needs MLD
Groundwater Consumer Person 1,640,800 599,200 560,000 2,800,000
Per Capita Consumption lpcd 150 150 150
Groundwater Consumption MLD 246 90 84 420
Water Loss 16% 16% 16%
Groundwater Abstraction MLD 293 107 100 500
Total Water Demand MLD 1,306 549 100 1,955Source: JICA Survey Team Note: (Water Consumption) = (Population) x (Unit Water Consumption Rate: 150 lpcd)
(Water Demand) = (Water Consumption) / (1 - UFW) *Water Demand is considered with groundwater use by private system. Assumed UFW ratio for private system is different from BWSSB for Core and ULB area. Slum population: 718,666 person shown in Table 2.3.5 of sub-section 2.3.4. In addition, public tap consumer was estimated as 52,900 by its consumption of 1,587 m3/day at May 2016 assuming the per capita consumption of 30 lpcd. Total slum population becomes is 772,000 (718,666 + 52,900). Slum population was estimated as decreasing up to 50 % at 2034 and 0 % at 2044.
Table 5.6.2 Water Demand by Study Area in BBMP for Target Year (2)
Item Unit 2024
Core ULB 110 V Total
Population Person 5,998,000 3,377,000 1,984,000 11,359,000
Service Ratio 73% 82% 72% 75%
Served Population Person 4,357,200 2,777,800 1,424,000 8,559,000
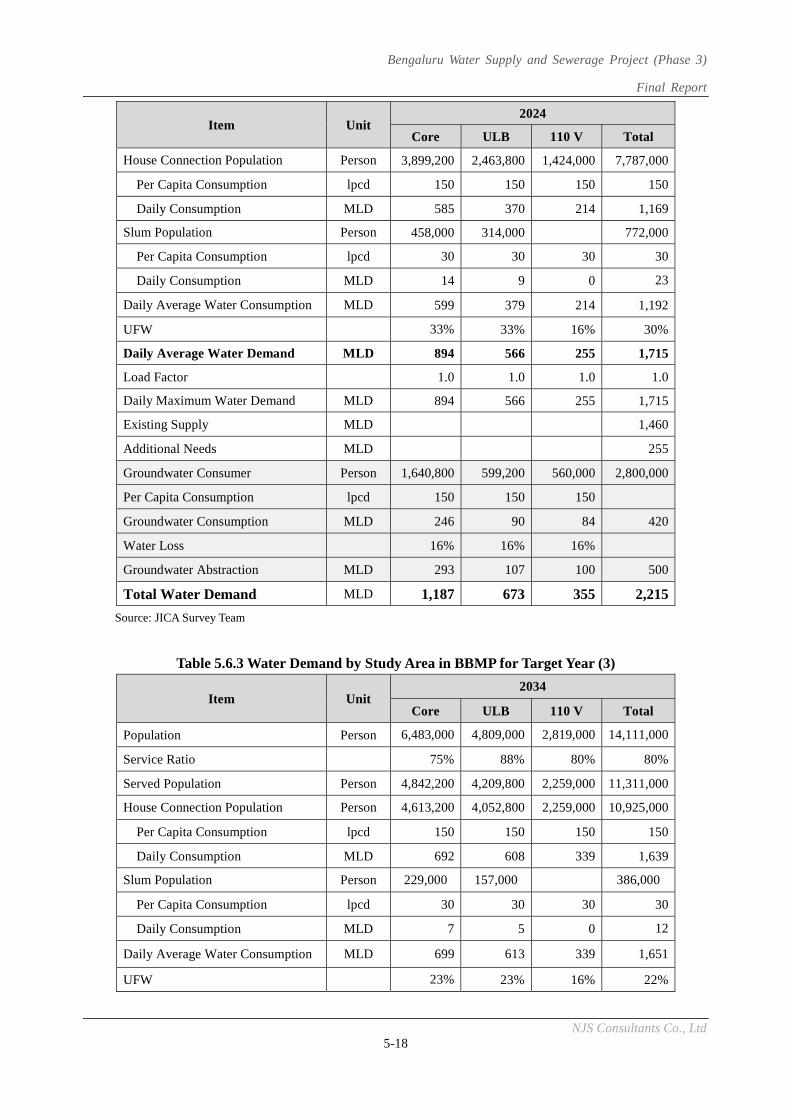
Bengaluru Water Supply and Sewerage Project (Phase 3)
Final Report
NJS Consultants Co., Ltd 5-18
Item Unit 2024
Core ULB 110 V Total
House Connection Population Person 3,899,200 2,463,800 1,424,000 7,787,000
Per Capita Consumption lpcd 150 150 150 150
Daily Consumption MLD 585 370 214 1,169
Slum Population Person 458,000 314,000 772,000
Per Capita Consumption lpcd 30 30 30 30
Daily Consumption MLD 14 9 0 23
Daily Average Water Consumption MLD 599 379 214 1,192
UFW 33% 33% 16% 30%
Daily Average Water Demand MLD 894 566 255 1,715
Load Factor 1.0 1.0 1.0 1.0
Daily Maximum Water Demand MLD 894 566 255 1,715
Existing Supply MLD 1,460
Additional Needs MLD 255
Groundwater Consumer Person 1,640,800 599,200 560,000 2,800,000
Per Capita Consumption lpcd 150 150 150
Groundwater Consumption MLD 246 90 84 420
Water Loss 16% 16% 16%
Groundwater Abstraction MLD 293 107 100 500
Total Water Demand MLD 1,187 673 355 2,215
Source: JICA Survey Team
Table 5.6.3 Water Demand by Study Area in BBMP for Target Year (3)
Item Unit 2034
Core ULB 110 V Total
Population Person 6,483,000 4,809,000 2,819,000 14,111,000
Service Ratio 75% 88% 80% 80%
Served Population Person 4,842,200 4,209,800 2,259,000 11,311,000
House Connection Population Person 4,613,200 4,052,800 2,259,000 10,925,000
Per Capita Consumption lpcd 150 150 150 150
Daily Consumption MLD 692 608 339 1,639
Slum Population Person 229,000 157,000
386,000
Per Capita Consumption lpcd 30 30 30 30
Daily Consumption MLD 7 5 0 12
Daily Average Water Consumption MLD 699 613 339 1,651
UFW 23% 23% 16% 22%
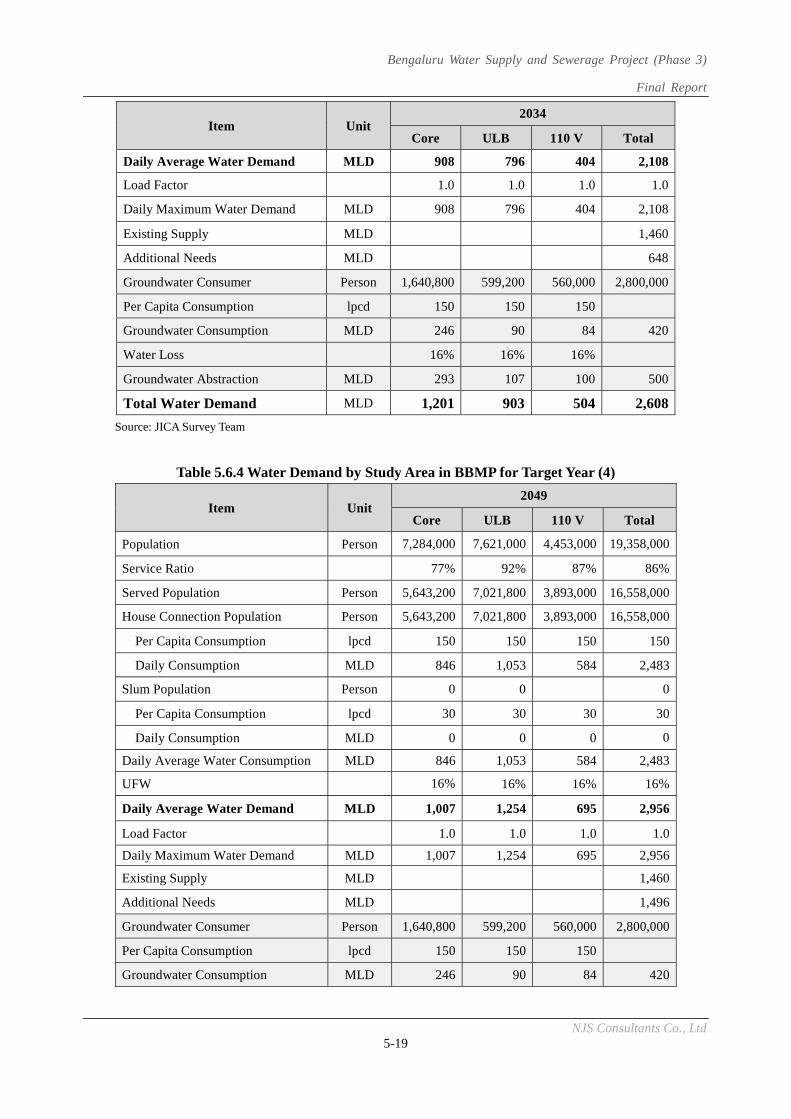
Bengaluru Water Supply and Sewerage Project (Phase 3)
Final Report
NJS Consultants Co., Ltd 5-19
Item Unit 2034
Core ULB 110 V Total
Daily Average Water Demand MLD 908 796 404 2,108
Load Factor 1.0 1.0 1.0 1.0
Daily Maximum Water Demand MLD 908 796 404 2,108
Existing Supply MLD 1,460
Additional Needs MLD 648
Groundwater Consumer Person 1,640,800 599,200 560,000 2,800,000
Per Capita Consumption lpcd 150 150 150
Groundwater Consumption MLD 246 90 84 420
Water Loss 16% 16% 16%
Groundwater Abstraction MLD 293 107 100 500
Total Water Demand MLD 1,201 903 504 2,608
Source: JICA Survey Team
Table 5.6.4 Water Demand by Study Area in BBMP for Target Year (4)
Item Unit 2049
Core ULB 110 V Total
Population Person 7,284,000 7,621,000 4,453,000 19,358,000
Service Ratio 77% 92% 87% 86%
Served Population Person 5,643,200 7,021,800 3,893,000 16,558,000
House Connection Population Person 5,643,200 7,021,800 3,893,000 16,558,000
Per Capita Consumption lpcd 150 150 150 150
Daily Consumption MLD 846 1,053 584 2,483
Slum Population Person 0 0
0
Per Capita Consumption lpcd 30 30 30 30
Daily Consumption MLD 0 0 0 0
Daily Average Water Consumption MLD 846 1,053 584 2,483
UFW 16% 16% 16% 16%
Daily Average Water Demand MLD 1,007 1,254 695 2,956
Load Factor 1.0 1.0 1.0 1.0
Daily Maximum Water Demand MLD 1,007 1,254 695 2,956
Existing Supply MLD 1,460
Additional Needs MLD 1,496
Groundwater Consumer Person 1,640,800 599,200 560,000 2,800,000
Per Capita Consumption lpcd 150 150 150
Groundwater Consumption MLD 246 90 84 420
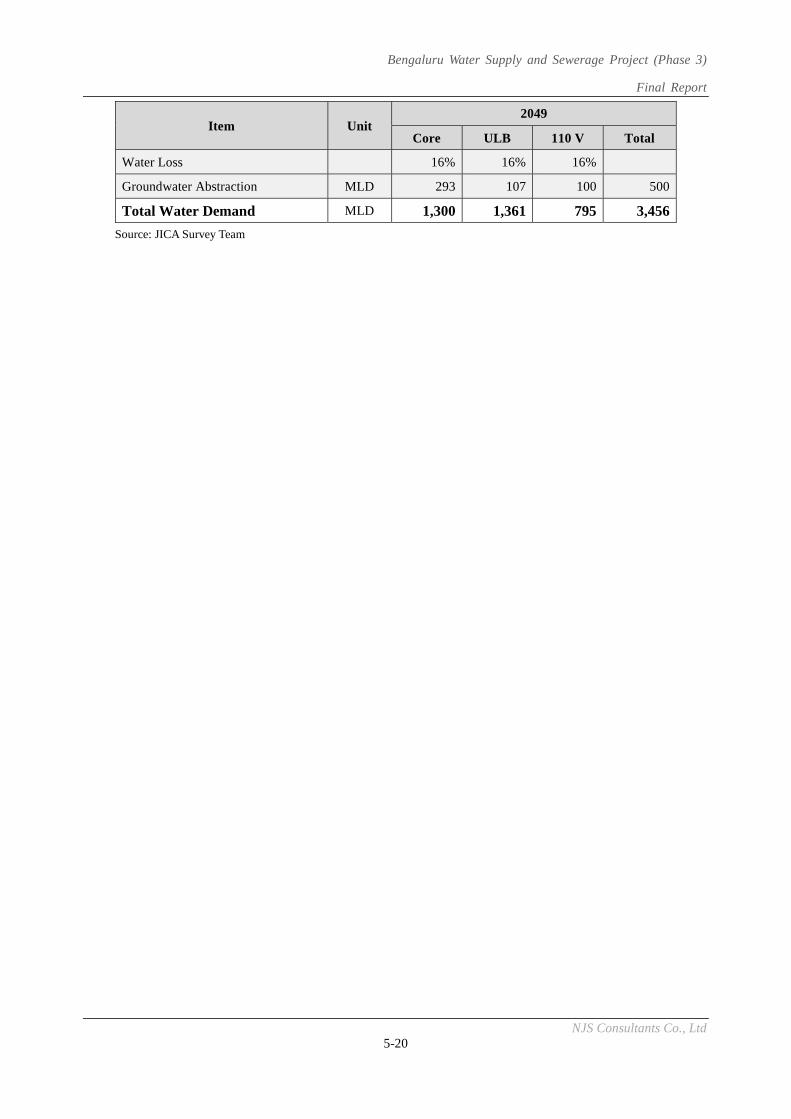
Bengaluru Water Supply and Sewerage Project (Phase 3)
Final Report
NJS Consultants Co., Ltd 5-20
Item Unit 2049
Core ULB 110 V Total
Water Loss 16% 16% 16%
Groundwater Abstraction MLD 293 107 100 500
Total Water Demand MLD 1,300 1,361 795 3,456
Source: JICA Survey Team
Related Documents