Environmental Systems Research Institute, Inc., 380 New York St., Redlands, CA 92373-8100 USA • TEL 909-793-2853 • FAX 909-307-3014 Performance and Scalability Benchmark ArcGIS Server 10 REST Dynamic Map Service Export Map Version 2.0 Prepared by: ESRI Professional Services Enterprise Implementation Services Team Redlands, California June 28, 2010

Welcome message from author
This document is posted to help you gain knowledge. Please leave a comment to let me know what you think about it! Share it to your friends and learn new things together.
Transcript
Environmental Systems Research Institute, Inc., 380 New York St., Redlands, CA 92373-8100 USA • TEL 909-793-2853 • FAX 909-307-3014
Performance and Scalability Benchmark ArcGIS Server 10 REST Dynamic Map Service Export Map
Version 2.0
Prepared by:
ESRI Professional Services
Enterprise Implementation Services Team
Redlands, California
June 28, 2010
Performance and Scalability Benchmark: ArcGIS Server 10 REST Dynamic Map Service Export Map
2
1 OBJECTIVE ................................................................................................................................................... 3
2 APPLICATION ARCHITECTURE ............................................................................................................ 3
3 HARDWARE AND SOFTWARE CONFIGURATION ............................................................................ 3
4 BENCHMARK RESULTS ............................................................................................................................ 4
4.1 PERFORMANCE AND SCALABILITY ....................................................................................................................... 4
4.2 RESOURCE UTILIZATION ................................................................................................................................... 5
5 CAPACITY PLANNING .............................................................................................................................. 6
5.1 CPU SPECRATE .............................................................................................................................................. 6
5.2 CPU SERVICE TIME ......................................................................................................................................... 6
5.3 TRANSACTION SIZE .......................................................................................................................................... 6
6 BENCHMARK VARIATION – IMAGE FORMAT .................................................................................. 7
6.1 CPU SPECRATE .............................................................................................................................................. 7
6.2 PERFORMANCE AND SCALABILITY ....................................................................................................................... 7
6.3 CPU SERVICE TIME ......................................................................................................................................... 7
6.4 TRANSACTION SIZE .......................................................................................................................................... 7
7 BENCHMARK VARIATION – IMAGE SIZE ........................................................................................ 10
7.1 PERFORMANCE AND SCALABILITY ..................................................................................................................... 10
7.2 CPU SERVICE TIME ....................................................................................................................................... 10
7.3 TRANSACTION SIZE/TIME ............................................................................................................................... 10
8 APPENDIXES .............................................................................................................................................. 13
8.1 BENCHMARK APPROACH ................................................................................................................................ 13
8.2 BENCHMARK CONFIGURATION ......................................................................................................................... 13
8.3 TRANSACTION DESCRIPTION ............................................................................................................................ 13
8.4 DATA DESCRIPTION ....................................................................................................................................... 13
8.5 TESTING TOOLS ............................................................................................................................................ 13
8.6 APPLICATION ............................................................................................................................................... 14
8.7 MXD DESCRIPTION ....................................................................................................................................... 14
8.8 DEFINITIONS ................................................................................................................................................ 17
8.8.1 Performance and Scalability ............................................................................................................. 17
8.8.2 CPU Service Time Web ...................................................................................................................... 17
8.8.3 CPU Service Time ArcGIS SOC ............................................................................................................ 17
8.8.4 CPU Service Time DB ......................................................................................................................... 17
Performance and Scalability Benchmark: ArcGIS Server 10 REST Dynamic Map Service Export Map
3
1 Objective
This benchmark’s objective is to measure and present the performance and scalability of the ArcGIS Server 10
REST API map service using the Portland Metro Area dataset. The dataset was tested without the raster layers.
For details on the benchmarking process, see Capacity Planning and Performance Benchmark Reference Guide.
2 Application Architecture
This benchmark will isolate the ArcGIS Server 10 REST API dynamic map service.
For details on ArcGIS Server services, see: ArcGIS Server Web Service API.
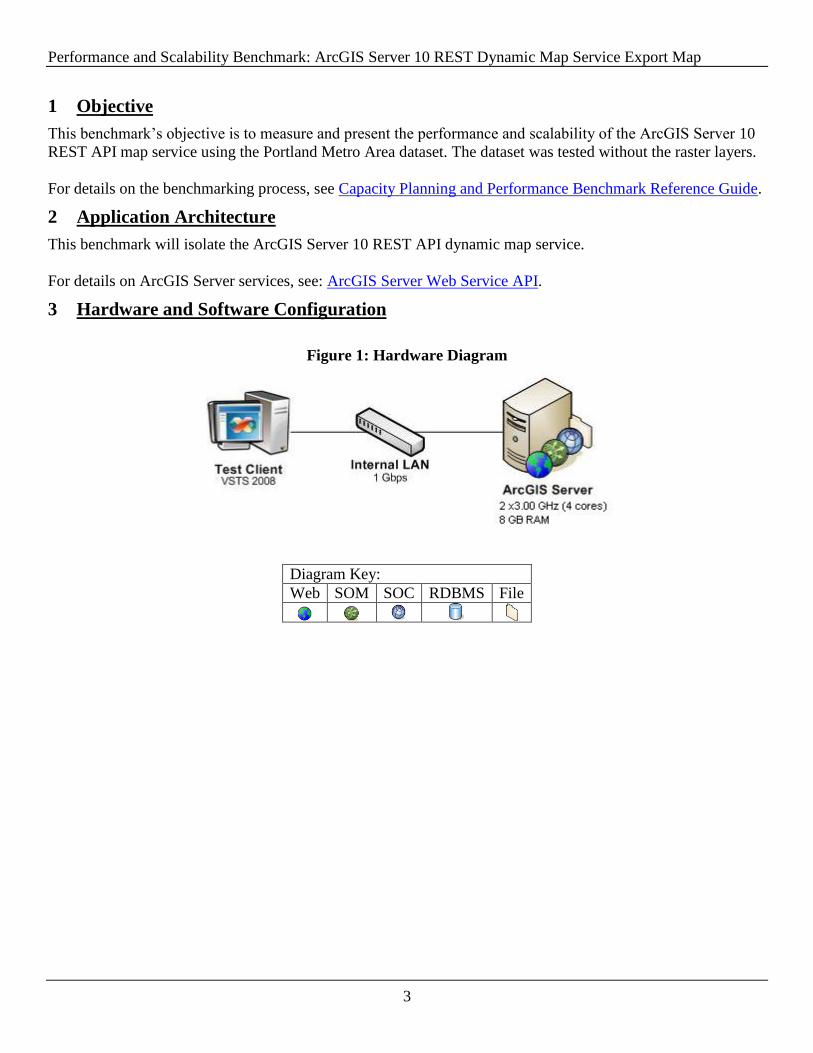
3 Hardware and Software Configuration
Figure 1: Hardware Diagram
Diagram Key:
Web SOM SOC RDBMS File
Performance and Scalability Benchmark: ArcGIS Server 10 REST Dynamic Map Service Export Map
4
4 Benchmark Results
This section reports key performance and scalability information. For details and practical application of these
results, see Capacity Planning and Performance Benchmark Reference Guide.
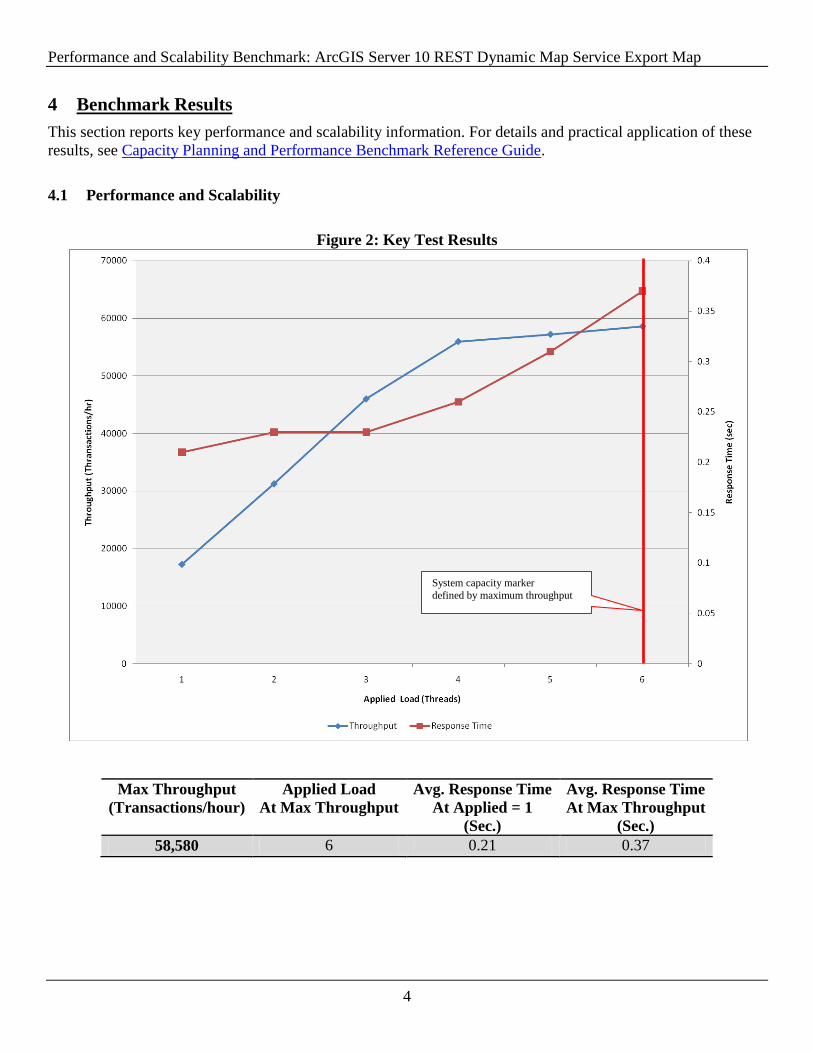
4.1 Performance and Scalability
Figure 2: Key Test Results
Max Throughput
(Transactions/hour)
Applied Load
At Max Throughput
Avg. Response Time
At Applied = 1
(Sec.)
Avg. Response Time
At Max Throughput
(Sec.)
58,580 6 0.21 0.37
System capacity marker
defined by maximum throughput
Performance and Scalability Benchmark: ArcGIS Server 10 REST Dynamic Map Service Export Map
5
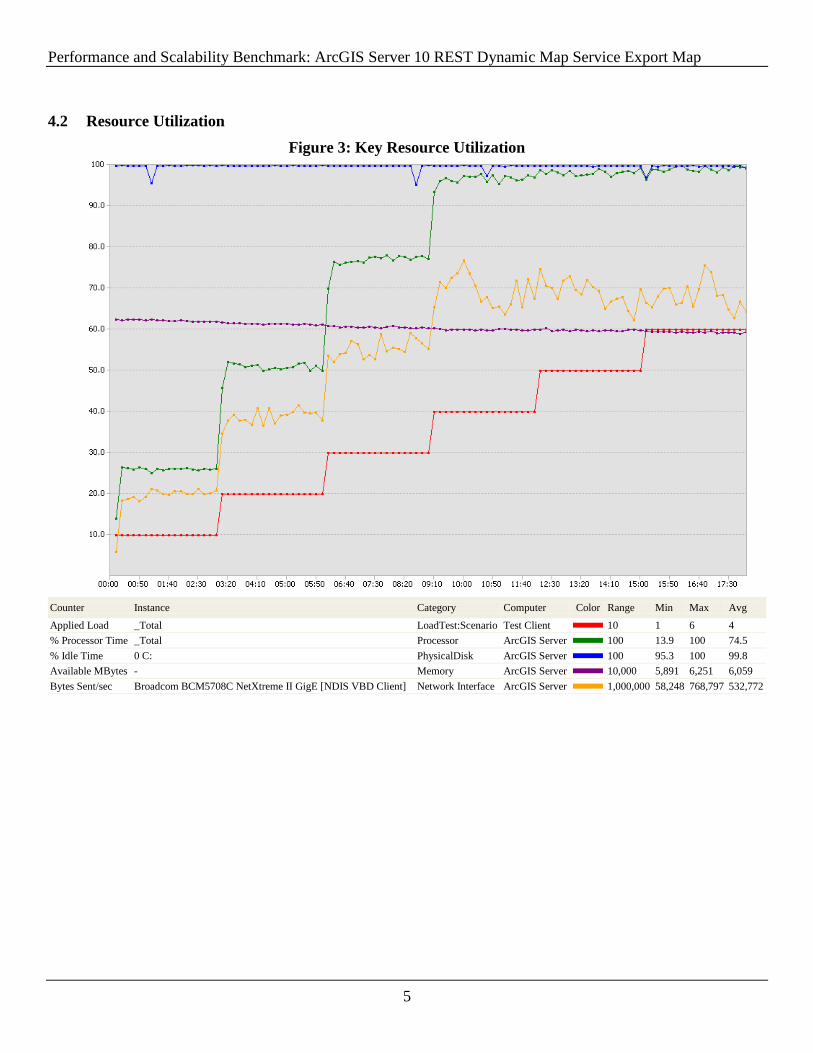
4.2 Resource Utilization
Figure 3: Key Resource Utilization
Counter Instance Category Computer Color Range Min Max Avg
Applied Load _Total LoadTest:Scenario Test Client
10 1 6 4
% Processor Time _Total Processor ArcGIS Server
100 13.9 100 74.5
% Idle Time 0 C: PhysicalDisk ArcGIS Server
100 95.3 100 99.8
Available MBytes - Memory ArcGIS Server
10,000 5,891 6,251 6,059
Bytes Sent/sec Broadcom BCM5708C NetXtreme II GigE [NDIS VBD Client] Network Interface ArcGIS Server
1,000,000 58,248 768,797 532,772
Performance and Scalability Benchmark: ArcGIS Server 10 REST Dynamic Map Service Export Map
6
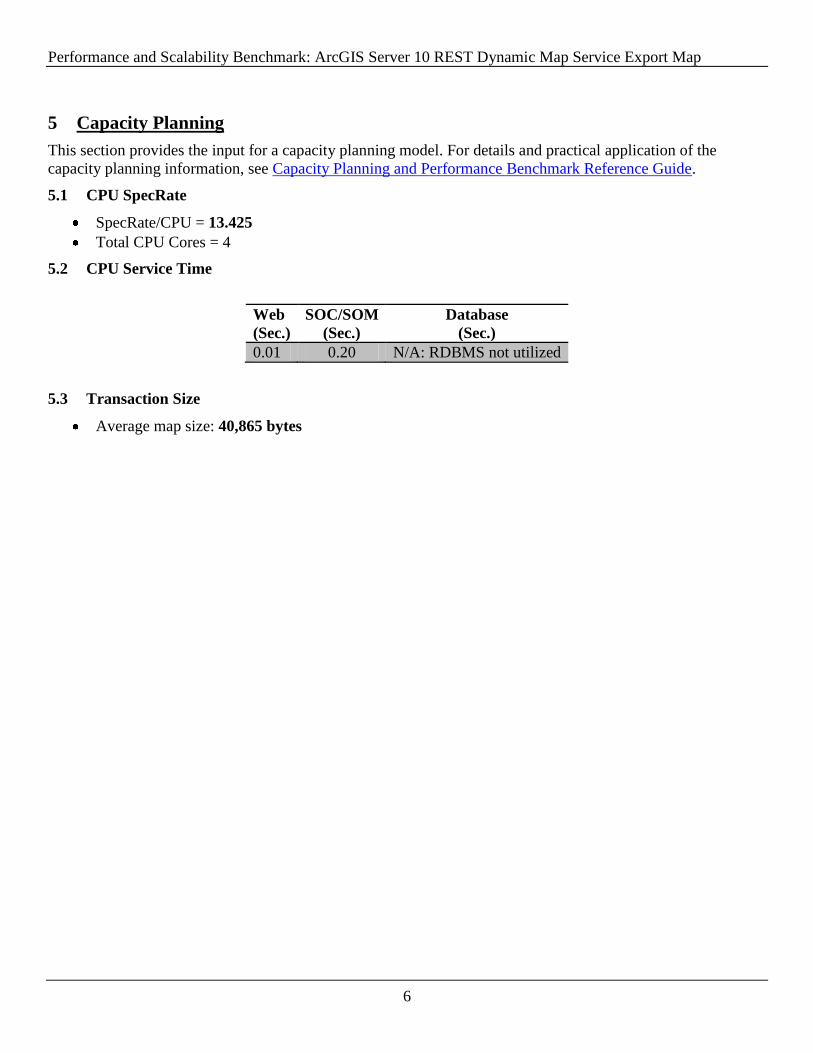
5 Capacity Planning
This section provides the input for a capacity planning model. For details and practical application of the
capacity planning information, see Capacity Planning and Performance Benchmark Reference Guide.
5.1 CPU SpecRate
SpecRate/CPU = 13.425
Total CPU Cores = 4
5.2 CPU Service Time
Web
(Sec.)
SOC/SOM
(Sec.)
Database
(Sec.)
0.01 0.20 N/A: RDBMS not utilized
5.3 Transaction Size
Average map size: 40,865 bytes

Performance and Scalability Benchmark: ArcGIS Server 10 REST Dynamic Map Service Export Map
7
6 Benchmark Variation – Image Format
This section provides supplemental benchmarks conducted subsequently. This benchmark has been varied by
image format type.
JPEG, 1280x1024
PNG 8, 1280x1024
PNG 24, 1280x1024
PNG 32, 1280x1024
6.1 CPU SpecRate
4 CPU cores.
SpecRate/CPU= 13.425
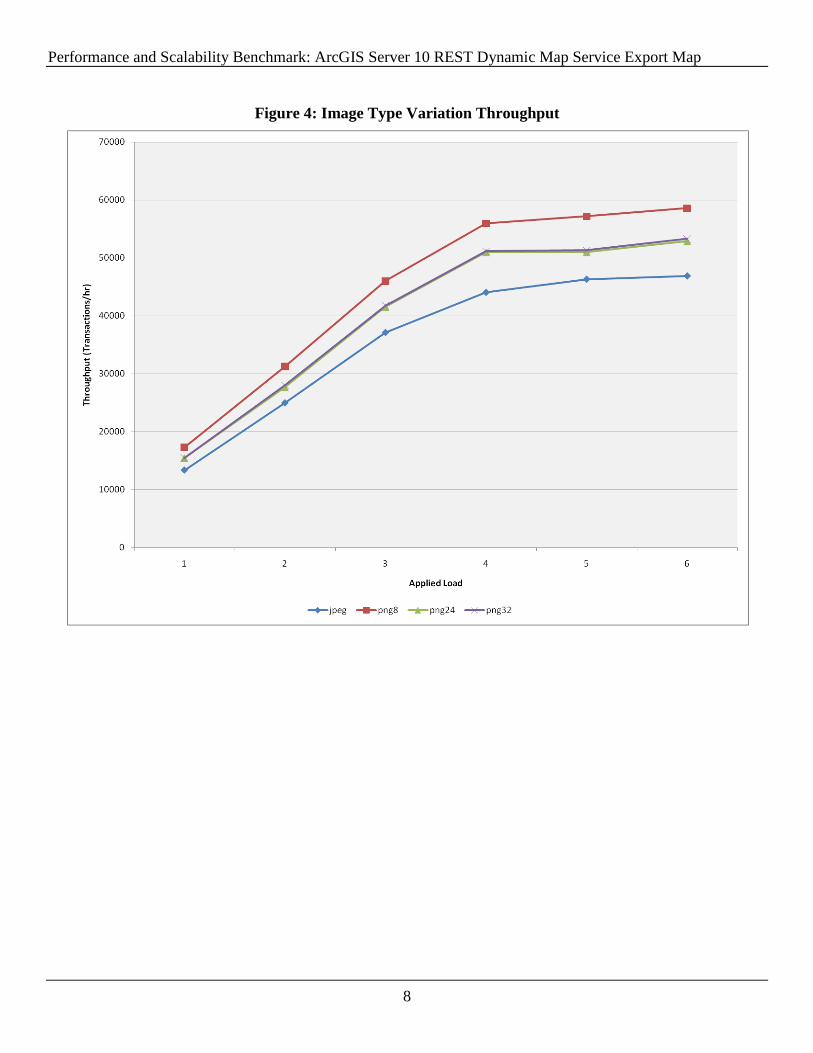
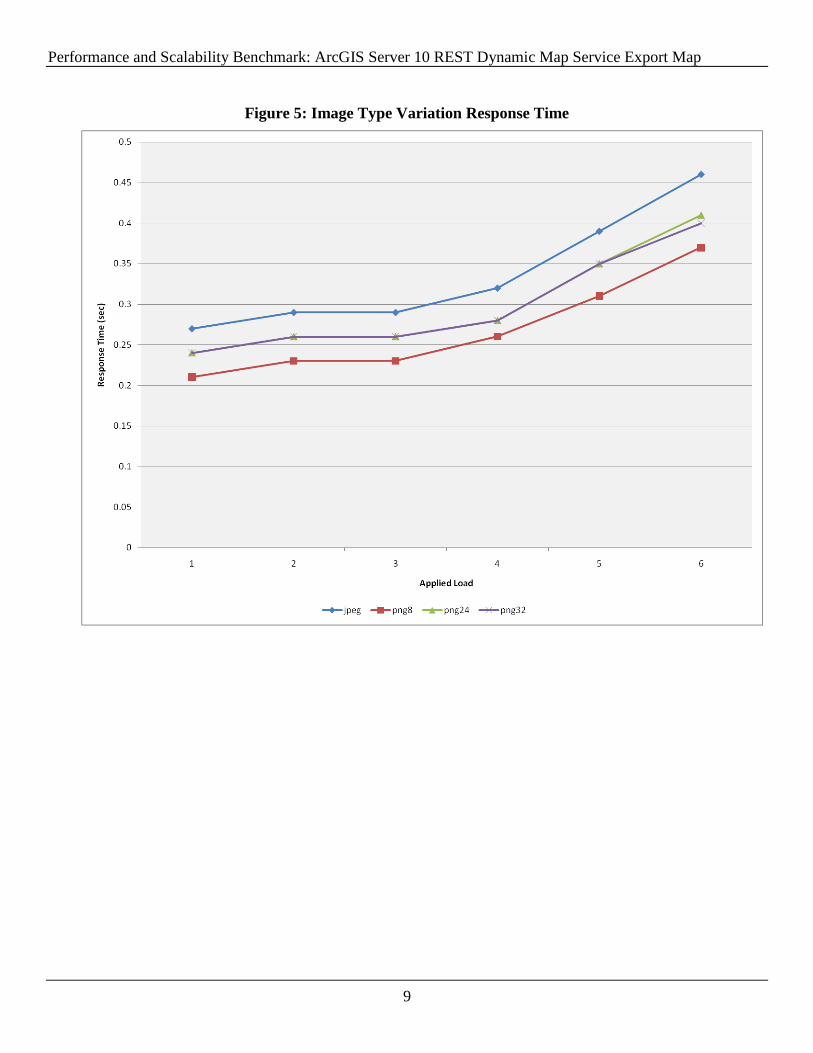
6.2 Performance and Scalability
Variation Maximum Throughput
(Transactions/hour)
User Load
At Max Throughput
Avg. Response Time
At User Load = 1
(Sec.)
Avg. Response Time
At Max Throughput
(Sec.)
JPEG 46,860 6 0.027 0.46
PNG 8 58,580 6 0.21 0.37
PNG 24 52,880 6 0.024 0.41
PNG 32 53,280 6 0.024 0.40
6.3 CPU Service Time
Variation Web
(Sec.)
SOC/SOM
(Sec.)
Database
(Sec.)
JPEG 0.01 0.25 N/A: RDBMS not utilized
PNG 8 0.01 0.20 N/A: RDBMS not utilized
PNG 24 0.01 0.23 N/A: RDBMS not utilized
PNG 32 0.01 0.23 N/A: RDBMS not utilized
6.4 Transaction Size
Variation Transaction Size
(bytes)
JPEG 239,164
PNG 8 40,865
PNG 24 75,625
PNG 32 78,183
Performance and Scalability Benchmark: ArcGIS Server 10 REST Dynamic Map Service Export Map
8
Figure 4: Image Type Variation Throughput
Performance and Scalability Benchmark: ArcGIS Server 10 REST Dynamic Map Service Export Map
9
Figure 5: Image Type Variation Response Time
Performance and Scalability Benchmark: ArcGIS Server 10 REST Dynamic Map Service Export Map
10
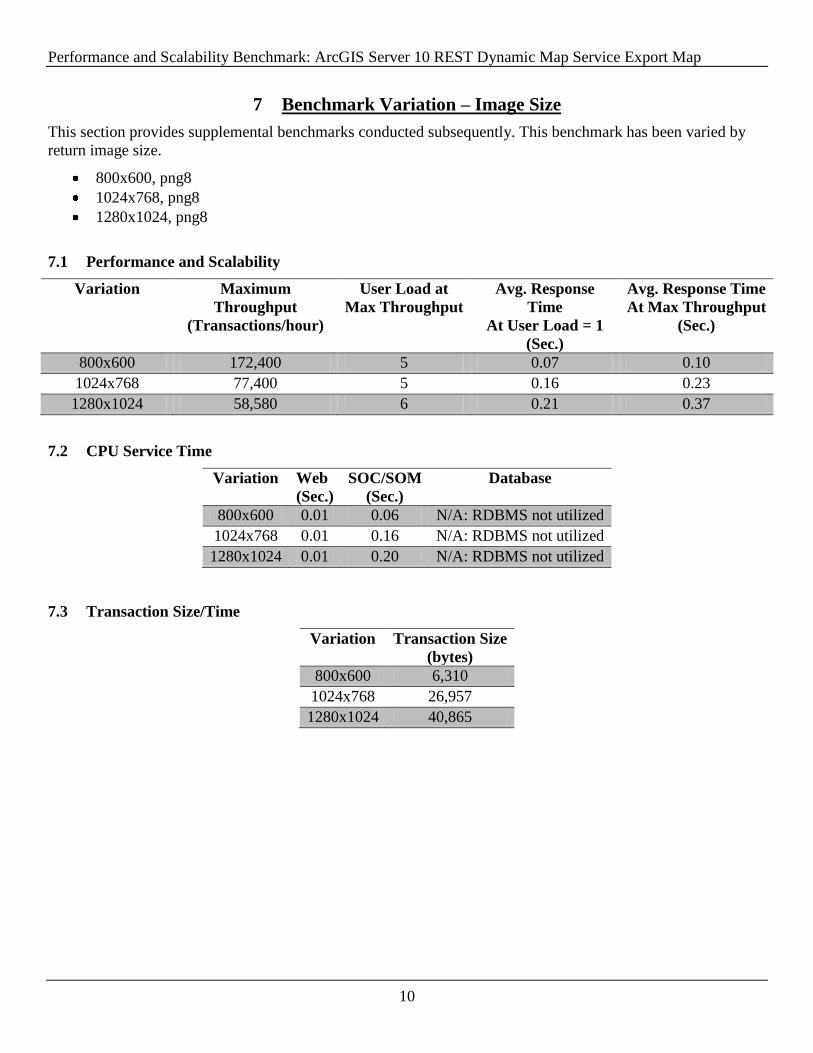
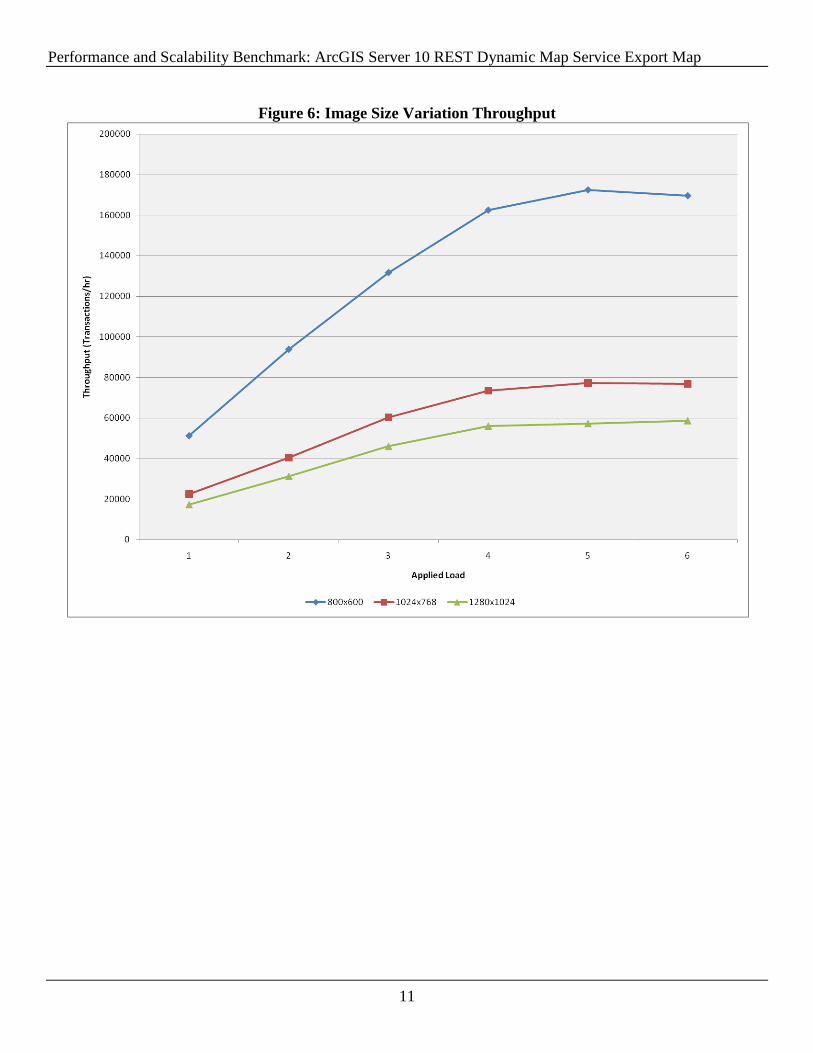
7 Benchmark Variation – Image Size
This section provides supplemental benchmarks conducted subsequently. This benchmark has been varied by
return image size.
800x600, png8
1024x768, png8
1280x1024, png8
7.1 Performance and Scalability
Variation Maximum
Throughput
(Transactions/hour)
User Load at
Max Throughput
Avg. Response
Time
At User Load = 1
(Sec.)
Avg. Response Time
At Max Throughput
(Sec.)
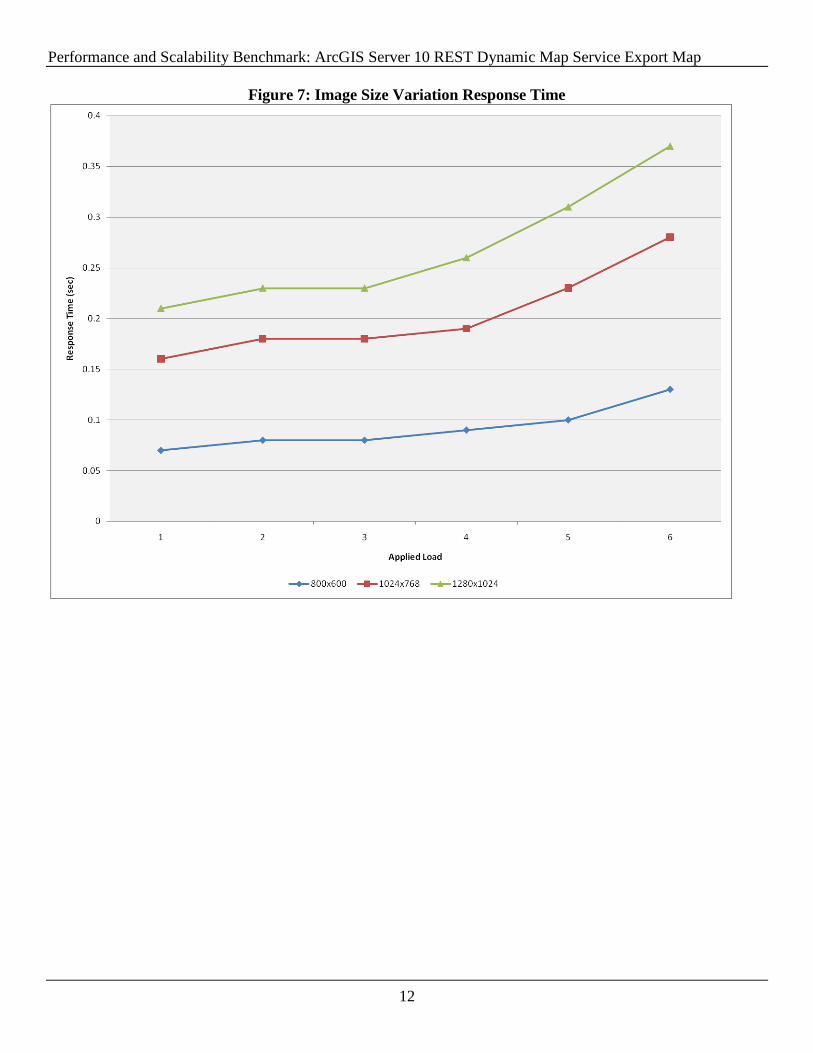
800x600 172,400 5 0.07 0.10
1024x768 77,400 5 0.16 0.23
1280x1024 58,580 6 0.21 0.37
7.2 CPU Service Time
Variation Web
(Sec.)
SOC/SOM
(Sec.)
Database
800x600 0.01 0.06 N/A: RDBMS not utilized
1024x768 0.01 0.16 N/A: RDBMS not utilized
1280x1024 0.01 0.20 N/A: RDBMS not utilized
7.3 Transaction Size/Time
Variation Transaction Size
(bytes)
800x600 6,310
1024x768 26,957
1280x1024 40,865
Performance and Scalability Benchmark: ArcGIS Server 10 REST Dynamic Map Service Export Map
11
Figure 6: Image Size Variation Throughput
Performance and Scalability Benchmark: ArcGIS Server 10 REST Dynamic Map Service Export Map
12
Figure 7: Image Size Variation Response Time
Performance and Scalability Benchmark: ArcGIS Server 10 REST Dynamic Map Service Export Map
13
8 Appendixes
8.1 Benchmark Approach
This benchmark has been designed to isolate and measure the performance and scalability of ArcGIS Server 10
REST Export Map within the defined environment. This will be accomplished by applying a load using
Microsoft Visual Studio 2008 System (VSTS) 2008.
The VSTS benchmark script will apply load by randomly requesting 1280 x 1024 PNG 8 images from a large
pool of defined map extents. As this load is increased, the benchmark environment will react accordingly. Load
will be increased at a constant rate until the performance trends are observed and key values identified.
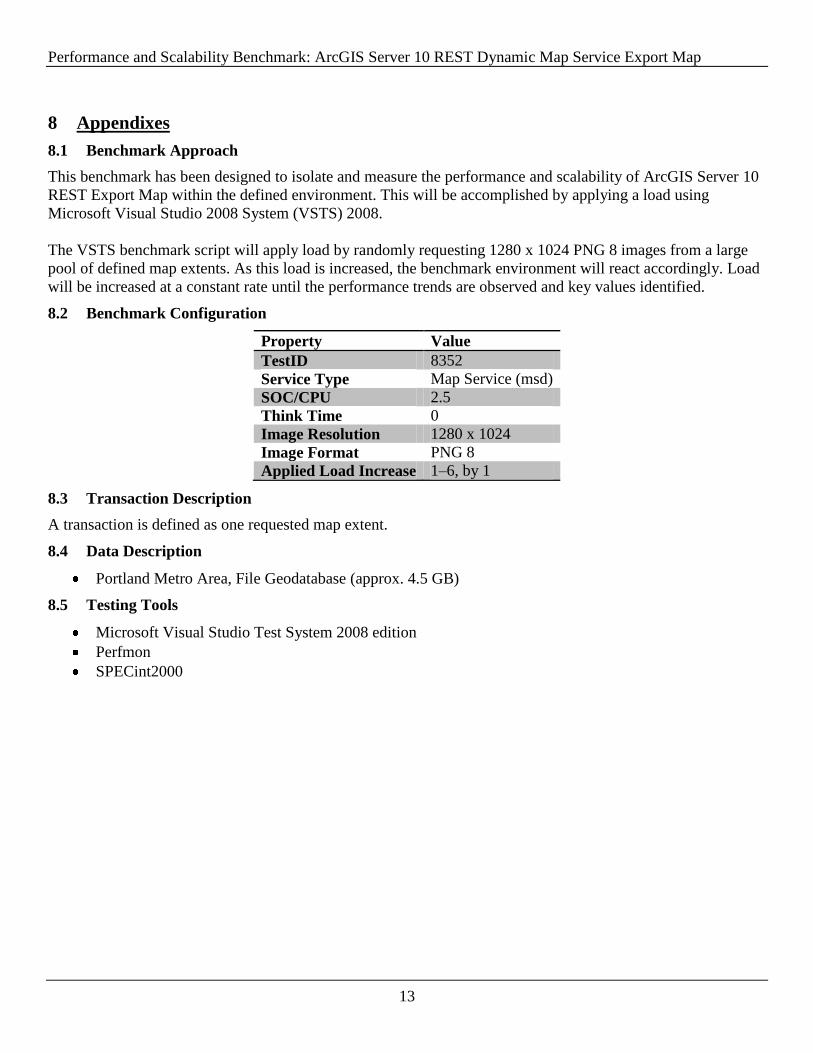
8.2 Benchmark Configuration
Property Value
TestID 8352
Service Type Map Service (msd)
SOC/CPU 2.5
Think Time 0
Image Resolution 1280 x 1024
Image Format PNG 8
Applied Load Increase 1–6, by 1
8.3 Transaction Description
A transaction is defined as one requested map extent.
8.4 Data Description
Portland Metro Area, File Geodatabase (approx. 4.5 GB)
8.5 Testing Tools
Microsoft Visual Studio Test System 2008 edition
Perfmon
SPECint2000
Performance and Scalability Benchmark: ArcGIS Server 10 REST Dynamic Map Service Export Map
14
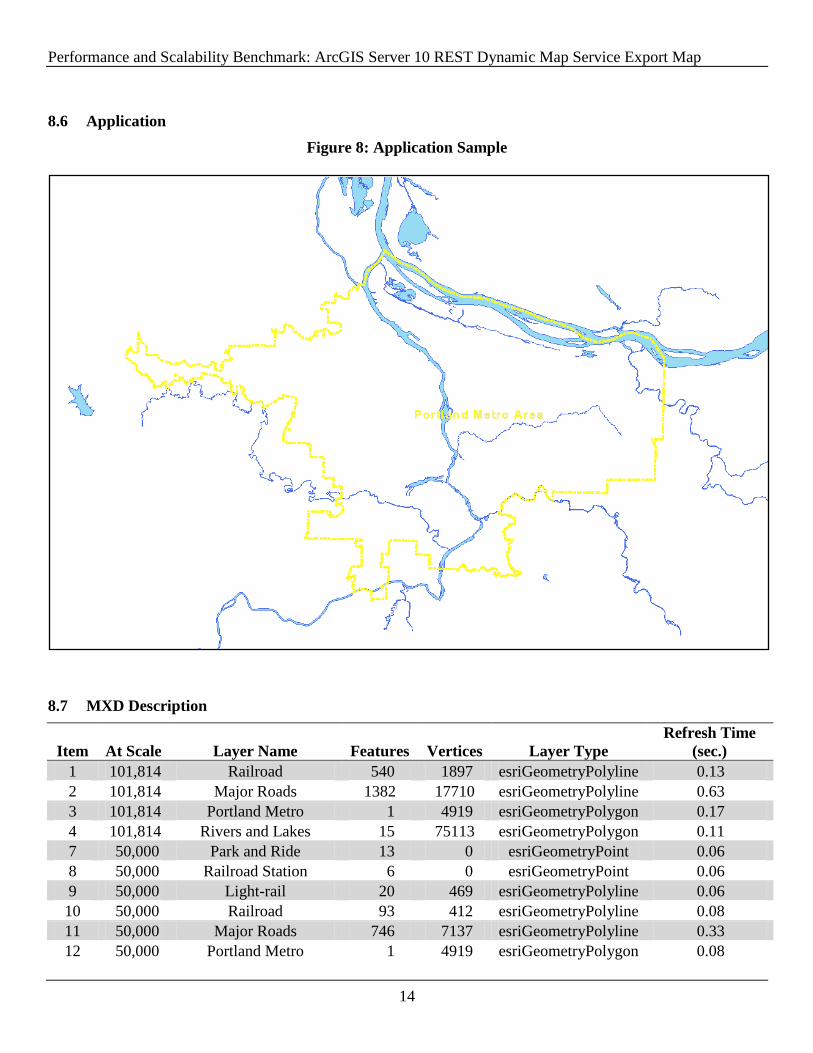
8.6 Application
Figure 8: Application Sample
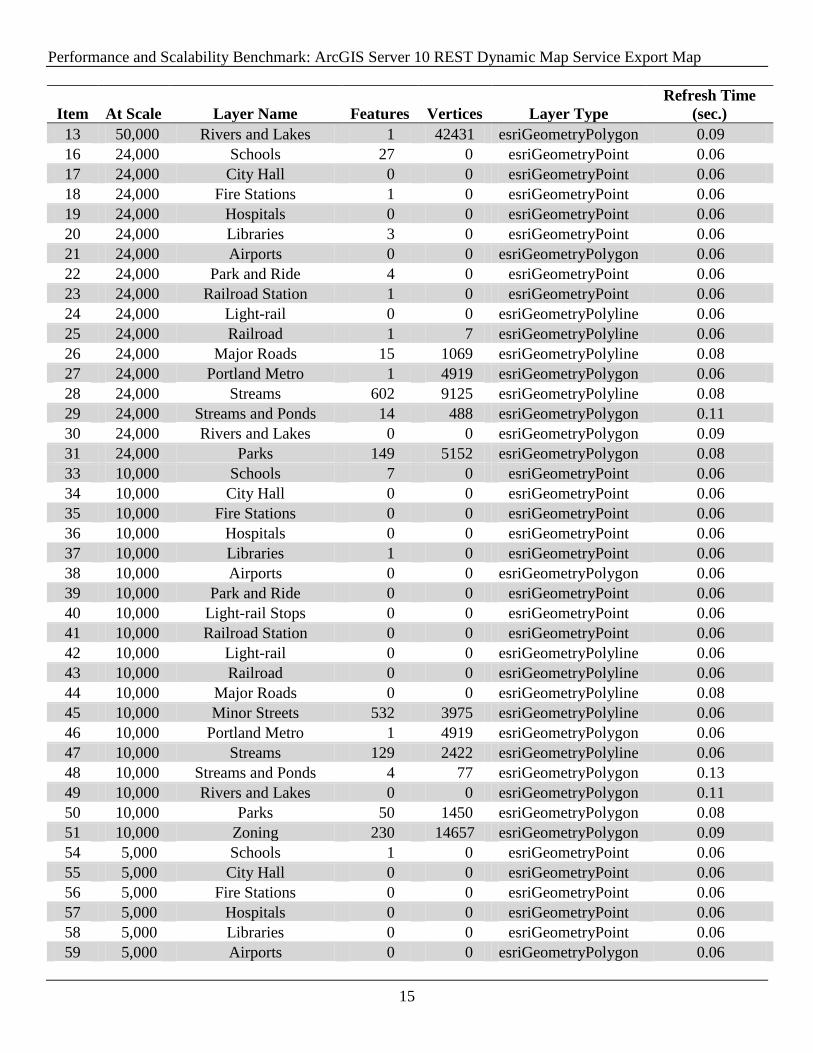
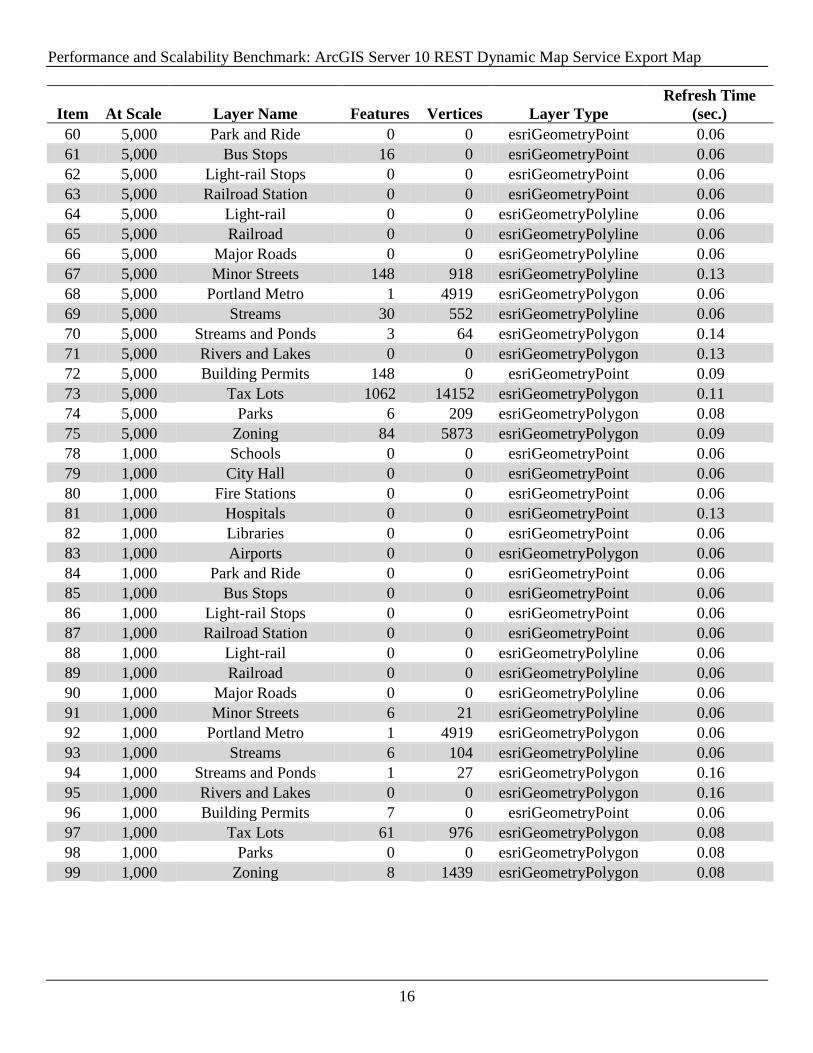
8.7 MXD Description
Item At Scale Layer Name Features Vertices Layer Type
Refresh Time
(sec.)
1 101,814 Railroad 540 1897 esriGeometryPolyline 0.13
2 101,814 Major Roads 1382 17710 esriGeometryPolyline 0.63
3 101,814 Portland Metro 1 4919 esriGeometryPolygon 0.17
4 101,814 Rivers and Lakes 15 75113 esriGeometryPolygon 0.11
7 50,000 Park and Ride 13 0 esriGeometryPoint 0.06
8 50,000 Railroad Station 6 0 esriGeometryPoint 0.06
9 50,000 Light-rail 20 469 esriGeometryPolyline 0.06
10 50,000 Railroad 93 412 esriGeometryPolyline 0.08
11 50,000 Major Roads 746 7137 esriGeometryPolyline 0.33
12 50,000 Portland Metro 1 4919 esriGeometryPolygon 0.08
Performance and Scalability Benchmark: ArcGIS Server 10 REST Dynamic Map Service Export Map
15
Item At Scale Layer Name Features Vertices Layer Type
Refresh Time
(sec.)
13 50,000 Rivers and Lakes 1 42431 esriGeometryPolygon 0.09
16 24,000 Schools 27 0 esriGeometryPoint 0.06
17 24,000 City Hall 0 0 esriGeometryPoint 0.06
18 24,000 Fire Stations 1 0 esriGeometryPoint 0.06
19 24,000 Hospitals 0 0 esriGeometryPoint 0.06
20 24,000 Libraries 3 0 esriGeometryPoint 0.06
21 24,000 Airports 0 0 esriGeometryPolygon 0.06
22 24,000 Park and Ride 4 0 esriGeometryPoint 0.06
23 24,000 Railroad Station 1 0 esriGeometryPoint 0.06
24 24,000 Light-rail 0 0 esriGeometryPolyline 0.06
25 24,000 Railroad 1 7 esriGeometryPolyline 0.06
26 24,000 Major Roads 15 1069 esriGeometryPolyline 0.08
27 24,000 Portland Metro 1 4919 esriGeometryPolygon 0.06
28 24,000 Streams 602 9125 esriGeometryPolyline 0.08
29 24,000 Streams and Ponds 14 488 esriGeometryPolygon 0.11
30 24,000 Rivers and Lakes 0 0 esriGeometryPolygon 0.09
31 24,000 Parks 149 5152 esriGeometryPolygon 0.08
33 10,000 Schools 7 0 esriGeometryPoint 0.06
34 10,000 City Hall 0 0 esriGeometryPoint 0.06
35 10,000 Fire Stations 0 0 esriGeometryPoint 0.06
36 10,000 Hospitals 0 0 esriGeometryPoint 0.06
37 10,000 Libraries 1 0 esriGeometryPoint 0.06
38 10,000 Airports 0 0 esriGeometryPolygon 0.06
39 10,000 Park and Ride 0 0 esriGeometryPoint 0.06
40 10,000 Light-rail Stops 0 0 esriGeometryPoint 0.06
41 10,000 Railroad Station 0 0 esriGeometryPoint 0.06
42 10,000 Light-rail 0 0 esriGeometryPolyline 0.06
43 10,000 Railroad 0 0 esriGeometryPolyline 0.06
44 10,000 Major Roads 0 0 esriGeometryPolyline 0.08
45 10,000 Minor Streets 532 3975 esriGeometryPolyline 0.06
46 10,000 Portland Metro 1 4919 esriGeometryPolygon 0.06
47 10,000 Streams 129 2422 esriGeometryPolyline 0.06
48 10,000 Streams and Ponds 4 77 esriGeometryPolygon 0.13
49 10,000 Rivers and Lakes 0 0 esriGeometryPolygon 0.11
50 10,000 Parks 50 1450 esriGeometryPolygon 0.08
51 10,000 Zoning 230 14657 esriGeometryPolygon 0.09
54 5,000 Schools 1 0 esriGeometryPoint 0.06
55 5,000 City Hall 0 0 esriGeometryPoint 0.06
56 5,000 Fire Stations 0 0 esriGeometryPoint 0.06
57 5,000 Hospitals 0 0 esriGeometryPoint 0.06
58 5,000 Libraries 0 0 esriGeometryPoint 0.06
59 5,000 Airports 0 0 esriGeometryPolygon 0.06
Performance and Scalability Benchmark: ArcGIS Server 10 REST Dynamic Map Service Export Map
16
Item At Scale Layer Name Features Vertices Layer Type
Refresh Time
(sec.)
60 5,000 Park and Ride 0 0 esriGeometryPoint 0.06
61 5,000 Bus Stops 16 0 esriGeometryPoint 0.06
62 5,000 Light-rail Stops 0 0 esriGeometryPoint 0.06
63 5,000 Railroad Station 0 0 esriGeometryPoint 0.06
64 5,000 Light-rail 0 0 esriGeometryPolyline 0.06
65 5,000 Railroad 0 0 esriGeometryPolyline 0.06
66 5,000 Major Roads 0 0 esriGeometryPolyline 0.06
67 5,000 Minor Streets 148 918 esriGeometryPolyline 0.13
68 5,000 Portland Metro 1 4919 esriGeometryPolygon 0.06
69 5,000 Streams 30 552 esriGeometryPolyline 0.06
70 5,000 Streams and Ponds 3 64 esriGeometryPolygon 0.14
71 5,000 Rivers and Lakes 0 0 esriGeometryPolygon 0.13
72 5,000 Building Permits 148 0 esriGeometryPoint 0.09
73 5,000 Tax Lots 1062 14152 esriGeometryPolygon 0.11
74 5,000 Parks 6 209 esriGeometryPolygon 0.08
75 5,000 Zoning 84 5873 esriGeometryPolygon 0.09
78 1,000 Schools 0 0 esriGeometryPoint 0.06
79 1,000 City Hall 0 0 esriGeometryPoint 0.06
80 1,000 Fire Stations 0 0 esriGeometryPoint 0.06
81 1,000 Hospitals 0 0 esriGeometryPoint 0.13
82 1,000 Libraries 0 0 esriGeometryPoint 0.06
83 1,000 Airports 0 0 esriGeometryPolygon 0.06
84 1,000 Park and Ride 0 0 esriGeometryPoint 0.06
85 1,000 Bus Stops 0 0 esriGeometryPoint 0.06
86 1,000 Light-rail Stops 0 0 esriGeometryPoint 0.06
87 1,000 Railroad Station 0 0 esriGeometryPoint 0.06
88 1,000 Light-rail 0 0 esriGeometryPolyline 0.06
89 1,000 Railroad 0 0 esriGeometryPolyline 0.06
90 1,000 Major Roads 0 0 esriGeometryPolyline 0.06
91 1,000 Minor Streets 6 21 esriGeometryPolyline 0.06
92 1,000 Portland Metro 1 4919 esriGeometryPolygon 0.06
93 1,000 Streams 6 104 esriGeometryPolyline 0.06
94 1,000 Streams and Ponds 1 27 esriGeometryPolygon 0.16
95 1,000 Rivers and Lakes 0 0 esriGeometryPolygon 0.16
96 1,000 Building Permits 7 0 esriGeometryPoint 0.06
97 1,000 Tax Lots 61 976 esriGeometryPolygon 0.08
98 1,000 Parks 0 0 esriGeometryPolygon 0.08
99 1,000 Zoning 8 1439 esriGeometryPolygon 0.08
Performance and Scalability Benchmark: ArcGIS Server 10 REST Dynamic Map Service Export Map
17
8.8 Definitions
8.8.1 Performance and Scalability
Performance can be expressed as response time (RT) at a single-user load.
Scalability is determined using one of the following criteria:
o When first error occurs
o When maximum throughput is reached
o When required response time is exceeded
8.8.2 CPU Service Time Web
Calculated from the following process:
W3wp.exe
8.8.3 CPU Service Time ArcGIS SOC
Calculated from the following process:
ArcSOC.exe
8.8.4 CPU Service Time DB
N/A: RDBMS not utilized
Related Documents