Bedrock, soil, and lichen geochemistry from Isle Royale National Park, Michigan By Laurel G. Woodruff 1 , William F. Cannon 2 , Connie L. Dicken 2 , James P. Bennett 3 , and Suzanne W. Nicholson 2 Open-File Report 03-276 2003 This report is preliminary and has not been reviewed for conformity with U.S. Geological Survey editorial standards. Any use of trade, firm, or product names is for descriptive purposes only and does not imply endorsement by the U.S. Government. U.S. DEPARTMENT OF THE INTERIOR U.S. GEOLOGICAL SURVEY 1 U.S. Geological Survey, 2280 Woodale Drive, Mounds View, MN 55112 2 U.S. Geological Survey, MS 954, Reston, VA 20192 3 U.S. Geological Survey, 6006 Schroeder Road, Madison, WI 53711 1

Welcome message from author
This document is posted to help you gain knowledge. Please leave a comment to let me know what you think about it! Share it to your friends and learn new things together.
Transcript
Bedrock, soil, and lichen geochemistry from Isle Royale National Park, Michigan
By Laurel G. Woodruff1, William F. Cannon2, Connie L. Dicken2, James P. Bennett3, and Suzanne W. Nicholson2
Open-File Report 03-276
2003
This report is preliminary and has not been reviewed for conformity with U.S. Geological Survey editorial standards. Any use of trade, firm, or product names is for descriptive purposes only and does not imply endorsement by the U.S. Government.
U.S. DEPARTMENT OF THE INTERIOR
U.S. GEOLOGICAL SURVEY
1 U.S. Geological Survey, 2280 Woodale Drive, Mounds View, MN 55112 2 U.S. Geological Survey, MS 954, Reston, VA 20192 3 U.S. Geological Survey, 6006 Schroeder Road, Madison, WI 53711
1
INTRODUCTION Isle Royale National Park, Michigan, is a large island in northeastern Lake
Superior that became a national park in 1940 and was designated as a wilderness area in 1976. The relative isolation of Isle Royale (Figure 1), 25 kilometers out in Lake Superior from the Canadian mainland, its generally harsh climate, and its status as a wilderness national park have minimized human influence on the geochemical evolution of its landscape.
USGS sampling on Isle Royale began in 1996 as part of a larger project on the geology of the Midcontinent rift in the Lake Superior region and continued through 2000. Sampling began with collecting bedrock samples to characterize the geochemistry of the volcanic rocks that make up the much of the island, as well as samples representative of the minor native copper mineralization found on the island. Preliminary results from the bedrock study indicated, among other findings, that basaltic bedrock on the island had no detectable mercury, but that there was an association between native copper mineralization and trace amounts of mercury (Cannon and Woodruff, 1999). This finding and the recognition by the National Park Service that 6 of 32 inland lakes on Isle Royale have mercury levels in game fish that exceed State of Michigan acceptable levels for human consumption (Kallemeyn, 2000) resulted in renewed sampling on the island focused more on environmental issues.
To evaluate atmospheric inputs of mercury and other elements to soil geochemistry, regionally distributed samples of both soils and lichens were collected as paired samples across the entire island. At each soil sample site, three epiphytic (grows in trees) lichen species, Evernia mesomorpha, Hypogymnia plysodes, and Parmelia sucata, were always collected. At some sites Cladina rangiferina, a lichen that grows on bare bedrock and soil surfaces, was also collected. The occurrence of Cladina rangiferina on the island is somewhat limited, and so this lichen species was not collected at all sites.
A high density of soil samples was collected within three individual watersheds (Sargent Lake, Lake Wagejo, and Lake Richie) for a localized study that evaluated the terrestrial distribution of mercury and other elements of environmental concern. These lakes were chosen using data from Kallemeyn (2000) that showed that Sargent Lake and Lake Wagejo have high mercury in fish, whereas Lake Richie, which is similar in size to Sargent Lake, does not. As part of this study on the terrestrial contribution of mercury to lakes, long cores of lake sediments were recovered from Sargent Lake and Lake Richie using a modified Livingston piston sampler.
For an ancillary study that evolved from the study on the distribution of mercury in certain watersheds, some soil samples were collected to evaluate the impact of forest fire on soil geochemistry, deliberately sampling within and outside areas on the island that burned in severe forest fires in 1936. To complete bedrock sampling on the island, rock samples from the Copper Harbor Formation, a sedimentary unit that occurs on the southeastern part of the island were collected in 1999.
This report presents all the geochemical data from samples collected by the USGS during this period (Figures 1 and 2). A number of reports presenting data interpretation are in preparation.
2
BEDROCK GEOLOGY The geologic evolution of Isle Royale began about 1,100 million years ago when
huge volumes of flood basalts of the Midcontinent rift erupted near the center of what is now Lake Superior and spread laterally across the Lake Superior region. The bedrock of Isle Royale is a series of stacked tholeiitic basalt flows with minor andesite and rhyolite that correlate with volcanic rocks in Michigan and Wisconsin designated as the Portage Lake Volcanics (Huber, 1973a; 1973c). Time breaks between flows are sometimes marked by accumulation of interflow sedimentary units, either sandstones or conglomerates, but commonly flows erupted one onto another. Because basalt erupted subaerially, flow tops typically were highly vesicular or rubbley with abundant open space. With the end of volcanism, fluids generated within the volcanic pile by low temperature burial metamorphism filled vesicles, open spaces, and fractures with secondary minerals, typically low-temperature zeolites, prehnite, calcite, or datolite, as well as native copper (Huber, 1973a).
Minor native copper mineralization, similar in style and timing to the more impressive mineralization found in contemporaneous rocks on the Keweenaw Peninsula of Michigan, developed locally in some permeable layers and fractures. A number of the copper deposits were mined during the later 1800’s, but production on Isle Royale was never extensive and mining activity died out in the 1890s (Rakestraw, 1965). The two largest areas of mining activity are the Island Mine, where copper was extracted from a conglomerate layer, and the Minong Mine where copper is found in fractures and openings in a rhyolite unit overlying the Minong basalt flow and within the brecciated basalt flow top. Copper mining at the Minong Mine included establishment of a small stamp mill where mineralized rock was pulverized prior to removal of native copper. Waste material from the stamp mill was dumped as stamp sands into the drainage between Chickenbone Lake and McCargoe Cove.
Sandstones and conglomerates of the Copper Harbor Formation make up the highlands of the southeast section of Isle Royale (Wolff and Huber, 1973). These rocks conformably overlie the volcanic section and represent sediment influx into a subsiding basin that formed following the end of major volcanism. A regional compressional event, estimated to have occurred sometime from 1,080 to 1,040 million years ago (Cannon, 1994), reversed movement along the Isle Royale fault, a major rift-bounding fault just north of the island. This reversed motion along the Isle Royale fault, as well as many of the other major rift-bounding faults in the Lake Superior region, uplifted the volcanic section of Isle Royale and tilted the strata to the southeast so that the flows and sediments on the island now dip to the southeast into Lake Superior at angles between 5 and 30 degrees. No rocks younger than the Copper Harbor Formation are found on Isle Royale, nor is there evidence of geologic activity on the island following uplift and tilting until Pleistocene glaciers moved through the region.
GLACIAL GEOLOGY
Early glacial history on Isle Royale was erased by the final advance and retreat of ice out of the Lake Superior area during a glacial surge known as the Marquette readvance, which culminated at about 10,025 yr B.P (Clayton, 1983; Lewis and Anderson, 1989). When this final ice sheet began to waste out of the Superior basin, an apparent still-stand of the ice margin on Isle Royale resulted in development of several
3
recessional moraines and deposition of a thick till across the southern third of the island (Huber, 1973b). Rapid ice retreat following the stand-still and continued submergence under early glacial lakes has left only a thin veneer of glacio-fluvial deposits on the northern two-thirds of the island (Huber, 1973b). Glacial striations in bedrock show that ice directions in the northern part of the island were northeast-southwest, along the strike of the basalt flows. Across the southern part of the island striations and other indicators of ice movement (e.g., drumlins) trend more east-west, oblique to the strike of the flows (Huber, 1973b).
The land surface of Isle Royale emerged sporadically from changing glacial lakes as differing outlets and spillways for the Lake Superior basin released and held back meltwater. With emergence of the island from ice and water, shoreline beaches, now high above current lake levels, were deposited and inland lakes became successively isolated from larger post-glacial lakes. Lake Minong (9500 B.P.) occupied the Lake Superior region as soon as ice moved out. Digital reconstructions show that much of the northern and eastern coastline of Isle Royale remained submerged during Minong time (McRae and others, 1998). This stage also marks a time of major drainage of glacial Lake Agassiz into the Lake Superior basin through outlets in the Nipigon basin and Thunder Bay areas (Clayton, 1983; Teller and Thorleifson, 1983), bringing large quantities of gray clay into the lake in the area of Isle Royale. Following the Minong stage, lake levels fell during the succeeding Houghton low stand, during which all of Isle Royale and surrounding land would have been above water. Water levels again rose during the Nipissing transgression (5,500-4,700 yr B.P.), inundating much of the Isle Royale coastline and forming large beach ridges below the Minong shoreline, but well above the present shoreline. The present day level of Lake Superior stabilized around 2,200 yr B.P.
REGIONAL LANDSCAPE
Ice plucking and scraping from multiple glacial advances exploited the differential erodibility of vesicular basalt flow top versus massive flow interior and sandstone versus conglomerate, removing most erodible rock. The resulting geomorphic pattern is a series of long, eroded valleys and resistant bedrock ridges that run the length of the island and control the topography. Bedrock is exposed or very near the surface in the northern part of the island where glacial deposits are thin, but may be covered by thick till in the southern area of the island, which creates a more subdued land surface. Bedrock ridges typically are bare or have minimal vegetation cover, whereas valleys between ridges are filled with lakes, streams and wetlands. In the northern part of the island, soils on uplands developed directly on bedrock or on thin glacial cover. These soils are typically thin, sandy or loamy, and boulders are common. In the southern part of the island, upland soils formed on thicker till or other glacial deposits and are better developed than in areas of thin glacial cover.
The forest on Isle Royale is at the southern boreal/northern hardwoods border. Forest species on Isle Royale have been influenced by drainage characteristics, topography, moose browsing, and fire history (Cole and others, 1997). Today much of the island, including the northern part and coastlines, is characterized by boreal trees such as white and black spruce, white cedar, aspen, balsam fir, and white pine. The thick glacial cover in the southern part of the island supports a northern hardwood forest, with
4
species such as red maple, sugar maple, red oak, and yellow birch. In low wet areas black spruce is the dominant species.
The current forest species over much of the southern and central parts of the island have been strongly influenced by major forest fires in 1936. By the summer of 1936, three drought years had created extreme fire hazards across much of the Upper Midwest. In midsummer of that year, fires broke out in the southern end of Isle Royale and spread north. The fires burned out of control for weeks, eventually covering more than 105 km2. In many places, the fires burned so hot that entire stands of trees were killed leaving bare rock exposed. Much of the pre-fire deciduous forest in the burn area was replaced by stands of white birch and aspen (Hansen and others, 1973, Cole and others, 1997).
LICHENS
Lichens are ideal for studying atmospheric inputs because they lack roots (hence have no sources of elements from the soil), lack a cuticle (hence they absorb elements from the atmosphere), and some species are able to sequester toxic elements and render them non-toxic. There are many species of lichens at Isle Royale (Wetmore, 1985), and several have been used previously for atmospheric deposition studies. Hypogymnia physodes and Evernia mesomorpha were collected at eighteen localities in the Isle Royale National Park between 1983 and 1992 (Bennett, 1995). In his report, Bennett found temporal and geographical patterns of element concentration in lichens on the island. Common air pollutants, such as Zn, Pb, Se and S, were higher in lichen tissue compared to their concentration in the Earth’s crust. Heavy metal elements associated with atmospheric deposition increased over the nine-year study period to a greater extent than non-metallic elements. Geographic distributions of anthropogenic elements were elevated around known local pollution sources and some elements did reach toxic levels in lichens (Bennett, 1995). METHODS OF STUDY Sample Collection Geochemical sample media include bedrock, mineralized rock, lake sediments, different soil horizons and four species of lichens (Figures 1 and 2). Because of restrictions on sampling within a wilderness park, rock samples were collected from mine dumps or loose blocks obviously fallen from outcrop. All rock samples were trimmed in the field to remove weathered material, and further trimmed and hand selected during preparation to minimize contribution from weathered or altered surfaces. Samples of native copper mineralized rock typically were composite chip samples collected from mine dumps. Descriptions recorded in the field are included in the data files.
Reconnaissance soil sample sites typically were from upland areas. Within the Sargent Lake and Lake Richie watersheds both upland and lowlands (but not wetland) sites were sampled. Soil samples were collected from soil pits dug with a shovel and extended with a hand auger. Sample pits were completed to the C-horizon or to a depth dictated by the presence of impenetrable rock. From each pit, soil from different horizons was collected so that each sample site has multiple geochemical analyses, each representing a different soil layer. All samples were stored in perforated polyethylene bags (Hubco Tyvek®). During the first year of soil sampling, which concentrated within
5
the Sargent Lake and Lake Wagejo watersheds, material from the O-horizon was not collected.
The O-horizon is the organic matter that lies on top of a mineral soil. The organic layer is divided into Oi (forest litter), Oe (forest duff) and Oa (humus) horizons. Forest litter is not decomposed, and contains identifiable dead plant material. Forest duff is partially decomposed organic material that may underlie the litter layer. Humus is completely decomposed, non-identifiable organic material. At each soil sample site, with the exceptions noted above, Oe-horizon material was collected, if available. Field descriptions discriminate between forest litter that is not decomposed and more decomposed forest duff, but do not attempt to distinguish duff from humus. Samples from Oe-horizons typically were grab samples collected from the soil plug removed from the sample pit. Litter material, when collected, was composited from material in the area of the sample site. The nature of the original material (e.g., needles versus leaves) was noted, as were the dominant tree species.
The upper mineral soils typically were classified as A-horizon, indicating some accumulation of organic carbon, and were distinguished from underlying soil horizons by changes in color. A-horizon soils were collected from most sample sites, with material composited from the entire thickness of the horizon. At some sites, a very thin A-horizon overlay an E-horizon, a zone of eluviation, easily distinguished by its light, buff or gray color. A limited number of E-horizon samples were also collected when little or no A-horizon soil was present.
Subsoil samples typically were composed of weathered parent material, which, on Isle Royale, is either bedrock or glacial deposits on bedrock. The depth of collection for C-horizon soil samples in areas of thin glacial cover typically was constrained by the depth to bedrock, with samples collected immediately above the bedrock surface. In areas of thick glacial cover, collection depths usually were 60 – 80 cm, which typically was the depth to parent glacial material. In a few cases, multiple samples were collected when obvious changes in color or texture were noted.
Lichen samples were collected by hand from trees in the immediate vicinity of soil sample sites and from bedrock, if available. The three epiphytic lichen species collected, Evernia mesomorpha, Hypogymnia plysodes, and Parmelia sucata, are easy to identify in the field and do not require chemical tests for identification. Each lichen species was picked separately and cleaned as well as possible in the field. Epiphytic lichens were collected without gloves only from evergreen species, with one exception in a hardwood maple forest where no evergreen trees were present. At a site, all three species were collected from multiple individuals of a single tree species (e.g., white spruce or balsam fir), but the single tree species varied from site to site, depending on availability. The result of this sampling method is collection of multiple thalli representing an aggregate sample from several trees in an area. Picking extended from near ground level to as high as could be reached when standing on the ground, approximately 1.5 – 2 meters. Lichens picked from dead or downed trees may have originally been higher in the air prior to tree mortality and are so noted. Cladina rangiferina was collected from bedrock surfaces by hand. Only fresh, apparently healthy lichen were picked in the field. At each site, about 20 grams of lichen was stored in perforated polyethylene bags (Hubco Tyvek®). Samples were air dried to ambient
6
moisture levels prior to shipping to the USGS National Wildlife Health Center in Madison, Wisconsin for analysis.
Lake sediment samples from Sargent Lake and Lake Richie were collected using a modified Livingston piston sampler (Wright, 1967). To obtain the cores, researchers from the USGS flew to Isle Royale in the winter of 1999 in a U.S. Forest Service Beaver seaplane, landing on the ice of each lake. Lake sediment core was obtained through the ice from near the deepest part of each lake, using lake bathymetry maps as guides. The coordinates for the site on Sargent Lake are: latitude 48.0820; longitude 88.6548. The coordinates for the site on Lake Richie are: latitude 48.0420; longitude 88.6930. Care was taken to sample from areas away from shore and where the lake bottom was relatively flat. At each lake the coring procedures were similar. After augering a hole through the ice, the depth of the water was measured with a Vexilar® portable sounder. Core was recovered through 11 meters of water in Sargent Lake and 9.75 meters of water in Lake Richie. To obtain the first core from an undisturbed bottom, the piston core apparatus was lowered to the sediment/water interface (using 2 meter extension drive rods) and then advanced the depth of the 1 meter core barrel. Prior to removing the piston corer, a sleeve of 15 cm (diameter) PVC was assembled and lowered through the hole in the ice around the drive rods and piston corer to act as a casing and guide for successive cores. The casing was pushed about 30 cm into the lake bottom to provide a firm anchor. With the casing in place, the piston corer was removed, and the 1 meter core extracted. Each core was immediately wrapped in plastic and aluminum foil and stored in a core box. The piston corer was then reintroduced into the original hole through the casing, and advanced another length of the core barrel (1 meter). The procedure was repeated until 5 meters of core were collected from Sargent Lake and 6 meters of core were collected from Lake Richie. Visual inspection of the cores as they were removed suggested little or no slumping in the borehole, although some compaction in the core was apparent. The length of available drive rods limited the length of core recovery at Sargent Lake, but at Lake Richie coring ended when advancement of the core barrel through compacted sediment was no longer possible. Both sets of long cores were split lengthwise immediately following fieldwork, and one half was preserved and the other half was further split for geochemical analysis. Sample Preparation
All rock, mineral soil and lake sediment samples were shipped to the USGS analytical laboratories in Denver, CO for sample preparation. Methods for sample preparation for analysis are described here and in more detail in Taggert (2002). Lichen and O-horizon samples were shipped to the USGS National Wildlife Health Center in Madison, Wisconsin for sample preparation and analysis. Rocks Rocks were crushed to 0.5 cm fragments in a jaw crusher and fed into a ceramic plate pulverizer where fragments were reduced to approximately minus 100-mesh. Each pulverized sample was split, with a portion submitted for geochemical analysis and a portion archived. Clean quartz rock and sand were crushed and pulverized between samples to minimize cross-contamination.
7
Soils Soil samples were air-dried and disaggregated in a soil grinder, if necessary.
Samples were then sieved to <63 micrometers prior to analysis. Samples were not ground. Lake sediment samples
The top meter of core from each lake was composited in 5 cm intervals. Samples from the remaining cores from each lake were collected in 2 cm intervals every 10 cm. Splits were placed in trace-element-free cardboard cans and dried overnight in a 50o C oven. Prior to analysis, samples were completely pulverized in a shatter-box. Lichens and O-horizon samples Upon arrival in Madison, Wisconsin, lichens and O-horizon organic material were extracted from the bags. Lichen samples were manually cleaned of debris, bark, and other foreign matter. Handling of tissue was with bare hands, which were washed between samples. Hand contact with tissues was only a few seconds for each thallus. Two to four grams of cleaned samples were placed in clear plastic bags and labeled for chemical analyses. Both lichen and O-horizon samples were ground to a powder in a stainless steel Wiley ED-5 mill using a 2 mm screen. After grinding the samples were placed in plastic vials and either stored in a desiccator or re-dried just prior to weighing for analysis. Analytical Techniques
A large number of chemical elements were determined, using a variety of quantitative analytical techniques. The USGS contract analytical laboratory, XRAL Laboratories, Don Mills, Ontario, Canada, did all mineral soil, lake sediment, and some rock analyses. Other rock analyses were done in-house at the USGS analytical laboratories in Denver, Colorado. Quality assurance/quality control (QA/QC) concerns were addressed through the use of internal reference standards and analytical duplicates for all samples processed by the USGS. Standard procedures require that QA/QC samples comprise about 10 percent of the total number of samples analyzed. Reference standards were interspersed with each batch of samples submitted for analysis. Values for the reference standards were checked to assure that reported values are within +/-20 percent of the accepted standard values. Analytical duplicates were included with each batch of samples. Duplicate analyses were checked to assure that the relative percent difference between duplicates was no greater than 20% for individual elements.
Each of the techniques used by either XRAL or the USGS is described in detail in Taggert (2002). USGS analysts who provided laboratory assistance with organic samples are Paul Briggs, Zoe Brown, and Monique Adams. Joe Taggert and Roy Knight assisted with analyses of rock samples.
Lichen and O-horizon samples were analyzed at the Soil and Plant Analysis Laboratory, University of Wisconsin, Madison, Wisconsin. Ling Zhang provided analytical assistance.
Summary of XRAL and USGS Techniques Inductively Coupled Plasma-Atomic Emission Spectroscopy (ICP-AES)
Forty major, minor, and trace elements were determined in rocks and mineral soils by inductively coupled plasma-atomic emission spectrometry. Each sample was digested using a mixture of hydrochloric, nitric, perchloric, and hydrofluoric acids at low
8
temperature. The digested sample was aspirated into the ICP-AES. Analyzed elements and lower detection limits are given in Table 1. In the mineral soil analyses a number of elements are consistently below the detection limits given in Table 1 and are not included in the data tables accompanying this report. These elements are Ag, As, Au, Be, Cd, Eu, Ho, Mo, Nd, Sn, Ta, Th, U, and Yb. Ga was excluded because the relative percent difference between duplicates consistently was above 20%. Wave-Length Dispersive X-Ray Diffraction (WDXRF)
Ten major elements were determined in rocks by wavelength dispersive X-ray fluorescence spectrometry. The sample is first ignited, then fused with lithium tetraborate and the resultant glass disc is introduced into a wavelength dispersive X-ray spectrometer. The disc is irradiated with X-rays from an X-ray tube. X-ray photons emitted by the elements in the sample are counted and concentrations determined using previously prepared calibration standards. In addition to 10 major elements, the method provides a gravimetric loss-on-ignition. Detection limits are given in Table 2. Instrumental Neutron Activation by Long Count (INAA)
Some trace elements in rocks were analyzed using instrumental neutron activation analysis. INAA selectively measures radioactive nuclide activity produced by nuclear reactions on naturally occurring isotopes. The activity of the indicator radionuclide produced during irradiation is directly proportional to the amount of the element in the sample. The analytical determination is made by comparing the induced activity in the sample with well-characterized standards activated under identical conditions of neutron flux. The activities of the samples and standards are measured using gamma-ray spectroscopy. Gamma-ray radiation emitted by a radionuclide is converted to an electrical signal by a semiconductor detector. A multichannel analyzer analyzes the electrical signal. Semiconductor detectors, such as high-purity and lithium-drifted germanium detectors, are used to exploit their high resolution. Spectra produced are analyzed by software that locates and identifies peaks, and calculates the area of each peak. Atomic Absorption Spectrophotometry (AAS)
Samples were digested using a multi-acid procedure in an open Teflon vessel. At the end of the digestion period, arsenic and selenium are reduced to oxidation states, +3 and +4, respectively. Sodium borohydride is added to the solution resulting in rapid formation of the hydrides. The gaseous hydrides are stripped from the analytical stream and transported with inert gas to the atomizer (a heated quartz furnace) of the atomic absorption spectrophotometer. For selenium, the quartz furnace is heated by an air-acetylene flame to 2000°C; and the arsenic furnace is electrically heated to 900°C. Concentrations of the elements are determined using calibration standards in solutions of similar matrix. The lower detection limit for arsenic is 0.6 ppm. The lower detection limit for selenium is 0.2 ppm. Automated Carbon Analyzer (ACA)
Total carbon was determined using an automated carbon analyzer. A weighed sample (approximately 0.20 g) is combusted in an oxygen atmosphere at 1350°C to oxidize carbon (C) to carbon dioxide (CO2). Moisture and dust are removed and a solid-state infrared detector measures the carbon dioxide gas. The lower reporting limit is 0.05. Columetric Titration (CT)
Samples were analyzed for carbonate carbon by coulometric titration. The sample is treated with hot 2 N perchloric acid and the evolved CO2 is passed into a cell
9
containing a solution of monoethanolamine. The CO2, quantitatively absorbed by the monoethanolamine, is coulometrically titrated using platinum and silver/potassium iodide electrodes. The lower reporting limit is 0.01%. Automated Sulfur Analyzer (ASA)
Total sulfur was determined using an automated sulfur analyzer. Approximately 0.25 g sample is weighed and mixed with 1 g vanadium pentoxide flux. The sample is combusted in an oxygen atmosphere at 1350°C where the sulfur oxidizes to sulfur dioxide. Moisture and dust are removed and the sulfur dioxide gas is then measured by a solid-state infrared detector. The lower reporting limit for sulfur is 0.05%. Continuous Flow-Cold Vapor Atomic Absorption Spectrometry (CV-AAS)
For mercury analyses, samples were digested with nitric acid and sodium dichromate in a disposable test tube. After digestion, samples are diluted with water to 12 mL. Samples are then mixed with air and a sodium chloride-hydroxylamine hydrochloride-sulfuric acid solution and Hg (II) is reduced to Hg° with stannous chloride in a continuous flow manifold. The mercury vapor is separated and measured using continuous-flow cold vapor-atomic absorption spectrometry. The lower detection limit for mercury is 0.02 ppm
Summary of University of Wisconsin Analytical Techniques
Lichen and O-horizon samples were analyzed at the Soil and Plant Analysis Laboratory, University of Wisconsin, Madison, Wisconsin. Analytical duplicate samples comprised about 10 percent of the total number of samples submitted.
For analyses of As, Cd, Co, Cr, Ni, Pb, Se, Ti and V, samples were digested in a heated nitric/perchloric acid mixture, diluted, and measured by inductively coupled plasma-mass spectroscopy (ICP-MS). For analyses of P, K, Ca, Mg, S, Zn, Mn, B, Cu, Fe, Na, and Al, samples were also digested in a heated nitric/perchloric acid mixture, diluted, and measured by inductively coupled plasma-optical emission spectroscopy (ICP-OES). Details on these methods, including detection limits, are described in: Department of Soil Science, University of Wisconsin-Extension-Madison, 1987, Wisconsin Procedures for Soil Testing, Plant Analysis and Feed & Forage Analysis, No. 6, Soil Fertility Series, 64 p. For mercury analyses, similar methods were used, but the nitric/perchloric acid used for digestion was heated to 130oC. Ash content for all samples was measured using a standard method described in: Standard Methods for the Examination of Water and Wastewater 15th Edition, 1980, p. 97. Mercury Analyses in Lichens and O-horizon soils The 142 lichen samples collected from Isle Royale in 1999 were analyzed by the methods described above. When the data were received, the analyst, Ling Zhang, commented that the mercury recovery for the 1999 samples was not complete because during hot-acid digestion mercury is easily lost. To correct this problem, Zhang developed a new, more efficient technique for mercury analysis that minimized loss. This new technique was used to analyze the same lichen species collected on Isle Royale in 2000. However, inspection of the mercury data from the two years revealed that the mean of the 2000 samples was significantly higher in mercury than the mean for the 1999 lichen samples, suggesting that the 1999 mercury lichen data were suspect. There was not sufficient quantity of sample after analyses to reanalyze the lichen collected in 1999 by the new, high-mercury recovery method.
10
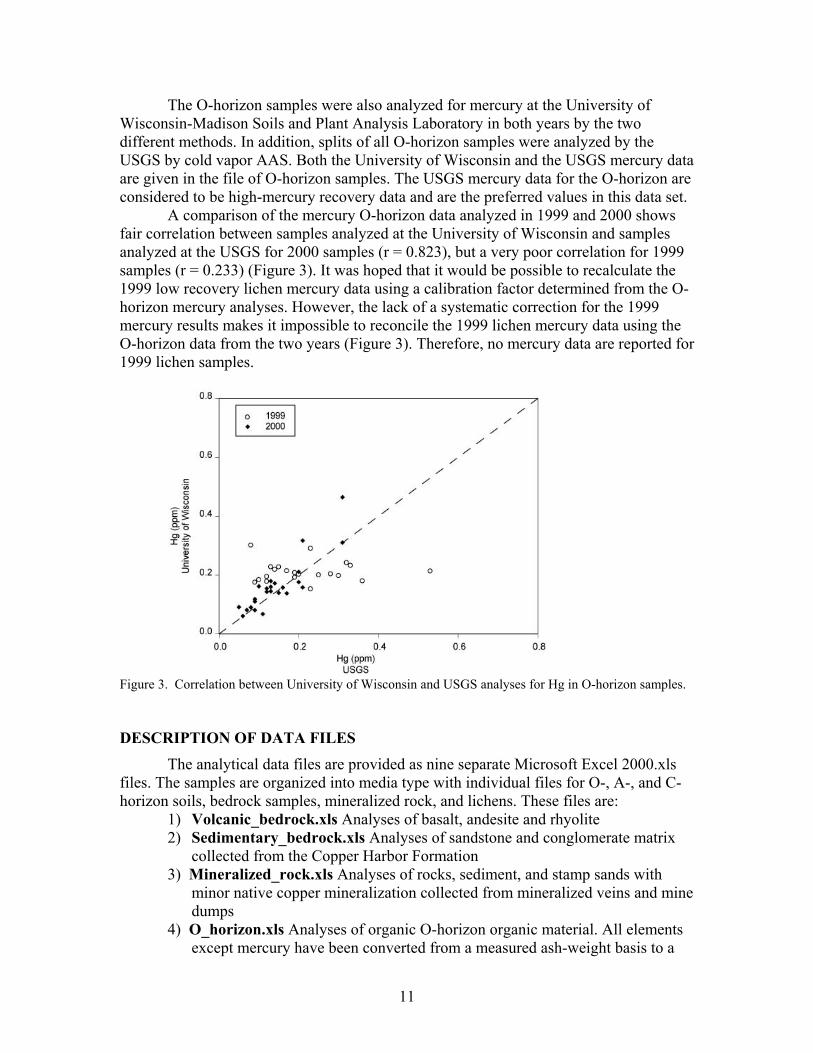
The O-horizon samples were also analyzed for mercury at the University of Wisconsin-Madison Soils and Plant Analysis Laboratory in both years by the two different methods. In addition, splits of all O-horizon samples were analyzed by the USGS by cold vapor AAS. Both the University of Wisconsin and the USGS mercury data are given in the file of O-horizon samples. The USGS mercury data for the O-horizon are considered to be high-mercury recovery data and are the preferred values in this data set.
A comparison of the mercury O-horizon data analyzed in 1999 and 2000 shows fair correlation between samples analyzed at the University of Wisconsin and samples analyzed at the USGS for 2000 samples (r = 0.823), but a very poor correlation for 1999 samples (r = 0.233) (Figure 3). It was hoped that it would be possible to recalculate the 1999 low recovery lichen mercury data using a calibration factor determined from the O-horizon mercury analyses. However, the lack of a systematic correction for the 1999 mercury results makes it impossible to reconcile the 1999 lichen mercury data using the O-horizon data from the two years (Figure 3). Therefore, no mercury data are reported for 1999 lichen samples.
Figure 3. Correlation between University of Wisconsin and USGS analyses for Hg in O-horizon samples.
DESCRIPTION OF DATA FILES
The analytical data files are provided as nine separate Microsoft Excel 2000.xls files. The samples are organized into media type with individual files for O-, A-, and C- horizon soils, bedrock samples, mineralized rock, and lichens. These files are:
1) Volcanic_bedrock.xls Analyses of basalt, andesite and rhyolite 2) Sedimentary_bedrock.xls Analyses of sandstone and conglomerate matrix
collected from the Copper Harbor Formation 3) Mineralized_rock.xls Analyses of rocks, sediment, and stamp sands with
minor native copper mineralization collected from mineralized veins and mine dumps
4) O_horizon.xls Analyses of organic O-horizon organic material. All elements except mercury have been converted from a measured ash-weight basis to a
11
dry-weight basis. Mercury values, measured on unashed samples, are not corrected for ash content.
5) A_horizon.xls Analyses of A-horizon and E-horizon mineral soils. 6) C_horizon.xls Analyses of C-horizon mineral soils. 7) Lichen.xls Analyses of four lichen species (where available). 8) Sargent_Lake_core.xls Analyses of sediment lake core collected from
Sargent Lake 9) Lake_Richie_core.xls Analyses of sediment lake core collected from Lake
Richie
Common Data Fields In all data tables the following abbreviations are used: n.a. = not analyzed; n.c. =
not collected; b.d. = below analytical detection limit; n.r. = not reported; dup. = duplicate sample. Field_No./Sample Site Field numbers are given for all bedrock, mineralized rock, and lake sediment samples. A and B designations for mineralized rock samples are separate samples of composited chips collected from mine dumps and are not duplicates. The field number for the lake sediments is an identifier for the portion of the core that was sampled. Mineral soil, organic material, and lichen samples are designated with the sample site number (shown in Figures 1 and 2). Identical sites numbers among the files indicates that the samples were collected from the same site. Coordinates
Latitude and longitude for sample site locations are given in the data tables as decimal degrees. The coordinates were determined by GPS during sample collection. The datum was 1927 CONUS and the spheroid was Clarke 1866. The coordinates for the two lake cores are not included in the data files, but are given in this text. Year Collected
Gives the year that each sample was collected. Samples were collected in May, 1998, September, 1999, and May, 2000. The lake cores were collected in February, 1999. Geochemical Analyses All geochemical data are given in the following format. Field identifiers consist of three lines. The first line gives the chemical element symbol and unit of measurement. The second line is an abbreviated code for the analytical technique used for the element in that particular column. Reporting units are weight percent (wt. %), parts per million (ppm), and parts per billion (ppb). The analytical methods codes are:
AAS atomic absorption spectrophotometry ACA automated carbon analyzer ASA automated sulfur analyzer CT columetric titration CV-AAS cold-vapor atomic absorption spectrophotometry for mercury ICP-AES inductively coupled plasma-atomic emission spectroscopy ICP-MS inductively coupled plasma-mass spectroscopy ICP-OES inductively coupled plasma-optical emission spectroscopy INNA instrumental neutron activation WDXRF wave-length dispersive X-ray fluorescence
12
The third line lists the laboratory (XRAL, USGS, UWI) where the analyses were done. An exception is the lichen data which do not have a location line as all analyses were completed at the University of Wisconsin. Unique Data Fields
Individual data files have several unique fields. Volcanic_bedrock.xls
Rock Description rock type and the named flow, after Huber (1973a) Mineralized_rock.xls
Mineralized Rock Source location of the mine dump, waste rock pile, or area where each sample was collected
Sedimentary_bedrock.xls Rock Description rock type
A_horizon.xls Estimated horizon thickness estimated thickness of soil horizon (in cm)
C_Horizon.xls Estimated collection depth depth at which the sample was collected (in cm)
Lichens.xls Epiphytic lichen comments tree species from which lichens were collected
Sargent_Lake _core Sample Description core number (increasing with depth) and distance from
the bottom of the individual cores to the sample area Estimated depth to the top of distance (in cm) from the sample area to the
water/sediment interface estimated water/sediment interface Lake Richie _core
Sample Description core number (increasing with depth) and distance from the bottom of the individual cores to the sample area
Estimated depth to the top of distance (in cm) from the sample area to the water/sediment interface estimated water/sediment interface
ACKNOWLEDGMENTS This work could not have been accomplished without the assistance of a number of people. Cheerful field work and shovel-carrying over the four-year period was provided by Rob Barber-DeLach, USGS, Doug Ottke, USGS, Michele McCray, USGS, and Shana Pimley, USGS. Klaus Schulz, USGS, Susanne Schmidt, University of Basel, Switzerland, provided assistance with bedrock sampling. Cliff Wetmore, University of Minnesota, educated geologists about the intricacies of lichen identification, in addition to picking lichens one season. The National Park Service staff on Isle Royale, especially Jack Oelfke and Mark Romanski, provided both the logistical and practical assistance that made this work possible.
13
REFERENCES Bennett, J.P. 1995. Abnormal chemical element concentrations in lichens of Isle Royale
National Park: Environmental and Experimental Botany, v. 35, p. 259-277. Cannon, W.F., 1994, Closing of the Midcontinent rift-- A far-field effect of Grenvillian
compression: Geology v. 22, 155-158. Cannon, W.F. and Woodruff, L.G., 1999, Mercury distribution in bedrock, native copper
ore, and soils-Isle Royale National Park, Michigan: 45th Annual Meeting of the Institute on Lake Superior Geology, v. 45, p. 12-13.
Cole, K. L., Flakne, R.L, Engstrom, D.R. and Harlow, D.E., 1997. Three hundred years
of vegetation change and fire history on Isle Royale, Michigan: Bulletin of the Ecological Society of America, v. 78, p.70.
Clayton, L., 1983, Chronology of Lake Agassiz drainage to Lake Superior: Geological
Society of Canada Special Paper 26, p. 291-307. Hansen, H. L.; Krefting, L. W. and Kurmis, V. 1973, The forest of Isle Royale in relation
to fire history and wildlife. Technical Bulletin 294; Forestry Series 13. Minneapolis, MN: University of Minnesota, Agricultural Experiment Station, 44 p.
Huber, N.K., 1973a, The Portage Lake Volcanics (middle Keweenawan) on Isle Royale,
Michigan: U.S. Geological Survey Professional Paper 754-B. 32 p. Huber, N.K., 1973b, Glacial and postglacial geologic history of Isle Royale National
Park, Michigan: U.S. Geological Survey Professional Paper 754-A. 15 p. Huber, N.K., 1973c, Geologic map of Isle Royale National Park, Keweenaw County,
Michigan: U.S. Geological Survey Miscellaneous Investigations Map I-796, scale 1:62,500.
Kallemeyn, L.W., 2000, A comparison of fish communities from 32 inland lakes in Isle
Royale National Park, 1929 and 1995-1997: U.S. Geological Survey Biological Science Report 2000-0004. 65 p.
Lewis, C.F.M. and Anderson, T.W., 1989, Oscillations of levels and cool phases of the
Laurentian Great Lakes caused by inflows from glacial Lakes Agissez and Barlow-Ojibway: Journal of Paleolimnology, v. 2, p. 99-149.
McRae, M.E., Cannon, W.F. and Woodruff, L.G., 1998, Post-glacial shorelines of Isle
Royale – where are they now?: 44th Annual Meeting of the Institute on Lake Superior Geology, v. 44, p. 86-87.
Rakestraw, L., 1965, Historic mining on Isle Royale: Isle Royale Natural History
Association, Houghton, Michigan, 20 p.
14
Taggert, J.E., Jr., 2002, Analytical methods for chemical analysis of geologic and other
materials, U.S. Geological Survey: U.S. Geological Survey Open-File Report 02-0223. Teller, J.T. and Thorleifson, L.H., 1983, The Lake Agassiz – Lake Superior connection:
Geological Society of Canada Special Paper 26, p. 261-290. Wetmore, C.M., 1985, Lichens and air quality in Isle Royale National Park: Final
Report, National Park Service Contract XC0001-22-0034 and USDI-PX6000-7-0731, 40 p.
Wolff, R.G. and Huber, N.K., 1973, The Copper Harbor Conglomerate (middle
Keweenawan) on Isle Royale, Michigan, and its regional implications: U.S. Geological Survey Professional Paper 754-B. 15 p.
Wright, H.E., Jr., 1967, A square-rod piston sampler for lake sediments: Journal of
Sedimentary Petrology, v. 37, p. 975-976.
15
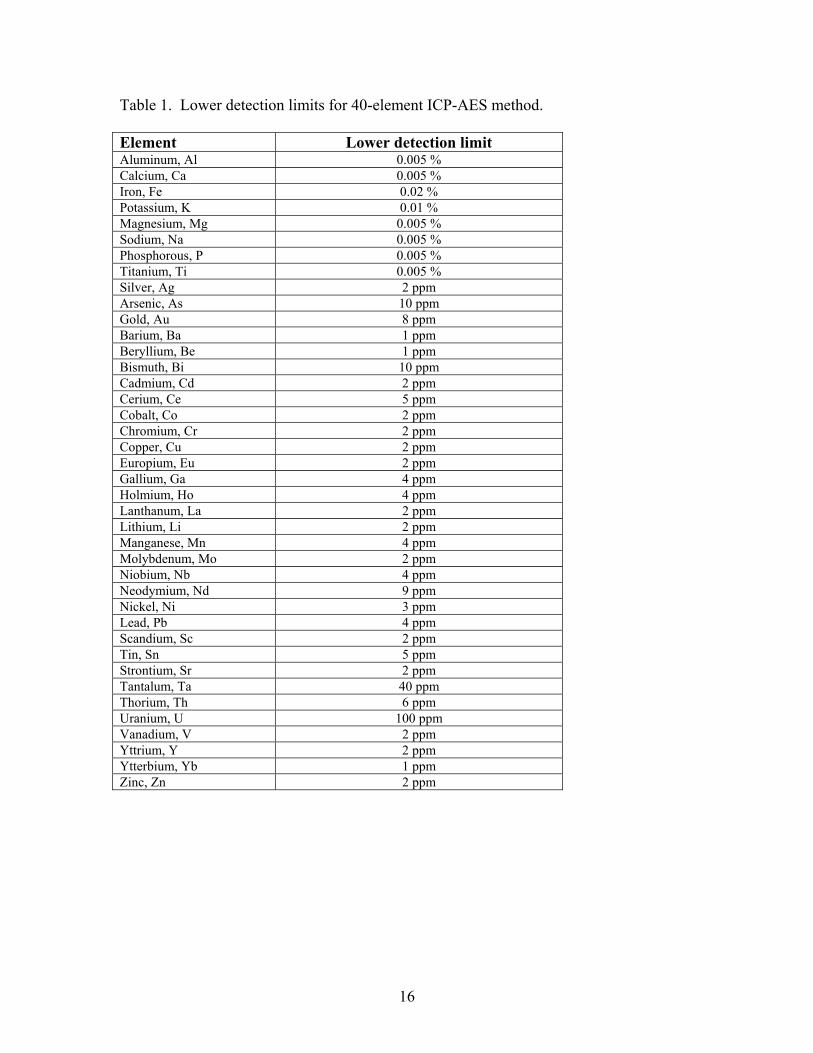
Table 1. Lower detection limits for 40-element ICP-AES method. Element Lower detection limit Aluminum, Al 0.005 % Calcium, Ca 0.005 % Iron, Fe 0.02 % Potassium, K 0.01 % Magnesium, Mg 0.005 % Sodium, Na 0.005 % Phosphorous, P 0.005 % Titanium, Ti 0.005 % Silver, Ag 2 ppm Arsenic, As 10 ppm Gold, Au 8 ppm Barium, Ba 1 ppm Beryllium, Be 1 ppm Bismuth, Bi 10 ppm Cadmium, Cd 2 ppm Cerium, Ce 5 ppm Cobalt, Co 2 ppm Chromium, Cr 2 ppm Copper, Cu 2 ppm Europium, Eu 2 ppm Gallium, Ga 4 ppm Holmium, Ho 4 ppm Lanthanum, La 2 ppm Lithium, Li 2 ppm Manganese, Mn 4 ppm Molybdenum, Mo 2 ppm Niobium, Nb 4 ppm Neodymium, Nd 9 ppm Nickel, Ni 3 ppm Lead, Pb 4 ppm Scandium, Sc 2 ppm Tin, Sn 5 ppm Strontium, Sr 2 ppm Tantalum, Ta 40 ppm Thorium, Th 6 ppm Uranium, U 100 ppm Vanadium, V 2 ppm Yttrium, Y 2 ppm Ytterbium, Yb 1 ppm Zinc, Zn 2 ppm
16
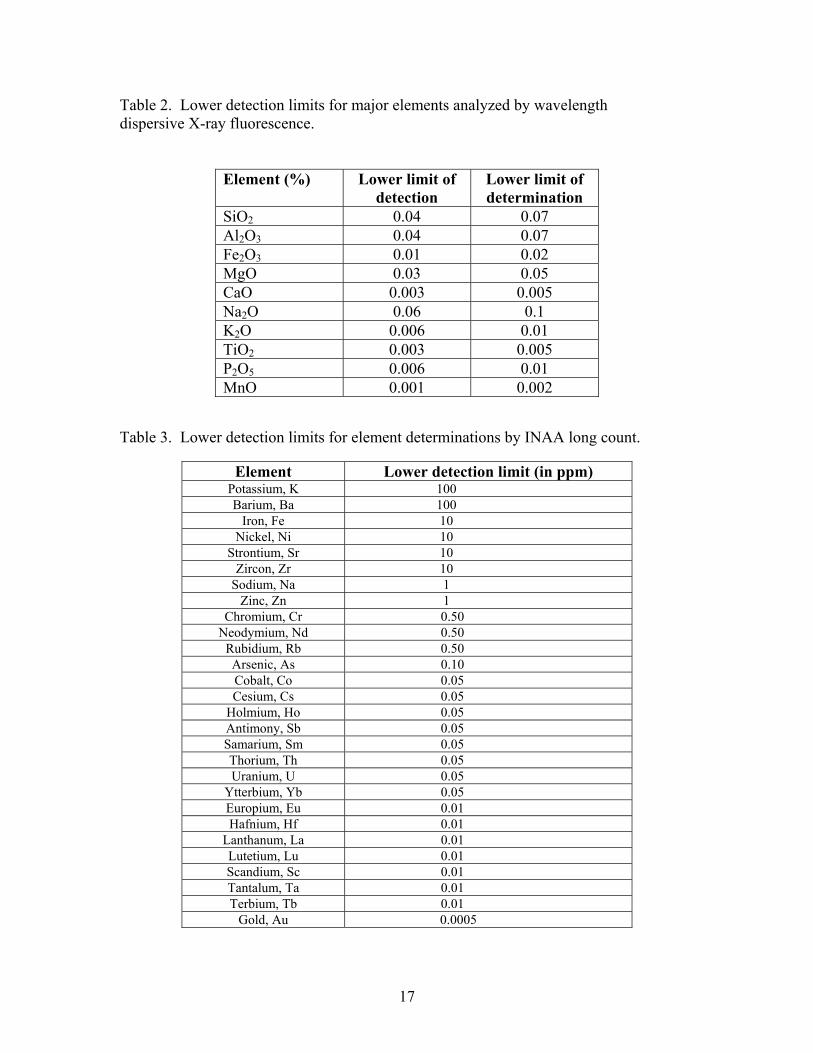
Table 2. Lower detection limits for major elements analyzed by wavelength dispersive X-ray fluorescence.
Element (%) Lower limit of detection
Lower limit of determination
SiO2 0.04 0.07 Al2O3 0.04 0.07 Fe2O3 0.01 0.02 MgO 0.03 0.05 CaO 0.003 0.005 Na2O 0.06 0.1 K2O 0.006 0.01 TiO2 0.003 0.005 P2O5 0.006 0.01 MnO 0.001 0.002
Table 3. Lower detection limits for element determinations by INAA long count.
Element Lower detection limit (in ppm) Potassium, K 100 Barium, Ba 100
Iron, Fe 10 Nickel, Ni 10
Strontium, Sr 10 Zircon, Zr 10
Sodium, Na 1 Zinc, Zn 1
Chromium, Cr 0.50 Neodymium, Nd 0.50
Rubidium, Rb 0.50 Arsenic, As 0.10 Cobalt, Co 0.05 Cesium, Cs 0.05
Holmium, Ho 0.05 Antimony, Sb 0.05 Samarium, Sm 0.05 Thorium, Th 0.05 Uranium, U 0.05
Ytterbium, Yb 0.05 Europium, Eu 0.01 Hafnium, Hf 0.01
Lanthanum, La 0.01 Lutetium, Lu 0.01 Scandium, Sc 0.01 Tantalum, Ta 0.01 Terbium, Tb 0.01
Gold, Au 0.0005
17
Related Documents