BALANCING IMBALANCES: INTEGRATED SURVEILLANCE AND THE ROLE OF THE MIP Jonas Fischer * and Alexandr Hobza * The new EU governance arrangements introduced as part of the so-called “six-pack” legislation aim at deepening of the EU fiscal surveillance frameworks as well as broadening surveillance to cover the issue of macroeconomic imbalances. The new elements are applied in a setting of integrated surveillance under the European Semester. The integrated approach reflects one of the key lessons of therecent crises, namely the strong interlinkages across sectors within an economy and the importance of the fiscal and external constraints. Against this broader context, the paper focuses on the new process to prevent and correct macroeconomic imbalances – the Macroeconomic Imbalance Procedure (MIP). It explains the rationale of the MIP, its place in EU multilateral surveillance and discusses its potential role in facilitating the adjustment of the accumulated macroeconomic imbalances. It takes a sectorial perspective and underlines the strong interlinkages across sectors within an economy. It also discusses the nature and importance of the external constraint within the euro area in the context of rebalancing and fiscal consolidation and implications for the adjustment. It argues that that the MIP can contribute to better economic outcomes through promoting adjustment and stability-oriented policies, reinstating external sustainability and avoiding asset booms. The overall governance framework of the EU is under rapid development, in particular as regards the financial sector and banking union, which also will change the conditions under which future imbalances may develop in the economy. Therefore, looking forward, the MIP will crucially need to stay flexible to react to changing circumstances. 1 Introduction It is now evident that the build-up of external and internal macroeconomic imbalances in the pre-crisis years contributed to the depth of the crisis. Their unwinding has proven very costly, contributing to a sovereign debt crisis and deleveraging pressures in the private sector. As a side product, the unravelling of the economic and financial crisis has exposed weaknesses in the surveillance arrangements within EMU. Therefore, alongside to policy responses to limit the impact of the crisis and to put in place an exit strategy, important progress is being made in developing the institutional building blocks of EU and euro area economic surveillance. In particular, these developments pointed to the need to broaden the economic governance framework underpinning EMU so as to better address the issue of unsustainable macroeconomic trends in all sectors of the economy. The potential implications of the accumulation of macroeconomic imbalances were not fully reflected in the existing governance arrangements in EMU. In particular, the necessary toolbox and the analytical basis for efficient surveillance on imbalances were missing at that time. The new procedure for the prevention and correction of macroeconomic imbalances – the Macroeconomic Imbalance Procedure (MIP) – responds to this need and was one of the key building blocks of the legislative package (the “six-pack”) to enhance the governance structures in EMU adopted in late 2011. The MIP should not be seen in isolation from other surveillance tools, ————— * The authors work at DG ECFIN at the European Commission. The views expressed in this article are those of the authors and do not necessarily represent those of the European Commission.

Welcome message from author
This document is posted to help you gain knowledge. Please leave a comment to let me know what you think about it! Share it to your friends and learn new things together.
Transcript

BALANCING IMBALANCES: INTEGRATED SURVEILLANCE AND THE ROLE OF THE MIP
Jonas Fischer* and Alexandr Hobza*
The new EU governance arrangements introduced as part of the so-called “six-pack” legislation aim at deepening of the EU fiscal surveillance frameworks as well as broadening surveillance to cover the issue of macroeconomic imbalances. The new elements are applied in a setting of integrated surveillance under the European Semester. The integrated approach reflects one of the key lessons of therecent crises, namely the strong interlinkages across sectors within an economy and the importance of the fiscal and external constraints.
Against this broader context, the paper focuses on the new process to prevent and correct macroeconomic imbalances – the Macroeconomic Imbalance Procedure (MIP). It explains the rationale of the MIP, its place in EU multilateral surveillance and discusses its potential role in facilitating the adjustment of the accumulated macroeconomic imbalances. It takes a sectorial perspective and underlines the strong interlinkages across sectors within an economy. It also discusses the nature and importance of the external constraint within the euro area in the context of rebalancing and fiscal consolidation and implications for the adjustment.
It argues that that the MIP can contribute to better economic outcomes through promoting adjustment and stability-oriented policies, reinstating external sustainability and avoiding asset booms. The overall governance framework of the EU is under rapid development, in particular as regards the financial sector and banking union, which also will change the conditions under which future imbalances may develop in the economy. Therefore, looking forward, the MIP will crucially need to stay flexible to react to changing circumstances.
1 Introduction
It is now evident that the build-up of external and internal macroeconomic imbalances in the pre-crisis years contributed to the depth of the crisis. Their unwinding has proven very costly, contributing to a sovereign debt crisis and deleveraging pressures in the private sector. As a side product, the unravelling of the economic and financial crisis has exposed weaknesses in the surveillance arrangements within EMU. Therefore, alongside to policy responses to limit the impact of the crisis and to put in place an exit strategy, important progress is being made in developing the institutional building blocks of EU and euro area economic surveillance.
In particular, these developments pointed to the need to broaden the economic governance framework underpinning EMU so as to better address the issue of unsustainable macroeconomic trends in all sectors of the economy. The potential implications of the accumulation of macroeconomic imbalances were not fully reflected in the existing governance arrangements in EMU. In particular, the necessary toolbox and the analytical basis for efficient surveillance on imbalances were missing at that time.
The new procedure for the prevention and correction of macroeconomic imbalances – the Macroeconomic Imbalance Procedure (MIP) – responds to this need and was one of the key building blocks of the legislative package (the “six-pack”) to enhance the governance structures in EMU adopted in late 2011. The MIP should not be seen in isolation from other surveillance tools, ————— * The authors work at DG ECFIN at the European Commission.
The views expressed in this article are those of the authors and do not necessarily represent those of the European Commission.

2 Jonas Fischer and Alexandr Hobza
such as the EDP and the European semester, but as part of the broader efforts to move towards more integrated and encompassing surveillance.
Against this background, Section 2 first provides a rationale for the MIP by looking at the economic developments in the run-up to the crisis; and discusses also the adjustment to external, fiscal and private sector macroeconomic imbalances. There is a particular focus on the sectorial interlinkages and the role of external and internal constraints for the adjustment. Section 3 then briefly presents the MIP and how it fits in the overall EU surveillance framework. Against the backdrop of accumulation of macroeconomic imbalances in 2000s, Section 4 examines the past country-specific policy advice given in the context of the economic surveillance, also before the crisis, and contrasts it with that given in the first years of application of the MIP. Section 5 concludes.
2 The macroeconomic imbalances and the need for an integrated surveillance approach
This section discusses the developments that preceded the onset of the economic and financial crisis and which were marked by the accumulation of significant macroeconomic imbalances. In particular, it focuses on the strong interlinkages across different sectors within economies as well as across different euro area members. It aims to demonstrate the need for a multifaceted approach to monitoring and tackling macroeconomic imbalances, which is reflected in the design of the MIP. Drawing on the adjustment experience of recent years, the section also outlines the economic challenges on the way forward that will have to be addressed in the context of the application of the integrated macroeconomic surveillance in the EU.
2.1 The emergence of imbalances in the run-up to the crisis: the loosening of constraints
2.1.2 The relevance of current accounts in a monetary union: the link to internal imbalances
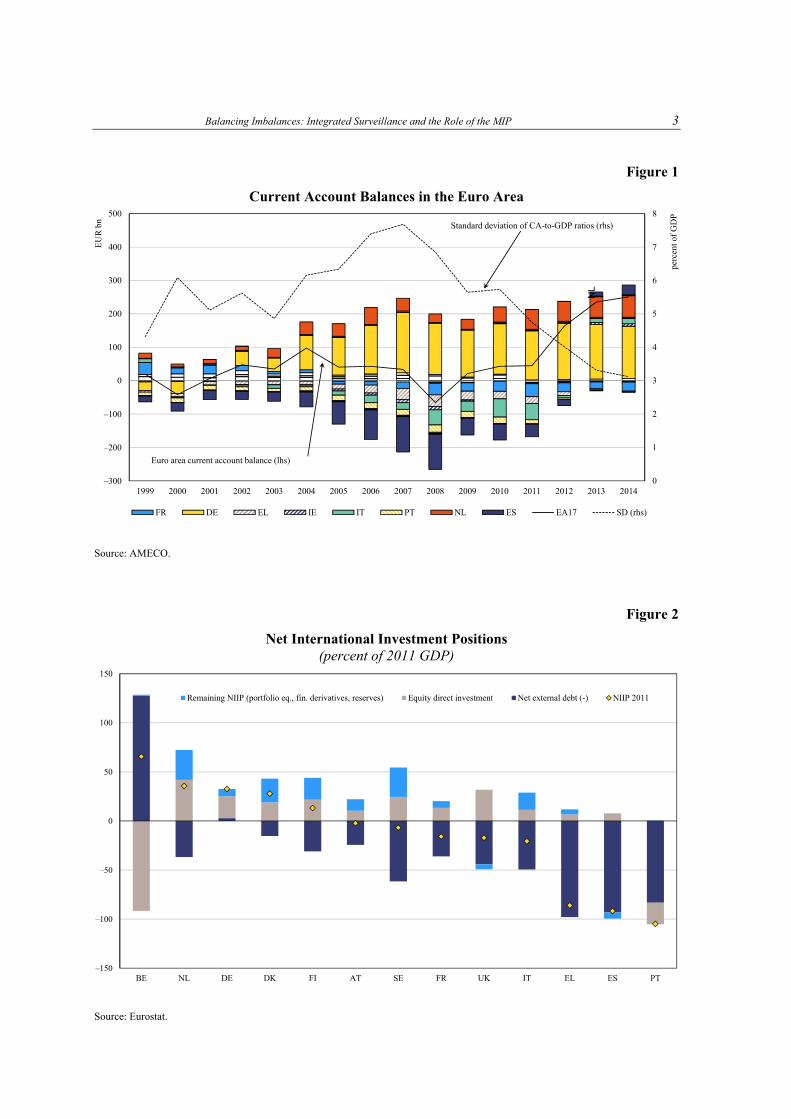
Perhaps the most visible manifestation of macroeconomic imbalances was the increasing divergence in external positions. Some Member States saw their current account deficits rise to staggering levels while others accumulated substantial current account surpluses (Figure 1). In 2008, current account deficits of the euro area deficit countries reached their peak and stood at almost 4.7 per cent of the group’s GDP, with deficits of Greece, Spain or Portugal being around or above 10 per cent of their respective GDP. Current account positions of surplus countries accounted for 5.5 per cent of their GDP in this year, with the highest one recorded in Germany and exceeding 6 per cent of GDP. These persistent external imbalances resulted in the rising stocks of net external liabilities in the deficit countries and improving net asset positions in the surplus countries (Figure 2). In particular, the negative net international positions of countries such as Greece, Spain and Portugal grew to levels exceeding their annual output, much of this consisting of debt liabilities.
These developments bear witness to the importance of current account balances even in a monetary union and underline the need to undertake surveillance on external imbalances. Clearly, the nature of the external constraint is different in a country participating in a monetary union compared to economies that have their own currency. A number of the concerns and risks that large current account imbalances generate do not apply in a monetary union: current account imbalances carry lesser immediate risks as there is no (or less of a) threat of a sudden stop, i.e., interruption of capital inflows. Also, creditors are protected from risks of large depreciations in the value of their assets abroad and in sudden losses of competitiveness through large exchange rate swings.
Balancing Imbalances: Integrated Surveillance and the Role of the MIP 3
Figure 1
Current Account Balances in the Euro Area Source: AMECO.
Figure 2
Net International Investment Positions (percent of 2011 GDP)
Source: Eurostat.
0
1
2
3
4
5
6
7
8
–300
–200
–100
0
100
200
300
400
500
1999 2000 2001 2002 2003 2004 2005 2006 2007 2008 2009 2010 2011 2012 2013 2014
perc
ent o
f G
DP
EU
R b
n
FR DE EL IE IT PT NL ES EA17 SD (rhs)
NL
Standard deviation of CA-to-GDP ratios (rhs)
Euro area current account balance (lhs)
–150
–100
–50
0
50
100
150
BE NL DE DK FI AT SE FR UK IT EL ES PT
Remaining NIIP (portfolio eq., fin. derivatives, reserves) Equity direct investment Net external debt (-) NIIP 2011
4 Jonas Fischer and Alexandr Hobza
Current account deficits and surpluses are also part of the adjustment process in a monetary union. They absorb asymmetric shocks in the absence of independent monetary policy and nominal exchange rate adjustment. Market-driven changes in cost and price competitiveness facilitate adjustment, with competitiveness losses taking place in overheating economies and gains in countries in cyclical downturn and with high unemployment.
However, current account balances provide useful information on potentially destabilising internal developments, particularly in a monetary union that consists of independent national states and lacks well-functioning cross-border adjustment mechanisms. Current account deficits are indicative of the extent to which the economic agents in a country rely on capital from abroad to fill in their saving-investment gaps. Concerns about the external debt sustainability still exist, in so far as they reflect the solvency of the government, firms and households, the financial responsibilities of which are usually intermediated by the respective banking systems. If deficits are excessive and the representative economic agent of a country lives beyond her means, her solvency will at some time be disputed and creditors will refuse increasing or rolling over credit. In these cases, there is a need to address the underlying distortions – this applies to both countries with their own currencies and those in a monetary union.
2.1.2 External imbalances and their drivers
The build-up of the large current account imbalances in the EU and the euro area coincided with several major developments on both European and global levels. These primarily included financial factors such as the introduction of the euro which reduced sovereign risk premiums across the euro area and promoted financial market integration in the EU as well as the global reduction in interest rates, which increased risk appetite among financial investors, led to severe underpricing of credit risks and initiated a global credit boom.
The financial factors played a particularly important role and contributed to the accumulation of external imbalances through two channels:
• They increased the cross-border supply of capital: the elimination of currency risk coupled with institutional reforms to harmonise financial sector policies have stimulated capital flows from the core to the periphery. The expansion of cross-border financial flows was a global phenomenon during the period up to the crisis, but was particularly strong in the euro area.
• They boosted demand for capital in the periphery: the softening of credit constraints as well as the sharp reduction of real interest rates have led to the fuelling of domestic demand in the south, which in turn caused prices and labour costs to increase. The ensuing real exchange rate appreciation implied a relative loss in competitiveness while at the same time there was a deterioration in the current account positions.
The mounting current account deficits and surpluses were thus a counterpart to strong capital flows across the euro-area. An important part of the widening in surpluses and deficits was driven by the convergence in interest rates after the introduction of the euro. A global decline in interest rates and ample supply of liquidity were accentuated by the financial euro-bias and progress in establishing a single financial market.
Capital inflows benefited mostly those countries which in the run-up to EMU experienced the largest reductions in nominal interest rates and where the real returns on investment appeared the highest. While the observed developments partially reflected sound catching-up processes, particularly in the initial period, they also had much less benign repercussions and became a significant ingredient of unsustainable macroeconomic trends in some countries. Part of the capital flows was channelled into unproductive uses and fuelled domestic demand booms, which were

Balancing Imbalances: Integrated Surveillance and the Role of the MIP 5
associated with excessive credit expansions in the private and/or public sectors and housing bubbles in some euro-area members.
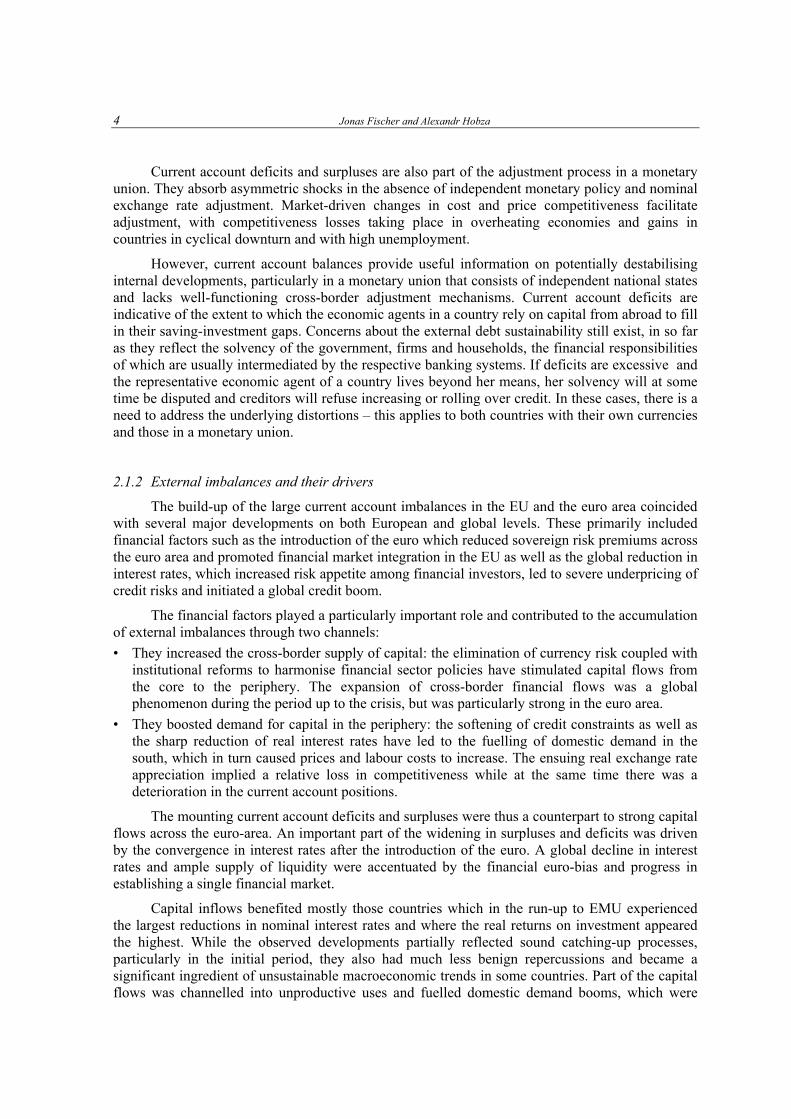
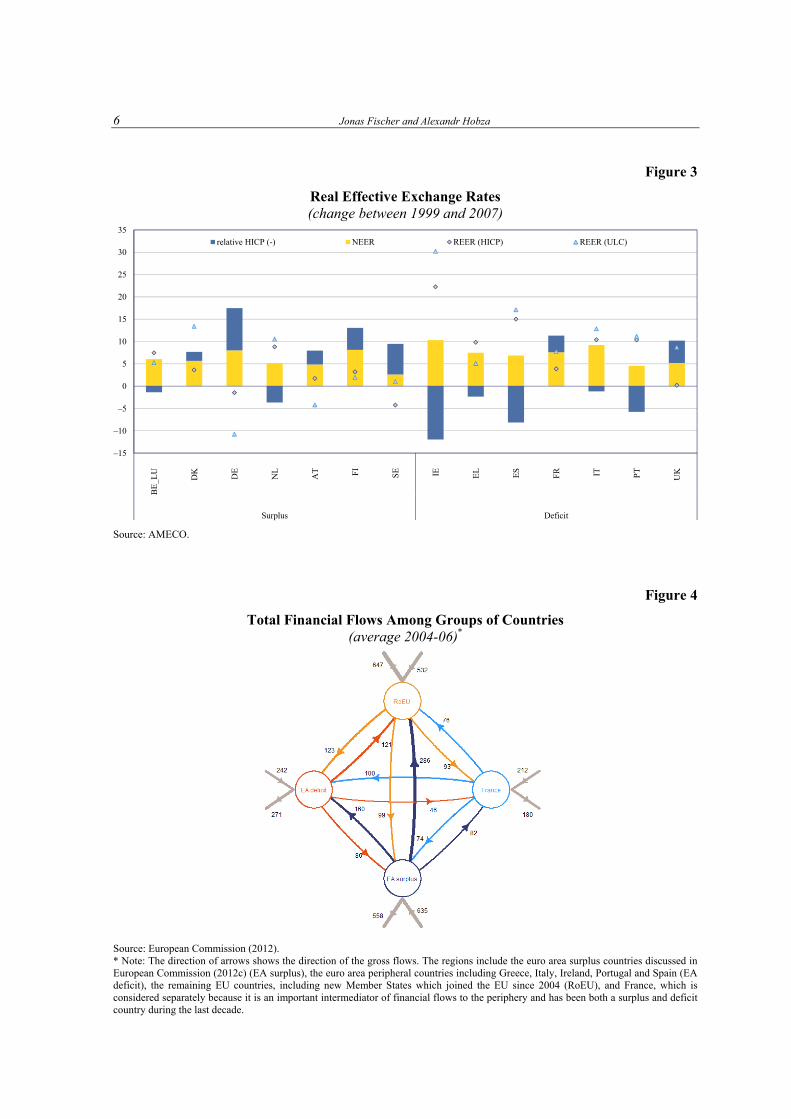
The expansion of domestic demand generated upward pressure on prices, which was particularly strong in non-tradable sectors. The resulting changes in relative prices induced a reallocation of resources in the economy towards the non-tradable sectors and, on the whole, resulted in substantial losses in price and cost competitiveness. This can be clearly seen from the developments in competitiveness indicators, such as real effective exchange rates or unit labour costs, which document the increasing divergences in the euro area (Figure 3). Faced with strong demand pressures, some countries were also unable to react appropriately to negative productivity shocks.
Inside the euro area, the external deficits were largely financed by the excess savings of the surplus countries, both directly and indirectly.1 Moreover, the core economies (in particular Germany and France) intermediated large financial flows from non-EU investors to deficit countries (Figure 4). Most of this financing took the form of debt and was channelled through the bond and inter-bank markets. In the absence of appropriate macro-financial supervision, all this resulted in credit-driven booms, reductions in savings and excessive investment in non-productive activities in the periphery, and excessive risk concentration in the financial systems of the core countries.
In addition, external shocks compounded the effects of intra-euro area factors in the emergence of large deficits and surpluses in the EU. During the first decade of its existence, the euro area was exposed to a number of external shocks such as the rapidly evolving competition from emerging countries, enlargement of the EU, increases in commodity prices, recycling of oil-producers’ income and changes in the pattern of global demand. These external shocks had different impacts on individual Member States. They were, on the whole, more favourable for the exports and terms of trade of the core EU economies, partially due to the product and geographic composition of their exports and stronger non-price competitiveness, while they put pressure on the export potential, and promoted imports of the periphery.2 In addition, the strengthening in the nominal exchange rate of the euro put further pressure on price competitiveness. Exports of the deficit countries have been more price sensitive and the composition of their exports has made them more vulnerable to shifts in the nominal exchange rates.
Therefore, the current account divergence in the euro area was a reflection of the ongoing adjustment to a number of endogenous and exogenous shocks. They were manifestations of increasing domestic disequilibria in the euro area countries and not necessarily a cause of the subsequent crisis.3
2.1.3 A sectorial perspective: linking external and internal imbalances
These trends point to the close interlinkages between cross-border financial flows, external positions of countries and developments in sectorial balance sheets. A sectorial perspective is thus essential to understand the interplay between domestic and external imbalances. It is relevant to detect a possible concentration of risks in specific parts of the economy and its institutional sectors. From an accounting perspective, current account balance corresponds to the saving-investment balance of the total economy, which, in turn, is the aggregate of saving-investment balances of domestic sectors:
————— 1 European Commission (2012c). 2 Chen et al., 2012. 3 Buti and Turrini, 2012.
6 Jonas Fischer and Alexandr Hobza
Figure 3
Real Effective Exchange Rates (change between 1999 and 2007)
Source: AMECO.
Figure 4
Total Financial Flows Among Groups of Countries (average 2004-06)*
Source: European Commission (2012). * Note: The direction of arrows shows the direction of the gross flows. The regions include the euro area surplus countries discussed in European Commission (2012c) (EA surplus), the euro area peripheral countries including Greece, Italy, Ireland, Portugal and Spain (EA deficit), the remaining EU countries, including new Member States which joined the EU since 2004 (RoEU), and France, which is considered separately because it is an important intermediator of financial flows to the periphery and has been both a surplus and deficit country during the last decade.
–15
–10
–5
0
5
10
15
20
25
30
35
BE
_LU
DK
DE
NL
AT FI
SE IE EL ES
FR IT PT
UK
Surplus Deficit
relative HICP (-) NEER REER (HICP) REER (ULC)

Balancing Imbalances: Integrated Surveillance and the Role of the MIP 7
CA = (S–I)private + (S–I)GG
The aggregate saving and investment can be decomposed into contributions from different institutional sectors, i.e., the government, households, businesses and financial corporations (the latter three sometimes aggregated in the private sector). This allows analysing contributions of these sectors to the overall external balance of the economy.
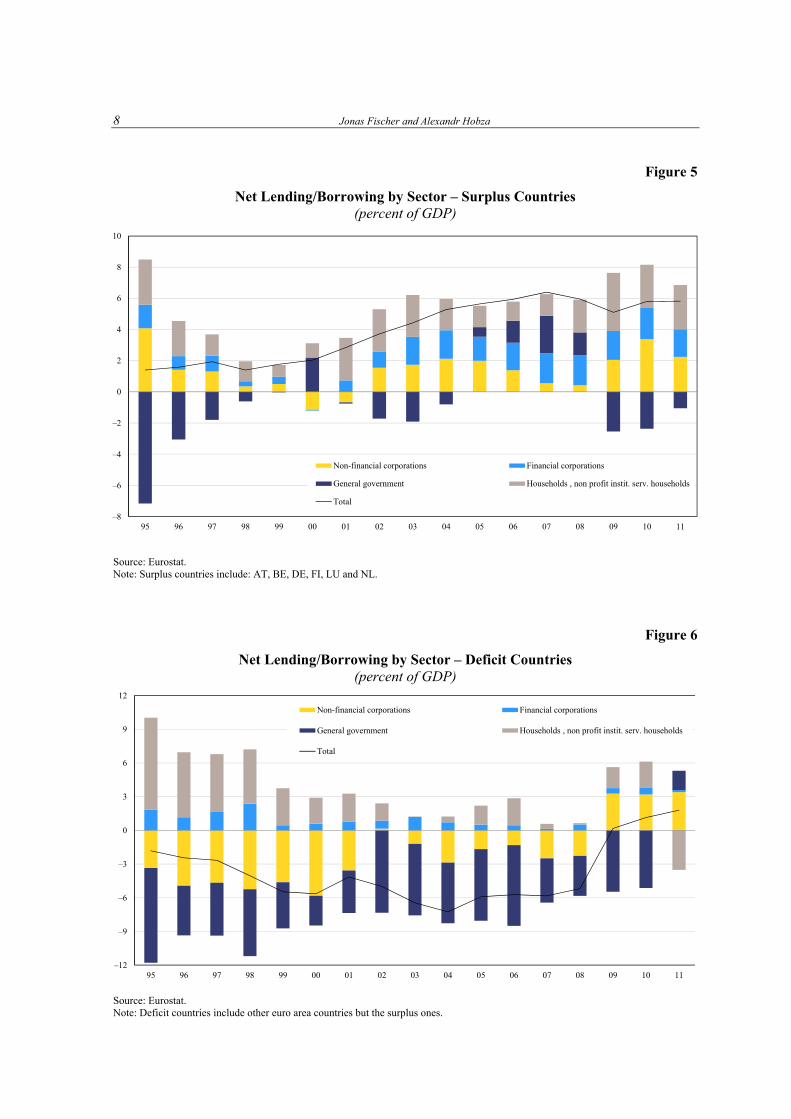
A look at the sectorial net lending/borrowing in the groups of surplus and deficit countries in the euro area shows that the key driver of the growing divergences in external positions prior to the on-set of the crisis was the non-financial private sector: while in surplus countries the financial balance of the private sector on average improved, in deficit countries it progressively deteriorated up to 2007 (Figures 5 and 6). The household sectors in both surplus and deficit countries were on average net lenders over the whole period, while the net lending position was much weaker in the latter and, moreover, deteriorating in the run-up to the crisis. The non-financial corporations were net borrowers in deficit countries while they turned into net lenders in surplus countries. This is quite striking given the fact that companies typically are net borrowers as they use credit to finance their investment plans.4
The government sector balances in the deficit countries were on average negative and contributed significantly to the external deficits. Their size did not change significantly over time though and thus they were not behind the expansion in deficits before the crisis. On the other hand, surplus countries tightened their fiscal policies considerably and their government sectors turned into net lenders, adding thus to the contributions of the private sectors to external surpluses. The net lending/borrowing positions of the financial sector were relatively small and broadly similar, reflecting the intermediation role of financial institutions.
A closer examination of the sectorial saving-investment balances in individual euro area countries unveils important differences in their contributions to the external position of the economy (Table 1). Overall, the size of saving-investment gaps tended to increase in many sectors in the run-up to the crisis. The highly negative net lending/borrowing positions of households in Ireland and Greece are remarkable and reflect the extent of the housing boom in Ireland and (probably) the consumption boom in Greece. In other high-deficit countries such as Spain or Portugal, it was the corporate sector, which was an important net borrower. Government balances were highly negative in Greece and Portugal but actually positive in Spain and Ireland.
2.1.4 Private sector imbalances and current accounts
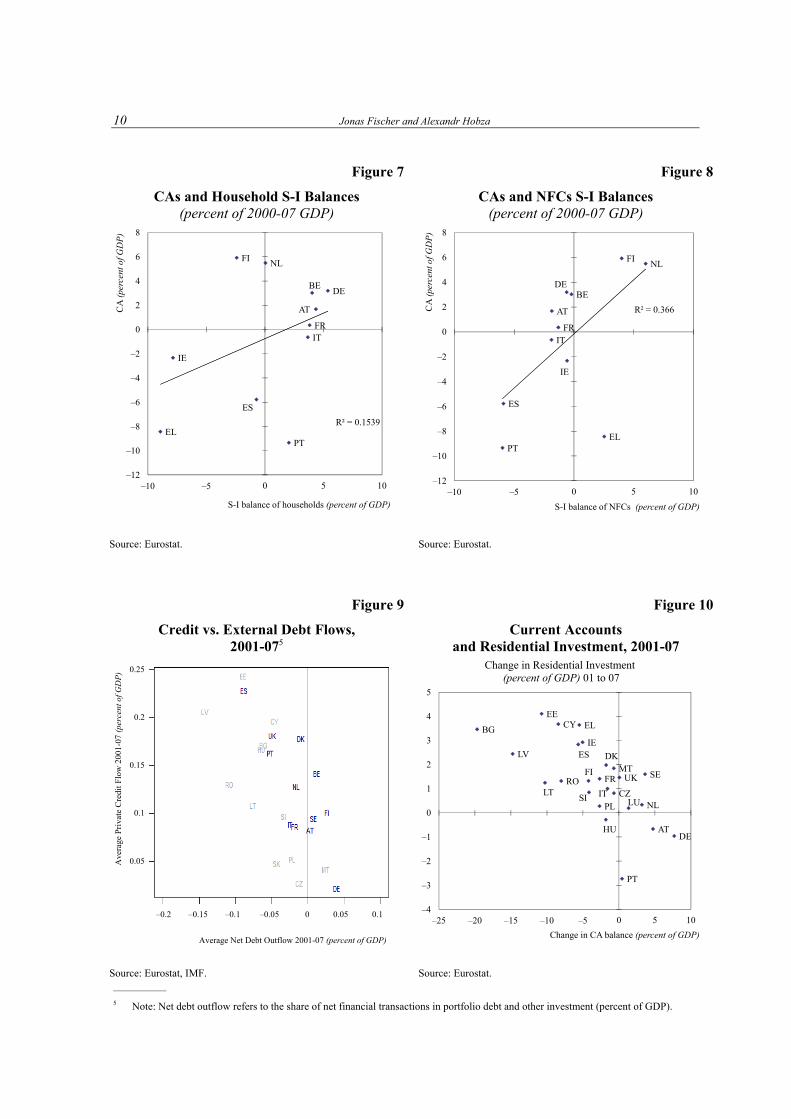
As mentioned above, the loosening of the external constraint coincided with the accumulation of private sector imbalances in the current account deficit countries. The increased ability of countries’ banking systems to tap international sources of capital allowed the credit growth significantly exceed the growth in domestic deposits. The ample supply of cheap capital benefited both households as well as companies. Figures 7 and 8 indicate that the association with current account positions was stronger in the corporate sector than in the household sector.
In this respect, the composition of capital inflows played an important role. Domestic credit expansions were fuelled by the fact that the capital inflows in the periphery took form of mostly (inter-bank) debt. Figure 9 shows the close association between cross-border debt flows and domestic credit growth. Debt flows, however, carry more risks than equity-based financing (e.g., the FDI), which allows more cross-border diversification of risk. At the same time, the expansion phase of imbalances may induce important relocation of resources in the economy: capital inflows
————— 4 For an analysis of developments in corporate balance sheets, see for example Ruscher and Wolff (2012).
8 Jonas Fischer and Alexandr Hobza
Figure 5
Net Lending/Borrowing by Sector – Surplus Countries (percent of GDP)
Source: Eurostat. Note: Surplus countries include: AT, BE, DE, FI, LU and NL.
Figure 6
Net Lending/Borrowing by Sector – Deficit Countries (percent of GDP)
Source: Eurostat. Note: Deficit countries include other euro area countries but the surplus ones.
–8
–6
–4
–2
0
2
4
6
8
10
95 96 97 98 99 00 01 02 03 04 05 06 07 08 09 10 11
Non-financial corporations Financial corporations
General government Households , non profit instit. serv. households
Total
–12
–9
–6
–3
0
3
6
9
12
95 96 97 98 99 00 01 02 03 04 05 06 07 08 09 10 11
Non-financial corporations Financial corporations
General government Households , non profit instit. serv. households
Total

B
alancing Imbalances: Integrated Surveillance and the R
ole of the MIP
9
Table 1
Average Saving-investment Balances of Different Sectors (percent of GDP)
Country 00-04 05-07 08-11
HH NFC FC GG Total HH NFC FC GG Total HH NFC FC GG Total
BE 4.9 –0.5 0.4 –0.1 4.8 2.5 0.3 1.3 –0.8 3.4 3.3 0.3 1.2 –3.6 1.2
DE 5.0 –1.4 0.6 –2.7 1.4 6.0 0.8 1.2 –1.6 6.4 5.8 1.3 0.8 –2.0 6.0
EE –3.3 –7.0 1.4 0.7 –8.2 –9.1 –6.3 0.8 2.0 –12.6 –0.7 4.8 –0.3 –0.9 3.0
IE –6.6 –0.1 3.6 0.4 0.3 –9.1 –1.0 4.2 1.6 –4.0 1.8 1.5 10.9 –16.2 –1.8
EL –9.0 3.5 0.6 –5.3 –10.2 –8.8 1.0 1.9 –6.3 –12.1 –8.5 4.6 2.7 –11.4 –12.6
ES 0.2 –4.1 0.9 –0.4 –3.4 –2.3 –8.8 1.2 1.9 –8.2 3.5 –1.5 1.5 –8.7 –5.1
FR 4.2 –0.9 0.3 –2.8 0.8 3.2 –2.0 0.6 –2.7 –0.9 4.3 –2.0 1.4 –5.8 –2.0
IT 3.7 –1.7 0.7 –2.9 –0.1 3.5 –2.2 0.7 –3.2 –1.1 2.1 –2.0 1.0 –4.0 –2.9
CY 1.0 0.6 –1.2 –3.9 –3.4 –1.8 –6.2 –0.0 –0.0 –8.1 –0.5 –7.9 3.6 –4.2 –9.0
NL 0.6 5.3 1.4 –1.1 6.2 –1.0 7.3 1.6 0.1 8.0 –0.2 7.9 0.8 –3.6 4.9
AT 3.9 –1.8 0.6 –1.8 0.9 5.1 –2.0 1.4 –1.5 3.0 4.3 –0.2 2.0 –3.0 3.0
PT 2.2 –5.5 –0.0 –3.9 –7.2 1.8 –6.8 0.7 –4.8 –9.1 3.9 –7.5 1.8 –7.0 –8.9
SI 4.9 –4.3 0.9 –3.0 –1.5 5.6 –7.8 –0.1 –1.0 –3.2 4.6 –2.7 1.4 –5.0 –1.7
SK –0.6 –0.5 1.0 –6.4 –6.5 –1.5 –3.8 0.6 –2.6 –7.3 0.7 1.7 1.1 –5.7 –2.2
FI –1.8 4.6 0.3 4.2 7.3 –3.5 3.1 0.6 4.0 4.2 –1.4 2.7 0.7 –0.5 1.5
Source: Eurostat. Note: The data for EL are provisional.
10 Jonas Fischer and Alexandr Hobza
Figure 7
CAs and Household S-I Balances (percent of 2000-07 GDP)
Figure 8
CAs and NFCs S-I Balances (percent of 2000-07 GDP)
Source: Eurostat. Source: Eurostat.
Figure 9
Credit vs. External Debt Flows, 2001-075
Figure 10
Current Accounts and Residential Investment, 2001-07
Source: Eurostat, IMF. Source: Eurostat.
————— 5 Note: Net debt outflow refers to the share of net financial transactions in portfolio debt and other investment (percent of GDP).
0.25
0.2
0.15
0.1
0.05 Ave
rage
Pri
vate
Cre
dit F
low
200
1-07
(pe
rcen
t of G
DP
)
–0.2 –0.15 –0.1 –0.05 0 0.05 0.1
Average Net Debt Outflow 2001-07 (percent of GDP)
BEDE
IE
EL
ES
FRIT
NL
AT
PT
FI
R² = 0.1539
–12
–10
–8
–6
–4
–2
0
2
4
6
8
–10 –5 0 5 10
CA
(pe
rcen
t of G
DP
)
S-I balance of households (percent of GDP)
BG
CZ
DK
DE
EE
IE
EL
ES
FR
IT
CY
LV
LTLU
HU
MT
NL
AT
PL
PT
RO
SI
SEFIUK
–4
–3
–2
–1
0
1
2
3
4
5
–25 –20 –15 –10 –5 0 5 10
Change in CA balance (percent of GDP)
Change in Residential Investment(percent of GDP) 01 to 07
BEDE
IE
EL
ES
FRIT
NL
AT
PT
FI
R² = 0.366
–12
–10
–8
–6
–4
–2
0
2
4
6
8
–10 –5 0 5 10
CA
(pe
rcen
t of G
DP
)
S-I balance of NFCs (percent of GDP)

Balancing Imbalances: Integrated Surveillance and the Role of the MIP 11
accompanying current account deficits are associated with relative growth of the non-traded sectors at the cost of the traded ones (Blanchard, 2007). Indeed, widening current account deficits in the pre-crisis period were closely related to the increases in residential investment and the expansions in the construction sectors (Figure 10). Reversal of such trends in the real economy in the adjustment phase can then become very costly in the presence of rigidities (Lane, 2013).
2.1.5 Fiscal policy and current accounts
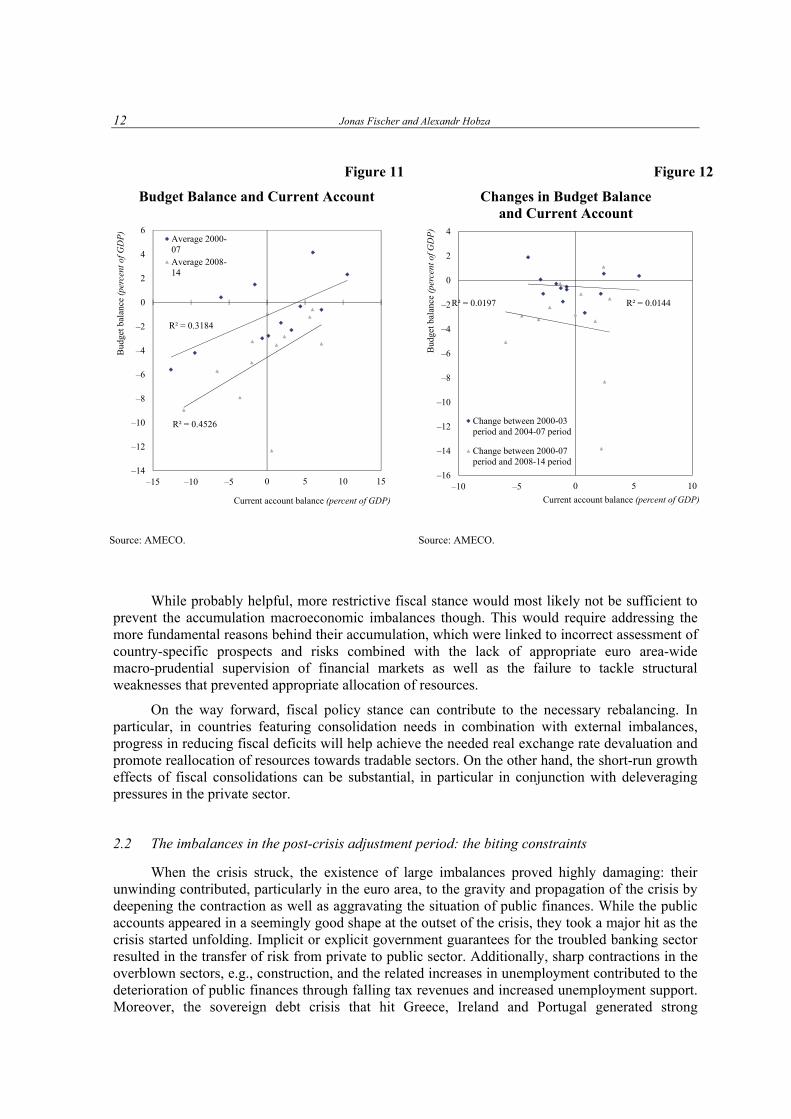
As discussed above, the fiscal stance proved to be an important determinant of current accounts in the euro area. This is in line with theoretical findings and empirical regularities. Unless offset by dissaving of the private sector (the Ricardian effect), a reduction in the government deficit contributes to higher current account surpluses or smaller deficits. The idea that external deficits are driven by government deficits is known as the “twin deficit” hypothesis. Figure 11 shows that average fiscal positions in surplus countries over the period 2000-7 were generally better than those in deficit countries and this relationship continues to hold. Empirical analyses confirm this positive relationship. For example, Abbas et al. (2011) find that an improvement in fiscal balance of 1 percentage point of GDP leads to an increase in current account balance in the range of 0.3-0.5 per cent of GDP. European Commission (2012c) finds a similar effect of around 0.2 per cent of GDP. This effect is generally lower during periods when fiscal policy or current accounts are subject to big changes, and this is especially the case in advanced economies. On the other hand, current account changes appear to be stronger during fiscal contractions. In the EU, the association between changes in fiscal positions and changes in current accounts in the pre-crisis period appears relatively weak (Figure 12). In particular, the increasing current account deficits in the euro area periphery were generally driven by the worsening financial position of the private sectors, with the public sectors’ saving-investment balances being negative, but roughly stable.
With fiscal policy being a key macro policy instrument to address country-specific developments in a monetary union, it appears that fiscal policies of the deficit countries were not leaning enough against the wind to contain the expanding imbalances in other sectors.
One aspect in this context could relate to how the fiscal stance and underlying fiscal positions are measured. Indeed, large current account imbalances may lead to a mis-measurement of the structural fiscal deficit and complicate setting appropriate fiscal stance. Unsustainable current account deficits may result from domestic absorption booms, the expansion of the construction sector, and the related windfall revenues. The standard approaches to adjusting budget balances, by applying constant revenue and expenditure elasticities for the cycle, fail to account for the temporary accelerations of revenues during absorption booms, which lead to an underestimation of structural deficits. Moreover, the abundance of credit may boost economic activity for several years, which may be misunderstood as an improvement in potential output.6 In the case of surpluses, the true underlying cyclically-corrected balance can actually be better than what the estimates of structural balance indicate. Targeting macroeconomic policies to such estimated structural balances means that the fiscal policy becomes overly restrictive and a more expansionary fiscal stance will lead to smaller than expected deteriorations in the budget balance. In addition, the effectiveness of fiscal policy to act against external imbalances might be limited by political economy constraints (Lane, 2010). Indeed, it appears that many euro area members failed to neutralise the windfall revenues in the pre-crisis period.
————— 6 European Commission, 2006; and Lendvai et al., 2011
12 Jonas Fischer and Alexandr Hobza
Figure 11
Budget Balance and Current Account
Figure 12
Changes in Budget Balance and Current Account
Source: AMECO. Source: AMECO.
While probably helpful, more restrictive fiscal stance would most likely not be sufficient to
prevent the accumulation macroeconomic imbalances though. This would require addressing the more fundamental reasons behind their accumulation, which were linked to incorrect assessment of country-specific prospects and risks combined with the lack of appropriate euro area-wide macro-prudential supervision of financial markets as well as the failure to tackle structural weaknesses that prevented appropriate allocation of resources.
On the way forward, fiscal policy stance can contribute to the necessary rebalancing. In particular, in countries featuring consolidation needs in combination with external imbalances, progress in reducing fiscal deficits will help achieve the needed real exchange rate devaluation and promote reallocation of resources towards tradable sectors. On the other hand, the short-run growth effects of fiscal consolidations can be substantial, in particular in conjunction with deleveraging pressures in the private sector.
2.2 The imbalances in the post-crisis adjustment period: the biting constraints
When the crisis struck, the existence of large imbalances proved highly damaging: their unwinding contributed, particularly in the euro area, to the gravity and propagation of the crisis by deepening the contraction as well as aggravating the situation of public finances. While the public accounts appeared in a seemingly good shape at the outset of the crisis, they took a major hit as the crisis started unfolding. Implicit or explicit government guarantees for the troubled banking sector resulted in the transfer of risk from private to public sector. Additionally, sharp contractions in the overblown sectors, e.g., construction, and the related increases in unemployment contributed to the deterioration of public finances through falling tax revenues and increased unemployment support. Moreover, the sovereign debt crisis that hit Greece, Ireland and Portugal generated strong
R² = 0.4526
R² = 0.3184
–14
–12
–10
–8
–6
–4
–2
0
2
4
6
–15 –10 –5 0 5 10 15
Bud
get b
alan
ce (
perc
ent o
f GD
P)
Current account balance (percent of GDP)
Average 2000-07Average 2008-14
R² = 0.0144R² = 0.0197
–16
–14
–12
–10
–8
–6
–4
–2
0
2
4
–10 –5 0 5 10
Bud
get b
alan
ce (
perc
ent o
f GD
P)
Current account balance (percent of GDP)
Change between 2000-03period and 2004-07 period
Change between 2000-07period and 2008-14 period

Balancing Imbalances: Integrated Surveillance and the Role of the MIP 13
cross-border spillover effects through the loss of confidence by financial markets. These developments clearly document the sectorial links within economies as well as cross-border linkages and further underline the need for an EU/euro area-wide approach to the surveillance of imbalances.
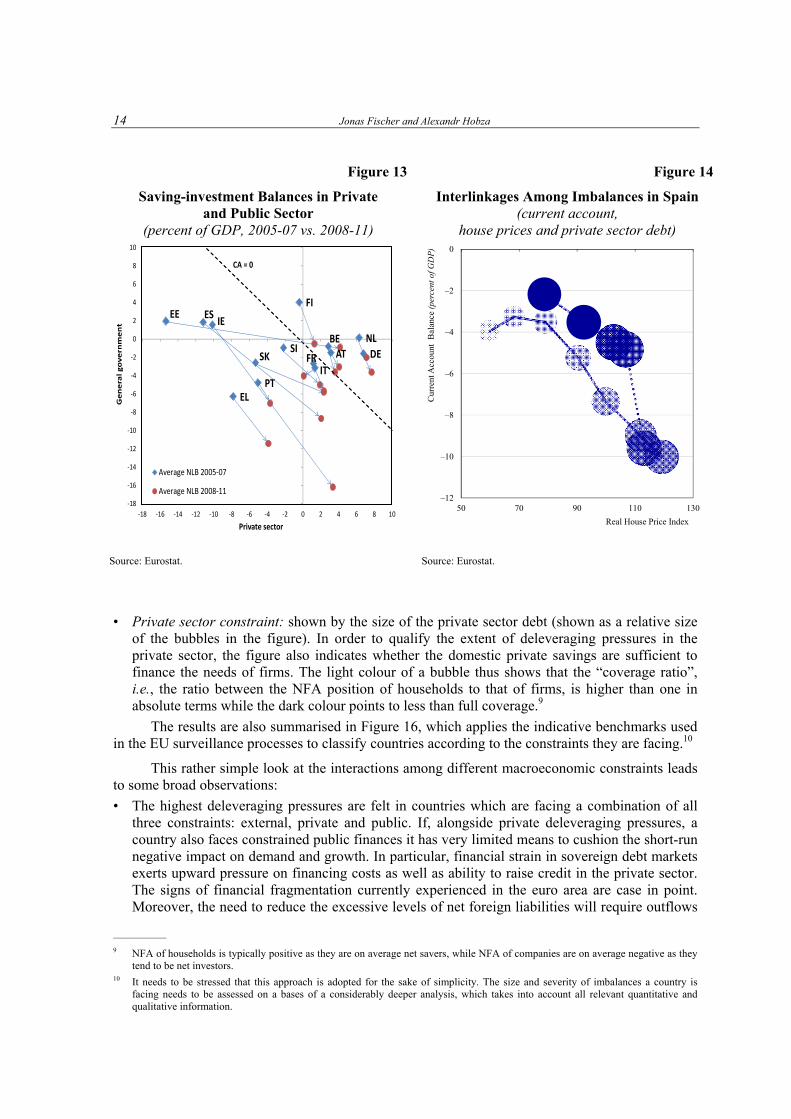
Figure 13 shows the changes in saving-investment balances of the private and public sectors and implicitly the economy as a whole (the downward-sloping line shows the locus of points where the country has a balanced current account) in the periods before (2000-7) and after (2008-11) the start of the crisis. It shows that the crisis has induced sharp corrections in private saving-investment balances in countries where private sectors were the largest net borrowers in the crisis such as Ireland, Greece or Spain. It was also these countries which experienced the most significant deteriorations in government balances. Interestingly, the external constraint started to bite only more recently in the euro area countries as the official financing (e.g., the ECB liquidity support, TARGET 2 balances, or direct programme assistance) replaced the private flows which suffered a “sudden stop” (Merler and Pisani-Ferry, 2012). This helped to cushion the impact of the necessary external adjustment, and current account deficits started to shrink only gradually. As a result, the euro area vulnerable countries moved broadly in parallel with the balanced-CA locus in Figure 13, with Portugal even recording, on average, a worsening in its external balance. In contrast, Estonia, which for most of the post-crisis period was still outside of the euro area,7 experienced a sharp correction in private balances, accompanied by only a mild deterioration in public net borrowing. This translated in a significal improvement in its external balance.
The adjustment in macroeconomic imbalances in the vulnerable countries significantly accelerated recently and should progress in the coming years. However, despite the adjustment in current accounts and corrections in housing markets, the outstanding stocks of debt remain high (Figure 14 shows the developments in Spain).
2.3 The prospects for adjustment to imbalances8
While the adjustment of macroeconomic imbalances is ongoing, it is far from complete. The growth performance in countries facing the biggest adjustment challenges will be substantially affected in the years to come. In particular, the large accumulated stocks of debt will require prolonged repair of balance sheets in private and public sectors, constraining both private consumption and investment. Similarly, some of the most affected countries still run non-negligible current account deficits that point to the need for external financing, which is difficult to secure given the distress in financial markets.
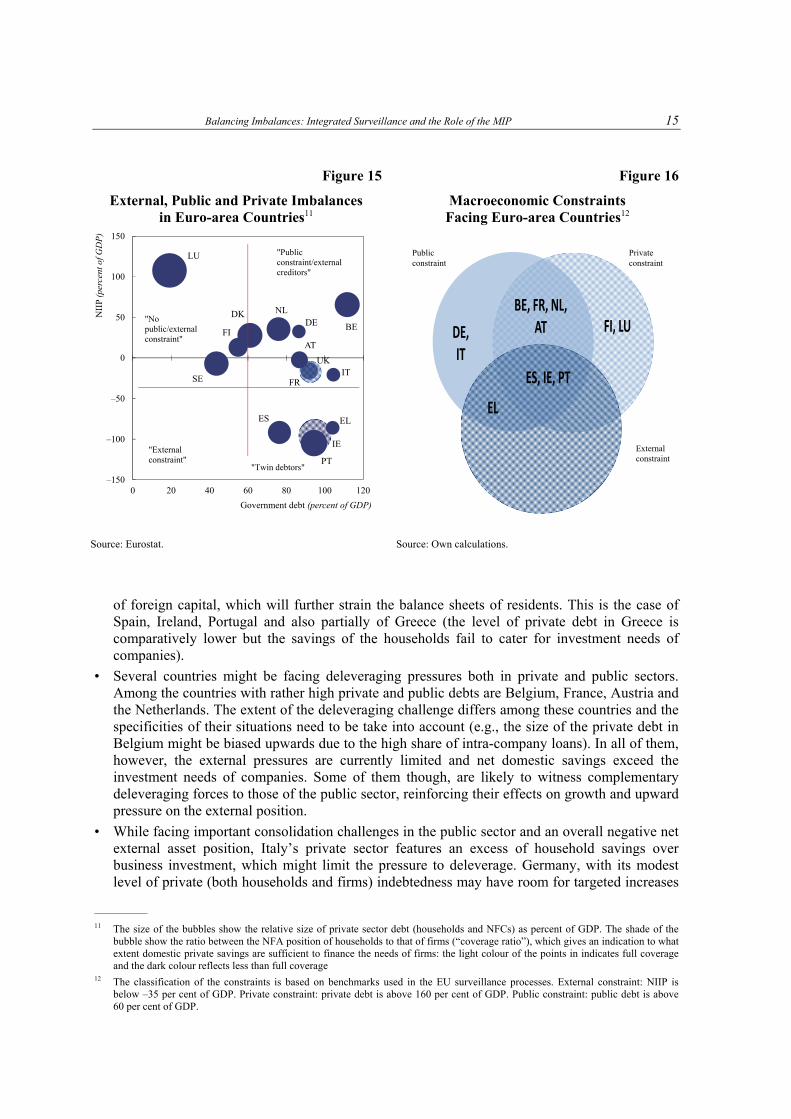
The challenge of the adjustment is arguably the largest when different constraints combine and a country faces imminent deleveraging pressures in the private sector, unsustainable external positions and is lacking fiscal space at the same time. To illustrate this, Figure 15 shows the constraints in different sectors in individual euro area countries. It classifies countries according to the three constraints:
• External constraint: the net international investment position shows the external constraint of the economy as a whole and links the internal position with the economies’ external needs/capacities;
• Fiscal constraint: the gross general government debt embodies the fiscal constraint and indicates the extent of the consolidation needs on the one hand and the ability of a government to compensate for a potential saving-investment gap in the private sector;
————— 7 Estonia joined euro area on 1st January 2011. 8 This section draws on the analysis in Curpo and Hobza (2013).
14 Jonas Fischer and Alexandr Hobza
Figure 13
Saving-investment Balances in Private and Public Sector
(percent of GDP, 2005-07 vs. 2008-11)
Figure 14
Interlinkages Among Imbalances in Spain (current account,
house prices and private sector debt)
BE
EE
DE
IE
EL
ES
FRIT
NLAT
PT
FI
SISK
-18
-16
-14
-12
-10
-8
-6
-4
-2
0
2
4
6
8
10
-18 -16 -14 -12 -10 -8 -6 -4 -2 0 2 4 6 8 10
Gen
eral
go
vern
men
t
Private sector
Average NLB 2005-07
Average NLB 2008-11
CA = 0
Source: Eurostat. Source: Eurostat.
• Private sector constraint: shown by the size of the private sector debt (shown as a relative size
of the bubbles in the figure). In order to qualify the extent of deleveraging pressures in the private sector, the figure also indicates whether the domestic private savings are sufficient to finance the needs of firms. The light colour of a bubble thus shows that the “coverage ratio”, i.e., the ratio between the NFA position of households to that of firms, is higher than one in absolute terms while the dark colour points to less than full coverage.9
The results are also summarised in Figure 16, which applies the indicative benchmarks used in the EU surveillance processes to classify countries according to the constraints they are facing.10
This rather simple look at the interactions among different macroeconomic constraints leads to some broad observations:
• The highest deleveraging pressures are felt in countries which are facing a combination of all three constraints: external, private and public. If, alongside private deleveraging pressures, a country also faces constrained public finances it has very limited means to cushion the short-run negative impact on demand and growth. In particular, financial strain in sovereign debt markets exerts upward pressure on financing costs as well as ability to raise credit in the private sector. The signs of financial fragmentation currently experienced in the euro area are case in point. Moreover, the need to reduce the excessive levels of net foreign liabilities will require outflows
————— 9 NFA of households is typically positive as they are on average net savers, while NFA of companies are on average negative as they
tend to be net investors. 10 It needs to be stressed that this approach is adopted for the sake of simplicity. The size and severity of imbalances a country is
facing needs to be assessed on a bases of a considerably deeper analysis, which takes into account all relevant quantitative and qualitative information.
–12
–10
–8
–6
–4
–2
0
50 70 90 110 130
Cur
rent
Acc
ount
Bal
ance
(pe
rcen
t of G
DP
)
Real House Price Index
Balancing Imbalances: Integrated Surveillance and the Role of the MIP 15
Figure 15
External, Public and Private Imbalances in Euro-area Countries11
Figure 16
Macroeconomic Constraints Facing Euro-area Countries12
ES, IE, PT
Public constraint
BE, FR, NL, AT
Private constraint
External constraint
DE, IT
EL
FI, LU
Source: Eurostat. Source: Own calculations.
of foreign capital, which will further strain the balance sheets of residents. This is the case of
Spain, Ireland, Portugal and also partially of Greece (the level of private debt in Greece is comparatively lower but the savings of the households fail to cater for investment needs of companies).
• Several countries might be facing deleveraging pressures both in private and public sectors. Among the countries with rather high private and public debts are Belgium, France, Austria and the Netherlands. The extent of the deleveraging challenge differs among these countries and the specificities of their situations need to be take into account (e.g., the size of the private debt in Belgium might be biased upwards due to the high share of intra-company loans). In all of them, however, the external pressures are currently limited and net domestic savings exceed the investment needs of companies. Some of them though, are likely to witness complementary deleveraging forces to those of the public sector, reinforcing their effects on growth and upward pressure on the external position.
• While facing important consolidation challenges in the public sector and an overall negative net external asset position, Italy’s private sector features an excess of household savings over business investment, which might limit the pressure to deleverage. Germany, with its modest level of private (both households and firms) indebtedness may have room for targeted increases
————— 11 The size of the bubbles show the relative size of private sector debt (households and NFCs) as percent of GDP. The shade of the
bubble show the ratio between the NFA position of households to that of firms (“coverage ratio”), which gives an indication to what extent domestic private savings are sufficient to finance the needs of firms: the light colour of the points in indicates full coverage and the dark colour reflects less than full coverage
12 The classification of the constraints is based on benchmarks used in the EU surveillance processes. External constraint: NIIP is below –35 per cent of GDP. Private constraint: private debt is above 160 per cent of GDP. Public constraint: public debt is above 60 per cent of GDP.
External constraint
Private constraint
Public constraint
BE
DKDE
IE
ELES
FRIT
NL
AT
PT
FI
SE
UK
LU
–150
–100
–50
0
50
100
150
0 20 40 60 80 100 120
NII
P (p
erce
nt o
f GD
P)
Government debt (percent of GDP)
"Twin debtors"
"Public constraint/externalcreditors"
"External constraint"
"No public/external constraint"

16 Jonas Fischer and Alexandr Hobza
in private sector leverage, compensating the public consolidation effects.
• Finally, Luxembourg and Finland show relatively high levels of private debt and comparatively low net savings. However, more detailed analyses conclude that the deleveraging pressures appear overall limited.13
These observations also document the more benign nature of the external constraint in a monetary union, which, in the absence of the sudden stop risk in the general sense, is essentially a reflection of internal imbalances. Thus, the external constraint always appears in a combination with either strained private or public balance sheets.
To further demonstrate the extent of the deleveraging challenge in the private sector in the group of most vulnerable countries, but also more generally, Figure 17 presents results of two stylised scenarios, which derive the level of credit that would bring the private debt-to-GDP ratio to a certain benchmark.14 The first one shows the average annual levels of credit-to-GDP that would keep the private sector debt-to-GDP ratio constant at the 2011 level and the second one shows the levels of credit that would reduce it by 2020 a threshold of 160 per cent (the indicative benchmark embedded in the MIP scoreboard).
This shows that households and firms in a number of euro area countries will have to go through an austerity period and face considerably lower levels of credit than in the past. Just to keep the private sector debt ratios at the 2011 level and prevent further increases, the inflows of new credit should on average be around half of what euro area countries were experiencing in the last decade. To bring the debt ratios down to the indicative threshold of 160 per cent of GDP, average private sector credit growth would have to be negative over the next decade in overly-indebted countries. This simple exercise cannot be seen as an assessment of deleveraging pressures but it clearly shows the sheer extent of the challenge.15 Such a contraction in credit supply would also have large implications for output growth and would generate further feedback loops on indebtedness and ability to service debt.
Moreover, some of the most affected countries still run non-negligible current account deficits that point to the need for external financing, which is difficult to secure given the distress in financial markets. Figure 18 shows that further improvements in the current accounts are needed in countries such as Greece, Spain or Portugal to bring the external debt on a downward path (in Ireland the actual current account balances of IE and SI are consistent with declining external indebtedness). Achieving external sustainability will require current account surpluses (or at least trade surpluses) for a prolonged period of time. To achieve this, more pronounced relative cost/price adjustment than experienced so far is likely necessary to ensure that the corrections in external imbalances prove to be lasting and not associated with the build-up of persistent internal imbalances such as a high rate of structural unemployment.
————— 13 Cuerpo et al., 2013 14 Such an approach is akin to sustainability assessments of external positions (see, for example, Lee et al., 2008) or public finances
(see European Commission, 2009). The underlying growth and inflation projections are based on the forecasts and long-run ageing projections in European Commission, 2011b and 2011c.
15 Obviously, this analysis is based on a number of simplifying assumptions. The selected benchmarks most likely do not correspond to “equilibrium” levels of indebtedness. Some economies might be capable of sustaining for an extended period of time higher levels of private sector debt than the 160 per cent of GDP benchmark. Moreover, this exercise only considers that deleveraging can take place through nominal growth or repayment of the debt. It does not take into account possible valuation changes, e.g., through price changes of corporate bonds, or outright write-offs. These factors can play a rather significant role, particularly in times of economic distress. In addition, these computations focus on gross debt and indebtedness, including the interest on outstanding debt. Given the high debt levels, servicing costs of debt can be high in many cases, effectively reducing the amount of “fresh” credit flows to the economy. Adverse shocks to financing costs can thus amplify the credit shortages further.

Balancing Imbalances: Integrated Surveillance and the Role of the MIP 17
Figure 17
Private Sector Credit Flows of Euro-area Countries Under Different Deleveraging Scenarios* Source: Eurostat and own calculations. * The countries are sorted in a decreasing order according to the level of private sector debt. The figure shows the average annual levels of private credit-to-GDP ratios in two deleveraging scenarios: (i) keeping private sector debt-to-GDP constant at 2011 levels until 2020 and (ii) bringing the level of debt-to-GDP to 160 per cent by 2020. The computations are based on a simple accumulation equation for private debt, taking into account projections of future real growth and inflation. For some countries, the past average credit flows are computed for a shorter period than 2000-2010 due to data limitations.
2.4 Summary
This section has shown how numerous macroeconomic imbal-ances accumulated in many euro area countries in the run-up to the Great Recession. Alongside to country-specific shocks and different policy paths, they were partially a result of differentiated reactions of individual economies to euro area-wide shocks (both related to the euro introduction and external ones) and inappropriate policy responses, including the lack of macro-prudential supervision in financial markets.
Figure 18
IIP Stabilizing Current Account Balances Based on Long-term Projections Until 2022
(percent of GDP)
Source: European Commission.
–15
–10
–5
0
5
10
15
20
25
IE LU PT BE ES NL FI AT FR DE IT
Credit 2000-2010 Debt-stabilizing credit Credit stabilising debt at 160% of GDP
–10
–8
–6
–4
–2
0
2
4
EL IE ES IT PT
CA 2012f IIP-stab. CA until 2022 halving dist. to -35% IIP

18 Jonas Fischer and Alexandr Hobza
When looking at developments of imbalances within the euro area before the onset of the financial crisis, it is important to distinguish between two periods.16 The initial period, following the establishment of the monetary union, was characterised by probably relatively sound financial flows spurred by the introduction of the euro which supported the catching up dynamics in the peripheral economies.17 However, the later period, starting sometimes in the second half of 2000s, witnessed extraordinary financial flows that helped fuel credit booms and assets bubbles in some euro area countries. It is in this period that current account positions of euro area countries began to diverge at a fast pace. The cross-border debt-financed credit expansions led to significant shifts in sectorial structures of the peripheral economies favouring non-tradable sectors, most notably construction, which are now costly to revert.
Despite important progress, many euro area countries are facing a formidable adjustment challenge. It is the largest in countries which are facing the tightening in all three constraints: the external, the private and the public. Countries with such “triple” debts are, in particular, Portugal, Ireland, Greece and Spain. Other countries are facing the “double” constrains stemming from the strained public finances and deleveraging pressures in the private sector. These countries such as the Netherlands are likely to witness complementary deleveraging forces to those of the public sector, reinforcing their effects on growth and upward pressure on the external position. Finally, countries like Germany, with a modest level of private (both households and firms) indebtedness may have room for targeted increases in private sector leverage, compensating the public consolidation effects.
3 The Macroeconomic Imbalances Procedure: context and set-up
The crises has been met by various policy responses both at EU and national level. As regards the policy responses coordinated at EU level, in the early stages of the crises, the focus invariably was more of a crisis management nature. Action started to be taken to stabilize the financial system and its institutions. Policy reactions included an expansionary monetary stance and initially also a coordinated expansionary fiscal policy response in the context of the European Economic Recovery Plan (EERP) that was running between 2009-10.18 Over time, the focus of policy action shifted towards measures to address the long-run consequences of the crisis on growth and fiscal sustainability and also policies to prevent future reoccurrences. The rationale behind the overall approach was the need to address a triplet of mutually intertwined objectives, namely: (i) to successfully accomplish the financial repair and fix the regulatory weaknesses in the financial system; (ii) to proceed with fiscal consolidation and put the strained public finances back on sustainable paths; and (iii) to boost growth and competitiveness in the EU in order to alleviate the necessary adjustment and limit the long-run costs of the recession.
The crises also pointed to the need for improved economic surveillance structures of Member States economies as well as for improved EU economic governance structures as indispensable for addressing the root problems at the origins of the crisis. The “six-pack” was a key response in this context. To this can be added the recent “two-pack” which aim to further strengthen surveillance mechanisms for euro area Member States, including budgetary surveillance and stronger monitoring of countries with financial stability issues or countries requiring financial assistance.19 As regards the rationale for having a new and separate procedure for the surveillance
————— 16 Lane and Pels (2012). 17 Blanchard and Giavazzi (2002). 18 See Fischer and Justo (2011) for an overview of the EERP. 19 On 23 November 2011 the Commission presented proposals for two new regulations adding to the “six-pack”. Political agreement
has been achieved and they should enter into force before the summer of 2013. The first regulation proposes new monitoring (continues)
Balancing Imbalances: Integrated Surveillance and the Role of the MIP 19
of imbalances, it had become evident from the economic developments described in Section 2 that the economic surveillance at the EU level needed to be further extended as regards macroeconomic imbalances, indebtedness and competitiveness issues, in particular within the euro area. It also became clear that fiscal surveillance had to be deepened, mainly by strengthening domestic fiscal frameworks and ensuring increased focus on public debt.
Finally, a better integration of surveillance across different policy areas also appeared warranted together with better integration into the national policy planning cycle. Previously, discussions between the EU and Member States on economic priorities and structural reforms were taking place through different processes. Reports were issued separately and decisions were spread across the year with less positive synergies and interlinkages than would be ideal. This is why also an “European Semester”20 was set up in 2011 to integrate and coordinate ex-ante budgetary and economic policies, in line with the Stability and Growth Pact and the Europe 2020 strategy as well as the MIP in 2012.
3.1 The MIP: the procedure step by step
The overall design of the Macroeconomic Imbalance Procedure follows the implicit logic of the Stability and Growth Pact, with a “preventive” arm and a stronger “corrective” arm for more serious cases. For euro-area countries, the corrective arm is supplemented by an enforcement mechanism including the possibility of financial sanctions.21 To detect macroeconomic imbalances, the procedure relies on a two-step approach (see Figure 19). The first step consists of an alert mechanism aiming to identify Member States where there are signs of a potentially building up boom-bust cycle or in which the adjustment to busts require more in-depth examination. In the second step, for the identified Member States, the in-depth reviews assess whether there are imbalances and, if so, their nature and extent.
3.1.1 Step 1: the Alert Mechanism
As said above, the aim of the alert mechanism is to identify countries and issues for which more in-depth analysis is required. The conclusions of the AMR are discussed in the Council and the Eurogroup to enable the Commission to obtain feedback from Member States. The Commission then decides on the final list of countries for which it will prepare country-specific in-depth reviews.
More specifically, the alert mechanism consists of an indicator-based scoreboard complemented by an economic reading thereof presented in an annual Alert Mechanism Report (AMR). It should be stressed that the scoreboard is just one component of the alert mechanism, and additional relevant indicators, economic circumstances and country-specific situations are taken into account. The economic reading of the scoreboard indicators implies that there is no automaticity involved (i.e., a “flash” for an indicator does not lead to an automatic conclusion that there is an imbalance) and that any other relevant information can also be taken into account (which is explicitly said in the regulation).
requirements include the introduction of a common budgetary timeline and common budgetary rules. The second Regulation propose stronger monitoring and surveillance procedures for Member States experiencing severe difficulties with regard to their financial stability or for those in receipt of financial assistance.
20 The annual economic policy surveillance cycle, based on the European Semester under the Europe 2020 strategy, contains the following central elements: (i) a comprehensive Commission report (Annual Growth Survey); (ii) the alignment of SCPs and NRPs; (iii) the possibility of country-surveillance missions; and (iv) the issuance of recommendations and early warnings.
21 The Macroeconomic Imbalance Procedure rests on two pieces of legislation. The first Regulation (EU 1176/2011) sets out the details of the new surveillance procedure and covers all the Member States. The second Regulation (EU 1174/2011) establishes the enforcement mechanism, including the potential use of sanctions, and only applies to the euro-area Member States.

20 Jonas Fischer and Alexandr Hobza
Figure 19
The Steps of the Preventive Arm of the MIP
The choice of indicators in the scoreboard focuses on the most relevant dimensions of
macroeconomic imbalances and competitiveness losses, with a particular focus on the smooth functioning of the euro area. For this reason, the scoreboard consists of indicators which can monitor external balances, competitiveness positions and internal imbalances, and encompass variables where both the economic literature and recent experiences suggest associations with economic crises. The scoreboard also has an important communication role, which is why the scoreboard consists only of a limited number of indicators. Moreover, the choice of indicators and transformations has been kept as simple and straightforward as possible. Given that the scoreboard (indicators and thresholds) need to provide signal of potentially harmful imbalances and competitiveness losses at an early stage, a combination of stock and flow indicators which can capture both shorter-term rapid deteriorations as well as the longer term gradual accumulation of imbalances have been chosen. Moreover, indicative thresholds have been at a level which aim to on the one hand avoid excessive numbers of “false alarms” but which on the other hand are not set so stringently that they only identify problems once they are entrenched. Further information on the scoreboard and the indicators are presented in Box 1.
BOX 1 THE DESIGN OF THE MIP SCOREBOARD
The indicators included in the scoreboard cover the most relevant areas of imbalances that are under the scope of the MIP. In line with the different challenges faced by the EU/euro-area countries, it comprises indicators of external positions and indicators of internal imbalances (see below). The scoreboard thus encompasses variables that both the economic literature and recent experience establish as being linked to economic crises. For the sake of transparency and easy communication, the scoreboard contains a limited number of simple indicators of high statistical quality. It combines stock and flow indicators that can

Balancing Imbalances: Integrated Surveillance and the Role of the MIP 21
capture both shorter-term rapid deteriorations and the longer-term gradual accumulation of imbalances.
To facilitate the use of the scoreboard, indicative thresholds have been set for each indicator. These thresholds are mostly based on a simple statistical approach and are set at lower and/or upper quartiles of the historical distributions of the indicator values. These statistically determined thresholds are broadly in line with the findings of economic literature on the early-warning properties of different indicators in terms of predicting economic and financial crises. The breach of the indicative thresholds does not automatically trigger an ‘alarm’ in the form of a requirement for an in-depth review, though. Only the comprehensive economic reading of the result of the scoreboard, which takes into account additional information, indicates a need for further analysis. The scoreboard takes into account the euro-area dimension and differentiates between euro-area and non-euro area Member States where appropriate (REER and ULC).
In view of the need to adjust to evolving macroeconomic conditions, the composition of the scoreboard is flexible. The design of the scoreboard could change over time to take into account improvements in data availability or enhancements in the underlying analysis and, even more importantly, new sources of potentially harmful macroeconomic imbalances that might develop in the future. Recognising the critical importance of taking due account of country-specific circumstances and institutions, the economic reading of the scoreboard is complemented by additional information and indicators.
The eleven indicators of the alert mechanism scoreboard are:22
1) three-year backward moving average of the current account balance in per cent of GDP, with a threshold of +6 per cent and –4 per cent;
2) net international investment position in per cent of GDP, with a threshold of -35 per cent;
3) five-year percentage change of export market shares measured in values, with a threshold of –6 per cent;
4) three-year percentage change in nominal unit labour cost (ULC), with thresholds of +9 per cent for euro-area countries and +12 per cent for non-euro area countries respectively;
5) three-year percentage change of the real effective exchange rates (REERs) based on HICP/CPI deflators, relative to 35 other industrial countries, with thresholds of –/+5 per cent for euro-area countries and –/+11 per cent for non-euro area countries respectively;
6) private sector debt in per cent of GDP, with a threshold of 160 per cent;
7) private sector credit flow in per cent of GDP, with a threshold of 15 per cent;
8) year-on-year changes in the house price index relative to a Eurostat consumption deflator, with a threshold of 6 per cent;
9) general government sector debt in per cent of GDP, with a threshold of 60 per cent;
10) three-year backward moving average of the unemployment rate, with a threshold of 10 per cent;
11) annual growth rate of total financial sector liabilities, with a threshold of 16.5 per cent.

22 Jonas Fischer and Alexandr Hobza
Opening of excessive imbalances procedure
Sufficient CAP (1)
Insufficient CAP
Sufficient action:EIP in Abeyance (2)
Insufficient action:Decision on non-compliance by RMQV
Sufficient CAP (see 1)
Insufficient CAP
End of imbalances:EIP is abrogated
Decision on interest-bearing deposit by RQMV
Decision on fine by RQMV
Sufficient action:EIP in Abeyance(see 2)
Insufficient action:
Adopt second decision on non-compliance by RMQV
Decision to convert interest-bearing deposit into fine by RQMV
Figure 20
Synthetic Overview of the Corrective Arm
3.1.2 Step 2: In-depth reviews and follow up
It is only on the basis of the in-depth reviews that an imbalance is identified and policy guidance may be issued to Member States. The reviews imply a thorough analysis of the macroeconomic imbalances, in particularly as regards their nature and extent, taking into account the economic and structural specificities of the Member State considered. If, on the basis of this analysis, the Commission considers the situation unproblematic it will conclude that no further steps are needed. If, however, the Commission considers that macroeconomic imbalances exist, it may come forward with proposals for policy recommendations for the Member State(s) concerned. In the preventive arm, these will be part of the integrated package of recommendations under the European Semester. This is particularly important since policy remedies to address imbalances cover to a very large extent policies (e.g., labour market, product market and fiscal policies) that may also be subject to other surveillance processes. If the Commission instead considers that there are severe imbalances, it may recommend that the Council open an excessive imbalance procedure, which constitutes the corrective arm of the new procedure.
3.2 The corrective arm and effective enforcement
Figure 20 provides a synthetic overview of the corrective arm including the enforcement dimension which applies only for euro area Member States. While in principle decisions are taken in the Council by qualified majority voting, the shaded boxes in the figure indicate Council decisions that are taken by reverse qualified majority voting (RQMV). In case of RQMV, a novelty for many of the key enforcement decisions across the six-pack, a Council decision on a 22 For a detailed discussion per indicator, see European Commission (2012), ‘Scoreboard for the surveillance of macroeconomic
imbalances’, European Economy, Occasional Paper No 92 (February).
Balancing Imbalances: Integrated Surveillance and the Role of the MIP 23
Commission recommendation is deemed to be adopted by the Council unless it decides, by qualified majority, to reject the recommendation within then days of the Commission adopting it. The aim of this voting rule is to increase the automaticity of the decision-making process.
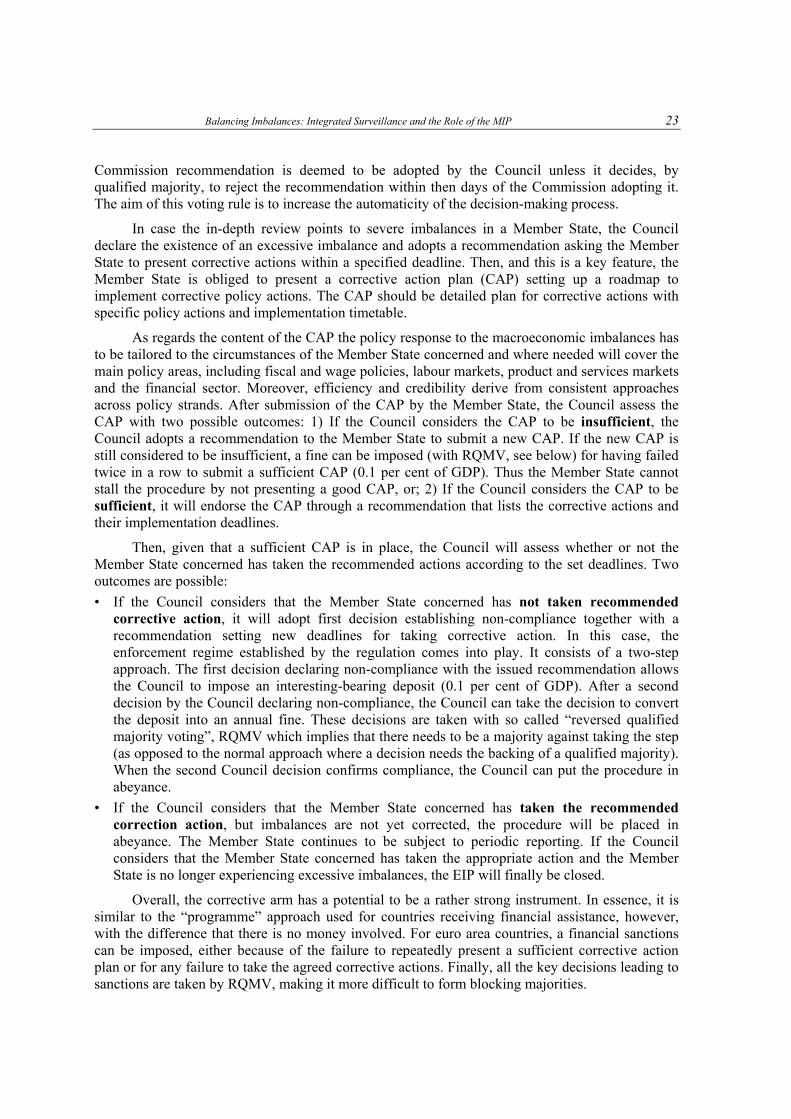
In case the in-depth review points to severe imbalances in a Member State, the Council declare the existence of an excessive imbalance and adopts a recommendation asking the Member State to present corrective actions within a specified deadline. Then, and this is a key feature, the Member State is obliged to present a corrective action plan (CAP) setting up a roadmap to implement corrective policy actions. The CAP should be detailed plan for corrective actions with specific policy actions and implementation timetable.
As regards the content of the CAP the policy response to the macroeconomic imbalances has to be tailored to the circumstances of the Member State concerned and where needed will cover the main policy areas, including fiscal and wage policies, labour markets, product and services markets and the financial sector. Moreover, efficiency and credibility derive from consistent approaches across policy strands. After submission of the CAP by the Member State, the Council assess the CAP with two possible outcomes: 1) If the Council considers the CAP to be insufficient, the Council adopts a recommendation to the Member State to submit a new CAP. If the new CAP is still considered to be insufficient, a fine can be imposed (with RQMV, see below) for having failed twice in a row to submit a sufficient CAP (0.1 per cent of GDP). Thus the Member State cannot stall the procedure by not presenting a good CAP, or; 2) If the Council considers the CAP to be sufficient, it will endorse the CAP through a recommendation that lists the corrective actions and their implementation deadlines.
Then, given that a sufficient CAP is in place, the Council will assess whether or not the Member State concerned has taken the recommended actions according to the set deadlines. Two outcomes are possible:
• If the Council considers that the Member State concerned has not taken recommended corrective action, it will adopt first decision establishing non-compliance together with a recommendation setting new deadlines for taking corrective action. In this case, the enforcement regime established by the regulation comes into play. It consists of a two-step approach. The first decision declaring non-compliance with the issued recommendation allows the Council to impose an interesting-bearing deposit (0.1 per cent of GDP). After a second decision by the Council declaring non-compliance, the Council can take the decision to convert the deposit into an annual fine. These decisions are taken with so called “reversed qualified majority voting”, RQMV which implies that there needs to be a majority against taking the step (as opposed to the normal approach where a decision needs the backing of a qualified majority). When the second Council decision confirms compliance, the Council can put the procedure in abeyance.
• If the Council considers that the Member State concerned has taken the recommended correction action, but imbalances are not yet corrected, the procedure will be placed in abeyance. The Member State continues to be subject to periodic reporting. If the Council considers that the Member State concerned has taken the appropriate action and the Member State is no longer experiencing excessive imbalances, the EIP will finally be closed.
Overall, the corrective arm has a potential to be a rather strong instrument. In essence, it is similar to the “programme” approach used for countries receiving financial assistance, however, with the difference that there is no money involved. For euro area countries, a financial sanctions can be imposed, either because of the failure to repeatedly present a sufficient corrective action plan or for any failure to take the agreed corrective actions. Finally, all the key decisions leading to sanctions are taken by RQMV, making it more difficult to form blocking majorities.

24 Jonas Fischer and Alexandr Hobza
4 External and internal constraints: their reflection in EU policy recommendations
The overarching objective of the MIP is to broaden the economic surveillance to cover also external and internal imbalances and complement thus the process of fiscal surveillance. This section, therefore, focuses on the policy advice in response to the emergence of macroeconomic imbalances. To this end, it starts by giving an overview of the first year of application of the MIP in 2012. It contrasts this with policy recommendations addressed to Member States in the context of the economic policy coordination processes since 2000, which were relevant from the point of view of macroeconomic imbalances. In particular, it analyses what different issues and when were de facto captured and how this corresponds to the trends in the build-up of imbalances discussed in Section 2. Finally, this discussion is completed by a simple backward-looking exercise, which examines the performance of the MIP scoreboard in identifying the build-up of imbalances in the course of 2000s in different areas and countries. Overall this allows to make some broad observations on how the EU policy advice has matched the constraints described in Section 2 and how the application of MIP can enhance this.
4.1 The application of the MIP: the outcome of the first and second rounds
The first Alert Mechanism Report was published in February 2012. It identified 12 Member States as warranting in-depth reviews on different aspects related to risks of imbalances.23 Seven of them were euro-area members: Belgium, Spain, France, Italy, Cyprus, Slovenia and Finland. The remaining five were Bulgaria, Hungary, Denmark, Sweden and the UK. This was a rather large number of countries, which reflected the fact that this was the first application of the MIP. Given the economic circumstance in which the MIP was launched, it had to cater also for the adjustment to previously accumulated imbalances and not only the prevention of newly emerging imbalances.
The issues for which these countries were selected mirrored the broad scope of the procedure as reflected in the scoreboard:
• External sustainability. In a few of the countries, the external position remained vulnerable due to large negative net international investment positions (NIIP) despite rapid adjustments in the current account (Hungary, Bulgaria, Spain). A key mitigating factor in this reading was the role of Foreign Direct Investment (FDI) in catching up economies.
• Export performance and competitiveness. For several countries, the focus was on a weak export performance (Italy, Belgium, France, Finland) visible both in large losses of global export market shares as well as a trend wise deteriorating current account positions (even though external sustainability as such was not an immediate issue). Clearly, several euro-area countries lost export market shares well beyond what would be explained by the rapidly increasing competition from emerging economies. The drivers behind this were in some cases the losses in cost competitiveness (for example Belgium), both due to high wage increases but even more low productivity growth, while in other cases issues linked to non-cost competitiveness issues dominated (for example France).
• Private sector indebtedness. Potential risk from high levels of overall indebtedness was pointed to for a number countries (for example Belgium, Denmark, Spain, Cyprus, Sweden, UK). While excessive credit flows were rapidly adjusting, many Member States were left with high levels of private sector indebtedness and are in a likely prolonged process of deleveraging and adjustment of sectorial balance sheets. In a number of cases, the deleveraging challenge for households and/or businesses is compounded by the high levels of public debt. It was
————— 23 The four programme countries (Greece, Portugal, Ireland and Romania) were not covered in the assessment as they are already
under an enhanced programme-based surveillance regime.

Balancing Imbalances: Integrated Surveillance and the Role of the MIP 25
highlighted that the impact of deleveraging in the private sector could be magnified by the fiscal pressures. It was also pointed out that elevated amounts of debt in the hands of non-residents can prove to be an additional concern in a context of high uncertainty in international financial markets.
• Housing and asset markets. Linked to the continuous build-up of indebtedness in the private sector, several countries displayed developments in asset markets, in particular housing, that warranted further analysis (for example Spain, Cyprus, Finland, Denmark, Sweden, UK). It is clear that countries were in different position in the adjustment phase. For example, while in Sweden and Finland house prices were still moving upwards in other cases the question was whether the adjustments that had already taken place was sufficient or if more was to come (Spain). Nevertheless, the combination of very high increases in house prices together with a rapid build-up of household debt was a specific concern.
Clearly, there were large differences across these countries, both in terms of scope of the problems and the severity of the risks involved. Some countries were seen to be in needed of correcting internal and external imbalances accumulated in the past (e.g., Spain, Cyprus, Hungary, Italy, Belgium, UK), while others showed an overall good performance but still had to deal with issues concentrated in specific parts of the economy (for example Sweden and Denmark).
Against this background, the first generation of In-depth Reviews were published on 29 May 2012, together with the rest of the 2012 European semester package. The analysis in the IDRs broadly confirmed and nuanced the risks for the twelve selected countries. In all 12 cases an imbalance under the preventive arm of the MIP was established. Table 2 gives a summary of what were the key features of the identified imbalances, corresponding very much to what were the main reasons for their selection for an IDR. There was some differentiation made in terms of the urgency/severity of the imbalance. For Spain and Cyprus the imbalance was seen as “very serious”, for Hungary, Slovenia, France and Italy as “serious” and for the others no qualification was made. However, it should be emphasised that from a legal perspective these distinctions play no role: they are all imbalances under the preventive arm.
Overall, this outcome corresponds well with the constraints for euro area countries as described in Section 2.3. For example, Spain and Cyprus face constraints simultaneously from the external, private and public side. In France, Italy and Belgium, the high public debt adds to restrictions from private sector indebtedness in a context of weakening external performance. Arguably, Finland faces the “softest” constraints where the issue of the weak export performance is closely related to a broad growth challenge, even though the current account position has deteriorated remarkably in recent years.
Because these imbalances fall under the preventive arm, the follow-up in terms of policy recommendations was integrated in the package of country-specific recommendations issued under the European semester, covering also the BEPGs, the employment guidelines as well as the Stability and Growth Pact. There were thus no individual “MIP” recommendations. Policies that were considered as valid policy responses to imbalances were earmarked as such but with no further distinction or consequence. While some of the issues covered by the MIP were relatively new to be in focus, the valid responses, as noted above, coincide with what is required for sustainable growth and jobs as well as sustainable public finances. For example, to address a weak export performance, higher productivity growth and wage growth in line with productivity are both relevant. However, these are the same policies that are necessary to support potential growth and stable inflation. Having said this, some more focus on policies to address cost and non-cost competitiveness issues as well as housing/indebtedness can arguably be a direct result from the introduction of the MIP.

26 Jonas Fischer and Alexandr Hobza
Table 2
Key Features of the Identified Imbalances Under the Preventive Arm in 2012-13
Belgium external competitiveness of goods and indebtedness, especially the high level of public debt
Bulgaria level of external indebtedness as well as certain macroeconomic developments related to corporate sector deleveraging and the labour market adjustment process
Denmark external competitiveness and potential risks related to household indebtedness
Spain significant level of private sector debt, the large negative external debt position and the financial sector, which were influenced by housing market developments
France export performance and competitiveness
Italy high public indebtedness, export performance, external competitiveness
Cyprus current account, public finances and the financial sector
Hungary negative size of the net international investment position and public debt
Slovenia corporate sector deleveraging and banking stability and unfavourable developments in external competitiveness
Finland external competitiveness
Sweden regarding private sector debt and the housing market
UK household debt and the housing market deserve attention, unfavourable developments in external competitiveness
On 28 November 2012, the Commission published the second AMR in which fourteen
Member States were selected for an IDR in 2013. This was the twelve Member States for which an imbalance was identified earlier in the year, plus the Netherlands (mainly due to high private sector indebtedness and housing) and Malta (mainly with reference to the very large banking sector). The second generation of IDRs were published on 10 April 2013.24 In all cases imbalances were identified, except for Spain and Slovenia where excessive imbalances were found. Nevertheless, the corrective arm was not initiated25 and the follow up in terms of recommendations was made under the preventive arm in the May European semester package.
————— 24 In the AMR Cyprus was selected for an IDR but in the meantime Cyprus entered a programme and accordingly no IDR was in th
end necessary. 25 At the time the Commission decided to judge the policy commitments made by Spain and Slovenia in the context of their National
Reform Programmes, before deciding whether to launch the corrective arm or not. As the policy plans were deemed sufficient it was decided not to start the corrective arm but to instead monitor implementation with higher scrutiny. As the excessive imbalance has been identified the option to apply the corrective arm still remains.
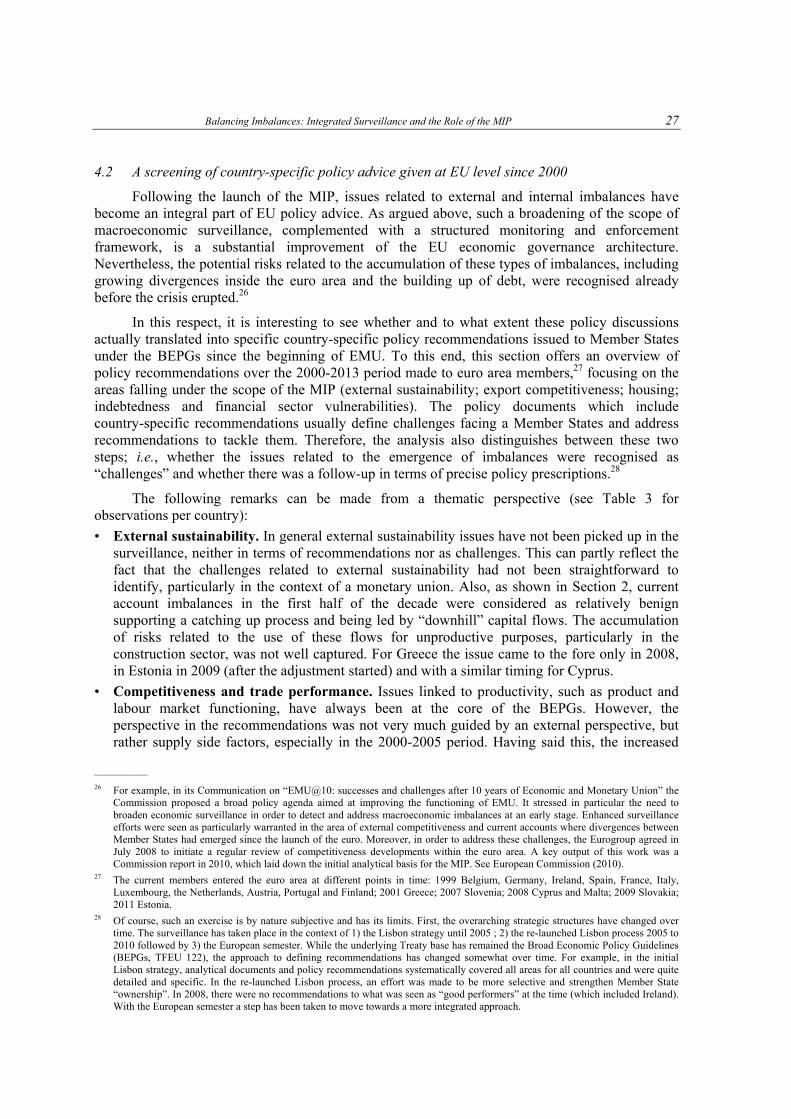
Balancing Imbalances: Integrated Surveillance and the Role of the MIP 27
4.2 A screening of country-specific policy advice given at EU level since 2000
Following the launch of the MIP, issues related to external and internal imbalances have become an integral part of EU policy advice. As argued above, such a broadening of the scope of macroeconomic surveillance, complemented with a structured monitoring and enforcement framework, is a substantial improvement of the EU economic governance architecture. Nevertheless, the potential risks related to the accumulation of these types of imbalances, including growing divergences inside the euro area and the building up of debt, were recognised already before the crisis erupted.26
In this respect, it is interesting to see whether and to what extent these policy discussions actually translated into specific country-specific policy recommendations issued to Member States under the BEPGs since the beginning of EMU. To this end, this section offers an overview of policy recommendations over the 2000-2013 period made to euro area members,27 focusing on the areas falling under the scope of the MIP (external sustainability; export competitiveness; housing; indebtedness and financial sector vulnerabilities). The policy documents which include country-specific recommendations usually define challenges facing a Member States and address recommendations to tackle them. Therefore, the analysis also distinguishes between these two steps; i.e., whether the issues related to the emergence of imbalances were recognised as “challenges” and whether there was a follow-up in terms of precise policy prescriptions.28
The following remarks can be made from a thematic perspective (see Table 3 for observations per country):
• External sustainability. In general external sustainability issues have not been picked up in the surveillance, neither in terms of recommendations nor as challenges. This can partly reflect the fact that the challenges related to external sustainability had not been straightforward to identify, particularly in the context of a monetary union. Also, as shown in Section 2, current account imbalances in the first half of the decade were considered as relatively benign supporting a catching up process and being led by “downhill” capital flows. The accumulation of risks related to the use of these flows for unproductive purposes, particularly in the construction sector, was not well captured. For Greece the issue came to the fore only in 2008, in Estonia in 2009 (after the adjustment started) and with a similar timing for Cyprus.
• Competitiveness and trade performance. Issues linked to productivity, such as product and labour market functioning, have always been at the core of the BEPGs. However, the perspective in the recommendations was not very much guided by an external perspective, but rather supply side factors, especially in the 2000-2005 period. Having said this, the increased
————— 26 For example, in its Communication on “EMU@10: successes and challenges after 10 years of Economic and Monetary Union” the
Commission proposed a broad policy agenda aimed at improving the functioning of EMU. It stressed in particular the need to broaden economic surveillance in order to detect and address macroeconomic imbalances at an early stage. Enhanced surveillance efforts were seen as particularly warranted in the area of external competitiveness and current accounts where divergences between Member States had emerged since the launch of the euro. Moreover, in order to address these challenges, the Eurogroup agreed in July 2008 to initiate a regular review of competitiveness developments within the euro area. A key output of this work was a Commission report in 2010, which laid down the initial analytical basis for the MIP. See European Commission (2010).
27 The current members entered the euro area at different points in time: 1999 Belgium, Germany, Ireland, Spain, France, Italy, Luxembourg, the Netherlands, Austria, Portugal and Finland; 2001 Greece; 2007 Slovenia; 2008 Cyprus and Malta; 2009 Slovakia; 2011 Estonia.
28 Of course, such an exercise is by nature subjective and has its limits. First, the overarching strategic structures have changed over time. The surveillance has taken place in the context of 1) the Lisbon strategy until 2005 ; 2) the re-launched Lisbon process 2005 to 2010 followed by 3) the European semester. While the underlying Treaty base has remained the Broad Economic Policy Guidelines (BEPGs, TFEU 122), the approach to defining recommendations has changed somewhat over time. For example, in the initial Lisbon strategy, analytical documents and policy recommendations systematically covered all areas for all countries and were quite detailed and specific. In the re-launched Lisbon process, an effort was made to be more selective and strengthen Member State “ownership”. In 2008, there were no recommendations to what was seen as “good performers” at the time (which included Ireland). With the European semester a step has been taken to move towards a more integrated approach.

28 Jonas Fischer and Alexandr Hobza
Table 3
CSRs 2000-2012: Broad Observations for Non-fiscal Real Economy Imbalances
BE Cost competitiveness from 2009 but with more focus in 2011-12. Else up to 2008 mainly supply side issues related to labour and product market functioning/competition. Private sector indebtedness only mentioned in 2012. Banking sector issues from 2011.
DE Competitiveness was an issue in 2000-01, then on only labour market and supply side issues. Opening up of services disappeared over 2004-06 period, then back with more focus. Cost competitiveness issues with a view to safeguard competitiveness. Banking sector from 2011.
EE 2004-
External position recognised as challenge in 2004 but not in focus in the years after. Housing and/or indebtedness issues not picked up (not even in 2007-08). From 2009 more focus on competitiveness as a reaction to adjustment. In general labour and product market functioning is focus.
IE
Housing first mentioned in 2007 as an issue to watch but no policy recommendation (either in 2008). In 2009, housing, competitiveness and banking sector vulnerabilities recognised as challenges, however recommendations on fiscal and potential growth issues. Worries of overheating in 2000-01, loss of competitiveness in 2003-05.
EL Before programme, overall focus on public finances and unemployment and product market inefficiencies. External competitiveness, including cost factors, or the deteriorating current account positions not covered (expect as a “one-off “ in 2008).
ES External sustainability issues only raised from 2008 and then with more focus in later years. Risks from developments in housing markets not raised until 2007-08 as potential risks. In the years before almost only focus on labour and product market functioning issues from a supply side perspective.
FR Competitiveness in focus from 2011 in context of weakening external performance, including both business profitability and cost aspects. Before focus mainly on labour market functioning and competition in selected sectors.
IT Competitiveness in context of weak export performance only from 2011. Before similar polices but from a domestic growth perspective with focus labour and product market functioning. Key macro issue of course fiscal.
CY 2004-
Challenges of external constraint, financial sector, housing, indebtedness only picked up with focus from 2011 (CA deficit features in 2009 but not before). Emphasis of policy advice in years before was on supporting skills and supporting diversification from tourism.
LU Some focus on cost competitiveness issues as from 2009, before mainly focus on labour supply. The role of large financial sector not covered.
MT 2004-
Some focus on wage cost competitiveness from 2009, but mainly from inflationary perspective. Banking sector first covered in 2012. The housing boom and build-up of private sector debt not covered, same is true for large external deficits.
NL
Housing only in focus from 2012, although mentioned also in 2011, but nothing in the years before. Risks of private sector indebtedness mentioned in 2007 but not in other years (except 2012). Cost competitiveness and wage inflation issues in 2006-2007. Else, overall focus on labour supply and productivity.
AT Focus in all years on labour supply, R&D and sectorial competition. Financial sector issues from 2009 but only with policy recommendations in 2012.
PT In the immediate years before programme started (2011), the weak external position was acknowledged as a risk but not in recommendations(beyond fiscal, on education and flexicurity). Cost competitiveness an issue 2003-05 but not in other years.
SI 2006-
Issues linked to banking sector from 2011. Cost competiveness from 2009 although in recommendation only 2012. Else, beyond fiscal labour and product market issues.
SK 2004-
In all years focus on labour and product market issues, including R&D. Only fiscal on macro side.
FI Issue of deteriorating current account position and weak external performance not in focus until 2012. Housing not mentioned before. Wage developments not in focus in 2009-11 despite large increases in ULC. Earlier years focus on competition in certain sectors and some labour market aspects.
EURO AREA 2003-
Some focus on risk of divergences in 2003, but then less in coming years until 2009. In-between focus on flexibility in labour markets and productivity. From 2009, more focus on divergences, financial stability and competitiveness.

Balancing Imbalances: Integrated Surveillance and the Role of the MIP 29
flexibility and ability to cushion idiosyncratic shocks have been at the core of the policy discourse from the very beginning of the euro area’s existence.
• Private sector indebtedness. Issues linked to the build-up of debt outside the government sector had generally not been picked up until the introduction of the MIP in 2012.
• Housing and asset markets. Similar to the issue of private sector indebtedness, issues linked to housing had not been on the radar screen. For example, it was not mentioned for Ireland until 2007 and similarly for Spain.
• Financial sector stability. Again an issue may not have been treated as being inside the scope of BEPGs until the last couple of years in the context of the crisis. However, it is interesting to note that in 2000-2001 the recommendations also included special sections on capital markets. Even if these were mainly focused on the provision of capital for investments (venture capital etc.), there was also mentioning of issues such as bankruptcy laws, banking supervision, etc.
• Euro area recommendations. Guidelines or recommendations for the euro area as a whole have been in place since 2003. Overall issues linked to increasing divergences inside the euro area, financial stability and competitiveness did not come in focus until 2009.
Overall, there has been a remarkable stability as regards the content of the recommendations. This is not surprising as structural issues are indeed medium- to long-term challenges that take time to address. For example, the horizontal BEPGs were used as a strategic tool and, starting from 2003, covered three-year periods, within the context of which the annual country specific policy advice was provided. Second, it is interesting to notice the clear focus on supply-side issues and inflation risks in the first half of 2000s. Only with the arrival of the crisis did descriptions of macro challenges gradually start to take into account issues such as the diverging current accounts and competitiveness. Third, and linked to this point, even if the new challenges have been increasingly recognised in later years there may have been some inertia for this to be reflected in the precise policy recommendations. Fourth, the overall strategic frameworks within which the surveillance is carried out (Lisbon I, II, Europe 2020) does matter for where the focus lies. For example, when the special sections on capital markets were abandoned in 2003, these issues arguably received somewhat less attention in the recommendations.
4.3 The Alert Mechanism Scoreboard: how it would have fared
All in all, it indeed appears that the gradual accumulation of macroeconomic imbalances before the onset of the crisis was not adequately identified and reflected in the EU policy advice. A dedicated surveillance procedure, therefore, can help fill in this gap. While the focus of the MIP is clearly forward-looking, aiming to prevent the emergence of the macroeconomic imbalances in the future, it is interesting to examine how it would have fared had it been in place already back in 2000s. To do this, we examine what signals the scoreboard would have given. A simple inspection of the scoreboard shows when and how key problems started to be clearly signalled.29
There are obviously many caveats that must be taken into account in such an exercise. The most important caveat is of course that the scoreboard has been designed on the basis of the lessons of the crises with a view to preventively capture the build-up of imbalances. Thus it can almost by definition be expected that the scoreboard should be doing well looking back. Moreover, even if a version of the MIP had been in place in 2000 it may be argued that it would have focussed on different issues. However, this may not be entirely sure. In 2000, there had indeed been not too distant experiences reminding very much of the crisis to come. For example, the Scandinavian
————— 29 The scoreboard tables are available as from 2001 in the statistical annex of the AMR-2013.

30 Jonas Fischer and Alexandr Hobza
banking crises in the early 1990’s included as ingredients property bubbles, unsustainable levels of mortgage debts as well as large losses of competitiveness and large current account deficits. Having this in mind it is not impossible that an early MIP would have captured many of the relevant issues in a timely fashion. Also, we are here using the figures of today and not the “real time” information which may play a role (the same is of course true for the thresholds, which are calculated based on information until 2007). Nevertheless, it should be kept in mind that the signals of the scoreboard do not lead automatically to any conclusions in the policy process, but that there is ample room for interpretation in an economic reading.
With these caveats in mind, Table 4 shows the years for which the indicators in the scoreboard “flash”. The following observations can be made:
• External sustainability (indicators: NIIP and CA). Very strong signals early on for Estonia, Greece, Spain and Portugal. In some countries the CA was weak early on even if it did not show in the NIIP indicator (Cyprus, Slovakia and still Malta). In Ireland the indicators only picked up the deterioration from 2007. Catching-up processes and the role of different drivers (debt versus non-debt instruments) would have been mitigating factors in the reading.
• Export performance and competitiveness (indicators: export market shares; REER; ULC; CA). The gradual decline in export performance over a long period of time is very visible for countries like France, Italy.
• Housing and asset markets (indicators: house prices and credit). The situation in Spain came out clearly already in 2001 and in Ireland from 2003. Questions would also have been raised for Luxembourg, Malta, Slovenia from 2004. It is also noticeable that in the Netherlands there is basically no signal despite being one of the countries with the highest accumulated surge in house prices, something that in turn reflects the very long house price cycle in this country.
• Private sector indebtedness (indicators: private debt, credit, public debt). The difficulties as regards high level of indebtedness in the private sector was generally visible already in the early 2000s. This indicator was already flashing then for Belgium, Ireland, Cyprus, Netherlands, Portugal (and also Malta and Luxembourg had data been available). The potentially problematic nature of these levels of debt would have been seen together with high public debt Cyprus, Spain, Portugal and Malta. In the case of Spain and Ireland the link to high credit growth is also comes out strongly.
Overall it can be noted that as regards the current programme countries, Greece, Portugal and Ireland, the signals coming from the scoreboard at an early stage were both strong and broadly based, in line with the encompassing nature of the imbalances. In other cases the signals are perhaps less clear but the main point is of course that the key role of the scoreboard is to force a discussion and analyses of the different aspects involved. This is true today and would have been true also in previous years.
5 Concluding remarks
When the crisis struck, the existence of large imbalances proved highly damaging to the EU economies. The ongoing adjustment process has taken a heavy toll on economic growth and has been straining the functioning of the EMU. The economy of many Member States are still characterised by a relatively high level of labour and product market rigidities which, in the absence of appropriate reforms, are likely to lengthen periods of adjustment and to make them more costly in terms of unemployment. The unwinding of the external and internal imbalances also had adverse implications for public finances, particularly in countries with excessive private debt levels. Implicit or explicit government guarantees for the troubled banking sector resulted in the transfer of risk from private to public sector. Additionally, sharp contractions in the overblown
Balancing Imbalances: Integrated Surveillance and the Role of the MIP 31
sectors, e.g., construction, and the related increases in unemployment contributed to the deterioration of public finances. This has increased divergences across EU countries in terms of the available macro-economic room of manoeuvre and exposure to vulnerabilities.
Despite important progress, many euro area countries are facing formidable adjustment challenges. They are the largest in countries which are facing the tightening in all three constraints: the external, the private and the public. Other countries face a “double” constrain stemming from the strained public finances and deleveraging pressures in the private sector. Finally, countries with a modest level of private (both households and firms) indebtedness may have room to allow the private sector to compensate for public sector consolidation effects.
The crisis experience pointed to the need for enhanced economic governance structures in the EU. The “six-pack” of legislative proposals was a key response in this context, strengthening the fiscal surveillance and extending surveillance to macroeconomic imbalances, indebtedness and competitiveness issues, in particular within the euro area. The MIP represents a key new block in the economic governance framework in the EU.
While the past policy advice issued to Member States before the start of the crisis contained a strong focus on flexibility-enhancing and competitiveness-promoting measures, many crucial aspects of accumulating macroeconomic imbalances were not captured. The emphasis on supply side issues and inflation risks in the policy advice (alongside a strong fiscal dimension) was highly relevant in increasing the resilience of euro area members to idiosyncratic shocks. However, the policy advice did not fully capture the increasing divergences and accumulation of external and private indebtedness, even though these issues were indeed examined and discussed, including in the Eurogroup. However, the EU surveillance was not alone in this perceived lack in the surveillance, it has also been acknowledged by other institutions such as the IMF.30
This also reflects the complexity involved when identifying the risks of imbalances in “real time” and the need for in-depth analysis. Macroeconomic imbalances can in many cases be justified by the underlying economic developments. For example, external imbalances do not necessarily need to be worrisome if deficits/surpluses are efficient market-based responses to changes in underlying fundamentals and the related saving and investment decisions of households or businesses. Similarly, “downhill” capital flows from rich to less well-off countries are usually seen as a positive development that facilitates economic convergence as they help catching-up countries cover their domestic financing gaps. To the extent that capital inflows are used for building up productive capacity, they boost future growth prospects and the ability to repay the borrowed capital. However, if they become excessive and are driven by policy or market failures, they can have dire repercussions.
Due to the existence of important cross-border spillovers, the adjustment to the existing imbalances raises important challenges for policy-makers in the euro area as a whole. The establishment of the banking union in general, and the introduction of appropriate macro-prudential supervision in particular, would address a large share of the financial market-related imbalances. However, the versatile nature of the imbalances requires a broad and integrated surveillance such as that introduced in the recent enhancements of the EMU economic governance structures.
The MIP should contribute to better economic outcomes through promoting adjustment and stability-oriented policies, reinstating external sustainability and avoiding asset booms. With the first application of the MIP in 2012, for the countries covered issues linked to external and internal imbalances was examined with more detail and focus, leading to more targeted policy advice. At
————— 30 See 2011 report by the IMF Independent Evaluation Office examining the performance of IMF surveillance over the 2004-07
period.
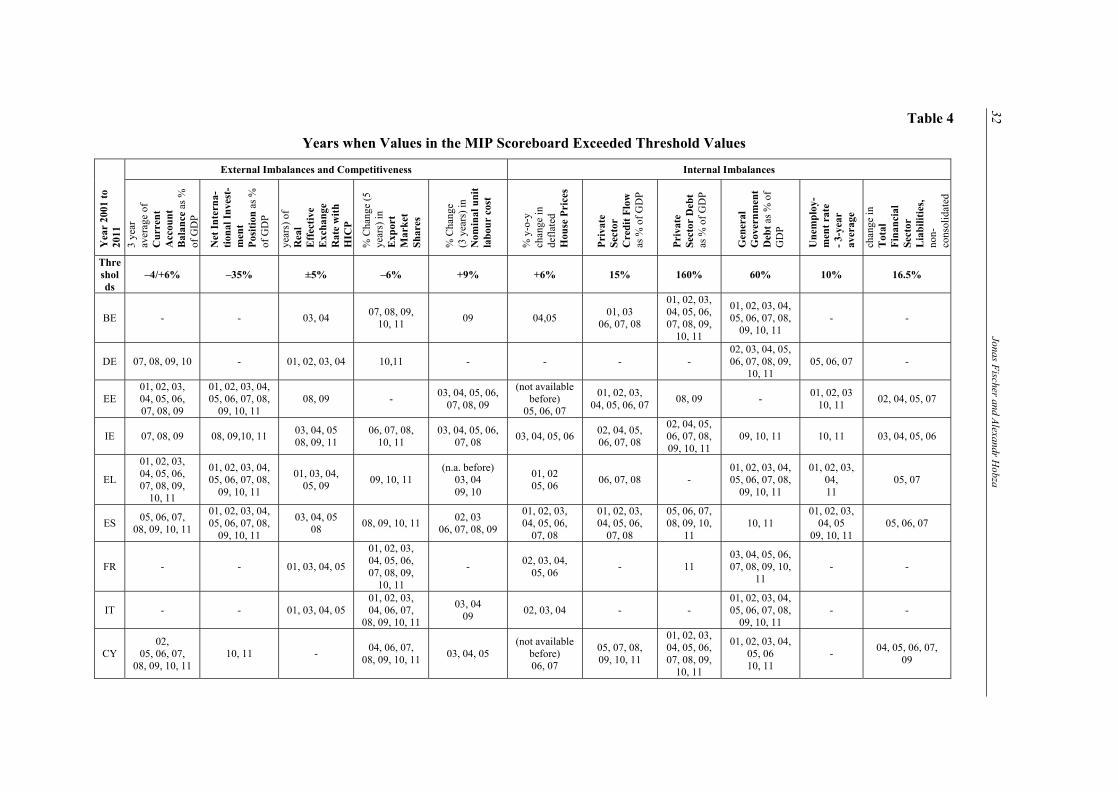
32
Jonas Fischer and A
lexandr Hobza
Table 4
Years when Values in the MIP Scoreboard Exceeded Threshold Values
Yea
r 20
01 t
o 20
11
External Imbalances and Competitiveness Internal Imbalances
3 ye
ar
aver
age
of
Cu
rren
t A
ccou
nt
Bal
ance
as
%
of G
DP
Net
In
tern
a-
tion
al I
nve
st-
men
t P
osit
ion
as
%
of G
DP
year
s) o
f R
eal
Eff
ecti
ve
Exc
han
ge
Rat
e w
ith
H
ICP
% C
hang
e (5
ye
ars)
in
Exp
ort
Mar
ket
S
har
es
% C
hang
e
(3 y
ears
) in
N
omin
al u
nit
la
bou
r co
st
% y
-o-y
ch
ange
in
defl
ated
H
ouse
Pri
ces
Pri
vate
S
ecto
r C
red
it F
low
as
% o
f G
DP
Pri
vate
S
ecto
r D
ebt
as %
of
GD
P
Gen
eral
G
over
nm
ent
Deb
t as
% o
f G
DP
Un
emp
loy-
men
t ra
te
- 3-
year
av
erag
e
chan
ge in
T
otal
F
inan
cial
S
ecto
r L
iab
ilit
ies,
no
n-co
nsol
idat
ed
Thresholds
–4/+6% –35% ±5% –6% +9% +6% 15% 160% 60% 10% 16.5%
BE - - 03, 04 07, 08, 09,
10, 11 09 04,05
01, 03 06, 07, 08
01, 02, 03, 04, 05, 06, 07, 08, 09,
10, 11
01, 02, 03, 04, 05, 06, 07, 08,
09, 10, 11 - -
DE 07, 08, 09, 10 - 01, 02, 03, 04 10,11 - - - - 02, 03, 04, 05, 06, 07, 08, 09,
10, 11 05, 06, 07 -
EE 01, 02, 03, 04, 05, 06, 07, 08, 09
01, 02, 03, 04, 05, 06, 07, 08,
09, 10, 11 08, 09 -
03, 04, 05, 06, 07, 08, 09
(not available before)
05, 06, 07
01, 02, 03, 04, 05, 06, 07
08, 09 - 01, 02, 03
10, 11 02, 04, 05, 07
IE 07, 08, 09 08, 09,10, 11 03, 04, 05 08, 09, 11
06, 07, 08, 10, 11
03, 04, 05, 06, 07, 08
03, 04, 05, 06 02, 04, 05, 06, 07, 08
02, 04, 05, 06, 07, 08, 09, 10, 11
09, 10, 11 10, 11 03, 04, 05, 06
EL
01, 02, 03, 04, 05, 06, 07, 08, 09,
10, 11
01, 02, 03, 04, 05, 06, 07, 08,
09, 10, 11
01, 03, 04, 05, 09
09, 10, 11 (n.a. before)
03, 04 09, 10
01, 02 05, 06
06, 07, 08 - 01, 02, 03, 04, 05, 06, 07, 08,
09, 10, 11
01, 02, 03, 04, 11
05, 07
ES 05, 06, 07,
08, 09, 10, 11
01, 02, 03, 04, 05, 06, 07, 08,
09, 10, 11
03, 04, 05 08
08, 09, 10, 11 02, 03
06, 07, 08, 09
01, 02, 03, 04, 05, 06,
07, 08
01, 02, 03, 04, 05, 06,
07, 08
05, 06, 07, 08, 09, 10,
11 10, 11
01, 02, 03, 04, 05
09, 10, 11 05, 06, 07
FR - - 01, 03, 04, 05
01, 02, 03, 04, 05, 06, 07, 08, 09,
10, 11
- 02, 03, 04,
05, 06 - 11
03, 04, 05, 06, 07, 08, 09, 10,
11 - -
IT - - 01, 03, 04, 05 01, 02, 03, 04, 06, 07,
08, 09, 10, 11
03, 04 09
02, 03, 04 - - 01, 02, 03, 04, 05, 06, 07, 08,
09, 10, 11 - -
CY 02,
05, 06, 07, 08, 09, 10, 11
10, 11 - 04, 06, 07,
08, 09, 10, 11 03, 04, 05
(not available before) 06, 07
05, 07, 08, 09, 10, 11
01, 02, 03, 04, 05, 06, 07, 08, 09,
10, 11
01, 02, 03, 04, 05, 06 10, 11
- 04, 05, 06, 07,
09

B
alancing Imbalances: Integrated Surveillance and the R
ole of the MIP
33
Table 4 (continued) Y
ear
2001
to
2011
External Imbalances and Competitiveness Internal Imbalances
3 ye
ar
aver
age
of
Cu
rren
t A
ccou
nt
Bal
ance
as
%
of G
DP
Net
In
tern
a-
tion
al I
nve
st-
men
t P
osit
ion
as
%
of G
DP
year
s) o
f R
eal
Eff
ecti
ve
Exc
han
ge
Rat
e w
ith
H
ICP
% C
hang
e (5
ye
ars)
in
Exp
ort
Mar
ket
S
har
es
% C
hang
e
(3 y
ears
) in
N
omin
al u
nit
la
bou
r co
st
% y
-o-y
ch
ange
in
defl
ated
H
ouse
Pri
ces
Pri
vate
S
ecto
r C
red
it F
low
as
% o
f G
DP
Pri
vate
S
ecto
r D
ebt
as %
of
GD
P
Gen
eral
G
over
nm
ent
Deb
t as
% o
f G
DP
Un
emp
loy-
men
t ra
te
- 3-
year
av
erag
e
chan
ge in
T
otal
F
inan
cial
S
ecto
r L
iab
ilit
ies,
no
n-co
nsol
idat
ed
Thresholds
–4/+6% –35% ±5% –6% +9% +6% 15% 160% 60% 10% 16.5%
LU
01, 02, 03, 04, 05, 06, 07, 08, 09,
10, 11
- 04, 05 11 01, 02, 03,
08, 09, 10, 11 01, 02, 03,
04, 05 07, 09
(not available before) 06, 07, 08, 09,
10, 11
- - -
MT
01, 02,
05, 06, 07, 08, 09, 10, 11
- 08, 09 04, 05, 06,
07, 08
(not available before) 03
09
02, 03, 04, 05, 06, 07,
08 06, 08
(not available before) 04, 05, 06, 07,
08, 09, 10, 11
01, 03, 04, 05, 06, 07, 08, 09, 10,
11
-
(not available before)
05, 07, 10
NL 05, 06, 07, 08
11 - 03, 04
01
08, 09, 10, 11
01, 02, 03
09 01 -
01, 02, 03, 04, 05, 06, 07, 08, 09,
10, 11
09, 10, 11 - -
AT - - - 09, 10, 11 09
(not available
before 06)
-
07 10, 11
01, 02, 03, 04, 05, 06, 07, 08, 09,
10, 11
- 05
PT
01, 02, 03, 04, 05, 06, 07, 08, 09,
10, 11
01, 02, 03, 04, 05, 06, 07, 08, 09,
10, 11
03, 04, 05 01
08, 09, 10, 11 01, 02, 03 -
01
06, 07, 08
01, 02, 03, 04, 05, 06, 07, 08, 09,
10, 11
04, 05, 06, 07, 08, 09,
10, 11 10, 11 -
SI 08 08, 09, 10, 11 09 01
11 01, 02, 03, 04
08, 09, 10 04,05, 06, 07 07, 08 - - - 02, 05, 07
SK 01, 02, 03, 04, 05, 06,
07, 08, 09, 10
05, 06, 07, 08, 09, 10, 11
02, 03, 04, 05, 06, 07, 08, 09, 10
- 01, 02
09, 10 06,07, 08 - - -
01, 02, 03, 04, 05, 06, 07, 08, 09,
10, 11
05, 07
FI 01, 02, 03, 04 01, 02 03, 04
09
03, 05, 06
09, 10, 11 09, 10, 11 03, 04, 05 07, 08 08, 09, 10, 11 - - 10, 11

34 Jonas Fischer and Alexandr Hobza
the same time, the overall governance framework of the EU is under rapid development, in particular as regards the financial sector and banking union, which also will change the conditions under which future imbalances may develop in the economy. Thus, looking forward, the MIP will crucially need to stay flexible to react to changing circumstances. To this end targeted efforts to develop analytical approaches and tools is required, guided by the requirements of the procedure in a learning-by-doing process. The second round of the MIP will be one further step in this direction.
Balancing Imbalances: Integrated Surveillance and the Role of the MIP 35
REFERENCES
Blanchard, O. and F. Giavazzi (2002), “Current Account Deficits in the Euro Area: The End of the Feldstein-Horioka Puzzle”, Brookings Papers on Economic Activity, No. 2, pp. 147-86.
Bouwen, P. and J. Fischer (2011), “Towards a Stronger EU Surveillance of Macroeconomic Imbalances: Rationale and Design of the New Procedure”, in Reflets et perspectives de la vie économique, 2012/1.
Buti, M. and A. Turrini (2012), “Slow but Steady? External Adjustment within the Eurozone Starts Working”, VoxEU.org, 12 November.
Chen, R., G.M. Milesi-Ferretti and T. Tressel (2012), “External Imbalances in the Euro Area”, IMF, Working Paper, No. 12/236.
Cuerpo, C. and A. Hobza (2013), “The Surveillance of Macroeconomic Imbalances in the EU: The Sectoral Perspective”, in B. Winkler et al. (eds.), Macroeconomic Imbalances and Financial Stability, Palgrave Macmillan, forthcoming.
Cuerpo, C., I. Drumond, J. Lendvai, P. Pontuch and R. Raciborski (2013), “Indebtedness, Deleveraging Dynamics and Macroeconomic Adjustment”, European Economy, Economic Paper, No. 477, April.
Deroose, S., D. Hodson and J. Kuhlmann (2008), “The Broad Economic Policy Guidelines: Before and After of the Re-launch of the Lisbon Strategy”, in JCMS 2008, Vol. 46, No. 4, pp. 827-48.
European Commission (2006), “The EU Economy 2006 Review”, European Economy, 2006/6.
————— (2010), “Surveillance Of Intra-euro-area Competitiveness And Imbalances”, European Economy, No. 1, May.
————— (2012a), “The 2012 Ageing Report: Economic and Budgetary Projections for the 27 EU Member States (2010-2060)”, European Economy 2012/2.
————— (2012b), “2012 Sustainability Report”, European Economy, No. 8.
————— (2012c), “Current Account Surpluses in the EU, European Economy, No. 9.
————— (2012), “Alert Mechanism Report 2012”.
————— (2012), “Alert Mechanism Report 2013”.
————— (2012), “Scoreboard for the surveillance of Macroeconomic Imbalances”, Occasional Paper, No. 92, February.
Fischer, J. and I. Justo (2011), “Government Fiscal and Real Economy Responses to the Crises: Automatic Stabilisers Versus Automatic Stabilisation”, in Banca d’Italia (ed.), Fiscal Policy: Lessons from the Crises, pp. 29-46, February.
IEO, Independent Evaluation Office of the IMF (2011), “IMF Performance in the Run-up to the Financial and Economic Crises”, Evaluation Report, 2011.
Lane, P. (2010), “External Imbalances and Fiscal Policy”, IIIS, Discussion Paper, No. 314.
————— (2013), “Capital Flows in the Euro Area”, (forthcoming).
Lane, P. and B. Pels (2012), “Current Account Imbalances in Europe”, Moneda y Credito (forthcoming).
36 Jonas Fischer and Alexandr Hobza
Lendvai, J., L. Moulin and A. Turrini (2011), “From CAB to CAAB? Correcting Indicators of Structural Fiscal Positions for Current Account Imbalances”, European Economy, Economic Paper, No. 442.
Merler, S. and J. Pisani-Ferry (2012), “Sudden Stops in the Euro Area”, Bruegel Policy Contribution, No. 2012/06.
Ruscher, E. and G. Wolff (2012), “Corporate Balance Sheet Adjustment: Stylised Facts, Causes and Consequences”, European Economy, Economic Paper, No. 449, Brussels.
Related Documents