Automobiles Sector Overview - 2014
Jul 29, 2015
Welcome message from author
This document is posted to help you gain knowledge. Please leave a comment to let me know what you think about it! Share it to your friends and learn new things together.
Transcript
15.9
34.0
FY13 FY20
Two wheelers (million units)
3.2
8.6
FY13 FY21
Passenger vehicles (million units)
Source: IHS, NEMMP 2020, ACMA, Aranca Research;
Note: E – Estimate
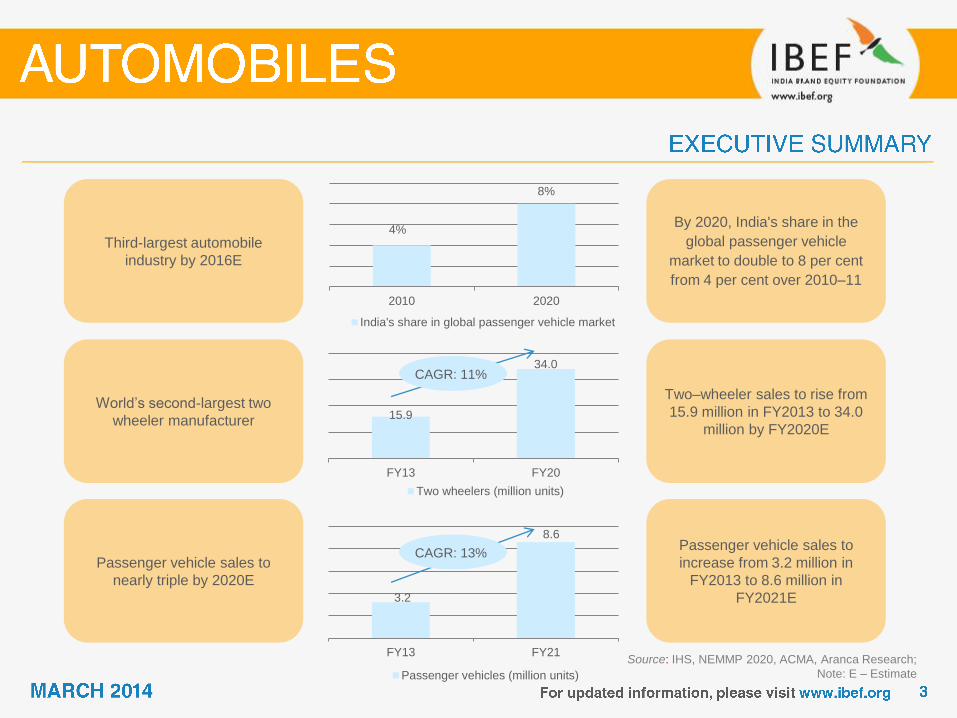
By 2020, India's share in the
global passenger vehicle
market to double to 8 per cent
from 4 per cent over 2010–11
Third-largest automobile
industry by 2016E
Two–wheeler sales to rise from
15.9 million in FY2013 to 34.0
million by FY2020E
World’s second-largest two
wheeler manufacturer
Passenger vehicle sales to
increase from 3.2 million in
FY2013 to 8.6 million in
FY2021E
Passenger vehicle sales to
nearly triple by 2020E
CAGR: 11%
4%
8%
2010 2020
India's share in global passenger vehicle market
CAGR: 13%
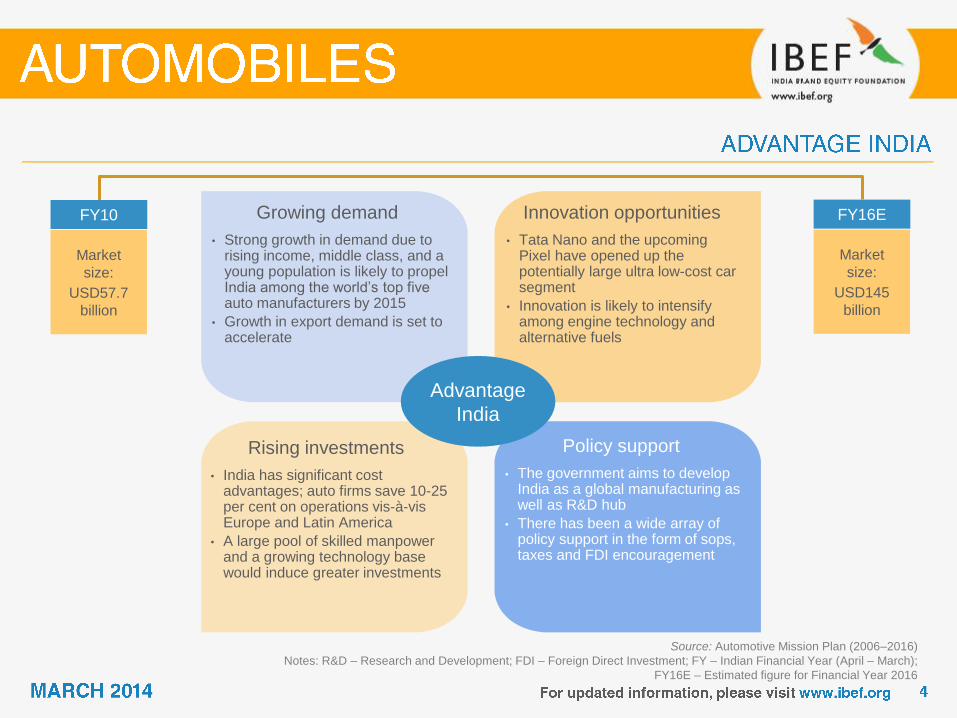
Growing demand
Source: Automotive Mission Plan (2006–2016)
Notes: R&D – Research and Development; FDI – Foreign Direct Investment; FY – Indian Financial Year (April – March);
FY16E – Estimated figure for Financial Year 2016
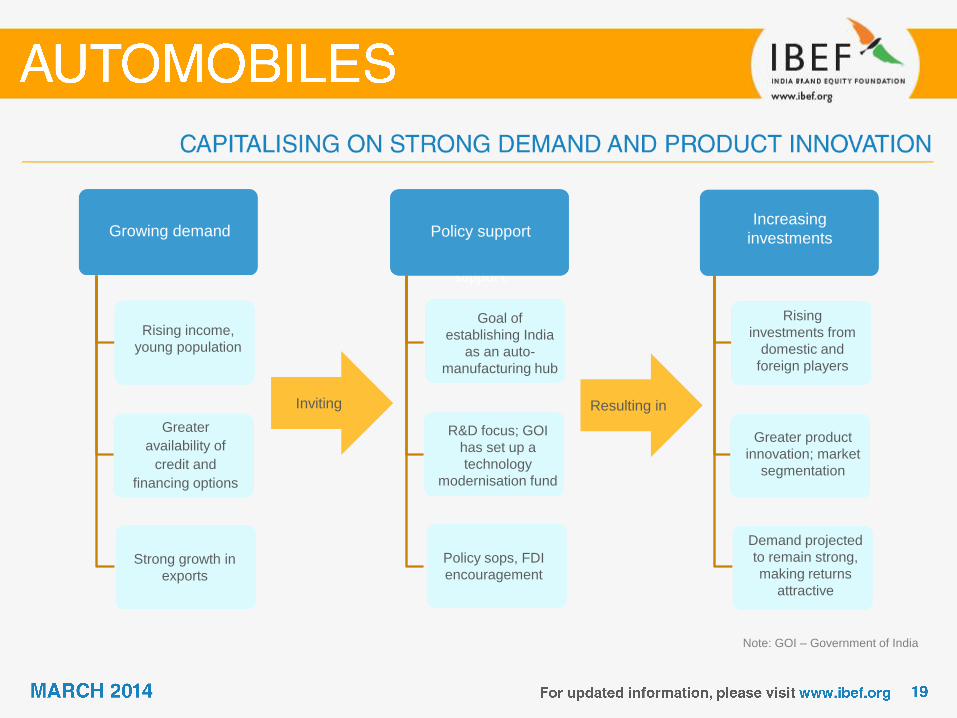
Growing demand
• Strong growth in demand due to rising income, middle class, and a young population is likely to propel India among the world’s top five auto manufacturers by 2015
• Growth in export demand is set to accelerate
Innovation opportunities
• Tata Nano and the upcoming Pixel have opened up the potentially large ultra low-cost car segment
• Innovation is likely to intensify among engine technology and alternative fuels
Policy support
• The government aims to develop India as a global manufacturing as well as R&D hub
• There has been a wide array of policy support in the form of sops, taxes and FDI encouragement
Rising investments
• India has significant cost advantages; auto firms save 10-25 per cent on operations vis-à-vis Europe and Latin America
• A large pool of skilled manpower and a growing technology base would induce greater investments
FY10
Market
size:
USD57.7
billion
FY16E
Market
size:
USD145
billion
Advantage
India
Source: Tata Motors, Society of Indian Automobile Manufacturers (SIAM), Aranca Research
Note: JV – Joint Venture
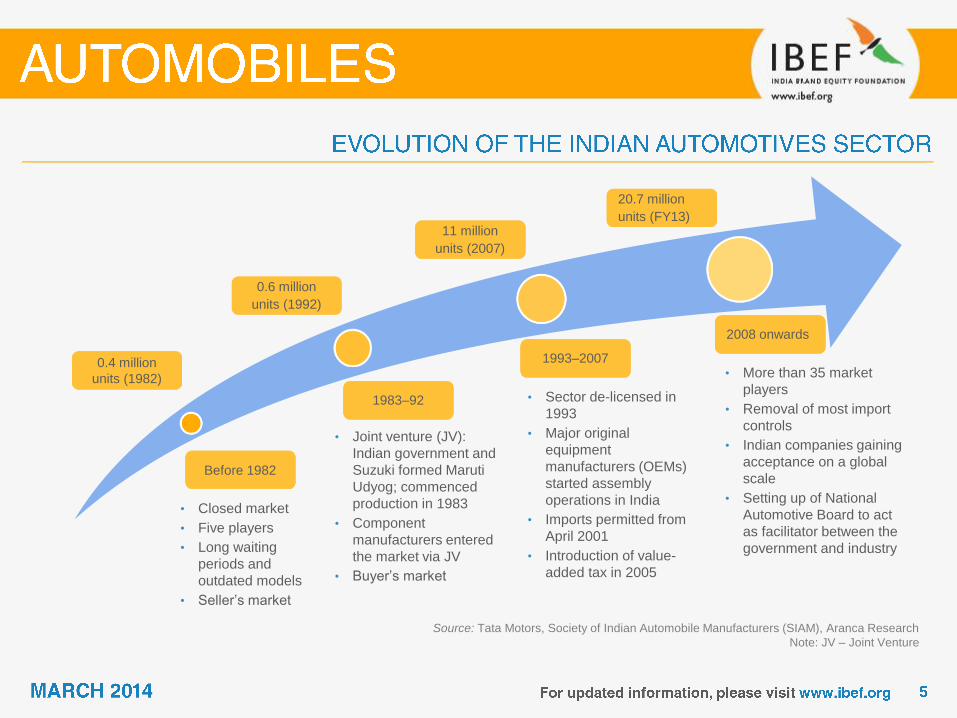
• Closed market
• Five players
• Long waiting
periods and
outdated models
• Seller’s market
• Joint venture (JV):
Indian government and
Suzuki formed Maruti
Udyog; commenced
production in 1983
• Component
manufacturers entered
the market via JV
• Buyer’s market
• Sector de-licensed in
1993
• Major original
equipment
manufacturers (OEMs)
started assembly
operations in India
• Imports permitted from
April 2001
• Introduction of value-
added tax in 2005
• More than 35 market
players
• Removal of most import
controls
• Indian companies gaining
acceptance on a global
scale
• Setting up of National
Automotive Board to act
as facilitator between the
government and industry
0.4 million
units (1982)
0.6 million
units (1992)
11 million
units (2007)
20.7 million
units (FY13)
Before 1982
1983–92
1993–2007
2008 onwards
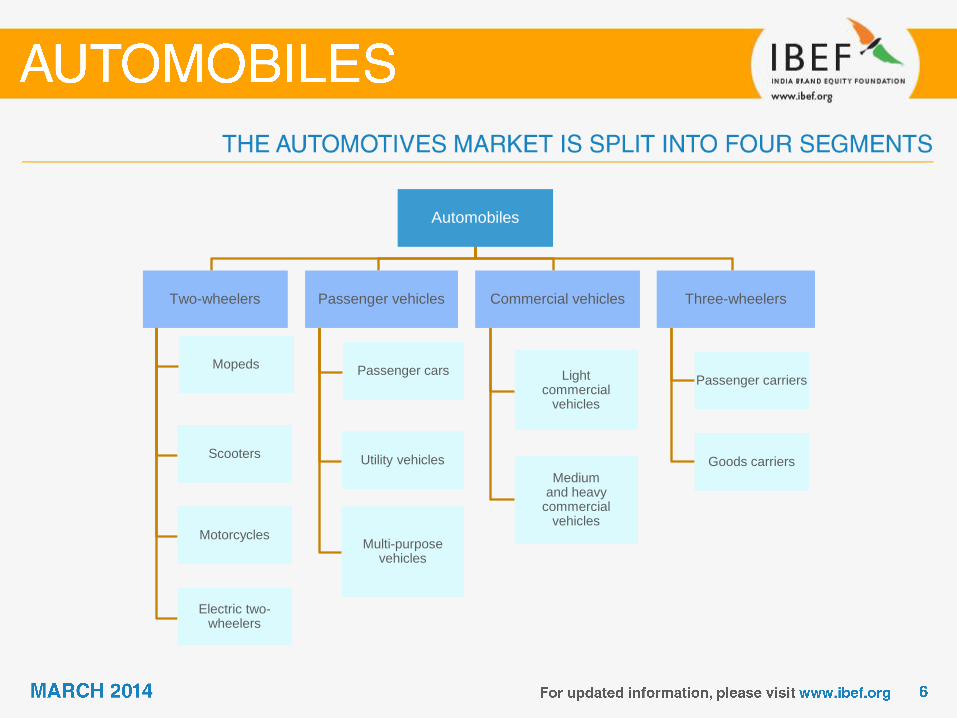
Automobiles
Two-wheelers
Mopeds
Scooters
Motorcycles
Electric two-wheelers
Passenger vehicles
Passenger cars
Utility vehicles
Multi-purpose vehicles
Commercial vehicles
Light commercial
vehicles
Medium and heavy
commercial vehicles
Three-wheelers
Passenger carriers
Goods carriers
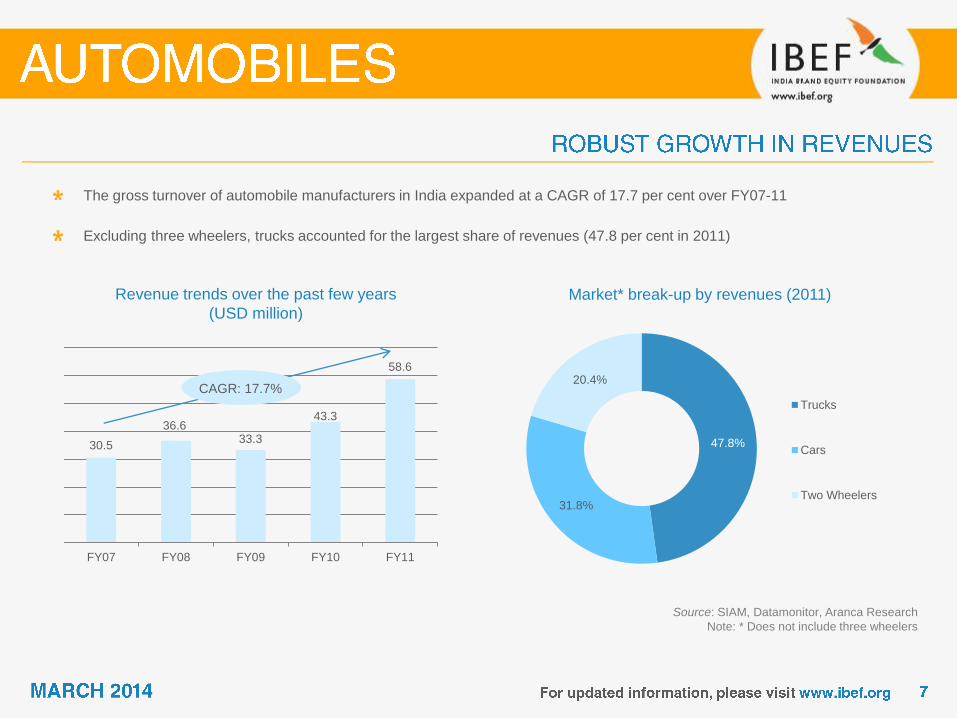
Revenue trends over the past few years
(USD million)
Source: SIAM, Datamonitor, Aranca Research
Note: * Does not include three wheelers
The gross turnover of automobile manufacturers in India expanded at a CAGR of 17.7 per cent over FY07-11
Excluding three wheelers, trucks accounted for the largest share of revenues (47.8 per cent in 2011)
Market* break-up by revenues (2011)
30.5
36.6 33.3
43.3
58.6
FY07 FY08 FY09 FY10 FY11
47.8%
31.8%
20.4%
Trucks
Cars
Two Wheelers
CAGR: 17.7%
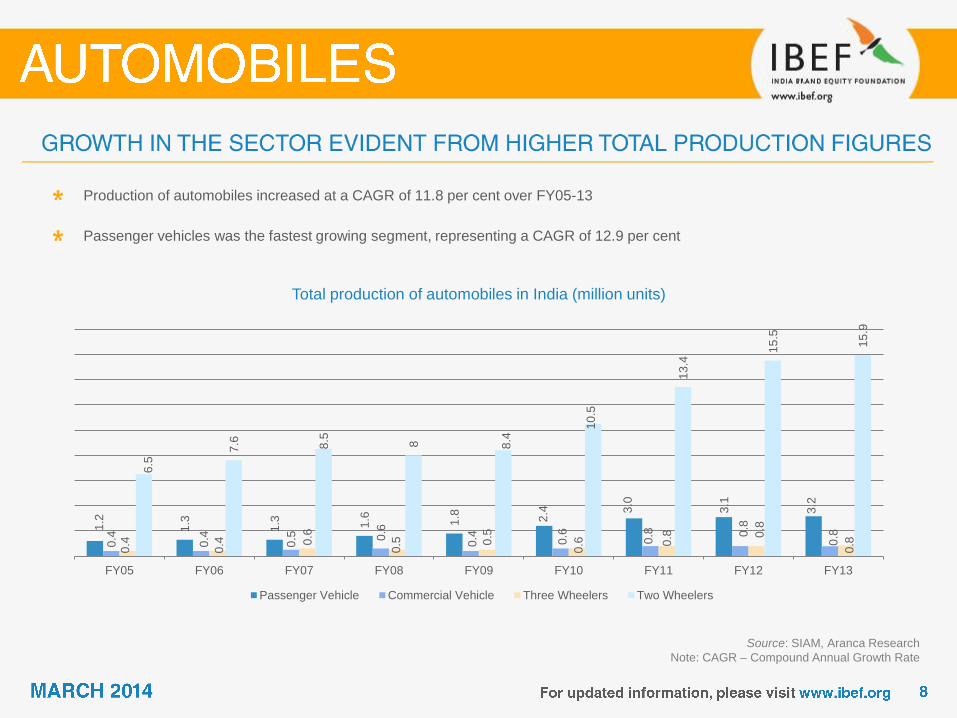
Total production of automobiles in India (million units)
Source: SIAM, Aranca Research
Note: CAGR – Compound Annual Growth Rate
Production of automobiles increased at a CAGR of 11.8 per cent over FY05-13
Passenger vehicles was the fastest growing segment, representing a CAGR of 12.9 per cent
1.2
1.3
1.3
1.6
1.8
2.4
3.0
3.1
3.2
0.4
0.4
0.5
0.6
0.4
0.6
0.8
0.8
0.8
0.4
0.4
0.6
0.5
0.5
0.6
0.8
0.8
0.8
6.5
7.6
8.5
8
8.4
10
.5
13
.4 1
5.5
15
.9
FY05 FY06 FY07 FY08 FY09 FY10 FY11 FY12 FY13
Passenger Vehicle Commercial Vehicle Three Wheelers Two Wheelers
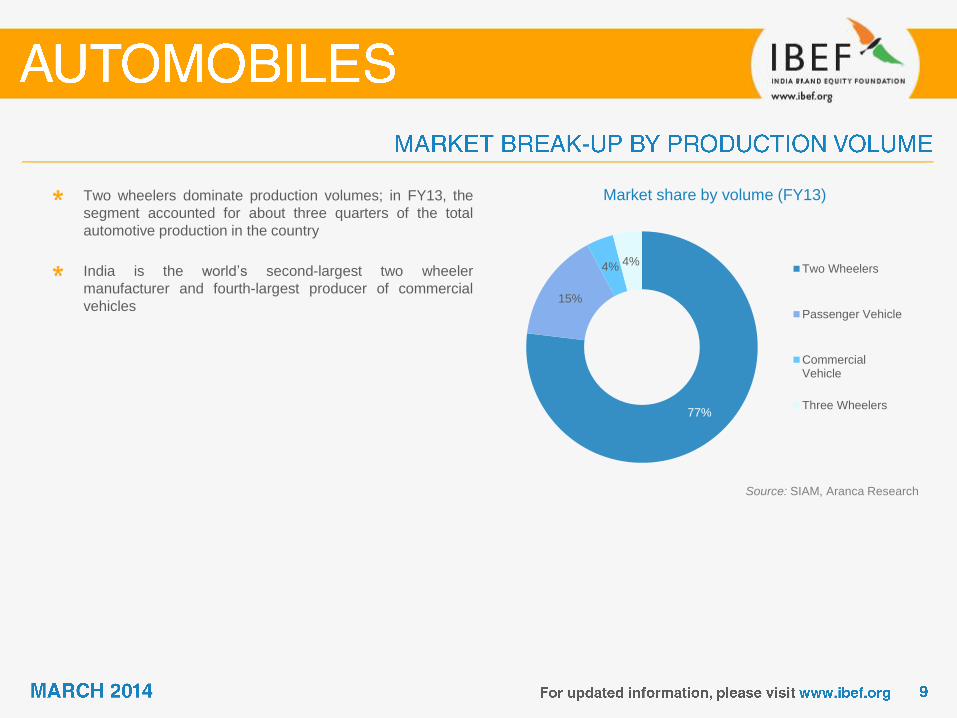
Market share by volume (FY13) Two wheelers dominate production volumes; in FY13, the
segment accounted for about three quarters of the total
automotive production in the country
India is the world’s second-largest two wheeler
manufacturer and fourth-largest producer of commercial
vehicles
77%
15%
4% 4% Two Wheelers
Passenger Vehicle
CommercialVehicle
Three Wheelers
Source: SIAM, Aranca Research
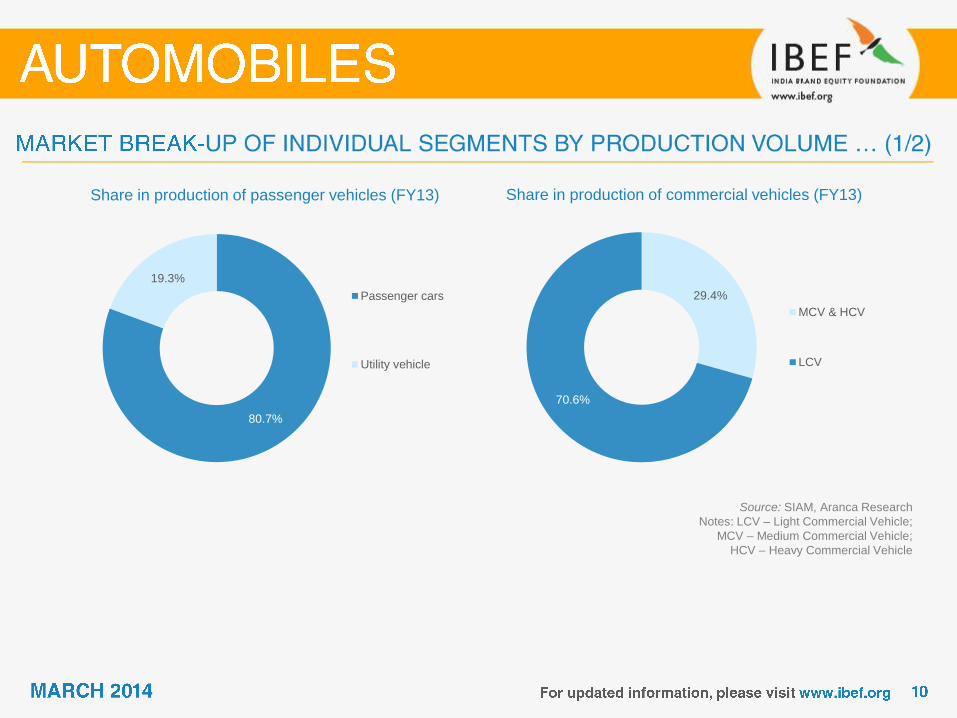
Share in production of passenger vehicles (FY13) Share in production of commercial vehicles (FY13)
80.7%
19.3%
Passenger cars
Utility vehicle
29.4%
70.6%
MCV & HCV
LCV
Source: SIAM, Aranca Research
Notes: LCV – Light Commercial Vehicle;
MCV – Medium Commercial Vehicle;
HCV – Heavy Commercial Vehicle
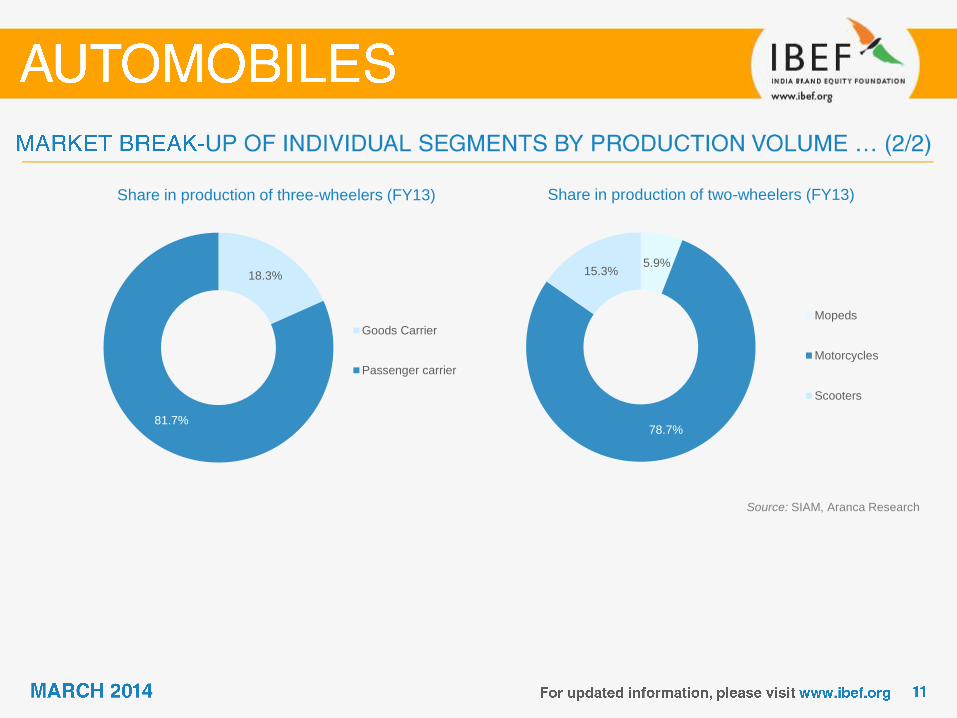
Share in production of three-wheelers (FY13) Share in production of two-wheelers (FY13)
18.3%
81.7%
Goods Carrier
Passenger carrier
Source: SIAM, Aranca Research
5.9%
78.7%
15.3%
Mopeds
Motorcycles
Scooters
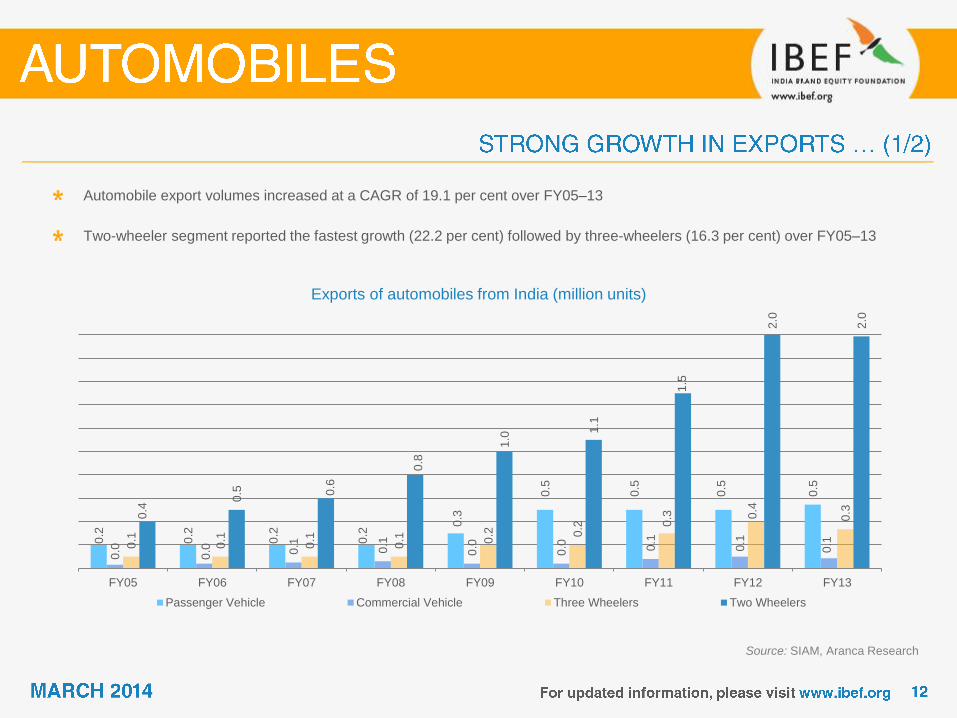
Exports of automobiles from India (million units)
Automobile export volumes increased at a CAGR of 19.1 per cent over FY05–13
Two-wheeler segment reported the fastest growth (22.2 per cent) followed by three-wheelers (16.3 per cent) over FY05–13
0.2
0.2
0.2
0.2
0.3
0.5
0.5
0.5
0.5
0.0
0.0
0.1
0.1
0.0
0.0
0.1
0.1
0.1
0.1
0.1
0.1
0.1
0.2
0.2
0.3
0.4
0.3
0.4
0.5
0.6
0.8
1.0
1.1
1.5
2.0
2.0
FY05 FY06 FY07 FY08 FY09 FY10 FY11 FY12 FY13
Passenger Vehicle Commercial Vehicle Three Wheelers Two Wheelers
Source: SIAM, Aranca Research
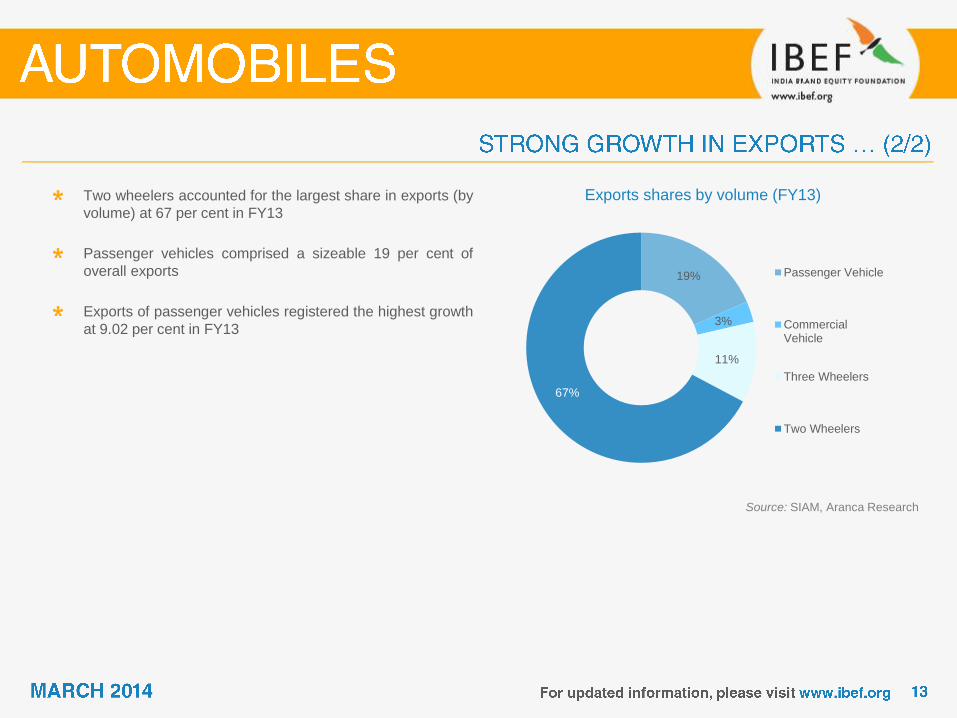
Exports shares by volume (FY13) Two wheelers accounted for the largest share in exports (by
volume) at 67 per cent in FY13
Passenger vehicles comprised a sizeable 19 per cent of
overall exports
Exports of passenger vehicles registered the highest growth
at 9.02 per cent in FY13
19%
3%
11%
67%
Passenger Vehicle
CommercialVehicle
Three Wheelers
Two Wheelers
Source: SIAM, Aranca Research
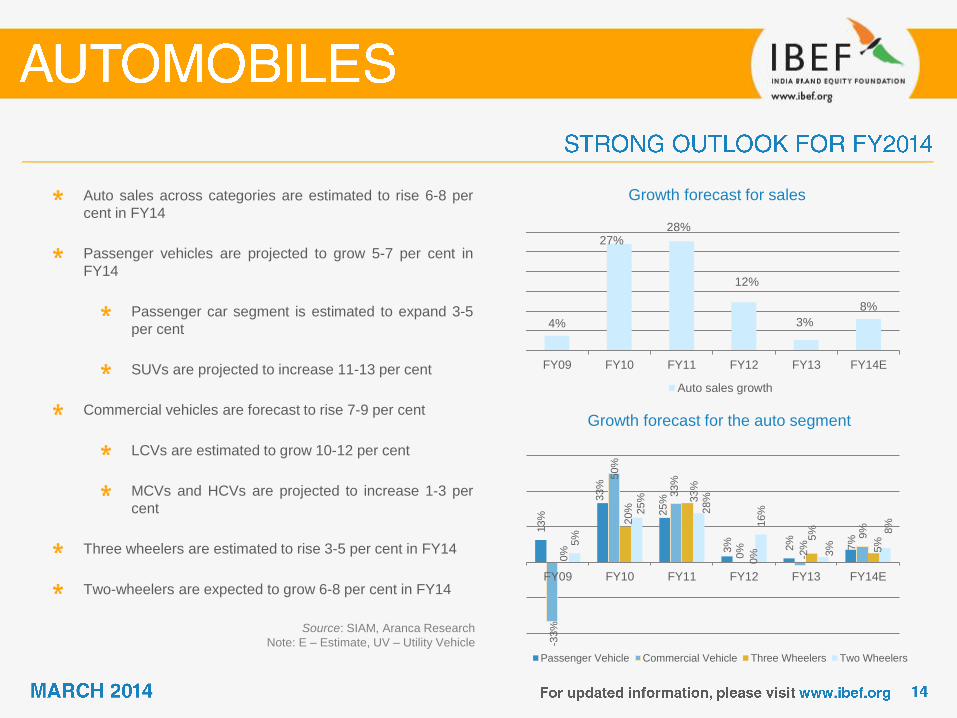
Growth forecast for sales
Source: SIAM, Aranca Research
Note: E – Estimate, UV – Utility Vehicle
Auto sales across categories are estimated to rise 6-8 per
cent in FY14
Passenger vehicles are projected to grow 5-7 per cent in
FY14
Passenger car segment is estimated to expand 3-5
per cent
SUVs are projected to increase 11-13 per cent
Commercial vehicles are forecast to rise 7-9 per cent
LCVs are estimated to grow 10-12 per cent
MCVs and HCVs are projected to increase 1-3 per
cent
Three wheelers are estimated to rise 3-5 per cent in FY14
Two-wheelers are expected to grow 6-8 per cent in FY14
4%
27% 28%
12%
3%
8%
FY09 FY10 FY11 FY12 FY13 FY14E
Auto sales growth
Growth forecast for the auto segment
13%
33%
25%
3%
2%
7%
-33%
50%
33%
0%
-2%
9%
0%
20%
33%
0%
5%
5%
5%
25%
28%
16%
3%
8%
FY09 FY10 FY11 FY12 FY13 FY14E
Passenger Vehicle Commercial Vehicle Three Wheelers Two Wheelers
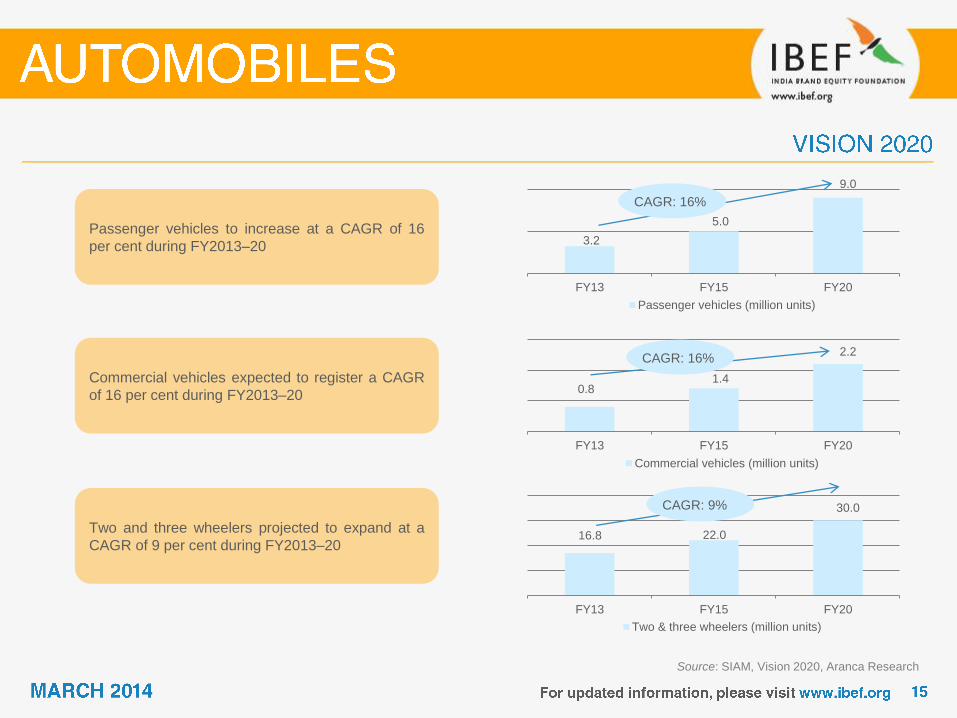
16.8 22.0
30.0
FY13 FY15 FY20
Two & three wheelers (million units)
0.8 1.4
2.2
FY13 FY15 FY20
Commercial vehicles (million units)
3.2
5.0
9.0
FY13 FY15 FY20
Passenger vehicles (million units)
Passenger vehicles to increase at a CAGR of 16
per cent during FY2013–20
Commercial vehicles expected to register a CAGR
of 16 per cent during FY2013–20
Two and three wheelers projected to expand at a
CAGR of 9 per cent during FY2013–20
CAGR: 16%
CAGR: 16%
CAGR: 9%
Source: SIAM, Vision 2020, Aranca Research
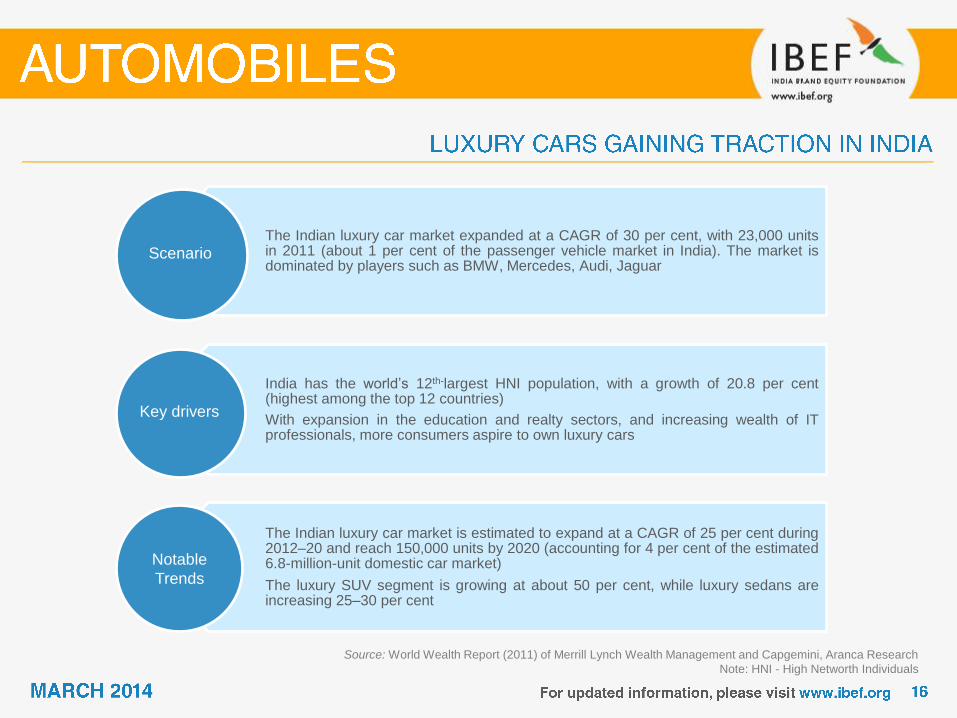
The Indian luxury car market expanded at a CAGR of 30 per cent, with 23,000 units in 2011 (about 1 per cent of the passenger vehicle market in India). The market is dominated by players such as BMW, Mercedes, Audi, Jaguar
India has the world’s 12th-largest HNI population, with a growth of 20.8 per cent (highest among the top 12 countries)
With expansion in the education and realty sectors, and increasing wealth of IT professionals, more consumers aspire to own luxury cars
The Indian luxury car market is estimated to expand at a CAGR of 25 per cent during 2012–20 and reach 150,000 units by 2020 (accounting for 4 per cent of the estimated 6.8-million-unit domestic car market)
The luxury SUV segment is growing at about 50 per cent, while luxury sedans are increasing 25–30 per cent
Scenario
Key drivers
Notable
Trends
Source: World Wealth Report (2011) of Merrill Lynch Wealth Management and Capgemini, Aranca Research
Note: HNI - High Networth Individuals
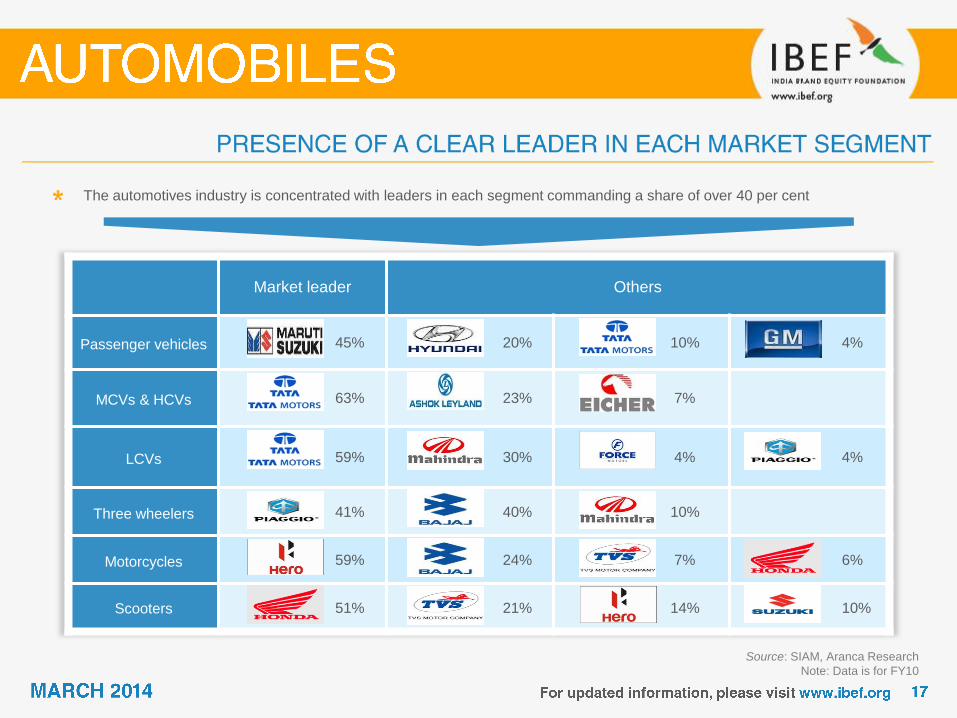
Source: SIAM, Aranca Research
Note: Data is for FY10
The automotives industry is concentrated with leaders in each segment commanding a share of over 40 per cent
Market leader Others
Passenger vehicles 45% 20% 10% 4%
MCVs & HCVs 63% 23% 7%
LCVs 59% 30% 4% 4%
Three wheelers 41% 40% 10%
Motorcycles 59% 24% 7% 6%
Scooters 51% 21% 14% 10%
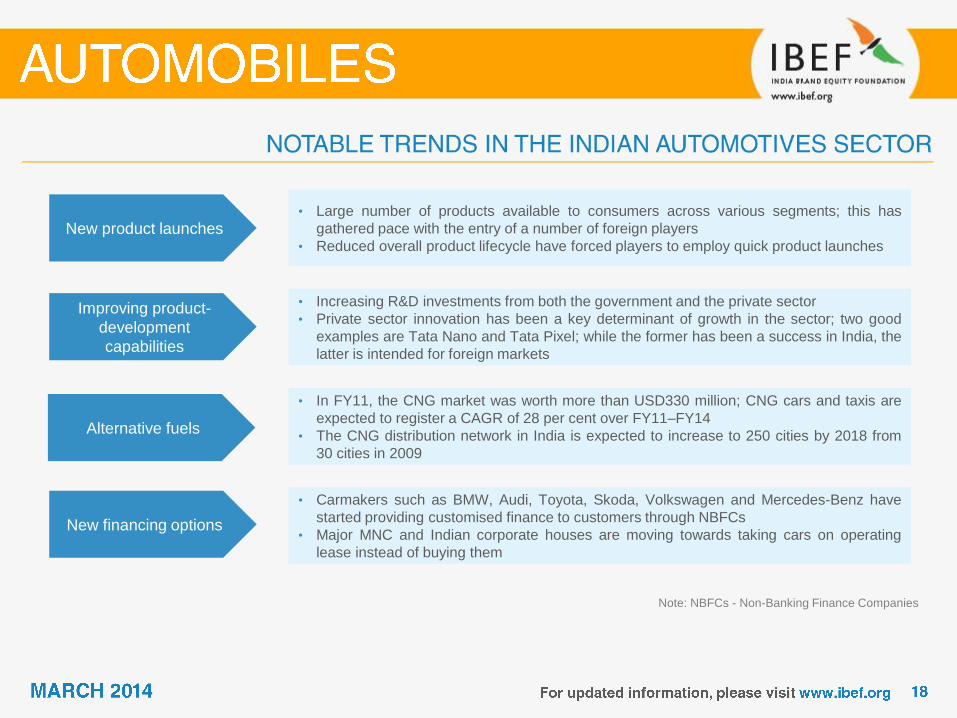
New product launches • Large number of products available to consumers across various segments; this has
gathered pace with the entry of a number of foreign players
• Reduced overall product lifecycle have forced players to employ quick product launches
Improving product-
development
capabilities
• Increasing R&D investments from both the government and the private sector
• Private sector innovation has been a key determinant of growth in the sector; two good
examples are Tata Nano and Tata Pixel; while the former has been a success in India, the
latter is intended for foreign markets
Alternative fuels
• In FY11, the CNG market was worth more than USD330 million; CNG cars and taxis are
expected to register a CAGR of 28 per cent over FY11–FY14
• The CNG distribution network in India is expected to increase to 250 cities by 2018 from
30 cities in 2009
New financing options
• Carmakers such as BMW, Audi, Toyota, Skoda, Volkswagen and Mercedes-Benz have
started providing customised finance to customers through NBFCs
• Major MNC and Indian corporate houses are moving towards taking cars on operating
lease instead of buying them
Note: NBFCs - Non-Banking Finance Companies
Strong
government
support
Growing demand
Inviting Resulting in
Growing demand Increasing
investments Policy support
Rising income,
young population
Greater
availability of
credit and
financing options
Strong growth in
exports
Goal of
establishing India
as an auto-
manufacturing hub
R&D focus; GOI
has set up a
technology
modernisation fund
Policy sops, FDI
encouragement
Rising
investments from
domestic and
foreign players
Greater product
innovation; market
segmentation
Demand projected
to remain strong,
making returns
attractive
Note: GOI – Government of India
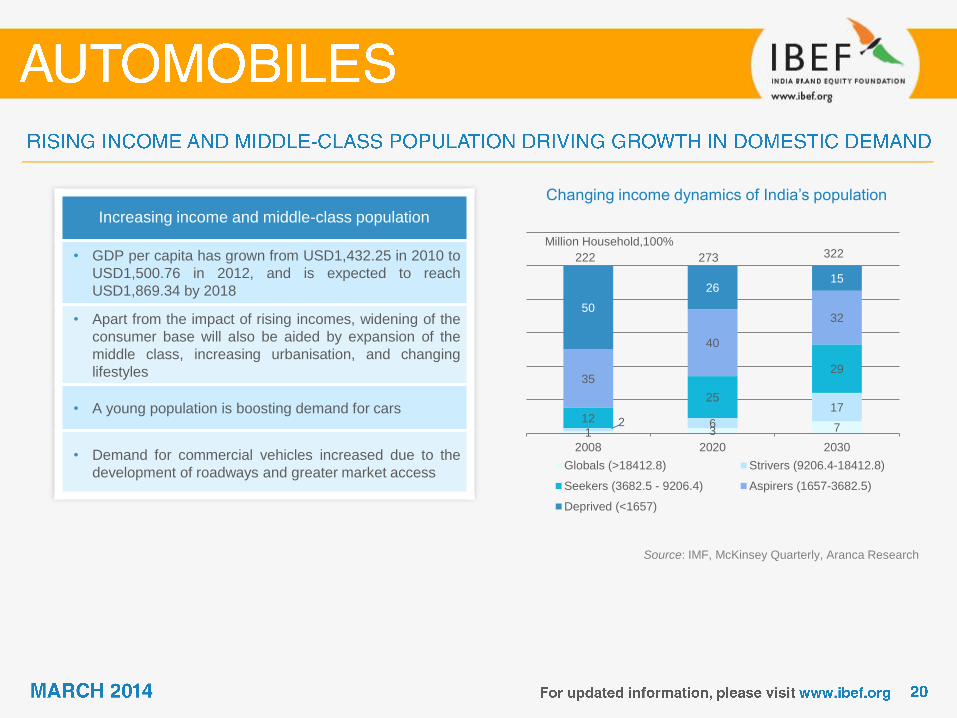
Increasing income and middle-class population
• GDP per capita has grown from USD1,432.25 in 2010 to
USD1,500.76 in 2012, and is expected to reach
USD1,869.34 by 2018
• Apart from the impact of rising incomes, widening of the
consumer base will also be aided by expansion of the
middle class, increasing urbanisation, and changing
lifestyles
• A young population is boosting demand for cars
• Demand for commercial vehicles increased due to the
development of roadways and greater market access
Changing income dynamics of India’s population
Source: IMF, McKinsey Quarterly, Aranca Research
1 3 7 2 6
17 12
25
29 35
40
32 50
26 15
2008 2020 2030
Globals (>18412.8) Strivers (9206.4-18412.8)
Seekers (3682.5 - 9206.4) Aspirers (1657-3682.5)
Deprived (<1657)
Million Household,100%
222 273 322
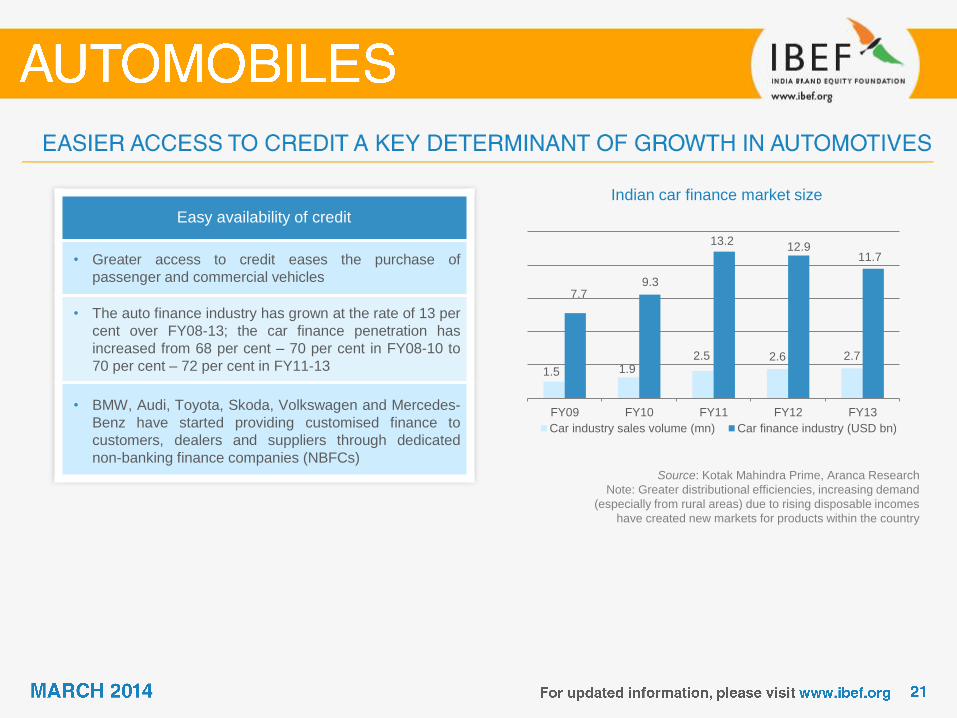
Easy availability of credit
• Greater access to credit eases the purchase of
passenger and commercial vehicles
• The auto finance industry has grown at the rate of 13 per
cent over FY08-13; the car finance penetration has
increased from 68 per cent – 70 per cent in FY08-10 to
70 per cent – 72 per cent in FY11-13
• BMW, Audi, Toyota, Skoda, Volkswagen and Mercedes-
Benz have started providing customised finance to
customers, dealers and suppliers through dedicated
non-banking finance companies (NBFCs)
Indian car finance market size
Source: Kotak Mahindra Prime, Aranca Research
Note: Greater distributional efficiencies, increasing demand
(especially from rural areas) due to rising disposable incomes
have created new markets for products within the country
1.5 1.9 2.5 2.6 2.7
7.7 9.3
13.2 12.9
11.7
FY09 FY10 FY11 FY12 FY13
Car industry sales volume (mn) Car finance industry (USD bn)
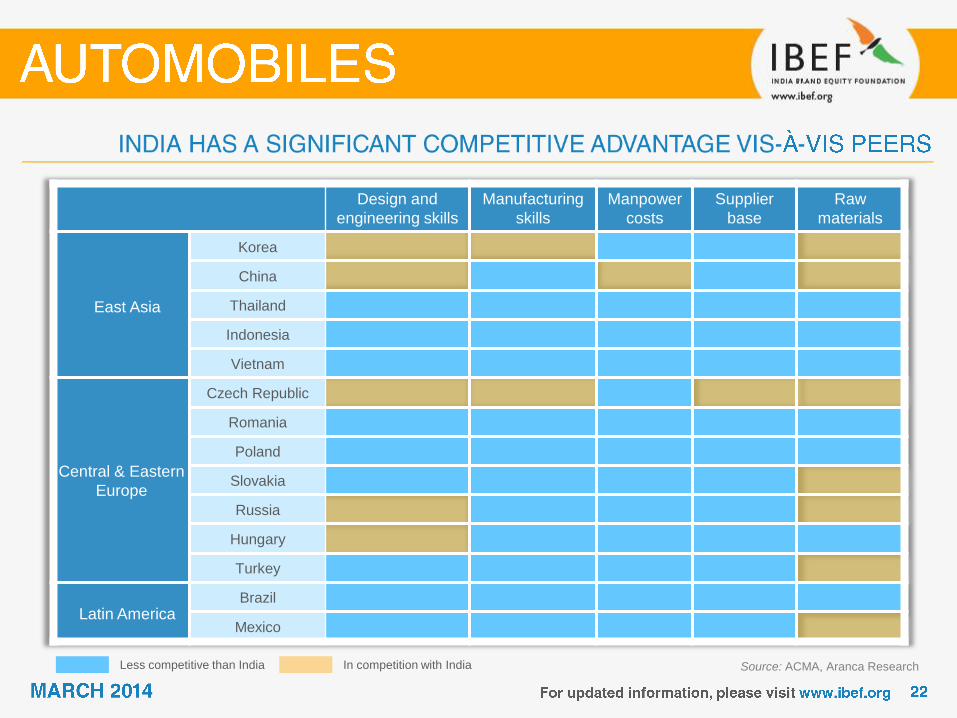
Design and
engineering skills
Manufacturing
skills
Manpower
costs
Supplier
base
Raw
materials
East Asia
Korea
China
Thailand
Indonesia
Vietnam
Central & Eastern
Europe
Czech Republic
Romania
Poland
Slovakia
Russia
Hungary
Turkey
Latin America Brazil
Mexico
Less competitive than India In competition with India Source: ACMA, Aranca Research
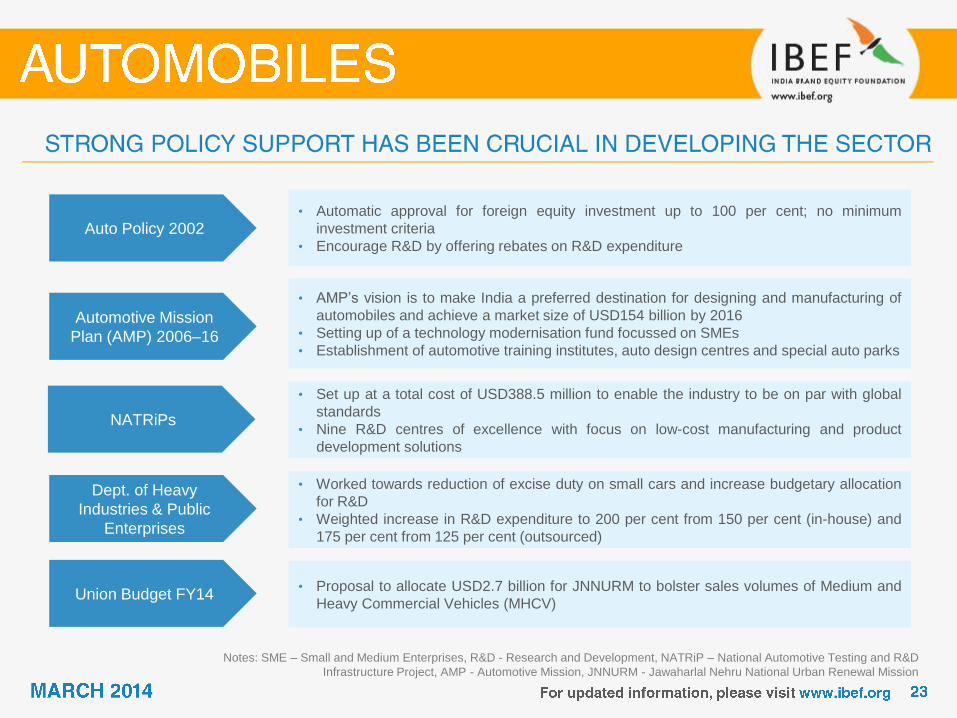
Auto Policy 2002 • Automatic approval for foreign equity investment up to 100 per cent; no minimum
investment criteria
• Encourage R&D by offering rebates on R&D expenditure
Automotive Mission
Plan (AMP) 2006–16
• AMP’s vision is to make India a preferred destination for designing and manufacturing of
automobiles and achieve a market size of USD154 billion by 2016
• Setting up of a technology modernisation fund focussed on SMEs
• Establishment of automotive training institutes, auto design centres and special auto parks
NATRiPs
• Set up at a total cost of USD388.5 million to enable the industry to be on par with global
standards
• Nine R&D centres of excellence with focus on low-cost manufacturing and product
development solutions
Dept. of Heavy
Industries & Public
Enterprises
• Worked towards reduction of excise duty on small cars and increase budgetary allocation
for R&D
• Weighted increase in R&D expenditure to 200 per cent from 150 per cent (in-house) and
175 per cent from 125 per cent (outsourced)
Notes: SME – Small and Medium Enterprises, R&D - Research and Development, NATRiP – National Automotive Testing and R&D
Infrastructure Project, AMP - Automotive Mission, JNNURM - Jawaharlal Nehru National Urban Renewal Mission
Union Budget FY14 • Proposal to allocate USD2.7 billion for JNNURM to bolster sales volumes of Medium and
Heavy Commercial Vehicles (MHCV)
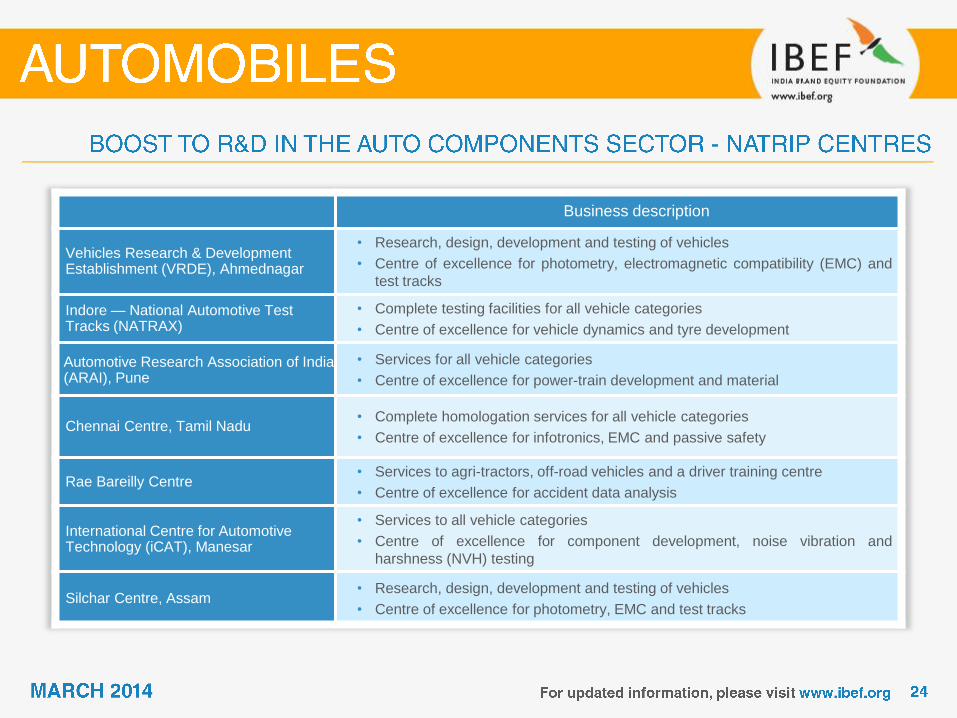
• Business description
Vehicles Research & Development Establishment (VRDE), Ahmednagar
• Research, design, development and testing of vehicles
• Centre of excellence for photometry, electromagnetic compatibility (EMC) and
test tracks
Indore — National Automotive Test Tracks (NATRAX)
• Complete testing facilities for all vehicle categories
• Centre of excellence for vehicle dynamics and tyre development
Automotive Research Association of India (ARAI), Pune
• Services for all vehicle categories
• Centre of excellence for power-train development and material
Chennai Centre, Tamil Nadu • Complete homologation services for all vehicle categories
• Centre of excellence for infotronics, EMC and passive safety
Rae Bareilly Centre • Services to agri-tractors, off-road vehicles and a driver training centre
• Centre of excellence for accident data analysis
International Centre for Automotive Technology (iCAT), Manesar
• Services to all vehicle categories
• Centre of excellence for component development, noise vibration and
harshness (NVH) testing
Silchar Centre, Assam • Research, design, development and testing of vehicles
• Centre of excellence for photometry, EMC and test tracks
Source: ACMA, Aranca Research
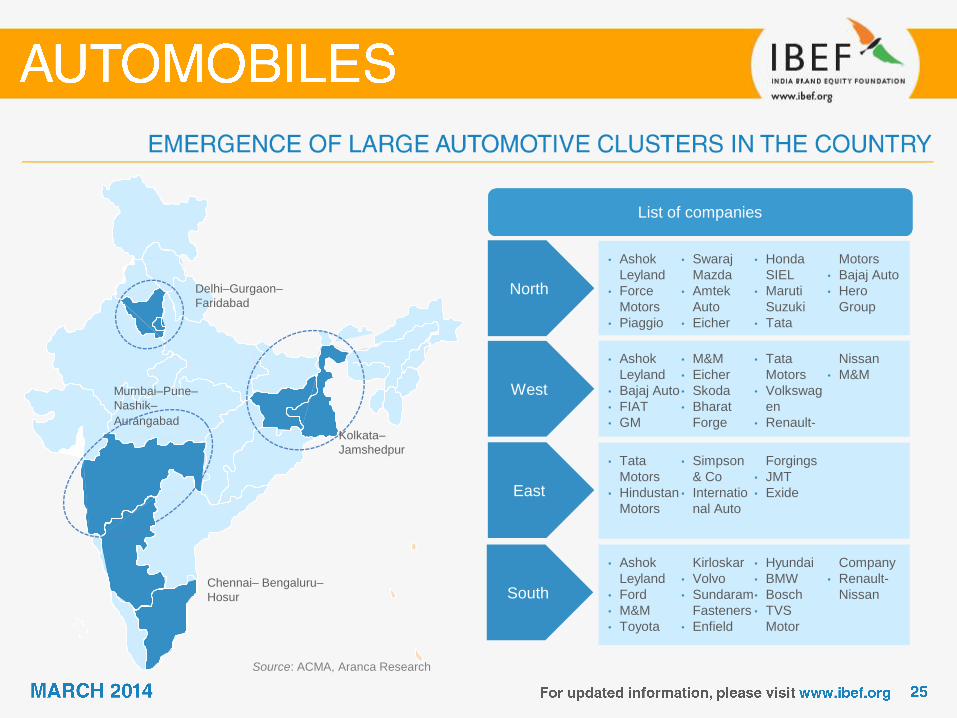
Delhi–Gurgaon–
Faridabad
Kolkata–
Jamshedpur
Chennai– Bengaluru–
Hosur
Mumbai–Pune–
Nashik–
Aurangabad
List of companies
North
West
East
South
• Ashok
Leyland
• Force
Motors
• Piaggio
• Swaraj
Mazda
• Amtek
Auto
• Eicher
• Honda
SIEL
• Maruti
Suzuki
• Tata
Motors
• Bajaj Auto
• Hero
Group
• Ashok
Leyland
• Bajaj Auto
• FIAT
• GM
• M&M
• Eicher
• Skoda
• Bharat
Forge
• Tata
Motors
• Volkswag
en
• Renault-
Nissan
• M&M
• Tata
Motors
• Hindustan
Motors
• Simpson
& Co
• Internatio
nal Auto
Forgings
• JMT
• Exide
• Ashok
Leyland
• Ford
• M&M
• Toyota
Kirloskar
• Volvo
• Sundaram
Fasteners
• Enfield
• Hyundai
• BMW
• Bosch
• TVS
Motor
Company
• Renault-
Nissan
Source: Aranca Research
Note: All figures as of 2011-12
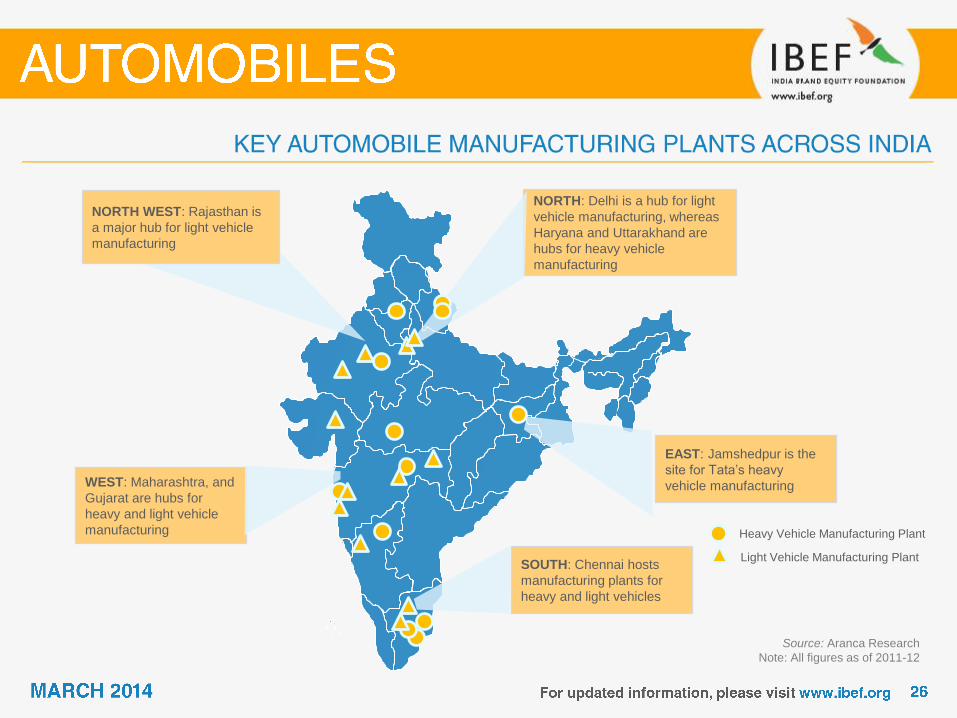
WEST: Maharashtra, and
Gujarat are hubs for
heavy and light vehicle
manufacturing
EAST: Jamshedpur is the
site for Tata’s heavy
vehicle manufacturing
SOUTH: Chennai hosts
manufacturing plants for
heavy and light vehicles
NORTH WEST: Rajasthan is
a major hub for light vehicle
manufacturing
NORTH: Delhi is a hub for light
vehicle manufacturing, whereas
Haryana and Uttarakhand are
hubs for heavy vehicle
manufacturing
Heavy Vehicle Manufacturing Plant
Light Vehicle Manufacturing Plant
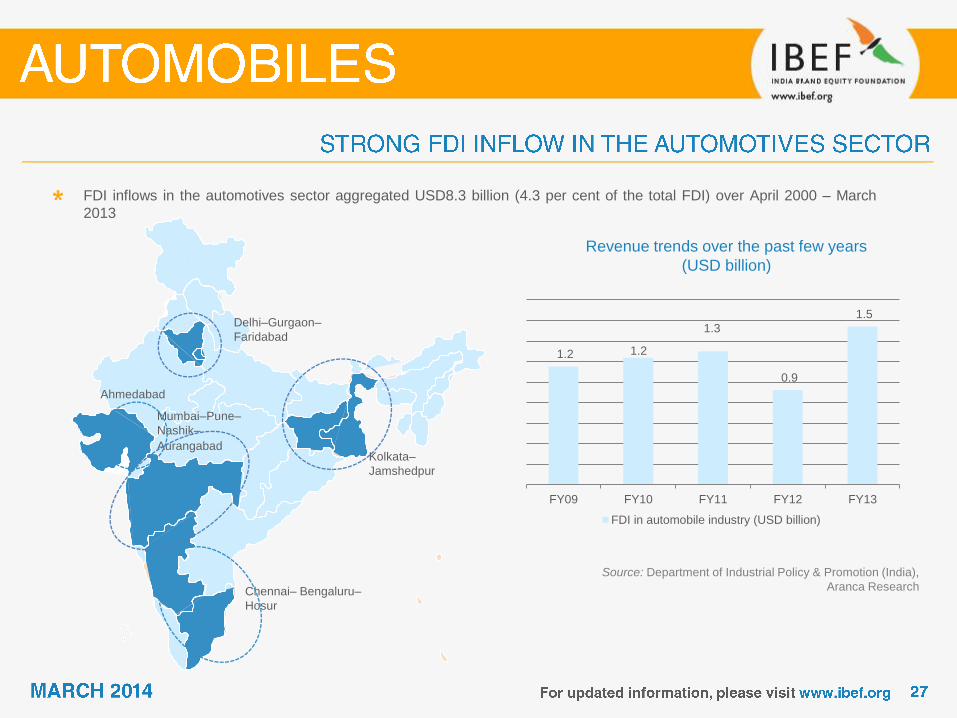
Revenue trends over the past few years
(USD billion)
Source: Department of Industrial Policy & Promotion (India),
Aranca Research
FDI inflows in the automotives sector aggregated USD8.3 billion (4.3 per cent of the total FDI) over April 2000 – March
2013
1.2 1.2
1.3
0.9
1.5
FY09 FY10 FY11 FY12 FY13
FDI in automobile industry (USD billion)
Delhi–Gurgaon–
Faridabad
Kolkata–
Jamshedpur
Chennai– Bengaluru–
Hosur
Mumbai–Pune–
Nashik–
Aurangabad
Ahmedabad
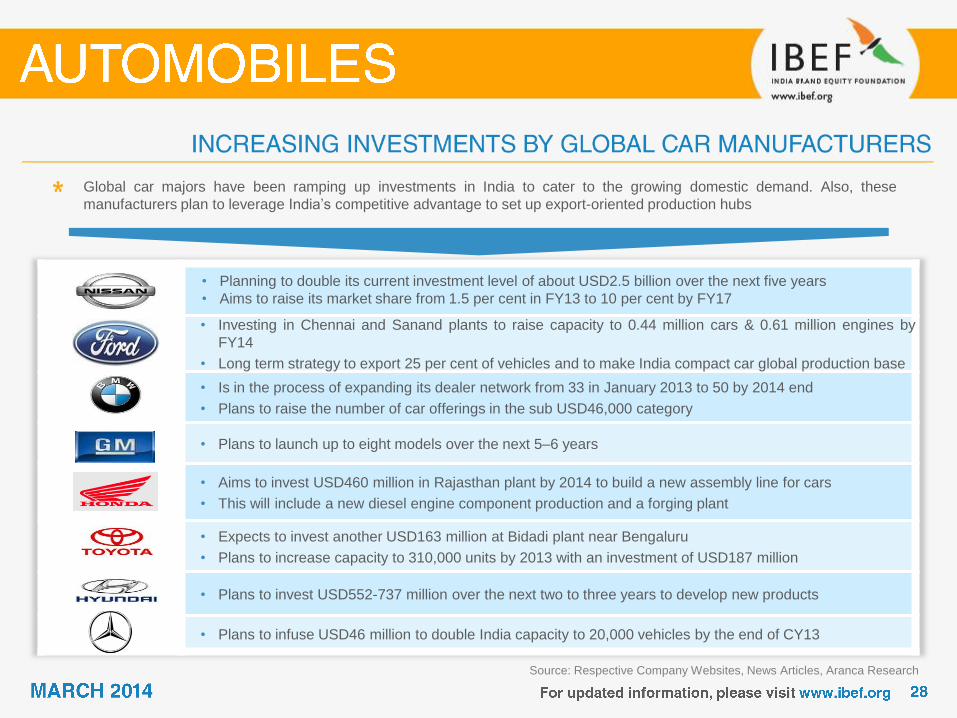
Source: Respective Company Websites, News Articles, Aranca Research
Global car majors have been ramping up investments in India to cater to the growing domestic demand. Also, these
manufacturers plan to leverage India’s competitive advantage to set up export-oriented production hubs
• Planning to double its current investment level of about USD2.5 billion over the next five years
• Aims to raise its market share from 1.5 per cent in FY13 to 10 per cent by FY17
• Investing in Chennai and Sanand plants to raise capacity to 0.44 million cars & 0.61 million engines by
FY14
• Long term strategy to export 25 per cent of vehicles and to make India compact car global production base
• Is in the process of expanding its dealer network from 33 in January 2013 to 50 by 2014 end
• Plans to raise the number of car offerings in the sub USD46,000 category
• Plans to launch up to eight models over the next 5–6 years
• Aims to invest USD460 million in Rajasthan plant by 2014 to build a new assembly line for cars
• This will include a new diesel engine component production and a forging plant
• Expects to invest another USD163 million at Bidadi plant near Bengaluru
• Plans to increase capacity to 310,000 units by 2013 with an investment of USD187 million
• Plans to invest USD552-737 million over the next two to three years to develop new products
• Plans to infuse USD46 million to double India capacity to 20,000 vehicles by the end of CY13
Source: Company Website, Aranca Research
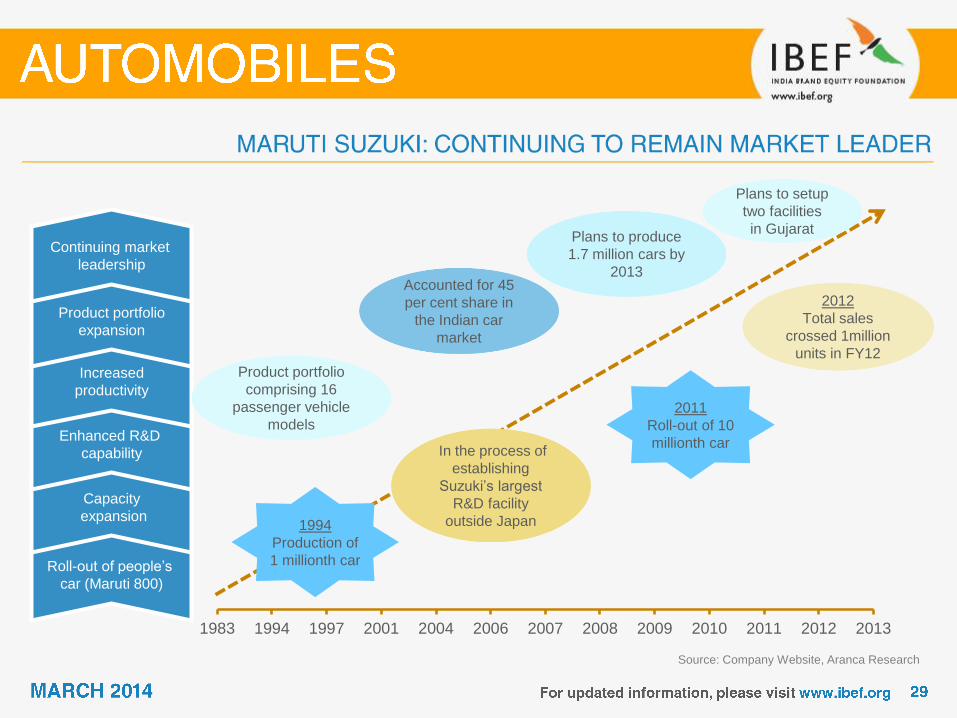
1983 1994 1997 2001 2004 2006 2007 2008 2009 2010 2011 2012 2013
Roll-out of people’s
car (Maruti 800)
Capacity
expansion
Enhanced R&D
capability
Increased
productivity
Product portfolio
expansion
Continuing market
leadership
Product portfolio
comprising 16
passenger vehicle
models
Accounted for 45
per cent share in
the Indian car
market
Plans to produce
1.7 million cars by
2013
2011
Roll-out of 10
millionth car
1994
Production of
1 millionth car
In the process of
establishing
Suzuki’s largest
R&D facility
outside Japan
2012
Total sales
crossed 1million
units in FY12
Plans to setup
two facilities
in Gujarat
Source: Company Website, Aranca Research
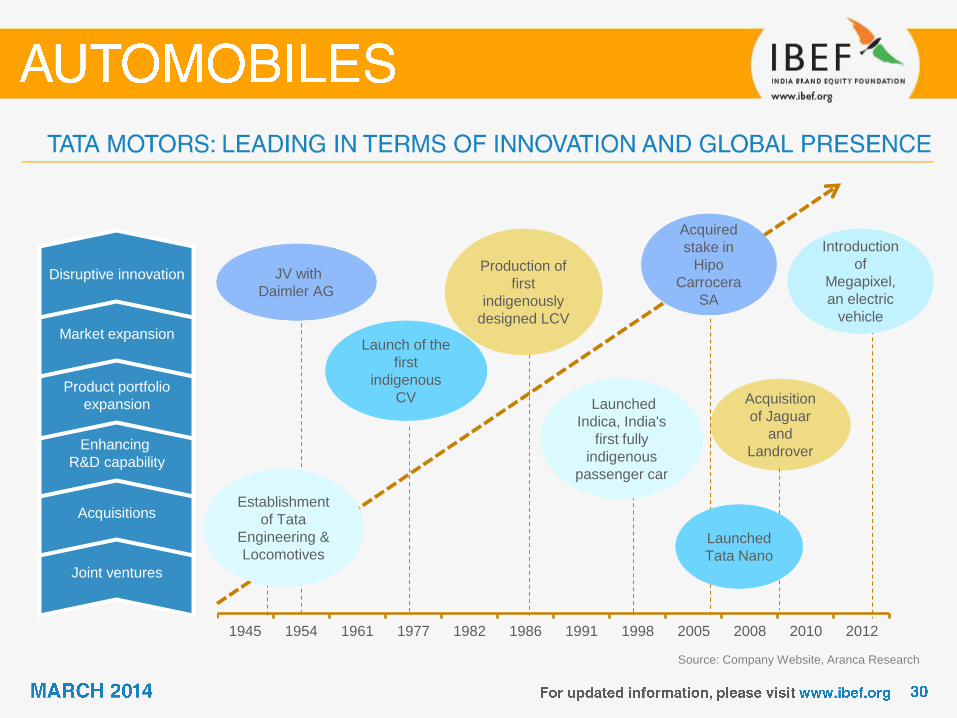
1945 1954 1961 1977 1982 1986 1991 1998 2005 2008 2010 2012
Joint ventures
Acquisitions
Enhancing
R&D capability
Product portfolio
expansion
Market expansion
Disruptive innovation JV with
Daimler AG
Production of
first
indigenously
designed LCV
Acquisition
of Jaguar
and
Landrover
Acquired
stake in
Hipo
Carrocera
SA
Launched
Indica, India's
first fully
indigenous
passenger car
Establishment
of Tata
Engineering &
Locomotives
Launch of the
first
indigenous
CV
Introduction
of
Megapixel,
an electric
vehicle
Launched
Tata Nano
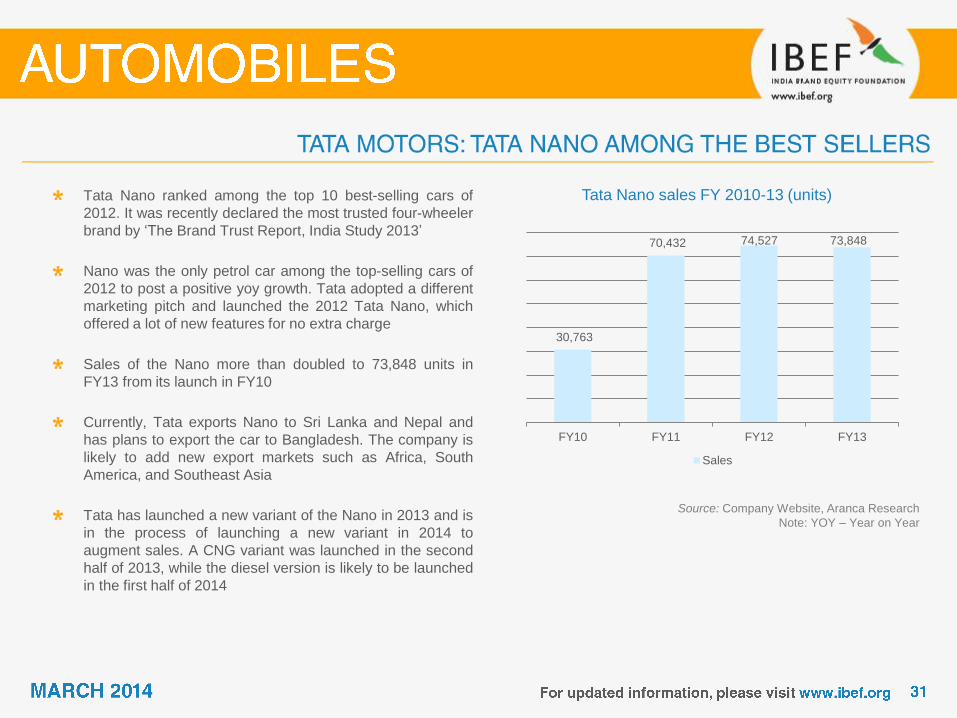
Tata Nano sales FY 2010-13 (units)
Source: Company Website, Aranca Research
Note: YOY – Year on Year
Tata Nano ranked among the top 10 best-selling cars of
2012. It was recently declared the most trusted four-wheeler
brand by ‘The Brand Trust Report, India Study 2013’
Nano was the only petrol car among the top-selling cars of
2012 to post a positive yoy growth. Tata adopted a different
marketing pitch and launched the 2012 Tata Nano, which
offered a lot of new features for no extra charge
Sales of the Nano more than doubled to 73,848 units in
FY13 from its launch in FY10
Currently, Tata exports Nano to Sri Lanka and Nepal and
has plans to export the car to Bangladesh. The company is
likely to add new export markets such as Africa, South
America, and Southeast Asia
Tata has launched a new variant of the Nano in 2013 and is
in the process of launching a new variant in 2014 to
augment sales. A CNG variant was launched in the second
half of 2013, while the diesel version is likely to be launched
in the first half of 2014
30,763
70,432 74,527 73,848
FY10 FY11 FY12 FY13
Sales
65 87 117
145 149 178
231 230
298
377
483
563
331
FY
02
FY
03
FY
04
FY
05
FY
06
FY
07
FY
08
FY
09
FY
10
FY
11
FY
12
FY
13
8M
FY
14
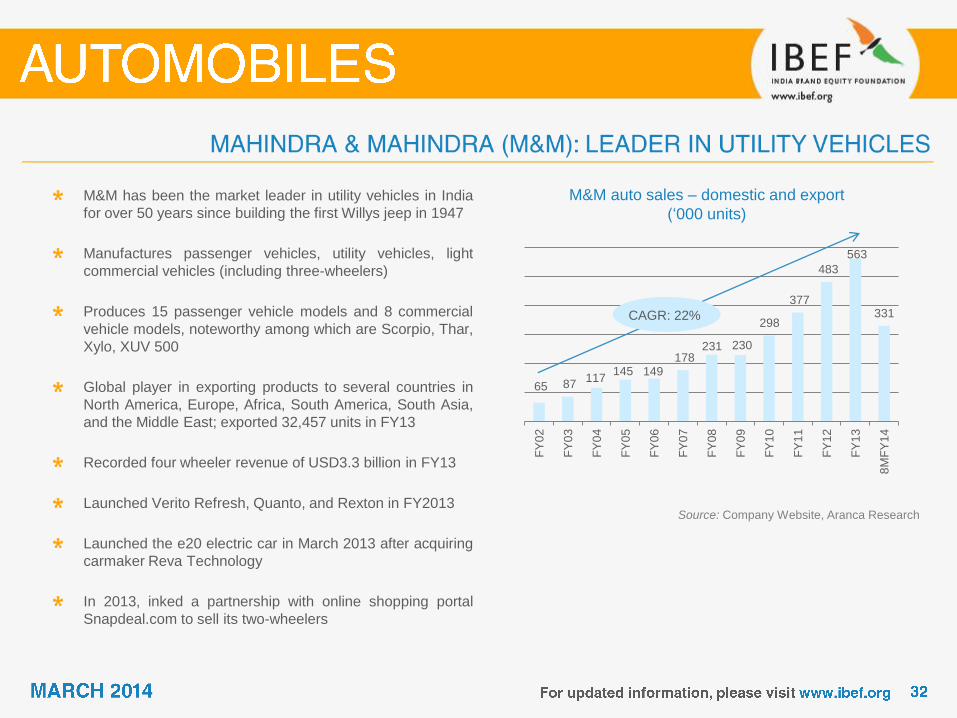
M&M auto sales – domestic and export
(‘000 units)
Source: Company Website, Aranca Research
M&M has been the market leader in utility vehicles in India
for over 50 years since building the first Willys jeep in 1947
Manufactures passenger vehicles, utility vehicles, light
commercial vehicles (including three-wheelers)
Produces 15 passenger vehicle models and 8 commercial
vehicle models, noteworthy among which are Scorpio, Thar,
Xylo, XUV 500
Global player in exporting products to several countries in
North America, Europe, Africa, South America, South Asia,
and the Middle East; exported 32,457 units in FY13
Recorded four wheeler revenue of USD3.3 billion in FY13
Launched Verito Refresh, Quanto, and Rexton in FY2013
Launched the e20 electric car in March 2013 after acquiring
carmaker Reva Technology
In 2013, inked a partnership with online shopping portal
Snapdeal.com to sell its two-wheelers
CAGR: 22%
Note: M&M – Mahindra & Mahindra
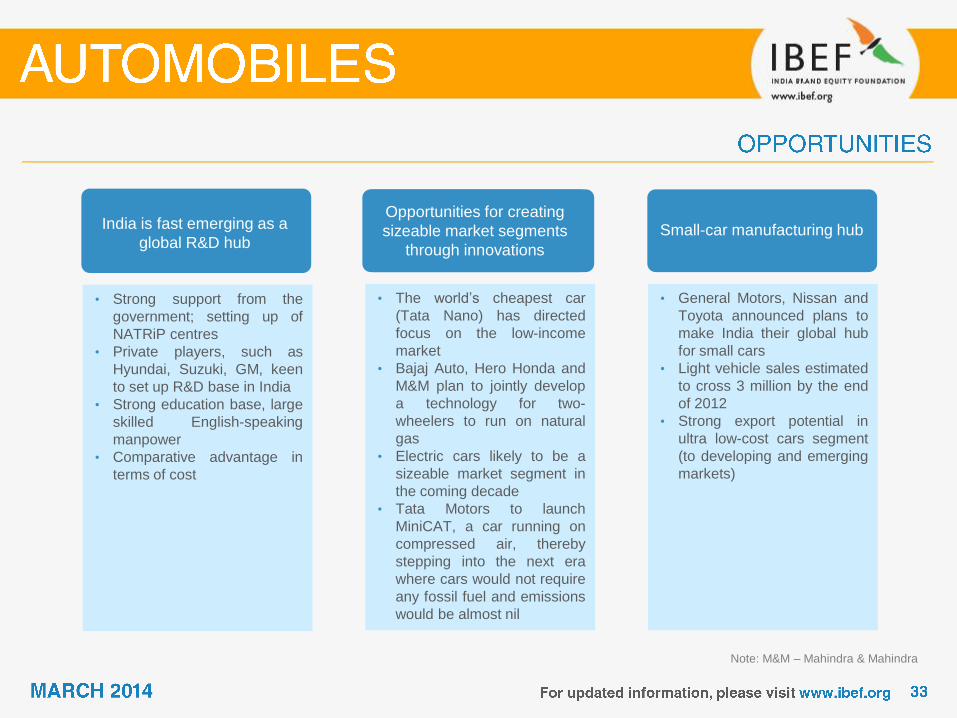
• Strong support from the
government; setting up of
NATRiP centres
• Private players, such as
Hyundai, Suzuki, GM, keen
to set up R&D base in India
• Strong education base, large
skilled English-speaking
manpower
• Comparative advantage in
terms of cost
• The world’s cheapest car
(Tata Nano) has directed
focus on the low-income
market
• Bajaj Auto, Hero Honda and
M&M plan to jointly develop
a technology for two-
wheelers to run on natural
gas
• Electric cars likely to be a
sizeable market segment in
the coming decade
• Tata Motors to launch
MiniCAT, a car running on
compressed air, thereby
stepping into the next era
where cars would not require
any fossil fuel and emissions
would be almost nil
• General Motors, Nissan and
Toyota announced plans to
make India their global hub
for small cars
• Light vehicle sales estimated
to cross 3 million by the end
of 2012
• Strong export potential in
ultra low-cost cars segment
(to developing and emerging
markets)
India is fast emerging as a
global R&D hub
Opportunities for creating
sizeable market segments
through innovations
Small-car manufacturing hub
Society of Indian Automobile Manufacturers (SIAM)
Core 4-B, 5th Floor, India Habitat Centre
Lodhi Road, New Delhi – 110 003
India
Phone: 91 11 24647810–2
Fax: 91 11 24648222
E-mail: [email protected]
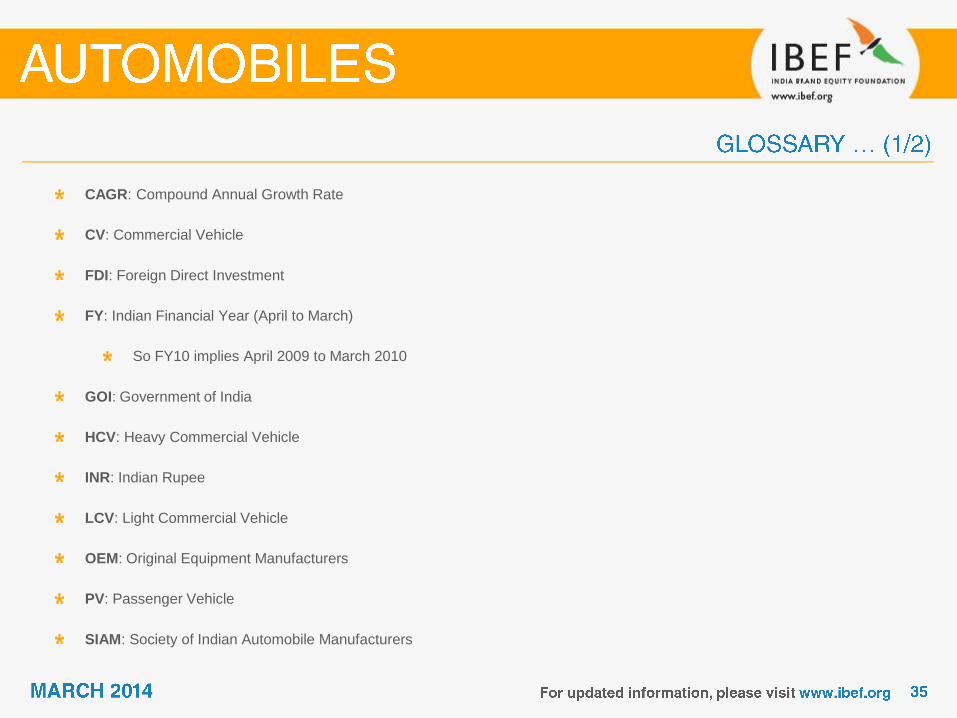
CAGR: Compound Annual Growth Rate
CV: Commercial Vehicle
FDI: Foreign Direct Investment
FY: Indian Financial Year (April to March)
So FY10 implies April 2009 to March 2010
GOI: Government of India
HCV: Heavy Commercial Vehicle
INR: Indian Rupee
LCV: Light Commercial Vehicle
OEM: Original Equipment Manufacturers
PV: Passenger Vehicle
SIAM: Society of Indian Automobile Manufacturers
ULCC: Ultra Low Cost Car
USD: US Dollar
Wherever applicable, numbers have been rounded off to the nearest whole number
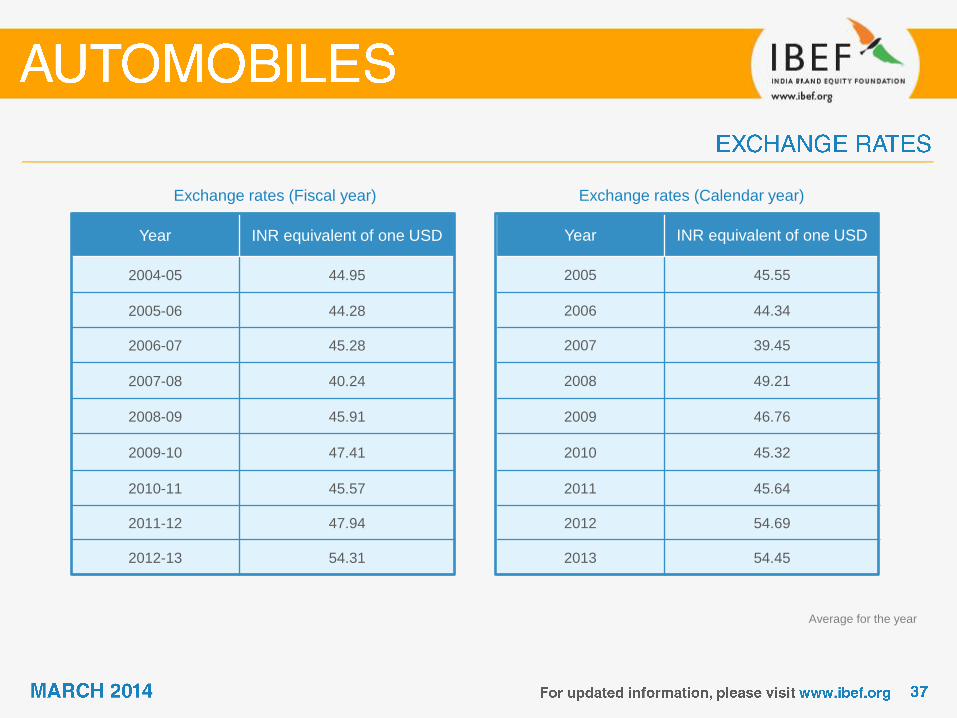
Year INR equivalent of one USD
2004-05 44.95
2005-06 44.28
2006-07 45.28
2007-08 40.24
2008-09 45.91
2009-10 47.41
2010-11 45.57
2011-12 47.94
2012-13 54.31
Exchange rates (Fiscal year)
Year INR equivalent of one USD
2005 45.55
2006 44.34
2007 39.45
2008 49.21
2009 46.76
2010 45.32
2011 45.64
2012 54.69
2013 54.45
Exchange rates (Calendar year)
Average for the year
India Brand Equity Foundation (“IBEF”) engaged Aranca to prepare this presentation and the same has been prepared
by Aranca in consultation with IBEF.
All rights reserved. All copyright in this presentation and related works is solely and exclusively owned by IBEF. The
same may not be reproduced, wholly or in part in any material form (including photocopying or storing it in any medium
by electronic means and whether or not transiently or incidentally to some other use of this presentation), modified or in
any manner communicated to any third party except with the written approval of IBEF.
This presentation is for information purposes only. While due care has been taken during the compilation of this
presentation to ensure that the information is accurate to the best of Aranca and IBEF’s knowledge and belief, the
content is not to be construed in any manner whatsoever as a substitute for professional advice.
Aranca and IBEF neither recommend nor endorse any specific products or services that may have been mentioned in
this presentation and nor do they assume any liability or responsibility for the outcome of decisions taken as a result of
any reliance placed on this presentation.
Neither Aranca nor IBEF shall be liable for any direct or indirect damages that may arise due to any act or omission on
the part of the user due to any reliance placed or guidance taken from any portion of this presentation.
Related Documents