Australasian Journal of Educational Technology, 2013, 29(2). 172 ascilite Mining interactions in immersive learning environments for real-time student feedback Gregor Kennedy, Ioanna Ioannou, Yun Zhou, James Bailey & Stephen O’Leary The University of Melbourne, Australia The analysis and use of data generated by students’ interactions with learning systems or programs – learning analytics – has recently gained widespread attention in the educational technology community. Part of the reason for this interest is based on the potential of learning analytic techniques such as data mining to find hidden patterns in students’ online interactions that can be meaningfully interpreted and then fed back to students in a way that supports their learning. In this paper we present an investigation of how the digital data records of students’ interactions within an immersive 3D environment can be mined, modeled and analysed, to provide real-time formative feedback to students as they complete simulated surgical tasks. The issues that emerged in this investigation as well as areas for further research and development are discussed. Introduction: analytics rising In recent years we have seen increased interest in the use of ‘learning’ or ‘academic’ analytics in education. It seems that after a long period of quiet contemplation, a mass of researchers, practitioners and administrators in the higher education and educational technology communities suddenly realized they were sitting on gold mines of electronic data that could be useful in understanding a range of educational processes. Like any gold rush, there has been a flurry of activity and interest as people gravitate towards the new boom. After being absent from the widely referred to Horizon Report, prepared annually by the New Media Consortium, analytics first appeared on the radar in 2011 and was touted as four to five years away from adoption. This year’s Australian Horizon Report predicted that analytics is one year or less away from widespread adoption (Johnson, Adams & Cummins, 2012). While often proffering optimistic predictions, the Horizon Report does reflect the topics and issues that, at a single point in time, are in the frontal lobes of the educational technology community. And it seems from 2011 ‘analytics’ was it. Early educational writing on analytics tended to focus on how information in University databases could be used to support institutional reporting and decision-making. An area that received initial interest was how data from institutional repositories could be harnessed to predict students who were at risk. As Goldstein (2005) argued, in a competitive, resource-constrained environment, Universities are under “pressure to maximize student retention and shorten time to graduation” (p. 1). For example, in their paper on academic analytics, Campbell, DeBlois and Oblinger (2007) provide a number of examples where institutions in the United States have made use of data such as GPA, SAT scores, visits to campus, and students’ use of the learning management system to predict outcomes such as students who are at risk and student retention. Similarly, Arnold (2010) reports on a system at Purdue University called “Signals”, which takes data from the University’s central systems and, using algorithms, “generates a risk level with supporting information for each student, represented by a green, yellow or red indicator (p. 2). In an Australian context, the University of New England recently developed the “Automated Wellness Engine” which shares some of the same goals. Just prior to these developments, educational technology researchers became interested in how small and large sized teaching and learning tools could be used to capture data that could be used to support their understanding of students’ learning processes in electronic learning environments. In the early 2000s educational technology researchers such as Phillips, Baudains and van Keulen (2002) and Kennedy and Judd (2008) harvested data from electronic learning environments and used them to describe how students were completing learning activities. Some of these data were based on students’ activities within learning management systems such as number of hits, the amount of time students were logged on, and frequencies of interactions. Researchers such as Judd and Kennedy (2008) sought to use similar kinds of data to find patterns in students’ interactions within interactive multimedia programs (Kennedy & Judd, 2008). This research into the more fine grained, micro-level behaviour of students within electronic

Welcome message from author
This document is posted to help you gain knowledge. Please leave a comment to let me know what you think about it! Share it to your friends and learn new things together.
Transcript
Australasian Journal of Educational Technology, 2013, 29(2).
172
ascilite
Mining interactions in immersive learning environments for real-time student feedback Gregor Kennedy, Ioanna Ioannou, Yun Zhou, James Bailey & Stephen O’Leary The University of Melbourne, Australia
The analysis and use of data generated by students’ interactions with learning systems or programs – learning analytics – has recently gained widespread attention in the educational technology community. Part of the reason for this interest is based on the potential of learning analytic techniques such as data mining to find hidden patterns in students’ online interactions that can be meaningfully interpreted and then fed back to students in a way that supports their learning. In this paper we present an investigation of how the digital data records of students’ interactions within an immersive 3D environment can be mined, modeled and analysed, to provide real-time formative feedback to students as they complete simulated surgical tasks. The issues that emerged in this investigation as well as areas for further research and development are discussed.
Introduction: analytics rising In recent years we have seen increased interest in the use of ‘learning’ or ‘academic’ analytics in education. It seems that after a long period of quiet contemplation, a mass of researchers, practitioners and administrators in the higher education and educational technology communities suddenly realized they were sitting on gold mines of electronic data that could be useful in understanding a range of educational processes. Like any gold rush, there has been a flurry of activity and interest as people gravitate towards the new boom. After being absent from the widely referred to Horizon Report, prepared annually by the New Media Consortium, analytics first appeared on the radar in 2011 and was touted as four to five years away from adoption. This year’s Australian Horizon Report predicted that analytics is one year or less away from widespread adoption (Johnson, Adams & Cummins, 2012). While often proffering optimistic predictions, the Horizon Report does reflect the topics and issues that, at a single point in time, are in the frontal lobes of the educational technology community. And it seems from 2011 ‘analytics’ was it. Early educational writing on analytics tended to focus on how information in University databases could be used to support institutional reporting and decision-making. An area that received initial interest was how data from institutional repositories could be harnessed to predict students who were at risk. As Goldstein (2005) argued, in a competitive, resource-constrained environment, Universities are under “pressure to maximize student retention and shorten time to graduation” (p. 1). For example, in their paper on academic analytics, Campbell, DeBlois and Oblinger (2007) provide a number of examples where institutions in the United States have made use of data such as GPA, SAT scores, visits to campus, and students’ use of the learning management system to predict outcomes such as students who are at risk and student retention. Similarly, Arnold (2010) reports on a system at Purdue University called “Signals”, which takes data from the University’s central systems and, using algorithms, “generates a risk level with supporting information for each student, represented by a green, yellow or red indicator (p. 2). In an Australian context, the University of New England recently developed the “Automated Wellness Engine” which shares some of the same goals. Just prior to these developments, educational technology researchers became interested in how small and large sized teaching and learning tools could be used to capture data that could be used to support their understanding of students’ learning processes in electronic learning environments. In the early 2000s educational technology researchers such as Phillips, Baudains and van Keulen (2002) and Kennedy and Judd (2008) harvested data from electronic learning environments and used them to describe how students were completing learning activities. Some of these data were based on students’ activities within learning management systems such as number of hits, the amount of time students were logged on, and frequencies of interactions. Researchers such as Judd and Kennedy (2008) sought to use similar kinds of data to find patterns in students’ interactions within interactive multimedia programs (Kennedy & Judd, 2008). This research into the more fine grained, micro-level behaviour of students within electronic
Australasian Journal of Educational Technology, 2013, 29(2).
173
learning systems was different to, but shared many similarities with, the macro, institutional level analytic approach described above. The need to parse, analyse, meaningfully interpret and report on large, complex data sets that had been digitally generated by learning and administrative systems was common to both. However the differences between these two types of analytic endeavours have recently caused researchers to make a useful distinction between ‘Academic Analytics’ on the one hand and ‘Learning Analytics’ on the other. The recently formed Society for Learning Analytics Research [SOLAR] (Siemens et al., 2011) suggests that:
Learning Analytics is the measurement, collection, analysis and reporting of data about learners and their contexts for the purposes of understanding and optimizing learning, and the environments in which it occurs …[while]… Academic Analytics is the improvement of organizational processes, workflows, resource allocation, and institutional measurement through the use of learner, academic, and institutional data. (p. 4)
Siemens et al. (2011), like Siemens and Long (2011), suggested that the target audience for these distinct analytic endeavours is different. Learning analytics is more focussed on providing an analysis to the learner, the educator and the teacher while academic analytics is more focused on providing advice to managers, administrators and funders. The focus of this paper is on the application of learning analytics in an immersive simulation-based learning environment. It considers how data mining techniques can be used with large data sets generated by a simulation-based learning environment to generate meaningful, real-time feedback to students as they complete a complex educational task. Learning analytics in education technology: a short history The field of academic or learning analytics is seen as relatively new (Long & Siemens, 2011; Olmos & Corrin, 2012), based in part on the size and type of data being analysed (see Long and Siemens, 2011). However, the investigation and characterisation of students’ learning processes based on digitally generated user data – and the subsequent use of these characterizations for the purpose of student feedback – has a short but significant history in education. Two areas of educational technology research and development dominate here: Intelligent Tutoring Systems and User Interaction or Interactivity Research. Intelligent tutoring systems (ITS) emerged in the 1970s after the educational technology community’s sustained interest in ‘Computer Aided Instruction’. Where Computer Aided Instruction programs were often based on simple drill and practice tasks, the goal of ITS was to “engage the students in sustained reasoning activity and to interact with the student based on a deep understanding of the student’s behavior.” (Corbett, Koedinger & Anderson, 1997, p. 850). A fundamental aim of ITS is to use artificial intelligence techniques to understand what students are doing with a piece of educational software so that advice and feedback can be provided to them to assist with their learning and understanding. Most ITS are based on establishing an ‘expert model’ of interactions and inputs to the system that represents the ideal or optimal path or pathways through an educational task. This expert model may be used to create a ‘pedagogical model’, which is used to construct an ideal educational process for individual learners (see Beck, Stern & Haugsjaa, 1996). The system then records and analyses the behaviour, interactions and inputs of the student, which forms an individual ‘student model’. Crudely, by comparing the student model to either the expert or the pedagogical model for a particular task, the ITS can determine the difference between the two models – for example, where steps are not completed, where inputted data is incorrect, or where stages of a procedure are out of order – and provide intelligent, individualized feedback. The learning activities upon which ITS are based often reflect tasks that have discrete steps or stages. As Van Lehn (2006) suggests “most tutoring consists of a chronological sequence of tasks that the student does with the aid of the tutor” (p. 228). While these learning activities and tasks can be used to support a range of types of learning outcomes – declarative, conceptual and procedural knowledge and
Australasian Journal of Educational Technology, 2013, 29(2).
174
understanding – the discrete and staged nature of the activities makes them amenable to the application of ITS. We do not mean to imply that these applications of ITS are simple; far from it. ITS often use sophisticated methods (e.g. Bayesian networks) to model very complex scenarios (e.g. complex physics or biomedical simulations) in order to determine both the expert and the student model. However, despite the clear success of some ITS, a number of researchers have noted that, for a variety of reasons, the ITS movement is yet to live up to its educational promise (Corbett et al.,1997; Dede, 2008). Cumming and McDougall (2000) go as far to say that by the late 1980s “ITSs were recognised as narrow and brittle” (p. 198). In more mainstream educational technology research, user interaction or interactivity researchers have used log files or audit trails to gather data on students’ learning experiences in electronic environments. Weaver, Kemm, Petrovic, Harris and Delbridge (1999) created a multimedia program to help students learn about biological control systems and used audit trails to track how they went about the task of building models of these systems. Kennedy and Judd (2008) used a cluster analysis of students’ interview interactions with a virtual patient to show how there were clear groups of students within a single cohort that reflected different types of interactions. They suggested these groups had implications for both the design of the learning program and the nature of what different students may be able to learn from it. In a web-based environment, researchers have used log files or the tools within learning management systems to track how students interact and engage with both content (lecture recordings, lecture notes, web pages) and other students in activities like discussion forums (see, for example, Phillips et al., 2002; Dawson, McWilliam, & Tan 2008; Dawson, 2006a, 2006b; Dawson, Bakharia, & Heathcote, 2010). While interactivity researchers often note the educational benefit that could come from providing students themselves (or possibly their teachers) with any analysis of their own learning behaviour and interactions, typically this feedback loop is not completed. This represents something of a ‘holy grail’ for interactivity researchers in the educational technology community. Previous interactive educational programs have displayed limited adaptivity – the notion that the program would come to genuinely know or understand the student user and adapt or respond to his or her needs like an expert teacher or facilitator would (see Jonassen, 1985). When adaptivity was built into a system, it typically amounted to directing students to different parts of a referentially structured program on the basis of their past responses or performance. While ITS made a better fist of both feedback and adaptivity by employing more sophisticated expert and student models in complex domains, as mentioned above, these systems and techniques have not enjoyed widespread use. In short, the highly valued educational technology characteristics of genuinely intelligent feedback and adaptivity remain elusive. Using mined data to provide real time feedback This brief history highlights that the field of educational technology has had a sustained interest in characterising students’ learning processes based on digitally generated user data and then using this to inform either the student, the designers of educational programs or students’ teachers. The lessons from these past research and development activities provide useful background for those with a new-found interest in learning and academic analytics. Our review also shows that in many cases the use of students’ on-task data is either relatively unsophisticated or is not used to provide immediate formative feedback to students while they are completing an educational task. For example, Computer Aided Instruction feedback is often very simple, while within the area of interaction research, the analysis of students’ interactions is typically completed long after the students have exited the system, if not the course. More sophisticated Intelligent Tutoring Systems, such as those based on Bayesian networks, implemented in complex domains fare better (see for example, Conati, Gertner, VanLehn & Druzdzel, 1997; Gamboa & Fred, 2001). However, such models are based on a priori knowledge not only of what specific ‘input variables’ should lead to students’ success in any domain (the basis of the expert or pedagogical models) but also on the varied interdependencies between these input variables. This approach becomes problematic in domains where the experts find it difficult to fully articulate the input variables that lead to success (for example, factors predicting variations in surgical technique, elements involved in successful, high pressure decision-making). Data mining approaches, grounded in the behaviour and interactions of both expert practitioners and novice students become very useful in this context. There are few examples of researchers using data mining techniques in the provision of real-time
Australasian Journal of Educational Technology, 2013, 29(2).
175
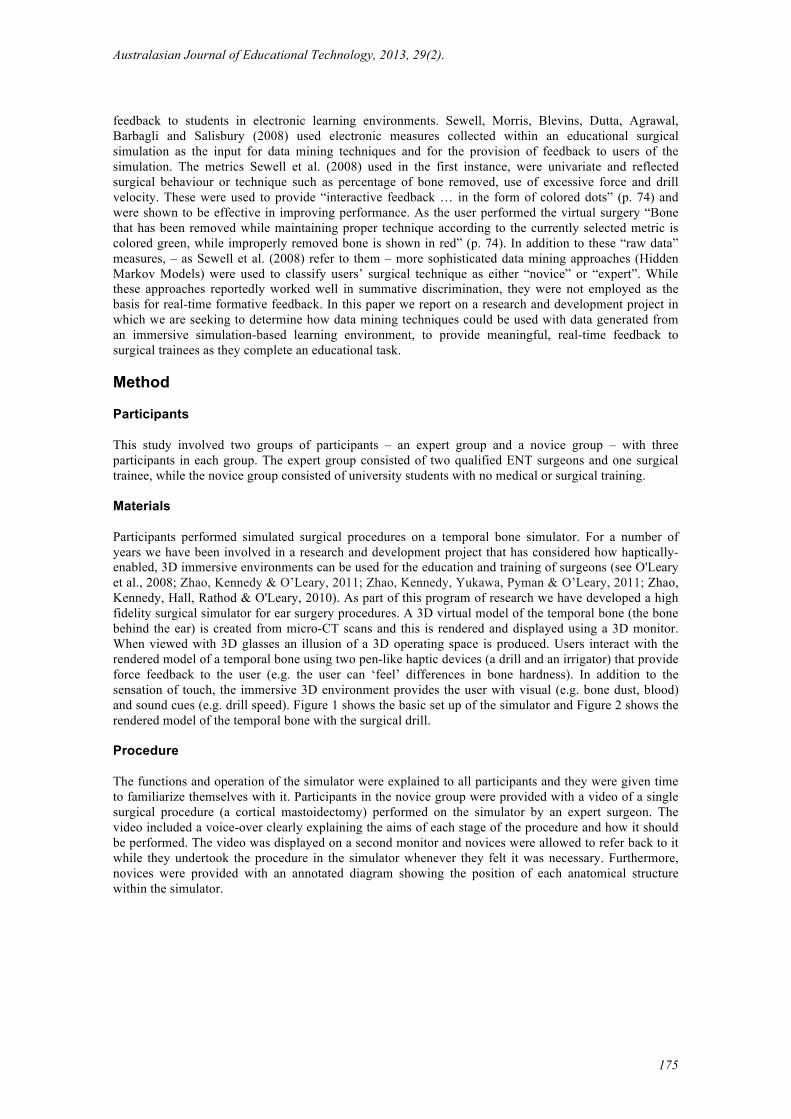
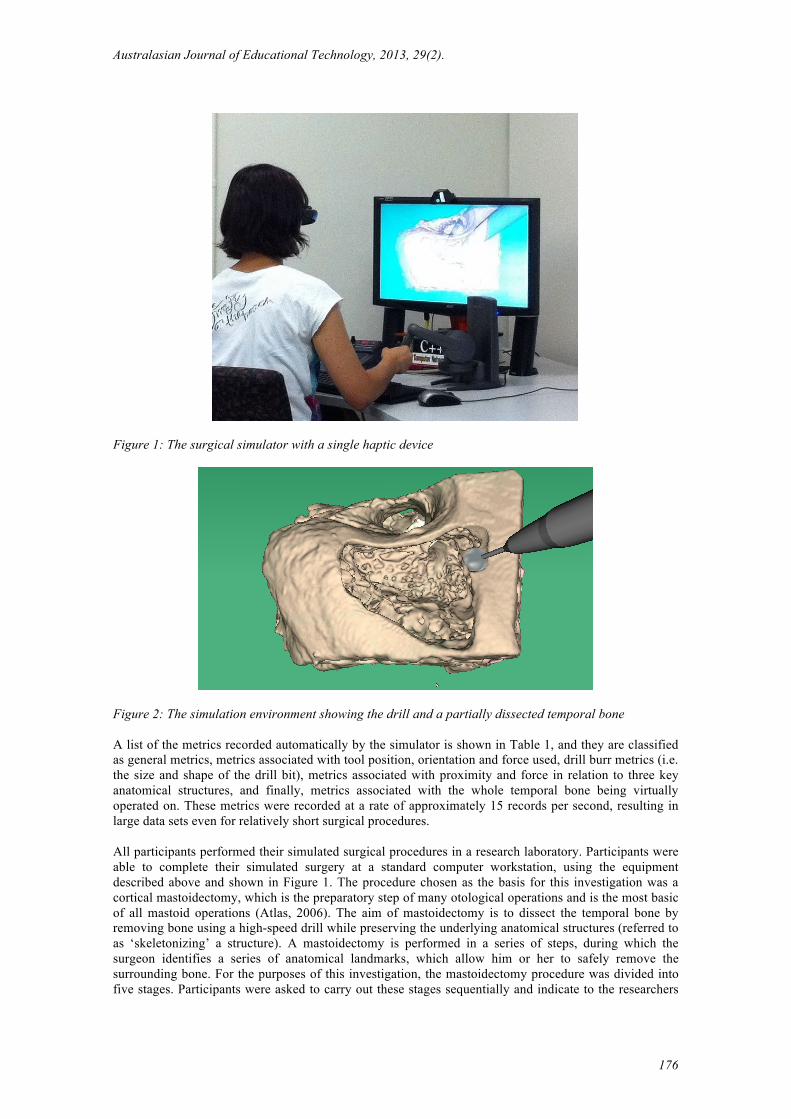
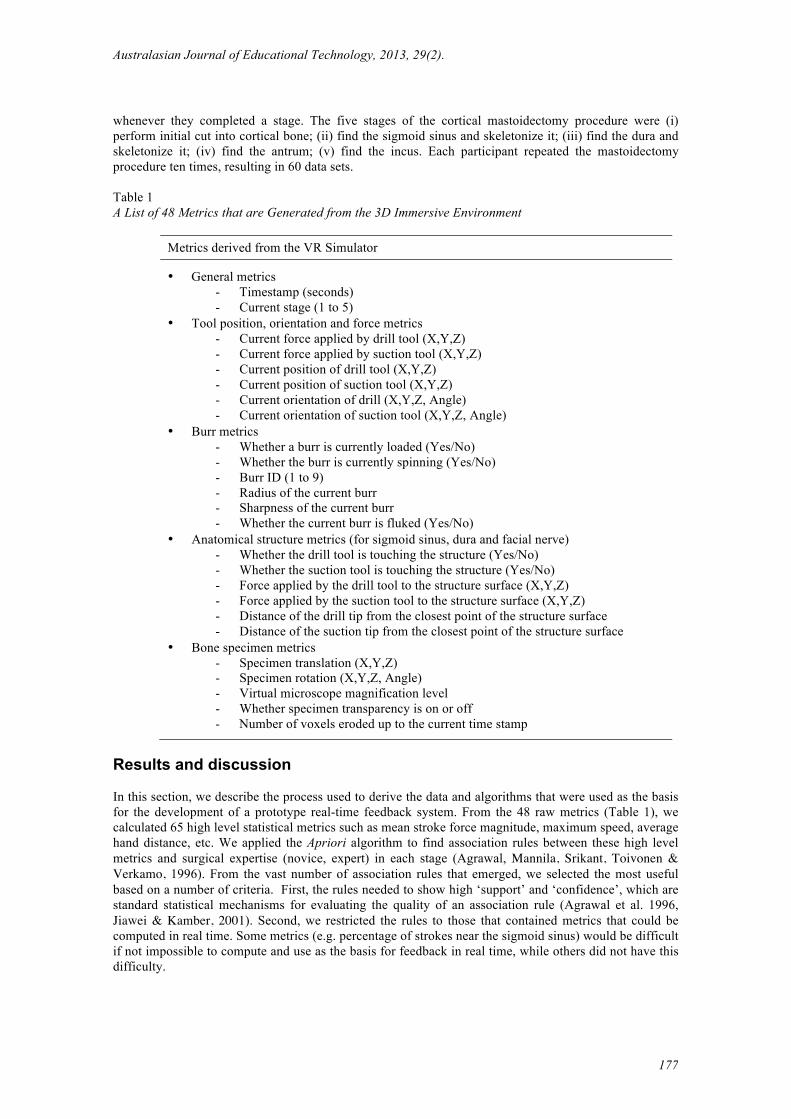
feedback to students in electronic learning environments. Sewell, Morris, Blevins, Dutta, Agrawal, Barbagli and Salisbury (2008) used electronic measures collected within an educational surgical simulation as the input for data mining techniques and for the provision of feedback to users of the simulation. The metrics Sewell et al. (2008) used in the first instance, were univariate and reflected surgical behaviour or technique such as percentage of bone removed, use of excessive force and drill velocity. These were used to provide “interactive feedback … in the form of colored dots” (p. 74) and were shown to be effective in improving performance. As the user performed the virtual surgery “Bone that has been removed while maintaining proper technique according to the currently selected metric is colored green, while improperly removed bone is shown in red” (p. 74). In addition to these “raw data” measures, – as Sewell et al. (2008) refer to them – more sophisticated data mining approaches (Hidden Markov Models) were used to classify users’ surgical technique as either “novice” or “expert”. While these approaches reportedly worked well in summative discrimination, they were not employed as the basis for real-time formative feedback. In this paper we report on a research and development project in which we are seeking to determine how data mining techniques could be used with data generated from an immersive simulation-based learning environment, to provide meaningful, real-time feedback to surgical trainees as they complete an educational task. Method Participants This study involved two groups of participants – an expert group and a novice group – with three participants in each group. The expert group consisted of two qualified ENT surgeons and one surgical trainee, while the novice group consisted of university students with no medical or surgical training. Materials Participants performed simulated surgical procedures on a temporal bone simulator. For a number of years we have been involved in a research and development project that has considered how haptically-enabled, 3D immersive environments can be used for the education and training of surgeons (see O'Leary et al., 2008; Zhao, Kennedy & O’Leary, 2011; Zhao, Kennedy, Yukawa, Pyman & O’Leary, 2011; Zhao, Kennedy, Hall, Rathod & O'Leary, 2010). As part of this program of research we have developed a high fidelity surgical simulator for ear surgery procedures. A 3D virtual model of the temporal bone (the bone behind the ear) is created from micro-CT scans and this is rendered and displayed using a 3D monitor. When viewed with 3D glasses an illusion of a 3D operating space is produced. Users interact with the rendered model of a temporal bone using two pen-like haptic devices (a drill and an irrigator) that provide force feedback to the user (e.g. the user can ‘feel’ differences in bone hardness). In addition to the sensation of touch, the immersive 3D environment provides the user with visual (e.g. bone dust, blood) and sound cues (e.g. drill speed). Figure 1 shows the basic set up of the simulator and Figure 2 shows the rendered model of the temporal bone with the surgical drill. Procedure The functions and operation of the simulator were explained to all participants and they were given time to familiarize themselves with it. Participants in the novice group were provided with a video of a single surgical procedure (a cortical mastoidectomy) performed on the simulator by an expert surgeon. The video included a voice-over clearly explaining the aims of each stage of the procedure and how it should be performed. The video was displayed on a second monitor and novices were allowed to refer back to it while they undertook the procedure in the simulator whenever they felt it was necessary. Furthermore, novices were provided with an annotated diagram showing the position of each anatomical structure within the simulator.
Australasian Journal of Educational Technology, 2013, 29(2).
176
Figure 1: The surgical simulator with a single haptic device
Figure 2: The simulation environment showing the drill and a partially dissected temporal bone A list of the metrics recorded automatically by the simulator is shown in Table 1, and they are classified as general metrics, metrics associated with tool position, orientation and force used, drill burr metrics (i.e. the size and shape of the drill bit), metrics associated with proximity and force in relation to three key anatomical structures, and finally, metrics associated with the whole temporal bone being virtually operated on. These metrics were recorded at a rate of approximately 15 records per second, resulting in large data sets even for relatively short surgical procedures. All participants performed their simulated surgical procedures in a research laboratory. Participants were able to complete their simulated surgery at a standard computer workstation, using the equipment described above and shown in Figure 1. The procedure chosen as the basis for this investigation was a cortical mastoidectomy, which is the preparatory step of many otological operations and is the most basic of all mastoid operations (Atlas, 2006). The aim of mastoidectomy is to dissect the temporal bone by removing bone using a high-speed drill while preserving the underlying anatomical structures (referred to as ‘skeletonizing’ a structure). A mastoidectomy is performed in a series of steps, during which the surgeon identifies a series of anatomical landmarks, which allow him or her to safely remove the surrounding bone. For the purposes of this investigation, the mastoidectomy procedure was divided into five stages. Participants were asked to carry out these stages sequentially and indicate to the researchers
Australasian Journal of Educational Technology, 2013, 29(2).
177
whenever they completed a stage. The five stages of the cortical mastoidectomy procedure were (i) perform initial cut into cortical bone; (ii) find the sigmoid sinus and skeletonize it; (iii) find the dura and skeletonize it; (iv) find the antrum; (v) find the incus. Each participant repeated the mastoidectomy procedure ten times, resulting in 60 data sets.
Table 1 A List of 48 Metrics that are Generated from the 3D Immersive Environment
Metrics derived from the VR Simulator
• General metrics - Timestamp (seconds) - Current stage (1 to 5)
• Tool position, orientation and force metrics - Current force applied by drill tool (X,Y,Z) - Current force applied by suction tool (X,Y,Z) - Current position of drill tool (X,Y,Z) - Current position of suction tool (X,Y,Z) - Current orientation of drill (X,Y,Z, Angle) - Current orientation of suction tool (X,Y,Z, Angle)
• Burr metrics - Whether a burr is currently loaded (Yes/No) - Whether the burr is currently spinning (Yes/No) - Burr ID (1 to 9) - Radius of the current burr - Sharpness of the current burr - Whether the current burr is fluked (Yes/No)
• Anatomical structure metrics (for sigmoid sinus, dura and facial nerve) - Whether the drill tool is touching the structure (Yes/No) - Whether the suction tool is touching the structure (Yes/No) - Force applied by the drill tool to the structure surface (X,Y,Z) - Force applied by the suction tool to the structure surface (X,Y,Z) - Distance of the drill tip from the closest point of the structure surface - Distance of the suction tip from the closest point of the structure surface
• Bone specimen metrics - Specimen translation (X,Y,Z) - Specimen rotation (X,Y,Z, Angle) - Virtual microscope magnification level - Whether specimen transparency is on or off - Number of voxels eroded up to the current time stamp
Results and discussion In this section, we describe the process used to derive the data and algorithms that were used as the basis for the development of a prototype real-time feedback system. From the 48 raw metrics (Table 1), we calculated 65 high level statistical metrics such as mean stroke force magnitude, maximum speed, average hand distance, etc. We applied the Apriori algorithm to find association rules between these high level metrics and surgical expertise (novice, expert) in each stage (Agrawal, Mannila, Srikant, Toivonen & Verkamo, 1996). From the vast number of association rules that emerged, we selected the most useful based on a number of criteria. First, the rules needed to show high ‘support’ and ‘confidence’, which are standard statistical mechanisms for evaluating the quality of an association rule (Agrawal et al. 1996, Jiawei & Kamber, 2001). Second, we restricted the rules to those that contained metrics that could be computed in real time. Some metrics (e.g. percentage of strokes near the sigmoid sinus) would be difficult if not impossible to compute and use as the basis for feedback in real time, while others did not have this difficulty.
Australasian Journal of Educational Technology, 2013, 29(2).
178
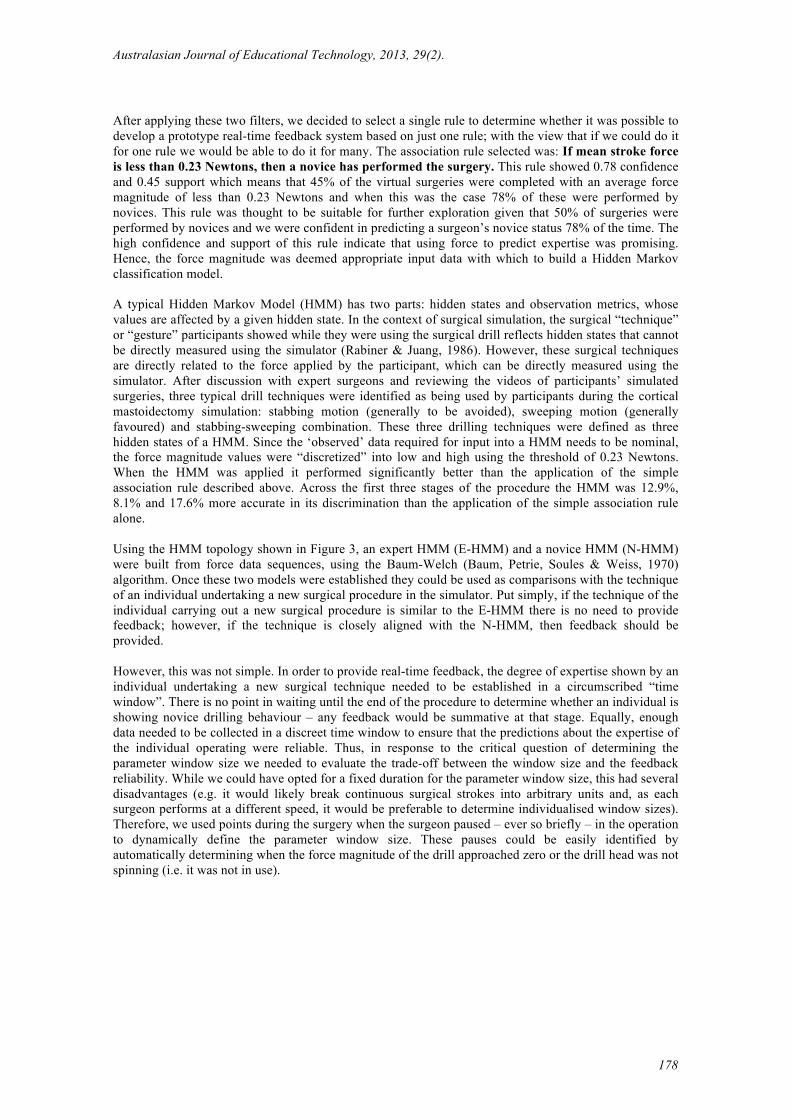
After applying these two filters, we decided to select a single rule to determine whether it was possible to develop a prototype real-time feedback system based on just one rule; with the view that if we could do it for one rule we would be able to do it for many. The association rule selected was: If mean stroke force is less than 0.23 Newtons, then a novice has performed the surgery. This rule showed 0.78 confidence and 0.45 support which means that 45% of the virtual surgeries were completed with an average force magnitude of less than 0.23 Newtons and when this was the case 78% of these were performed by novices. This rule was thought to be suitable for further exploration given that 50% of surgeries were performed by novices and we were confident in predicting a surgeon’s novice status 78% of the time. The high confidence and support of this rule indicate that using force to predict expertise was promising. Hence, the force magnitude was deemed appropriate input data with which to build a Hidden Markov classification model. A typical Hidden Markov Model (HMM) has two parts: hidden states and observation metrics, whose values are affected by a given hidden state. In the context of surgical simulation, the surgical “technique” or “gesture” participants showed while they were using the surgical drill reflects hidden states that cannot be directly measured using the simulator (Rabiner & Juang, 1986). However, these surgical techniques are directly related to the force applied by the participant, which can be directly measured using the simulator. After discussion with expert surgeons and reviewing the videos of participants’ simulated surgeries, three typical drill techniques were identified as being used by participants during the cortical mastoidectomy simulation: stabbing motion (generally to be avoided), sweeping motion (generally favoured) and stabbing-sweeping combination. These three drilling techniques were defined as three hidden states of a HMM. Since the ‘observed’ data required for input into a HMM needs to be nominal, the force magnitude values were “discretized” into low and high using the threshold of 0.23 Newtons. When the HMM was applied it performed significantly better than the application of the simple association rule described above. Across the first three stages of the procedure the HMM was 12.9%, 8.1% and 17.6% more accurate in its discrimination than the application of the simple association rule alone. Using the HMM topology shown in Figure 3, an expert HMM (E-HMM) and a novice HMM (N-HMM) were built from force data sequences, using the Baum-Welch (Baum, Petrie, Soules & Weiss, 1970) algorithm. Once these two models were established they could be used as comparisons with the technique of an individual undertaking a new surgical procedure in the simulator. Put simply, if the technique of the individual carrying out a new surgical procedure is similar to the E-HMM there is no need to provide feedback; however, if the technique is closely aligned with the N-HMM, then feedback should be provided. However, this was not simple. In order to provide real-time feedback, the degree of expertise shown by an individual undertaking a new surgical technique needed to be established in a circumscribed “time window”. There is no point in waiting until the end of the procedure to determine whether an individual is showing novice drilling behaviour – any feedback would be summative at that stage. Equally, enough data needed to be collected in a discreet time window to ensure that the predictions about the expertise of the individual operating were reliable. Thus, in response to the critical question of determining the parameter window size we needed to evaluate the trade-off between the window size and the feedback reliability. While we could have opted for a fixed duration for the parameter window size, this had several disadvantages (e.g. it would likely break continuous surgical strokes into arbitrary units and, as each surgeon performs at a different speed, it would be preferable to determine individualised window sizes). Therefore, we used points during the surgery when the surgeon paused – ever so briefly – in the operation to dynamically define the parameter window size. These pauses could be easily identified by automatically determining when the force magnitude of the drill approached zero or the drill head was not spinning (i.e. it was not in use).
Australasian Journal of Educational Technology, 2013, 29(2).
179
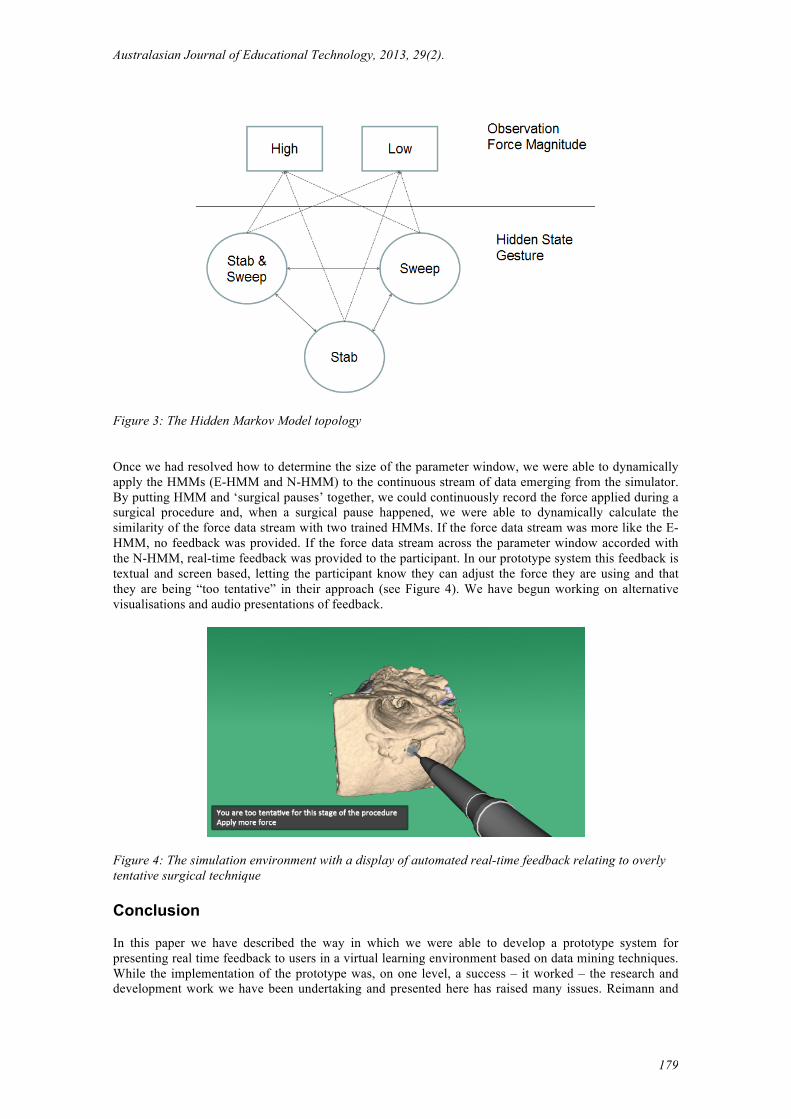
Figure 3: The Hidden Markov Model topology Once we had resolved how to determine the size of the parameter window, we were able to dynamically apply the HMMs (E-HMM and N-HMM) to the continuous stream of data emerging from the simulator. By putting HMM and ‘surgical pauses’ together, we could continuously record the force applied during a surgical procedure and, when a surgical pause happened, we were able to dynamically calculate the similarity of the force data stream with two trained HMMs. If the force data stream was more like the E-HMM, no feedback was provided. If the force data stream across the parameter window accorded with the N-HMM, real-time feedback was provided to the participant. In our prototype system this feedback is textual and screen based, letting the participant know they can adjust the force they are using and that they are being “too tentative” in their approach (see Figure 4). We have begun working on alternative visualisations and audio presentations of feedback.
Figure 4: The simulation environment with a display of automated real-time feedback relating to overly tentative surgical technique Conclusion In this paper we have described the way in which we were able to develop a prototype system for presenting real time feedback to users in a virtual learning environment based on data mining techniques. While the implementation of the prototype was, on one level, a success – it worked – the research and development work we have been undertaking and presented here has raised many issues. Reimann and
Australasian Journal of Educational Technology, 2013, 29(2).
180
Markauskaite (2010) indicate that there are numerous technical, legal and methodological considerations to be dealt with when using educational technology data that are “flowing in streams” (p. 259) and we have encountered some of these in this project. The three principal challenges we encountered in the development of the prototype were: • Meaningfulness. As has been noted by others, it is relatively simple to automatically collect data
from digital learning environments, but it is more difficult to meaningfully interpret this data and present it to the end user. By using association rules and data mining techniques we were able to build sophisticated expert and novice models of surgical technique. However, being statistically generated, these rules and models were agnostic when it came to meaning, and we constantly needed to draw on the advice of expert surgeons to interpret the models. While the ‘bottom-up’ statistics could be used to discriminate novice and expert surgical technique, the rule or model was only useful if it could be (i) meaningfully interpreted, ‘top down’ by an expert surgeon and (ii) meaningfully displayed as feedback to the end user.
• Temporality. As mentioned above, a critical component of the development of the system was to determine the appropriate window size for recording and analyzing users’ data in real time. There was a need to have a time-window size that allowed enough information to be collected to make a robust diagnostic decision, but at the same time not have a time-window that was so long that it delayed feedback to the user, to the extent that it became summative.
• Openness. There were challenges associated with working within an open educational technology system where users could essentially do whatever they wished as opposed to more constrained procedural educational technology systems that are defined by a sequential, step-wise approach to complex domains. The openness of the system meant that there was considerable noise in the data that may not have been apparent with a more closed system.
In addition to these challenges, the development and implementation of this prototype system raises many questions that will be the subject of future research. A key focus of our future research will be on how multiple surgical technique variables, rules and models can be used – analysed and interpreted – as the basis for meaningful real-time feedback to end users. This will require us to consider the issue of how to most adequately display complex user-performance information to individuals as they engage in simulation-based education and training. This is of course, not a new issue, and research in the area of human factors and human-computer interaction will provide some direction in this area. These represent significant challenges in our future research. However, these challenges are worth striving to overcome, as there would be clear advantages to be gained from determining how the mining of data streams from complex, virtual learning environments could be used to provide meaningful, real-time feedback to users. In the current context of surgical education and training, an expert surgeon is typically required to provide feedback as tasks are undertaken by novice trainees. The provision of meaningful real-time feedback in simulated training could offer significant savings in terms of expert surgeon time and scarce cadavers. This would allow the immersive simulator described in this project to be employed as a self-directed learning tool in basic training, prior to students receiving more tailored instruction with an expert surgeon on cadavers or in the operating room. Acknowledgements The research and development presented in this paper was generously supported by The Garnett Passe and Rodney Williams Memorial Foundation and the Institute for a Broadband Enabled Society at the University of Melbourne. References
Agrawal, R., Mannila, H., Srikant, R., Toivonen, H. & Verkamp, A. I. (1996). Fast discovery of
association rules. Advances in knowledge discovery and data mining,12, 307-328. Arnold, K. (2010). Signals: Applying academic analytics. Education Quarterly, 33(1). Retrieved from:
http://www.educause.edu/ero/article/signals-applying-academic-analytics

Australasian Journal of Educational Technology, 2013, 29(2).
181
Atlas M, E. R. (2006). A Guide to Temporal Bone Dissection. Western Australia: Lions Ear and Hearing Institute.
Baum, L. E., Petrie, T., Soules, G. & Weiss, N. (1970). A maximization technique occurring in the
statistical analysis of probabilistic functions of Markov chains. The annals of mathematical statistics, 41, 164-171. Retrieved from http://www.audiblemagic.com/pdf/US7877438.pdf
Beck, J., Stern, M., & Haugsjaa, E. (1996). Applications of AI in education. ACM Crossroads, 11-15. Campbell, J. P., DeBlois, P. B., & Oblinger, D. G. (2007). Academic Analytics: A New Tool for a New
Era. EDUCAUSE Review, 42(4), 40-57. Conati, C. C., Gertner, A. S., VanLehn, K. K., & Druzdzel, M. J. (1997). On-Line Student Modeling for
Coached Problem Solving Using Bayesian Networks. Courses And Lectures- International Centre For Mechanical Sciences, (383), 231-242.
Corbett, A., Koedinger, K. & Anderson, J. (1997). Intelligent Tutoring Systems. In M. Helander, T. K.
Landauer & P. Prabhu (Eds.), Handbook of Human-Computer Interaction, Second, Completely Revised Edition (pp. 849–874). Elsevier.
Cumming, G., & McDougall, A. (2000). Mainstreaming AIED into education? International Journal of
Artificial Intelligence in Education, 11, 197–207. Retrieved from http://hal.archives-ouvertes.fr/docs/00/19/73/31/PDF/cumming00.pdf
Dawson, S. (2006a). The impact of institutional surveillance technologies on student behaviour.
Surveillance and Society, 4(1/2), 69–84. Retrieved from http://eprints.qut.edu.au/archive/00012342/01/12342.pdf
Dawson, S. (2006b). Relationship between student communication interaction and sense of community in
higher education. Internet and Higher Education, 9(3), 153–162. Retrieved from http://www.sciencedirect.com/science/article/pii/S1096751606000388
Dawson, S., Bakharia, A. & Heathcote, E. (2010). SNAPP: Realising the affordances of real-time SNA
within networked learning environments. In L. Dirckinck-Holmfeld, V. Hodgson, C. Jones, M. de Laat, D. McConnell & T. Ryberg (Eds.), Proceedings of the 7th International Conference on Networked Learning. Aalborg, Denmark.
Dawson, S., McWilliam, E. & Tan, J. P.L. (2008). Teaching smarter: How mining ICT data can inform
and improve learning and teaching practice. In R. Atkinson & C. McBeath (Eds.), Hello! Where are you in the landscape of educational technology? (pp. 221–230). Proceedings of the 25th annual Australasian Society for Computers in Learning in Tertiary Education 2008 conference, Deakin University, Melbourne, 30 November–3 December. Retrieved from http://ascilite.org.au/conferences/melbourne08/procs/dawson.pdf
Dede, C. (2008). Theoretical perspectives influencing the use of information technology in teaching and
learning. In J. Voogt, G. Knezek (Eds.). International Handbook of Information Technology in Primary and Secondary Education (pp. 43-62). New York: Springer.
Gamboa, H., & Fred, A. (2001). Designing intelligent tutoring systems: A Bayesian approach. In ICEIS
01, 3rd International conference on enterprise information systems (pp. 452–458). Setubal, Portugal: Kluwer.
Goldstein, P. J. (2005). Academic analytics: The uses of management information and technology in
higher education. Boulder: EDUCAUSE Center for Applied Research. Retrieved from http://net.educause.edu/ir/library/pdf/EKF/EKF0508.pdf
Jiawei, H. & Kamber, M. (2001). Data mining: concepts and techniques. San Francisco, CA: Morgan
Kaufmann.
Australasian Journal of Educational Technology, 2013, 29(2).
182
Johnson, L., Adams, S. & Cummins, M. (2012). The NMC Horizon Report: 2012 Higher Education
Edition. Austin, Texas: The New Media Consortium. Jonassen, D. H. (1985). Interactive Lesson Designs: A Taxonomy. Educational Technology, 25(6), 7-17. Kennedy, G. E. & Judd, T. S. (2004). Making sense of audit trail data. Australasian Journal of
Educational Technology, 20(1), 18–32. Retrieved from http://www.ascilite.org.au/ajet/ajet20/kennedy.html
O'Leary, S., Hutchins, M. A., Stevenson, D. R., Gunn, C., Krumpholz, A., Kennedy, G. E., Tykocinski,
M., Dahm, M., & Pyman, B. (2008). Validation of a networked virtual reality simulation of temporal bone surgery. The Laryngoscope, 118 (6), 1040-1046.
Olmos, M. & Corrin, L. (2012) Academic analytics in a medical curriculum: Enabling educational
excellence. Australasian Journal of Educational Technology, 28 (1), 1-15. Phillips, R.A., Baudains, C. & van Keulen, M. (2002). An evaluation of student learning in a web-
supported unit on plant diversity. In A. Williamson, C. Gunn, A. Young & T. Clear (Eds.), Winds of change in the sea of learning (pp. 525–534). Proceedings of the 19th annual Australasian Society for Computers in Learning in Tertiary Education 2002 conference, UNITEC Institute of Technology, Auckland, New Zealand, 8–11 December. Retrieved from www.ascilite.org.au/conferences/auckland02/proceedings/papers/161.pdf
Reimann, P. & Markauskaite, L. (2010). New Learning - Old Methods? How E-research Might Change
Technology - Enhanced Learning Research . In Khine, M. S. & Saleh, I. M. (Eds.), New Science of Learning: Computers, Cognition and Collaboration in Education (pp. 249–272), New York: Springer.
Rabiner, L. & Juang, B. (1986). An introduction to hidden Markov models. ASSP Magazine, IEEE, 3(1),
4-16. Retrieved from http://dip.sun.ac.za/~herbst/MachineLearning/ExtraNotes/rabiner.pdf Sewell, C., Morris, D., Blevins, N.H., Dutta, S., Agrawal, S., Barbagli, F. & Salisbury, K. (2008).
Providing metrics and performance feedback in a surgical simulator. Computer Aided Surgery, 13 (2), 63-81.
Siemens, G., Gasevic, D., Haythornthwaite, C., Dawson, S., Buckingham Shum, S., Ferguson, R., et al.
(2011) Open Learning Analytics: An Integrated and Modularized Platform (Concept Paper): SOLAR. Siemens, G., & Long, P. (2011). Penetrating the Fog: Analytics in Learning and Education. EDUCAUSE
Review, 46(5), 30-32. VanLehn, K. (2006). The Behavior of Tutoring Systems. International Journal Of Artificial Intelligence
In Education, 16(3), 227-265. Retrieved from http://iospress.metapress.com/content/al6r85mm7c6qf7dr/
Weaver, D.A, Kemm, R.E., Petrovic, T., Harris, P.J. & Delbridge, L.M. (1999). Learning about control
systems by model building — A biological case study. In J. Winn (Ed.). Responding to Diversity Proceedings ASCILITE ‘99 (pp. 381-389). Queensland: University of Technology.
Zhao, Y., Kennedy, G., & O’Leary, S. (2011). Can virtual reality simulator be used as a training aid to
improve cadaver temporal bone dissection? Results of a randomized blinded control trial. The Laryngoscope, 121 (4), 831-837.
Zhao Y, Kennedy G, Yukawa, K., Pyman, B., & O’Leary S. (2011). Improving Temporal Bone
Dissection Using Self-Directed Virtual Reality Simulation. Otolaryngology Head and Neck Surgery, 144 (3), 357 - 364.
Zhao, Y., Kennedy, G., Hall, R., Rathod, H. & O'Leary, S. (2010). Differentiating levels of surgical

Australasian Journal of Educational Technology, 2013, 29(2).
183
experience on a virtual reality temporal bone simulator. Otolaryngology--Head And Neck Surgery: Official Journal Of American Academy Of Otolaryngology-Head And Neck Surgery, 143(5 Suppl 3), S30-S35.
Corresponding author: Gregor Kennedy, [email protected]
Australasian Journal of Educational Technology © 2013.
Please cite as: Kennedy, G., Ioannou, I., Zhou, Y., Bailey, J., & O’Leary, S. (2013). Mining interactions in immersive learning environments for real-time student feedback. Australasian Journal of Educational Technology, 29(2), 172-183.
Related Documents