1 Transport of Asian trace gases via eddy shedding from the Asian summer monsoon 1 anticyclone and associated impacts on ozone heating rates 2 Suvarna Fadnavis 1 , Chaitri Roy 1 , Rajib Chattopadhyay 1 , Christopher E. Sioris 2 , Alexandru 3 Rap 3 , Rolf Müller 4 , K. Ravi Kumar 5 and Raghavan Krishnan 1 4 1 Indian Institute of Tropical Meteorology, Pune, India 5 2 Environment and Climate Change, Toronto, Canada 6 3 School of Earth and Environment, University of Leeds, Leeds, United Kingdom 7 4 Forschungszentrum Jülich GmbH, IEK-7, Jülich, Germany 8 5 King Abdullah University of Science and Technology, Thuwal, Saudi Arabia 9 *Email of corresponding author: [email protected] 10 Abstract: 11 The highly vibrant Asian Summer Monsoon (ASM) anticyclone plays an important role in 12 efficient transport of Asian tropospheric air masses to the extratropical upper troposphere and 13 lower stratosphere (UTLS). In this paper, we demonstrate long-range transport of Asian trace 14 gases via eddy shedding events using MIPAS (Michelson Interferometer for Passive 15 Atmospheric Sounding) satellite observations, ERA-Interim re-analysis data and the 16 ECHAM5–HAMMOZ global chemistry–climate model. Model simulations and observations 17 consistently show that the Asian boundary layer trace gases are lifted to UTLS altitudes in the 18 monsoon anticyclone and are further transported horizontally eastward and westward by 19 eddies detached from the anticyclone. We present an event of eddy shedding during 1-8 July 20 2003 and discuss a 1995-2016 climatology of eddy shedding events. Our analysis indicates 21 Atmos. Chem. Phys. Discuss., https://doi.org/10.5194/acp-2018-168 Manuscript under review for journal Atmos. Chem. Phys. Discussion started: 12 March 2018 c Author(s) 2018. CC BY 4.0 License.

Welcome message from author
This document is posted to help you gain knowledge. Please leave a comment to let me know what you think about it! Share it to your friends and learn new things together.
Transcript
1
Transport of Asian trace gases via eddy shedding from the Asian summer monsoon 1
anticyclone and associated impacts on ozone heating rates 2
Suvarna Fadnavis1, Chaitri Roy
1, Rajib Chattopadhyay
1, Christopher E. Sioris
2, Alexandru 3
Rap3, Rolf Müller
4, K. Ravi Kumar
5 and Raghavan Krishnan
1 4
1Indian Institute of Tropical Meteorology, Pune, India 5
2Environment and Climate Change, Toronto, Canada
6
3School of Earth and Environment, University of Leeds, Leeds, United Kingdom 7
4Forschungszentrum Jülich GmbH, IEK-7, Jülich, Germany 8
5King Abdullah University of Science and Technology, Thuwal, Saudi Arabia 9
*Email of corresponding author: [email protected] 10
Abstract: 11
The highly vibrant Asian Summer Monsoon (ASM) anticyclone plays an important role in 12
efficient transport of Asian tropospheric air masses to the extratropical upper troposphere and 13
lower stratosphere (UTLS). In this paper, we demonstrate long-range transport of Asian trace 14
gases via eddy shedding events using MIPAS (Michelson Interferometer for Passive 15
Atmospheric Sounding) satellite observations, ERA-Interim re-analysis data and the 16
ECHAM5–HAMMOZ global chemistry–climate model. Model simulations and observations 17
consistently show that the Asian boundary layer trace gases are lifted to UTLS altitudes in the 18
monsoon anticyclone and are further transported horizontally eastward and westward by 19
eddies detached from the anticyclone. We present an event of eddy shedding during 1-8 July 20
2003 and discuss a 1995-2016 climatology of eddy shedding events. Our analysis indicates 21
Atmos. Chem. Phys. Discuss., https://doi.org/10.5194/acp-2018-168Manuscript under review for journal Atmos. Chem. Phys.Discussion started: 12 March 2018c© Author(s) 2018. CC BY 4.0 License.
2
that eddies detached from the anticyclone are instrumental in distributing the Asian trace gases 22
away from the Asian region to the West-Pacific (20°-30° N; 120°-150° E) and West-Africa 23
(20°-30N, 0°-30E). Over the last two decades, the estimated frequency of eddy shedding is 24
~68 % towards West-Africa and ~25 % towards the West-Pacific. 25
Model sensitivity experiments for a 10 % reduction in Asian emissions of non-methane 26
volatile organic compounds (NMVOCs) and nitrogen oxides (NOx) were performed with 27
ECHAM5–HAMMOZ to understand the impact of Asian emissions on the UTLS. The model 28
simulations show that transport of Asian emissions due to eddy shedding significantly affects 29
the chemical composition of the upper troposphere (~100-400 hPa) and lower stratosphere 30
(~100-80 hPa) over West-Africa and the West-Pacific. The 10 % reduction of NMVOCs and 31
NOx Asian emissions leads to decreases in peroxyacetyl nitrate (PAN) (2-10 % near 200-80 32
hPa), ozone (1-4.5 % near ~150 hPa) and ozone heating rates (0.001-0.004 K·day-1
near 300-33
150 hPa) in the upper troposphere over West-Africa and the West-Pacific. 34
Key Words: Asian summer monsoon anticyclone; Eddy shedding from the monsoon 35
anticyclone, Transport of Asian trace gases, Ozone heating rates; ECHAM5-HAMMOZ 36
model. 37
38
39
40
41
Atmos. Chem. Phys. Discuss., https://doi.org/10.5194/acp-2018-168Manuscript under review for journal Atmos. Chem. Phys.Discussion started: 12 March 2018c© Author(s) 2018. CC BY 4.0 License.
3
1. Introduction 42
Rapid industrialization, traffic growth, and urbanization resulted in significant increases in the 43
concentrations of tropospheric trace gases, such as carbon dioxide (CO2), carbon monoxide 44
(CO) and methane (CH4) over Asia. There is global concern about rising levels of these trace 45
gases (due to their global warming potential) as they are projected to increase further over the 46
coming years despite efforts to implement several mitigation strategies (Ohara et al., 2007). In 47
situ observations, satellite measurements, trajectory analysis and model simulations show long 48
range transport of Asian trace gases to remote locations (e.g. North America, Europe) (Liang 49
et al., 2004). The transported trace gases change the radiative balance, dynamics and chemical 50
composition at the respective locations (Vogel et al., 2016). Satellite observations show 51
increasing trends in several tropospheric Asian trace gases over the last decade, e.g. ozone at 52
~1-3 % year-1
(Verstraeten et al., 2015), CO at 3% year-1
(Strode and Pawson, 2013), NOx at 53
~3.8 -7.3 % year-1
(Schneider and van der A, 2012; Ghude et al., 2013). Biomass burning is 54
another major contributor to the observed growth in these trace gases (van der Werf et al., 55
2006). Peroxyacetyl nitrate (PAN), a powerful pollutant formed in biomass burning plumes 56
(Wayne, 2000), is a secondary pollutant produced through the oxidation of hydrocarbons 57
released from anthropogenic and biogenic sources. It is a reservoir of reactive nitrogen and 58
plays a fundamental role in the global ozone budget (Tereszchuk et al., 2013; Payne et al., 59
2017). PAN can also be formed in the upper troposphere through the production of NOx from 60
lightning (Zhao et al., 2009). Simulations of the Model of Ozone and Related Tracers 61
(MOZART) show an increase of 20-30 % of PAN concentrations in the upper troposphere 62
and lower stratosphere (UTLS) over the Asian summer monsoon (ASM) region produced from 63
Atmos. Chem. Phys. Discuss., https://doi.org/10.5194/acp-2018-168Manuscript under review for journal Atmos. Chem. Phys.Discussion started: 12 March 2018c© Author(s) 2018. CC BY 4.0 License.
4
lightning (Tie et al., 2002). While in the lower troposphere, PAN has a short lifetime (a few 64
hours), in the UTLS it has a longer lifetime (3-5 months), and can therefore act as a reservoir 65
and carrier of NOx (Tereszchuk et al., 2013). Recent satellite observations show an increasing 66
trend in PAN (~0.1 ± 0.05 to 2.7 ± 0.8 ppt year-1
) in the UTLS over Asia (Fadnavis et al., 67
2014). 68
Monsoon convection plays an important role in lofting of boundary layer Asian air masses to 69
the UTLS (e.g., Randel et al., 2010; Fadnavis et al., 2015; Santee et al., 2017). The uplifted air 70
masses become confined into the anticyclone enclosed by jets (westerly and easterly jets to the 71
north and south, respectively), which act as a strong transport-barrier and restrict isentropic 72
mixing into the extra-tropical lower stratosphere or the equatorial tropics (Ploeger et al., 2015; 73
Ploeger et al., 2017). Confinements of high amounts of trace gases, including ozone precursors 74
(e.g., hydrogen cyanide (HCN), CO, hydrochloric acid (HCl), NOx and PAN), and low ozone 75
in the anticyclone are evident in satellite and aircraft observations, (Randel et al., 2010; Vogel 76
et al., 2014; Fadnavis et al., 2015; Ungermann et al., 2016; Santee et al., 2017). The observed 77
ozone minimum in spite of high amounts of its precursors in the anticyclone is still an open 78
question. The trace gases partially enter the lower stratosphere and affect the UTLS chemical 79
composition (Randel et al., 2010; Fadnavis et al., 2015, 2016; Garny and Randel, 2016), with 80
associated radiative forcing impacts (Riese et al., 2012). Cross-tropopause transport associated 81
with the Asian monsoon is evident in a number of species, including aerosols, hydrogen 82
cyanide (HCN) and PAN (Randel et al. 2010; Fadnavis et al. 2014, 2015; Bourassa et al., 83
2012). 84
Atmos. Chem. Phys. Discuss., https://doi.org/10.5194/acp-2018-168Manuscript under review for journal Atmos. Chem. Phys.Discussion started: 12 March 2018c© Author(s) 2018. CC BY 4.0 License.
5
The ASM anticyclone is highly dynamic in nature (e.g., Hsu and Plumb, 2000; Popovic and 85
Plumb, 2001; Vogel et al., 2016). On the sub-seasonal scale, it shows variation in strength and 86
location (Garny and Randel, 2016). It frequently sheds eddies and on occasions, it splits into 87
two anticyclones, namely the Tibetan and Iranian anticyclones (Zhang et al., 2002; Nützel et 88
al., 2016). An eddy detached from the anticyclone carries Asian air masses (trace gases) away 89
from the ASM region. There are scattered studies indicating eddy shedding to the west 90
(Popovic and Plumb, 2001) and east (Ungermann et al., 2016; Vogel et al., 2014) of the 91
anticyclone. An eddy shedding event causes irreversible mixing in the surrounding air 92
changing the chemical composition and radiative balance of that region (Garny and Randel, 93
2016). Here, we analyze in detail transport of Asian trace gases via eddies, subsequent mixing 94
into the extra-tropics and radiative impact of eddy shedding events on decadal scales. In this 95
paper, we ask the following questions: (1) how frequent were eddy shedding events during the 96
last two decades? (2) Which regions are the most affected? (3) Does the transport of Asian 97
trace gases arising from eddy shedding affect UTLS ozone concentrations and heating rates at 98
remote locations? 99
To address these questions, we first consider an eddy shedding event demonstrating eastward 100
and westward shedding from the ASM anticyclone during 1-8 July 2003. This year was chosen 101
since the monsoon season was quite normal (i.e., no evidence of El Niño or Indian Ocean 102
dipole phenomenon influencing the monsoon circulation). We then present a climatology of 103
eddy shedding events and lead-lag relations of eddies with the anticyclone. We also evaluate 104
the impact of increasing Asian emissions of NOx and NMVOCs on ozone and PAN during the 105
eddy shedding event, using model sensitivity simulations. Finally, we estimate the associated 106
Atmos. Chem. Phys. Discuss., https://doi.org/10.5194/acp-2018-168Manuscript under review for journal Atmos. Chem. Phys.Discussion started: 12 March 2018c© Author(s) 2018. CC BY 4.0 License.
6
changes in ozone heating rates in the UTLS due to Asian trace gases transported via eddy 107
shedding events. 108
2. Experimental set-up and satellite observations 109
2.1 Satellite observations 110
The MIPAS (Michelson Interferometer for Passive Atmospheric Sounding) instrument was 111
launched in March 2002 into a polar orbit of 800 km altitude. Its orbital period is about 100 112
min. MIPAS-E provided continual limb emission measurements in the mid-infrared over the 113
range 685– 2410 cm−1
(14.6–4.15 µm) until December 2004 (Fischer et al., 2008). From 114
January 2005 through April 2012, MIPAS-E was operated with a reduced spectral resolution, 115
and a vertical resolution of 3 km of in the UTLS region. MIPAS monitored many atmospheric 116
trace constituents including CO, PAN, and O3. The details of the general retrieval method and 117
setup, error estimates and use of averaging kernel and visibility flag are documented by von 118
Clarmann et al. (2009). Here, we analyze the MIPAS observed CO, PAN, and O3 data during 119
1-8 July 2003. 120
To account for the comparatively low, and altitude-dependent vertical resolution of MIPAS, 121
the model data were convolved with the MIPAS averaging kernel to be directly comparable to 122
MIPAS measurements of CO, PAN, and ozone. MIPAS vertical resolution for CO, O3 and 123
PAN in the UTLS is 5, 3.5 and 5 km, respectively. The data are contoured and gridded at 15 124
latitude and 10 longitude resolution. In the process, the data quality specifications as 125
documented at http://share.lsdf.kit.edu/imk/asf/sat/mipas-export/Documentation/ were 126
Atmos. Chem. Phys. Discuss., https://doi.org/10.5194/acp-2018-168Manuscript under review for journal Atmos. Chem. Phys.Discussion started: 12 March 2018c© Author(s) 2018. CC BY 4.0 License.
7
employed, namely: only data with a visibility flag equal to 1 and a diagonal value of averaging 127
kernel greater than 0.03 were used for ozone and PAN, while 0.008 was used for CO. 128
2.2 Experimental set-up 129
We employ the ECHAM5-HAMMOZ (Roeckner et al., 2003) aerosol-chemistry-climate 130
model to understand re-distribution of Asian trace gases via eddy shedding from the 131
anticyclone. ECHAM5-HAMMOZ comprises of the general circulation model ECHAM5 132
(Roeckner et al., 2003), the tropospheric chemistry module MOZ (Horowitz et al., 2003), and 133
the aerosol module, Hamburg Aerosol Model (HAM) (Stier et al., 2005). The chemistry of 134
ozone, VOCs, NOx, and other gas-phase species is based on the MOZART-2 chemical scheme 135
(Horowitz et al., 2003). It includes Ox-NOx-hydrocarbons with 63 tracers and168 reactions. 136
The details of the parameterizations and emissions used in the model as well as a validation of 137
the results are described by Fadnavis et al. (2013, 2014, 2015) and Pozzoli et al. (2011). 138
The model simulations were performed at the T42 spectral resolution corresponding to about 139
2.8°× 2.8° in the horizontal dimension and 31 vertical hybrid σ-p levels from the surface up to 140
10 hPa. Here, we note that our base year for aerosol and trace gas emissions is 2000. We 141
performed two simulations: (i) a control experiment (CTRL), and (ii) a sensitivity experiment 142
(Asia10), where emissions of both NOx and NMVOCs were simultaneously reduced by 10 % 143
over Asia (10 S–50 N, 60–130 E). Both simulations were performed for the year 2003 144
driven by European Centre for Medium-Range Weather Forecasts operational analyses 145
(Integrated Forecast System (IFS) cycle-32r2) meteorological fields (available every six 146
hours) (Uppala et al., 2005). All simulations include lightning NOx and the subsequent PAN 147
Atmos. Chem. Phys. Discuss., https://doi.org/10.5194/acp-2018-168Manuscript under review for journal Atmos. Chem. Phys.Discussion started: 12 March 2018c© Author(s) 2018. CC BY 4.0 License.
8
production. Since the lightning parameterization is the same in the CTRL and sensitivity 148
simulations, its impact may be negligible. However, there may be an indirect impact of 149
changed emissions on lightning and thus on NOx or PAN production. The model simulations 150
used here are the same as those used by Fadnavis et al. (2015). 151
The climatology of ozone mass mixing ratio, winds and Potential Vorticity (PV) are obtained 152
from ERA-Interim reanalysis data for the period 1995-2016. The anomalies are obtained from 153
difference between daily mean values of July 2003 and daily climatology. Power spectral 154
analysis and lag/lead correlations have been carried out on PV data for the period 1995-2016 155
to show climatological features. 156
Instantaneous ozone heating rates are calculated using the Edwards and Slingo (1996) 157
radiative transfer model. We used the off-line version of the model, with six shortwave and 158
nine longwave bands, and a delta-Eddington 2-stream scattering solver at all wavelengths, in a 159
set-up similar to other recent studies (Rap et al., 2015, Roy et al., 2017). 160
3. Results 161
3.1 A typical case study of eddy shedding from the monsoon anticyclone 162
The dynamics of the monsoon anticyclone is better portrayed at the 370 K potential 163
temperature surface and the monsoon anticyclone is obvious as an area of low PV values (PV< 164
2 PVU, 1 PVU = 10-6
K m2 kg
-1 s
-1) (indicating tropospheric air-mass) at this surface (Garny 165
and Randel, 2016). Eddies are identified as air with low PV emanating from the monsoon 166
anticyclone (Popovic and Plumb, 2001; Vogel et al., 2014). Past studies have shown that 167
Atmos. Chem. Phys. Discuss., https://doi.org/10.5194/acp-2018-168Manuscript under review for journal Atmos. Chem. Phys.Discussion started: 12 March 2018c© Author(s) 2018. CC BY 4.0 License.
9
during the monsoon season (June to September), the bulk of the low PV air at the isentropic 168
level of 370 K, is confined between about 20–35N and 20–120E indicating the spatial 169
extent of the anticyclone (Popovic and Plumb, 2001; Vogel et al., 2014; Garny and Randel, 170
2016). A pocket of low PV air-mass detached from the boundary of the anticyclone (outside 171
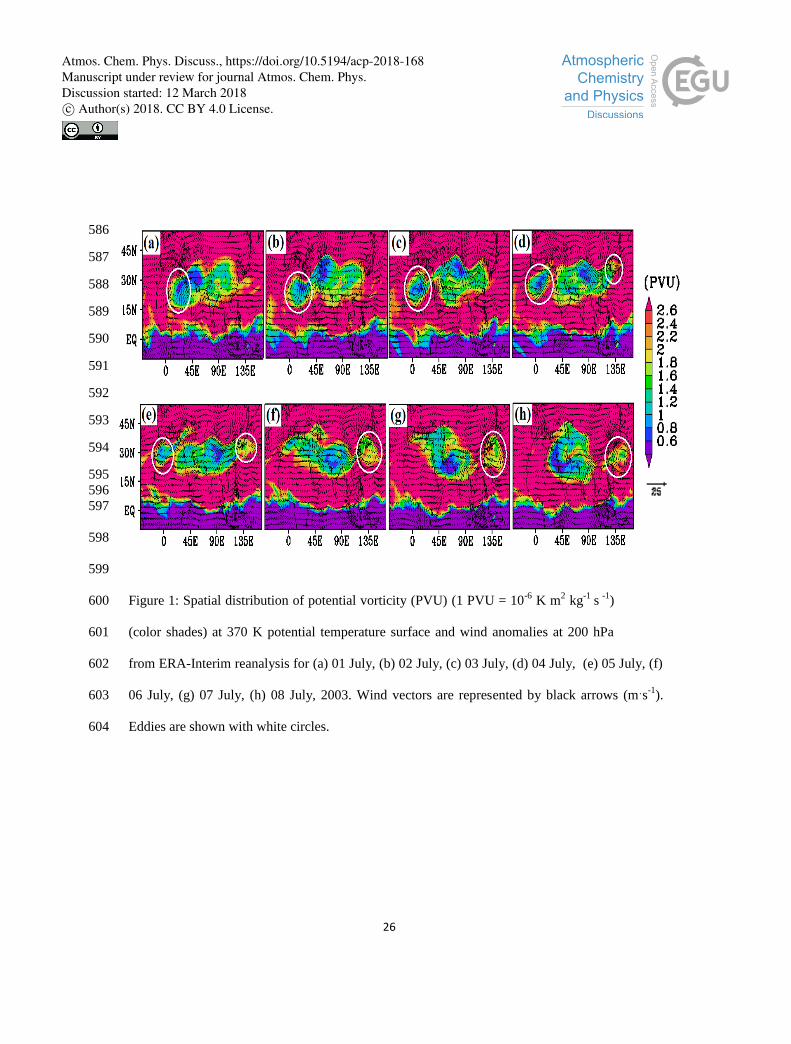
the anticyclone, 20–35N and 20–120E) is considered as an eddy. Figure 1a-h shows the 172
distribution of PV at 370 K during 1-8 July 2003. It can be seen that during this period the 173
anticyclone was wobbling and shed eddies eastward and westward over West-Africa (20-30° 174
N, 0-30E) and the West-Pacific (20-30° N; 120-150° E). Initially, during 2-5 July 2003, the 175
ASM anticyclone shed an eddy westward over West-Africa. The eddy moved further west 176
with the progression of time. Later during 4-8 July 2003, eddy shedding occurred to the east of 177
the anticyclone, over the West-Pacific and the air detached from the anticyclone moved further 178
eastward with time. The longitude-pressure section of PV shows that the eddy protrudes down 179
to 400 hPa (not shown). 180
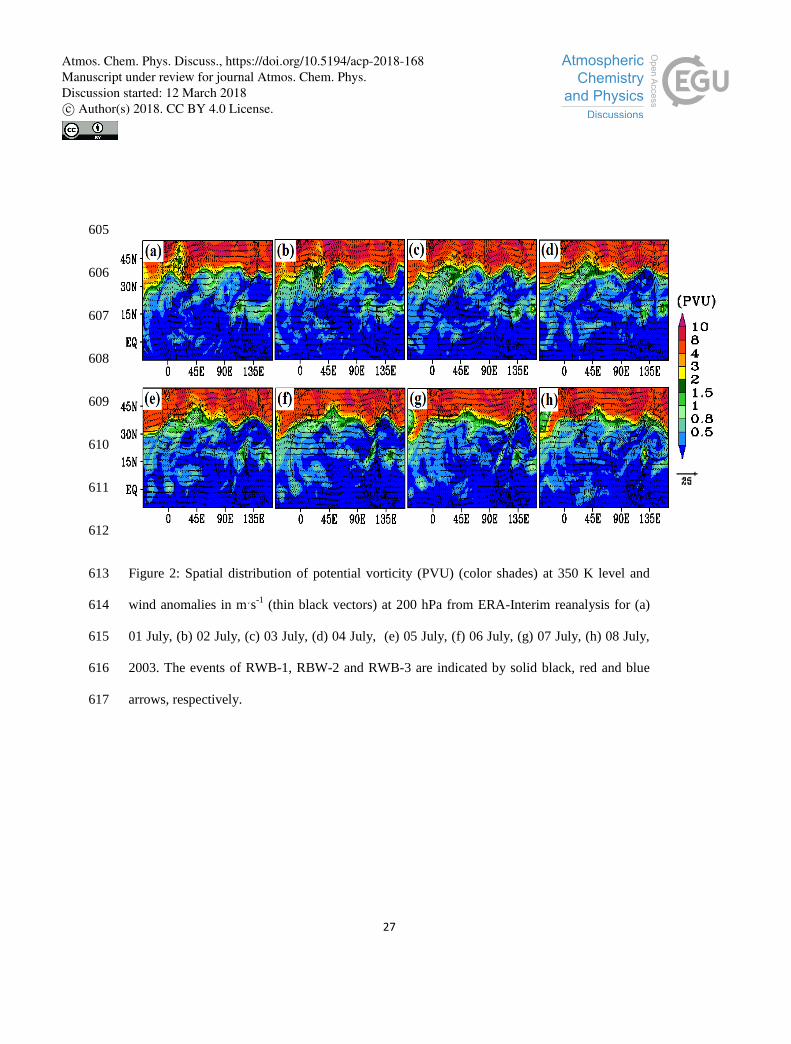
Previous studies have shown that eddy shedding events are associated with Rossby wave 181
breaking (RWB) (Hsu and Plumb, 2000; Popovic and Plumb, 2001; Fadnavis and 182
Chattopadhyay, 2017). The RWB is manifested as a rapid and large-scale irreversible 183
overturning of PV contours on the 350K isentropic surface. It is accompanied with a cyclonic 184
circulation at 200 hPa (Strong and Magnusdottir, 2008; Fadnavis and Chattopadhyay, 2017). 185
Figure 2a-h shows the distribution of PV at the 350K surface and the circulation at 200 hPa 186
during 1-8 July 2003. It can be seen that, during 1-8 July 2003, three RWB events occurred: 187
one near 30E (referred as RWB-1), one near 70E (refereed as RWB-2) and another one 188
Atmos. Chem. Phys. Discuss., https://doi.org/10.5194/acp-2018-168Manuscript under review for journal Atmos. Chem. Phys.Discussion started: 12 March 2018c© Author(s) 2018. CC BY 4.0 License.
10
near 120E (referred to as RWB-3). Since RWB-3 was outside the region of the ASM 189
anticyclone (over the West-Pacific ~150-170° E) it did not play a role in the eddy shedding 190
event of 1-8 July. If we track the location of these RWB events (indicated by the black and red 191
arrows), one can see that, with the progression of time, the RWB feature moved eastward. The 192
eastward migration of RWB is linked to its movement along the subtropical westerly jet 193
(Fadnavis and Chattopadhyay, 2017). Initially during 1-5 July RWB-1 was strong (PV > 2 194
PVU) while RWB-2 (PV < 2 PVU) was weak. During this period the southward and westward 195
moving RWB-1 leads to eddy shedding over West Africa. Later, during 4-8 July, RWB-2 196
strengthened while RWB-1 weakened and disappeared. The southward and eastward moving 197
RWB-2 was responsible for the eddy shedding event near the Western Pacific (see Fig. 2d-h). 198
3.2. Climatology of eddy shedding from the monsoon anticyclone 199
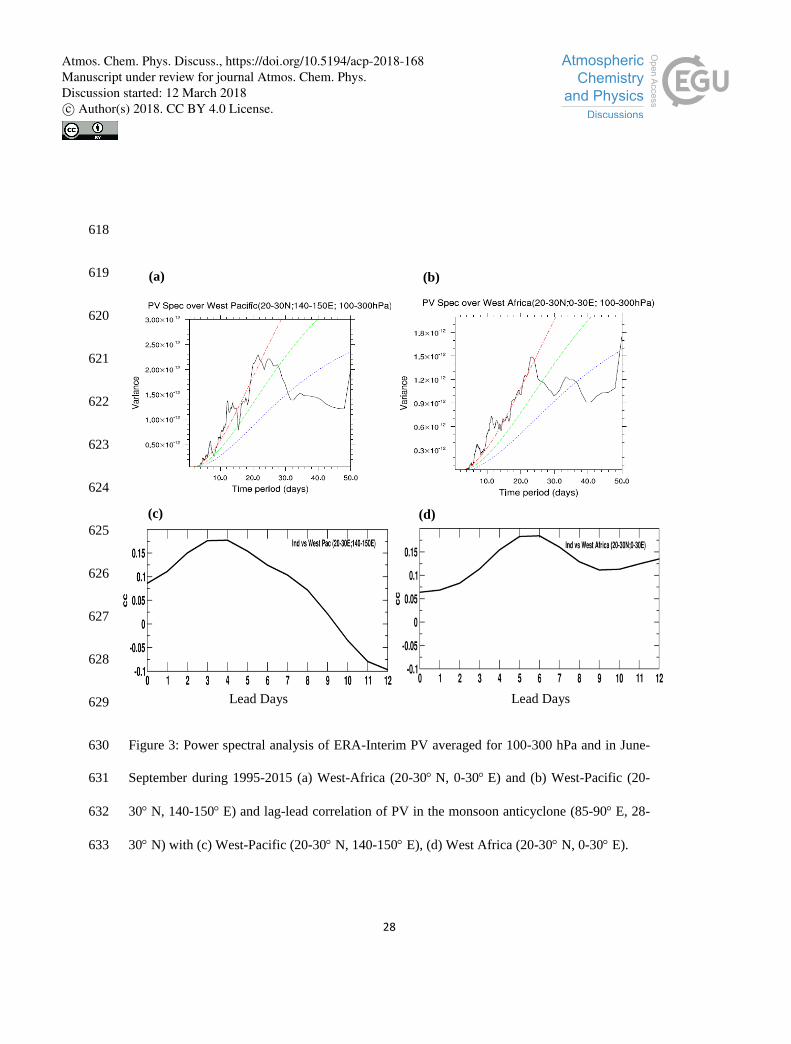
A power spectrum analysis has been performed on the PV data (averaged for 300-100 hPa) 200
during 1995-2016 for West-Africa (20-30° N, 0-30° E) and the West-Pacific (20-30° N, 140-201
150° E). Figure 3a-b shows the distribution of power spectral variance over these two regions. 202
The variance is significant at 99 % for 3-5 days and 12-15 days for both the regions indicating 203
that the eddy shedding activity is dominated in the range of synoptic frequency (~10 days). 204
Popovic and Plumb (2001) also indicated a typical duration of an eddy shedding event of ~4-8 205
days. We compute the frequency of eddy shedding days (PV < 1 PVU) occurring over West-206
Africa and the Western Pacific. The ERA-Interim data for the last two decades show that eddy 207
shedding is quite frequent over west-Africa ~68 % and the West-Pacific ~25 %. The lag-lead 208
correlation of PV (averaged for 200-100 hPa) for the centre region of the anticyclone (85-90° 209
Atmos. Chem. Phys. Discuss., https://doi.org/10.5194/acp-2018-168Manuscript under review for journal Atmos. Chem. Phys.Discussion started: 12 March 2018c© Author(s) 2018. CC BY 4.0 License.
11
E, 28-30° N) with PV averaged over the West-Pacific shows a maximum positive lead 210
correlation at 3-4 days (Fig. 3c). Similarly, PV over West-Africa shows a maximum positive 211
lead correlation for 5-6 days with the PV averaged over the monsoon anticyclone (Fig. 3d). 212
This indicates that the transport of the eddies from the anticyclone (source region) has a 213
typical duration of three to four days over the West Pacific and five to six days over West 214
Africa. This transport time is the timescale over which the trace gases are moved to remote 215
locations from the ASM anticyclone. 216
3.3. Long range transport of trace gases 217
3.3.1 Horizontal transport of ozone, CO and PAN via eddies 218
Biomass burning over south-east Asia and East Asia produces large amounts of CO, NOx, 219
VOCs, PAN, ozone and aerosols (e.g., Streets et al., 2003, Fadnavis et al., 2014). The 220
monsoon convection over the Bay of Bengal, southern slopes of Himalaya and South China 221
Sea (see Fig. S1) lifts up these species into the anticyclone where they may get dispersed in 222
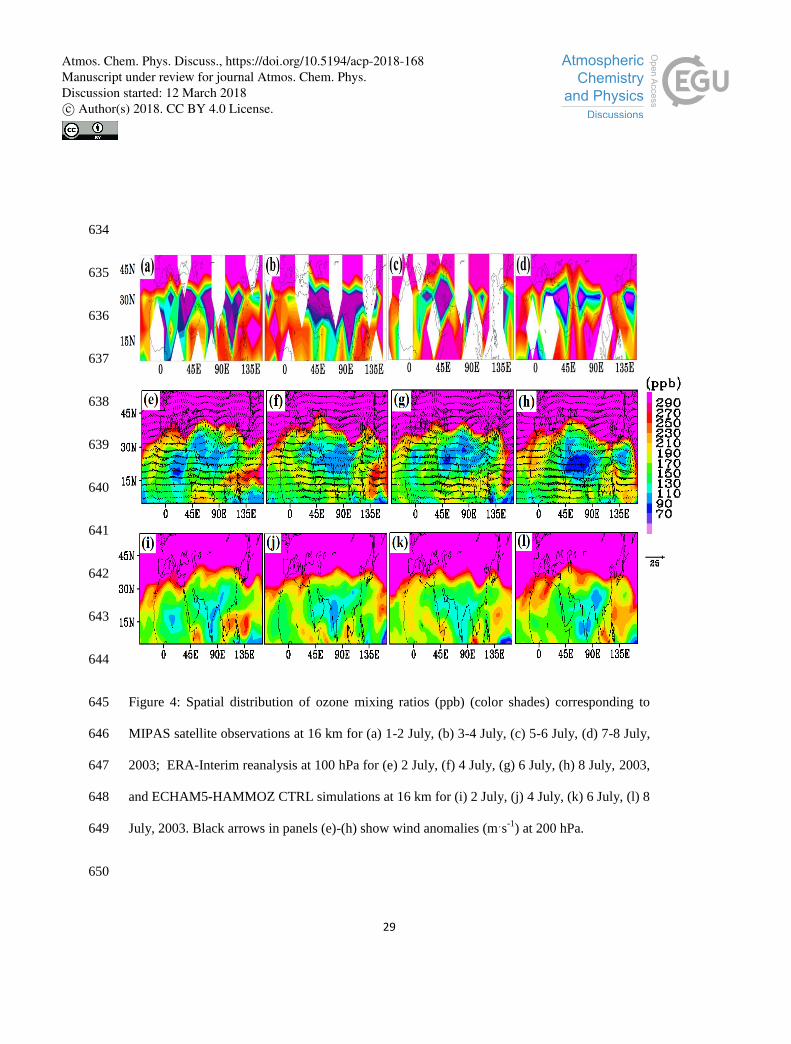
the UTLS by the vibrant anticyclone and its associated eddies. Figure 4a-h shows the 223
distribution of ozone during 1-8 July 2003 (MIPAS O3 is binned for 2 days and simulated O3 224
is plotted for alternate days) in the anticyclone at 16 km (~100 hPa). Ozone concentrations 225
from MIPAS satellite measurements and model simulations (CTRL) are plotted at 16 km and 226
from ERA-Interim reanalysis at 100 hPa. For comparison, we have interpolated the model data 227
to the MIPAS altitude grid and smoothed with the averaging kernel. The ASM anticyclone is 228
marked by minimum ozone although its precursors (e.g. CO, NOx and CH4) show maxima 229
(Randel et al., 2010; Roy et al., 2017). The spatial pattern of low ozone amounts in the 230
Atmos. Chem. Phys. Discuss., https://doi.org/10.5194/acp-2018-168Manuscript under review for journal Atmos. Chem. Phys.Discussion started: 12 March 2018c© Author(s) 2018. CC BY 4.0 License.
12
anticyclone and the associated eddies is evident in all of the data sets during 1-8 July 2003. 231
During 1-5 July, ozone concentrations in the eddy over West-Africa are ~60-200 ppb in 232
MIPAS, ~60-100 ppb in ERA-Interim and 80-150 ppb in the model simulations. During 4-8 233
July, the eddy over the west Pacific shows ozone amounts of ~80-200 ppb in MIPAS, ~80-120 234
ppb in ERA-Interim and ~150-200 ppb in the model simulations. In general, MIPAS 235
measurements and simulated ozone amounts shows reasonable agreement, while ozone 236
amounts in ERA-Interim are lower by 30-80 ppb than both MIPAS measurements and the 237
model simulations. 238
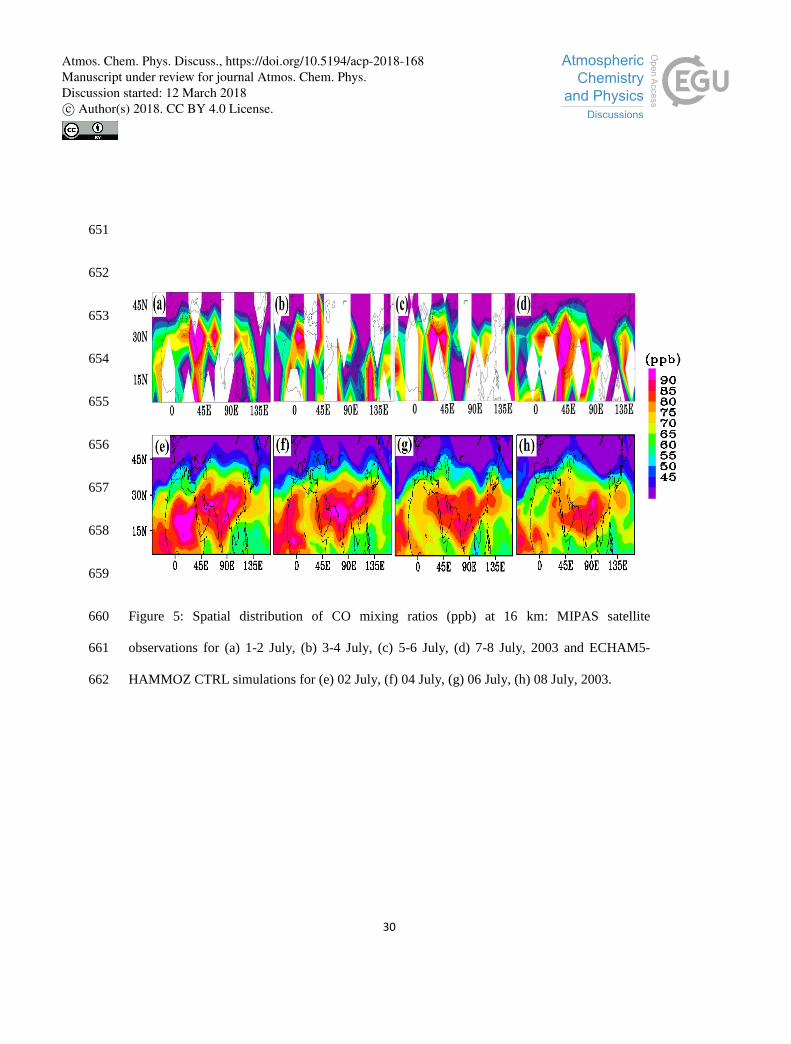
Figure 5a-h shows the distribution of CO from MIPAS observations and model simulations 239
during 1-8 July 2003 (MIPAS CO is binned for 2 days and simulated CO is plotted for 240
alternate days). The confinement of high concentrations of CO in the anticyclone and in eddies 241
is seen in both MIPAS observations and model simulations. During 1-5 July, eddies over west-242
Africa and west-Pacific show CO volume mixing ratios of ~65-85 ppb in MIPAS, and ~70-90 243
ppb in the model simulations. 244
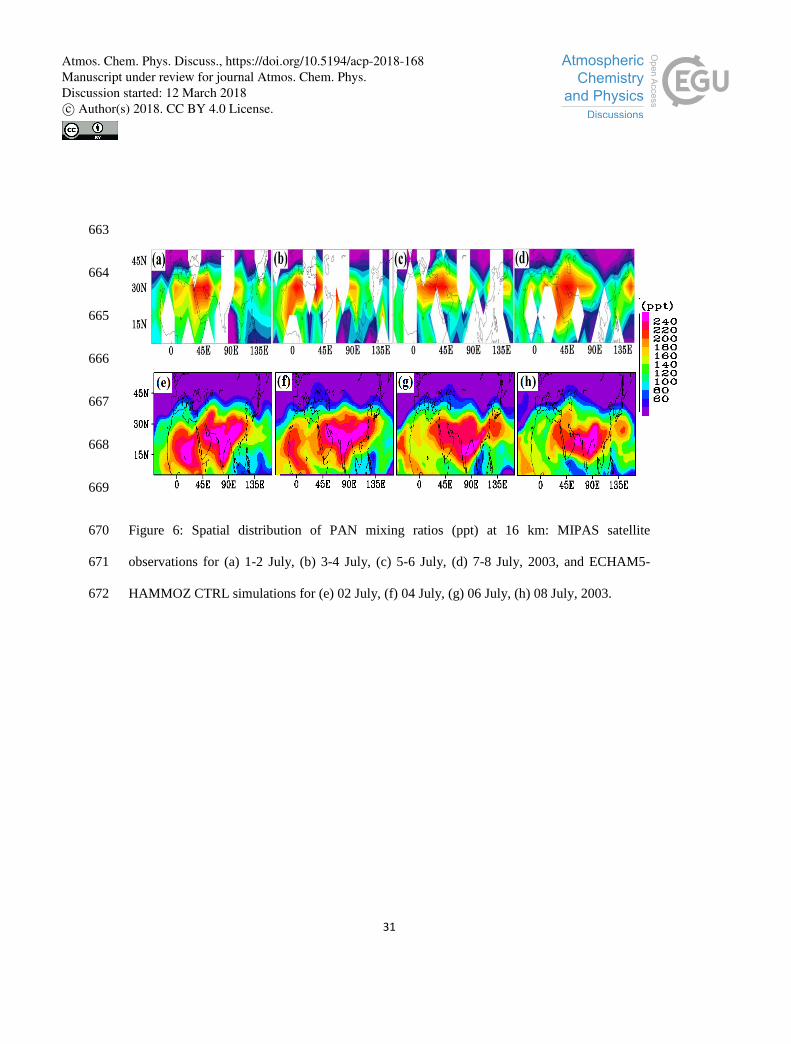
Figure 6a-h shows the distribution of PAN from MIPAS measurements and the model 245
simulation (CTRL) at 16km during 1-8 July 2003 (MIPAS PAN mixing ratios are binned for 246
2 days and simulated PAN is plotted for alternate days). A confinement of high amounts of 247
PAN in the anticyclone and the associated eddies is seen both in the MIPAS measurements 248
and the model simulations. During 1-5 July, MIPAS observed PAN amounts are ~120-230 ppt 249
in eddies over west-Africa, while the model simulation shows ~180-240 ppt of PAN at the 250
Atmos. Chem. Phys. Discuss., https://doi.org/10.5194/acp-2018-168Manuscript under review for journal Atmos. Chem. Phys.Discussion started: 12 March 2018c© Author(s) 2018. CC BY 4.0 License.
13
same location. The eddy over the west-Pacific shows PAN amounts of ~120-230 ppt in the 251
MIPAS measurements and 160-230 ppt in the model simulations. 252
There are minor differences in ozone, CO and PAN amounts from model simulation, satellite 253
observations and ozone from ERA-Interim. These differences may be due to a number of 254
reasons e.g. different grid sizes of MIPAS (10°×15°), ERA-Interim (0.75°×0.75°) and model 255
data (2.8°×2.8°), binning of MIPAS data for two days to accommodate better special 256
coverage, uncertainties in the model emission inventory, and retrieval errors in the satellite 257
data. 258
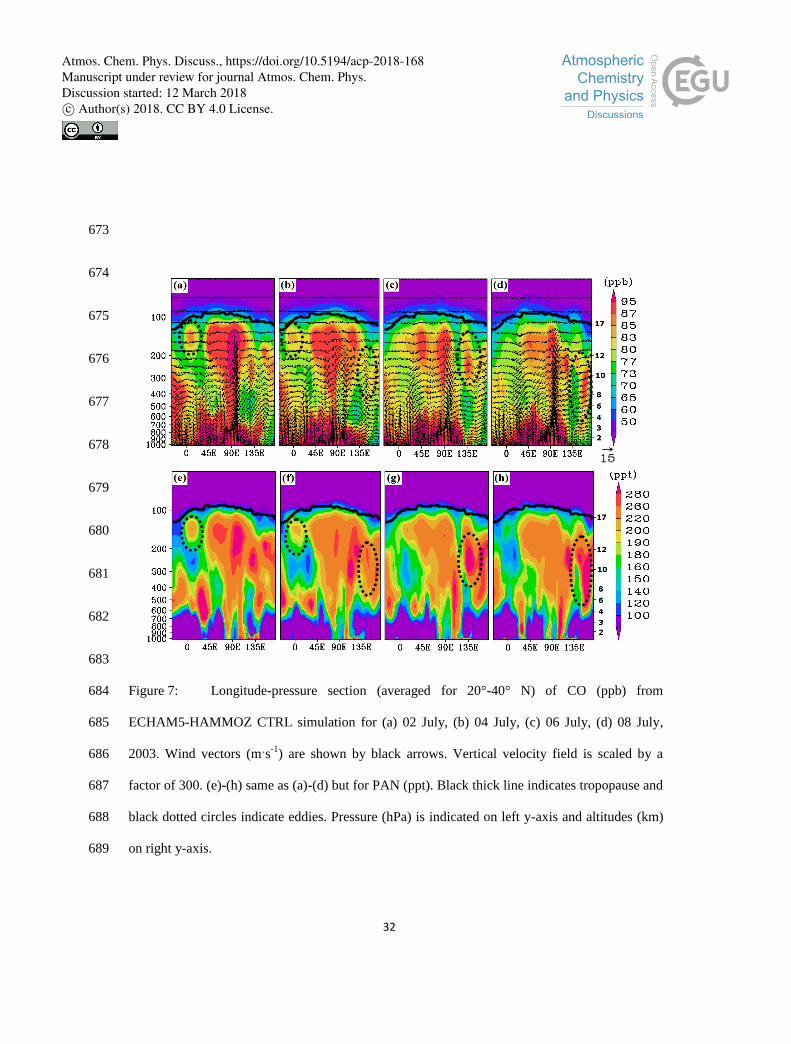
3.3.2 Vertical distribution of CO, PAN and ozone 259
Further, we show the vertical distribution of CO and PAN as an indication of the Asian 260
biomass burning emissions. Figure 7 shows longitude-pressure cross-sections (averaged for 261
20°-40N) of CO and PAN from the CTRL simulation, with wind vectors depicting 262
circulation patterns. It shows during 1-5 July 2003 a plume of CO/PAN uplifted from the 263
Asian region (80°-120° E) moving further upward into the UTLS. The location of the plume 264
coincides with the region of convective transport (Fig. S1). In the upper troposphere (~120 265
hPa) westward horizontal transport of CO/PAN towards West-Africa is obvious as a result of 266
eddy shedding during the respective days. In particular, during 2-4 July high amounts of 267
CO/PAN are observed near 0°-30° E at 100 hPa (Fig. 7a-b and 7e-f). On 2 July there is some 268
PAN transport over west-Pacific. During 4-8 July 2003, eddy shedding occurs to the east of 269
the anticyclone over the West-Pacific (120°-150° E) (see Figure 1e-f). East-ward horizontal 270
transport of CO/PAN in the regions of eddy shedding is evident in Fig.7c-d and 7g-h. The 271
Atmos. Chem. Phys. Discuss., https://doi.org/10.5194/acp-2018-168Manuscript under review for journal Atmos. Chem. Phys.Discussion started: 12 March 2018c© Author(s) 2018. CC BY 4.0 License.
14
Asian trace gases then disperse downward deep into the troposphere (~500 hPa over the West 272
Pacific and ~200 hPa over West-Africa) and are partially lifted into the lower stratosphere. 273
The vertical distribution of ozone shows low ozone amounts extending from convective 274
regions of the Bay of Bengal (80-95° E) and the South China Sea (~120° E) upward in the 275
upper troposphere (Fig.S2). This is due to low ozone amounts in marine air masses over Asia 276
during the monsoon season (Zhao et al., 2009). This feature is not as clear as seen in the 277
vertical distribution of CO and PAN, since a number of factors are influencing ozone 278
production and loss processes at different altitudes in the troposphere and lower stratosphere 279
(e.g. lightning in the upper troposphere). 280
3.4 Influence of Asian emissions on extra-tropical UTLS 281
In this section, we investigate the influence of Asian anthropogenic emissions of 282
NMVOCs and NOx on the distribution of PAN and ozone in the tropical/extra-tropical UTLS 283
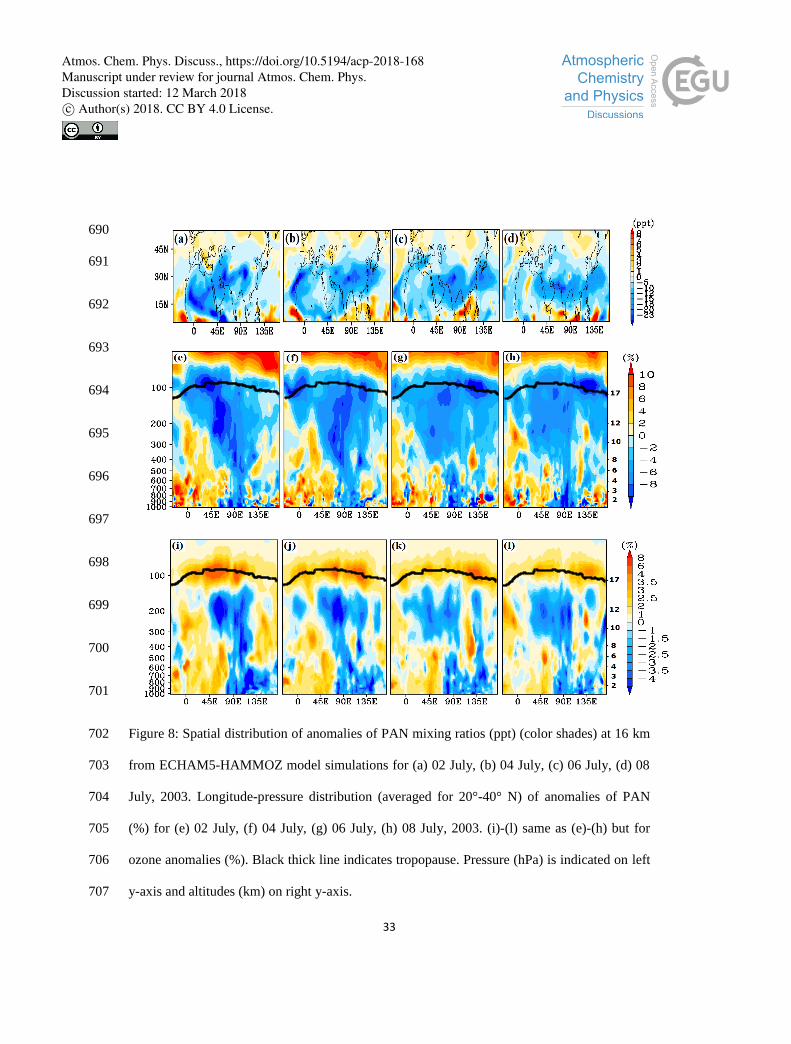
from sensitivity experiments. Figure 8a-d shows anomalies of PAN (Asia10-CTRL) at 16km 284
during 1-8 July 2003 (plotted on alternate days). The negative anomalies in PAN are seen 285
confined to the region of the anticyclone and the associated eddies (1-5 July over West-Africa 286
and 4-8 July over West-Pacific). These anomalies portray the response of Asian boundary 287
layer emissions (NMVOCs and NOx) on the upper level anticyclone and the associated eddies. 288
A number of studies (Randel et al., 2010; Fadnavis et al., 2013; 2015; Vogel et al., 2014) have 289
shown lifting of Asian emissions to the UTLS by the monsoon convection and its confinement 290
in the anticyclone. Decrease in Asian emissions (NMVOCs and NOx) by 10 % decreases PAN 291
Atmos. Chem. Phys. Discuss., https://doi.org/10.5194/acp-2018-168Manuscript under review for journal Atmos. Chem. Phys.Discussion started: 12 March 2018c© Author(s) 2018. CC BY 4.0 License.
15
amounts by ~5-23 % in the ASM anticyclone and the associated eddies over West-Africa and 292
the West-Pacific. 293
Further, we analyze the vertical distribution of anomalies of PAN and ozone. Figure 8e-h 294
shows longitude-pressure sections of anomalies of PAN. It shows negative anomalies (in 295
response to reduced Asian emissions) along the transport pathways (Fig. S1), i.e., from the 296
boundary layer of the Asian region (80°-120° E) into the upper troposphere and 297
westward/eastward transport from the anticyclone owing to eddy shedding. These anomalies 298
extending above the tropopause indicate cross-tropopause transport. Our simulations show that 299
a 10 % reduction in Asian emissions of both NMVOCs and NOx, results in a decrease in the 300
amount of PAN by ~2-10 % over North-West Africa during 1-5 July and over the Western 301
Pacific during 4-8 July 2003. 302
The vertical distribution of ozone anomalies show negative values (–1 to –4.5 %) in the 303
troposphere extending from the surface up to 180 hPa along the transport pathways (80°-110° 304
E). Near the tropopause ozone anomalies are positive, varying between 1 to 8 % (Fig.8i-l). 305
During the monsoon season, marine air masses containing low amounts of ozone prevail over 306
the Asian land mass. The monsoon air mass gathers Asian boundary layer ozone precursors 307
(and the other trace gases) and is uplifted to the UTLS by the monsoon circulation. It should 308
be noted that a decrease in emissions of NOx and NMVOCs in the Asia10 simulations 309
produces lower ozone amounts in the troposphere than CTRL. Therefore, in the regions of 310
eddy shedding, negative anomalies near 200-300 hPa indicate transport of monsoon air (via 311
eddies) towards West-Africa during 1-5 July and to the West-Pacific during 4-8 July. Also, 312
Atmos. Chem. Phys. Discuss., https://doi.org/10.5194/acp-2018-168Manuscript under review for journal Atmos. Chem. Phys.Discussion started: 12 March 2018c© Author(s) 2018. CC BY 4.0 License.
16
there may be ozone production in the troposphere from its precursors carried by the monsoon 313
circulation. PAN transported by eddies in the troposphere over West-Africa and the West 314
Pacific will release NOx and contributes to tropospheric ozone production (Fig. 7e-h and Fig. 315
8e-h). The increase in lower stratospheric ozone concentrations near the tropopause (Fig. 8i-l), 316
in response to the 10 % reduction of Asian NOx and NMVOCs emissions, may be due to the 317
inverse relation between ozone amounts and its precursors in the monsoon anticyclone 318
(Randel et al., 2010) and other factors such as changes in dynamics due to emission change. 319
Ozone changes near the tropopause have been shown to have a large impact on the Earth’s 320
radiative balance (Riese et al., 2012). 321
3.5 Influence of Asian emission of trace gases on ozone heating rates 322
Ozone is a dominant contributor to radiative heating in the tropical lower stratosphere, 323
impacting the local heating budget and non-local forcing of the troposphere below (Gilford 324
and Solomon, 2017). We estimate changes in ozone heating rates caused by a 10 % decrease 325
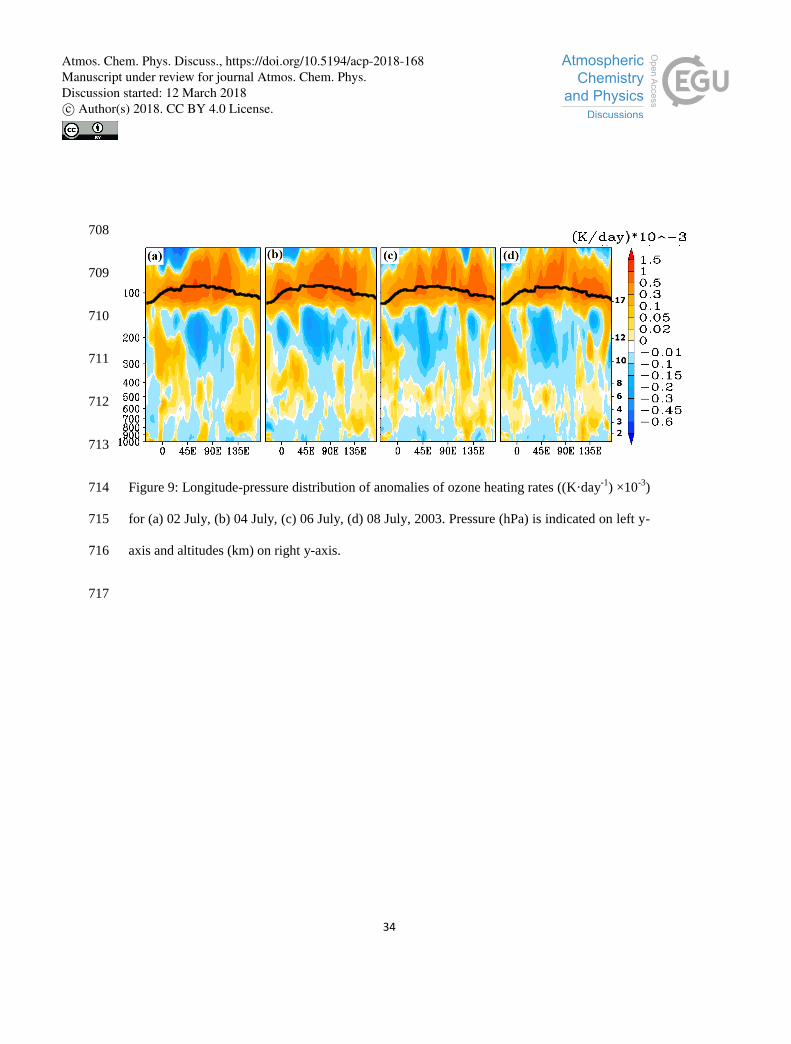
in Asian NMVOCs and NOx emissions. Figure 9a-d, showing anomalies of ozone heating 326
rates on 1-8 July (plotted on alternate days), indicates a reduction in ozone heating rates in 327
response to a decrease in Asian NMVOCs and NOx emissions, coincident with the region of 328
convective transport (Fig. S1). In the upper troposphere (300-180 hPa), the negative anomalies 329
in ozone heating rates vary between –0.001 and –0.0045 K·day-1
. Interestingly, reduced Asian 330
emissions (NMVOCS and NOx), leads to a reduction in ozone, which leads to a reduction in 331
ozone heating rates (–0.001 to –0.003 K·day-1
) in the region of eddy shedding over West-332
Africa (1-5 July) and the West-Pacific (4-8 July). The ozone poor Asian air mass trapped 333
Atmos. Chem. Phys. Discuss., https://doi.org/10.5194/acp-2018-168Manuscript under review for journal Atmos. Chem. Phys.Discussion started: 12 March 2018c© Author(s) 2018. CC BY 4.0 License.
17
within eddies has reduced the heating over West-Africa and the West-Pacific. Influence of 334
Asian NOx emissions on ozone heating rates (mean for June-September ~0.0001 - 0.0012 335
K·day-1
for 38 % increase over India) in the upper troposphere (300-200 hPa) have been 336
reported in the past (Roy et al., 2017). Near the tropopause, ozone heating rates are positive 337
0.001 - 0.005 K·day-1
, which is due to positive anomalies of ozone near the tropopause (Fig. 338
8i-l). The ECMWF dataset for 44 years (1958-2001) shows an inter-annual amplitude of the 339
ozone heating rate ±0.00025 K·day-1
near the tropopause over 30° S-30° N (Wang et al. 2008). 340
4. Summary and Discussion 341
In this study we show evidence of eddy shedding from the ASM anticyclone to both its eastern 342
and western edge, during 1-8 July 2003 based on MIPAS satellite observations and ERA 343
Interim re-analysis data as well as the associated transport patterns of trace gases from the 344
ASM region to remote regions. The transport diagnostic based on ERA-Interim data shows 345
that eddy shedding events are associated with RWB in the subtropical westerly jet. The RWB 346
feature moves eastward in the subtropical westerly jet. Initially, during 1-5 July 2003, RWB 347
occurs in the western part of the anticyclone and then sheds over West-Africa (20°-30N, 0-348
30E). Later, during 5-8 July 2003, RWB moves to the eastern part of the anticyclone and 349
sheds an eddy over the West-Pacific (20°-30° N; 120°-150° E). Analysis of ERA-Interim PV 350
data for the last two decades (1995-2016) shows that the frequency of eddy shedding from the 351
ASM anticyclone over West-Africa is ~68 % and ~25 % over the West-Pacific. PV (300-100 352
hPa) at the centre of the anticyclone (85°-90° E, 28°-30° N) shows maximum correlation with 353
PV over West-Africa 3-4 days later and 5-6 days later in the West-Pacific. It indicates that the 354
Atmos. Chem. Phys. Discuss., https://doi.org/10.5194/acp-2018-168Manuscript under review for journal Atmos. Chem. Phys.Discussion started: 12 March 2018c© Author(s) 2018. CC BY 4.0 License.
18
anticyclone sheds eddies with transport duration of typically three to four days to West Africa 355
and five-six days to the Western Pacific. 356
We employ the chemistry climate model ECHAM5-HAMMOZ to investigate transport of 357
Asian boundary layer trace gases (CO, ozone and PAN) into the monsoon anticyclone and the 358
associated eddies. The model simulations show that Asian trace gases transported into the 359
monsoon anticyclone are further carried away horizontally towards West-Africa and the West-360
Pacific by eddies which detach from the anticyclone. These eddies protrude down to ~200 hPa 361
over West-Africa and ~500 hPa over the West Pacific. They re-distribute Asian trace gases 362
downward into the troposphere over these regions. Moreover, part of this air-mass is also 363
transported upward into the lower stratosphere. A higher frequency of eddy shedding over 364
West-Africa (68 %) during last two decades indicates a greater influence of Asian trace gases 365
on the UTLS over West-Africa than the West-Pacific over last two decades (1995-2016). 366
We evaluate the impact of Asian NOx and NMVOCs emissions on ozone and PAN in 367
the regions of the ASM anticyclone and the associated eddies. The model sensitivity 368
simulations for a 10 % reduction in Asian emissions of NMVOCs and NOx indicate significant 369
reduction (~2-10 %) in the concentration of PAN in the UTLS (300-80 hPa) over West-Africa 370
and the West-Pacific. The vertical distribution of anomalies of PAN shows negative values 371
along the transport pathways, i.e., rising from the Asian region (80°-120° E) into the upper 372
troposphere and both westward and eastward transport towards the region of eddy shedding. 373
Tropospheric ozone (1000-180 hPa) shows a decrease of up to –4.5 % in response to a 10 % 374
decrease in Asian emissions of NMVOCs and NOx, while positive ozone anomalies (up to 8 375
Atmos. Chem. Phys. Discuss., https://doi.org/10.5194/acp-2018-168Manuscript under review for journal Atmos. Chem. Phys.Discussion started: 12 March 2018c© Author(s) 2018. CC BY 4.0 License.
19
%) are seen near the tropopause. The reason for the observed ozone minimum (noting that 376
ozone precursors show high amounts) in the anticyclone is still an open question. The satellites 377
and aircraft observations show inverse relation between the amount of ozone and its 378
precursors. The increase in ozone anomalies in the anticyclone in response to a reduction of 379
NOx and NMVOCs may be a consequence of the observed inverse relation between ozone and 380
its precursors in the anticyclone or it may be due to changes in dynamics in response to 381
emission change, which requires further investigations. 382
Our analysis indicates that transport of Asian trace gases from the anticyclone to West-Africa 383
and the West-Pacific via eddies causes a change in the chemical composition of the UTLS and 384
may therefore impact the radiative balance of the UTLS. We also estimate that a 10 % 385
reduction in Asian NMVOCs and NOx emissions leads to a decrease of ozone heating rates of 386
0.001 to 0.004 K·day-1
in the region of transport into the troposphere and an increase of 0.001 387
to 0.005 K·day-1
near the tropopause and lower stratosphere (180-50 hPa) over Asia (20°-150° 388
E; 20°-40° N). Previous studies show that ozone changes in the lower stratosphere have the 389
largest impact on the ozone radiative forcing (Riese et al., 2012). Interestingly, in the upper 390
troposphere (200-300 hPa) negative anomalies of ozone heating rates (~0.001-0.003 K·day-1
) 391
are seen in the region of eddy shedding over West-Africa and the West-Pacific. Thus transport 392
of Asian air masses via eddies eventually alters the heating rates in the UTLS in the regions of 393
eddy shedding and may thus affect radiative forcing and local temperature. However such 394
questions are beyond the scope of this study. It should be noted that there are minor 395
differences in the amounts of ozone, CO and PAN between model simulations and satellite 396
observations (ozone from ERA-Interim). The ozone heating rates estimated from the model 397
Atmos. Chem. Phys. Discuss., https://doi.org/10.5194/acp-2018-168Manuscript under review for journal Atmos. Chem. Phys.Discussion started: 12 March 2018c© Author(s) 2018. CC BY 4.0 License.
20
simulations will vary accordingly. Notwithstanding, we suggest further scrutiny of long range 398
transport of Asian trace gases via eddies shedding from the anticyclone and its impact on 399
ozone heating rates in the respective regions. 400
Acknowledgements: Dr. S. Fadnavis and C. Roy acknowledges with gratitude Prof. Ravi 401
Nanjundiah, Director of IITM, for his encouragement during the course of this study. We are 402
grateful to B. Vogel for helpful discussions. This work was partly funded by the European 403
Community’s Seventh Framework Programme (FP7/2007–2013) as part of the StratoClim 404
project (grant agreement no. 603557). We thank the European Centre for Medium-Range 405
Weather Forecasts (ECMWF) for providing meteorological data sets. The authors are also 406
thankful to Dr. Bernd Funke and Dr. Michael Kiefer for their help related to MIPAS data. 407
Atmos. Chem. Phys. Discuss., https://doi.org/10.5194/acp-2018-168Manuscript under review for journal Atmos. Chem. Phys.Discussion started: 12 March 2018c© Author(s) 2018. CC BY 4.0 License.
21
References: 408
Bourassa, A. E., Robock, A., Randel, W. J., Deshler, T., Rieger, L. A., Lloyd, N. D., 409
Llewellyn, E. J. and Degenstein, D. A.: Large volcanic aerosol load in the stratosphere 410
linked to Asian monsoon transport, Science, 336(6090), 78–81, 411
doi:10.1126/science.1219371, 2012. 412
Edwards, J. M. and Slingo, A.: Studies with a flexible new radiation code. I: Choosing a 413
configuration for a large-scale model, Q. J. R. Meteorol. Soc., 122(531), 689–719, 414
doi:10.1256/smsqj.53106, 1996. 415
Fadnavis, S., Semeniuk, K., Pozzoli, L., Schultz, M. G., Ghude, S. D., Das, S. and Kakatkar, 416
R.: Transport of aerosols into the UTLS and their impact on the asian monsoon region 417
as seen in a global model simulation, Atmos. Chem. Phys., 13(17), 8771–8786, 418
doi:10.5194/acp-13-8771-2013, 2013. 419
Fadnavis, S., Schultz, M. G., Semeniuk, K., Mahajan, A. S., Pozzoli, L., Sonbawne, S., Ghude, 420
S. D., Kiefer, M. and Eckert, E.: Trends in peroxyacetyl nitrate (PAN) in the upper 421
troposphere and lower stratosphere over southern Asia during the summer monsoon 422
season: Regional impacts, Atmos. Chem. Phys., 14(23), 12725–12743, 423
doi:10.5194/acp-14-12725-2014, 2014. 424
Fadnavis, S., Semeniuk, K., Schultz, M. G., Kiefer, M., Mahajan, A., Pozzoli, L. and 425
Sonbawane, S.: Transport pathways of peroxyacetyl nitrate in the upper troposphere 426
and lower stratosphere from different monsoon systems during the summer monsoon 427
season, Atmos. Chem. Phys., 15(20), 11477–11499, doi:10.5194/acp-15-11477-2015, 428
2015. 429
Fadnavis, S. and Chattopadhyay, R.: Linkages of subtropical stratospheric intraseasonal 430
intrusions with Indian summer monsoon deficit rainfall, J. Clim., 30(13), 5083–5095, 431
doi:10.1175/JCLI-D-16-0463.1, 2017. 432
Fischer, H., Birk, M., Blom, C., Carli, B., Carlotti, M., von Clarmann, T., Delbouille, L., 433
Dudhia, A., Ehhalt, D., Endemann, M., Flaud, J. M., Gessner, R., Kleinert, A., 434
Koopman, R., Langen, J., López-Puertas, M., Mosner, P., Nett, H., Oelhaf, H., Perron, 435
G., Remedios, J., Ridolfi, M., Stiller, G. and Zander, R.: MIPAS: An instrument for 436
atmospheric and climate research, Atmos. Chem. Phys., 8(8), 2151–2188, 437
doi:10.5194/acp-8-2151-2008, 2008. 438
Garny, H. and Randel, W. J.: Transport pathways from the Asian monsoon anticyclone to the 439
stratosphere, Atmos. Chem. Phys., 16(4), 2703–2718, doi: 10.5194/acp-16-2703-2016, 440
2016. 441
Ghude, S. D., Kulkarni, S. H., Jena, C., Pfister, G. G., Beig, G., Fadnavis, S. and van Der, R. 442
J.: Application of satellite observations for identifying regions of dominant sources of 443
Atmos. Chem. Phys. Discuss., https://doi.org/10.5194/acp-2018-168Manuscript under review for journal Atmos. Chem. Phys.Discussion started: 12 March 2018c© Author(s) 2018. CC BY 4.0 License.
22
nitrogen oxides over the indian subcontinent, J. Geophys. Res. Atmos., 118(2), 1075–444
1089, doi: 10.1029/2012JD017811, 2013. 445
Gilford, D. M. and Solomon, S.: Radiative effects of stratospheric seasonal cycles in the 446
tropical upper troposphere and lower stratosphere, J. Clim., 30(8), 2769–2783, 447
doi:10.1175/JCLI-D-16-0633.1, 2017. 448
Horowitz, L. W., Walters, S., Mauzerall, D. L., Emmons, L. K., Rasch, P. J., Granier, C., Tie, 449
X., Lamarque, J.-F., Schultz, M. G., Tyndall, G. S., Orlando, J. J. and Brasseur, G. P.: 450
A global simulation of tropospheric ozone and related tracers: Description and 451
evaluation of MOZART, version 2, J. Geophys. Res. Atmos., 108(D24), doi: 452
10.1029/2002JD002853, 2003. 453
Hsu, C. J. and Plumb, R. A.: Nonaxisymmetric Thermally Driven Circulations and Upper-454
Tropospheric Monsoon Dynamics, J. Atmos. Sci., 57(1977), 1255–1276, 455
doi:https://doi.org/10.1175/1520-0469(2000)057<1255:NTDCAU>2.0.CO;2, 2000. 456
Liang, Q., Jaeglé, L., Jaffe, D. A., Weiss-Penzias, P., Heckman, A. and Snow, J. A.: Long-457
range transport of Asian pollution to the northeast Pacific: Seasonal variations and 458
transport pathways of carbon monoxide, J. Geophys. Res. D Atmos., 109(23), 1–16, 459
doi:10.1029/2003JD004402, 2004. 460
Nützel, M., Dameris, M., and Garny, H.: Movement, drivers andbimodality of the South Asian 461
High, Atmos. Chem. Phys., 16,14755-14774, https://doi.org/10.5194/acp-16-14755-462
2016, 2016. 463
Ohara, T., Akimoto, H., Kurokawa, J., Horii, N., Yamaji, K., Yan, X. and Hayasaka, T.: An 464
Asian emission inventory of anthropogenic emission sources for the period 1980–2020, 465
Atmos. Chem. Phys., 7, 4419–4444, doi:10.5194/acp-7-4419-2007, 2007. 466
Payne, V. H., Fischer, E. V., Worden, J. R., Jiang, Z., Zhu, L., Kurosu, T. P. and Kulawik, S. 467
S.: Spatial variability in tropospheric peroxyacetyl nitrate in the tropics from infrared 468
satellite observations in 2005 and 2006, Atmos. Chem. Phys., 17(10), 6341–6351, 469
doi:10.5194/acp-17-6341-2017, 2017. 470
Ploeger, F., Gottschling, C., Griessbach, S., Grooß, J.-U., Guenther, G., Konopka, P., Müller, 471
R., Riese, M., Stroh, F., Tao, M., Ungermann, J., Vogel, B. and von Hobe, M.: A 472
potential vorticity-based determination of the transport barrier in the Asian summer 473
monsoon anticyclone, Atmos. Chem. Phys., 15(22), 13145–13159, doi:10.5194/acp-474
15-13145-2015, 2015. 475
Ploeger, F., Konopka, P., Walker, K. and Riese, M.: Quantifying trace gases transport from the 476
Asian monsoon anticyclone into the lower stratosphere, Atmos. Chem. Phys., 17(11), 477
7055–7066, doi: 10.5194/acp-17-7055-2017, 2017. 478
Popovic, J. M. and Plumb, R. A.: Eddy Shedding from the Upper-Tropospheric Asian 479
Atmos. Chem. Phys. Discuss., https://doi.org/10.5194/acp-2018-168Manuscript under review for journal Atmos. Chem. Phys.Discussion started: 12 March 2018c© Author(s) 2018. CC BY 4.0 License.
23
Monsoon Anticyclone, J. Atmos. Sci., 58(1), 93–104, doi:https://doi.org/10.1175/1520-480
0469(2001)058<0093:ESFTUT>2.0.CO;2, 2001. 481
Pozzoli, L., Janssens-Maenhout, G., Diehl, T., Bey, I., Schultz, M. G., Feichter, J., Vignati, E. 482
and Dentener, F.: Re-analysis of tropospheric sulfate aerosol and ozone for the period 483
1980-2005 using the aerosol-chemistry-climate model ECHAM5-HAMMOZ, Atmos. 484
Chem. Phys., 11(18), 9563–9594, doi:10.5194/acp-11-9563-2011, 2011. 485
Randel, W. J., Park, M., Emmons, L., Kinnison, D., Bernath, P., Walker, K. A., Boone, C., and 486
Pumphrey, H.: Asian monsoon transport of trace gases to the stratosphere, Science, 487
328, 611-613, 10.1126/science.1182274, 2010. 488
Rap A., Richards N.A.D.; Forster P.M.; Monks S.; Arnold S.R.; Chipperfield,M., Satellite 489
constraint on the tropospheric ozone radiative effect, Geophys. Res. Lett., 42,5074-490
5081,doi: 10.1002/2015GL064037, 2015. 491
Riese, M., F. Ploeger, A. Rap, B. Vogel, P. Konopka, M. Dameris, and P. Forster, Impact of 492
uncertaintiesin atmospheric mixing on simulated UTLS composition and related 493
radiative effects, J. Geophys. Res., 117, D16305,doi: 10.1029/2012JD017751, 2012. 494
Roeckner, E., Bauml, G., Bonaventura, L., Brokopf, R., Esch, M., Giorgetta, M., Hagemann, 495
S., Kirchner, I., Kornblueh, L., Manzini, E., Rhodin, A., Schlese, U., Schulzweida, U., 496
and Tompkins, A.: The atmospehric general circulation model ECHAM5: Part 1, Tech. 497
Rep. 349, Max Planck Institute for Meteorology, Hamburg, 2003. 498
Roxy, M. K., Ghosh, S., Pathak, A., Athulya, R., Mujumdar, M., Murtugudde, R., Terray, P. 499
and Rajeevan, M.: A threefold rise in widespread extreme rain events over central 500
India, Nat. Commun., 8(1), 1–11, doi:10.1038/s41467-017-00744-9, 2017. 501
Roy, C., Fadnavis, S., Müller, R., Chaudhary, A. D. and Ploeger, F.: Influence of enhanced 502
Asian NOxemissions on ozone in the Upper Troposphere and Lower Stratosphere 503
(UTLS) in chemistry climate model simulations,Atmos. Chem. Phys., 17, 1297-1311, 504
doi: https://doi.org/10.5194/acp-17-1297-2017. 505
Santee, M. L., G. L. Manney, N. J. Livesey, M. J. Schwartz, J. L. Neu, and W. G. Read, A 506
comprehensive overview of the climatological composition of the Asian summer 507
monsoon anticyclone based on 10 years of Aura Microwave Limb Sounder 508
measurements, J. Geophys. Res. Atmos., 122, 5491–5514, doi:10.1002/2016JD026408, 509
2017. 510
Schneider, P. and van Der A, R. J.: A global single-sensor analysis of 2002-2011 tropospheric 511
nitrogen dioxide trends observed from space, J. Geophys. Res. Atmos., 117(16), 1–17, 512
doi: 10.1029/2012JD017571, 2012. 513
Stier, P., Feichter, J., Kinne, S., Kloster, S., Vignati, E., Wilson, J., Ganzeveld, L., Tegen, I., 514
Werner, M., Balkanski, Y., Schulz, M., Boucher, O., Minikin, A. and Petzold, A.: The 515
Atmos. Chem. Phys. Discuss., https://doi.org/10.5194/acp-2018-168Manuscript under review for journal Atmos. Chem. Phys.Discussion started: 12 March 2018c© Author(s) 2018. CC BY 4.0 License.
24
aerosol-climate model ECHAM5-HAM, Atmos. Chem. Phys., 5, 1125-1156, doi: 516
1680-7324/acp/2005-5-1125, 2005. 517
Streets, D. G., Yarber, K. F., Woo, J.-H. and Carmichael, G. R.: Biomass burning in Asia: 518
Annual and seasonal estimates and atmospheric emissions, Global Biogeochem. 519
Cycles, 17(4), doi:10.1029/2003GB002040, 2003. 520
Strode, S. A. and Pawson, S.: Detection of carbon monoxide trends in the presence of 521
interannual variability, J. Geophys. Res. Atmos., 118(21), 12257–12273, doi: 522
10.1002/2013JD020258, 2013. 523
Strong, C. and Magnusdottir, G.: Tropospheric Rossby Wave Breaking and the NAO/NAM, J. 524
Atmos. Sci., 65(9), 2861–2876, doi:10.1175/2008JAS2632.1, 2008. 525
Tereszchuk, K. A., Moore, D. P., Harrison, J. J., Boone, C. D., Park, M., Remedios, J. J., 526
Randel, W. J. and Bernath, P. F.: Observations of peroxyacetyl nitrate (PAN) in the 527
upper troposphere by the Atmospheric Chemistry Experiment-Fourier Transform 528
Spectrometer (ACE-FTS), Atmos. Chem. Phys., 13(11), 5601–5613, doi:10.5194/acp-529
13-5601-2013, 2013. 530
Tie, X., Zhang, R., Brasseur, G. and Lei, W.: Global NOx Production by Lightning, J. Atmos. 531
Chem., 43(1), 61–74, doi:10.1023/A:1016145719608, 2002. 532
Ungermann, J., Ern, M., Kaufmann, M., Müller, R., Spang, R., Ploeger, F., Vogel, B. and 533
Riese, M.: Observations of PAN and its confinement in the Asian summer monsoon 534
anticyclone in high spatial resolution, Atmos. Chem. Phys., 16(13), 8389–8403, doi: 535
10.5194/acp-16-8389-2016, 2016. 536
Uppala, S. M., Kållberg, P. W., Simmons, A. J., Andrae, U., da Costa Bechtold, V., Fiorino, 537
M., Gibson, J. K., Haseler, J., Hernandez, A., Kelly, G. A., Li, X., Onogi, K., Saarinen, 538
S., Sokka, N., Allan, R. P., Andersson, E., Arpe, K., Balmaseda, M. A., Beljaars, A. C. 539
M., van de Berg, L., Bidlot, J., Bormann, N., Caires, S., Chevallier, F., Dethof, A., 540
Dragosavac, M., Fisher, M., Fuentes, M., Hagemann, S., Hólm, E., Hoskins, B. J., 541
Isaksen, L., Janssen, P. A. E. M., Jenne, R., McNally, A. P., Mahfouf, J. F., Morcrette, 542
J. J., Rayner, N. A., Saunders, R. W., Simon, P., Sterl, A., Trenberth, K. E., Untch, A., 543
Vasiljevic, D., Viterbo, P. and Woollen, J.: The ERA-40 re-analysis, Q. J. R. Meteorol. 544
Soc., 131(612), 2961–3012, doi:10.1256/qj.04.176, 2005. 545
Verstraeten, W. W., Neu, J. L., Williams, J. E., Bowman, K. W., Worden, J. R. and Boersma, 546
K. F.: Rapid increases in tropospheric ozone production and export from China, Nat. 547
Geosci., 8(9), 690–695, doi:10.1038/ngeo2493, 2015. 548
Vogel, B., Günther, G., Müller, R., Grooß, J.-U., Hoor, P., Krämer, M., Müller, S., Zahn, A. 549
and Riese, M.: Fast transport from Southeast Asia boundary layer sources to northern 550
Europe: Rapid uplift in typhoons and eastward eddy shedding of the Asian monsoon 551
anticyclone, Atmos. Chem. Phys., 14(23), 12745–12762, doi:10.5194/acp-14-12745-552
Atmos. Chem. Phys. Discuss., https://doi.org/10.5194/acp-2018-168Manuscript under review for journal Atmos. Chem. Phys.Discussion started: 12 March 2018c© Author(s) 2018. CC BY 4.0 License.
25
2014, 2014. 553
Vogel, B., Günther, G., Müller, R., Grooß, J.-U., Afchine, A., Bozem, H., Hoor, P., Krämer, 554
M., Müller, S., Riese, M., Rolf, C., Spelten, N., Stiller, G. P., Ungermann, J., and Zahn, 555
A.: Long-range transport pathways of tropospheric source gases originating in Asia 556
into the northern lower stratosphere during the Asian monsoon season 2012, Atmos. 557
Chem. Phys., 16, 15301-15325, https://doi.org/10.5194/acp-16-15301-2016, 2016. 558
von Clarmann, T., De Clercq, C., Ridolfi, M., Höpfner, M. and Lambert, J. C.: The horizontal 559
resolution of MIPAS, Atmos. Meas. Tech., 2(1), 47–54, doi:10.5194/amt-2-47-2009, 560
2009. 561
van der Werf, G. R., Randerson, J. T., Giglio, L., Collatz, G. J., Kasibhatla, P. S. and Arellano, 562
Avelino F., J.: Interannual variability in global biomass burning emissions from 1997 563
to 2004, Atmos. Chem. Phys., 6(11), 3423–3441, doi:10.5194/acpd-6-3175-2006, 564
2006. 565
Wang, W.-G., Yuan, M., Wang, H.-Y., Sun, J.-H., Xie, Y.-Q., Fan, W.-X. and Chen, X.-M., A 566
Study of Ozone Amount in the Transition Layer Between Troposphere and 567
Stratosphere and Its Heating Rate. Chinese J. Geophys., 51: 916–930. 568
doi:10.1002/cjg2.1287, 2008 569
Wayne, R. P.: Chemistry of the atmospheres, 3rd Edn., Oxford science publications, 570
Clarendon Press, Oxford, 337, 2000. 571
Zhang, Q., Wu, G. and Qian, Y.: The Bimodality of the 100 hPa South Asia High and its 572
Relationship to the Climate Anomaly over East Asia in summer. J. Meteorol. Soc. 573
Japan, 80(4), 733–744, doi:10.2151/jmsj.80.733, 2002. 574
Zhao, C., Wang, Y., Choi, Y. and Zeng, T.: Summertime impact of convective transport and 575
lightning NOxproduction over North America: Modeling dependence on 576
meteorological simulations, Atmos. Chem. Phys., 9(13), 4315–4327, doi: 10.5194/acp-577
9-4315-2009, 2009. 578
579
580
581
582
583
584
585
Atmos. Chem. Phys. Discuss., https://doi.org/10.5194/acp-2018-168Manuscript under review for journal Atmos. Chem. Phys.Discussion started: 12 March 2018c© Author(s) 2018. CC BY 4.0 License.
26
586
587
588
589
590
591
592
593
594
595
596
597
598
599
Figure 1: Spatial distribution of potential vorticity (PVU) (1 PVU = 10-6
K m2 kg
-1 s
-1) 600
(color shades) at 370 K potential temperature surface and wind anomalies at 200 hPa 601
from ERA-Interim reanalysis for (a) 01 July, (b) 02 July, (c) 03 July, (d) 04 July, (e) 05 July, (f) 602
06 July, (g) 07 July, (h) 08 July, 2003. Wind vectors are represented by black arrows (mˑs-1
). 603
Eddies are shown with white circles. 604
Atmos. Chem. Phys. Discuss., https://doi.org/10.5194/acp-2018-168Manuscript under review for journal Atmos. Chem. Phys.Discussion started: 12 March 2018c© Author(s) 2018. CC BY 4.0 License.
27
605
606
607
608
609
610
611
612
Figure 2: Spatial distribution of potential vorticity (PVU) (color shades) at 350 K level and 613
wind anomalies in mˑs-1
(thin black vectors) at 200 hPa from ERA-Interim reanalysis for (a) 614
01 July, (b) 02 July, (c) 03 July, (d) 04 July, (e) 05 July, (f) 06 July, (g) 07 July, (h) 08 July, 615
2003. The events of RWB-1, RBW-2 and RWB-3 are indicated by solid black, red and blue 616
arrows, respectively. 617
Atmos. Chem. Phys. Discuss., https://doi.org/10.5194/acp-2018-168Manuscript under review for journal Atmos. Chem. Phys.Discussion started: 12 March 2018c© Author(s) 2018. CC BY 4.0 License.
28
618
619
620
621
622
623
624
625
626
627
628
629
Figure 3: Power spectral analysis of ERA-Interim PV averaged for 100-300 hPa and in June-630
September during 1995-2015 (a) West-Africa (20-30N, 0-30E) and (b) West-Pacific (20-631
30N, 140-150E) and lag-lead correlation of PV in the monsoon anticyclone (85-90E, 28-632
30N) with (c) West-Pacific (20-30N, 140-150E), (d) West Africa (20-30N, 0-30E). 633
(a) (b)
Lead Days Lead Days
(c) (d)
Atmos. Chem. Phys. Discuss., https://doi.org/10.5194/acp-2018-168Manuscript under review for journal Atmos. Chem. Phys.Discussion started: 12 March 2018c© Author(s) 2018. CC BY 4.0 License.
29
634
635
636
637
638
639
640
641
642
643
644
Figure 4: Spatial distribution of ozone mixing ratios (ppb) (color shades) corresponding to 645
MIPAS satellite observations at 16 km for (a) 1-2 July, (b) 3-4 July, (c) 5-6 July, (d) 7-8 July, 646
2003; ERA-Interim reanalysis at 100 hPa for (e) 2 July, (f) 4 July, (g) 6 July, (h) 8 July, 2003, 647
and ECHAM5-HAMMOZ CTRL simulations at 16 km for (i) 2 July, (j) 4 July, (k) 6 July, (l) 8 648
July, 2003. Black arrows in panels (e)-(h) show wind anomalies (mˑs-1
) at 200 hPa. 649
650
Atmos. Chem. Phys. Discuss., https://doi.org/10.5194/acp-2018-168Manuscript under review for journal Atmos. Chem. Phys.Discussion started: 12 March 2018c© Author(s) 2018. CC BY 4.0 License.
30
651
652
653
654
655
656
657
658
659
Figure 5: Spatial distribution of CO mixing ratios (ppb) at 16 km: MIPAS satellite 660
observations for (a) 1-2 July, (b) 3-4 July, (c) 5-6 July, (d) 7-8 July, 2003 and ECHAM5-661
HAMMOZ CTRL simulations for (e) 02 July, (f) 04 July, (g) 06 July, (h) 08 July, 2003. 662
Atmos. Chem. Phys. Discuss., https://doi.org/10.5194/acp-2018-168Manuscript under review for journal Atmos. Chem. Phys.Discussion started: 12 March 2018c© Author(s) 2018. CC BY 4.0 License.
31
663
664
665
666
667
668
669
Figure 6: Spatial distribution of PAN mixing ratios (ppt) at 16 km: MIPAS satellite 670
observations for (a) 1-2 July, (b) 3-4 July, (c) 5-6 July, (d) 7-8 July, 2003, and ECHAM5-671
HAMMOZ CTRL simulations for (e) 02 July, (f) 04 July, (g) 06 July, (h) 08 July, 2003. 672
Atmos. Chem. Phys. Discuss., https://doi.org/10.5194/acp-2018-168Manuscript under review for journal Atmos. Chem. Phys.Discussion started: 12 March 2018c© Author(s) 2018. CC BY 4.0 License.
32
673
674
675
676
677
678
679
680
681
682
683
Figure 7: Longitude-pressure section (averaged for 20°-40° N) of CO (ppb) from 684
ECHAM5-HAMMOZ CTRL simulation for (a) 02 July, (b) 04 July, (c) 06 July, (d) 08 July, 685
2003. Wind vectors (mˑs-1
) are shown by black arrows. Vertical velocity field is scaled by a 686
factor of 300. (e)-(h) same as (a)-(d) but for PAN (ppt). Black thick line indicates tropopause and 687
black dotted circles indicate eddies. Pressure (hPa) is indicated on left y-axis and altitudes (km) 688
on right y-axis. 689
Atmos. Chem. Phys. Discuss., https://doi.org/10.5194/acp-2018-168Manuscript under review for journal Atmos. Chem. Phys.Discussion started: 12 March 2018c© Author(s) 2018. CC BY 4.0 License.
33
690
691
692
693
694
695
696
697
698
699
700
701
Figure 8: Spatial distribution of anomalies of PAN mixing ratios (ppt) (color shades) at 16 km 702
from ECHAM5-HAMMOZ model simulations for (a) 02 July, (b) 04 July, (c) 06 July, (d) 08 703
July, 2003. Longitude-pressure distribution (averaged for 20°-40° N) of anomalies of PAN 704
(%) for (e) 02 July, (f) 04 July, (g) 06 July, (h) 08 July, 2003. (i)-(l) same as (e)-(h) but for 705
ozone anomalies (%). Black thick line indicates tropopause. Pressure (hPa) is indicated on left 706
y-axis and altitudes (km) on right y-axis. 707
Atmos. Chem. Phys. Discuss., https://doi.org/10.5194/acp-2018-168Manuscript under review for journal Atmos. Chem. Phys.Discussion started: 12 March 2018c© Author(s) 2018. CC BY 4.0 License.
34
708
709
710
711
712
713
Figure 9: Longitude-pressure distribution of anomalies of ozone heating rates ((K·day-1
) ×10-3
) 714
for (a) 02 July, (b) 04 July, (c) 06 July, (d) 08 July, 2003. Pressure (hPa) is indicated on left y-715
axis and altitudes (km) on right y-axis. 716
717
Atmos. Chem. Phys. Discuss., https://doi.org/10.5194/acp-2018-168Manuscript under review for journal Atmos. Chem. Phys.Discussion started: 12 March 2018c© Author(s) 2018. CC BY 4.0 License.
Related Documents