1 Version: October 2008 ‘As-is’ Process Map

Asset enlargement certification part 2
Jul 30, 2015
Welcome message from author
This document is posted to help you gain knowledge. Please leave a comment to let me know what you think about it! Share it to your friends and learn new things together.
Transcript
1Version: October 2008
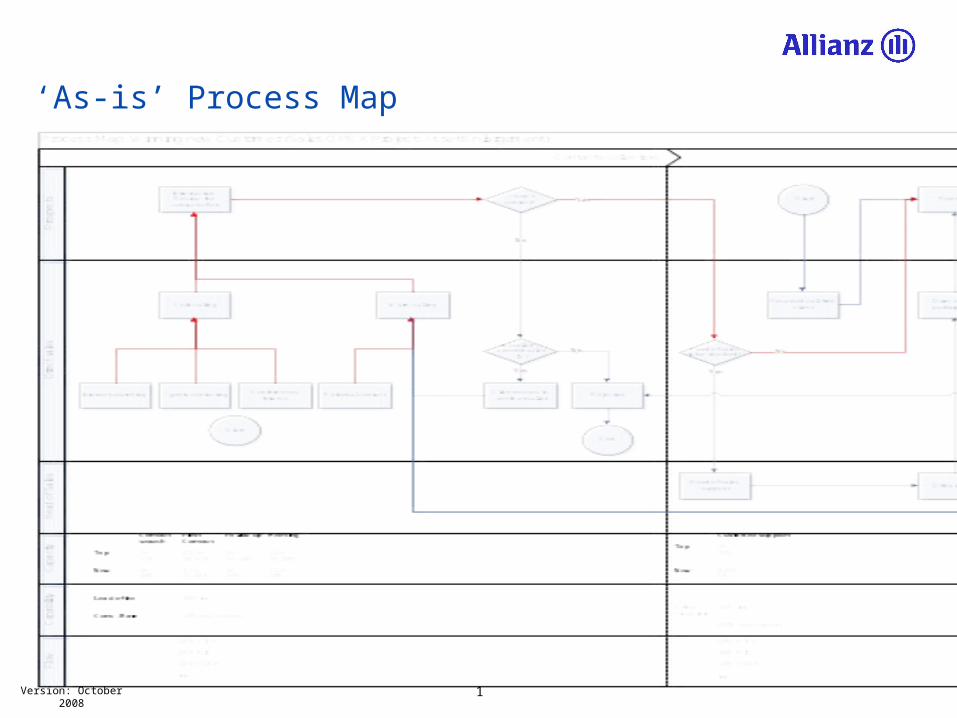
‘As-is’ Process Map
2Version: October 2008
13. 'As Is' baseline statement
Note: Black Belt applicants should calculate an “As Is” sigma level!Note: Black Belt applicants should calculate an “As Is” sigma level!
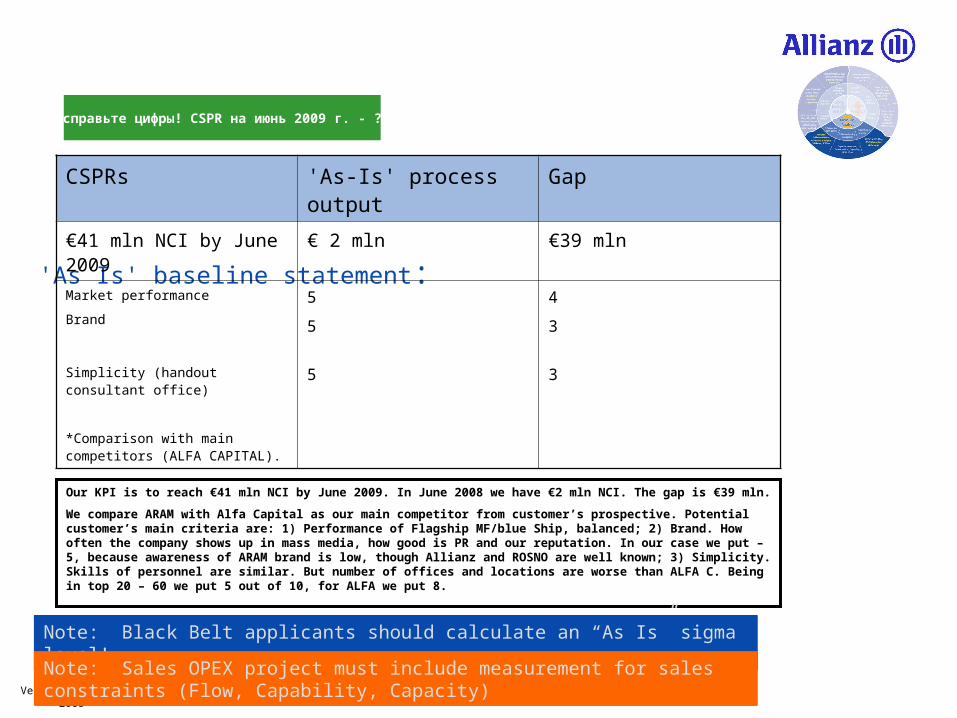
'As Is' baseline statement:
Note: Sales OPEX project must include measurement for sales constraints (Flow, Capability, Capacity)Note: Sales OPEX project must include measurement for sales constraints (Flow, Capability, Capacity)
CSPRs 'As-Is' process output Gap
€41 mln NCI by June 2009 € 2 mln €39 mln
Market performance
Brand
Simplicity (handout consultant office)
*Comparison with main competitors (ALFA CAPITAL).
5
5
5
4
3
3
Our KPI is to reach €41 mln NCI by June 2009. In June 2008 we have €2 mln NCI. The gap is €39 mln.
We compare ARAM with Alfa Capital as our main competitor from customer’s prospective. Potential customer’s main criteria are: 1) Performance of Flagship MF/blue Ship, balanced; 2) Brand. How often the company shows up in mass media, how good is PR and our reputation. In our case we put – 5, because awareness of ARAM brand is low, though Allianz and ROSNO are well known; 3) Simplicity. Skills of personnel are similar. But number of offices and locations are worse than ALFA C. Being in top 20 – 60 we put 5 out of 10, for ALFA we put 8.
Исправьте цифры! CSPR на июнь 2009 г. - ??
3Version: October 2008
Conclusion:
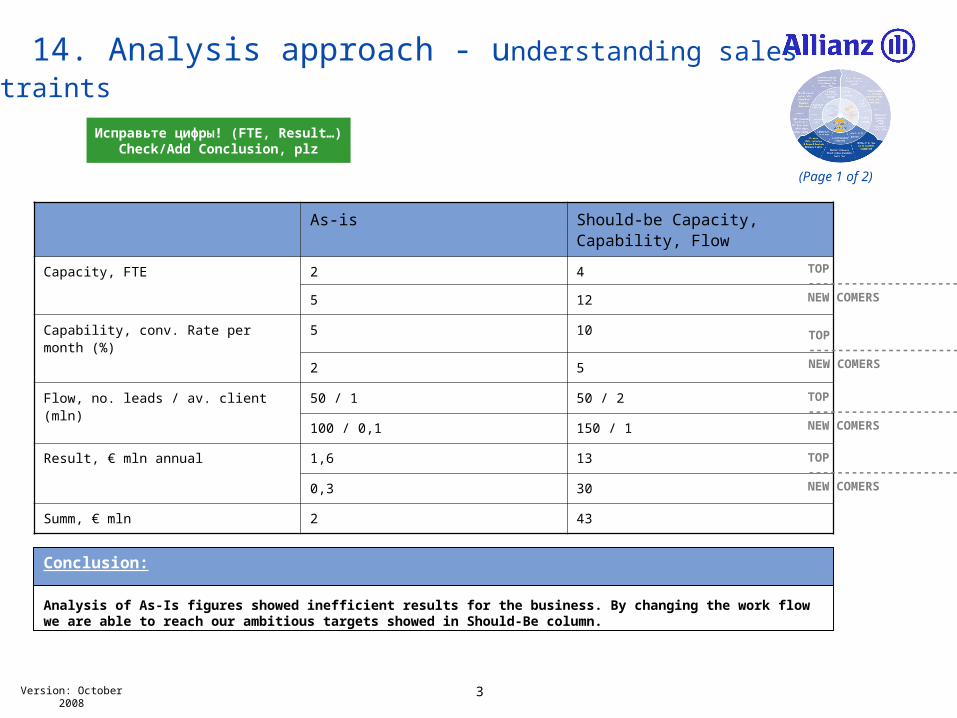
14. Analysis approach - understanding sales constraints
(Page 1 of 2)
As-is Should-be Capacity, Capability, Flow
Capacity, FTE 2 4
5 12
Capability, conv. Rate per month (%) 5 10
2 5
Flow, no. leads / av. client (mln) 50 / 1 50 / 2
100 / 0,1 150 / 1
Result, € mln annual 1,6 13
0,3 30
Summ, € mln 2 43
TOP----------------------NEW COMERS
TOP----------------------NEW COMERS
TOP----------------------NEW COMERS
TOP----------------------NEW COMERS
Исправьте цифры! (FTE, Result…)Check/Add Conclusion, plz
Analysis of As-Is figures showed inefficient results for the business. By changing the work flow we are able to reach our ambitious targets showed in Should-Be column.
4Version: October 2008
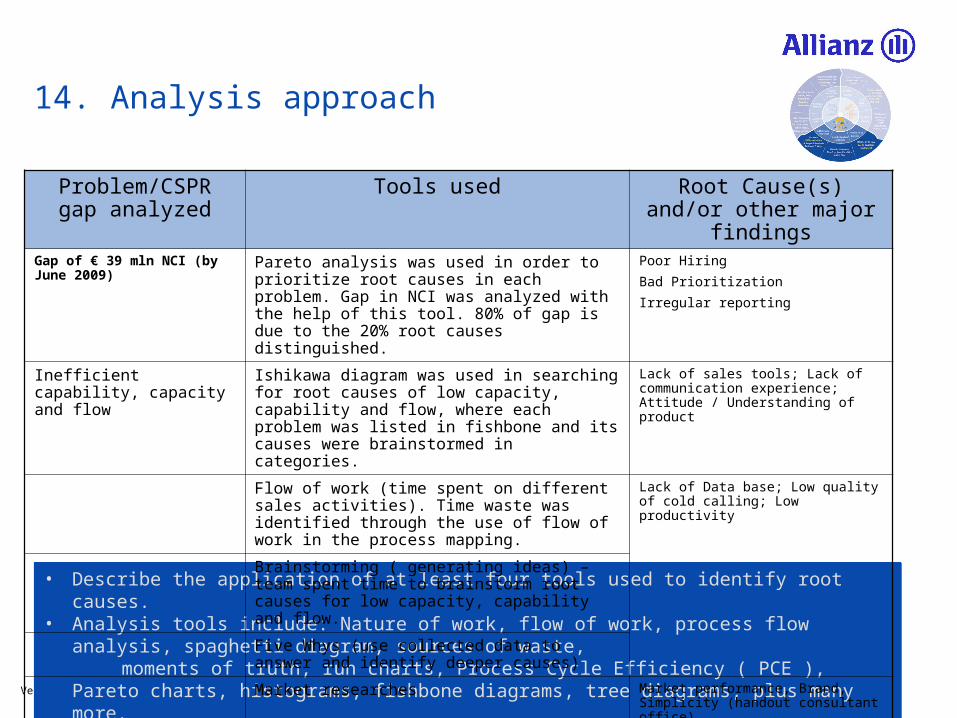
14. Analysis approach
• Describe the application of at least four tools used to identify root causes.• Analysis tools include: Nature of work, flow of work, process flow analysis, spaghetti diagram, sources of waste, moments of truth, run charts, Process Cycle Efficiency ( PCE ), Pareto charts, histograms, fishbone diagrams, tree
diagrams, plus many more.• Supporting documentation can be attached to this page ( if required ).
Problem/CSPR gap analyzed
Tools used Root Cause(s) and/or other major findings
Gap of € 39 mln NCI (by June 2009)
Pareto analysis was used in order to prioritize root causes in each problem. Gap in NCI was analyzed with the help of this tool. 80% of gap is due to the 20% root causes distinguished.
Poor Hiring
Bad Prioritization
Irregular reporting
Inefficient capability, capacity and flow
Ishikawa diagram was used in searching for root causes of low capacity, capability and flow, where each problem was listed in fishbone and its causes were brainstormed in categories.
Lack of sales tools; Lack of communication experience; Attitude / Understanding of product
Flow of work (time spent on different sales activities). Time waste was identified through the use of flow of work in the process mapping.
Lack of Data base; Low quality of cold calling; Low productivity
Brainstorming ( generating ideas) – team spent time to brainstorm root causes for low capacity, capability and flow.
Five Whys (use collected data to answer and identify deeper causes)
Market researches Market performance, Brand, Simplicity (handout consultant office)
5Version: October 2008
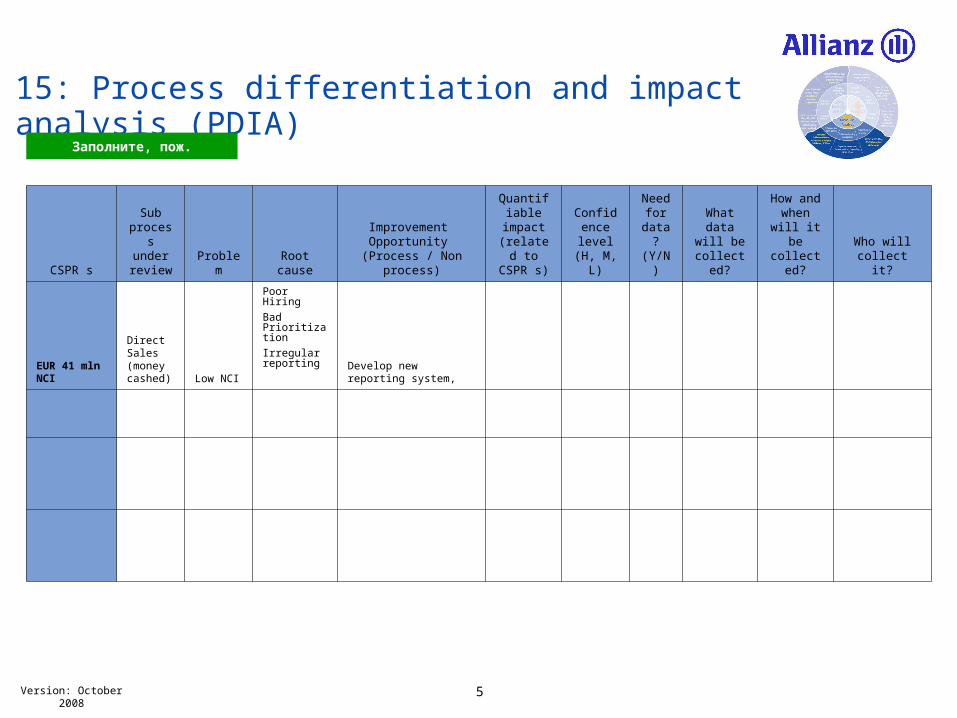
15: Process differentiation and impact analysis (PDIA)
CSPR s
Sub process under review Problem Root cause
Improvement Opportunity
(Process / Non process)
Quantifiable impact (related to CSPR s)
Confidence level (H, M, L)
Need for
data? (Y/N)
What data will be
collected?
How and when will
it be collected?
Who will collect it?
EUR 41 mln NCI
Direct Sales (money cashed) Low NCI
Poor Hiring
Bad Prioritization
Irregular reporting Develop new reporting
system,
Заполните, пож.
6Version: October 2008
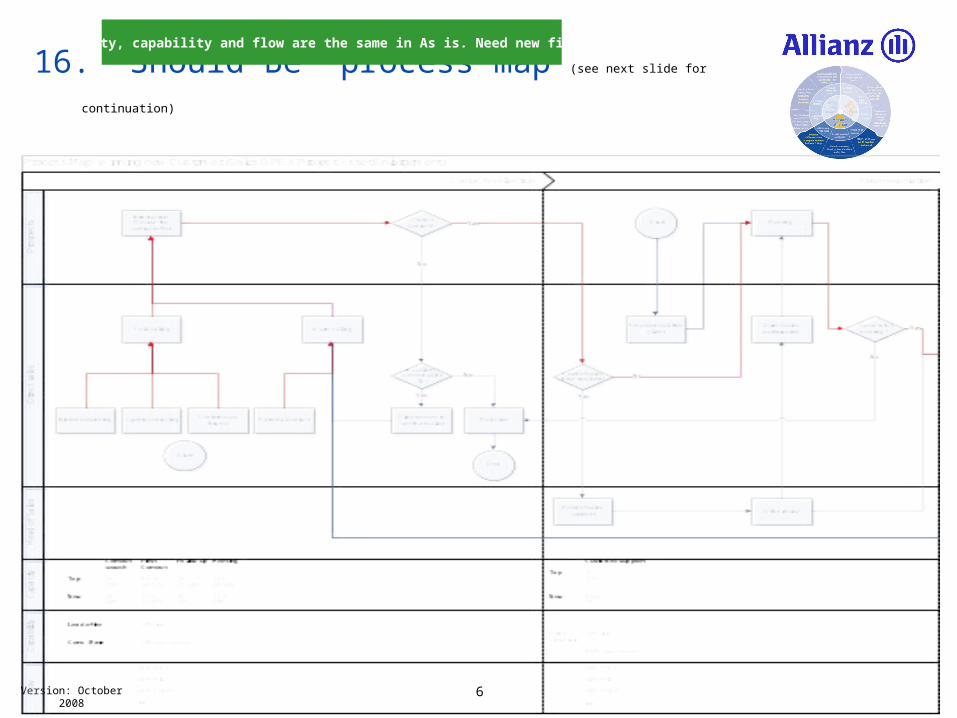
16. 'Should Be' process map (see next slide for continuation)
Capacity, capability and flow are the same in As is. Need new figures!
7Version: October 2008
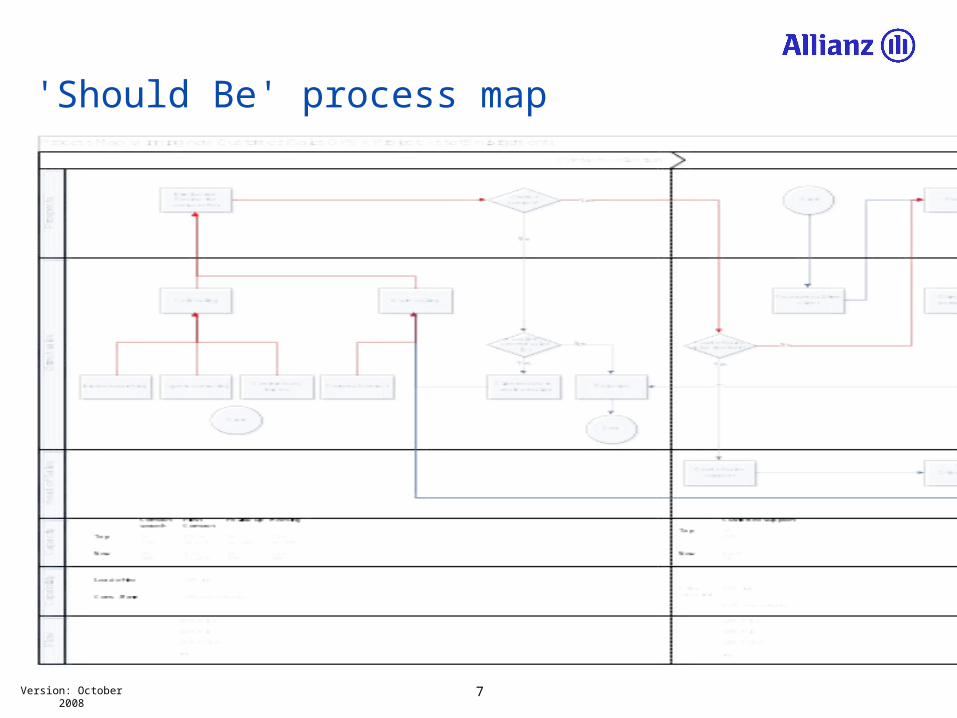
'Should Be' process map
8Version: Oct. 2008
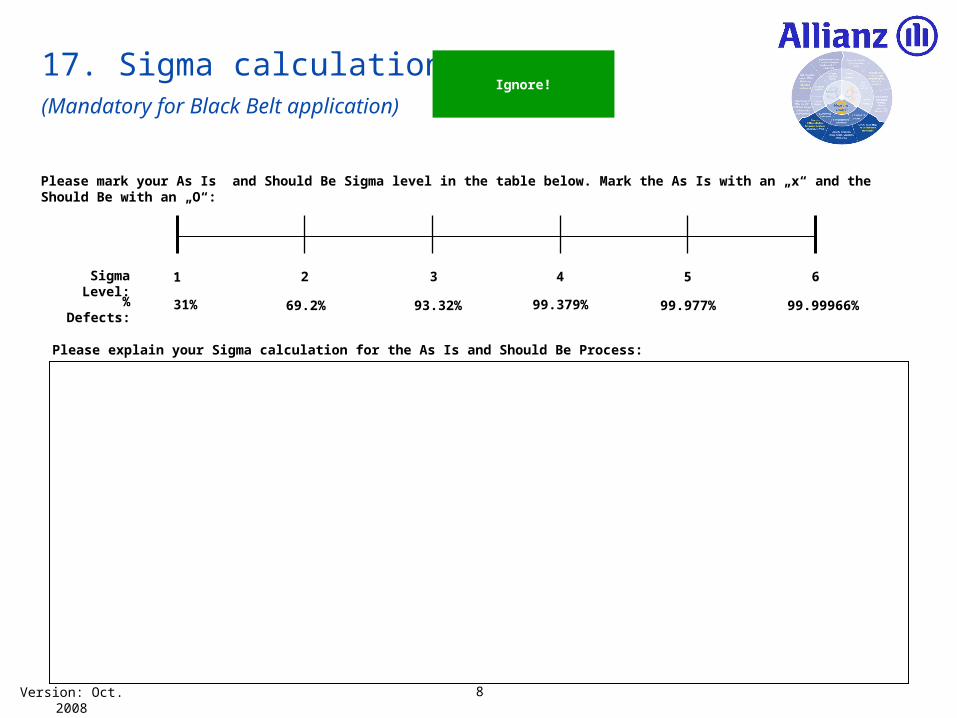
17. Sigma calculation (Mandatory for Black Belt application)
Sigma Level: 1 2 3 4 5 6
% Defects: 31% 69.2% 93.32% 99.379% 99.977% 99.99966%
Please explain your Sigma calculation for the As Is and Should Be Process:
Please mark your As Is and Should Be Sigma level in the table below. Mark the As Is with an „x“ and the Should Be with an „O“:
Ignore!
9Version: October 2008
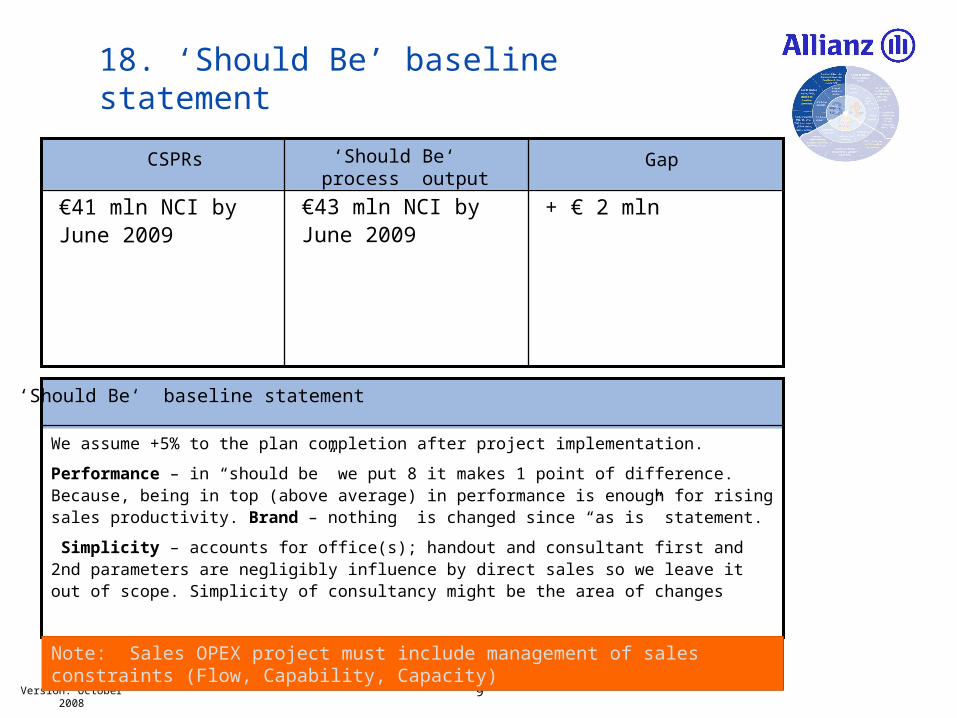
18. ‘Should Be’ baseline statement
We assume +5% to the plan completion after project implementation.
Performance – in “should be” we put 8 it makes 1 point of difference. Because, being in top (above average) in performance is enough for rising sales productivity. Brand – nothing is changed since “as is” statement.
Simplicity – accounts for office(s); handout and consultant first and 2nd parameters are negligibly influence by direct sales so we leave it out of scope. Simplicity of consultancy might be the area of changes
‘Should Be‘ baseline statement
CSPRs ‘Should Be‘ process output
Gap
Note: Sales OPEX project must include management of sales constraints (Flow, Capability, Capacity)Note: Sales OPEX project must include management of sales constraints (Flow, Capability, Capacity)
€41 mln NCI by June 2009
€43 mln NCI by June 2009
+ € 2 mln
10Version: October 2008
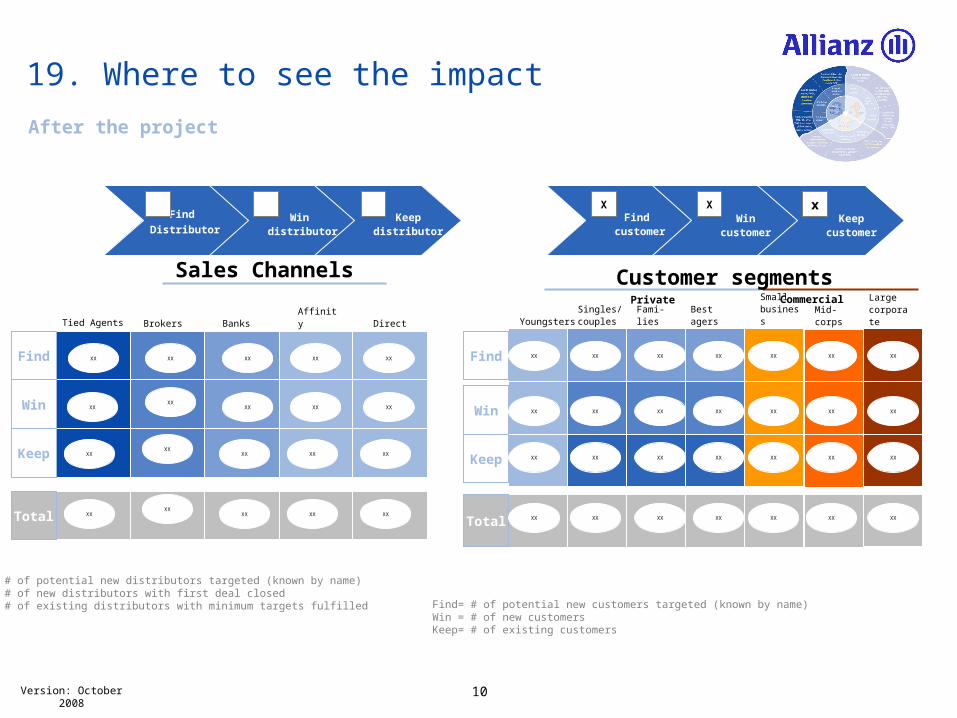
19. Where to see the impact
Find
DistributorWin
distributorKeep
distributorFind
customerWin
customerKeep
customer
X X x
After the project
YoungstersSingles/ couples
Fami-lies
Best agers
PrivateSmall business
Mid-corps
Large corporate
Commercial
Tied Agents Brokers Banks Affinity
Sales Channels
Direct
Customer segments
XXFind
Win
Keep
Total
Find= # of potential new distributors targeted (known by name)Win = # of new distributors with first deal closed Keep= # of existing distributors with minimum targets fulfilled Find= # of potential new customers targeted (known by name)
Win = # of new customers Keep= # of existing customers
Find
Win
Keep
Total
XX XX XX
XXXX
XX
XX
XX XX
XXXX
XX XX XX
XXXX
XX XX XX
XX XX XX XX XX XX XX
XX XX XX XX XX XX XX
XX XX XX XX XX XX XX
XX XX XX XX XX XX XX
11Version: October 2008
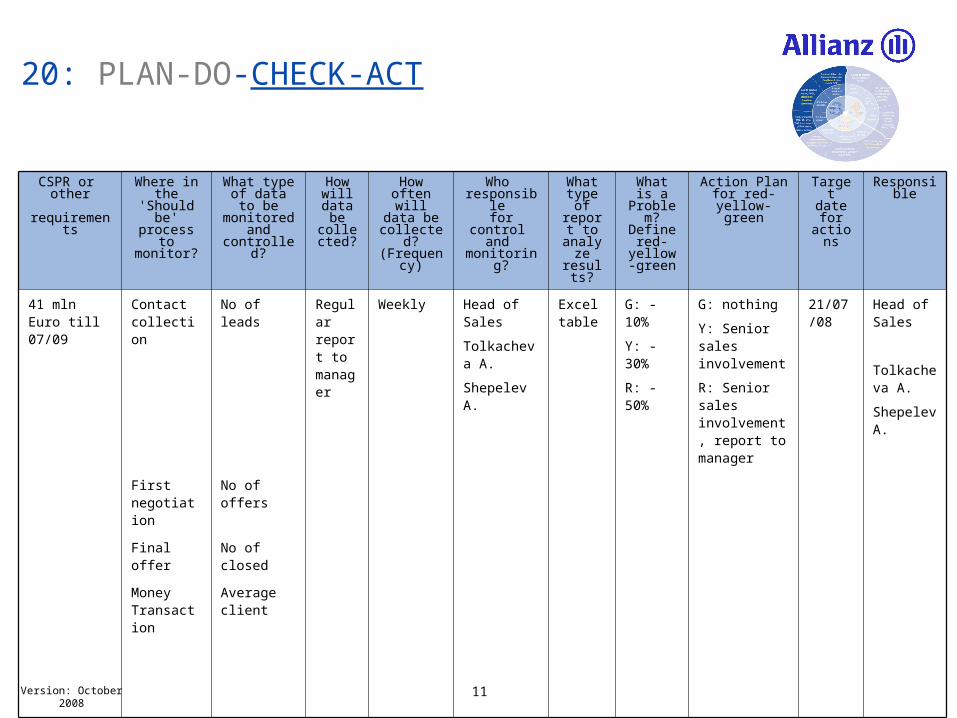
20: PLAN-DO-CHECK-ACT
CSPR or other
requirements
Where in the 'Should be' process to monitor?
What type of data to be
monitored and controlled?
How will data be
collected?
How often will data be collected?
(Frequency)
Who responsible for control
and monitoring?
What type of
report to analyze results?
What is a Problem?
Define red-yellow-green
Action Planfor red-yellow-
green
Target datefor
actions
Responsible
41 mln Euro till 07/09
Contact collection
No of leads Regular report to manager
Weekly Head of Sales
Tolkacheva A.
Shepelev A.
Excel table
G: -10%
Y: -30%
R: -50%
G: nothing
Y: Senior sales involvement
R: Senior sales involvement, report to manager
21/07/08 Head of Sales
Tolkacheva A.
Shepelev A.
First negotiation
No of offers
Final offer No of closed
Money Transaction
Average client
12Version: Oct. 2008
21.FMEA - Failure Modes and Effect Analysis (Black Belt applications only)
FMEA Process Action results
Item / Process step
Potential Failure mode
Potential effects of failure
Severity
Potential cause(s) of failure
Occurrence
Current controls
Detection
RPN Recommended action
Responsibility and target completion date
Action taken
Severity
Occurrence
Detection
RPN
Total risk priority number Resulting risk priority number
Ignore!
13Version: October 2008
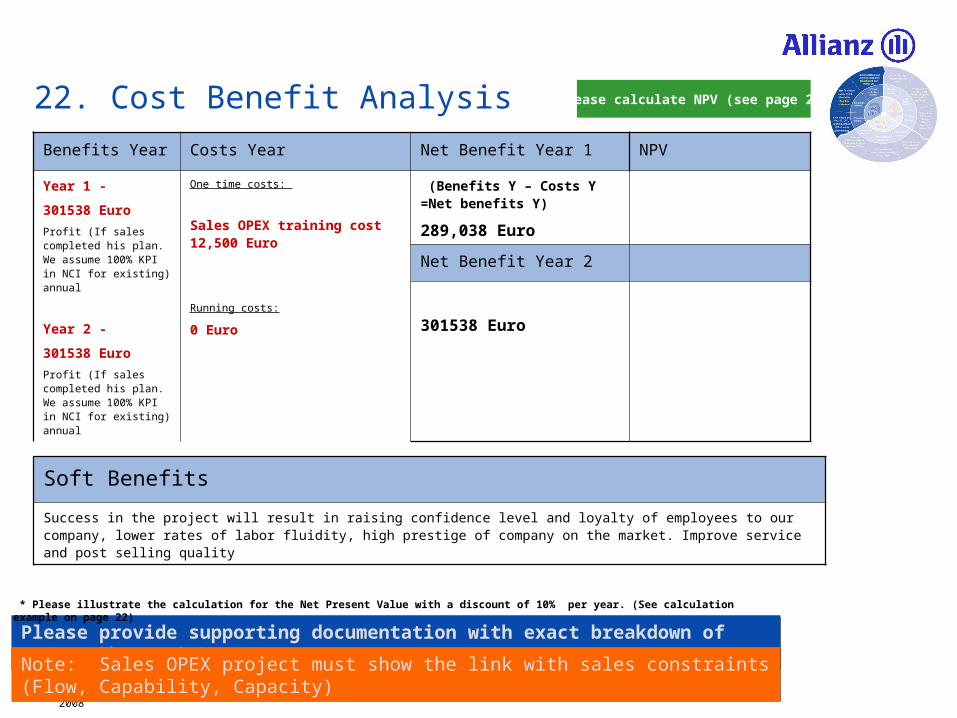
22. Cost Benefit Analysis
Benefits Year Costs Year Net Benefit Year 1 NPV
Year 1 -
301538 Euro
Profit (If sales completed his plan. We assume 100% KPI in NCI for existing) annual
Year 2 -
301538 Euro
Profit (If sales completed his plan. We assume 100% KPI in NCI for existing) annual
One time costs:
Sales OPEX training cost 12,500 Euro
Running costs:
0 Euro
(Benefits Y – Costs Y =Net benefits Y)
289,038 Euro
Net Benefit Year 2
301538 Euro
Please provide supporting documentation with exact breakdown of Benefits and Costs! (see page 23)Please provide supporting documentation with exact breakdown of Benefits and Costs! (see page 23)
* Please illustrate the calculation for the Net Present Value with a discount of 10% per year. (See calculation example on page 22)
Note: Sales OPEX project must show the link with sales constraints (Flow, Capability, Capacity)Note: Sales OPEX project must show the link with sales constraints (Flow, Capability, Capacity)
Soft Benefits
Success in the project will result in raising confidence level and loyalty of employees to our company, lower rates of labor fluidity, high prestige of company on the market. Improve service and post selling quality
Please calculate NPV (see page 22)
14Version: October 2008
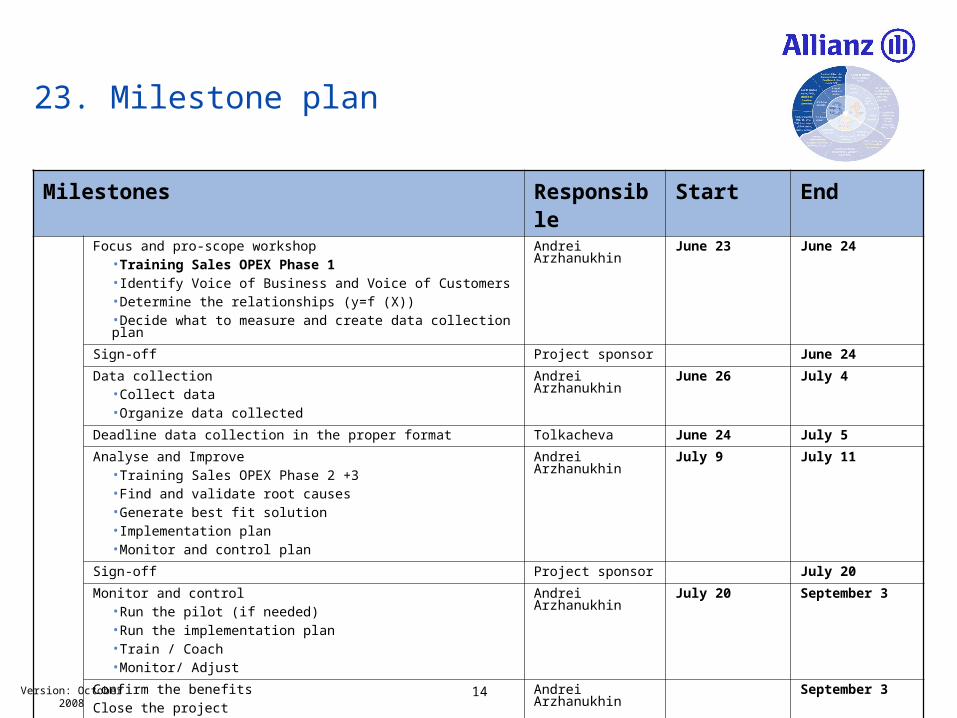
23. Milestone plan
Milestones Responsible Start EndFocus and pro-scope workshop
•Training Sales OPEX Phase 1•Identify Voice of Business and Voice of Customers•Determine the relationships (y=f (X)) •Decide what to measure and create data collection plan
Andrei Arzhanukhin June 23 June 24
Sign-off Project sponsor June 24
Data collection •Collect data•Organize data collected
Andrei Arzhanukhin June 26 July 4
Deadline data collection in the proper format Tolkacheva June 24 July 5
Analyse and Improve•Training Sales OPEX Phase 2 +3•Find and validate root causes •Generate best fit solution•Implementation plan •Monitor and control plan
Andrei Arzhanukhin July 9 July 11
Sign-off Project sponsor July 20
Monitor and control•Run the pilot (if needed)•Run the implementation plan •Train / Coach•Monitor/ Adjust
Andrei Arzhanukhin July 20 September 3
Confirm the benefits
Close the project
Andrei Arzhanukhin September 3
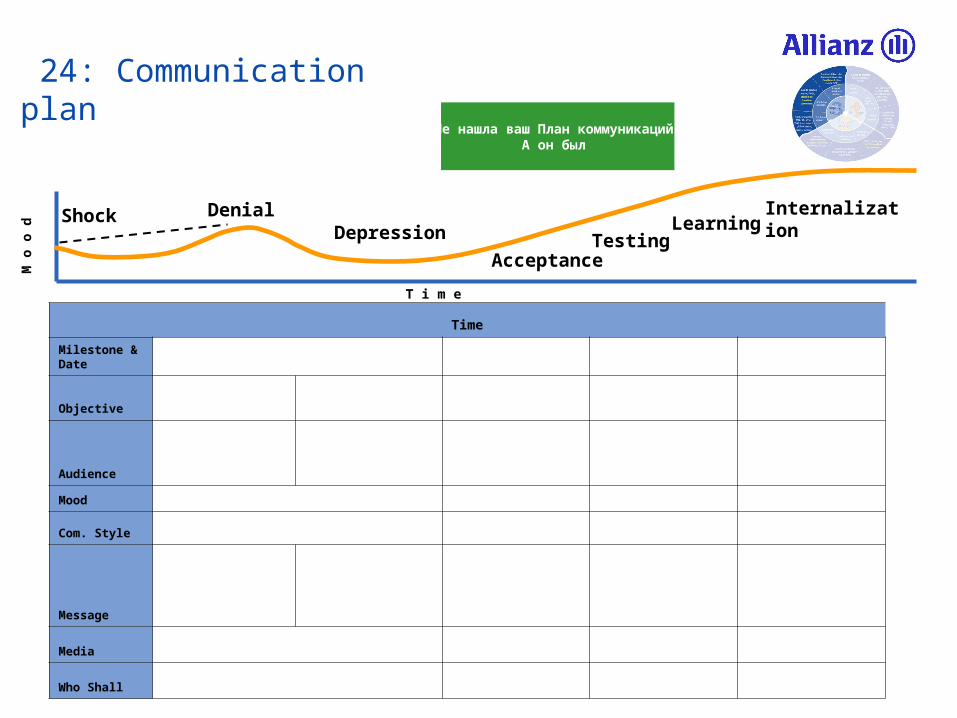
T i m e
M o
o d
Denial ShockDepression
Acceptance
LearningInternalization
Testing
24: Communication plan
Time
Milestone & Date
Objective
Audience
Mood
Com. Style
Message
Media
Who Shall
Не нашла ваш План коммуникаций,А он был
16Version: October 2008
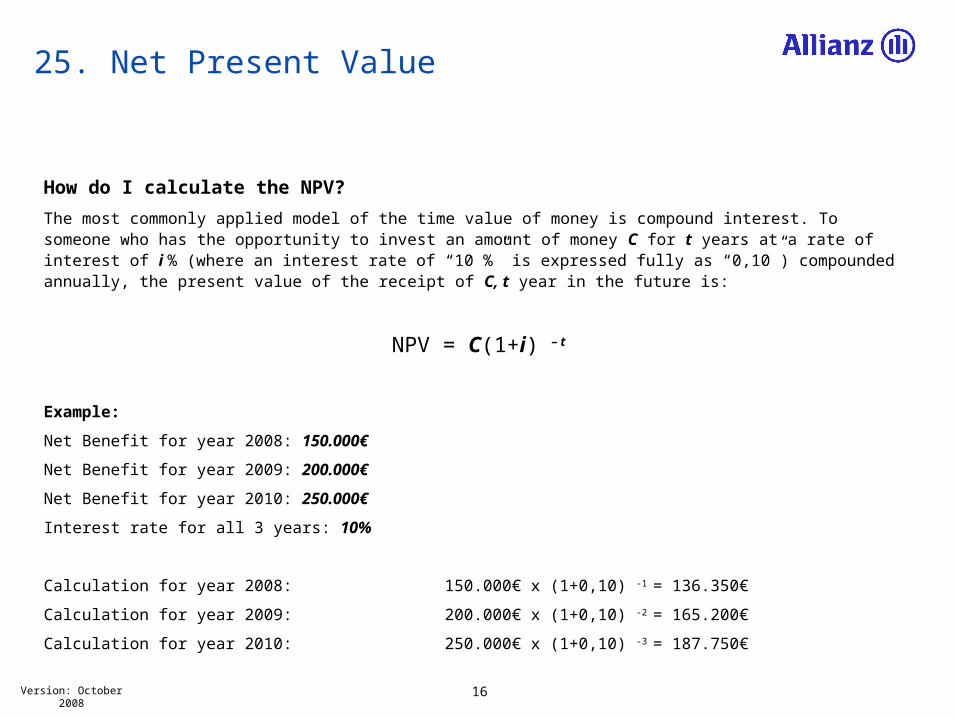
25. Net Present Value
How do I calculate the NPV?
The most commonly applied model of the time value of money is compound interest. To someone who has the opportunity to invest an amount of money C for t years at a rate of interest of i % (where an interest rate of “10 %” is expressed fully as “0,10”) compounded annually, the present value of the receipt of C, t year in the future is:
NPV = C(1+i) – t
Example:
Net Benefit for year 2008: 150.000€
Net Benefit for year 2009: 200.000€
Net Benefit for year 2010: 250.000€
Interest rate for all 3 years: 10%
Calculation for year 2008: 150.000€ x (1+0,10) -1 = 136.350€
Calculation for year 2009: 200.000€ x (1+0,10) -2 = 165.200€
Calculation for year 2010: 250.000€ x (1+0,10) -3 = 187.750€
17Version: October 2008
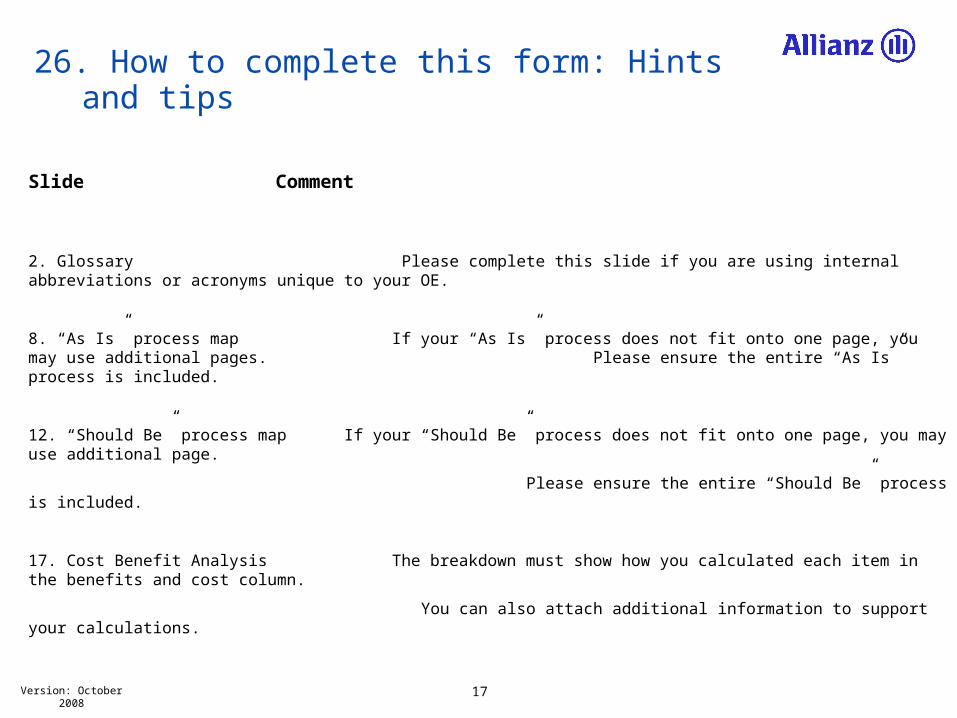
26. How to complete this form: Hints and tips
Slide Comment
2. Glossary Please complete this slide if you are using internal abbreviations or acronyms unique to your OE.
8. “As Is” process map If your “As Is” process does not fit onto one page, you may use additional pages. Please ensure the entire “As Is” process is included.
12. “Should Be” process map If your “Should Be” process does not fit onto one page, you may use additional page.
Please ensure the entire “Should Be” process is included.
17. Cost Benefit Analysis The breakdown must show how you calculated each item in the benefits and cost column.
You can also attach additional information to support your calculations.
Related Documents