Assessing the Impact of the Lake Kissimmee Restoration on Apple Snails Final Report prepared for Florida Game and Fresh Water Fish Commission Bureau of Nongame Wildlife 620 South Meridian St. Tallahassee, FL 32399-1600 by Philip C. Darby Patricia L. Valentine-Darby and H. Franklin Percival Florida Cooperative Fish and Wildlife Research Unit Biological Research Division, USGS and Department of Wildlife Ecology and Conservation University of Florida P.O. Box 110450 Gainesville, FL 32611-0450 April 1998

Welcome message from author
This document is posted to help you gain knowledge. Please leave a comment to let me know what you think about it! Share it to your friends and learn new things together.
Transcript
Assessing the Impact of the
Lake Kissimmee Restoration on Apple Snails
Final Report
prepared for
Florida Game and Fresh Water Fish CommissionBureau ofNongame Wildlife
620 South Meridian St.Tallahassee, FL 32399-1600
by
Philip C. Darby
Patricia L. Valentine-Darby
and
H. Franklin Percival
Florida Cooperative Fish and Wildlife Research UnitBiological Research Division, USGS
andDepartment ofWildlife Ecology and Conservation
University ofFloridaP.O. Box 110450
Gainesville, FL 32611-0450
April 1998

ACKNO~LEDGMENTS
We appreciate the support ofthe Florida Game and Fresh Water Fish Commission
(GFC) for this project. In particular we would like to thank David Cook for his interest
and support throughout the projects history. Jon Buntz (GFC) and Ed Moyer (GFC) were
generous with their time and support to help us initiate the project. We also are grateful
to Stuart Cumberbatch and Karen Lamonte (GFC) for meeting with us in Kenansville to
discuss our research, and to Angela Williams (GFC) for her work in preparing our
special use permit.
Wiley Kitchens and Rob Bennetts (Florida Cooperative Fish and Wildlife
Research Unit) provided helpful advice for the study design and throughout our field
work, analyses, and draft reports.
The transmitters were provided through funding from a contract with the South
Florida Water Management District (SFWMD) and St. Johns River Water Management
District (SJRWMD) to study apple snail ecology. The results of the transmitter study
also appeared in the Final Report for the SFWMD - SJRWMD contract (SJRWMD
Technical Report #****). Because the trap array validation study, an integral part of
SFWMD Contract C-E6609, has relevance to the Lake Kissimmee study described
herein, we included the validation results as an appendix in this GFC report. The throw
trap sampling for the trap array validation was performed by Jason Croop and Betty
Jordan.
Patrick and Traci Dean were instrumental in our efforts, helping to keep trucks
and airboats running, and assisting with the trap arrays. We greatly appreciate the
assistance provided by the following individuals in setting up and checking the trap
arrays: Jason Croop, Lane Hunneycutt, Betty Jordan, Steve McGehee, Bill Millinor,
Mike Betts, Theresa Sitar, Greg Kaufinann, Jeff Carter, Ron Breeding, and Karen Warr.
We also appreciate the administrative support provided by Debra Hughes and
Barbara Fesler. This study was conducted under the auspices ofthe Florida Cooperative
Fish and Wildlife Research Unit (GFC, Univ. ofFlorida, U. S. Geological Survey
Biological Research Division, and Wildlife Management Institute, cooperating).

TABLE OF CONTENTS
ABSTRACT .
ACKNOWLEDGMENTS .ii
1.0 INTRODUCTION 1
2.0 METHODS x
Study sites x
Snail movements and survival.. x
Snail abundance x
Analyses x
3.0 RESULTS x
Snail movements and survival. x
Snail abundance x
4.0 DISCUSSION x
LITERATURE CITED x
APPENDICES x

INTRODUCTION
Seasonal fluctuations in rainfall occur naturally in Florida, historically producing
correspondingly large intra-annual and inter-annual fluctuations in lake water levels. As
a result, "normal" lake levels are elusive; the norm is for wide fluctuations, a pattern
which earned them the descriptive title, "astatic", or unstable (Brenner et. al. 1990).
Lake Kissimmee, in Osceola County, FL, had a mean average water level fluctuation of
1.4 meters, but over several years varied as much as 3.7 meters (Grocki 1975). The
substrate and vegetative communities, in part, reflect the pattern ofhydrologic
fluctuations, their timing, duration, and frequency. Topographic variability in lake
systems, coupled with their hydrologic patterns, yield a mosaic of shrubby, emergent and
submerged plant habitats in the littoral zone ofthe lake. Fish and wildlife have adapted
accordingly, and successfully forage and reproduce in these highly fluctuating systems
(*SOURCES*).
Installation and operation of water control structures over the past 40 to 50 years
have dampened the degree of hydrologic fluctuations in many Florida lakes, resulting in
long term stabilization oflake levels [Holcomb and Wegener 1971, Wegener et. al. 1974,
Fox et. al. 1977, Moyer and Williams 1982, Florida Game and Fresh Water Fish
Commission (GFC) 1995]. The mean annual flux on Lake Kissimmee was reduced from
1.4 meters to 0.9 meters (Wegener et al 1973). In addition, increased nutrient inputs to
Florida's watersheds from agricultural and urban development have resulted in lake
eutrophication (Wegener et. al. 1974, Moyer and Williams 1982). As nutrients increased
and water levels stabilized, rooted aquatic macrophytes expanded and organic debris
accumulated to form undesirable lake substrates. Fish populations suffer from drops in

accumulated to form undesirable lake substrates. Fish populations suffer from drops in
dissolved oxygen associated with decaying algae and plant matter, the alteration of plant
community composition, and poor habitat quality of the substrate (Wegener and
Williams 1974).
To remedy these problems in Florida lakes, the Florida Game and Fresh Water
Fish Commission initiated a lake restoration program in 1971 which emphasizes the use
of a lake draw down to expose sediments (GFC 95). The objective of the program is to
reduce undesirable plant species, expand desirable plant communities, and consolidate
flocculent organic sediments (Holcomb and Wegener 1971, Wegener et. al. 1974, Fox et.
al. 1977, Cooke 1980, Tarver 1980, GFC 1995). In addition, muck removal operations
following lake level draw downs are meant to resolve the problem of extensive build up
of organic sediments (GFC 1995, Moyer et. al. 1995). The goal of the draw down and
restoration activity is to improve aquatic habitat in support of fisheries and wildlife while
improving lake quality for recreational usage (e.g. sport fishing) (Wegener and Williams
1974, Tarver 1980,. GFC 1995).
The Florida Game and Fresh Water Fish Commission (GFC), in cooperation with
the South Florida Water Management District (SFWMD), conducted a draw down of
Lake Kissimmee from December 1995- June 1996, dropping lake levels by
approximately 1.7 meters. The Lake Kissimmee draw down provided an excellent
opportunity to investigate the impact of management techniques on an invertebrate
which is a critical component of the central lakes food web, the Florida apple snail
(Pomacea paludosa, SAY). Although data on the responses of some invertebrate species
2

to draw downs in central Florida are available (Wegener et. al. 1974, Fox et. al. 1977,
Butler et. al. 1992), no published studies document the responses of P. paludosa.
The Florida apple snail belongs to the tropical family of aquatic snails, Pilidae,
which inhabitant wetland areas in Florida, Central and South America, Africa and India.
Most Pilidae habitat typically (under natural hydrologic patterns) experiences a seasonal
dry down, and the Florida apple snail is no exception. Pilidae snails utilize both a lung
and gill for respiration (Andrews 1965). The dual respiratory system enables these
animals to tolerate daily and seasonal dissolved oxygen fluctuations, permits egg-laying
above water level (eggs thus avoid hypoxia and predation), and, in some Pilid species,
enables adults to maintain aerobic respiration during the dry-season (McClary 1964,
Burky et al. 1972, Aldridge 1983).
Apple snails are critical components of lake food webs in Florida. They are prey
to alligators (Alligator mississippiensis)( Delany and Abercrombie 1986), fish (Lepomis
microlophus)(Chable 1947), turtles (Trionyxferox) (Dalrymple 1977), and ibis
(Eudocimus albus)(Kushlan 1974). Apple snails comprise over 75% ofthe diet of the
limpkins (Aramus guaraunaXCottam 1942), and nearly 100% ofthe diet of endangered
snail kite (Rostramus sociabilis)(Snyder and Snyder 1969). Although the majority of the
snail kite population occupies wetland habitats in south Florida throughout the year, they
have been found to emigrate from this area when the dry season escalates into a
prolonged drought (Beissinger and Takekawa 1983, Bennetts and Kitchens 1997).
Researchers have identified the central lakes system as a critical refuge for the snail kite
during these droughts (Beissinger and Takekawa 1983, Bennetts and Kitchens 1997). In
3

addition, the kites have been consistently nesting (even in non-drought years) on Lake
Kissimmee and Lake Tohopekaliga since the early 1980's, providing further support (in
the form of suitable foraging and nesting habitat) for the endangered kite population
(Beissinger and Takekawa 1983, Bennetts and Kitchens 1997).
The impetus for the Lake Kissimmee draw down is habitat improvement for
fisheries and wildlife (GFC 1995). A conservation priority ranking system for Florida
wildlife identifies the snail kite and limpkin, largely due to their specialized diet ofapple
snails, as deserving special attention for monitoring and management (Milsap et. a1.
1990).Moyer et a1. 1991 specifically recommended an evaluation of the impact of lake
draw downs on apple snails. In this report we present the findings of a three-year study
of the immediate and long term impacts of the Lake Kissimmee draw down and
restoration activity on apple snail populations. The objectives ofthis research are as
follows:
• To study the impacts oflake restoration activity (e.g. draw down, muck removal)on snail populations in several sites throughout the lake by assessing pre-drawdown and post-draw down snail abundance~
• To study the movement patterns of snails to find out what proportion of thepopulation migrates to deeper water or become stranded in the dry down area aslake levels recede;
• To study the capacity for snails to survive in dry down conditions.
4

METHODS
Study Site
Lake Kissimmee is an approximately 14,000 ha lake in Osceola County, Florida.
The extensive littoral zone supports numerous species ofmacrophytes including
maidencane (Panicum hemitomon), pickerelweed (Pontederia cordata) and cattail
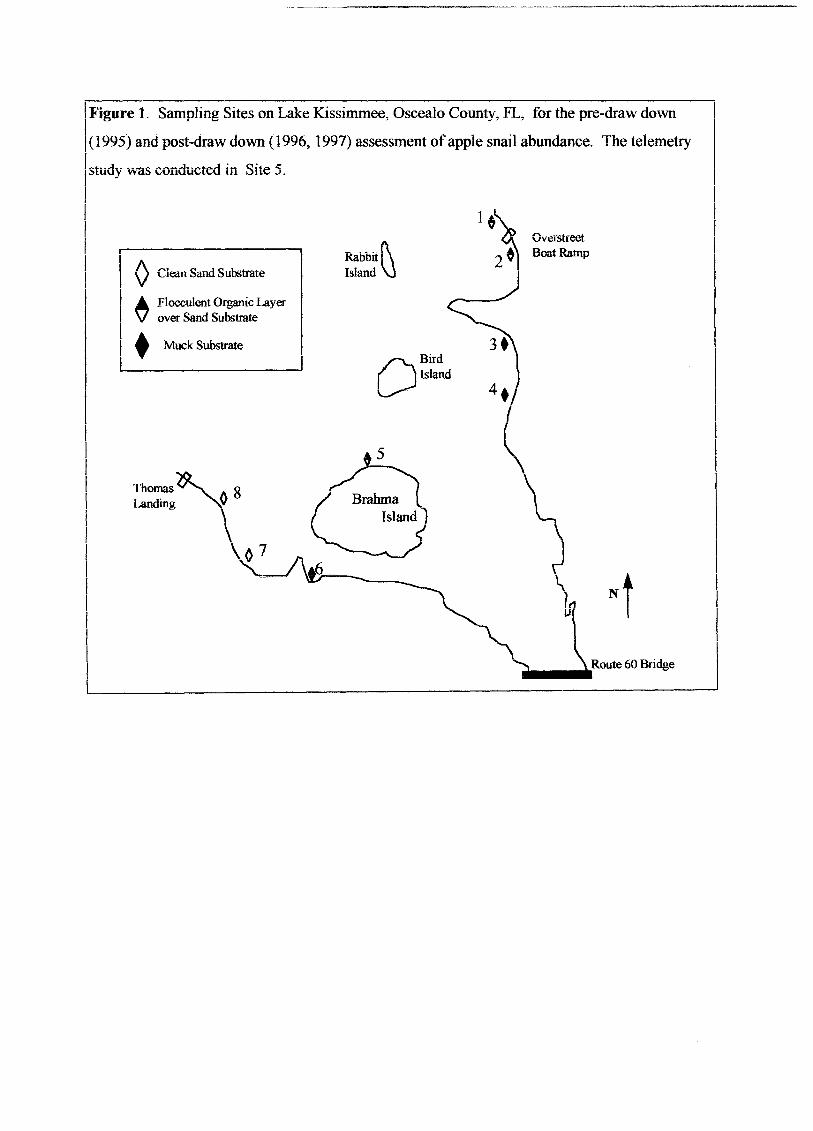
(Typha sp.). We selected 8 sites in 1995 to study the impacts ofthe draw down on snail
populations (Figure 1). We classified each study site as one of three types: 1) clean sand
site, where virtually no organic layer had accumulated and the sand was easily visible, 2)
flocculent organic site, where sand was visible in patches, but a thin (approximately 15
cm or less) flocculent organic layer was common and 3) muck sites, where the substrate
was a thick layer ofroots and decaying parts of spatterdock (Nuphar luteum), and no
sand substrate was visible anywhere in the site. We selected two sites with a sand
substrate, three with a flocculent organic layer, and three muck sites (Figure 1). The
draw down began in December 1995 and was held at low pool stage from early February
through early June 1996 (Figure 2).
Snail Movements and Survival During the Draw Down
Observations ofsnail movements in the Upper St. Johns Marsh indicated that
snails move weekly distances that are sufficient to avoid being stranded in the exposed
littoral zone during a lake draw down (Darby et al. 1997). The application ofminiature
transmitters for the Lake Kissimmee draw down study was an extension ofour Upper St.
Johns Marsh study on snail movements. Additional details on their application may be
5

found in Darby et al. (1997). The transmitters have a 60 day life, so a staggered release
schedule was required to monitor snail movements and survival for the November 1995
through February 1996 study period (Table 1). Transmitter use is limited to snails with
shells greater than 30 mm in length.
An airboat was used to access the study area which was on the north end of
Brahma Island. The movement patterns of snails prior to and during the draw down were
studied on the north shore ofBrahma Island in part because we were certain no scraping
or burning would be performed there. Apple snails were collected when wading or by
collecting snails from trap arrays. A transmitter with a unique frequency was affixed to
each snail shell using a marine epoxy. Each snail was returned to its original location of
capture. The location was marked with a PVC pole driven into the substrate. Each pole
was labeled with the snail identification number.
At the time ofcollection and subsequent relocation, distance and direction from
the previous location, and water depth at the current and the previous location were
measured (Figure 3). Water depth, water temperature, and substrate temperature (once
waters receded) were measured at 7 monitoring stations for the duration of the radio
telemetry study.
Apple snail movements were monitored until the transmitter battery failed or until
the snail was found dead. We continued to monitor stranded snails after the transmitter
died since they did not move unless they were taken by a predator. Throughout the 18
week study period, snails were checked at 7 to 11 day intervals in most cases (for 8 of 11
site visits); the remaining intervals were 14, 17, and 17 days. If an empty shell was
6
found, evidence ofpredation was noted (e.g. shell extracted from exposed substrate, shell
found in obvious limpkin or kite shell pile). If no signs of activity were observed with an
intact snail, a knife (8 mm blade width) was inserted between the operculum and the
shell and the operculum gently pried open in order to see the snail flesh. Our experience
shows that the operculum, accompanied by snail flesh, is very easily removed from a
dead snail. If there was resistance and the flesh looked intact, the snail was returned to
its position in the substrate. The mortality data (date and snail condition) were
incorporated into our survival analyses. These data were also used to calculate the
number ofweeks each stranded snail survived under dry down conditions. Since snails
became stranded or died between visits to the study site, we used one-halfthe number of
days of the interval in our calculations. For example, if a snail was alive on Day 1, and
we found it dead on Day 9, we would estimate that the snail lived 4 days during that 8
day period.
The telemetry study was conducted over a period of time when water levels
dropped from an initial 49.88 feet mean sea level (MSL) down to 45.81 feet MSL.
Snail Abundance
The inability to sample apple snails under natural conditions has been the greatest
obstacle in understanding apple snail population dynamics. We have completed a study
which examined the efficiency and feasibility of three techniques to extract apple snails
from throw traps; a portable suction dredge, a bar seine, and a dip net (Darby et. al.
1997).
7

~------------------
The suction dredge was used to assess the utility of an alternate trapping system
which depends on snail movements, one we refer to as trap arrays. These arrays are
based on traps designed for capturing reptiles and amphibians as described by Enge
(1997) and Dodd (1991). A trapping method such as this provides an indirect measure of
snail abundance, not an actual density (snails per unit area). We modified this trap
system to target apple snails. Our traps were a Y -shaped array, each arm consisting of a
wall to direct moving animals to either end ofthe array. At the end ofeach of the three
walls is a funnel trap designed to permit entrance but restrict exit from the trap. We
constructed the funnel traps to extend above water level (up to about 1 meter) in order to
allow snails to breath air. The majority ofthe trap system consists of 112" mesh,
fabricated from extruded high density polyethylene (Nalle Plastics, Austin, TX) [The
State ofFlorida nor the Federal Government endorses commercial products mentioned in
this text]. The 3 walls of the Y-shaped array were approximately 5 meters long. Plastic
coated wire was used to construct the base and entrance of the funnel units to increase
stability.
The trap array approach to determining relative snail abundance was validated
using throw traps extracted by a suction dredge. The results, initially presented in Darby
et al. (1997), are included herein as Appendix II for the convenience of the reader.
Through communications with the Lake Restoration Section (pers. comm., GFC,
Kissimmee, FL), we were aware ofthe general location of the muck removal, disking and
burning activity, but specific locations were uncertain part because of the unpredictability
of site accessibility and rainfall. In the end, 3 sites were scraped; the remaining five sites
8
experienced only the draw down. As a result, we did not have a balanced distribution of
treatments among our sites (see Results).
An individual site was approximately 80-100 meters along the lake shore between
water depths of 0.3 and 1 meter (the minimum and maximum depths suitable for trap
arrays). Following a trap check, some trap units were moved 15 to 20 meters to a new
location within the site to obtain a more representative sample. Our telemetry research
indicates that most snails, especially outside their peak breeding season, move fewer than
20 meters over the course of 7 days (Darby et. al. 1997), so we obtained a representative
sample while avoiding multiple captures of individual snails.
The shell length ofall snails captured in trap arrays were measured. Based on
Hanning (1979) and our own observations of snail growth and reproductive activity, we
classified juvenile snails as having <25 mm shell length.
All trap array sampling in the Fall of 1995, 1996, and 1997 was when lake water
levels were 49.5 to 51.5 feet mean sea level (MSL) (Figure 2).
Analyses
Movements and Survival
Weekly apple snail movements were examined as a function of water depth. We
grouped data by biweekly intervals to increase our sample size for the analyses. If an
individual snail's movements were measured twice within a class interval, the mean
value for the distances traveled was used for that individual. Distances traveled (in
meters) were transformed using the function 10glO (meters +1) in order to meet
9

assumptions ofnormality for the analyses ofvariance. We used a mixed model ANaVA
(snails monitored = random effect~ depth monitored = fixed effect) for movement
analyses. Since some individuals were monitored across several depth classes, each
depth class included some ofthe same individuals. We performed a repeated measures
ANaVA (Crowder and Hand 1990, SAS Inc. 1992) to account for repeated measure of
some individuals across depth class. The analysis produces F-statistics that are not a
ratio of sums of squares, but are instead from a Wald-test. Sums of squares (SS) and
mean squares (MS) are therefore not reported for those analyses. For more information
on this type of F-statistic see Searle et at (1992). For this and subsequent analyses (see
below), depth was divided into categories of 10 cm intervals.
Movements along gradients of depth (as distinguished from depth in which a
snail was found) were analyzed differently. Gradients were calculated based on
measurements taken simultaneously at two consecutive snail locations (Figure 3). Note
that gradients refer to differences between two consecutive snail locations, so that the
scale along which the gradient occurred depends on how far the snail traveled and where
the snail was located in the littoral zone. We were interested in whether or not a snail
moved along a gradient (i.e., towards deeper water), not the actual value of the gradient.
Ifwe had calculated the mean gradient experienced by a group of snails within some
interval, one large change in water depth for one snail, for example -50 cm, would negate
the weight of five snails which moved along a + 10 cm depth gradient. We therefore
tested whether or not snails move along a positive depth gradient by scoring each
individual movement as positive (P) or non-positive (NP) (which included zero and
10

negative gradients). The number ofP and NP for each class interval were added, and a
frequency table of the proportions ofP and NP was generated. The association between
gradients and either time or depth was tested using the Mantel-Haenszel chi-square
statistic (SAS Inc. 1988, Mantel and Haenszel 1959). We analyzed the depth gradient
along which a snail moved as a function of depth in which the snail began its movement
(e.g., depth 1 in Figure 3). We refer to this depth as the "previous depth" in the gradient.
The Kaplan-Meier procedure to accommodate staggered release of transmitters
was used for survival analyses (Pollock et al. 1989). We also calculated the mean
survival time for snails stranded in the dry down area. Survival was calculated for nine
two-week intervals over the 18 week telemetry study.
Snail Abundance
Descriptive statistics for the trap array data revealed that the increased variance
was associated with larger means of snail catch per trap, and therefore not normally
distributed. All trap array data were transformed using the 10glO (snail catch +1) (Sokal
and Rohlf 1981) prior to analyses.
The effect of substrate type on snail abundance in 1995 was analyzed with a
nested analysis ofvariance (ANOVA), with site (ranging from 1 to 3 sites per substrate
type) as a factor nested within substrate type (muck, flocculent organic, and sand). Given
that some substrate types were scraped (e.g., 2 of 3 flocculent sites) and others were not
(e.g., both sand sites), we could not perform a single ANOVA that could explain all the
possible combinations of initial substrate type, restoration treatment, and year.
11

Therefore, we performed three separate one-way ANOVA's for the effect ofyear on each
of the three substrate types.
12
Results
Snail Movements During Drawdown
The mean weekly distances traveled by snails during the 18 week study ranged
from 0.3 to 21 meters (Figure 4). The data shown include only snails in greater than 10
em ofwater. Snail movements in less than 10 em are greatly reduced (Fs,4o=6.04,
p<O.OO 1) (Figure 5), likely due to the increased obstacles such as fallen over emergent
vegetation and the settling of floating vegetation, organic debris and periphyton. This
same phenomenon was observed for snail movements in our Spring 1995 field season in
the Upper S1. Johns Marsh (Darby et. al. 1997).
Based on an average water level drop of 13 em per week, the slope of the littoral
zone (approximately 100 em drop over 100 meters), and distances traveled, we believe
that only snails released in greater than 20 cm water depths would have the opportunity
to stay ahead of the receding water and avoid being stranded.
Twenty-two of the 31 snails were released in over 20 em ofwater; the mean (±
SD) depth at release was 40.7 em (± 9.6 em). Ofthe other 9 snails, 7 were found in
water between 10 cm and 20 em deep. These 7 snails were included with the 22 snails,
just described, in the analyses of snail movements along gradients, but not in the
calculations ofproportions of stranded snails. FinaJly, 2 snails were found within a week
after initial exposure to dry conditions; we included these snails only in the assessment of
snail survival under dry down conditions.
Snails did not exhibit a tendency to move along a depth gradient either as a
function of2-week time intervals (MH X2 = 0.081 ,p= 0.776) (Table 2), nor as a
13
function of the depth of the snails' location (MH X2 = 1.168, p=O.280)(Table 3). For
these analyses we had 38 movements in depths greater than 10 em from which to
calculate movements in relation to water depth. These results are consistent with those
ofthe Upper St. Johns study (Darby et. al. 1997). A closer examination of the 10 snails
which did move along a positive depth gradient (total of 14 "P"movements, see Tables 2
and 3) revealed little advantage for these snails; eight later became stranded, one died
just before it would have been stranded, and just one made it to deeper water by the end
of our study.
Fifteen of the 22 snails (70%) released in greater than 20 em of water became
stranded. Ofthe remaining 30%, 1 in 22 snails (5%) moved into an area which did not
become dry. The remaining 25% ofthese 22 snails died just before they would have
become stranded within the flocculent material and vegetation of the receding water.
Snail Survival Over the Course ofthe Drawdown- The first snail deaths did not
occur until snails became stranded sometime between 4 December and 18 December.
(Figure 6). Snail survival was not dependent on the length of time bearing a transmitter
since at any time period snails had worn transmitters for 1 to over 8 weeks. However,
intolerance to dry down conditions was also not the direct cause of death in the majority
of cases (Table 4). Of the 23 stranded snails monitored in our study, 57% were taken by
predators.
We monitored the survival of 23 snails after they became stranded in the dry
littoral zone. The mean (± SD) survival time for stranded snails was 3.9 ± 3.1 weeks,
14

the same survival time found for snails (n =8) stranded in 8lM in 1995 (Darby et. aI.
1997). However, unlike the 81M observations, the majority ofdeaths during the Lake
Kissimmee draw down were a result of predation. Another discrepancy from the 81M
study was that during the Kissimmee draw down, central Florida experienced several
freezes; at least 11 of23 stranded snails survived at least one of these freezes. Our
assessment is based stranded snails which lived at least 3 weeks in dry conditions. We
defined a freeze event as one where the mean minimum temperatures ofVero Beach and
Orlando reported by the National Weather 8ervice (NW8) were 32 OF or below. Based
on this criteria, central Florida experienced freezes on three occassions; 25 December (32
OF), 9 January (29.5 OF) , and 5 February (28 OF). (Note that we did not measure the
substrate temperatures where the snails were located during these late night/early
morning hours; our analysis is based solely on air temperature data from the NW8). We
saw no indication that the freezes caused a significant decrease in the rate of survival
decline (Figure 7), however only 7 non-predation deaths were confirmed. The high
incidence of predation deaths, as well as the contributions ofdessication, precluded an
evaluation of deaths caused by temperature. Two of the seven non-predations deaths
were snails that were still in 8 and 15 cm of water, and therefore did not experience
freezing temperatures (i.e., the water column did not freeze solid).
At the termination of the study, we pulled the one remaining stranded snail, still
alive after 8-9 weeks in the dry down area, and placed it in an aquarium with water. The
snail revived within 24 hours and lived another 8 weeks in an aquarium. We also
observed two-snails revive in water which had survived at least 3 months in dry
15

conditions. These snails were inadvertently left in the trap arrays which we had stored on
dry ground at our field station since November. These snails had survived 3 freezes (as
defined above) in the traps without any benefit of substrate moisture or damp organic
debris.
Pre-Draw Down Snail Abundance-
Our pre-draw down assessment was the first application oftrap arrays to
investigate snail abundance. The full data set is provided in Appendix II. We observed
no effect of the number ofdays between trap checks and the number of snails captured
(Appendix III). Based on this observation, we calculated all snail abundances based on
the number of trap checks per site. Note, however, that we have no data to suggest that
trap intervals of less than 6 days have no effect on snail capture rates.
Substrate type had an effect on snail abundance (Table 5) (Table 6). Our analyses
were limited to samples of2 to 3 sites per substrate type, and there was a signficant site
effect within substrate type, so the analyses did not reveal a strong statistical relationship
(p=O.lO). However, it is apparent that muck sites, where no snails were found with trap
arrays or with the suction dredge, did not support apple snails.
Post Draw Down Snail Abundance
Our inability to predict precisely which sites received which treatments resulted
in an unbalanced design with regards to substrate type and whether a site was "treated"
by the dry down only, or by the dry down and also by scraping (Table 7). We could not
16

perform a single analyses which included all study sites, because, for example we had
only one site (for which no variance component can be derived) for muck that was
scraped, and also for a flocculent organic site that was not scraped We performed
separate ANOVAs for each available substrate/treatment type with year as the main
effect.
In 1996 and 1997, we were unable to sample site 6 due to a combination ofhigher
lake levels and consolidation of substrate, which resulted in water too deep (>1.7 meters)
to use our traps (Table 8). There was no area with similar substrate and vegetation
sufficiently close for us to make meaningful comparisons to the original 1995 trap
location.
Overall the snail population on the lake in 1996 and 1997 was reduced to 20%
and 13%, respectively, ofthe pre-draw down (1995) population. (Figure 8). Highly
significant declines in the sand substrate sites (sites 7 and 8) accounted for the majority
of the first year 80% decline (Table 9) (Figure 9). The scraped flocculent organic sites
showed an initial increase followed by a decline to 1995 levels (Table 10) (Figure 9).
The site affect was attributable to the substantially higher catch associated with site 2
relative to site 1. The scraped muck site (site 4) also showed an increase in snails
captured following treatment (Table 11) (Figure 9), but note that this is just 4.8% ofthe
total lake catch in 1996, and 18% in 1997.
Juveniles accounted for 32% ofour total catch in 1995, but dropped to less than
halfthat in 1996, followed by some recovery in 1997 (Figure 10).
17

Discussion
The Lake Kissimmee draw down of 1995-1996 resulted in extensive mortality in
the apple snail population. Snails exhibited little tendency to migrate to deeper water to
avoid being stranded. This is consistent with our observations of snail movements in the
Upper S1. Johns Marsh (SlM) during Spring 1995 (Darbyet. al. 1997). However, data
from studies in S1M indicate that snail movements during the Spring were driven largely
by mating and reproduction. During the winter draw down ofLake Kissimmee, snails
were not in their breeding season. In addition, snail movements may have been hindered
by cold temperatures during the draw down, which lessens our ability to meaningfully
compare this data with the movement data from SlM. However, it is clear that apple
snails did not find deeper water during the draw down. Seven of 22 snails (32%)
released in water depths over 20 cm moved, at least once during monitoring, 15 meters or
more in a week. We believe this is a rate of travel that would have been sufficient to stay
ahead of the drying front, had they actively searched for deeper water. The gradient data
and direction of movements by Lake Kissimmee snails indicate that snails were not
moving in an effort to migrate to deeper water to prevent being stranded Only one of
these snails made it to deep water.
Snails in the telemetry study survived about 4 weeks in the exposed littoral zone .
Excluding two snails censored from the data, 93% ofour study population died. Our
observations of snail survival over the course ofthree freezes indicated that some apple
snails tolerated freezing air temperatures. However, we could not distinguish deaths
caused by freezing from desiccation intolerance, and therefore can not quantitatively
18
express low temperature tolerances. Predation of stranded snails was also a confounding
factor in our interpretation of apple snail tolerances to low temperature and desiccation.
The high mortality ofour telemetry study population resulted primarily from the
vulnerability of stranded apple snails to predation by birds which forage in shallow water
and exposed lake bottom. Ibis, grackles and limpkins were all observed foraging in our
study site, and we found that at least 52% ofthe 29 snail deaths were a result of
predation. [We classified 3 deaths as unknown cause, but any of these 3 deaths could
conceivably have been predation deaths]. Although foraging opportunities for snail kites
were diminished in the dry down zone, other predatory birds seemed to benefit, at least
temporarily, from the draw down.
Sitings of snail kites on East Lake Tohopekaliga, which underwent a draw down
and muck removal in 1989, indicated that snail kites prefer muck removal sites to
unaltered sites (muck remaining) following recovery of lake water levels (Moyer et. al.
1995). This may result from an increase in apple snail density (due to habitat
improvements resulting in increased snail recruitment) and/or an increase in the
availability of apple snails to kites (due to increased visibility as a result of changes in the
plant community in restored sites) (Moyer et. al. 1995). No data on changes in apple
snail populations on East Lake Tohopekaliga are available. Removal of organic material
on Lake Kissimmee appeared to enhance habitat suitability for apple snails, relative to
pre-draw down conditions, in that all scraped sites (2 initially flocculent organic, and 1
initially muck) yielded more snails in post-draw down versus pre-draw down sampling.
These three sites yielded 99% and 84% ofthe catch in 1996 and 1997, respectively. Note
19

however, that the increases were marginal in terms ofabsolute numbers (i.e., in 1997 the
total snails/per trap check from these 3 sites were 1/10th of the total snails/trap check
from the three most populated sites in 1995).
No apple snails were found in any ofthe muck sites using either trap arrays or
throw traps extracted with suction dredge. The organic substrate in these sites, largely
formulated from decaying N luteum, may not be suitable for apple snails. Note that the
muck sites we observed on Lake Kissimmee are quite distinct (e.g, copious flocculent
debris, low visibility of the water column) from the sawgrass-based fibric peats ofthe
everglades systems (Gleason and Stone 1994) where we have found snails (Darby et al.
1997). The difference between snail density in the clean sand substrate sites and sites
with sand covered with a thin flocculent organic layer suggests that even thin layers of
flocculent organic debris negatively impact apple snail populations. However, the history
of apple snail populations has not been documented on Lake Kissimmee (i.e., maybe
snails were absent for organic accumulation); we can only say that muck and flocculent
organic based sites had considerably fewer snails than the clean sand substrates which
support maidencane. We do not believe that our observations were merely a function of
general site location, however; for example one muck site (No.6) was within 200 meters
ofthe site with the highest density of snails (No.7) found in our 1995 survey.
Floating islands were a problem in most sites, but especially in site 3 and 8 in
1996. Maidencane had begun to emerge in all scraped sites (1, 2, and 4) by the time we
sampled in 1996. Site 5 had been transformed from a predominately maidencane site to
one with dominated by water hyacinth (Eichhornia crassipes). By the Fall of 1997 most
20
of the floating islands were gone, and the water hyacinth was not extensive in site 5.
Floating islands and water hyacinth were associated with sites supporting very few snails
(none in sites 3, 5, and one in site 8, in 1996). We have no direct evidence that these
habitat characteristics suppress snail populations, but it would be reasonable to predict
that floating islands and water hyacinth would impede apple snail aerial respiration and
oviposition.
Knowledge of the impacts of lake draw down and restoration activity on aquatic
invertebrates, especially mollusks, are limited in scope. Reports of increases in aquatic
invertebrates as a result of lake draw downs have been based largely on non-mollusk
invertebrates, primarily those eaten by fish. Wegener et al. (1974) sampled aquatic
macro-invertebrates before, during and after the draw down ofLake Tohopekaliga in
1971. Compared to the pre-draw down estimates, the number of littoral invertebrates
increased by 63 percent and that of limnetic invertebrates increased by 150 percent
(peak numbers occurred in the summer of 1972). However, standing crops decreased to
pre-draw down levels by the winter of 1973. The authors reported that oligochaetes (e.g.,
aquatic worms) and tendipeds (e.g., midges) accounted for much ofthe increase in
numbers. Kadlec (1962) also reported increases in oligochaetes in some sites following a
draw down ofa waterfowl impoundment. However, the impoundment draw down was
very detrimental to other invertebrates; numbers ofmollusks and insects were greatly
reduced after the draw down. Crustaceans were reduced to a lesser extent (Kadlec 1962).
Aquatic gastropods ofthe family Viviparidae decreased after the draw down ofLake
Tohopekaliga of 1971, while planorbid snails were found in higher numbers within a year
21

ofthe draw down. (Wegener et. al. 1974). Wegener et. al. (1974) reported only post
draw down apple snail abundance, so no assessment could be made of the impacts of the
draw down to apple snails. Butler et. al. (1992) also reported macro-invertebrate
densities following another Lake Tohopekeliga draw down 15 years later, however, a pre
draw down assessment had not been conducted. During this 6 month draw down in
1986- 1987, organic sediment was removed along some of the lake shoreline. Butler et.
al. (1992) compared the species diversity and abundance in these restored (i.e. muck
removal) sites to control sites (no muck removal) one and two years post-draw down.
Although year to year variation within control and restored sites complicated
interpretation, samples from control sites were found to have a higher density of several
invertebrate species (e.g., amphipods, midges, water beetles) in general, while freshwater
shrimp and planorbid snails existed in greater numbers in the restored sites two years
after the draw down. Sand substrates in restored sites yielded overall greater numbers of
invertebrates (taken from substrate core samples) than samples from sites with detritus
mixed with sand, clay or mud. This is consistent with our analyses ofsubstrate effect
(pre-draw down only) on apple snail abundance on Lake Kissimmee.
Lake Kissimmee post-draw down apple snail catch in 1996 and 1997 was 20%
and 13%, respectively, of the 1995, pre-draw down, apple snail catch. This dramatic
decline in snail abundance likely resulted from two impacts on the 1995 apple snail
population. First, our Lake Kissimmee telemetry study revealed that survival for stranded
snails was below 10% by February 1996, thirteen weeks after the dry down began. Given
the large proportion of snails which became stranded and the low survival rates, the
22
--------------------------------------
population decline would be expected. As far as recovery of the population, littoral zone
topography may explain the increased numbers in some sites relative to others. Sites 5, 7
and 8, which accounted for 95% ofthe 1995 catch, had wide, very gradually sloped
littoral zones with a rapid drop in depth at the littoral! pelagic interface. In the eastern
shore sites (1, 2, 3 and 4) the slope of the vegetated zone was steeper over a shorter
distance (a qualitative assessment), so that a greater proportion of the near-shore
emergent vegetation remained inundated during the draw down. Throughout the draw
down we observed maidencane and pickerelweed growing on the fringe ofthese 4 sites
less than 50 meters from our trap locations. In sites 5, 7, and 8, snails would have had a
greater distance (approximately 100 meters) to travel to our trap locations. This may
explain why the eastern shore sites, despite the surface being scraped, showed an increase
in snail numbers (Table I). We believe the snails moved in from the nearby littoral zone
which remained inundated during the draw down, a hypothesis based on documented
movements of snails with transmitters (Darby et. al. 1997).
The second major factor in the overall snail decline is that the draw down and
restoration activity occurred during peak snail reproduction. Our egg cluster surveys in
the Upper St. Johns Marsh in 1996 (Darby et al. 1997), as well as earlier surveys done by
Hanning (1979) on Lake Okeechobee, and Odum (1957) in Silver springs, reveal that the
majority of apple snail egg cluster production consistently occurs in March, April and
May (Figure 11). On Lake Kissimmee, 32% ofthe 1995 snail catch were juveniles versus
3% in 1996. We believe this reflects a suppression ofrecruitment. Recruitment in our
sites would have been eliminated since apple snails aestivate (or at least are immobile)
23

during dry downs. Lake Kissimmee snails captured in 1996 were likely young of the year
which had hatched in the residual submerged littoral zone, and had reached adult size and
migrated into the scraped sites. Data on snail growth indicate that snails reach adult size
within 4 to 5 months (Hanning 1979); we sampled 4 months after the typical breeding
season. The snails found in 1996 most likely were not adults which had hatched in 1995
(i.e. adults over 15 months old). We have laboratory data from 500 snails, and survival
data from over 50 snails in the field, which indicate that snails die, regardless of
hydrologic condition, at about 12 to 15 months of age (Darby et al. 1997). Our survival
data concur with Hanning (1979) and Ferrer et al. (1990) with regards to estimates of
apple snail life span. The Lake Kissimmee littoral zone was dry through what typically is
the breeding season (Figure 12). Therefore, any recruitment in 1996 would be limited to
snails in the inundated littoral zone which existed from approximately March through
June 1996. By the time Lake Kissimmee water levels were restored in June and July, a
substantial portion of the 1995 year class would have died off (see Darby et al. 1997) and
would not have contributed to recruitment.
Our observations of snail abundance on Lake Kissimmee indicate the recovery of
snail populations to pre-draw down levels requires two years or more (our last 1997
survey was 1.5 years after water levels were restored). This is consistent with how long it
takes snail kites to return to a system that had experienced a dry down (the time
contingent on the severity of the dry down) (Bennetts and Kitchens 1997). Based on
what we know about apple snail biology (Darby et al. 1997) and natural hydroperiods
(Fennema et al. 1994) in central and south Florida, we consider the Lake Kissimmee
24

draw down event an extreme dry down event. Continued simultaneous assessments of
apple snail and snail kite survey on Lake Kissimmee (achieved in 1995-1997 through our
efforts on snails and GFC surveys of snail kites) could yield infonnation on the
relationship between snail kite habitat use and snail population fluctuations, infonnation
that to date has not been available.
The period of low pool stage which left the littoral zone dry on Lake Kissimmee
(approximately 5.5 months) likely exceeded the tolerance of the majority of the snail
population (Darby et al. 1997). However, even shortening the duration ofthe dry down
may not prevent a population decline during a lake dry down. The timing also appears
critical, and has ramifications for both snails and snail kites.
Dry downs that encompass the apple snail breeding season will suppress apple
snail recruitment. Also, central Florida lakes provide refuge for the snail kite population
when south Florida wetland experiences prolonged drying events (Takekawa and
Beissinger 1989, Bennetts and Kitchens 1997). Iflake restoration activity coincided with
a drought in other portions ofthe snail kite range, the kite population may suffer from
suppressed recruitment and more restricted foraging opportunities.
Dry downs are natural events in Florida wetland and lacustrine systems. Indeed
they are essential in maintaining the mosaic ofplant communities and relatively clean
sand substrate historically found on Lake Kissimmee. However, dry downs of prolonged
duration, and ones timed such that the natural cycle of apple snail senescence and
recruitment is disrupted, results in severe declines in apple snail abundance. As natural
resource managers continue to attempt to balance the needs of wildlife, fisheries and
25

human interests in Florida's lakes, dry downs will undoubtedly be an important tool
towards achieving their goals. However, as we have found with apple snails, the
consideration of the timing and duration ofdry downs, relative to the long term goals of
habitat maintenance, is an important aspect of utilization of dry downs as a management
tool.
26

~ ~--~-----------------------------
LITERATURE CITED
Aldridge, D.W. 1983. Physiological ecology of freshwater prosobranchs. Pages inW.n. Russel-Hunter, ed. The Mollusca. Vol. 6. Academic Press, Inc., New York.
Andrews, E.B. 1965. The functional anatomy ofthe mantle cavity, kidney and bloodsystem of some pilid gastropods (Prosobranchia). 1. ZooI. 146:70-94.
Beissinger, S.R. and J.E. Takekawa. 1983. Habitat use by and dispersal of snail kites inFlorida during drought conditions. Florida Field Naturalist. 11: 89-106.
Bennetts, R.E. and W.M. Kitchens 1993. Estimation and environmental correlates ofsurvival and dispersal of Snail Kites in Florida. 1993 Annual Report. U. S. Fish andWildlife Service, Jacksonville, FL.
Brenner, M., M.W. Binford and E.S. Deevey. 1990. Lakes. Pages 364-391 in R.L.Myers and 1.J. Ewel, eds. Ecosystems ofFlorida. University of Central Florida Press,Orlando, FL.
Burky, A.J., J. Pacheco and E. Pereyra. 1972. Temperature, water, and respiratoryregimes of an amphibious snail, Pomacea urceus (Muller), from the Venezuelansavanna. BioI. Bull. 143:304-316.
Butler, R.S., E. J. Moyer, M. W. Hulon, and YP. Williams. 1992. Littoral zoneinvertebrate communities as affected by a habitat restoration project on LakeTohopekaliga, Florida. J. Freshwater Ecology. 7: 317-328.
Chable, AC. 1947. A study of the food habits and ecological relationships of thesunfishes ofNorthem Florida. M.S. Thesis, University ofFlorida, Gainesville.
Cooke, G.D. 1980. Lake level drawdown as a macrophyte control technique. WaterResources Bulletin. 16: 317-322.
Cottam, C. 1942. Supplementary notes on the food of the limpkin. The Nautilus. 55:125-128.
Dalrymple, G.H. Intraspecific variation in the cranial feeding mechanism of turtles ofthe genus Trionyx (Reptilia, Testudines, Trionychidae). J. Herpetology. 11: 255-285.
Darby, P.C., J.n. Croop, H.F. Percival and W.M Kitchens. 1996. Ecological studies ofapple snails (Pomacea paludosa). 1995 Annual Report. South Florida WaterManagement District, West Palm Beach, FL and St. Johns River Water ManagementDistrict, Palataka, FL.
Delany, M.F. and C.L. Abercrombie. 1986. American alligator food habits inNorthcentral Florida. l Wildl. Manage. 50: 348-353.
Fox, lL., P.L Brezonik, and M.A. Keirn. 1977. Lake drawdown as a method ofimproving water quality. U.S.E.P.A. Office ofResearch and Development,Corvallis, Oregon. EPA-600/3-77-005.
Game and Fresh Water Fish Commission. 1995. Lake Kissimmee 1996 LakeRestoration. Unpubl. Report. Lake Restoration Section, Florida Game and FreshWater Fish Commission, Kissimmee, FL.
Holcomb, D. and W. Wegener. 1971. Hydrophytic changes related to lake fluctuation asmeasured by point transects. Proc. 25th Ann. Conf SE Assoc. of Game and FishCommissioners. 25: 570-583.
Kadlec, J.A. 1962. Effects of a drawdown on a waterfowl impoundment. Ecology.43:267-281.
Kushlan, lA. 1974. Ecology ofthe white ibis in southern Florida. Ph.D. Dissertation.University ofMiami, Coral Gables. 129 pp.
Kushlan, J.A. 1975. Population changes of the apple snail, Pomacea paludosa, in thesouthern Everglades. The Nautilus 89:21-23.
Kushlan, J.A. 1986. Responses ofwading birds to seasonally fluctuating water levels:strategies and their limits. Colonial Waterbirds. 9: 155-162.
Kushlan, lA. 1990. Freshwater Marshes. Pages 324-363 in R.L. Meyers and J.l Ewel,eds. Ecosystems ofFlorida. University ofCentral Florida Press, Orlando, FL.
Kushlan, lA. and M.S. Kushlan. 1979. Observations on crayfish in the everglades,Florida, USA Crustaceana. Supplement 5: 115-120.
McClary, A. 1964. Surface inspiration an ciliary feeding in Pomacea paludosa(prosobranchia: mesogastropoda: ampullariidae). Malacologia 2:87-104.
Milsap, B.A., lA. Gore, D.E. Runde, and S.I. Cerulean. 1990. Setting priorities for theconservation of fish and wildlife species in Florida. Wildlife Monographs. Ill: 157.
Moyer, E.J. and V.P. Williams 1982. Effects oflake bottom channelization oninvertebrate fish food organisms in Lake Tohopekaliga, Florida. Proc. Ann. Conf.Southeast Assoc. Fish and Wildlife Agencies. 36: 294-304

Moyer, E.I., M.W. Hulon, I. Buntz, RW. Hujik, 1.1. Sweatman and AS. Furukawa.1995. Kissimmee chain oflakes studies. Study III. East Lake Tohopekaliga BasinInvestigations (unpub. rep.). Fla. Game and Fresh Water Fish Comm., Tallahassee.
Pollock, KH, S.R Winterstein, CM. Bunck, and p.o. Curtis. 1989. Survival analysisin telemetry studies: the staggered entry design. J. Wildl. Manage. 53: 7-15.
SAS Inc. 1986 - the handbook for linear models
Snyder, N.F. and HA Snyder. 1969. A comparative study ofmollusc predation bylimpkins, everglades kites, and boat-tailed grackles. The Living Bird. 8: 177-223.
Snyder, N.F. and H.A Snyder. 1971. Defenses of the Florida apple snail (Pomaceapaludosa). Behaviour 40:175-215.
Snyder, N.F., S.R Beissinger and RE. Chandler. 1989. Reproduction and demographyof the Florida everglade (snail) kite. The Condor. 91: 300-316.
Tarver, D.P. 1980. Water fluctuation and the aquatic flora ofLake Miccosukee. I.Aquat. Plant Manage. 18:19-23.
Wegener, W. and V. Williams. 1974. Fish population responses to improved lakehabitat utilizing an extreme drawdown. Proc. S.E. Assoc. Game & Fish Comm.28:144-161.
Wegener, W., V. Williams, and T.D. McCall. 1974. Aquatic macroinvertebrateresponses to an extreme drawdown. Proc. S.E. Assoc. Game & Fish Comm. 28: 126143.

Table 1. Transmitter release schedule for the Lake Kissimmeetelemetry study. Transmitters had a 60 day life span. Numberobserved refers to the number released that month plus the numberstill operating from the previous month minus those whosebatteries failed.
Number NumberMonth Released Observed
November 1995 9 9
December 1995 8 17
January 1996 14 22
February 1996 0 14
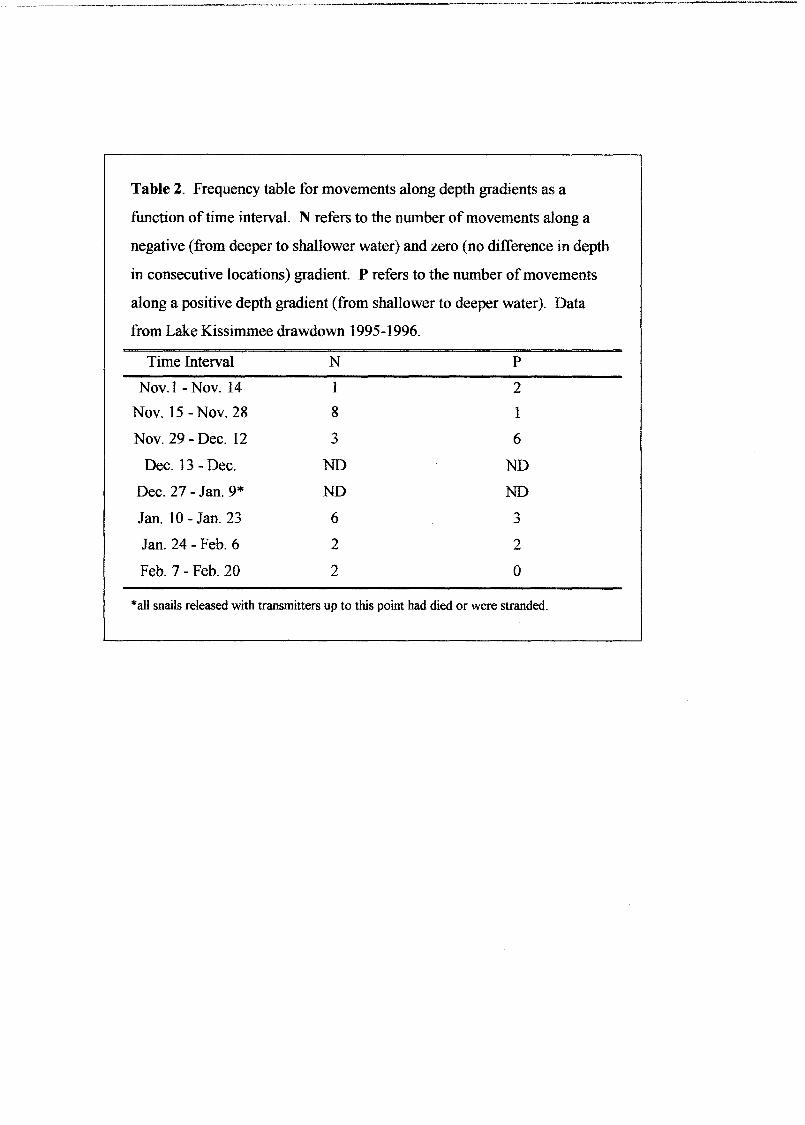
Table 2. Frequency table for movements along depth gradients as a
function oftime interval. N refers to the number ofmovements along a
negative (from deeper to shallower water) and zero (no difference in depth
in consecutive locations) gradient. P refers to the number ofmovements
along a positive depth gradient (from shallower to deeper water). Data
from Lake Kissimmee drawdown 1995-1996.
Time Interval N P
Nov. 1 - Nov. 14 1 2
Nov. 15 - Nov. 28 8 1
Nov. 29 - Dec. 12 3 6
Dec. 13 - Dec. ND ND
Dec. 27 - Jan. 9* ND ND
Jan. 10 - Jan. 23 6 3
Jan. 24 - Feb. 6 2 2
Feb. 7 - Feb. 20 2 0
*alI snails released with transmitters up to this point had died or were stranded.

Table 3. Frequency table for movements along depth gradients as a
function of previous depth in which a snail was found. N referes to the
number ofmovements along a negative (from deeper to shallower water)
and zero (no difference in depth in consecutive locations) gradient. P
refers to the number ofmovements along a positive depth gradient (from
shallower to deeper water).
Depth Class (cm) N P
10 no data no data
20 2 2
30 6 3
40 5 7
50 7 2
60 2 0
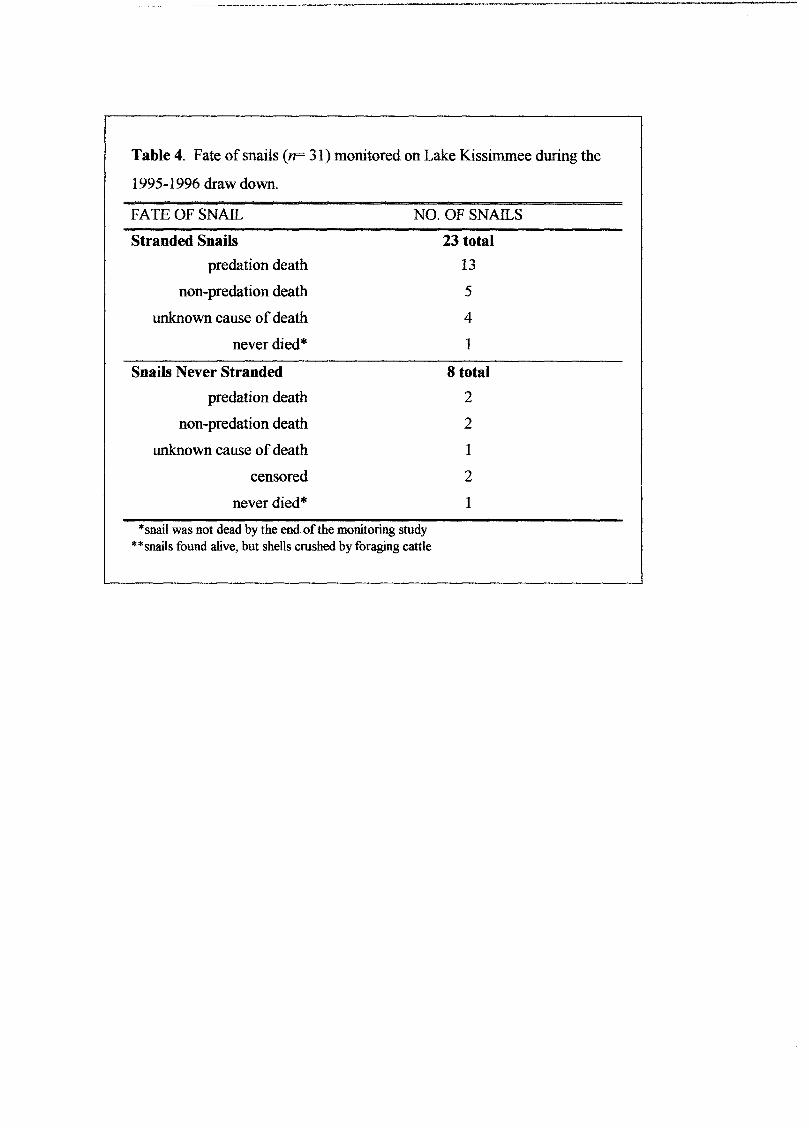
Table 4. Fate of snails (n= 31) monitored on Lake Kissimmee during the
1995-1996 draw down.
FATE OF SNAIL
Stranded Snails
predation death
non-predation death
unknown cause ofdeath
never died*
Snails Never Stranded
predation death
non-predation death
unknown cause ofdeath
censored
neverdied*
NO. OF SNAILS
23 total
13
5
4
1
8 total
2
2
1
2
1
*snail was not dead by the end of the monitoring study**snails found alive, but shells crushed by foraging cattle

Table 5. Snail abundance as a function of type of substrate which
dominated the sampling sites. SAND refers to sites in which clean sand was
easily visible, SAND w/FO refers to sand covered with flocculent organic
material, and MUCK refers to substrates dominated by decaying Nuphar
luteum and associated root systems.
Substrate Type Sites Snails / trap check (±SE)
SAND 7,8 44 (± B.O)
SANDw/FO 1,2,5 11.8 (± 9.70)
MUCK 3,4,6 o(±O)
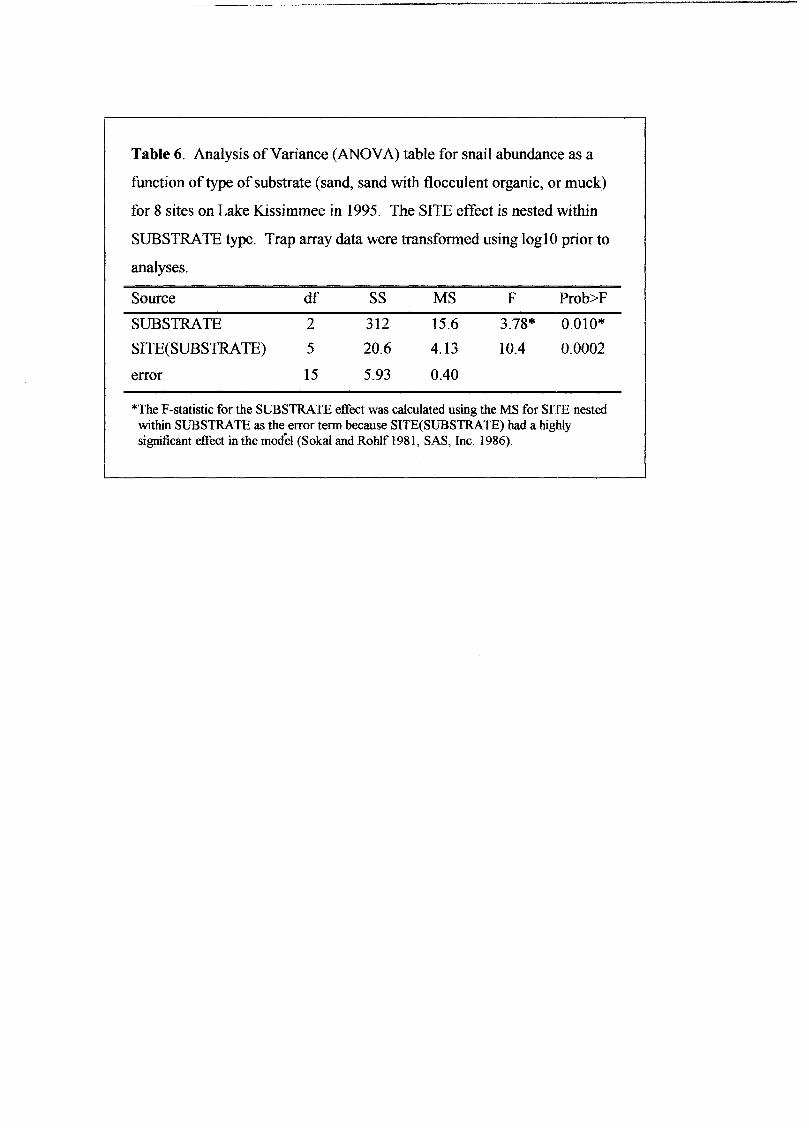
Table 6. Analysis ofVariance (ANOVA) table for snail abundance as a
function of type ofsubstrate (sand, sand with flocculent organic, or muck)
for 8 sites on Lake Kissimmee in 1995. The SITE effect is nested within
SUBSTRATE type. Trap array data were transformed using 10g10 prior to
analyses.
Source df SS MS F Prob>F
SUBSTRATE 2 312 15.6 3.78* 0.010*
SITE(SUBSTRATE) 5 20.6 4.13 10.4 0.0002
error 15 5.93 0.40
*The F-statistic for the SUBSTRATE effect was calculated using the MS for SITE nestedwithin SUBSTRATE as the error term because SITE(SUBSTRATE) had a highlysignificant effect in the model (Sakal and RoWf 1981, SAS, Inc. 1986).

------------.~-_..
Table 7. Treatment of the eight sampling sites showing the imbalanced
design associated with the three substrate categories [CLEAN SAND,
SAND with flocculent organic (FO), and MUCK]. Site 6 is not shown here
since it was not sampled in 1996 or 1997.
Category/Site No. Treatment
CLEAN SAND
7 dry down only
8 dry down only
SANDwithFO
1 dry down and scrape
2 dry down and scrape
5 dry down only
MUCK
3 dry down only
4 dry down and scrape

~ ~~-~~-~-~---------------,
Table 8. Trapping effort for the assessment of pre-draw
down (1995) and post-draw down (1996,1997) apple snail
populations on Lake Kissimmee. Trap effort is in terms of
number of trap checks. ND= no data collected.--=
Site 1995 1996 1997
1 4 3 3
2 4 4 4
3 1 2 3
4 4 5 4
5 3 3 3
6 1 ND ND
7 4 4 3
8 2 4 3
total checks 23 25 23
mean checks/site 2.9 3.6 3.3

Table 9. Analysis ofYariance (ANOYA) table for snail abundance as a
function of YEAR for sand sites (No.7 & 8) on Lake Kissimmee from 1995
- 1997. Trap array data were transformed using log10 prior to analyses.
Source df SS MS F Prob>F
YEAR 2 346 22.8 99.7 0.0001
SITE 1 0.24 0.24 1.06 0.32
YEAR*SITE 2 0.64 0.32 1.40 0.28
error 14 3.20 0.23

Table 10. Analysis ofVariance (ANOVA) table for snail abundance as a
function of YEAR for scraped flocculent organic sites (No. 1 & 2) on Lake
Kissimmee from 1995 - 1997. Trap array data were transformed using
10glO prior to analyses.
Source df SS MS F Prob>F
YEAR 2 12.0 6.01 16.9 0.0001
SITE 1 1.93 1.93 5.45 0.033
YEAR*SITE 2 1.05 0.52 1.48 0.26
error 16 5.68 0.35

Table 11. Analysis ofYariance (ANOYA) table for snail abundance as a
function of YEAR for the one scraped muck site (No.4) on Lake
Kissimmee from 1995 - 1997. Trap array data were transformed using
10g1O prior to analyses.
Source
YEAR
error
df
2
10
SS
0.36
0.41
MS
0.182
0.042
F
4.34
Prob>F
0.044
OverstreetBoat Ramp
OBirdr Island
Rabbitf\Island \j
.... Flocculent Organic Layer'V over Sand Substrate
+Muck Substrate
oClean Sand Substrate
~ThomasR 1\ 8 / Brahma1Landing ".\t
\ ( IslandJ
\0 7 ~~~ \
~ Ll..........__.\.Route 60 Bridge
IFigure 1. Sampling Sites on Lake Kissimmee, Oscealo County, FL, for the pre-draw down
I(1995) and post-draw down (1996, 1997) assessment ofapple snail abundance. The telemetry
Istudy was conducted in Site 5.
I
II

Figure 2. Water levels on Lake Kissimmee from September 1995 through December 1996, and
from September 1997 through November 1997. Box A= 1995 trap array sampling, Box B=
telemetry study, Box C= 1996 trap array sampling, and Box D = 1997 trap array sampling.
53
52
51
50
i1 49
!.l 48~CII~ 47j
46
45
44
43SEP NOV JAN MAR MAY
I
JUL SEP NOV SEP

Figure 3.. An example ofhow gradient data were derived from telemetry data. A snail is
located on January 5 and its location marked with a pvc pole. On January 12 we found the snail
(@) at its new location. We measured depth 1 and depth 2 simultaneously on Jaunuary 12.
January 5
January 12•
~@
DEPTH 1on January 12
DEPTH 2on January 12
GRADIENT = DEPTH 2 - DEPTH 1

Figure 4. Distances traveled by snails as a function of biweekly time interval on Lake
Kissimmee during the 1995-1996 draw down. Data are from snails in water depths> 10 cm.
Error bars are standard errors. Numbers above or inside bars are sample sizes. Dates on x-axis
are the last day of a two week time interval.
3O-r----------------------------------,
25
20
10
o~an 9 '------~-dan 23 "---. Feb 6 -Feb 21

Figure 5. Distances traveled by snails as a function of depth at Lake Kissimmee during the
1995-1996 draw down. Data are from snails in water depths> 10 em. Error bars are standard
errors. Numbers above or inside bars are sample sizes.
30
125 I20 -1-
g IIaIu 15 +I:
oSIII:c
10
5
43
05
4
10 20 30
depth (em)
40 50
1I I I
I I
60

Figure 6. Survival of31 snails during the Lake Kissimmee 1995-1996 draw down. 95%
confidence intervals shown. Vertical dotted line indicates when the littoral zone of the study site
first started to become dry.
\\
\\
\\
\\
\\
\
'"
" ... ..." ... ... .,
""-
""-"
""-
"-"
-- --"""""" "-
""
... ... ... ... ... ..."
\\
\\ , ,
",""""
0.2
0.4
0.6
0.8
oNOV DEC JAN FEB
" --

Figure 7. Survival of31 snails during the Lake Kissimmee 1995-1996 draw down. Non
predation deaths (n =5) (solid black dots) are shown in relation to the three freeze events (*) as
defined in the text.
1
0.8
0.6
0.4
0.2
O-!----+---+---+-----+----+---+----+---+-------'NOV DEC JAN FEB

Figure 8. Snail abundance (snails/trap check) as determined by trap array sampling on Lake
Kissimmee in 1995 (8 sites), 1996 (7 sites) and 1997 (7 sites). Error bars are standard errors
(SE). Numbers inside bars are sample size (number of trap checks). Note that the mean (± SE )
value for each site includes variance attributable to sites, substrate types, treatment effects (i.e.,
draw down and/or scraping) and sampling error.
25·,.------------------------------,
20
"'" 15~.I::UGo
~-..'ii 10c:..
5
o -f----
1995 1996 1997

Figure 9. Snail abundance (snails/trap check) in sites categorized as sand substrate (n=2), sand
with flocculent organic substrate that was scraped (n=2), and muck that was scraped (n=1)
during the Lake Kissimmee draw down. Error bars are standard errors (SE), and reflect variance
attributable to sampling error (in contrast to SE in figure 8).
60 ,-----------------------------~
50
40 -
30
20
OSAND (not scraped) ImSAND w/FO (scraped) I_MUCK (scraped) I
1995 1996 1997

Figure 10. Percent of snails from 1995, 1996, and 1997 that were considered to be juveniles.
We considered a juvenile snail to be one which had a shell length ofless than 25 mrn.
35
30
25
,g 20cII>'"...>J!. 15.
10
5
01995 1996 1997

I --BCW MA(1996)
I --L. Okeechobee (1976)
I -o-L_ Okeechobee (1977) II -o-Silver Springs (1953-19~
-------------_._--------_._-----_._----
Figure 11. Temporal variation in apple snail egg cluster production from three areas in Florida.
Lake Okeechobee data is from Hanning (1979), Silver Springs data is from Odum (1957), and
BCWMA data is from Darby et al. (1997). Different survey techniques were used to sample egg
clusters in these three studies, so the data from Hanning (1979) and Odum (1957) were
transformed by multiplication with a constant in order to place the data on the same scale. ND
refers to no data; these data points were exirapolated to complete the graph and therefore may
not accurately reflect the actual peak production.
I 6.---,-------I I
I 'II ~ fi 4
I ~ 3
~.~'l;j 2E
09===~~--+---~-__+---t---t__-__+_--_+_--1-----.:~-_____1
JAN FEB MAR APR MAY JUN JUL AUG SEP OCT NOV DEC

Figure 12. Kissimmee water levels (line graph) and egg cluster surveys (black dots) from the
[Upper St. Johns Marsh as reported in Darby et al. 1997. Dotted line shows ground level, all lake
Istages below this level indicate that the littoral zone was exposed. Our assessment of water level
relative to dry littoral zone was based on observations of the littoral zone in our sampling sites
during the 1995-1996 draw down.
•52
50
48
46
•
•
44~ --"~ .....l
SEP NOV JAN MAR MAY JUL
Related Documents