Welcome message from author
This document is posted to help you gain knowledge. Please leave a comment to let me know what you think about it! Share it to your friends and learn new things together.
Transcript
Asian Cities title.p65 1/19/04, 11:22 AM1
© Asian Development Bank 2004
All rights reserved
First published by the Asian Development Bank (ADB) in January 2004, ISBN971-561-524-4, Publication Stock No. 121303 as part of the “Water for All”publication series under the Water Awareness Program. This publicationwas prepared by consultants for ADB under the Cooperation Fund for theWater Sector: Promoting Effective Water Management Policies and Practices.The findings, interpretations, and conclusions expressed here do notnecessarily represent the views of ADB or those of its member governments.ADB does not guarantee the accuracy of the data included in this publicationand accepts no responsibility whatsoever of any consequences of their use.Use of the term “country” does not imply any judgment by the authors orADB as to the legal or other status of any territorial entity.
Asian Cities title.p65 1/19/04, 11:22 AM2
___________________________________________________________________________________________________ iii
FOREWORD
This book is about the performance of water supply and sanitation utilities in 18 Asian cities and what civil society sees as its role in improving water services in the cities. The surveys, consultations, analyses, and commentaries that come together in the book are the results of a Study on Water in Asian Cities funded by the Asian Development Bank (ADB) under a regional technical assistance on Promoting Effective Water Management Policies and Practices. This work continues a tradition of ADB support for water services in cities of Asia and the Pacific, following on from Water Utilities Data Books published by ADB in 1993 and 1997.
The performance data in this book comprise essential benchmarking indicators on service level, service quality, operational efficiency, and financial management. Also included are broader performance dimensions including water resources management, policy and regulation, private sector participation, small-scale service providers, wastewater and sanitation, and urban flood management.
Are water utilities performing better now than in 1997? The answer seems to be “marginally”, and only in certain limited
aspects. Customer satisfaction is up and water resources management has improved. Utilities’ human resources management is also generally better. But gains in service coverage and non-revenue water are minimal. Importantly, overall financial management of utilities seems to have worsened. Revenues from tariffs are still not able to cover operations and maintenance costs, let alone financing costs and capital expenditure. Poor families in Asian cities continue to suffer from bad water supply services principally because of low and inappropriate water supply tariffs.
The findings of the Study on Water in Asian Cities were discussed at a regional consultation workshop on the role of civil
society in this sector held at the ADB headquarters, Manila in October 2002. The proceedings of the workshop and a summary of civil society’s views are also included in this book. The study findings and civil society’s perceived roles were presented and discussed at the Third World Water Forum in Osaka, Japan in March 2003.
Civil society appreciates the centrality of improved water supplies in reducing urban poverty. And although from this
common understanding, the priorities and preferences of civil society diverge enormously there are many shared positions, notably on the need for demand management and awareness, taking care of the poor first, the role of women and stakeholder participation, involving the media, and getting tough on polluters. Improving governance and reducing corruption are also important to civil society. The social good versus economic good issue remains highly topical particularly around service tariffs and the role of the private sector. Despite great interest and significant knowledge, civil society is not yet a powerful force for reform in the Region. The ADB will help development partners harness this power, which is vital for achieving good governance in the water sector.
Charles Andrews, Principal Water Supply and Sanitation Specialist in ADB’s Agriculture, Natural Resources and Social
Sectors Division of the Regional and Sustainable Development Department was responsible for the overall production of the publication. A former ADB staff, Arthur C. McIntosh, initiated the study and Cesar E. Yñiguez, a consultant, helped administer the study and prepare the publication.
This third performance data publication has been eagerly awaited and it is designed for easy assessment of the
strengths, weaknesses, and potential of utilities and groups of utilities. The book is designed to assist utility managers, local officials, and customer groups in the participating cities, as well as others working for efficient and equitable water markets.
Jan P. M. van Heeswijk Director General Regional and Sustainable Development Department
___________________________________________________________________________________________________ iv
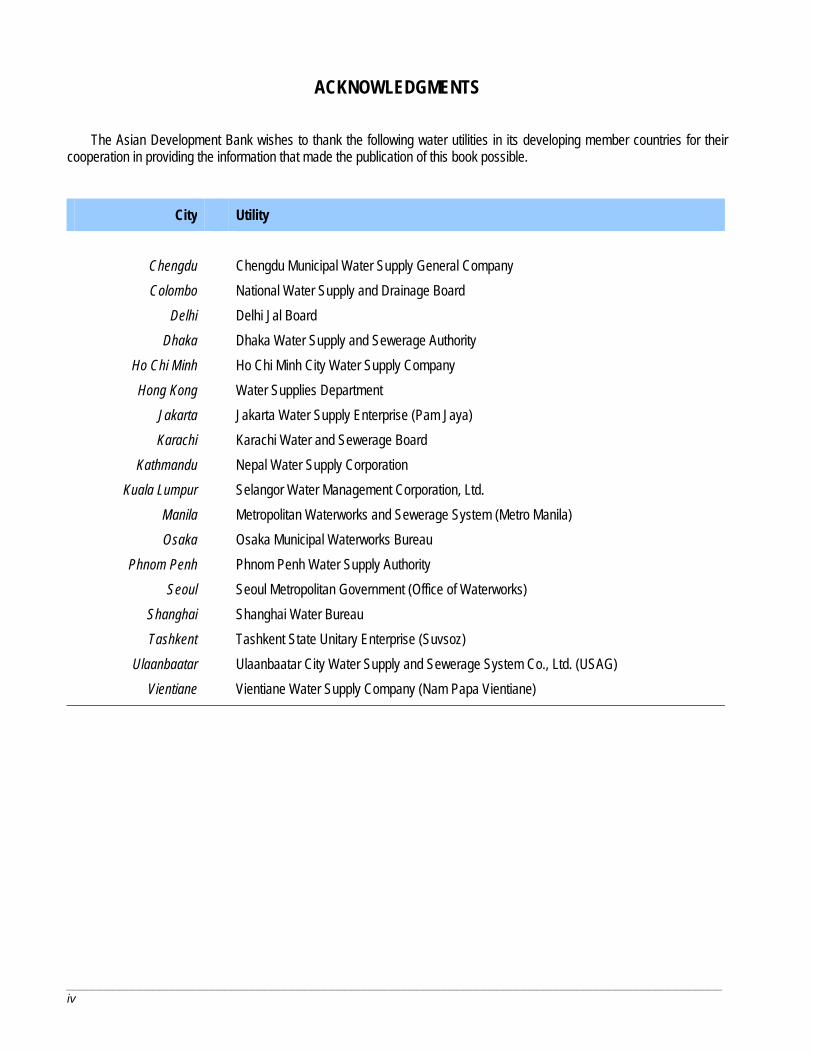
ACKNOWLEDGMENTS
The Asian Development Bank wishes to thank the following water utilities in its developing member countries for their cooperation in providing the information that made the publication of this book possible.
City Utility
Chengdu Chengdu Municipal Water Supply General Company Colombo National Water Supply and Drainage Board
Delhi Delhi Jal Board Dhaka Dhaka Water Supply and Sewerage Authority
Ho Chi Minh Ho Chi Minh City Water Supply Company Hong Kong Water Supplies Department
Jakarta Jakarta Water Supply Enterprise (Pam Jaya) Karachi Karachi Water and Sewerage Board
Kathmandu Nepal Water Supply Corporation Kuala Lumpur Selangor Water Management Corporation, Ltd.
Manila Metropolitan Waterworks and Sewerage System (Metro Manila) Osaka Osaka Municipal Waterworks Bureau
Phnom Penh Phnom Penh Water Supply Authority Seoul Seoul Metropolitan Government (Office of Waterworks)
Shanghai Shanghai Water Bureau Tashkent Tashkent State Unitary Enterprise (Suvsoz)
Ulaanbaatar Ulaanbaatar City Water Supply and Sewerage System Co., Ltd. (USAG) Vientiane Vientiane Water Supply Company (Nam Papa Vientiane)
___________________________________________________________________________________________________ v
The efforts made by the domestic consultants in collecting the information and preparing the reports on the various themes for each city are greatly appreciated. The information on Chengdu water supply was provided by Veolia Water (formerly Vivendi Water).
The Annex on the Proceedings of the Regional Consultation Workshop on “Water in Asian Cities – The Role of Civil Society” was taken from the report on the proceedings and integration of the domestic consultants’ reports prepared by Geoffrey Bridges of Mott MacDonald Limited.
Special acknowledgment is due to the ADB resident missions in India, Bangladesh, Pakistan, and Uzbekistan, for their assistance in initiating and facilitating communications with water utilities in the participating cities in those countries.
Among the ADB staff who assisted, special thanks are due to Bradford R. Philips, Director of the Agriculture, Natural Resources and Social Sectors Division (RSAN), and Wouter Lincklaen Arriens, Lead Water Resources Specialist, RSAN, for their support and encouragement in the preparation of the study; and Xiaoyan Ye and In-Ho Keum for providing information on Phnom Penh and Shanghai, respectively. Desktop publishing advice was provided by Judy T. Yñiguez and Vicente Angeles of the Printing Unit, under the supervision of Raveendranath Rajan. Penny Poole of the Water Team coordinated the publishing process under ADB’s Water Awareness Program.
Charles T. Andrews
Principal Water Supply and Sanitation Specialist Agriculture, Natural Resources and Social Sectors Division
___________________________________________________________________________________________________ vi
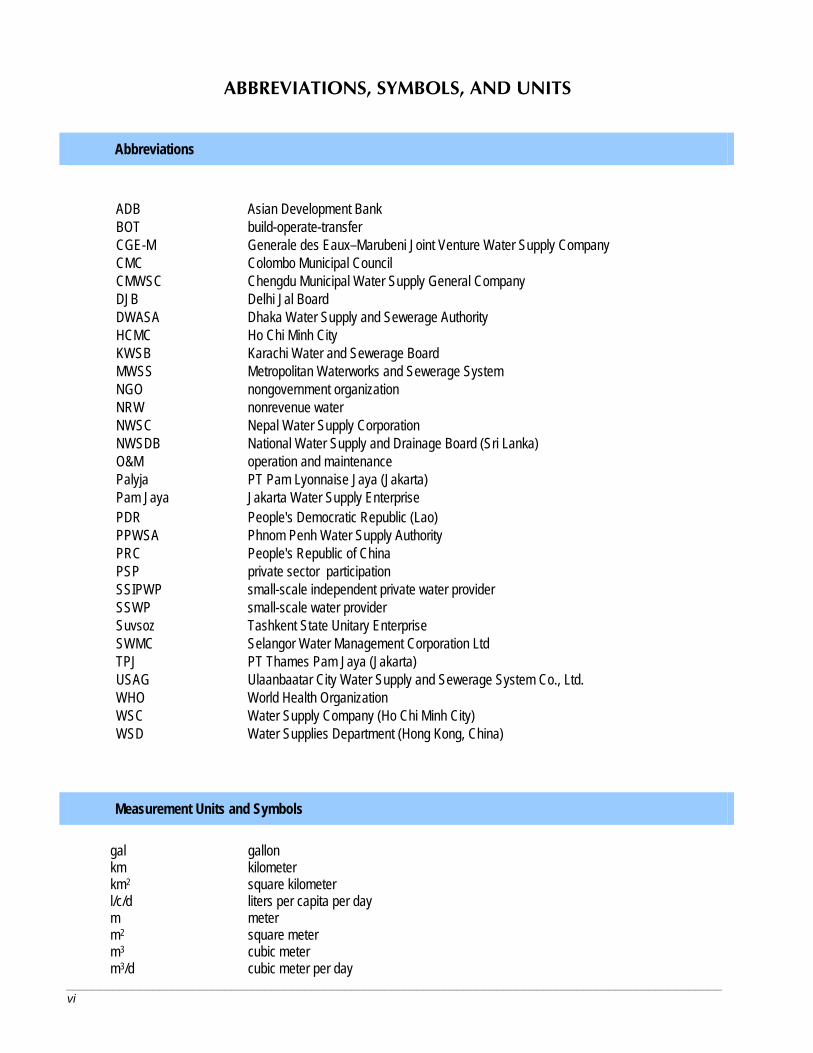
ABBREVIATIONS, SYMBOLS, AND UNITS Abbreviations
ADB Asian Development Bank BOT build-operate-transfer CGE-M Generale des Eaux–Marubeni Joint Venture Water Supply Company CMC Colombo Municipal Council CMWSC Chengdu Municipal Water Supply General Company DJB Delhi Jal Board DWASA Dhaka Water Supply and Sewerage Authority HCMC Ho Chi Minh City KWSB Karachi Water and Sewerage Board MWSS Metropolitan Waterworks and Sewerage System NGO nongovernment organization NRW nonrevenue water NWSC Nepal Water Supply Corporation NWSDB National Water Supply and Drainage Board (Sri Lanka) O&M operation and maintenance Palyja PT Pam Lyonnaise Jaya (Jakarta) Pam Jaya Jakarta Water Supply Enterprise PDR People's Democratic Republic (Lao) PPWSA Phnom Penh Water Supply Authority PRC People's Republic of China PSP private sector participation SSIPWP small-scale independent private water provider SSWP small-scale water provider Suvsoz Tashkent State Unitary Enterprise SWMC Selangor Water Management Corporation Ltd TPJ PT Thames Pam Jaya (Jakarta) USAG Ulaanbaatar City Water Supply and Sewerage System Co., Ltd. WHO World Health Organization WSC Water Supply Company (Ho Chi Minh City) WSD Water Supplies Department (Hong Kong, China)
Measurement Units and Symbols
gal gallon km kilometer km2 square kilometer l/c/d liters per capita per day m meter m2 square meter m3 cubic meter m3/d cubic meter per day
___________________________________________________________________________________________________ vii
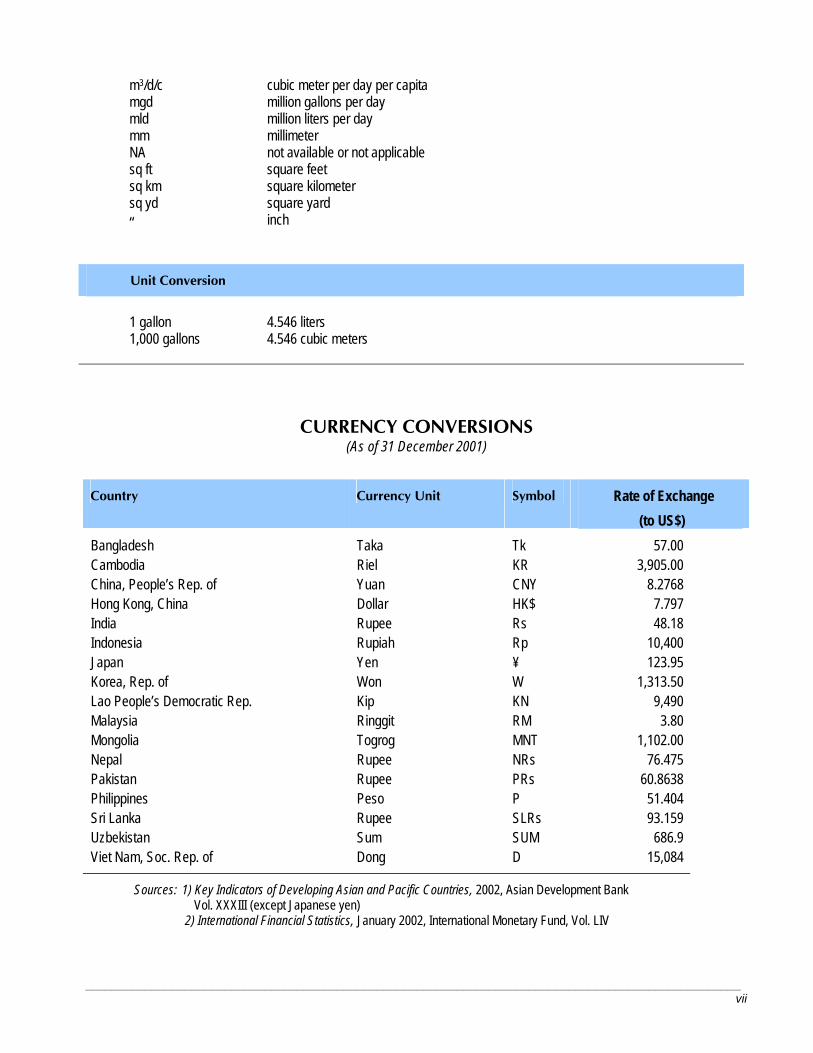
m3/d/c cubic meter per day per capita mgd million gallons per day mld million liters per day mm millimeter NA not available or not applicable sq ft square feet sq km square kilometer sq yd square yard “ inch
Unit Conversion
1 gallon 4.546 liters 1,000 gallons 4.546 cubic meters
CURRENCY CONVERSIONS (As of 31 December 2001)
Country Currency Unit Symbol Rate of Exchange (to US$)
Bangladesh Taka Tk 57.00 Cambodia Riel KR 3,905.00 China, People’s Rep. of Yuan CNY 8.2768 Hong Kong, China Dollar HK$ 7.797 India Rupee Rs 48.18 Indonesia Rupiah Rp 10,400 Japan Yen ¥ 123.95 Korea, Rep. of Won W 1,313.50 Lao People’s Democratic Rep. Kip KN 9,490 Malaysia Ringgit RM 3.80 Mongolia Togrog MNT 1,102.00 Nepal Rupee NRs 76.475 Pakistan Rupee PRs 60.8638 Philippines Peso P 51.404 Sri Lanka Rupee SLRs 93.159 Uzbekistan Sum SUM 686.9 Viet Nam, Soc. Rep. of Dong D 15,084
Sources: 1) Key Indicators of Developing Asian and Pacific Countries, 2002, Asian Development Bank Vol. XXXIII (except Japanese yen)
2) International Financial Statistics, January 2002, International Monetary Fund, Vol. LIV
___________________________________________________________________________________________________ viii
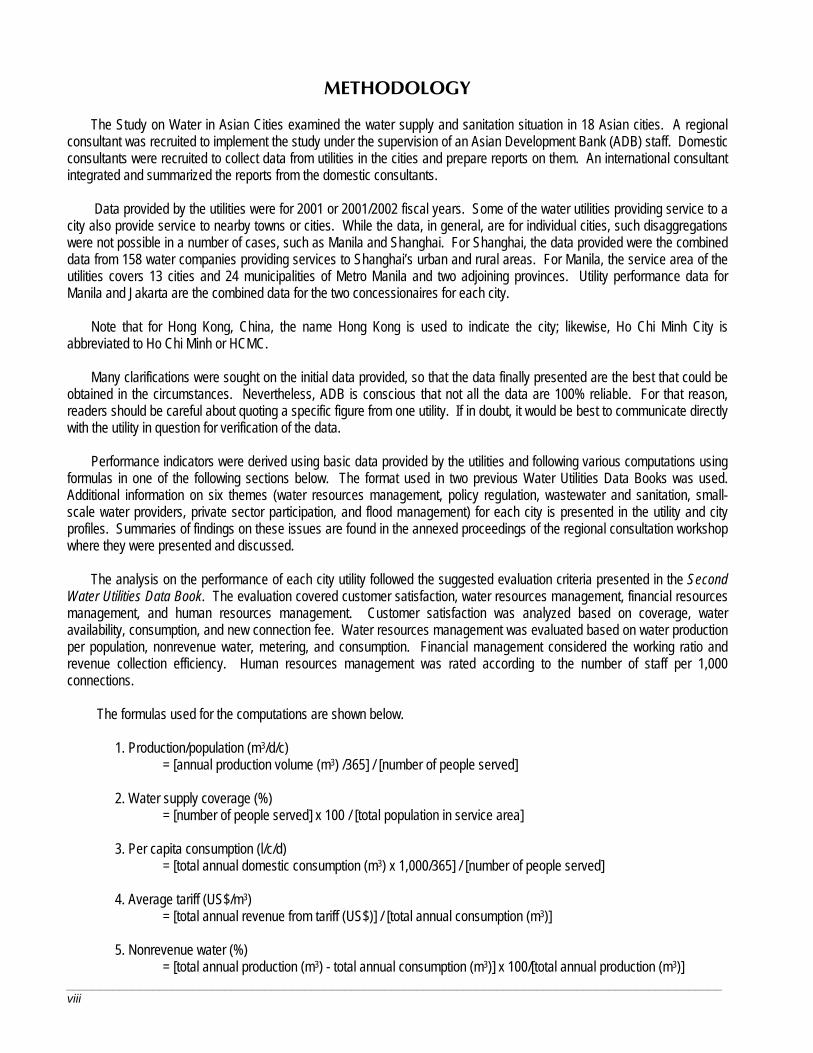
METHODOLOGY
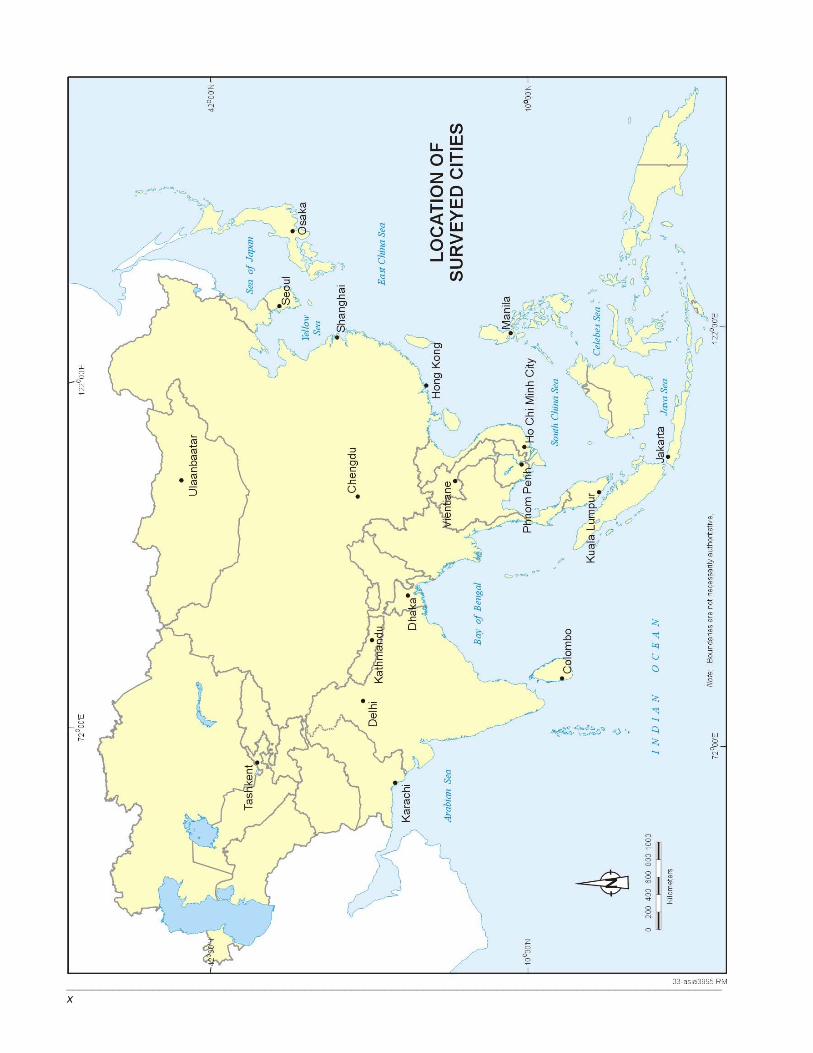
The Study on Water in Asian Cities examined the water supply and sanitation situation in 18 Asian cities. A regional consultant was recruited to implement the study under the supervision of an Asian Development Bank (ADB) staff. Domestic consultants were recruited to collect data from utilities in the cities and prepare reports on them. An international consultant integrated and summarized the reports from the domestic consultants.
Data provided by the utilities were for 2001 or 2001/2002 fiscal years. Some of the water utilities providing service to a city also provide service to nearby towns or cities. While the data, in general, are for individual cities, such disaggregations were not possible in a number of cases, such as Manila and Shanghai. For Shanghai, the data provided were the combined data from 158 water companies providing services to Shanghai’s urban and rural areas. For Manila, the service area of the utilities covers 13 cities and 24 municipalities of Metro Manila and two adjoining provinces. Utility performance data for Manila and Jakarta are the combined data for the two concessionaires for each city.
Note that for Hong Kong, China, the name Hong Kong is used to indicate the city; likewise, Ho Chi Minh City is
abbreviated to Ho Chi Minh or HCMC. Many clarifications were sought on the initial data provided, so that the data finally presented are the best that could be
obtained in the circumstances. Nevertheless, ADB is conscious that not all the data are 100% reliable. For that reason, readers should be careful about quoting a specific figure from one utility. If in doubt, it would be best to communicate directly with the utility in question for verification of the data.
Performance indicators were derived using basic data provided by the utilities and following various computations using
formulas in one of the following sections below. The format used in two previous Water Utilities Data Books was used. Additional information on six themes (water resources management, policy regulation, wastewater and sanitation, small-scale water providers, private sector participation, and flood management) for each city is presented in the utility and city profiles. Summaries of findings on these issues are found in the annexed proceedings of the regional consultation workshop where they were presented and discussed.
The analysis on the performance of each city utility followed the suggested evaluation criteria presented in the Second
Water Utilities Data Book. The evaluation covered customer satisfaction, water resources management, financial resources management, and human resources management. Customer satisfaction was analyzed based on coverage, water availability, consumption, and new connection fee. Water resources management was evaluated based on water production per population, nonrevenue water, metering, and consumption. Financial management considered the working ratio and revenue collection efficiency. Human resources management was rated according to the number of staff per 1,000 connections.
The formulas used for the computations are shown below.
1. Production/population (m3/d/c) = [annual production volume (m3) /365] / [number of people served]
2. Water supply coverage (%) = [number of people served] x 100 / [total population in service area]
3. Per capita consumption (l/c/d)
= [total annual domestic consumption (m3) x 1,000/365] / [number of people served] 4. Average tariff (US$/m3) = [total annual revenue from tariff (US$)] / [total annual consumption (m3)] 5. Nonrevenue water (%)
= [total annual production (m3) - total annual consumption (m3)] x 100/[total annual production (m3)]
___________________________________________________________________________________________________ ix
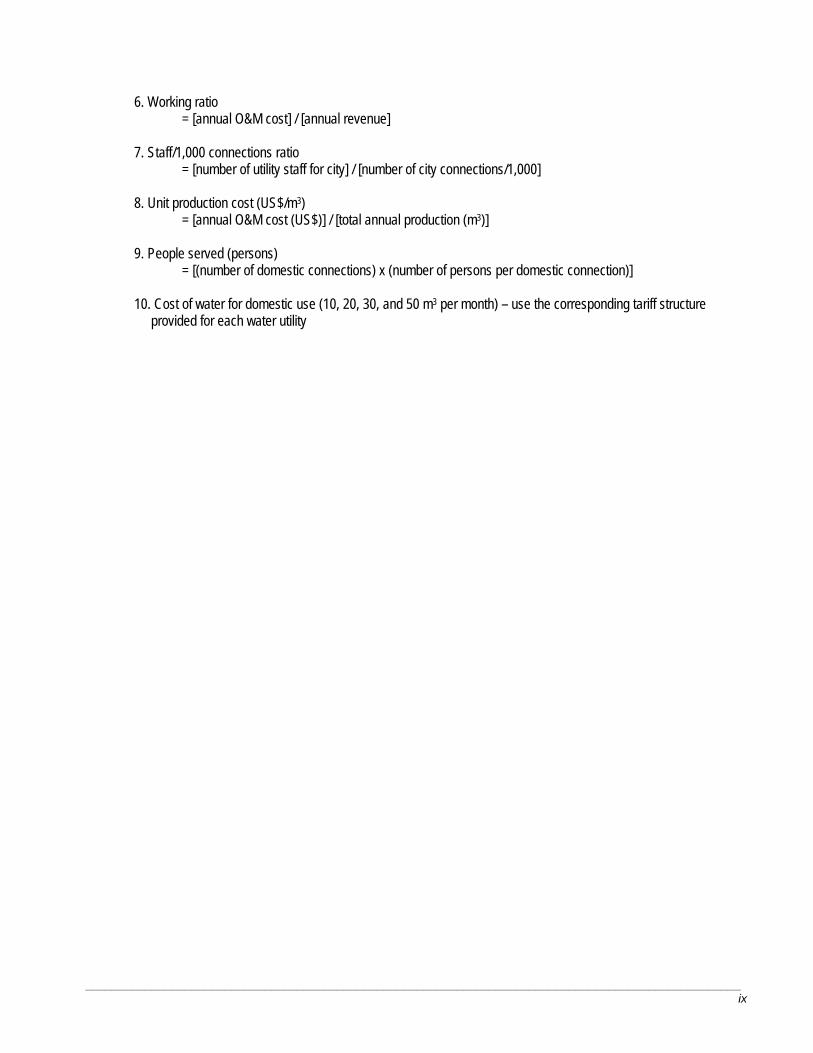
6. Working ratio = [annual O&M cost] / [annual revenue] 7. Staff/1,000 connections ratio = [number of utility staff for city] / [number of city connections/1,000] 8. Unit production cost (US$/m3) = [annual O&M cost (US$)] / [total annual production (m3)] 9. People served (persons) = [(number of domestic connections) x (number of persons per domestic connection)]
10. Cost of water for domestic use (10, 20, 30, and 50 m3 per month) – use the corresponding tariff structure provided for each water utility
___________________________________________________________________________________________________ x

___________________________________________________________________________________________________ xi
CONTENTS
Page
Foreword iii Acknowledgments iv Abbreviations, Symbols, and Units vi Currency Conversions vii Methodology viii Map x List of Tables and Figures xiv PART I –SECTOR PROFILE 1 Summary of Results for 18 Utilities 3 Comment and Analysis by City 4 Comment and Analysis by Parameter 6 Changes for 15 Water Utilities from Second Data Book to 2001 9 Views of Civil Society on City Water Supplies 10 PART II–REGIONAL PROFILES (Figures and Tables) 13 Institutions
Names and Locations of Utilities 15 Size of Utilities 15 Working Ratio 16 Capital Expenditure per Connection 16 Operation and Maintenance Production Volume 17 Consumption Volume 17 Annual Operation and Maintenance Costs 18 Consumer Metering 18 Service Water Supply Coverage 19 Sewerage Access 19 City Connections 20 Persons per Domestic Connection 20
Water Availability 21 Water Use 21 Per Capita Consumption 22 Bottled Water Usage 22
Management Nonrevenue Water 23 Unit Production Cost 23 Average Tariff 24 Staff per 1,000 Connections 24
___________________________________________________________________________________________________ xii
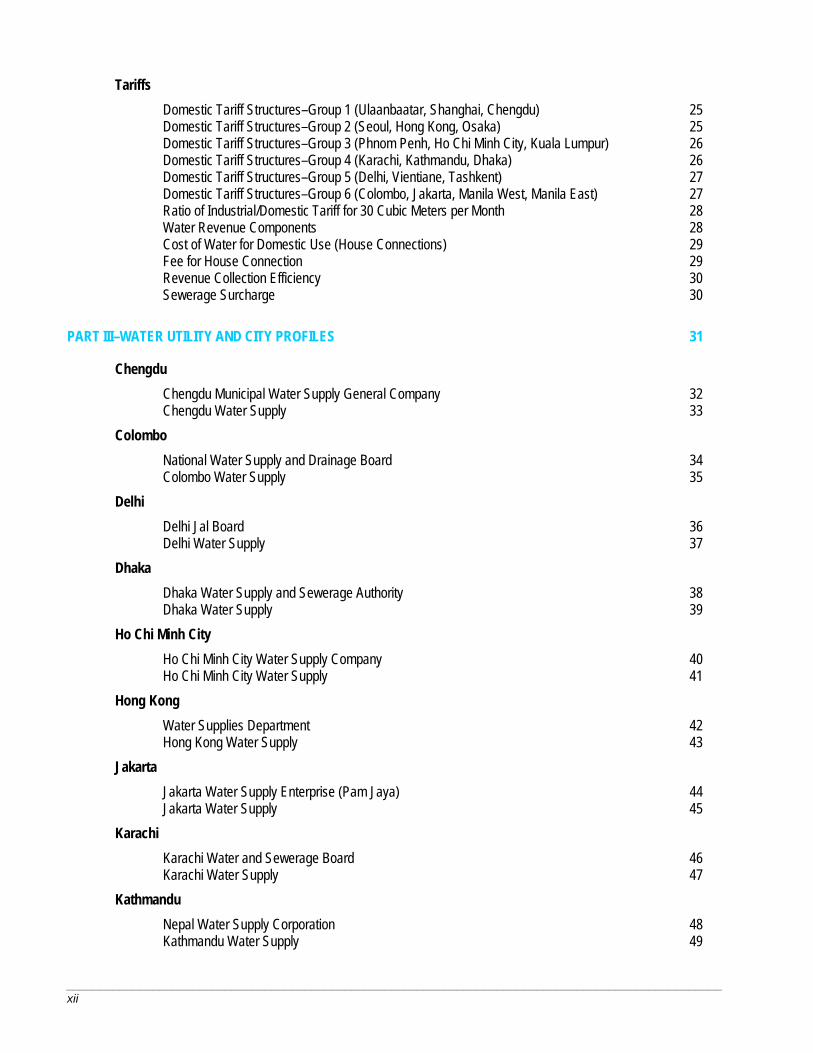
Tariffs Domestic Tariff Structures–Group 1 (Ulaanbaatar, Shanghai, Chengdu) 25 Domestic Tariff Structures–Group 2 (Seoul, Hong Kong, Osaka) 25 Domestic Tariff Structures–Group 3 (Phnom Penh, Ho Chi Minh City, Kuala Lumpur) 26 Domestic Tariff Structures–Group 4 (Karachi, Kathmandu, Dhaka) 26 Domestic Tariff Structures–Group 5 (Delhi, Vientiane, Tashkent) 27 Domestic Tariff Structures–Group 6 (Colombo, Jakarta, Manila West, Manila East) 27 Ratio of Industrial/Domestic Tariff for 30 Cubic Meters per Month 28 Water Revenue Components 28 Cost of Water for Domestic Use (House Connections) 29 Fee for House Connection 29 Revenue Collection Efficiency 30 Sewerage Surcharge 30 PART III–WATER UTILITY AND CITY PROFILES 31
Chengdu Chengdu Municipal Water Supply General Company 32 Chengdu Water Supply 33
Colombo National Water Supply and Drainage Board 34
Colombo Water Supply 35 Delhi
Delhi Jal Board 36 Delhi Water Supply 37 Dhaka
Dhaka Water Supply and Sewerage Authority 38 Dhaka Water Supply 39 Ho Chi Minh City
Ho Chi Minh City Water Supply Company 40 Ho Chi Minh City Water Supply 41 Hong Kong
Water Supplies Department 42 Hong Kong Water Supply 43
Jakarta Jakarta Water Supply Enterprise (Pam Jaya) 44 Jakarta Water Supply 45 Karachi
Karachi Water and Sewerage Board 46 Karachi Water Supply 47 Kathmandu
Nepal Water Supply Corporation 48 Kathmandu Water Supply 49
___________________________________________________________________________________________________ xiii
Kuala Lumpur Selangor Water Management Corporation, Ltd. 50 Kuala Lumpur Water Supply 51 Manila
Metropolitan Waterworks and Sewerage System 52 Manila Water Supply 53 Osaka Osaka Municipal Waterworks Bureau 54
Osaka Water Supply 55 Phnom Penh
Phnom Penh Water Supply Authority 56 Phnom Penh Water Supply 57
Seoul Seoul Metropolitan Government (Office of Waterworks) 58 Seoul Water Supply 59 Shanghai Shanghai Water Bureau 60 Shanghai Water Supply 61
Tashkent Tashkent State Unitary Enterprise (Suvsoz) 62 Tashkent Water Supply 63 Ulaanbaatar Ulaanbaatar City Water Supply and Sewerage System Co., Ltd. 64 Ulaanbaatar Water Supply 65
Vientiane Vientiane Water Supply Company (Nam Papa Vientiane) 66 Vientiane Water Supply 67 ANNEX 69
Proceedings of the Regional Consultation Workshop on Water in Asian Cities –The Role of Civil Society 71
Appendix 1: Workshop Program 84 Appendix 2: List of Participants and Observers 87
___________________________________________________________________________________________________ xiv
TABLES Number Title Page
1 Summary of Results for 18 Utilities 3 2 Names and Locations of Utilities 15 3 Size of Utility 15 4 Cost of Water for Domestic Use (House Connections) 29 5 Fee for House Connection 29
FIGURES Number Title Page
1 Working Ratio 16 2 Capital Expenditure per Connection 16 3 Production Volume 17 4 Consumption Volume 17 5 Annual Operation and Maintenance Costs 18 6 Consumer Metering 18 7 Water Supply Coverage 19 8 Sewerage Access 19 9 City Connections 20 10 Persons per Domestic Connection 20 11 Water Availability 21 12 Water Use 21 13 Per Capita Consumption 22 14 Bottled Water Usage 22 15 Nonrevenue Water 23 16 Unit Production Cost 23 17 Average Tariff 24 18 Staff per 1,000 Connections 24
19a Domestic Tariff Structures–Group 1 25 19b Domestic Tariff Structures–Group 2 25 19c Domestic Tariff Structures–Group 3 26 19d Domestic Tariff Structures–Group 4 26 19e Domestic Tariff Structures–Group 5 27 19f Domestic Tariff Structures–Group 6 27 20 Ratio of Industrial/Domestic Tariff for 30 Cubic Meters per Month 28 21 Water Revenue Components 28 22 Revenue Collection Efficiency 30 23 Sewerage Surcharge 30
Sector Profile
1
63672 adb_Asian Cities chap pages.p65 1/19/04, 12:10 PM1
_______________________________________________________________________________________________________ Summary of Results for 18 Utilities 3
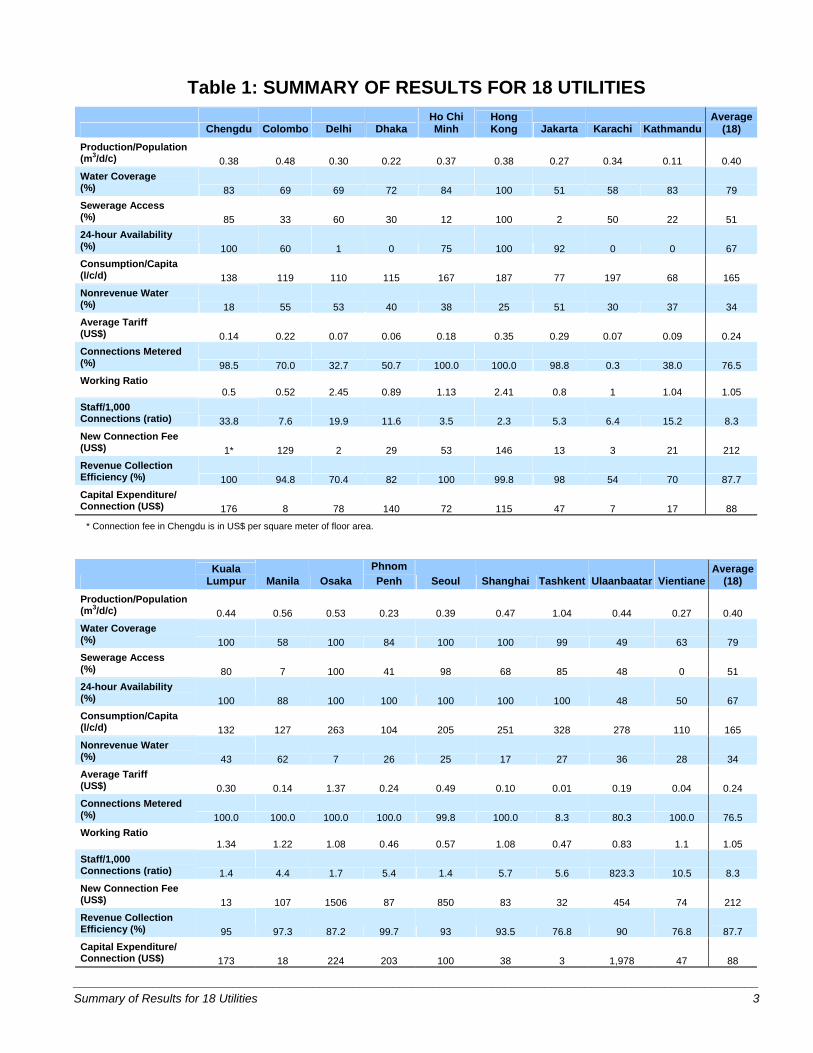
Table 1: SUMMARY OF RESULTS FOR 18 UTILITIES
Chengdu Colombo Delhi Dhaka Ho Chi Minh
Hong Kong Jakarta Karachi Kathmandu
Average(18)
Production/Population (m3/d/c) 0.38 0.48 0.30 0.22 0.37 0.38 0.27 0.34 0.11 0.40 Water Coverage (%) 83 69 69 72 84 100 51 58 83 79 Sewerage Access (%) 85 33 60 30 12 100 2 50 22 51 24-hour Availability (%) 100 60 1 0 75 100 92 0 0 67 Consumption/Capita (l/c/d) 138 119 110 115 167 187 77 197 68 165 Nonrevenue Water (%) 18 55 53 40 38 25 51 30 37 34 Average Tariff (US$) 0.14 0.22 0.07 0.06 0.18 0.35 0.29 0.07 0.09 0.24 Connections Metered (%) 98.5 70.0 32.7 50.7 100.0 100.0 98.8 0.3 38.0 76.5 Working Ratio 0.5 0.52 2.45 0.89 1.13 2.41 0.8 1 1.04 1.05 Staff/1,000 Connections (ratio) 33.8 7.6 19.9 11.6 3.5 2.3 5.3 6.4 15.2 8.3 New Connection Fee (US$) 1* 129 2 29 53 146 13 3 21 212 Revenue Collection Efficiency (%) 100 94.8 70.4 82 100 99.8 98 54 70 87.7 Capital Expenditure/ Connection (US$) 176 8 78 140 72 115 47 7 17 88
* Connection fee in Chengdu is in US$ per square meter of floor area.
Kuala
Lumpur Manila Osaka Phnom Penh Seoul Shanghai Tashkent Ulaanbaatar Vientiane
Average(18)
Production/Population (m3/d/c) 0.44 0.56 0.53 0.23 0.39 0.47 1.04 0.44 0.27 0.40 Water Coverage (%) 100 58 100 84 100 100 99 49 63 79 Sewerage Access (%) 80 7 100 41 98 68 85 48 0 51 24-hour Availability (%) 100 88 100 100 100 100 100 48 50 67 Consumption/Capita (l/c/d) 132 127 263 104 205 251 328 278 110 165 Nonrevenue Water (%) 43 62 7 26 25 17 27 36 28 34 Average Tariff (US$) 0.30 0.14 1.37 0.24 0.49 0.10 0.01 0.19 0.04 0.24 Connections Metered (%) 100.0 100.0 100.0 100.0 99.8 100.0 8.3 80.3 100.0 76.5 Working Ratio 1.34 1.22 1.08 0.46 0.57 1.08 0.47 0.83 1.1 1.05 Staff/1,000 Connections (ratio) 1.4 4.4 1.7 5.4 1.4 5.7 5.6 823.3 10.5 8.3 New Connection Fee (US$) 13 107 1506 87 850 83 32 454 74 212 Revenue Collection Efficiency (%) 95 97.3 87.2 99.7 93 93.5 76.8 90 76.8 87.7 Capital Expenditure/ Connection (US$) 173 18 224 203 100 38 3 1,978 47 88
____________________________________________________________________________________________________ 4 Water in Asian Cities
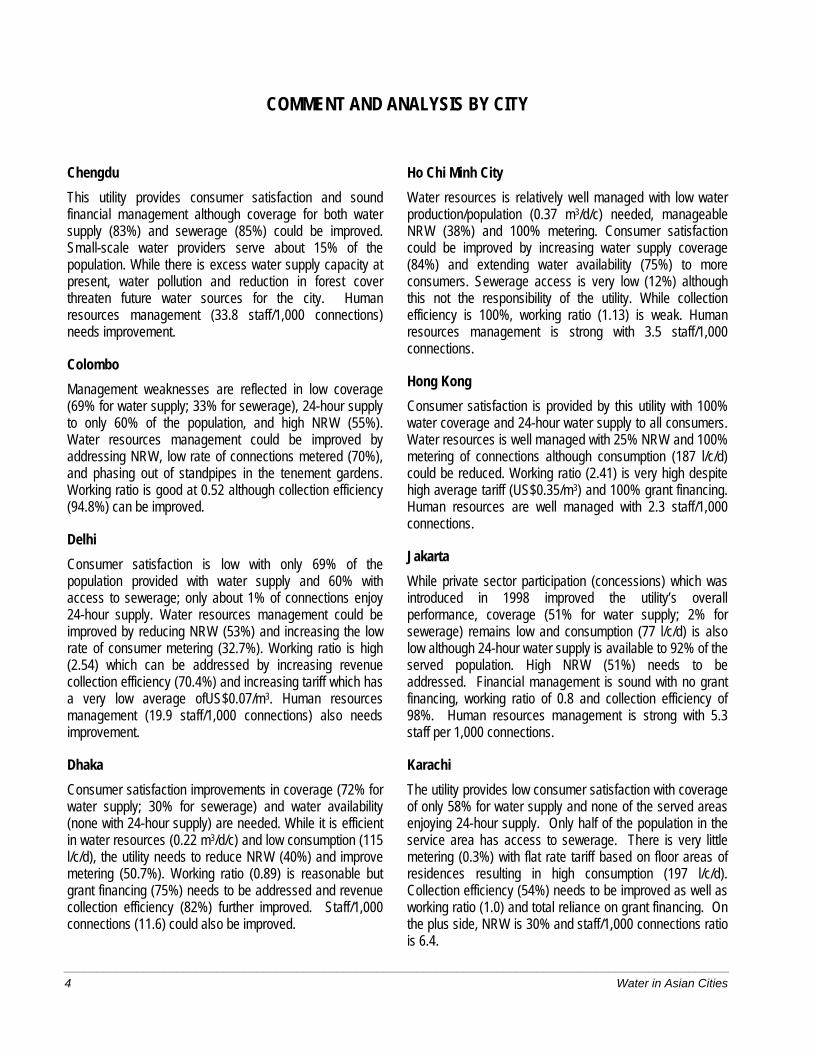
COMMENT AND ANALYSIS BY CITY
Chengdu This utility provides consumer satisfaction and sound financial management although coverage for both water supply (83%) and sewerage (85%) could be improved. Small-scale water providers serve about 15% of the population. While there is excess water supply capacity at present, water pollution and reduction in forest cover threaten future water sources for the city. Human resources management (33.8 staff/1,000 connections) needs improvement.
Colombo Management weaknesses are reflected in low coverage (69% for water supply; 33% for sewerage), 24-hour supply to only 60% of the population, and high NRW (55%). Water resources management could be improved by addressing NRW, low rate of connections metered (70%), and phasing out of standpipes in the tenement gardens. Working ratio is good at 0.52 although collection efficiency (94.8%) can be improved.
Delhi Consumer satisfaction is low with only 69% of the population provided with water supply and 60% with access to sewerage; only about 1% of connections enjoy 24-hour supply. Water resources management could be improved by reducing NRW (53%) and increasing the low rate of consumer metering (32.7%). Working ratio is high (2.54) which can be addressed by increasing revenue collection efficiency (70.4%) and increasing tariff which has a very low average ofUS$0.07/m3. Human resources management (19.9 staff/1,000 connections) also needs improvement.
Dhaka Consumer satisfaction improvements in coverage (72% for water supply; 30% for sewerage) and water availability (none with 24-hour supply) are needed. While it is efficient in water resources (0.22 m3/d/c) and low consumption (115 l/c/d), the utility needs to reduce NRW (40%) and improve metering (50.7%). Working ratio (0.89) is reasonable but grant financing (75%) needs to be addressed and revenue collection efficiency (82%) further improved. Staff/1,000 connections (11.6) could also be improved.
Ho Chi Minh City Water resources is relatively well managed with low water production/population (0.37 m3/d/c) needed, manageable NRW (38%) and 100% metering. Consumer satisfaction could be improved by increasing water supply coverage (84%) and extending water availability (75%) to more consumers. Sewerage access is very low (12%) although this not the responsibility of the utility. While collection efficiency is 100%, working ratio (1.13) is weak. Human resources management is strong with 3.5 staff/1,000 connections.
Hong Kong Consumer satisfaction is provided by this utility with 100% water coverage and 24-hour water supply to all consumers. Water resources is well managed with 25% NRW and 100% metering of connections although consumption (187 l/c/d) could be reduced. Working ratio (2.41) is very high despite high average tariff (US$0.35/m3) and 100% grant financing. Human resources are well managed with 2.3 staff/1,000 connections.
Jakarta While private sector participation (concessions) which was introduced in 1998 improved the utility’s overall performance, coverage (51% for water supply; 2% for sewerage) remains low and consumption (77 l/c/d) is also low although 24-hour water supply is available to 92% of the served population. High NRW (51%) needs to be addressed. Financial management is sound with no grant financing, working ratio of 0.8 and collection efficiency of 98%. Human resources management is strong with 5.3 staff per 1,000 connections.
Karachi The utility provides low consumer satisfaction with coverage of only 58% for water supply and none of the served areas enjoying 24-hour supply. Only half of the population in the service area has access to sewerage. There is very little metering (0.3%) with flat rate tariff based on floor areas of residences resulting in high consumption (197 l/c/d). Collection efficiency (54%) needs to be improved as well as working ratio (1.0) and total reliance on grant financing. On the plus side, NRW is 30% and staff/1,000 connections ratio is 6.4.
____________________________________________________________________________________________________ Comment and Analysis by City 5
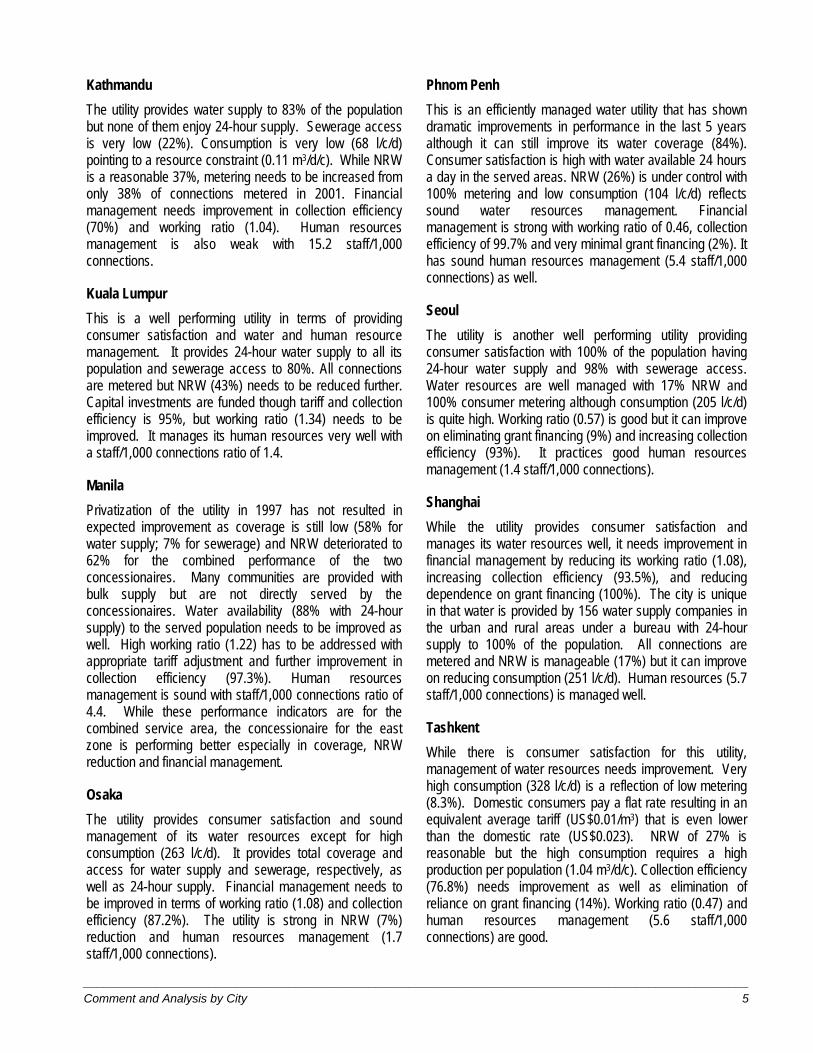
Kathmandu The utility provides water supply to 83% of the population but none of them enjoy 24-hour supply. Sewerage access is very low (22%). Consumption is very low (68 l/c/d) pointing to a resource constraint (0.11 m3/d/c). While NRW is a reasonable 37%, metering needs to be increased from only 38% of connections metered in 2001. Financial management needs improvement in collection efficiency (70%) and working ratio (1.04). Human resources management is also weak with 15.2 staff/1,000 connections.
Kuala Lumpur This is a well performing utility in terms of providing consumer satisfaction and water and human resource management. It provides 24-hour water supply to all its population and sewerage access to 80%. All connections are metered but NRW (43%) needs to be reduced further. Capital investments are funded though tariff and collection efficiency is 95%, but working ratio (1.34) needs to be improved. It manages its human resources very well with a staff/1,000 connections ratio of 1.4.
Manila Privatization of the utility in 1997 has not resulted in expected improvement as coverage is still low (58% for water supply; 7% for sewerage) and NRW deteriorated to 62% for the combined performance of the two concessionaires. Many communities are provided with bulk supply but are not directly served by the concessionaires. Water availability (88% with 24-hour supply) to the served population needs to be improved as well. High working ratio (1.22) has to be addressed with appropriate tariff adjustment and further improvement in collection efficiency (97.3%). Human resources management is sound with staff/1,000 connections ratio of 4.4. While these performance indicators are for the combined service area, the concessionaire for the east zone is performing better especially in coverage, NRW reduction and financial management.
Osaka The utility provides consumer satisfaction and sound management of its water resources except for high consumption (263 l/c/d). It provides total coverage and access for water supply and sewerage, respectively, as well as 24-hour supply. Financial management needs to be improved in terms of working ratio (1.08) and collection efficiency (87.2%). The utility is strong in NRW (7%) reduction and human resources management (1.7 staff/1,000 connections).
Phnom Penh This is an efficiently managed water utility that has shown dramatic improvements in performance in the last 5 years although it can still improve its water coverage (84%). Consumer satisfaction is high with water available 24 hours a day in the served areas. NRW (26%) is under control with 100% metering and low consumption (104 l/c/d) reflects sound water resources management. Financial management is strong with working ratio of 0.46, collection efficiency of 99.7% and very minimal grant financing (2%). It has sound human resources management (5.4 staff/1,000 connections) as well.
Seoul The utility is another well performing utility providing consumer satisfaction with 100% of the population having 24-hour water supply and 98% with sewerage access. Water resources are well managed with 17% NRW and 100% consumer metering although consumption (205 l/c/d) is quite high. Working ratio (0.57) is good but it can improve on eliminating grant financing (9%) and increasing collection efficiency (93%). It practices good human resources management (1.4 staff/1,000 connections).
Shanghai While the utility provides consumer satisfaction and manages its water resources well, it needs improvement in financial management by reducing its working ratio (1.08), increasing collection efficiency (93.5%), and reducing dependence on grant financing (100%). The city is unique in that water is provided by 156 water supply companies in the urban and rural areas under a bureau with 24-hour supply to 100% of the population. All connections are metered and NRW is manageable (17%) but it can improve on reducing consumption (251 l/c/d). Human resources (5.7 staff/1,000 connections) is managed well.
Tashkent While there is consumer satisfaction for this utility, management of water resources needs improvement. Very high consumption (328 l/c/d) is a reflection of low metering (8.3%). Domestic consumers pay a flat rate resulting in an equivalent average tariff (US$0.01/m3) that is even lower than the domestic rate (US$0.023). NRW of 27% is reasonable but the high consumption requires a high production per population (1.04 m3/d/c). Collection efficiency (76.8%) needs improvement as well as elimination of reliance on grant financing (14%). Working ratio (0.47) and human resources management (5.6 staff/1,000 connections) are good.
____________________________________________________________________________________________________ 6 Water in Asian Cities
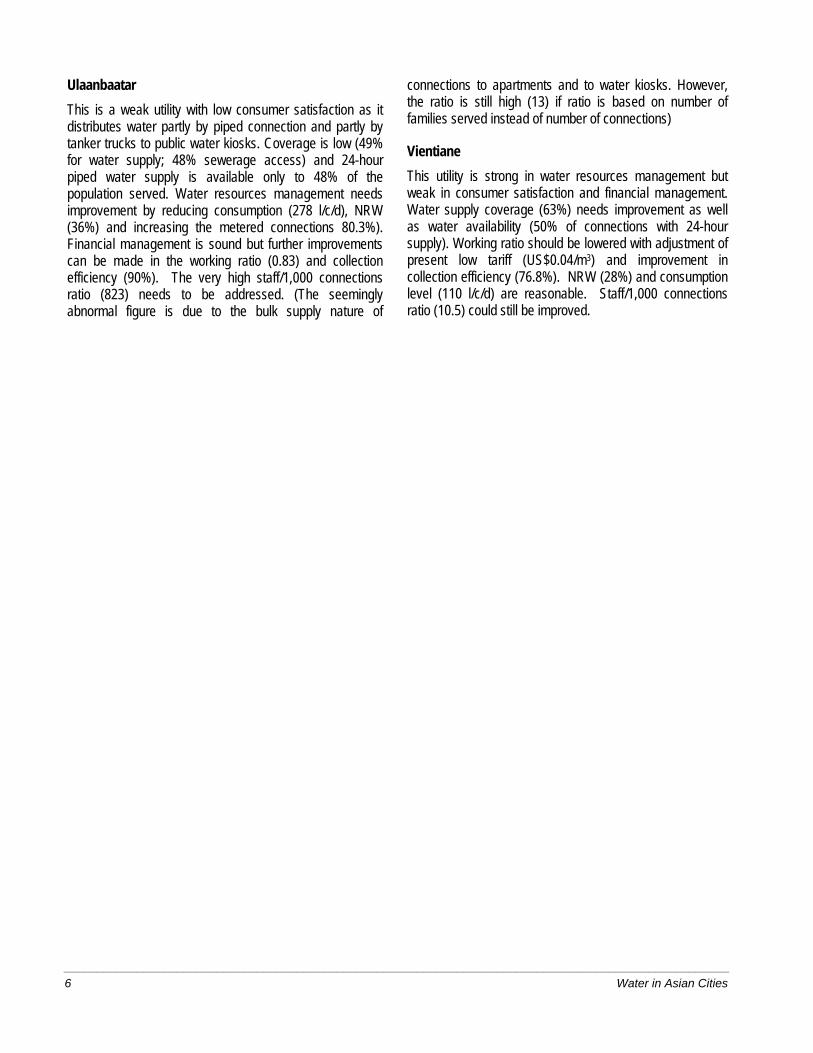
Ulaanbaatar This is a weak utility with low consumer satisfaction as it distributes water partly by piped connection and partly by tanker trucks to public water kiosks. Coverage is low (49% for water supply; 48% sewerage access) and 24-hour piped water supply is available only to 48% of the population served. Water resources management needs improvement by reducing consumption (278 l/c/d), NRW (36%) and increasing the metered connections 80.3%). Financial management is sound but further improvements can be made in the working ratio (0.83) and collection efficiency (90%). The very high staff/1,000 connections ratio (823) needs to be addressed. (The seemingly abnormal figure is due to the bulk supply nature of
connections to apartments and to water kiosks. However, the ratio is still high (13) if ratio is based on number of families served instead of number of connections)
Vientiane This utility is strong in water resources management but weak in consumer satisfaction and financial management. Water supply coverage (63%) needs improvement as well as water availability (50% of connections with 24-hour supply). Working ratio should be lowered with adjustment of present low tariff (US$0.04/m3) and improvement in collection efficiency (76.8%). NRW (28%) and consumption level (110 l/c/d) are reasonable. Staff/1,000 connections ratio (10.5) could still be improved.
____________________________________________________________________________________________________ Comment and Analysis by Parameter 7
COMMENT AND ANALYSIS BY PARAMETER
Production per Person (Average – 0.40 m3/d/person) This parameter measures overall efficiency of water resource use. The very low figures of Kathmandu (0.11), Dhaka (0.22), and Phnom Penh (0.23) reflect a shortage of water resources. High figures reflect either high levels of NRW, such as in Colombo (0.48) and Manila (0.56), an abundance of water resources for nondomestic purposes as in Tashkent (1.04), or a high demand (consumption) as in Osaka (0.53).
Water Supply Coverage (Average – 79%) Out of the 18 utilities, 5 indicate 100% coverage and another has 99%. Ulaanbaatar (49%), Jakarta (51%), Karachi (58%), and Manila (58%) have the lowest coverage because of shortage of water resources for development. It is of some concern that about two thirds of the utilities studied show a strong need to improve coverage. Apart from development of water resources, more effort needs to be put into advocacy and public awareness to increase willingness to pay for new services.
Sewerage Access (Average – 51%) Sewerage access has always lagged behind water supply development universally. It is nevertheless a very important complement to water supply as it impacts on the quality of groundwater and surface water sources. Of the 18 utilities studied, only 2 have 100% coverage and another has 98%. About half the cities have less than 50% of the population enjoying access to sewerage. The implications for pollution of water sources need to be addressed.
24-hour Water Availability (Average – 67%) Only 8 of the 18 utilities provide a 24-hour water supply to 100% of those connected. This is of some concern, because it is not only a risk to health, but also affects metering and ability to reduce NRW levels. Dhaka, Kathmandu, and Karachi have no areas with 24-hour supply. Delhi can provide continuous supply to only 1% of its service population. Full metering combined with adequate tariffs can help achieve 100% coverage with 24-hour water supply.
Consumption (Average – 165 l/c/d) There has been considerable debate over the amount of water people need for domestic purposes and the amount they use. Often it has been stated that for religious or other
reasons, people in hot tropical countries need to bathe several times per day and they are not wasting water. Be that as it may, of necessity, people make do on far less when water is in short supply. Some areas of low consumption are Kathmandu (68 l/c/d) and Jakarta (77 l/c/d). By contrast, there are a number of high consumption areas, such as Tashkent (328 l/c/d), Ulaanbaatar (278 l/c/d), Osaka (263 l/c/d), and Shanghai (251 l/c/d). One can reflect that Hong Kong (187 l/c/d), Ho Chi Minh (167 l/c/d), Chengdu (138 l/c/d), Kuala Lumpur (132 l/c/d), and Manila (127 l/c/d) get by on much less.
Nonrevenue Water (Average – 34%) The worst examples of NRW are Manila (62%), Colombo (55%), Delhi (53%), and Jakarta (51%). The best examples are Osaka (7%), Shanghai (17%), Chengdu (18%), Seoul (25%), and Hong Kong (25%). Given the shortage of water resources, low coverage and low water availability, more must be done by most utilities to reduce NRW levels. In order of priority, this must be elimination of public taps, 100% metering of production and consumption, repair of visible leaks, elimination of illegal connections, and identification and repair of invisible leaks. Strong leadership and disciplined management are essential.
Average Tariff (Average – US$0.24/m3) Among the 18 utilities, the average tariff ranges from lows of US$0.01/m3 (Tashkent), US$0.04/m3 (Vientiane), US$0.06/m3 (Dhaka), and US$0.07/m3 (Karachi and Delhi) to highs of US$1.37/m3 (Osaka), US$0.49/m3 (Seoul), and US$0.35/m3 (Hong Kong). The average tariff is a good measure of the financial discipline of a utility and its autonomy to cover operational costs with revenues from tariffs. The average tariff must be the main tool in imposing demand management on the consumer public and for financial sustainability of the utility.
Connections Metered (Average – 76.5%) This is perhaps the single most important area requiring improvement among water utilities. More than half the utilities do not have 100% metering of consumption (let alone regular replacement of meters). Five have incomplete metering, three some metering, and two very little. If one assumes only 60% of meters are functioning correctly (an optimistic assumption) then less than 50% of all connections are adequately metered. Metering is required to fully account for water production and consumption as a first step in reducing NRW.
___________________________________________________________________________________________________ 8 Water in Asian Cities
Working Ratio (Average – 1.05) A low operating ratio means revenues from tariffs cover the operation and maintenance (O&M) costs comfortably. A ratio above one means they do not cover O&M costs. Nevertheless, some utilities include depreciation and debt service in the O&M costs and others do not, so it is not always fair to compare two utilities on this parameter. Nine of the 18 utilities meet O&M costs. The worst performers are Delhi (2.45), Hong Kong (2.41), Kuala Lumpur (1.34), and Manila (1.22), while the best are Phnom Penh (0.46), Tashkent (0.47), Chengdu (0.50), Colombo (0.52), and Seoul (0.57).
Staff/1,000 Connections Ratio (Average – 8.3) This ratio varies from lows of 1.4 (Kuala Lumpur and Seoul), 1.7 (Osaka), and 2.3 (Hong Kong) to highs of 33.8 (Chengdu), 19.9 (Delhi), and 15.2 (Kathmandu). Ulaanbaatar at 823.3 is exceptionally high because of the mainly bulk supplies. Some utilities that have low ratios contract out a number of their services, such as billing and collection and leak repairs. High staff numbers indicate low efficiency.
New Connection Fee (Average – US$212) Despite much talk, little appears to have been done to assist lower-income people to facilitate taking up a direct connection to their households. Many of those not connected in cities are low-income families who pay much more to small-scale water providers or vendors. Only a handful of utilities have introduced staggered payment of the connection fee—a small deposit and the balance in installments with water consumption charges over a period of 12 or more months. Some house connection fees (Osaka US$1,506, Seoul US$850, and Ulaanbaatar US$454) are extremely high. The continued use of public taps and high connection fees are certainly significant reasons for the low coverage rates in many utilities.
Revenue Collection Efficiency (Average – 87.7%) This parameter, together with average tariff and working ratio, impacts on the financial health of a utility. Only 7 utilities reported collection efficiencies of 95% or better—
100% (Ho Chi Minh and Chengdu); Hong Kong (99.8%); Phnom Penh (99.7%); Jakarta (98%); Manila (97.3%); and Kuala Lumpur (95%). Low efficiencies reported were 54% (Karachi), 70% (Kathmandu), 70.4% (Delhi), and 76.8% (Tashkent and Vientiane). Collection efforts can be supplemented with awareness campaigns to encourage consumers to pay their bills on time.
Capital Expenditure per Connection (Average – US$88) It is certainly significant that almost half of the utilities are spending more than US$100/connection per year on capital improvements. Given that coverage is generally inadequate, significantly more funds are needed for capital development to overcome the present situation, in which utilities are always striving try to satisfy existing demand. Greater advocacy for the sector must be combined with more public awareness.
General Conclusions
The analysis of data indicates that the utilities studied are improving in terms of customer satisfaction and water and human resources management, but they need to arrest the ongoing deterioration in financial management. Gains in coverage are minimal and NRW levels are high. Attention needs to be focused on the following:
• advocacy for more investment in the sector and greater coverage,
• 24-hour water supply, • demand management by pricing and public
awareness, • 100% metering, • phasing out of public taps, • reduction of NRW levels, • reduction of staffing levels, • reduction of grant financing, • installments for payment of connection fees, and • higher domestic tariffs and improved collection
efficiency.
_____________________________________________________________________________________________________ Changes for 15 Utilities from Second Data Book to 2001 9
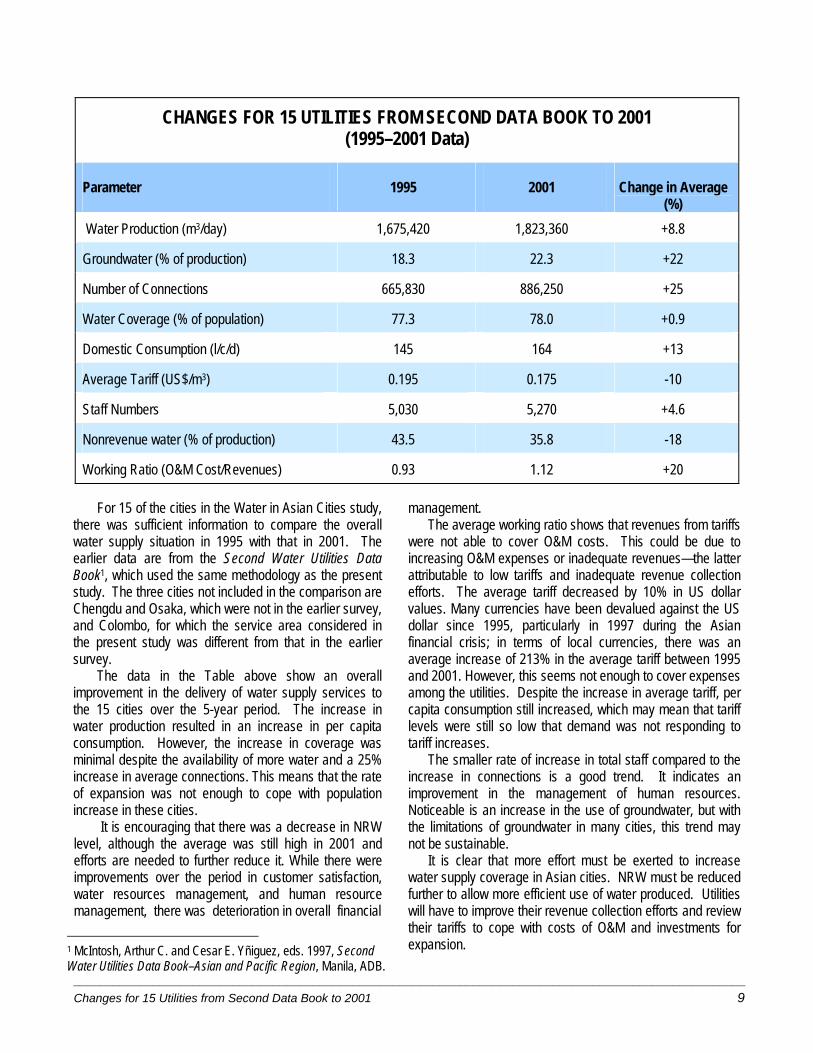
CHANGES FOR 15 UTILITIES FROM SECOND DATA BOOK TO 2001 (1995–2001 Data)
Parameter 1995 2001 Change in Average (%)
Water Production (m3/day) 1,675,420 1,823,360 +8.8
Groundwater (% of production) 18.3 22.3 +22
Number of Connections 665,830 886,250 +25
Water Coverage (% of population) 77.3 78.0 +0.9
Domestic Consumption (l/c/d) 145 164 +13
Average Tariff (US$/m3) 0.195 0.175 -10
Staff Numbers 5,030 5,270 +4.6
Nonrevenue water (% of production) 43.5 35.8 -18
Working Ratio (O&M Cost/Revenues) 0.93 1.12 +20
For 15 of the cities in the Water in Asian Cities study, there was sufficient information to compare the overall water supply situation in 1995 with that in 2001. The earlier data are from the Second Water Utilities Data Book1, which used the same methodology as the present study. The three cities not included in the comparison are Chengdu and Osaka, which were not in the earlier survey, and Colombo, for which the service area considered in the present study was different from that in the earlier survey.
The data in the Table above show an overall improvement in the delivery of water supply services to the 15 cities over the 5-year period. The increase in water production resulted in an increase in per capita consumption. However, the increase in coverage was minimal despite the availability of more water and a 25% increase in average connections. This means that the rate of expansion was not enough to cope with population increase in these cities.
It is encouraging that there was a decrease in NRW level, although the average was still high in 2001 and efforts are needed to further reduce it. While there were improvements over the period in customer satisfaction, water resources management, and human resource management, there was deterioration in overall financial
1 McIntosh, Arthur C. and Cesar E. Yñiguez, eds. 1997, Second Water Utilities Data Book–Asian and Pacific Region, Manila, ADB.
management. The average working ratio shows that revenues from tariffs
were not able to cover O&M costs. This could be due to increasing O&M expenses or inadequate revenues—the latter attributable to low tariffs and inadequate revenue collection efforts. The average tariff decreased by 10% in US dollar values. Many currencies have been devalued against the US dollar since 1995, particularly in 1997 during the Asian financial crisis; in terms of local currencies, there was an average increase of 213% in the average tariff between 1995 and 2001. However, this seems not enough to cover expenses among the utilities. Despite the increase in average tariff, per capita consumption still increased, which may mean that tariff levels were still so low that demand was not responding to tariff increases.
The smaller rate of increase in total staff compared to the increase in connections is a good trend. It indicates an improvement in the management of human resources. Noticeable is an increase in the use of groundwater, but with the limitations of groundwater in many cities, this trend may not be sustainable.
It is clear that more effort must be exerted to increase water supply coverage in Asian cities. NRW must be reduced further to allow more efficient use of water produced. Utilities will have to improve their revenue collection efforts and review their tariffs to cope with costs of O&M and investments for expansion.
VIEWS OF CIVIL SOCIETY ON CITY WATER SUPPLIES
The Regional Consultation Workshop on Water in Asian Cities – The Role of Civil Society was held at the Asian
Development Bank (ADB) in Manila on 14–16 October 2002. The purpose of the Workshop was to explore the role of civil society in developing water supply and sanitation services in Asian cities. There were 110 participants and observers from 18 countries in the region including representatives of nongovernment organizations (NGOs), development institutions, international and regional organizations, and academe; and journalists, private contractors, and consultants. Participants from the cities in the study were asked to submit a one-page overview before coming to the workshop.
The workshop discussions were based on the findings of the Study on Water in Asian Cities covering 18 cities in the
region, case studies of small-scale independent private water providers serving the urban poor in 8 of those cities, and the summary of the overviews from the civil society participants. Group discussions focused on identifying key issues and proposing ways and means of resolving them.
The main findings of the workshop, reflecting the views of civil society as articulated by the participants, were as follows:
Governance/Policy Development • There is an ongoing debate on the social versus economic good of water, which has major implications regarding
privatization. • Governance and tariffs are key issues; socially acceptable policies and regulations are essential. • Donors are working with local government units to provide local financing. Conservation/Water Demand Management • Rainwater harvesting is vital for the future sustainability of the cities. • There are success stories of vastly improved water coverage, establishment of continuous supply, and major reductions
in NRW, but discipline, leadership, and donor coordination are required for these to occur. • Demand-side management is very important. • Utilities should produce bottled water. • ADB evaluations show that direct connections, continuous water supply, and sanitation are essential to improve the
quality of life. Water and the Urban Poor • Take care of the poor and disadvantaged first through improved access to water services, specifically targeting the
desperately poor through needs mapping, etc. • Include women in access and distribution consultations. • Involve the poor in managing water services. • Civil society can give a voice to the poor. • Community participation is essential, including that of local government. • Flexibility and social recognition are required—there is no universal solution. Water Awareness and Education • All stakeholders need to raise their awareness and understanding of all the issues as well as the views of other
stakeholders. • NGO forums or city forums (coalitions of civil society groups including the private sector) should be used to improve
dialogue and lobbying. • Water and human values and culture are important; attitudes and values may have to change, overcome resistance to
change, and adopt value-based approaches to education. • Films are a powerful tool, but the message must be correct. • Journalist networks and the media can play an important role.
___________________________________________________________________________________________________ 10 Water in Asian Cities
___________________________________________________________________________________________________ Views of Civil Society on City Water Supplies 11
Private Sector Participation • Involve the private sector in the delivery of “Water for All” services. • Reassess the role of and partnerships with small-scale water providers, which already provide 20–50% of water in
many cities. • Human rights views on private sector participation conflict with access, private commodities, and the concept of making
a profit from water services. • Improve public utilities before embarking on PSP. • PSP is helping the poor and reducing connection fee obstacles. • Property titles are not required in order to provide water services. • Operators must have a social dimension—they need to involve customers. Tariffs • Full cost recovery is not impossible; demand management is required. • The rich and middle class receive subsidies, but not always the poor. • Consider subsidizing connection fees rather than the tariff.
Pollution Control and Sanitation • Standards and their enforcement are essential for good water quality. • Remove the biggest polluters from cities. • Watersheds need to be protected and a water levy imposed on users. • United Nations-Habitat emphasizes the key role of sanitation in achieving the Millennium Development Goals; also,
political awareness, demand management, capacity building, education, and a focus on the poor are critical.
Regional Profiles
2
63672 adb_Asian Cities chap pages.p65 1/19/04, 12:10 PM2
_____________________________________________________________________________________________________ Regional Profiles - INSTITUTIONS 15
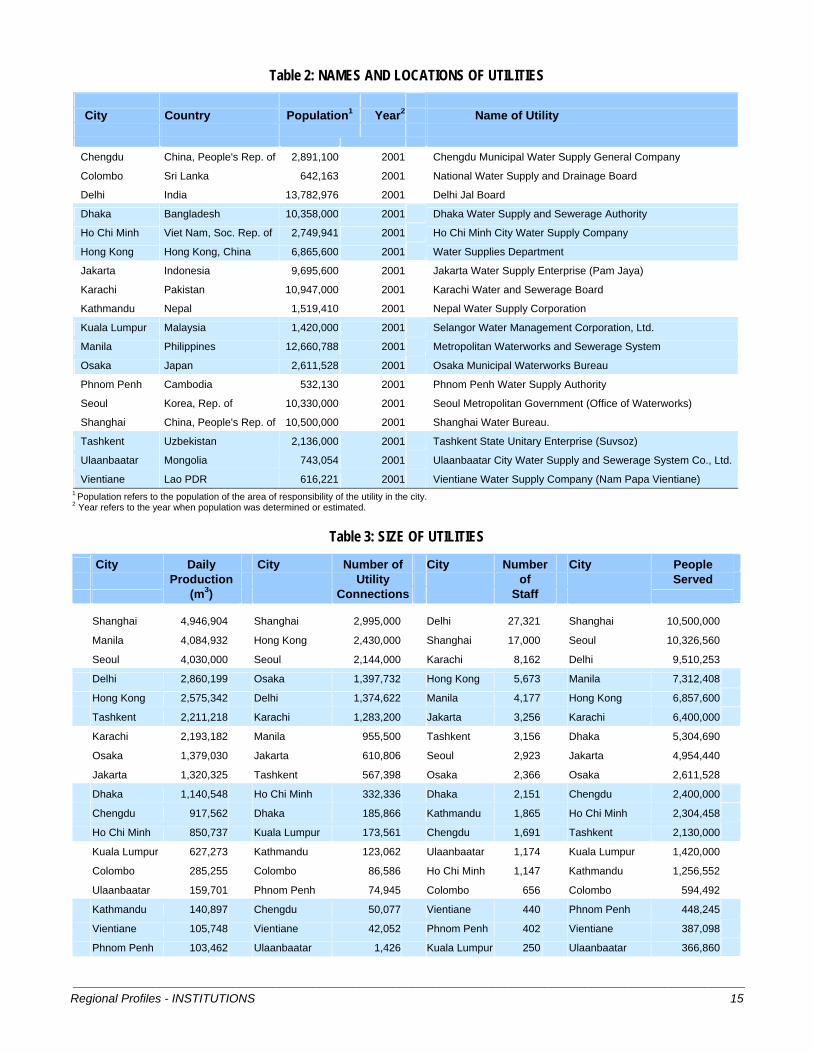
Table 2: NAMES AND LOCATIONS OF UTILITIES
City Country Population1 Year2 Name of Utility
Chengdu China, People's Rep. of 2,891,100 2001 Chengdu Municipal Water Supply General Company
Colombo Sri Lanka 642,163 2001 National Water Supply and Drainage Board
Delhi India 13,782,976 2001 Delhi Jal Board
Dhaka Bangladesh 10,358,000 2001 Dhaka Water Supply and Sewerage Authority
Ho Chi Minh Viet Nam, Soc. Rep. of 2,749,941 2001 Ho Chi Minh City Water Supply Company
Hong Kong Hong Kong, China 6,865,600 2001 Water Supplies Department
Jakarta Indonesia 9,695,600 2001 Jakarta Water Supply Enterprise (Pam Jaya)
Karachi Pakistan 10,947,000 2001 Karachi Water and Sewerage Board
Kathmandu Nepal 1,519,410 2001 Nepal Water Supply Corporation
Kuala Lumpur Malaysia 1,420,000 2001 Selangor Water Management Corporation, Ltd.
Manila Philippines 12,660,788 2001 Metropolitan Waterworks and Sewerage System
Osaka Japan 2,611,528 2001 Osaka Municipal Waterworks Bureau
Phnom Penh Cambodia 532,130 2001 Phnom Penh Water Supply Authority
Seoul Korea, Rep. of 10,330,000 2001 Seoul Metropolitan Government (Office of Waterworks)
Shanghai China, People's Rep. of 10,500,000 2001 Shanghai Water Bureau.
Tashkent Uzbekistan 2,136,000 2001 Tashkent State Unitary Enterprise (Suvsoz)
Ulaanbaatar Mongolia 743,054 2001 Ulaanbaatar City Water Supply and Sewerage System Co., Ltd.
Vientiane Lao PDR 616,221 2001 Vientiane Water Supply Company (Nam Papa Vientiane) 1 Population refers to the population of the area of responsibility of the utility in the city. 2 Year refers to the year when population was determined or estimated.
Table 3: SIZE OF UTILITIES
City Daily City Number of City Number City People Production Utility of Served (m3) Connections Staff
Shanghai 4,946,904 Shanghai 2,995,000 Delhi 27,321 Shanghai 10,500,000
Manila 4,084,932 Hong Kong 2,430,000 Shanghai 17,000 Seoul 10,326,560
Seoul 4,030,000 Seoul 2,144,000 Karachi 8,162 Delhi 9,510,253
Delhi 2,860,199 Osaka 1,397,732 Hong Kong 5,673 Manila 7,312,408
Hong Kong 2,575,342 Delhi 1,374,622 Manila 4,177 Hong Kong 6,857,600
Tashkent 2,211,218 Karachi 1,283,200 Jakarta 3,256 Karachi 6,400,000
Karachi 2,193,182 Manila 955,500 Tashkent 3,156 Dhaka 5,304,690
Osaka 1,379,030 Jakarta 610,806 Seoul 2,923 Jakarta 4,954,440
Jakarta 1,320,325 Tashkent 567,398 Osaka 2,366 Osaka 2,611,528
Dhaka 1,140,548 Ho Chi Minh 332,336 Dhaka 2,151 Chengdu 2,400,000
Chengdu 917,562 Dhaka 185,866 Kathmandu 1,865 Ho Chi Minh 2,304,458
Ho Chi Minh 850,737 Kuala Lumpur 173,561 Chengdu 1,691 Tashkent 2,130,000
Kuala Lumpur 627,273 Kathmandu 123,062 Ulaanbaatar 1,174 Kuala Lumpur 1,420,000
Colombo 285,255 Colombo 86,586 Ho Chi Minh 1,147 Kathmandu 1,256,552
Ulaanbaatar 159,701 Phnom Penh 74,945 Colombo 656 Colombo 594,492
Kathmandu 140,897 Chengdu 50,077 Vientiane 440 Phnom Penh 448,245
Vientiane 105,748 Vientiane 42,052 Phnom Penh 402 Vientiane 387,098
Phnom Penh 103,462 Ulaanbaatar 1,426 Kuala Lumpur 250 Ulaanbaatar 366,860
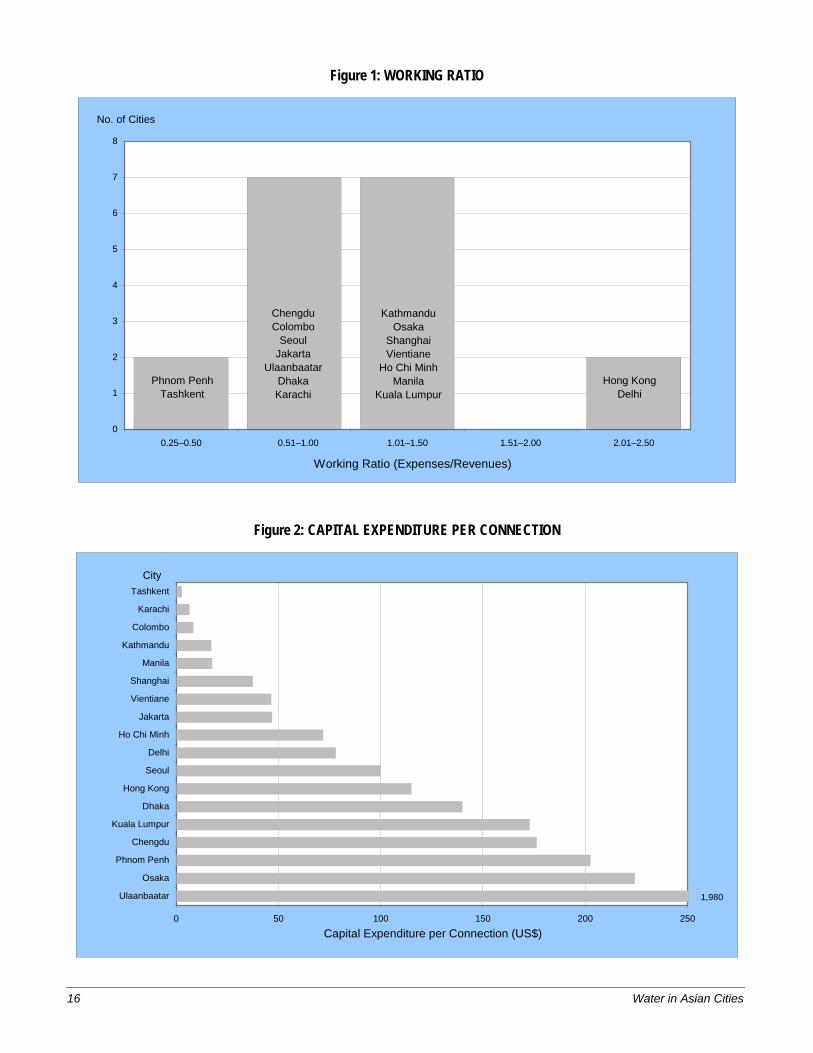
Figure 1: WORKING RATIO
0
1
2
3
4
5
6
7
8
0.25–0.50 0.51–1.00 1.01–1.50 1.51–2.00 2.01–2.50
ChengduColombo
SeoulJakarta
UlaanbaatarDhakaKarachi
Phnom PenhTashkent
KathmanduOsaka
ShanghaiVientiane
Ho Chi MinhManila
Kuala LumpurHong Kong
Delhi
Working Ratio (Expenses/Revenues)
No. of Cities
Figure 2: CAPITAL EXPENDITURE PER CONNECTION
0 50 100 150 200 250
Ulaanbaatar
Osaka
Phnom Penh
Chengdu
Kuala Lumpur
Dhaka
Hong Kong
Seoul
Delhi
Ho Chi Minh
Jakarta
Vientiane
Shanghai
Manila
Kathmandu
Colombo
Karachi
Tashkent
Capital Expenditure per Connection (US$)
City
1,980
______________________________________________________________________________________________________ 16 Water in Asian Cities
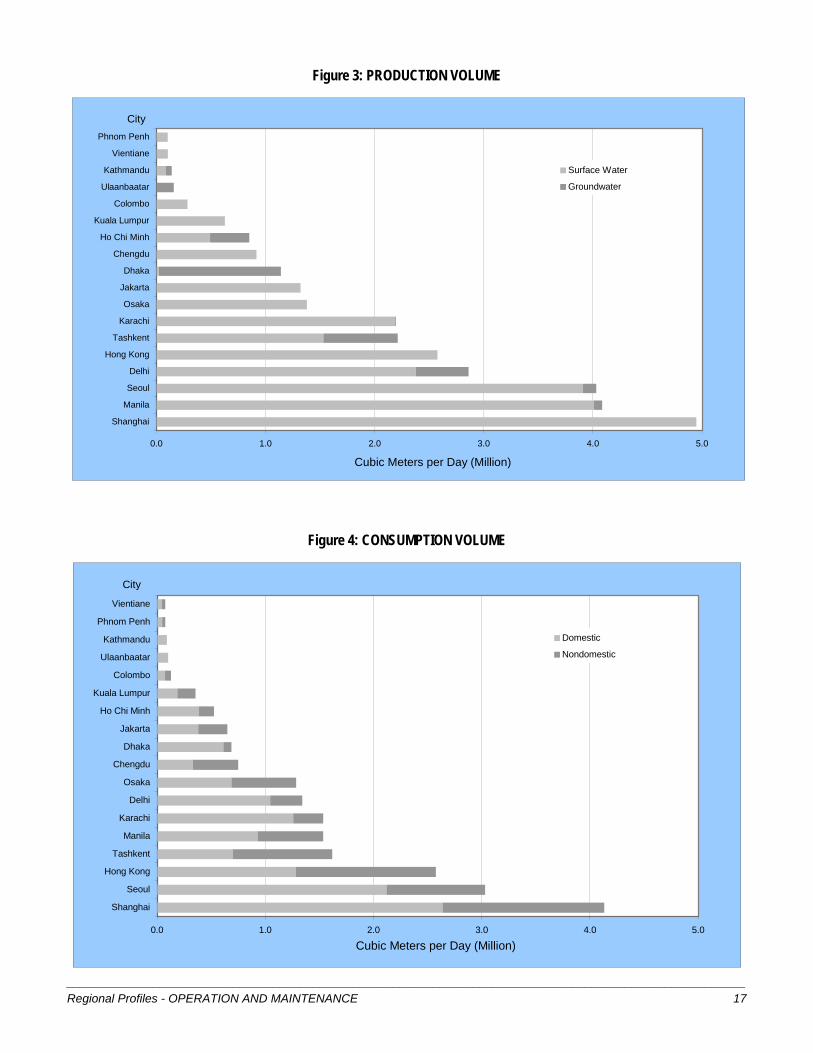
Figure 3: PRODUCTION VOLUME
0.0 1.0 2.0 3.0 4.0 5.0
Shanghai
Manila
Seoul
Delhi
Hong Kong
Tashkent
Karachi
Osaka
Jakarta
Dhaka
Chengdu
Ho Chi Minh
Kuala Lumpur
Colombo
Ulaanbaatar
Kathmandu
Vientiane
Phnom Penh
Surface Water
Groundwater
Cubic Meters per Day (Million)
City
Figure 4: CONSUMPTION VOLUME
______________________________________________________________________________________________________ Regional Profiles - OPERATION AND MAINTENANCE 17
0.0 1.0 2.0 3.0 4.0 5.0
Shanghai
Seoul
Hong Kong
Tashkent
Manila
Karachi
Delhi
Osaka
Chengdu
Dhaka
Jakarta
Ho Chi Minh
Kuala Lumpur
Colombo
Ulaanbaatar
Kathmandu
Phnom Penh
Vientiane
Domestic
Nondomestic
Cubic Meters per Day (Million)
City
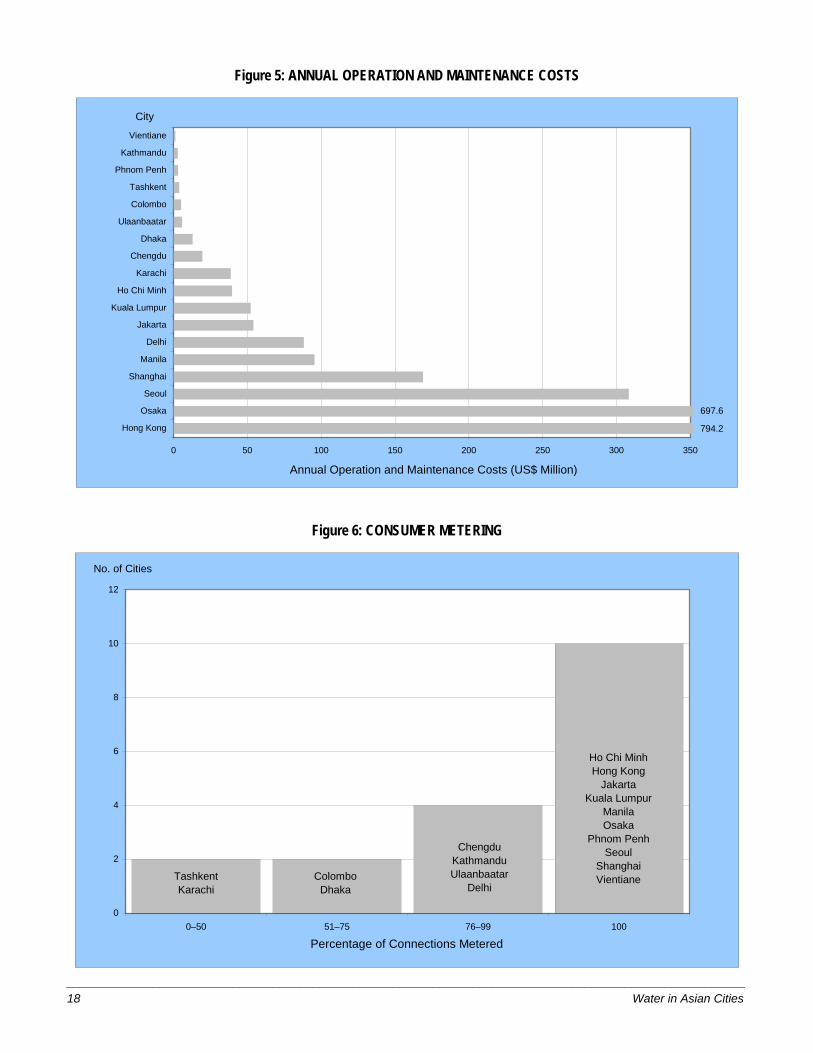
Figure 5: ANNUAL OPERATION AND MAINTENANCE COSTS
0 50 100 150 200 250 300 350
Hong Kong
Osaka
Seoul
Shanghai
Manila
Delhi
Jakarta
Kuala Lumpur
Ho Chi Minh
Karachi
Chengdu
Dhaka
Ulaanbaatar
Colombo
Tashkent
Phnom Penh
Kathmandu
Vientiane
Annual Operation and Maintenance Costs (US$ Million)
City
697.6
794.2
Figure 6: CONSUMER METERING
______________________________________________________________________________________________________ 18 Water in Asian Cities
0
2
4
6
8
10
12
0–50 51–75 76–99 100
No. of Cities
TashkentKarachi
ColomboDhaka
ChengduKathmanduUlaanbaatar
Delhi
Ho Chi MinhHong Kong
JakartaKuala Lumpur
ManilaOsaka
Phnom PenhSeoul
ShanghaiVientiane
Percentage of Connections Metered
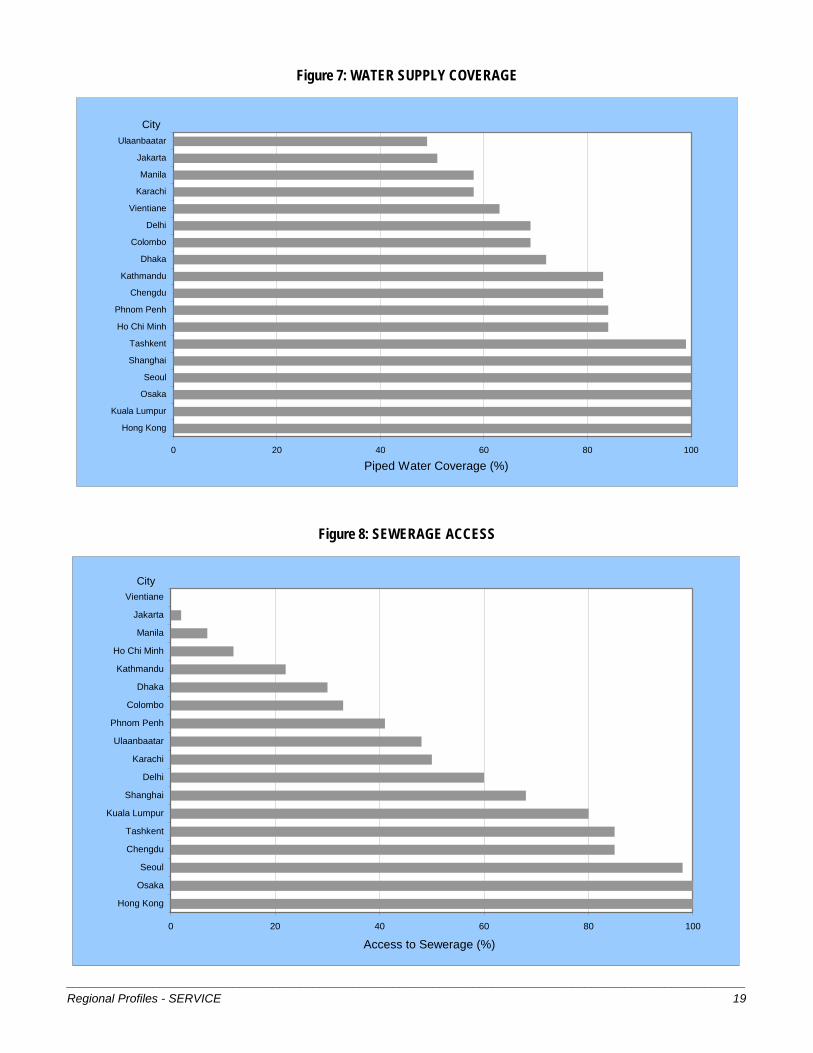
Figure 7: WATER SUPPLY COVERAGE
0 20 40 60 80 100
Hong Kong
Kuala Lumpur
Osaka
Seoul
Shanghai
Tashkent
Ho Chi Minh
Phnom Penh
Chengdu
Kathmandu
Dhaka
Colombo
Delhi
Vientiane
Karachi
Manila
Jakarta
Ulaanbaatar
Piped Water Coverage (%)
City
Figure 8: SEWERAGE ACCESS
______________________________________________________________________________________________________ Regional Profiles - SERVICE 19
0 20 40 60 80 100
Hong Kong
Osaka
Seoul
Chengdu
Tashkent
Kuala Lumpur
Shanghai
Delhi
Karachi
Ulaanbaatar
Phnom Penh
Colombo
Dhaka
Kathmandu
Ho Chi Minh
Manila
Jakarta
Vientiane
Access to Sewerage (%)
City
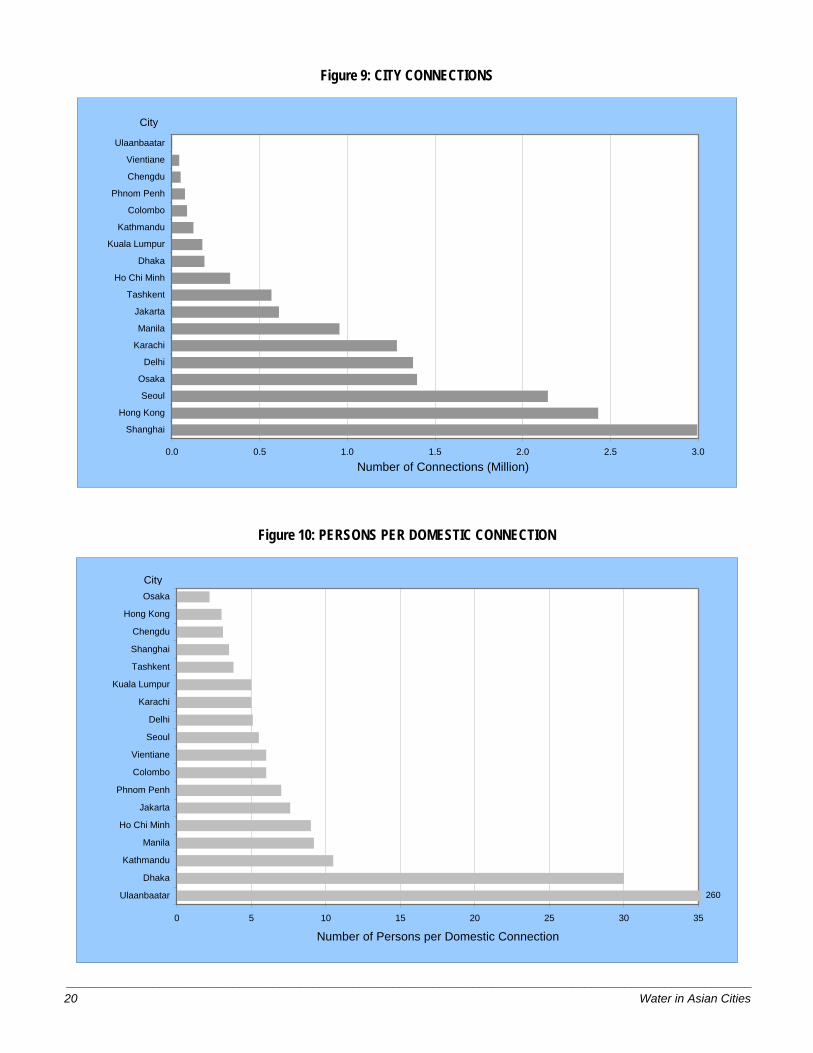
Figure 9: CITY CONNECTIONS
0.0 0.5 1.0 1.5 2.0 2.5 3.0
Shanghai
Hong Kong
Seoul
Osaka
Delhi
Karachi
Manila
Jakarta
Tashkent
Ho Chi Minh
Dhaka
Kuala Lumpur
Kathmandu
Colombo
Phnom Penh
Chengdu
Vientiane
Ulaanbaatar
Number of Connections (Million)
City
Figure 10: PERSONS PER DOMESTIC CONNECTION
0 5 10 15 20 25 30 35
Ulaanbaatar
Dhaka
Kathmandu
Manila
Ho Chi Minh
Jakarta
Phnom Penh
Colombo
Vientiane
Seoul
Delhi
Karachi
Kuala Lumpur
Tashkent
Shanghai
Chengdu
Hong Kong
Osaka
260
Number of Persons per Domestic Connection
City
_______________________________________________________________________________________________________
20 Water in Asian Cities
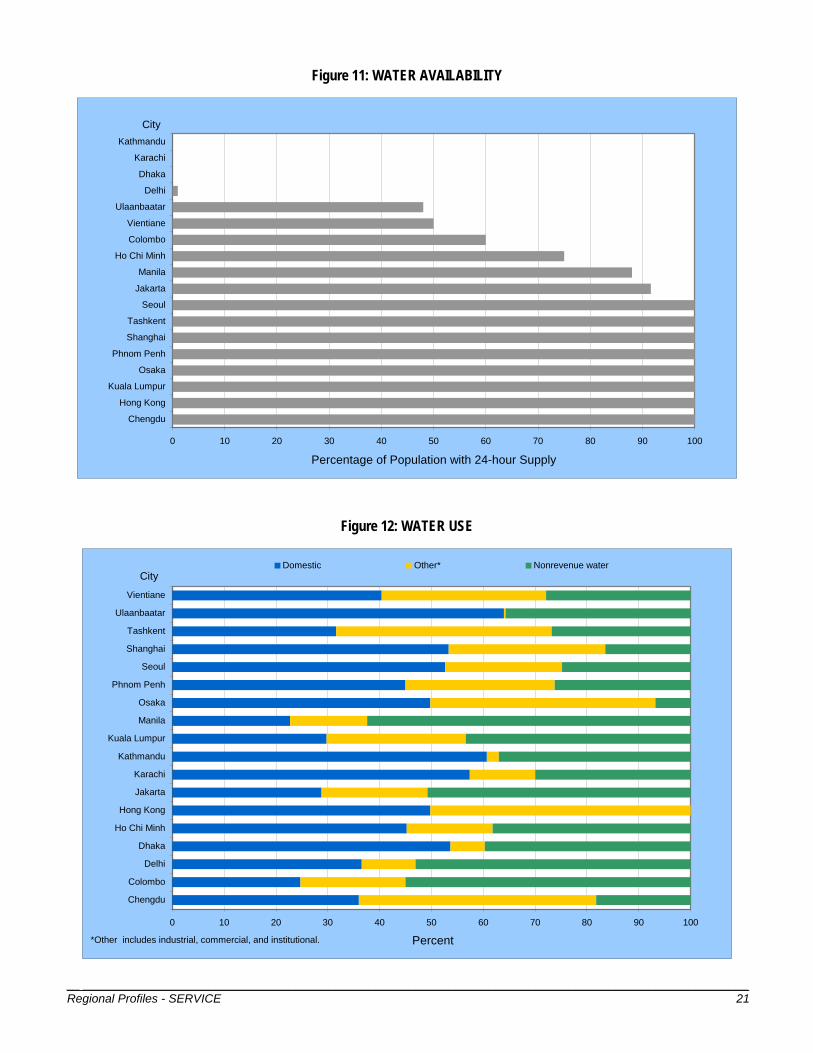
Figure 11: WATER AVAILABILITY
0 10 20 30 40 50 60 70 80 90 100
Chengdu
Hong Kong
Kuala Lumpur
Osaka
Phnom Penh
Shanghai
Tashkent
Seoul
Jakarta
Manila
Ho Chi Minh
Colombo
Vientiane
Ulaanbaatar
Delhi
Dhaka
Karachi
Kathmandu
Percentage of Population with 24-hour Supply
City
Figure 12: WATER USE
0 10 20 30 40 50 60 70 80 90 100
Chengdu
Colombo
Delhi
Dhaka
Ho Chi Minh
Hong Kong
Jakarta
Karachi
Kathmandu
Kuala Lumpur
Manila
Osaka
Phnom Penh
Seoul
Shanghai
Tashkent
Ulaanbaatar
Vientiane
Domestic Other* Nonrevenue water
*Other includes industrial, commercial, and institutional. Percent
City
__ ____________________________________________________________________________________________________ Regional Profiles - SERVICE 21
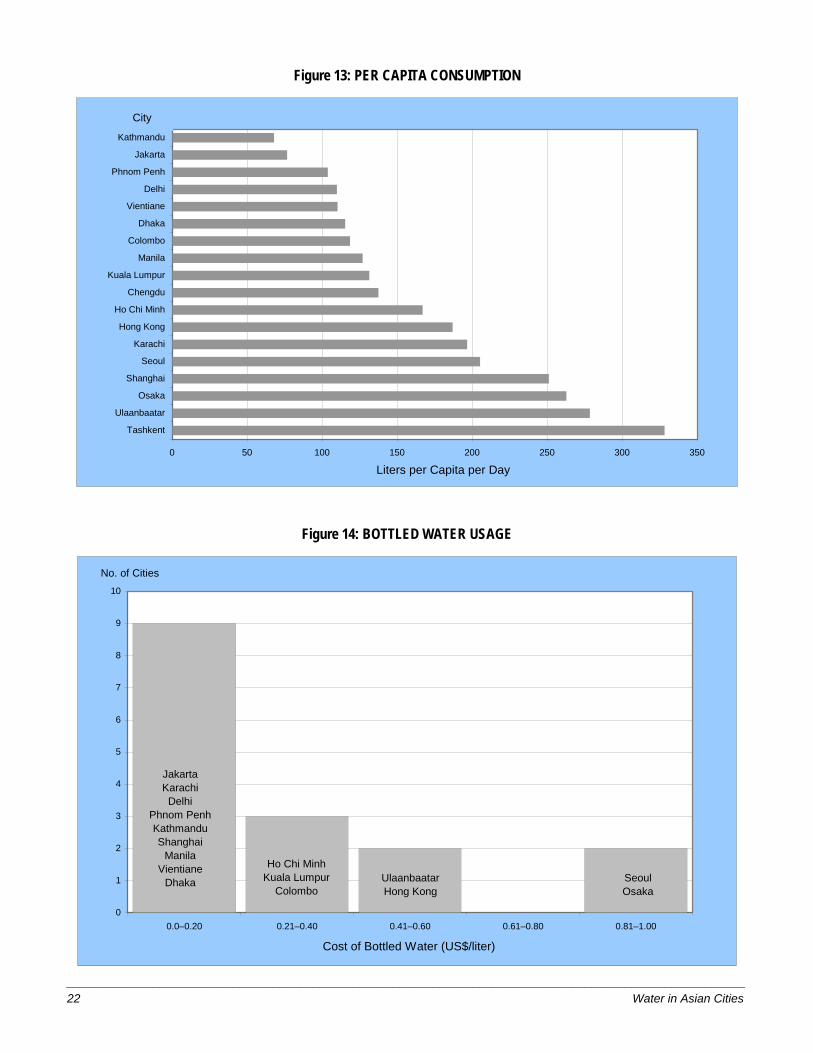
Figure 13: PER CAPITA CONSUMPTION
0 50 100 150 200 250 300 350
Tashkent
Ulaanbaatar
Osaka
Shanghai
Seoul
Karachi
Hong Kong
Ho Chi Minh
Chengdu
Kuala Lumpur
Manila
Colombo
Dhaka
Vientiane
Delhi
Phnom Penh
Jakarta
Kathmandu
City
Liters per Capita per Day
Figure 14: BOTTLED WATER USAGE
______________________________________________________________________________________________________ 22 Water in Asian Cities
0
1
2
3
4
5
6
7
8
9
10
0.0–0.20 0.21–0.40 0.41–0.60 0.61–0.80 0.81–1.00
JakartaKarachiDelhi
Phnom PenhKathmanduShanghai
ManilaVientiane
Dhaka
Ho Chi MinhKuala Lumpur
ColomboUlaanbaatarHong Kong
Seoul Osaka
No. of Cities
Cost of Bottled Water (US$/liter)
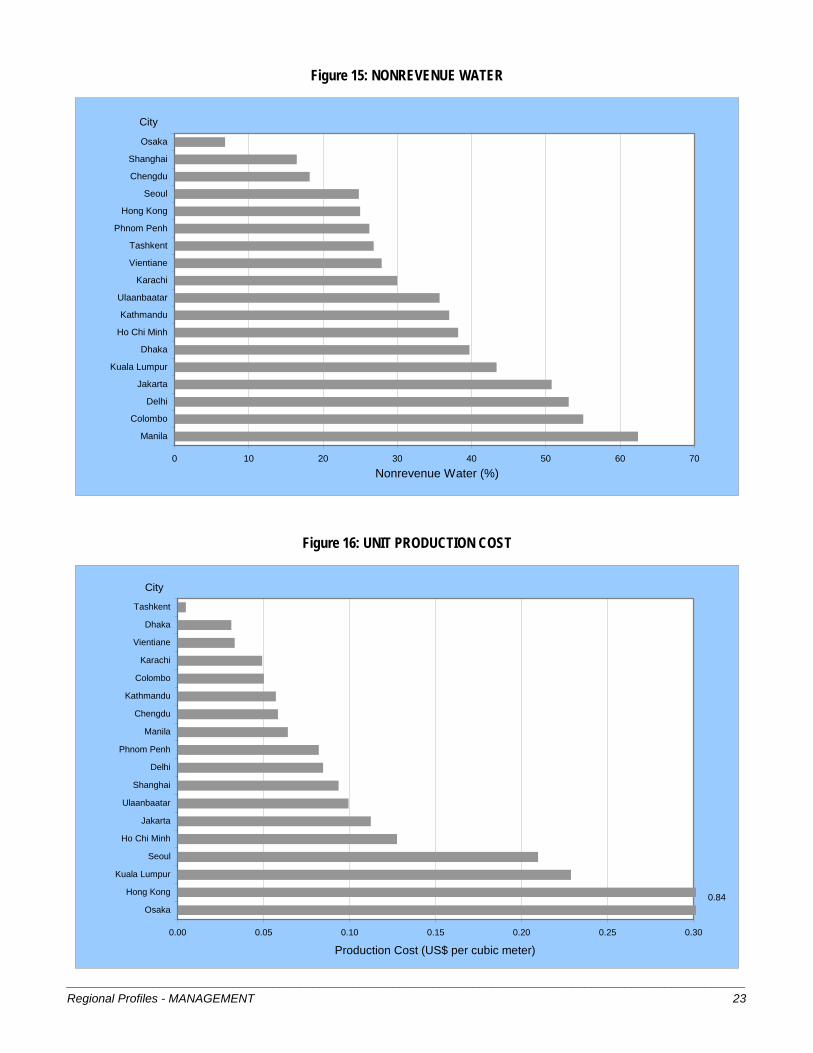
Figure 15: NONREVENUE WATER
0 10 20 30 40 50 60 70
Manila
Colombo
Delhi
Jakarta
Kuala Lumpur
Dhaka
Ho Chi Minh
Kathmandu
Ulaanbaatar
Karachi
Vientiane
Tashkent
Phnom Penh
Hong Kong
Seoul
Chengdu
Shanghai
Osaka
Nonrevenue Water (%)
City
Figure 16: UNIT PRODUCTION COST
______________________________________________________________________________________________________ Regional Profiles - MANAGEMENT 23
0.00 0.05 0.10 0.15 0.20 0.25 0.30
Osaka
Hong Kong
Kuala Lumpur
Seoul
Ho Chi Minh
Jakarta
Ulaanbaatar
Shanghai
Delhi
Phnom Penh
Manila
Chengdu
Kathmandu
Colombo
Karachi
Vientiane
Dhaka
Tashkent
Production Cost (US$ per cubic meter)
City
0.84
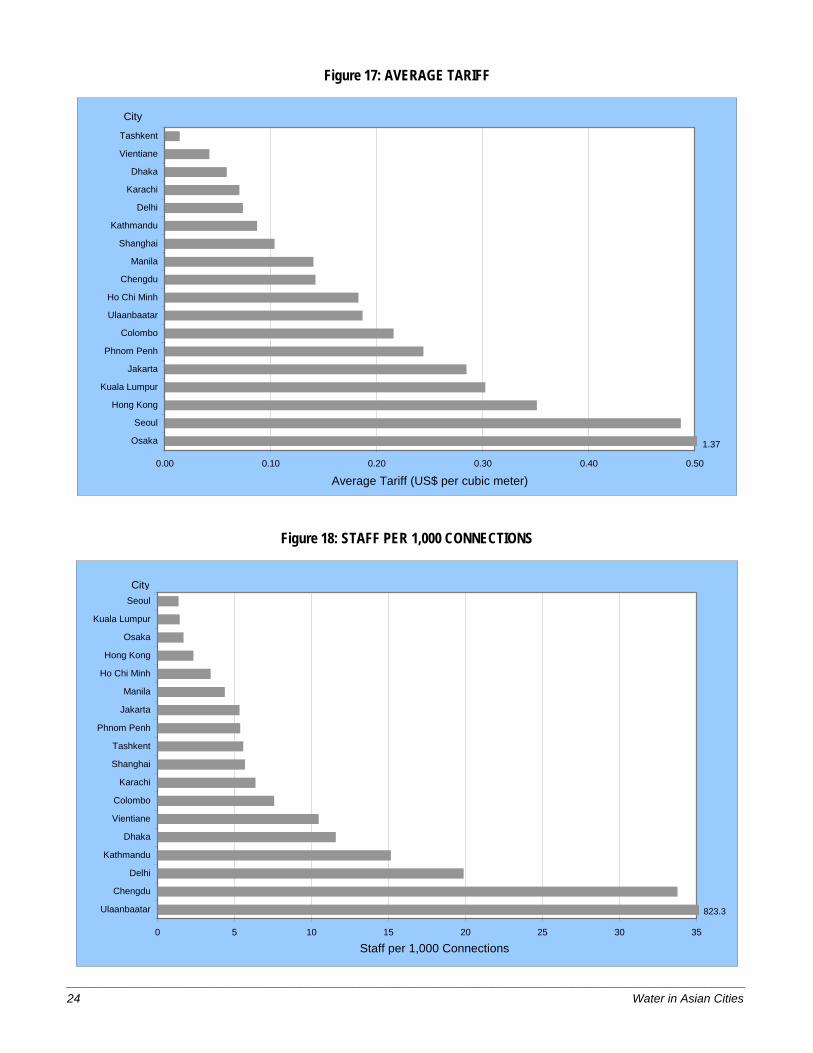
Figure 17: AVERAGE TARIFF
0.00 0.10 0.20 0.30 0.40 0.50
Osaka
Seoul
Hong Kong
Kuala Lumpur
Jakarta
Phnom Penh
Colombo
Ulaanbaatar
Ho Chi Minh
Chengdu
Manila
Shanghai
Kathmandu
Delhi
Karachi
Dhaka
Vientiane
Tashkent
City
Average Tariff (US$ per cubic meter)
1.37
Figure 18: STAFF PER 1,000 CONNECTIONS
______________________________________________________________________________________________________ 24 Water in Asian Cities
0 5 10 15 20 25 30 35
Ulaanbaatar
Chengdu
Delhi
Kathmandu
Dhaka
Vientiane
Colombo
Karachi
Shanghai
Tashkent
Phnom Penh
Jakarta
Manila
Ho Chi Minh
Hong Kong
Osaka
Kuala Lumpur
Seoul
Staff per 1,000 Connections
City
823.3
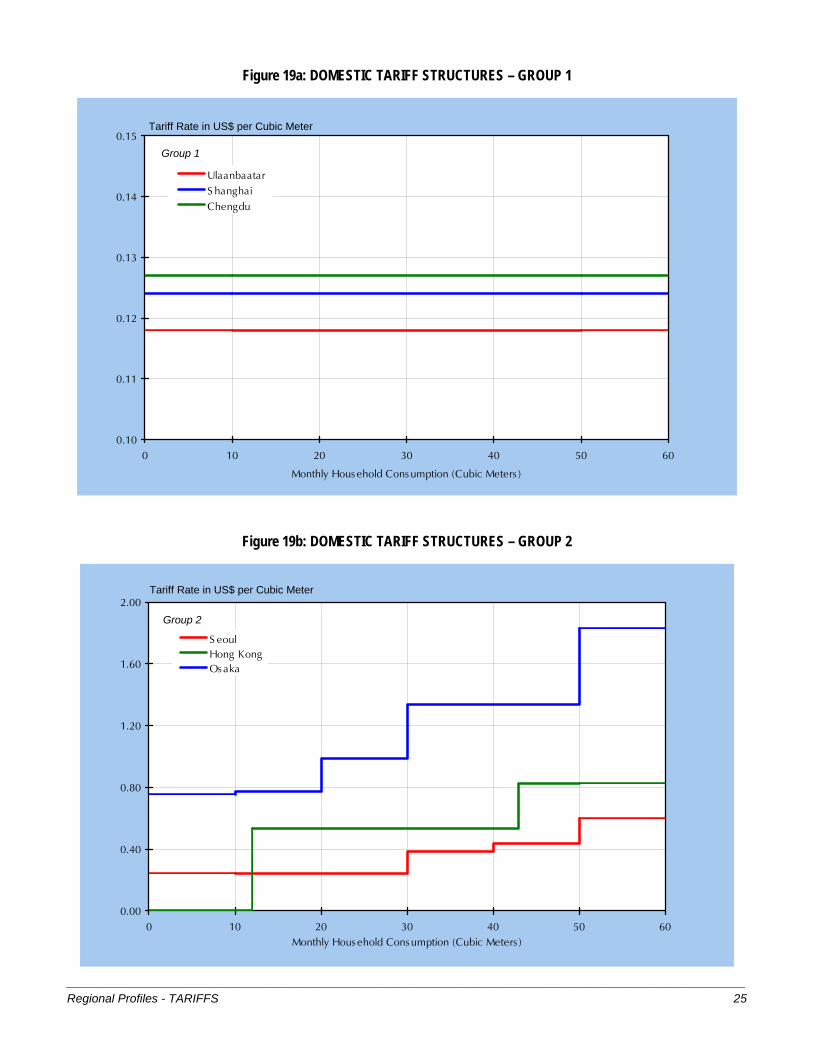
Figure 19a: DOMESTIC TARIFF STRUCTURES – GROUP 1
0.10
0.11
0.12
0.13
0.14
0.15
0 10 20 30 40 50 60
Monthly Hous ehold Cons umption (Cubic Meters )
UlaanbaatarS hanghaiChengdu
Tariff Rate in US$ per Cubic Meter
Group 1
Figure 19b: DOMESTIC TARIFF STRUCTURES – GROUP 2
______________________________________________________________________________________________________ Regional Profiles - TARIFFS 25
0.00
0.40
0.80
1.20
1.60
2.00
0 10 20 30 40 50 60Monthly Hous ehold Cons umption (Cubic Meters )
S eoulHong KongOs aka
Group 2
Tariff Rate in US$ per Cubic Meter
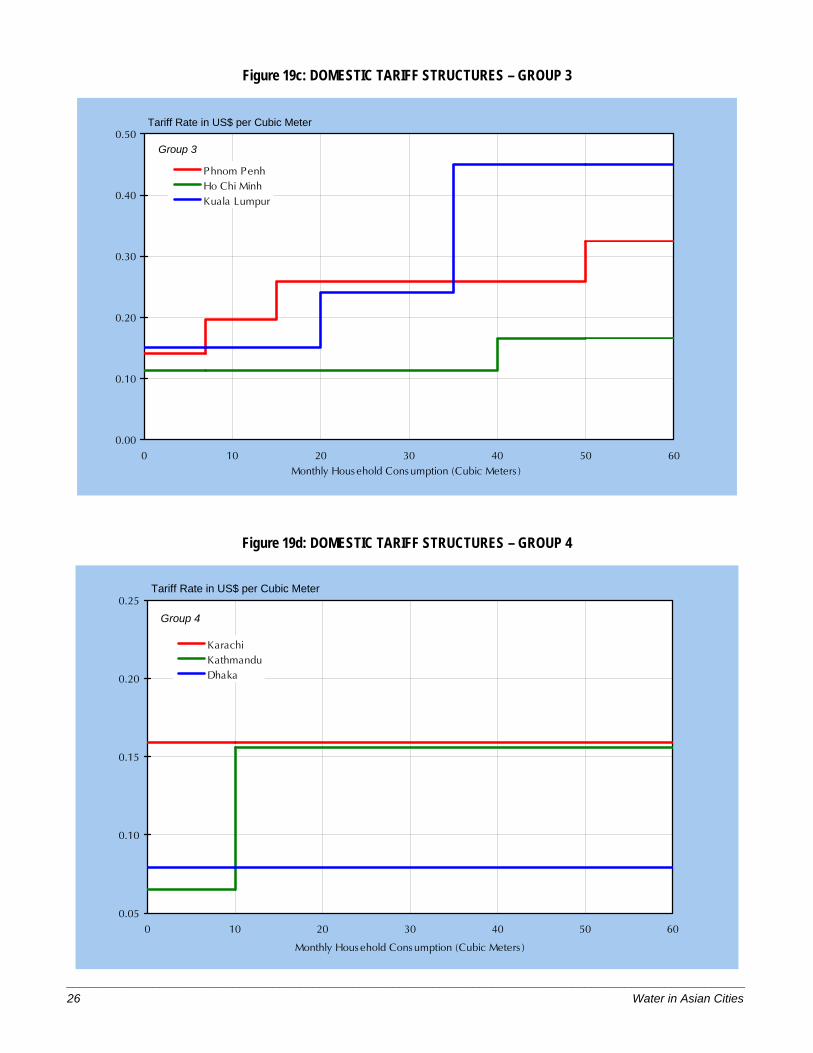
Figure 19c: DOMESTIC TARIFF STRUCTURES – GROUP 3
0.00
0.10
0.20
0.30
0.40
0.50
0 10 20 30 40 50 60Monthly Hous ehold Cons umption (Cubic Meters )
Phnom PenhHo Chi MinhKuala Lumpur
Group 3
Tariff Rate in US$ per Cubic Meter
Figure 19d: DOMESTIC TARIFF STRUCTURES – GROUP 4
______________________________________________________________________________________________________ 26 Water in Asian Cities
0.05
0.10
0.15
0.20
0.25
0 10 20 30 40 50 60
Monthly Hous ehold Cons umption (Cubic Meters )
KarachiKathmanduDhaka
Group 4
Tariff Rate in US$ per Cubic Meter
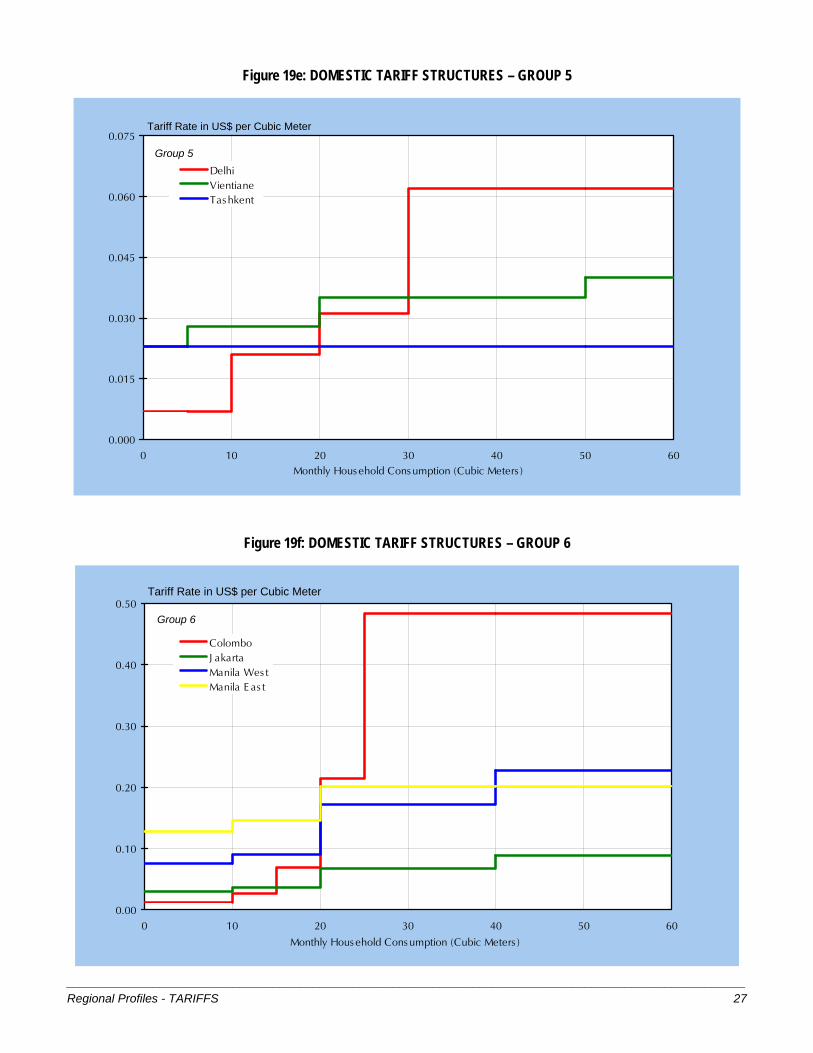
Figure 19e: DOMESTIC TARIFF STRUCTURES – GROUP 5
0.000
0.015
0.030
0.045
0.060
0.075
0 10 20 30 40 50 60Monthly Hous ehold Cons umption (Cubic Meters )
DelhiVientianeTas hkent
Group 5
Tariff Rate in US$ per Cubic Meter
Figure 19f: DOMESTIC TARIFF STRUCTURES – GROUP 6
______________________________________________________________________________________________________ Regional Profiles - TARIFFS 27
0.00
0.10
0.20
0.30
0.40
0.50
0 10 20 30 40 50 60Monthly Hous ehold Cons umption (Cubic Meters )
ColomboJ akartaManila Wes tManila E as t
Group 6
Tariff Rate in US$ per Cubic Meter
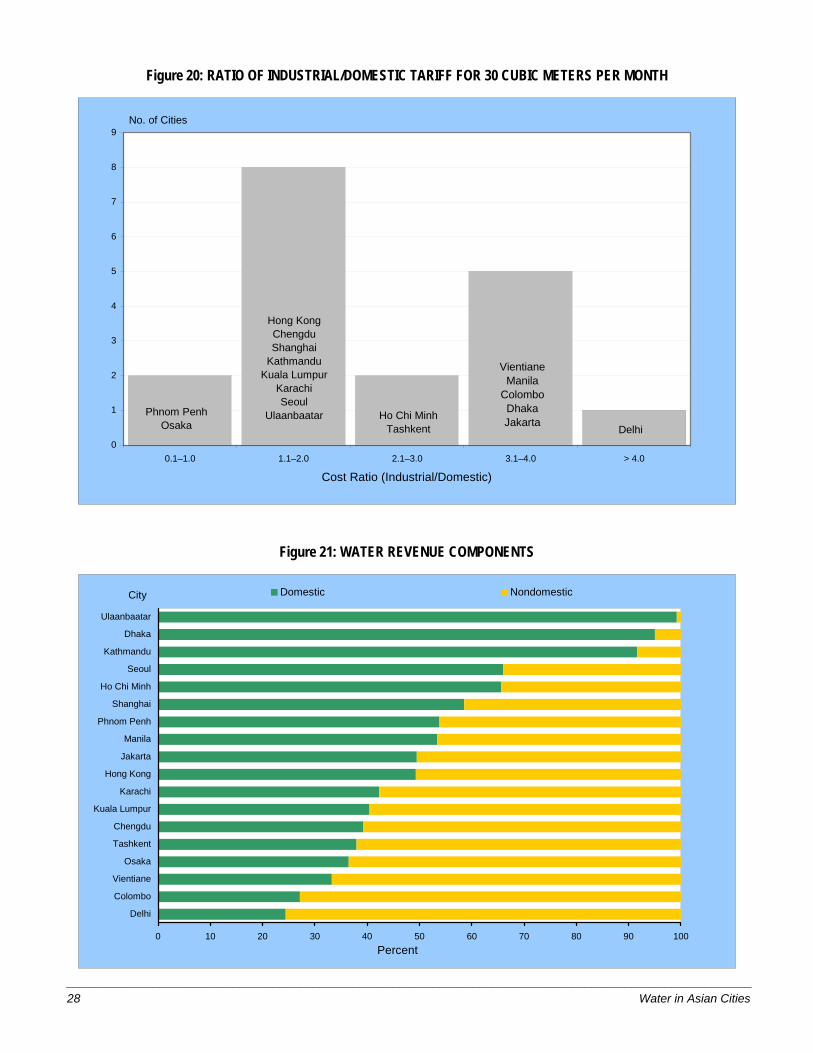
Figure 20: RATIO OF INDUSTRIAL/DOMESTIC TARIFF FOR 30 CUBIC METERS PER MONTH
0
1
2
3
4
5
6
7
8
9
0.1–1.0 1.1–2.0 2.1–3.0 3.1–4.0 > 4.0
Phnom PenhOsaka
Hong KongChengduShanghai
KathmanduKuala Lumpur
KarachiSeoul
Ulaanbaatar Ho Chi MinhTashkent Delhi
No. of Cities
VientianeManila
ColomboDhakaJakarta
Cost Ratio (Industrial/Domestic)
Figure 21: WATER REVENUE COMPONENTS
_______________________________________________________________________________________________________ 28 Water in Asian Cities
0 10 20 30 40 50 60 70 80 90 100
Delhi
Colombo
Vientiane
Osaka
Tashkent
Chengdu
Kuala Lumpur
Karachi
Hong Kong
Jakarta
Manila
Phnom Penh
Shanghai
Ho Chi Minh
Seoul
Kathmandu
Dhaka
Ulaanbaatar
Domestic Nondomestic
Percent
City
_______________________________________________________________________________________________________ Regional Profiles - TARIFFS 29
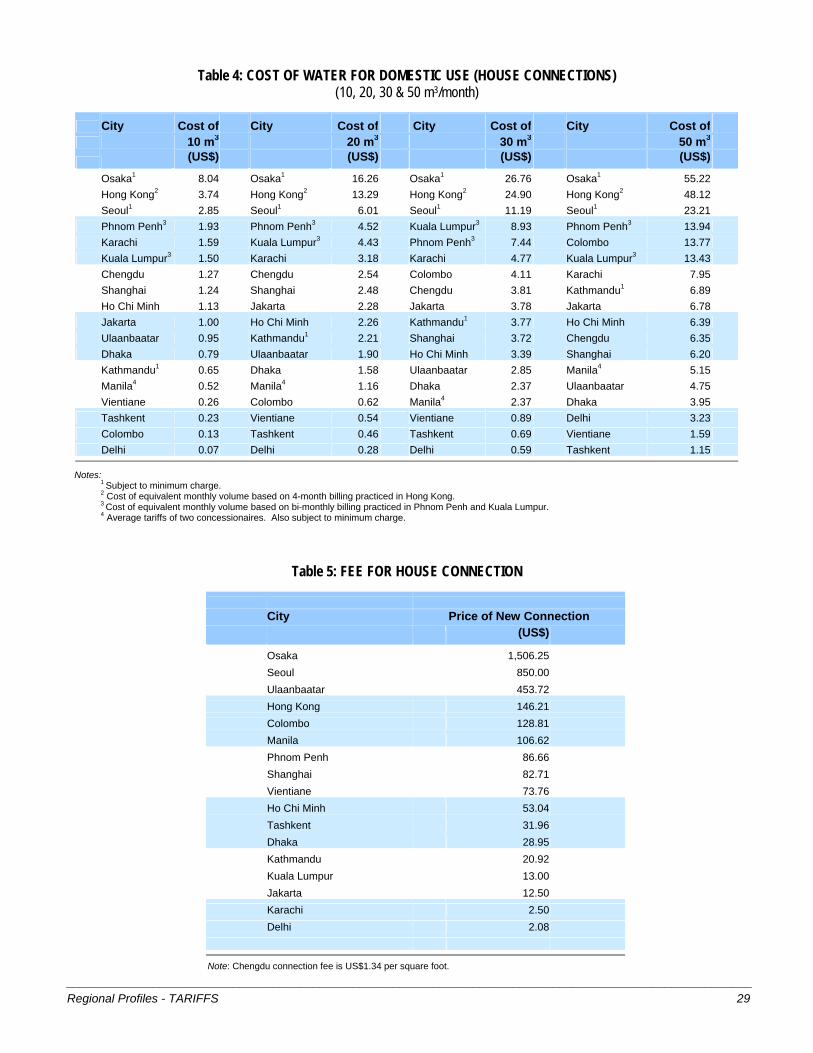
Table 4: COST OF WATER FOR DOMESTIC USE (HOUSE CONNECTIONS) (10, 20, 30 & 50 m3/month)
City Cost of City Cost of City Cost of City Cost of 10 m3 20 m3 30 m3 50 m3 (US$) (US$) (US$) (US$)
Osaka1 8.04 Osaka1 16.26 Osaka1 26.76 Osaka1 55.22 Hong Kong2 3.74 Hong Kong2 13.29 Hong Kong2 24.90 Hong Kong2 48.12 Seoul1 2.85 Seoul1 6.01 Seoul1 11.19 Seoul1 23.21 Phnom Penh3 1.93 Phnom Penh3 4.52 Kuala Lumpur3 8.93 Phnom Penh3 13.94 Karachi 1.59 Kuala Lumpur3 4.43 Phnom Penh3 7.44 Colombo 13.77 Kuala Lumpur3 1.50 Karachi 3.18 Karachi 4.77 Kuala Lumpur3 13.43 Chengdu 1.27 Chengdu 2.54 Colombo 4.11 Karachi 7.95 Shanghai 1.24 Shanghai 2.48 Chengdu 3.81 Kathmandu1 6.89 Ho Chi Minh 1.13 Jakarta 2.28 Jakarta 3.78 Jakarta 6.78 Jakarta 1.00 Ho Chi Minh 2.26 Kathmandu1 3.77 Ho Chi Minh 6.39 Ulaanbaatar 0.95 Kathmandu1 2.21 Shanghai 3.72 Chengdu 6.35 Dhaka 0.79 Ulaanbaatar 1.90 Ho Chi Minh 3.39 Shanghai 6.20 Kathmandu1 0.65 Dhaka 1.58 Ulaanbaatar 2.85 Manila4 5.15 Manila4 0.52 Manila4 1.16 Dhaka 2.37 Ulaanbaatar 4.75 Vientiane 0.26 Colombo 0.62 Manila4 2.37 Dhaka 3.95 Tashkent 0.23 Vientiane 0.54 Vientiane 0.89 Delhi 3.23 Colombo 0.13 Tashkent 0.46 Tashkent 0.69 Vientiane 1.59 Delhi 0.07 Delhi 0.28 Delhi 0.59 Tashkent 1.15
Notes: 1 Subject to minimum charge. 2 Cost of equivalent monthly volume based on 4-month billing practiced in Hong Kong. 3 Cost of equivalent monthly volume based on bi-monthly billing practiced in Phnom Penh and Kuala Lumpur. 4 Average tariffs of two concessionaires. Also subject to minimum charge.
Table 5: FEE FOR HOUSE CONNECTION
City Price of New Connection
(US$)
Osaka 1,506.25 Seoul 850.00 Ulaanbaatar 453.72 Hong Kong 146.21 Colombo 128.81 Manila 106.62 Phnom Penh 86.66 Shanghai 82.71 Vientiane 73.76 Ho Chi Minh 53.04 Tashkent 31.96 Dhaka 28.95 Kathmandu 20.92 Kuala Lumpur 13.00 Jakarta 12.50 Karachi 2.50 Delhi 2.08
Note: Chengdu connection fee is US$1.34 per square foot.
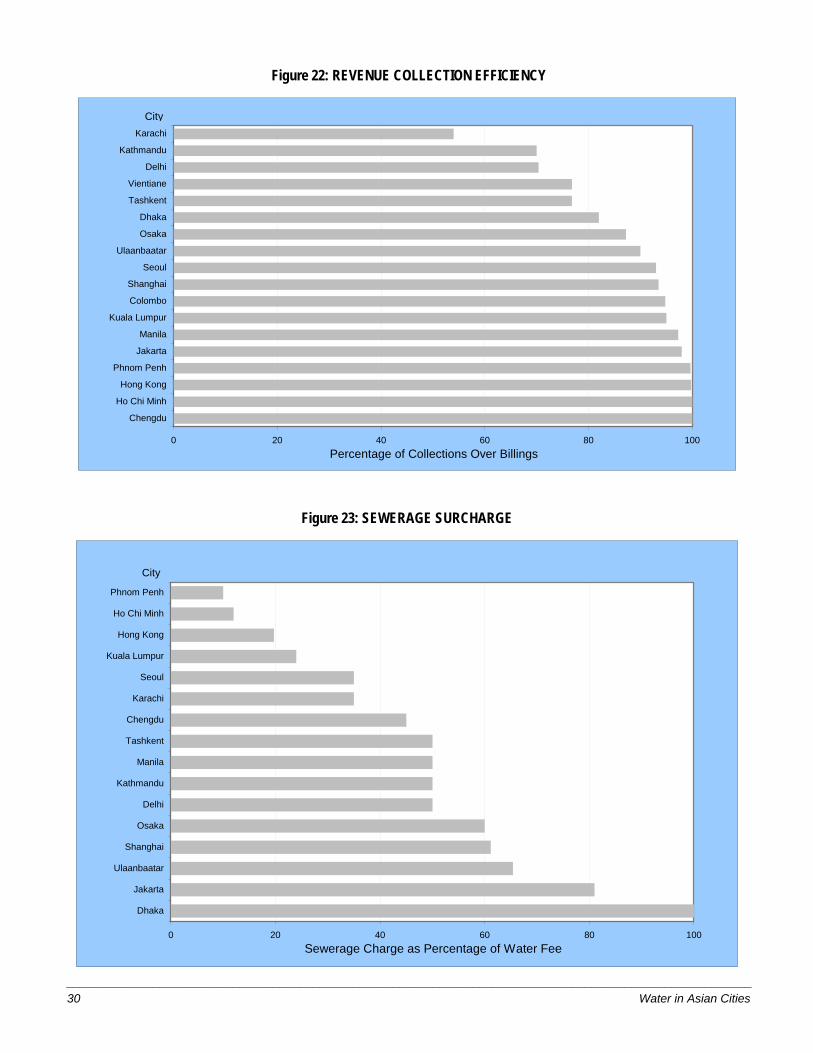
Figure 22: REVENUE COLLECTION EFFICIENCY
0 20 40 60 80 10
Chengdu
Ho Chi Minh
Hong Kong
Phnom Penh
Jakarta
Manila
Kuala Lumpur
Colombo
Shanghai
Seoul
Ulaanbaatar
Osaka
Dhaka
Tashkent
Vientiane
Delhi
Kathmandu
Karachi
0
City
Percentage of Collections Over Billings
Figure 23: SEWERAGE SURCHARGE
_______________________________________________________________________________________________________ 30 Water in Asian Cities
0 20 40 60 80 10
Dhaka
Jakarta
Ulaanbaatar
Shanghai
Osaka
Delhi
Kathmandu
Manila
Tashkent
Chengdu
Karachi
Seoul
Kuala Lumpur
Hong Kong
Ho Chi Minh
Phnom Penh
0
City
Sewerage Charge as Percentage of Water Fee
Water Utility andCity Profiles
3
63672 adb_Asian Cities chap pages.p65 1/19/04, 12:10 PM3
32 Water in Asian Cities
CHENGDU Utility Profile
Water Utility
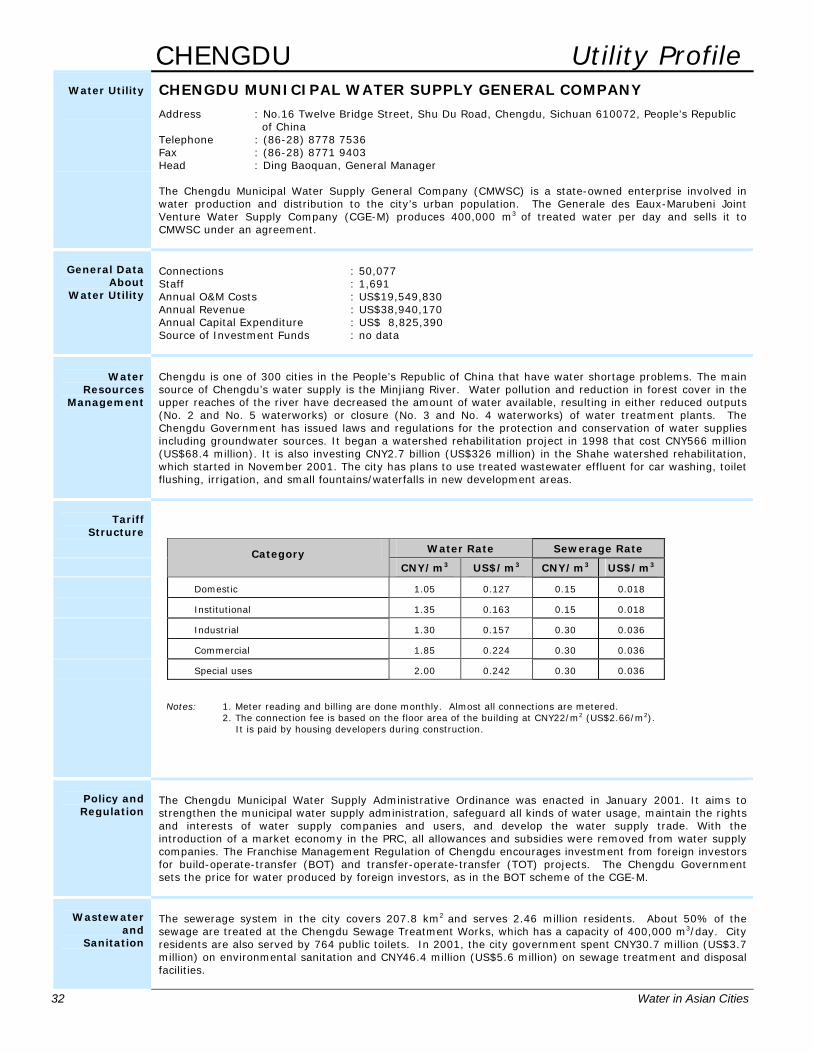
CHENGDU MUNICIPAL WATER SUPPLY GENERAL COMPANY
Address : No.16 Twelve Bridge Street, Shu Du Road, Chengdu, Sichuan 610072, People’s Republic of China Telephone : (86-28) 8778 7536 Fax : (86-28) 8771 9403 Head : Ding Baoquan, General Manager
The Chengdu Municipal Water Supply General Company (CMWSC) is a state-owned enterprise involved in water production and distribution to the city’s urban population. The Generale des Eaux-Marubeni Joint Venture Water Supply Company (CGE-M) produces 400,000 m3 of treated water per day and sells it to CMWSC under an agreement.
General Data
About Water Utility
Connections : 50,077 Staff : 1,691 Annual O&M Costs : US$19,549,830 Annual Revenue : US$38,940,170 Annual Capital Expenditure : US$ 8,825,390 Source of Investment Funds : no data
Water
Resources Management
Chengdu is one of 300 cities in the People’s Republic of China that have water shortage problems. The main source of Chengdu’s water supply is the Minjiang River. Water pollution and reduction in forest cover in the upper reaches of the river have decreased the amount of water available, resulting in either reduced outputs (No. 2 and No. 5 waterworks) or closure (No. 3 and No. 4 waterworks) of water treatment plants. The Chengdu Government has issued laws and regulations for the protection and conservation of water supplies including groundwater sources. It began a watershed rehabilitation project in 1998 that cost CNY566 million (US$68.4 million). It is also investing CNY2.7 billion (US$326 million) in the Shahe watershed rehabilitation, which started in November 2001. The city has plans to use treated wastewater effluent for car washing, toilet flushing, irrigation, and small fountains/waterfalls in new development areas.
Tariff
Structure
Water Rate Sewerage Rate
Category
CNY/m3 US$/m3 CNY/m3 US$/m3
Domestic 1.05 0.127 0.15 0.018
Institutional 1.35 0.163 0.15 0.018
Industrial 1.30 0.157 0.30 0.036
Commercial 1.85 0.224 0.30 0.036
Special uses 2.00 0.242 0.30 0.036
Notes: 1. Meter reading and billing are done monthly. Almost all connections are metered. 2. The connection fee is based on the floor area of the building at CNY22/m2 (US$2.66/m2). It is paid by housing developers during construction.
Policy and Regulation
The Chengdu Municipal Water Supply Administrative Ordinance was enacted in January 2001. It aims to strengthen the municipal water supply administration, safeguard all kinds of water usage, maintain the rights and interests of water supply companies and users, and develop the water supply trade. With the introduction of a market economy in the PRC, all allowances and subsidies were removed from water supply companies. The Franchise Management Regulation of Chengdu encourages investment from foreign investors for build-operate-transfer (BOT) and transfer-operate-transfer (TOT) projects. The Chengdu Government sets the price for water produced by foreign investors, as in the BOT scheme of the CGE-M.
Wastewater
and Sanitation
The sewerage system in the city covers 207.8 km2 and serves 2.46 million residents. About 50% of the sewage are treated at the Chengdu Sewage Treatment Works, which has a capacity of 400,000 m3/day. City residents are also served by 764 public toilets. In 2001, the city government spent CNY30.7 million (US$3.7 million) on environmental sanitation and CNY46.4 million (US$5.6 million) on sewage treatment and disposal facilities.

CHENGDU 33
City Profile
CHENGDU WATER SUPPLY
Production & Distribution
Population: 2,891,100 (2001)
Annual Production 334,910,000 m3 Groundwater Nil Surface Water 100% Annual Consumption Domestic 120,540,000 m3 Nondomestic 153,370,000 m3
Total 273,910,000 m3
Service Connections
Domestic1 35,217 Nondomestic 14,860 Total 50,077
Service
Indicators
Service Coverage 83% 24-hour Water Availability 100% Per Capita Consumption 138 l/c/d Average Tariff US$0.142/m3
Efficiency
Indicators
Nonrevenue Water 18% Unit Production Cost US$0.058/m3 Working Ratio 0.50 Staff/1,000 Connections 33.8 Revenue Collection Efficiency 100%
Non-domestic
46%
NRW 18%
Domestic 36%
Annual Water Use 334,910,000 m3
Non-domestic
61%
Domestic 39%
Annual Tariff Revenues US$38,940,170
Small-scale
Water Providers
There are 69 small-scale water providers in Chengdu concentrated around the Third Loop Road. They supplied 46.34 million m3 of water to about 497,800 people or 15% of the population in 2000. Price per m3
ranges from CNY0.50 (US$0.06) to CNY2.00 (US$0.24), averaging CNY0.98 (US$0.12) for domestic use, CNY1.12 (US$0.14) for industrial use, CNY1.39 (US$0.17) for public service departments, and CNY2.00 (US$0.24) for commercial use and special trades. Some of these providers sell groundwater at CNY0.30 (US$0.04)/m3. Total revenues of small-scale water providers in 2000 amounted to CNY27.5 million (US$3.32 million) although many made very little profit; 17 made a loss and 10 broke even.
Private Sector
Participation
The Chengdu No. 6 Waterworks was constructed and is being operated under a BOT scheme by CGE-M. The company sells water to CMWSC under an agreement that requires CMWSC to purchase 400,000 m3 of water daily. CGE-M must deliver at least the same amount; otherwise, it is penalized. CMWSC also produces water and has a total capacity of 980,000 m3/day. The total demand is about 1 million m3/day, but because of the agreement, CMWSC is forced to reduce its own production by 40% and buy higher priced water from CGE-M. This situation was caused by an overestimate of demand based on population growth and the abundance of groundwater, as well as the emergence of many small-scale water providers.
Flood
Management
During the 20th century, Chengdu suffered from 15 major flooding disasters. The worst were in 1964 and 1981 when storm waters combined with flood flow from the upper reaches of the Minjiang River. Flood management is the responsibility of the Flood Prevention Headquarters of the People’s Government of Chengdu under the Chengdu Water Conservancy Bureau. In 2001, expenditure for flood control works and management was CNY19.64 million (US$2.37 million).
Notes
1 Average number of persons/connections was 3.1. The increase in total connections in 2001 was 111. Data as of 2001.
34 Water in Asian Cities
COLOMBO Utility Profile
Water Utility
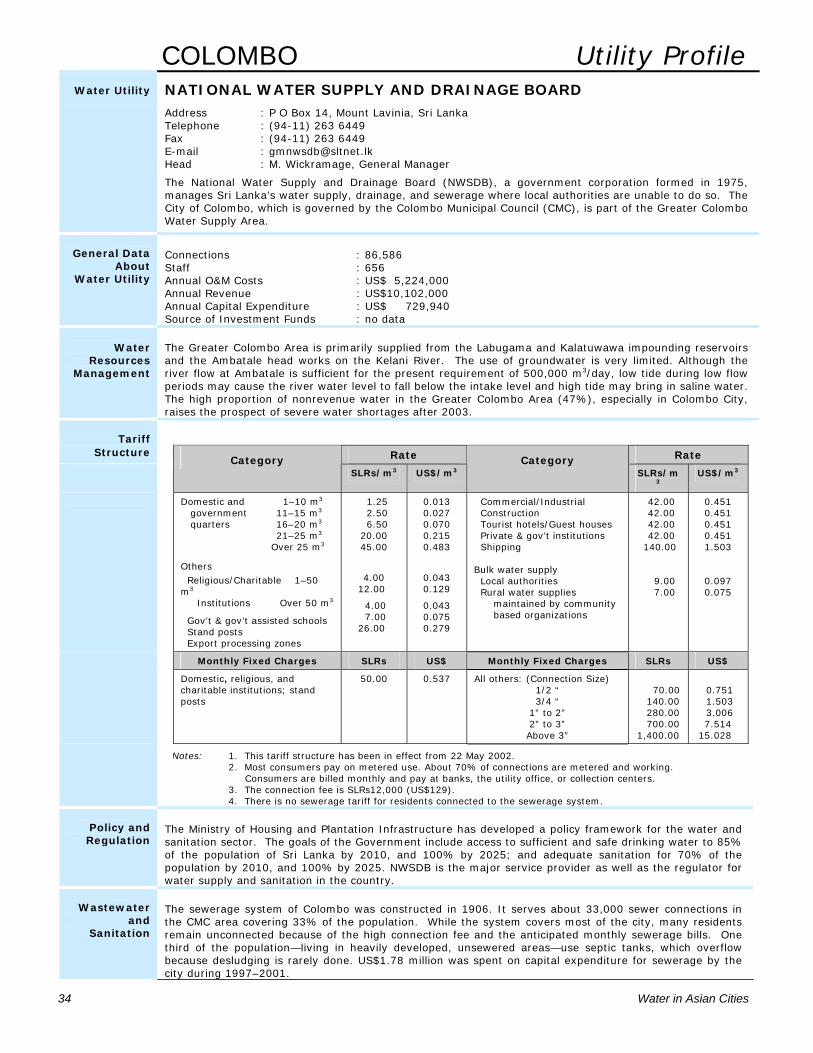
NATIONAL WATER SUPPLY AND DRAINAGE BOARD Address : P O Box 14, Mount Lavinia, Sri Lanka
Telephone : (94-11) 263 6449 Fax : (94-11) 263 6449 E-mail : [email protected] Head : M. Wickramage, General Manager
The National Water Supply and Drainage Board (NWSDB), a government corporation formed in 1975, manages Sri Lanka’s water supply, drainage, and sewerage where local authorities are unable to do so. The City of Colombo, which is governed by the Colombo Municipal Council (CMC), is part of the Greater Colombo Water Supply Area.
General Data
About Water Utility
Connections : 86,586 Staff : 656 Annual O&M Costs : US$ 5,224,000 Annual Revenue : US$10,102,000 Annual Capital Expenditure : US$ 729,940 Source of Investment Funds : no data
Water
Resources Management
The Greater Colombo Area is primarily supplied from the Labugama and Kalatuwawa impounding reservoirs and the Ambatale head works on the Kelani River. The use of groundwater is very limited. Although the river flow at Ambatale is sufficient for the present requirement of 500,000 m3/day, low tide during low flow periods may cause the river water level to fall below the intake level and high tide may bring in saline water. The high proportion of nonrevenue water in the Greater Colombo Area (47%), especially in Colombo City, raises the prospect of severe water shortages after 2003.
Tariff
Structure Rate Rate
Category SLRs/m3 US$/m3
Category SLRs/m
3US$/m3
Domestic and 1–10 m3
government 11–15 m3
quarters 16–20 m3
21–25 m3
Over 25 m3
Others Religious/Charitable 1–50 m3
Institutions Over 50 m3
Gov’t & gov’t assisted schools Stand posts Export processing zones
1.25 2.50 6.50 20.00 45.00
4.00
12.00
4.00 7.00
26.00
0.013 0.027 0.070 0.215 0.483
0.043 0.129
0.043 0.075 0.279
Commercial/Industrial Construction Tourist hotels/Guest houses Private & gov’t institutions Shipping Bulk water supply Local authorities Rural water supplies maintained by community based organizations
42.00 42.00 42.00 42.00 140.00
9.00 7.00
0.451 0.451 0.451 0.451 1.503
0.097 0.075
Monthly Fixed Charges SLRs US$ Monthly Fixed Charges SLRs US$
Domestic, religious, and charitable institutions; stand posts
50.00 0.537 All others: (Connection Size) 1/2 “ 3/4 “
1” to 2” 2” to 3” Above 3”
70.00 140.00 280.00 700.00 1,400.00
0.751 1.503 3.006 7.514
15.028
Notes: 1. This tariff structure has been in effect from 22 May 2002. 2. Most consumers pay on metered use. About 70% of connections are metered and working. Consumers are billed monthly and pay at banks, the utility office, or collection centers. 3. The connection fee is SLRs12,000 (US$129). 4. There is no sewerage tariff for residents connected to the sewerage system.
Policy and Regulation
The Ministry of Housing and Plantation Infrastructure has developed a policy framework for the water and sanitation sector. The goals of the Government include access to sufficient and safe drinking water to 85% of the population of Sri Lanka by 2010, and 100% by 2025; and adequate sanitation for 70% of the population by 2010, and 100% by 2025. NWSDB is the major service provider as well as the regulator for water supply and sanitation in the country.
Wastewater
and Sanitation
The sewerage system of Colombo was constructed in 1906. It serves about 33,000 sewer connections in the CMC area covering 33% of the population. While the system covers most of the city, many residents remain unconnected because of the high connection fee and the anticipated monthly sewerage bills. One third of the population—living in heavily developed, unsewered areas—use septic tanks, which overflow because desludging is rarely done. US$1.78 million was spent on capital expenditure for sewerage by the city during 1997–2001.
COLOMBO 35
City Profile
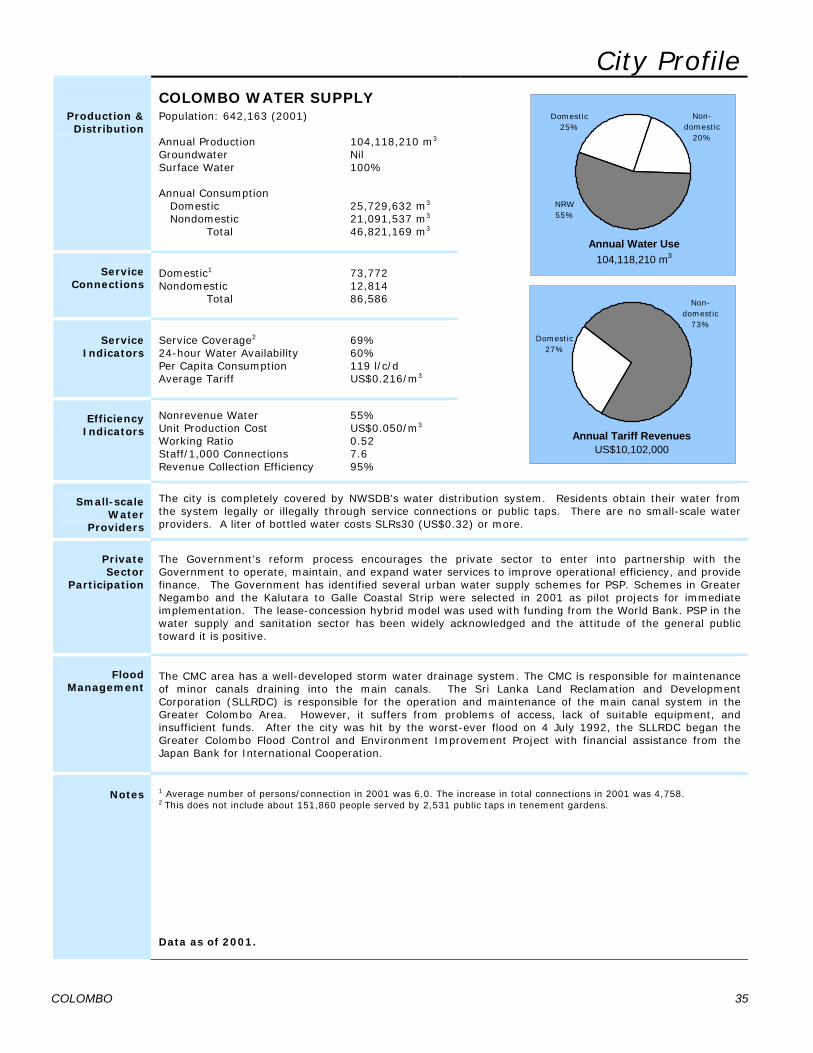
COLOMBO WATER SUPPLY Production & Distribution
Population: 642,163 (2001)
Annual Production 104,118,210 m3 Groundwater Nil Surface Water 100% Annual Consumption Domestic 25,729,632 m3 Nondomestic 21,091,537 m3 Total 46,821,169 m3
Service Connections
Domestic1 73,772 Nondomestic 12,814 Total 86,586
Service
Indicators
Service Coverage2 69% 24-hour Water Availability 60% Per Capita Consumption 119 l/c/d Average Tariff US$0.216/m3
Efficiency
Indicators
Nonrevenue Water 55% Unit Production Cost US$0.050/m3 Working Ratio 0.52 Staff/1,000 Connections 7.6 Revenue Collection Efficiency 95%
Domestic25%
NRW 55%
Non-domestic
20%
Annual Water Use 104,118,210 m3
Domestic27%
Non-domestic
73%
Annual Tariff Revenues US$10,102,000
Small-scale
Water Providers
The city is completely covered by NWSDB’s water distribution system. Residents obtain their water from the system legally or illegally through service connections or public taps. There are no small-scale water providers. A liter of bottled water costs SLRs30 (US$0.32) or more.
Private Sector
Participation
The Government’s reform process encourages the private sector to enter into partnership with the Government to operate, maintain, and expand water services to improve operational efficiency, and provide finance. The Government has identified several urban water supply schemes for PSP. Schemes in Greater Negambo and the Kalutara to Galle Coastal Strip were selected in 2001 as pilot projects for immediate implementation. The lease-concession hybrid model was used with funding from the World Bank. PSP in the water supply and sanitation sector has been widely acknowledged and the attitude of the general public toward it is positive.
Flood
Management
The CMC area has a well-developed storm water drainage system. The CMC is responsible for maintenance of minor canals draining into the main canals. The Sri Lanka Land Reclamation and Development Corporation (SLLRDC) is responsible for the operation and maintenance of the main canal system in the Greater Colombo Area. However, it suffers from problems of access, lack of suitable equipment, and insufficient funds. After the city was hit by the worst-ever flood on 4 July 1992, the SLLRDC began the Greater Colombo Flood Control and Environment Improvement Project with financial assistance from the Japan Bank for International Cooperation.
Notes
1 Average number of persons/connection in 2001 was 6.0. The increase in total connections in 2001 was 4,758. 2 This does not include about 151,860 people served by 2,531 public taps in tenement gardens. Data as of 2001.
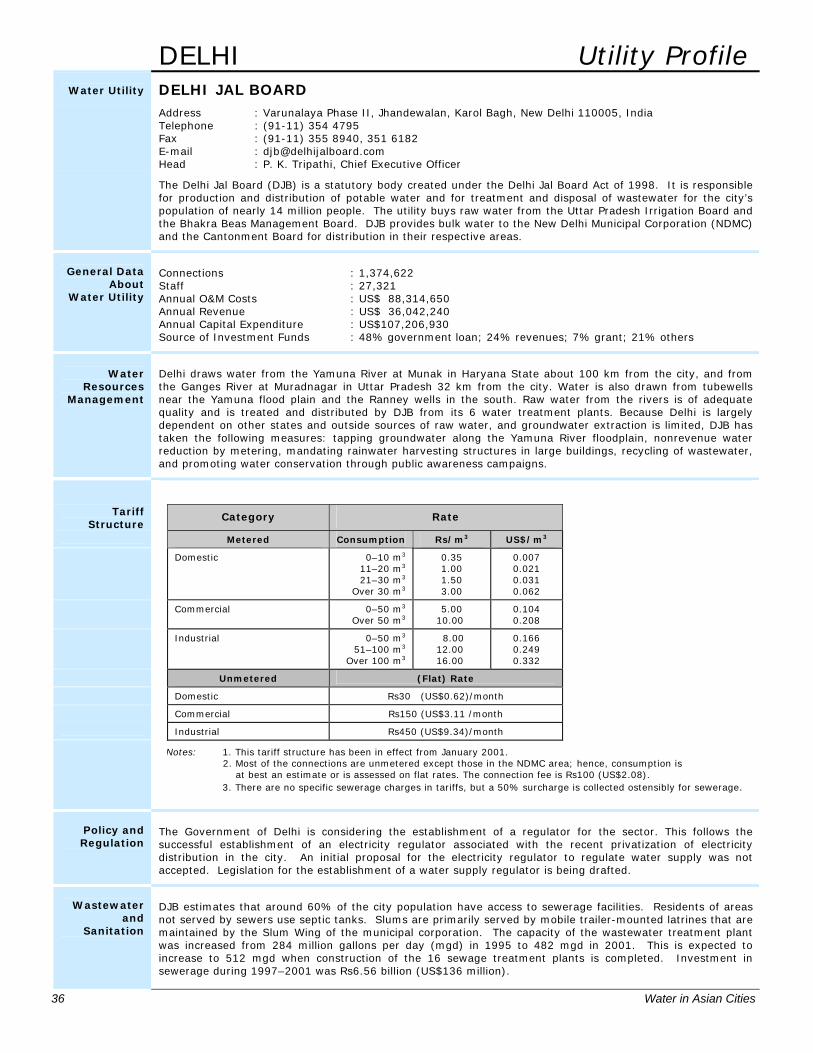
36 Water in Asian Cities
DELHI Utility Profile
Water Utility
DELHI JAL BOARD Address : Varunalaya Phase II, Jhandewalan, Karol Bagh, New Delhi 110005, India
Telephone : (91-11) 354 4795 Fax : (91-11) 355 8940, 351 6182 E-mail : [email protected] Head : P. K. Tripathi, Chief Executive Officer
The Delhi Jal Board (DJB) is a statutory body created under the Delhi Jal Board Act of 1998. It is responsible for production and distribution of potable water and for treatment and disposal of wastewater for the city’s population of nearly 14 million people. The utility buys raw water from the Uttar Pradesh Irrigation Board and the Bhakra Beas Management Board. DJB provides bulk water to the New Delhi Municipal Corporation (NDMC) and the Cantonment Board for distribution in their respective areas.
General Data
About Water Utility
Connections : 1,374,622 Staff : 27,321 Annual O&M Costs : US$ 88,314,650 Annual Revenue : US$ 36,042,240 Annual Capital Expenditure : US$107,206,930 Source of Investment Funds : 48% government loan; 24% revenues; 7% grant; 21% others
Water
Resources Management
Delhi draws water from the Yamuna River at Munak in Haryana State about 100 km from the city, and from the Ganges River at Muradnagar in Uttar Pradesh 32 km from the city. Water is also drawn from tubewells near the Yamuna flood plain and the Ranney wells in the south. Raw water from the rivers is of adequate quality and is treated and distributed by DJB from its 6 water treatment plants. Because Delhi is largely dependent on other states and outside sources of raw water, and groundwater extraction is limited, DJB has taken the following measures: tapping groundwater along the Yamuna River floodplain, nonrevenue water reduction by metering, mandating rainwater harvesting structures in large buildings, recycling of wastewater, and promoting water conservation through public awareness campaigns.
Tariff Structure
Category Rate
Metered Consumption Rs/m3 US$/m3
Domestic 0–10 m3
11–20 m3
21–30 m3
Over 30 m3
0.35 1.00 1.50 3.00
0.007 0.021 0.031 0.062
Commercial 0–50 m3
Over 50 m35.00
10.00 0.104 0.208
Industrial 0–50 m3
51–100 m3
Over 100 m3
8.00 12.00 16.00
0.166 0.249 0.332
Unmetered (Flat) Rate
Domestic Rs30 (US$0.62)/month
Commercial Rs150 (US$3.11 /month
Industrial Rs450 (US$9.34)/month
Notes: 1. This tariff structure has been in effect from January 2001. 2. Most of the connections are unmetered except those in the NDMC area; hence, consumption is
at best an estimate or is assessed on flat rates. The connection fee is Rs100 (US$2.08). 3. There are no specific sewerage charges in tariffs, but a 50% surcharge is collected ostensibly for sewerage.
Policy and Regulation
The Government of Delhi is considering the establishment of a regulator for the sector. This follows the successful establishment of an electricity regulator associated with the recent privatization of electricity distribution in the city. An initial proposal for the electricity regulator to regulate water supply was not accepted. Legislation for the establishment of a water supply regulator is being drafted.
Wastewater
and Sanitation
DJB estimates that around 60% of the city population have access to sewerage facilities. Residents of areas not served by sewers use septic tanks. Slums are primarily served by mobile trailer-mounted latrines that are maintained by the Slum Wing of the municipal corporation. The capacity of the wastewater treatment plant was increased from 284 million gallons per day (mgd) in 1995 to 482 mgd in 2001. This is expected to increase to 512 mgd when construction of the 16 sewage treatment plants is completed. Investment in sewerage during 1997–2001 was Rs6.56 billion (US$136 million).
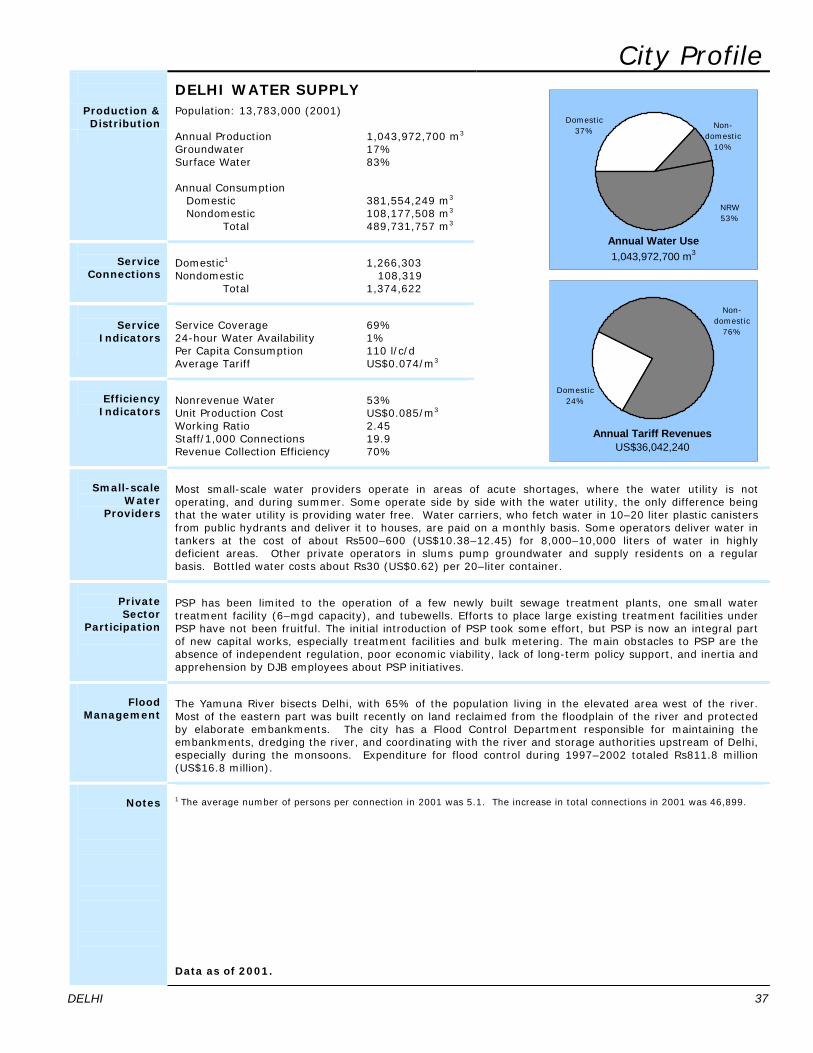
City Profile
DELHI WATER SUPPLY Production & Distribution
Population: 13,783,000 (2001)
Annual Production 1,043,972,700 m3
Groundwater 17% Surface Water 83% Annual Consumption Domestic 381,554,249 m3
Nondomestic 108,177,508 m3
Total 489,731,757 m3
Service
Connections
Domestic1 1,266,303 Nondomestic 108,319 Total 1,374,622
Service
Indicators
Service Coverage 69% 24-hour Water Availability 1% Per Capita Consumption 110 l/c/d Average Tariff US$0.074/m3
Efficiency
Indicators
Nonrevenue Water 53% Unit Production Cost US$0.085/m3
Working Ratio 2.45 Staff/1,000 Connections 19.9 Revenue Collection Efficiency 70%
Non-domestic
10%
NRW 53%
Domestic37%
Annual Water Use 1,043,972,700 m3
Domestic24%
Non-domestic
76%
Annual Tariff Revenues US$36,042,240
Small-scale
Water Providers
Most small-scale water providers operate in areas of acute shortages, where the water utility is not operating, and during summer. Some operate side by side with the water utility, the only difference being that the water utility is providing water free. Water carriers, who fetch water in 10–20 liter plastic canisters from public hydrants and deliver it to houses, are paid on a monthly basis. Some operators deliver water in tankers at the cost of about Rs500–600 (US$10.38–12.45) for 8,000–10,000 liters of water in highly deficient areas. Other private operators in slums pump groundwater and supply residents on a regular basis. Bottled water costs about Rs30 (US$0.62) per 20–liter container.
Private Sector
Participation
PSP has been limited to the operation of a few newly built sewage treatment plants, one small water treatment facility (6–mgd capacity), and tubewells. Efforts to place large existing treatment facilities under PSP have not been fruitful. The initial introduction of PSP took some effort, but PSP is now an integral part of new capital works, especially treatment facilities and bulk metering. The main obstacles to PSP are the absence of independent regulation, poor economic viability, lack of long-term policy support, and inertia and apprehension by DJB employees about PSP initiatives.
Flood
Management
The Yamuna River bisects Delhi, with 65% of the population living in the elevated area west of the river. Most of the eastern part was built recently on land reclaimed from the floodplain of the river and protected by elaborate embankments. The city has a Flood Control Department responsible for maintaining the embankments, dredging the river, and coordinating with the river and storage authorities upstream of Delhi, especially during the monsoons. Expenditure for flood control during 1997–2002 totaled Rs811.8 million (US$16.8 million).
Notes
1 The average number of persons per connection in 2001 was 5.1. The increase in total connections in 2001 was 46,899.
Data as of 2001.
DELHI 37
38 Water in Asian Cities
DHAKA Utility Profile
Water Utility
DHAKA WATER SUPPLY AND SEWERAGE AUTHORITY
Address : 98 Kazi Nazrul Islam Avenue, Kawran Bazar, Dhaka-1215, Bangladesh Telephone : (880-2) 811 6792 Fax : (880-2) 811 2109 E-mail : [email protected] Head : A. N. H. Akhtar Hussain, Managing Director
The Dhaka Water Supply and Sewerage Authority (DWASA) is a government corporation established in 1963 to take over the responsibility for water supply and sewerage services in Dhaka and the nearby city of Narayanganj from the Department of Public Health Engineering. It was reconstituted in 1996 to run on a commercial basis and was made the sole authority to plan, develop, and maintain the water supply and sewerage and drainage facilities in the city.
General Data
About Water Utility
Connections : 185,866 Staff : 2,151 Annual O&M Costs : US$13,000,000 Annual Revenue : US$14,660,000 Annual Capital Expenditure : US$26,005,790 Source of Investment Funds : 46% government grant; 22% foreign loan; 31% foreign grant; 1% tariff
Water
Resources Management
DWASA supplies 1,300 million liters per day (mld) of the estimated water demand of 1,600 mld; most of the supply is from deep tubewells. This huge abstraction of groundwater has resulted in lowering of the groundwater table at an alarming rate. The Government recently harnessed surface water with the commissioning of a 225 mld capacity water treatment plant. Rainwater harvesting is also being promoted to meet a part of the water demand. Steps are being taken to protect the raw water quality of the nearest surface water sources, the Buriganga and Shitalakhya rivers. The Department of Environment has established 6 monitoring stations on the rivers around Dhaka to monitor surface water quality and at a number of points to monitor wastewater.
Tariff
Structure
Category Rate
Metered Tk/m3 US$/m3
Domestic 4.50 0.079
Commercial and industrial 15.00 0.263
Unmetered
Domestic and community 29.0% of valuation of holding per annum
Commercial and industrial 29.5% of valuation of holding per annum
Notes: 1. About 51% of connections have meters that are working.
2. Billing is done monthly and consumers pay through banks. 3. Connection fees are Tk1,650 (US$28.95) for 18 mm and Tk3,442 (US$60.39) for 25 mm pipes, respectively.
4. Sewerage charge is 100% of the water bill for connected users.
Policy and Regulation
The Government framed a National Policy for Safe Water Supply and Sanitation in 1998 to improve the standard of public health and the environment. The policy made water supply and sewerage authorities responsible for providing safe drinking water in urban areas including slums and squatter settlements, setting tariffs, reducing nonrevenue water, and promoting PSP and NGO participation in water supply activities. Tariffs can be reviewed yearly but adjustments can only be made every 5 years, subject to government approval. At a workshop in 2001, there was consensus for the establishment of a national regulatory body that would comprise representatives from government, local bodies, national professional agency, water providers, consumers’ association, engineering university, and lawyers’ council. However, no appreciable progress has been made toward forming this regulatory body.
Wastewater
and Sanitation
The existing sanitation facilities of Dhaka are insufficient. Only about 30% of the city’s population are connected to the sewerage system. Some households not connected to the system use septic tanks that are desludged manually. Others dispose of wastewater through surface drains, or in low-lying areas, natural drains, or water bodies that find their way to storm sewers. Indiscriminate disposal of untreated industrial effluent to rivers is common. Laws to prevent environmental pollution are not enforced. Investment in this sector during 1997–2001 was Tk456 million (US$8 million).
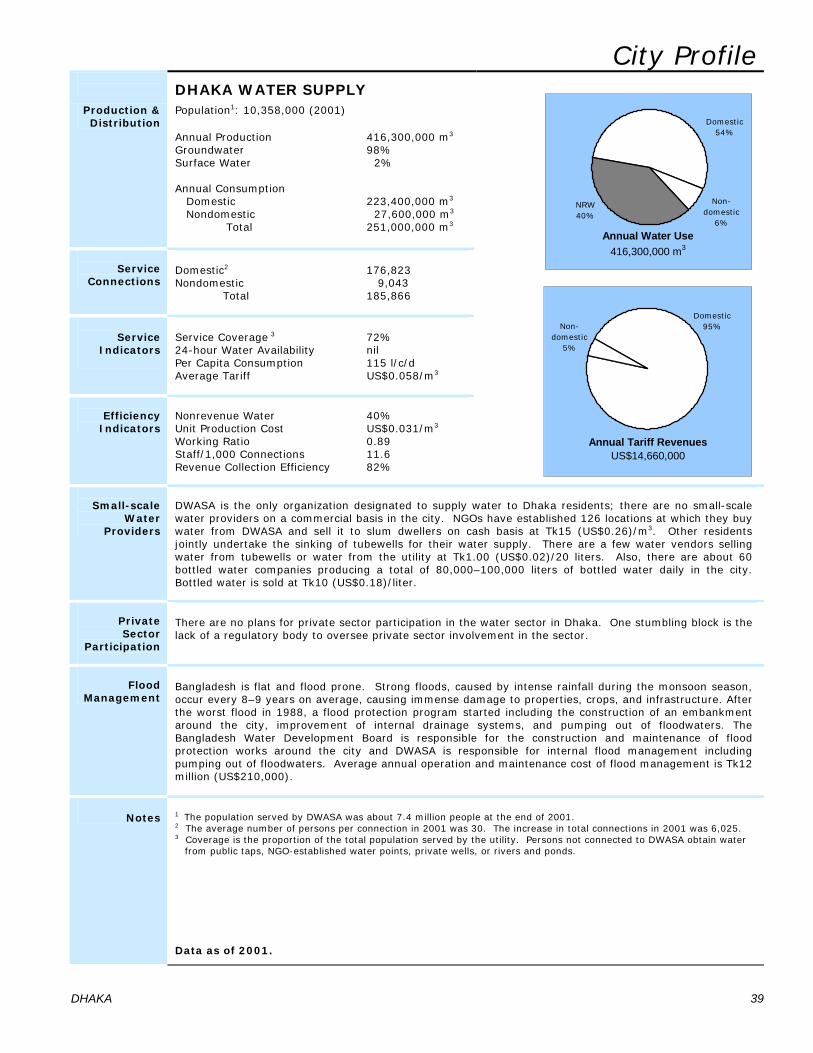
City Profile
DHAKA WATER SUPPLY Population1: 10,358,000 (2001)
Production & Distribution
Annual Production 416,300,000 m3
Groundwater 98% Surface Water 2% Annual Consumption Domestic 223,400,000 m3
Nondomestic 27,600,000 m3
Total 251,000,000 m3
Service
Connections
Domestic2 176,823 Nondomestic 9,043 Total 185,866
Service
Indicators
Service Coverage 3 72% 24-hour Water Availability nil Per Capita Consumption 115 l/c/d Average Tariff US$0.058/m3
Efficiency Indicators
Nonrevenue Water 40% Unit Production Cost US$0.031/m3
Working Ratio 0.89 Staff/1,000 Connections 11.6 Revenue Collection Efficiency 82%
Non-domestic
6%
NRW 40%
Domestic54%
Annual Water Use 416,300,000 m3
Non-domestic
5%
Domestic95%
Annual Tariff Revenues US$14,660,000
Small-scale
Water Providers
DWASA is the only organization designated to supply water to Dhaka residents; there are no small-scale water providers on a commercial basis in the city. NGOs have established 126 locations at which they buy water from DWASA and sell it to slum dwellers on cash basis at Tk15 (US$0.26)/m3. Other residents jointly undertake the sinking of tubewells for their water supply. There are a few water vendors selling water from tubewells or water from the utility at Tk1.00 (US$0.02)/20 liters. Also, there are about 60 bottled water companies producing a total of 80,000–100,000 liters of bottled water daily in the city. Bottled water is sold at Tk10 (US$0.18)/liter.
Private Sector
Participation
There are no plans for private sector participation in the water sector in Dhaka. One stumbling block is the lack of a regulatory body to oversee private sector involvement in the sector.
Flood
Management
Bangladesh is flat and flood prone. Strong floods, caused by intense rainfall during the monsoon season, occur every 8–9 years on average, causing immense damage to properties, crops, and infrastructure. After the worst flood in 1988, a flood protection program started including the construction of an embankment around the city, improvement of internal drainage systems, and pumping out of floodwaters. The Bangladesh Water Development Board is responsible for the construction and maintenance of flood protection works around the city and DWASA is responsible for internal flood management including pumping out of floodwaters. Average annual operation and maintenance cost of flood management is Tk12 million (US$210,000).
Notes 1 The population served by DWASA was about 7.4 million people at the end of 2001.
2 The average number of persons per connection in 2001 was 30. The increase in total connections in 2001 was 6,025. 3 Coverage is the proportion of the total population served by the utility. Persons not connected to DWASA obtain water from public taps, NGO-established water points, private wells, or rivers and ponds.
Data as of 2001.
DHAKA 39
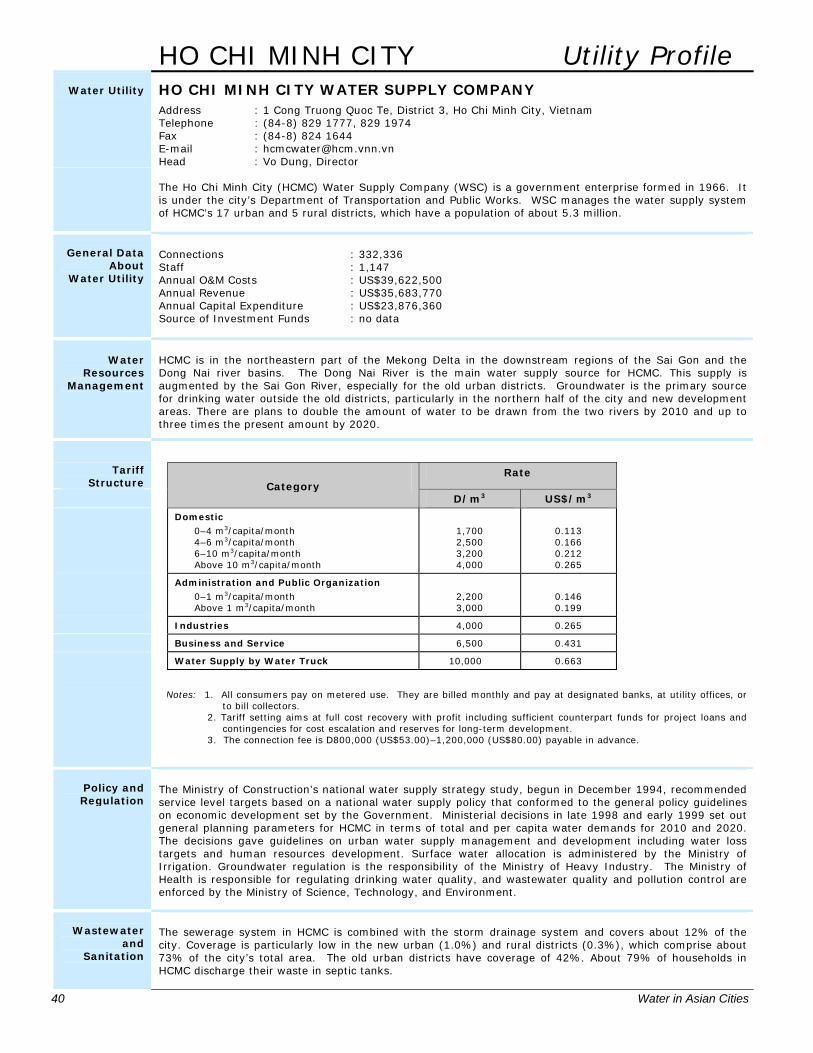
40 Water in Asian Cities
HO CHI MINH CITY Utility Profile
Water Utility
HO CHI MINH CITY WATER SUPPLY COMPANY Address : 1 Cong Truong Quoc Te, District 3, Ho Chi Minh City, Vietnam
Telephone : (84-8) 829 1777, 829 1974 Fax : (84-8) 824 1644 E-mail : [email protected] Head : Vo Dung, Director
The Ho Chi Minh City (HCMC) Water Supply Company (WSC) is a government enterprise formed in 1966. It is under the city’s Department of Transportation and Public Works. WSC manages the water supply system of HCMC’s 17 urban and 5 rural districts, which have a population of about 5.3 million.
General Data
About Water Utility
Connections : 332,336 Staff : 1,147 Annual O&M Costs : US$39,622,500 Annual Revenue : US$35,683,770 Annual Capital Expenditure : US$23,876,360 Source of Investment Funds : no data
Water
Resources Management
HCMC is in the northeastern part of the Mekong Delta in the downstream regions of the Sai Gon and the Dong Nai river basins. The Dong Nai River is the main water supply source for HCMC. This supply is augmented by the Sai Gon River, especially for the old urban districts. Groundwater is the primary source for drinking water outside the old districts, particularly in the northern half of the city and new development areas. There are plans to double the amount of water to be drawn from the two rivers by 2010 and up to three times the present amount by 2020.
Tariff
Structure Rate
Category D/m3 US$/m3
Domestic 0–4 m3/capita/month 4–6 m3/capita/month 6–10 m3/capita/month Above 10 m3/capita/month
1,700 2,500 3,200 4,000
0.113 0.166 0.212 0.265
Administration and Public Organization 0–1 m3/capita/month Above 1 m3/capita/month
2,200 3,000
0.146 0.199
Industries 4,000 0.265
Business and Service 6,500 0.431
Water Supply by Water Truck 10,000 0.663
Notes: 1. All consumers pay on metered use. They are billed monthly and pay at designated banks, at utility offices, or to bill collectors. 2. Tariff setting aims at full cost recovery with profit including sufficient counterpart funds for project loans and contingencies for cost escalation and reserves for long-term development. 3. The connection fee is D800,000 (US$53.00)–1,200,000 (US$80.00) payable in advance.
Policy and Regulation
The Ministry of Construction’s national water supply strategy study, begun in December 1994, recommended service level targets based on a national water supply policy that conformed to the general policy guidelines on economic development set by the Government. Ministerial decisions in late 1998 and early 1999 set out general planning parameters for HCMC in terms of total and per capita water demands for 2010 and 2020. The decisions gave guidelines on urban water supply management and development including water loss targets and human resources development. Surface water allocation is administered by the Ministry of Irrigation. Groundwater regulation is the responsibility of the Ministry of Heavy Industry. The Ministry of Health is responsible for regulating drinking water quality, and wastewater quality and pollution control are enforced by the Ministry of Science, Technology, and Environment.
Wastewater
and Sanitation
The sewerage system in HCMC is combined with the storm drainage system and covers about 12% of the city. Coverage is particularly low in the new urban (1.0%) and rural districts (0.3%), which comprise about 73% of the city’s total area. The old urban districts have coverage of 42%. About 79% of households in HCMC discharge their waste in septic tanks.
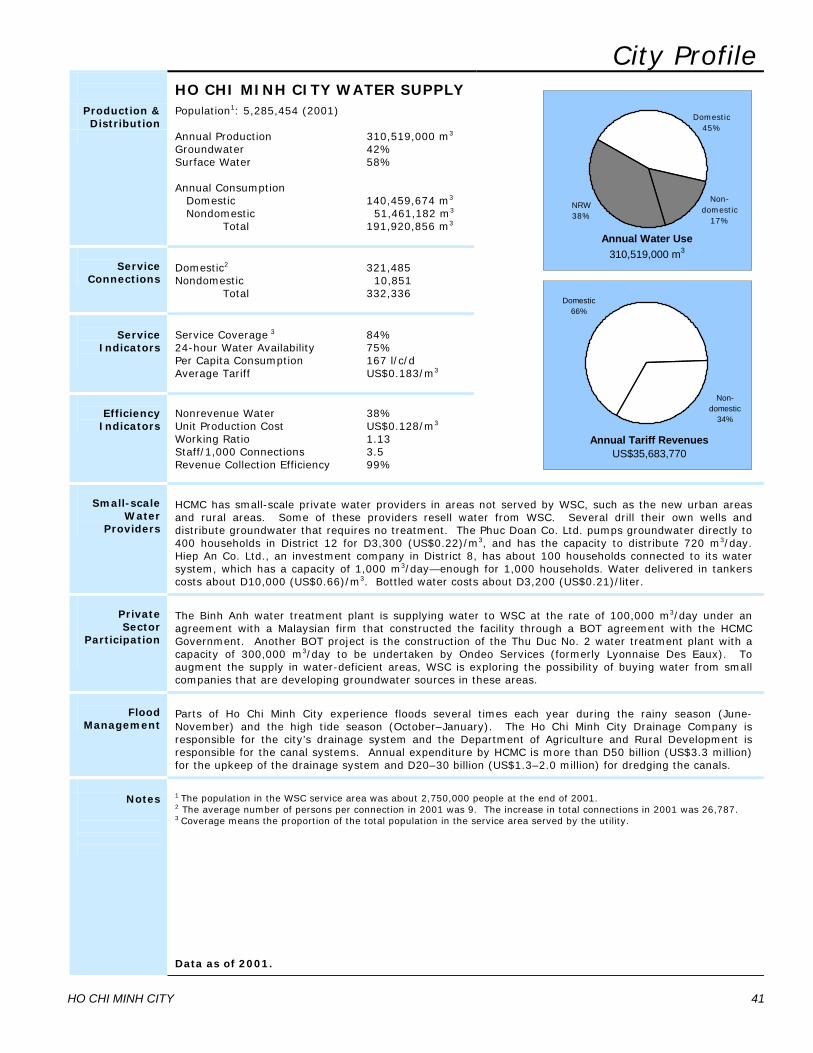
City Profile
HO CHI MINH CITY WATER SUPPLY Production & Distribution
Population1: 5,285,454 (2001)
Annual Production 310,519,000 m3
Groundwater 42% Surface Water 58% Annual Consumption Domestic 140,459,674 m3
Nondomestic 51,461,182 m3
Total 191,920,856 m3
Service Connections
Domestic2 321,485 Nondomestic 10,851 Total 332,336
Service
Indicators
Service Coverage 3 84% 24-hour Water Availability 75% Per Capita Consumption 167 l/c/d Average Tariff US$0.183/m3
Efficiency Indicators
Nonrevenue Water 38% Unit Production Cost US$0.128/m3
Working Ratio 1.13 Staff/1,000 Connections 3.5 Revenue Collection Efficiency 99%
Non-domestic
17%
NRW 38%
Domestic45%
Annual Water Use 310,519,000 m3
Annual Tariff Revenues US$35,683,770
Domestic66%
Non-domestic
34%
Small-scale
Water Providers
HCMC has small-scale private water providers in areas not served by WSC, such as the new urban areas and rural areas. Some of these providers resell water from WSC. Several drill their own wells and distribute groundwater that requires no treatment. The Phuc Doan Co. Ltd. pumps groundwater directly to 400 households in District 12 for D3,300 (US$0.22)/m3, and has the capacity to distribute 720 m3/day. Hiep An Co. Ltd., an investment company in District 8, has about 100 households connected to its water system, which has a capacity of 1,000 m3/day—enough for 1,000 households. Water delivered in tankers costs about D10,000 (US$0.66)/m3. Bottled water costs about D3,200 (US$0.21)/liter.
Private Sector
Participation
The Binh Anh water treatment plant is supplying water to WSC at the rate of 100,000 m3/day under an agreement with a Malaysian firm that constructed the facility through a BOT agreement with the HCMC Government. Another BOT project is the construction of the Thu Duc No. 2 water treatment plant with a capacity of 300,000 m3/day to be undertaken by Ondeo Services (formerly Lyonnaise Des Eaux). To augment the supply in water-deficient areas, WSC is exploring the possibility of buying water from small companies that are developing groundwater sources in these areas.
Flood
Management
Parts of Ho Chi Minh City experience floods several times each year during the rainy season (June- November) and the high tide season (October–January). The Ho Chi Minh City Drainage Company is responsible for the city’s drainage system and the Department of Agriculture and Rural Development is responsible for the canal systems. Annual expenditure by HCMC is more than D50 billion (US$3.3 million) for the upkeep of the drainage system and D20–30 billion (US$1.3–2.0 million) for dredging the canals.
Notes
1 The population in the WSC service area was about 2,750,000 people at the end of 2001. 2 The average number of persons per connection in 2001 was 9. The increase in total connections in 2001 was 26,787. 3 Coverage means the proportion of the total population in the service area served by the utility. Data as of 2001.
HO CHI MINH CITY 41
42 Water in Asian Cities
HONG KONG Utility Profile
Water Utility
WATER SUPPLIES DEPARTMENT
Address : 48/F Immigration Tower, 7 Gloucester Road, Wanchai, Hong Kong, China Telephone : (85-2) 2829 4500 Fax : (85-2) 2824 0578 E-mail : [email protected] Head : William G. C. Ko, Director
The Water Supplies Department (WSD) of the Government of Hong Kong Special Administrative Region of the People’s Republic of China (Government of the HKSAR) is tasked with developing and managing water services for the city. The utility, which dates back to 1863, buys about 78% of its water supply from mainland People’s Republic of China, treats the water, and distributes it to the urban population of 6,865,600 people. It also distributes seawater for flushing purposes.
General Data
About Water Utility
Connections : 2,430,000 Staff : 5,673 Annual O&M Costs : US$794,151,600 Annual Revenue : US$329,870,460 Annual Capital Expenditure : US$279,466,460 Source of Investment Funds : 100% government grant
Water
Resources Management
Since 1960, the Government of the HKSAR has made agreements with Guangdong authorities for the supply of raw water from the East River. In 2001, this river contributed about 78% of the water supply; rainwater, impounded in 120 km of channels and 17 reservoirs, supplied the remaining 22%. The freshwater supply is supplemented by a unique seawater supply system, which saves about 20% of freshwater needs.
Tariff Structure
Rate (4-month period)
Category
HK$/m3 US$/m3
Domestic First 12 m3
Next 31 m3
Next 19 m3
Remainder
Free 4.16 6.45 9.05
Free 0.534 0.827 1.161
Nondomestic Trade Construction Shipping Ocean going Nonocean going
4.58 7.11
10.93 4.58
0.587 0.912
1.402 0.587
Flushing Water First 30 m3
Remainder
Free 4.58
Free 0.587
Notes: 1. This tariff structure has been in effect since 16 February 1995.
2. Charges are for 4-month periods. Flushing water is billed separately to registered customers. 3. All consumers pay on metered use and most are billed every 4 months; large consumers are billed monthly. 4. Consumers pay at banks, post offices, automated teller machines, the utility office or at government collection offices. 5. The connection fee for pipes up to 20 mm in diameter and for any length up to 100 meters is HK$1,140 (US$146.21).
6. There is a sewerage surcharge of approximately 20% in the water bill.
Policy and Regulation
The water policy objective of the Government of the HKSAR is to ensure the provision of reliable, adequate, and quality water and an efficient water supply service, as stated in the vision, mission, and values statements of WSD. In setting water charges, the major factors considered are the financial impact on customers, cost recovery and return on assets, prevention of waste, and avoidance of cross subsidy. WSD is a government utility and is self-regulated, but is accountable to the Waterworks Account Committee. Other government departments monitor health (Health Department), radiological (Hong Kong Observatory), and environmental (Environmental Protection Department) aspects of the water supply.
Wastewater
and Sanitation
The entire city population of Hong Kong has access to sewerage. Septic tanks are used only in remote villages where desludging is done by tankers. The Environmental Protection Department regulates industrial effluent disposal and water pollution control including issuance of standards for effluents discharged into the drainage and sewerage systems and coastal waters. The Drainage Services Department invested about US$1,140 million in sanitation during 1997–2002.
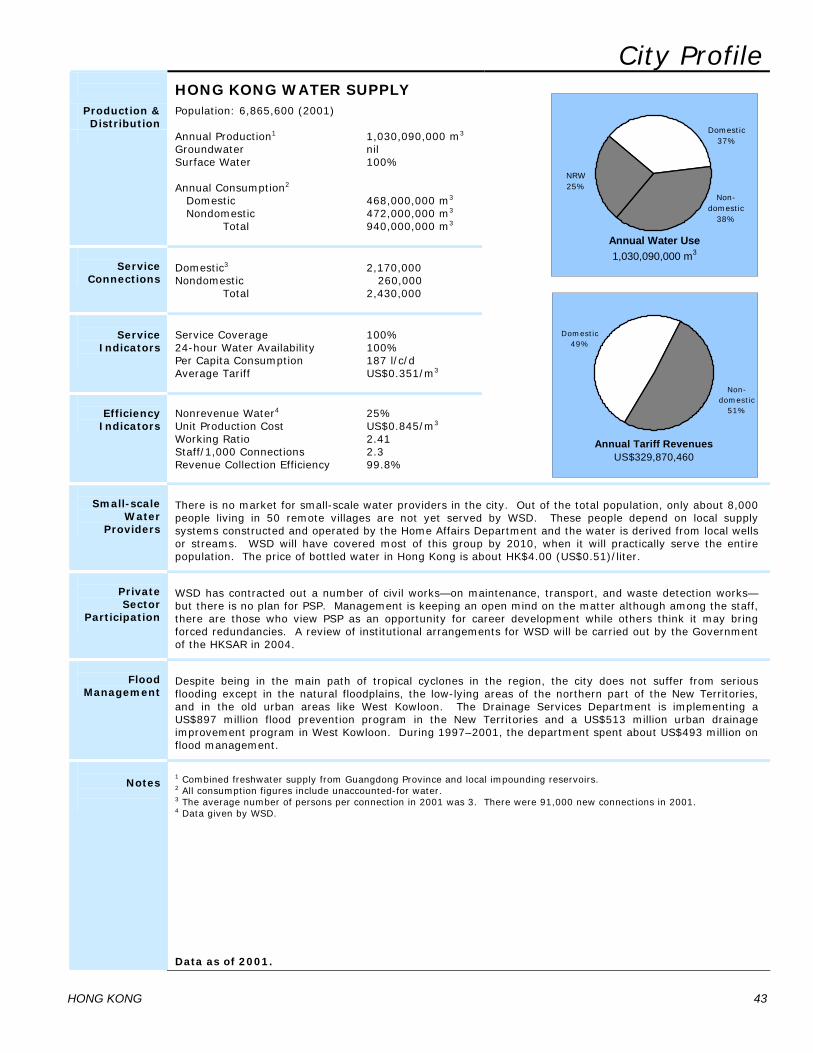
HONG KONG 43
City Profile
HONG KONG WATER SUPPLY Production & Distribution
Population: 6,865,600 (2001)
Annual Production1 1,030,090,000 m3 Groundwater nil Surface Water 100% Annual Consumption2 Domestic 468,000,000 m3 Nondomestic 472,000,000 m3 Total 940,000,000 m3
Service Connections
Domestic3 2,170,000 Nondomestic 260,000 Total 2,430,000
Service
Indicators
Service Coverage 100% 24-hour Water Availability 100% Per Capita Consumption 187 l/c/d Average Tariff US$0.351/m3
Efficiency
Indicators
Nonrevenue Water4 25% Unit Production Cost US$0.845/m3 Working Ratio 2.41 Staff/1,000 Connections 2.3 Revenue Collection Efficiency 99.8%
Non-domestic
38%
NRW 25%
Domestic37%
Annual Water Use 1,030,090,000 m3
Non-domestic
51%
Domestic49%
Annual Tariff Revenues US$329,870,460
Small-scale Water
Providers
There is no market for small-scale water providers in the city. Out of the total population, only about 8,000 people living in 50 remote villages are not yet served by WSD. These people depend on local supply systems constructed and operated by the Home Affairs Department and the water is derived from local wells or streams. WSD will have covered most of this group by 2010, when it will practically serve the entire population. The price of bottled water in Hong Kong is about HK$4.00 (US$0.51)/liter.
Private Sector
Participation
WSD has contracted out a number of civil works—on maintenance, transport, and waste detection works—but there is no plan for PSP. Management is keeping an open mind on the matter although among the staff, there are those who view PSP as an opportunity for career development while others think it may bring forced redundancies. A review of institutional arrangements for WSD will be carried out by the Government of the HKSAR in 2004.
Flood
Management
Despite being in the main path of tropical cyclones in the region, the city does not suffer from serious flooding except in the natural floodplains, the low-lying areas of the northern part of the New Territories, and in the old urban areas like West Kowloon. The Drainage Services Department is implementing a US$897 million flood prevention program in the New Territories and a US$513 million urban drainage improvement program in West Kowloon. During 1997–2001, the department spent about US$493 million on flood management.
Notes
1 Combined freshwater supply from Guangdong Province and local impounding reservoirs. 2 All consumption figures include unaccounted-for water. 3 The average number of persons per connection in 2001 was 3. There were 91,000 new connections in 2001. 4 Data given by WSD. Data as of 2001.
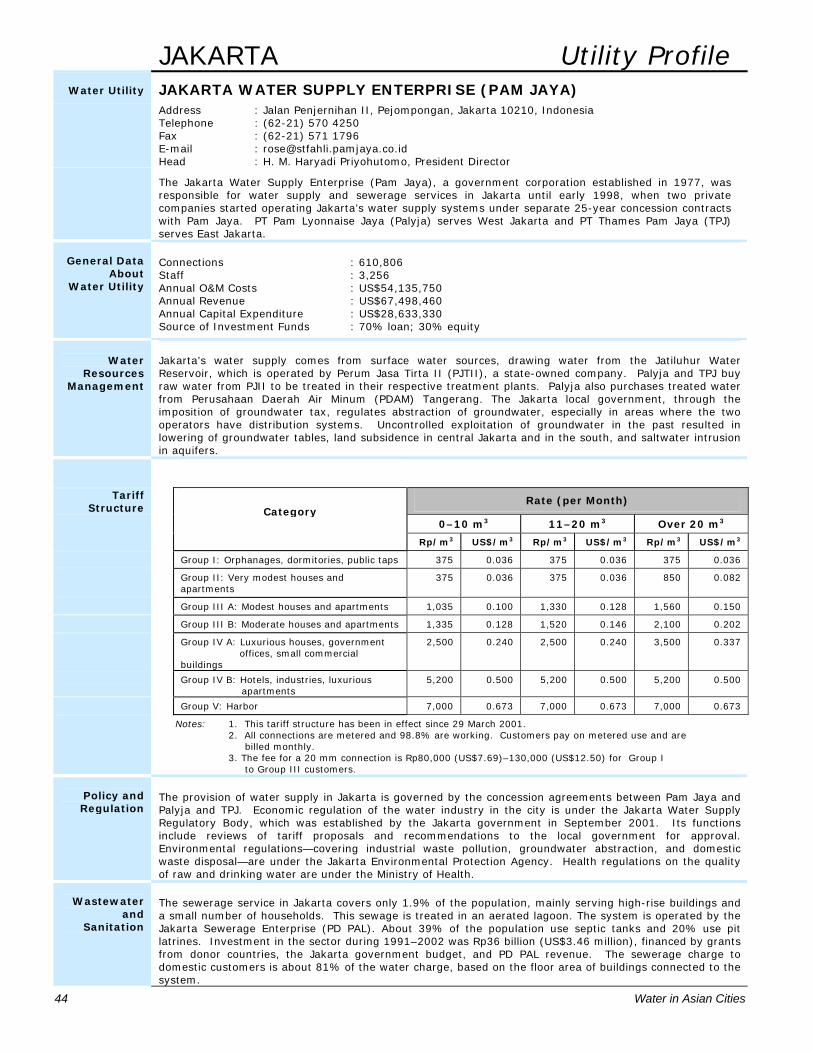
44 Water in Asian Cities
JAKARTA Utility Profile
Water Utility
JAKARTA WATER SUPPLY ENTERPRISE (PAM JAYA) Address : Jalan Penjernihan II, Pejompongan, Jakarta 10210, Indonesia
Telephone : (62-21) 570 4250 Fax : (62-21) 571 1796 E-mail : [email protected] Head : H. M. Haryadi Priyohutomo, President Director
The Jakarta Water Supply Enterprise (Pam Jaya), a government corporation established in 1977, was responsible for water supply and sewerage services in Jakarta until early 1998, when two private companies started operating Jakarta’s water supply systems under separate 25-year concession contracts with Pam Jaya. PT Pam Lyonnaise Jaya (Palyja) serves West Jakarta and PT Thames Pam Jaya (TPJ) serves East Jakarta.
General Data
About Water Utility
Connections : 610,806 Staff : 3,256 Annual O&M Costs : US$54,135,750 Annual Revenue : US$67,498,460 Annual Capital Expenditure : US$28,633,330 Source of Investment Funds : 70% loan; 30% equity
Water
Resources Management
Jakarta’s water supply comes from surface water sources, drawing water from the Jatiluhur Water Reservoir, which is operated by Perum Jasa Tirta II (PJTII), a state-owned company. Palyja and TPJ buy raw water from PJII to be treated in their respective treatment plants. Palyja also purchases treated water from Perusahaan Daerah Air Minum (PDAM) Tangerang. The Jakarta local government, through the imposition of groundwater tax, regulates abstraction of groundwater, especially in areas where the two operators have distribution systems. Uncontrolled exploitation of groundwater in the past resulted in lowering of groundwater tables, land subsidence in central Jakarta and in the south, and saltwater intrusion in aquifers.
Tariff Structure
Rate (per Month)
0–10 m3 11–20 m3 Over 20 m3
Category
Rp/m3 US$/m3 Rp/m3 US$/m3 Rp/m3 US$/m3
Group I: Orphanages, dormitories, public taps 375 0.036 375 0.036 375 0.036
Group II: Very modest houses and apartments
375 0.036 375 0.036 850 0.082
Group III A: Modest houses and apartments 1,035 0.100 1,330 0.128 1,560 0.150
Group III B: Moderate houses and apartments 1,335 0.128 1,520 0.146 2,100 0.202
Group IV A: Luxurious houses, government offices, small commercial buildings
2,500 0.240 2,500 0.240 3,500 0.337
Group IV B: Hotels, industries, luxurious apartments
5,200 0.500 5,200 0.500 5,200 0.500
Group V: Harbor 7,000 0.673 7,000 0.673 7,000 0.673
Notes: 1. This tariff structure has been in effect since 29 March 2001. 2. All connections are metered and 98.8% are working. Customers pay on metered use and are billed monthly. 3. The fee for a 20 mm connection is Rp80,000 (US$7.69)–130,000 (US$12.50) for Group I to Group III customers.
Policy and Regulation
The provision of water supply in Jakarta is governed by the concession agreements between Pam Jaya and Palyja and TPJ. Economic regulation of the water industry in the city is under the Jakarta Water Supply Regulatory Body, which was established by the Jakarta government in September 2001. Its functions include reviews of tariff proposals and recommendations to the local government for approval. Environmental regulations—covering industrial waste pollution, groundwater abstraction, and domestic waste disposal—are under the Jakarta Environmental Protection Agency. Health regulations on the quality of raw and drinking water are under the Ministry of Health.
Wastewater
and Sanitation
The sewerage service in Jakarta covers only 1.9% of the population, mainly serving high-rise buildings and a small number of households. This sewage is treated in an aerated lagoon. The system is operated by the Jakarta Sewerage Enterprise (PD PAL). About 39% of the population use septic tanks and 20% use pit latrines. Investment in the sector during 1991–2002 was Rp36 billion (US$3.46 million), financed by grants from donor countries, the Jakarta government budget, and PD PAL revenue. The sewerage charge to domestic customers is about 81% of the water charge, based on the floor area of buildings connected to the system.
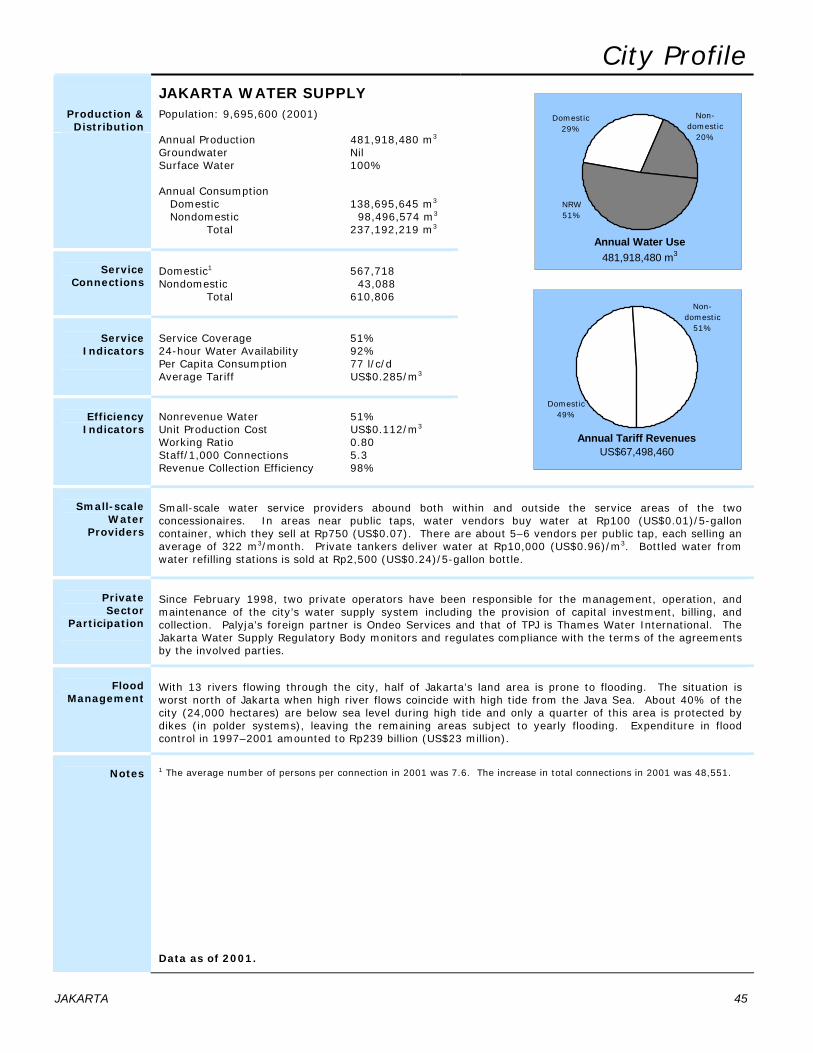
JAKARTA 45
City Profile
JAKARTA WATER SUPPLY Production & Distribution
Population: 9,695,600 (2001)
Annual Production 481,918,480 m3 Groundwater Nil Surface Water 100% Annual Consumption Domestic 138,695,645 m3 Nondomestic 98,496,574 m3 Total 237,192,219 m3
Service Connections
Domestic1 567,718 Nondomestic 43,088 Total 610,806
Service
Indicators
Service Coverage 51% 24-hour Water Availability 92% Per Capita Consumption 77 l/c/d Average Tariff US$0.285/m3
Efficiency
Indicators
Nonrevenue Water 51% Unit Production Cost US$0.112/m3 Working Ratio 0.80 Staff/1,000 Connections 5.3 Revenue Collection Efficiency 98%
Domestic29%
NRW 51%
Non-domestic
20%
Annual Water Use 481,918,480 m3
Non-domestic
51%
Domestic49%
Annual Tariff Revenues US$67,498,460
Small-scale
Water Providers
Small-scale water service providers abound both within and outside the service areas of the two concessionaires. In areas near public taps, water vendors buy water at Rp100 (US$0.01)/5-gallon container, which they sell at Rp750 (US$0.07). There are about 5–6 vendors per public tap, each selling an average of 322 m3/month. Private tankers deliver water at Rp10,000 (US$0.96)/m3. Bottled water from water refilling stations is sold at Rp2,500 (US$0.24)/5-gallon bottle.
Private Sector
Participation
Since February 1998, two private operators have been responsible for the management, operation, and maintenance of the city’s water supply system including the provision of capital investment, billing, and collection. Palyja’s foreign partner is Ondeo Services and that of TPJ is Thames Water International. The Jakarta Water Supply Regulatory Body monitors and regulates compliance with the terms of the agreements by the involved parties.
Flood
Management
With 13 rivers flowing through the city, half of Jakarta’s land area is prone to flooding. The situation is worst north of Jakarta when high river flows coincide with high tide from the Java Sea. About 40% of the city (24,000 hectares) are below sea level during high tide and only a quarter of this area is protected by dikes (in polder systems), leaving the remaining areas subject to yearly flooding. Expenditure in flood control in 1997–2001 amounted to Rp239 billion (US$23 million).
Notes
1 The average number of persons per connection in 2001 was 7.6. The increase in total connections in 2001 was 48,551.
Data as of 2001.
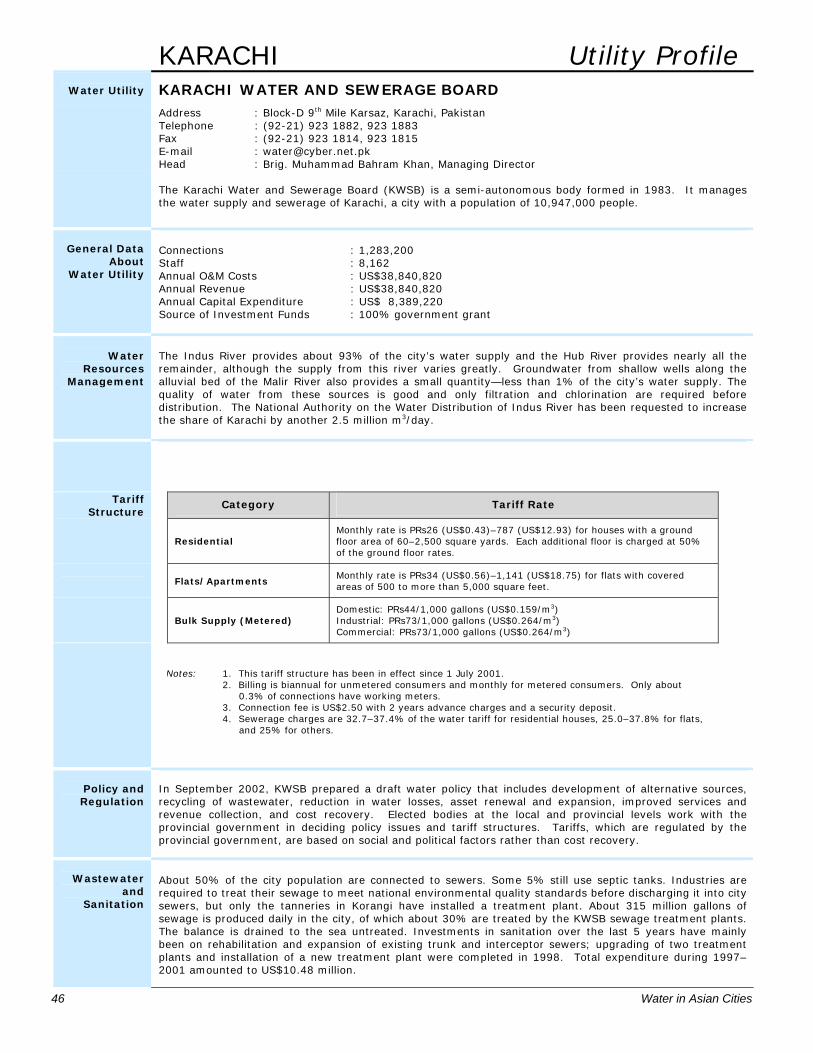
46 Water in Asian Cities
KARACHI Utility Profile
Water Utility
KARACHI WATER AND SEWERAGE BOARD Address : Block-D 9th Mile Karsaz, Karachi, Pakistan
Telephone : (92-21) 923 1882, 923 1883 Fax : (92-21) 923 1814, 923 1815 E-mail : [email protected] Head : Brig. Muhammad Bahram Khan, Managing Director
The Karachi Water and Sewerage Board (KWSB) is a semi-autonomous body formed in 1983. It manages the water supply and sewerage of Karachi, a city with a population of 10,947,000 people.
General Data
About Water Utility
Connections : 1,283,200 Staff : 8,162 Annual O&M Costs : US$38,840,820 Annual Revenue : US$38,840,820 Annual Capital Expenditure : US$ 8,389,220 Source of Investment Funds : 100% government grant
Water
Resources Management
The Indus River provides about 93% of the city’s water supply and the Hub River provides nearly all the remainder, although the supply from this river varies greatly. Groundwater from shallow wells along the alluvial bed of the Malir River also provides a small quantity—less than 1% of the city’s water supply. The quality of water from these sources is good and only filtration and chlorination are required before distribution. The National Authority on the Water Distribution of Indus River has been requested to increase the share of Karachi by another 2.5 million m3/day.
Tariff Structure
Category Tariff Rate
Residential Monthly rate is PRs26 (US$0.43)–787 (US$12.93) for houses with a ground floor area of 60–2,500 square yards. Each additional floor is charged at 50% of the ground floor rates.
Flats/Apartments
Monthly rate is PRs34 (US$0.56)–1,141 (US$18.75) for flats with covered areas of 500 to more than 5,000 square feet.
Bulk Supply (Metered) Domestic: PRs44/1,000 gallons (US$0.159/m3) Industrial: PRs73/1,000 gallons (US$0.264/m3) Commercial: PRs73/1,000 gallons (US$0.264/m3)
Notes: 1. This tariff structure has been in effect since 1 July 2001. 2. Billing is biannual for unmetered consumers and monthly for metered consumers. Only about 0.3% of connections have working meters. 3. Connection fee is US$2.50 with 2 years advance charges and a security deposit. 4. Sewerage charges are 32.7–37.4% of the water tariff for residential houses, 25.0–37.8% for flats, and 25% for others.
Policy and Regulation
In September 2002, KWSB prepared a draft water policy that includes development of alternative sources, recycling of wastewater, reduction in water losses, asset renewal and expansion, improved services and revenue collection, and cost recovery. Elected bodies at the local and provincial levels work with the provincial government in deciding policy issues and tariff structures. Tariffs, which are regulated by the provincial government, are based on social and political factors rather than cost recovery.
Wastewater
and Sanitation
About 50% of the city population are connected to sewers. Some 5% still use septic tanks. Industries are required to treat their sewage to meet national environmental quality standards before discharging it into city sewers, but only the tanneries in Korangi have installed a treatment plant. About 315 million gallons of sewage is produced daily in the city, of which about 30% are treated by the KWSB sewage treatment plants. The balance is drained to the sea untreated. Investments in sanitation over the last 5 years have mainly been on rehabilitation and expansion of existing trunk and interceptor sewers; upgrading of two treatment plants and installation of a new treatment plant were completed in 1998. Total expenditure during 1997–2001 amounted to US$10.48 million.
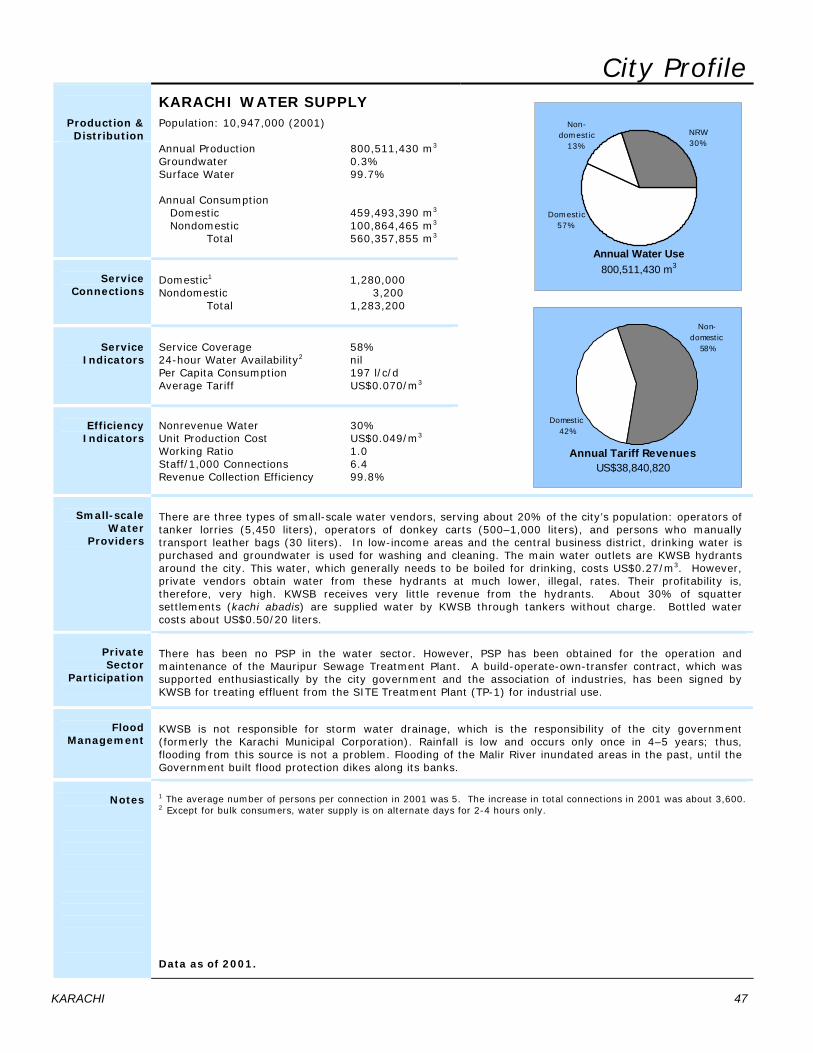
City Profile
KARACHI WATER SUPPLY Production & Distribution
Population: 10,947,000 (2001)
Annual Production 800,511,430 m3
Groundwater 0.3% Surface Water 99.7% Annual Consumption Domestic 459,493,390 m3
Nondomestic 100,864,465 m3
Total 560,357,855 m3
Service Connections
Domestic1 1,280,000 Nondomestic 3,200 Total 1,283,200
Service
Indicators
Service Coverage 58% 24-hour Water Availability2 nil Per Capita Consumption 197 l/c/d Average Tariff US$0.070/m3
Efficiency Indicators
Nonrevenue Water 30% Unit Production Cost US$0.049/m3
Working Ratio 1.0 Staff/1,000 Connections 6.4 Revenue Collection Efficiency 99.8%
Non-domestic
13%
NRW 30%
Domestic57%
Annual Water Use 800,511,430 m3
Non-domest ic
58%
Domest ic42%
Annual Tariff Revenues US$38,840,820
Small-scale
Water Providers
There are three types of small-scale water vendors, serving about 20% of the city’s population: operators of tanker lorries (5,450 liters), operators of donkey carts (500–1,000 liters), and persons who manually transport leather bags (30 liters). In low-income areas and the central business district, drinking water is purchased and groundwater is used for washing and cleaning. The main water outlets are KWSB hydrants around the city. This water, which generally needs to be boiled for drinking, costs US$0.27/m3. However, private vendors obtain water from these hydrants at much lower, illegal, rates. Their profitability is, therefore, very high. KWSB receives very little revenue from the hydrants. About 30% of squatter settlements (kachi abadis) are supplied water by KWSB through tankers without charge. Bottled water costs about US$0.50/20 liters.
Private Sector
Participation
There has been no PSP in the water sector. However, PSP has been obtained for the operation and maintenance of the Mauripur Sewage Treatment Plant. A build-operate-own-transfer contract, which was supported enthusiastically by the city government and the association of industries, has been signed by KWSB for treating effluent from the SITE Treatment Plant (TP-1) for industrial use.
Flood
Management
KWSB is not responsible for storm water drainage, which is the responsibility of the city government (formerly the Karachi Municipal Corporation). Rainfall is low and occurs only once in 4–5 years; thus, flooding from this source is not a problem. Flooding of the Malir River inundated areas in the past, until the Government built flood protection dikes along its banks.
Notes
1 The average number of persons per connection in 2001 was 5. The increase in total connections in 2001 was about 3,600. 2 Except for bulk consumers, water supply is on alternate days for 2-4 hours only.
Data as of 2001.
KARACHI 47
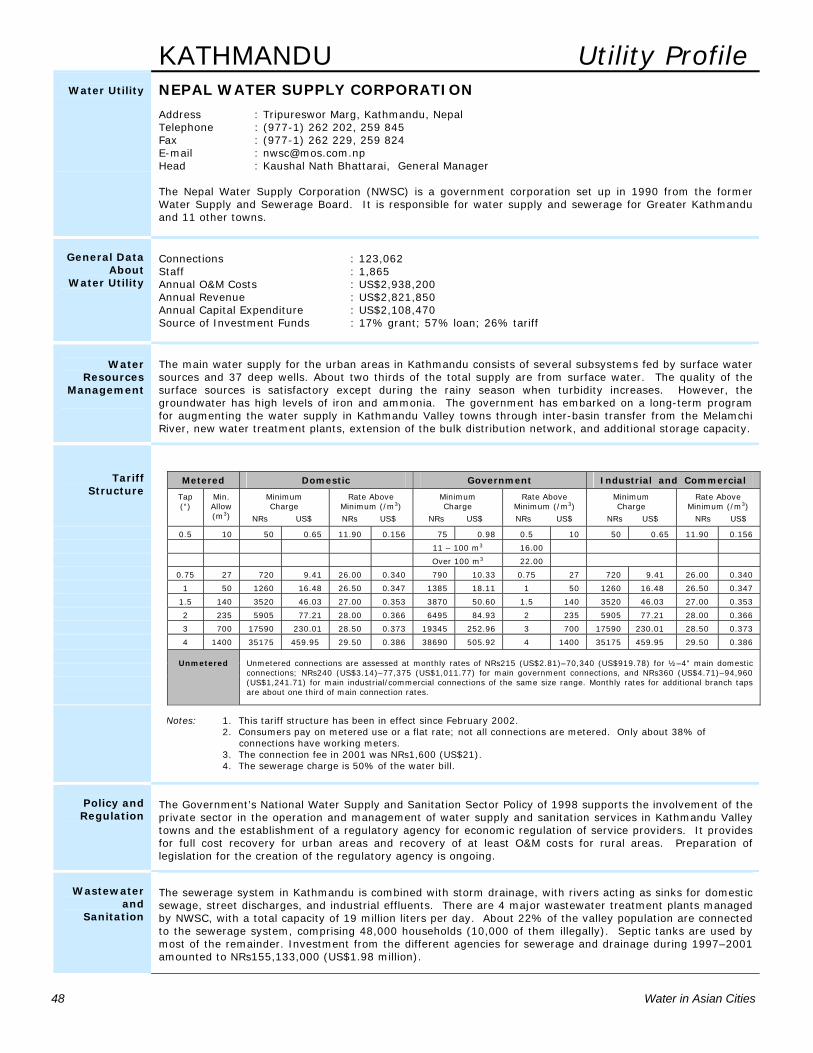
48 Water in Asian Cities
KATHMANDU Utility Profile
Water Utility
NEPAL WATER SUPPLY CORPORATION
Address : Tripureswor Marg, Kathmandu, Nepal Telephone : (977-1) 262 202, 259 845 Fax : (977-1) 262 229, 259 824 E-mail : [email protected] Head : Kaushal Nath Bhattarai, General Manager
The Nepal Water Supply Corporation (NWSC) is a government corporation set up in 1990 from the former Water Supply and Sewerage Board. It is responsible for water supply and sewerage for Greater Kathmandu and 11 other towns.
General Data
About Water Utility
Connections : 123,062 Staff : 1,865 Annual O&M Costs : US$2,938,200 Annual Revenue : US$2,821,850 Annual Capital Expenditure : US$2,108,470 Source of Investment Funds : 17% grant; 57% loan; 26% tariff
Water
Resources Management
The main water supply for the urban areas in Kathmandu consists of several subsystems fed by surface water sources and 37 deep wells. About two thirds of the total supply are from surface water. The quality of the surface sources is satisfactory except during the rainy season when turbidity increases. However, the groundwater has high levels of iron and ammonia. The government has embarked on a long-term program for augmenting the water supply in Kathmandu Valley towns through inter-basin transfer from the Melamchi River, new water treatment plants, extension of the bulk distribution network, and additional storage capacity.
Metered Domestic Government Industrial and Commercial
Tariff Structure Tap
(“) Min. Allow (m3)
Minimum Charge
NRs US$
Rate Above Minimum (/m3)
NRs US$
Minimum Charge
NRs US$
Rate Above Minimum (/m3)
NRs US$
Minimum Charge
NRs US$
Rate Above Minimum (/m3)
NRs US$
0.5 10 50 0.65 11.90 0.156 75 0.98 0.5 10 50 0.65 11.90 0.156
11 – 100 m3 16.00
Over 100 m3 22.00
0.75 27 720 9.41 26.00 0.340 790 10.33 0.75 27 720 9.41 26.00 0.340
1 50 1260 16.48 26.50 0.347 1385 18.11 1 50 1260 16.48 26.50 0.347
1.5 140 3520 46.03 27.00 0.353 3870 50.60 1.5 140 3520 46.03 27.00 0.353
2 235 5905 77.21 28.00 0.366 6495 84.93 2 235 5905 77.21 28.00 0.366
3 700 17590 230.01 28.50 0.373 19345 252.96 3 700 17590 230.01 28.50 0.373
4 1400 35175 459.95 29.50 0.386 38690 505.92 4 1400 35175 459.95 29.50 0.386
Unmetered Unmetered connections are assessed at monthly rates of NRs215 (US$2.81)–70,340 (US$919.78) for ½–4” main domestic connections; NRs240 (US$3.14)–77,375 (US$1,011.77) for main government connections, and NRs360 (US$4.71)–94,960 (US$1,241.71) for main industrial/commercial connections of the same size range. Monthly rates for additional branch taps are about one third of main connection rates.
Notes: 1. This tariff structure has been in effect since February 2002.
2. Consumers pay on metered use or a flat rate; not all connections are metered. Only about 38% of connections have working meters. 3. The connection fee in 2001 was NRs1,600 (US$21). 4. The sewerage charge is 50% of the water bill.
Policy and Regulation
The Government’s National Water Supply and Sanitation Sector Policy of 1998 supports the involvement of the private sector in the operation and management of water supply and sanitation services in Kathmandu Valley towns and the establishment of a regulatory agency for economic regulation of service providers. It provides for full cost recovery for urban areas and recovery of at least O&M costs for rural areas. Preparation of legislation for the creation of the regulatory agency is ongoing.
Wastewater
and Sanitation
The sewerage system in Kathmandu is combined with storm drainage, with rivers acting as sinks for domestic sewage, street discharges, and industrial effluents. There are 4 major wastewater treatment plants managed by NWSC, with a total capacity of 19 million liters per day. About 22% of the valley population are connected to the sewerage system, comprising 48,000 households (10,000 of them illegally). Septic tanks are used by most of the remainder. Investment from the different agencies for sewerage and drainage during 1997–2001 amounted to NRs155,133,000 (US$1.98 million).
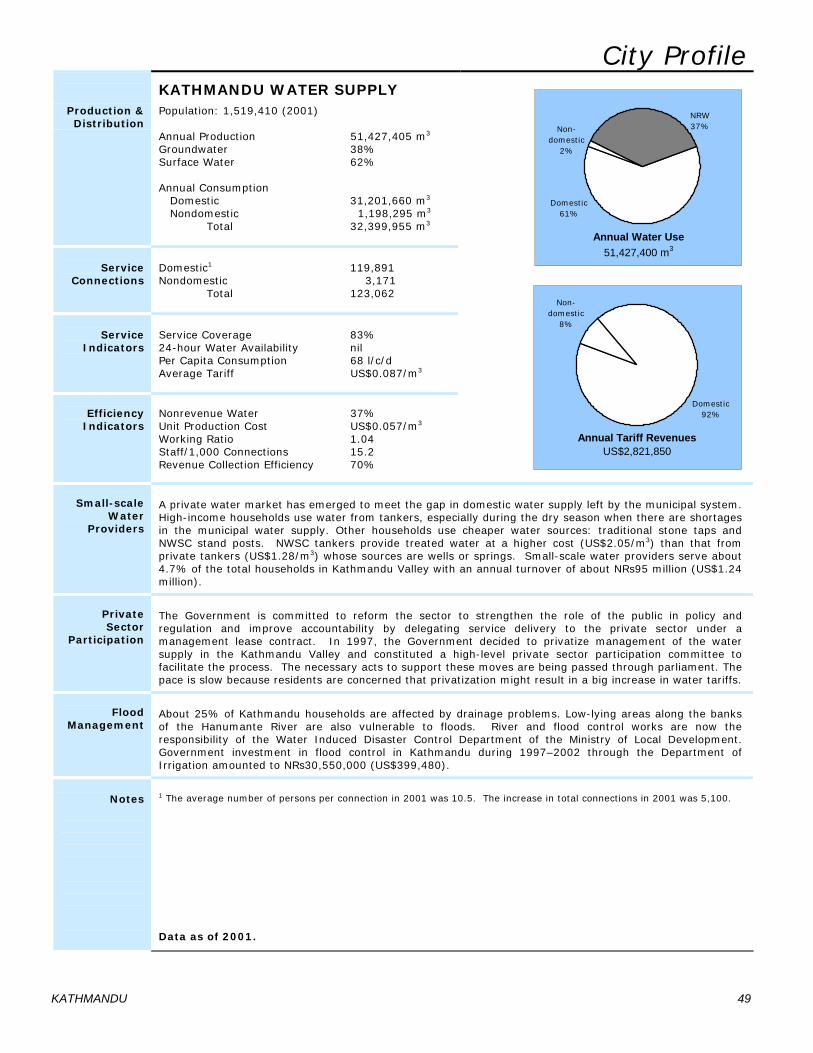
City Profile
KATHMANDU WATER SUPPLY
Production & Distribution
Population: 1,519,410 (2001)
Annual Production 51,427,405 m3
Groundwater 38% Surface Water 62% Annual Consumption Domestic 31,201,660 m3
Nondomestic 1,198,295 m3
Total 32,399,955 m3
Service Connections
Domestic1 119,891 Nondomestic 3,171 Total 123,062
Service
Indicators
Service Coverage 83% 24-hour Water Availability nil Per Capita Consumption 68 l/c/d Average Tariff US$0.087/m3
Efficiency Indicators
Nonrevenue Water 37% Unit Production Cost US$0.057/m3
Working Ratio 1.04 Staff/1,000 Connections 15.2 Revenue Collection Efficiency 70%
Non-domestic
2%
NRW 37%
Domestic61%
Annual Water Use 51,427,400 m3
Non-domestic
8%
Domestic92%
Annual Tariff Revenues US$2,821,850
Small-scale
Water Providers
A private water market has emerged to meet the gap in domestic water supply left by the municipal system. High-income households use water from tankers, especially during the dry season when there are shortages in the municipal water supply. Other households use cheaper water sources: traditional stone taps and NWSC stand posts. NWSC tankers provide treated water at a higher cost (US$2.05/m3) than that from private tankers (US$1.28/m3) whose sources are wells or springs. Small-scale water providers serve about 4.7% of the total households in Kathmandu Valley with an annual turnover of about NRs95 million (US$1.24 million).
Private Sector
Participation
The Government is committed to reform the sector to strengthen the role of the public in policy and regulation and improve accountability by delegating service delivery to the private sector under a management lease contract. In 1997, the Government decided to privatize management of the water supply in the Kathmandu Valley and constituted a high-level private sector participation committee to facilitate the process. The necessary acts to support these moves are being passed through parliament. The pace is slow because residents are concerned that privatization might result in a big increase in water tariffs.
Flood
Management
About 25% of Kathmandu households are affected by drainage problems. Low-lying areas along the banks of the Hanumante River are also vulnerable to floods. River and flood control works are now the responsibility of the Water Induced Disaster Control Department of the Ministry of Local Development. Government investment in flood control in Kathmandu during 1997–2002 through the Department of Irrigation amounted to NRs30,550,000 (US$399,480).
Notes
1 The average number of persons per connection in 2001 was 10.5. The increase in total connections in 2001 was 5,100. Data as of 2001.
KATHMANDU 49
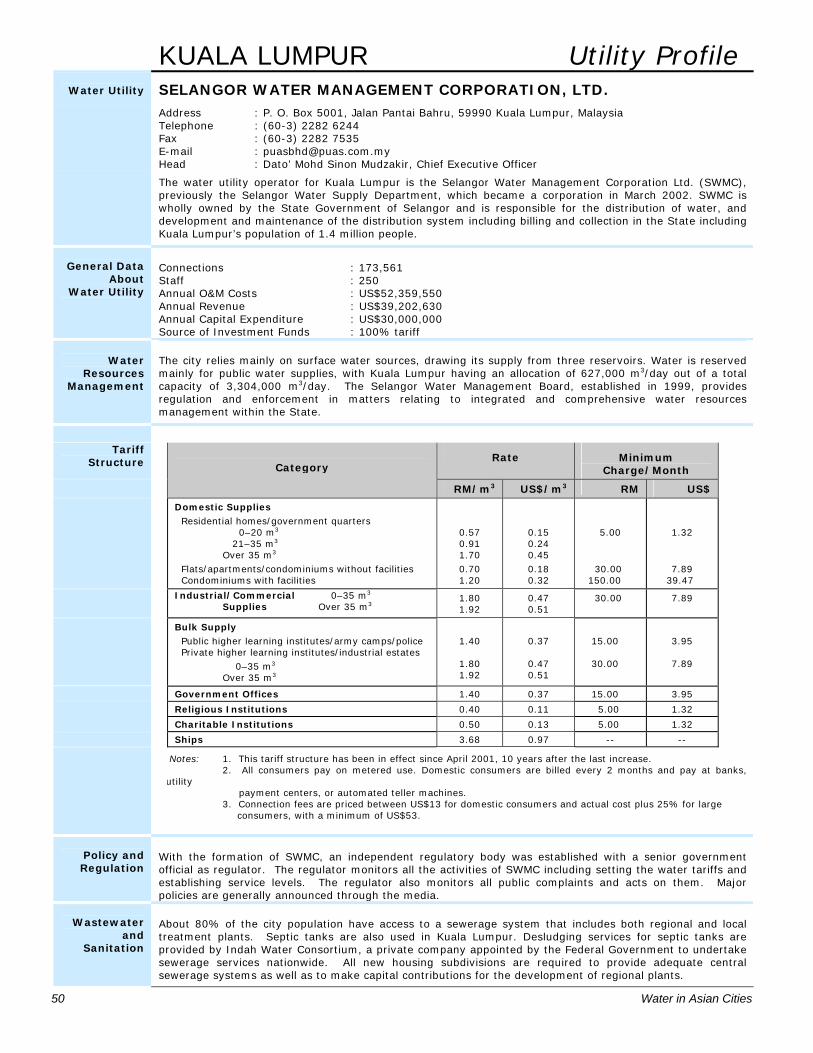
50 Water in Asian Cities
KUALA LUMPUR Utility Profile
Water Utility
SELANGOR WATER MANAGEMENT CORPORATION, LTD. Address : P. O. Box 5001, Jalan Pantai Bahru, 59990 Kuala Lumpur, Malaysia
Telephone : (60-3) 2282 6244 Fax : (60-3) 2282 7535 E-mail : [email protected] Head : Dato’ Mohd Sinon Mudzakir, Chief Executive Officer
The water utility operator for Kuala Lumpur is the Selangor Water Management Corporation Ltd. (SWMC), previously the Selangor Water Supply Department, which became a corporation in March 2002. SWMC is wholly owned by the State Government of Selangor and is responsible for the distribution of water, and development and maintenance of the distribution system including billing and collection in the State including Kuala Lumpur’s population of 1.4 million people.
General Data
About Water Utility
Connections : 173,561 Staff : 250 Annual O&M Costs : US$52,359,550 Annual Revenue : US$39,202,630 Annual Capital Expenditure : US$30,000,000 Source of Investment Funds : 100% tariff
Water
Resources Management
The city relies mainly on surface water sources, drawing its supply from three reservoirs. Water is reserved mainly for public water supplies, with Kuala Lumpur having an allocation of 627,000 m3/day out of a total capacity of 3,304,000 m3/day. The Selangor Water Management Board, established in 1999, provides regulation and enforcement in matters relating to integrated and comprehensive water resources management within the State.
Tariff Structure
Rate Minimum
Charge/Month
Category
RM/m3 US$/m3 RM US$
Domestic Supplies Residential homes/government quarters 0–20 m3
21–35 m3
Over 35 m3
Flats/apartments/condominiums without facilities Condominiums with facilities
0.57 0.91 1.70 0.70 1.20
0.15 0.24 0.45 0.18 0.32
5.00
30.00 150.00
1.32
7.89 39.47
Industrial/Commercial 0–35 m3 Supplies Over 35 m3
1.80 1.92
0.47 0.51
30.00 7.89
Bulk Supply Public higher learning institutes/army camps/police Private higher learning institutes/industrial estates 0–35 m3
Over 35 m3
1.40
1.80 1.92
0.37
0.47 0.51
15.00
30.00
3.95
7.89
Government Offices 1.40 0.37 15.00 3.95
Religious Institutions 0.40 0.11 5.00 1.32
Charitable Institutions 0.50 0.13 5.00 1.32
Ships 3.68 0.97 -- --
Notes: 1. This tariff structure has been in effect since April 2001, 10 years after the last increase. 2. All consumers pay on metered use. Domestic consumers are billed every 2 months and pay at banks,
utility payment centers, or automated teller machines. 3. Connection fees are priced between US$13 for domestic consumers and actual cost plus 25% for large consumers, with a minimum of US$53.
Policy and Regulation
With the formation of SWMC, an independent regulatory body was established with a senior government official as regulator. The regulator monitors all the activities of SWMC including setting the water tariffs and establishing service levels. The regulator also monitors all public complaints and acts on them. Major policies are generally announced through the media.
Wastewater
and Sanitation
About 80% of the city population have access to a sewerage system that includes both regional and local treatment plants. Septic tanks are also used in Kuala Lumpur. Desludging services for septic tanks are provided by Indah Water Consortium, a private company appointed by the Federal Government to undertake sewerage services nationwide. All new housing subdivisions are required to provide adequate central sewerage systems as well as to make capital contributions for the development of regional plants.
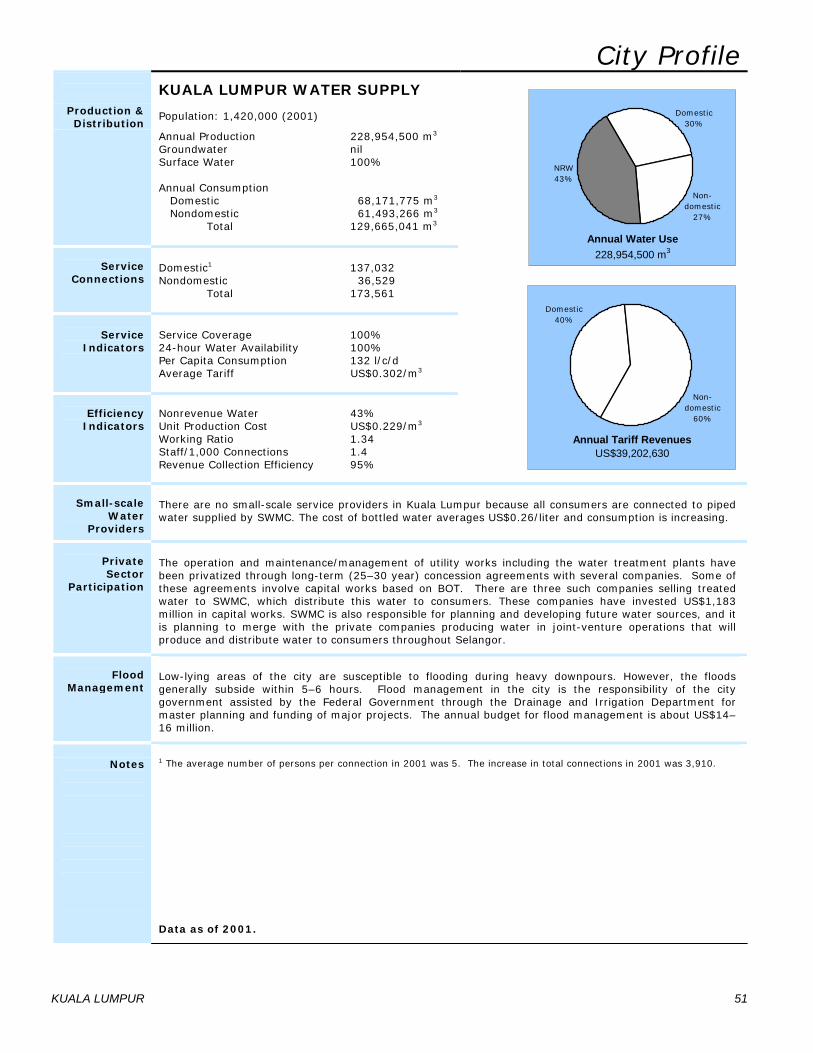
City Profile
KUALA LUMPUR WATER SUPPLY
Production & Distribution
Population: 1,420,000 (2001)
Annual Production 228,954,500 m3
Groundwater nil Surface Water 100% Annual Consumption Domestic 68,171,775 m3
Nondomestic 61,493,266 m3
Total 129,665,041 m3
Service Connections
Domestic1 137,032 Nondomestic 36,529 Total 173,561
Service
Indicators
Service Coverage 100% 24-hour Water Availability 100% Per Capita Consumption 132 l/c/d Average Tariff US$0.302/m3
Efficiency Indicators
Nonrevenue Water 43% Unit Production Cost US$0.229/m3
Working Ratio 1.34 Staff/1,000 Connections 1.4 Revenue Collection Efficiency 95%
Domestic30%
NRW 43%
Non-domestic
27%
Annual Water Use 228,954,500 m3
Non-domestic
60%
Domestic40%
Annual Tariff Revenues US$39,202,630
Small-scale
Water Providers
There are no small-scale service providers in Kuala Lumpur because all consumers are connected to piped water supplied by SWMC. The cost of bottled water averages US$0.26/liter and consumption is increasing.
Private Sector
Participation
The operation and maintenance/management of utility works including the water treatment plants have been privatized through long-term (25–30 year) concession agreements with several companies. Some of these agreements involve capital works based on BOT. There are three such companies selling treated water to SWMC, which distribute this water to consumers. These companies have invested US$1,183 million in capital works. SWMC is also responsible for planning and developing future water sources, and it is planning to merge with the private companies producing water in joint-venture operations that will produce and distribute water to consumers throughout Selangor.
Flood
Management
Low-lying areas of the city are susceptible to flooding during heavy downpours. However, the floods generally subside within 5–6 hours. Flood management in the city is the responsibility of the city government assisted by the Federal Government through the Drainage and Irrigation Department for master planning and funding of major projects. The annual budget for flood management is about US$14–16 million.
Notes
1 The average number of persons per connection in 2001 was 5. The increase in total connections in 2001 was 3,910.
Data as of 2001.
KUALA LUMPUR 51
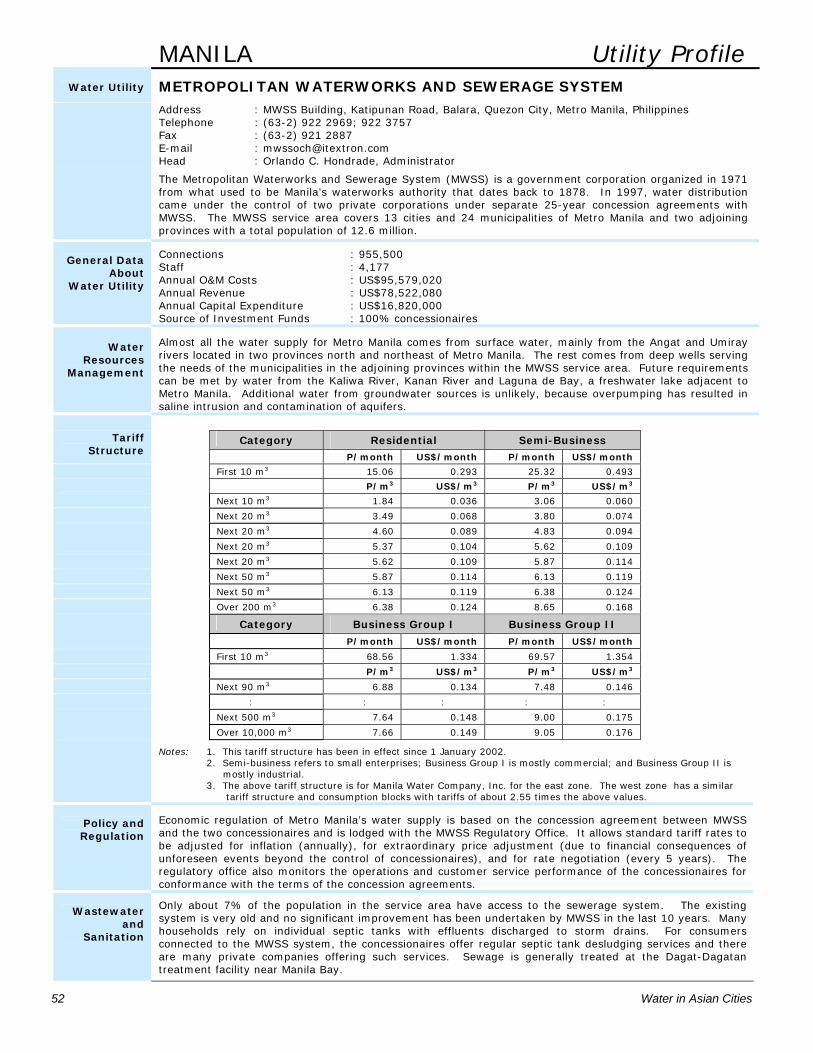
52 Water in Asian Cities
MANILA Utility Profile
Water Utility
METROPOLITAN WATERWORKS AND SEWERAGE SYSTEM Address : MWSS Building, Katipunan Road, Balara, Quezon City, Metro Manila, Philippines
Telephone : (63-2) 922 2969; 922 3757 Fax : (63-2) 921 2887 E-mail : [email protected] Head : Orlando C. Hondrade, Administrator
The Metropolitan Waterworks and Sewerage System (MWSS) is a government corporation organized in 1971 from what used to be Manila’s waterworks authority that dates back to 1878. In 1997, water distribution came under the control of two private corporations under separate 25-year concession agreements with MWSS. The MWSS service area covers 13 cities and 24 municipalities of Metro Manila and two adjoining provinces with a total population of 12.6 million.
General Data
About Water Utility
Connections : 955,500 Staff : 4,177 Annual O&M Costs : US$95,579,020 Annual Revenue : US$78,522,080 Annual Capital Expenditure : US$16,820,000 Source of Investment Funds : 100% concessionaires
Water
Resources Management
Almost all the water supply for Metro Manila comes from surface water, mainly from the Angat and Umiray rivers located in two provinces north and northeast of Metro Manila. The rest comes from deep wells serving the needs of the municipalities in the adjoining provinces within the MWSS service area. Future requirements can be met by water from the Kaliwa River, Kanan River and Laguna de Bay, a freshwater lake adjacent to Metro Manila. Additional water from groundwater sources is unlikely, because overpumping has resulted in saline intrusion and contamination of aquifers.
Category Residential Semi-Business Tariff Structure
P/month US$/month P/month US$/month
First 10 m3 15.06 0.293 25.32 0.493
P/m3 US$/m3 P/m3 US$/m3
Next 10 m3 1.84 0.036 3.06 0.060
Next 20 m3 3.49 0.068 3.80 0.074
Next 20 m3 4.60 0.089 4.83 0.094
Next 20 m3 5.37 0.104 5.62 0.109
Next 20 m3 5.62 0.109 5.87 0.114
Next 50 m3 5.87 0.114 6.13 0.119
Next 50 m3 6.13 0.119 6.38 0.124
Over 200 m3 6.38 0.124 8.65 0.168
Category Business Group I Business Group II
P/month US$/month P/month US$/month
First 10 m3 68.56 1.334 69.57 1.354
P/m3 US$/m3 P/m3 US$/m3
Next 90 m3 6.88 0.134 7.48 0.146
: : : : :
Next 500 m3 7.64 0.148 9.00 0.175
Over 10,000 m3 7.66 0.149 9.05 0.176
Notes: 1. This tariff structure has been in effect since 1 January 2002. 2. Semi-business refers to small enterprises; Business Group I is mostly commercial; and Business Group II is mostly industrial. 3. The above tariff structure is for Manila Water Company, Inc. for the east zone. The west zone has a similar tariff structure and consumption blocks with tariffs of about 2.55 times the above values.
Policy and Regulation
Economic regulation of Metro Manila’s water supply is based on the concession agreement between MWSS and the two concessionaires and is lodged with the MWSS Regulatory Office. It allows standard tariff rates to be adjusted for inflation (annually), for extraordinary price adjustment (due to financial consequences of unforeseen events beyond the control of concessionaires), and for rate negotiation (every 5 years). The regulatory office also monitors the operations and customer service performance of the concessionaires for conformance with the terms of the concession agreements.
Wastewater
and Sanitation
Only about 7% of the population in the service area have access to the sewerage system. The existing system is very old and no significant improvement has been undertaken by MWSS in the last 10 years. Many households rely on individual septic tanks with effluents discharged to storm drains. For consumers connected to the MWSS system, the concessionaires offer regular septic tank desludging services and there are many private companies offering such services. Sewage is generally treated at the Dagat-Dagatan treatment facility near Manila Bay.
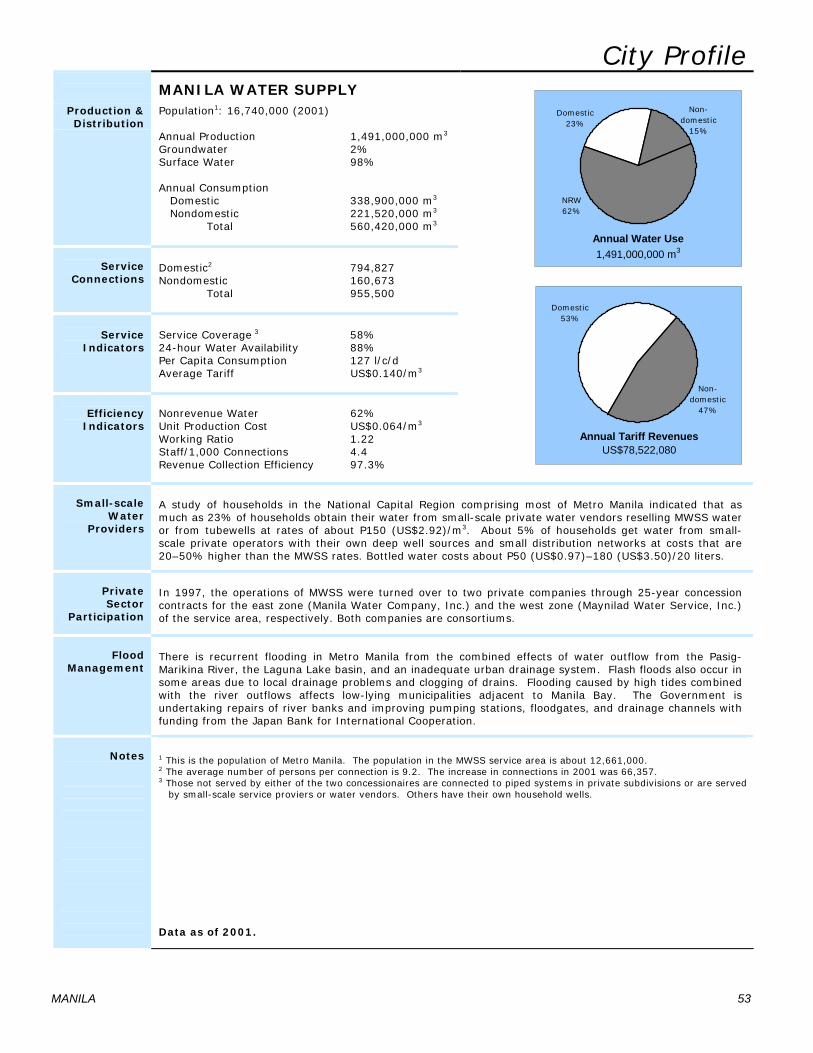
City Profile
MANILA WATER SUPPLY
Production & Distribution
Population1: 16,740,000 (2001)
Annual Production 1,491,000,000 m3
Groundwater 2% Surface Water 98% Annual Consumption Domestic 338,900,000 m3
Nondomestic 221,520,000 m3
Total 560,420,000 m3
Service Connections
Domestic2 794,827 Nondomestic 160,673 Total 955,500
Service
Indicators
Service Coverage 3 58% 24-hour Water Availability 88% Per Capita Consumption 127 l/c/d Average Tariff US$0.140/m3
Efficiency Indicators
Nonrevenue Water 62% Unit Production Cost US$0.064/m3
Working Ratio 1.22 Staff/1,000 Connections 4.4 Revenue Collection Efficiency 97.3%
Domestic23%
NRW 62%
Non-domestic
15%
Annual Water Use 1,491,000,000 m3
Non-domestic
47%
Domestic53%
Annual Tariff Revenues US$78,522,080
Small-scale
Water Providers
A study of households in the National Capital Region comprising most of Metro Manila indicated that as much as 23% of households obtain their water from small-scale private water vendors reselling MWSS water or from tubewells at rates of about P150 (US$2.92)/m3. About 5% of households get water from small-scale private operators with their own deep well sources and small distribution networks at costs that are 20–50% higher than the MWSS rates. Bottled water costs about P50 (US$0.97)–180 (US$3.50)/20 liters.
Private Sector
Participation
In 1997, the operations of MWSS were turned over to two private companies through 25-year concession contracts for the east zone (Manila Water Company, Inc.) and the west zone (Maynilad Water Service, Inc.) of the service area, respectively. Both companies are consortiums.
Flood
Management
There is recurrent flooding in Metro Manila from the combined effects of water outflow from the Pasig-Marikina River, the Laguna Lake basin, and an inadequate urban drainage system. Flash floods also occur in some areas due to local drainage problems and clogging of drains. Flooding caused by high tides combined with the river outflows affects low-lying municipalities adjacent to Manila Bay. The Government is undertaking repairs of river banks and improving pumping stations, floodgates, and drainage channels with funding from the Japan Bank for International Cooperation.
Notes
1 This is the population of Metro Manila. The population in the MWSS service area is about 12,661,000. 2 The average number of persons per connection is 9.2. The increase in connections in 2001 was 66,357. 3 Those not served by either of the two concessionaires are connected to piped systems in private subdivisions or are served by small-scale service proviers or water vendors. Others have their own household wells.
Data as of 2001.
MANILA 53
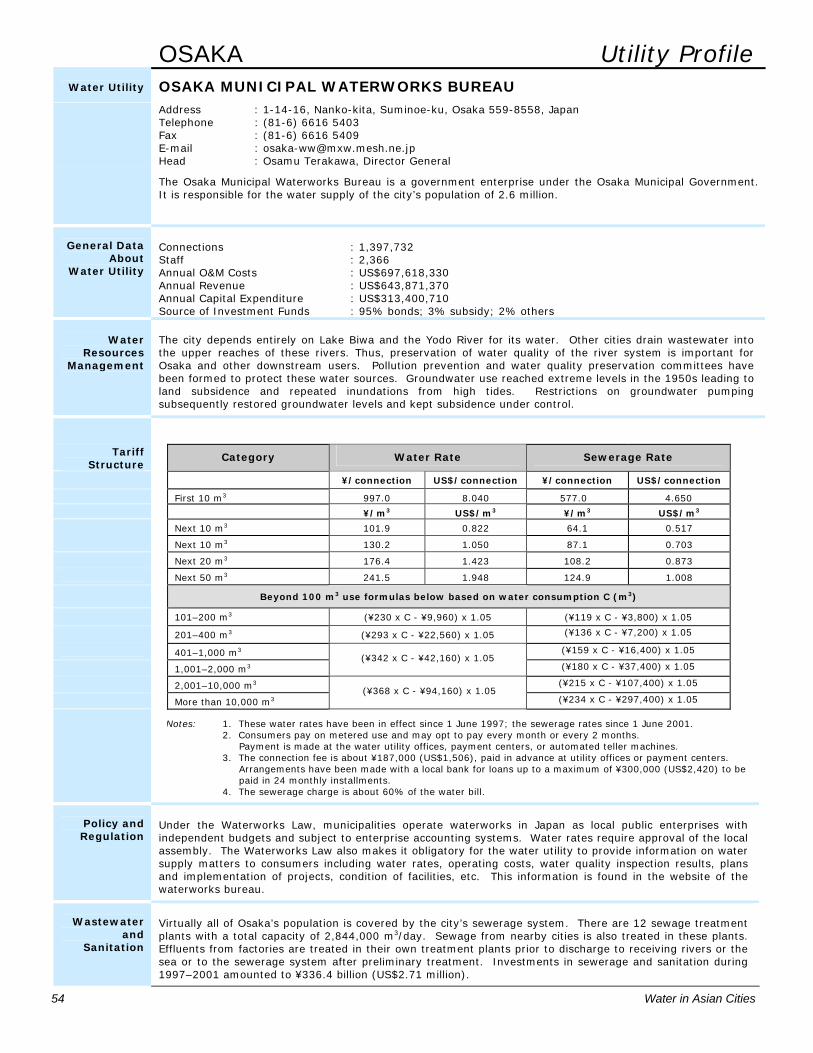
54 Water in Asian Cities
OSAKA Utility Profile
Water Utility
OSAKA MUNICIPAL WATERWORKS BUREAU Address : 1-14-16, Nanko-kita, Suminoe-ku, Osaka 559-8558, Japan
Telephone : (81-6) 6616 5403 Fax : (81-6) 6616 5409 E-mail : [email protected] Head : Osamu Terakawa, Director General
The Osaka Municipal Waterworks Bureau is a government enterprise under the Osaka Municipal Government. It is responsible for the water supply of the city’s population of 2.6 million.
General Data
About Water Utility
Connections : 1,397,732 Staff : 2,366 Annual O&M Costs : US$697,618,330 Annual Revenue : US$643,871,370 Annual Capital Expenditure : US$313,400,710 Source of Investment Funds : 95% bonds; 3% subsidy; 2% others
Water
Resources Management
The city depends entirely on Lake Biwa and the Yodo River for its water. Other cities drain wastewater into the upper reaches of these rivers. Thus, preservation of water quality of the river system is important for Osaka and other downstream users. Pollution prevention and water quality preservation committees have been formed to protect these water sources. Groundwater use reached extreme levels in the 1950s leading to land subsidence and repeated inundations from high tides. Restrictions on groundwater pumping subsequently restored groundwater levels and kept subsidence under control.
Tariff Structure
Category Water Rate Sewerage Rate
¥/connection US$/connection ¥/connection US$/connection
First 10 m3 997.0 8.040 577.0 4.650 ¥/m3 US$/m3 ¥/m3 US$/m3
Next 10 m3 101.9 0.822 64.1 0.517
Next 10 m3 130.2 1.050 87.1 0.703
Next 20 m3 176.4 1.423 108.2 0.873
Next 50 m3 241.5 1.948 124.9 1.008
Beyond 100 m3 use formulas below based on water consumption C (m3)
101–200 m3 (¥230 x C - ¥9,960) x 1.05 (¥119 x C - ¥3,800) x 1.05
201–400 m3 (¥293 x C - ¥22,560) x 1.05 (¥136 x C - ¥7,200) x 1.05
401–1,000 m3 (¥159 x C - ¥16,400) x 1.05
1,001–2,000 m3(¥342 x C - ¥42,160) x 1.05
(¥180 x C - ¥37,400) x 1.05
2,001–10,000 m3 (¥215 x C - ¥107,400) x 1.05
More than 10,000 m3 (¥368 x C - ¥94,160) x 1.05
(¥234 x C - ¥297,400) x 1.05
Notes: 1. These water rates have been in effect since 1 June 1997; the sewerage rates since 1 June 2001.
2. Consumers pay on metered use and may opt to pay every month or every 2 months. Payment is made at the water utility offices, payment centers, or automated teller machines. 3. The connection fee is about ¥187,000 (US$1,506), paid in advance at utility offices or payment centers. Arrangements have been made with a local bank for loans up to a maximum of ¥300,000 (US$2,420) to be paid in 24 monthly installments. 4. The sewerage charge is about 60% of the water bill.
Policy and Regulation
Under the Waterworks Law, municipalities operate waterworks in Japan as local public enterprises with independent budgets and subject to enterprise accounting systems. Water rates require approval of the local assembly. The Waterworks Law also makes it obligatory for the water utility to provide information on water supply matters to consumers including water rates, operating costs, water quality inspection results, plans and implementation of projects, condition of facilities, etc. This information is found in the website of the waterworks bureau.
Wastewater
and Sanitation
Virtually all of Osaka’s population is covered by the city’s sewerage system. There are 12 sewage treatment plants with a total capacity of 2,844,000 m3/day. Sewage from nearby cities is also treated in these plants. Effluents from factories are treated in their own treatment plants prior to discharge to receiving rivers or the sea or to the sewerage system after preliminary treatment. Investments in sewerage and sanitation during 1997–2001 amounted to ¥336.4 billion (US$2.71 million).
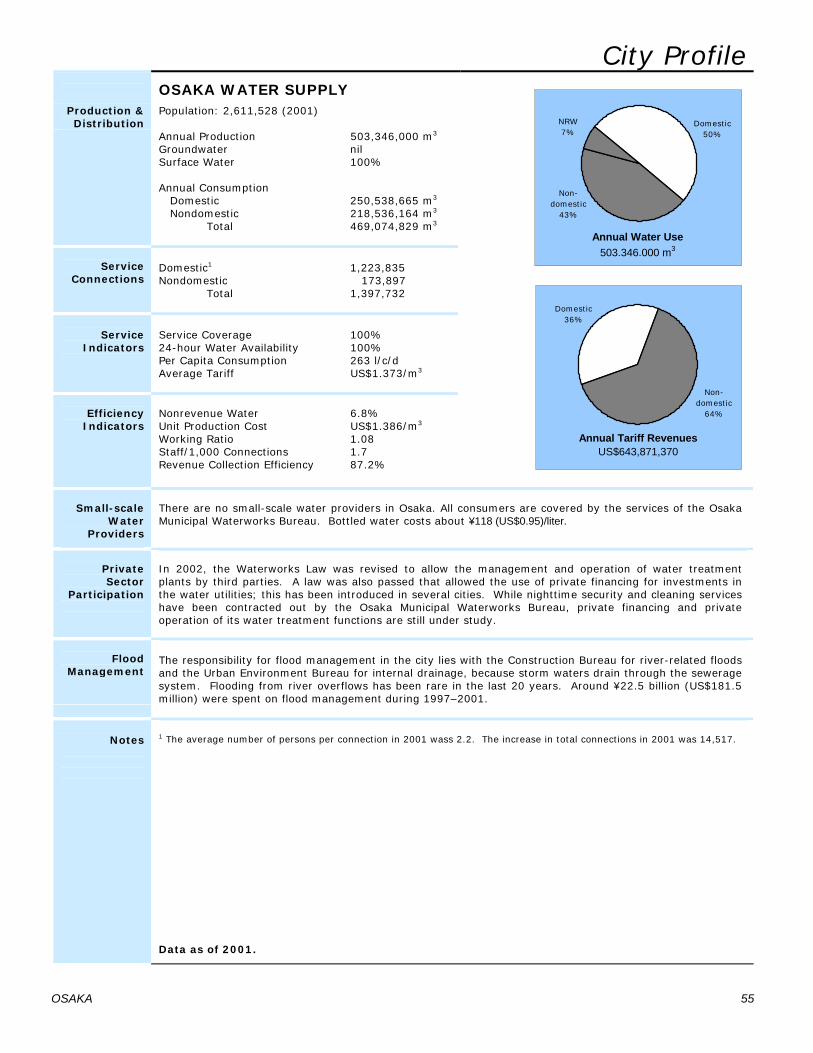
City Profile
OSAKA WATER SUPPLY
Production & Distribution
Population: 2,611,528 (2001)
Annual Production 503,346,000 m3
Groundwater nil Surface Water 100% Annual Consumption Domestic 250,538,665 m3
Nondomestic 218,536,164 m3
Total 469,074,829 m3
Service Connections
Domestic1 1,223,835 Nondomestic 173,897 Total 1,397,732
Service
Indicators
Service Coverage 100% 24-hour Water Availability 100% Per Capita Consumption 263 l/c/d Average Tariff US$1.373/m3
Efficiency Indicators
Nonrevenue Water 6.8% Unit Production Cost US$1.386/m3
Working Ratio 1.08 Staff/1,000 Connections 1.7 Revenue Collection Efficiency 87.2%
Non-domestic
43%
NRW 7%
Domestic50%
Annual Water Use 503,346,000 m3
Non-domestic
64%
Domestic36%
Annual Tariff Revenues US$643,871,370
Small-scale Water
Providers
There are no small-scale water providers in Osaka. All consumers are covered by the services of the Osaka Municipal Waterworks Bureau. Bottled water costs about ¥118 (US$0.95)/liter.
Private Sector
Participation
In 2002, the Waterworks Law was revised to allow the management and operation of water treatment plants by third parties. A law was also passed that allowed the use of private financing for investments in the water utilities; this has been introduced in several cities. While nighttime security and cleaning services have been contracted out by the Osaka Municipal Waterworks Bureau, private financing and private operation of its water treatment functions are still under study.
Flood
Management
The responsibility for flood management in the city lies with the Construction Bureau for river-related floods and the Urban Environment Bureau for internal drainage, because storm waters drain through the sewerage system. Flooding from river overflows has been rare in the last 20 years. Around ¥22.5 billion (US$181.5 million) were spent on flood management during 1997–2001.
Notes
1 The average number of persons per connection in 2001 wass 2.2. The increase in total connections in 2001 was 14,517.
Data as of 2001.
OSAKA 55
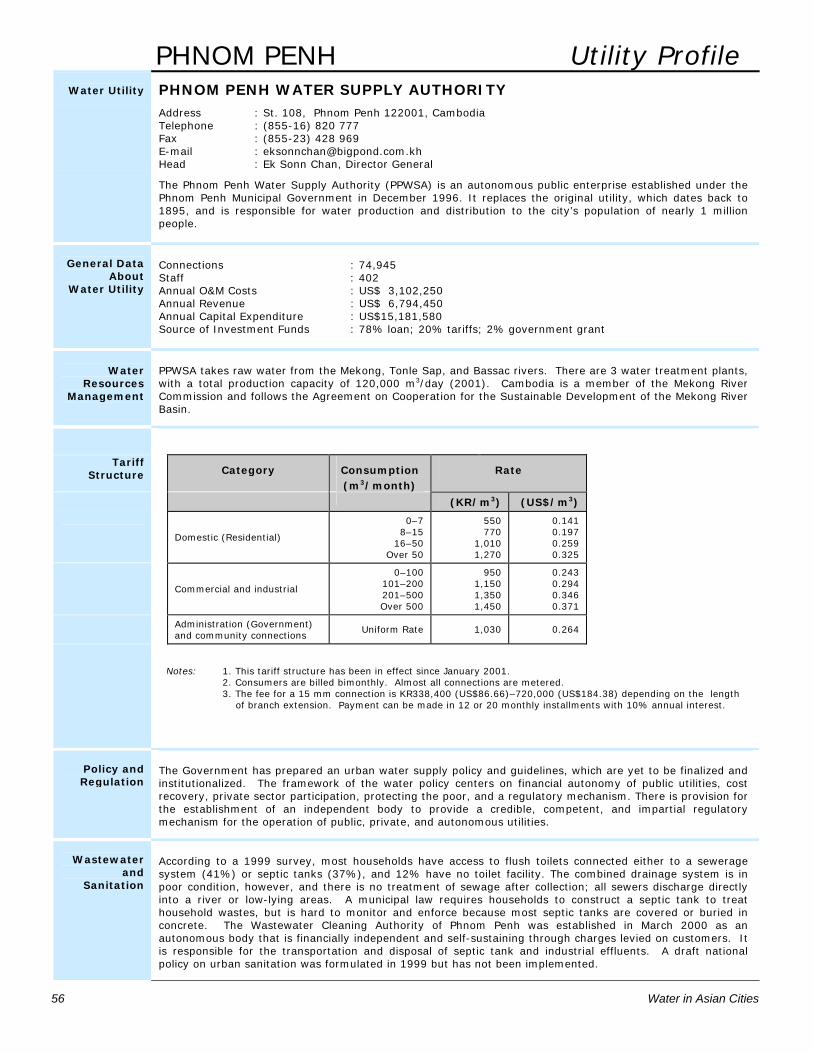
56 Water in Asian Cities
PHNOM PENH Utility Profile
Water Utility
PHNOM PENH WATER SUPPLY AUTHORITY Address : St. 108, Phnom Penh 122001, Cambodia
Telephone : (855-16) 820 777 Fax : (855-23) 428 969 E-mail : [email protected] Head : Ek Sonn Chan, Director General
The Phnom Penh Water Supply Authority (PPWSA) is an autonomous public enterprise established under the Phnom Penh Municipal Government in December 1996. It replaces the original utility, which dates back to 1895, and is responsible for water production and distribution to the city’s population of nearly 1 million people.
General Data
About Water Utility
Connections : 74,945 Staff : 402 Annual O&M Costs : US$ 3,102,250 Annual Revenue : US$ 6,794,450 Annual Capital Expenditure : US$15,181,580 Source of Investment Funds : 78% loan; 20% tariffs; 2% government grant
Water
Resources Management
PPWSA takes raw water from the Mekong, Tonle Sap, and Bassac rivers. There are 3 water treatment plants, with a total production capacity of 120,000 m3/day (2001). Cambodia is a member of the Mekong River Commission and follows the Agreement on Cooperation for the Sustainable Development of the Mekong River Basin.
Tariff Structure
Category Consumption
(m3/month) Rate
(KR/m3) (US$/m3)
Domestic (Residential)
0–7 8–15 16–50
Over 50
550 770
1,010 1,270
0.141 0.197 0.259 0.325
Commercial and industrial
0–100 101–200 201–500 Over 500
950 1,150 1,350 1,450
0.243 0.294 0.346 0.371
Administration (Government) and community connections
Uniform Rate 1,030 0.264
Notes: 1. This tariff structure has been in effect since January 2001. 2. Consumers are billed bimonthly. Almost all connections are metered. 3. The fee for a 15 mm connection is KR338,400 (US$86.66)–720,000 (US$184.38) depending on the length of branch extension. Payment can be made in 12 or 20 monthly installments with 10% annual interest.
Policy and Regulation
The Government has prepared an urban water supply policy and guidelines, which are yet to be finalized and institutionalized. The framework of the water policy centers on financial autonomy of public utilities, cost recovery, private sector participation, protecting the poor, and a regulatory mechanism. There is provision for the establishment of an independent body to provide a credible, competent, and impartial regulatory mechanism for the operation of public, private, and autonomous utilities.
Wastewater
and Sanitation
According to a 1999 survey, most households have access to flush toilets connected either to a sewerage system (41%) or septic tanks (37%), and 12% have no toilet facility. The combined drainage system is in poor condition, however, and there is no treatment of sewage after collection; all sewers discharge directly into a river or low-lying areas. A municipal law requires households to construct a septic tank to treat household wastes, but is hard to monitor and enforce because most septic tanks are covered or buried in concrete. The Wastewater Cleaning Authority of Phnom Penh was established in March 2000 as an autonomous body that is financially independent and self-sustaining through charges levied on customers. It is responsible for the transportation and disposal of septic tank and industrial effluents. A draft national policy on urban sanitation was formulated in 1999 but has not been implemented.

City Profile
PHNOM PENH WATER SUPPLY
Production & Distribution
Population1: 981,805 (2001)
Annual Production 37,763,647 Groundwater Nil Surface Water 100% Annual Consumption Domestic 16,988,665 m3
Nondomestic 10,867,034 m3
Total 27,855,699 m3
Service Connections
Domestic2 64,035 Nondomestic 10,910 Total 74,945
Service
Indicators
Service Coverage 84% 24-hour Water Availability 100% Per Capita Consumption 104 l/c/d Average Tariff US$0.244/m3
Efficiency Indicators
Nonrevenue Water 26% Unit Production Cost US$0.082/m3
Working Ratio 0.46 Staff/1,000 Connections 5.4 Revenue Collection Efficiency 99.6%
Non-domestic
29%
NRW 26%
Domestic45%
Annual Water Use 37,763,650 m3
Non-domestic
46%
Domestic54%
Annual Tariff Revenues US$6,794,450
Small-scale
Water Providers
In Phnom Penh, private water networks supply water to households, particularly those located in the vicinity of the Tonle Sap, Mekong, and Bassac rivers. These private networks pump water directly from the river and supply untreated water (although some treat it with aluminum sulfate) to individual connections, for which consumption is either metered or unmetered. Average price is about KR1,500 (US$0.38)/m3. Others perform further treatment on water from PPWSA and sell it as bottled water at an average cost of US$1.00/20 liters. Still others resell PPWSA water to households without connections at KR7,500 (US$1.92)–KR20,000 (US$5.12)/m3.
Private Sector
Participation
In its draft water policy, the Government of Cambodia encourages PSP in all areas of service provision including service contracts, management contacts, lease contracts, concession contracts, BOT contracts, and build-operate-own contracts. However, to date, there is no PSP in water supply in Phnom Penh.
Flood
Management
The city is susceptible to flooding from the surrounding rivers and water backup during peak flood events caused by flood regulation measures in downstream Viet Nam. Flood protection and drainage facilities in Phnom Penh consist of outer and inner ring dikes, 10 drainage pumping stations, drainage channels, and the sewer network. The Kop Srov and Tompun dikes are eroded and major drainage channels are clogged with debris and sediments in many parts. The Emergency Flood Rehabilitation Project funded by ADB is rehabilitating these dikes at a cost of US$54 million.
Notes
1 The population in the service area is 532,130. 2 The average number of persons per connection in 2001 was 7. The increase in total connections in 2001 was 7,929.
Data as of 2001.
PHNOM PENH 57
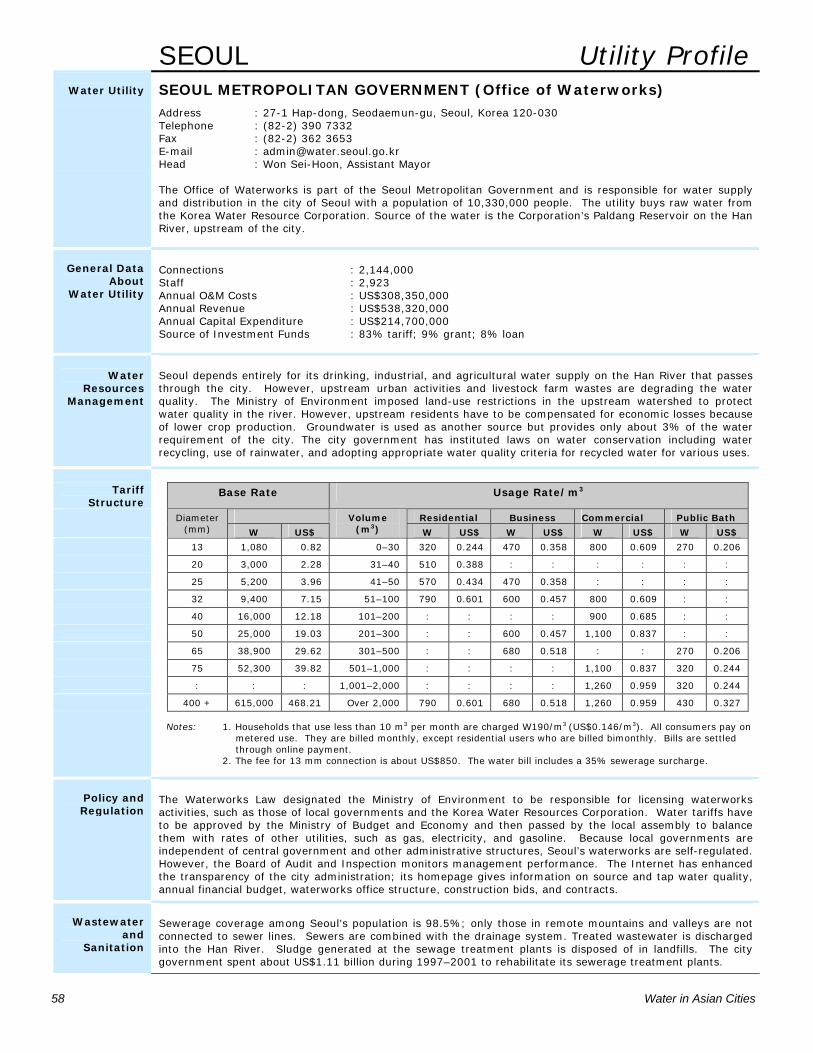
58 Water in Asian Cities
SEOUL Utility Profile
Water Utility
SEOUL METROPOLITAN GOVERNMENT (Office of Waterworks) Address : 27-1 Hap-dong, Seodaemun-gu, Seoul, Korea 120-030
Telephone : (82-2) 390 7332 Fax : (82-2) 362 3653 E-mail : [email protected] Head : Won Sei-Hoon, Assistant Mayor
The Office of Waterworks is part of the Seoul Metropolitan Government and is responsible for water supply and distribution in the city of Seoul with a population of 10,330,000 people. The utility buys raw water from the Korea Water Resource Corporation. Source of the water is the Corporation’s Paldang Reservoir on the Han River, upstream of the city.
General Data
About Water Utility
Connections : 2,144,000 Staff : 2,923 Annual O&M Costs : US$308,350,000 Annual Revenue : US$538,320,000 Annual Capital Expenditure : US$214,700,000 Source of Investment Funds : 83% tariff; 9% grant; 8% loan
Water
Resources Management
Seoul depends entirely for its drinking, industrial, and agricultural water supply on the Han River that passes through the city. However, upstream urban activities and livestock farm wastes are degrading the water quality. The Ministry of Environment imposed land-use restrictions in the upstream watershed to protect water quality in the river. However, upstream residents have to be compensated for economic losses because of lower crop production. Groundwater is used as another source but provides only about 3% of the water requirement of the city. The city government has instituted laws on water conservation including water recycling, use of rainwater, and adopting appropriate water quality criteria for recycled water for various uses.
Tariff
Structure Base Rate Usage Rate/m3
Residential Business Commercial Public Bath Diameter (mm) W US$
Volume (m3) W US$ W US$ W US$ W US$
13 1,080 0.82 0–30 320 0.244 470 0.358 800 0.609 270 0.206
20 3,000 2.28 31–40 510 0.388 : : : : : :
25 5,200 3.96 41–50 570 0.434 470 0.358 : : : :
32 9,400 7.15 51–100 790 0.601 600 0.457 800 0.609 : :
40 16,000 12.18 101–200 : : : : 900 0.685 : :
50 25,000 19.03 201–300 : : 600 0.457 1,100 0.837 : :
65 38,900 29.62 301–500 : : 680 0.518 : : 270 0.206
75 52,300 39.82 501–1,000 : : : : 1,100 0.837 320 0.244
: : : 1,001–2,000 : : : : 1,260 0.959 320 0.244
400 + 615,000 468.21 Over 2,000 790 0.601 680 0.518 1,260 0.959 430 0.327
Notes: 1. Households that use less than 10 m3 per month are charged W190/m3 (US$0.146/m3). All consumers pay on
metered use. They are billed monthly, except residential users who are billed bimonthly. Bills are settled through online payment. 2. The fee for 13 mm connection is about US$850. The water bill includes a 35% sewerage surcharge.
Policy and Regulation
The Waterworks Law designated the Ministry of Environment to be responsible for licensing waterworks activities, such as those of local governments and the Korea Water Resources Corporation. Water tariffs have to be approved by the Ministry of Budget and Economy and then passed by the local assembly to balance them with rates of other utilities, such as gas, electricity, and gasoline. Because local governments are independent of central government and other administrative structures, Seoul’s waterworks are self-regulated. However, the Board of Audit and Inspection monitors management performance. The Internet has enhanced the transparency of the city administration; its homepage gives information on source and tap water quality, annual financial budget, waterworks office structure, construction bids, and contracts.
Wastewater
and Sanitation
Sewerage coverage among Seoul’s population is 98.5%; only those in remote mountains and valleys are not connected to sewer lines. Sewers are combined with the drainage system. Treated wastewater is discharged into the Han River. Sludge generated at the sewage treatment plants is disposed of in landfills. The city government spent about US$1.11 billion during 1997–2001 to rehabilitate its sewerage treatment plants.
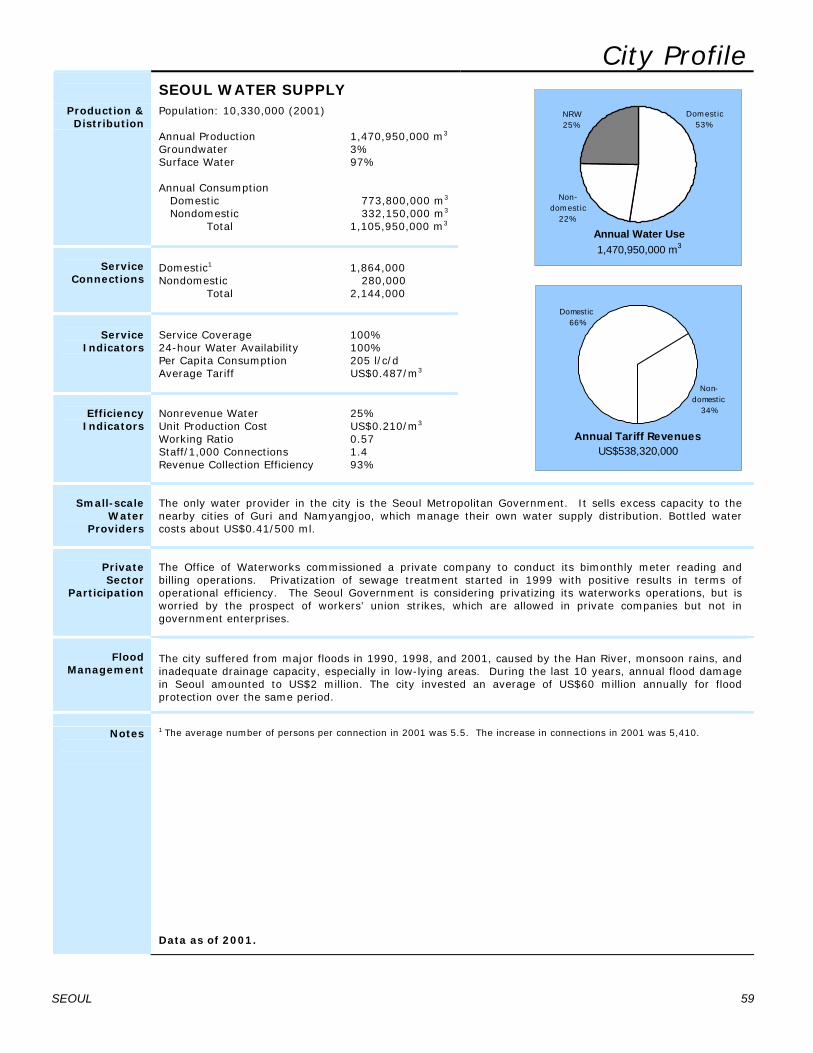
SEOUL 59
City Profile
SEOUL WATER SUPPLY
Production & Distribution
Population: 10,330,000 (2001)
Annual Production 1,470,950,000 m3 Groundwater 3% Surface Water 97% Annual Consumption Domestic 773,800,000 m3 Nondomestic 332,150,000 m3 Total 1,105,950,000 m3
Service Connections
Domestic1 1,864,000 Nondomestic 280,000 Total 2,144,000
Service
Indicators
Service Coverage 100% 24-hour Water Availability 100% Per Capita Consumption 205 l/c/d Average Tariff US$0.487/m3
Efficiency
Indicators
Nonrevenue Water 25% Unit Production Cost US$0.210/m3 Working Ratio 0.57 Staff/1,000 Connections 1.4 Revenue Collection Efficiency 93%
Non-domestic
22%
NRW 25%
Domestic53%
Annual Water Use 1,470,950,000 m3
Non-domest ic
34%
Domest ic66%
Annual Tariff Revenues US$538,320,000
Small-scale Water
Providers
The only water provider in the city is the Seoul Metropolitan Government. It sells excess capacity to the nearby cities of Guri and Namyangjoo, which manage their own water supply distribution. Bottled water costs about US$0.41/500 ml.
Private Sector
Participation
The Office of Waterworks commissioned a private company to conduct its bimonthly meter reading and billing operations. Privatization of sewage treatment started in 1999 with positive results in terms of operational efficiency. The Seoul Government is considering privatizing its waterworks operations, but is worried by the prospect of workers’ union strikes, which are allowed in private companies but not in government enterprises.
Flood
Management
The city suffered from major floods in 1990, 1998, and 2001, caused by the Han River, monsoon rains, and inadequate drainage capacity, especially in low-lying areas. During the last 10 years, annual flood damage in Seoul amounted to US$2 million. The city invested an average of US$60 million annually for flood protection over the same period.
Notes
1 The average number of persons per connection in 2001 was 5.5. The increase in connections in 2001 was 5,410.
Data as of 2001.
60 Water in Asian Cities
SHANGHAI Utility Profile
Water Utility
SHANGHAI WATER BUREAU Address : No. 257 Tongren Road, Shanghai 200040, People’s Republic of China
Telephone : (86-21) 6247 6232 Fax : (86-21) 6247 8411 Head : Jiayi Zhang, Director
The Shanghai Water Bureau is responsible for water resources management and water issues throughout Shanghai. There are about 158 water supply companies, categorized as large-scale companies (5) that supply water in urban areas; district or county companies (9) that serve district and county towns; and township companies (144) that serve townships and rural areas.
General Data About
Water Utility
Connections : 2,995,000 Staff : 17,000 Annual O&M Costs : US$169,093,950 Annual Revenue : US$156,101,980 Annual Capital Expenditure : US$112,489,720 Source of Investment Funds : 100% grant
Water
Resources Management
The main drinking water sources for Shanghai are the Huangpu River and the Baoshan segment of the Changjiang (Yangtze) River. Groundwater is used in the suburban and rural areas of the city and this has led to land subsidence in these areas. The Government began restricting the use of groundwater in the city in 1996. Nevertheless, subsidence continued at an average of 11 mm per year in the city center in 1998–2000. The shortfall in supply will be made up by using more water from the Changjiang River, which will be treated at the Ling Qiao water treatment plant.
Tariff Structure
Water Rate Wastewater Rate
Category
CNY/m3 US$/m3 CNY/m3 US$/m3
Residence 1.03 0.124 0.70 0.085
Industry & Administration 1.30 0.157 0.70 0.085
Commerce/Other Business 1.50 0.181 0.70 0.085
Beverage Production 2.00 0.242 0.70 0.085
Sauna Baths 5.00 0.604 0.70 0.085
Bulk Supply 0.90 0.109 0.70 0.085
Notes: 1. This tariff structure has been in effect since 1 December 2001. 2. All consumers pay on metered use. Billing is done through a meter reader or by a remote metering
system. Payment is made in designated banks. An innovative system in some areas is payment through prepaid cards that activate control valves to release water. 3. The connection fee is about CNY684 (US$83). 4. The volume of wastewater is taken as 90% of water consumption.
Policy and Regulation
Both central and local government policies guide the development of the water supply sector in Shanghai through the State Water Law and laws governing tariffs and regulation of urban water supplies. The Shanghai Water Bureau is responsible for water resources management and all water issues. The current thrust of the Shanghai Government is continuation of ongoing reforms based on market mechanisms, reduction of the water supply deficit, improvement of service to consumers, and rehabilitation of the Suzhou River.
Wastewater
and Sanitation
About 68% of wastewater produced are collected through the combined sewer system in the urban and rural areas of Shanghai. Most of the households connected to the sewer systems have septic tanks discharging effluents to the sewers. Latrines remain important in Shanghai, especially in the old city and rural areas. Public latrines are located in shopping centers, parks, hotels, bazaars, recreation grounds, and other public areas; a fee for use is required in about half of them. Transfer tanks for excrement in nonsewered areas are a special sanitation facility in Shanghai; residents deposit their waste to be collected by trucks for treatment at wastewater treatment plants.
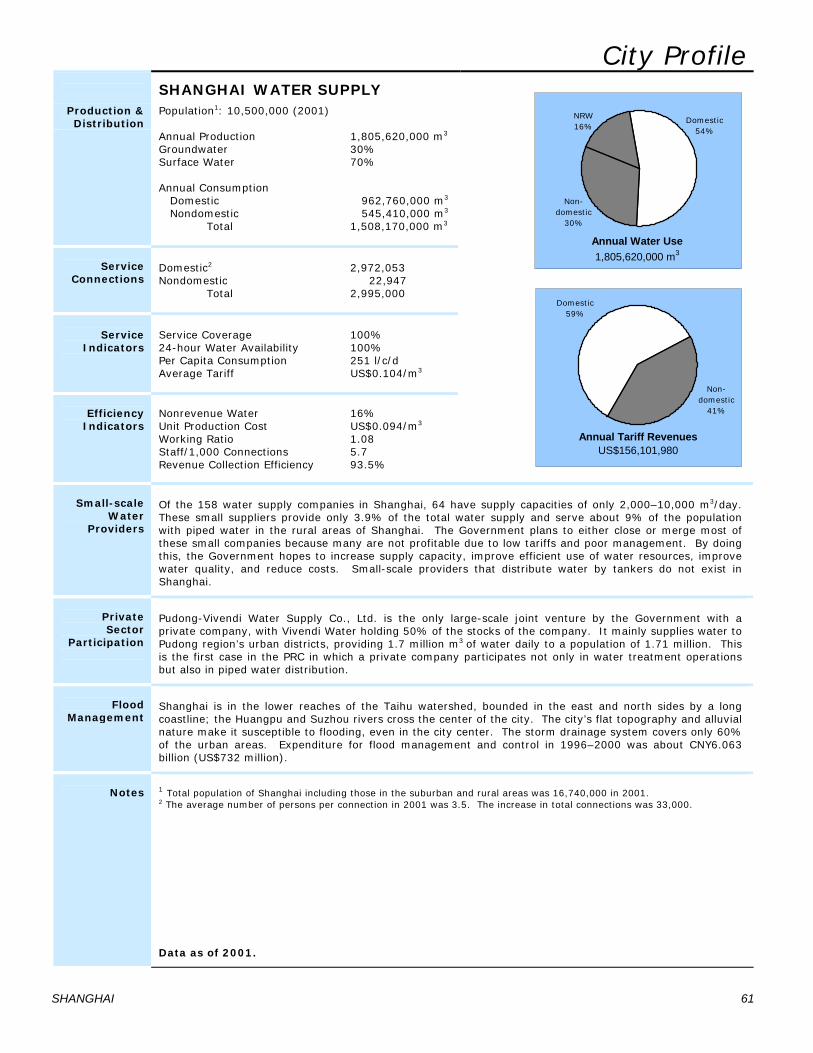
City Profile
SHANGHAI WATER SUPPLY
Production & Distribution
Population1: 10,500,000 (2001)
Annual Production 1,805,620,000 m3
Groundwater 30% Surface Water 70% Annual Consumption Domestic 962,760,000 m3
Nondomestic 545,410,000 m3
Total 1,508,170,000 m3
Service Connections
Domestic2 2,972,053 Nondomestic 22,947 Total 2,995,000
Service
Indicators
Service Coverage 100% 24-hour Water Availability 100% Per Capita Consumption 251 l/c/d Average Tariff US$0.104/m3
Efficiency Indicators
Nonrevenue Water 16% Unit Production Cost US$0.094/m3
Working Ratio 1.08 Staff/1,000 Connections 5.7 Revenue Collection Efficiency 93.5%
Non-domestic
30%
NRW 16%
Domestic54%
Annual Water Use 1,805,620,000 m3
Non-domestic
41%
Domestic59%
Annual Tariff Revenues US$156,101,980
Small-scale
Water Providers
Of the 158 water supply companies in Shanghai, 64 have supply capacities of only 2,000–10,000 m3/day. These small suppliers provide only 3.9% of the total water supply and serve about 9% of the population with piped water in the rural areas of Shanghai. The Government plans to either close or merge most of these small companies because many are not profitable due to low tariffs and poor management. By doing this, the Government hopes to increase supply capacity, improve efficient use of water resources, improve water quality, and reduce costs. Small-scale providers that distribute water by tankers do not exist in Shanghai.
Private Sector
Participation
Pudong-Vivendi Water Supply Co., Ltd. is the only large-scale joint venture by the Government with a private company, with Vivendi Water holding 50% of the stocks of the company. It mainly supplies water to Pudong region’s urban districts, providing 1.7 million m3 of water daily to a population of 1.71 million. This is the first case in the PRC in which a private company participates not only in water treatment operations but also in piped water distribution.
Flood
Management
Shanghai is in the lower reaches of the Taihu watershed, bounded in the east and north sides by a long coastline; the Huangpu and Suzhou rivers cross the center of the city. The city’s flat topography and alluvial nature make it susceptible to flooding, even in the city center. The storm drainage system covers only 60% of the urban areas. Expenditure for flood management and control in 1996–2000 was about CNY6.063 billion (US$732 million).
Notes
1 Total population of Shanghai including those in the suburban and rural areas was 16,740,000 in 2001. 2 The average number of persons per connection in 2001 was 3.5. The increase in total connections was 33,000. Data as of 2001.
SHANGHAI 61
62 Water in Asian Cities
TASHKENT Utility Profile
Water Utility
TASHKENT STATE UNITARY ENTERPRISE (Suvsoz) Address : #2 Chekhova Street, Tashkent 700060, Uzbekistan
Telephone : (998-71) 152 1955 Fax : (998-71) 152 1938 E-mail : none Head : Rauf Kurbanov, Director
The Tashkent State Unitary Enterprise (Suvsoz) is a government enterprise established in 1931. It is responsible for water supply and sanitation services for the city’s population of 2,130,600 through its city water and sewerage departments. These departments have corresponding independent district departments in each of the city’s 11 districts. In 2001, Suvsoz established departments for installation and repair of water meters.
General Data
About Water Utility
Connections : 567,398 Staff : 3,156 Annual O&M Costs : US$3,874,930 Annual Revenue : US$8,274,520 Annual Capital Expenditure : US$1,577,710 Source of Investment Funds : 36% tariff; 14% central government grant; 50% others
Water
Resources Management
Tashkent’s water supply is from surface water in the Bozsu Canal and groundwater from the Chatkai-Kuramin watershed. Water from these sources is considered satisfactory. Priority for use of both surface water and groundwater is given to domestic consumption. Rights for surface water use are regulated by the Ministry of Agriculture and Water Resources; groundwater rights are regulated by the Ministry of Geology. Water conservation by recycling is encouraged among city enterprises. The present production capacity is more than adequate for the present and near future demand, although some facilities need rehabilitation.
Tariff Structure
Rate
Category
(SUM/m3) (US$/m3)
Water Supply
Domestic 16.00 0.023
Enterprises (Bulk Consumers) 39.66 0.058
Sewerage Services
Domestic 8.00 0.012
Enterprises (Bulk Consumers) 14.07 0.020
Notes: 1. Only about 8.3% of connections are metered and working. Almost all domestic consumers pay a flat rate based on established per capita consumption. Consumers are billed monthly and pay at banks in cash. Bulk consumers pay by deposit to a Suvsoz bank account.
2. The connection fee is SUM21,950 (US$32). 3. The sewerage charge is 50% of the water bill for domestic consumers.
Policy and Regulation
Policies on water supply management are found in the Law on Water and Water Use (adopted by the Republic of Uzbekistan on 6 May 1993) and subsequent decrees of the cabinet ministries and resolutions of the Mayor of Tashkent. Some of these decrees and resolutions are specific to water management and metering in houses and apartments. The Anti-monopoly Committee of the City Administration, an independent body, regulates tariff issues. Reasons for tariff increases are announced and explained through print and broadcast media. The operational and financial performance of Suvsoz is subject to annual review by the City Administration and the City Communal Services Operational Association, but these are not published by the media.
Wastewater
and Sanitation
The centralized sewerage system covers 85% of the city’s population. There are three wastewater treatment stations and facilities with a total capacity of almost 2 million m3/day. Snowmelt and rainwater are drained separately through ditches, canals, and rivers. Some organizations and enterprises not connected to the sewerage system have their own wastewater treatment facilities. Smaller enterprises use cesspits that are desludged by special trucks or sludge collectors.
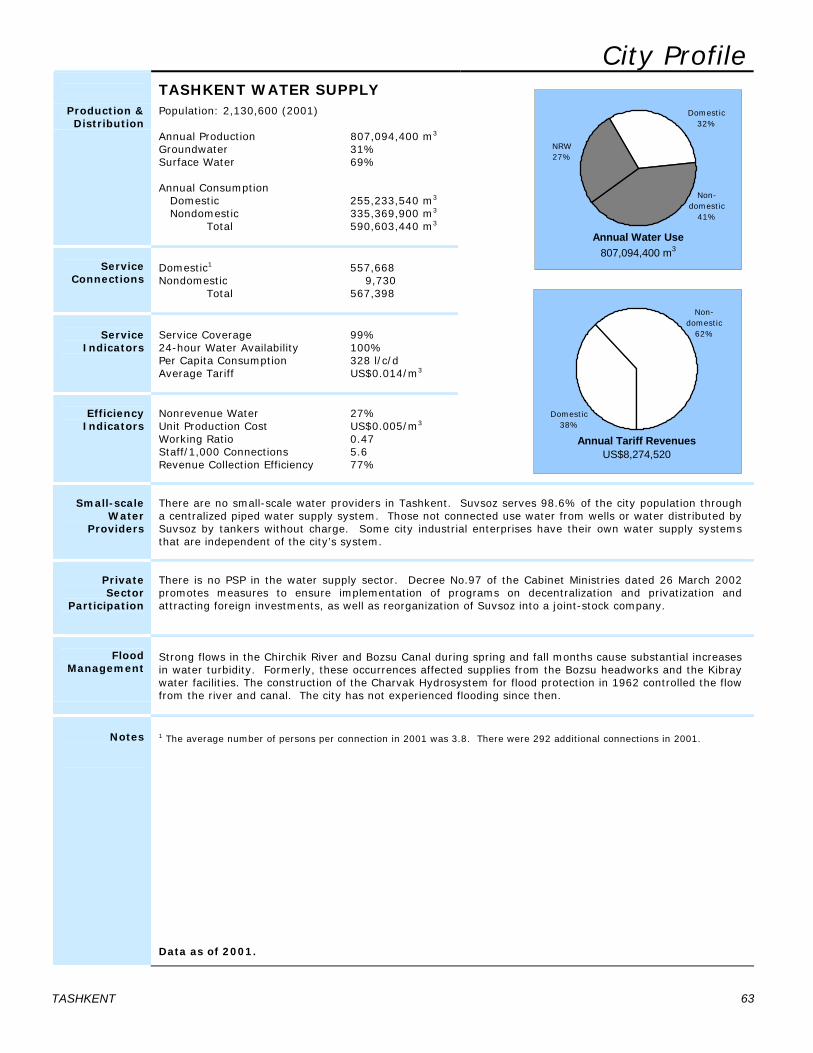
TASHKENT 63
City Profile
TASHKENT WATER SUPPLY Production & Distribution
Population: 2,130,600 (2001)
Annual Production 807,094,400 m3 Groundwater 31% Surface Water 69% Annual Consumption Domestic 255,233,540 m3 Nondomestic 335,369,900 m3 Total 590,603,440 m3
Service Connections
Domestic1 557,668 Nondomestic 9,730 Total 567,398
Service
Indicators
Service Coverage 99% 24-hour Water Availability 100% Per Capita Consumption 328 l/c/d Average Tariff US$0.014/m3
Efficiency
Indicators
Nonrevenue Water 27% Unit Production Cost US$0.005/m3 Working Ratio 0.47 Staff/1,000 Connections 5.6 Revenue Collection Efficiency 77%
Non-domestic
41%
NRW 27%
Domestic32%
Annual Water Use 807,094,400 m3
Non-domestic
62%
Domestic38%
Annual Tariff Revenues US$8,274,520
Small-scale Water
Providers
There are no small-scale water providers in Tashkent. Suvsoz serves 98.6% of the city population through a centralized piped water supply system. Those not connected use water from wells or water distributed by Suvsoz by tankers without charge. Some city industrial enterprises have their own water supply systems that are independent of the city’s system.
Private Sector
Participation
There is no PSP in the water supply sector. Decree No.97 of the Cabinet Ministries dated 26 March 2002 promotes measures to ensure implementation of programs on decentralization and privatization and attracting foreign investments, as well as reorganization of Suvsoz into a joint-stock company.
Flood
Management
Strong flows in the Chirchik River and Bozsu Canal during spring and fall months cause substantial increases in water turbidity. Formerly, these occurrences affected supplies from the Bozsu headworks and the Kibray water facilities. The construction of the Charvak Hydrosystem for flood protection in 1962 controlled the flow from the river and canal. The city has not experienced flooding since then.
Notes
1 The average number of persons per connection in 2001 was 3.8. There were 292 additional connections in 2001.
Data as of 2001.
64 Water in Asian Cities
ULAANBAATAR Utility Profile
Water Utility
ULAANBAATAR CITY WATER SUPPLY AND SEWERAGE SYSTEM CO., LTD. Address : Khukh Tengeriin Gudamj 5, Ulaanbaatar 49, Mongolia
Telephone : (976-11) 455 055 Fax : (976-11) 450 120 E-mail : [email protected] Head : Osoryn Erdenebaatar, Chairman
The Water Supply and Sewerage System Co., Ltd. (USAG) is a state enterprise established in 1975 under the Municipality of Ulaanbaatar. It is responsible for water supply and sewerage in the city and the peri-urban ger (round canvas-and-felt tents) areas with a total population of 743, 000 people, excluding distant subdistricts. USAG distributes water partly through piped connections and partly by tanker trucks to public water kiosks. A bulk supply is provided to most apartments through OSNAAKs (refer to Note 2 below), which manage distribution to apartment residents and bill residents at 150 liters per capita per day.
General Data
About Water Utility
Connections : 1,426 Staff : 1,174 Annual O&M Costs : US$5,795,600 Annual Revenue : US$6,991,100 Annual Capital Expenditure : US$2,820,900 Source of Investment Funds : no data
Water
Resources Management
The water distributed by USAG comes from groundwater pumped from 160 production wells in 4 alluvial areas known as upper source, central water source, industrial water source, and meat complex area, respectively. The drilling of 20 more wells in the lower Nalaih area is planned. The main constraint in using surface water from the Tuul River is freezing of the river from December to March and reduced flow during September to December and March to May.
Tariff Structure
Rate
Category
(MNT/m3) (US$/m3)
Water Supply
Institutions/Industries 200 0.18
Residents 130 0.12
Apartments 105 0.10
Wastewater Services
Institutions/Industries 115 0.10
Residents 85 0.08
Apartments 70 0.06
Notes: 1. This tariff structure has been in effect since July 2000. 2. Domestic connections referred to are bulk connections to apartments managed by OSNAAKs. Water is also sold in water kiosks supplied by USAG through a subsidiary tank company, especially in the ger areas. OSNAAKs are government units managing services in residential apartments. 3. Consumers are billed monthly and pay through bill collectors or banks. 4. Contractors bear all costs of new connections. The connection fee is about MNT500,000 (US$426).
Policy and Regulation
USAG has several strategies to maintain its financial capacity and the sustainable development of the utility: the installation of meters, billing based on metered consumption to reduce water wastage, and an improved tariff structure to cover operating expenses with provisions for long-term capital investment.
Wastewater
and Sanitation
About 48% of the city population are connected to the sewerage system; the rest have latrines and septic tanks. People living in the ger areas have latrines within their fenced lots while small industries have septic tanks. Each of the six districts of the city has a special truck for desludging industrial septic tanks. The trucks bring wastewater to the Central Wastewater Treatment Plant. USAG and the Environmental Control Office monitor industrial effluent discharges against limits set by the ministries of health, environment, industry, and trade.
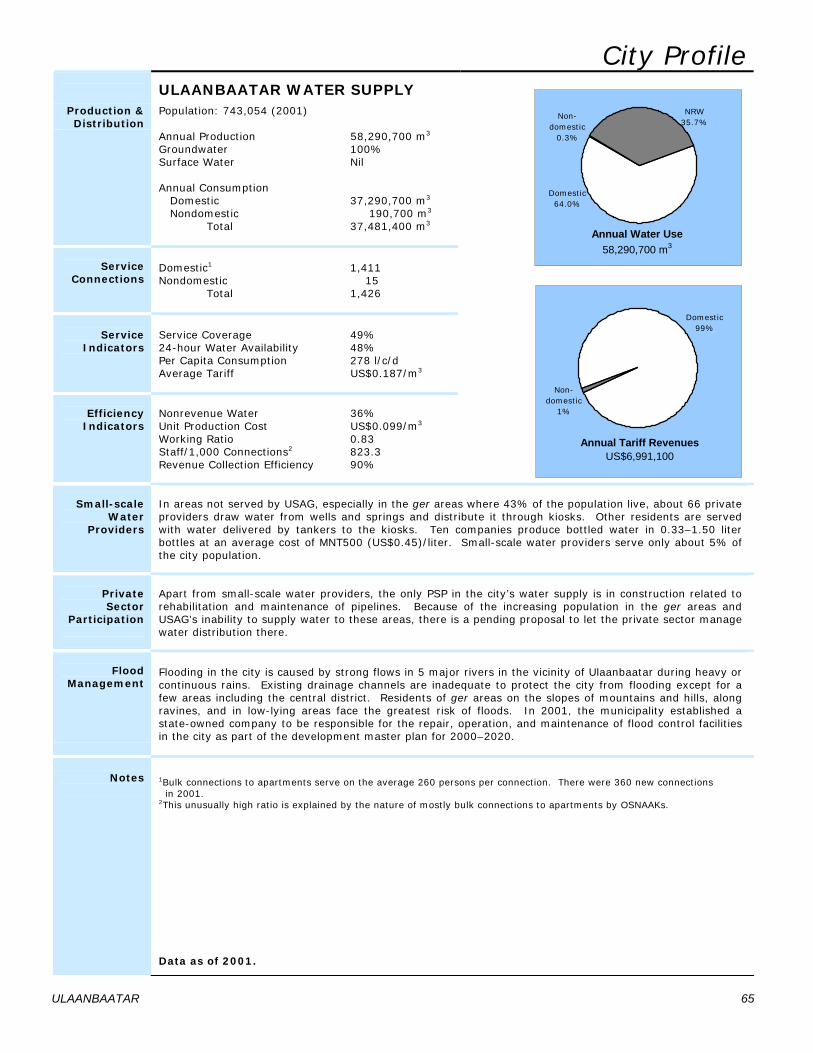
ULAANBAATAR 65
City Profile
ULAANBAATAR WATER SUPPLY
Production & Distribution
Population: 743,054 (2001)
Annual Production 58,290,700 m3 Groundwater 100% Surface Water Nil Annual Consumption Domestic 37,290,700 m3 Nondomestic 190,700 m3 Total 37,481,400 m3
Service Connections
Domestic1 1,411 Nondomestic 15 Total 1,426
Service
Indicators
Service Coverage 49% 24-hour Water Availability 48% Per Capita Consumption 278 l/c/d Average Tariff US$0.187/m3
Efficiency
Indicators
Nonrevenue Water 36% Unit Production Cost US$0.099/m3 Working Ratio 0.83 Staff/1,000 Connections2 823.3 Revenue Collection Efficiency 90%
Non-domestic
0.3%
NRW 35.7%
Domestic64.0%
Annual Water Use 58,290,700 m3
Non-domestic
1%
Domestic99%
Annual Tariff Revenues US$6,991,100
Small-scale Water
Providers
In areas not served by USAG, especially in the ger areas where 43% of the population live, about 66 private providers draw water from wells and springs and distribute it through kiosks. Other residents are served with water delivered by tankers to the kiosks. Ten companies produce bottled water in 0.33–1.50 liter bottles at an average cost of MNT500 (US$0.45)/liter. Small-scale water providers serve only about 5% of the city population.
Private Sector
Participation
Apart from small-scale water providers, the only PSP in the city’s water supply is in construction related to rehabilitation and maintenance of pipelines. Because of the increasing population in the ger areas and USAG’s inability to supply water to these areas, there is a pending proposal to let the private sector manage water distribution there.
Flood
Management
Flooding in the city is caused by strong flows in 5 major rivers in the vicinity of Ulaanbaatar during heavy or continuous rains. Existing drainage channels are inadequate to protect the city from flooding except for a few areas including the central district. Residents of ger areas on the slopes of mountains and hills, along ravines, and in low-lying areas face the greatest risk of floods. In 2001, the municipality established a state-owned company to be responsible for the repair, operation, and maintenance of flood control facilities in the city as part of the development master plan for 2000–2020.
Notes
1Bulk connections to apartments serve on the average 260 persons per connection. There were 360 new connections in 2001. 2This unusually high ratio is explained by the nature of mostly bulk connections to apartments by OSNAAKs.
Data as of 2001.
66 Water in Asian Cities
VIENTIANE Utility Profile
Water Utility
VIENTIANE WATER SUPPLY COMPANY (Nam Papa Vientiane) Address : Box 2571, Phonekheng Road, Vientiane, Lao PDR
Telephone : (856-21) 412 880 Fax : (856-21) 414 378 E-mail : [email protected] Head : Daophet Bouapha, General Manager
Vientiane Water Supply Company (Nam Papa Vientiane) is the water utility operator for Vientiane Prefecture including the city of about 616,000 people. Prior to 1999, the Lao Water Supply Company (Nam Papa Lao), a national government enterprise established in 1962, was responsible for the water supply of the entire country including Vientiane. In line with the decentralization policy of the Government, each province is now responsible for water supply within its own boundaries. State-owned enterprises (known as Nam Papas) are currently managing all urban water systems in provinces that own such facilities.
General Data
About Water Utility
Connections : 42,052 Staff : 440 Annual O&M Costs : US$1,281,540 Annual Revenue : US$1,170,330 Annual Capital Expenditure : US$1,957,010 Source of Investment Funds : 60% tariff; 33% connection fees; 7% government grant
Water
Resources Management
Water availability is high because of low population density. The main use is in agriculture for irrigation (82%); industry uses 10% and households the remaining 8%. The water sources for Vientiane Prefecture and four other large urban centers are the Mekong River and groundwater. The water in the river and its tributaries within the prefecture is not significantly polluted, although there is high turbidity during the rainy season. Presidential Decree No. 126, promulgated in November 1966, governs the administration, use, and development of water and water resources in the Lao People’s Democratic Republic so as to preserve and sustain the resources, ensure water quality and quantity, and protect the environment.
Tariff
Structure Monthly Consumption
Rate Monthly Consumption Rate
(m3) (KN/m3) (US$/m3) (m3) (KN/m3) (US$/m3)
I. Domestic and Government Offices 0–5 m3
6–20 m3
21–50 m3
Over 50 m3
219 263 329 383
0.023 0.028 0.035 0.040
III. Enterprises & Business (using water as raw material) 0–50 m3
51–100 m3
Over 100 m3
855 1,216 1,360
0.090 0.128 0.143
II. Enterprises & Business (not using water as raw material) 0–5 m3
6–20 m3
21–50 m3
Over 50 m3
549 602 636 670
0.058 0.063 0.067 0.071
IV. Diplomatic Personnel/ Foreigners 0–10 m3
Over 10 m3
6,184 7,668
0.652 0.808
Notes: 1. This tariff structure has been in effect since 1 September 2001.
2. All consumers pay on metered use. Payment is through bill collectors or at the water utility office. 3. Tariff setting objectives are to recover costs including O&M and to generate enough surplus to meet a portion of debt service. 4. The connection fee for a 15 mm domestic connection is KN700,000 (US$74).
Policy and Regulation
Prime Ministerial Decision No 37 defines the government policy on management and development of the water supply and sanitation sector. It includes strategies, targets, and operational framework for effective and sustainable financing, development, and management of the water supply and wastewater systems in urban and rural areas throughout the country. The Government established the Water Supply Authority to oversee developments in the water supply sector, the planning of projects in urban and rural areas, and to regulate the water supply and wastewater sector. Nam Papas are regulated within the provinces through Business Law 42/PR and each is responsible to a Water Administration Board.
Wastewater
and Sanitation
No urban center has a comprehensive piped sewerage system. A small-bore sewer system installed in a limited area in Vientiane municipality is not working due to blockages. In areas with onsite sanitation, septic tank effluents discharge into storm drains to watercourses. Pit latrines are desludged irregularly. There is no national agency responsible for sanitation in the urban centers, although Nam Saat is responsible for sanitation in the rural areas.
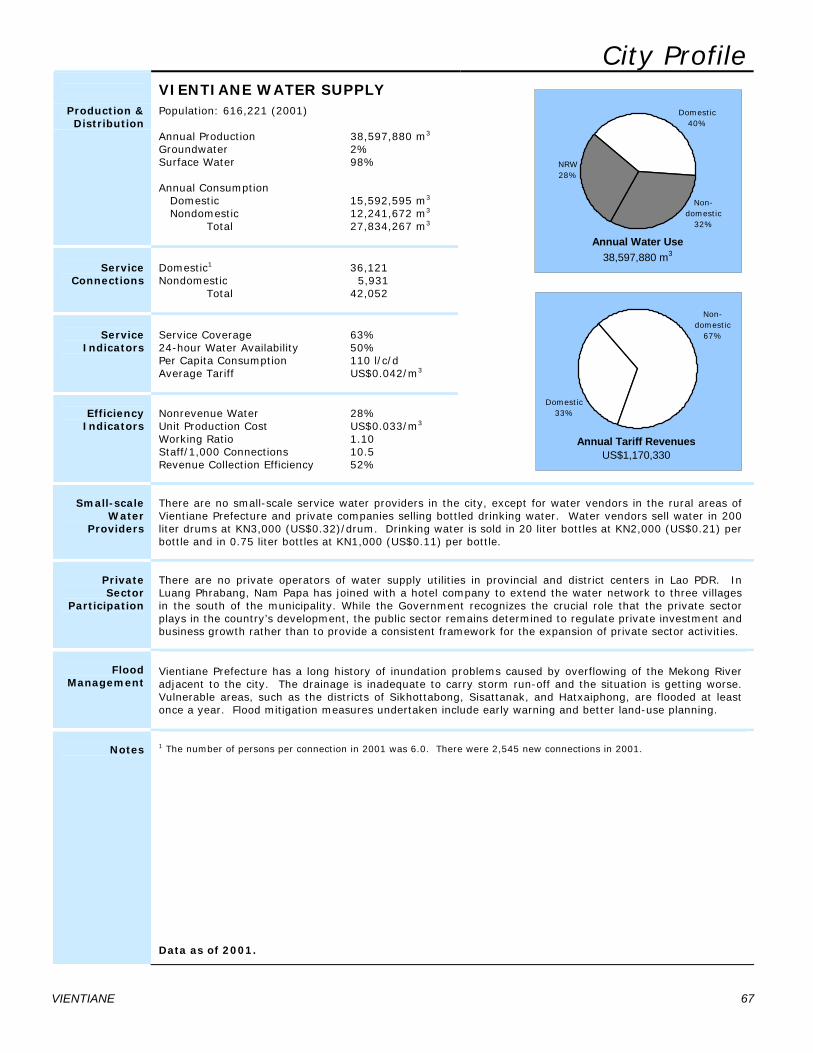
VIENTIANE 67
City Profile
VIENTIANE WATER SUPPLY
Production & Distribution
Population: 616,221 (2001)
Annual Production 38,597,880 m3 Groundwater 2% Surface Water 98% Annual Consumption Domestic 15,592,595 m3 Nondomestic 12,241,672 m3 Total 27,834,267 m3
Service Connections
Domestic1 36,121 Nondomestic 5,931 Total 42,052
Service
Indicators
Service Coverage 63% 24-hour Water Availability 50% Per Capita Consumption 110 l/c/d Average Tariff US$0.042/m3
Efficiency
Indicators
Nonrevenue Water 28% Unit Production Cost US$0.033/m3 Working Ratio 1.10 Staff/1,000 Connections 10.5 Revenue Collection Efficiency 52%
Non-domestic
32%
NRW 28%
Domestic40%
Annual Water Use 38,597,880 m3
Non-domestic
67%
Domestic33%
Annual Tariff Revenues US$1,170,330
Small-scale Water
Providers
There are no small-scale service water providers in the city, except for water vendors in the rural areas of Vientiane Prefecture and private companies selling bottled drinking water. Water vendors sell water in 200 liter drums at KN3,000 (US$0.32)/drum. Drinking water is sold in 20 liter bottles at KN2,000 (US$0.21) per bottle and in 0.75 liter bottles at KN1,000 (US$0.11) per bottle.
Private Sector
Participation
There are no private operators of water supply utilities in provincial and district centers in Lao PDR. In Luang Phrabang, Nam Papa has joined with a hotel company to extend the water network to three villages in the south of the municipality. While the Government recognizes the crucial role that the private sector plays in the country’s development, the public sector remains determined to regulate private investment and business growth rather than to provide a consistent framework for the expansion of private sector activities.
Flood
Management
Vientiane Prefecture has a long history of inundation problems caused by overflowing of the Mekong River adjacent to the city. The drainage is inadequate to carry storm run-off and the situation is getting worse. Vulnerable areas, such as the districts of Sikhottabong, Sisattanak, and Hatxaiphong, are flooded at least once a year. Flood mitigation measures undertaken include early warning and better land-use planning.
Notes
1 The number of persons per connection in 2001 was 6.0. There were 2,545 new connections in 2001.
Data as of 2001.
AnnexProceedings of the Regional
Consultation Workshop onWater in Asian Cities –The Role of Civil Society
14–16 October 2002Asian Development Bank, Manila
63672 adb_Asian Cities chap pages.p65 1/19/04, 12:10 PM4
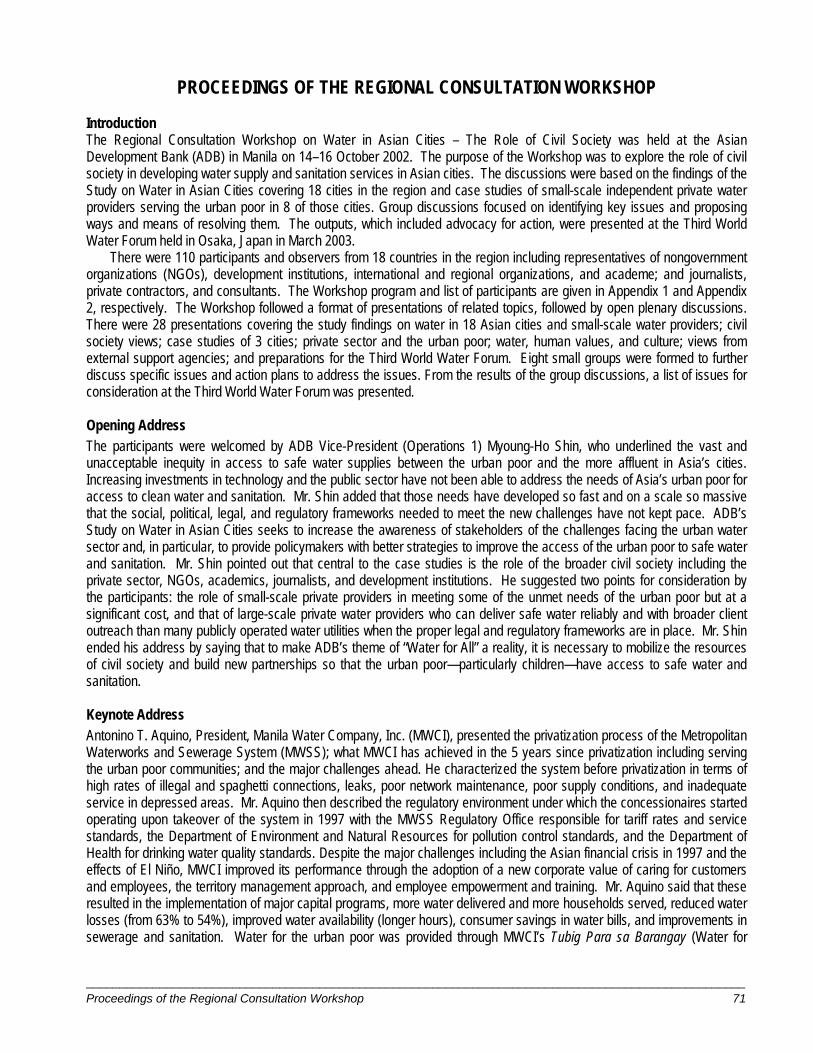
___________________________________________________________________________________________________ Proceedings of the Regional Consultation Workshop 71
PROCEEDINGS OF THE REGIONAL CONSULTATION WORKSHOP Introduction The Regional Consultation Workshop on Water in Asian Cities – The Role of Civil Society was held at the Asian Development Bank (ADB) in Manila on 14–16 October 2002. The purpose of the Workshop was to explore the role of civil society in developing water supply and sanitation services in Asian cities. The discussions were based on the findings of the Study on Water in Asian Cities covering 18 cities in the region and case studies of small-scale independent private water providers serving the urban poor in 8 of those cities. Group discussions focused on identifying key issues and proposing ways and means of resolving them. The outputs, which included advocacy for action, were presented at the Third World Water Forum held in Osaka, Japan in March 2003.
There were 110 participants and observers from 18 countries in the region including representatives of nongovernment organizations (NGOs), development institutions, international and regional organizations, and academe; and journalists, private contractors, and consultants. The Workshop program and list of participants are given in Appendix 1 and Appendix 2, respectively. The Workshop followed a format of presentations of related topics, followed by open plenary discussions. There were 28 presentations covering the study findings on water in 18 Asian cities and small-scale water providers; civil society views; case studies of 3 cities; private sector and the urban poor; water, human values, and culture; views from external support agencies; and preparations for the Third World Water Forum. Eight small groups were formed to further discuss specific issues and action plans to address the issues. From the results of the group discussions, a list of issues for consideration at the Third World Water Forum was presented. Opening Address The participants were welcomed by ADB Vice-President (Operations 1) Myoung-Ho Shin, who underlined the vast and unacceptable inequity in access to safe water supplies between the urban poor and the more affluent in Asia’s cities. Increasing investments in technology and the public sector have not been able to address the needs of Asia’s urban poor for access to clean water and sanitation. Mr. Shin added that those needs have developed so fast and on a scale so massive that the social, political, legal, and regulatory frameworks needed to meet the new challenges have not kept pace. ADB’s Study on Water in Asian Cities seeks to increase the awareness of stakeholders of the challenges facing the urban water sector and, in particular, to provide policymakers with better strategies to improve the access of the urban poor to safe water and sanitation. Mr. Shin pointed out that central to the case studies is the role of the broader civil society including the private sector, NGOs, academics, journalists, and development institutions. He suggested two points for consideration by the participants: the role of small-scale private providers in meeting some of the unmet needs of the urban poor but at a significant cost, and that of large-scale private water providers who can deliver safe water reliably and with broader client outreach than many publicly operated water utilities when the proper legal and regulatory frameworks are in place. Mr. Shin ended his address by saying that to make ADB’s theme of “Water for All” a reality, it is necessary to mobilize the resources of civil society and build new partnerships so that the urban poor—particularly children—have access to safe water and sanitation. Keynote Address Antonino T. Aquino, President, Manila Water Company, Inc. (MWCI), presented the privatization process of the Metropolitan Waterworks and Sewerage System (MWSS); what MWCI has achieved in the 5 years since privatization including serving the urban poor communities; and the major challenges ahead. He characterized the system before privatization in terms of high rates of illegal and spaghetti connections, leaks, poor network maintenance, poor supply conditions, and inadequate service in depressed areas. Mr. Aquino then described the regulatory environment under which the concessionaires started operating upon takeover of the system in 1997 with the MWSS Regulatory Office responsible for tariff rates and service standards, the Department of Environment and Natural Resources for pollution control standards, and the Department of Health for drinking water quality standards. Despite the major challenges including the Asian financial crisis in 1997 and the effects of El Niño, MWCI improved its performance through the adoption of a new corporate value of caring for customers and employees, the territory management approach, and employee empowerment and training. Mr. Aquino said that these resulted in the implementation of major capital programs, more water delivered and more households served, reduced water losses (from 63% to 54%), improved water availability (longer hours), consumer savings in water bills, and improvements in sewerage and sanitation. Water for the urban poor was provided through MWCI’s Tubig Para sa Barangay (Water for
____________________________________________________________________________________________________ 72 Water in Asian Cities
Communities) with 95,000 households or 570,000 people provided with piped water supply. He saw as major challenges ahead the expansion of coverage, new water supply sources, and sewer and sanitation projects. Water in Asian Cities – The Challenge Arthur C. McIntosh, ADB Principal Water Supply Specialist, presented the challenging issues facing the sector in the region; the root causes of the problems; why civil society should be involved; and the need for knowledge, awareness, and communication. He cited the problems of low coverage in Southeast Asia and intermittent water supplies in South Asia, resulting in dependence on water vendors or standpipe supplies with low availability, high costs, and dubious water quality. Mr. McIntosh traced the root cause of these situations to poor governance and inadequate tariffs. He said that government policies must address serving the urban poor and eliminating intermittent water supplies. Water operators require an independent regulator, autonomy, and incentives. Without adequate tariffs, operators cannot invest in new services or improve existing services. Civil society groups, such as NGOs, academe, and journalists can ensure that all the public are made aware of the issues. Mr. McIntosh also noted the value of regular and dedicated attention to improving knowledge, awareness, and communication on the subject among all stakeholders. He challenged the participants to find out how civil society can work with other stakeholders to resolve water problems. Water Utility and Civil Society Findings Geoffrey Bridges, international consultant for the Study on Water in Asian Cities, presented the initial findings of the study on water supplies in 18 Asian cities and a summary of the overviews from civil society in these cities.
Summary of Water Supply Reports: The water supply reports were summarized according to nine themes: Water Resources
• Heavy reliance is placed on surface water, but sources are becoming more polluted because pollution control is poorly enforced by governments.
• There is a need to reduce leakage and to recycle treated effluent (e.g., Chengdu is planning to recycle 70% of wastewater by 2005); over-abstraction of groundwater is a major issue in some cities.
• Planned water resource developments are generally adequate for the next 5 years, but there are major deficits in Shanghai, Delhi, and Chengdu.
Policy and Regulation
• Water supply policies are widely based on the provision of a reliable, adequate, and safe water supply at reasonable cost.
• Most utilities are in the public sector and are self-regulated. Independent regulators exist in cities with private operators, such as Jakarta, Manila, and Kuala Lumpur, but are desirable even for public water utilities.
• Tariff policies are based on sustainability with little subsidy, but there is much sociopolitical influence on tariff levels in many cities.
• Transparency and public awareness are poor even where provision of data is obligatory. Water utility information is available through websites in Hong Kong, Osaka, and Seoul.
Operator Performance and Private Sector Participation
• While operators are mostly self-regulated public sector utilities, there is a trend for greater private sector participation (PSP). However, there are major concerns on job losses, higher tariffs, and loss of control over the utility.
• The existing types of PSP are concessions (Jakarta, Manila); outsourcing (Ulaanbaatar); build-operate-transfer (BOT) (Chengdu, Kuala Lumpur); and a joint venture stock company (Shanghai).
• In 2000, only 4 cities collected sufficient revenue to cover operation and maintenance (O&M) costs and capital expenditures, 5 cities covered O&M costs only, and 9 cities did not cover O&M costs (including Hong Kong, Kuala Lumpur, and Osaka).
• Staff per 1,000 connections ranged from 1.4 (Seoul) to 33.8 (Chengdu), with a mean ratio of 5.7; Manila’s ratio decreased from 9.8 in 1997 to 4.4 in 2002.
___________________________________________________________________________________________________ Proceedings of the Regional Consultation Workshop 73
• Nonrevenue water (NRW) ranged from 62.4% (Manila) to 6.8% (Osaka); 9 cities have NRW levels well above 30%, which is considered to be a reasonable international target. Phnom Penh reduced its NRW from 70% in 1993 to 26% in 2001.
• In most cities, more than 80% of the population has 24-hour water availability. Delhi, Dhaka, Karachi, and Kathmandu have almost no areas with continuous water supply.
Small-scale Water Providers
• Small-scale water providers (SSWPs), such as private networks, tankers, and water vendors delivering to homes, have little opportunity in cities with good coverage; the majority resell water from piped networks, but some draw water from private tubewells and springs.
• In Manila, 42.5% of the population are not served by piped water and rely on water vendors (23%), other SSWPs (19%), and small network operators (8%). Kathmandu’s affluent population relies on tankers during dry months. In Chengdu, small operators serve 15% of the population; SSWPs in Phnom Penh and Vientiane supply untreated water.
• Annual revenue turnover is estimated to be US$1.2 million for tankers in Kathmandu and US$3.3 million for SSWPs in Chengdu. Typical unit costs for SSWP water supplies are US$1.92/m3 from tankers (Phnom Penh), US$4.17/m3 from vendors (Jakarta), and US$985/m3 for bottled water (Osaka).
Tariffs and Subsidies
• Most cities have a rising block tariff with basic subsidized allowance for the poor and provision for regular tariff reviews. The tariff in Hong Kong has been unchanged since 1995; Kuala Lumpur revised its tariff in 2001 for the first time in 10 years.
• Although policies indicate low subsidies, they are not implemented because of political interference. Hong Kong, China has a large subsidy, which is used for O&M and capital expenses. Domestic tariffs in Delhi, Tashkent, and Vientiane are equivalent to less than US$0.03/m3 for a monthly consumption of 20 m3.
• Collection efficiencies range from 52% in Vientiane to 100% in Chengdu, Hong Kong, and Phnom Penh (where it was only 40% in 1993).
• Water connection fees are high relative to monthly tariffs in some cities. The connection fee in Seoul and Ulaanbaatar is equivalent to 177 months and 192 months average tariff for 20 m3 consumption, respectively .
Service Levels
• The water supply is intermittent in some areas of Colombo, Ho Chi Minh City, Jakarta, Manila, Ulaanbaatar, and Vientiane; less than 5% of consumers in Delhi, Dhaka, Karachi, and Kathmandu receive continuous supply.
• Intermittent supply costs are US$750–950 per household for inhouse storage and pump capital costs, and annual running costs of US$50–150.
• Access to piped water supplies varies from 100% in Hong Kong, Kuala Lumpur, Osaka, Seoul, Shanghai, and Tashkent to less than 50% in Ulaanbaatar.
• Daily per capita domestic consumption is in the range of 68.0–328.3 liters in Tashkent. In Ulaanbaatar, it is 5.3 liters in the traditional settlements (ger areas) and 318 liters in apartments.
Wastewater and Sanitation
• Access to piped sewerage ranges from 100% in Hong Kong, Osaka, and Seoul to very low coverage in Ho Chi Minh City (11.7%), Jakarta (1.9%), and Manila (7%); Vientiane has no piped sewerage system.
• Individual or communal septic tanks are the main alternative to piped sewerage, serving 70% of the population in Kathmandu, 37% in Phnom Penh, and 30% in Jakarta.
• Septic tank desludging, which should be undertaken every 5 years, is only done when overflow occurs. Desludging costs are US$25–50.
• Environmental conditions are generally poor because only part of the wastewater collected is treated, with most discharged directly to watercourses. Pollution from industrial effluent is increasing and policing of disposal difficult and rarely enforced.
____________________________________________________________________________________________________ 74 Water in Asian Cities
Flood Management • Susceptibility to flooding is high in cities where cyclones or hurricanes occur; there are regular floods in Dhaka,
Jakarta, Manila, Phnom Penh, Ulaanbaatar, and Vientiane. Water and Culture
• Water is viewed as God-given resource in most cultures. It is widely regarded as a symbol of purification, holiness, and blessing, and is used for cleansing rituals in the main regional religions. It is a symbol of power in the Republic of Korea.
• In many countries, water is used in festivals, often by dousing the participants. Common Issues among the Cities
• There is heavy reliance on surface water sources, which are becoming increasingly polluted; many aquifers are being over-pumped.
• Although most tariff policies are based on principles of sustainability, many cities pay lip service to this for sociopolitical reasons, with tariffs set far too low for financial viability.
• NRW in most cities is well above internationally accepted norms. Where NRW is high, supply continuity is poor and system coverage often low.
• Where service coverage is low, high reliance is placed on small-scale water providers. • In 11 of the cities, less than 50% of the population have access to piped sewerage.
Open Discussion Highlights • On water as a social good: water becomes an economic good when it becomes a scarce resource. • On universal standards for water quantity: the World Health Organization (WHO) regards a daily per capita
consumption of 5 liters as the minimum, with 25 liters as the practical basic need. • On arsenic in groundwater: there was no report on arsenic being a major problem in any of the 18 cities. • On surface water sources: there were concerns on upstream water quality. Summary of Civil Society Overviews: Participants from the cities in the study were asked to submit a one-page
overview before coming to the workshop. Following is a summary of the major concerns from the overviews.
Governance, Policy, and Regulation • There is usually no policy to regulate wastewater disposal or incentives to minimize and treat waste at source. • A regulatory agency is needed to oversee policy implementation regarding PSP. • Ways to control corruption in the sector are needed. • Decentralization of water services would help to discourage population drift from rural to urban areas.
Water Resources Management
• Groundwater use should be controlled to prevent over-abstraction. • Principles of integrated water resources management and long-term planning should be applied to protect the
limited water resources. • Pollution control in watersheds needs to be improved. • Land development regulations are poor with regard to conservation of watersheds.
Operations and Service Levels
• Service coverage is limited, especially in poor peri-urban areas; it is necessary to improve demand management and efficiency (e.g., metering, water-saving devices, decreased irrigation).
• Leakage in distribution pipes should be addressed by rehabilitation of distribution systems and monitoring leaks. • The intermittent supply and inequitable distribution of water could be alleviated through rainwater harvesting and
improved demand management. • Water quality could be improved by repairing leaks, improving water treatment operations, cleaning up rivers, and
regulating the bottled water industry. • The lack of civil society participation can be overcome by developing channels for dialogue.
___________________________________________________________________________________________________ Proceedings of the Regional Consultation Workshop 75
Tariffs and Subsidies
• Tariffs are too high for the poor; the tariff structure should be adjusted to make water affordable for the poor. • Increased funding for O&M and expansion can be obtained by increasing tariffs. • Where connection charges are high, payment in installments should be allowed or subsidies for connection
provided. Impact on the Poor
• Business takes advantage of the poor—resold water costs more; engagement of civil society with relevant organizations should be developed.
• Privatization affects the poor most—loss of land and higher charges; increased participation of civil society and increased awareness through education/school programs are needed.
• PSP involves higher tariffs and reduction/removal of subsidies to the poor; again, increased participation of civil society and increased awareness through education/school programs are needed.
• The poor often resort to polluted water sources; community development projects should be developed with support from media and NGOs.
Common Concerns from Civil Society
• Pollution of water sources is increasing and their sustainability decreasing. • Coverage of water services is generally low. • Tariffs and connection fees in some cities are high, making municipal water supplies unaffordable to the poor. • There is a need for greater civil society engagement and contribution, as takes place in advocacy for pro-poor
policies in Kathmandu, and consumer meetings with regulators and the water company in Kuala Lumpur. Open Discussion Highlights
• Water supply should be demand driven; there should be more demand management. • There is a need to develop indicators for sustainability (security of supply, demand management, etc.). Water
recycling is another option, now being considered in Dhaka. • Civil society has major roles, such as NGOs in advocacy, but such groups must be well trained and resourced. • There are still problems of autonomy and accountability. • Water is often underpriced and this leads to nonviability. • PSP should not be a substitute for resolving the inadequacies of governments.
Civil Society Presentations
S. Jaganathan of Larsen and Toubro, Ltd., Bangalore, presented the Sri Sathya Sai Drinking Water Supply Project as an example of a private initiative with its innovative turnkey contract arrangements, the creation of an autonomous water board, and contracts for O&M. The project covers 731 villages in Anantapur District in Andhra Pradesh State and serves about 900,000 people from 23 water supply schemes, using both surface water and groundwater sources. Funding was provided by the Sri Sathya Sai Central Trust. The construction company, Larsen and Toubro, Ltd., is also responsible for O&M. The State created an autonomous board to oversee the O&M.
Kulwant Singh of the Housing and Urban Development Corporation, New Delhi, described the Sri Sathya Sai Drinking
Water Supply Project, a unique project between an NGO and the private sector that resulted in the reduction in the drudgery of carrying water, thus improving women’s quality of life. He said that it also resulted in increased attendance in school. The same group undertook a sanitation project in Pune where communal toilets were provided at 40% of normal costs and covered 80% of the population. The community pays a monthly charge for use to cover O&M expenses.
Guna Raj Shrestha of NGO Forum, Kathmandu, presented the water supply situation in Kathmandu and how the NGO
Forum was formed in March 2001; membership has grown from 4 to 30 NGOs. The main objectives of the NGO Forum are to ensure water access to all, ensure long-term performance and sustainability, and ensure that the environment is maintained. The Forum meets monthly and has organized civil society groups to meet government, aid agencies, utilities,
____________________________________________________________________________________________________ 76 Water in Asian Cities
private companies, and other stakeholders. Feedback from the meetings is relayed to the Government, which, as a result, is now preparing by-laws on private companies.
Charles Santiago of Stamford College, Kuala Lumpur, stated that under the Dublin Principle, access to water must be
within market rules. He expressed concern that a human right has, therefore, been made an economic commodity; a free good has been turned into market profit and water equity is skewed toward people who can pay for it. He said that the State has a duty to safeguard water supply access to all.
Jese Sikivou of the Pacific Islands Broadcasting Association, Suva, stressed the importance of ownership of land and
resources in the Fiji Islands because this can affect the way water is distributed. He also added that gender is another important issue, especially the role of women in the distribution of water.
Shiao-Shing Chen of the National Taipei University of Technology, Taipei,China, presented critical issues for drinking
water safety and water resource protection. He said that source waters need to be protected by setting standards, removing polluting sources, and making polluters pay. These actions lead to rapid recovery of water source quality. He emphasized the need for a system to monitor water quality.
Manu Bhatnagar of the Indian National Trust for Art and Cultural Heritage, New Delhi, stressed the importance of water
resources management at all levels of project planning. He noted that many cities have laws on water harvesting that are not implemented. He added that it is better to protect and improve raw water quality than to treat increasingly contaminated water—prevention is better than cure. Mr. Bhatnagar further stated that the view that “NGOs are meant to be seen and not heard” must change; the efforts of NGOs at local levels are gaining ground.
D. C. H. Senarath of the University of Moratuwa, Sri Lanka, stated that policy and regulation need to be socially
acceptable. NGOs and media have an important role to play, but they tend to emphasize the negative aspects. Cecilia Soriano of Ateneo de Manila University, Metro Manila, said that while the analytical framework for water
resources development highlights the need to maintain water quantity, water quality is also important and needs to be maintained by treatment and, wherever possible, preventing pollution.
The presentations were followed by a short video entitled Delhi – The Receding Waters, on the water crisis in Delhi; it
was made by Krishnendu Bose with Earthcare Films, New Delhi.
Case Studies Presentations
Rainwater Harvesting in Chennai K. R. Gopinath presented different methods of rainwater harvesting and case studies on how they were used in
Chennai. He said that rainwater could be collected for drinking purposes (individual households or community supplies) or for artificially recharging aquifers by augmenting the natural filtration of surface water into aquifers by some unique systems and techniques. Rainwater collected from roofs, the ground, or other collection systems is directed to percolation pits that lead to aquifers. Another alternative mentioned was the use of abandoned wells and boreholes as conduits for recharging after infiltration. Mr. Gopinath enumerated examples of artificial recharging done by KRG Rainwater Harvesting Foundation for Hindustan Coca Cola Beverages in Kerala and for a number of households in Chennai.
Open Discussion It was pointed out that in Bangladesh, an NGO is promoting rainwater harvesting during the monsoon season in rural
areas as an alternative to arsenic-affected wells. Also, in the Pacific Islands, governments are removing import duties on rainwater catchment systems.
Greater Colombo Water Supply – A Financial Perspective Premakumar Fernando described the problems with Greater Colombo’s water supply: high NRW (35%), low tariffs for
domestic consumers who are highly subsidized by industrial/commercial consumers (1:7.7) and the Government, and high per capita daily consumption (140 liters). The high NRW and high demand is affecting the water utility’s ability to extend its
___________________________________________________________________________________________________ Proceedings of the Regional Consultation Workshop 77
service to more consumers. Mr. Fernando proposed reducing NRW and per capita consumption through consumer awareness and tariff adjustment. He said tariffs can fund expansion; water can be saved through consumer awareness; NRW can be reduced through minimal investment; and needed investments can be halved through proper asset management.
Open Discussion During the open discussion, there was agreement on the importance of awareness and the role of journalists in voicing
the concerns of the poor and acting as catalysts. The media also have a role in promoting the value of water and getting high-income groups to conserve water.
Phnom Penh Water Supply Authority – 1993 and Now Ek Sonn Chan presented the dramatic improvement in Phnom Penh’s water supply from 1993 to 2002; how this was
achieved through cultural change, target setting, revenue generation, and investment; and how the poor are being reached. He cited improvements in staff/1,000 connections (reduced from 22 to 5), coverage (increased from 50% to100%), supply duration (from 10 hours to 24 hours daily), metering (from 12% to 100%), collection (from 50% to 99%) and NRW (from 72% to 22%). Mr. Chan described the restructuring of the Water Supply Authority, training, motivation and discipline, and teamwork as part of the cultural change. Revenues were increased through improved collection, NRW reduction, improved services, and tariff revision. The measures had government and donor support, and public acceptance. These were accompanied by network rehabilitation and increased supply capacity. Affordable and adequate direct connections were made for the poor.
Ownership and Partnership for the Improvement of Water Supply in Phnom Penh City Keiko Yamamoto described how the master plan for the Phnom Penh water supply system was established through
coordination among multilateral and bilateral donors in providing assistance for both structural measures and technology transfer. Japan provided assistance in the latter and in O&M training. She noted that the plan had been successful because of strong ownership of the project by the utility, good partnerships with donors and aid agencies, the combination of structural and technological measures, metering and tariff recovery systems, and improved staff working conditions.
Open Discussion It was pointed out in the discussion that consultation with the poor was clearly a major factor in the Phnom Penh
success—32 of 38 poor communities gained a piped water supply and the remaining 6 received stand posts. In rehabilitating old lines, more expensive but more durable materials were used. Also, some politicians responsible for illegal connections were made to abide by the rules and there is now far less political interference in the Water Supply Authority. Private Sector and the Urban Poor
Water for All – Providing Water Services to Low-income Communities Mai Flor presented Ondeo Services’ program for providing water services to low-income communities by showing the
principles of action, examples in several cities, and the lessons learned in the program. Ondeo has 125 million customers, of whom 8.8 million are low-income consumers in developing countries. The key challenges in serving the urban poor include rapid population growth, high proportion of urban populations that live in slums without adequate social services, urban poverty, need for large investments, and lack of replicable models. Alongside the challenges are the realities of water supply—the poor pay more than their fair share for water services; subsidies mainly benefit the nonpoor; investments are far too great a burden on governments; the poor are willing to pay given the right conditions; sanitation for the poor is feasible and demand is higher than expected; and private operators will serve all their customers. The principles adopted by Ondeo in serving the poor are involving local communities in the decision-making process and in subsequent construction and operational management; creating strategic partnerships with governments, NGOs, and international organizations; optimizing technical standards to make them suitable; and providing real services, not only connections but also technical and financial support, training, health and hygiene education, and special tariffs.
Ms. Flor then cited Ondeo’s experiences in Buenos Aires (Argentina), Casa Blanca (Morocco), La Paz (Bolivia), and
western Manila (Philippines). Based these experiences, the lessons learned were the value of including low-income communities in business plans; services have to be adapted to suit local conditions; development of services should be
____________________________________________________________________________________________________ 78 Water in Asian Cities
demand driven; development of services must be profitable for the community and the company; and “Water for All” can become a reality for existing and future cities.
Privatization and Services to the Poor Jacques Bret cited the global problem of rapid growth of population, an increase of 5.5 million each month; there are
currently 1.5 billion who do not have satisfactory access to water. Global urbanization is a major problem. The key players are local governments, local water authorities, and private operators. While there are technical initiatives from the technologically advanced north that can be adopted in the south, social initiatives are also required. He said there is a need to better understand user needs. Policies should be drawn up with full public participation. He cited projects in Durban and Pietermaritzburg in South Africa that involved the local community and were set up by Business Partners in Development.
Small –scale Independent Private Water Providers – A Significant Role for Water Supply in Cities Herve Conan summarized the involvement in South America, Africa, and Asia of small-scale independent private water
providers (SSIPWPs). Citing the scope of their services and their niche in the market, he pointed out the need to recognize and legalize them so that they can be part of the public-private-community partnership. SSIPWPs provide more water to consumers than large international private companies; more than 25% of urban residents are served by them. He gave examples of consumers served by SSIPWPs in South America – Santa Cruz (100%), Guatemala (50%); and Africa – Abidjan (75% of households), Kampala (35%), and Dar Es Salaam (31%). In Asia, piped systems are emerging among the SSIPWPs, as in Cebu in the Philippines. In all these examples, the businesses are generally considered risky and are operating in unfriendly political and legal environments.
SSIPWPs are normally informal family businesses that are commercially driven and use low-cost technology. They are
a niche market, being responsive to customer demand, technically innovative, and flexible toward customers (SSIPWP staff live within the community they serve in most cases). The role of the SSIPWPs is often not recognized—they operate in an illegal or uncertain legal framework—but they will play an important role in the long term, as long as formal water utilities fail in providing services to their service areas. SSIPWPs need to be recognized and legalized because a competitive environment is more efficient to avoid high and excessive tariffs than control by local authorities.
Small-scale Independent Water Providers Study in the Philippines Andrew Whillas presented the initial findings of the study on the five types of SSIPWPs in the Philippines: those owned
by real estate developers, home owners’ associations, local entrepreneurs serving poor communities, water truckers and haulers, and water cooperatives. Access to water for the poor is greatest with local entrepreneurs (40%), followed by cooperatives (32%) and water truckers (25%). Nonpiped consumers spend about 16% of household income on water compared with 6.1% for those connected. These expenditures are much higher than those of consumers connected to either of the two Manila concessionaires—1.0–1.7% of household income. The study also showed that SSIPWPs are sustainable, with the oldest being 50 years old. Preliminary findings of the study are: most SSIPWPs are likely to stay in business; the poor tend to pay the highest price for water, but the burden can be reduced through rationalization of bulk rates, improved efficiencies provided by concessionaires and the SSIPWPs, and changes in connection fee policy; there is no immediate need for economic regulation of SSIPWPs; there is potential for collaborative partnerships between concessionaires and SSIPWPs (bulk supply for distribution); and official pricing by the formal utilities affects the pricing of water from SSIPWPs and their market structure.
Experiences of External Support Agencies
Philippines Water and Sanitation Sector Assistance Strategy Note and Experiences Maya Villaluz presented the water and sanitation sector assistance strategy of the World Bank for the Philippines.
There is an inadequate and eroding capability of existing sectoral institutions to expand and improve service delivery under existing financing procedures. The sector assistance strategy, therefore, aims to improve efficiency and accountability of water utilities to consumers, facilitate PSP, and leverage private financial flows into the sector. Ms. Villaluz then outlined the focus, activities, timing, outputs, and responsible agencies for each strategy theme. These include technical assistance grants and investments in the sector through government financing institutions to local government units and water districts, while improving the financing framework for local government units and supporting public-private partnerships and
___________________________________________________________________________________________________ Proceedings of the Regional Consultation Workshop 79
regulatory reforms. The strategy also includes emphasis on partnerships with NGOs in public consultations, and academe for research in such areas as best practices and water demand.
Lessons Learned from ADB’s Operations Evaluation K. E. Seetharam presented the results of an ADB impact evaluation study that looked at the longer-term real impacts
achieved by its projects in the water sector, for which ADB has invested US$4.4 billion or 5% of its total lending. Among the main lessons learned from the study were that utilities should aim for full cost recovery—people are willing to pay for continuous supply and direct connections—with PSP helping to reduce cost. Sanitation, hygiene, and health promotion should be included (water supply in isolation is not enough to maximize health benefits). NRW can be reduced (25% to 30% is possible), and leakage detection is only one aspect; others include a caretaker approach to providing service management. Demand-side management should be used. There are alternatives to distribution through taps—some consumers are prepared to pay up to 7,000 times the normal cost of tap water for a small volume of bottled water. Beneficiaries should be involved at all stages of rural water supply projects; often one committed person makes all the difference. Finally, projects should be implemented expeditiously (within 2 years) because people will not wait long before they seek alternative sources.
Water for Asian Cities: Pro-poor Investments in Water and Sanitation to Support the Millennium Development Goals Kalyan Ray presented the proposed Water for Asian Cities Program as part of the efforts to achieve the Millennium
Development Summit goals of improving the lives of 100 million slum dwellers by 2020; and halving by 2015 the proportion of people without access to safe drinking water and sanitation. He explained the United Nations-Habitat’s strategy and response of programmatic and institutional strengthening; delivery mechanisms through programs, partnerships, and alliances; and the use of the water and sanitation trust fund. Mr. Ray cited the learning experience from the Water for African Cities Program, which has a strong demand-side focus. The program has enhanced institutional and human resource capacity, enhanced political will and awareness, created an enabling environment for new investments and city-to-city cooperation, and created a flexible framework for regional cooperation and interagency collaboration. Based on the New Delhi Consultation, the Water for Asian Cities Program should provide greater attention to sanitation, hygiene promotion, and urban demand management; and give highest priority to the peri-urban poor for future investments in urban basic services. In partnership with local governments, the urban poor can improve their living conditions and income opportunities through local initiatives.
Lessons from Japan Bank for International Cooperation Water Supply Projects Motonori Tsuno presented lessons from the experience of the Japan Bank for International Cooperation in relocation of
shanty communities using the concept of community action planning that was developed with national housing authorities in Sri Lanka. He said that the conditions that are considered essential for improving the living conditions in resettlement areas are support from external agencies and previous experience in residents’ associations. The project in Badowita is considered sustainable; it has a strong link to the University of Sri Lanka, which will continue supporting and monitoring the community. The project model is also considered transferable.
Operation and Maintenance Network Activities Kazuaki Mori presented the activities of the Operations and Maintenance Network, one of the groups under the Water
Supply and Sanitation Collaborative Council (WSSCC). The network was established during the Fourth Global Forum of the WSSCC in Manila in 1997 to address the issue of poor management and inadequate operation and maintenance in water supply and sanitation projects. The network’s objectives are to support information provision on O&M by regional or national resource centers; to promote available O&M tools; to revise, upgrade, and adapt (to local context) O&M tools; to promote country-level policy formulation for O&M and its sustainability; and to contribute to a more efficient and effective use of limited resources. Tools include guidelines, manuals, training packages, and case studies as sources of information for decision makers, planners, economists, consultants, and sector professionals. Collaboration with regional groups will be supported through network development.
Open Discussion A major issue discussed was the importance of water awareness and the important role of media. It was mentioned
that in Africa, a media network and journalists’ workshops are being organized. The media often focused on problems rather than the options and solutions. Sometimes, there is no media strategy to encourage people to support a project. On
____________________________________________________________________________________________________ 80 Water in Asian Cities
tariffs and privatization, it was stated that tariff increases are governed by contract and that there is a review and approval process as a safeguard to excessive tariff increases when contractors are not performing well. Water and Human Values and Culture
Mantra Pushpam – A Presentation on Water S. Vaidhyasubramaniam presented a multimedia presentation on water in a Vedic hymn usually sung during offerings
with flowers. It deals with the relationship of water with fire, wind, sun, moon, stars, clouds, and the seasons, and the energies involved.
Water and Human Values and Culture in India Jagadiswara Rao presented ancient knowledge and practices about water in India and the problems brought about by
unsustainable population levels in modern India. He described new ways of developing water sources to meet the growing demand for water by utilizing all sources from rivers to groundwater, interlinking rivers, and desalinating seawater. Mr. Rao presented lessons from droughts in Karnataka, Andhra Pradesh, and Tamil Nadu where surface water sources were depleted and only deep groundwater saved drinking water and irrigation supplies. He advocated the use of groundwater both from shallow and deep aquifers with recharging and proper development. Mr. Rao saw the need for rainwater harvesting and groundwater recharging including artificial means to sustain development.
Water Education in African Countries Kalyan Ray presented examples in Africa of problems needing value-based solutions. He cited situations where illegal
tapping of water lines is widespread; farmers in Africa have even tapped sewer lines for irrigation, resulting in pollution of water sources; and there were riots in Johannesburg over a water tariff increase several years ago. Mr. Ray mentioned some value-based solutions including attitudinal change. People should be willing to pay higher tariffs by cutting back on entertainment expenses in order to supply water to poor neighborhoods. To combat corruption, they should be willing to pay the full bill and not avoid payment. Conservation should be encouraged by stopping watering during dry periods. A new water ethic is needed, for which children and the young are the best ambassadors. Mr. Ray added that when included in the educational curriculum, it has been found that the value-based approach does not overload the current curriculum, and is cost effective because no additional investment is required.
Open Discussion There was wide support for value-based approaches to solutions to water problems and environmental concerns. It
was pointed out that in Africa, some 170 lesson plans have been developed and that these are available to others. On groundwater abstraction, concern was again expressed about arsenic problems in shallow wells in Bangladesh. It was pointed out that the Global Water Partnership is encouraging the use of inflatable dams in Karnataka and Bangladesh to retard river flows and encourage recharge in the dry season. Preparations for the Third World Water Forum
Masahiro Kobayashi presented the preparations being made for the Third World Water Forum. In the ensuing open discussion, the participants were worried that the high cost of participation would exclude the poor and NGOs from speaking out in the forum. Mr. Kobayashi replied that there was a special rate for NGOs and this would possibly be extended to representatives from low-income countries. Concerning indigenous/grassroots inputs, some representatives would be invited to present their inputs. Group Discussion
Following the presentations, the participants broke up into groups, each of which discussed one of the eight topics selected in the plenary sessions: governance/policy development, conservation/water demand management, water awareness/education, private sector participation, small-scale water providers, tariffs, pollution control, and water and the urban poor.
___________________________________________________________________________________________________ Proceedings of the Regional Consultation Workshop 81
Before the group discussion session, Mr. Yosuke Yamashiki and Ms. Keiko Wada made a brief presentation on Water Supply in Osaka from the Lake Biwa–Yodo River Basin. They described the basin, the need for advanced water treatment, and the role of civil society in addressing issues affecting the basin. Eutrophication of water upstream from Lake Biwa and treated wastewater discharge from upstream cities including Kyoto necessitated the use of advanced water treatment for Osaka. Environmental concerns for the basin are being addressed by journalists and NGOs who are raising awareness and promoting transparency, and by academe who are providing scientific data through such studies as a 3-dimensional eutrophication model for Lake Biwa. Presentation of Group Discussion Outputs Group 1: Governance/Policy Development
• Make civil society stakeholders effective partners with government in the policymaking process at the national, regional (river basin), and local levels.
• Assist government in its role of enabler to implement integrated water management policies as promoted by the Global Water Partnership using participative river basin management techniques.
• Make policies equitable and inclusive of all sectors of society, but with a bias towards pro-poor support, and respecting the four fundamental areas of water—people, food production, industry, and environment.
Group 2: Conservation/Water Demand Management
• Establish a dedicated working group within ADB to focus on resource conservation, in particular aquifer recharge and recycling. The group could also consider undertaking or funding research.
• Develop hydrological land-use plans, including rainwater harvesting and treated wastewater recycling, and prepare water budgets in cities.
• Promote water saving devices, making them compulsory for new developments. • Encourage improved management of local watersheds.
Group 3: Water Awareness/Education
• Promote cultural, environmental, functional, and economic values of water, sanitation, and hygiene behavior. • Develop equity and pro-poor policies. • Promote school sanitation and hygiene. • Re-balance budget allocations between sanitation and water supply. • Promote social marketing of sanitation and hygiene through messages and activities. • Organize forums of water professionals (water experts, media, academe). • Develop indicators for impact monitoring. • Periodically review achievements to ensure Millennium Development Goals are achieved. • Establish public information centers at the national or regional level to ensure easy access to information for all.
Group 4: Private Sector Participation
• Remove political interference in utility operation, for example through corporatization. • Give national companies priority over international companies, and encourage involvement of community-based
companies in water service provision. • Develop strong regulatory organizations with specific guidelines to ensure pro-poor emphasis and to incorporate an
exit strategy in PSP contract documents. • Remove water services from the General Agreement on Trades and Services of the World Trade Organization.
Group 5: Small-scale Water Providers
• Facilitate their regulation within the water sector. • Facilitate recognition/legalization of SSWPs. • Clarify the utility network development plans. • Define regulations at the lowest possible level. • Develop good local governance.
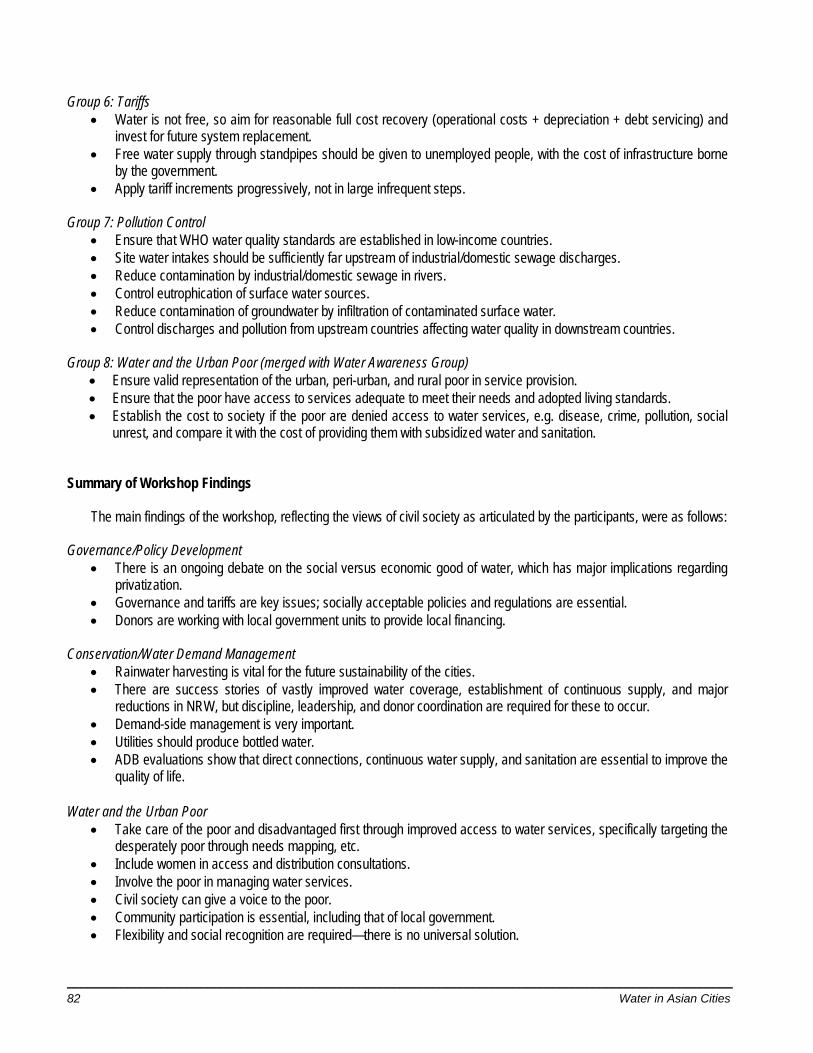
____________________________________________________________________________________________________ 82 Water in Asian Cities
Group 6: Tariffs
• Water is not free, so aim for reasonable full cost recovery (operational costs + depreciation + debt servicing) and invest for future system replacement.
• Free water supply through standpipes should be given to unemployed people, with the cost of infrastructure borne by the government.
• Apply tariff increments progressively, not in large infrequent steps. Group 7: Pollution Control
• Ensure that WHO water quality standards are established in low-income countries. • Site water intakes should be sufficiently far upstream of industrial/domestic sewage discharges. • Reduce contamination by industrial/domestic sewage in rivers. • Control eutrophication of surface water sources. • Reduce contamination of groundwater by infiltration of contaminated surface water. • Control discharges and pollution from upstream countries affecting water quality in downstream countries.
Group 8: Water and the Urban Poor (merged with Water Awareness Group)
• Ensure valid representation of the urban, peri-urban, and rural poor in service provision. • Ensure that the poor have access to services adequate to meet their needs and adopted living standards. • Establish the cost to society if the poor are denied access to water services, e.g. disease, crime, pollution, social
unrest, and compare it with the cost of providing them with subsidized water and sanitation. Summary of Workshop Findings
The main findings of the workshop, reflecting the views of civil society as articulated by the participants, were as follows: Governance/Policy Development
• There is an ongoing debate on the social versus economic good of water, which has major implications regarding privatization.
• Governance and tariffs are key issues; socially acceptable policies and regulations are essential. • Donors are working with local government units to provide local financing.
Conservation/Water Demand Management
• Rainwater harvesting is vital for the future sustainability of the cities. • There are success stories of vastly improved water coverage, establishment of continuous supply, and major
reductions in NRW, but discipline, leadership, and donor coordination are required for these to occur. • Demand-side management is very important. • Utilities should produce bottled water. • ADB evaluations show that direct connections, continuous water supply, and sanitation are essential to improve the
quality of life. Water and the Urban Poor
• Take care of the poor and disadvantaged first through improved access to water services, specifically targeting the desperately poor through needs mapping, etc.
• Include women in access and distribution consultations. • Involve the poor in managing water services. • Civil society can give a voice to the poor. • Community participation is essential, including that of local government. • Flexibility and social recognition are required—there is no universal solution.
___________________________________________________________________________________________________ Proceedings of the Regional Consultation Workshop 83
Water Awareness and Education • All stakeholders need to raise their awareness and understanding of all the issues as well as the views of other
stakeholders. • NGO forums or city forums (coalitions of civil society groups including the private sector) should be used to improve
dialogue and lobbying. • Water and human values and culture are important; attitudes and values may have to change, overcome
“resistance to change,” and adopt value-based approaches to education. • Films are a powerful tool, but the message must be correct. • Journalist networks and the media can play an important role.
Private Sector Participation
• Involve the private sector in the delivery of “Water for All” services. • Reassess the role of and partnerships with SSWPs, which already provide 20–50% of water in many cities. • Human rights views on PSP conflict with access, private commodities, and the concept of making a profit from
water services. • Improve public utilities before embarking on PSP. • PSP is helping the poor and reducing connection fee obstacles. • Property titles are not required in order to provide water services. • Operators must have a social dimension—they need to involve customers.
Tariffs
• Full cost recovery is not impossible; demand management is required. • The rich and middle class receive subsidies, but not always the poor. • Consider subsidizing connection fees rather than the tariff.
Pollution Control and Sanitation • Standards and their enforcement are essential for good water quality. • Remove the biggest polluters from cities. • Watersheds need to be protected and a water levy imposed on users. • UN-Habitat emphasizes the key role of sanitation in achieving the Millennium Development Goals; also, political
awareness, demand management, capacity building, education, and a focus on the poor are critical. Closing Statement
Bradford R. Philips, Director of the Agriculture, Natural Resources, and Social Sectors Division of the Regional and Sustainable Development Department of ADB, stated that the workshop had been unique; it was the first time that ADB had actively targeted civil society for sharing information about water supply and sanitation. He said that because civil society was a special stakeholder in the development process, ADB wanted to develop better ways of working with civil society groups as full partners in solving development issues. Further, as the workshop confirmed, there was a great need for awareness of water issues and civil society needed to play a central role in creating such awareness. In this regard, he said, ADB was working at the international level through the Third World Water Forum to bring the issues and actions to everyone’s attention. While ADB was working at the regional level through workshops such as this, the workshop had shown the need to do more on awareness at the national and local levels. The workshop also highlighted how water supply and sanitation problems varied from country to country as pointed out by participants coming from different countries and institutions with different political, social, and economic perspectives. Hence, there was a need for understanding and flexibility by ADB in promoting reforms in this sector. Mr. Philips also noted the endorsement of the participants on the need to give the urban poor access to clean water and sanitation and the issues of affordability and willingness to pay. He said that ADB would consider these issues. He then assured the participants that their efforts in the workshop would make a difference because ADB would provide the participants’ governments with the findings of the workshop for review and comment. Those governments would articulate their proposed actions to deal with civil society concerns at the Third World Water Forum. Finally, he asked the participants to keep in touch with ADB and other development partners so they could work together for their common goal.
____________________________________________________________________________________________________ 84 Water in Asian Cities
WORKSHOP PROGRAM
Regional Consultation Workshop on Water in Asian Cities – The Role of Civil Society
Asian Development Bank
Manila, Philippines 14—16 October 2002
Monday, 14 October 08:00 - 08:30 Registration of Participants 08:30 - 09:15 Opening Session Chairperson: B. R. Philips, RSAN, ADB
• Song and Dance on Water School Children from Casa Del Niño Science Schools
• Opening Address Myoung-Ho Shin, Vice-President, ADB
• Keynote Address Antonino T. Aquino, President
Manila Water Co., Inc. 09:15 - 09:45 Coffee Break and Group Photo 09:45 - 10:00 Workshop Arrangements Cesar E. Yñiguez, Consultant, RSAN 10:00 - 12:00 Session 1: Water in Asian Cities Chairperson: Allen Williams, RSAN, ADB
• Challenge Arthur C. McIntosh, RSAN, ADB
• Presentation – Geoffrey Bridges, Mott McDonald Water Utility Findings Civil Society Findings
• Discussion 12:00 - 13:30 Lunch Break 13:30 - 15:00 Session 2: Civil Society Presentations Chairperson: David Dole, EREA, ADB
• S. Jaganathan, Sri Sathya Sai Project, Bangalore • Guna Raj Shrestha, NGO Forum, Kathmandu • Charles Santiago, Stamford College, Kuala Lumpur • Jese Sikivou, Pacific Islands Broadcasting Association, Suva • Shiao-Shing Chen, National Taipei University of Technology, Taipei,China • Manu Bhatnagar, INTACH, New Delhi • D. C. H. Senarath, University of Moratuwa, Sri Lanka • Cecilia Soriano, Ateneo de Manila University, Quezon City
____________________________________________________________________________________________________ Appendix 1 – Workshop Program 85
• Kulwant Singh, HUDCO, New Delhi • Short Video “Delhi – The Receding Waters” , Krishnendu Bose, Earthcare Films,
New Delhi 15:00 - 15:15 Coffee Break 15:15 - 17:00 Session 3: Case Study Presentations Chairperson: Charles Andrews, SESS, ADB
• Chennai K. R. Gopinath, KRG Rainwater Harvesting Foundation
• Sri Lanka Premakumar Fernando, NWSDB
• Phnom Penh Ek Sonn Chan, PPWSA Keiko Yamamoto, JICA
• Discussion
Tuesday, 15 October 08:30 - 10:00 Session 4: Private Sector and the Urban Poor Chairperson: Ma. Teresa Kho, PSIF, ADB
• Privatization and Services to the Poor Mai Flor, Ondeo Services Jacques Bret, Vivendi Water
• Small-Scale Private Water Providers Herve Conan, BURGEAP
Andrew J. Whillas, WSP-EAP • Discussion
10:00 - 10:15 Coffee Break 10:15 - 12:00 Session 5: External Support Agencies’ Experiences Chairperson: David Edwards, OED2, ADB
• Water Supply and Sanitation Strategy Maya Villaluz, World Bank, Manila
• ADB Post Evaluation K. E. Seetharam, OED, ADB
• Lessons from the Water for African Cities Programme Kalyan Ray, UN-Habitat
• Lessons from JBIC Water Supply Projects Motonori Tsuno, OED, JBIC
• O&M Network Activities Kazuaki Mori, WSSCC and NIPH
• Discussion 12:00 - 13:30 Lunch Break
____________________________________________________________________________________________________ 86 Water in Asian Cities
13:30 - 14:00 Session 6: Issues for Group Discussion Chairperson: Geoffry Bridges, Mott MacDonald
• Plenary Discussion
14:00 - 15:30 Session 7: Group Discussion 15:30 - 15:45 Coffee Break 15:45 - 17:00 Session 7: Group Discussion (continuation)
Wednesday, 16 October 08:30 - 10:00 Session 8: Water and Human Values and Culture Chairperson: K. E. Seetharam, OED2, ADB
• Multi-media Presentation on Water and Culture S. Vaidhyasubramaniam, SASTRA, Thanjavur
• Water and Human Values and Culture R. Jagadiswara Rao, Tirupati, India
• Water Education Kalyan Ray, UN-Habitat
10:00 - 10:15 Coffee Break 10:15 – 10:45 Session 9: Preparations for the 3rd World Water Forum Chairperson: K.E. Seetharam, OED2, ADB
• Framework and Progress on the 3rd World Water Forum
Masahiro Kobayashi, 3WWF Secretariat • Asian Cities water supply issues to be taken to 3WWF
10:45 - 11:30 Session 10: Presentation of Group Discussion Outputs Chairperson: Geoffry Bridges, Mott McDonald 11:30 – 12:00 Session 11: Summary of Workshop Findings Chairperson: Arthur C. McIntosh, RSAN, ADB 12:00 - 12:30 Closing Program
• Closing Statement Bradford R. Philips, Director, RSAN
LIST OF PARTICIPANTS AND OBSERVERS
BANGLADESH Mr. Quamrul Islam Chowdhury World Water Forum of Journalists 42/1/Kha, Segun Bagicha Dhaka -1000, Bangladesh Tel (880 2) 933 6987 Fax (880 2) 933 0354 Mobile (880 17) 591 792 E-mail: [email protected] Mr. Nazrul Islam Department of Geography & Environment University of Dhaka Dhaka-1000, Bangladesh Tel (880 2) 812 0047 Fax (880 2) 811 9451 E-mail: [email protected] or [email protected] Mr. Quamrul Islam Siddique Chairman, Bangladesh Water Partnership House No-14, Road No-9 Dhanmondi Residential Area Dhaka-1205, Bangladesh Tel (880 2) 811 2002 Fax (880 2) 912 5000 Mobile (880 11) 852 642 E-mail: [email protected]
CAMBODIA Mr. Som Mithonarath Director, Business Development SAWAC Consultants for Development #203, Street 310, P. O. Box 549 Phnom Penh, Cambodia Tel (855 23) 362 064 Fax (855 23) 217 568 Mobile (855 12) 825 512 E-mail: [email protected] Mr. Cheang Sokha Reporter, Business News 12EO, Street 82 (Preah Vihear) Sras Chok, Daun Penh Phnom Penh, Cambodia Tel (855 23) 722 332 Mobile (855 12) 862 612 E-mail: [email protected]
Mr. Chea Visoth Advisor to the General Director Phnom Penh Water Supply Authority Phnom Penh, Cambodia Tel (855 16) 880 885 Fax (855 23) 428 969 E-mail: [email protected] Mr. Ek Sonn Chan General Director Phnom Penh Water Supply Authority Phnom Penh, Cambodia Tel (855 16) 820 777 Fax (855 23) 428 969 E-mail: [email protected]
PEOPLE'S REPUBLIC OF CHINA Mr. Pan Tian Shanghai Morning Post Floor 17, Hankou Road Shanghai 200001, People’s Rep. of China Tel (86 21) 6352 1111 Fax (86 21) 6351 1030 Mobile (86 136) 2193 6135 E-mail: [email protected] Mr. Jin Wei Tong-ji University 588 Mi Yun Road Shanghai 200092, People’s Rep. of China Tel (86 21) 6598 1805 Fax (86 21) 6598 5157 Mobile (86 138) 0163 3597 E-mail: [email protected] Mr. Liu Xinchao Shanghai Water Supply & Wastewater Discharge Technological Information Network Room 202, No. 15, Lane 318 San Men Road Shanghai 200439, People’s Rep. of China Fax (86 21) 6598 0690 Mobile (86 135) 0165 7280 E-mail: [email protected]
FIJI ISLANDS Mr. Jese Sikivou Chief Executive Officer Pacific Islands Broadcasting Association
____________________________________________________________________________________________________ Appendix 2 – List of Participants and Observers 87
____________________________________________________________________________________________________ 88 Water in Asian Cities
16 Ma’afu Street Suva, Fiji Tel (679) 315 522 Fax (679) 315 379 E-mail: [email protected]
HONG KONG, CHINA Mr. Kin Che Lam Chairman, Department of Geography and Resource Management Chinese University of Hong Kong Shatin, New Territories Hong Kong, China Tel (852) 2609 6458 Fax (852) 2603 5006 E-mail: [email protected] Mr. Chun Ho Wong Senior Reporter Ming Pao Newspaper Ltd. 15/F, Block A Ming Pao Industrial Centre 18 Kai Yip Street, Chai Wan Hong Kong, China Tel (852) 2595 3166 Mobile (852) 9610 6288 E-mail: [email protected] Mr. Ka Sing Yeung Head, Corporate Human Resources Human Resources Department The Hong Kong & China Gas Co., Ltd. 23/F, 363 Java Road, North Point Hong Kong, China Tel (852) 2963 3880 Fax (852) 2561 6113 E-mail: [email protected]
INDIA Mr. Manu Bhatnagar Advisor, Indian National Trust for Art & Cultural Heritage (INTACH) 71, Lodhi Estate New Delhi 110 003, India Tel (91 11) 469 2774, 464 5482 Fax (91 11) 461 1290 E-mail: [email protected] Mr. Krishnendu Bose Earthcare Films B-91 Defence Colony New Delhi 110 024, India Tel (91 11) 462 5896, 465 4221
Fax (91 11) 464 7310, 462 6699 E-mail: [email protected] Mr. Om Prakash Mathur National Institute of Public Finance and Policy 18/2, Satsang Vihar Marg, Special Institutional Area New Delhi 110 067, India Tel (91-11) 656 9303, 656 3305 Fax (91-11) 685 2548, 651 2703 E-mail: [email protected] Ms. Rupa Chinai Special Correspondent, The Times of India Dr. D. N. Road, Mumbai 400 001, India Tel (91 22) 5635 4656 Fax (91 22) 2273 1144 or 2273 1401 E-mail: [email protected]
INDONESIA Ms. Ida Dhaliawati Jl. Wisma Jaya No.2, Rawamangun Jakarta Timur 13220, Indonesia Tel (62 21) 489 2158 Mobile (62 812) 994 1015 E-mail: [email protected] Mr. Job Supangkat Indonesian Communication Forum on Drinking Water Quality Management (FORKAMI) Jl. Percetakan Negara No. 29 Gedung D Lt. 3, Jakarta 10560, Indonesia Tel/Fax(62 21) 426 8865 Mobile (62 812) 818 4792 E-mail: [email protected] Mr. Maddar Thayrun Internews Indonesia Jl. Tanjung No.50 Menteng, Jakarta 10350, Indonesia Tel (62 21) 392 3030 Fax (62 21) 392 2255 Mobile (62 812) 934 8358 E-mail: [email protected]
JAPAN Ms. Keiko Wada Lake Biwa-Yodo River Water Quality Preservation Organization (WADA) 1-1-30-3F Yokoi Kitahama Bldg, Kitahama Chuo-ku, Osaka 541-0014 Japan
____________________________________________________________________________________________________ Appendix 2 – List of Participants and Observers 89
Tel (81 6) 6202 1267 Fax (81 6) 6202 1317 E-mail: [email protected] Mr. Tsutomu Watanabe Science Writer 4-129-1-506 Minamikidera Nara 630-8303, Japan Tel (81 7) 4223 6640 Mobile (81 90) 3923 6036 E-mail: [email protected] Mr. Yosuke Yamashiki Assistant Professor Graduate School of Global Environmental Studies Kyoto University Yoshida-honmachi, Sakyo-ku Kyoto 606-8501, Japan Tel (81 7) 5753 9143 Fax (81 7) 5753 3336 E-mail:[email protected]
REPUBLIC OF KOREA Mr. Suing-il Choi Professor, Department of Environmental Engineering Korea University 1, 5-ka, Anam-dong, Sungbuk-gu Seoul 136 701, Korea Tel (82 2) 3290 3976 Fax (82 2) 928 7430 Mobile (82 16) 352 1453 E-mail: [email protected] Mr. Kim Dong Hwan Journalist and Publisher Water Resource and Environment 613-2, Bulkwang1-dong, Eunpyung-gu Seoul, Korea Tel (82 2) 308 2333 Fax (82 2) 358 2335 Mobile (82 11) 733 2331 E-mail: [email protected] Mr. Na Gui Hwan 507 Suwoon Bd. 88 Kyungwoon-dong, Chongro-gu Seoul 110 775, Korea Tel (82 2) 733 1489 Fax (82 2) 733 2229 Mobile (82 11) 868 1489 E-mail: [email protected]
LAO PEOPLE’S DEMOCRATIC REPUBLIC Mr. Boualinh Soysouvanh Vice Dean, Faculty of Engineering and Architecture National University of Laos Vientiane, Lao PDR Fax (856 21) 314 382 Mobile (856 20) 507 321 E-mail: [email protected] Mr. Phoutthasack Inthakoummane Chief Reporter, Vientiane Times Newspaper Pangkham Road, PO Box 5723 Vientiane, Lao PDR Tel (856 21) 217 593, 216 364 Fax (856 21) 216 365 Mobile (856 21) 900 151 E-mail: [email protected]
MALAYSIA Ms. Anuradha Chelliah Manager, Consumer Research, Education and Protection Education and Research Association for Consumer No. 24, Jalan SS1/22A 47300 Petaling Jaya, Malaysia Tel (60 3) 7877 4741 Fax (60 3) 7873 0636 E-mail: [email protected] Mr. Charles Santiago Senior Lecturer, Stamford College MSN Diversified C-3A1 Block C, Avenue Court Jalan Tmn. Sri Sentosa 58200 Kuala Lumpur, Malaysia Mobile (60 19) 315 0939 E-mail: [email protected] MONGOLIA Ms. Norolhoosuren Munhuu Centre for Social Development Post Office Box 20-A Sukhbaatar Square 3 Ulaanbaatar-11, Mongolia Tel (976 11) 321 135 Fax (976 11) 329 607 E-mail: [email protected] Ms. Badralmaa Regzedmaa Head of Training Division Academy of Management Khun-Uul District
____________________________________________________________________________________________________ 90 Water in Asian Cities
Ulaanbaatar-36, Mongolia Tel (976 99) 162 138 Fax (976 11) 343 037 E-mail: [email protected] Mr. Dendev Sandagsuren Editor-in-Chief, Mongoliin Medee Chingeltei District, Baga Toiruu 1 Ulaanbaatar, Mongolia Tel (976 11) 318 718 Fax (976 11) 318 718 E-mail: [email protected]
NEPAL Mr. Navin Singh Khadka Executive Editor Space Time Today P.O. Box 21177, Lazimpat Kathmandu, Nepal Tel (977 1) 420 020 or 411 475 Fax (977 1) 425 570 Mobile (977 98) 103 8361 E-mail: [email protected] Mr. Guna Raj Shrestha NGO Forum on Kathmandu Water Supply and Sanitation Development Network P.O. Box 8973, NPC 112 Kathmandu, Nepal Tel (977 1) 491 475 or 491 990 Fax (977 1) 232 011 E-mail: [email protected] or [email protected] Mr. Surendra S. Phuyal Senior Journalist The Kathmandu Post Kantipur Publications Pvt Ltd P O Box 8559 Kathmandu, Nepal Tel (977 1) 480 100 (977 1) 450 900 E-mail: [email protected]
PHILIPPINES Fr. Margarito Alingasa President, Cebu Uniting for Sustainable Water Foundation, Inc. EADSC Building 35 Lopez Jaena St., Cebu City Philippines 6000 Tel (63 32) 255 5626/27 Fax (63 32) 414 9316
E-mail: [email protected] Ms. Violeta Q. Perez-Corral Coordinator, NGO Forum on ADB Unit 402, 107-A Kalayaan Avenue Diliman, 1101 Quezon City Metro Manila, Philippines Tel (63 2) 433 1256 Fax (63 2) 929 7987 E-mail: [email protected] Ms. Cecilia G. Soriano President Ateneo Center for Social Policy and Public Affairs Ateneo de Manila University Social Development Complex Loyola Heights, Quezon City 1108 Philippines Tel (63 2) 426 6061/62 Fax (63 2) 426 5999 E-mail: [email protected] Ms. Elizabeth Roxas Executive Director Environmental Broadcast Circle 81 C. Raymundo, Caniogan Pasig City 1600, Philippines Tel (63 2) 641 4416 Fax (63 2) 642 2128 E-mail: [email protected] Ms. Soledad Emilia J. Cruz Director, Corporate Affairs Group Department of Finance 5th Floor, DOF Building, Roxas Boulevard Manila 1004, Philippines Tel (63 2) 525 7427 Fax (63 2) 525 1313 E-mail: [email protected] Mr. Amado de Jesus, Jr., FUAP Chairman, Green Architecture Movement United Architects of the Philippines 8408 Maharlika Avenue Marcelo Green Village, Phase 5 Paranaque City 1700, Philippines Tel (63 2) 824 5209 Fax (63 2) 824 5209 Mobile (63 919) 506 3891 E-mail: [email protected] Mr. Dennis Von C. Custodio Officer-in-Charge Supervising Economic Development Specialist
____________________________________________________________________________________________________ Appendix 2 – List of Participants and Observers 91
National Economic Development Authority 3/F NEDA sa Pasig Building Blessed J.M. Escriva Drive, Ortigas Center Pasig City, Philippines Tel (63 2) 631-3724 or 2192 Fax (63 2) 631-2188 E-mail: [email protected] Mr. Manuel S. Satorre, Jr. Philippine Environmental Journalists, Inc. Holy Family Village 2, Banilad, Cebu City 6000 Philippines Tel (63 32) 346 2786 Fax (63 32) 233 4595 E-mail: [email protected] Ms. Erlinda P. Zurita Notre Dame University Cotabato City, Philippines Tel (63 64) 421 2698 Fax (63 64) 421 4312 E-mail: [email protected]
SRI LANKA Ms. Chandani Jayatilleke Business Editor, Daily News Lake House, Colombo 10, Sri Lanka Tel (94 1) 429 221 Fax (94 1) 429 220 Mobile (94 777) 270 042 E-mail: [email protected] Mr. D C H Senarath Senior Professor Department of Civil Engineering University of Moratuwa Moratuwa, Sri Lanka Tel (94 1) 650 567/8 Fax (94 1) 651 216 E-mail: [email protected] Ms. Kamini M. Vitarana Ruk Rakaganno Women’s Environment Centre 291/16, Edward Avenue Havelock Road, Colombo 06, Sri Lanka Tel (94 1) 554 438 Fax (94 1) 554 438 E-mail: [email protected] Mr. Premakumar Fernando Deputy General Manager for Finance National Water Supply & Drainage Board P.O. Box 14, Mount Lavinia, Sri Lanka
Tel (94 1) 637 863 Fax (94 1) 637 863 E-mail: [email protected]
TAIPEI,CHINA Mr. Shiao-Shing Chen Assistant Professor Department of Civil Engineering National Taipei University of Technology Taipei,China Tel (886 2) 2771 2171 #2642 Fax (886 2) 2781 4518 E-mail: [email protected]
THAILAND Ms. Issariya Praithongyaem Editor, Thai News Agency Kc Court 2, Apartment 501 1755/6 Chan Road, Yannawa Bangkok 10120, Thailand Tel (66 2) 201 6481 Fax (66 2) 678 9163 Mobile (66 1) 424 6657 E-mail: [email protected] Mr. Somphot Somboon Chairman North East Rural Development Association 229/81 Pracha Samoson Road Amphoe Muang Khon Kaen 40000, Thailand Tel (66 43) 241 171 Fax (66 43) 241 171 E-mail: [email protected] Mr. Amnat Wongbandit Faculty of Law, Thammasat University Bangkok 10200, Thailand Tel (66 2) 613 2155 Fax (66 2) 224 9421 Mobile (66 1) 338 7494 E-mail: [email protected]
PRIVATE CONTRACTORS AND CONSULTANTS Mr. Antonino T. Aquino President Manila Water Company, Inc. Administration Building, 489 Katipunan Road, Balara 1105 Quezon City, Philippines Tel (63 2) 928-1223 or 922 3761 Fax (63 2) 922-3761 E-mail: [email protected]
____________________________________________________________________________________________________ 92 Water in Asian Cities
Ms. Babette A. Simbulan Compliance Manager Regulatory and Planning Group Manila Water Company, Inc. 489 Katipunan Road, Balara 1105 Quezon City, Philippines Tel (63 2) 928-1459 or 926 7999 Fax (63 2) 981-8126 E-mail: [email protected] Ms. Mai Flor Director for Business Development Ondeo Services Philippines Unit 802 Taipan Place, Emerald Avenue Ortigas Center, Pasig City Philippines Tel (63 2) 9142191 to 96 Fax (63 2) 6383821 E-mail: [email protected] Mr. Jacques Bret CEO, Seureca Consulting Engineers Subsidiary of Vivendi Water 6, rue Anatole de la Forge - 75858 Paris cedex 17 – France Tel (33 1) 4572 9292 Fax (33 1) 4572 9293 Mobile (33 6) 0703 8117 E-mail: [email protected] Mr. Stephan Truchot Project Finance Director - Asia Vivendi Water Asia Ltd 22/F, 8 Queen’s Road Central Central District, Hong Kong, China Tel (852) 2167 1168 Fax (852) 2167 8101 E-mail: [email protected] Mr. Herve Conan Asia Project Manager International Department, BURGEAP 27, rue de Vanves 92772 Boulogne Billancourt Cedex France Tel (33 1) 4610 2540 Fax (33 1) 4610 2549 E-mail: [email protected]
DEVELOPMENT INSTITUTIONS Ms. Maya Gabriela Q. Villaluz Operations Officer - Environment The World Bank
23rd Floor, The Taipan Place Emerald Avenue, Ortigas Center, Pasig City, Philippines Tel (63 2) 917 3074 Fax (63 2) 637 5870 E-mail: [email protected] Mr. Andrew J. Whillas Team Leader, Water Supply & Sanitation Performance Enhancement Project Water and Sanitation Program - East Asia and Pacific DILG, WSSPMO, 5th Flr Francisco Gold II Condominium EDSA corner Mapagmahal Street, Quezon City Philippines Tel (63 2) 925 0362 Fax (63 2) 925 7342 E-mail: [email protected] Mr. Russel Abrams Acting Regional Adviser (Environmental Health) Western Pacific Regional Office (WPRO) World Health Organization U N Avenue, 1000 Manila, Philippines Tel (63 2) 528 8001, 528 9890 Fax (63 2) 521 1036 E-mail: [email protected] Mr. Kalyan Ray Chief Water, Sanitation & Infrastructure Branch United Nations Human Settlement Programme P.O. Box 30030, Nairobi, Kenya Tel (254 2) 623039 or 623781 Fax (254 2) 623588 or 624265 E-mail: [email protected] Mr. Masahiro Kobayashi Secretariat, 3rd World Water Forum 5th Floor, 2-2-4, Kojimachi, Chiyoda-ku Tokyo Japan 102-0083 Tel (81-3) 5212 1645 Fax (81-3) 5212 1649 E-mail: [email protected] Mr. Kazuaki Mori Chief of Facilities Engineering Section Department of Water Supply Engineering National Institute of Public Health 4-6-1 Shirokanedai, Minato-ku Tokyo, Japan 108-8638 Tel (81-3) 3441 7111 ext. 375 Fax (81-3) 3446 7161 E-mail: [email protected]
____________________________________________________________________________________________________ Appendix 2 – List of Participants and Observers 93
Mr. Motonori Tsuno Director General, Development Assistance Operations Evaluation Office Project Development Department Japan Bank for International Cooperation 4-1, Ohtemachi 1-Chome, Chiyoda-ku Tokyo, Japan 100-8144 Tel (81 3) 5218 9601 Fax (81 3) 5218 9640 E-mail: [email protected] Ms. Keiko Yamamoto Senior Advisor for Water Supply Institute for International Cooperation Japan International Cooperation Agency 10-5, Ichigaya Honmura-cho, Shinjuku-ku, Tokyo, Japan 162-8433 Tel (81-3) 3269-3851 Fax (81-3) 3269-6992 E-mail: [email protected]
NGOS AND OTHER ORGANIZATIONS Mr. Kulwant Singh Executive Director Housing & Urban Development Corp., Ltd. HUDCO House, Lodhi Road New Delhi - 110 003, India Tel (91 11) 436 7834 Fax (91 11) 436 5292 E-mail: [email protected] Mr. Masaru Emoto Chief, Hado Institute Hado Kyoikusha Co., Ltd. 2F 2-14-4, Yanagibashi Taito-ku Tokyo 111-0052 Japan Tel (81 3) 3866 3592 Fax (81 3) 3866-5353 E-mail: [email protected] Mr. S. Jaganathan Regional Projects Manager Larsen & Toubro Limited, ECC Division 19, Kumara Krupa Road Bangalore - 560 001, India Tel (91 80) 225 9675 ext. 221 Fax (91 80) 225 6127 Mobile (91-98) 4411 3943 E-mail: [email protected] Mr. K. R. Gopinath K R G Rainwater Harvesting Foundation
A-84/2, Bharani Kailash Apartments Anna Nagar East, Chennai - 600 102, India Tel (91 44) 2621 5060 or 5549 3117 Fax (91 44) 2645 0827 Mobile (91 98) 4104 5666 E-mail: [email protected] Mr. S. Vaidhyasubramanian Dean, Planning and Development Shanmugha Arts, Science, Technology and Research Academy (SASTRA) Deemed University Thanjavur - 613 402, Tamil Nadu, India Tel (91-43) 6326 4101 or 6326 4102 Fax (91-43) 6226 4120 E-mail: [email protected] Mr. R. Jagadiswara Rao Former Professor of Geology Sri Venkateswara University 63A, 2nd Cross West, Vidyanagar Tirupati, AP 517502, India Tel (91-877) 224 9433 Fax (91-877) 224 9433 E-mail: [email protected]
OBSERVERS Mr. Virgilio Rivera Jr. Group Director, Regulatory Planning Manila Water Company, Inc. Administration Bldg., 489 Katipunan Road Balara 1105 Quezon City, Philippines Tel (63 2) 928 1495 or 981-8111 Fax (63 2) 981 8164 E-mail: [email protected] Ms. Loida S. Diño Area Business Manager Taguig/Pateros Rizal Business Area Manila Water Company, Inc. 489 Katipunan Road, Balara 1105 Quezon City, Philippines Tel (63 2) 757 2202 or 981-8107 Fax (63 2) 920 8164 E-mail: [email protected] Mr. Bernard Poignant International Finance Project Director Vivendi Environnement 38, avenue Kleber, 75116 Paris, France Tel (33 1) 7175 0152 Fax (33 1) 7175 1029 Mobile (33 6) 1229 2026
____________________________________________________________________________________________________ 94 Water in Asian Cities
E-mail: [email protected] Ms. Feri Lumampao Associate Director, Approtech Asia G/F PSDC Building Real corner Magallanes Street Intramuros, 1002 Manila, Philippines Tel (63 2) 527 6514 Fax (63 2) 527 3744 E-mail: [email protected] Ms. Kyoko Ishida Japan Center for a Sustainable Environment and Society 2F Kowa Bldg. 32, 5-2-32 Minami Azabu Minato-ku, Tokyo 106-0047 Japan Tel (81 3) 3447 9585 Fax (81 3) 3447 9383 E-mail: [email protected] Mr. Mohamed Roseli Bin Zainal Abidin Assistant Senior Director Department of Irrigation and Drainage Kuala Lumpur, Malaysia Tel (60 3) 2617 5682 Fax (60 3) 2166 5900 E-mail: [email protected] Mr. Md. Zahangir Alam Project Director Local Government Engineering Department (LGED) Level-12, LGED Bhaban, Agargaon Dhaka, Bangladesh Tel (880 2) 911 0768 Fax (880 2) 912 8804 E-mail: [email protected] Mr. Damodar Bhattarai Senior Divisional Engineer, DWIDP Kathmandu, Nepal Tel (977-1) 535 502 or 535 407 Fax (977-1) 523 528 E-mail: [email protected] Ms. Yumiko Honda Associate Expert Social Development Study Department Japan International Cooperation Agency 10-5, Ichigaya Honmura-cho, Shinjuku-ku, Tokyo, Japan 162-8433 Tel (81-3) 5352 5359 Fax (81-3) 5352 5094 E-mail: [email protected]
Mr. Toshiki Kawakami Director Research & Development Department CTI Engineering International Co., Ltd 23rd Chuo Building 4-2 Nihombashi Kodemmacho Chuo-ku, Tokyo 103-0001, Japan Tel (81-3) 3663 1544 Fax (81-3) 3663 1834 E-mail: [email protected] Mr. Kiyoto Kobayashi Assistant Resident Representative Japan International Cooperation Agency 12th Floor, Pacific Star Building Sen. Gil J. Puyat Avenue Makati City, Philippines Tel (63-2) 893 3081loc. 234 Fax (63-2) 816 4222 E-mail: [email protected] Mr. Kosuke Odowara Japan International Cooperation Agency 10-5, Ichigaya Honmura-cho, Shinjuku-ku, Tokyo, Japan 162-8433 Tel (81-3) 5352-5359 Fax (81-3) 5352-5094 E-mail: [email protected] Mr. Quadir Nurul Shah Assistant Engineer Local Government Engineering Department (LGED) Level-12, LGED Bhaban, Agargaon Dhaka, Bangladesh Tel (880 2) 812 4037 Fax (880 2) 912 8804 E-mail: [email protected] Mr. Kimio Shimomura Deputy Manager World Water Forum Division CTI Engineering Co., Ltd 9th Chuo Building 4-9-11 Nihonbashi-Honcho Chuo-ku, Tokyo 103-8430, Japan Tel (81-3) 3663 3633 Fax (81-3) 3663 3637 E-mail: [email protected] Mr. Teruo Tahara Senior Chief Engineer Research & Development Department
____________________________________________________________________________________________________ Appendix 2 – List of Participants and Observers 95
CTI Engineering International Co., Ltd 23rd Chuo Building 4-2 Nihombashi Kodemmacho Chuo-ku, Tokyo 103-0001, Japan Tel (81-3) 3663 1496 Fax (81-3) 3663 1834 E-mail: [email protected] Mr. Achmad Rusfandi Usman Lecturer on Engineering Faculty Brawijaya University Malang, Indonesia Tel (62-21) 390 7533 Fax (62-21) 390 7536 E-mail: [email protected] Mr. Bounthieng Venvongsoth Hydraulic Engineer Inland Waterways Administration Division Department of Roads Ministry of Communication, Transport, Post and Communication Vientiane, Lao PDR Tel (856-21) 416 430 or 412 288 Fax (856-21) 414 386 or 452 482 E-mail: [email protected] Mr. Wang Xiang Director, Department of Flood Detention Area Management Office of State Flood Control and Drought Relief Headquarters No.2 Lane 2 Baiguang Road Beijing 100761, People’s Rep. of China Tel (86-10) 6320 2585 Fax (86-10) 6320 2160 E-mail: [email protected] Mr. Cheng Xiaotao Director Department of Water Hazards Research China Institute of Water Resources and Hydropower Research (IWHR) Ministry of Water Resources Yuyuantan Kejiyuan, Haidian District Beijing 100038, People’s Rep. of China Tel (86-10) 6320 4316 Fax (86-10) 6320 4013 E-mail: [email protected]
ASIAN DEVELOPMENT BANK 6 ADB Avenue, Mandaluyong City 0401 Metro Manila, Philippines Mr. Charles T. Andrews Senior Urban Management Specialist Social Sectors Division Southeast Asia Department Tel (63-2) 632 6731 Fax (63-2) 636 2408 E-mail: [email protected] Mr. David Dole Economist Economic Analysis and Operations Support Division Economics and Research Department Tel (63-2) 632 6655 Fax (63-2) 636 2365 E-mail: [email protected] Mr. David Edwards Director Operations Evaluation Division 2 Operations Evaluation Department Tel (63-2) 632 4102 Fax (63-2) 636 2161 E-mail: [email protected] Ms. Elaine Glennie Financial Management Specialist Governance, Finance and Trade Division South Asia Department Tel (63-2) 632 6426 Fax (63-2) 636 2444 E-mail: [email protected] Mr. Edward M. Haugh, Jr. Director Social Sectors Division South Asia Department Tel (63-2) 632 6860 Fax (63-2) 636 2444 E-mail: [email protected] Mr. Shakeel A. Khan Urban Development Specialist Social Sectors Division South Asia Department Tel (63-2) 632 6767 Fax (63-2) 636 2444 E-mail: [email protected]
____________________________________________________________________________________________________ 96 Water in Asian Cities
Ms. Teresa Kho Investment Officer Infrastructure Finance Division Private Sector Operations Department Tel (63-2) 632 6390 Fax (63-2) 636 2347 E-mail: [email protected] Mr. Hiroyoshi Kurihara Senior Project Specialist Social Sectors Division South Asia Department Tel (63-2) 632 6851 Fax (63-2) 636 2444 E-mail: [email protected] Ms. Maria Paniagua Urban Development and Planning Specialist Social Sectors Division South Asia Department Tel (63-2) 632 6840 Fax (63-2) 636 2444 E-mail: [email protected] Mr. Bradford R. Philips Director Agriculture, Natural Resources and Social Sectors Division Regional and Sustainable Development Department Tel (63-2) 632 6751 Fax (63-2) 636 2409 E-mail: [email protected] Mr. K. E. Seetharam Evaluation Specialist Operations Evaluation Division 2 Operations Evaluation Department Tel (63-2) 632 4116 Fax (63-2) 636 2161 E-mail: [email protected] Mr. Myoung-Ho Shin Vice-President for Operations 1 Tel (63-2) 632 6015 Fax (63-2) 636 2444 E-mail: [email protected] Mr. Ramesh Subramaniam Financial Economist Governance, Finance and Trade Division East and Central Asia Department Tel (63-2) 632 6437 Fax (63-2) 636 2444
E-mail: [email protected] Mr. Etienne R. van de Walle Senior Economist Office of the Director General Pacific Department Tel (63-2) 632 6134 Fax (63-2) 636 2442 E-mail: [email protected] Mr. Allen Williams Principal Urban Development Specialist Agriculture, Natural Resources and Social Sectors Division Regional and Sustainable Development Department Tel (63-2) 632 6784 Fax (63-2) 636 2444 E-mail: [email protected]
WORKSHOP SECRETARIAT Mr. Arthur C. McIntosh Principal Water Supply Specialist Agriculture, Natural Resources and Social Sectors Division Regional and Sustainable Development Department Asian Development Bank 6 ADB Avenue, Mandaluyong City P.O. Box 789, 0980 Manila, Philippines Tel (63-2) 632 6839 Fax (63-2) 636 2409 E-mail: [email protected] Mr. Geoffrey Bridges Associate Mott MacDonald Demeter House, Station Road Cambridge CB1 2RS, United Kingdom Tel (44-1223) 463 500 or 463 532 Fax (44-1223) 461 007 E-mail: [email protected] Mr. Cesar E. Yñiguez Regional Consultant Study on Water in Asian Cities 77 Mabolo Street, Mapayapa Village Capitol District, Quezon City 1107 Philippines Tel (63-2) 931 6613 or 428 0189 Fax (63 2) 931 6613 E-mail: [email protected]
____________________________________________________________________________________________________ Appendix 2 – List of Participants and Observers 97
Mr. Vergel K. Latay Senior Operations Assistant Agriculture, Natural Resources and Social Sectors Division Regional and Sustainable Development Department Asian Development Bank 6 ADB Avenue, Mandaluyong City P.O. Box 789, 0980 Manila, Philippines Tel (63-2) 632 6839 Fax (63-2) 636 2409 E-mail: [email protected] Ms. Myla C. Bonto Administrative Assistant Agriculture, Natural Resources and Social Sectors Division Regional and Sustainable Development Department Asian Development Bank 6 ADB Avenue, Mandaluyong City P.O. Box 789, 0980 Manila, Philippines Tel (63-2) 632 6839 Fax (63-2) 636 2409 E-mail: [email protected]
Related Documents