Welcome message from author
This document is posted to help you gain knowledge. Please leave a comment to let me know what you think about it! Share it to your friends and learn new things together.
Transcript

other TORC1 subunits, Tor1 and Tco89. Ste12 is a transcription factor activated by a MAPKsignaling cascade, and Cdc42 is a small G protein that regulates MAPK signaling. Many of thegenes in the network encode MAPK pathway components. Cdc39 is a component of theCCR4-NOT core complex, and we identified many other components of this complex in ourscreen [24–28]. These essential proteins were added in order to create a more complete and bi-ologically meaningful network, not to artificially increase its connectedness by adding “hubs”.In fact, only two of these eight proteins, Cdc39 and Cdc42, have more than four connections toother proteins in the network. Moreover, as described below, we have shown that removal ofall of these essential proteins from the network does not significantly affect its topological prop-erties. There are 94 proteins (nodes) and 203 total connections (edges) in the complete network(S2 Table).
To evaluate the significance of this network, we first wished to determine whether the exten-sive interconnections among its proteins reflect a common biological function and are likely tohave been selected by evolution. To address this issue, we asked whether randomly selected col-lections of similar numbers of proteins from the yeast proteome would display similar connec-tion densities. We generated 200 random collections of approximately 98 proteins (nodes)each and annotated the interactions within each collection that had been identified in pub-lished experiments. Of the 200 networks thus defined, most had fewer than 30 total connec-tions (edges), with an average of 24.8 and standard deviation of 11.5. Only one of the 200randomly selected networks has more than 50 connections. This network contains a ubiquitinprotein, UBI4, which forms a hub that makes 43 of the 73 total connections in that network (S1Fig). In summary, then, the 203 edges in our network make the connectivity in our network~15.5 standard deviations from randomly selected networks of yeast proteins with a similarnumber of nodes. This corresponds to a p-value of 10–54.
Molecular characteristics of the fat storage regulation networkThe network contains extra- and intracellular energy/glucose detection mechanisms controlledby Mth1 and the AMP-activated protein kinase complex (AMPK) encoded by the SNF1, SNF4,and SIP1 genes and their regulators TOS3, ELM1, and SAK1. High levels of extra- or intracellu-lar glucose cause degradation of Mth1[29,30], while high AMP/ATP ratios cause activation ofAMPK [31]. A reduction in signaling through either system is likely to produce a perceivedsurplus of energy that can stimulate fat storage. Mth1 and AMPK are connected to a set of tran-scriptional regulators and to four processes that may represent outputs. These are: 1) autop-hagy, which involves the TORC1 and vacuolar H+-ATPase (Vma) pathways [32]; 2) de novofatty acid and sterol synthesis pathways; 3) MAP kinase (MAPK) pathways; 4) mRNA degrada-tion, elongation, and initiation pathways involving the CCR4-NOT complex and its associatedproteins. The MAP kinase pathways are involved in sugar and amino acid starvation responses,while the CCR4-NOT complex is known to repress the translation of mRNAs encoding pro-teins necessary for utilization of non-fermentable carbon sources and for glucose neogenesis[24,26].
Fig 1. The fat storage regulation network. (A) Nile Red/DAPI measurements (left), and TLC analysis (right) for two mutants (four replicates for each). S islard standard, and the arrow indicates the triglyceride band. Four replicate samples are shown. (B) Fat storage-regulating yeast genes encode connectedproteins. In the key at the bottom, the sizes of the circles represent the magnitude of the increase in fat levels relative to wild type, as measured by TLC (forquantification of the fat levels in each mutant see S1 Table). The molecular function of a given protein is represented by the color of the circles, while the typeof reported molecular contact between two proteins is represented by the color of the connecting lines. Unfilled rectangles are proteins encoded by 8essential genes that are likely to be part of the network (see text). (C) The network contains 7 highly connected protein communities composed of more thanthree proteins (enclosed by black dashed lines). Error bars in (A) are standard deviations of 10 replicas for a given genotype, and asterisks denote t-teststatistical significance as compared to wild-type (wt) (**p < 0.5E-5, ***p < 0.5E-8, ****p < 0.5E-9).
doi:10.1371/journal.pcbi.1004264.g001
Small-World Properties of a Fat Regulation Network
PLOS Computational Biology | DOI:10.1371/journal.pcbi.1004264 July 20, 1969 5 / 27
We next examined if proteins that participate in the same process or pathway exhibit ahigher tendency to have connections with each other than with other network proteins using awalk-trap algorithm. This function finds densely connected communities via random walksfrom one node to another [33]. The idea is that short random walks will tend to stay in thesame community. This analysis showed that the network contains seven different communities(modules) composed of three or more proteins, and that each module is enriched for proteinsthat are involved in the same process (Fig 1C).
We performed an analysis of the Gene Ontology (GO) terms associated with each of theproteins in the network. GO includes three categories: Biological Process, Molecular Function,and Cellular Component. S3 Table shows a list of the GO terms that are enriched for networkproteins relative to random yeast proteins, with p-values for the statistical significances of theenrichments. Many of these highly enriched categories are very general, with the top threebeing “growth”, “biological regulation”, and “protein phosphorylation”. Others overlap withthe output processes described above (Fig 1), and are properties of the signaling pathways, bio-logical processes, and cellular components represented in the network. Four of the moduleswithin the network defined by the walk-trap algorithm (Fig 1C) are highly enriched for specificGO terms. These are terms related to MAPK signaling (green circles), vacuolar acidificationand proton transport (dark blue circles), mRNA catabolic processes (light blue circles), andpositive regulation of transcription (red circles). It has been previously shown that GO catego-ries can correspond to clusters within the global yeast protein-protein interaction map[34].
The fact that proteins required for filamentous growth are overrepresented in the network(p = 1.8 x 10⁻⁸) is interesting, In limited nutritional conditions, yeast can adopt a filamentousgrowth pattern that permits a non-motile colony to explore its surroundings for additional nu-trients. The induction of this state requires the action of the AMPK, MAP, and Tor kinasepathways [25], which form a considerable portion of the fat regulation network. We hypothe-size that some yeast mutants that store excess fat do so because they are in a state of perceivedenergy excess, which is the opposite of the conditions in which filamentous growth wouldbe favored.
In yeast, MAP kinase pathways are organized as cassettes composed of specific combina-tions of MAPKKKs, MAPKKs, and MAPKs, and these cassettes can cross-regulate one another[28]. Because we found mutations affecting multiple MAP kinase pathways, there may be re-dundancy between the cassettes with regard to control of fat storage. Consistent with this, weobserved that a double mutant (fus3 kss1) lacking two MAPKs accumulates more fat than ei-ther single mutant (S2 Fig). We also note that mutations in TORC1 units and not TORC2units cause an increase in fat storage, thus implicating only TORC1 in yeast fat storage regula-tion. This was confirmed by the fact that rapamycin (Rap), a selective inhibitor of the TORC1complex[27], causes an increase in fat storage in wild-type yeast (S2 Fig).
We did not isolate any ‘lean’mutants in our screen. This could be due to the fact that ourgrowth media does not contain fatty acids that could be converted to phospholipids necessaryfor membrane synthesis during cell division, or, alternatively, to genetic redundancy. Indeed,in cases where a low fat storage yeast strain has been reported, a phenotype was only detectedwhen more than one fatty acid synthesis gene is removed [35,36].
Most of the genes we identified have not been previously implicated in fat storage. Earlierscreens were done for LD morphology defects, but only ~20% of the 171 genes previously re-ported to affect LDs showed an increase in fat storage in our assays [37–39]. This is not surpris-ing, because these genes were identified in screens by altered LD morphologies in live mutantcells, not by measuring fat content. Because the goal of our screen was to find mutants with al-tered fat storage levels, not to study LD dynamics, we fixed cells in order to deactivate pumps
Small-World Properties of a Fat Regulation Network
PLOS Computational Biology | DOI:10.1371/journal.pcbi.1004264 July 20, 1969 6 / 27
that can affect dye uptake and block vesicular traffic to increase the specificity of the dyes tolipid droplets, and used quantitative assays to evaluate fat content [20,40,41].
Mathematical analysis of network architectureThe fact that the interconnection density of the fat storage regulation network is much greaterthan that of any randomly generated network of yeast proteins (S1 Fig) implies that the majori-ty of the connections within the network have biological relevance. This makes yeast fat regula-tion an ideal system in which to examine whether a biological network conforms to amathematical model for network design. See S1 Text for detailed information on methods formathematical analysis used in this paper.
Many real-world networks, such as the Internet, power grids, and social networks, havebeen studied, and they tend to have certain features in common. A social network, for example,contains many different local clusters of people that are linked to each other by mutual ac-quaintances, so that any person within the cluster can be reached from another person by asmall number of steps. Social networks also contain celebrities (“hubs”), who have exponential-ly more followers than does an average member of the network. Similarly, biological signalingnetworks tend to contain modules and have hub-like proteins that make many more connec-tions than other proteins.
These features of real-world networks have been simulated using graph theory, which is thestudy of systems of objects, referred to as nodes, and their relationships, referred to as edges orconnections. The properties of networks generated by graph generation models can be charac-terized by a variety of different parameters (for review see [42]), including degree distributionP(k), global clustering coefficient Cg, modularityM, and path length L. P(k) is the probabilitythat a given network node has a certain number of connections, while Cg is a measure of the de-gree to which nodes in a network tend to cluster together [43].M is a measure of the divisionof a network into communities or modules, produced by the tendency of some nodes to formconnections primarily within the community to which they belong. Finally, L is the averagenumber of steps along the shortest paths that connect all possible pairs of network nodes.
The simplest model used to generate networks is the Erdos-Renyi model [44], characterizedby an equal probability of forming connections between any two nodes (Fig 2A). Erdos-Renyinetworks have a degree distribution similar to a Poisson distribution (Fig 2B), and have low Cg,M, and L values. Most real-world networks are not approximated well by this model, becauseErdos-Renyi graphs lack local clustering and hubs.
The Watts-Strogatz model was designed to produce better models of real-world networksby remedying the lack of clustering in Erdos-Renyi networks. Watts-Strogatz graphs are pro-duced by randomly moving the edges of a regular ring lattice, thus producing “criss-cross” con-nections across the ring[19]. This does not imply that a real network approximated by theWatts-Strogatz model contains a structure resembling a ring lattice. Moving edges on a ringlattice is simply the algorithm by which these graphs are generated. Similarly, Erdos-Renyi andscale-free graphs (see below) are also generated by specific algorithms, but this does not implythat real networks with similar topologies are built using these algorithms. Watts-Strogatz net-works are expected to have a degree distribution that depends on the rewiring probability β,which is related to the number of new connections between nodes that are introduced into thering lattice. β varies between 0 (a regular ring lattice) and 1 (a lattice where so many connec-tions are changed that it approximates an Erdos-Renyi graph). For moderate to high rewiringprobabilities, the degree distribution of the network is a binomial distribution, which in thelimit (β = 1) approximates a Poisson distribution. For a low rewiring probability (β near 0), thedistribution resembles the P(k) of a regular ring lattice, which is a delta function. In all cases,
Small-World Properties of a Fat Regulation Network
PLOS Computational Biology | DOI:10.1371/journal.pcbi.1004264 July 20, 1969 7 / 27
Small-World Properties of a Fat Regulation Network
PLOS Computational Biology | DOI:10.1371/journal.pcbi.1004264 July 20, 1969 8 / 27
graphs of P(k) as a function of k for such networks have a distinct peak. Networks generated bythe Watts-Strogatz model have local clustering and small-world properties, with high Cg andM values relative to those of Erdos-Renyi networks[19] (Fig 2A).
Scale-free networks have a P(k) distribution that follows a power law, meaning that a fewhub nodes make exponentially more connections than other nodes in the network. A graph ofP(k) as a function of k for a scale-free network resembles an exponential decay curve (Fig 2B).The best-known model for generating such networks is the Barabási–Albert model, where thenetwork evolves via the addition of new nodes that preferentially form connections to highly-connected nodes[45]. This model can account for the hubs found in real-world networks, butnot for local clustering. Hierarchical scale-free networks are composed of modular units ofnodes and connections that are combined in an iterative manner, while non-hierarchical scale-free networks have hubs but are not arranged in an organized pattern (Fig 2A). Some have ar-gued that protein networks within cells are likely to be non-hierarchical scale-free networks[46], but others have found that real biological networks cannot be made to fit a power-law dis-tribution[47,48].
The fat storage regulation network resembles a Watts-Strogatz small-world networkThe P(k) distribution of the experimental network has a distinct peak, and resembles a Poissondistribution more closely than an exponential decay curve, which indicates that the network isnot scale-free (Fig 2B). To quantify this statement, we considered the SSE (standard sum ofsquares due to error) between a binomial distribution and the observed P(k) distribution of theexperimental network. The minimal SSE obtained between a binomial distribution and the de-gree distribution for the experimental network is 0.012. The mean SSE on a selection of200,000 simulated random (Erdos-Renyi) networks with the same expected distribution was0.0099, with a standard deviation of 0.0057. This tells us that the SSE value of our network isless than half a standard deviation from the expected value. By contrast, the SSE obtained byfitting the experimental network to a power-law distribution was over two standard deviationsfrom this expected mean. This provides strong evidence that the fat storage regulation networkis much more likely to be approximated by an Erdos-Renyi model or a Wattz-Strogatz modelthan by a scale-free model (Fig 2B and S4 Table).
The experimental network has a relatively small L value (3.18), which is essentially the sameas the expected L values for simulated random (Erdos-Renyi) networks (3.19). This does notdistinguish between the Watts-Strogatz and Erdos-Renyi models, since both produce networkswith low L values. However, the Cg andM values for the experimental network (0.22 and 0.567,respectively) are higher than the expected values for simulated Erdos-Renyi networks (0.048and 0.44), but are in agreement with the Watts-Strogatz model for a moderate rewiring proba-bility (β = 0.238). Its high Cg value and low L value characterize the experimental network assmall-world. This small-world topology is a distinctive feature of the Watts-Strogatz model.
Fig 2. The fat storage regulation network has aWatts-Strogatz topology in which the importance of a protein is associated with Katz centrality. (A)Representations of the four major types of network topology. Nodes with the same color are members of the samemodule, while red circles in the scale-freenetwork diagrams represent hubs. (B) The calculated P(k) distribution of the fat storage regulation network (red line) as compared to Poisson (blue line) andpower-law distributions (yellow line). (C-H) The upper cartoon in each panel is a heat map of a small toy network showing the relative centrality for each node(high-low order: red-orange-yellow-green-aqua-blue). The lower diagram shows the experimental network map, with the sizes of the grey circles showing therelative impact on fat levels of mutation in the gene encoding that protein, and the sizes of the overlaid red circles represent the centrality values for eachnode. (H) is a map of transcriptional regulation, with the sizes of the grey circles indicating the number of genes regulated by a given transcription factor orglobal regulator. Upper black text: p-value for independence testing (Blomqvist β test). Lower black text: correlation.
doi:10.1371/journal.pcbi.1004264.g002
Small-World Properties of a Fat Regulation Network
PLOS Computational Biology | DOI:10.1371/journal.pcbi.1004264 July 20, 1969 9 / 27
In a scale-free network, loss of peripheral nodes will have little effect on network parame-ters, but loss of hub nodes can produce major changes in path length L. An analogy to this isthat shutdown or dysfunction of a hub airport (e.g., O’Hare in Chicago) due to bad weatherwill cause many travelers to have to take additional flights to reach their destinations. However,shutdown of a small regional airport will have no effect on the global pattern of air travel. Toevaluate whether our network is vulnerable to deletion of any nodes, we determined the contri-bution made by each protein to the topological parameters of the entire network. This wasdone by calculating L, Cg, andM for the network and then recalculating those parameters (L-P,Cg-P, andM-P) when each network protein and its connections were removed. Only minorchanges to these values were observed in response to removal of any one protein (<10%; S2Table). This is of interest, because it argues that the Watts-Strogatz topology of the networkmay contribute to the robustness of its topological parameters to deletion of any node. Unlikescale-free networks, it lacks essential hub nodes for which elimination of function by mutationor damage would dramatically alter the entire network. We also simultaneously removed alleight of the proteins encoded by essential genes that were added to the network (see above), toensure that these proteins were not required for network properties. This produced no signifi-cant changes in L orM, and only a 10% decrease in Cg.
To evaluate the relationships between the experimentally determined fat storage regulationnetwork and manually curated GO categories, we generated networks of protein-protein con-nections for the proteins in yeast Biological Process categories, since fat storage regulation ismore like a Biological Process than it is like a Molecular Function or Cellular Component.These categories range in size from a few proteins to more than 250. We then calculated edgedensity (the number of edges/number of possible edges), Cg, andM for these networks andcompared these numbers to the values for the fat storage regulation network. S3 Fig shows thatthe edge density for our network is around the median for the GO categories. Cg is below themedian, andM is above the median. These data indicate that the experimental fat storage regu-lation network has similar properties to those of networks formed from the proteins within GOBiological Process categories. Proteins in a ‘typical’ Biological Process category are extensivelyinterconnected, and exhibit more clustering but less modularity than the proteins in the fatstorage regulation network.
The importance of a protein to the network’s function is related to its Katzcentrality scoreBecause the fat regulation network was defined by a quantitative genetic screen, it has the use-ful property that the importance of a given protein to network output can be defined by the se-verity of the fat storage phenotype (the amount of fat added above wild-type levels) for adeletion mutation in the gene encoding that protein. This is graphically depicted in Figs 1 and2, where the sizes of the circles in the network diagrams are proportional to the strength of thephenotype produced by loss of the corresponding protein. This allows us to evaluate the rela-tionship between a node’s position in the network and its importance for network function. Ifsuch a relationship can be established, it can be used by future investigators to find the essentialelements in other biological networks that are found to fit the Watts-Strogatz model, but forwhich quantitative information on phenotype is not available.
In network analysis, the centrality of a node, C(v), refers to indicators that identify the mostimportant nodes [49]. For example, centrality analysis has been used to find the most influen-tial person in a social network. There are many types of centrality, each of which emphasizes acertain quantifiable attribute of a given node. We examined the five standard centrality types(Degree, Betweenness, Closeness, Eigenvector, and Katz centralities) [49–51] to measure these
Small-World Properties of a Fat Regulation Network
PLOS Computational Biology | DOI:10.1371/journal.pcbi.1004264 July 20, 1969 10 / 27
attributes. For degree centrality, the value is evaluated by counting the number of directly con-nected nodes. Betweenness centrality is evaluated by counting the number of shortest pathsthat pass through a given node. Closeness centrality is a sum of the inverses of the shortestpath lengths. Eigenvector centrality is an implicitly defined measure evaluated by asserting thatthe centrality of a single node is proportional to the sum of the centralities of all nodes it is con-nected to. For Katz centrality, the importance of a node is determined by how many nodes it ispath-connected to, with a penalty that increases exponentially with the path length betweenthose nodes. The colored heat-map diagrams in Fig 2C–2G show the values of each type of cen-trality for each node in a small toy network, with red indicating the highest centrality. The dia-grams below superimpose centrality values, indicated by the sizes of the red circles, on the greycircles that indicate phenotypic severity.
We assessed the relationships between the centrality of a given node and the severity of thefat storage defect exhibited when the gene corresponding to that node is removed, using bothindependence and correlation testing (Fig 2C–2H and S4 Table). Dependence is any statisticalrelationship between two random variables, while correlation is a special type of dependencethat can be used to predict the magnitude of the change that will occur in one variable in re-sponse to changes in a linked variable. Two random variables that are independent necessarilyhave low correlation, but variables with low correlation can be dependent. For example, drivingwhile intoxicated and fatal car accidents are clearly not independent of each other, but the cor-relation between the two is only moderate, since only 32% of such accidents involved an intoxi-cated driver and most intoxicated drivers do not have an accident. Dependence is a moregeneral and arguably more useful measure, as it is able to detect nonlinear relationships, where-as correlation assumes a simple linear dependence.
The only centrality measure that passed five separate independence tests (Blomqvist β,Goodman-Kruskal, Hoeffding D, Kendall tau, and Spearman Rank) was Katz centrality (Fig2E), for which the p-value (probability of independence) was<0.027 for all 5 tests. There aregood reasons that Katz centrality gives the best dependence score, which are based on how thecentrality measures are defined. First, a good measure of the importance of a protein nodeshould be global, and not just depend on proteins that are directly connected to it. Second,those nodes related by longer paths should have a smaller effect on each other’s function thanthose related by shorter paths. These attributes are held by closeness, eigenvector and Katz cen-trality measures. The effect of adding a node on the closeness centrality depends on the recipro-cal of path lengths, for eigenvector centrality it is loosely related to degrees of the node, and forKatz centrality, the effect will become exponentially smaller the as the path length increases. Inmany models, it is reasonable to assume that only a fraction of a signal passes through a nodeto each of the other nodes to which it connects, and this assumption predicts an exponentialdrop-off.
Although the statistical analysis shows a clear relationship between the severity of the fatstorage phenotype and Katz centrality, the moderate correlation between these parameters(0.24) suggests that this is not necessarily a linear relationship. Fig 2E displays this graphically.It shows that many of the larger grey circles have corresponding large red circles, but there aresome large grey circles with very small red circles, indicating low Katz centrality. This showsthat the quantitative impact on fat levels caused by removal of a network protein cannot alwaysbe predicted from its Katz centrality score in a linear way. In particular, mutations eliminatingtranscriptional regulators that have low Katz centrality scores often have large impacts on fatlevels (e.g., Spt10). This may be due to the fact that the importance of a transcriptional regula-tor to the network is more likely to be related to the number of gene targets whose expression itcontrols than to the number of proteomic connections it makes. Most of the transcription fac-tors that regulate fat storage levels bind to the promoter regions of genes that are themselves
Small-World Properties of a Fat Regulation Network
PLOS Computational Biology | DOI:10.1371/journal.pcbi.1004264 July 20, 1969 11 / 27
part of the network, creating potential feedback loops [52] (Fig 2H). Ino2, Srb5, and Ctk1 bindto the promoter regions of up to 40% of network genes. In total, 67% of network genes havenetwork transcription factors other than the global regulators Hhf1 and Spt10 that bind totheir promoter regions. The number of network genes that a given network transcriptional reg-ulator binds to is an excellent predictor (correlation = 0.787; probability of independence<0.01; S4 Table) for the severity of the fat storage defect when the gene that encodes itis removed.
The network is divisible into subnetworks that regulate different aspectsof fat metabolismAnother useful feature of yeast fat regulation is that mutants selected for increased fat contentcan also be examined for related phenotypes, such as LD morphology and metabolic alter-ations. We can then ask whether the genes and proteins that share these “sub-phenotypes” alsoform networks, and examine the relationships between these subnetworks and the larger fatregulation network.
Yeast LDs are composed of triglycerides and sterol esters surrounded by a monolayer ofphospholipids. LDs may increase in size and/or number when trigylceride levels increase. Awild-type fixed yeast cell usually has three to eight LDs that are around 0.4 μm in diameter (Fig3A). We examined all the mutants for LD morphology phenotypes, grouped them into threephenotypic classes, and created subnetworks encompassing all the proteins for each class. ClassI contained mutants with small but numerous LDs, class II contained mutants with mixed pop-ulations of normal and small LDs, and class III contained mutants that have giant LDs (Fig 3).Each of the three subnetworks was highly interconnected, indicating that members of the samemorphological class tend to have mutations affecting proteins that are connected to each other(S5 Table).
Fat levels are influenced by the rate of fat storage utilization, the rate of de novo fatty acidsynthesis, and the level of caloric intake. We examined fat storage utilization by subjecting allof the mutants to glucose starvation for three days. ~85% of the mutants showed no reductionin fat storage or a reduced rate of fat storage depletion compared to wild-type when starved, in-dicating defects in the ability to use stored fat to meet energy demands (Fig 4A and S6 Table).
To be used as an energy source, fats have to be broken down to glycerol and fatty acids,which are used by mitochondria for ATP production [53,54]. We evaluated the overall statusof mitochondria in all mutants with reduced fat utilization rate by growing them on glycerol.~60% of mutants showed either slowed or no growth on glycerol, suggesting defects in mito-chondrial function. All of these mutants also failed to grow on palmitic acid and lard. Another26 mutants did grow on glycerol, but failed to grow on either palmitic acid or lard or both. Mu-tations that produce a similar growth defect on a given carbon energy source tend to affect pro-teins that are connected to one another, forming subnetworks (S6 Table and Fig 4B and 4C).These results show that a significant portion of the network is dedicated to maintaining normalmitochondrial function. Indeed, nearly half of the genes we identified were previously implicat-ed in mitochondrial function[53].
In our growth conditions, cells were provided with glucose and a mixture of amino acidsthat can be used for de novo fatty acid synthesis. To examine if any of the mutants have alter-ations in this process, we grew them on media containing either 14C-labeled D-glucose or 14C-labeled L-aspartic acid. About 30% of the mutants showed an increase in the conversion of ei-ther D-glucose or L-aspartic acid to fat. Mutants that exhibited increased conversion of eithernutrient to fat tend to encode proteins that are part of a connected subnetwork (Fig 5 and S7Table).
Small-World Properties of a Fat Regulation Network
PLOS Computational Biology | DOI:10.1371/journal.pcbi.1004264 July 20, 1969 12 / 27
Small-World Properties of a Fat Regulation Network
PLOS Computational Biology | DOI:10.1371/journal.pcbi.1004264 July 20, 1969 13 / 27
To test the hypothesis that genes for which mutants exhibit similar physiological profileswould encode proteins that formed subnetworks, we examined all of the potential subnetworksencoded by subsets of genes with similar detailed sub-phenotypes, in the same way that we hadexamined the complete network. We found that these subnetworks also exhibited Watts-Stro-gatz small-world topology, with relatively high clustering coefficients (0.179–0.28) and shortpath lengths (3.09–3.85). To determine if the subnetworks represented functional subsets ofthe larger network, we then compared each subnetwork to randomized simulations of 104 net-works with identical degree distribution and vertex counts. In all cases, the experimentally ob-served subnetworks had much higher clustering coefficients than their simulated equivalents(red and green numbers on the right sides of the panels of S5–S7 Tables and Figs 3–5), indicat-ing that the subnetworks were selected by evolution, and do not represent randomly chosensubsets of the complete network. We also observed that in all cases, these subnetworks are notconfined to a single module, but span modular boundaries. These results suggest that the largernetwork that controls fat storage contains within it smaller networks that govern different as-pects of physiology related to a cell’s decision whether to store fat or metabolize it for energy.
Patterns of communication among distant network nodes are consistentwith the Watts-Strogatz small-world topologyHaving established that the fat regulation network fits the Watts-Strogatz model, we then con-ducted experiments in which we perturbed the functions of multiple network nodes and mea-sured the effects of these perturbations on fat content. This allowed us to evaluate whether thepatterns of communication among distant nodes in the real network are consistent with theWatts-Strogatz topology. We call these patterns “signal propagation”, because, although theyare not measured dynamically, they reflect the movement of information through the network.They thus represent signal flow along signal transduction pathways and crosstalk betweenthese pathways.
We conducted “chemogenomic” experiments in which we simultaneously perturbed thefunctions of multiple network nodes by treating yeast bearing a deletion mutation in each net-work gene with a set of drugs that block the functions of specific network pathways, followedby measuring the effects of these perturbations on fat content. The approach of adding drugsto single mutants to block multiple nodes was chosen in order to avoid the slow growth or le-thality frequently observed for double mutants (see [55]), as well as the necessity to constructall possible double mutants. The chemogenomic approach has often been employed in theyeast system to map synergistic and antagonistic relationships between drug targets and othergenes (for recent reviews see [56,57]).
We selected five drugs that blocked signal propagation through specific network pathways.The first drug was U0126, an inhibitor of mammalian MAPKKs [58] that has been shown toblock reporter expression controlled by the MAPK mating factor response pathway [59]. Thesecond drug was Rap, an inhibitor of the mammalian and yeast TORC1 complex[27]. Thethird and fourth drugs were chloroquine (ChQ) and concanamycin A (Conc. A); these are
Fig 3. Genes for whichmutations produce similar LD phenotypes affect connected proteins. (A) Fixed wild type yeast cells stained with BIODIPY 493/518, as visualized by confocal microscopy. Most cells have 3–8 LDs that are ~0.4 μm in diameter (yellow arrow). (B) Mutants with numerous and small LDs(red arrow), as exemplified by fus3Δ (left). The right sides of panels B-D show the genes for which mutants display this phenotype and their proteomicconnections. (C) Mutants with a mixture of small and normal size LDs (red and yellow arrows, respectively), as exemplified bymot2Δ (left). (D) Mutants withsupersized LDs, in addition to large and small LDs (yellow arrowhead, yellow arrow, and red arrow, respectively) as exemplified by snf4Δ (left). At the rightside of each panel are indicated the global clustering coefficient (upper) and path length (lower) for each subnetwork (red font), presented over the mean ofvalues from 10,000 generated simulated random networks with the same degree distribution and vertex count as the subnetwork in that panel (green font).Key for diagrams as in Fig 1. Scale bar, 4 μm.
doi:10.1371/journal.pcbi.1004264.g003
Small-World Properties of a Fat Regulation Network
PLOS Computational Biology | DOI:10.1371/journal.pcbi.1004264 July 20, 1969 14 / 27
Fig 4. Genes for whichmutations affect carbon source usage affect connected proteins. (A) TLC assays of wild-type yeast (four replicates each) showa gradual reduction in the intensity of the triglyceride band (arrows) as starvation continues for three days. This reduction is either not observed in mutants
Small-World Properties of a Fat Regulation Network
PLOS Computational Biology | DOI:10.1371/journal.pcbi.1004264 July 20, 1969 15 / 27
both known to block the acidification of vacuoles by the Vma pump [60–63]. The fifth drugwas cerulenin, which inhibits both yeast and mammalian fatty acid synthase [64,65] and there-by eliminates fat synthesis; cerulenin also served as a control to ensure that the effects of themutations were dependent on network output. The specificity of the drugs we chose was con-firmed by the fact that they did not produce increases in fat levels in mutants missing their po-tential targets (since in those mutants signals from the drug targets are already absent), and bythe observation that they produce fat levels similar to mutations that remove these targets (seeSupplemental Materials and Methods). Regardless of whether the drugs were completely spe-cific for particular targets, they clearly caused perturbations in network function, as indicatedby their ability to alter fat levels in wild type yeast (Fig 6B). The effects of these perturbationson mutant networks, each of which lacks a single node, can therefore be used to analyze inter-node communication within the network.
We defined three types of signaling relationships between network proteins that are re-moved by mutation and those whose activities are blocked by a given drug. First, the proteinscould be in independent signaling pathways. In such cases, the application of the drug wouldproduce an additive effect, such that the amount of additional fat would equal the sum of theamount of fat added by the mutation and the amount added to wild-type yeast in response todrug treatment. This type of interaction is like the negative interactions between deletion muta-tions (or between deletion mutations and drugs) that are often observed in double mutant orchemogenomic analyses of yeast growth phenotypes (reviewed by[56]). The strongest form ofthis type of negative genetic interaction is synthetic lethality, in which double mutant cells (ormutant cells treated with drug) die, while single mutants or drug-treated wild-type cells are via-ble. Second, the proteins could be part of the same pathway. In such cases, treating the mutantwith drug would produce fat levels that are no higher than those in wild-type yeast treated withdrug, since pathway signaling had already been eliminated by the mutation. Third, the proteinsaffected by the drug and by the mutation could be components of two pathways that relay part,but not all, of their signals through each other. We refer to these as synergistic pathways. Insuch cases, addition of a drug affecting pathway 1 to a mutant affecting pathway 2 would pro-duce an increase in fat levels that is less than the sum of the amount of fat added by the mutantand the amount added by the drug, since the portion of the signal relayed through the action ofboth pathways was already blocked by the mutation, and the drug could therefore only affectthe fraction of the signal that was still active and available for inhibition. In other words, part ofthe fat level increase observed for the mutation alone would be due to partial blockage of thedrug-affected pathway (Fig 6A).
During the course of our analyses, we noticed that none of the drug-mutant combinationsproduced fat levels that approach the levels of our “fattest”mutant, spt10Δ, indicating that ouranalysis was not limited by cells reaching their maximum fat storage capacity. We also neverobserved a situation in which the amount of fat in given drug-mutant combination was greaterthan the sum of the amount added by the drug alone and the mutation alone. These observa-tions indicated that the behavior of the network could be understood using our method.
First, we found that, for each of the four different drugs that increase fat, 12–15% of networkproteins behave as if they are in pathways that are independent of the pathway affected by the
(e.g., snf1Δ) or occurs at a slower rate (e.g., opi3Δ). See Supplement for network analysis of fat store degradation. (B) Mutants that show slow or no growthon 3% glycerol, as exemplified by snf1Δ and vma2Δmutants (image on left shows a dilution series from top to bottom). (C) Mutants that show slow or nogrowth on 0.1% lard and/or 0.1% palmitic acid, as exemplified by dhh1Δ and bem1Δmutants (image on left). Mutations causing similar carbon sourceutilization defects affect genes that encode proteins that tend to be proteomically connected to one another (diagrams in (B) and (C). At the right side of eachpanel is the global clustering coefficient (upper) and path length (lower) for each subnetwork (red font), presented over the mean of values from 10,000simulated random networks with the same degree distribution and vertex count as the subnetwork in that panel (green font). Key for diagrams as in Fig 1.
doi:10.1371/journal.pcbi.1004264.g004
Small-World Properties of a Fat Regulation Network
PLOS Computational Biology | DOI:10.1371/journal.pcbi.1004264 July 20, 1969 16 / 27
Small-World Properties of a Fat Regulation Network
PLOS Computational Biology | DOI:10.1371/journal.pcbi.1004264 July 20, 1969 17 / 27
drug (e.g., they have strong synthetic negative interactions with the drug target). Second, 58%of network proteins had either “same pathway” or “synergistic pathway” relationships with allfour drug target pathways (S8 Table and Figs 6 and S4), indicating that there is extensive com-munication across the network and that network outputs reflect integration among multiplesignaling pathways. The fact that proteins involved in such relationships can be in different re-gions of the network is consistent with the idea that the short path length characteristic ofsmall-world networks facilitates signal propagation between distant parts of the network.
Third, proteins that had a “same pathway”-type relationship with a given drug target some-times were in different network communities from the drug target. Some of these relationshipssuggested hitherto unknown interactions between pathways. For example, components of theCCR4-NOT complex involved in mRNA processing had “same pathway” type relationships tothe MAPK node affected by U0126, showing that the output of CCR4-NOT was relevant toregulation of fat by the MAPK pathway (Fig 6D). Proteins with “same pathway” type relation-ships to a given drug could be grouped into subnetworks that had Cg values that were muchhigher than those of simulated random networks of the same size and connectivity (0.22–0.35),indicating that they have been selected by evolution. These subnetworks did show significantoverlap with one another (sharing some of the same proteins), but each one had a unique com-bination of proteins that was specific for a given drug (S9 Table and Figs 6 and S4).
Fourth, there is a “sub-additive” response (that is, an increase in fat content that is less thanthe sum of the increase produced by the drug and that produced by the mutation) to loss offunction of two nodes for most node pairs. Fifth, eight proteins had a “same-pathway” type re-lationship with all four drugs, qualifying them as points of convergence for network signals(Fig 6E). This might suggest that these are hub proteins within a scale-free network. However,the hypothetical power-law distribution shown in Fig 2B predicts that in order for our networkto be truly scale-free, the number of hubs should not have exceeded two. Furthermore, of theseeight proteins, only Ste5 had more than four connections, and hubs should make many moreconnections than other proteins in the network.
We compared our results to some recent analyses of double mutant and drug-mutantgrowth and metabolism phenotypes[55,66,67]. These are genome-wide studies, so only a smallpercentage of mutants (~5%) exhibited a double mutant interaction or an interaction with agiven drug. In our study, we investigated a subset of genes that we had defined as critical for fatstorage regulation, and examined interactions with drugs that we had selected due to their abil-ity to affect fat content, so we observed that most mutants displayed interactions with all of thedrugs. In the genome-wide studies, the frequency of synthetic (negative) interactions wasmuch higher for genes within the same GO Biological Process category than for genes in differ-ent categories. For most categories, this frequency was between 10 and 18%[55], which is in thesame range as the frequency of genes within the fat regulation network that have strong nega-tive interactions with a given drug target (12–15%; “independent pathways” category). Thus,the experimentally defined fat storage regulation network, which has interconnection densityand modularity values that are similar to those of some Biological Process categories (S3 Fig),also behaves somewhat like a Biological Process category with respect to chemogenomic inter-actions. Finally, about 1/3 of interactions observed in genome-wide studies were positive, but
Fig 5. Genes for whichmutations affect conversion of glucose or aspartic acid to fat affect connected proteins. (A) Proteins encoded by genes forwhich mutation produces more than a 20% increase in the rate of conversion of 14C labeled D-glucose to fat relative to wild-type tend to be proteomicallyconnected to one another. (B) Proteins encoded by genes for which mutation produces more than a 20% increase in the rate of conversion of 14C labeled L-aspartic acid to fat relative to wild-type tend to be proteomically connected to one another. At the right side of each panel is the global clustering coefficient(upper) and path length (lower) for each subnetwork (red font), presented over the mean of values from 10,000 simulated random networks with the samedegree distribution and vertex count as the subnetwork in that panel (green font). Key for diagrams as in Fig 1.
doi:10.1371/journal.pcbi.1004264.g005
Small-World Properties of a Fat Regulation Network
PLOS Computational Biology | DOI:10.1371/journal.pcbi.1004264 July 20, 1969 18 / 27
Small-World Properties of a Fat Regulation Network
PLOS Computational Biology | DOI:10.1371/journal.pcbi.1004264 July 20, 1969 19 / 27
we did not detect any positive interactions. This is due to the fact that we only isolated genesfor which mutation increases fat contes, so all of our phenotypes have the same sign. Cellularsignaling pathways, however, contain both positive and negative regulators, and mutation ofregulators with opposite sign can produce phenotypes of opposite sign.
We also compared the results of Rap treatment of fat storage mutants with a study that ex-amined interactions between Rap and all nonessential genes for a different TORC1-dependentphenotype, expression of a DAL80 reporter that is induced by TORC1 inactivation by Rap orstarvation[68]. Of the 63 Rap-specific genes they identified, only 6 (Bck1, Las21, Slt2, Srb5,Swi4, Swi6) were identified in our screen as mutations that increase fat content, suggesting thatfat storage regulation and DAL80 induction are not closely related processes. However, two ofthese common genes (Srb5 and Swi6), increase induction of the DAL80 reporter by Rap[68]and also synergize with Rap to increase fat content (Fig 6 and S8 Table).
DiscussionBy screening the yeast (Saccharomyces cerevisiae) viable deletion collection for mutations af-fecting fat content, we discovered a densely interconnected network of 94 proteins that regu-lates fat storage (Fig 1). From a computational analysis of this network, we derived three majorconclusions. First, the network is not scale-free, and can be best approximated by the Watts-Strogatz model, which has not been previously applied to biological signaling networks (Fig 2).This model can account for the high degree of clustering observed in the experimental network.Second, the importance of an individual protein to network function is dependent on a particu-lar measure of centrality, Katz centrality, which is influenced by the topological relationshipsbetween the test protein and the other proteins within its network community or module (Fig2). Physiological analysis showed that the fat regulation network is divisible into connectedsubnetworks which span community boundaries and affect specific aspects of lipid metabolism(Figs 3–5). Finally, by combining drug perturbations with genetics (chemogenomics), weshowed that there is extensive cross-talk between the different signaling pathways representedin the network (Fig 6).
The small-world topology endows the network with useful features. Its short path lengthproperty allows distant nodes to communicate with each other through a small number ofsteps. Its topological parameters are robust with respect to removal of any one protein. Inscale-free networks, the removal of highly connected hubs will cause substantial changes in net-work topology and may fragment them into unconnected subnetworks [69–71], while the ab-sence of modular structure in the Erdos-Renyi model makes it inconsistent with the formationof biological networks that must receive different types of inputs and couple them tounique outputs.
Fig 6. Internode communication patterns deduced from drug-mutant interactions. (A) Representations of signaling relationships between drug targetsand mutant genes. In the diagrams, gene A encodes protein A, while gene B encodes protein B, which is the target of the drug. (B) TLC assays of wild-type(wt) yeast (three replicates each) showing the impact of different drug treatments on triglyceride bands (arrows). All mutants were subjected to the sametreatments and analyzed in the same manner, as exemplified by the three replicas ofmkk2Δ for each drug (note that U0126, which targets MAPKKs, does notincrease fat levesl inmkk2Δ cells relative to untreated mutant cells). (C-D) Networks of interactions between mutants and U0126 (C) and Rap (D). Proteinnames are given in the corresponding larger diagram in (E). Note that the majority of proteins have signaling interactions with the drugs that range from“same pathway” (no enhancement of drug effect by mutation; dark brown), to different degrees of synergism (enhancement of drug effect by mutation,indicated by different shades of light brown), and there are fewer cases of parallel pathway (independent) relationships, in which the drug and mutant effectsare additive (light grey). These parallel pathway relationships are like the synthetic negative interactions seen in double mutant studies. Corresponding datafor ChQ., Conc. A, and Cer. are in S4 Fig. At the right side of panels (C) and (D) are indicated the global clustering coefficient (upper) and path length (lower)for a subnetwork of all proteins having a “same pathway” relationship to that drug (red font), presented over the mean of values from 10,000 simulatedrandom networks with the same degree distribution and vertex count (green font). (E) Diagram of same pathway signaling relationships between drugs andnetwork proteins. The circle color represents the number of drugs with which a protein has a same pathway relationship.
doi:10.1371/journal.pcbi.1004264.g006
Small-World Properties of a Fat Regulation Network
PLOS Computational Biology | DOI:10.1371/journal.pcbi.1004264 July 20, 1969 20 / 27
Our results also show that the importance of a protein to network function is dependent onits Katz centrality score (Fig 2). The Katz centrality of a node is determined by the number ofshortest paths that pass through it to all other nodes in the network, with penalties assigned toconnections to distant nodes (nodes that are connected to the node of interest only through aproximal node). The reason that this type of centrality gives the best prediction of a protein’simportance to the function of the fat regulation network may be due to the fact that it combinesthe local attributes of a node within its community with the position of that community withinthe network as a whole. As such, it is suited to modular/community based networks, and wepredict that future analysis of other such networks will reveal that some of the most importantproteins will be identifiable by their Katz centrality scores. In the fat regulation network, theimportance of some of the proteins with high Katz centrality can be explained based on theirknown roles in the module to which they belong. Two examples are Bem1, which is a MAP ki-nase pathway scaffolding protein [72,73], and Snf1, which is the catalytic subunit of the AMPKcomplex [29,31].
By analyzing other phenotypes associated with alterations in fat storage, such as LD mor-phology and utilization of carbon sources, we further demonstrate that the network can be di-vided into subnetworks that span molecular categories and modules, but affect specific aspectsof lipid metabolism (Figs 3–5). All subnetworks contain proteins that have connections thatspan modular boundaries.
To examine whether the topological features described above are associated with biological-ly relevant properties, we examined signal propagation within the network by combining ge-netics and pharmacology (Fig 6). The results indicate that the network has a sub-additiveresponse to perturbation, because the blockage of two pathways or proteins by a drug and amutation usually produces effects that are smaller than the sum of those caused by the drugand the mutation individually. Of course, the network is not immune to alteration; the removalof a protein from the network does produce an increase in fat levels, since that is how the net-work was defined. Nevertheless, the attenuated response of the network to blockage of multiplenodes is consistent with the idea that network structure buffers it against external or internalperturbations. The fact that proteins in distant parts of the network often interact with eachother, as indicated by the drug-mutant experiments, are in agreement with the short pathlength and small-world properties of the Watts-Strogatz model.
Unlike Erdos-Renyi networks, Watts-Strogatz networks are modular. In neural networks,modularity is known to facilitate multifunctionality, which can divide large tasks into smallercompartmentalized subtasks that can be executed efficiently [74–76]. Multifunctionality alsoallows neural networks to integrate different inputs and generate diverse output responses. Theyeast fat regulation network has properties that are analogous to multifunctionality in modularneural networks, because it takes in multiple inputs, processes them, and generates multipleoutputs in response. The integrated input of the network represents an evaluation of the avail-able nutrients and energy stores. It is provided by the glucose level detection function of Mth1and the AMP and starvation detection mechanisms of MAP kinase and AMPK pathways. Thenetwork then generates anabolic and catabolic outputs that are appropriate to those inputs.Our analysis of mutant phenotypes indicates that these outputs affect many aspects of cellphysiology, such as LD morphology, mitochondrial function, and fat store utilization.
Biological signaling networks often contain hub-like elements, and some researchers haveproposed that biological networks with hubs are best described by scale-free models[46]. How-ever, real interaction network datasets that have been tested do not fit power-law P(k) distribu-tions, which are diagnostic of scale-free networks [47,48]. The P(k) distributions of proteins inyeast proteomic networks generated by the two-hybrid method have been subjected to mathe-matical analysis, and a variety of models were tested, including Poisson and binomial
Small-World Properties of a Fat Regulation Network
PLOS Computational Biology | DOI:10.1371/journal.pcbi.1004264 July 20, 1969 21 / 27
distributions (characteristic of Erdos-Renyi and Watts-Strogatz networks) and power-law dis-tributions (characteristic of scale-free networks) were tested. None of the models could be de-finitively proven or ruled out [18,77].
Almost all of the proteomic connections used to define the fat storage regulation networkwere identified by affinity purification/coprecipitation methods, which provide a reliablemeans to identify abundant and stable protein complexes that exist in vivo [7,8,10,12,78,79].Our computational analysis clearly shows that this network’s topology is best approximated bythe Watts-Strogatz small-world model (Fig 2B). This topology has significant regulatory ad-vantages that are correlated with biologically relevant features, and we suggest that mathemati-cal analysis of other proteomic networks defined by a combination of genetics and affinitypurification methods may reveal that many signaling networks within cells are of this type.
Genetics and fat assaysA collection of haploidMATa nonessential yeast deletion strains was purchased from ThermoScientific. The strains were transferred into 150 μl YPD media in a 96 well-plate and grown forthree days at 30°C. 5 μl of the resulting culture was respectively transferred into 150 μl syntheticcomplete dextrose media [80] in a 96 well assay plates (black wall with transparent bottom)and grown for two days at 30° C. After the growth period, formaldehyde was added to eachwell to a final concentration of 4%, followed by incubation at room temperature for 20 minutes.The plates were then spun down at 3000 rpm for two minutes and the supernatant was dis-carded. The pellets were then resuspended in 150 μl PBS containing 0.125 μg/ml Nile Red and0.003 μMDAPI, followed by incubation at room temperature for 20 minutes. Fluorescence wasmeasured using a spectrophotometer for both Nile Red (Ex485/Em590) and DAPI (Ex 358/Em440). Results were plotted as a ratio between the Nile Red and DAPI signals. Any positivelines were regrown in eight replicas, of which 4 were stained as above; the others were pro-cessed in the same manner, except that Nile Red and DAPI were not added. The latter groupwas used to measure autofluorescence, the value of which was later subtracted from the finalreading. Only lines that remained positive were taken to the second round of selection.
Lines that passed both the 96-well plate assay and the histological examination were subjectedto the TLC assay. In this assay cultures were grown in complete synthetic 2% dextrose media fortwo days at 30° C, and 20 ml normalized culture of OD600 = 1 was obtained. Protein from 1ml ofOD600 = 1 culture was extracted and measured and reading was used for additional normalizationstep, and we rarely observe a situation in which cultures with the same OD600 ending up having adifferent protein measurements. The twice-normalized culture was then spun down, and the re-sulting pellets were suspended in 200 μl 2:1 chloroform: methanol mixture, and three glass beads(2 mm) were added to each tube. The samples were subjected to continuous agitation for onehour, and vortexed three times (1 minute each) during that period. The samples were then spundown for 2 min. at maximum speed and the lower phase was isolated and transferred to a freshtube. The isolated lower phase was spun down again and run on a TLC plate as described [20].
For confocal microscopy, yeast were grown on synthetic complete 2% dextrose media at30° C for two days. The samples were then spun down and processed for microscopy [81].
For additional information see S1 Text (Supplementary Materials and Methods), whichcontains methods for starvation studies, growth on different carbon sources, drug treatment,and mathematical analysis.
Supporting InformationS1 Fig. Histogram of the number of edges in N = 200 randomly sampled subsets of theyeast proteome. To test whether or not the interconnection density of the fat storage network
Small-World Properties of a Fat Regulation Network
PLOS Computational Biology | DOI:10.1371/journal.pcbi.1004264 July 20, 1969 22 / 27
is significant, we compared its statistics to those of networks of comparable size chosen by ran-dom selection from the yeast proteome. These random sub-networks all had far less connectiv-ity (average 24.8 edges, standard deviation 11.5) than the fat storage network (203 total edges).Almost all of these randomly sampled networks lacked sufficient connectivity to calculatemeaningful network statistics such as shortest path length and global clustering coefficient.(TIF)
S2 Fig. Synergy between the Fus3 and Kss1 MAPKs, and the effects of TORC1 mutationsand rapamycin in yeast. (A) fus3,kss1 double mutants have a higher fat levels than either singlemutant. S is 4 μg lard standard, black arrow is triglyceride band, 4 μl volume was used for eachsample lane. (B) Mutations in genes encoding TORC1 components (tor1 and tco89) cause anincrease in fat storage levels (upper panel), while mutations in genes encoding TORC2 compo-nents (avo2 and bit61) do not (middle panel). Treatment of wild type yeast with the TORC1 in-hibitor rapamycin causes an increase in fat storage as compared to vehicle only control (lowerpanel). S is 4 μg lard standard, black arrow is triglyceride band, 4 μl volume was used for eachsample lane.(TIF)
S3 Fig. Histograms of the relationships between fat storage regulation network and allyeast GO Biological Process categories. The four histograms show edge density (# edges/#possible edges), cluster coefficient (Cg), modularity (M), and the number of nodes (proteins)for each GO Biological Process category. In each histogram the value of the parameter for theexperimental fat storage regulation network is shown by a vertical red line.(JPG)
S4 Fig. Internode communication deduced from drug-mutant interactions. (A) Representa-tions of signaling relationships between drug targets and mutant genes. Networks of interac-tions between mutants and ChQ, Con. A, and Cer. Protein names are given in larger diagramin Fig 6E. Note that the majority of proteins have signaling interactions with the drugs thatrange from “same pathway” (no enhancement of drug effect by mutation; dark brown), to dif-ferent degrees of synergism (enhancement of drug effect by mutation, indicated by differentshades of light brown), and there are only a few cases of non-interacting parallel (independent)relationships, in which the drug and mutant effects are additive (light grey). At the right side ofpanels are indicated the global clustering coefficient (upper) and path length (lower) for a sub-network of all proteins having a same pathway relationship to that drug (red font), presentedover the mean of values from 10,000 generated simulated random networks with the same de-gree distribution and vertex count (green font).(TIF)
S1 Text. Supplementary materials and methods.(DOCX)
S1 Table. TLC quantification of fat levels in yeast mutants.(XLSX)
S2 Table. Connection matrix of nodes and edges in the network.(XLSX)
S3 Table. GO term classifications that are significantly enriched for network proteins.(XLS)
Small-World Properties of a Fat Regulation Network
PLOS Computational Biology | DOI:10.1371/journal.pcbi.1004264 July 20, 1969 23 / 27
S4 Table. Mathematical analysis and computational modeling of the different network to-pological parameters shown in Fig 2.(XLSX)
S5 Table. Mathematical analysis and computational modeling of the LD morphology sub-networks shown in Fig 3.(XLSX)
S6 Table. Mathematical analysis and computational modeling of the carbon source utiliza-tion subnetworks shown in Fig 4.(XLSX)
S7 Table. Mathematical analysis and computational modeling of subnetworks of proteinsfor which mutations affect conversion of glucose or aspartic acid to fat as shown in Fig 5.(XLSX)
S8 Table. Quantification of the increase in fat levels produced by drugs in mutants vs. wild-type, as shown in Fig 6.(XLSX)
S9 Table. Mathematical analysis and computational modeling of the “same pathway” sub-networks in Fig 6.(XLSX)
AcknowledgmentsWe thank Robert Oania, Christopher Frick, Mark Budde, Erich Schwarz, and Eric Forgostonfor helpful discussions and comments on the manuscript.
Author ContributionsConceived and designed the experiments: BAA KZ. Performed the experiments: BAA PA COSG NO. Analyzed the data: BAA KZ CO SG NO. Contributed reagents/materials/analysistools: BAA CO SG NO. Wrote the paper: BAA KZ CO NO.
References1. Lin C, Cho Y, HwangW, Pei P (2007) Clustering methods in protein-protein interaction network. In;
Xiaohua Hu, Yi Pan editors. Knowledge Discovery in Bioinformatics: Techniques, Methods, and Appli-cations: JohnWiley & Sons.
2. Scherens B, Goffeau A (2004) The uses of genome-wide yeast mutant collections. Genome Biol 5:229. PMID: 15239820
3. Uetz P, Giot L, Cagney G, Mansfield TA, Judson RS, et al. (2000) A comprehensive analysis of protein-protein interactions in Saccharomyces cerevisiae. Nature 403: 623–627. PMID: 10688190
4. Tarassov K, Messier V, Landry CR, Radinovic S, Serna Molina MM, et al. (2008) An in vivo map of theyeast protein interactome. Science 320: 1465–1470. doi: 10.1126/science.1153878 PMID: 18467557
5. Ptacek J, Devgan G, Michaud G, Zhu H, Zhu X, et al. (2005) Global analysis of protein phosphorylationin yeast. Nature 438: 679–684. PMID: 16319894
6. Breitkreutz A, Choi H, Sharom JR, Boucher L, Neduva V, et al. (2010) A global protein kinase and phos-phatase interaction network in yeast. Science 328: 1043–1046. doi: 10.1126/science.1176495 PMID:20489023
7. Gavin AC, Bosche M, Krause R, Grandi P, Marzioch M, et al. (2002) Functional organization of theyeast proteome by systematic analysis of protein complexes. Nature 415: 141–147. PMID: 11805826
8. Ho Y, Gruhler A, Heilbut A, Bader GD, Moore L, et al. (2002) Systematic identification of protein com-plexes in Saccharomyces cerevisiae by mass spectrometry. Nature 415: 180–183. PMID: 11805837
Small-World Properties of a Fat Regulation Network
PLOS Computational Biology | DOI:10.1371/journal.pcbi.1004264 July 20, 1969 24 / 27
9. Ito T, Chiba T, Ozawa R, Yoshida M, Hattori M, et al. (2001) A comprehensive two-hybrid analysis to ex-plore the yeast protein interactome. Proc Natl Acad Sci U S A 98: 4569–4574. PMID: 11283351
10. Pu S, Wong J, Turner B, Cho E, Wodak SJ (2009) Up-to-date catalogues of yeast protein complexes.Nucleic Acids Res 37: 825–831. doi: 10.1093/nar/gkn1005 PMID: 19095691
11. Cagney G (2009) Interaction networks: lessons from large-scale studies in yeast. Proteomics 9: 4799–4811. doi: 10.1002/pmic.200900177 PMID: 19743423
12. Reguly T, Breitkreutz A, Boucher L, Breitkreutz BJ, Hon GC, et al. (2006) Comprehensive curation andanalysis of global interaction networks in Saccharomyces cerevisiae. J Biol 5: 11. PMID: 16762047
13. Shoemaker BA, Panchenko AR (2007) Deciphering protein-protein interactions. Part I. Experimentaltechniques and databases. PLoS Comput Biol 3: e42. PMID: 17397251
14. Janjic V, Sharan R, Przulj N (2014) Modelling the yeast interactome. Sci Rep 4: 4273. doi: 10.1038/srep04273 PMID: 24589662
15. Yaveroglu ON, Malod-Dognin N, Davis D, Levnajic Z, Janjic V, et al. (2014) Revealing the hidden lan-guage of complex networks. Sci Rep 4: 4547. doi: 10.1038/srep04547 PMID: 24686408
16. Jeong H, Mason SP, Barabasi AL, Oltvai ZN (2001) Lethality and centrality in protein networks. Nature411: 41–42. PMID: 11333967
17. Batada NN, Hurst LD, Tyers M (2006) Evolutionary and physiological importance of hub proteins. PLoSComput Biol 2: e88. PMID: 16839197
18. Hahn MW, Kern AD (2005) Comparative genomics of centrality and essentiality in three eukaryotic pro-tein-interaction networks. Mol Biol Evol 22: 803–806. PMID: 15616139
19. Watts DJ, Strogatz SH (1998) Collective dynamics of 'small-world' networks. Nature 393: 440–442.PMID: 9623998
20. Al-Anzi B, Zinn K (2010) Colorimetric measurement of triglycerides cannot provide an accurate mea-sure of stored fat content in Drosophila. PLoS One 5: e12353. doi: 10.1371/journal.pone.0012353PMID: 20808765
21. Beller M, Sztalryd C, Southall N, Bell M, Jackle H, et al. (2008) COPI complex is a regulator of lipid ho-meostasis. PLoS Biol 6: e292. doi: 10.1371/journal.pbio.0060292 PMID: 19067489
22. Guo Y, Walther TC, Rao M, Stuurman N, Goshima G, et al. (2008) Functional genomic screen revealsgenes involved in lipid-droplet formation and utilization. Nature 453: 657–661. doi: 10.1038/nature06928 PMID: 18408709
23. Nandy SK, Jouhten P, Nielsen J (2010) Reconstruction of the yeast protein-protein interaction networkinvolved in nutrient sensing and global metabolic regulation. BMC Syst Biol 4: 68. doi: 10.1186/1752-0509-4-68 PMID: 20500839
24. Cui Y, Ramnarain DB, Chiang YC, Ding LH, McMahon JS, et al. (2008) Genome wide expression anal-ysis of the CCR4-NOT complex indicates that it consists of three modules with the NOTmodule control-ling SAGA-responsive genes. Mol Genet Genomics 279: 323–337. doi: 10.1007/s00438-007-0314-1PMID: 18214544
25. Cullen PJ, Sprague GF Jr. (2012) The regulation of filamentous growth in yeast. Genetics 190: 23–49.doi: 10.1534/genetics.111.127456 PMID: 22219507
26. Denis CL, Malvar T (1990) The CCR4 gene from Saccharomyces cerevisiae is required for both nonfer-mentative and spt-mediated gene expression. Genetics 124: 283–291. PMID: 2407614
27. Loewith R, Hall MN (2011) Target of rapamycin (TOR) in nutrient signaling and growth control. Genetics189: 1177–1201. doi: 10.1534/genetics.111.133363 PMID: 22174183
28. Rensing L, Ruoff P (2009) How can yeast cells decide between three activated MAP kinase pathways?A model approach. J Theor Biol 257: 578–587. PMID: 19322936
29. Busti S, Coccetti P, Alberghina L, Vanoni M (2010) Glucose signaling-mediated coordination of cellgrowth and cell cycle in Saccharomyces cerevisiae. Sensors (Basel) 10: 6195–6240. doi: 10.3390/s100606195 PMID: 22219709
30. Karhumaa K, Wu B, Kielland-Brandt MC (2010) Conditions with high intracellular glucose inhibit sens-ing through glucose sensor Snf3 in Saccharomyces cerevisiae. J Cell Biochem 110: 920–925. doi: 10.1002/jcb.22605 PMID: 20564191
31. Hedbacker K, Carlson M (2008) SNF1/AMPK pathways in yeast. Front Biosci 13: 2408–2420. PMID:17981722
32. Mijaljica D, Prescott M, Devenish RJ (2011) V-ATPase engagement in autophagic processes. Autop-hagy 7: 666–668. PMID: 21494095
33. Pons P, Latapy M (2006) Computing communities in large networks using random walks. Journal ofGraph Algorithms and Applications 10: 191–218.
Small-World Properties of a Fat Regulation Network
PLOS Computational Biology | DOI:10.1371/journal.pcbi.1004264 July 20, 1969 25 / 27
34. Lavallee-AdamM, Coulombe B, Blanchette M (2010) Detection of locally over-represented GO terms inprotein-protein interaction networks. J Comput Biol 17: 443–457. doi: 10.1089/cmb.2009.0165 PMID:20377456
35. Kohlwein SD (2010) Triacylglycerol homeostasis: insights from yeast. J Biol Chem 285: 15663–15667.doi: 10.1074/jbc.R110.118356 PMID: 20231294
36. Kohlwein SD (2010) Obese and anorexic yeasts: experimental models to understand the metabolicsyndrome and lipotoxicity. Biochim Biophys Acta 1801: 222–229. doi: 10.1016/j.bbalip.2009.12.016PMID: 20056167
37. Szymanski KM, Binns D, Bartz R, Grishin NV, Li WP, et al. (2007) The lipodystrophy protein seipin isfound at endoplasmic reticulum lipid droplet junctions and is important for droplet morphology. ProcNatl Acad Sci U S A 104: 20890–20895. PMID: 18093937
38. Fei W, Shui G, Gaeta B, Du X, Kuerschner L, et al. (2008) Fld1p, a functional homologue of human sei-pin, regulates the size of lipid droplets in yeast. J Cell Biol 180: 473–482. doi: 10.1083/jcb.200711136PMID: 18250201
39. Fei W, Yang H (2012) Genome-wide screens for gene products regulating lipid droplet dynamics. Meth-ods Cell Biol 108: 303–316. doi: 10.1016/B978-0-12-386487-1.00014-6 PMID: 22325608
40. Al-Anzi B, Zinn K (2011) Genetics of fat storage in flies and worms: what went wrong? Front Genet 2:87. doi: 10.3389/fgene.2011.00087 PMID: 22303381
41. Vachova L, Stovicek V, Hlavacek O, Chernyavskiy O, Stepanek L, et al. (2011) Flo11p, drug effluxpumps, and the extracellular matrix cooperate to form biofilm yeast colonies. J Cell Biol 194: 679–687.doi: 10.1083/jcb.201103129 PMID: 21875945
42. NewmanME (2003) The structure and function of complex networks. SIAM Review 45: 67–256.
43. NewmanME (2006) Modularity and community structure in networks. Proc Natl Acad Sci U S A 103:8577–8582. PMID: 16723398
44. Erdős P, Rényi A (1960) On the evolution of random graphs. Publications of THEMATHEMATICAL IN-STITUTE OF THE HUNGARIAN ACADEMYOF SCIENCES. pp. 17–61.
45. Barabasi AL, Albert R (1999) Emergence of scaling in random networks. Science 286: 509–512.PMID: 10521342
46. Nacher JC, Akutsu T (2007) Recent progress on the analysis of power-law features in complex cellularnetworks. Cell Biochem Biophys 49: 37–47. PMID: 17873338
47. Khanin R, Wit E (2006) How scale-free are biological networks. J Comput Biol 13: 810–818. PMID:16706727
48. Lima-Mendez G, van Helden J (2009) The powerful law of the power law and other myths in network bi-ology. Mol Biosyst 5: 1482–1493. doi: 10.1039/b908681a PMID: 20023717
49. Borgatti S, Martin GR (2005) A Graph-Theoretic Perspective on Centrality. Social Networks 28: 466–484.
50. Katz L (1953) A New Status Index Derived from Sociometric Index. Psychometrika 18: 39–43.
51. Newman N (2005) A measure of betweenness centrality based on random walks. Social Networks 27:39–54.
52. Venters BJ, Wachi S, Mavrich TN, Andersen BE, Jena P, et al. (2011) A comprehensive genomic bind-ing map of gene and chromatin regulatory proteins in Saccharomyces. Mol Cell 41: 480–492. doi: 10.1016/j.molcel.2011.01.015 PMID: 21329885
53. Dimmer KS, Fritz S, Fuchs F, Messerschmitt M, Weinbach N, et al. (2002) Genetic basis of mitochondri-al function and morphology in Saccharomyces cerevisiae. Mol Biol Cell 13: 847–853. PMID: 11907266
54. Lockshon D, Olsen CP, Brett CL, Chertov A, Merz AJ, et al. (2012) Rho signaling participates in mem-brane fluidity homeostasis. PLoS One 7: e45049. doi: 10.1371/journal.pone.0045049 PMID:23071506
55. Costanzo M, Baryshnikova A, Bellay J, Kim Y, Spear ED, et al. (2010) The genetic landscape of a cell.Science 327: 425–431. doi: 10.1126/science.1180823 PMID: 20093466
56. Giaever G, Nislow C (2014) The yeast deletion collection: a decade of functional genomics. Genetics197: 451–465. doi: 10.1534/genetics.114.161620 PMID: 24939991
57. Fortney K, Xie W, Kotlyar M, Griesman J, Kotseruba Y, et al. (2013) NetwoRx: connecting drugs to net-works and phenotypes in Saccharomyces cerevisiae. Nucleic Acids Res 41: D720–727. doi: 10.1093/nar/gks1106 PMID: 23203867
58. Duncia JV, Santella JB 3rd, Higley CA, Pitts WJ, Wityak J, et al. (1998) MEK inhibitors: the chemistryand biological activity of U0126, its analogs, and cyclization products. Bioorg Med Chem Lett 8: 2839–2844. PMID: 9873633
Small-World Properties of a Fat Regulation Network
PLOS Computational Biology | DOI:10.1371/journal.pcbi.1004264 July 20, 1969 26 / 27
59. Vohra PK, Puri V, Thomas CF Jr. (2003) Complementation and characterization of the Pneumocystiscarinii MAPK, PCM. FEBS Lett 551: 139–146. PMID: 12965219
60. Drose S, Bindseil KU, Bowman EJ, Siebers A, Zeeck A, et al. (1993) Inhibitory effect of modified bafilo-mycins and concanamycins on P- and V-type adenosinetriphosphatases. Biochemistry 32: 3902–3906. PMID: 8385991
61. Bowman EJ, Bowman BJ (2005) V-ATPases as drug targets. J Bioenerg Biomembr 37: 431–435.PMID: 16691478
62. Johnson RM, Allen C, Melman SD, Waller A, Young SM, et al. (2010) Identification of inhibitors of vacu-olar proton-translocating ATPase pumps in yeast by high-throughput screening flow cytometry. AnalBiochem 398: 203–211. doi: 10.1016/j.ab.2009.12.020 PMID: 20018164
63. Shao E, Forgac M (2004) Involvement of the nonhomologous region of subunit A of the yeast V-ATPase in coupling and in vivo dissociation. J Biol Chem 279: 48663–48670. PMID: 15355963
64. Ohno T, Awaya J, Kesado T, Nomura S, Omura S (1974) Mechanism of action of CM-55, a syntheticanalogue of the antilipogenic antibiotic cerulenin. Antimicrob Agents Chemother 6: 387–392. PMID:4157441
65. Pultz D, Bennetzen MV, Rodkaer SV, Zimmermann C, Enserink JM, et al. (2012) Global mapping ofprotein phosphorylation events identifies Ste20, Sch9 and the cell-cycle regulatory kinases Cdc28/Pho85 as mediators of fatty acid starvation responses in Saccharomyces cerevisiae. Mol Biosyst 8:796–803. doi: 10.1039/c2mb05356j PMID: 22218487
66. Szappanos B, Kovacs K, Szamecz B, Honti F, Costanzo M, et al. (2011) An integrated approach tocharacterize genetic interaction networks in yeast metabolism. Nat Genet 43: 656–662. doi: 10.1038/ng.846 PMID: 21623372
67. Lee AY, St Onge RP, Proctor MJ, Wallace IM, Nile AH, et al. (2014) Mapping the cellular response tosmall molecules using chemogenomic fitness signatures. Science 344: 208–211. doi: 10.1126/science.1250217 PMID: 24723613
68. Neklesa TK, Davis RW (2009) A genome-wide screen for regulators of TORC1 in response to aminoacid starvation reveals a conserved Npr2/3 complex. PLoS Genet 5: e1000515. doi: 10.1371/journal.pgen.1000515 PMID: 19521502
69. Albert R, Jeong H, Barabasi AL (2000) Error and attack tolerance of complex networks. Nature 406:378–382. PMID: 10935628
70. Cohen R, Erez K, ben-Avraham D, Havlin S (2000) Resilience of the internet to random breakdowns.Phys Rev Lett 85: 4626–4628. PMID: 11082612
71. Cohen R, Erez K, ben-Avraham D, Havlin S (2001) Breakdown of the internet under intentional attack.Phys Rev Lett 86: 3682–3685. PMID: 11328053
72. Bose I, Irazoqui JE, Moskow JJ, Bardes ES, Zyla TR, et al. (2001) Assembly of scaffold-mediated com-plexes containing Cdc42p, the exchange factor Cdc24p, and the effector Cla4p required for cell cycle-regulated phosphorylation of Cdc24p. J Biol Chem 276: 7176–7186. PMID: 11113154
73. Takaku T, Ogura K, Kumeta H, Yoshida N, Inagaki F (2010) Solution structure of a novel Cdc42 bindingmodule of Bem1 and its interaction with Ste20 and Cdc42. J Biol Chem 285: 19346–19353. doi: 10.1074/jbc.M110.116749 PMID: 20410294
74. Happel B, Murre J (1994) The Design and Evolution of Modular Neural Network Architectures. NeuralNetworks 7: 985–1004.
75. Hubel DH, Livingstone MS (1990) Color and contrast sensitivity in the lateral geniculate body and pri-mary visual cortex of the macaquemonkey. J Neurosci 10: 2223–2237. PMID: 2198331
76. Azam F (2000) Biologically Inspired Modular Neural Networks. In: Tech V, editor.
77. Stumpf MP, Wiuf C, May RM (2005) Subnets of scale-free networks are not scale-free: sampling prop-erties of networks. Proc Natl Acad Sci U S A 102: 4221–4224. PMID: 15767579
78. Sprinzak E, Sattath S, Margalit H (2003) How reliable are experimental protein-protein interaction data?J Mol Biol 327: 919–923. PMID: 12662919
79. Yu X, Ivanic J, Wallqvist A, Reifman J (2009) A novel scoring approach for protein co-purification datareveals high interaction specificity. PLoS Comput Biol 5: e1000515. doi: 10.1371/journal.pcbi.1000515PMID: 19779545
80. Roskams J, Rodgers L (2002) Lab Ref: A handbook of recipes, reagent, and other reference tools foruse at the bench: Cold Spring Harbor Laboratory Press.
81. Wolinski H, Bredies K, Kohlwein SD (2012) Quantitative imaging of lipid metabolism in yeast: from 4Danalysis to high content screens of mutant libraries. Methods Cell Biol 108: 345–365. doi: 10.1016/B978-0-12-386487-1.00016-X PMID: 22325610
Small-World Properties of a Fat Regulation Network
PLOS Computational Biology | DOI:10.1371/journal.pcbi.1004264 July 20, 1969 27 / 27


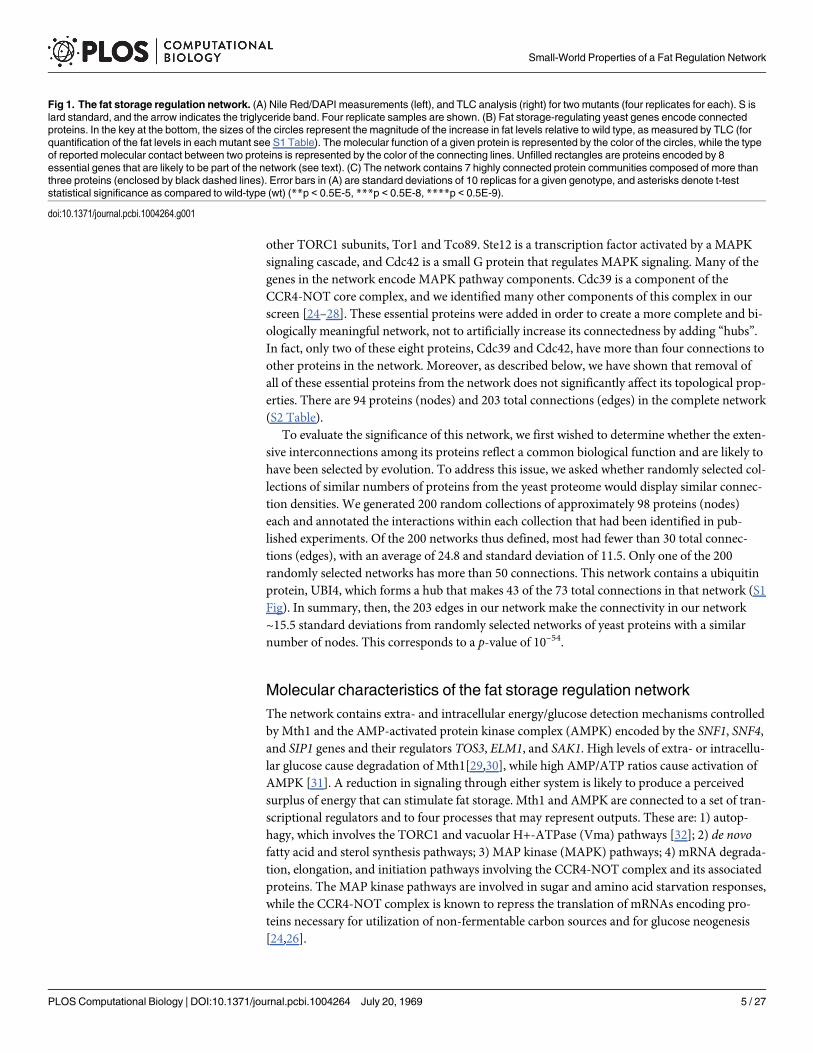
other TORC1 subunits, Tor1 and Tco89. Ste12 is a transcription factor activated by a MAPKsignaling cascade, and Cdc42 is a small G protein that regulates MAPK signaling. Many of thegenes in the network encode MAPK pathway components. Cdc39 is a component of theCCR4-NOT core complex, and we identified many other components of this complex in ourscreen [24–28]. These essential proteins were added in order to create a more complete and bi-ologically meaningful network, not to artificially increase its connectedness by adding “hubs”.In fact, only two of these eight proteins, Cdc39 and Cdc42, have more than four connections toother proteins in the network. Moreover, as described below, we have shown that removal ofall of these essential proteins from the network does not significantly affect its topological prop-erties. There are 94 proteins (nodes) and 203 total connections (edges) in the complete network(S2 Table).
To evaluate the significance of this network, we first wished to determine whether the exten-sive interconnections among its proteins reflect a common biological function and are likely tohave been selected by evolution. To address this issue, we asked whether randomly selected col-lections of similar numbers of proteins from the yeast proteome would display similar connec-tion densities. We generated 200 random collections of approximately 98 proteins (nodes)each and annotated the interactions within each collection that had been identified in pub-lished experiments. Of the 200 networks thus defined, most had fewer than 30 total connec-tions (edges), with an average of 24.8 and standard deviation of 11.5. Only one of the 200randomly selected networks has more than 50 connections. This network contains a ubiquitinprotein, UBI4, which forms a hub that makes 43 of the 73 total connections in that network (S1Fig). In summary, then, the 203 edges in our network make the connectivity in our network~15.5 standard deviations from randomly selected networks of yeast proteins with a similarnumber of nodes. This corresponds to a p-value of 10–54.
Molecular characteristics of the fat storage regulation networkThe network contains extra- and intracellular energy/glucose detection mechanisms controlledby Mth1 and the AMP-activated protein kinase complex (AMPK) encoded by the SNF1, SNF4,and SIP1 genes and their regulators TOS3, ELM1, and SAK1. High levels of extra- or intracellu-lar glucose cause degradation of Mth1[29,30], while high AMP/ATP ratios cause activation ofAMPK [31]. A reduction in signaling through either system is likely to produce a perceivedsurplus of energy that can stimulate fat storage. Mth1 and AMPK are connected to a set of tran-scriptional regulators and to four processes that may represent outputs. These are: 1) autop-hagy, which involves the TORC1 and vacuolar H+-ATPase (Vma) pathways [32]; 2) de novofatty acid and sterol synthesis pathways; 3) MAP kinase (MAPK) pathways; 4) mRNA degrada-tion, elongation, and initiation pathways involving the CCR4-NOT complex and its associatedproteins. The MAP kinase pathways are involved in sugar and amino acid starvation responses,while the CCR4-NOT complex is known to repress the translation of mRNAs encoding pro-teins necessary for utilization of non-fermentable carbon sources and for glucose neogenesis[24,26].
Fig 1. The fat storage regulation network. (A) Nile Red/DAPI measurements (left), and TLC analysis (right) for two mutants (four replicates for each). S islard standard, and the arrow indicates the triglyceride band. Four replicate samples are shown. (B) Fat storage-regulating yeast genes encode connectedproteins. In the key at the bottom, the sizes of the circles represent the magnitude of the increase in fat levels relative to wild type, as measured by TLC (forquantification of the fat levels in each mutant see S1 Table). The molecular function of a given protein is represented by the color of the circles, while the typeof reported molecular contact between two proteins is represented by the color of the connecting lines. Unfilled rectangles are proteins encoded by 8essential genes that are likely to be part of the network (see text). (C) The network contains 7 highly connected protein communities composed of more thanthree proteins (enclosed by black dashed lines). Error bars in (A) are standard deviations of 10 replicas for a given genotype, and asterisks denote t-teststatistical significance as compared to wild-type (wt) (**p < 0.5E-5, ***p < 0.5E-8, ****p < 0.5E-9).
doi:10.1371/journal.pcbi.1004264.g001
Small-World Properties of a Fat Regulation Network
PLOS Computational Biology | DOI:10.1371/journal.pcbi.1004264 July 20, 1969 5 / 27
We next examined if proteins that participate in the same process or pathway exhibit ahigher tendency to have connections with each other than with other network proteins using awalk-trap algorithm. This function finds densely connected communities via random walksfrom one node to another [33]. The idea is that short random walks will tend to stay in thesame community. This analysis showed that the network contains seven different communities(modules) composed of three or more proteins, and that each module is enriched for proteinsthat are involved in the same process (Fig 1C).
We performed an analysis of the Gene Ontology (GO) terms associated with each of theproteins in the network. GO includes three categories: Biological Process, Molecular Function,and Cellular Component. S3 Table shows a list of the GO terms that are enriched for networkproteins relative to random yeast proteins, with p-values for the statistical significances of theenrichments. Many of these highly enriched categories are very general, with the top threebeing “growth”, “biological regulation”, and “protein phosphorylation”. Others overlap withthe output processes described above (Fig 1), and are properties of the signaling pathways, bio-logical processes, and cellular components represented in the network. Four of the moduleswithin the network defined by the walk-trap algorithm (Fig 1C) are highly enriched for specificGO terms. These are terms related to MAPK signaling (green circles), vacuolar acidificationand proton transport (dark blue circles), mRNA catabolic processes (light blue circles), andpositive regulation of transcription (red circles). It has been previously shown that GO catego-ries can correspond to clusters within the global yeast protein-protein interaction map[34].
The fact that proteins required for filamentous growth are overrepresented in the network(p = 1.8 x 10⁻⁸) is interesting, In limited nutritional conditions, yeast can adopt a filamentousgrowth pattern that permits a non-motile colony to explore its surroundings for additional nu-trients. The induction of this state requires the action of the AMPK, MAP, and Tor kinasepathways [25], which form a considerable portion of the fat regulation network. We hypothe-size that some yeast mutants that store excess fat do so because they are in a state of perceivedenergy excess, which is the opposite of the conditions in which filamentous growth wouldbe favored.
In yeast, MAP kinase pathways are organized as cassettes composed of specific combina-tions of MAPKKKs, MAPKKs, and MAPKs, and these cassettes can cross-regulate one another[28]. Because we found mutations affecting multiple MAP kinase pathways, there may be re-dundancy between the cassettes with regard to control of fat storage. Consistent with this, weobserved that a double mutant (fus3 kss1) lacking two MAPKs accumulates more fat than ei-ther single mutant (S2 Fig). We also note that mutations in TORC1 units and not TORC2units cause an increase in fat storage, thus implicating only TORC1 in yeast fat storage regula-tion. This was confirmed by the fact that rapamycin (Rap), a selective inhibitor of the TORC1complex[27], causes an increase in fat storage in wild-type yeast (S2 Fig).
We did not isolate any ‘lean’mutants in our screen. This could be due to the fact that ourgrowth media does not contain fatty acids that could be converted to phospholipids necessaryfor membrane synthesis during cell division, or, alternatively, to genetic redundancy. Indeed,in cases where a low fat storage yeast strain has been reported, a phenotype was only detectedwhen more than one fatty acid synthesis gene is removed [35,36].
Most of the genes we identified have not been previously implicated in fat storage. Earlierscreens were done for LD morphology defects, but only ~20% of the 171 genes previously re-ported to affect LDs showed an increase in fat storage in our assays [37–39]. This is not surpris-ing, because these genes were identified in screens by altered LD morphologies in live mutantcells, not by measuring fat content. Because the goal of our screen was to find mutants with al-tered fat storage levels, not to study LD dynamics, we fixed cells in order to deactivate pumps
Small-World Properties of a Fat Regulation Network
PLOS Computational Biology | DOI:10.1371/journal.pcbi.1004264 July 20, 1969 6 / 27
that can affect dye uptake and block vesicular traffic to increase the specificity of the dyes tolipid droplets, and used quantitative assays to evaluate fat content [20,40,41].
Mathematical analysis of network architectureThe fact that the interconnection density of the fat storage regulation network is much greaterthan that of any randomly generated network of yeast proteins (S1 Fig) implies that the majori-ty of the connections within the network have biological relevance. This makes yeast fat regula-tion an ideal system in which to examine whether a biological network conforms to amathematical model for network design. See S1 Text for detailed information on methods formathematical analysis used in this paper.
Many real-world networks, such as the Internet, power grids, and social networks, havebeen studied, and they tend to have certain features in common. A social network, for example,contains many different local clusters of people that are linked to each other by mutual ac-quaintances, so that any person within the cluster can be reached from another person by asmall number of steps. Social networks also contain celebrities (“hubs”), who have exponential-ly more followers than does an average member of the network. Similarly, biological signalingnetworks tend to contain modules and have hub-like proteins that make many more connec-tions than other proteins.
These features of real-world networks have been simulated using graph theory, which is thestudy of systems of objects, referred to as nodes, and their relationships, referred to as edges orconnections. The properties of networks generated by graph generation models can be charac-terized by a variety of different parameters (for review see [42]), including degree distributionP(k), global clustering coefficient Cg, modularityM, and path length L. P(k) is the probabilitythat a given network node has a certain number of connections, while Cg is a measure of the de-gree to which nodes in a network tend to cluster together [43].M is a measure of the divisionof a network into communities or modules, produced by the tendency of some nodes to formconnections primarily within the community to which they belong. Finally, L is the averagenumber of steps along the shortest paths that connect all possible pairs of network nodes.
The simplest model used to generate networks is the Erdos-Renyi model [44], characterizedby an equal probability of forming connections between any two nodes (Fig 2A). Erdos-Renyinetworks have a degree distribution similar to a Poisson distribution (Fig 2B), and have low Cg,M, and L values. Most real-world networks are not approximated well by this model, becauseErdos-Renyi graphs lack local clustering and hubs.
The Watts-Strogatz model was designed to produce better models of real-world networksby remedying the lack of clustering in Erdos-Renyi networks. Watts-Strogatz graphs are pro-duced by randomly moving the edges of a regular ring lattice, thus producing “criss-cross” con-nections across the ring[19]. This does not imply that a real network approximated by theWatts-Strogatz model contains a structure resembling a ring lattice. Moving edges on a ringlattice is simply the algorithm by which these graphs are generated. Similarly, Erdos-Renyi andscale-free graphs (see below) are also generated by specific algorithms, but this does not implythat real networks with similar topologies are built using these algorithms. Watts-Strogatz net-works are expected to have a degree distribution that depends on the rewiring probability β,which is related to the number of new connections between nodes that are introduced into thering lattice. β varies between 0 (a regular ring lattice) and 1 (a lattice where so many connec-tions are changed that it approximates an Erdos-Renyi graph). For moderate to high rewiringprobabilities, the degree distribution of the network is a binomial distribution, which in thelimit (β = 1) approximates a Poisson distribution. For a low rewiring probability (β near 0), thedistribution resembles the P(k) of a regular ring lattice, which is a delta function. In all cases,
Small-World Properties of a Fat Regulation Network
PLOS Computational Biology | DOI:10.1371/journal.pcbi.1004264 July 20, 1969 7 / 27
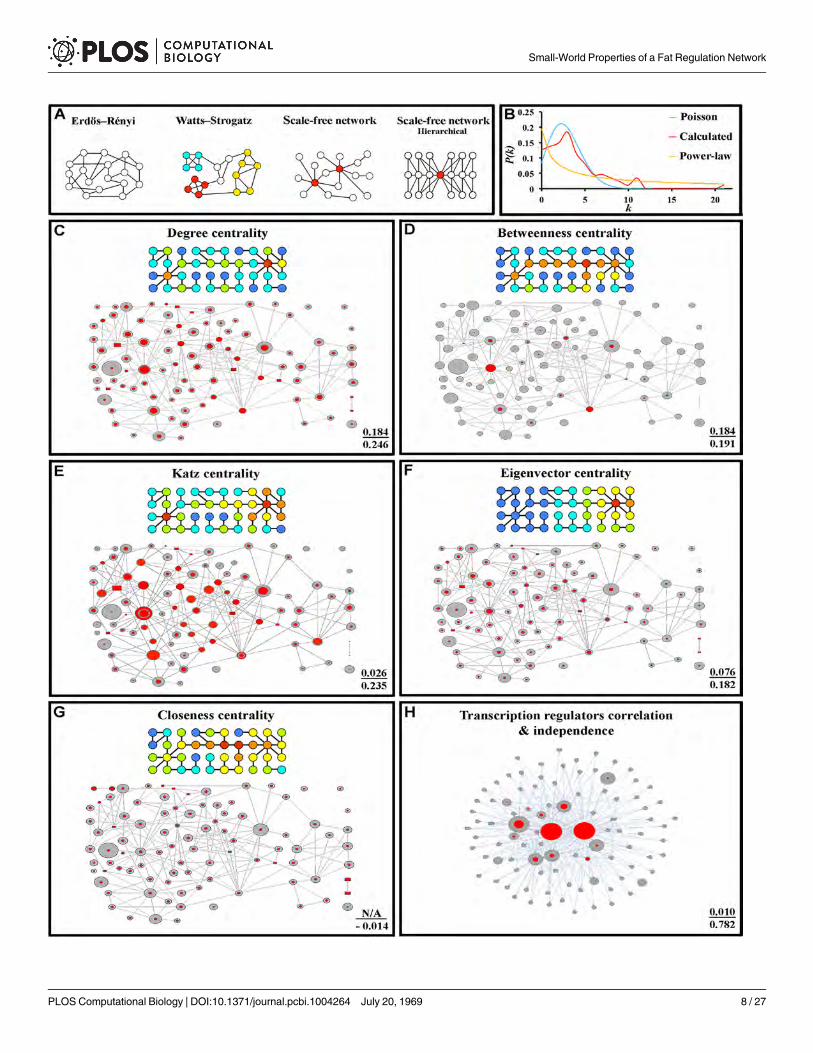
Small-World Properties of a Fat Regulation Network
PLOS Computational Biology | DOI:10.1371/journal.pcbi.1004264 July 20, 1969 8 / 27
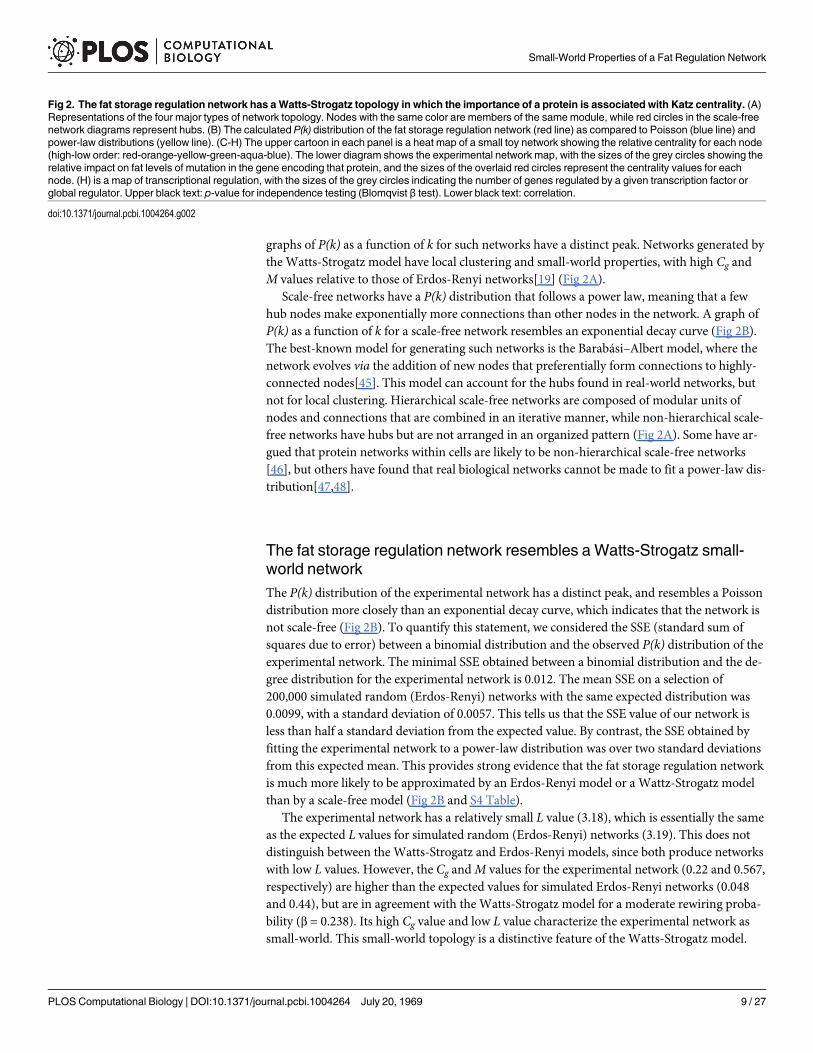
graphs of P(k) as a function of k for such networks have a distinct peak. Networks generated bythe Watts-Strogatz model have local clustering and small-world properties, with high Cg andM values relative to those of Erdos-Renyi networks[19] (Fig 2A).
Scale-free networks have a P(k) distribution that follows a power law, meaning that a fewhub nodes make exponentially more connections than other nodes in the network. A graph ofP(k) as a function of k for a scale-free network resembles an exponential decay curve (Fig 2B).The best-known model for generating such networks is the Barabási–Albert model, where thenetwork evolves via the addition of new nodes that preferentially form connections to highly-connected nodes[45]. This model can account for the hubs found in real-world networks, butnot for local clustering. Hierarchical scale-free networks are composed of modular units ofnodes and connections that are combined in an iterative manner, while non-hierarchical scale-free networks have hubs but are not arranged in an organized pattern (Fig 2A). Some have ar-gued that protein networks within cells are likely to be non-hierarchical scale-free networks[46], but others have found that real biological networks cannot be made to fit a power-law dis-tribution[47,48].
The fat storage regulation network resembles a Watts-Strogatz small-world networkThe P(k) distribution of the experimental network has a distinct peak, and resembles a Poissondistribution more closely than an exponential decay curve, which indicates that the network isnot scale-free (Fig 2B). To quantify this statement, we considered the SSE (standard sum ofsquares due to error) between a binomial distribution and the observed P(k) distribution of theexperimental network. The minimal SSE obtained between a binomial distribution and the de-gree distribution for the experimental network is 0.012. The mean SSE on a selection of200,000 simulated random (Erdos-Renyi) networks with the same expected distribution was0.0099, with a standard deviation of 0.0057. This tells us that the SSE value of our network isless than half a standard deviation from the expected value. By contrast, the SSE obtained byfitting the experimental network to a power-law distribution was over two standard deviationsfrom this expected mean. This provides strong evidence that the fat storage regulation networkis much more likely to be approximated by an Erdos-Renyi model or a Wattz-Strogatz modelthan by a scale-free model (Fig 2B and S4 Table).
The experimental network has a relatively small L value (3.18), which is essentially the sameas the expected L values for simulated random (Erdos-Renyi) networks (3.19). This does notdistinguish between the Watts-Strogatz and Erdos-Renyi models, since both produce networkswith low L values. However, the Cg andM values for the experimental network (0.22 and 0.567,respectively) are higher than the expected values for simulated Erdos-Renyi networks (0.048and 0.44), but are in agreement with the Watts-Strogatz model for a moderate rewiring proba-bility (β = 0.238). Its high Cg value and low L value characterize the experimental network assmall-world. This small-world topology is a distinctive feature of the Watts-Strogatz model.
Fig 2. The fat storage regulation network has aWatts-Strogatz topology in which the importance of a protein is associated with Katz centrality. (A)Representations of the four major types of network topology. Nodes with the same color are members of the samemodule, while red circles in the scale-freenetwork diagrams represent hubs. (B) The calculated P(k) distribution of the fat storage regulation network (red line) as compared to Poisson (blue line) andpower-law distributions (yellow line). (C-H) The upper cartoon in each panel is a heat map of a small toy network showing the relative centrality for each node(high-low order: red-orange-yellow-green-aqua-blue). The lower diagram shows the experimental network map, with the sizes of the grey circles showing therelative impact on fat levels of mutation in the gene encoding that protein, and the sizes of the overlaid red circles represent the centrality values for eachnode. (H) is a map of transcriptional regulation, with the sizes of the grey circles indicating the number of genes regulated by a given transcription factor orglobal regulator. Upper black text: p-value for independence testing (Blomqvist β test). Lower black text: correlation.
doi:10.1371/journal.pcbi.1004264.g002
Small-World Properties of a Fat Regulation Network
PLOS Computational Biology | DOI:10.1371/journal.pcbi.1004264 July 20, 1969 9 / 27
In a scale-free network, loss of peripheral nodes will have little effect on network parame-ters, but loss of hub nodes can produce major changes in path length L. An analogy to this isthat shutdown or dysfunction of a hub airport (e.g., O’Hare in Chicago) due to bad weatherwill cause many travelers to have to take additional flights to reach their destinations. However,shutdown of a small regional airport will have no effect on the global pattern of air travel. Toevaluate whether our network is vulnerable to deletion of any nodes, we determined the contri-bution made by each protein to the topological parameters of the entire network. This wasdone by calculating L, Cg, andM for the network and then recalculating those parameters (L-P,Cg-P, andM-P) when each network protein and its connections were removed. Only minorchanges to these values were observed in response to removal of any one protein (<10%; S2Table). This is of interest, because it argues that the Watts-Strogatz topology of the networkmay contribute to the robustness of its topological parameters to deletion of any node. Unlikescale-free networks, it lacks essential hub nodes for which elimination of function by mutationor damage would dramatically alter the entire network. We also simultaneously removed alleight of the proteins encoded by essential genes that were added to the network (see above), toensure that these proteins were not required for network properties. This produced no signifi-cant changes in L orM, and only a 10% decrease in Cg.
To evaluate the relationships between the experimentally determined fat storage regulationnetwork and manually curated GO categories, we generated networks of protein-protein con-nections for the proteins in yeast Biological Process categories, since fat storage regulation ismore like a Biological Process than it is like a Molecular Function or Cellular Component.These categories range in size from a few proteins to more than 250. We then calculated edgedensity (the number of edges/number of possible edges), Cg, andM for these networks andcompared these numbers to the values for the fat storage regulation network. S3 Fig shows thatthe edge density for our network is around the median for the GO categories. Cg is below themedian, andM is above the median. These data indicate that the experimental fat storage regu-lation network has similar properties to those of networks formed from the proteins within GOBiological Process categories. Proteins in a ‘typical’ Biological Process category are extensivelyinterconnected, and exhibit more clustering but less modularity than the proteins in the fatstorage regulation network.
The importance of a protein to the network’s function is related to its Katzcentrality scoreBecause the fat regulation network was defined by a quantitative genetic screen, it has the use-ful property that the importance of a given protein to network output can be defined by the se-verity of the fat storage phenotype (the amount of fat added above wild-type levels) for adeletion mutation in the gene encoding that protein. This is graphically depicted in Figs 1 and2, where the sizes of the circles in the network diagrams are proportional to the strength of thephenotype produced by loss of the corresponding protein. This allows us to evaluate the rela-tionship between a node’s position in the network and its importance for network function. Ifsuch a relationship can be established, it can be used by future investigators to find the essentialelements in other biological networks that are found to fit the Watts-Strogatz model, but forwhich quantitative information on phenotype is not available.
In network analysis, the centrality of a node, C(v), refers to indicators that identify the mostimportant nodes [49]. For example, centrality analysis has been used to find the most influen-tial person in a social network. There are many types of centrality, each of which emphasizes acertain quantifiable attribute of a given node. We examined the five standard centrality types(Degree, Betweenness, Closeness, Eigenvector, and Katz centralities) [49–51] to measure these
Small-World Properties of a Fat Regulation Network
PLOS Computational Biology | DOI:10.1371/journal.pcbi.1004264 July 20, 1969 10 / 27
attributes. For degree centrality, the value is evaluated by counting the number of directly con-nected nodes. Betweenness centrality is evaluated by counting the number of shortest pathsthat pass through a given node. Closeness centrality is a sum of the inverses of the shortestpath lengths. Eigenvector centrality is an implicitly defined measure evaluated by asserting thatthe centrality of a single node is proportional to the sum of the centralities of all nodes it is con-nected to. For Katz centrality, the importance of a node is determined by how many nodes it ispath-connected to, with a penalty that increases exponentially with the path length betweenthose nodes. The colored heat-map diagrams in Fig 2C–2G show the values of each type of cen-trality for each node in a small toy network, with red indicating the highest centrality. The dia-grams below superimpose centrality values, indicated by the sizes of the red circles, on the greycircles that indicate phenotypic severity.
We assessed the relationships between the centrality of a given node and the severity of thefat storage defect exhibited when the gene corresponding to that node is removed, using bothindependence and correlation testing (Fig 2C–2H and S4 Table). Dependence is any statisticalrelationship between two random variables, while correlation is a special type of dependencethat can be used to predict the magnitude of the change that will occur in one variable in re-sponse to changes in a linked variable. Two random variables that are independent necessarilyhave low correlation, but variables with low correlation can be dependent. For example, drivingwhile intoxicated and fatal car accidents are clearly not independent of each other, but the cor-relation between the two is only moderate, since only 32% of such accidents involved an intoxi-cated driver and most intoxicated drivers do not have an accident. Dependence is a moregeneral and arguably more useful measure, as it is able to detect nonlinear relationships, where-as correlation assumes a simple linear dependence.
The only centrality measure that passed five separate independence tests (Blomqvist β,Goodman-Kruskal, Hoeffding D, Kendall tau, and Spearman Rank) was Katz centrality (Fig2E), for which the p-value (probability of independence) was<0.027 for all 5 tests. There aregood reasons that Katz centrality gives the best dependence score, which are based on how thecentrality measures are defined. First, a good measure of the importance of a protein nodeshould be global, and not just depend on proteins that are directly connected to it. Second,those nodes related by longer paths should have a smaller effect on each other’s function thanthose related by shorter paths. These attributes are held by closeness, eigenvector and Katz cen-trality measures. The effect of adding a node on the closeness centrality depends on the recipro-cal of path lengths, for eigenvector centrality it is loosely related to degrees of the node, and forKatz centrality, the effect will become exponentially smaller the as the path length increases. Inmany models, it is reasonable to assume that only a fraction of a signal passes through a nodeto each of the other nodes to which it connects, and this assumption predicts an exponentialdrop-off.
Although the statistical analysis shows a clear relationship between the severity of the fatstorage phenotype and Katz centrality, the moderate correlation between these parameters(0.24) suggests that this is not necessarily a linear relationship. Fig 2E displays this graphically.It shows that many of the larger grey circles have corresponding large red circles, but there aresome large grey circles with very small red circles, indicating low Katz centrality. This showsthat the quantitative impact on fat levels caused by removal of a network protein cannot alwaysbe predicted from its Katz centrality score in a linear way. In particular, mutations eliminatingtranscriptional regulators that have low Katz centrality scores often have large impacts on fatlevels (e.g., Spt10). This may be due to the fact that the importance of a transcriptional regula-tor to the network is more likely to be related to the number of gene targets whose expression itcontrols than to the number of proteomic connections it makes. Most of the transcription fac-tors that regulate fat storage levels bind to the promoter regions of genes that are themselves
Small-World Properties of a Fat Regulation Network
PLOS Computational Biology | DOI:10.1371/journal.pcbi.1004264 July 20, 1969 11 / 27
part of the network, creating potential feedback loops [52] (Fig 2H). Ino2, Srb5, and Ctk1 bindto the promoter regions of up to 40% of network genes. In total, 67% of network genes havenetwork transcription factors other than the global regulators Hhf1 and Spt10 that bind totheir promoter regions. The number of network genes that a given network transcriptional reg-ulator binds to is an excellent predictor (correlation = 0.787; probability of independence<0.01; S4 Table) for the severity of the fat storage defect when the gene that encodes itis removed.
The network is divisible into subnetworks that regulate different aspectsof fat metabolismAnother useful feature of yeast fat regulation is that mutants selected for increased fat contentcan also be examined for related phenotypes, such as LD morphology and metabolic alter-ations. We can then ask whether the genes and proteins that share these “sub-phenotypes” alsoform networks, and examine the relationships between these subnetworks and the larger fatregulation network.
Yeast LDs are composed of triglycerides and sterol esters surrounded by a monolayer ofphospholipids. LDs may increase in size and/or number when trigylceride levels increase. Awild-type fixed yeast cell usually has three to eight LDs that are around 0.4 μm in diameter (Fig3A). We examined all the mutants for LD morphology phenotypes, grouped them into threephenotypic classes, and created subnetworks encompassing all the proteins for each class. ClassI contained mutants with small but numerous LDs, class II contained mutants with mixed pop-ulations of normal and small LDs, and class III contained mutants that have giant LDs (Fig 3).Each of the three subnetworks was highly interconnected, indicating that members of the samemorphological class tend to have mutations affecting proteins that are connected to each other(S5 Table).
Fat levels are influenced by the rate of fat storage utilization, the rate of de novo fatty acidsynthesis, and the level of caloric intake. We examined fat storage utilization by subjecting allof the mutants to glucose starvation for three days. ~85% of the mutants showed no reductionin fat storage or a reduced rate of fat storage depletion compared to wild-type when starved, in-dicating defects in the ability to use stored fat to meet energy demands (Fig 4A and S6 Table).
To be used as an energy source, fats have to be broken down to glycerol and fatty acids,which are used by mitochondria for ATP production [53,54]. We evaluated the overall statusof mitochondria in all mutants with reduced fat utilization rate by growing them on glycerol.~60% of mutants showed either slowed or no growth on glycerol, suggesting defects in mito-chondrial function. All of these mutants also failed to grow on palmitic acid and lard. Another26 mutants did grow on glycerol, but failed to grow on either palmitic acid or lard or both. Mu-tations that produce a similar growth defect on a given carbon energy source tend to affect pro-teins that are connected to one another, forming subnetworks (S6 Table and Fig 4B and 4C).These results show that a significant portion of the network is dedicated to maintaining normalmitochondrial function. Indeed, nearly half of the genes we identified were previously implicat-ed in mitochondrial function[53].
In our growth conditions, cells were provided with glucose and a mixture of amino acidsthat can be used for de novo fatty acid synthesis. To examine if any of the mutants have alter-ations in this process, we grew them on media containing either 14C-labeled D-glucose or 14C-labeled L-aspartic acid. About 30% of the mutants showed an increase in the conversion of ei-ther D-glucose or L-aspartic acid to fat. Mutants that exhibited increased conversion of eithernutrient to fat tend to encode proteins that are part of a connected subnetwork (Fig 5 and S7Table).
Small-World Properties of a Fat Regulation Network
PLOS Computational Biology | DOI:10.1371/journal.pcbi.1004264 July 20, 1969 12 / 27
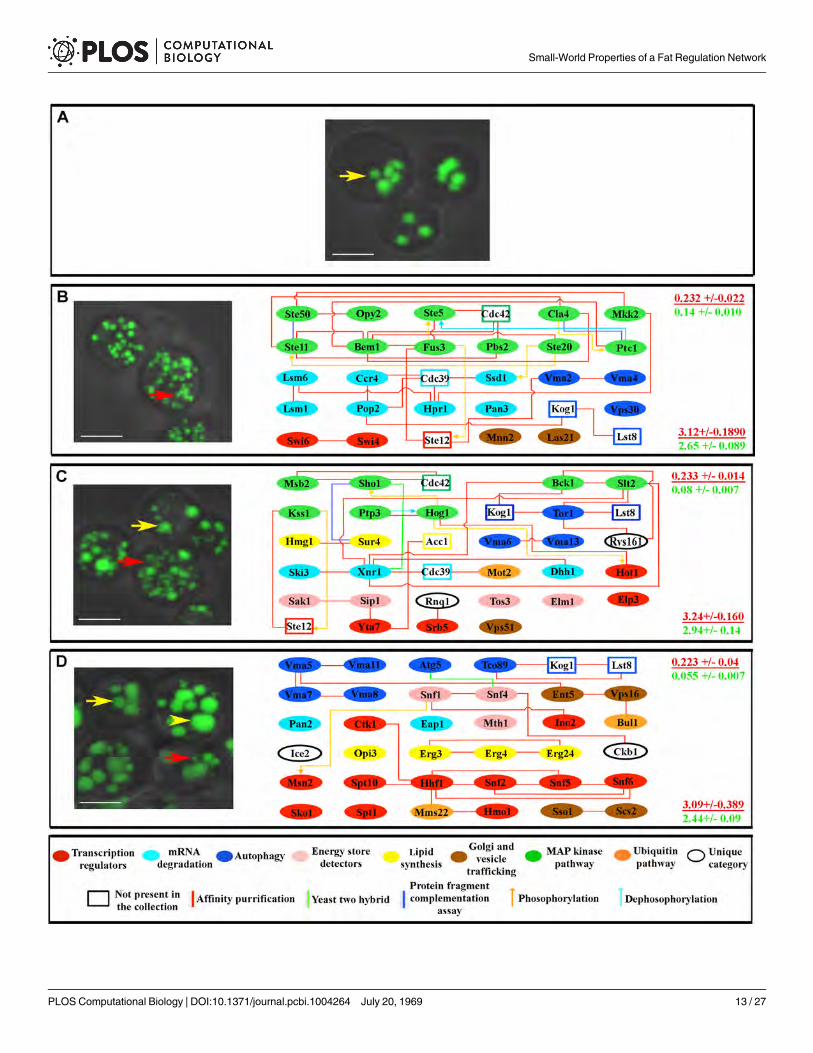
Small-World Properties of a Fat Regulation Network
PLOS Computational Biology | DOI:10.1371/journal.pcbi.1004264 July 20, 1969 13 / 27
To test the hypothesis that genes for which mutants exhibit similar physiological profileswould encode proteins that formed subnetworks, we examined all of the potential subnetworksencoded by subsets of genes with similar detailed sub-phenotypes, in the same way that we hadexamined the complete network. We found that these subnetworks also exhibited Watts-Stro-gatz small-world topology, with relatively high clustering coefficients (0.179–0.28) and shortpath lengths (3.09–3.85). To determine if the subnetworks represented functional subsets ofthe larger network, we then compared each subnetwork to randomized simulations of 104 net-works with identical degree distribution and vertex counts. In all cases, the experimentally ob-served subnetworks had much higher clustering coefficients than their simulated equivalents(red and green numbers on the right sides of the panels of S5–S7 Tables and Figs 3–5), indicat-ing that the subnetworks were selected by evolution, and do not represent randomly chosensubsets of the complete network. We also observed that in all cases, these subnetworks are notconfined to a single module, but span modular boundaries. These results suggest that the largernetwork that controls fat storage contains within it smaller networks that govern different as-pects of physiology related to a cell’s decision whether to store fat or metabolize it for energy.
Patterns of communication among distant network nodes are consistentwith the Watts-Strogatz small-world topologyHaving established that the fat regulation network fits the Watts-Strogatz model, we then con-ducted experiments in which we perturbed the functions of multiple network nodes and mea-sured the effects of these perturbations on fat content. This allowed us to evaluate whether thepatterns of communication among distant nodes in the real network are consistent with theWatts-Strogatz topology. We call these patterns “signal propagation”, because, although theyare not measured dynamically, they reflect the movement of information through the network.They thus represent signal flow along signal transduction pathways and crosstalk betweenthese pathways.
We conducted “chemogenomic” experiments in which we simultaneously perturbed thefunctions of multiple network nodes by treating yeast bearing a deletion mutation in each net-work gene with a set of drugs that block the functions of specific network pathways, followedby measuring the effects of these perturbations on fat content. The approach of adding drugsto single mutants to block multiple nodes was chosen in order to avoid the slow growth or le-thality frequently observed for double mutants (see [55]), as well as the necessity to constructall possible double mutants. The chemogenomic approach has often been employed in theyeast system to map synergistic and antagonistic relationships between drug targets and othergenes (for recent reviews see [56,57]).
We selected five drugs that blocked signal propagation through specific network pathways.The first drug was U0126, an inhibitor of mammalian MAPKKs [58] that has been shown toblock reporter expression controlled by the MAPK mating factor response pathway [59]. Thesecond drug was Rap, an inhibitor of the mammalian and yeast TORC1 complex[27]. Thethird and fourth drugs were chloroquine (ChQ) and concanamycin A (Conc. A); these are
Fig 3. Genes for whichmutations produce similar LD phenotypes affect connected proteins. (A) Fixed wild type yeast cells stained with BIODIPY 493/518, as visualized by confocal microscopy. Most cells have 3–8 LDs that are ~0.4 μm in diameter (yellow arrow). (B) Mutants with numerous and small LDs(red arrow), as exemplified by fus3Δ (left). The right sides of panels B-D show the genes for which mutants display this phenotype and their proteomicconnections. (C) Mutants with a mixture of small and normal size LDs (red and yellow arrows, respectively), as exemplified bymot2Δ (left). (D) Mutants withsupersized LDs, in addition to large and small LDs (yellow arrowhead, yellow arrow, and red arrow, respectively) as exemplified by snf4Δ (left). At the rightside of each panel are indicated the global clustering coefficient (upper) and path length (lower) for each subnetwork (red font), presented over the mean ofvalues from 10,000 generated simulated random networks with the same degree distribution and vertex count as the subnetwork in that panel (green font).Key for diagrams as in Fig 1. Scale bar, 4 μm.
doi:10.1371/journal.pcbi.1004264.g003
Small-World Properties of a Fat Regulation Network
PLOS Computational Biology | DOI:10.1371/journal.pcbi.1004264 July 20, 1969 14 / 27
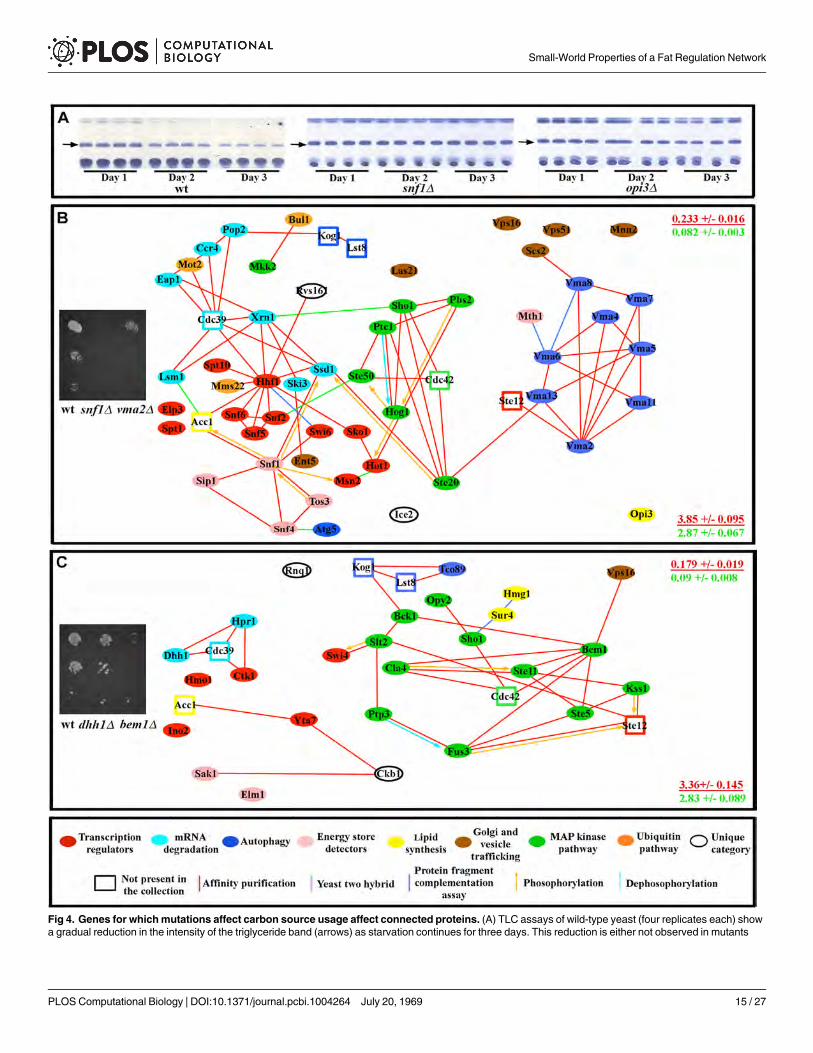
Fig 4. Genes for whichmutations affect carbon source usage affect connected proteins. (A) TLC assays of wild-type yeast (four replicates each) showa gradual reduction in the intensity of the triglyceride band (arrows) as starvation continues for three days. This reduction is either not observed in mutants
Small-World Properties of a Fat Regulation Network
PLOS Computational Biology | DOI:10.1371/journal.pcbi.1004264 July 20, 1969 15 / 27
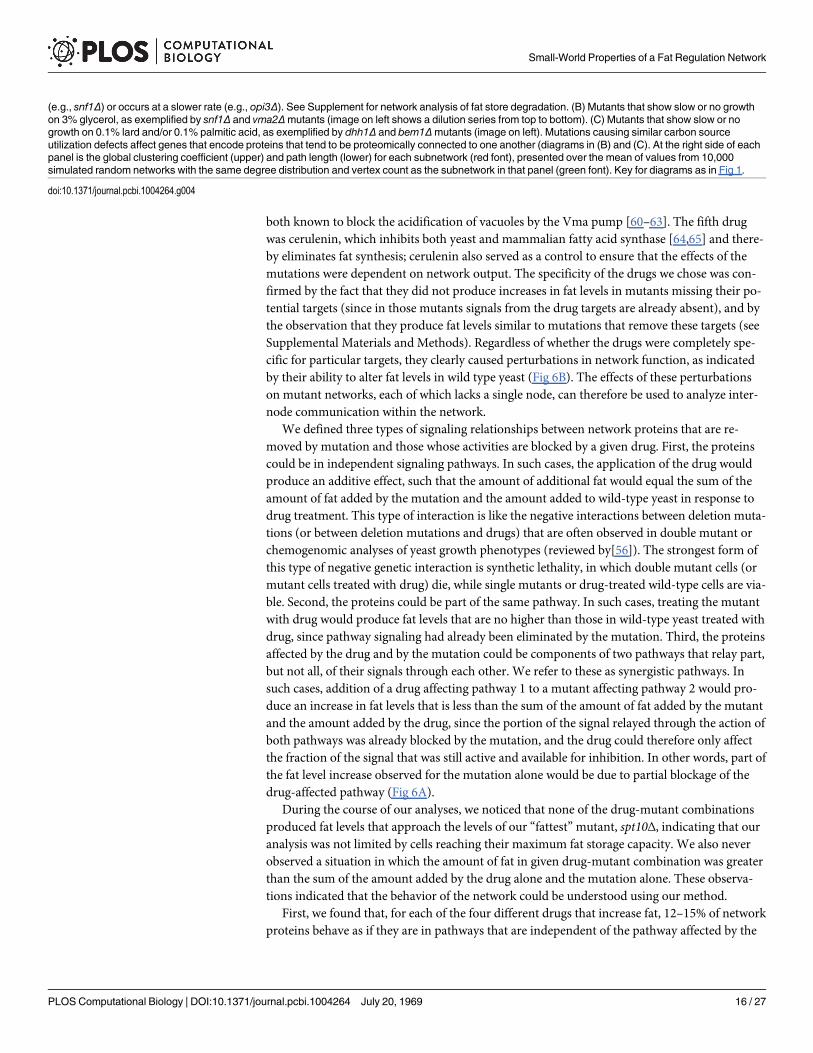
both known to block the acidification of vacuoles by the Vma pump [60–63]. The fifth drugwas cerulenin, which inhibits both yeast and mammalian fatty acid synthase [64,65] and there-by eliminates fat synthesis; cerulenin also served as a control to ensure that the effects of themutations were dependent on network output. The specificity of the drugs we chose was con-firmed by the fact that they did not produce increases in fat levels in mutants missing their po-tential targets (since in those mutants signals from the drug targets are already absent), and bythe observation that they produce fat levels similar to mutations that remove these targets (seeSupplemental Materials and Methods). Regardless of whether the drugs were completely spe-cific for particular targets, they clearly caused perturbations in network function, as indicatedby their ability to alter fat levels in wild type yeast (Fig 6B). The effects of these perturbationson mutant networks, each of which lacks a single node, can therefore be used to analyze inter-node communication within the network.
We defined three types of signaling relationships between network proteins that are re-moved by mutation and those whose activities are blocked by a given drug. First, the proteinscould be in independent signaling pathways. In such cases, the application of the drug wouldproduce an additive effect, such that the amount of additional fat would equal the sum of theamount of fat added by the mutation and the amount added to wild-type yeast in response todrug treatment. This type of interaction is like the negative interactions between deletion muta-tions (or between deletion mutations and drugs) that are often observed in double mutant orchemogenomic analyses of yeast growth phenotypes (reviewed by[56]). The strongest form ofthis type of negative genetic interaction is synthetic lethality, in which double mutant cells (ormutant cells treated with drug) die, while single mutants or drug-treated wild-type cells are via-ble. Second, the proteins could be part of the same pathway. In such cases, treating the mutantwith drug would produce fat levels that are no higher than those in wild-type yeast treated withdrug, since pathway signaling had already been eliminated by the mutation. Third, the proteinsaffected by the drug and by the mutation could be components of two pathways that relay part,but not all, of their signals through each other. We refer to these as synergistic pathways. Insuch cases, addition of a drug affecting pathway 1 to a mutant affecting pathway 2 would pro-duce an increase in fat levels that is less than the sum of the amount of fat added by the mutantand the amount added by the drug, since the portion of the signal relayed through the action ofboth pathways was already blocked by the mutation, and the drug could therefore only affectthe fraction of the signal that was still active and available for inhibition. In other words, part ofthe fat level increase observed for the mutation alone would be due to partial blockage of thedrug-affected pathway (Fig 6A).
During the course of our analyses, we noticed that none of the drug-mutant combinationsproduced fat levels that approach the levels of our “fattest”mutant, spt10Δ, indicating that ouranalysis was not limited by cells reaching their maximum fat storage capacity. We also neverobserved a situation in which the amount of fat in given drug-mutant combination was greaterthan the sum of the amount added by the drug alone and the mutation alone. These observa-tions indicated that the behavior of the network could be understood using our method.
First, we found that, for each of the four different drugs that increase fat, 12–15% of networkproteins behave as if they are in pathways that are independent of the pathway affected by the
(e.g., snf1Δ) or occurs at a slower rate (e.g., opi3Δ). See Supplement for network analysis of fat store degradation. (B) Mutants that show slow or no growthon 3% glycerol, as exemplified by snf1Δ and vma2Δmutants (image on left shows a dilution series from top to bottom). (C) Mutants that show slow or nogrowth on 0.1% lard and/or 0.1% palmitic acid, as exemplified by dhh1Δ and bem1Δmutants (image on left). Mutations causing similar carbon sourceutilization defects affect genes that encode proteins that tend to be proteomically connected to one another (diagrams in (B) and (C). At the right side of eachpanel is the global clustering coefficient (upper) and path length (lower) for each subnetwork (red font), presented over the mean of values from 10,000simulated random networks with the same degree distribution and vertex count as the subnetwork in that panel (green font). Key for diagrams as in Fig 1.
doi:10.1371/journal.pcbi.1004264.g004
Small-World Properties of a Fat Regulation Network
PLOS Computational Biology | DOI:10.1371/journal.pcbi.1004264 July 20, 1969 16 / 27
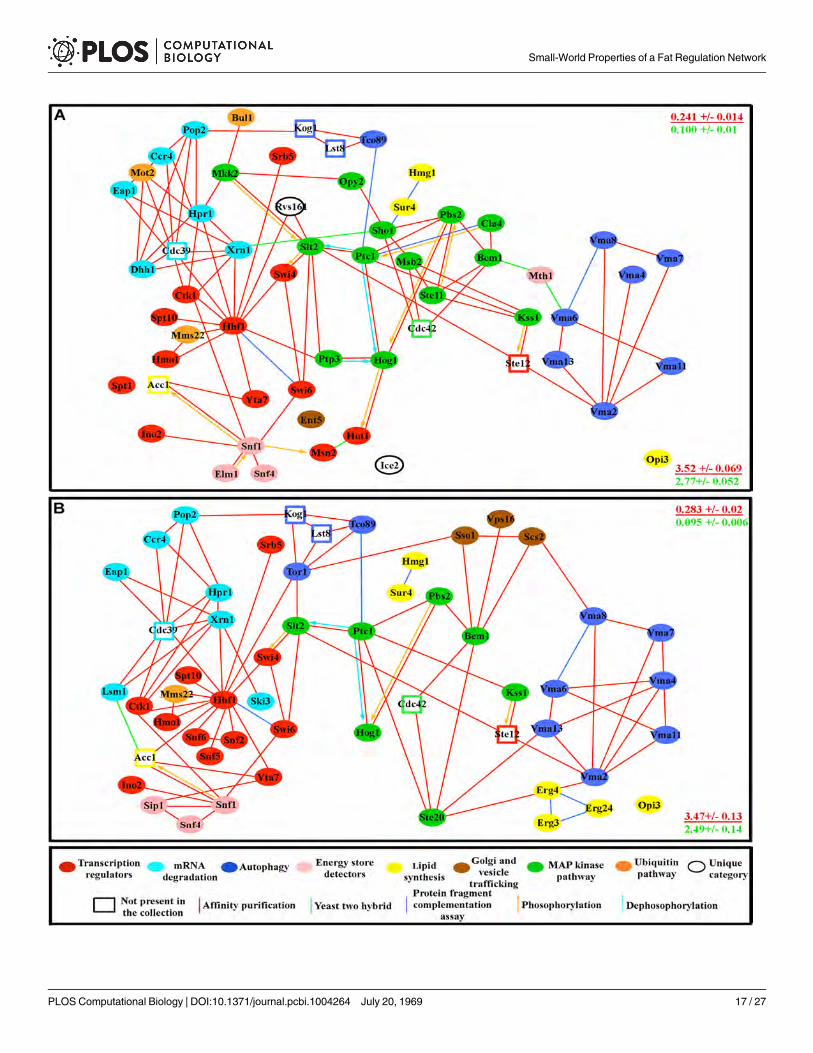
Small-World Properties of a Fat Regulation Network
PLOS Computational Biology | DOI:10.1371/journal.pcbi.1004264 July 20, 1969 17 / 27
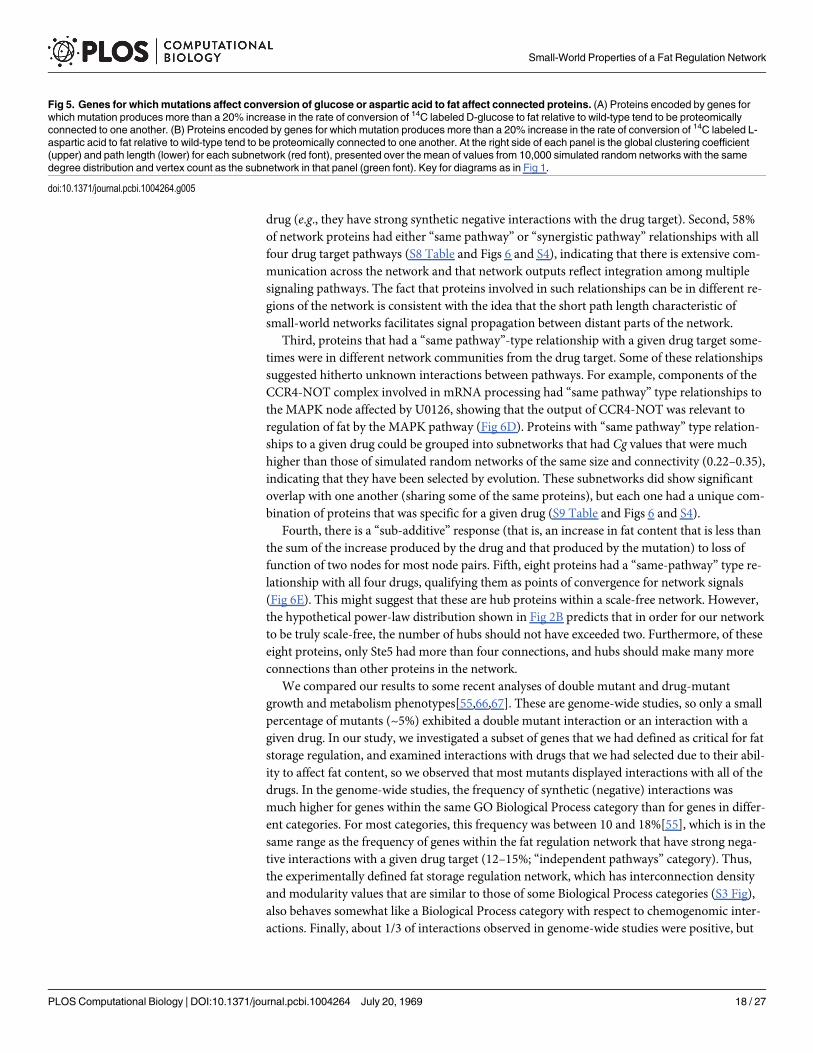
drug (e.g., they have strong synthetic negative interactions with the drug target). Second, 58%of network proteins had either “same pathway” or “synergistic pathway” relationships with allfour drug target pathways (S8 Table and Figs 6 and S4), indicating that there is extensive com-munication across the network and that network outputs reflect integration among multiplesignaling pathways. The fact that proteins involved in such relationships can be in different re-gions of the network is consistent with the idea that the short path length characteristic ofsmall-world networks facilitates signal propagation between distant parts of the network.
Third, proteins that had a “same pathway”-type relationship with a given drug target some-times were in different network communities from the drug target. Some of these relationshipssuggested hitherto unknown interactions between pathways. For example, components of theCCR4-NOT complex involved in mRNA processing had “same pathway” type relationships tothe MAPK node affected by U0126, showing that the output of CCR4-NOT was relevant toregulation of fat by the MAPK pathway (Fig 6D). Proteins with “same pathway” type relation-ships to a given drug could be grouped into subnetworks that had Cg values that were muchhigher than those of simulated random networks of the same size and connectivity (0.22–0.35),indicating that they have been selected by evolution. These subnetworks did show significantoverlap with one another (sharing some of the same proteins), but each one had a unique com-bination of proteins that was specific for a given drug (S9 Table and Figs 6 and S4).
Fourth, there is a “sub-additive” response (that is, an increase in fat content that is less thanthe sum of the increase produced by the drug and that produced by the mutation) to loss offunction of two nodes for most node pairs. Fifth, eight proteins had a “same-pathway” type re-lationship with all four drugs, qualifying them as points of convergence for network signals(Fig 6E). This might suggest that these are hub proteins within a scale-free network. However,the hypothetical power-law distribution shown in Fig 2B predicts that in order for our networkto be truly scale-free, the number of hubs should not have exceeded two. Furthermore, of theseeight proteins, only Ste5 had more than four connections, and hubs should make many moreconnections than other proteins in the network.
We compared our results to some recent analyses of double mutant and drug-mutantgrowth and metabolism phenotypes[55,66,67]. These are genome-wide studies, so only a smallpercentage of mutants (~5%) exhibited a double mutant interaction or an interaction with agiven drug. In our study, we investigated a subset of genes that we had defined as critical for fatstorage regulation, and examined interactions with drugs that we had selected due to their abil-ity to affect fat content, so we observed that most mutants displayed interactions with all of thedrugs. In the genome-wide studies, the frequency of synthetic (negative) interactions wasmuch higher for genes within the same GO Biological Process category than for genes in differ-ent categories. For most categories, this frequency was between 10 and 18%[55], which is in thesame range as the frequency of genes within the fat regulation network that have strong nega-tive interactions with a given drug target (12–15%; “independent pathways” category). Thus,the experimentally defined fat storage regulation network, which has interconnection densityand modularity values that are similar to those of some Biological Process categories (S3 Fig),also behaves somewhat like a Biological Process category with respect to chemogenomic inter-actions. Finally, about 1/3 of interactions observed in genome-wide studies were positive, but
Fig 5. Genes for whichmutations affect conversion of glucose or aspartic acid to fat affect connected proteins. (A) Proteins encoded by genes forwhich mutation produces more than a 20% increase in the rate of conversion of 14C labeled D-glucose to fat relative to wild-type tend to be proteomicallyconnected to one another. (B) Proteins encoded by genes for which mutation produces more than a 20% increase in the rate of conversion of 14C labeled L-aspartic acid to fat relative to wild-type tend to be proteomically connected to one another. At the right side of each panel is the global clustering coefficient(upper) and path length (lower) for each subnetwork (red font), presented over the mean of values from 10,000 simulated random networks with the samedegree distribution and vertex count as the subnetwork in that panel (green font). Key for diagrams as in Fig 1.
doi:10.1371/journal.pcbi.1004264.g005
Small-World Properties of a Fat Regulation Network
PLOS Computational Biology | DOI:10.1371/journal.pcbi.1004264 July 20, 1969 18 / 27
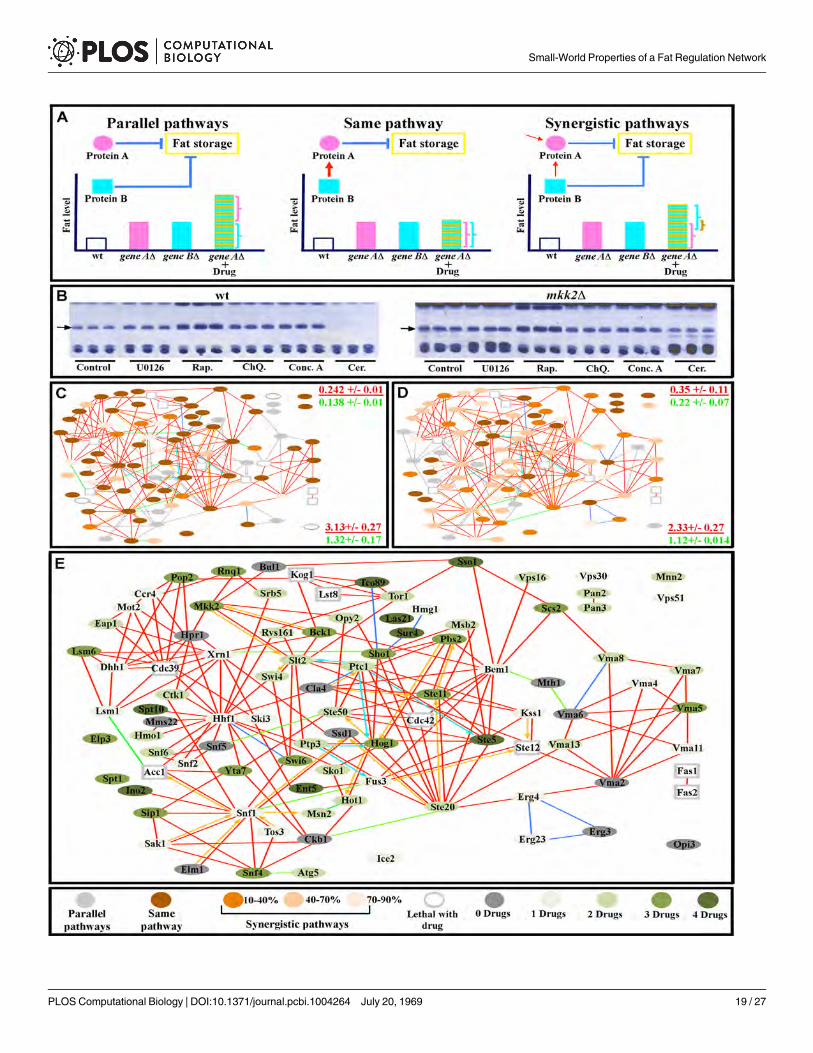
Small-World Properties of a Fat Regulation Network
PLOS Computational Biology | DOI:10.1371/journal.pcbi.1004264 July 20, 1969 19 / 27
we did not detect any positive interactions. This is due to the fact that we only isolated genesfor which mutation increases fat contes, so all of our phenotypes have the same sign. Cellularsignaling pathways, however, contain both positive and negative regulators, and mutation ofregulators with opposite sign can produce phenotypes of opposite sign.
We also compared the results of Rap treatment of fat storage mutants with a study that ex-amined interactions between Rap and all nonessential genes for a different TORC1-dependentphenotype, expression of a DAL80 reporter that is induced by TORC1 inactivation by Rap orstarvation[68]. Of the 63 Rap-specific genes they identified, only 6 (Bck1, Las21, Slt2, Srb5,Swi4, Swi6) were identified in our screen as mutations that increase fat content, suggesting thatfat storage regulation and DAL80 induction are not closely related processes. However, two ofthese common genes (Srb5 and Swi6), increase induction of the DAL80 reporter by Rap[68]and also synergize with Rap to increase fat content (Fig 6 and S8 Table).
DiscussionBy screening the yeast (Saccharomyces cerevisiae) viable deletion collection for mutations af-fecting fat content, we discovered a densely interconnected network of 94 proteins that regu-lates fat storage (Fig 1). From a computational analysis of this network, we derived three majorconclusions. First, the network is not scale-free, and can be best approximated by the Watts-Strogatz model, which has not been previously applied to biological signaling networks (Fig 2).This model can account for the high degree of clustering observed in the experimental network.Second, the importance of an individual protein to network function is dependent on a particu-lar measure of centrality, Katz centrality, which is influenced by the topological relationshipsbetween the test protein and the other proteins within its network community or module (Fig2). Physiological analysis showed that the fat regulation network is divisible into connectedsubnetworks which span community boundaries and affect specific aspects of lipid metabolism(Figs 3–5). Finally, by combining drug perturbations with genetics (chemogenomics), weshowed that there is extensive cross-talk between the different signaling pathways representedin the network (Fig 6).
The small-world topology endows the network with useful features. Its short path lengthproperty allows distant nodes to communicate with each other through a small number ofsteps. Its topological parameters are robust with respect to removal of any one protein. Inscale-free networks, the removal of highly connected hubs will cause substantial changes in net-work topology and may fragment them into unconnected subnetworks [69–71], while the ab-sence of modular structure in the Erdos-Renyi model makes it inconsistent with the formationof biological networks that must receive different types of inputs and couple them tounique outputs.
Fig 6. Internode communication patterns deduced from drug-mutant interactions. (A) Representations of signaling relationships between drug targetsand mutant genes. In the diagrams, gene A encodes protein A, while gene B encodes protein B, which is the target of the drug. (B) TLC assays of wild-type(wt) yeast (three replicates each) showing the impact of different drug treatments on triglyceride bands (arrows). All mutants were subjected to the sametreatments and analyzed in the same manner, as exemplified by the three replicas ofmkk2Δ for each drug (note that U0126, which targets MAPKKs, does notincrease fat levesl inmkk2Δ cells relative to untreated mutant cells). (C-D) Networks of interactions between mutants and U0126 (C) and Rap (D). Proteinnames are given in the corresponding larger diagram in (E). Note that the majority of proteins have signaling interactions with the drugs that range from“same pathway” (no enhancement of drug effect by mutation; dark brown), to different degrees of synergism (enhancement of drug effect by mutation,indicated by different shades of light brown), and there are fewer cases of parallel pathway (independent) relationships, in which the drug and mutant effectsare additive (light grey). These parallel pathway relationships are like the synthetic negative interactions seen in double mutant studies. Corresponding datafor ChQ., Conc. A, and Cer. are in S4 Fig. At the right side of panels (C) and (D) are indicated the global clustering coefficient (upper) and path length (lower)for a subnetwork of all proteins having a “same pathway” relationship to that drug (red font), presented over the mean of values from 10,000 simulatedrandom networks with the same degree distribution and vertex count (green font). (E) Diagram of same pathway signaling relationships between drugs andnetwork proteins. The circle color represents the number of drugs with which a protein has a same pathway relationship.
doi:10.1371/journal.pcbi.1004264.g006
Small-World Properties of a Fat Regulation Network
PLOS Computational Biology | DOI:10.1371/journal.pcbi.1004264 July 20, 1969 20 / 27
Our results also show that the importance of a protein to network function is dependent onits Katz centrality score (Fig 2). The Katz centrality of a node is determined by the number ofshortest paths that pass through it to all other nodes in the network, with penalties assigned toconnections to distant nodes (nodes that are connected to the node of interest only through aproximal node). The reason that this type of centrality gives the best prediction of a protein’simportance to the function of the fat regulation network may be due to the fact that it combinesthe local attributes of a node within its community with the position of that community withinthe network as a whole. As such, it is suited to modular/community based networks, and wepredict that future analysis of other such networks will reveal that some of the most importantproteins will be identifiable by their Katz centrality scores. In the fat regulation network, theimportance of some of the proteins with high Katz centrality can be explained based on theirknown roles in the module to which they belong. Two examples are Bem1, which is a MAP ki-nase pathway scaffolding protein [72,73], and Snf1, which is the catalytic subunit of the AMPKcomplex [29,31].
By analyzing other phenotypes associated with alterations in fat storage, such as LD mor-phology and utilization of carbon sources, we further demonstrate that the network can be di-vided into subnetworks that span molecular categories and modules, but affect specific aspectsof lipid metabolism (Figs 3–5). All subnetworks contain proteins that have connections thatspan modular boundaries.
To examine whether the topological features described above are associated with biological-ly relevant properties, we examined signal propagation within the network by combining ge-netics and pharmacology (Fig 6). The results indicate that the network has a sub-additiveresponse to perturbation, because the blockage of two pathways or proteins by a drug and amutation usually produces effects that are smaller than the sum of those caused by the drugand the mutation individually. Of course, the network is not immune to alteration; the removalof a protein from the network does produce an increase in fat levels, since that is how the net-work was defined. Nevertheless, the attenuated response of the network to blockage of multiplenodes is consistent with the idea that network structure buffers it against external or internalperturbations. The fact that proteins in distant parts of the network often interact with eachother, as indicated by the drug-mutant experiments, are in agreement with the short pathlength and small-world properties of the Watts-Strogatz model.
Unlike Erdos-Renyi networks, Watts-Strogatz networks are modular. In neural networks,modularity is known to facilitate multifunctionality, which can divide large tasks into smallercompartmentalized subtasks that can be executed efficiently [74–76]. Multifunctionality alsoallows neural networks to integrate different inputs and generate diverse output responses. Theyeast fat regulation network has properties that are analogous to multifunctionality in modularneural networks, because it takes in multiple inputs, processes them, and generates multipleoutputs in response. The integrated input of the network represents an evaluation of the avail-able nutrients and energy stores. It is provided by the glucose level detection function of Mth1and the AMP and starvation detection mechanisms of MAP kinase and AMPK pathways. Thenetwork then generates anabolic and catabolic outputs that are appropriate to those inputs.Our analysis of mutant phenotypes indicates that these outputs affect many aspects of cellphysiology, such as LD morphology, mitochondrial function, and fat store utilization.
Biological signaling networks often contain hub-like elements, and some researchers haveproposed that biological networks with hubs are best described by scale-free models[46]. How-ever, real interaction network datasets that have been tested do not fit power-law P(k) distribu-tions, which are diagnostic of scale-free networks [47,48]. The P(k) distributions of proteins inyeast proteomic networks generated by the two-hybrid method have been subjected to mathe-matical analysis, and a variety of models were tested, including Poisson and binomial
Small-World Properties of a Fat Regulation Network
PLOS Computational Biology | DOI:10.1371/journal.pcbi.1004264 July 20, 1969 21 / 27
distributions (characteristic of Erdos-Renyi and Watts-Strogatz networks) and power-law dis-tributions (characteristic of scale-free networks) were tested. None of the models could be de-finitively proven or ruled out [18,77].
Almost all of the proteomic connections used to define the fat storage regulation networkwere identified by affinity purification/coprecipitation methods, which provide a reliablemeans to identify abundant and stable protein complexes that exist in vivo [7,8,10,12,78,79].Our computational analysis clearly shows that this network’s topology is best approximated bythe Watts-Strogatz small-world model (Fig 2B). This topology has significant regulatory ad-vantages that are correlated with biologically relevant features, and we suggest that mathemati-cal analysis of other proteomic networks defined by a combination of genetics and affinitypurification methods may reveal that many signaling networks within cells are of this type.
Genetics and fat assaysA collection of haploidMATa nonessential yeast deletion strains was purchased from ThermoScientific. The strains were transferred into 150 μl YPD media in a 96 well-plate and grown forthree days at 30°C. 5 μl of the resulting culture was respectively transferred into 150 μl syntheticcomplete dextrose media [80] in a 96 well assay plates (black wall with transparent bottom)and grown for two days at 30° C. After the growth period, formaldehyde was added to eachwell to a final concentration of 4%, followed by incubation at room temperature for 20 minutes.The plates were then spun down at 3000 rpm for two minutes and the supernatant was dis-carded. The pellets were then resuspended in 150 μl PBS containing 0.125 μg/ml Nile Red and0.003 μMDAPI, followed by incubation at room temperature for 20 minutes. Fluorescence wasmeasured using a spectrophotometer for both Nile Red (Ex485/Em590) and DAPI (Ex 358/Em440). Results were plotted as a ratio between the Nile Red and DAPI signals. Any positivelines were regrown in eight replicas, of which 4 were stained as above; the others were pro-cessed in the same manner, except that Nile Red and DAPI were not added. The latter groupwas used to measure autofluorescence, the value of which was later subtracted from the finalreading. Only lines that remained positive were taken to the second round of selection.
Lines that passed both the 96-well plate assay and the histological examination were subjectedto the TLC assay. In this assay cultures were grown in complete synthetic 2% dextrose media fortwo days at 30° C, and 20 ml normalized culture of OD600 = 1 was obtained. Protein from 1ml ofOD600 = 1 culture was extracted and measured and reading was used for additional normalizationstep, and we rarely observe a situation in which cultures with the same OD600 ending up having adifferent protein measurements. The twice-normalized culture was then spun down, and the re-sulting pellets were suspended in 200 μl 2:1 chloroform: methanol mixture, and three glass beads(2 mm) were added to each tube. The samples were subjected to continuous agitation for onehour, and vortexed three times (1 minute each) during that period. The samples were then spundown for 2 min. at maximum speed and the lower phase was isolated and transferred to a freshtube. The isolated lower phase was spun down again and run on a TLC plate as described [20].
For confocal microscopy, yeast were grown on synthetic complete 2% dextrose media at30° C for two days. The samples were then spun down and processed for microscopy [81].
For additional information see S1 Text (Supplementary Materials and Methods), whichcontains methods for starvation studies, growth on different carbon sources, drug treatment,and mathematical analysis.
Supporting InformationS1 Fig. Histogram of the number of edges in N = 200 randomly sampled subsets of theyeast proteome. To test whether or not the interconnection density of the fat storage network
Small-World Properties of a Fat Regulation Network
PLOS Computational Biology | DOI:10.1371/journal.pcbi.1004264 July 20, 1969 22 / 27
is significant, we compared its statistics to those of networks of comparable size chosen by ran-dom selection from the yeast proteome. These random sub-networks all had far less connectiv-ity (average 24.8 edges, standard deviation 11.5) than the fat storage network (203 total edges).Almost all of these randomly sampled networks lacked sufficient connectivity to calculatemeaningful network statistics such as shortest path length and global clustering coefficient.(TIF)
S2 Fig. Synergy between the Fus3 and Kss1 MAPKs, and the effects of TORC1 mutationsand rapamycin in yeast. (A) fus3,kss1 double mutants have a higher fat levels than either singlemutant. S is 4 μg lard standard, black arrow is triglyceride band, 4 μl volume was used for eachsample lane. (B) Mutations in genes encoding TORC1 components (tor1 and tco89) cause anincrease in fat storage levels (upper panel), while mutations in genes encoding TORC2 compo-nents (avo2 and bit61) do not (middle panel). Treatment of wild type yeast with the TORC1 in-hibitor rapamycin causes an increase in fat storage as compared to vehicle only control (lowerpanel). S is 4 μg lard standard, black arrow is triglyceride band, 4 μl volume was used for eachsample lane.(TIF)
S3 Fig. Histograms of the relationships between fat storage regulation network and allyeast GO Biological Process categories. The four histograms show edge density (# edges/#possible edges), cluster coefficient (Cg), modularity (M), and the number of nodes (proteins)for each GO Biological Process category. In each histogram the value of the parameter for theexperimental fat storage regulation network is shown by a vertical red line.(JPG)
S4 Fig. Internode communication deduced from drug-mutant interactions. (A) Representa-tions of signaling relationships between drug targets and mutant genes. Networks of interac-tions between mutants and ChQ, Con. A, and Cer. Protein names are given in larger diagramin Fig 6E. Note that the majority of proteins have signaling interactions with the drugs thatrange from “same pathway” (no enhancement of drug effect by mutation; dark brown), to dif-ferent degrees of synergism (enhancement of drug effect by mutation, indicated by differentshades of light brown), and there are only a few cases of non-interacting parallel (independent)relationships, in which the drug and mutant effects are additive (light grey). At the right side ofpanels are indicated the global clustering coefficient (upper) and path length (lower) for a sub-network of all proteins having a same pathway relationship to that drug (red font), presentedover the mean of values from 10,000 generated simulated random networks with the same de-gree distribution and vertex count (green font).(TIF)
S1 Text. Supplementary materials and methods.(DOCX)
S1 Table. TLC quantification of fat levels in yeast mutants.(XLSX)
S2 Table. Connection matrix of nodes and edges in the network.(XLSX)
S3 Table. GO term classifications that are significantly enriched for network proteins.(XLS)
Small-World Properties of a Fat Regulation Network
PLOS Computational Biology | DOI:10.1371/journal.pcbi.1004264 July 20, 1969 23 / 27
S4 Table. Mathematical analysis and computational modeling of the different network to-pological parameters shown in Fig 2.(XLSX)
S5 Table. Mathematical analysis and computational modeling of the LD morphology sub-networks shown in Fig 3.(XLSX)
S6 Table. Mathematical analysis and computational modeling of the carbon source utiliza-tion subnetworks shown in Fig 4.(XLSX)
S7 Table. Mathematical analysis and computational modeling of subnetworks of proteinsfor which mutations affect conversion of glucose or aspartic acid to fat as shown in Fig 5.(XLSX)
S8 Table. Quantification of the increase in fat levels produced by drugs in mutants vs. wild-type, as shown in Fig 6.(XLSX)
S9 Table. Mathematical analysis and computational modeling of the “same pathway” sub-networks in Fig 6.(XLSX)
AcknowledgmentsWe thank Robert Oania, Christopher Frick, Mark Budde, Erich Schwarz, and Eric Forgostonfor helpful discussions and comments on the manuscript.
Author ContributionsConceived and designed the experiments: BAA KZ. Performed the experiments: BAA PA COSG NO. Analyzed the data: BAA KZ CO SG NO. Contributed reagents/materials/analysistools: BAA CO SG NO. Wrote the paper: BAA KZ CO NO.
References1. Lin C, Cho Y, HwangW, Pei P (2007) Clustering methods in protein-protein interaction network. In;
Xiaohua Hu, Yi Pan editors. Knowledge Discovery in Bioinformatics: Techniques, Methods, and Appli-cations: JohnWiley & Sons.
2. Scherens B, Goffeau A (2004) The uses of genome-wide yeast mutant collections. Genome Biol 5:229. PMID: 15239820
3. Uetz P, Giot L, Cagney G, Mansfield TA, Judson RS, et al. (2000) A comprehensive analysis of protein-protein interactions in Saccharomyces cerevisiae. Nature 403: 623–627. PMID: 10688190
4. Tarassov K, Messier V, Landry CR, Radinovic S, Serna Molina MM, et al. (2008) An in vivo map of theyeast protein interactome. Science 320: 1465–1470. doi: 10.1126/science.1153878 PMID: 18467557
5. Ptacek J, Devgan G, Michaud G, Zhu H, Zhu X, et al. (2005) Global analysis of protein phosphorylationin yeast. Nature 438: 679–684. PMID: 16319894
6. Breitkreutz A, Choi H, Sharom JR, Boucher L, Neduva V, et al. (2010) A global protein kinase and phos-phatase interaction network in yeast. Science 328: 1043–1046. doi: 10.1126/science.1176495 PMID:20489023
7. Gavin AC, Bosche M, Krause R, Grandi P, Marzioch M, et al. (2002) Functional organization of theyeast proteome by systematic analysis of protein complexes. Nature 415: 141–147. PMID: 11805826
8. Ho Y, Gruhler A, Heilbut A, Bader GD, Moore L, et al. (2002) Systematic identification of protein com-plexes in Saccharomyces cerevisiae by mass spectrometry. Nature 415: 180–183. PMID: 11805837
Small-World Properties of a Fat Regulation Network
PLOS Computational Biology | DOI:10.1371/journal.pcbi.1004264 July 20, 1969 24 / 27
9. Ito T, Chiba T, Ozawa R, Yoshida M, Hattori M, et al. (2001) A comprehensive two-hybrid analysis to ex-plore the yeast protein interactome. Proc Natl Acad Sci U S A 98: 4569–4574. PMID: 11283351
10. Pu S, Wong J, Turner B, Cho E, Wodak SJ (2009) Up-to-date catalogues of yeast protein complexes.Nucleic Acids Res 37: 825–831. doi: 10.1093/nar/gkn1005 PMID: 19095691
11. Cagney G (2009) Interaction networks: lessons from large-scale studies in yeast. Proteomics 9: 4799–4811. doi: 10.1002/pmic.200900177 PMID: 19743423
12. Reguly T, Breitkreutz A, Boucher L, Breitkreutz BJ, Hon GC, et al. (2006) Comprehensive curation andanalysis of global interaction networks in Saccharomyces cerevisiae. J Biol 5: 11. PMID: 16762047
13. Shoemaker BA, Panchenko AR (2007) Deciphering protein-protein interactions. Part I. Experimentaltechniques and databases. PLoS Comput Biol 3: e42. PMID: 17397251
14. Janjic V, Sharan R, Przulj N (2014) Modelling the yeast interactome. Sci Rep 4: 4273. doi: 10.1038/srep04273 PMID: 24589662
15. Yaveroglu ON, Malod-Dognin N, Davis D, Levnajic Z, Janjic V, et al. (2014) Revealing the hidden lan-guage of complex networks. Sci Rep 4: 4547. doi: 10.1038/srep04547 PMID: 24686408
16. Jeong H, Mason SP, Barabasi AL, Oltvai ZN (2001) Lethality and centrality in protein networks. Nature411: 41–42. PMID: 11333967
17. Batada NN, Hurst LD, Tyers M (2006) Evolutionary and physiological importance of hub proteins. PLoSComput Biol 2: e88. PMID: 16839197
18. Hahn MW, Kern AD (2005) Comparative genomics of centrality and essentiality in three eukaryotic pro-tein-interaction networks. Mol Biol Evol 22: 803–806. PMID: 15616139
19. Watts DJ, Strogatz SH (1998) Collective dynamics of 'small-world' networks. Nature 393: 440–442.PMID: 9623998
20. Al-Anzi B, Zinn K (2010) Colorimetric measurement of triglycerides cannot provide an accurate mea-sure of stored fat content in Drosophila. PLoS One 5: e12353. doi: 10.1371/journal.pone.0012353PMID: 20808765
21. Beller M, Sztalryd C, Southall N, Bell M, Jackle H, et al. (2008) COPI complex is a regulator of lipid ho-meostasis. PLoS Biol 6: e292. doi: 10.1371/journal.pbio.0060292 PMID: 19067489
22. Guo Y, Walther TC, Rao M, Stuurman N, Goshima G, et al. (2008) Functional genomic screen revealsgenes involved in lipid-droplet formation and utilization. Nature 453: 657–661. doi: 10.1038/nature06928 PMID: 18408709
23. Nandy SK, Jouhten P, Nielsen J (2010) Reconstruction of the yeast protein-protein interaction networkinvolved in nutrient sensing and global metabolic regulation. BMC Syst Biol 4: 68. doi: 10.1186/1752-0509-4-68 PMID: 20500839
24. Cui Y, Ramnarain DB, Chiang YC, Ding LH, McMahon JS, et al. (2008) Genome wide expression anal-ysis of the CCR4-NOT complex indicates that it consists of three modules with the NOTmodule control-ling SAGA-responsive genes. Mol Genet Genomics 279: 323–337. doi: 10.1007/s00438-007-0314-1PMID: 18214544
25. Cullen PJ, Sprague GF Jr. (2012) The regulation of filamentous growth in yeast. Genetics 190: 23–49.doi: 10.1534/genetics.111.127456 PMID: 22219507
26. Denis CL, Malvar T (1990) The CCR4 gene from Saccharomyces cerevisiae is required for both nonfer-mentative and spt-mediated gene expression. Genetics 124: 283–291. PMID: 2407614
27. Loewith R, Hall MN (2011) Target of rapamycin (TOR) in nutrient signaling and growth control. Genetics189: 1177–1201. doi: 10.1534/genetics.111.133363 PMID: 22174183
28. Rensing L, Ruoff P (2009) How can yeast cells decide between three activated MAP kinase pathways?A model approach. J Theor Biol 257: 578–587. PMID: 19322936
29. Busti S, Coccetti P, Alberghina L, Vanoni M (2010) Glucose signaling-mediated coordination of cellgrowth and cell cycle in Saccharomyces cerevisiae. Sensors (Basel) 10: 6195–6240. doi: 10.3390/s100606195 PMID: 22219709
30. Karhumaa K, Wu B, Kielland-Brandt MC (2010) Conditions with high intracellular glucose inhibit sens-ing through glucose sensor Snf3 in Saccharomyces cerevisiae. J Cell Biochem 110: 920–925. doi: 10.1002/jcb.22605 PMID: 20564191
31. Hedbacker K, Carlson M (2008) SNF1/AMPK pathways in yeast. Front Biosci 13: 2408–2420. PMID:17981722
32. Mijaljica D, Prescott M, Devenish RJ (2011) V-ATPase engagement in autophagic processes. Autop-hagy 7: 666–668. PMID: 21494095
33. Pons P, Latapy M (2006) Computing communities in large networks using random walks. Journal ofGraph Algorithms and Applications 10: 191–218.
Small-World Properties of a Fat Regulation Network
PLOS Computational Biology | DOI:10.1371/journal.pcbi.1004264 July 20, 1969 25 / 27
34. Lavallee-AdamM, Coulombe B, Blanchette M (2010) Detection of locally over-represented GO terms inprotein-protein interaction networks. J Comput Biol 17: 443–457. doi: 10.1089/cmb.2009.0165 PMID:20377456
35. Kohlwein SD (2010) Triacylglycerol homeostasis: insights from yeast. J Biol Chem 285: 15663–15667.doi: 10.1074/jbc.R110.118356 PMID: 20231294
36. Kohlwein SD (2010) Obese and anorexic yeasts: experimental models to understand the metabolicsyndrome and lipotoxicity. Biochim Biophys Acta 1801: 222–229. doi: 10.1016/j.bbalip.2009.12.016PMID: 20056167
37. Szymanski KM, Binns D, Bartz R, Grishin NV, Li WP, et al. (2007) The lipodystrophy protein seipin isfound at endoplasmic reticulum lipid droplet junctions and is important for droplet morphology. ProcNatl Acad Sci U S A 104: 20890–20895. PMID: 18093937
38. Fei W, Shui G, Gaeta B, Du X, Kuerschner L, et al. (2008) Fld1p, a functional homologue of human sei-pin, regulates the size of lipid droplets in yeast. J Cell Biol 180: 473–482. doi: 10.1083/jcb.200711136PMID: 18250201
39. Fei W, Yang H (2012) Genome-wide screens for gene products regulating lipid droplet dynamics. Meth-ods Cell Biol 108: 303–316. doi: 10.1016/B978-0-12-386487-1.00014-6 PMID: 22325608
40. Al-Anzi B, Zinn K (2011) Genetics of fat storage in flies and worms: what went wrong? Front Genet 2:87. doi: 10.3389/fgene.2011.00087 PMID: 22303381
41. Vachova L, Stovicek V, Hlavacek O, Chernyavskiy O, Stepanek L, et al. (2011) Flo11p, drug effluxpumps, and the extracellular matrix cooperate to form biofilm yeast colonies. J Cell Biol 194: 679–687.doi: 10.1083/jcb.201103129 PMID: 21875945
42. NewmanME (2003) The structure and function of complex networks. SIAM Review 45: 67–256.
43. NewmanME (2006) Modularity and community structure in networks. Proc Natl Acad Sci U S A 103:8577–8582. PMID: 16723398
44. Erdős P, Rényi A (1960) On the evolution of random graphs. Publications of THEMATHEMATICAL IN-STITUTE OF THE HUNGARIAN ACADEMYOF SCIENCES. pp. 17–61.
45. Barabasi AL, Albert R (1999) Emergence of scaling in random networks. Science 286: 509–512.PMID: 10521342
46. Nacher JC, Akutsu T (2007) Recent progress on the analysis of power-law features in complex cellularnetworks. Cell Biochem Biophys 49: 37–47. PMID: 17873338
47. Khanin R, Wit E (2006) How scale-free are biological networks. J Comput Biol 13: 810–818. PMID:16706727
48. Lima-Mendez G, van Helden J (2009) The powerful law of the power law and other myths in network bi-ology. Mol Biosyst 5: 1482–1493. doi: 10.1039/b908681a PMID: 20023717
49. Borgatti S, Martin GR (2005) A Graph-Theoretic Perspective on Centrality. Social Networks 28: 466–484.
50. Katz L (1953) A New Status Index Derived from Sociometric Index. Psychometrika 18: 39–43.
51. Newman N (2005) A measure of betweenness centrality based on random walks. Social Networks 27:39–54.
52. Venters BJ, Wachi S, Mavrich TN, Andersen BE, Jena P, et al. (2011) A comprehensive genomic bind-ing map of gene and chromatin regulatory proteins in Saccharomyces. Mol Cell 41: 480–492. doi: 10.1016/j.molcel.2011.01.015 PMID: 21329885
53. Dimmer KS, Fritz S, Fuchs F, Messerschmitt M, Weinbach N, et al. (2002) Genetic basis of mitochondri-al function and morphology in Saccharomyces cerevisiae. Mol Biol Cell 13: 847–853. PMID: 11907266
54. Lockshon D, Olsen CP, Brett CL, Chertov A, Merz AJ, et al. (2012) Rho signaling participates in mem-brane fluidity homeostasis. PLoS One 7: e45049. doi: 10.1371/journal.pone.0045049 PMID:23071506
55. Costanzo M, Baryshnikova A, Bellay J, Kim Y, Spear ED, et al. (2010) The genetic landscape of a cell.Science 327: 425–431. doi: 10.1126/science.1180823 PMID: 20093466
56. Giaever G, Nislow C (2014) The yeast deletion collection: a decade of functional genomics. Genetics197: 451–465. doi: 10.1534/genetics.114.161620 PMID: 24939991
57. Fortney K, Xie W, Kotlyar M, Griesman J, Kotseruba Y, et al. (2013) NetwoRx: connecting drugs to net-works and phenotypes in Saccharomyces cerevisiae. Nucleic Acids Res 41: D720–727. doi: 10.1093/nar/gks1106 PMID: 23203867
58. Duncia JV, Santella JB 3rd, Higley CA, Pitts WJ, Wityak J, et al. (1998) MEK inhibitors: the chemistryand biological activity of U0126, its analogs, and cyclization products. Bioorg Med Chem Lett 8: 2839–2844. PMID: 9873633
Small-World Properties of a Fat Regulation Network
PLOS Computational Biology | DOI:10.1371/journal.pcbi.1004264 July 20, 1969 26 / 27
59. Vohra PK, Puri V, Thomas CF Jr. (2003) Complementation and characterization of the Pneumocystiscarinii MAPK, PCM. FEBS Lett 551: 139–146. PMID: 12965219
60. Drose S, Bindseil KU, Bowman EJ, Siebers A, Zeeck A, et al. (1993) Inhibitory effect of modified bafilo-mycins and concanamycins on P- and V-type adenosinetriphosphatases. Biochemistry 32: 3902–3906. PMID: 8385991
61. Bowman EJ, Bowman BJ (2005) V-ATPases as drug targets. J Bioenerg Biomembr 37: 431–435.PMID: 16691478
62. Johnson RM, Allen C, Melman SD, Waller A, Young SM, et al. (2010) Identification of inhibitors of vacu-olar proton-translocating ATPase pumps in yeast by high-throughput screening flow cytometry. AnalBiochem 398: 203–211. doi: 10.1016/j.ab.2009.12.020 PMID: 20018164
63. Shao E, Forgac M (2004) Involvement of the nonhomologous region of subunit A of the yeast V-ATPase in coupling and in vivo dissociation. J Biol Chem 279: 48663–48670. PMID: 15355963
64. Ohno T, Awaya J, Kesado T, Nomura S, Omura S (1974) Mechanism of action of CM-55, a syntheticanalogue of the antilipogenic antibiotic cerulenin. Antimicrob Agents Chemother 6: 387–392. PMID:4157441
65. Pultz D, Bennetzen MV, Rodkaer SV, Zimmermann C, Enserink JM, et al. (2012) Global mapping ofprotein phosphorylation events identifies Ste20, Sch9 and the cell-cycle regulatory kinases Cdc28/Pho85 as mediators of fatty acid starvation responses in Saccharomyces cerevisiae. Mol Biosyst 8:796–803. doi: 10.1039/c2mb05356j PMID: 22218487
66. Szappanos B, Kovacs K, Szamecz B, Honti F, Costanzo M, et al. (2011) An integrated approach tocharacterize genetic interaction networks in yeast metabolism. Nat Genet 43: 656–662. doi: 10.1038/ng.846 PMID: 21623372
67. Lee AY, St Onge RP, Proctor MJ, Wallace IM, Nile AH, et al. (2014) Mapping the cellular response tosmall molecules using chemogenomic fitness signatures. Science 344: 208–211. doi: 10.1126/science.1250217 PMID: 24723613
68. Neklesa TK, Davis RW (2009) A genome-wide screen for regulators of TORC1 in response to aminoacid starvation reveals a conserved Npr2/3 complex. PLoS Genet 5: e1000515. doi: 10.1371/journal.pgen.1000515 PMID: 19521502
69. Albert R, Jeong H, Barabasi AL (2000) Error and attack tolerance of complex networks. Nature 406:378–382. PMID: 10935628
70. Cohen R, Erez K, ben-Avraham D, Havlin S (2000) Resilience of the internet to random breakdowns.Phys Rev Lett 85: 4626–4628. PMID: 11082612
71. Cohen R, Erez K, ben-Avraham D, Havlin S (2001) Breakdown of the internet under intentional attack.Phys Rev Lett 86: 3682–3685. PMID: 11328053
72. Bose I, Irazoqui JE, Moskow JJ, Bardes ES, Zyla TR, et al. (2001) Assembly of scaffold-mediated com-plexes containing Cdc42p, the exchange factor Cdc24p, and the effector Cla4p required for cell cycle-regulated phosphorylation of Cdc24p. J Biol Chem 276: 7176–7186. PMID: 11113154
73. Takaku T, Ogura K, Kumeta H, Yoshida N, Inagaki F (2010) Solution structure of a novel Cdc42 bindingmodule of Bem1 and its interaction with Ste20 and Cdc42. J Biol Chem 285: 19346–19353. doi: 10.1074/jbc.M110.116749 PMID: 20410294
74. Happel B, Murre J (1994) The Design and Evolution of Modular Neural Network Architectures. NeuralNetworks 7: 985–1004.
75. Hubel DH, Livingstone MS (1990) Color and contrast sensitivity in the lateral geniculate body and pri-mary visual cortex of the macaquemonkey. J Neurosci 10: 2223–2237. PMID: 2198331
76. Azam F (2000) Biologically Inspired Modular Neural Networks. In: Tech V, editor.
77. Stumpf MP, Wiuf C, May RM (2005) Subnets of scale-free networks are not scale-free: sampling prop-erties of networks. Proc Natl Acad Sci U S A 102: 4221–4224. PMID: 15767579
78. Sprinzak E, Sattath S, Margalit H (2003) How reliable are experimental protein-protein interaction data?J Mol Biol 327: 919–923. PMID: 12662919
79. Yu X, Ivanic J, Wallqvist A, Reifman J (2009) A novel scoring approach for protein co-purification datareveals high interaction specificity. PLoS Comput Biol 5: e1000515. doi: 10.1371/journal.pcbi.1000515PMID: 19779545
80. Roskams J, Rodgers L (2002) Lab Ref: A handbook of recipes, reagent, and other reference tools foruse at the bench: Cold Spring Harbor Laboratory Press.
81. Wolinski H, Bredies K, Kohlwein SD (2012) Quantitative imaging of lipid metabolism in yeast: from 4Danalysis to high content screens of mutant libraries. Methods Cell Biol 108: 345–365. doi: 10.1016/B978-0-12-386487-1.00016-X PMID: 22325610
Small-World Properties of a Fat Regulation Network
PLOS Computational Biology | DOI:10.1371/journal.pcbi.1004264 July 20, 1969 27 / 27
Related Documents