ANALYZING AND VISUALIZING CORRESPONDENCE NETWORKS FOR BROWSABLE INTERFACES Scott Weingart Cyberinfrastructure for Network Science Center Information Visualization Laboratory Indiana Philosophy Ontology Project School of Library and Information Science Department of History and Philosophy of Science Indiana University, Bloomington, IN http://www.scottbot.net Thanks to Katy Borner, The Sci2 Team, and Huygens ING. Representing The Republic of Letters, 6/30/2011-7/1/2011 Huygens ING – Institute for Dutch History The Hague, The Netherlands 10:50-12:20 on July 1, 2011

ANALYZING AND VISUALIZING CORRESPONDENCE NETWORKS FOR BROWSABLE INTERFACES Scott Weingart
Dec 31, 2015
ANALYZING AND VISUALIZING CORRESPONDENCE NETWORKS FOR BROWSABLE INTERFACES Scott Weingart Cyberinfrastructure for Network Science Center Information Visualization Laboratory Indiana Philosophy Ontology Project School of Library and Information Science - PowerPoint PPT Presentation
Welcome message from author
This document is posted to help you gain knowledge. Please leave a comment to let me know what you think about it! Share it to your friends and learn new things together.
Transcript
ANALYZING AND VISUALIZINGCORRESPONDENCE NETWORKS FOR BROWSABLE INTERFACES
Scott WeingartCyberinfrastructure for Network Science CenterInformation Visualization LaboratoryIndiana Philosophy Ontology Project
School of Library and Information ScienceDepartment of History and Philosophy of Science
Indiana University, Bloomington, INhttp://www.scottbot.net
Thanks to Katy Borner, The Sci2 Team, and Huygens ING.
Representing The Republic of Letters, 6/30/2011-7/1/2011Huygens ING – Institute for Dutch HistoryThe Hague, The Netherlands
10:50-12:20 on July 1, 2011
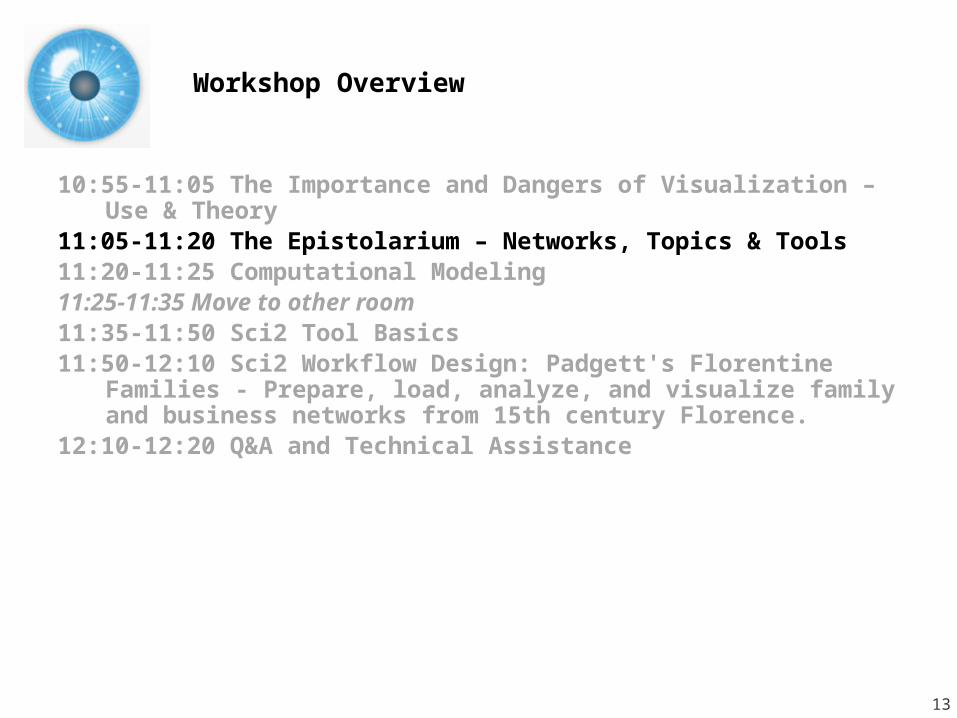
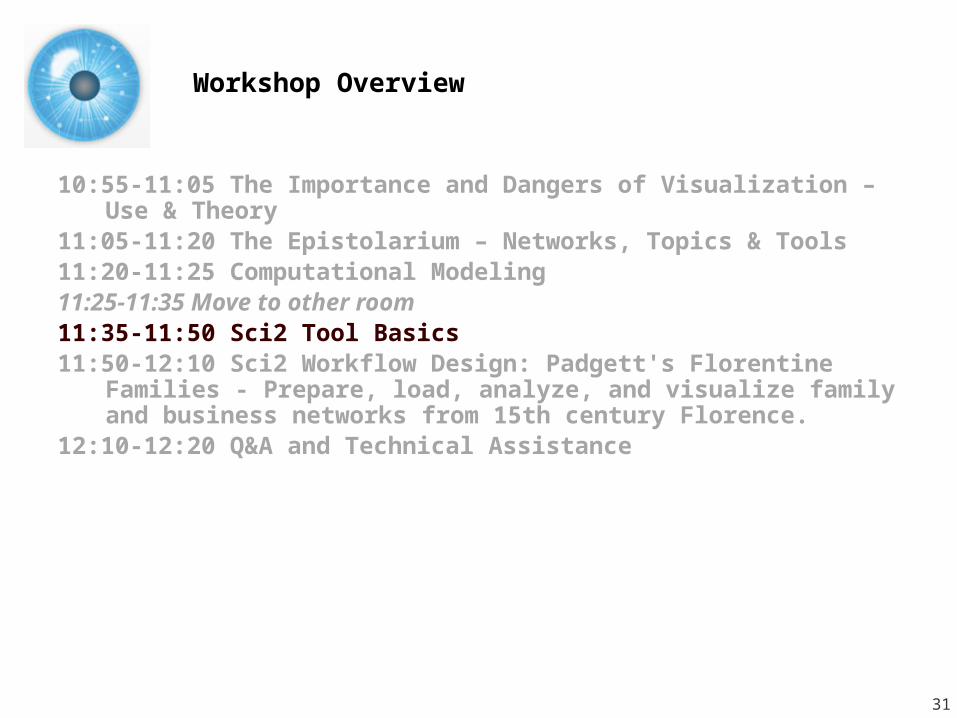
10:55-11:05 The Importance and Dangers of Visualization – Use & Theory
11:05-11:20 The Epistolarium – Networks, Topics & Tools11:20-11:25 Computational Modeling 11:25-11:35 Move to other room11:35-11:50 Sci2 Tool Basics 11:50-12:10 Sci2 Workflow Design: Padgett's Florentine
Families - Prepare, load, analyze, and visualize family and business networks from 15th century Florence.
12:10-12:20 Q&A and Technical Assistance
Workshop Overview
2
10:55-11:05 The Importance and Dangers of Visualization – Use & Theory
11:05-11:20 The Epistolarium – Networks, Topics & Tools11:20-11:25 Computational Modeling 11:25-11:35 Move to other room11:35-11:50 Sci2 Tool Basics 11:50-12:10 Sci2 Workflow Design: Padgett's Florentine
Families - Prepare, load, analyze, and visualize family and business networks from 15th century Florence.
12:10-12:20 Q&A and Technical Assistance
Workshop Overview
3
The Importance and Dangers of Visualization:
Use & Theory
4
Uses of Visualization
Solidifies objects of inquiry
Exploration
Discovery
Trend-spotting
Evidence
Audience Engagement
Engaging public / funding agencies
The Importance of Visualization
[Visualization] aim at more than making the invisible
visible. [It aspires] to all-at-once-ness, the
condensation of laborious, step-by-step procedures in
to an immediate coup d’oeil… What was a painstaking
process of calculation and correlation—for example, in
the construction of a table of variables—becomes a
flash of intuition. And all-at-once intuition is
traditionally the way that angels know, in contrast to
the plodding demonstrations of humans.
Descartes’s craving for angelic all-at-once-ness emerged
forcefully in his mathematics…, compressing the steps
of mathematical proof into a single bright flare of
insight: “I see the whole thing at once, by intuition.”
Lorraine Daston – On Scientific Observation
Warnings
[H]umanists have adopted many applications such as GIS
mapping, graphs, and charts for statistical display that were
developed in other disciplines… such graphical tools are a
kind of intellectual Trojan horse…
Data pass themselves off as mere descriptions of a priori
conditions. Rendering observation (the act of creating a
statistical, empirical, or subjective account or image) as if it
were the same as the phenomena observed collapses the
critical distance between the phenomenal world and its
interpretation, undoing the basis of interpretation on which
humanistic knowledge production is based... we seem ready
and eager to suspend critical judgment in a rush to
visualization.
Johanna Drucker – Humanities Approaches to Graphical
Display
Warnings
Data format limits use, already an act
of interpretation.
Statistics is often misused (wield it
very carefully).
Interpreting spatial distance as
meaningful.
Always include a legend (this
presentation breaks that rule).
Accidental legitimization in eyes of
public.
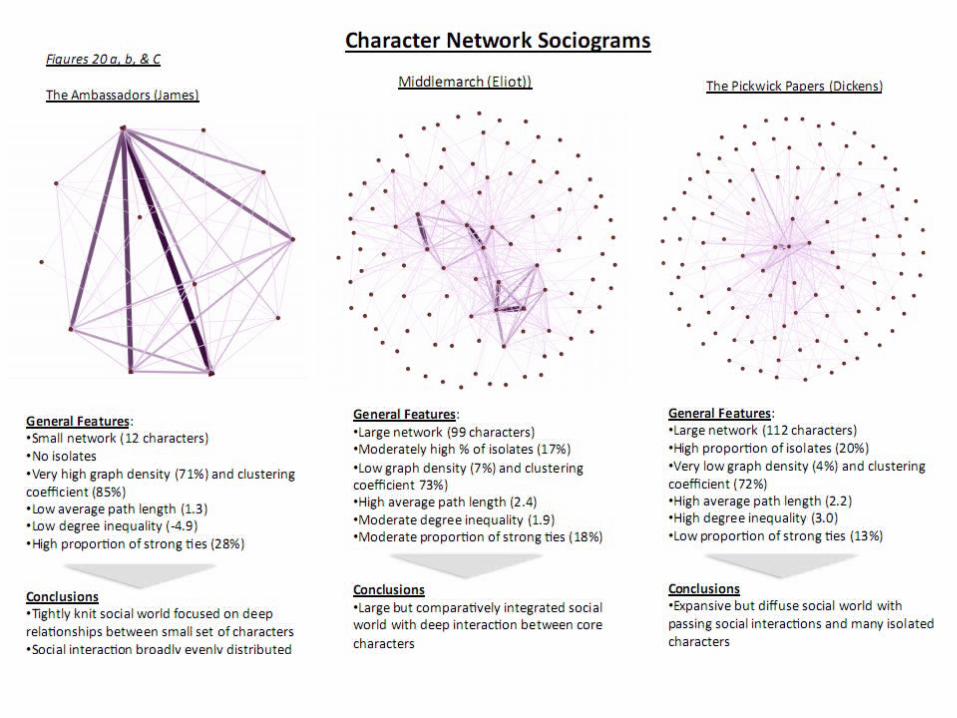
Character Networks in the 19th Century British Novel
-Graham SackI use computational methods to count the frequency and co-
occurrence of a generally ignored sub-class of common words,
namely, character names. Character names are often regarded as
noise and excluded from authorship and stylistics analysis
because they are not consistent across texts. This study makes
character names its main object of analysis because the objective
is quite different: rather than style or authorship, this study
attempts to make inferences about characterization and social
form, two areas about which computational analysis has had
comparatively little to say.
Character Networks in the 19th Century British Novel
-Graham Sack
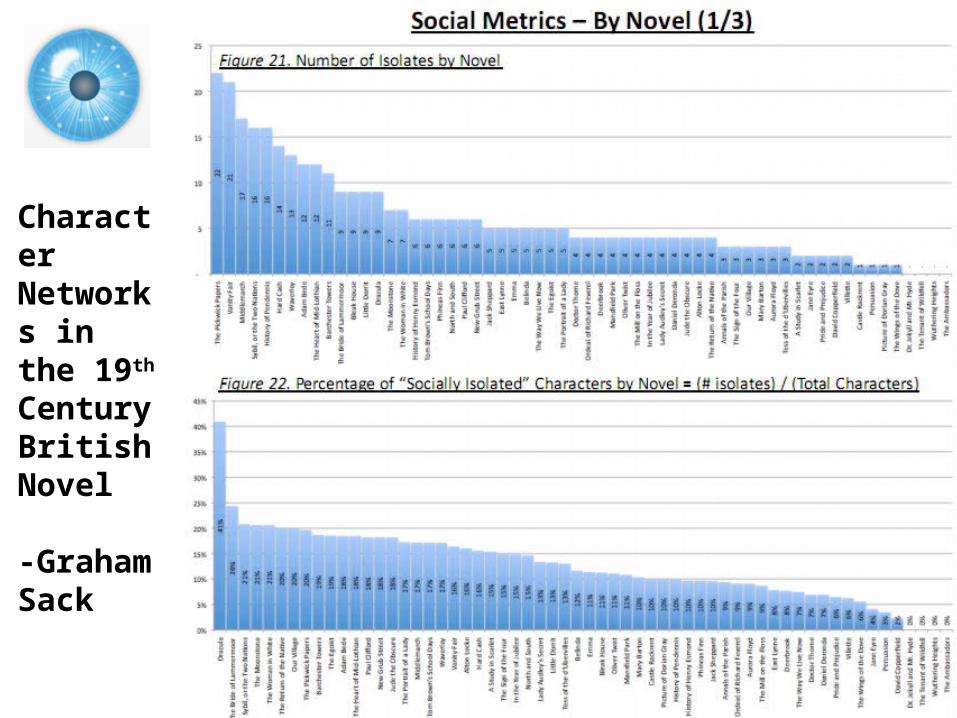
Character Networks in the 19th Century British Novel
-Graham Sack
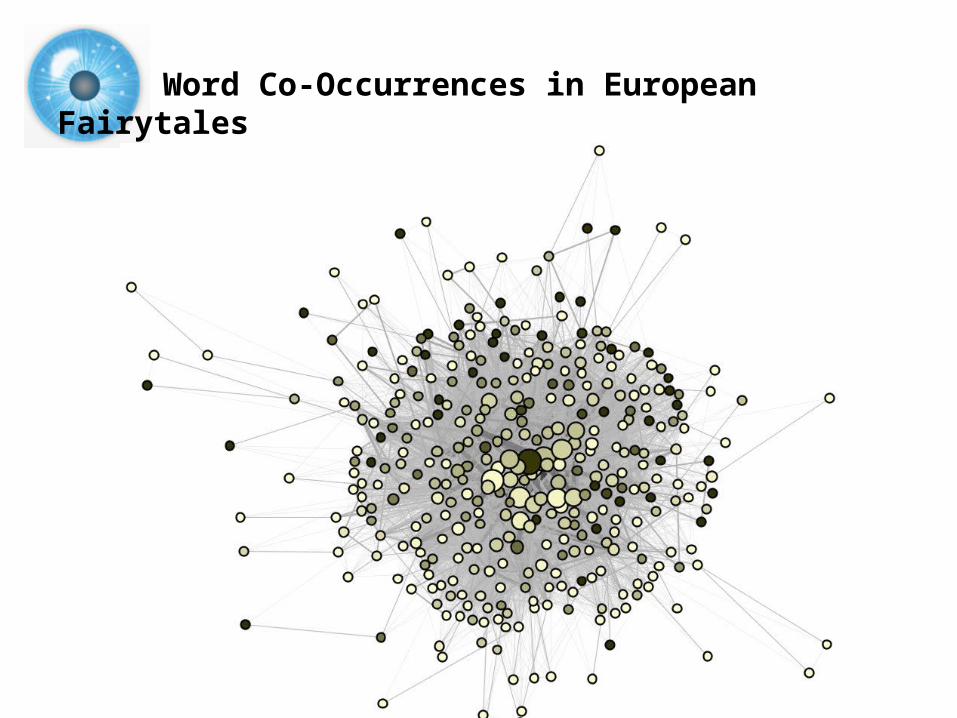
Word Co-Occurrences in European Fairytales
-Jorgensen & Weingart
10:55-11:05 The Importance and Dangers of Visualization – Use & Theory
11:05-11:20 The Epistolarium – Networks, Topics & Tools11:20-11:25 Computational Modeling 11:25-11:35 Move to other room11:35-11:50 Sci2 Tool Basics 11:50-12:10 Sci2 Workflow Design: Padgett's Florentine
Families - Prepare, load, analyze, and visualize family and business networks from 15th century Florence.
12:10-12:20 Q&A and Technical Assistance
Workshop Overview
13
The Epistolarium – Networks, Topics & Tools
14
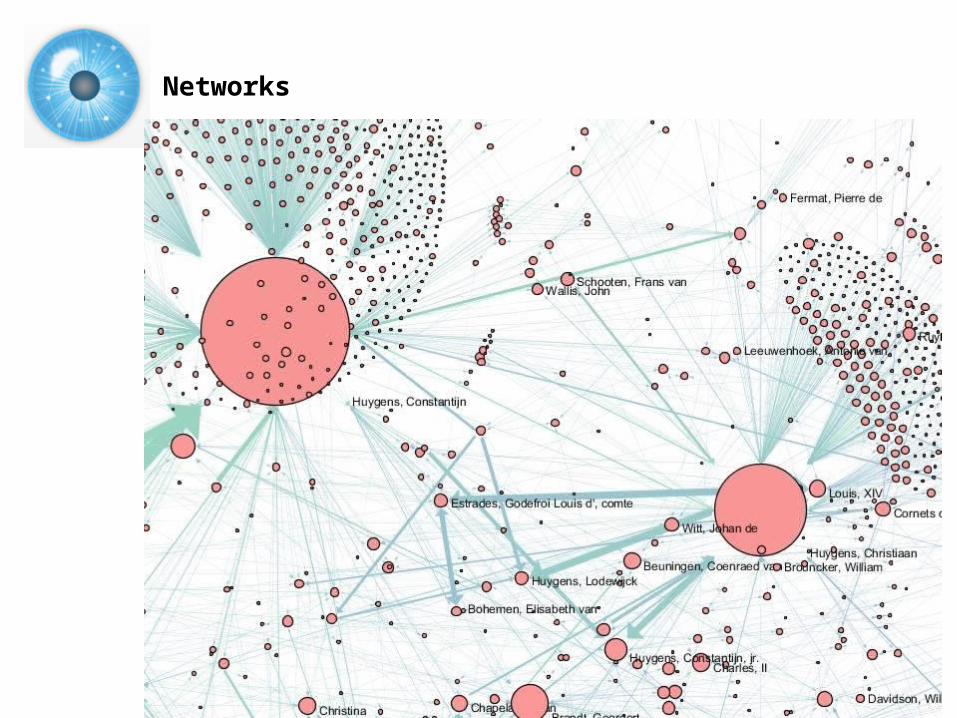
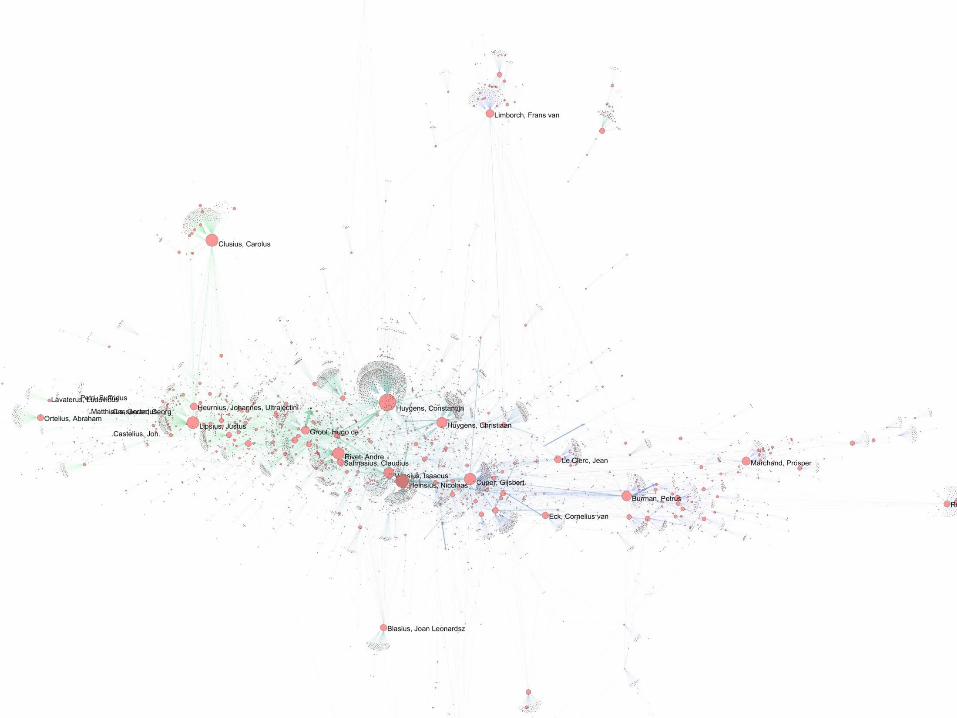
Networks
Networks
Networks
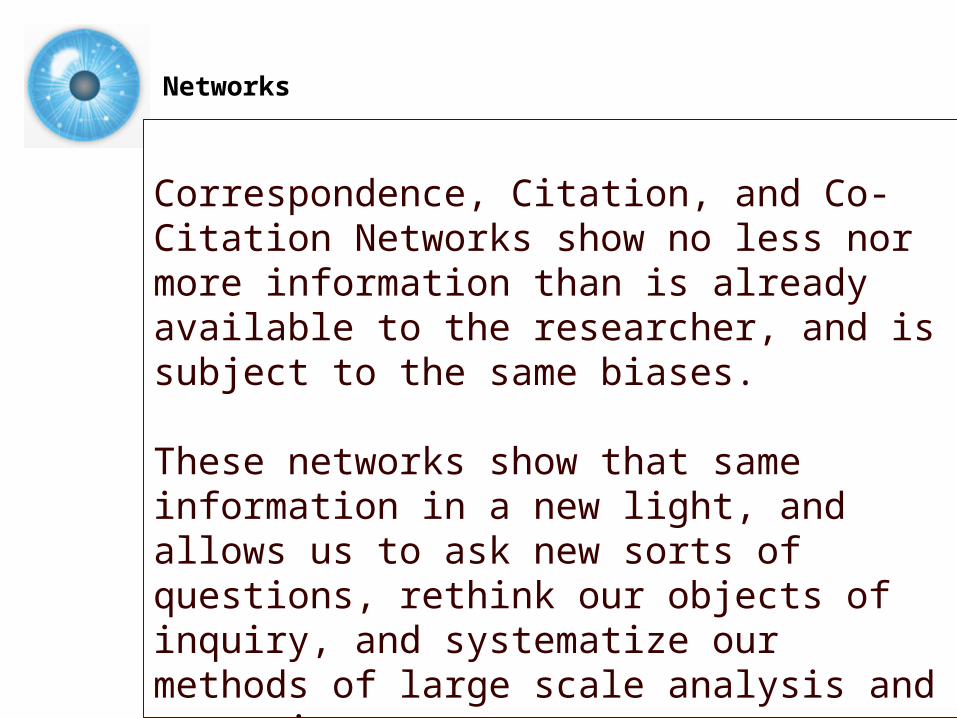
Correspondence, Citation, and Co-Citation Networks show no less nor more information than is already available to the researcher, and is subject to the same biases.
These networks show that same information in a new light, and allows us to ask new sorts of questions, rethink our objects of inquiry, and systematize our methods of large scale analysis and comparison.
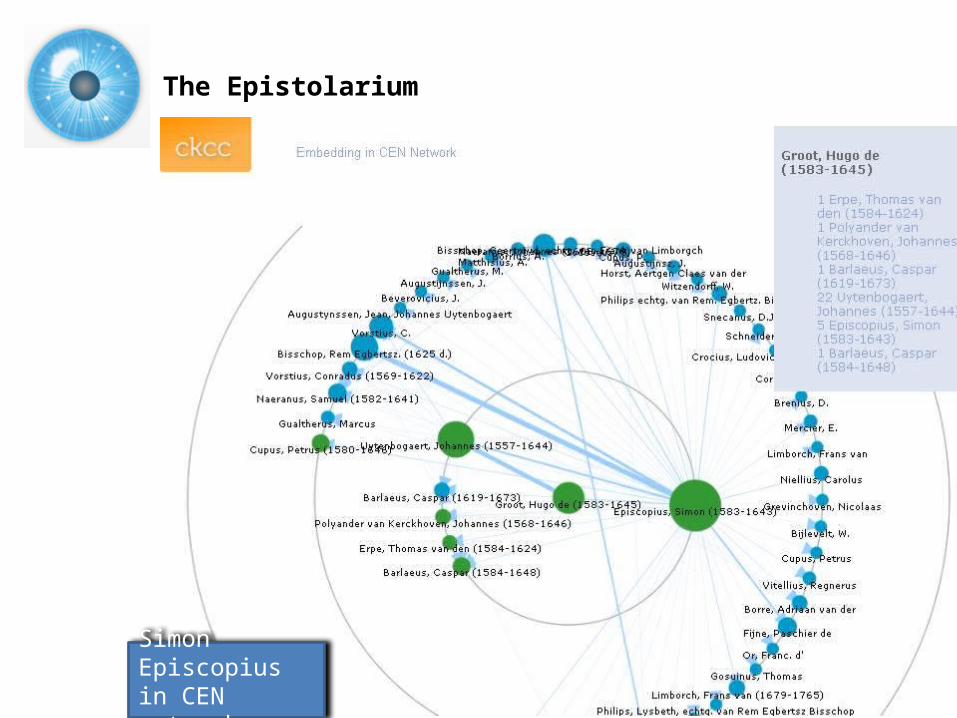
The Epistolarium
Simon Episcopiusin CEN network
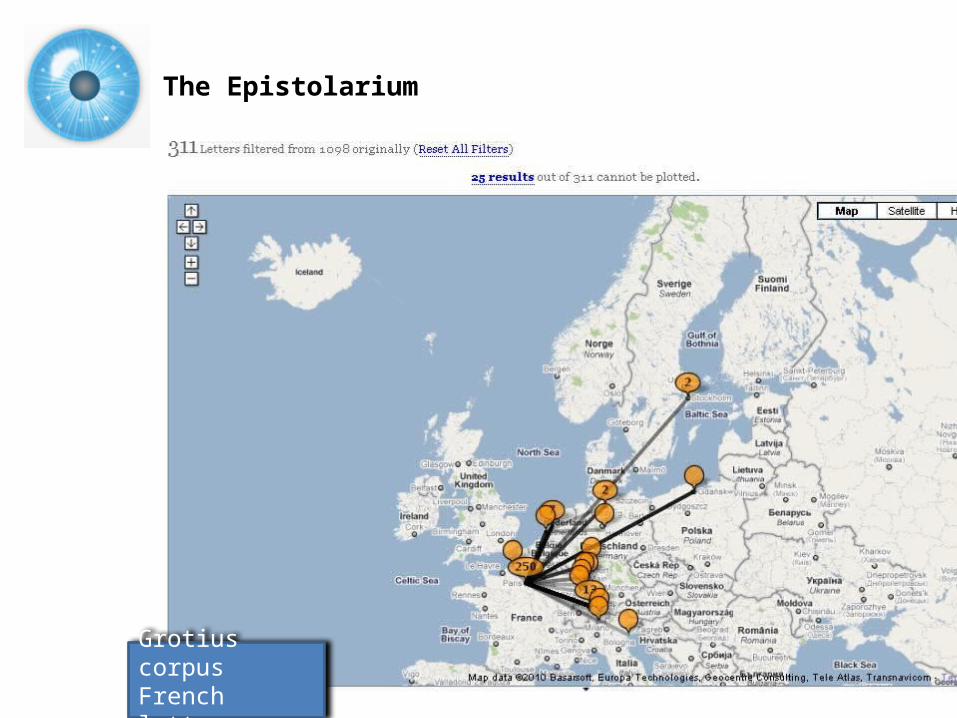
The Epistolarium
Grotius corpusFrench letters
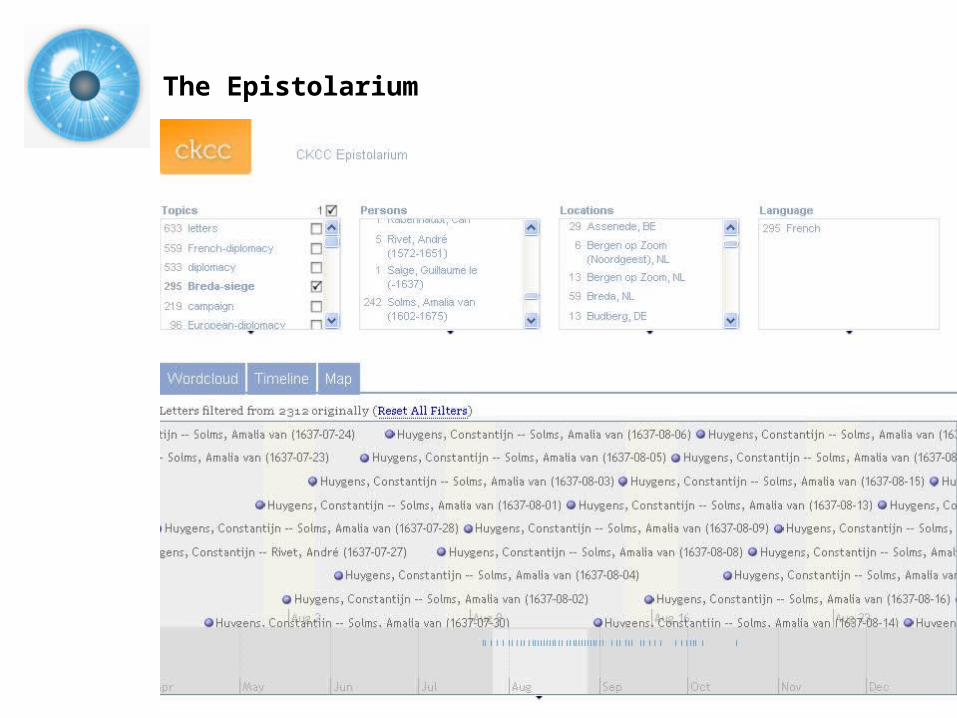
The Epistolarium
Topics
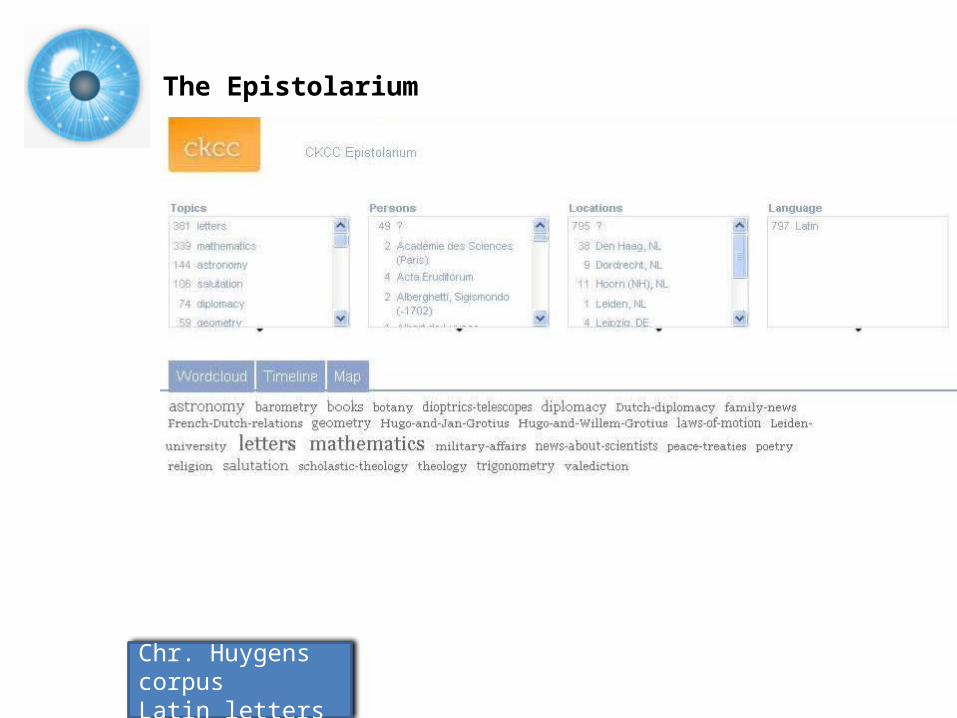
The Epistolarium
Chr. Huygens corpusLatin letters
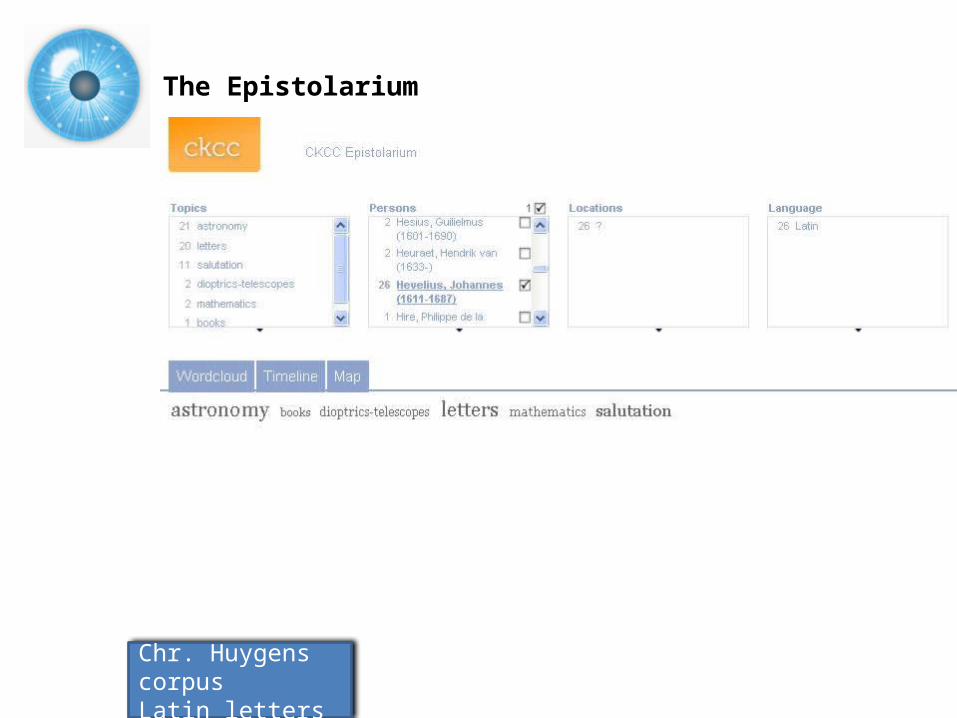
The Epistolarium
Chr. Huygens corpusLatin letters
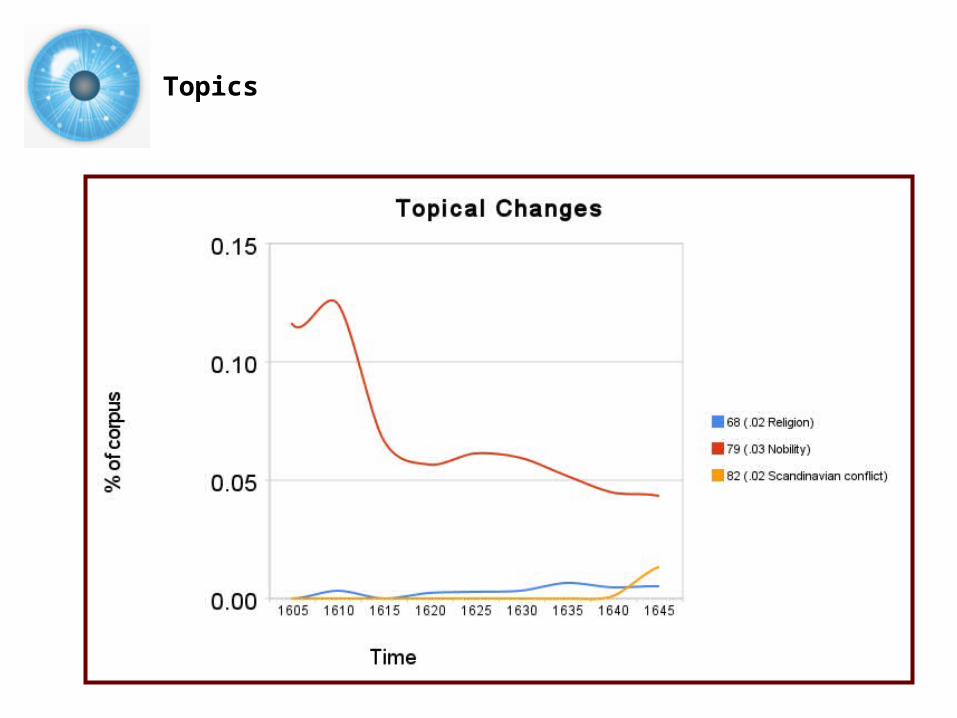
Topics
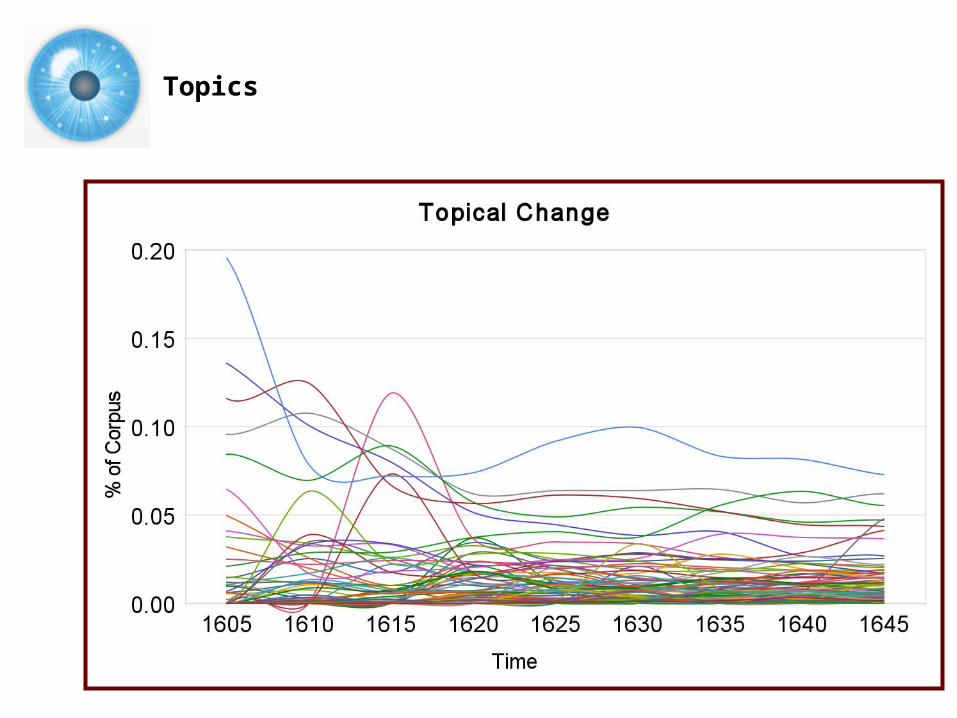
Topics
10:55-11:05 The Importance and Dangers of Visualization – Use & Theory
11:05-11:20 The Epistolarium – Networks, Topics & Tools11:20-11:25 Computational Modeling 11:25-11:35 Move to other room11:35-11:50 Sci2 Tool Basics 11:50-12:10 Sci2 Workflow Design: Padgett's Florentine
Families - Prepare, load, analyze, and visualize family and business networks from 15th century Florence.
12:10-12:20 Q&A and Technical Assistance
Workshop Overview
26
Computational Modeling
27
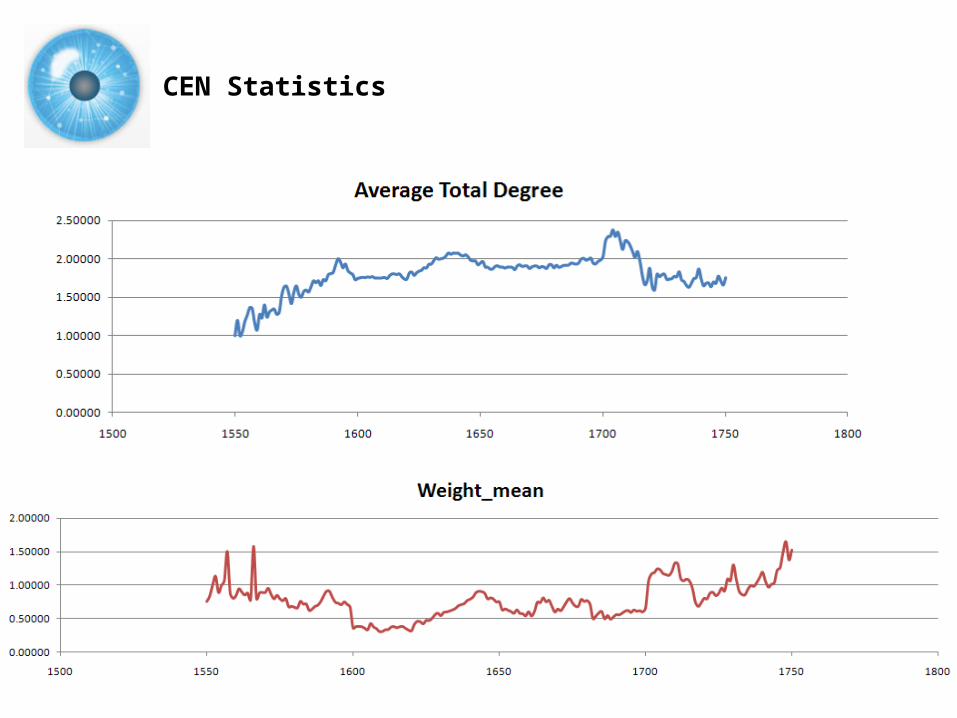
CEN Statistics
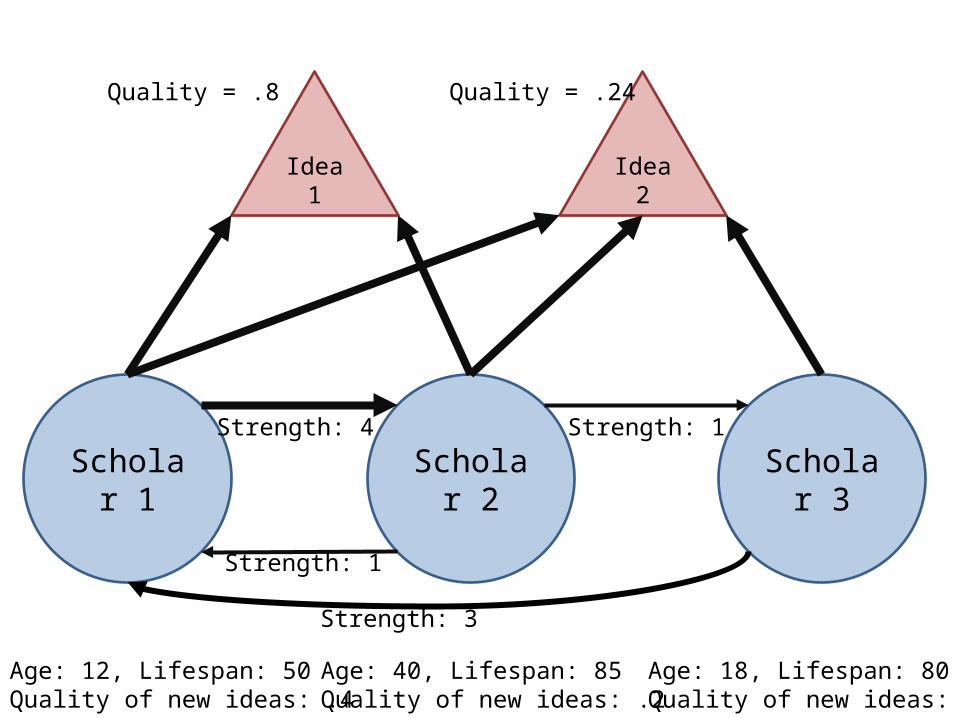
Scholar 1
Idea 1
Scholar 2 Scholar 3
Idea 2
Quality = .8 Quality = .24
Age: 12, Lifespan: 50Quality of new ideas: .4 +/- .05
Age: 40, Lifespan: 85Quality of new ideas: .2 +/- .15
Age: 18, Lifespan: 80Quality of new ideas: .9 +/- .03
Strength: 3
Strength: 1
Strength: 4 Strength: 1
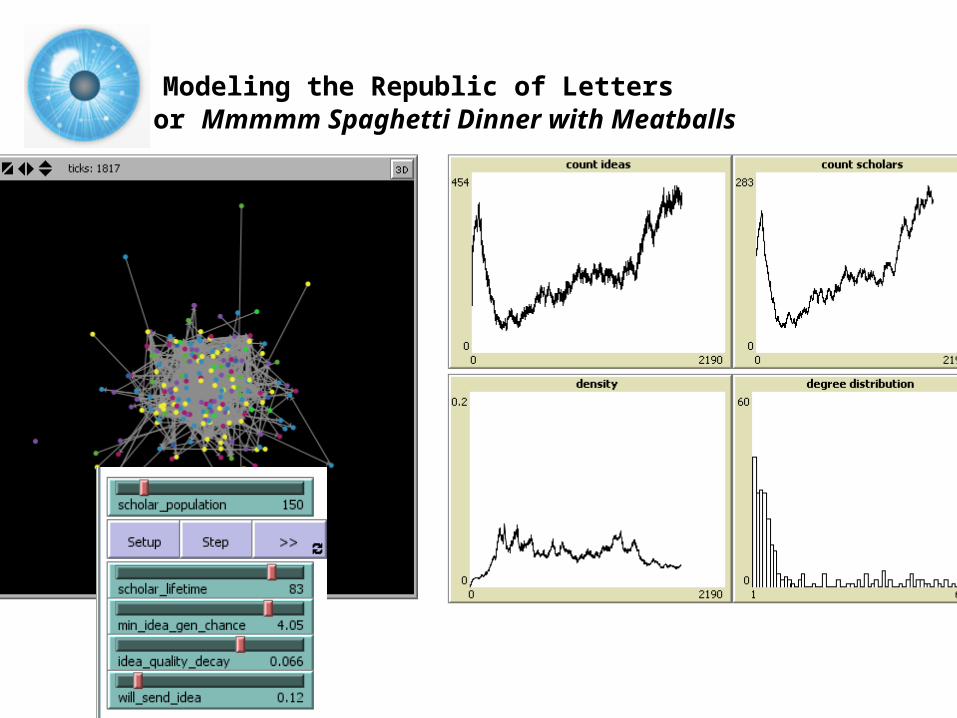
Modeling the Republic of Lettersor Mmmmm Spaghetti Dinner with
Meatballs
10:55-11:05 The Importance and Dangers of Visualization – Use & Theory
11:05-11:20 The Epistolarium – Networks, Topics & Tools11:20-11:25 Computational Modeling 11:25-11:35 Move to other room11:35-11:50 Sci2 Tool Basics 11:50-12:10 Sci2 Workflow Design: Padgett's Florentine
Families - Prepare, load, analyze, and visualize family and business networks from 15th century Florence.
12:10-12:20 Q&A and Technical Assistance
Workshop Overview
31
Sci2 Tool Basics
32
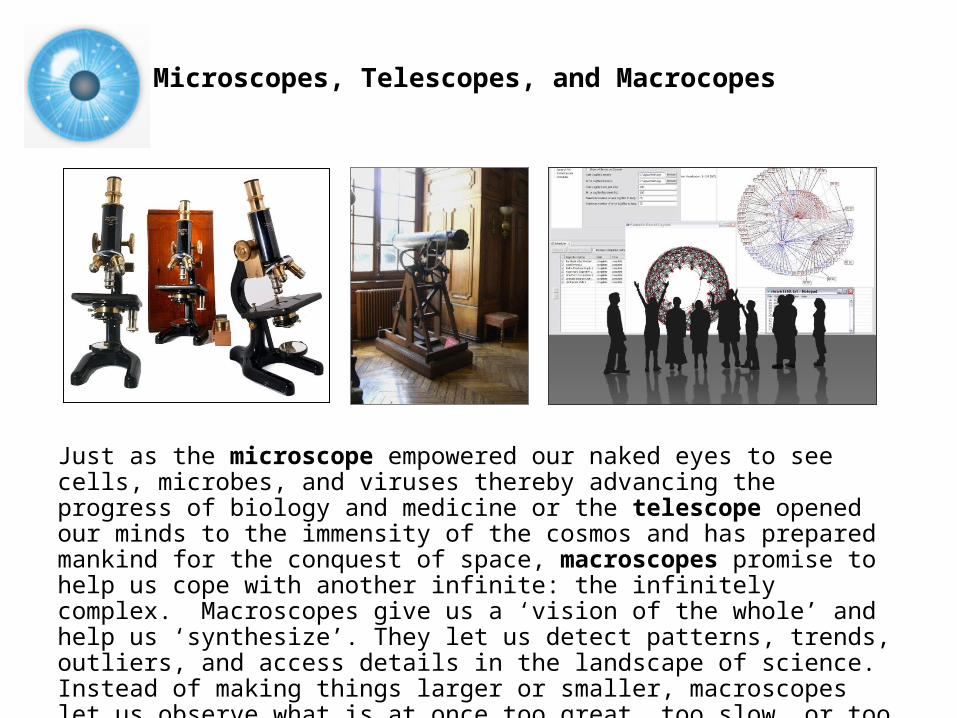
Just as the microscope empowered our naked eyes to see cells, microbes, and viruses thereby advancing the progress of biology and medicine or the telescope opened our minds to the immensity of the cosmos and has prepared mankind for the conquest of space, macroscopes promise to help us cope with another infinite: the infinitely complex. Macroscopes give us a ‘vision of the whole’ and help us ‘synthesize’. They let us detect patterns, trends, outliers, and access details in the landscape of science. Instead of making things larger or smaller, macroscopes let us observe what is at once too great, too slow, or too complex for our eyes.
Microscopes, Telescopes, and Macrocopes
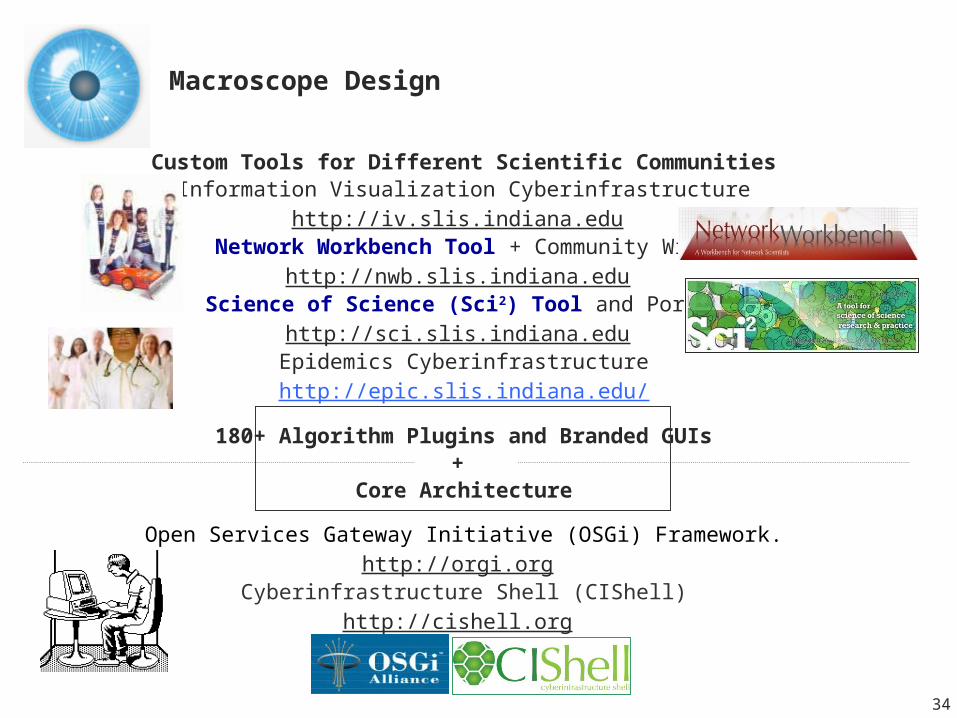
Custom Tools for Different Scientific CommunitiesInformation Visualization Cyberinfrastructure
http://iv.slis.indiana.edu Network Workbench Tool + Community Wiki
http://nwb.slis.indiana.edu Science of Science (Sci2) Tool and Portal
http://sci.slis.indiana.edu Epidemics Cyberinfrastructure
http://epic.slis.indiana.edu/
180+ Algorithm Plugins and Branded GUIs+
Core Architecture
Open Services Gateway Initiative (OSGi) Framework.http://orgi.org
Cyberinfrastructure Shell (CIShell)http://cishell.org
Macroscope Design
34
35
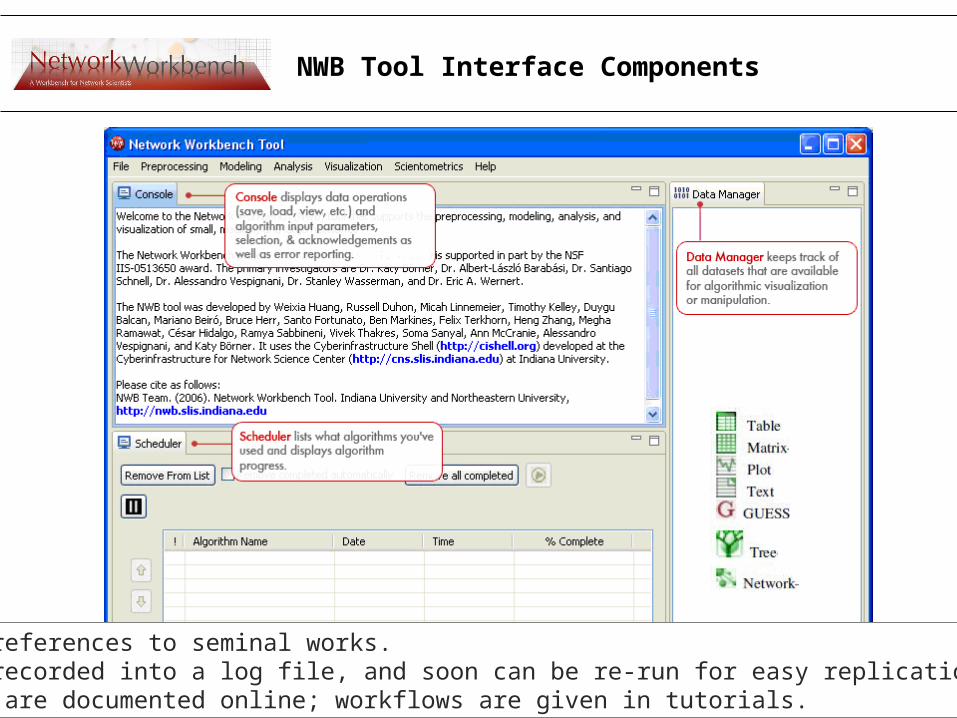
NWB Tool Interface Components
Console shows references to seminal works.Workflows are recorded into a log file, and soon can be re-run for easy replication.All algorithms are documented online; workflows are given in tutorials.
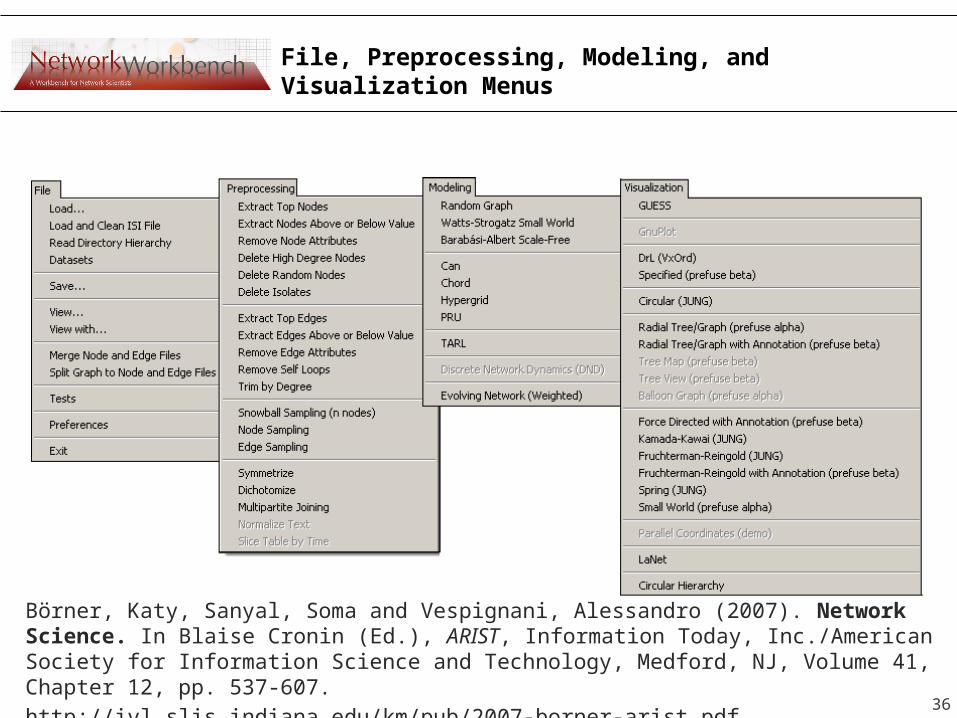
File, Preprocessing, Modeling, and Visualization Menus
36
Börner, Katy, Sanyal, Soma and Vespignani, Alessandro (2007). Network Science. In Blaise Cronin (Ed.), ARIST, Information Today, Inc./American Society for Information Science and Technology, Medford, NJ, Volume 41, Chapter 12, pp. 537-607. http://ivl.slis.indiana.edu/km/pub/2007-borner-arist.pdf
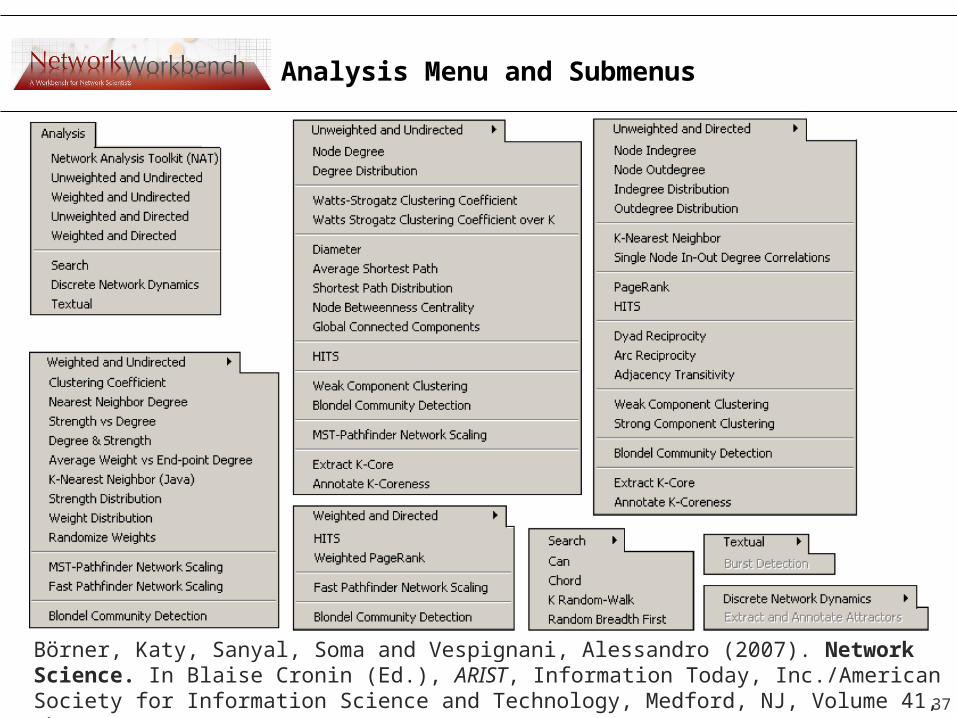
Analysis Menu and Submenus
37
Börner, Katy, Sanyal, Soma and Vespignani, Alessandro (2007). Network Science. In Blaise Cronin (Ed.), ARIST, Information Today, Inc./American Society for Information Science and Technology, Medford, NJ, Volume 41, Chapter 12, pp. 537-607. http://ivl.slis.indiana.edu/km/pub/2007-borner-arist.pdf
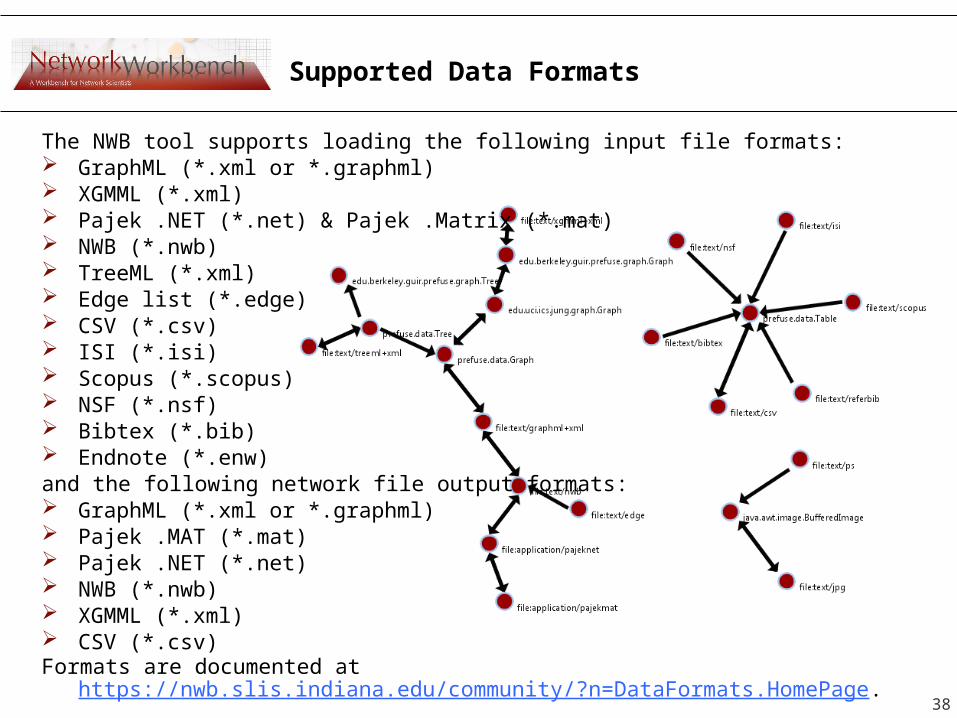
Supported Data Formats
The NWB tool supports loading the following input file formats: GraphML (*.xml or *.graphml) XGMML (*.xml) Pajek .NET (*.net) & Pajek .Matrix (*.mat) NWB (*.nwb) TreeML (*.xml) Edge list (*.edge) CSV (*.csv) ISI (*.isi) Scopus (*.scopus) NSF (*.nsf) Bibtex (*.bib) Endnote (*.enw)and the following network file output formats: GraphML (*.xml or *.graphml) Pajek .MAT (*.mat) Pajek .NET (*.net) NWB (*.nwb) XGMML (*.xml) CSV (*.csv)Formats are documented at
https://nwb.slis.indiana.edu/community/?n=DataFormats.HomePage. 38
File-types
Excel
Database
Text
CSV
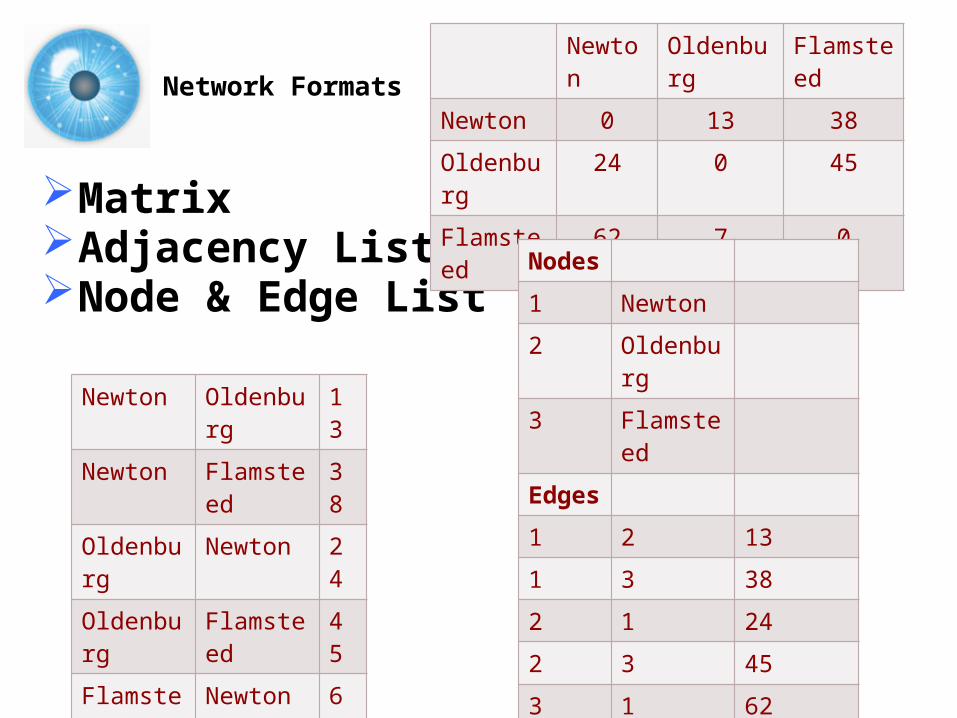
Network Formats
MatrixAdjacency ListNode & Edge List
Newton
Oldenburg
Flamsteed
Newton 0 13 38
Oldenburg
24 0 45
Flamsteed
62 7 0
Newton Oldenburg
13
Newton Flamsteed
38
Oldenburg
Newton 24
Oldenburg
Flamsteed
45
Flamsteed
Newton 62
Flamsteed
Oldenburg
7
Nodes
1 Newton
2 Oldenburg
3 Flamsteed
Edges
1 2 13
1 3 38
2 1 24
2 3 45
3 1 62
3 2 7
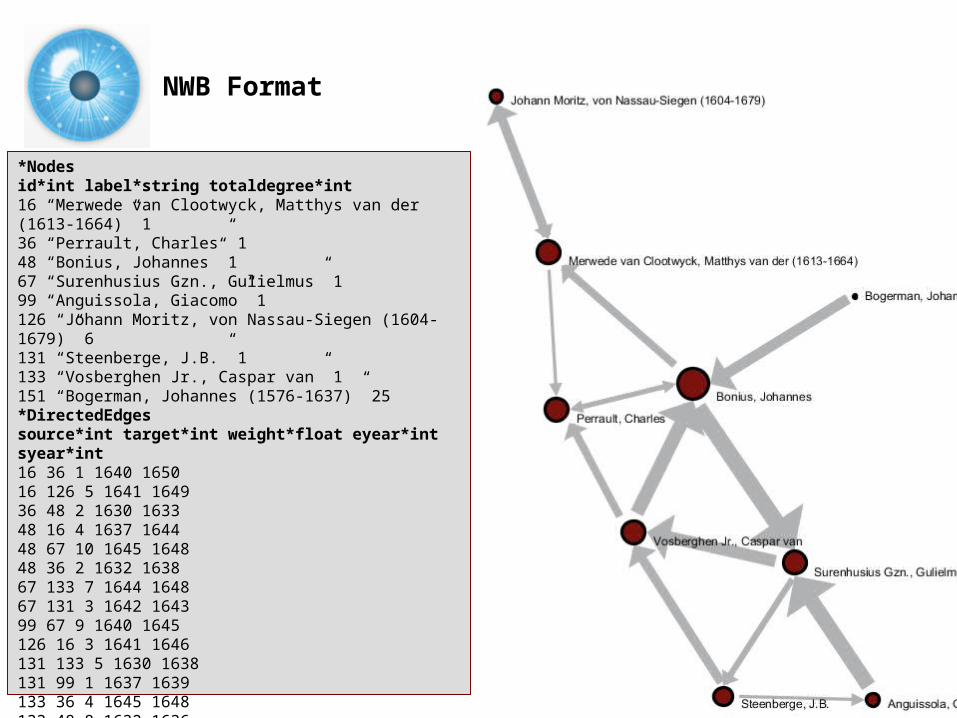
NWB Format
*Nodesid*int label*string totaldegree*int 16 “Merwede van Clootwyck, Matthys van der (1613-1664)” 1 36 “Perrault, Charles” 1 48 “Bonius, Johannes” 1 67 “Surenhusius Gzn., Gulielmus” 1 99 “Anguissola, Giacomo” 1 126 “Johann Moritz, von Nassau-Siegen (1604-1679)” 6 131 “Steenberge, J.B.” 1 133 “Vosberghen Jr., Caspar van” 1 151 “Bogerman, Johannes (1576-1637)” 25 *DirectedEdges source*int target*int weight*float eyear*int syear*int 16 36 1 1640 1650 16 126 5 1641 1649 36 48 2 1630 1633 48 16 4 1637 1644 48 67 10 1645 1648 48 36 2 1632 1638 67 133 7 1644 1648 67 131 3 1642 1643 99 67 9 1640 1645 126 16 3 1641 1646 131 133 5 1630 1638 131 99 1 1637 1639 133 36 4 1645 1648 133 48 8 1632 1636 151 48 6 1644 1647
42
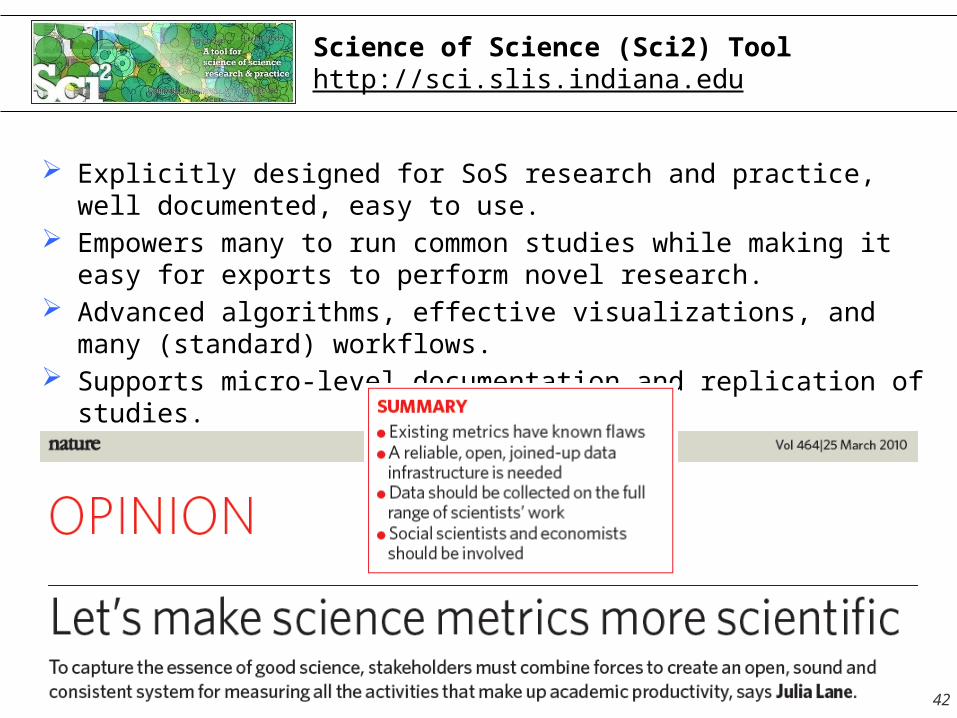
Science of Science (Sci2) Toolhttp://sci.slis.indiana.edu
Explicitly designed for SoS research and practice, well documented, easy to use.
Empowers many to run common studies while making it easy for exports to perform novel research.
Advanced algorithms, effective visualizations, and many (standard) workflows.
Supports micro-level documentation and replication of studies.
Is open source—anybody can review and extend the code, or use it for commercial purposes.
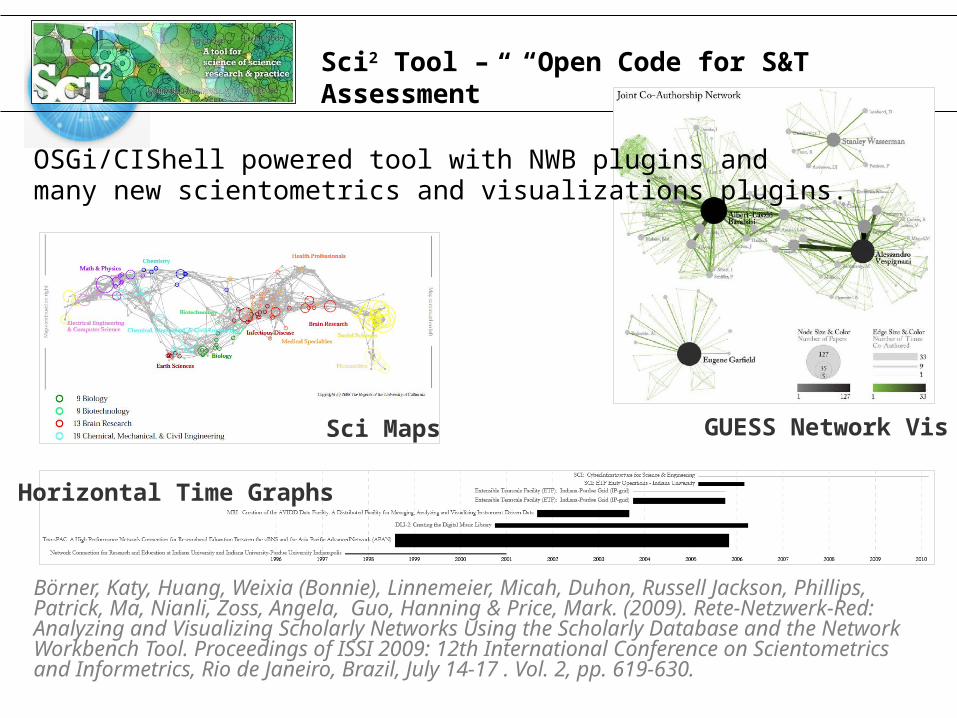
Sci2 Tool – “Open Code for S&T Assessment”
OSGi/CIShell powered tool with NWB plugins and many new scientometrics and visualizations plugins.
Börner, Katy, Huang, Weixia (Bonnie), Linnemeier, Micah, Duhon, Russell Jackson, Phillips, Patrick, Ma, Nianli, Zoss, Angela, Guo, Hanning & Price, Mark. (2009). Rete-Netzwerk-Red: Analyzing and Visualizing Scholarly Networks Using the Scholarly Database and the Network Workbench Tool. Proceedings of ISSI 2009: 12th International Conference on Scientometrics and Informetrics, Rio de Janeiro, Brazil, July 14-17 . Vol. 2, pp. 619-630.
Horizontal Time Graphs
Sci Maps GUESS Network Vis
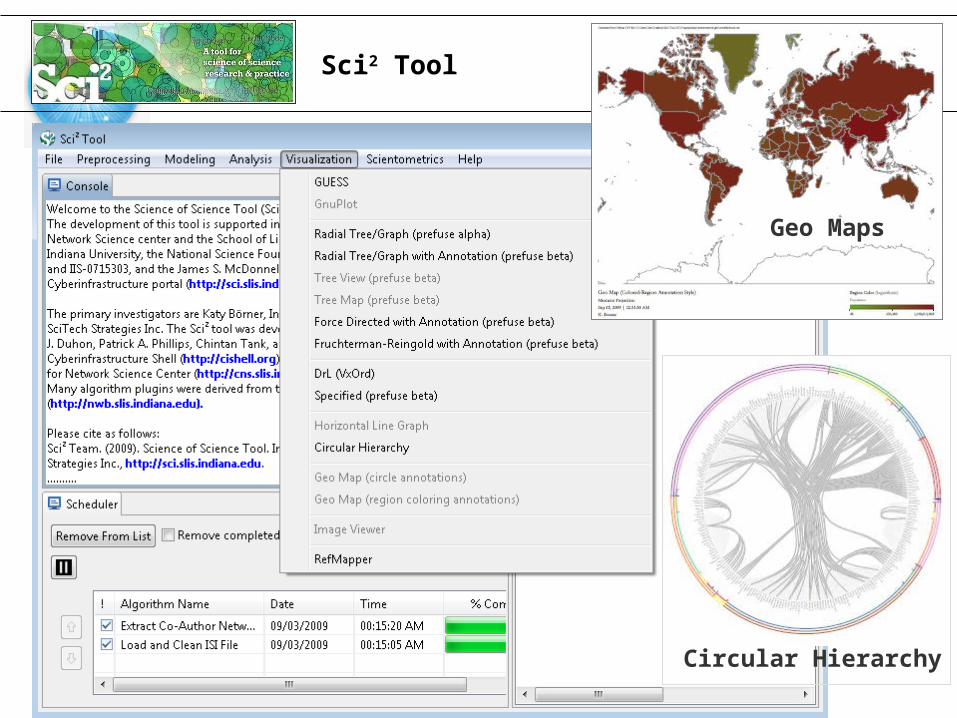
Sci2 Tool
Geo Maps
Circular Hierarchy
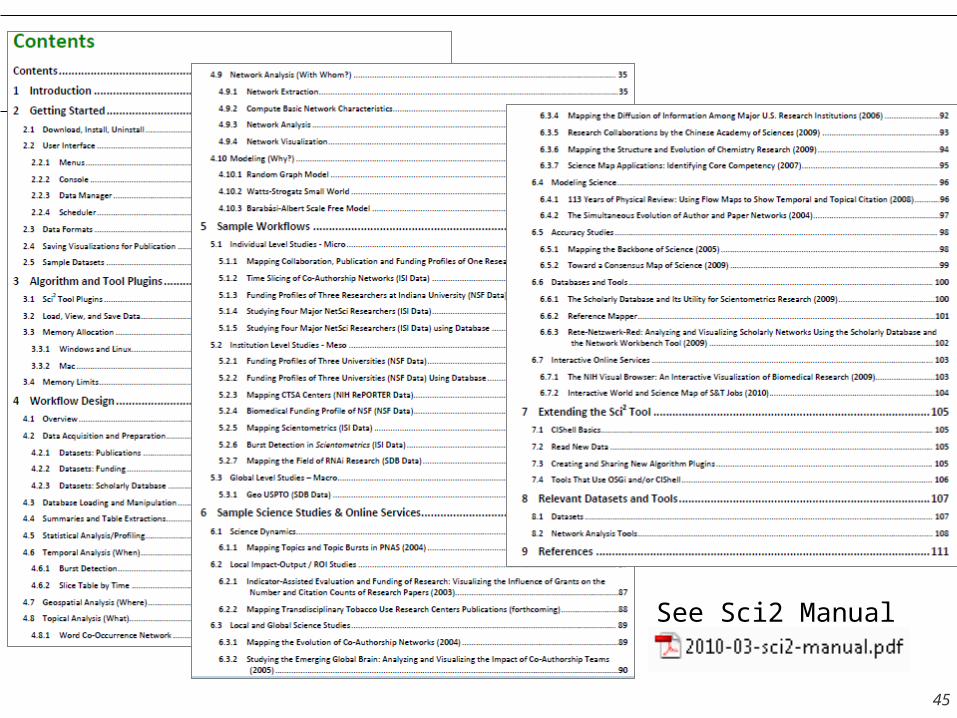
See Sci2 Manual
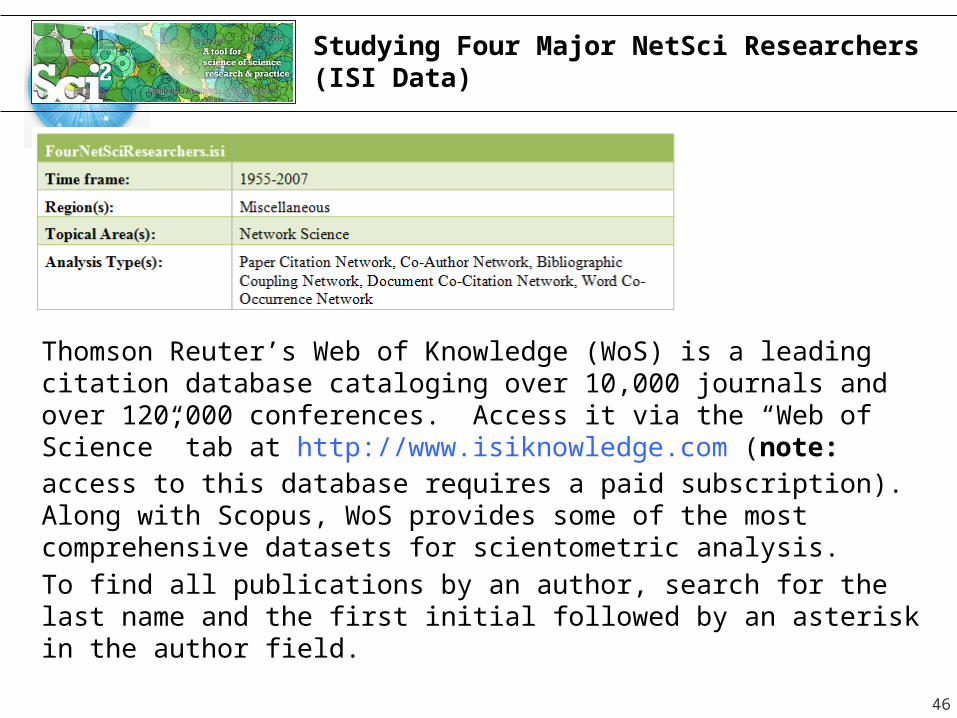
Studying Four Major NetSci Researchers (ISI Data)
Thomson Reuter’s Web of Knowledge (WoS) is a leading citation database cataloging over 10,000 journals and over 120,000 conferences. Access it via the “Web of Science” tab at http://www.isiknowledge.com (note: access to this database requires a paid subscription). Along with Scopus, WoS provides some of the most comprehensive datasets for scientometric analysis. To find all publications by an author, search for the last name and the first initial followed by an asterisk in the author field.
46
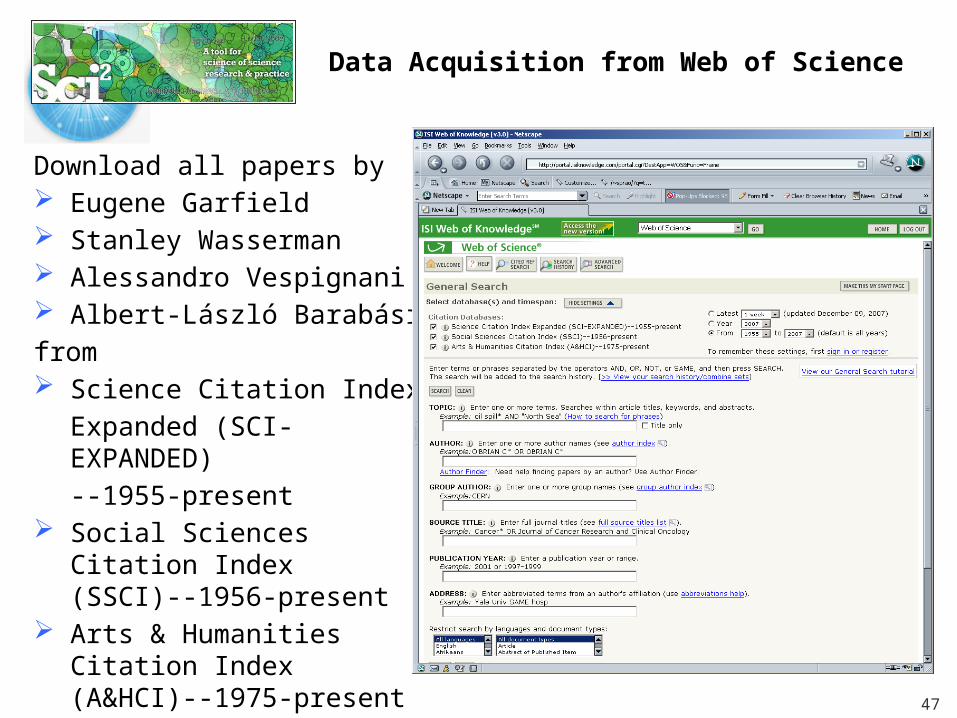
Data Acquisition from Web of Science
Download all papers by Eugene Garfield Stanley Wasserman Alessandro Vespignani Albert-László Barabásifrom Science Citation Index
Expanded (SCI-EXPANDED)--1955-present
Social Sciences Citation Index (SSCI)--1956-present
Arts & Humanities Citation Index (A&HCI)--1975-present 47
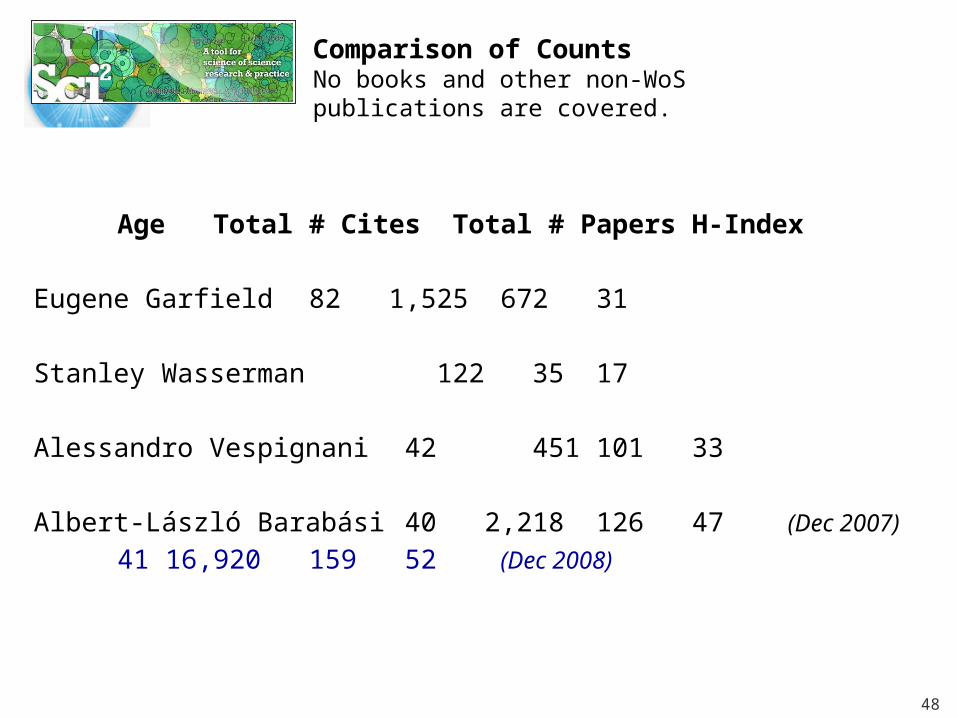
Comparison of CountsNo books and other non-WoS publications are covered.
Age Total # CitesTotal # Papers H-Index
Eugene Garfield 82 1,525672 31
Stanley Wasserman 122 35 17
Alessandro Vespignani 42 451101 33
Albert-László Barabási 40 2,218126 47 (Dec 2007)
41 16,920159 52 (Dec 2008)
48
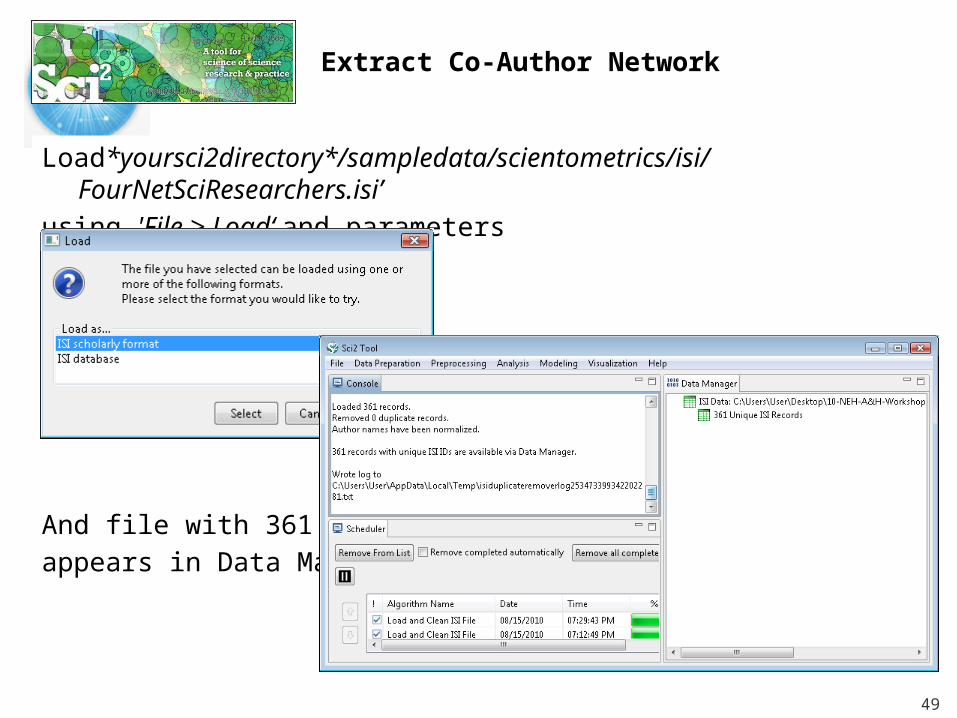
Extract Co-Author Network
Load*yoursci2directory*/sampledata/scientometrics/isi/FourNetSciResearchers.isi’
using 'File > Load‘ and parameters
And file with 361 records appears in Data Manager.
49
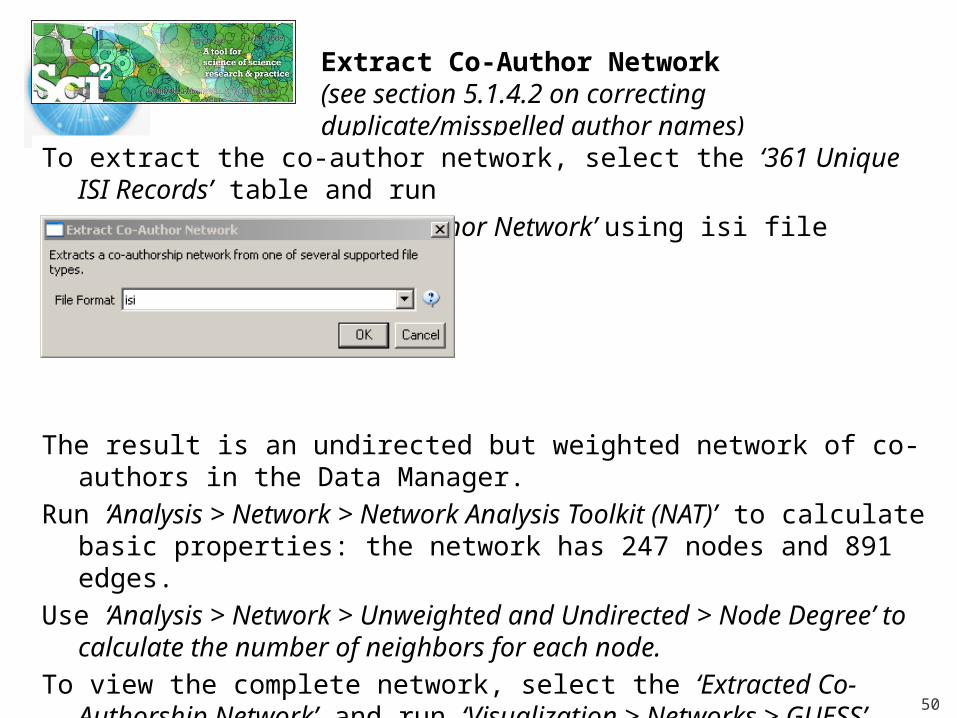
Extract Co-Author Network(see section 5.1.4.2 on correcting duplicate/misspelled author names)
To extract the co-author network, select the ‘361 Unique ISI Records’ table and run
‘Data Preparation > Extract Co-Author Network’ using isi file format:
The result is an undirected but weighted network of co-authors in the Data Manager.
Run ‘Analysis > Network > Network Analysis Toolkit (NAT)’ to calculate basic properties: the network has 247 nodes and 891 edges.
Use ‘Analysis > Network > Unweighted and Undirected > Node Degree’ to calculate the number of neighbors for each node.
To view the complete network, select the ‘Extracted Co-Authorship Network’ and run ‘Visualization > Networks > GUESS’.
Network is loaded with random layout. In GUESS, run ‘Layout > GEM’ and ‘Layout > Bin Pack’ to improve layout.
50
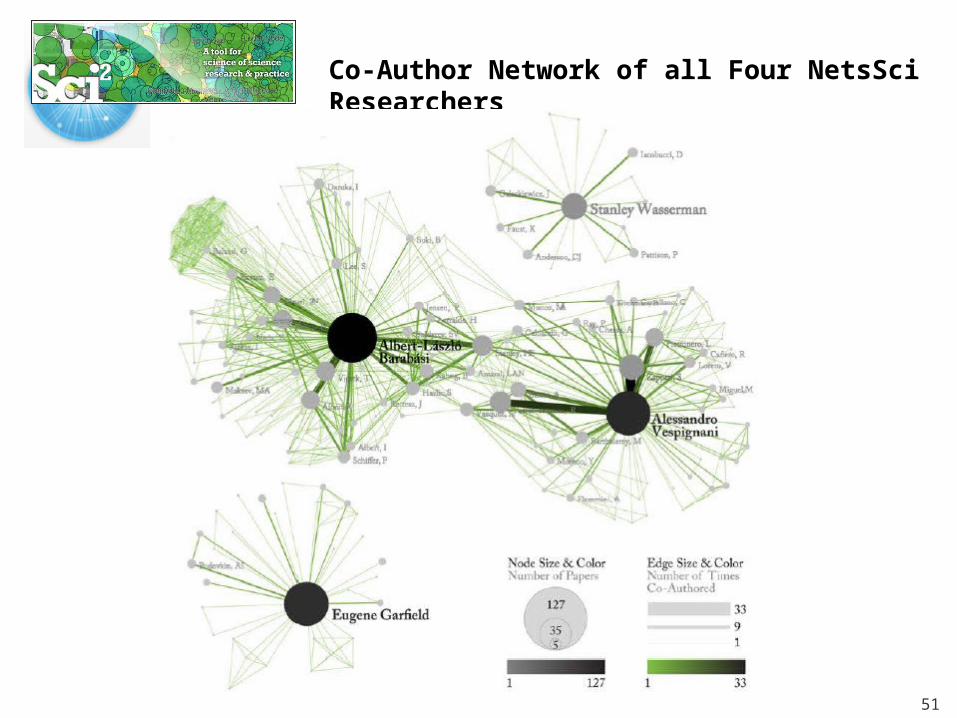
Co-Author Network of all Four NetsSci Researchers
51
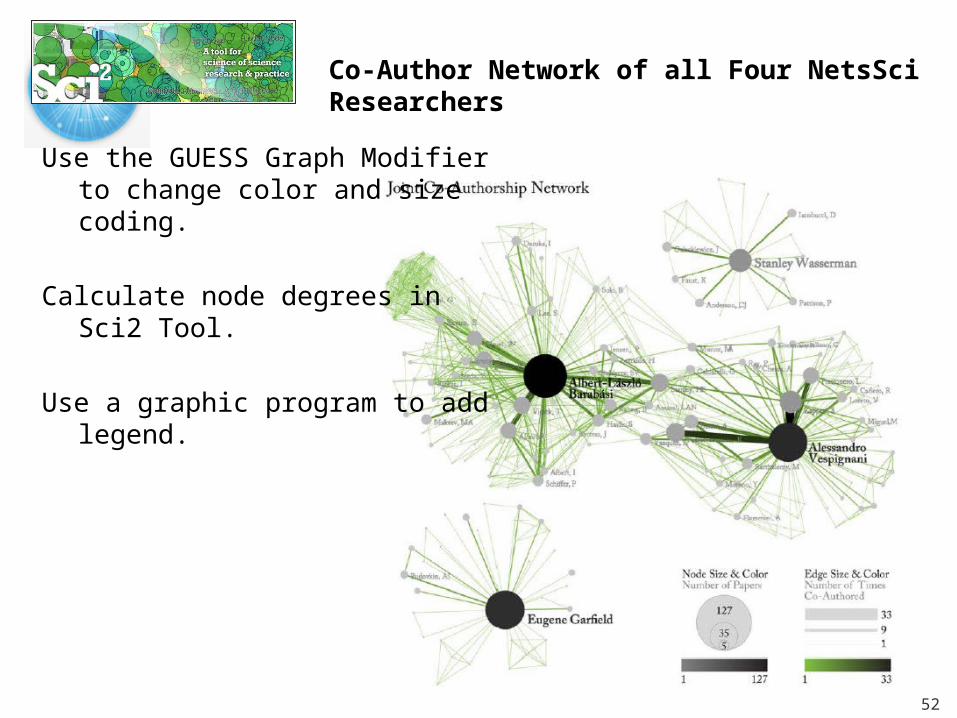
Co-Author Network of all Four NetsSci Researchers
52
Use the GUESS Graph Modifier to change color and size coding.
Calculate node degrees in Sci2 Tool.
Use a graphic program to add legend.
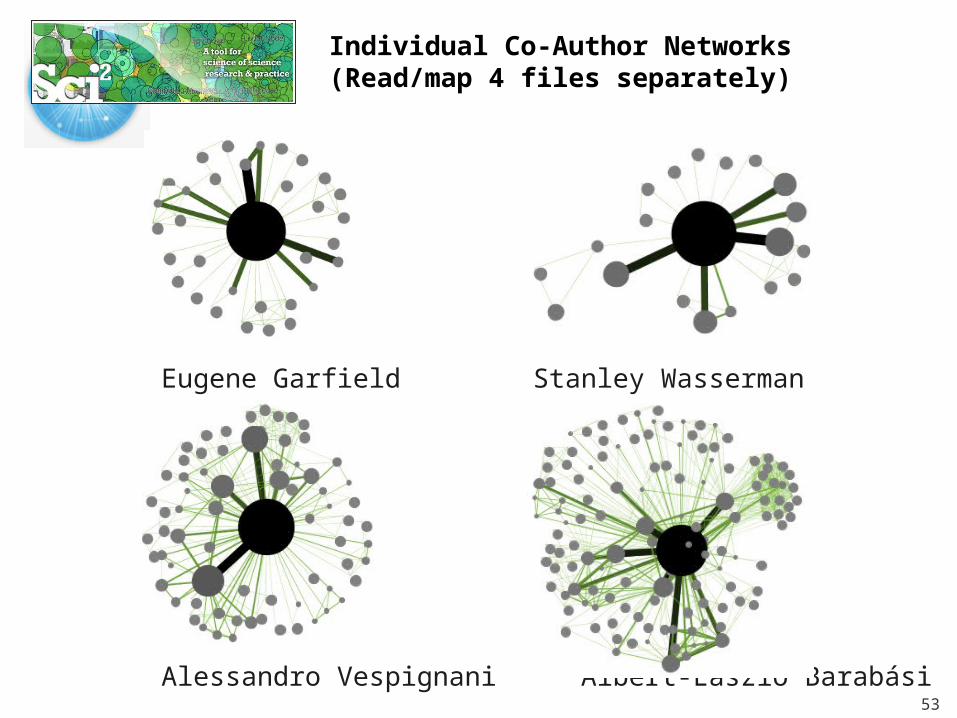
Individual Co-Author Networks (Read/map 4 files separately)
Eugene Garfield Stanley Wasserman
Alessandro Vespignani Albert-László Barabási53
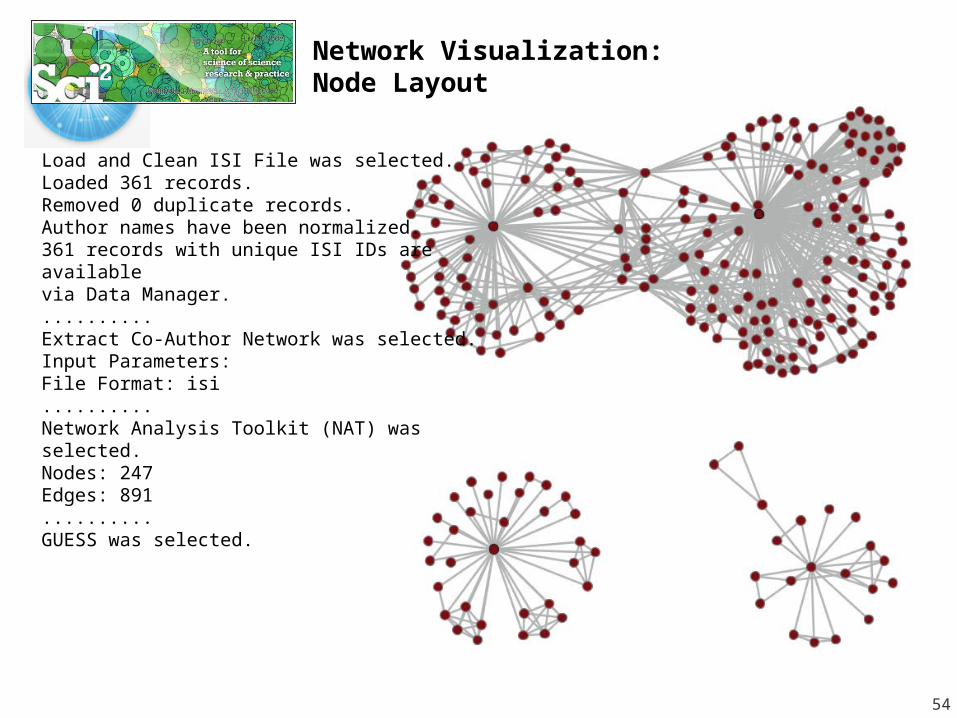
Network Visualization: Node Layout
54
Load and Clean ISI File was selected.Loaded 361 records.Removed 0 duplicate records.Author names have been normalized.361 records with unique ISI IDs are available via Data Manager...........Extract Co-Author Network was selected.Input Parameters:File Format: isi..........Network Analysis Toolkit (NAT) was selected.Nodes: 247Edges: 891..........GUESS was selected.
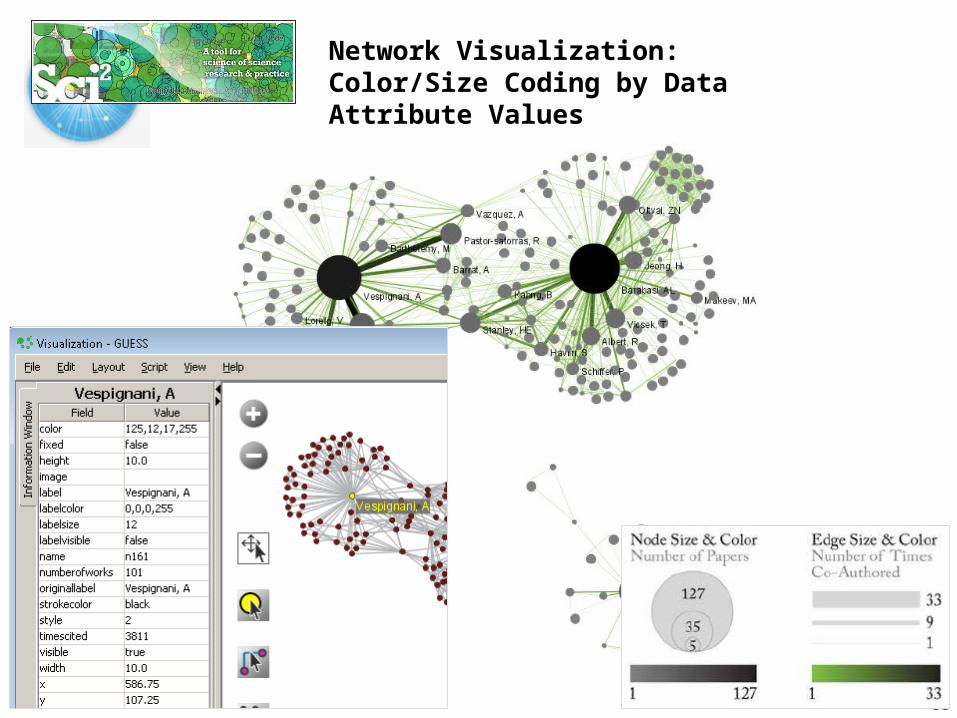
Network Visualization: Color/Size Coding by Data Attribute Values
55
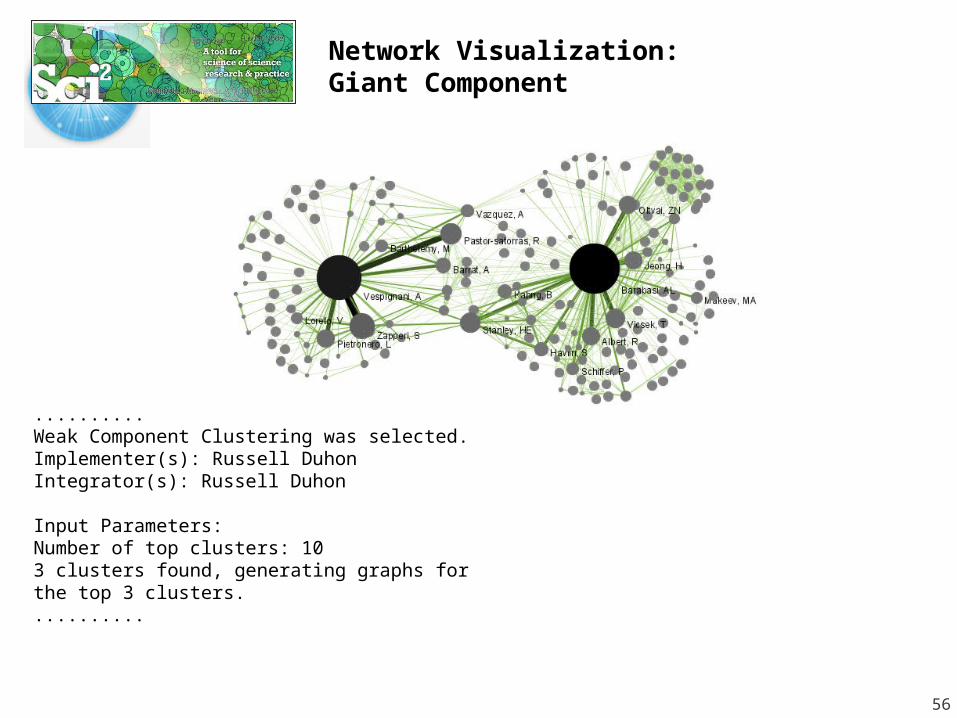
Network Visualization: Giant Component
56
..........Weak Component Clustering was selected.Implementer(s): Russell DuhonIntegrator(s): Russell Duhon
Input Parameters:Number of top clusters: 103 clusters found, generating graphs for the top 3 clusters...........
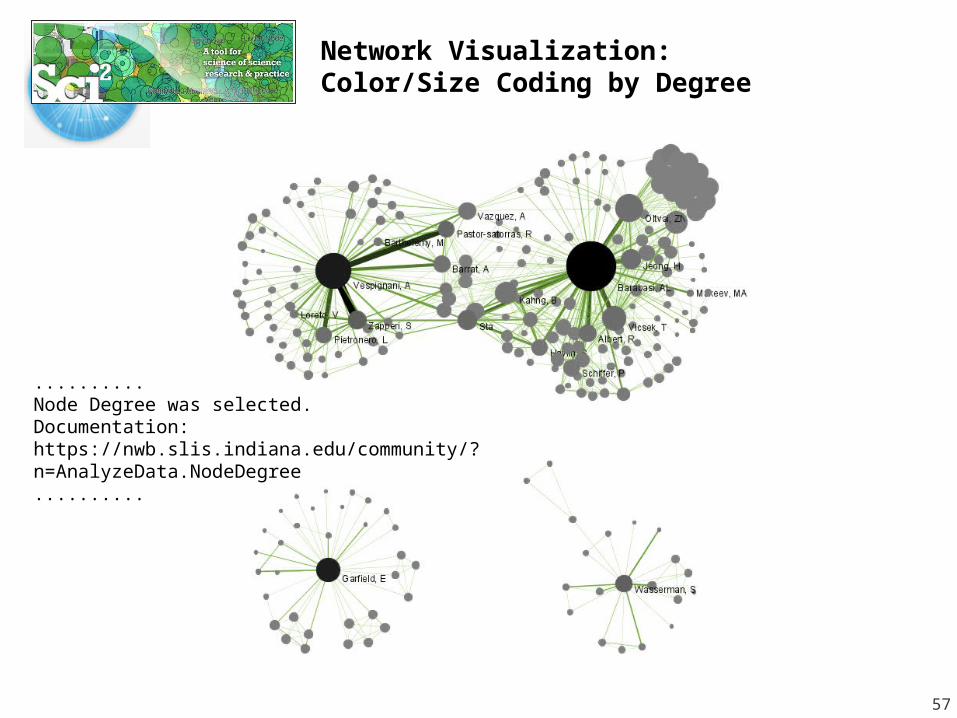
Network Visualization: Color/Size Coding by Degree
57
..........Node Degree was selected.Documentation: https://nwb.slis.indiana.edu/community/?n=AnalyzeData.NodeDegree..........
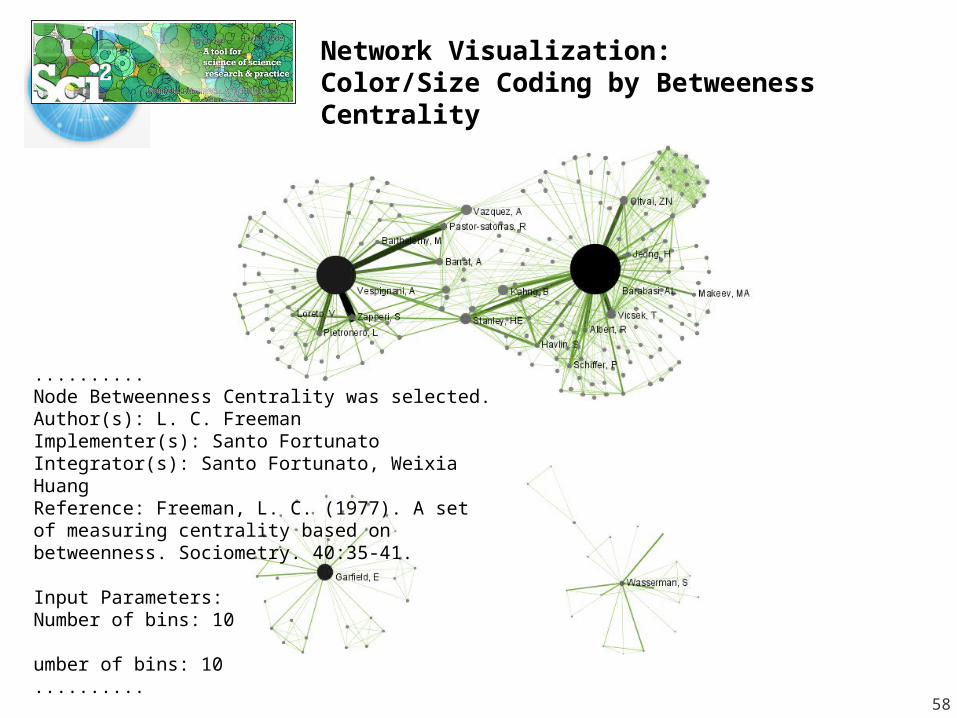
Network Visualization: Color/Size Coding by Betweeness Centrality
58
..........Node Betweenness Centrality was selected.Author(s): L. C. FreemanImplementer(s): Santo FortunatoIntegrator(s): Santo Fortunato, Weixia HuangReference: Freeman, L. C. (1977). A set of measuring centrality based on betweenness. Sociometry. 40:35-41.
Input Parameters:Number of bins: 10 umber of bins: 10..........
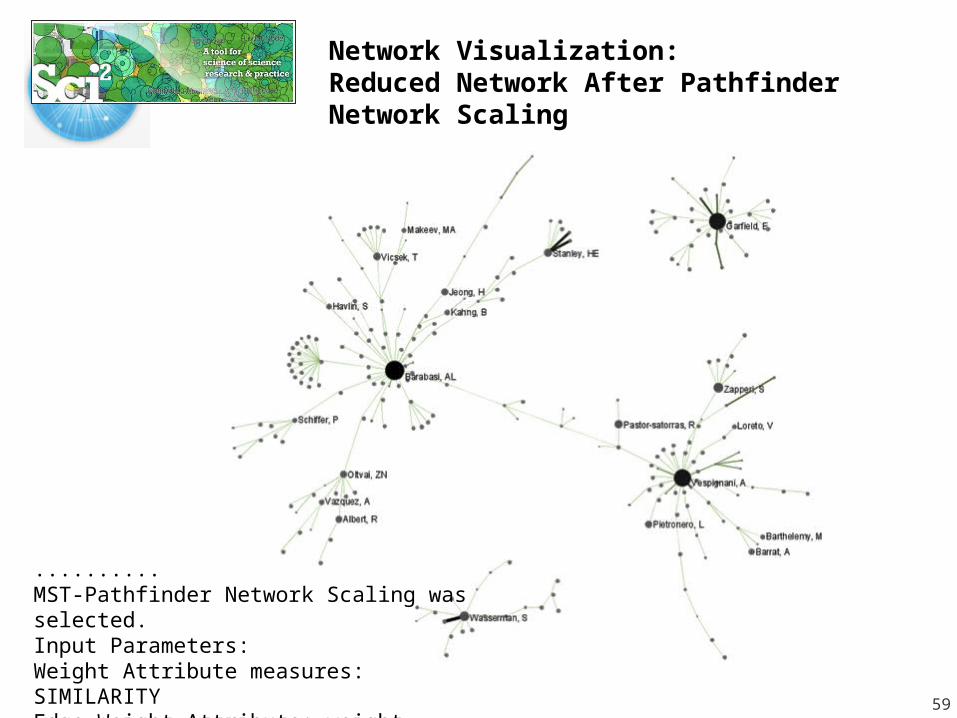
Network Visualization: Reduced Network After Pathfinder Network Scaling
59
..........MST-Pathfinder Network Scaling was selected.Input Parameters:Weight Attribute measures: SIMILARITYEdge Weight Attribute: weight..........
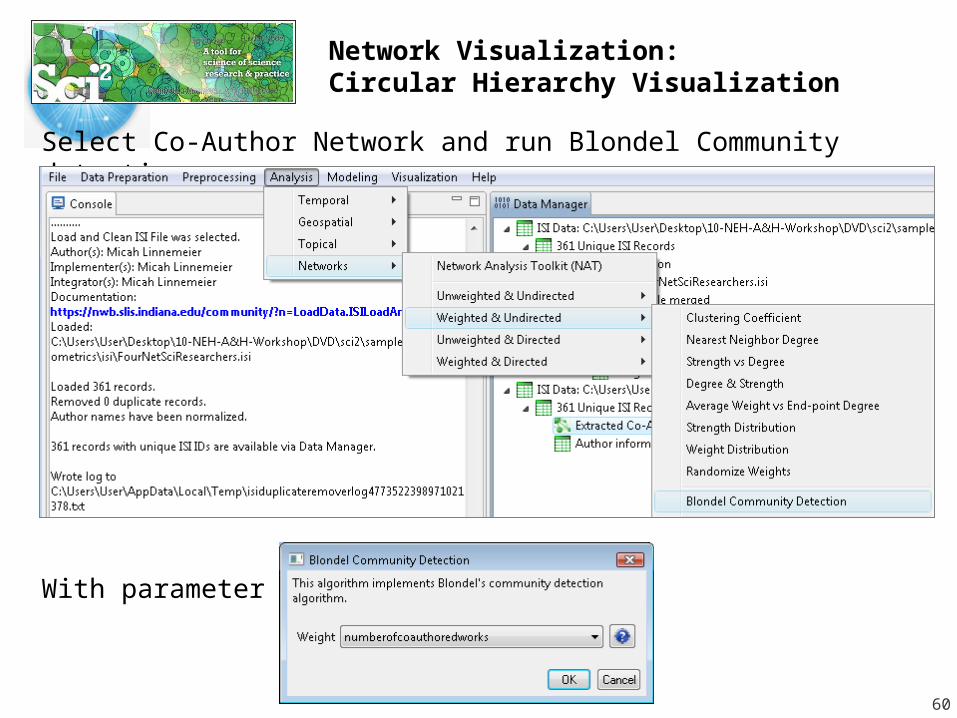
Network Visualization: Circular Hierarchy Visualization
60
Select Co-Author Network and run Blondel Community detection:
With parameter values
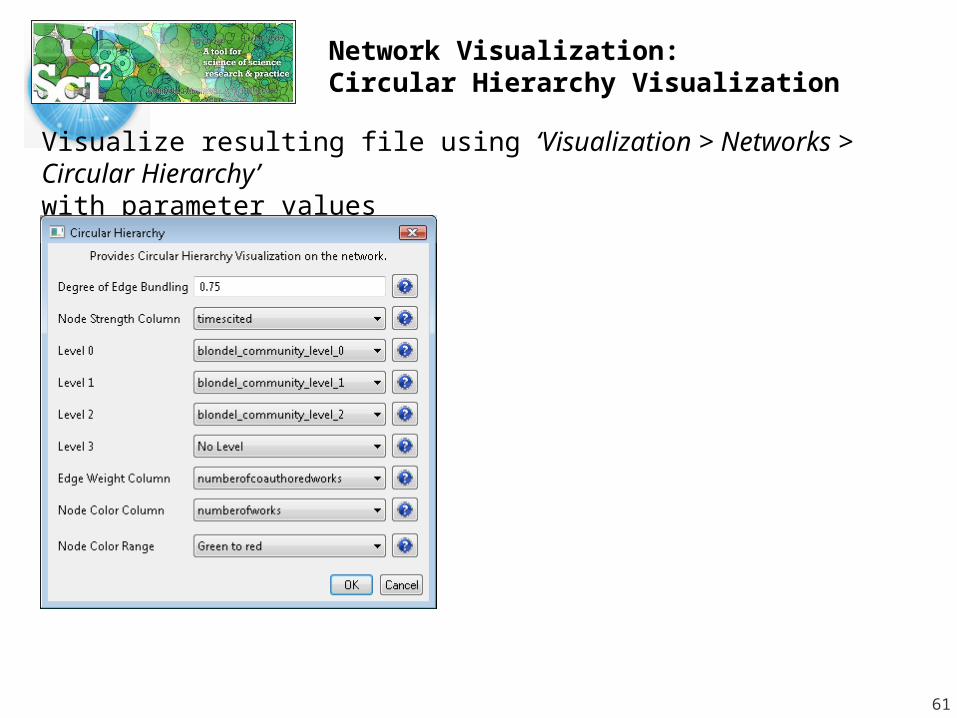
Network Visualization: Circular Hierarchy Visualization
61
Visualize resulting file using ‘Visualization > Networks > Circular Hierarchy’with parameter values
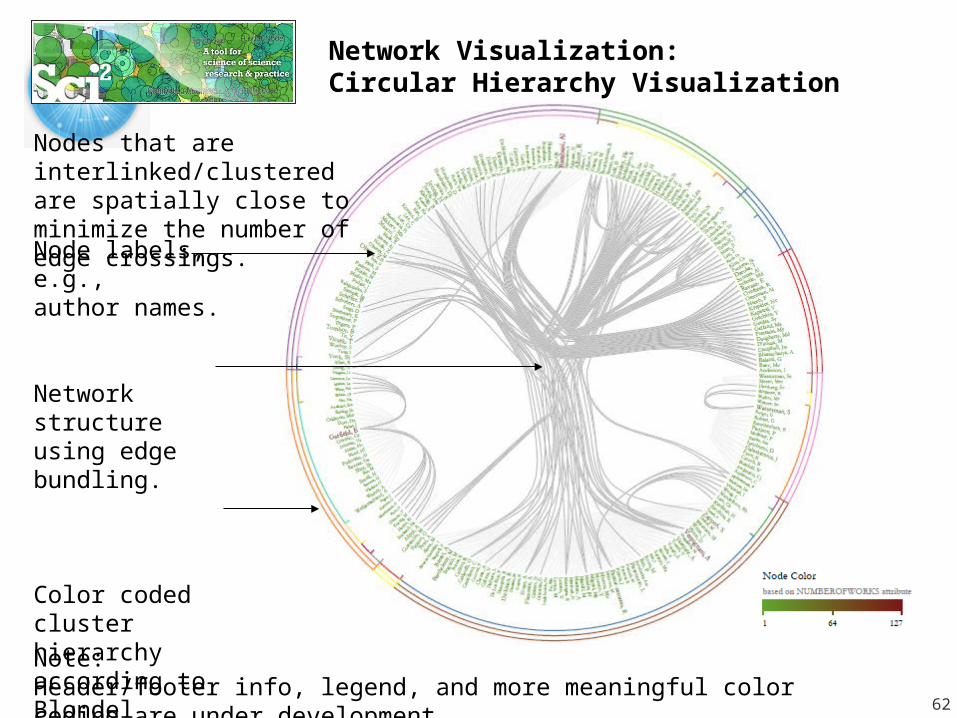
Network Visualization: Circular Hierarchy Visualization
62
Node labels, e.g., author names.
Network structure using edge bundling.
Color coded cluster hierarchy according to Blondel community detection algorithm.
Note:Header/footer info, legend, and more meaningful color coding are under development.
Nodes that are interlinked/clustered are spatially close to minimize the number of edge crossings.
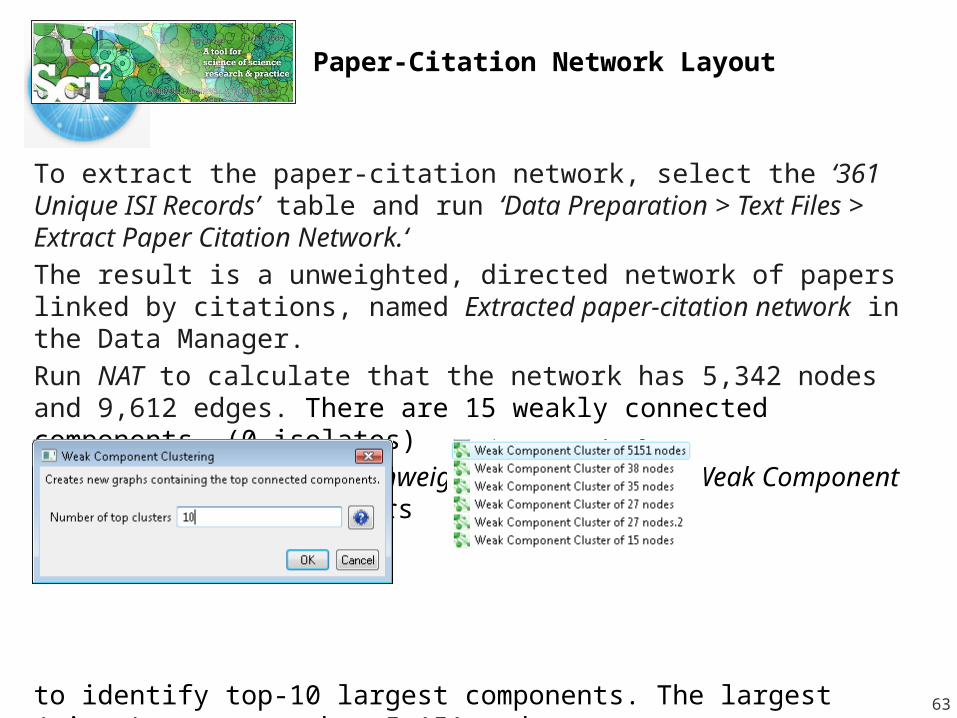
Paper-Citation Network Layout
To extract the paper-citation network, select the ‘361 Unique ISI Records’ table and run ‘Data Preparation > Text Files > Extract Paper Citation Network.‘The result is a unweighted, directed network of papers linked by citations, named Extracted paper-citation network in the Data Manager.Run NAT to calculate that the network has 5,342 nodes and 9,612 edges. There are 15 weakly connected components. (0 isolates)Run ‘Analysis > Networks > Unweighted and Directed > Weak Component Clustering’ with parameters
to identify top-10 largest components. The largest (giant) component has 5,151 nodes.
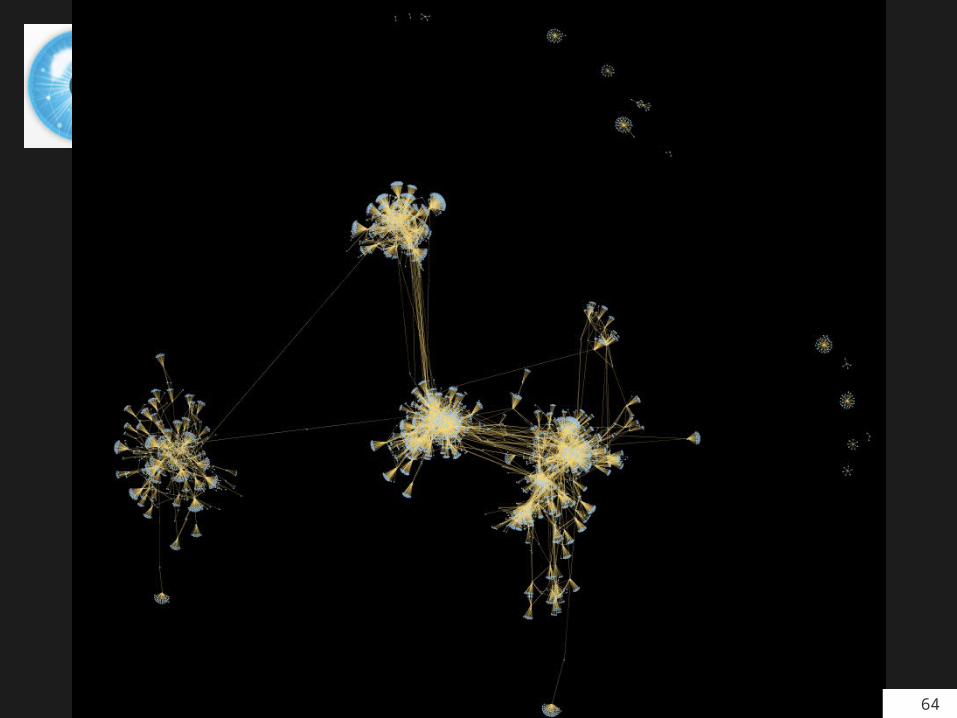
To view the complete network, select the network and run ‘Visualization > GUESS’.
63
64
10:55-11:05 The Importance and Dangers of Visualization – Use & Theory
11:05-11:20 The Epistolarium – Networks, Topics & Tools11:20-11:25 Computational Modeling 11:25-11:35 Move to other room11:35-11:50 Sci2 Tool Basics 11:50-12:10 Sci2 Workflow Design: Padgett's Florentine
Families - Prepare, load, analyze, and visualize family and business networks from 15th century Florence.
12:10-12:20 Q&A and Technical Assistance
Workshop Overview
65
Workflow Design:Padgett’s Florentine Families
66
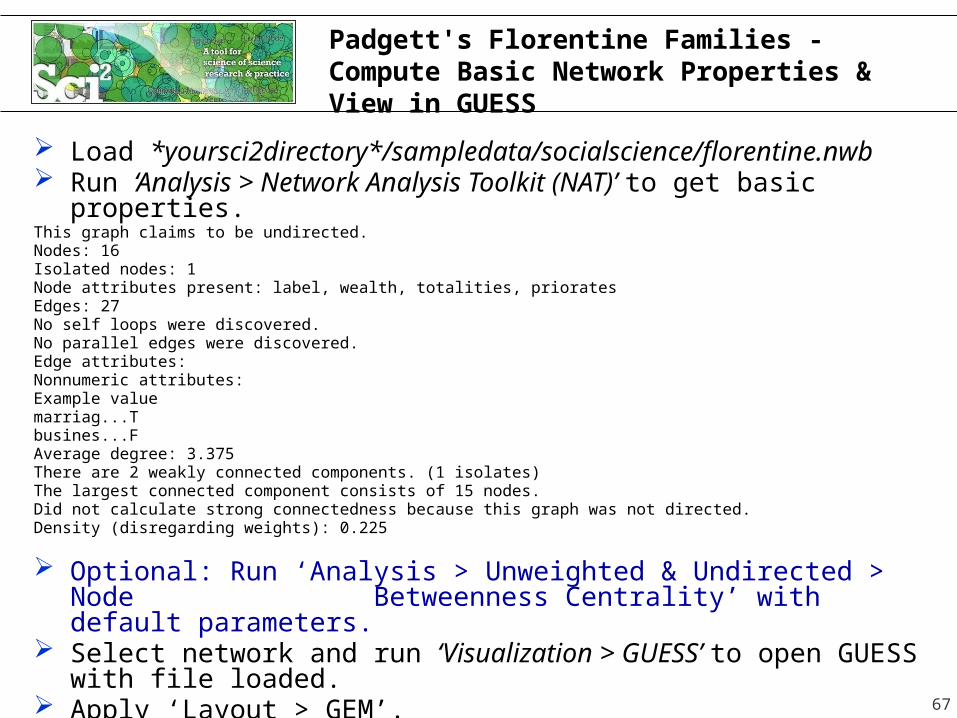
Padgett's Florentine Families - Compute Basic Network Properties & View in GUESS
Load *yoursci2directory*/sampledata/socialscience/florentine.nwb
Run ‘Analysis > Network Analysis Toolkit (NAT)’ to get basic properties.
This graph claims to be undirected.Nodes: 16Isolated nodes: 1Node attributes present: label, wealth, totalities, prioratesEdges: 27No self loops were discovered.No parallel edges were discovered.Edge attributes:Nonnumeric attributes:Example valuemarriag...Tbusines...FAverage degree: 3.375There are 2 weakly connected components. (1 isolates)The largest connected component consists of 15 nodes.Did not calculate strong connectedness because this graph was not directed.Density (disregarding weights): 0.225
Optional: Run ‘Analysis > Unweighted & Undirected > Node Betweenness Centrality’ with default
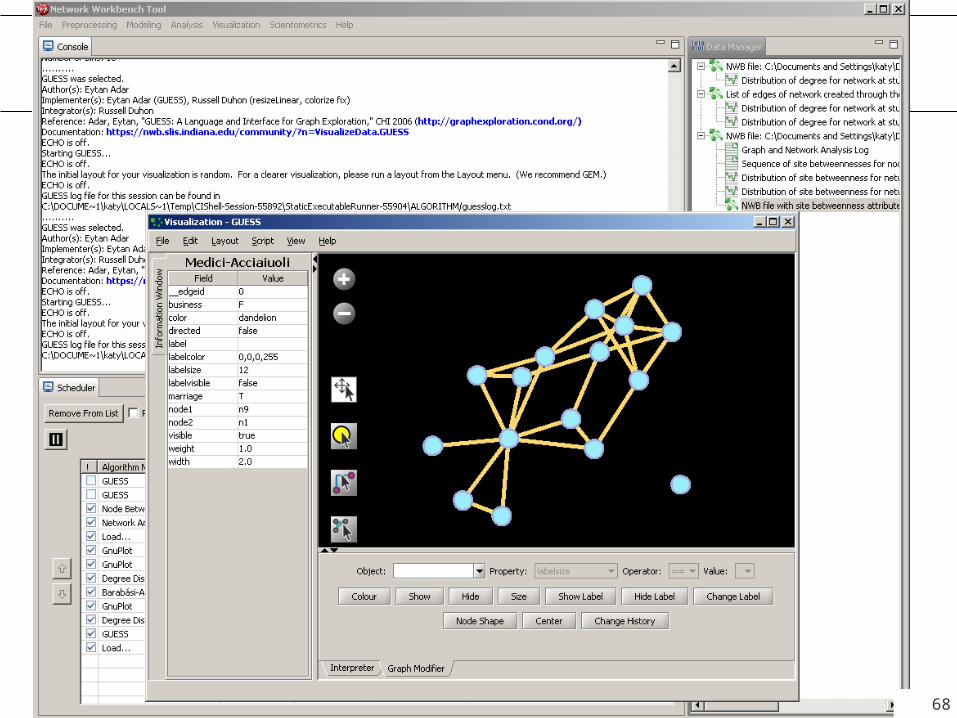
parameters. Select network and run ‘Visualization > GUESS’ to open
GUESS with file loaded. Apply ‘Layout > GEM’. Open NWB File
67
68
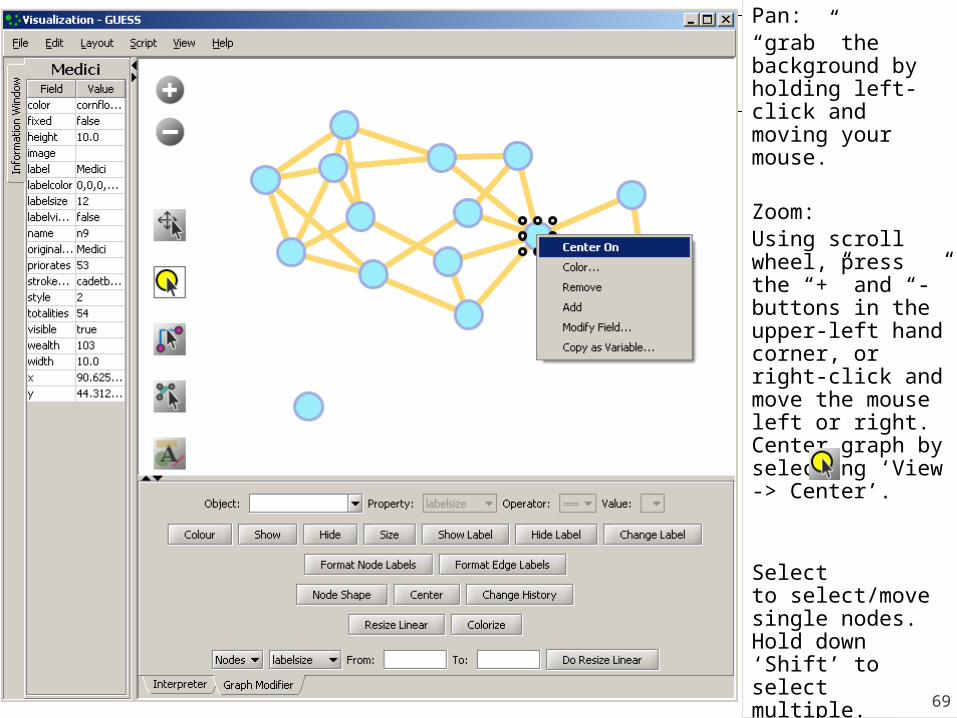
Pan:“grab” the background by holding left-click and moving your mouse.
Zoom:Using scroll wheel, press the “+” and “-” buttons in the upper-left hand corner, or right-click and move the mouse left or right. Center graph by selecting ‘View -> Center’.
Select to select/move single nodes. Hold down ‘Shift’ to select multiple.
Right click to modify Color, etc.
69
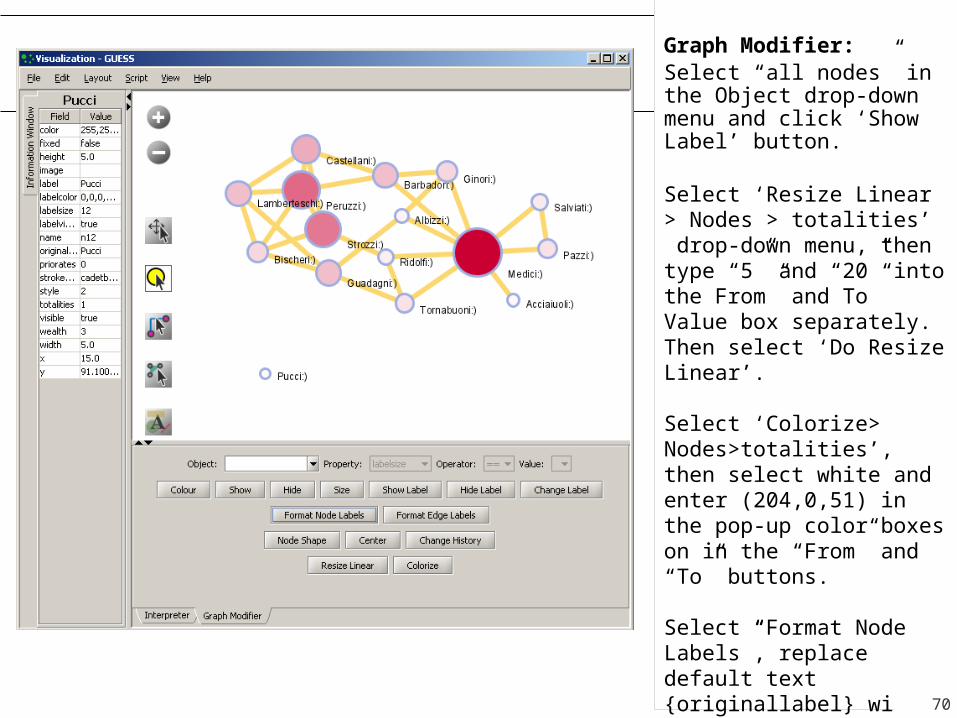
Graph Modifier:Select “all nodes” in the Object drop-down menu and click ‘Show Label’ button.
Select ‘Resize Linear > Nodes > totalities’ drop-down menu, then type “5” and “20” into the From” and To” Value box separately. Then select ‘Do Resize Linear’.
Select ‘Colorize> Nodes>totalities’, then select white and enter (204,0,51) in the pop-up color boxes on in the “From” and “To” buttons.
Select “Format Node Labels”, replace default text {originallabel} with your own label in the pop-up box ‘Enter a formatting string for node labels.’
70
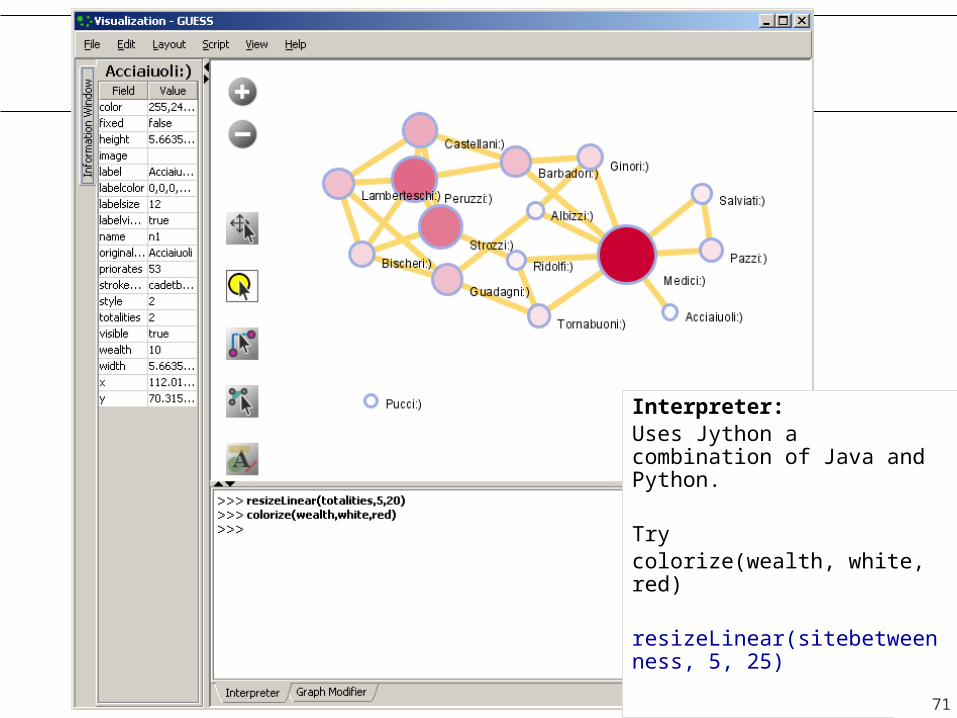
Interpreter:Uses Jython a combination of Java and Python.
Trycolorize(wealth, white, red)
resizeLinear(sitebetweenness, 5, 25)
71
10:55-11:05 The Importance and Dangers of Visualization – Use & Theory
11:05-11:20 The Epistolarium – Networks, Topics & Tools11:20-11:25 Computational Modeling 11:25-11:35 Move to other room11:35-11:50 Sci2 Tool Basics 11:50-12:10 Sci2 Workflow Design: Padgett's Florentine
Families - Prepare, load, analyze, and visualize family and business networks from 15th century Florence.
12:10-12:20 Q&A and Technical Assistance
Workshop Overview
72
Related Documents