Vikrum Vishnubhakta APS Healthcare/Forward Consultants Division of Public Health Delaware Health and Social Services OCTOBER 4, 2011 Analysis of the 2007 Delaware Birth Defects Registry

Welcome message from author
This document is posted to help you gain knowledge. Please leave a comment to let me know what you think about it! Share it to your friends and learn new things together.
Transcript
Vikrum Vishnubhakta
APS Healthcare/Forward Consultants
Division of Public Health Delaware Health and Social Services
OCTOBER 4, 2011
Analysis of the
2007 Delaware
Birth Defects
Registry
ANALYSIS OF THE 2007 BIRTH DEFECTS REGISTRY
Delaware Department of Health and Social Services, Division of Public Health 2
CONTACT
Alisa Olshefsky Chief, Family Health Management Systems Section Delaware Department of Health and Social Services, Division of Public Health 417 Federal Street, Jesse Cooper Building Dover, DE 19901 302.744.4551 Office 302.739.6653 Fax [email protected]
Vikrum Vishnubhakta Consultant/Principal, Forward Consultants on behalf of APS Healthcare 350 South Hamilton Street, Suite 506 Madison, WI 53703 608.208.1670 Office 608.338.0426 Fax [email protected]
CITATION The Division of Public Health will be acknowledged when the report is quoted or referenced using the following format: “Delaware Health and Social Services, Division of Public Health. Analysis of the 2007 Birth Defects Registry. October 4, 2011.”
ANALYSIS OF THE 2007 BIRTH DEFECTS REGISTRY
Delaware Department of Health and Social Services, Division of Public Health 3
EXECUTIVE SUMMARY
Birth defects are among the leading causes of infant death in Delaware and nationwide. For this reason,
the state’s birth defects registry was developed to collect and identify the diverse factors that may cause
birth defects. This report on the birth defects registry has two objectives:
1. To provide a snapshot of the characteristics of mothers and infants listed in the birth defects
registry, focusing only on those infants who were born to Delaware residents in 2007 (“registered
infants”).
2. To compare the demographic and health attributes of these infants to all infants born to Delaware
residents in 2007.
To answer these objectives, a comprehensive set of analyses was performed on the mothers of the infants
listed in the registry, on the infants listed in the registry, and on the registry itself. These analyses
included but were not limited to a comparison of the demographic indicators and health status of mothers
in the registry compared to all Delaware residents that gave birth in 2007, and an assessment of infants in
the registry that expired within one year after birth. In addition, an investigation was conducted on
whether infants listed in the registry were diagnosed with the same birth defect as a family member,
recognizing the limitations that reported birth defect(s) of family member(s) were based on the mother’s
recollection of the birth defect(s) and that the medical records of the family member(s) were not
reviewed.
Results indicate that mothers to infants in the registry had generally the same age, education, race and
ethnicity, and gravida as all Delaware residents that gave birth in 2007. Moreover, certain findings
paralleled those found other Delaware-specific maternal health assessments.
ANALYSIS OF THE 2007 BIRTH DEFECTS REGISTRY
Delaware Department of Health and Social Services, Division of Public Health 4
TABLE OF CONTENTS
INTRODUCTION..............................................................................................................................5
METHODOLOGY .............................................................................................................................6
Procedure for Case Finding and Ascertainment...............................................................................6
Creation of a Potential Case List .....................................................................................................6
Case Ascertainment through Medical Records .................................................................................8
Analysis of the Registry ..................................................................................................................8
CHARACTERISTICS OF THE REGISTRY ......................................................................................8
CHARACTERISTICS OF MOTHERS IN THE REGISTRY ...............................................................9
Mother’s Residence ........................................................................................................................9
Mother’s Age .................................................................................................................................9
Mother’s Education...................................................................................................................... 10
Mother’s Race and Ethnicity ........................................................................................................ 10
Mother’s Pregnancy History ......................................................................................................... 11
Gravida .................................................................................................................................... 11
Previous Infant Death................................................................................................................. 11
Live Children ............................................................................................................................ 11
Vitamin Use ................................................................................................................................. 12
Prenatal Carey ............................................................................................................................. 12
Maternal Illnesses, Conditions, and Complications ........................................................................ 13
CHARACTERISTICS OF INFANTS IN THE REGISTRY ............................................................... 18
Facility of Birth............................................................................................................................ 18
Gestational Weeks........................................................................................................................ 18
Pregnancy Outcome ..................................................................................................................... 19
Plurality ...................................................................................................................................... 19
Gender ........................................................................................................................................ 19
Growth Percentiles....................................................................................................................... 20
Weight Percentiles ..................................................................................................................... 20
Length (Stature) Percentiles ........................................................................................................ 21
Head Circumference Percentiles.................................................................................................. 21
Family Member with Birth Defect................................................................................................. 24
Infant Deaths in the Registry ........................................................................................................ 26
Characteristics of the Expired Infants........................................................................................... 27
Reported Birth Defects of the Infant Deaths in the Registry ............................................................. 28
Family Member with Birth Defect among Infant Deaths in the Registry ............................................ 29
Illnesses, Conditions, and Complications of Mothers of the Infant Deaths in the Registry .................... 29
DISCUSSION .................................................................................................................................. 30
APPENDIX A. Birth Defects Registry Reportable Diagnoses. ............................................................. 32
APPENDIX B. Birth Defects Registry Fields...................................................................................... 35
APPENDIX C.1. Mother’s Race and Ethnicity................................................................................... 38
APPENDIX C.2. Gravida. ................................................................................................................ 42
APPENDIX C.3. Gestational Weeks. ................................................................................................. 47
REFERENCES ................................................................................................................................ 51
ANALYSIS OF THE 2007 BIRTH DEFECTS REGISTRY
Delaware Department of Health and Social Services, Division of Public Health 5
INTRODUCTION
A birth defect, or congenital anomaly, is an abnormality of structure, function, or metabolism that
typically occurs to an infant prior to birth and can cause mental or physical disabilities or even death.1
Approximately 120,000 infants (3% of all infants) in the United States are born with birth defects,2 and
nationwide, birth defects are the leading cause of death in the first year of life.3 In Delaware, birth defects
were the second leading cause of infant mortality in the 2004-2008 period, accounting for 13.2 percent of
all infant deaths.4 Although genetic and environmental factors – individually or in combination – can
cause birth defects, the causes of 7 out of 10 birth defects are unknown.1
The Delaware Birth Defects Registry is a statewide program that collects and analyzes information on
children with birth defects.5 The intent of the registry is to identify the environmental, genetic, and health
risk factors that may ultimately cause birth defects. To be included as a case in the Delaware Birth
Defects Registry, all of the following criteria must be met:
The mother must reside in Delaware at the time of delivery/pregnancy outcome.
The infant or fetus must have a birth defect or developmental disability monitored by the registry.
The birth defect must be diagnosed prenatally or within one year after delivery.
The case definition includes all pregnancy outcomes (i.e., live births, spontaneous fetal deaths, and
induced pregnancy terminations for a fetus weighing at least 350 grams, or in the absence of weight, 20
weeks of gestation).
This report has two objectives:
1. To provide a snapshot of the characteristics of mothers and infants listed in the birth defects
registry, focusing only on those infants who were born to Delaware residents in 2007 (“registered
infants”).
2. To compare the demographic and health attributes of these infants to all infants born to Delaware
residents in 2007. This may assist in investigations on feto-infant health disparities and on
policies relevant to maternal and child health.
These objectives can be answered through a meticulous analysis of the demographics, prior pregnancy
history, and health conditions of the mother and an assessment of the reported birth defects and health
status of the infant.
ANALYSIS OF THE 2007 BIRTH DEFECTS REGISTRY
Delaware Department of Health and Social Services, Division of Public Health 6
METHODOLOGY
Procedure for Case Finding and Ascertainment
Entries in the birth defects registry (“cases”) are identified through a routine review of primary source
records. Primary sources currently include, but are not limited to, the following:
Electronic birth records.
Hospital electronic and paper medical records.
Maternal Fetal Medicine electronic records.
Vital Statistics.
Licensed birthing centers.
Cases are ascertained from multiple sources along three broad paths.
First Path. The records of birth hospitals, licensed birthing centers, and midwives provide the
first path for case detection. The frequency of visits to each facility is determined in part by the
number of births per year in that facility. The Program Manager requests a list of all patients that
were discharged during a specified birth cohort year that have one or more of the codes listed in
Appendix A.
Second Path. A second path for case detection involves collecting information from places where
children may be prenatally diagnosed or where pregnancies may be terminated. The Program
Manager requests a list of all patients that received prenatal care or testing from the Maternal
Fetal Medicine groups during the specific birth cohort being abstracted and resulted in a diagnosis
of one or more of the codes listed in Appendix A.
Third Path. A third path of case detection involves the review of other sources by the program
staff. One of these sources is the Delaware Office of Vital Statistics, which provides a list of
names and date of birth or date of death. In addition to these records, staff also review other data
sets, such as Hospital Discharge Data and those collected by Newborn Screening – Blood Spot
and Hearing. In addition to serving as a catch for any missed cases, these vital record reviews
also provide a means for verifying data on completed cases and a source of data for incomplete
cases.
Creation of a Potential Case List
Potential case lists are requested by the Program Manager through each institution’s medical records
department. Lists are created using software to query all births and/or fetal deaths for the ICD-9 codes
tracked by the registry. When an institutional list is received it is validated for the appropriate codes and
any erroneous codes that are not tracked by the registry are removed. The lists are provided in a vertical
ANALYSIS OF THE 2007 BIRTH DEFECTS REGISTRY
Delaware Department of Health and Social Services, Division of Public Health 7
formation in which each case has one line of data for each defect noted in the chart. The Program
Manager uses SPSS software to flatten the list into a horizontal formation in which each case has only one
line of data with each suspected defect listed one after another. The fetal death, infant death, birth
certificate and newborn screening lists are also prepared in this fashion. To obtain the suspected defects
and/or cause of death from the fetal death list a codebook of diagnoses provided by the Office of Vital
Statistics is used. The infant death list is provided with ICD-10 diagnoses which are translated into ICD-
9 for consistency in the registry. The newborn screening list provides a description in words to note the
screening abnormality which is transferred into ICD-9 codes by the registry team. The maternal fetal
medicine groups provide potential case defect descriptions through cytogenic reports and fetal therapy
lists which are also translated into ICD-9 codes by the registry team. For any list in which defect
descriptions are provided and ICD-9 codes are translated, both the code and original defect description are
maintained in the registry for validation purposes.
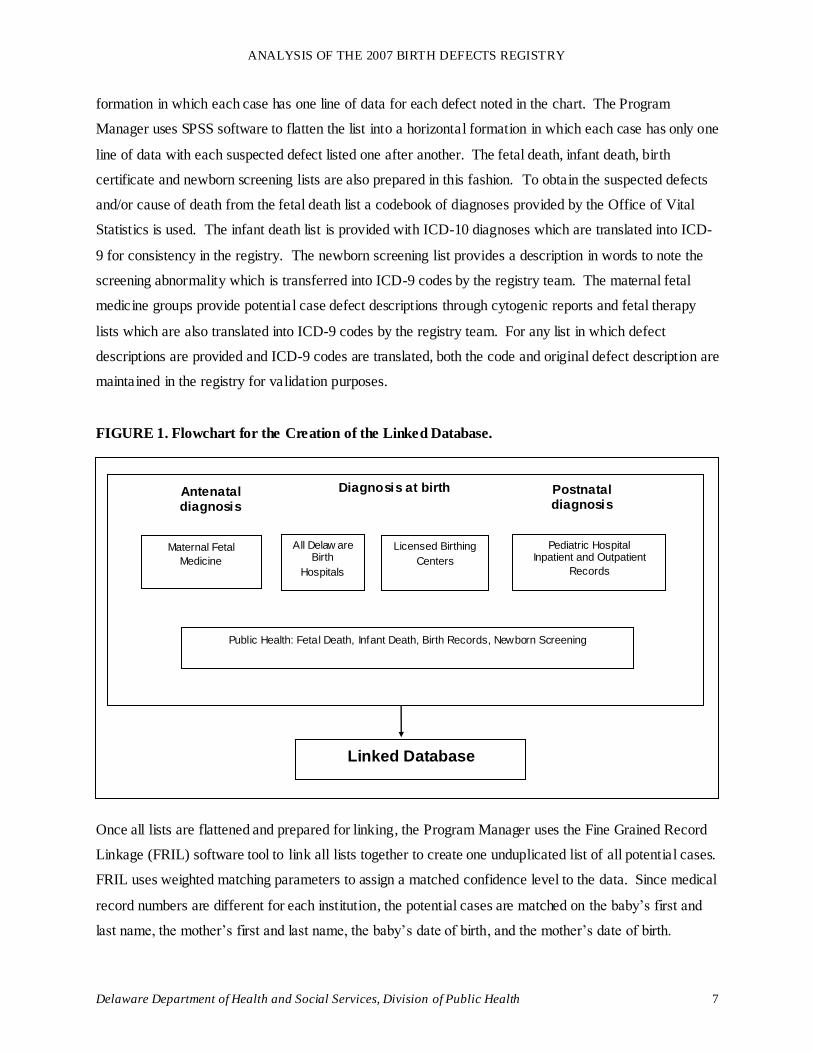
FIGURE 1. Flowchart for the Creation of the Linked Database.
Once all lists are flattened and prepared for linking, the Program Manager uses the Fine Grained Record
Linkage (FRIL) software tool to link all lists together to create one unduplicated list of all potential cases.
FRIL uses weighted matching parameters to assign a matched confidence level to the data. Since medical
record numbers are different for each institution, the potential cases are matched on the baby’s first and
last name, the mother’s first and last name, the baby’s date of birth, and the mother’s date of birth.
Maternal Fetal
Medicine All Delaw are
Birth
Hospitals
Licensed Birthing
Centers Pediatric Hospital
Inpatient and Outpatient
Records
Public Health: Fetal Death, Infant Death, Birth Records, Newborn Screening
Linked Database
Antenatal diagnosis
Diagnosis at birth Postnatal diagnosis
ANALYSIS OF THE 2007 BIRTH DEFECTS REGISTRY
Delaware Department of Health and Social Services, Division of Public Health 8
Mother’s date of birth is not always available, especially from the pediatric hospital, in which case only
the mother’s name is used to match. When lists are matched together the data from institution #1 is
linked to institution #2. If the same mother/child pair exists in both datasets that pair is linked together in
order for the ICD-9 codes and suspected defects from both institutions to be associated with that child.
This linking process maintains a unique list of cases in which no child is duplicated but rather data from
subsequent institutions is appended to the already existing data for that child.
Upon completion of the unduplicated list , the Program Manger automatically uploads all potential case
information into the Delaware Birth Defects Registry Access database housed within Christiana Care
Health System. The Program Assistants/Chart Abstractors use the unduplicated list in the Microsoft
Access database to complete their case confirmation and abstraction. The Program Manager can sort the
unduplicated case list by defect group or institution using SPSS or the Microsoft Access database.
Case Ascertainment through Medical Records
If any of the conditions in Appendix A appear during the case finding process, the medical record
undergoes a full review for any reportable defects that may be associated with these conditions. A Case
Abstraction Form is then completed on all medical records where a reportable condition is confirmed.
Once a Case Abstraction Form is completed on a confirmed case, additional information is entered in the
Access Database. If the case is confirmed as a non-case, Program Assistants code this as “not a case” in
the database and no further information is collected for that case. A clinical geneticist makes the
confirmation of whether a case was a case or a non-case. All cases and non-cases are documented on the
Delaware Birth Defects Progress Sheet for that cohort year.
Analysis of the Registry
Christiana Care Health System submitted the complete 2007 Delaware Birth Defects Registry database to
the Delaware Division of Public Health (DPH). DPH made the database available to APS Healthcare, the
contracted evaluation specialist. APS Healthcare uploaded the database – set up as a secure Microsoft
Excel spreadsheet – to Microsoft Access and analyzed the data using SQL code. Graphs, percent
calculations, statistical analysis, and tables were generated in Microsoft Excel.
CHARACTERISTICS OF THE REGISTRY
Appendix B lists the fields included in the 2007 Delaware Birth Defects Registry. The registry consists
of 483 unique infants. It is important to note that many of the fields listed in Appendix B do not have
ANALYSIS OF THE 2007 BIRTH DEFECTS REGISTRY
Delaware Department of Health and Social Services, Division of Public Health 9
data for each of the 483 infants. For this reason, the counts may not add to 483 in several of the tables in
this analysis.
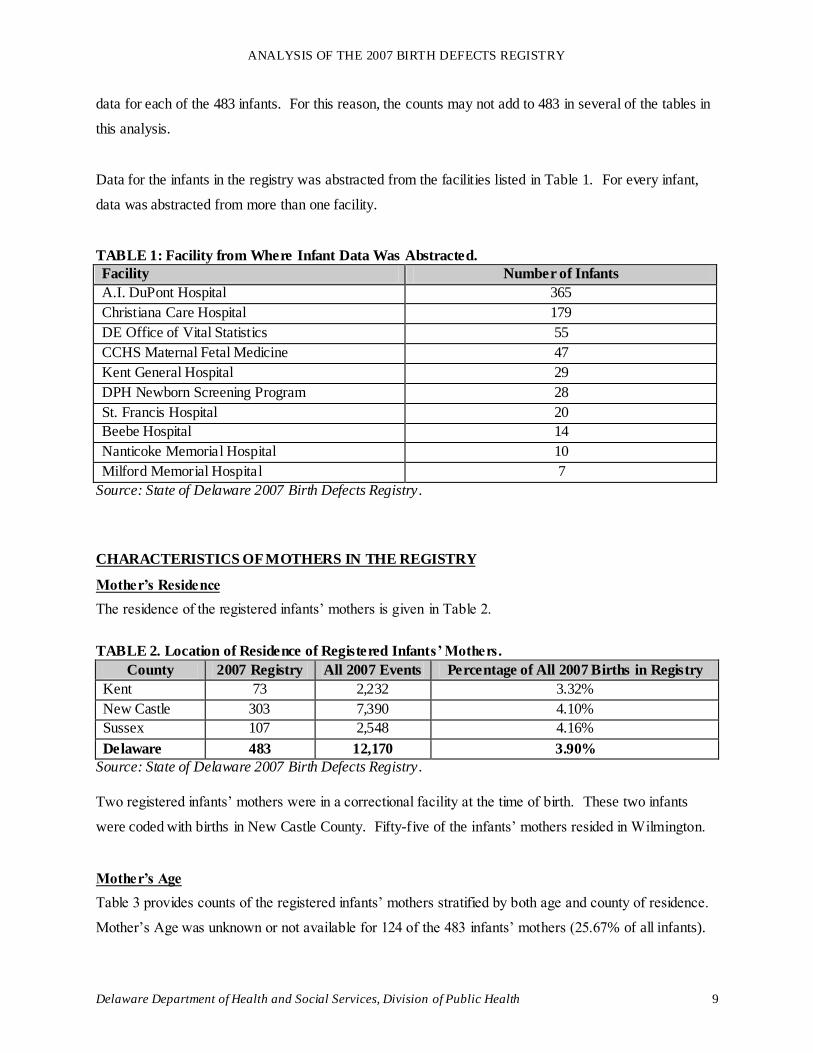
Data for the infants in the registry was abstracted from the facilities listed in Table 1. For every infant,
data was abstracted from more than one facility.
TABLE 1: Facility from Where Infant Data Was Abstracted.
Facility Number of Infants
A.I. DuPont Hospital 365
Christiana Care Hospital 179
DE Office of Vital Statistics 55
CCHS Maternal Fetal Medicine 47
Kent General Hospital 29
DPH Newborn Screening Program 28
St. Francis Hospital 20
Beebe Hospital 14
Nanticoke Memorial Hospital 10
Milford Memorial Hospital 7
Source: State of Delaware 2007 Birth Defects Registry.
CHARACTERISTICS OF MOTHERS IN THE REGISTRY
Mother’s Residence
The residence of the registered infants’ mothers is given in Table 2.
TABLE 2. Location of Residence of Registered Infants’ Mothers.
County 2007 Registry All 2007 Events Percentage of All 2007 Births in Registry
Kent 73 2,232 3.32%
New Castle 303 7,390 4.10%
Sussex 107 2,548 4.16%
Delaware 483 12,170 3.90%
Source: State of Delaware 2007 Birth Defects Registry.
Two registered infants’ mothers were in a correctional facility at the time of birth. These two infants
were coded with births in New Castle County. Fifty-five of the infants’ mothers resided in Wilmington.
Mother’s Age
Table 3 provides counts of the registered infants’ mothers stratified by both age and county of residence.
Mother’s Age was unknown or not available for 124 of the 483 infants’ mothers (25.67% of all infants).
ANALYSIS OF THE 2007 BIRTH DEFECTS REGISTRY
Delaware Department of Health and Social Services, Division of Public Health 10
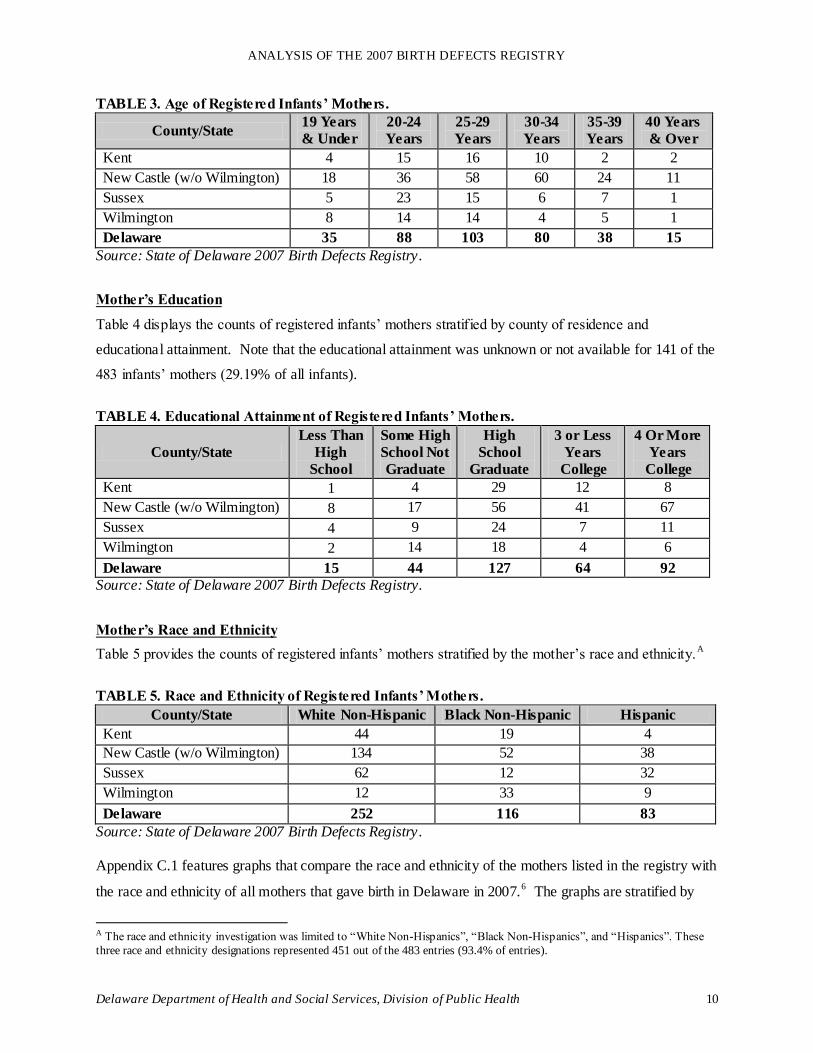
TABLE 3. Age of Registered Infants’ Mothers.
County/State 19 Years
& Under
20-24
Years
25-29
Years
30-34
Years
35-39
Years
40 Years
& Over
Kent 4 15 16 10 2 2
New Castle (w/o Wilmington) 18 36 58 60 24 11
Sussex 5 23 15 6 7 1
Wilmington 8 14 14 4 5 1
Delaware 35 88 103 80 38 15
Source: State of Delaware 2007 Birth Defects Registry.
Mother’s Education
Table 4 displays the counts of registered infants’ mothers stratified by county of residence and
educational attainment. Note that the educational attainment was unknown or not available for 141 of the
483 infants’ mothers (29.19% of all infants).
TABLE 4. Educational Attainment of Registered Infants’ Mothers.
County/State
Less Than
High
School
Some High
School Not
Graduate
High
School
Graduate
3 or Less
Years
College
4 Or More
Years
College
Kent 1 4 29 12 8
New Castle (w/o Wilmington) 8 17 56 41 67
Sussex 4 9 24 7 11
Wilmington 2 14 18 4 6
Delaware 15 44 127 64 92
Source: State of Delaware 2007 Birth Defects Registry.
Mother’s Race and Ethnicity
Table 5 provides the counts of registered infants’ mothers stratified by the mother’s race and ethnicity.A
TABLE 5. Race and Ethnicity of Registered Infants’ Mothers.
County/State White Non-Hispanic Black Non-Hispanic Hispanic
Kent 44 19 4
New Castle (w/o Wilmington) 134 52 38
Sussex 62 12 32
Wilmington 12 33 9
Delaware 252 116 83
Source: State of Delaware 2007 Birth Defects Registry. Appendix C.1 features graphs that compare the race and ethnicity of the mothers listed in the registry with
the race and ethnicity of all mothers that gave birth in Delaware in 2007.6 The graphs are stratified by
A The race and ethnicity investigation was limited to “White Non-Hispanics”, “Black Non-Hispanics”, and “Hispanics”. These
three race and ethnicity designations represented 451 out of the 483 entries (93.4% of entries).
ANALYSIS OF THE 2007 BIRTH DEFECTS REGISTRY
Delaware Department of Health and Social Services, Division of Public Health 11
race and ethnicity (“White Non-Hispanic”, “Black Non-Hispanic”, and “Hispanic”) as well as by the
location of the mother’s residence. With the exception of Sussex County, no statistically significant
differences exist between the percentage of mothers in the registry and all mothers that gave birth in
Delaware in 2007 in the race and ethnicity categories.B In Sussex County, the percentage of mothers in
the registry that were Black non-Hispanic was less than half the percentage of all mothers that gave birth
in the county in 2007 (9.52% compared to 19.51%). The reported number of mothers in the registry that
were Black non-Hispanic in Sussex is 10, which suggests that this difference may not be due to a small
sample size.C Moreover, according to the “Births to Black Non-Hispanic Mothers” graph in Appendix
C.1, these percentages were lower than those reported in the other two counties and in Delaware.
Conversely, for mothers in the registry and all mothers that gave birth in 2007, the percentage of births to
Hispanic mothers is significantly higher in Sussex compared to the other counties and the state overall.
Mother’s Pregnancy History
Gravida
Appendix C.2 shows graphs of the gravida (the total number of times the mother has been pregnant) of
the mother at the child’s birth. These graphs compare the gravida of mothers listed in the registry with
the gravida of all mothers that gave birth in Delaware in 2007.6 The graphs are stratified by the gravida
value (“1”, “2”, “3”, “4”, “5”, and “6 or More”) as well as by the location of the mother’s residence.
With one exception (1 mother in Sussex who had a gravida of 5), no statistically significant differences
exist between the gravida of mothers in the registry and mothers that gave birth in Delaware in 2007.B
Previous Infant Death
One entry in the registry documents that the mother had a previous birth that resulted in a neonatal death
(death between 1 hour and 27 days after birth). Likewise, one entry documents that the mother had a
previous birth that resulted in a postneonatal death (death between 28 days and 365 days after birth).
Live Children
As displayed in Table 6, the majority of registered infants’ mothers had either no live children or one live
child at the time of the birth of the infant entered into the birth defects registry.
B Statistical significance was established using 95% confidence intervals (CI). If the 95% CI do not overlap, the difference
between the two percentages is statistically significant. This does not necessarily mean that no statistically significant difference
exists if the 95% CI overlap (this would result in type II error). However, if the standard error (SE) of the percentages overlap,
the difference is not statistically significant. Each tail of the 95% CI is 1.96 times larger than each tail of the SE. Given these
facts, if the tails of one of the 95% CI bars are wholly in the tails of the other 95% CI bar, then it can be stated that no statisticaly significant difference exists (a variation of the “rule of eye” test). C A small sample size is generally defined as a value less than 5.
ANALYSIS OF THE 2007 BIRTH DEFECTS REGISTRY
Delaware Department of Health and Social Services, Division of Public Health 12
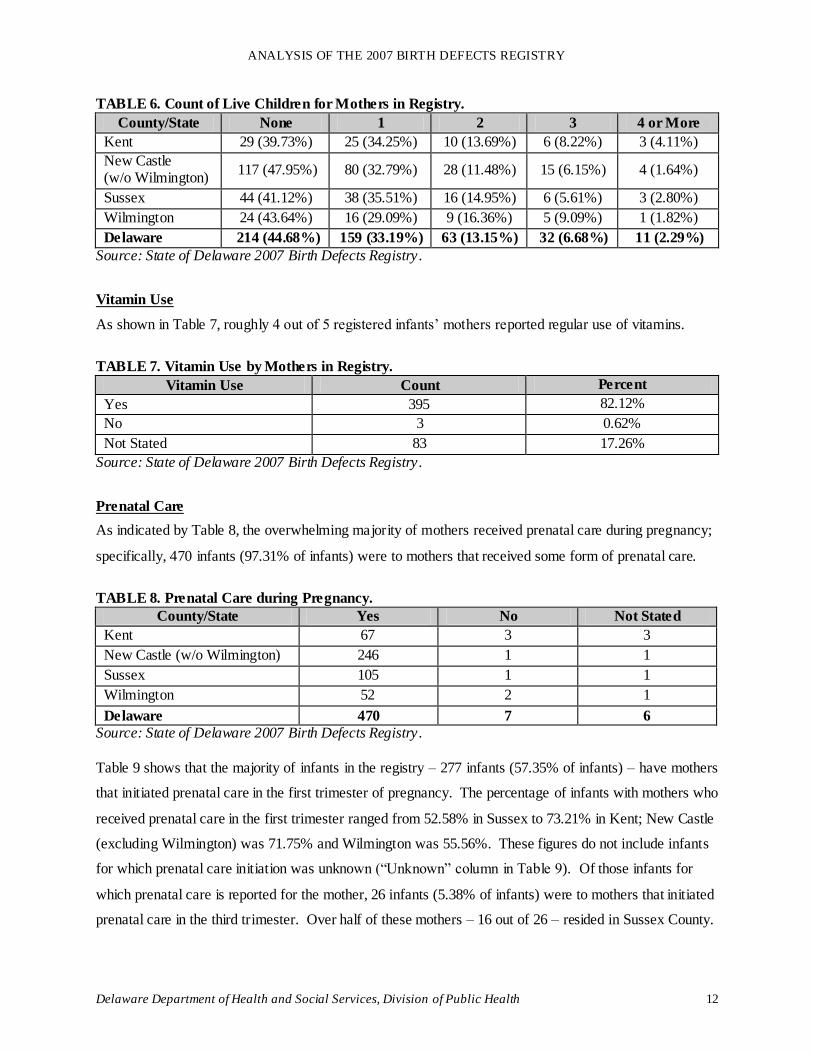
TABLE 6. Count of Live Children for Mothers in Registry.
County/State None 1 2 3 4 or More
Kent 29 (39.73%) 25 (34.25%) 10 (13.69%) 6 (8.22%) 3 (4.11%)
New Castle (w/o Wilmington)
117 (47.95%) 80 (32.79%) 28 (11.48%) 15 (6.15%) 4 (1.64%)
Sussex 44 (41.12%) 38 (35.51%) 16 (14.95%) 6 (5.61%) 3 (2.80%)
Wilmington 24 (43.64%) 16 (29.09%) 9 (16.36%) 5 (9.09%) 1 (1.82%)
Delaware 214 (44.68%) 159 (33.19%) 63 (13.15%) 32 (6.68%) 11 (2.29%)
Source: State of Delaware 2007 Birth Defects Registry.
Vitamin Use
As shown in Table 7, roughly 4 out of 5 registered infants’ mothers reported regular use of vitamins.
TABLE 7. Vitamin Use by Mothers in Registry.
Vitamin Use Count Percent
Yes 395 82.12%
No 3 0.62%
Not Stated 83 17.26%
Source: State of Delaware 2007 Birth Defects Registry.
Prenatal Care
As indicated by Table 8, the overwhelming majority of mothers received prenatal care during pregnancy;
specifically, 470 infants (97.31% of infants) were to mothers that received some form of prenatal care.
TABLE 8. Prenatal Care during Pregnancy.
County/State Yes No Not Stated
Kent 67 3 3
New Castle (w/o Wilmington) 246 1 1
Sussex 105 1 1
Wilmington 52 2 1
Delaware 470 7 6
Source: State of Delaware 2007 Birth Defects Registry.
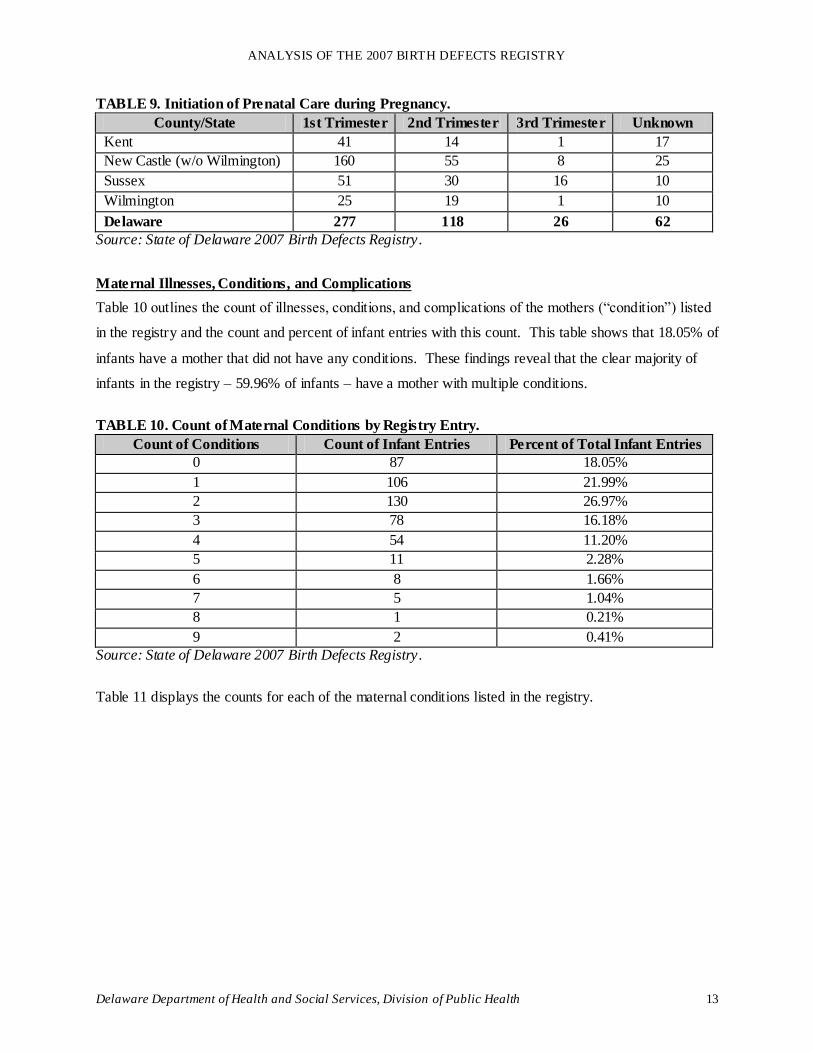
Table 9 shows that the majority of infants in the registry – 277 infants (57.35% of infants) – have mothers
that initiated prenatal care in the first trimester of pregnancy. The percentage of infants with mothers who
received prenatal care in the first trimester ranged from 52.58% in Sussex to 73.21% in Kent; New Castle
(excluding Wilmington) was 71.75% and Wilmington was 55.56%. These figures do not include infants
for which prenatal care initiation was unknown (“Unknown” column in Table 9). Of those infants for
which prenatal care is reported for the mother, 26 infants (5.38% of infants) were to mothers that initiated
prenatal care in the third trimester. Over half of these mothers – 16 out of 26 – resided in Sussex County.
ANALYSIS OF THE 2007 BIRTH DEFECTS REGISTRY
Delaware Department of Health and Social Services, Division of Public Health 13
TABLE 9. Initiation of Prenatal Care during Pregnancy.
County/State 1st Trimester 2nd Trimester 3rd Trimester Unknown
Kent 41 14 1 17
New Castle (w/o Wilmington) 160 55 8 25
Sussex 51 30 16 10
Wilmington 25 19 1 10
Delaware 277 118 26 62
Source: State of Delaware 2007 Birth Defects Registry.
Maternal Illnesses, Conditions, and Complications
Table 10 outlines the count of illnesses, conditions, and complications of the mothers (“condition”) listed
in the registry and the count and percent of infant entries with this count. This table shows that 18.05% of
infants have a mother that did not have any conditions. These findings reveal that the clear majority of
infants in the registry – 59.96% of infants – have a mother with multiple conditions.
TABLE 10. Count of Maternal Conditions by Registry Entry.
Count of Conditions Count of Infant Entries Percent of Total Infant Entries
0 87 18.05%
1 106 21.99%
2 130 26.97%
3 78 16.18%
4 54 11.20%
5 11 2.28%
6 8 1.66%
7 5 1.04%
8 1 0.21%
9 2 0.41%
Source: State of Delaware 2007 Birth Defects Registry.
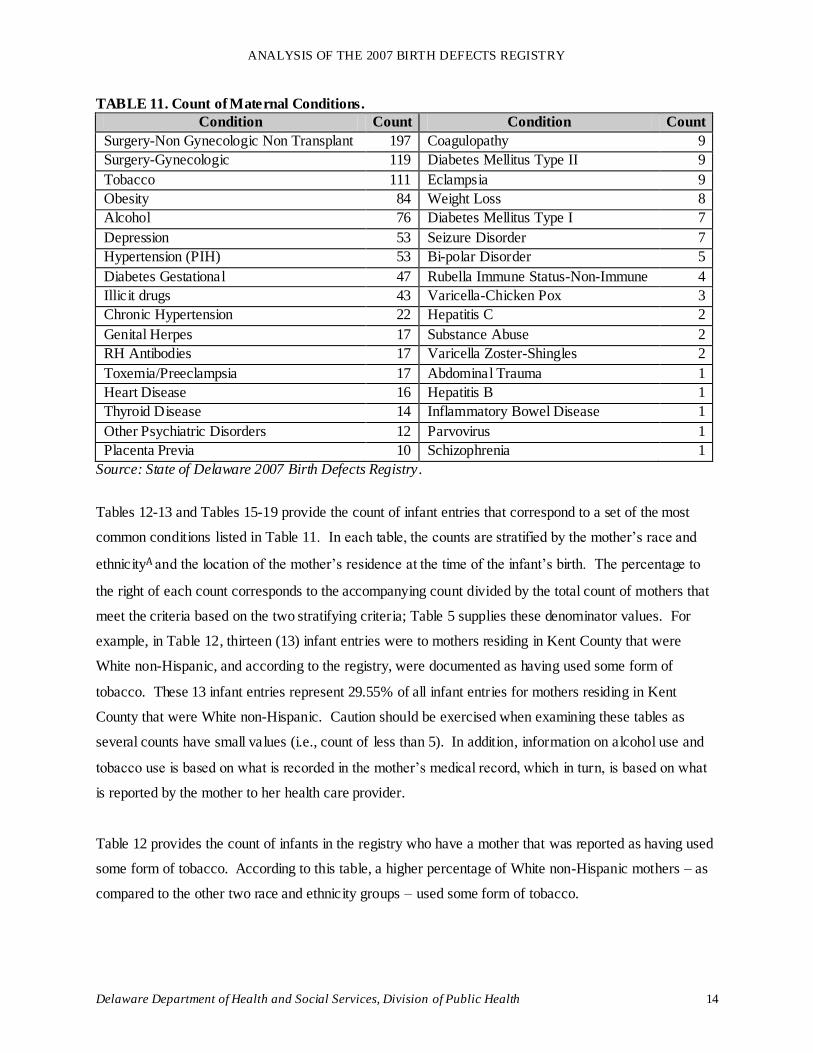
Table 11 displays the counts for each of the maternal conditions listed in the registry.
ANALYSIS OF THE 2007 BIRTH DEFECTS REGISTRY
Delaware Department of Health and Social Services, Division of Public Health 14
TABLE 11. Count of Maternal Conditions.
Condition Count Condition Count
Surgery-Non Gynecologic Non Transplant 197 Coagulopathy 9
Surgery-Gynecologic 119 Diabetes Mellitus Type II 9
Tobacco 111 Eclampsia 9
Obesity 84 Weight Loss 8
Alcohol 76 Diabetes Mellitus Type I 7
Depression 53 Seizure Disorder 7
Hypertension (PIH) 53 Bi-polar Disorder 5
Diabetes Gestational 47 Rubella Immune Status-Non-Immune 4
Illicit drugs 43 Varicella-Chicken Pox 3
Chronic Hypertension 22 Hepatitis C 2
Genital Herpes 17 Substance Abuse 2
RH Antibodies 17 Varicella Zoster-Shingles 2
Toxemia/Preeclampsia 17 Abdominal Trauma 1
Heart Disease 16 Hepatitis B 1
Thyroid Disease 14 Inflammatory Bowel Disease 1
Other Psychiatric Disorders 12 Parvovirus 1
Placenta Previa 10 Schizophrenia 1
Source: State of Delaware 2007 Birth Defects Registry.
Tables 12-13 and Tables 15-19 provide the count of infant entries that correspond to a set of the most
common conditions listed in Table 11. In each table, the counts are stratified by the mother’s race and
ethnicityA and the location of the mother’s residence at the time of the infant’s birth. The percentage to
the right of each count corresponds to the accompanying count divided by the total count of mothers that
meet the criteria based on the two stratifying criteria; Table 5 supplies these denominator values. For
example, in Table 12, thirteen (13) infant entries were to mothers residing in Kent County that were
White non-Hispanic, and according to the registry, were documented as having used some form of
tobacco. These 13 infant entries represent 29.55% of all infant entries for mothers residing in Kent
County that were White non-Hispanic. Caution should be exercised when examining these tables as
several counts have small values (i.e., count of less than 5). In addition, information on alcohol use and
tobacco use is based on what is recorded in the mother’s medical record, which in turn, is based on what
is reported by the mother to her health care provider.
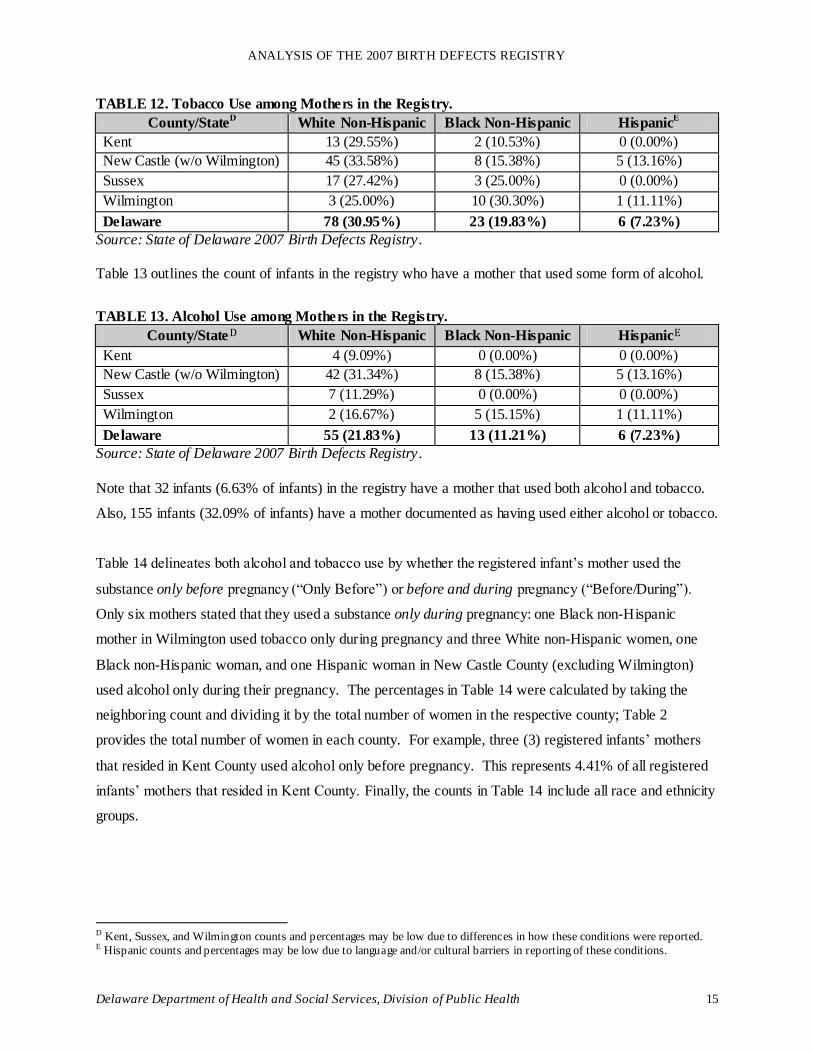
Table 12 provides the count of infants in the registry who have a mother that was reported as having used
some form of tobacco. According to this table, a higher percentage of White non-Hispanic mothers – as
compared to the other two race and ethnicity groups – used some form of tobacco.
ANALYSIS OF THE 2007 BIRTH DEFECTS REGISTRY
Delaware Department of Health and Social Services, Division of Public Health 15
TABLE 12. Tobacco Use among Mothers in the Registry.
County/StateD White Non-Hispanic Black Non-Hispanic Hispanic
E
Kent 13 (29.55%) 2 (10.53%) 0 (0.00%)
New Castle (w/o Wilmington) 45 (33.58%) 8 (15.38%) 5 (13.16%)
Sussex 17 (27.42%) 3 (25.00%) 0 (0.00%)
Wilmington 3 (25.00%) 10 (30.30%) 1 (11.11%)
Delaware 78 (30.95%) 23 (19.83%) 6 (7.23%)
Source: State of Delaware 2007 Birth Defects Registry. Table 13 outlines the count of infants in the registry who have a mother that used some form of alcohol.
TABLE 13. Alcohol Use among Mothers in the Registry.
County/StateD White Non-Hispanic Black Non-Hispanic HispanicE
Kent 4 (9.09%) 0 (0.00%) 0 (0.00%)
New Castle (w/o Wilmington) 42 (31.34%) 8 (15.38%) 5 (13.16%)
Sussex 7 (11.29%) 0 (0.00%) 0 (0.00%)
Wilmington 2 (16.67%) 5 (15.15%) 1 (11.11%)
Delaware 55 (21.83%) 13 (11.21%) 6 (7.23%)
Source: State of Delaware 2007 Birth Defects Registry.
Note that 32 infants (6.63% of infants) in the registry have a mother that used both alcohol and tobacco.
Also, 155 infants (32.09% of infants) have a mother documented as having used either alcohol or tobacco.
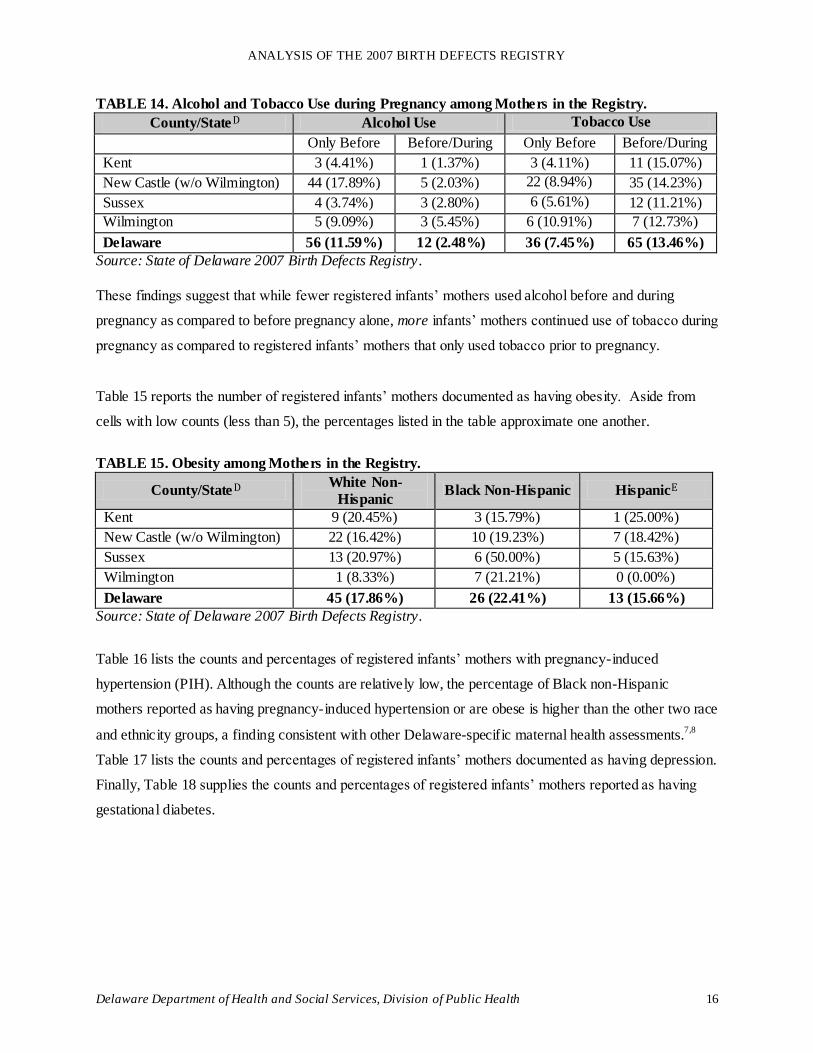
Table 14 delineates both alcohol and tobacco use by whether the registered infant’s mother used the
substance only before pregnancy (“Only Before”) or before and during pregnancy (“Before/During”).
Only six mothers stated that they used a substance only during pregnancy: one Black non-Hispanic
mother in Wilmington used tobacco only during pregnancy and three White non-Hispanic women, one
Black non-Hispanic woman, and one Hispanic woman in New Castle County (excluding Wilmington)
used alcohol only during their pregnancy. The percentages in Table 14 were calculated by taking the
neighboring count and dividing it by the total number of women in the respective county; Table 2
provides the total number of women in each county. For example, three (3) registered infants’ mothers
that resided in Kent County used alcohol only before pregnancy. This represents 4.41% of all registered
infants’ mothers that resided in Kent County. Finally, the counts in Table 14 include all race and ethnicity
groups.
D Kent, Sussex, and Wilmington counts and percentages may be low due to differences in how these conditions were reported. E Hispanic counts and percentages may be low due to language and/or cultural barriers in reporting of these conditions.
ANALYSIS OF THE 2007 BIRTH DEFECTS REGISTRY
Delaware Department of Health and Social Services, Division of Public Health 16
TABLE 14. Alcohol and Tobacco Use during Pregnancy among Mothers in the Registry.
County/StateD Alcohol Use Tobacco Use
Only Before Before/During Only Before Before/During
Kent 3 (4.41%) 1 (1.37%) 3 (4.11%) 11 (15.07%)
New Castle (w/o Wilmington) 44 (17.89%) 5 (2.03%) 22 (8.94%) 35 (14.23%)
Sussex 4 (3.74%) 3 (2.80%) 6 (5.61%) 12 (11.21%)
Wilmington 5 (9.09%) 3 (5.45%) 6 (10.91%) 7 (12.73%)
Delaware 56 (11.59%) 12 (2.48%) 36 (7.45%) 65 (13.46%)
Source: State of Delaware 2007 Birth Defects Registry.
These findings suggest that while fewer registered infants’ mothers used alcohol before and during
pregnancy as compared to before pregnancy alone, more infants’ mothers continued use of tobacco during
pregnancy as compared to registered infants’ mothers that only used tobacco prior to pregnancy.
Table 15 reports the number of registered infants’ mothers documented as having obesity. Aside from
cells with low counts (less than 5), the percentages listed in the table approximate one another.
TABLE 15. Obesity among Mothers in the Registry.
County/StateD White Non-
Hispanic Black Non-Hispanic HispanicE
Kent 9 (20.45%) 3 (15.79%) 1 (25.00%)
New Castle (w/o Wilmington) 22 (16.42%) 10 (19.23%) 7 (18.42%)
Sussex 13 (20.97%) 6 (50.00%) 5 (15.63%)
Wilmington 1 (8.33%) 7 (21.21%) 0 (0.00%)
Delaware 45 (17.86%) 26 (22.41%) 13 (15.66%)
Source: State of Delaware 2007 Birth Defects Registry.
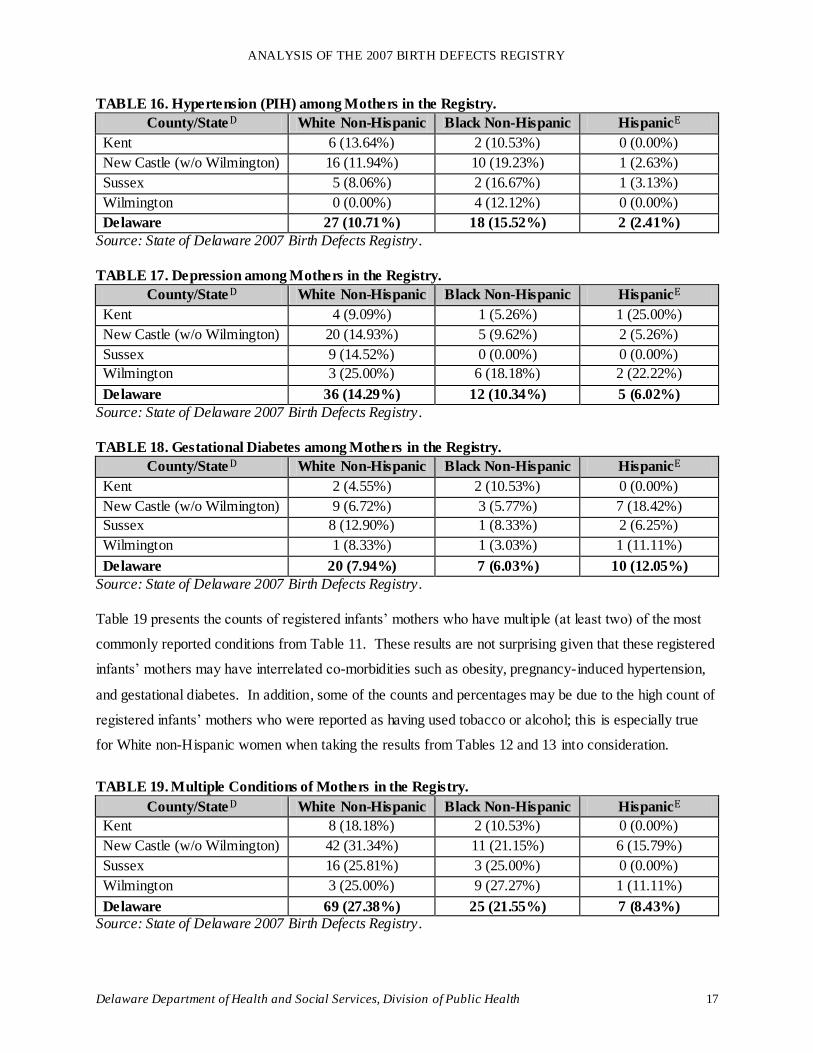
Table 16 lists the counts and percentages of registered infants’ mothers with pregnancy-induced
hypertension (PIH). Although the counts are relatively low, the percentage of Black non-Hispanic
mothers reported as having pregnancy-induced hypertension or are obese is higher than the other two race
and ethnicity groups, a finding consistent with other Delaware-specific maternal health assessments.7,8
Table 17 lists the counts and percentages of registered infants’ mothers documented as having depression.
Finally, Table 18 supplies the counts and percentages of registered infants’ mothers reported as having
gestational diabetes.
ANALYSIS OF THE 2007 BIRTH DEFECTS REGISTRY
Delaware Department of Health and Social Services, Division of Public Health 17
TABLE 16. Hypertension (PIH) among Mothers in the Registry.
County/StateD White Non-Hispanic Black Non-Hispanic HispanicE
Kent 6 (13.64%) 2 (10.53%) 0 (0.00%)
New Castle (w/o Wilmington) 16 (11.94%) 10 (19.23%) 1 (2.63%)
Sussex 5 (8.06%) 2 (16.67%) 1 (3.13%)
Wilmington 0 (0.00%) 4 (12.12%) 0 (0.00%)
Delaware 27 (10.71%) 18 (15.52%) 2 (2.41%)
Source: State of Delaware 2007 Birth Defects Registry.
TABLE 17. Depression among Mothers in the Registry.
County/StateD White Non-Hispanic Black Non-Hispanic HispanicE
Kent 4 (9.09%) 1 (5.26%) 1 (25.00%)
New Castle (w/o Wilmington) 20 (14.93%) 5 (9.62%) 2 (5.26%)
Sussex 9 (14.52%) 0 (0.00%) 0 (0.00%)
Wilmington 3 (25.00%) 6 (18.18%) 2 (22.22%)
Delaware 36 (14.29%) 12 (10.34%) 5 (6.02%)
Source: State of Delaware 2007 Birth Defects Registry.
TABLE 18. Gestational Diabetes among Mothers in the Registry.
County/StateD White Non-Hispanic Black Non-Hispanic HispanicE
Kent 2 (4.55%) 2 (10.53%) 0 (0.00%)
New Castle (w/o Wilmington) 9 (6.72%) 3 (5.77%) 7 (18.42%)
Sussex 8 (12.90%) 1 (8.33%) 2 (6.25%)
Wilmington 1 (8.33%) 1 (3.03%) 1 (11.11%)
Delaware 20 (7.94%) 7 (6.03%) 10 (12.05%)
Source: State of Delaware 2007 Birth Defects Registry.
Table 19 presents the counts of registered infants’ mothers who have multiple (at least two) of the most
commonly reported conditions from Table 11. These results are not surprising given that these registered
infants’ mothers may have interrelated co-morbidities such as obesity, pregnancy-induced hypertension,
and gestational diabetes. In addition, some of the counts and percentages may be due to the high count of
registered infants’ mothers who were reported as having used tobacco or alcohol; this is especially true
for White non-Hispanic women when taking the results from Tables 12 and 13 into consideration.
TABLE 19. Multiple Conditions of Mothers in the Registry.
County/StateD White Non-Hispanic Black Non-Hispanic HispanicE
Kent 8 (18.18%) 2 (10.53%) 0 (0.00%)
New Castle (w/o Wilmington) 42 (31.34%) 11 (21.15%) 6 (15.79%)
Sussex 16 (25.81%) 3 (25.00%) 0 (0.00%)
Wilmington 3 (25.00%) 9 (27.27%) 1 (11.11%)
Delaware 69 (27.38%) 25 (21.55%) 7 (8.43%)
Source: State of Delaware 2007 Birth Defects Registry.
ANALYSIS OF THE 2007 BIRTH DEFECTS REGISTRY
Delaware Department of Health and Social Services, Division of Public Health 18
CHARACTERISTICS OF INFANTS IN THE REGISTRY
Facility of Birth
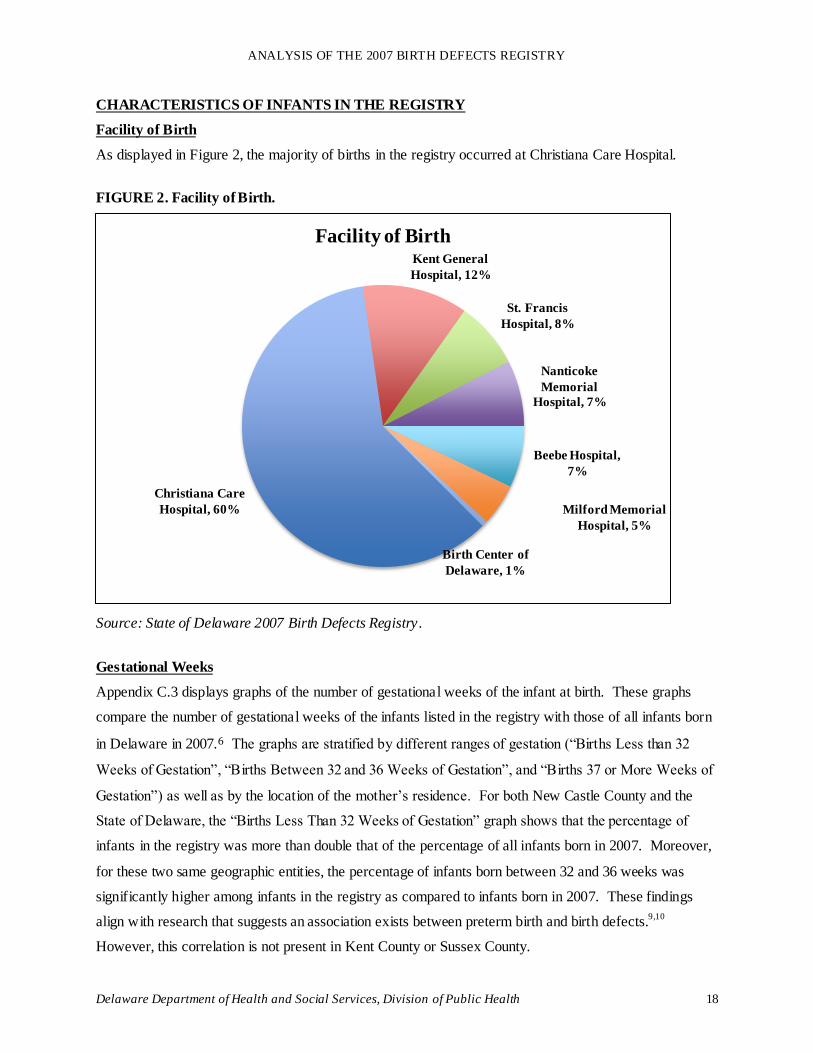
As displayed in Figure 2, the majority of births in the registry occurred at Christiana Care Hospital.
FIGURE 2. Facility of Birth.
Source: State of Delaware 2007 Birth Defects Registry.
Gestational Weeks
Appendix C.3 displays graphs of the number of gestational weeks of the infant at birth. These graphs
compare the number of gestational weeks of the infants listed in the registry with those of all infants born
in Delaware in 2007.6 The graphs are stratified by different ranges of gestation (“Births Less than 32
Weeks of Gestation”, “Births Between 32 and 36 Weeks of Gestation”, and “Births 37 or More Weeks of
Gestation”) as well as by the location of the mother’s residence. For both New Castle County and the
State of Delaware, the “Births Less Than 32 Weeks of Gestation” graph shows that the percentage of
infants in the registry was more than double that of the percentage of all infants born in 2007. Moreover,
for these two same geographic entities, the percentage of infants born between 32 and 36 weeks was
significantly higher among infants in the registry as compared to infants born in 2007. These findings
align with research that suggests an association exists between preterm birth and birth defects.9,10
However, this correlation is not present in Kent County or Sussex County.
Christiana Care
Hospital, 60%
Kent General
Hospital, 12%
St. Francis
Hospital, 8%
Nanticoke
Memorial
Hospital, 7%
Beebe Hospital,
7%
Milford Memorial
Hospital, 5%
Birth Center of
Delaware, 1%
Facility of Birth
ANALYSIS OF THE 2007 BIRTH DEFECTS REGISTRY
Delaware Department of Health and Social Services, Division of Public Health 19
Pregnancy Outcome
Table 20 lists the numbers and percentages of live births and fetal deaths from the registry. In this
assessment, fetal death includes stillbirth and termination of pregnancy. The majority of fetal death cases
– 12 of 18 – occurred among mothers residing in New Castle County (w/o Wilmington).
TABLE 20. Pregnancy Outcome for Registry Entries.
County Live Birth Fetal Death
Count Percentage Count Percentage
Kent 70 95.89% 3 4.11%
New Castle (w/o Wilmington) 234 95.12% 12 4.88%
Sussex 105 98.13% 2 1.87%
Wilmington 54 98.18% 1 1.82%
Delaware 463 96.26% 18 3.74%
Source: State of Delaware 2007 Birth Defects Registry.
Plurality
Table 21 shows the number and percentage of infants that are singleton (a single birth), twins, or triplets.
TABLE 21. Plurality for Infants in the Registry.
Plurality Count Percentage
Singleton 458 94.82%
Twin 24 4.97%
Triplet 1 0.21%
Source: State of Delaware 2007 Birth Defects Registry.
Of the 24 infants that are part of a set of twins, 10 were the first-born twin, 13 were the second-born twin,
and the birth order was unknown for one of the infants in one of the sets of twins. For the triplet, the
second-born infant was the one diagnosed with a birth defect.
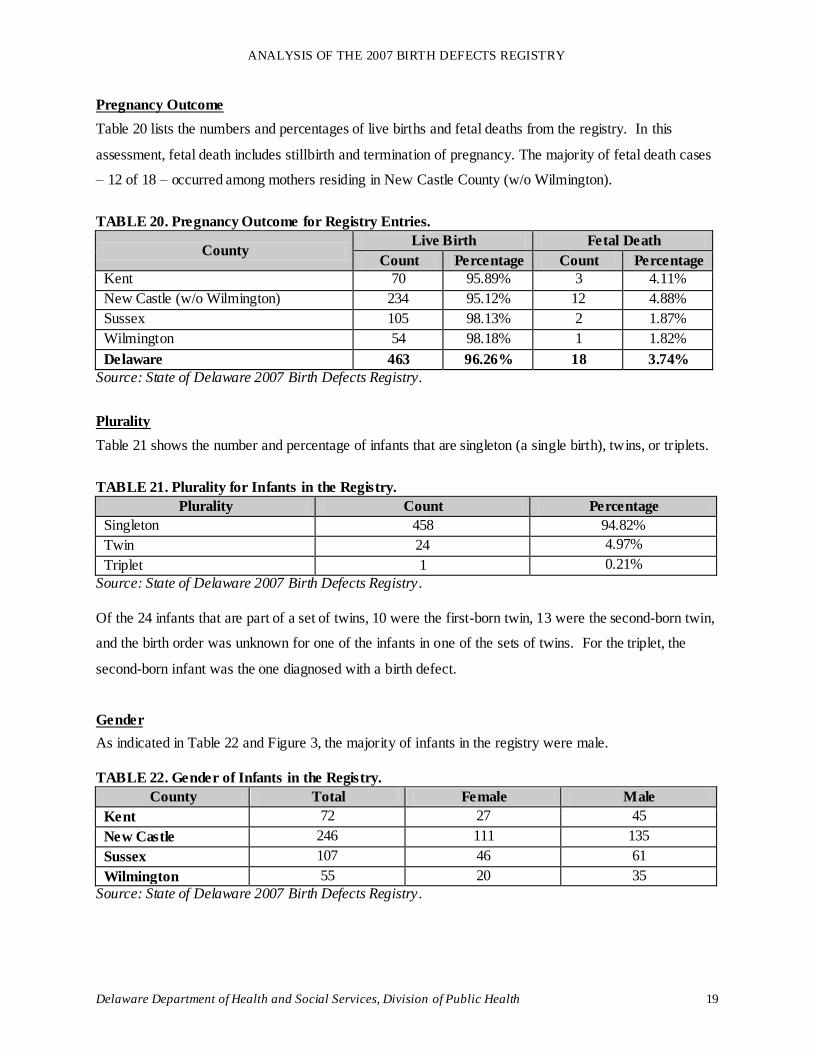
Gender
As indicated in Table 22 and Figure 3, the majority of infants in the registry were male.
TABLE 22. Gender of Infants in the Registry.
County Total Female Male
Kent 72 27 45
New Castle 246 111 135
Sussex 107 46 61
Wilmington 55 20 35
Source: State of Delaware 2007 Birth Defects Registry.
ANALYSIS OF THE 2007 BIRTH DEFECTS REGISTRY
Delaware Department of Health and Social Services, Division of Public Health 20
FIGURE 3. Gender of Infants in Registry.
Source: State of Delaware 2007 Birth Defects Registry.
Growth Percentiles
The WHO Child Growth Standards11
were applied to calculate the percentages of infants in the registry
that were below the 25th
, between the 25th
and 75th
, and above the 75th
percentiles in weight, length
(stature), and head circumference. The age at birth (0 months) was used when aligning these percentiles
and percentiles were adjusted based on the infant’s gender. The results of these growth percentile
measures are intended to see if any correlations exist; a causal link between birth defects and these results
cannot be established.
Weight Percentiles
Table 23 illustrates that a sizeable percentage of the infants in the birth defects registry are at or below the
25th
percentile for weight at the time of birth. Note that the majority of infants in Wilmington were born
at or below the 25th percentile for weight and only 9.09% were born at or above the 75th percentile.
62.50%
54.88% 57.01%
63.64%
37.50%
45.12% 42.99%
36.36%
0.00%
10.00%
20.00%
30.00%
40.00%
50.00%
60.00%
70.00%
Kent New Castle Sussex Wilmington
Gender of Children in Registry
Male
Female
ANALYSIS OF THE 2007 BIRTH DEFECTS REGISTRY
Delaware Department of Health and Social Services, Division of Public Health 21
TABLE 23. Weight Percentile at Time of Birth.
County/State 25th
and Below Between 25th – 75th 75th and Over
Kent 38.89% 50.00% 11.11%
New Castle w/o Wilmington 39.75% 43.44% 16.80%
Sussex 39.25% 45.79% 14.95%
Wilmington 60.00% 30.91% 9.09%
Delaware 41.84% 43.51% 14.64%
Source: State of Delaware 2007 Birth Defects Registry
Length (Stature) Percentiles
As shown in Table 24, Kent County had the most disparate length results with 29.85% of infants having a
length at or below the 25th
percentile and 41.79% of infants at or above the 75th
percentile.
TABLE 24. Length (Stature) at Time of Birth.
County/State 25th
and Below Between 25th – 75th 75th and Over
Kent 29.85% 28.36% 41.79%
New Castle w/o Wilmington 31.22% 32.91% 35.86%
Sussex 30.19% 33.96% 35.85%
Wilmington 37.04% 37.04% 25.93%
Delaware 31.47% 32.97% 35.56%
Source: State of Delaware 2007 Birth Defects Registry
Head Circumference Percentiles
Table 25 suggests that approximately 8 out of 9 infants in the registry are below the 75th
percentile for
head circumference at the time of birth.
TABLE 25. Head Circumference at Time of Birth.
County/State 25th and Below Between 25th – 75th 75th and Over
Kent 40.98% 47.54% 11.48%
New Castle w/o Wilmington 48.94% 39.72% 11.35%
Sussex 40.00% 48.00% 12.00%
Wilmington 50.00% 38.89% 11.11%
Delaware 44.97% 43.49% 11.54%
Source: State of Delaware 2007 Birth Defects Registry
Each ICD-9 code was categorized as a “confirmed” or “possible/probable” diagnosis of a birth defect. In
the registry, 477 infants (98.8% of infants) had only a “confirmed” diagnosis of a birth defect while four
infants (0.83% of infants) had only a “possible/probable” diagnosis of a birth defect. Finally, two infants
(0.41% of infants) had at least one “possible/probable” and at least one “confirmed” diagnosis of a birth
defect. Given that almost all of the infants had a “confirmed” diagnosis of a birth defect, all infants were
included in the analysis even if the infant had only a “possible/probable” diagnosis of a birth defect.
ANALYSIS OF THE 2007 BIRTH DEFECTS REGISTRY
Delaware Department of Health and Social Services, Division of Public Health 22
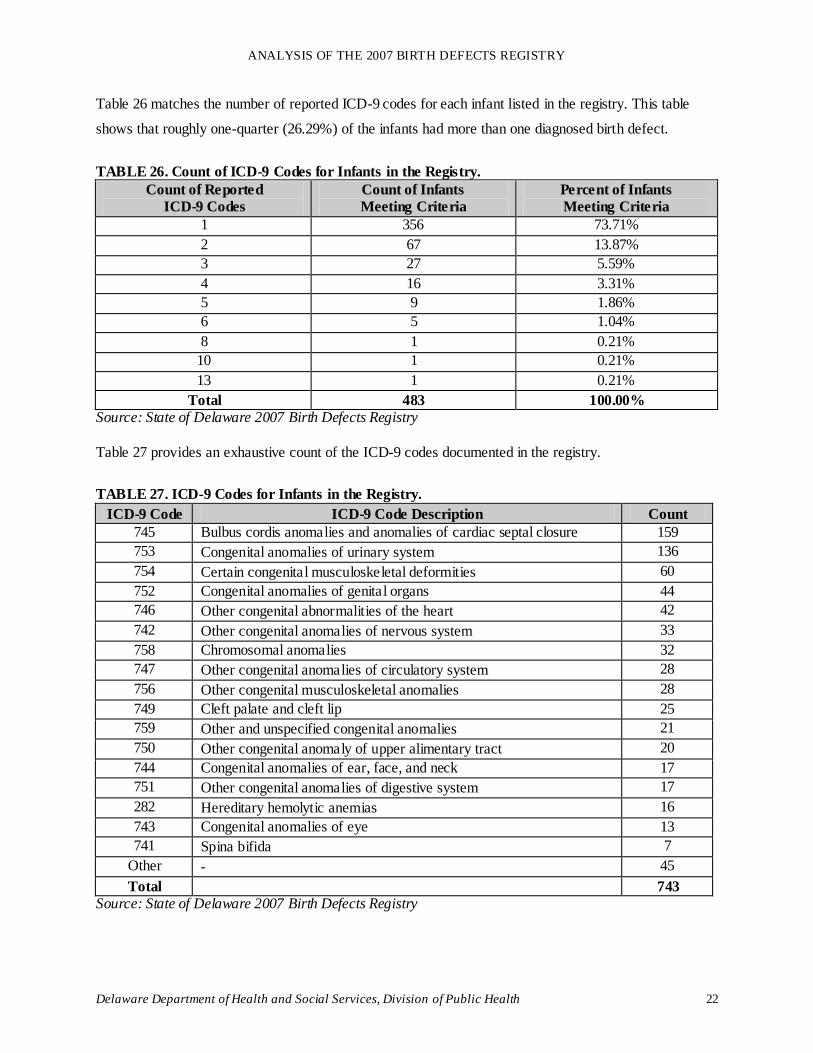
Table 26 matches the number of reported ICD-9 codes for each infant listed in the registry. This table
shows that roughly one-quarter (26.29%) of the infants had more than one diagnosed birth defect.
TABLE 26. Count of ICD-9 Codes for Infants in the Registry.
Count of Reported
ICD-9 Codes
Count of Infants
Meeting Criteria
Percent of Infants
Meeting Criteria
1 356 73.71%
2 67 13.87%
3 27 5.59%
4 16 3.31%
5 9 1.86%
6 5 1.04%
8 1 0.21%
10 1 0.21%
13 1 0.21%
Total 483 100.00%
Source: State of Delaware 2007 Birth Defects Registry
Table 27 provides an exhaustive count of the ICD-9 codes documented in the registry.
TABLE 27. ICD-9 Codes for Infants in the Registry.
ICD-9 Code ICD-9 Code Description Count
745 Bulbus cordis anomalies and anomalies of cardiac septal closure 159
753 Congenital anomalies of urinary system 136
754 Certain congenital musculoskeletal deformities 60
752 Congenital anomalies of genital organs 44
746 Other congenital abnormalities of the heart 42
742 Other congenital anomalies of nervous system 33
758 Chromosomal anomalies 32
747 Other congenital anomalies of circulatory system 28
756 Other congenital musculoskeletal anomalies 28
749 Cleft palate and cleft lip 25
759 Other and unspecified congenital anomalies 21
750 Other congenital anomaly of upper alimentary tract 20
744 Congenital anomalies of ear, face, and neck 17
751 Other congenital anomalies of digestive system 17
282 Hereditary hemolytic anemias 16
743 Congenital anomalies of eye 13
741 Spina bifida 7
Other - 45
Total 743
Source: State of Delaware 2007 Birth Defects Registry
ANALYSIS OF THE 2007 BIRTH DEFECTS REGISTRY
Delaware Department of Health and Social Services, Division of Public Health 23
A substantial number of codes are associated with congenital heart defects (159 diagnoses or 21.40% of
all diagnoses) or congenital urinary tract abnormalities (136 or 18.30% of all diagnoses).
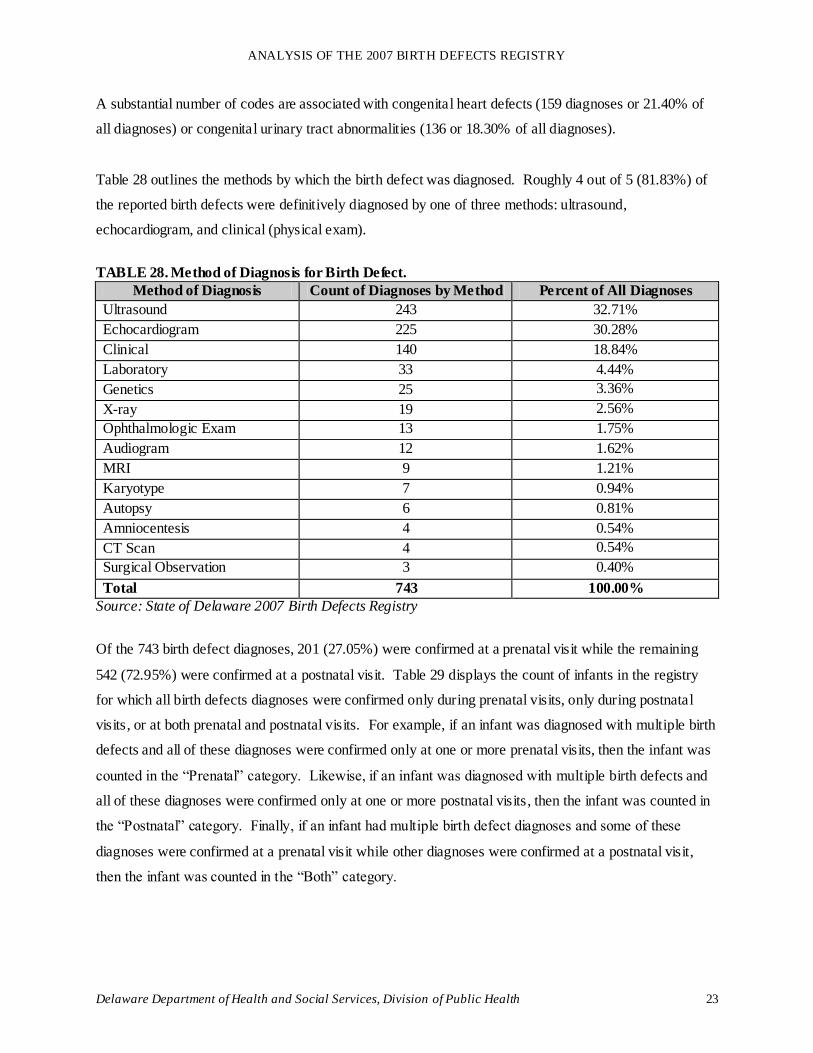
Table 28 outlines the methods by which the birth defect was diagnosed. Roughly 4 out of 5 (81.83%) of
the reported birth defects were definitively diagnosed by one of three methods: ultrasound,
echocardiogram, and clinical (physical exam).
TABLE 28. Method of Diagnosis for Birth Defect.
Method of Diagnosis Count of Diagnoses by Method Percent of All Diagnoses
Ultrasound 243 32.71%
Echocardiogram 225 30.28%
Clinical 140 18.84%
Laboratory 33 4.44%
Genetics 25 3.36%
X-ray 19 2.56%
Ophthalmologic Exam 13 1.75%
Audiogram 12 1.62%
MRI 9 1.21%
Karyotype 7 0.94%
Autopsy 6 0.81%
Amniocentesis 4 0.54%
CT Scan 4 0.54%
Surgical Observation 3 0.40%
Total 743 100.00%
Source: State of Delaware 2007 Birth Defects Registry
Of the 743 birth defect diagnoses, 201 (27.05%) were confirmed at a prenatal visit while the remaining
542 (72.95%) were confirmed at a postnatal visit. Table 29 displays the count of infants in the registry
for which all birth defects diagnoses were confirmed only during prenatal visits, only during postnatal
visits, or at both prenatal and postnatal visits. For example, if an infant was diagnosed with multiple birth
defects and all of these diagnoses were confirmed only at one or more prenatal visits, then the infant was
counted in the “Prenatal” category. Likewise, if an infant was diagnosed with multiple birth defects and
all of these diagnoses were confirmed only at one or more postnatal visits, then the infant was counted in
the “Postnatal” category. Finally, if an infant had multiple birth defect diagnoses and some of these
diagnoses were confirmed at a prenatal visit while other diagnoses were confirmed at a postnatal visit,
then the infant was counted in the “Both” category.
ANALYSIS OF THE 2007 BIRTH DEFECTS REGISTRY
Delaware Department of Health and Social Services, Division of Public Health 24
TABLE 29. Infants with Diagnosis of All Birth Defects Confirmed at Prenatal, Postnatal, or Both.
County/State Prenatal Postnatal Both
Infants 88 (18.22%) 341 (70.60%) 54 (11.18%)
Source: State of Delaware 2007 Birth Defects Registry
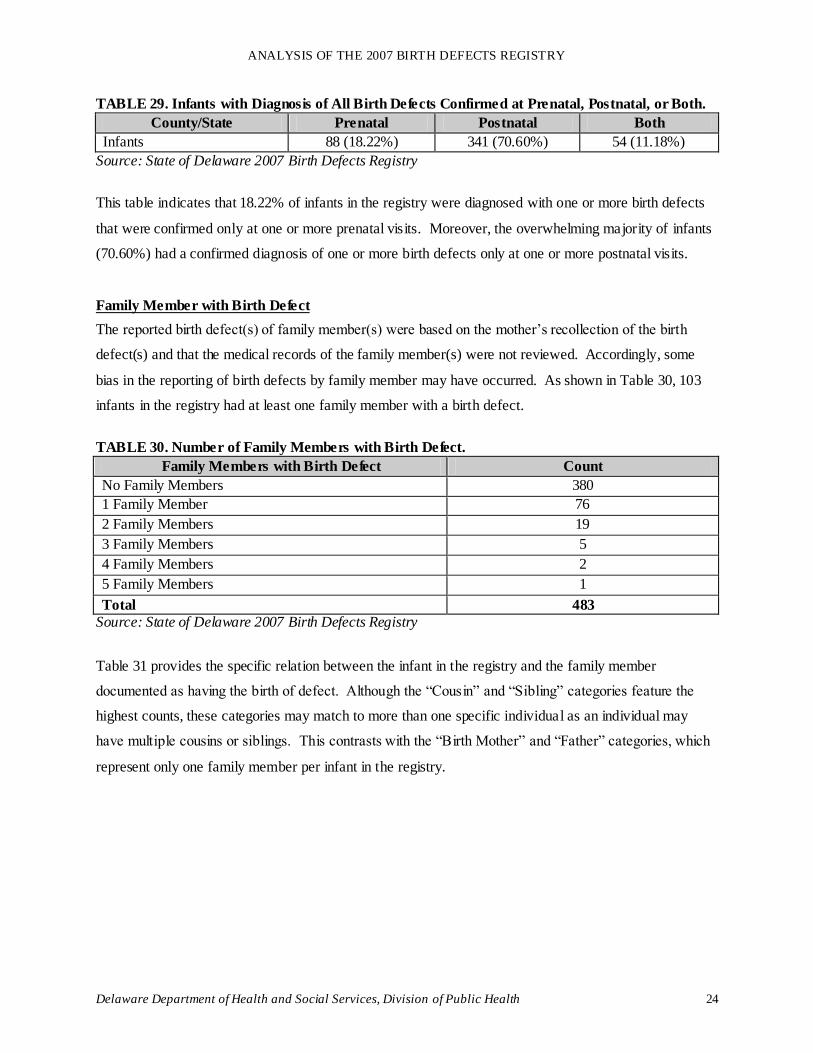
This table indicates that 18.22% of infants in the registry were diagnosed with one or more birth defects
that were confirmed only at one or more prenatal visits. Moreover, the overwhelming majority of infants
(70.60%) had a confirmed diagnosis of one or more birth defects only at one or more postnatal visits.
Family Member with Birth Defect
The reported birth defect(s) of family member(s) were based on the mother’s recollection of the birth
defect(s) and that the medical records of the family member(s) were not reviewed. Accordingly, some
bias in the reporting of birth defects by family member may have occurred. As shown in Table 30, 103
infants in the registry had at least one family member with a birth defect.
TABLE 30. Number of Family Members with Birth Defect.
Family Members with Birth Defect Count
No Family Members 380
1 Family Member 76
2 Family Members 19
3 Family Members 5
4 Family Members 2
5 Family Members 1
Total 483
Source: State of Delaware 2007 Birth Defects Registry
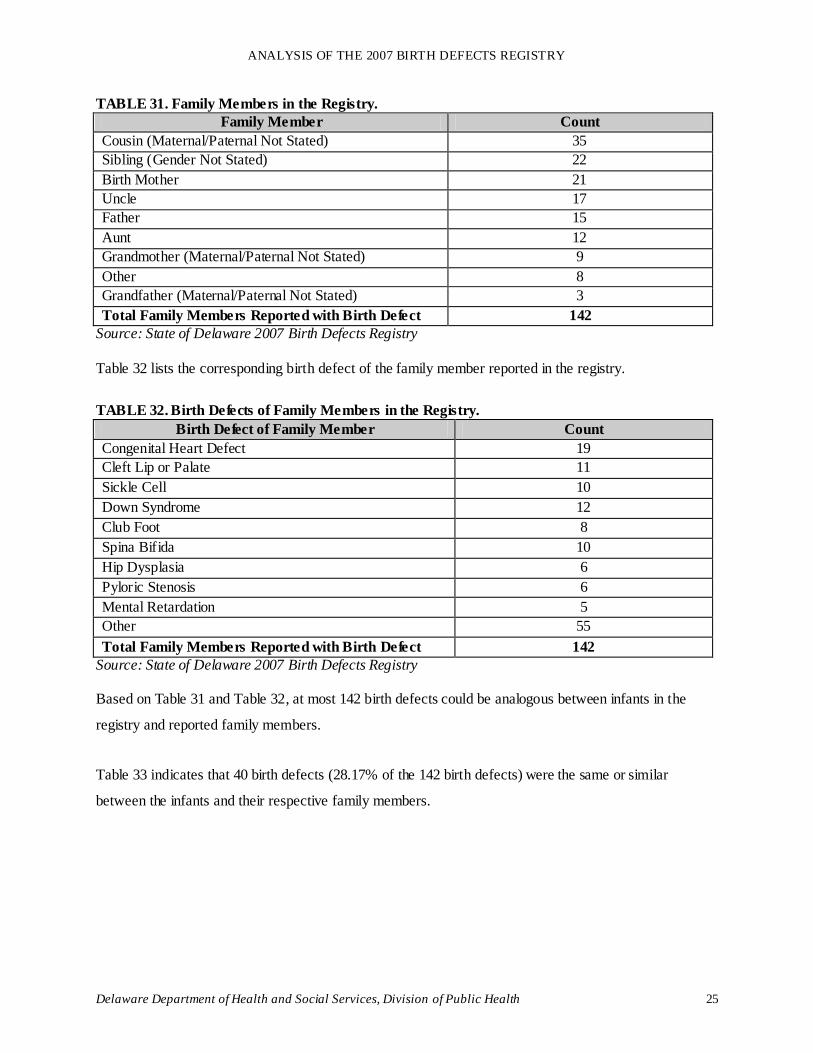
Table 31 provides the specific relation between the infant in the registry and the family member
documented as having the birth of defect. Although the “Cousin” and “Sibling” categories feature the
highest counts, these categories may match to more than one specific individual as an individual may
have multiple cousins or siblings. This contrasts with the “Birth Mother” and “Father” categories, which
represent only one family member per infant in the registry.
ANALYSIS OF THE 2007 BIRTH DEFECTS REGISTRY
Delaware Department of Health and Social Services, Division of Public Health 25
TABLE 31. Family Members in the Registry.
Family Member Count
Cousin (Maternal/Paternal Not Stated) 35
Sibling (Gender Not Stated) 22
Birth Mother 21
Uncle 17
Father 15
Aunt 12
Grandmother (Maternal/Paternal Not Stated) 9
Other 8
Grandfather (Maternal/Paternal Not Stated) 3
Total Family Members Reported with Birth Defect 142
Source: State of Delaware 2007 Birth Defects Registry
Table 32 lists the corresponding birth defect of the family member reported in the registry.
TABLE 32. Birth Defects of Family Members in the Registry.
Birth Defect of Family Member Count
Congenital Heart Defect 19
Cleft Lip or Palate 11
Sickle Cell 10
Down Syndrome 12
Club Foot 8
Spina Bifida 10
Hip Dysplasia 6
Pyloric Stenosis 6
Mental Retardation 5
Other 55
Total Family Members Reported with Birth Defect 142
Source: State of Delaware 2007 Birth Defects Registry
Based on Table 31 and Table 32, at most 142 birth defects could be analogous between infants in the
registry and reported family members.
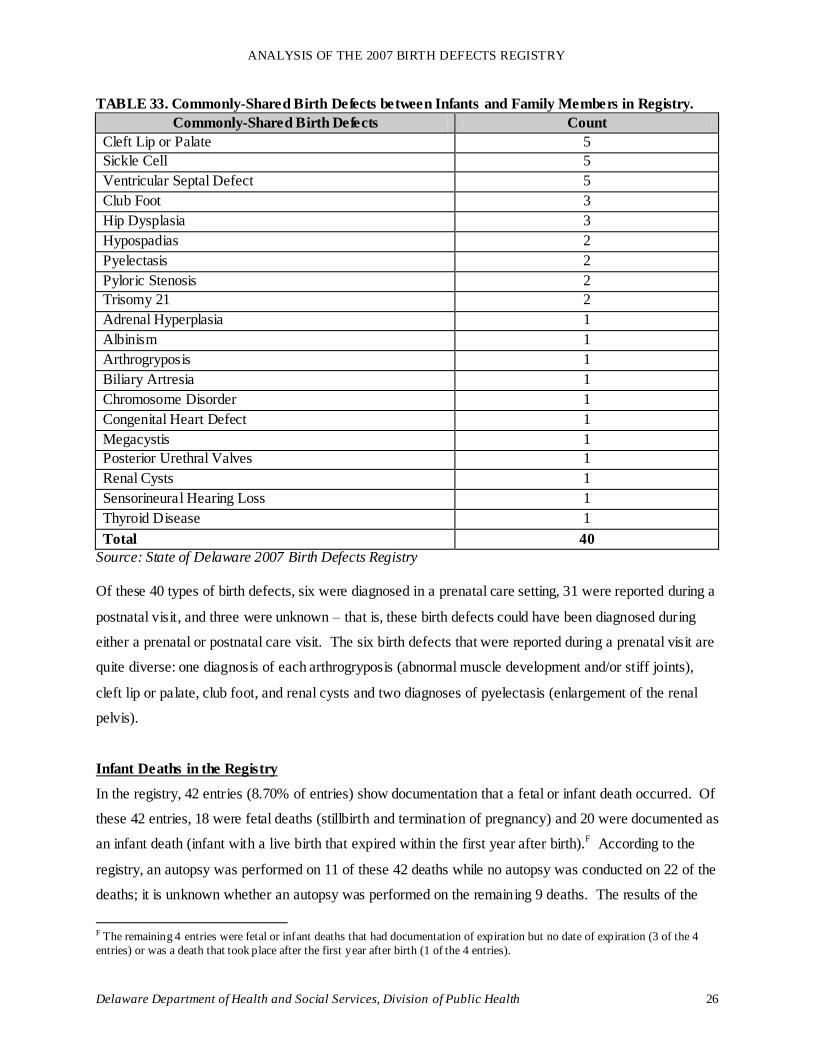
Table 33 indicates that 40 birth defects (28.17% of the 142 birth defects) were the same or similar
between the infants and their respective family members.
ANALYSIS OF THE 2007 BIRTH DEFECTS REGISTRY
Delaware Department of Health and Social Services, Division of Public Health 26
TABLE 33. Commonly-Shared Birth Defects between Infants and Family Members in Registry.
Commonly-Shared Birth Defects Count
Cleft Lip or Palate 5
Sickle Cell 5
Ventricular Septal Defect 5
Club Foot 3
Hip Dysplasia 3
Hypospadias 2
Pyelectasis 2
Pyloric Stenosis 2
Trisomy 21 2
Adrenal Hyperplasia 1
Albinism 1
Arthrogryposis 1
Biliary Artresia 1
Chromosome Disorder 1
Congenital Heart Defect 1
Megacystis 1
Posterior Urethral Valves 1
Renal Cysts 1
Sensorineural Hearing Loss 1
Thyroid Disease 1
Total 40
Source: State of Delaware 2007 Birth Defects Registry
Of these 40 types of birth defects, six were diagnosed in a prenatal care setting, 31 were reported during a
postnatal visit, and three were unknown – that is, these birth defects could have been diagnosed during
either a prenatal or postnatal care visit. The six birth defects that were reported during a prenatal visit are
quite diverse: one diagnosis of each arthrogryposis (abnormal muscle development and/or stiff joints),
cleft lip or palate, club foot, and renal cysts and two diagnoses of pyelectasis (enlargement of the renal
pelvis).
Infant Deaths in the Registry
In the registry, 42 entries (8.70% of entries) show documentation that a fetal or infant death occurred. Of
these 42 entries, 18 were fetal deaths (stillbirth and termination of pregnancy) and 20 were documented as
an infant death (infant with a live birth that expired within the first year after birth).F According to the
registry, an autopsy was performed on 11 of these 42 deaths while no autopsy was conducted on 22 of the
deaths; it is unknown whether an autopsy was performed on the remaining 9 deaths. The results of the
F The remaining 4 entries were fetal or infant deaths that had documentation of expiration but no date of expiration (3 of the 4
entries) or was a death that took place after the first year after birth (1 of the 4 entries).
ANALYSIS OF THE 2007 BIRTH DEFECTS REGISTRY
Delaware Department of Health and Social Services, Division of Public Health 27
autopsy are not provided in the registry, and therefore, it cannot be determined whether the reported birth
defect(s) was a causal factor for the death. With this in mind, this analysis of deaths is intended only to
better understand the characteristics of this specific set of entries in the birth defect registry.
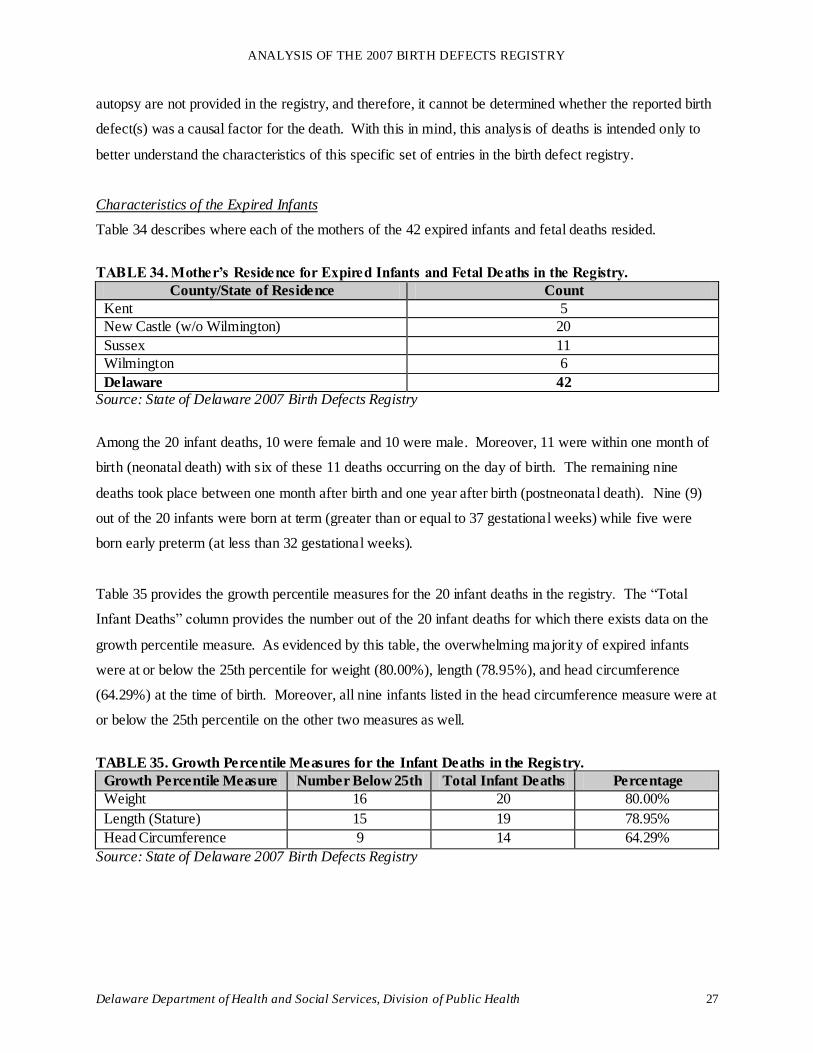
Characteristics of the Expired Infants
Table 34 describes where each of the mothers of the 42 expired infants and fetal deaths resided.
TABLE 34. Mother’s Residence for Expired Infants and Fetal Deaths in the Registry.
County/State of Residence Count
Kent 5
New Castle (w/o Wilmington) 20
Sussex 11
Wilmington 6
Delaware 42
Source: State of Delaware 2007 Birth Defects Registry
Among the 20 infant deaths, 10 were female and 10 were male. Moreover, 11 were within one month of
birth (neonatal death) with six of these 11 deaths occurring on the day of birth. The remaining nine
deaths took place between one month after birth and one year after birth (postneonatal death). Nine (9)
out of the 20 infants were born at term (greater than or equal to 37 gestational weeks) while five were
born early preterm (at less than 32 gestational weeks).
Table 35 provides the growth percentile measures for the 20 infant deaths in the registry. The “Total
Infant Deaths” column provides the number out of the 20 infant deaths for which there exists data on the
growth percentile measure. As evidenced by this table, the overwhelming majority of expired infants
were at or below the 25th percentile for weight (80.00%), length (78.95%), and head circumference
(64.29%) at the time of birth. Moreover, all nine infants listed in the head circumference measure were at
or below the 25th percentile on the other two measures as well.
TABLE 35. Growth Percentile Measures for the Infant Deaths in the Registry.
Growth Percentile Measure Number Below 25th Total Infant Deaths Percentage
Weight 16 20 80.00%
Length (Stature) 15 19 78.95%
Head Circumference 9 14 64.29%
Source: State of Delaware 2007 Birth Defects Registry
ANALYSIS OF THE 2007 BIRTH DEFECTS REGISTRY
Delaware Department of Health and Social Services, Division of Public Health 28
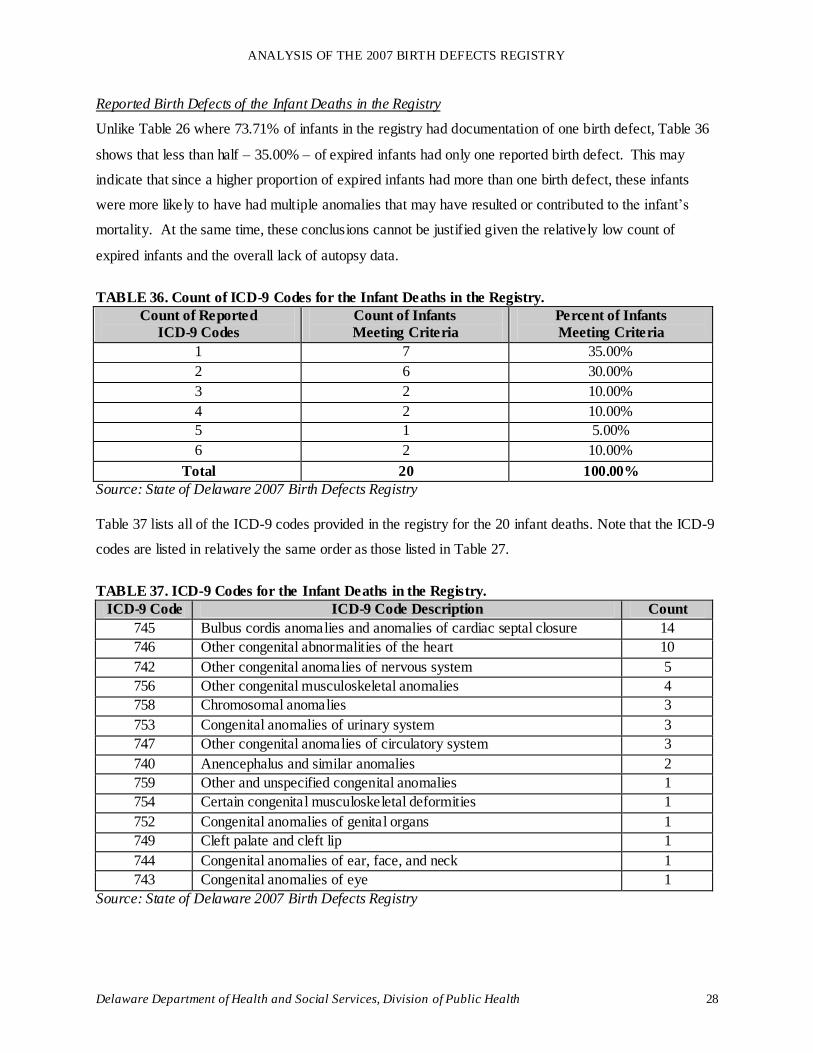
Reported Birth Defects of the Infant Deaths in the Registry
Unlike Table 26 where 73.71% of infants in the registry had documentation of one birth defect, Table 36
shows that less than half – 35.00% – of expired infants had only one reported birth defect. This may
indicate that since a higher proportion of expired infants had more than one birth defect, these infants
were more likely to have had multiple anomalies that may have resulted or contributed to the infant’s
mortality. At the same time, these conclusions cannot be justified given the relatively low count of
expired infants and the overall lack of autopsy data.
TABLE 36. Count of ICD-9 Codes for the Infant Deaths in the Registry.
Count of Reported
ICD-9 Codes
Count of Infants
Meeting Criteria
Percent of Infants
Meeting Criteria
1 7 35.00%
2 6 30.00%
3 2 10.00%
4 2 10.00%
5 1 5.00%
6 2 10.00%
Total 20 100.00%
Source: State of Delaware 2007 Birth Defects Registry
Table 37 lists all of the ICD-9 codes provided in the registry for the 20 infant deaths. Note that the ICD-9
codes are listed in relatively the same order as those listed in Table 27.
TABLE 37. ICD-9 Codes for the Infant Deaths in the Registry.
ICD-9 Code ICD-9 Code Description Count
745 Bulbus cordis anomalies and anomalies of cardiac septal closure 14
746 Other congenital abnormalities of the heart 10
742 Other congenital anomalies of nervous system 5
756 Other congenital musculoskeletal anomalies 4
758 Chromosomal anomalies 3
753 Congenital anomalies of urinary system 3
747 Other congenital anomalies of circulatory system 3
740 Anencephalus and similar anomalies 2
759 Other and unspecified congenital anomalies 1
754 Certain congenital musculoskeletal deformities 1
752 Congenital anomalies of genital organs 1
749 Cleft palate and cleft lip 1
744 Congenital anomalies of ear, face, and neck 1
743 Congenital anomalies of eye 1
Source: State of Delaware 2007 Birth Defects Registry
ANALYSIS OF THE 2007 BIRTH DEFECTS REGISTRY
Delaware Department of Health and Social Services, Division of Public Health 29
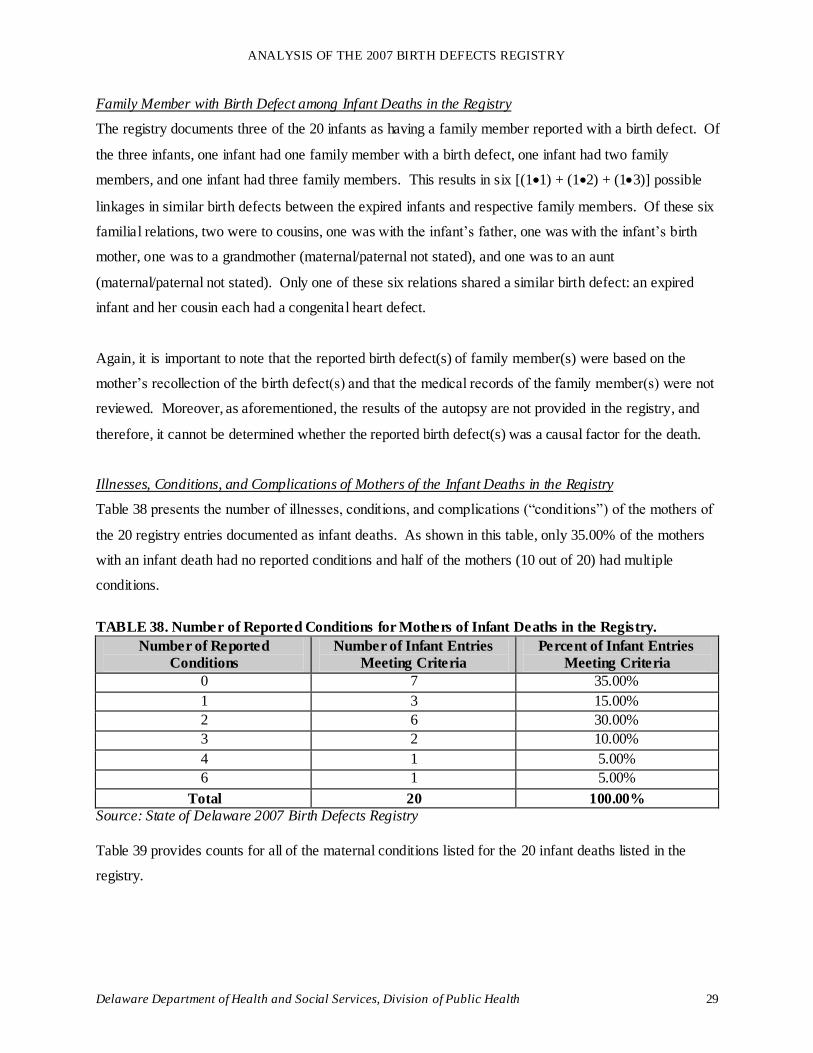
Family Member with Birth Defect among Infant Deaths in the Registry
The registry documents three of the 20 infants as having a family member reported with a birth defect. Of
the three infants, one infant had one family member with a birth defect, one infant had two family
members, and one infant had three family members. This results in six [(11) + (12) + (13)] possible
linkages in similar birth defects between the expired infants and respective family members. Of these six
familial relations, two were to cousins, one was with the infant’s father, one was with the infant’s birth
mother, one was to a grandmother (maternal/paternal not stated), and one was to an aunt
(maternal/paternal not stated). Only one of these six relations shared a similar birth defect: an expired
infant and her cousin each had a congenital heart defect.
Again, it is important to note that the reported birth defect(s) of family member(s) were based on the
mother’s recollection of the birth defect(s) and that the medical records of the family member(s) were not
reviewed. Moreover, as aforementioned, the results of the autopsy are not provided in the registry, and
therefore, it cannot be determined whether the reported birth defect(s) was a causal factor for the death.
Illnesses, Conditions, and Complications of Mothers of the Infant Deaths in the Registry
Table 38 presents the number of illnesses, conditions, and complications (“conditions”) of the mothers of
the 20 registry entries documented as infant deaths. As shown in this table, only 35.00% of the mothers
with an infant death had no reported conditions and half of the mothers (10 out of 20) had multiple
conditions.
TABLE 38. Number of Reported Conditions for Mothers of Infant Deaths in the Registry.
Number of Reported
Conditions
Number of Infant Entries
Meeting Criteria
Percent of Infant Entries
Meeting Criteria
0 7 35.00%
1 3 15.00%
2 6 30.00%
3 2 10.00%
4 1 5.00%
6 1 5.00%
Total 20 100.00%
Source: State of Delaware 2007 Birth Defects Registry
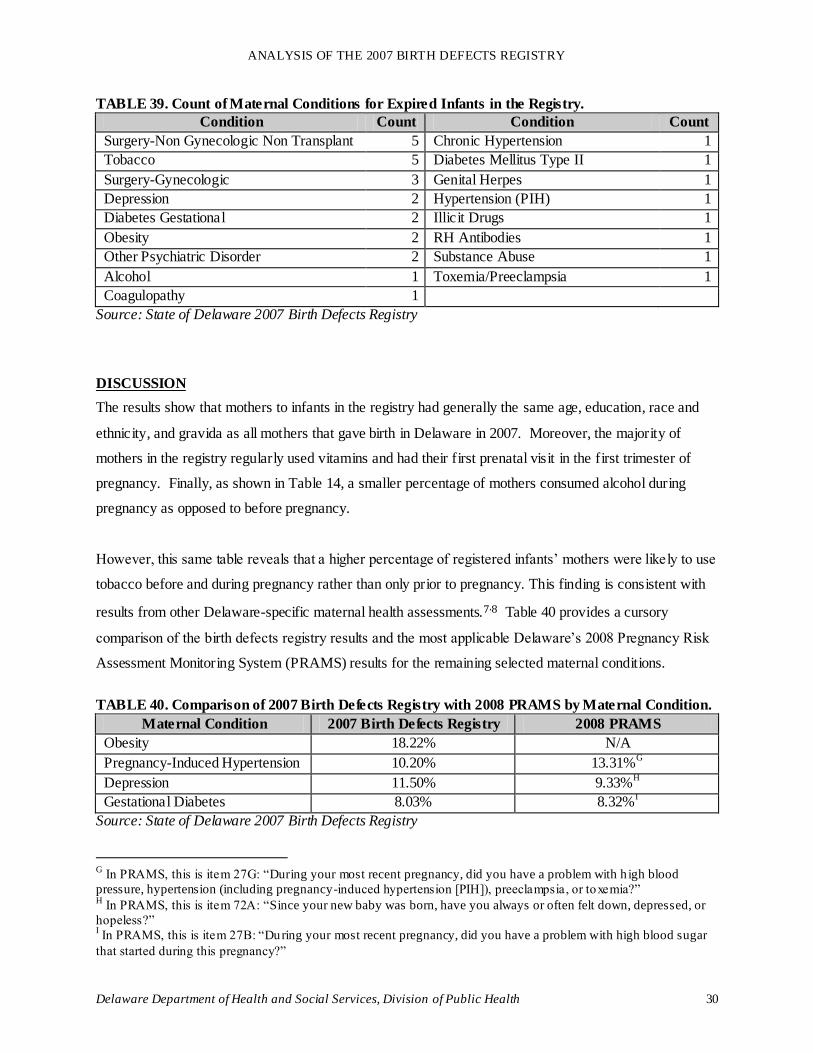
Table 39 provides counts for all of the maternal conditions listed for the 20 infant deaths listed in the
registry.
ANALYSIS OF THE 2007 BIRTH DEFECTS REGISTRY
Delaware Department of Health and Social Services, Division of Public Health 30
TABLE 39. Count of Maternal Conditions for Expired Infants in the Registry.
Condition Count Condition Count
Surgery-Non Gynecologic Non Transplant 5 Chronic Hypertension 1
Tobacco 5 Diabetes Mellitus Type II 1
Surgery-Gynecologic 3 Genital Herpes 1
Depression 2 Hypertension (PIH) 1
Diabetes Gestational 2 Illicit Drugs 1
Obesity 2 RH Antibodies 1
Other Psychiatric Disorder 2 Substance Abuse 1
Alcohol 1 Toxemia/Preeclampsia 1
Coagulopathy 1
Source: State of Delaware 2007 Birth Defects Registry
DISCUSSION
The results show that mothers to infants in the registry had generally the same age, education, race and
ethnicity, and gravida as all mothers that gave birth in Delaware in 2007. Moreover, the majority of
mothers in the registry regularly used vitamins and had their first prenatal visit in the first trimester of
pregnancy. Finally, as shown in Table 14, a smaller percentage of mothers consumed alcohol during
pregnancy as opposed to before pregnancy.
However, this same table reveals that a higher percentage of registered infants’ mothers were likely to use
tobacco before and during pregnancy rather than only prior to pregnancy. This finding is consistent with
results from other Delaware-specific maternal health assessments.7,8 Table 40 provides a cursory
comparison of the birth defects registry results and the most applicable Delaware’s 2008 Pregnancy Risk
Assessment Monitoring System (PRAMS) results for the remaining selected maternal conditions.
TABLE 40. Comparison of 2007 Birth Defects Registry with 2008 PRAMS by Maternal Condition.
Maternal Condition 2007 Birth Defects Registry 2008 PRAMS
Obesity 18.22% N/A
Pregnancy-Induced Hypertension 10.20% 13.31%G
Depression 11.50% 9.33%H
Gestational Diabetes 8.03% 8.32%I
Source: State of Delaware 2007 Birth Defects Registry
G
In PRAMS, this is item 27G: “During your most recent pregnancy, did you have a problem with h igh blood
pressure, hypertension (including pregnancy-induced hypertension [PIH]), preeclampsia, or toxemia?” H
In PRAMS, this is item 72A: “Since your new baby was born, have you always or often felt down, depressed, or
hopeless?” I In PRAMS, this is item 27B: “During your most recent pregnancy, did you have a problem with high blood sugar
that started during this pregnancy?”
ANALYSIS OF THE 2007 BIRTH DEFECTS REGISTRY
Delaware Department of Health and Social Services, Division of Public Health 31
Unlike mothers in the registry, infants in the registry have generally different demographic and health
attributes as compared to all infants born in Delaware. At the state level, a higher percentage of registered
infants are born preterm and male, although some commonly reported birth defects – such as hypospadias
– affect males and not females. Moreover, although comparisons for growth percentile measures cannot
be made, a higher proportion of infants in the registry are typically at or below the 25th percentile for
birth weight, body length, or head circumference.
Furthermore, as indicated in Table 26, roughly three out of four registered infants had documentation of
one birth defect with the remaining one out of four having multiple birth defects reported. The registry
lists 103 infants as having at least one or more family members with a birth defect, bringing the total
count of familial connections to 142. Finally, the registry documented 18 fetal deaths and 20 infant
deaths, and in comparison to all infants in the registry, a lower proportion of these 20 infant deaths (7 out
of 20) had only one birth defect.
The results of this report should add more to the body of knowledge of maternal and child wellbeing in
Delaware. Although the etiology of a birth defect generally cannot be uncovered and one calendar year of
data may limit the strength of the results, this report may afford some cursory insights about what factors
could be modified to reduce the incidence of birth defects in Delaware.
ANALYSIS OF THE 2007 BIRTH DEFECTS REGISTRY
Delaware Department of Health and Social Services, Division of Public Health 32
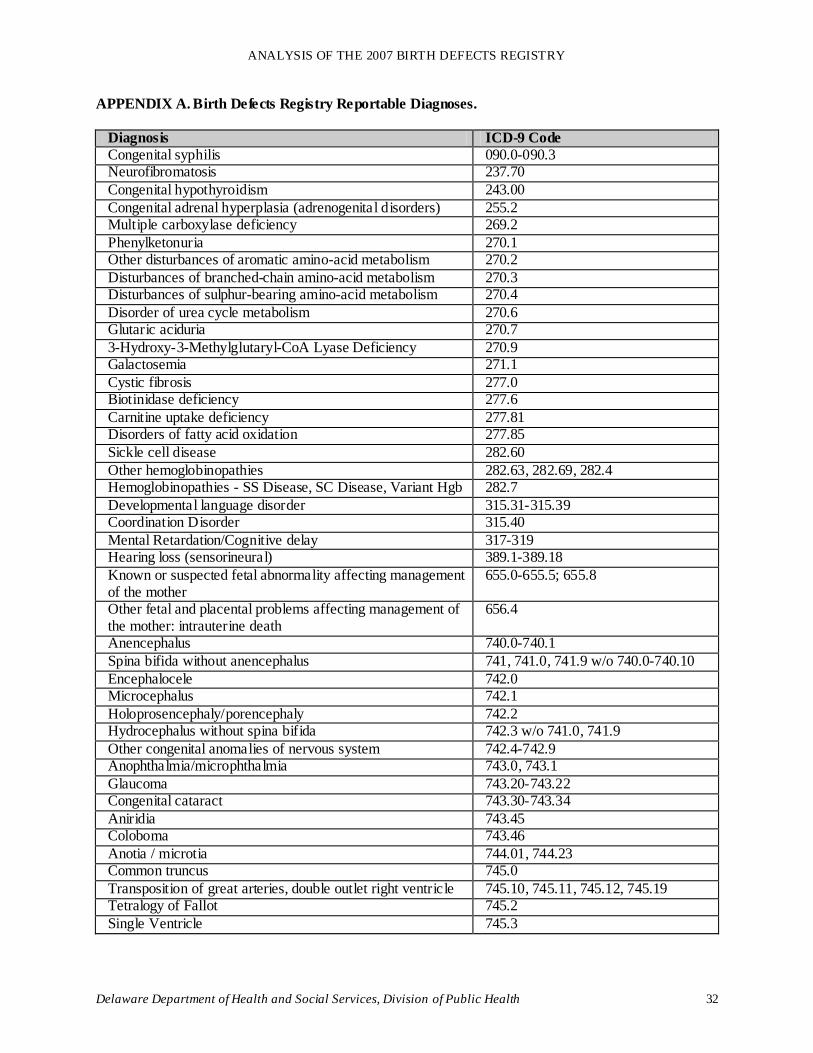
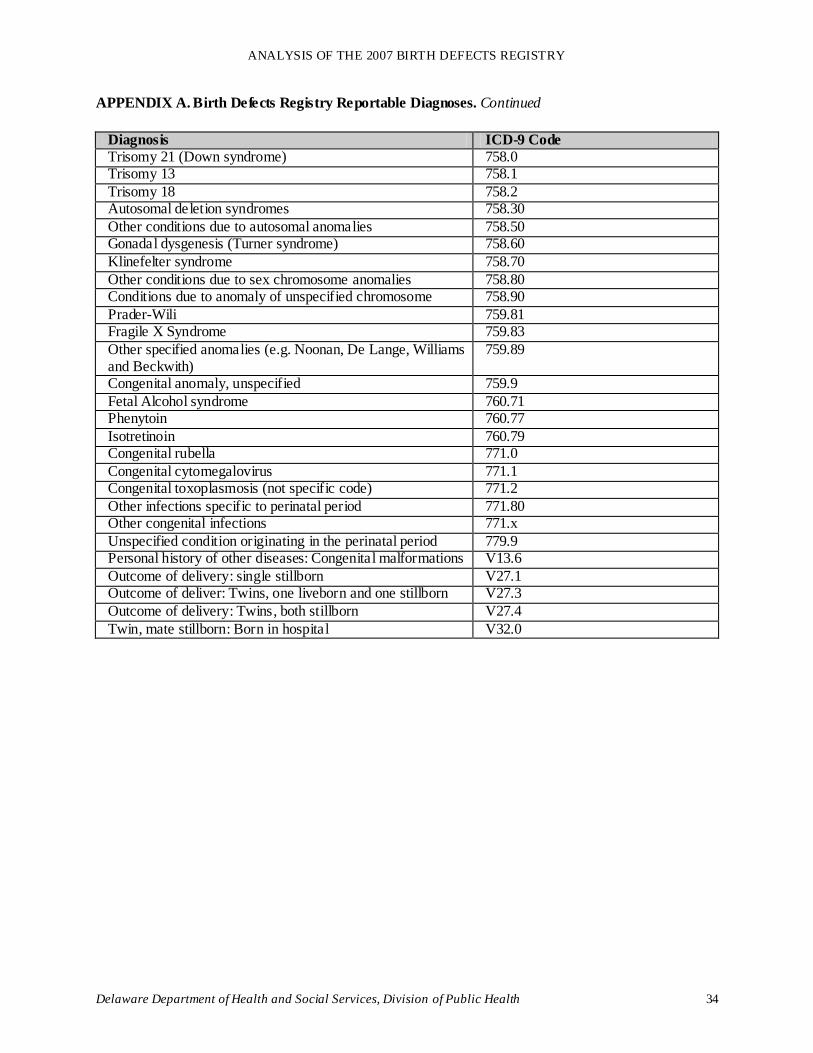
APPENDIX A. Birth Defects Registry Reportable Diagnoses.
Diagnosis ICD-9 Code
Congenital syphilis 090.0-090.3 Neurofibromatosis 237.70
Congenital hypothyroidism 243.00
Congenital adrenal hyperplasia (adrenogenital disorders) 255.2 Multiple carboxylase deficiency 269.2
Phenylketonuria 270.1 Other disturbances of aromatic amino-acid metabolism 270.2
Disturbances of branched-chain amino-acid metabolism 270.3 Disturbances of sulphur-bearing amino-acid metabolism 270.4
Disorder of urea cycle metabolism 270.6 Glutaric aciduria 270.7
3-Hydroxy-3-Methylglutaryl-CoA Lyase Deficiency 270.9 Galactosemia 271.1
Cystic fibrosis 277.0 Biotinidase deficiency 277.6
Carnitine uptake deficiency 277.81 Disorders of fatty acid oxidation 277.85
Sickle cell disease 282.60
Other hemoglobinopathies 282.63, 282.69, 282.4 Hemoglobinopathies - SS Disease, SC Disease, Variant Hgb 282.7
Developmental language disorder 315.31-315.39 Coordination Disorder 315.40
Mental Retardation/Cognitive delay 317-319 Hearing loss (sensorineural) 389.1-389.18
Known or suspected fetal abnormality affecting management of the mother
655.0-655.5; 655.8
Other fetal and placental problems affecting management of the mother: intrauterine death
656.4
Anencephalus 740.0-740.1
Spina bifida without anencephalus 741, 741.0, 741.9 w/o 740.0-740.10
Encephalocele 742.0 Microcephalus 742.1
Holoprosencephaly/porencephaly 742.2 Hydrocephalus without spina bifida 742.3 w/o 741.0, 741.9
Other congenital anomalies of nervous system 742.4-742.9 Anophthalmia/microphthalmia 743.0, 743.1
Glaucoma 743.20-743.22 Congenital cataract 743.30-743.34
Aniridia 743.45 Coloboma 743.46
Anotia / microtia 744.01, 744.23 Common truncus 745.0
Transposition of great arteries, double outlet right ventricle 745.10, 745.11, 745.12, 745.19 Tetralogy of Fallot 745.2
Single Ventricle 745.3
ANALYSIS OF THE 2007 BIRTH DEFECTS REGISTRY
Delaware Department of Health and Social Services, Division of Public Health 33
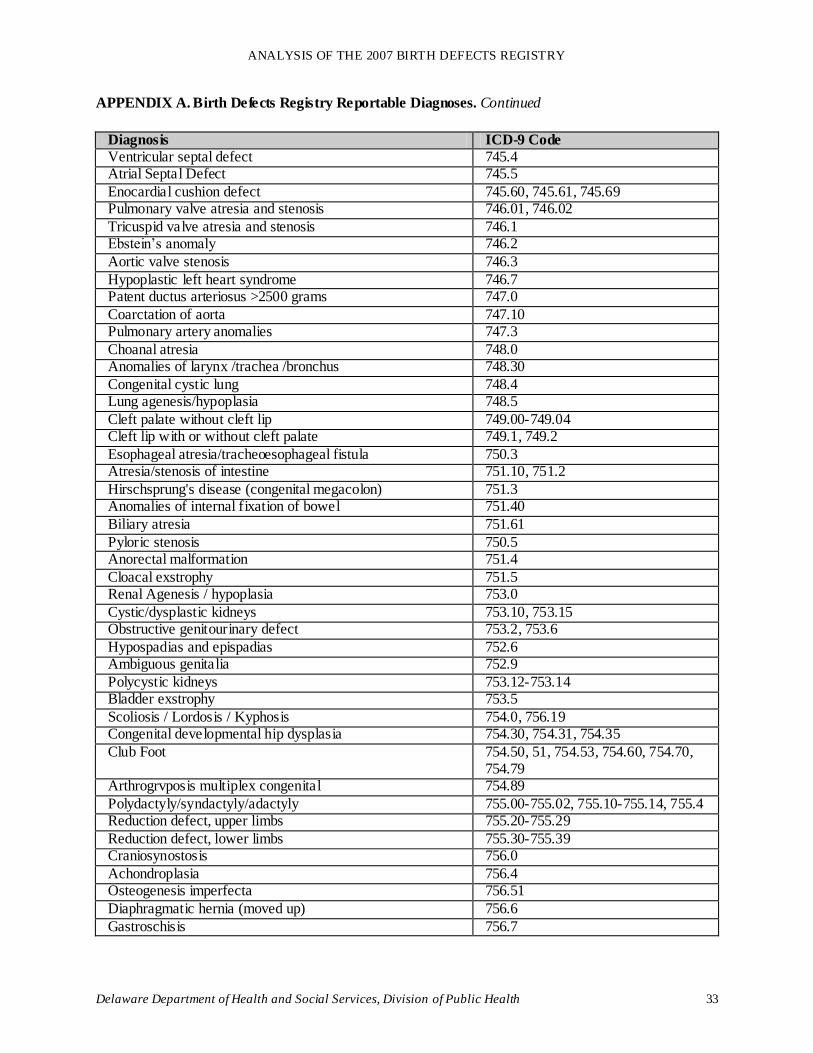
APPENDIX A. Birth Defects Registry Reportable Diagnoses. Continued
Diagnosis ICD-9 Code
Ventricular septal defect 745.4 Atrial Septal Defect 745.5
Enocardial cushion defect 745.60, 745.61, 745.69 Pulmonary valve atresia and stenosis 746.01, 746.02
Tricuspid valve atresia and stenosis 746.1 Ebstein’s anomaly 746.2
Aortic valve stenosis 746.3
Hypoplastic left heart syndrome 746.7 Patent ductus arteriosus >2500 grams 747.0
Coarctation of aorta 747.10 Pulmonary artery anomalies 747.3
Choanal atresia 748.0 Anomalies of larynx /trachea /bronchus 748.30
Congenital cystic lung 748.4 Lung agenesis/hypoplasia 748.5
Cleft palate without cleft lip 749.00-749.04 Cleft lip with or without cleft palate 749.1, 749.2
Esophageal atresia/tracheoesophageal fistula 750.3 Atresia/stenosis of intestine 751.10, 751.2
Hirschsprung's disease (congenital megacolon) 751.3 Anomalies of internal fixation of bowel 751.40
Biliary atresia 751.61
Pyloric stenosis 750.5 Anorectal malformation 751.4
Cloacal exstrophy 751.5 Renal Agenesis / hypoplasia 753.0
Cystic/dysplastic kidneys 753.10, 753.15 Obstructive genitourinary defect 753.2, 753.6
Hypospadias and epispadias 752.6 Ambiguous genitalia 752.9
Polycystic kidneys 753.12-753.14 Bladder exstrophy 753.5
Scoliosis / Lordosis / Kyphosis 754.0, 756.19 Congenital developmental hip dysplasia 754.30, 754.31, 754.35
Club Foot 754.50, 51, 754.53, 754.60, 754.70, 754.79
Arthrogrvposis multiplex congenital 754.89
Polydactyly/syndactyly/adactyly 755.00-755.02, 755.10-755.14, 755.4 Reduction defect, upper limbs 755.20-755.29
Reduction defect, lower limbs 755.30-755.39 Craniosynostosis 756.0
Achondroplasia 756.4 Osteogenesis imperfecta 756.51
Diaphragmatic hernia (moved up) 756.6
Gastroschisis 756.7
ANALYSIS OF THE 2007 BIRTH DEFECTS REGISTRY
Delaware Department of Health and Social Services, Division of Public Health 34
APPENDIX A. Birth Defects Registry Reportable Diagnoses. Continued
Diagnosis ICD-9 Code
Trisomy 21 (Down syndrome) 758.0 Trisomy 13 758.1
Trisomy 18 758.2 Autosomal deletion syndromes 758.30
Other conditions due to autosomal anomalies 758.50 Gonadal dysgenesis (Turner syndrome) 758.60
Klinefelter syndrome 758.70
Other conditions due to sex chromosome anomalies 758.80 Conditions due to anomaly of unspecified chromosome 758.90
Prader-Wili 759.81 Fragile X Syndrome 759.83
Other specified anomalies (e.g. Noonan, De Lange, Williams and Beckwith)
759.89
Congenital anomaly, unspecified 759.9
Fetal Alcohol syndrome 760.71 Phenytoin 760.77
Isotretinoin 760.79 Congenital rubella 771.0
Congenital cytomegalovirus 771.1 Congenital toxoplasmosis (not specific code) 771.2
Other infections specific to perinatal period 771.80 Other congenital infections 771.x
Unspecified condition originating in the perinatal period 779.9 Personal history of other diseases: Congenital malformations V13.6
Outcome of delivery: single stillborn V27.1 Outcome of deliver: Twins, one liveborn and one stillborn V27.3
Outcome of delivery: Twins, both stillborn V27.4
Twin, mate stillborn: Born in hospital V32.0
ANALYSIS OF THE 2007 BIRTH DEFECTS REGISTRY
Delaware Department of Health and Social Services, Division of Public Health 35
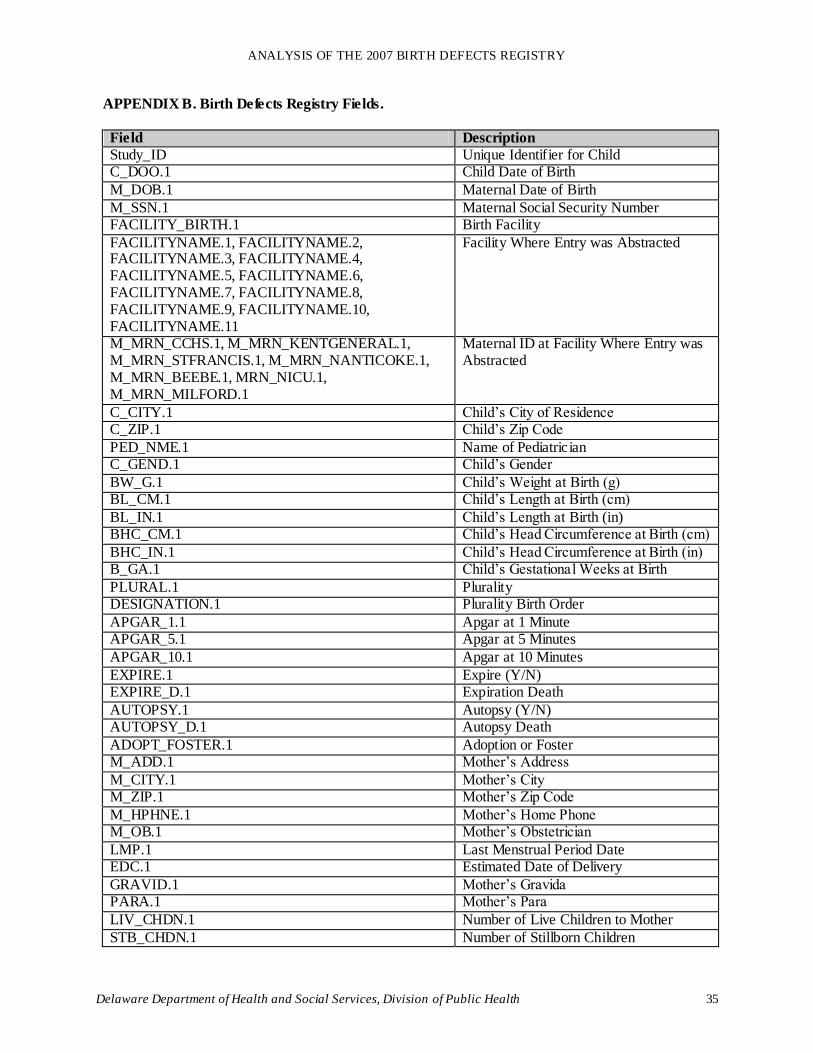
APPENDIX B. Birth Defects Registry Fields.
Field Description
Study_ID Unique Identifier for Child C_DOO.1 Child Date of Birth
M_DOB.1 Maternal Date of Birth
M_SSN.1 Maternal Social Security Number FACILITY_BIRTH.1 Birth Facility
FACILITYNAME.1, FACILITYNAME.2, FACILITYNAME.3, FACILITYNAME.4, FACILITYNAME.5, FACILITYNAME.6, FACILITYNAME.7, FACILITYNAME.8, FACILITYNAME.9, FACILITYNAME.10, FACILITYNAME.11
Facility Where Entry was Abstracted
M_MRN_CCHS.1, M_MRN_KENTGENERAL.1, M_MRN_STFRANCIS.1, M_MRN_NANTICOKE.1, M_MRN_BEEBE.1, MRN_NICU.1, M_MRN_MILFORD.1
Maternal ID at Facility Where Entry was Abstracted
C_CITY.1 Child’s City of Residence C_ZIP.1 Child’s Zip Code
PED_NME.1 Name of Pediatrician C_GEND.1 Child’s Gender
BW_G.1 Child’s Weight at Birth (g) BL_CM.1 Child’s Length at Birth (cm)
BL_IN.1 Child’s Length at Birth (in) BHC_CM.1 Child’s Head Circumference at Birth (cm)
BHC_IN.1 Child’s Head Circumference at Birth (in) B_GA.1 Child’s Gestational Weeks at Birth
PLURAL.1 Plurality DESIGNATION.1 Plurality Birth Order
APGAR_1.1 Apgar at 1 Minute APGAR_5.1 Apgar at 5 Minutes
APGAR_10.1 Apgar at 10 Minutes
EXPIRE.1 Expire (Y/N) EXPIRE_D.1 Expiration Death
AUTOPSY.1 Autopsy (Y/N) AUTOPSY_D.1 Autopsy Death
ADOPT_FOSTER.1 Adoption or Foster M_ADD.1 Mother’s Address
M_CITY.1 Mother’s City M_ZIP.1 Mother’s Zip Code
M_HPHNE.1 Mother’s Home Phone M_OB.1 Mother’s Obstetrician
LMP.1 Last Menstrual Period Date EDC.1 Estimated Date of Delivery
GRAVID.1 Mother’s Gravida PARA.1 Mother’s Para
LIV_CHDN.1 Number of Live Children to Mother
STB_CHDN.1 Number of Stillborn Children
ANALYSIS OF THE 2007 BIRTH DEFECTS REGISTRY
Delaware Department of Health and Social Services, Division of Public Health 36
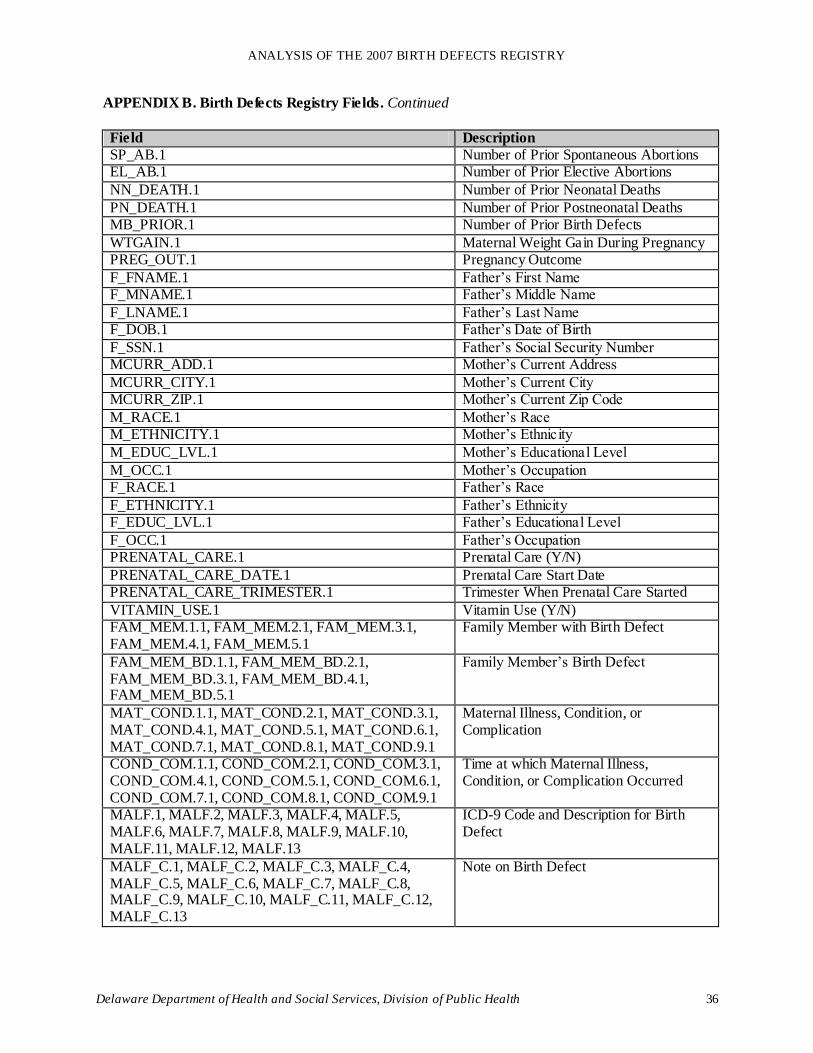
APPENDIX B. Birth Defects Registry Fields. Continued
Field Description
SP_AB.1 Number of Prior Spontaneous Abortions EL_AB.1 Number of Prior Elective Abortions
NN_DEATH.1 Number of Prior Neonatal Deaths
PN_DEATH.1 Number of Prior Postneonatal Deaths MB_PRIOR.1 Number of Prior Birth Defects
WTGAIN.1 Maternal Weight Gain During Pregnancy PREG_OUT.1 Pregnancy Outcome
F_FNAME.1 Father’s First Name F_MNAME.1 Father’s Middle Name
F_LNAME.1 Father’s Last Name F_DOB.1 Father’s Date of Birth
F_SSN.1 Father’s Social Security Number MCURR_ADD.1 Mother’s Current Address
MCURR_CITY.1 Mother’s Current City MCURR_ZIP.1 Mother’s Current Zip Code
M_RACE.1 Mother’s Race M_ETHNICITY.1 Mother’s Ethnicity
M_EDUC_LVL.1 Mother’s Educational Level
M_OCC.1 Mother’s Occupation F_RACE.1 Father’s Race
F_ETHNICITY.1 Father’s Ethnicity F_EDUC_LVL.1 Father’s Educational Level
F_OCC.1 Father’s Occupation PRENATAL_CARE.1 Prenatal Care (Y/N)
PRENATAL_CARE_DATE.1 Prenatal Care Start Date PRENATAL_CARE_TRIMESTER.1 Trimester When Prenatal Care Started
VITAMIN_USE.1 Vitamin Use (Y/N) FAM_MEM.1.1, FAM_MEM.2.1, FAM_MEM.3.1, FAM_MEM.4.1, FAM_MEM.5.1
Family Member with Birth Defect
FAM_MEM_BD.1.1, FAM_MEM_BD.2.1, FAM_MEM_BD.3.1, FAM_MEM_BD.4.1, FAM_MEM_BD.5.1
Family Member’s Birth Defect
MAT_COND.1.1, MAT_COND.2.1, MAT_COND.3.1, MAT_COND.4.1, MAT_COND.5.1, MAT_COND.6.1, MAT_COND.7.1, MAT_COND.8.1, MAT_COND.9.1
Maternal Illness, Condition, or Complication
COND_COM.1.1, COND_COM.2.1, COND_COM.3.1, COND_COM.4.1, COND_COM.5.1, COND_COM.6.1, COND_COM.7.1, COND_COM.8.1, COND_COM.9.1
Time at which Maternal Illness, Condition, or Complication Occurred
MALF.1, MALF.2, MALF.3, MALF.4, MALF.5, MALF.6, MALF.7, MALF.8, MALF.9, MALF.10, MALF.11, MALF.12, MALF.13
ICD-9 Code and Description for Birth Defect
MALF_C.1, MALF_C.2, MALF_C.3, MALF_C.4, MALF_C.5, MALF_C.6, MALF_C.7, MALF_C.8, MALF_C.9, MALF_C.10, MALF_C.11, MALF_C.12, MALF_C.13
Note on Birth Defect
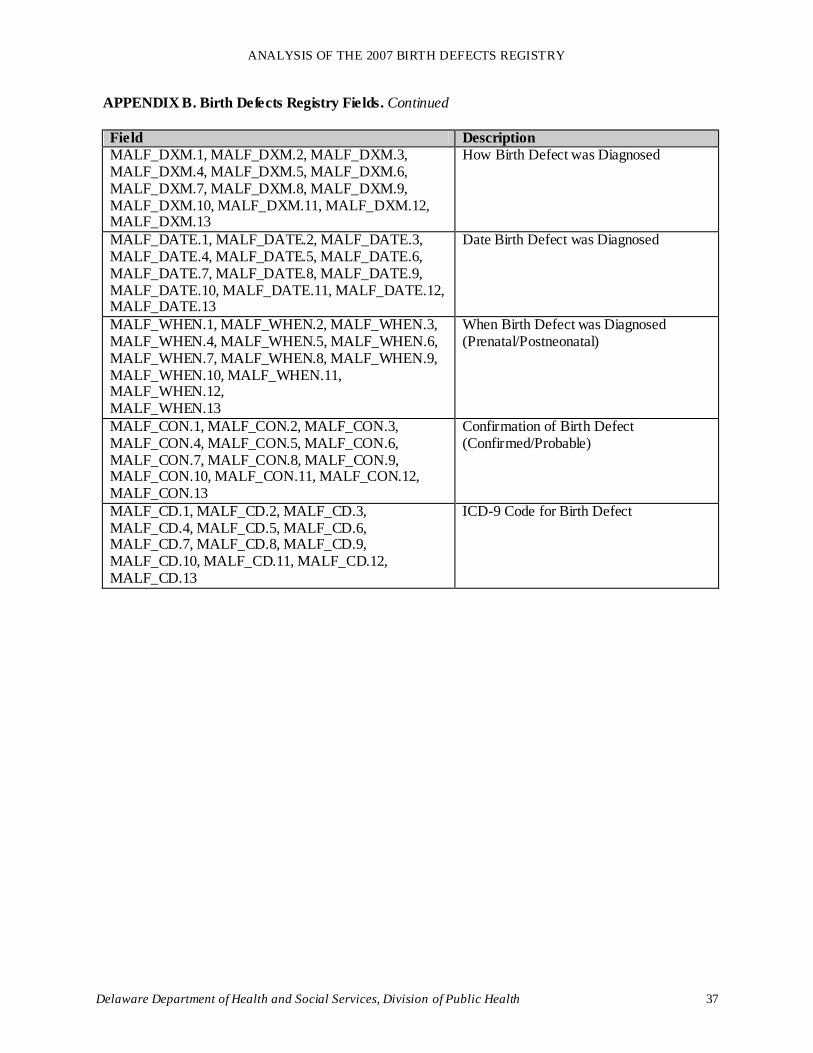
ANALYSIS OF THE 2007 BIRTH DEFECTS REGISTRY
Delaware Department of Health and Social Services, Division of Public Health 37
APPENDIX B. Birth Defects Registry Fields. Continued
Field Description
MALF_DXM.1, MALF_DXM.2, MALF_DXM.3, MALF_DXM.4, MALF_DXM.5, MALF_DXM.6, MALF_DXM.7, MALF_DXM.8, MALF_DXM.9, MALF_DXM.10, MALF_DXM.11, MALF_DXM.12, MALF_DXM.13
How Birth Defect was Diagnosed
MALF_DATE.1, MALF_DATE.2, MALF_DATE.3, MALF_DATE.4, MALF_DATE.5, MALF_DATE.6, MALF_DATE.7, MALF_DATE.8, MALF_DATE.9, MALF_DATE.10, MALF_DATE.11, MALF_DATE.12, MALF_DATE.13
Date Birth Defect was Diagnosed
MALF_WHEN.1, MALF_WHEN.2, MALF_WHEN.3, MALF_WHEN.4, MALF_WHEN.5, MALF_WHEN.6, MALF_WHEN.7, MALF_WHEN.8, MALF_WHEN.9, MALF_WHEN.10, MALF_WHEN.11, MALF_WHEN.12, MALF_WHEN.13
When Birth Defect was Diagnosed (Prenatal/Postneonatal)
MALF_CON.1, MALF_CON.2, MALF_CON.3, MALF_CON.4, MALF_CON.5, MALF_CON.6, MALF_CON.7, MALF_CON.8, MALF_CON.9, MALF_CON.10, MALF_CON.11, MALF_CON.12, MALF_CON.13
Confirmation of Birth Defect (Confirmed/Probable)
MALF_CD.1, MALF_CD.2, MALF_CD.3, MALF_CD.4, MALF_CD.5, MALF_CD.6, MALF_CD.7, MALF_CD.8, MALF_CD.9, MALF_CD.10, MALF_CD.11, MALF_CD.12, MALF_CD.13
ICD-9 Code for Birth Defect
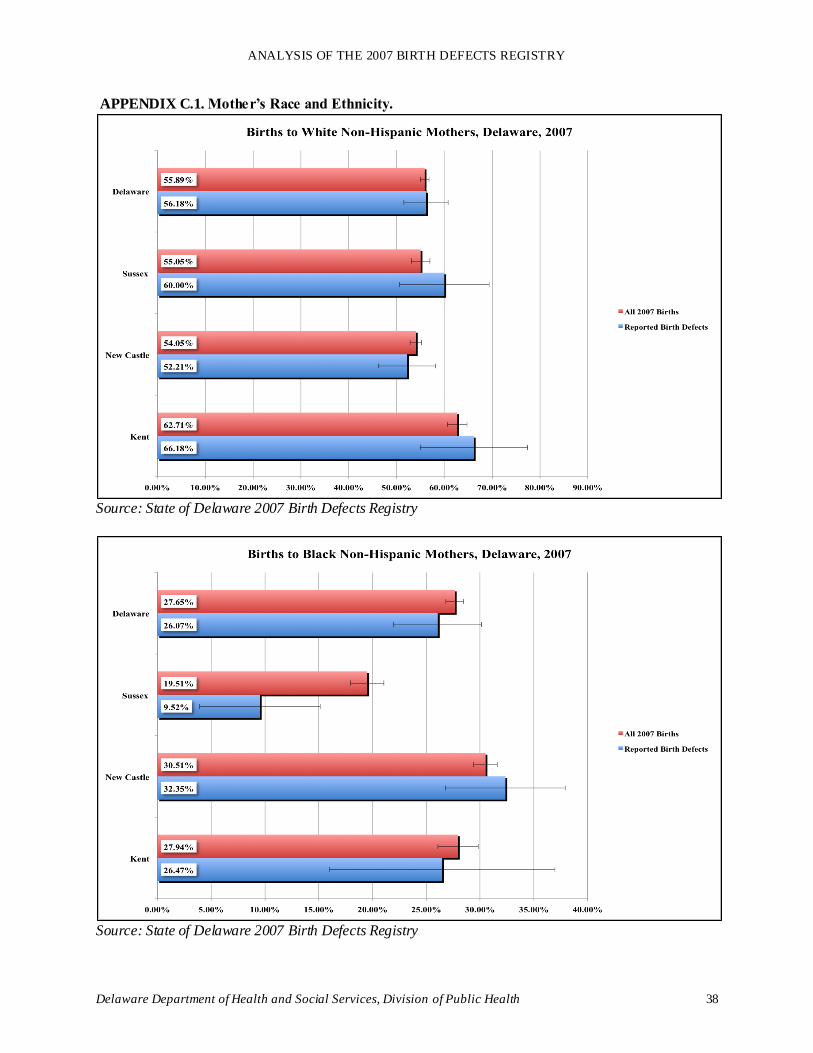
ANALYSIS OF THE 2007 BIRTH DEFECTS REGISTRY
Delaware Department of Health and Social Services, Division of Public Health 38
APPENDIX C.1. Mother’s Race and Ethnicity.
Source: State of Delaware 2007 Birth Defects Registry
Source: State of Delaware 2007 Birth Defects Registry
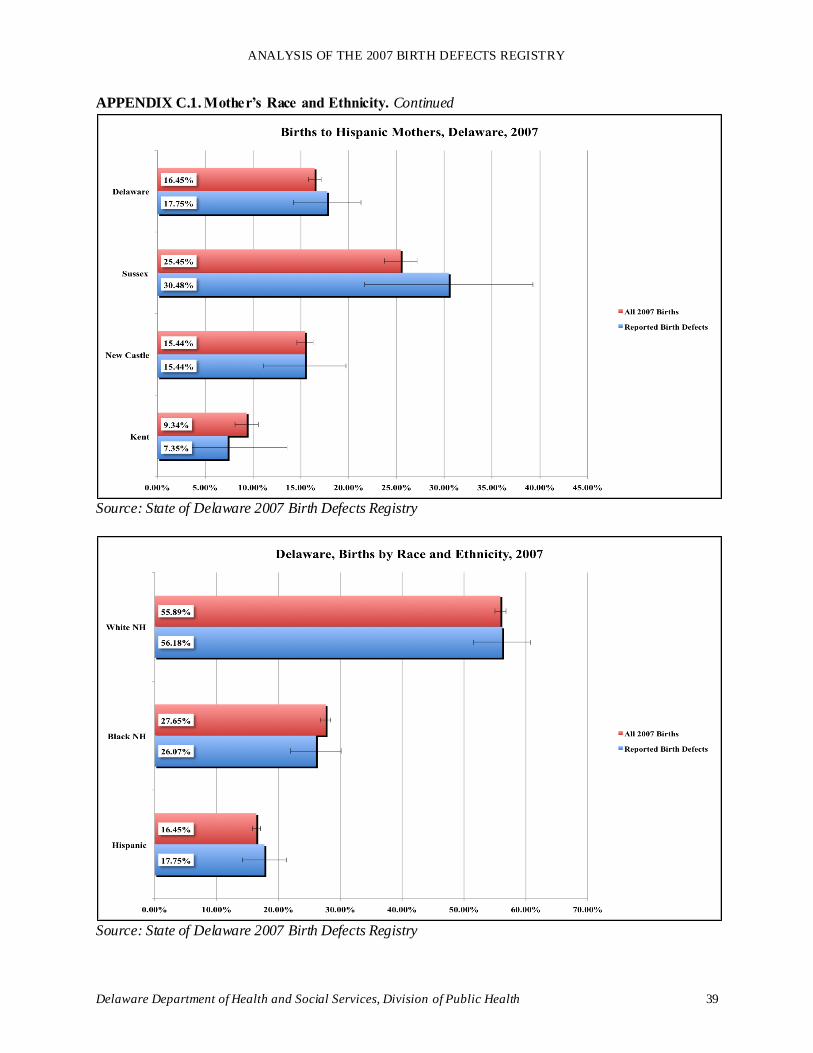
ANALYSIS OF THE 2007 BIRTH DEFECTS REGISTRY
Delaware Department of Health and Social Services, Division of Public Health 39
APPENDIX C.1. Mother’s Race and Ethnicity. Continued
Source: State of Delaware 2007 Birth Defects Registry
Source: State of Delaware 2007 Birth Defects Registry
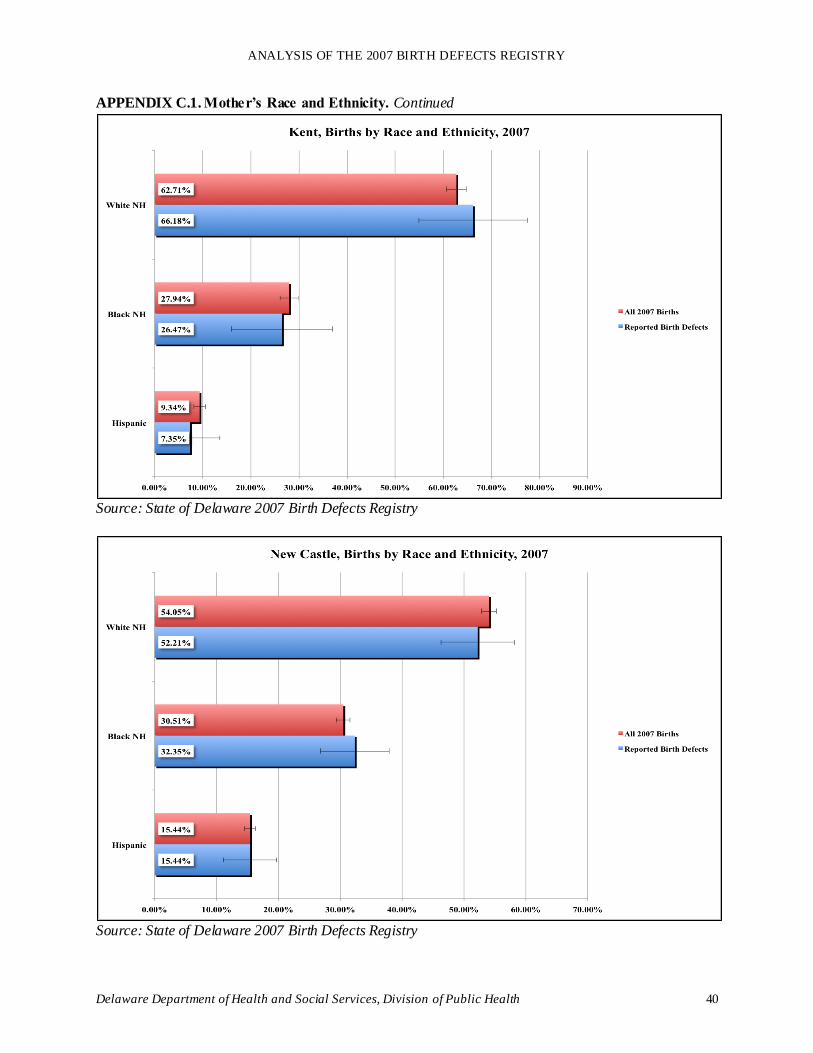
ANALYSIS OF THE 2007 BIRTH DEFECTS REGISTRY
Delaware Department of Health and Social Services, Division of Public Health 40
APPENDIX C.1. Mother’s Race and Ethnicity. Continued
Source: State of Delaware 2007 Birth Defects Registry
Source: State of Delaware 2007 Birth Defects Registry
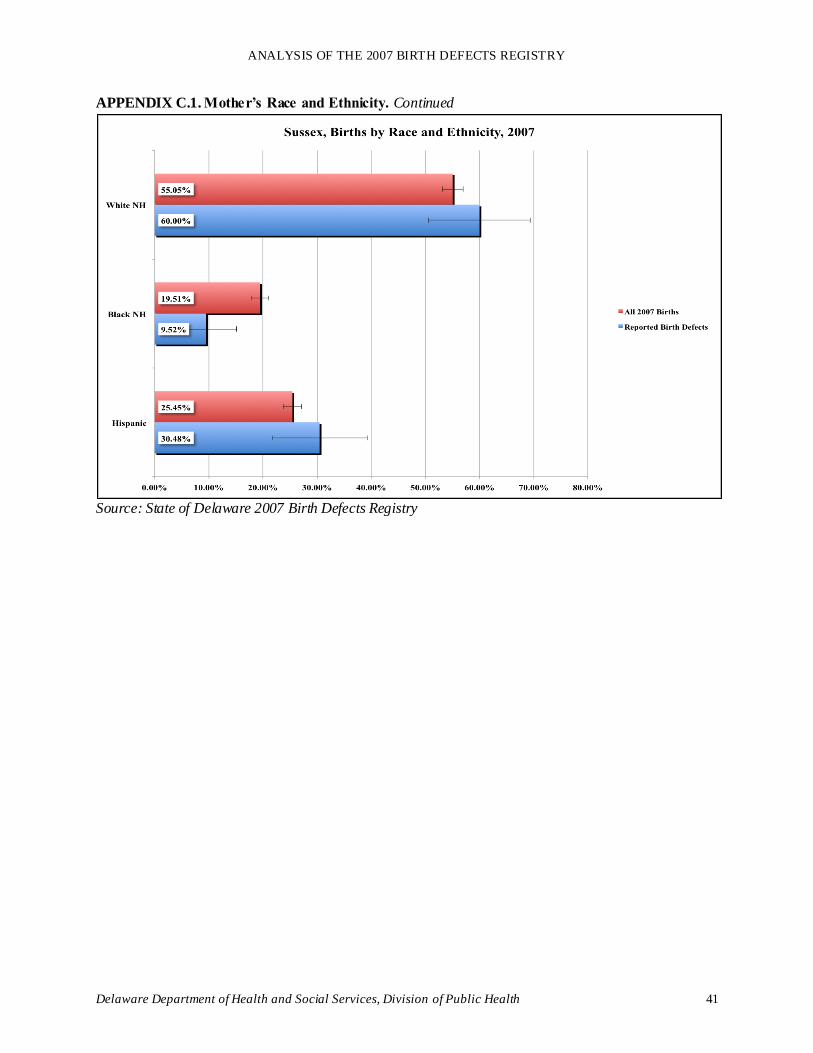
ANALYSIS OF THE 2007 BIRTH DEFECTS REGISTRY
Delaware Department of Health and Social Services, Division of Public Health 41
APPENDIX C.1. Mother’s Race and Ethnicity. Continued
Source: State of Delaware 2007 Birth Defects Registry
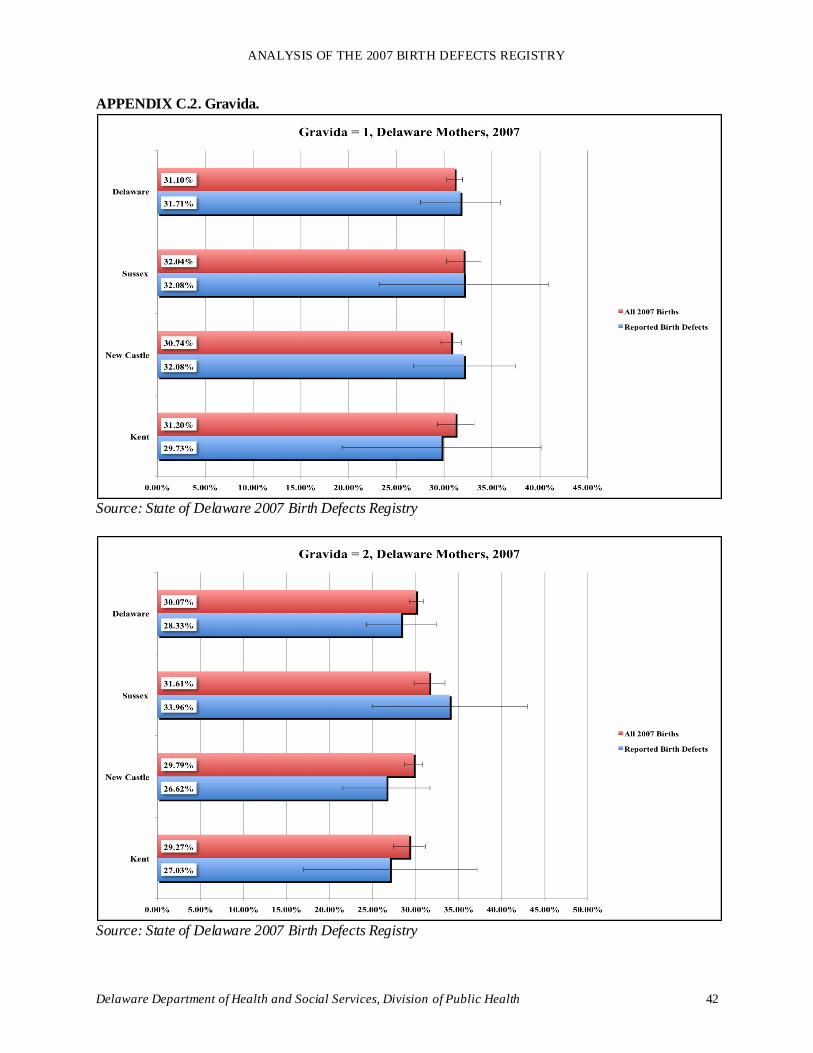
ANALYSIS OF THE 2007 BIRTH DEFECTS REGISTRY
Delaware Department of Health and Social Services, Division of Public Health 42
APPENDIX C.2. Gravida.
Source: State of Delaware 2007 Birth Defects Registry
Source: State of Delaware 2007 Birth Defects Registry
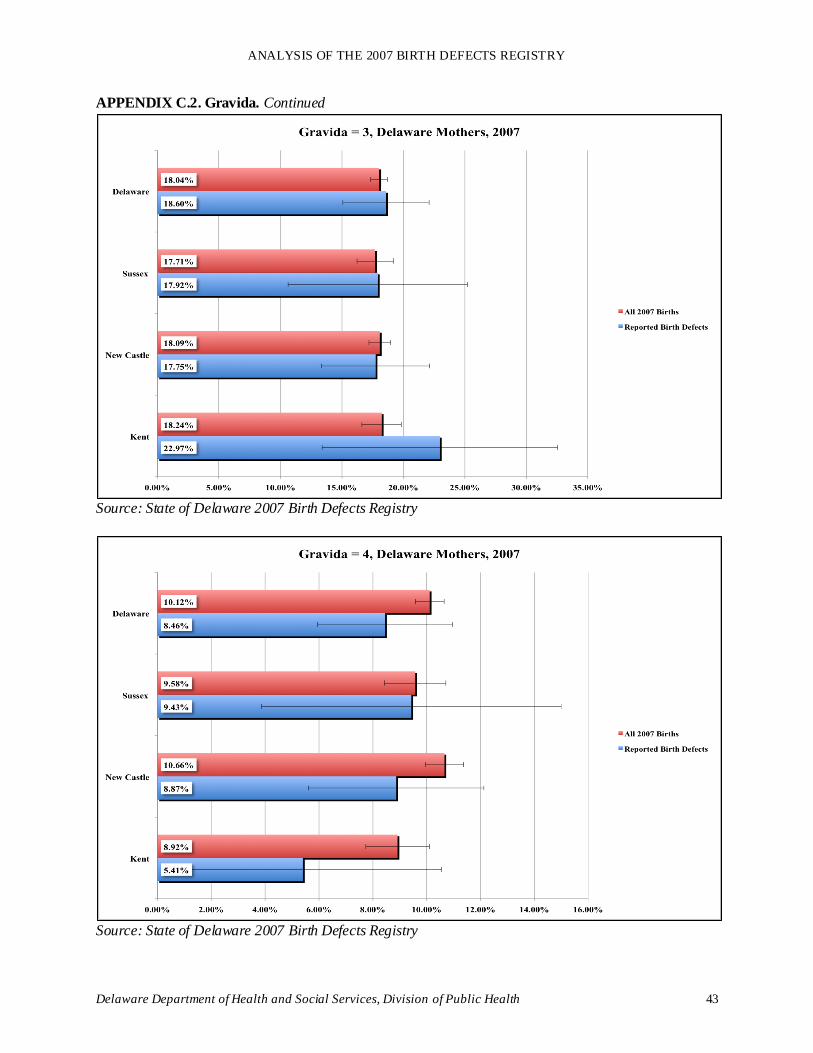
ANALYSIS OF THE 2007 BIRTH DEFECTS REGISTRY
Delaware Department of Health and Social Services, Division of Public Health 43
APPENDIX C.2. Gravida. Continued
Source: State of Delaware 2007 Birth Defects Registry
Source: State of Delaware 2007 Birth Defects Registry
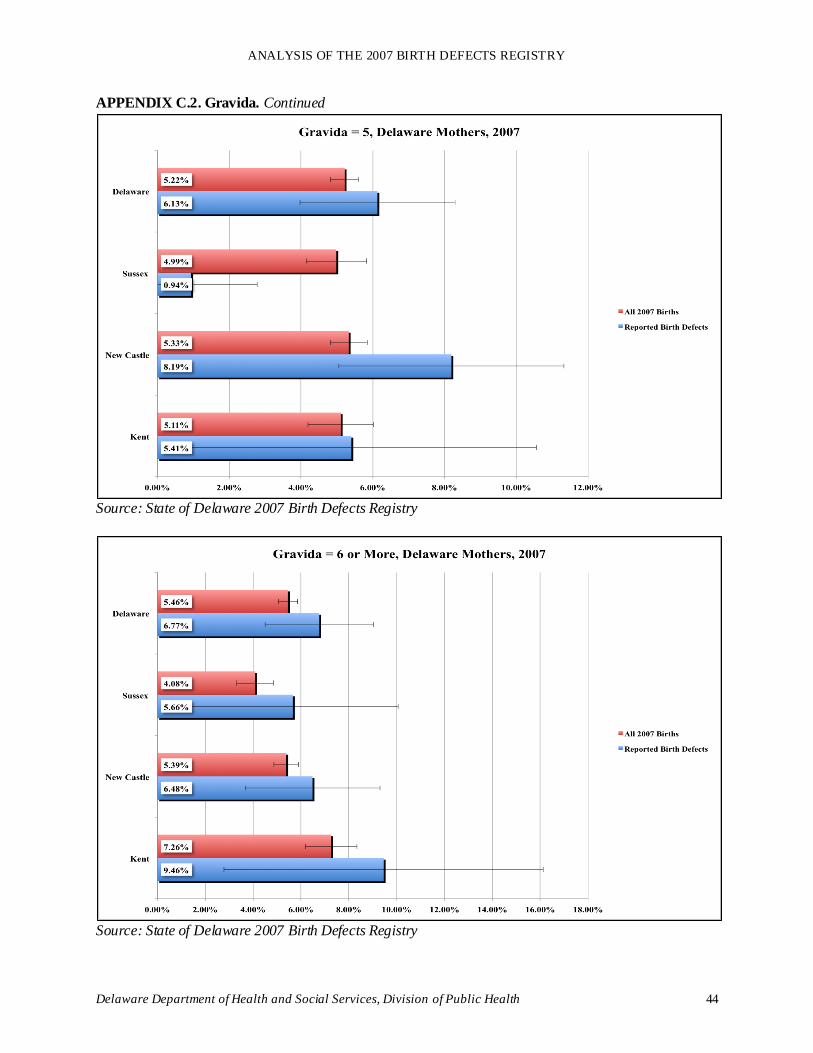
ANALYSIS OF THE 2007 BIRTH DEFECTS REGISTRY
Delaware Department of Health and Social Services, Division of Public Health 44
APPENDIX C.2. Gravida. Continued
Source: State of Delaware 2007 Birth Defects Registry
Source: State of Delaware 2007 Birth Defects Registry
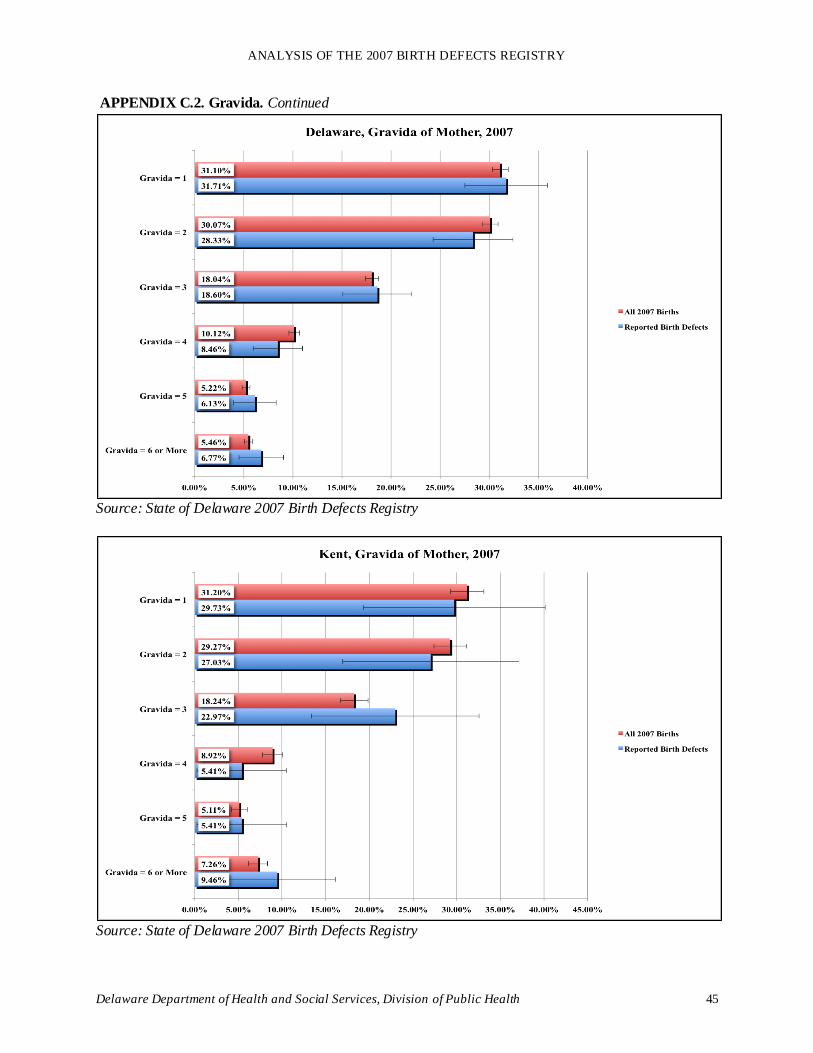
ANALYSIS OF THE 2007 BIRTH DEFECTS REGISTRY
Delaware Department of Health and Social Services, Division of Public Health 45
APPENDIX C.2. Gravida. Continued
Source: State of Delaware 2007 Birth Defects Registry
Source: State of Delaware 2007 Birth Defects Registry
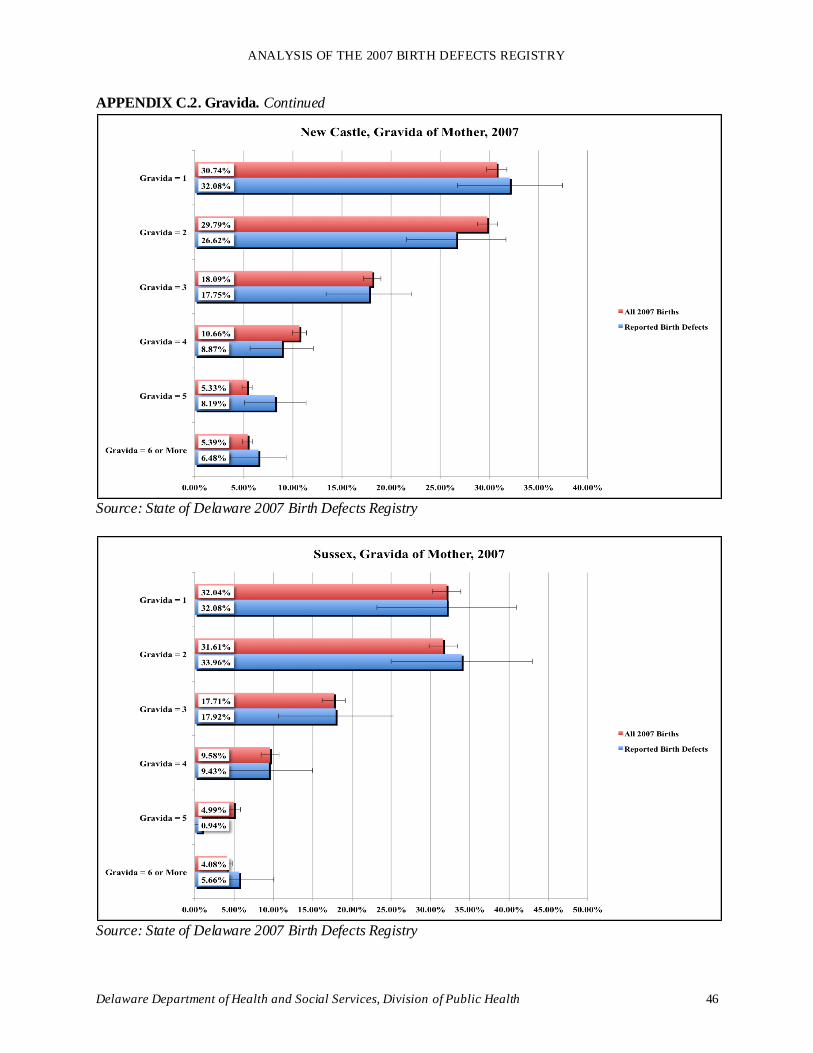
ANALYSIS OF THE 2007 BIRTH DEFECTS REGISTRY
Delaware Department of Health and Social Services, Division of Public Health 46
APPENDIX C.2. Gravida. Continued
Source: State of Delaware 2007 Birth Defects Registry
Source: State of Delaware 2007 Birth Defects Registry
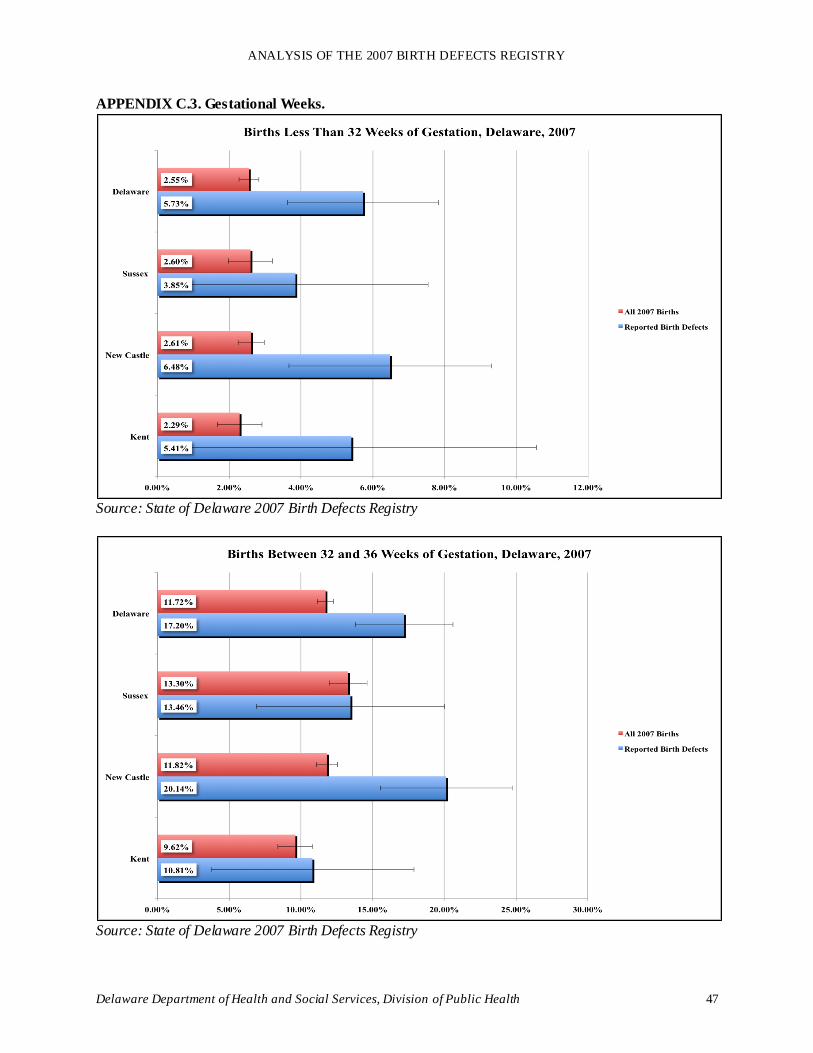
ANALYSIS OF THE 2007 BIRTH DEFECTS REGISTRY
Delaware Department of Health and Social Services, Division of Public Health 47
APPENDIX C.3. Gestational Weeks.
Source: State of Delaware 2007 Birth Defects Registry
Source: State of Delaware 2007 Birth Defects Registry
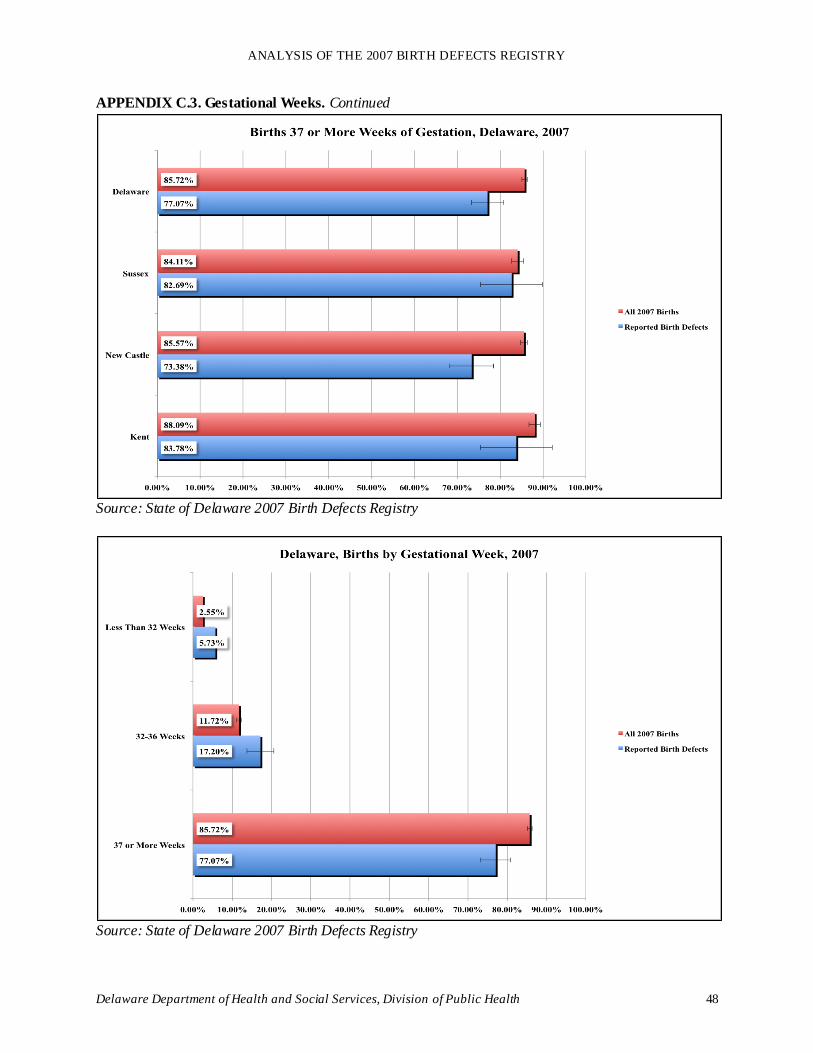
ANALYSIS OF THE 2007 BIRTH DEFECTS REGISTRY
Delaware Department of Health and Social Services, Division of Public Health 48
APPENDIX C.3. Gestational Weeks. Continued
Source: State of Delaware 2007 Birth Defects Registry
Source: State of Delaware 2007 Birth Defects Registry
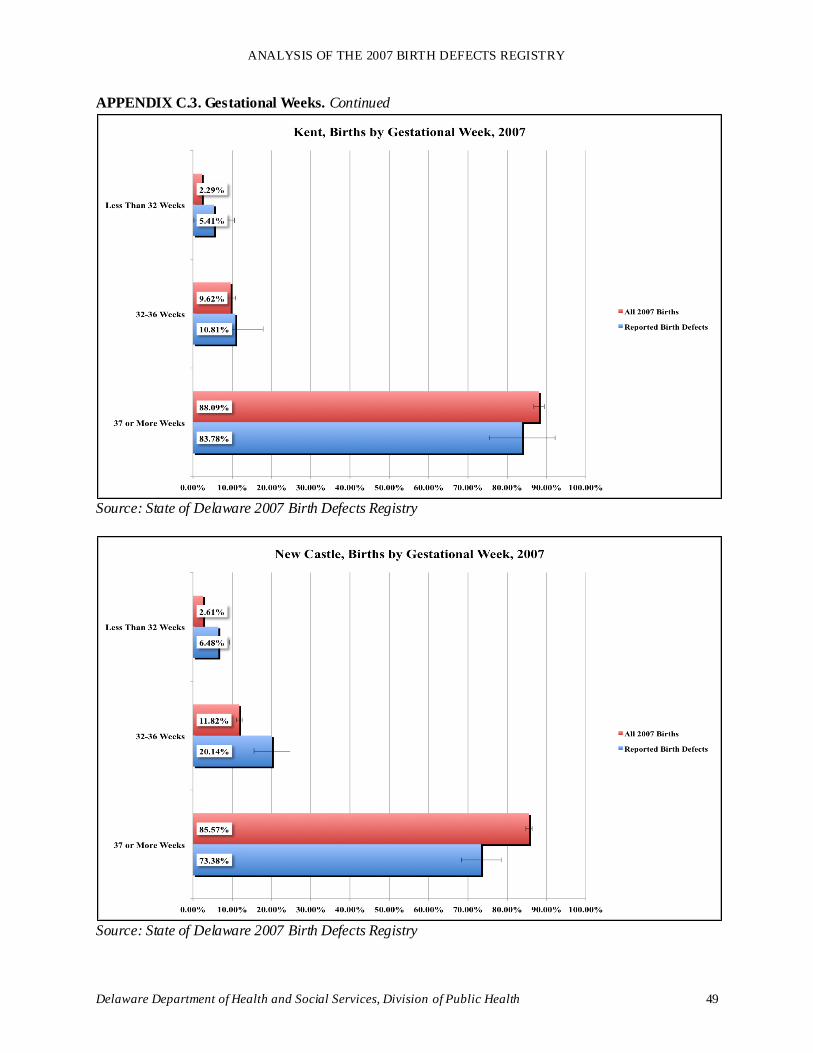
ANALYSIS OF THE 2007 BIRTH DEFECTS REGISTRY
Delaware Department of Health and Social Services, Division of Public Health 49
APPENDIX C.3. Gestational Weeks. Continued
Source: State of Delaware 2007 Birth Defects Registry
Source: State of Delaware 2007 Birth Defects Registry
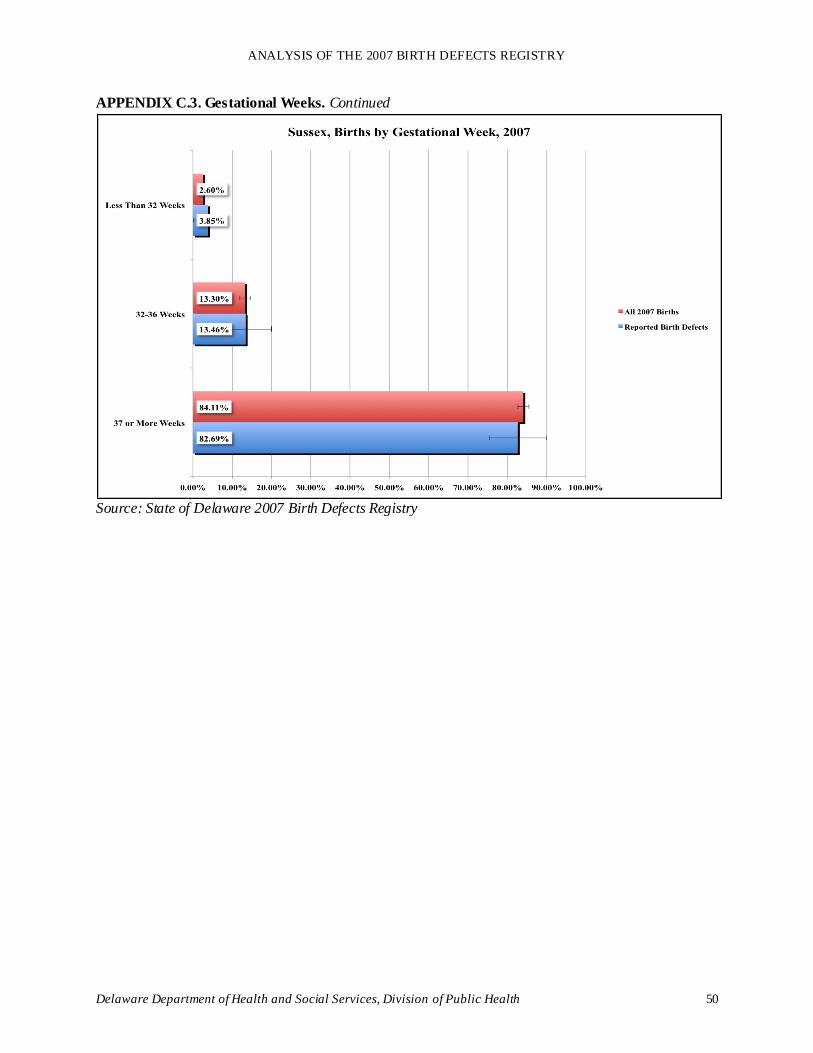
ANALYSIS OF THE 2007 BIRTH DEFECTS REGISTRY
Delaware Department of Health and Social Services, Division of Public Health 50
APPENDIX C.3. Gestational Weeks. Continued
Source: State of Delaware 2007 Birth Defects Registry
ANALYSIS OF THE 2007 BIRTH DEFECTS REGISTRY
Delaware Department of Health and Social Services, Division of Public Health 51
REFERENCES
1 March of Dimes. (2011). Birth defects. Retrieved from March of Dimes website:
http://www.marchofdimes.com/Baby/birthdefects.html. 2 Centers for Disease Control and Prevention. (2006). Improved national prevalence estimates for 18
selected major birth defects – United States, 1999-2001. MMWR, 54(51,52): 1301-5. 3 Mathews, T. and MacDorman, M. (2008, July). Infant mortality statistics from the 2005 period linked
birth/infant death data set. Nat Vit Stat Rep, 57, 2. 4 Delaware Health Statistics Center. (2011, February). Delaware Vital Statistics Annual Report, 2008.
Retrieved from Department of Health and Social Services, Division of Public Health website: http://www.dhss.delaware.gov/dhss/dph/hp/annrepvs.html. 5 Delaware Health and Social Services, Division of Public Health. (2011, April). Delaware Birth Defects
Surveillance Registry Program. Retrieved from Delaware Health and Social Services, Division of Public Health website: http://dhss.delaware.gov/dph/chca/dphbdr1.html. 6 Centers for Disease Control and Prevention. National Center for Health Statistics. VitalStats.
http://www.cdc.gov/nchs/vitalstats.htm. 7 Delaware Department of Health and Social Services, Division of Public Health. (2010, June). Perinatal
Periods of Risk Analysis. Retrieved from Department of Health and Social Services, Division of Public Health website: http://dhss.delaware.gov/dhss/dph/chca/files/perinatalrisk082010.pdf. 8 Delaware Department of Health and Social Services, Division of Public Health. (2010, September).
Delaware Pregnancy Risk Assessment Monitoring System (PRAMS) 2008 Analysis. Retrieved from Department of Health and Social Services, Division of Public Health website: http://dhss.delaware.gov/dhss/dph/chca/files/pram2008finaloct20.pdf. 9 Honein, M. et al. (2009). The association between major birth defects and preterm birth. Mat Child
Health J, 13(2): 164-75. 10
Swamy, G., Ostbye, T., Skjaerven, R. (2008). Association of preterm birth with long-term survival, reproduction, and next-generation preterm birth. JAMA, 299(12): 1429-36. 11
Grummer-Strawn, L., Reinold, C., Krebs, N. (2010). Use of World Health Organization and CDC growth charts for children aged 0-59 months in the United States. MMWR Recomm Rep, 59(RR-9): 1-15.
Related Documents