PNNL-22698 Prepared for the U.S. Department of Energy under Contract DE-AC05-76RL01830 Analysis of Daylighting Requirements within ASHRAE Standard 90.1 RA Athalye Y Xie B Liu MI Rosenberg August 2013

Welcome message from author
This document is posted to help you gain knowledge. Please leave a comment to let me know what you think about it! Share it to your friends and learn new things together.
Transcript

PNNL-22698
Prepared for the U.S. Department of Energy under Contract DE-AC05-76RL01830
Analysis of Daylighting Requirements within ASHRAE Standard 90.1 RA Athalye Y Xie B Liu MI Rosenberg August 2013

DISCLAIMER This documentation was prepared as an account of work sponsored by an agency of the United States Government. Neither the United States Government nor any agency thereof, nor Battelle Memorial Institute, nor any of their employees, makes any warranty, express or implied, or assumes any legal liability or responsibility for the accuracy, completeness, or usefulness of any information, apparatus, product, or process disclosed, or represents that its use would not infringe privately owned rights. Reference herein to any specific commercial product, process, or service by trade name, trademark, manufacturer, or otherwise does not necessarily constitute or imply its endorsement, recommendation, or favoring by the United States Government or any agency thereof, or Battelle Memorial Institute. The views and opinions of authors expressed herein do not necessarily state or reflect those of the United States Government or any agency thereof.
PACIFIC NORTHWEST NATIONAL LABORATORY
operated by BATTELLE
for the UNITED STATES DEPARTMENT OF ENERGY
under Contract DE-AC05-76RL01830
Printed in the United States of America
Available to DOE and DOE contractors from the Office of Scientific and Technical Information,
P.O. Box 62, Oak Ridge, TN 37831-0062; ph: (865) 576-8401, fax: (865) 576-5728
email: [email protected]
Available to the public from the National Technical Information Service, U.S. Department of Commerce, 5285 Port Royal Rd., Springfield, VA 22161
ph: (800) 553-6847, fax: (703) 605-6900 email: [email protected]
online ordering: http://www.ntis.gov/ordering.htm
This document was printed on recycled paper. (8/00)

PNNL-22698
Analysis of Daylighting Requirements within ASHRAE Standard 90.1
RA Athalye Y Xie B Liu MI Rosenberg
August 2013
Prepared for U.S. Department of Energy under Contract DE-AC05-76RL01830 Pacific Northwest National Laboratory Richland, Washington 99352

v
Executive Summary
Pacific Northwest National Laboratory (PNNL), under the Building Energy Codes Program (BECP) funded by U.S. Department of Energy (DOE), provides support to the ASHRAE/IES/IESNA Standard 90.1(Standard 90.1) Standing Standards Project Committee (SSPC 90.1) and its subcommittees. In an effort to provide the ASHRAE SSPC 90.1 with data that will improve the daylighting and fenestration requirements in the Standard, PNNL collaborated with Heschong Mahone Group (HMG), now part of TRC Energy Services. Combining EnergyPlus, a whole-building energy simulation software developed by DOE, with Radiance, a highly accurate illumination modeling software (Ward 1994), it was possible to analyze daylighting requirements within Standard 90.1 in greater detail.
The initial scope of the study was to evaluate the impact of the fraction of window area compared to exterior wall area (window-to-wall ratio (WWR)) on energy consumption when daylighting controls are implemented. This scope was expanded to study the impact of fenestration visible transmittance (VT), electric lighting controls and daylighted area on building energy consumption.
Methodology
Prototype Building. PNNL has developed and maintains a suite of 16 prototype building models that are used to assess potential impacts of improvements to Standard 90.1 and gauge the impact of new versions of the Standard on commercial buildings (Thornton et al. 2011). The Medium Office prototype model was used for this study because it is representative of a typical office building that is likely to include daylighting. The prototype building is divided into perimeter and core zones, with the perimeter zone having a depth of 15 feet, resulting in core zones that occupy 60% of the total building area. With a depth of 15 feet, the perimeter zone includes both primary and secondary sidelighted areas as defined by Standard 90.1.
The prototype model complies with the minimum requirements of ASHRAE Standard 90.1-2010 (Standard 90.1-2010), including the envelope, lighting and, heating, ventilating and air conditioning (HVAC) systems. Lighting power density (LPD), occupancy sensors and other lighting controls were implemented as per the requirements of Standard 90.1-2010. Parameters of the building not specified by Standard 90.1 (for example, temperature setpoints, hours of operation, number of occupants, etc.) were determined based on standard practice for that building type (Thornton et al. 2011).
Analytical Tools. Daylighting analysis was performed using Radiance, and the energy analysis was performed using DOE’s energy simulation program EnergyPlus. Radiance’s capability for accurately modeling complex fenestration systems is well documented (Mardaljevic 1995). Results from Radiance were used as inputs to EnergyPlus to determine the interaction of daylight illumination with building electric lighting and heating, ventilating, and air conditioning systems.
Templates were developed for typical open and enclosed perimeter office spaces to be used in the Radiance simulation. These template spaces simulated details, such as interior partitions and furniture, which are often ignored in energy models. The template spaces were used in all the Radiance simulations.

vi
Complex fenestration systems, such as those with blinds, require excessive computation time to simulate with Radiance. Therefore, the three-phase approach (Ward 2011) was used to shorten computation time within Radiance.
Output from Radiance is in the form of hourly illuminance values. Illuminance at selected sensors in the primary and secondary daylighted areas in each template space was reported to EnergyPlus. This was done for every building façade and is different for different floors as a result of the impact of exterior obstructions. The illumination output from Radiance was converted into schedules for electric lighting that were input into EnergyPlus to calculate the annual whole-building energy consumption.
Daylightable Area. A total of 12 medium office floor plans were reviewed (F. W. Dodge 2002) to determine the type of spaces and the fraction of perimeter area that can be typically daylighted. It was found that, on average, 80% of the perimeter could be daylighted. Spaces located on the perimeter that were determined not to be typically daylighted included restrooms, small storage rooms, copy rooms, etc, equaling 20% of the perimeter zone. The spaces that could be daylighted were comprised of enclosed spaces (60%) and open offices (40%). It was assumed that half the enclosed spaces with access to the perimeter were smaller than 250 ft2, and therefore did not require daylighting controls, as per Standard 90.1-2010. As a result, 56% of the perimeter zone area was assumed to be daylighted.
Blinds. Blinds were simulated in this study in both Radiance and EnergyPlus. Two types of blinds were simulated to represent the optimum and worst-case scenarios. Blinds were operated by lowering and raising them on the inside of the window. The control assumed an ‘active’ occupant who draws the blinds when glare is present and raises the blinds when the glare condition subsides.
Exterior Obstructions. Exterior obstructions can also have an impact on daylighting effectiveness (Carmody 2004). Using data from the Public Interest Energy Research (PIER) Office Daylighting Potential Report (Saxena 2011), the presence of trees was simulated in Radiance, whereas urban obstructions were simulated in both Radiance and EnergyPlus.
Climate Zones. Of the 16 ASHRAE climate zones present in North America (Briggs et al. 2003), 6 were chosen to study the impact of daylighting: 2A-Houston, 2B-Phoenix, 3C-San Francisco, 4A-Baltimore, 5A-Chicago, and 5C-Vancouver. These locations were selected to represent a variety of climate zones and International Green Construction Code (IgCC) sky-types.
WWR Analysis
The primary goal of the study was to investigate the impact of WWR on building energy consumption when daylighting controls are included. The WWR of the Medium Office prototype was varied by changing the sill-height of the windows, while leaving all other window parameters intact. Following this approach, the WWR was varied between 0%, i.e., a fully opaque envelope and 50%, with a 10% increment in WWR beginning at 20%. This resulted in five cases: 0%, 20%, 33%, 40%, and 50%. The default WWR for the Medium Office prototype is 33% and this WWR was used in lieu of 30%. The 0% WWR cases were used only for calculating the % change in energy use index (EUI) with WWR.
Two types of windows were created in each of the six climate zones: a minimally code-compliant window, and a window with high visible transmittance (VT) that also complies with Standard 90.1. The high VT window allowed more daylight into the space.
vii
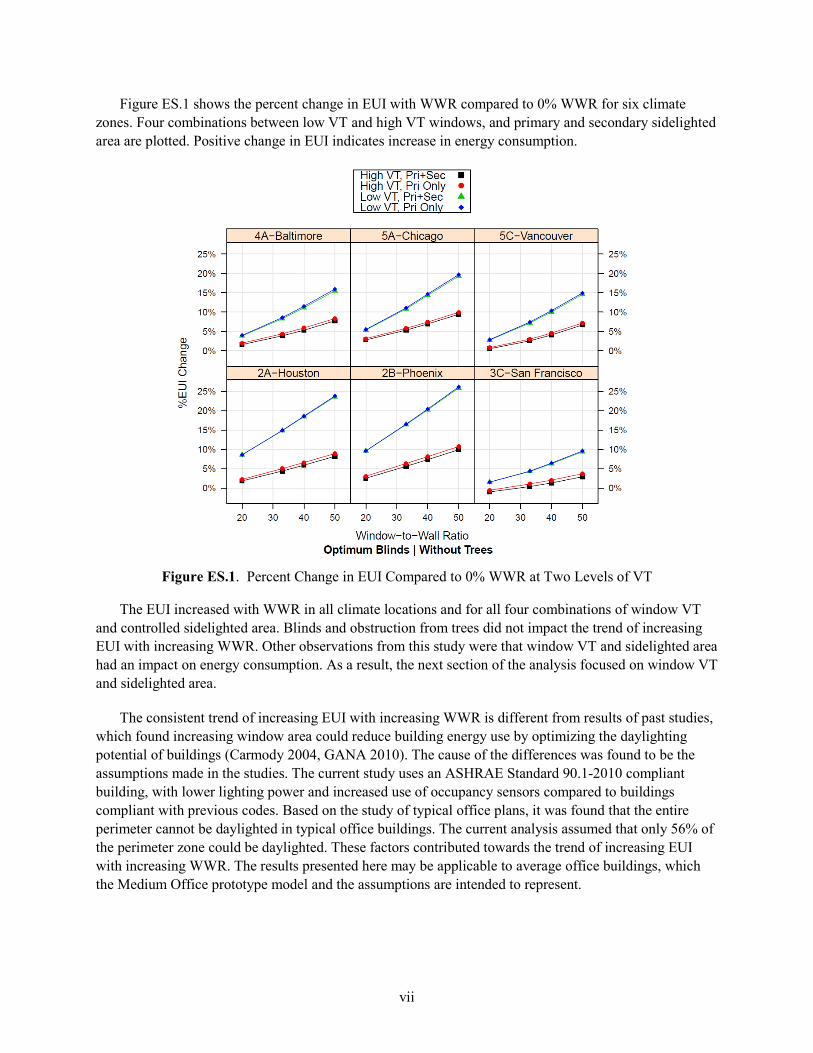
Figure ES.1 shows the percent change in EUI with WWR compared to 0% WWR for six climate zones. Four combinations between low VT and high VT windows, and primary and secondary sidelighted area are plotted. Positive change in EUI indicates increase in energy consumption.
Figure ES.1. Percent Change in EUI Compared to 0% WWR at Two Levels of VT
The EUI increased with WWR in all climate locations and for all four combinations of window VT and controlled sidelighted area. Blinds and obstruction from trees did not impact the trend of increasing EUI with increasing WWR. Other observations from this study were that window VT and sidelighted area had an impact on energy consumption. As a result, the next section of the analysis focused on window VT and sidelighted area.
The consistent trend of increasing EUI with increasing WWR is different from results of past studies, which found increasing window area could reduce building energy use by optimizing the daylighting potential of buildings (Carmody 2004, GANA 2010). The cause of the differences was found to be the assumptions made in the studies. The current study uses an ASHRAE Standard 90.1-2010 compliant building, with lower lighting power and increased use of occupancy sensors compared to buildings compliant with previous codes. Based on the study of typical office plans, it was found that the entire perimeter cannot be daylighted in typical office buildings. The current analysis assumed that only 56% of the perimeter zone could be daylighted. These factors contributed towards the trend of increasing EUI with increasing WWR. The results presented here may be applicable to average office buildings, which the Medium Office prototype model and the assumptions are intended to represent.
viii
Window Visible Transmittance Analysis
An important observation in WWR analysis was that fenestration VT had a significant impact on energy consumption. In this analysis, the window VT was varied from 0% to 90% in increments of 10%. Radiance was used to perform the daylighting analysis and to calculate the lighting schedule reduction fractions at different VTs. The WWR was varied between 20% and 50% WWR, as in the WWR analysis. Four control strategies were simulated:
1. Two-step control, which is the minimum requirement in Standard 90.1-2010. In this strategy, lights dim to two-thirds of full power and then to one-third of full power depending upon the amount of daylight available. If more daylight is available, the lights still remain at one-third of full power.
2. Two-step plus off-step control. Similar to (1), except lights turn off completely when there is enough daylight to maintain desired illumination levels with no electric lighting.
3. Continuous dimming control up to 10% of full power. Here, lights dim continuously up to 10% of full power, and do not dim below 10% of full power even if more daylight is available.
4. Continuous dimming plus off-step control. Similar to (3), except lights turn off completely when enough daylight is available to maintain desired illumination levels with no electric lighting.
Figure ES.2 shows the percent change in EUI with increasing VT compared to 0% VT. Four control strategies are plotted for six climate locations. Negative % EUI change indicates a decrease in energy consumption. From Figure ES.2, it can be seen that the building energy consumption continuously reduces with increasing VT when daylighting is included. This was found to be true in nearly all the cases analyzed in the VT study. Another important observation was that the strategies where lights were allowed to turn off consistently performed much better than strategies where lights remain on at reduced levels. Moreover, the stepped plus off strategy saved nearly the same amount of energy as the continuous dimming plus off strategy.
Capturing Daylighting Savings with EnergyPlus
Radiance was chosen to perform the daylighting calculations because of its ability to accurately predict interior illuminance levels (Mardaljevic 1995). However, the workflow when using Radiance as the daylighting engine and porting the results to EnergyPlus is tedious and time consuming compared to using EnergyPlus as the daylighting engine. Using the infrastructure already established during the course of this study, it was possible to compare the energy consumption of the Medium Office prototype model using EnergyPlus’ daylighting engine and the Radiance daylighting engine to determine if significant accuracy would be sacrificed by using only EnergyPlus.
In EnergyPlus, the split-flux method was used because the radiosity (Delight) method does not run on the Linux version of EnergyPlus (needed for parametric runs in PNNL’s simulation structure). The operation of blinds was kept the same between Radiance and EnergyPlus, and was based on Radiance output. Trees and furniture were only simulated in Radiance. The corresponding EnergyPlus cases showed the impact of not including trees or furniture. The WWR was fixed at 33%, high VT windows were used, and only the primary daylight zone was controlled using the two-step plus off strategy.

ix
Figure ES.2. Impact of Lighting Control Strategy at Different VTs
Table ES.1 shows the % EUI difference between EnergyPlus and Radiance for five unique cases.
Table ES.1. Percent EUI Difference between EnergyPlus and Radiance
% EUI Difference
Furniture Blinds Trees 2A-
Houston 2B-
Phoenix 3C-San
Francisco 4A-
Baltimore 5A-
Chicago 5C-
Vancouver No No No 0.23% 0.09% 0.09% -0.03% -0.10% 0.00% No No Yes -0.23% -0.09% -0.09% 0.02% 0.10% -0.01% No Yes No -0.23% -0.10% -0.16% 0.03% 0.15% -0.11% Yes No No -0.22% -0.08% -0.06% 0.04% 0.12% 0.03% Yes Yes Yes -0.23% -0.09% -0.14% 0.04% 0.16% -0.08% Max % EUI Difference 0.23% 0.10% 0.16% 0.04% 0.16% 0.11%
The maximum absolute % EUI difference was 0.23%. The lighting end use is directly affected by daylighting performance. The maximum percent EUI difference for the lighting end use only was 0.57%.

x
Conclusions
The main goal of this study was to explore the relationship of major variables related to daylighting and fenestration in the context of Standard 90.1. The major conclusions from the study can be summarized as follows:
1. Increasing the WWR of the Medium Office building in conjunction with daylighting controls resulted in an increase in energy consumption in all climate zones under all conditions.
2. Blinds had marginal impact on the trend of increasing energy consumption with increasing WWR.
3. Exterior obstructions in the form of trees had marginal impact on the energy consumption. Urban obstructions, on the other hand, had significant impact on the energy consumption.
4. Increasing the VT of the fenestration in the Medium Office building resulted in a decrease in energy consumption in all climate zones under almost all conditions.
5. Increasing the VT did not change the trend of increasing energy consumption with increasing WWR.
6. Higher VT reduced energy consumption in the presence of urban obstructions.
7. A stepped plus off control strategy saved nearly the same amount of energy as a continuous dimming plus off strategy. The off-step is crucial in maximizing energy savings from daylighting.
8. Controlling the secondary sidelighted area increased energy savings at all WWRs.
9. For the Medium Office prototype model, the difference between EnergyPlus and Radiance in capturing the daylighting savings was marginal.
10. For buildings with simple geometry and multiple zones with daylighting, where the daylighted area is likely to be saturated for a majority of the occupied hours and where the goal is to capture energy savings from daylighting, modeling with Radiance may only offer a modest increase in the accuracy of captured energy savings compared to the split-flux method in EnergyPlus.

xi
Acknowledgments
This report was prepared by Pacific Northwest National Laboratory (PNNL) for the U.S. Department of Energy (DOE) Building Energy Codes Program (BECP). The authors would like to thank DOE for their dedicated support and thoughtful guidance during the project.
The authors would also like to thank members of the ASHRAE Standing Standards Project Committee (SSPC) of 90.1 for their input and review.
This study was conducted in collaboration with the Heschong Mahone Group (now TRC Energy Services). The authors would like to recognize Mudit Saxena, Timothy Perry and Cathy Chappell from HMG for their contributions. The authors also recognize Dr. Jian Zhang of PNNL for his contribution.

xii
Acronyms and Abbreviations
ANSI American National Standards Institute ASHRAE American Society of Heating, Refrigerating and Air-Conditioning Engineers BECP Building Energy Codes Program DOE U.S. Department of Energy EUI energy use intensity fc foot-candles ft feet or foot ft2 square feet or square foot HVAC heating, ventilating, and air conditioning HMG Heschong Mahone Group IES Illuminating Engineering Society IESNA Illuminating Engineering Society of North America IgCC International Green Construction Code kBtu/ft2 kilo British thermal units per square foot LPD lighting power density NOAA National Oceanic and Atmospheric Administration PI progress indicator PIER Public Interest Energy Research PNNL Pacific Northwest National Laboratory PSA primary sidelighted area SHGC solar heat gain coefficient SSA secondary sidelighted area SSPC Standing Standard Project Committee U-factor thermal transmittance W watt WWR window-to-wall ratio VAV variable air volume VT fenestration visible transmittance

v
Table of Contents
1.0 Background ................................................................................................................................... 1 2.0 Methodology ................................................................................................................................. 2
2.1 Medium Office Prototype Building Description .................................................................. 2 2.2 Climate Zones ...................................................................................................................... 3 2.3 Daylightable Area Calculation ............................................................................................. 4 2.4 Template Spaces ................................................................................................................... 5 2.5 Blinds Modeling ................................................................................................................... 6 2.6 Exterior Obstructions ........................................................................................................... 7 2.7 Mapping Radiance Output to EnergyPlus ............................................................................ 8
3.0 Impact of Window-to-wall Ratio on Energy Consumption .......................................................... 11 3.1 Variables for the WWR Analysis ......................................................................................... 11 3.2 Results .................................................................................................................................. 12
3.2.1 Window VT ............................................................................................................... 13 3.2.2 Blinds ........................................................................................................................ 13 3.2.3 Exterior Obstructions ................................................................................................ 14 3.2.4 Sidelighted Area ........................................................................................................ 15
3.3 Discussion ............................................................................................................................ 16 4.0 Impact of Visible Transmittance on Energy Consumption .......................................................... 19
4.1 Variables for the VT Analysis .............................................................................................. 19 4.2 Results .................................................................................................................................. 20
4.2.1 Window VT ............................................................................................................... 21 4.2.2 Exterior Obstructions ................................................................................................ 22 4.2.3 Lighting Control Strategy .......................................................................................... 23 4.2.4 Sidelighted Area ........................................................................................................ 24
4.3 Discussion ............................................................................................................................ 25 5.0 Comparison of EnergyPlus and Radiance When Predicting Whole-Building Energy
Consumption ................................................................................................................................. 27 5.1 Changes to Methodology ..................................................................................................... 27 5.2 Illuminance Output Comparison .......................................................................................... 28 5.3 Energy Consumption Comparison ....................................................................................... 29 5.4 Discussion ............................................................................................................................ 30
6.0 Summary of Conclusions .............................................................................................................. 31 7.0 References .................................................................................................................................... 32
vi
Tables
2.1 Medium Office Prototype Building Properties ............................................................................. 3 2.2 Climate Zones Selected for this Study .......................................................................................... 4 2.3 Average Daylight Area Properties of 12 Medium Office Buildings............................................. 5 2.4 Interior Surfaces and their Reflectances ....................................................................................... 6 2.5 Blinds Properties ........................................................................................................................... 7 2.6 Perimeter Zone LPD Distribution Between Daylightable and non-Daylightable Spaces ............. 9 2.7 Sample Conversion of Illuminance Input to Lighting Power Schedule for Stepped Control ....... 9 3.1 Properties of Windows used in the WWR Analysis ..................................................................... 12 3.2 List of Variables for the WWR Analysis ...................................................................................... 12 3.3 Comparison of Assumptions in Previous and Present Studies ..................................................... 17 4.1 List of Variables for the VT Analysis ........................................................................................... 20 5.1 Radiance and EnergyPlus Cases for Comparison ......................................................................... 27 5.2 List of Variables for Radiance and EnergyPlus Comparison ....................................................... 28 5.3 Percent EUI Difference Between EnergyPlus and Radiance ........................................................ 29 5.4 Percent Lighting EUI Difference Between EnergyPlus and Radiance ......................................... 30 5.5 Average Annual Illuminance in Primary Daylight Zone of Top South Perimeter Zone During
Occupied Hours ............................................................................................................................ 30
Figures
2.1 Perspective and Plan View of the Medium Office Prototype Building ........................................ 2 2.2 Annual Mean Sunshine Percentage Across the United States (Source: National Oceanic and
Atmospheric Administration) and Selected Climate Locations for the Study .............................. 4 2.3 Radiance Template Spaces: (a) Enclosed Office, (b) Open Office ............................................... 6 2.4 Radiance Rendering of a Tree-Covered Office Space .................................................................. 7 3.1 Percent Change in EUI Compared to 0% WWR at Two Levels of VT ........................................ 13 3.2 Percent Change in EUI Compared to 0% WWR with Two Types of Blinds for Two Levels
of VT ............................................................................................................................................. 14 3.3 Percent Change in EUI Compared to 0% WWR with Two Types of Blinds, With and
Without Trees for Two Levels of VT ........................................................................................... 15 3.4 Percent Change in EUI Compared to 0% WWR for Primary Sidelighted Area Control and
Primary Plus Secondary Sidelighted Area Control ....................................................................... 16 3.5 Percent Change in EUI Compared to 0% WWR for Medium Office Building with New
Assumptions.................................................................................................................................. 17 4.1 Impact of VT on EUI at Different WWRs .................................................................................... 21 4.2 Impact of WWR and Urban Obstructions on VT ......................................................................... 22

vii
4.3 Impact of Urban Obstructions at Different VTs ........................................................................... 23 4.4 Impact of Daylight Control Strategy at Different VTs ................................................................. 24 4.5 Impact of Daylighted Area on VT ................................................................................................ 25 5.1 Hourly Illuminance Comparison Between Radiance and EnergyPlus .......................................... 28 5.2 Hourly Illuminance Comparison Between Radiance and EnergyPlus .......................................... 29

1
1.0 Background
ASHRAE/IES/IESNA Standard 90.1(Standard 90.1) includes requirements for maximum window-to-wall ratio (WWR), fenestration U-factor and solar heat gain coefficient (SHGC), and for controlling daylighted areas that meet certain criteria. Standard 90.1 is under continuous development, and there was a desire to update the daylighting requirements in the Standard. In particular, there was much debate regarding the WWR, which is capped at 40% in Standard 90.1-2010, and whether it could be reduced without sacrificing daylighting savings.
Pacific Northwest National Laboratory (PNNL) under the Building Energy Codes Program (BECP) funded by U.S. Department of Energy (DOE) has provided support to the Standard 90.1 Standing Standards Project Committee (SSPC 90.1) and the corresponding subcommittees in terms of modeling the requirements of Standard 90.1. PNNL has developed a suite of 16 Prototype Building models (Thornton et al. 2011) with extensive inputs from Standard 90.1 SSPC members and other building industry experts. The Prototype Building models cover 80% of the commercial building floor area in the United States for new construction, including both commercial buildings and mid- to high-rise buildings. These Prototype Building models are under continuous development, and they are used to represent the impact of Standard 90.1 on commercial buildings.
To provide the Standard 90.1 SSPC with data that will improve the daylighting and fenestration requirements, PNNL collaborated with Heschong Mahone Group (HMG), now a part of TRC Solutions, to perform the daylight modeling. In the prototype models, daylighting is modeled using the default EnergyPlus daylighting engine; however, there was concern regarding the accuracy of that engine. With HMG’s expertise in Radiance, a highly accurate illumination modeling software tool using ray-tracing methodology, it would be possible to include detailed parameters, such as blinds, exterior obstructions, and interior furniture, which may have an impact on daylighting but were previously not included in the modeling.
The EnergyPlus daylighting algorithm overestimates the internally reflected component of daylight (Winkelmann and Selkowitz1985). Radiance was chosen to perform the daylighting calculations because of its ability to accurately predict interior illuminance levels (Mardaljevic 1995). Complex fenestration systems, such as those with blinds, may require excessive computation time to simulate with Radiance. The three-phase approach (Ward 2011) was used to lower the computation time while simulating blinds. Radiance output was then imported to EnergyPlus and the annual whole-building energy consumption was calculated.
The detailed methodology used for the study is explained in Section 2.0. The study can be broadly classified into three separate analyses: the impact of WWR on energy consumption (Section 3.0); the impact of VT on energy consumption (Section 4.0); the comparison of EnergyPlus and Radiance in capturing the energy savings from daylighting (Section 5.0). The major results from the study are summarized in Section 6.0.
2
2.0 Methodology
This analysis was performed using Radiance (Ward 1994), combined with DOE’s energy simulation program EnergyPlus (DOE 2012). Radiance was used to perform the daylighting analysis, and the results were ported to EnergyPlus to perform whole-building energy analysis.
Key building elements, such as blinds, interior furniture and exterior obstructions, were taken into account while performing the analysis. Blinds were modeled in both Radiance and EnergyPlus, whereas exterior obstructions and interior furniture were modeled only in Radiance. The simulation was run for six climate zones that were selected based on solar resource, latitude, and climate type.
PNNL has developed and maintains a suite of 16 prototype building models that are used to assess potential impacts of improvements to Standard 90.1 and gauge the impact new versions of the Standard have on commercial buildings (Thornton et al. 2011). These models represent average buildings likely to be found in the field. The Medium Office prototype model was used to perform the analysis because it is representative of a typical office building that is likely to include daylighting. Typical medium office building plans were reviewed to determine the amount of area within the building perimeter zones that can be daylighted. The sections below describe individual elements of the methodology in greater detail.
2.1 Medium Office Prototype Building Description
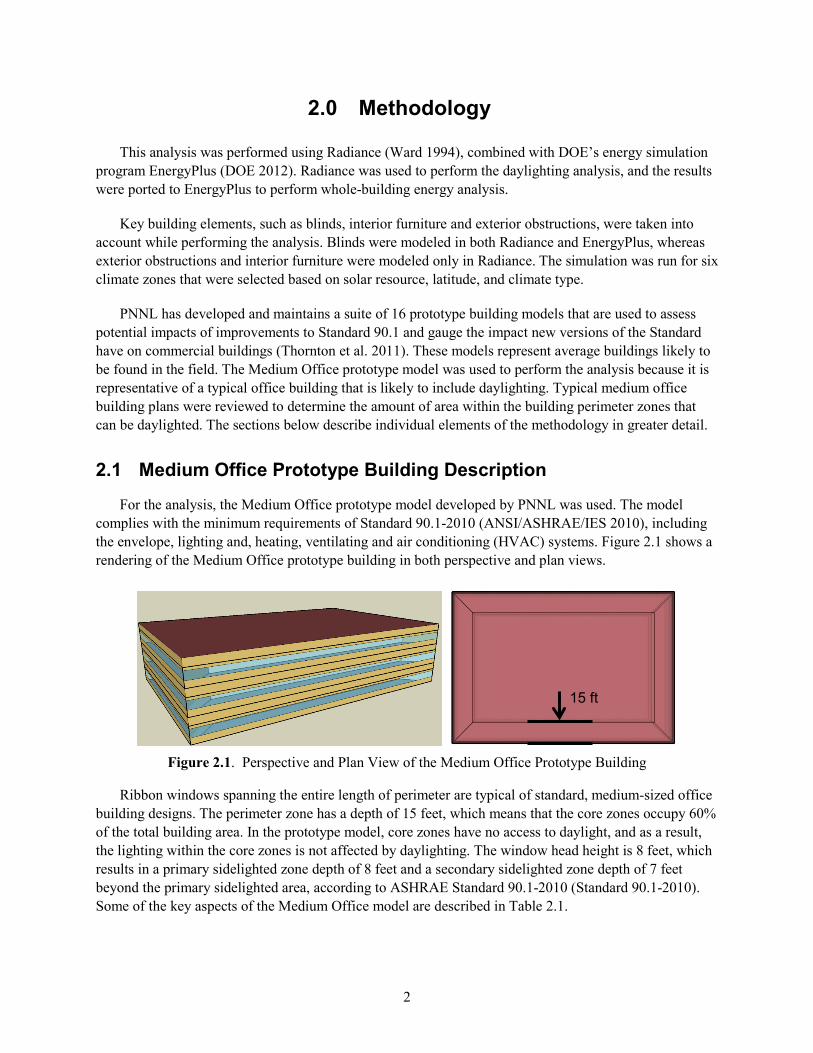
For the analysis, the Medium Office prototype model developed by PNNL was used. The model complies with the minimum requirements of Standard 90.1-2010 (ANSI/ASHRAE/IES 2010), including the envelope, lighting and, heating, ventilating and air conditioning (HVAC) systems. Figure 2.1 shows a rendering of the Medium Office prototype building in both perspective and plan views.
Figure 2.1. Perspective and Plan View of the Medium Office Prototype Building
Ribbon windows spanning the entire length of perimeter are typical of standard, medium-sized office building designs. The perimeter zone has a depth of 15 feet, which means that the core zones occupy 60% of the total building area. In the prototype model, core zones have no access to daylight, and as a result, the lighting within the core zones is not affected by daylighting. The window head height is 8 feet, which results in a primary sidelighted zone depth of 8 feet and a secondary sidelighted zone depth of 7 feet beyond the primary sidelighted area, according to ASHRAE Standard 90.1-2010 (Standard 90.1-2010). Some of the key aspects of the Medium Office model are described in Table 2.1.
15 ft

3
Table 2.1. Medium Office Prototype Building Properties
Property Description Area 53, 600 ft2 Dimensions 164 ft (along north-south axis) x 109 ft Perimeter Zone Depth 15 ft Perimeter Zone Area Fraction 40% of total building area Window Head height 8 ft Window-to-wall Ratio 33% Construction Assembly Types Steel-framed walls with cavity insulation
Built-up roof with insulation entirely above deck Slab-on-grade floor Lighting Power Density 1.0 W/ft2 Occupancy Sensors Yes, per Standard 90.1-2010 HVAC System Type One system per floor
Multi-zone variable air volume (VAV) with electric reheat
The lighting power density (LPD) was input at 1.0 W/ft2, as prescribed for an office building in Standard 90.1-2010. Occupancy sensors and other lighting controls were also implemented as per the requirements of Standard 90.1-2010. These controls were implemented through electric lighting schedule adjustments and resulted in lowering the contribution of daylighting savings because the electric lighting for a given hour could be de-energized by occupancy sensors and therefore there may be no savings from daylighting controls during that hour. These controls and all other details of the Medium Office prototype model have been documented by Thornton et al. (2011).
2.2 Climate Zones
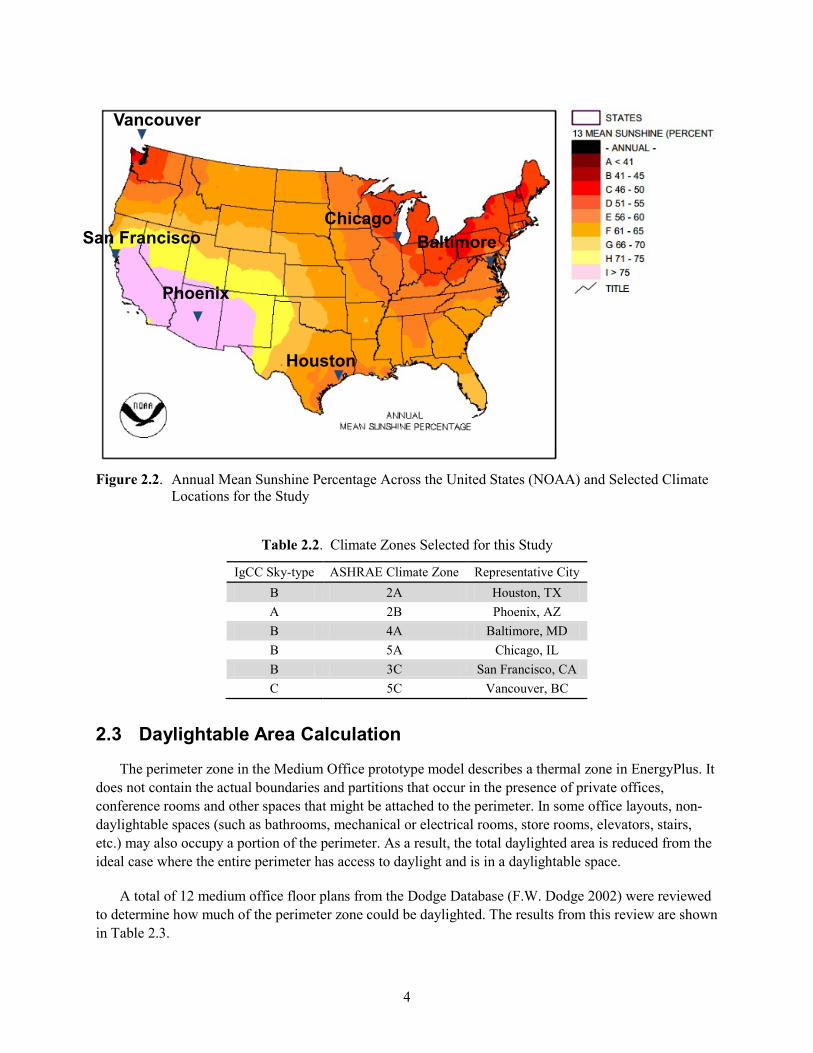
To understand the impact of daylighting on whole-building energy performance, it was important to choose locations that not only had a wide range of daylight potential, but also different climates. The International Green Construction Code (IgCC) classifies the contiguous United States into three major sky-types based on the annual mean sunshine percentage. Figure 2.2 shows the mean annual sunshine percentage. Sky-type A has a mean annual sunshine percentage greater than 75%, whereas for sky-type B, the mean annual sunshine percentage is between 45% and 75% and for sky-type C, it is less than 45%.
Figure 2.2 also shows the approximate locations of the cities selected as climate locations for the study. Apart from covering the three sky-types, the climate locations were chosen so they covered the range of latitudes in the U.S. and also a range of ASHRAE climate zones. Extreme climate zones (1, 6, 7 and 8) were not considered. When more than one city was available for a given latitude, sky-type and climate zone, the city with a higher construction weight (Jarnagin and Bandyopadhyay 2010) was chosen. Table 2.2 maps the six selected climate locations to the ASHRAE climate zones and IgCC sky-types.
4
Figure 2.2. Annual Mean Sunshine Percentage Across the United States (NOAA) and Selected Climate
Locations for the Study
Table 2.2. Climate Zones Selected for this Study
IgCC Sky-type ASHRAE Climate Zone Representative City B 2A Houston, TX A 2B Phoenix, AZ B 4A Baltimore, MD B 5A Chicago, IL B 3C San Francisco, CA C 5C Vancouver, BC
2.3 Daylightable Area Calculation
The perimeter zone in the Medium Office prototype model describes a thermal zone in EnergyPlus. It does not contain the actual boundaries and partitions that occur in the presence of private offices, conference rooms and other spaces that might be attached to the perimeter. In some office layouts, non-daylightable spaces (such as bathrooms, mechanical or electrical rooms, store rooms, elevators, stairs, etc.) may also occupy a portion of the perimeter. As a result, the total daylighted area is reduced from the ideal case where the entire perimeter has access to daylight and is in a daylightable space.
A total of 12 medium office floor plans from the Dodge Database (F.W. Dodge 2002) were reviewed to determine how much of the perimeter zone could be daylighted. The results from this review are shown in Table 2.3.
Vancouver
San Francisco
Phoenix
Chicago Baltimore
Houston

5
Table 2.3. Average Daylight Area Properties of 12 Medium Office Buildings
Description Average Fraction Maximum perimeter area that can be daylighted 80% Open office area in daylighted zone 40% Enclosed space area in daylighted zone 60% Enclosed spaces larger than 250 ft2 in daylighted zone* 50%
*Assumption
The study showed that in the 12 floor plans that were reviewed, only 80% of the perimeter could be daylighted. The rest of the perimeter was comprised of spaces that did not have fenestration, were too small (less than 250 ft2), or did not have enough lighting to justify daylighting controls (less than 0.6 Watts). The spaces that could be daylighted were open offices and enclosed spaces, comprising mainly private offices and conference rooms. Without data showing the area of individual enclosed spaces, it was assumed that 50% of the enclosed spaces were larger than 250 ft2. This is significant for the analysis because enclosed spaces smaller than 250 ft2 do not require daylighting controls in Standard 90.1-2010.
2.4 Template Spaces
One of the reasons for using Radiance was that it allowed the modeling of interior furniture in a space, exterior obstructions (such as buildings or trees), and window blinds. Realistic office space templates were created in Radiance and used incorporating blinds to correctly capture light levels within those spaces.
Template Spaces. Real office perimeter spaces can have furniture, partitions, and almost always have blinds or shades on the windows. These features are not captured in the perimeter zone as modeled in EnergyPlus. Based on data in Table 2.3, two space templates were created for simulating daylighting in Radiance: an open office and an enclosed office. These template spaces, representing real office spaces, were used in all the Radiance simulations. The template spaces were created in SketchUp (Google 2012) and are shown in Figure 2.3.
For the open office template, a partition height of 60 inches was selected, which represents a worst-case scenario in typical office buildings. In the private office template, the private offices were separated from the rest of the space with ceiling height opaque partitions at a depth of 12 ft. Surface reflectances for the ceiling, floor and walls are shown in Table 2.4 and are slightly lower than those recommended by the IES (DiLaura et. al. 2011).

6
(a) (b)
Figure 2.3. Radiance Template Spaces: (a) Enclosed Office, (b) Open Office
Table 2.4. Interior Surfaces and their Reflectances
Surface Reflectance Walls, Partitions 0.5 Floor 0.2 Ceiling 0.7 Furniture 0.5
2.5 Blinds Modeling
Blinds are typically found on commercial office building windows. They are located on the interior side of a window to provide occupants privacy, and control over glare. However, blinds are often omitted in daylighting studies. It is difficult to simulate blinds because of their complex geometry and also because it is difficult to predict occupant behavior in controlling the blinds.
Blinds are simulated in this study in both Radiance and EnergyPlus. In Radiance, blinds capture the daylighting impact, whereas in EnergyPlus they capture the impact on solar gain. Two cases were considered, one optimum case and one a worst case. This helped bound the range of the impact of blinds on daylighting effectiveness. The optimum blinds, or case 1, closed just enough to block direct sun on December 21st (lowest sun angle) from striking the lower 6 feet on the back wall of the private office template. For the worst case, blinds closed to 60°, which after considering the thickness of the slat, represents fully closed blinds. Table 2.5 provides details on the properties of the blinds used in the simulation.
Blinds are operated by lowering and raising them over the inside of the window. The control assumes an ‘active’ occupant that draws the blinds when glare is present and raises the blinds when the glare condition is relieved. The slat angle cannot be changed in Radiance, so it was fixed in EnergyPlus as well. Glare is assumed to be present when more than 2% of the sensors in the daylight zone are above 300 fc indicating direct solar radiation. The sensors are arranged in a grid of 2 ft x 2 ft.
7
Table 2.5. Blinds Properties
Property Case 1: Optimum Blinds
Case 2: Worst-Case Blinds
Slat Width (m) 0.025 0.025 Slat Separation (m) 0.02 0.02 Slat Thickness (m) 0.001 0.001 Slat Angle (deg) 42 30 Slat Conductivity (W/m-K) 0.9 0.9 Surface Visible Reflectance 0.709 0.127 Blind-to-Glass Distance (m) 0.05 0.05 Top Opening Multiplier 0.25 0.25 Bottom Opening Multiplier 0.25 0.25 Side Opening Multiplier 0.25 0.25
2.6 Exterior Obstructions
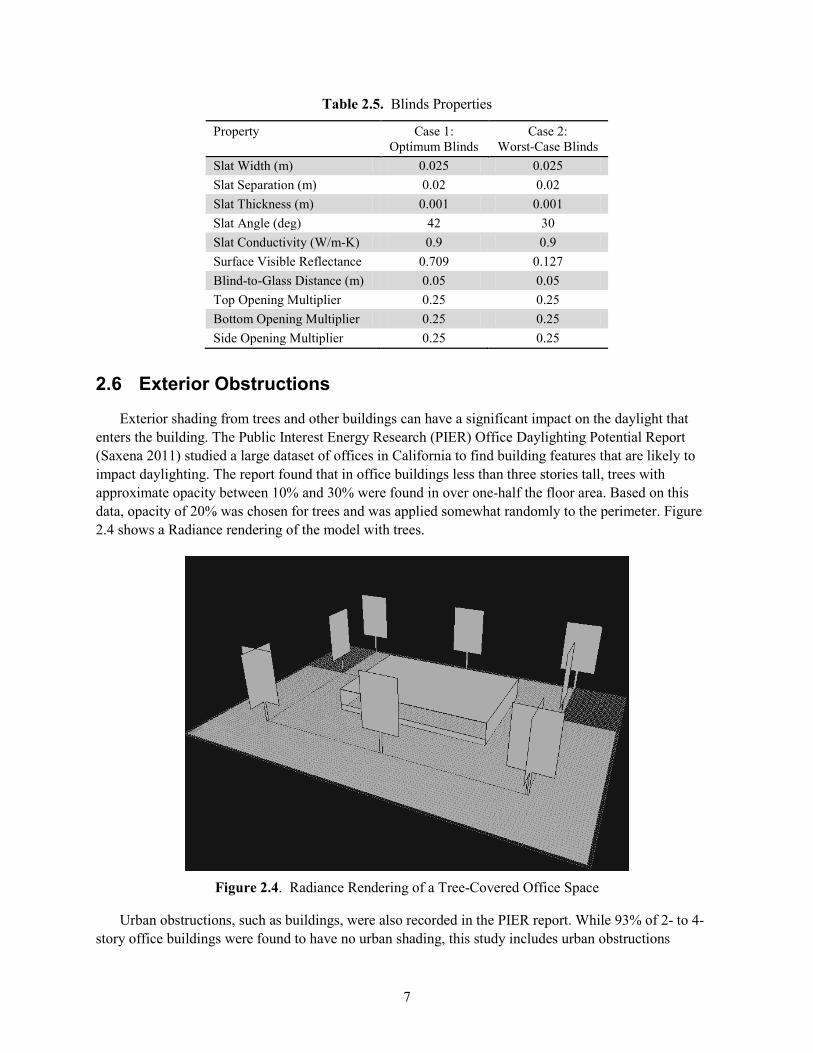
Exterior shading from trees and other buildings can have a significant impact on the daylight that enters the building. The Public Interest Energy Research (PIER) Office Daylighting Potential Report (Saxena 2011) studied a large dataset of offices in California to find building features that are likely to impact daylighting. The report found that in office buildings less than three stories tall, trees with approximate opacity between 10% and 30% were found in over one-half the floor area. Based on this data, opacity of 20% was chosen for trees and was applied somewhat randomly to the perimeter. Figure 2.4 shows a Radiance rendering of the model with trees.
Figure 2.4. Radiance Rendering of a Tree-Covered Office Space
Urban obstructions, such as buildings, were also recorded in the PIER report. While 93% of 2- to 4-story office buildings were found to have no urban shading, this study includes urban obstructions

8
because they can shade adjacent buildings for a large portion of daylight hours during the year. To model urban obstructions, a vertical opaque plane was created surrounding the building at a 45° profile angle from the top of the window of the second floor. The opaque plane is set 80 feet away from each perimeter zone wall, with 80 feet being typical façade to façade distances across an urban street (Carmody 2004).
Reduced solar gain caused by the presence of trees was not captured in EnergyPlus because of the impracticality of modeling trees in EnergyPlus. Urban obstructions, though, were modeled in both EnergyPlus and Radiance, and thus, their impact on daylighting and solar gain was captured.
2.7 Mapping Radiance Output to EnergyPlus
In each simulation, the illuminance output from Radiance for the two template spaces must be mapped to the perimeter zones in EnergyPlus. The perimeter zone (15 ft total depth) is divided into the primary sidelighted area (8 ft depth) with an area equal to 0.564 times the total perimeter zone area and the secondary sidelighted area (remaining 7 ft) with a fractional zone area of 0.436. The primary and secondary sidelighted areas are defined using the Standard 90.1-2010 definitions. For each perimeter zone, at every hour, there are three outputs from Radiance:
1. Open office illuminance in primary sidelighted area (PSA)
2. Enclosed office illuminance in PSA
3. Open office illuminance in secondary sidelighted area (SSA).
Enclosed spaces in the SSA will not receive any daylight and were ignored. In Radiance, a 2 ft x 2 ft grid of sensors at a height of 31 inches above the floor covering the entire floor was set up in the template spaces. A single sensor from each template space was used as the illuminance output from Radiance. This sensor was located at the center of the template space along the width, and its depth from the perimeter was equal to two-thirds of the depth of the primary or secondary sidelighted zone depth. The three illuminance outputs were converted to lighting schedules as described below, which were then applied to lighting in EnergyPlus.
Data from Table 2.3 was used to determine the lighting power that corresponded to the three sidelighted areas listed above. Four Lights objects1 were created in EnergyPlus for each perimeter zone in the Medium Office prototype. Three Lights objects correspond to the three sidelighted areas and the fourth object corresponds to the remaining lighting power that is not affected by daylighting.
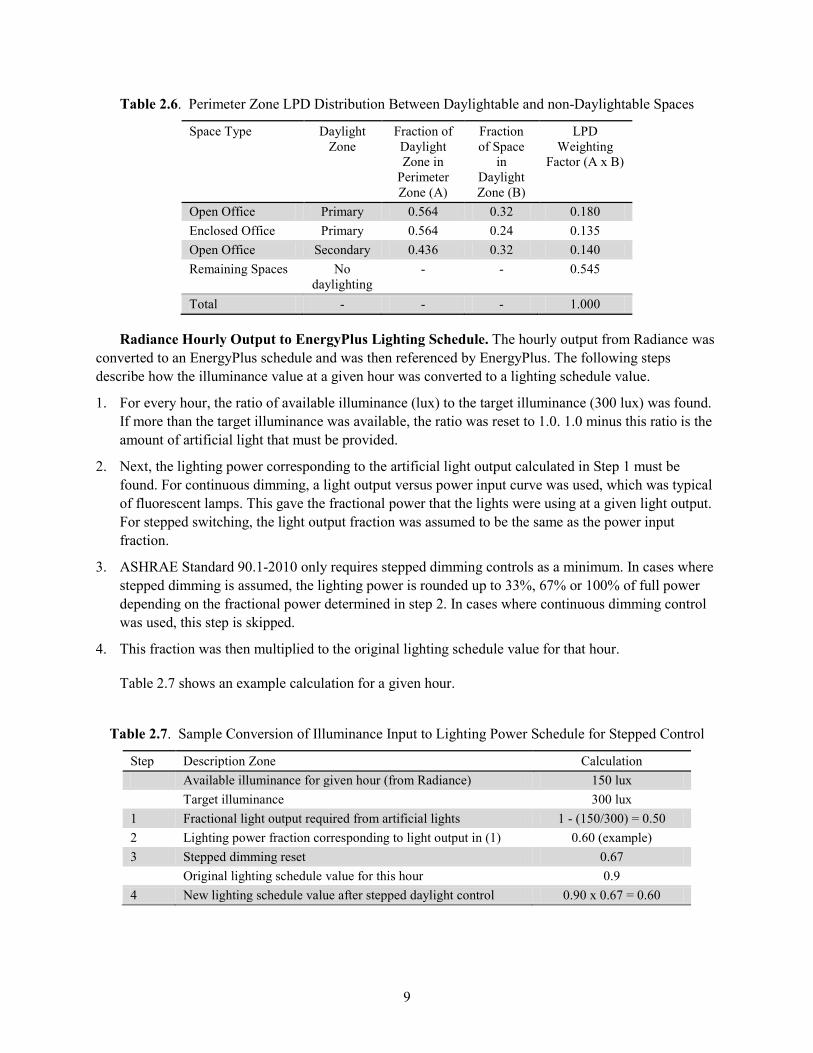
Table 2.6 shows the distribution of LPD between daylightable and non-daylightable areas for the four Lights objects. The first three rows account for the fraction of LPD that will be affected by daylighting. The remaining LPD fraction will not be affected by daylighting. In simulation cases complying with Standard 90.1-2010, the SSA was not required to be controlled and was not be considered; thus, for those cases the fraction of LPD that is not affected by daylighting was larger.
1 An object in EnergyPlus that defines all or part of electric lighting in a zone.
9
Table 2.6. Perimeter Zone LPD Distribution Between Daylightable and non-Daylightable Spaces
Space Type Daylight Zone
Fraction of Daylight Zone in
Perimeter Zone (A)
Fraction of Space
in Daylight Zone (B)
LPD Weighting
Factor (A x B)
Open Office Primary 0.564 0.32 0.180 Enclosed Office Primary 0.564 0.24 0.135 Open Office Secondary 0.436 0.32 0.140 Remaining Spaces No
daylighting - - 0.545
Total - - - 1.000
Radiance Hourly Output to EnergyPlus Lighting Schedule. The hourly output from Radiance was converted to an EnergyPlus schedule and was then referenced by EnergyPlus. The following steps describe how the illuminance value at a given hour was converted to a lighting schedule value.
1. For every hour, the ratio of available illuminance (lux) to the target illuminance (300 lux) was found. If more than the target illuminance was available, the ratio was reset to 1.0. 1.0 minus this ratio is the amount of artificial light that must be provided.
2. Next, the lighting power corresponding to the artificial light output calculated in Step 1 must be found. For continuous dimming, a light output versus power input curve was used, which was typical of fluorescent lamps. This gave the fractional power that the lights were using at a given light output. For stepped switching, the light output fraction was assumed to be the same as the power input fraction.
3. ASHRAE Standard 90.1-2010 only requires stepped dimming controls as a minimum. In cases where stepped dimming is assumed, the lighting power is rounded up to 33%, 67% or 100% of full power depending on the fractional power determined in step 2. In cases where continuous dimming control was used, this step is skipped.
4. This fraction was then multiplied to the original lighting schedule value for that hour.
Table 2.7 shows an example calculation for a given hour.
Table 2.7. Sample Conversion of Illuminance Input to Lighting Power Schedule for Stepped Control
Step Description Zone Calculation Available illuminance for given hour (from Radiance) 150 lux Target illuminance 300 lux 1 Fractional light output required from artificial lights 1 - (150/300) = 0.50 2 Lighting power fraction corresponding to light output in (1) 0.60 (example) 3 Stepped dimming reset 0.67 Original lighting schedule value for this hour 0.9 4 New lighting schedule value after stepped daylight control 0.90 x 0.67 = 0.60
10
The above calculation was performed for every hour, for every case, and for every perimeter zone (12 in total) of the Medium Office prototype. The schedules were assigned to the corresponding Lights objects.

11
3.0 Impact of Window-to-wall Ratio on Energy Consumption
One of the important goals of this study was to determine the impact of WWR on the energy consumption in buildings when daylighting controls were utilized. Past studies (Carmody 2004, GANA 2010) showed that lighting energy reduction through daylighting controls was able to offset the increase in energy caused by heating and cooling loads from a higher WWR. In this study, we wanted to determine whether the same results apply to a building that meets the minimum requirements of Standard 90.1-2010, and was simulated using an improved daylighting engine, including blinds, interior furniture and exterior obstructions.
3.1 Variables for the WWR Analysis
The following is a description of variables that result in unique cases in the analysis.
WWR. In this analysis, the WWR of the Medium Office prototype was varied by changing the sill-height of the windows. The WWR was varied between 0% WWR (i.e., a fully opaque envelope) and 50% WWR, with a 10% increment in WWR beginning at 20%. This resulted in five cases: 0%, 20%, 33%, 40%, and 50%. The default WWR for the Medium Office prototype is 33% and this WWR was used in lieu of 30%. The 0% WWR cases were used only for calculating the % change in energy use intensity (EUI), expressed as kBtu per ft2 of building area, at another WWR.
Climate Zones. The six selected climate zones are described in Section 2.2.
Template Spaces. The two template spaces – open office and enclosed office – were used in Radiance for the daylighting simulation (described in Section 2.4). For each EnergyPlus simulation, there were two Radiance simulations per perimeter zone, one each for the open and private office template.
Blinds. Two types of blinds were used; they are described in Section 2.5.
Exterior Obstructions. Trees, as described in Section 2.6, formed the exterior obstructions. For cases with trees, the bottom two floors were shaded by the trees, whereas the top floor was considered to not be shaded by trees. Urban obstructions were not studied in this analysis.
Facades. There were four facades in the Medium Office prototype, each facing a cardinal direction. In Radiance, this amounts to four different simulations, the outputs of which were mapped to the four perimeter zones (per floor) in a single EnergyPlus simulation.
Window Type. Windows were selected for two categories per climate zone; one category was the minimally compliant window, while the other was a high VT window. Table 3.1 shows the windows selected for the two categories by climate zone, including the SHGC, U-factor, VT, and the assembly layers. The minimally compliant window just met the Standard 90.1-2010 requirements. The high VT window had a high VT, and U-factor and SHGC as close as possible to the Standard 90.1-2010 U-factor and SHGC requirements.
12
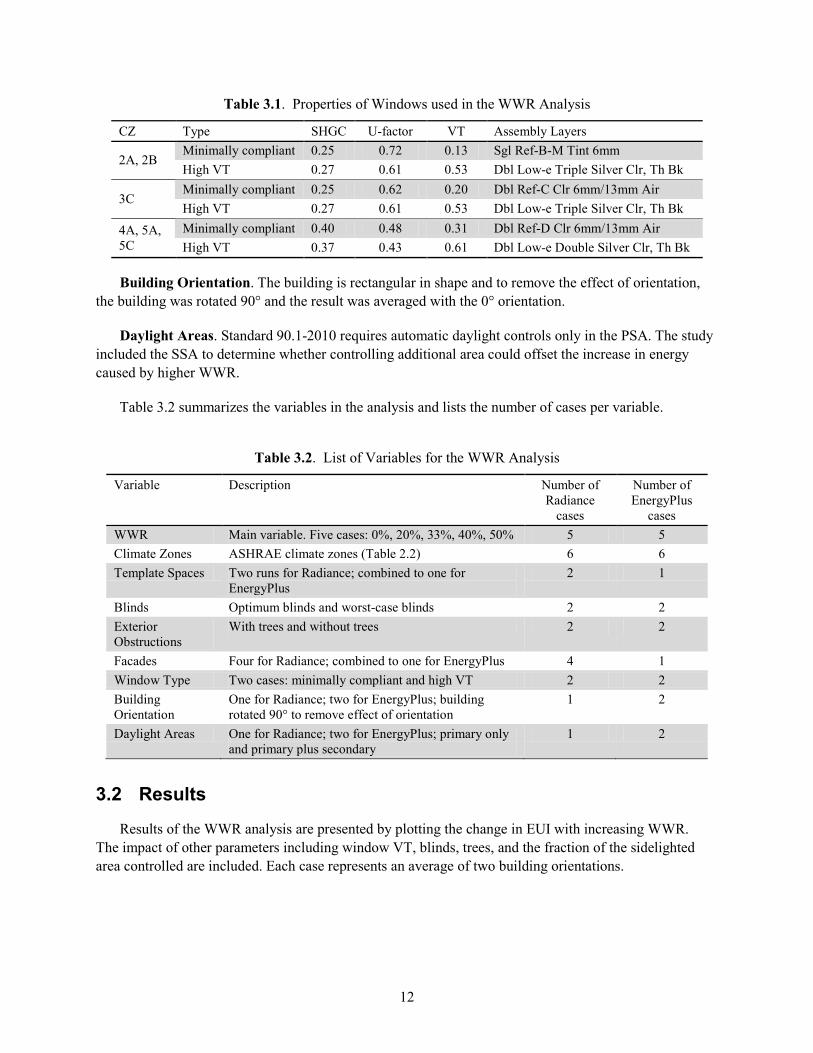
Table 3.1. Properties of Windows used in the WWR Analysis
CZ Type SHGC U-factor VT Assembly Layers
2A, 2B Minimally compliant 0.25 0.72 0.13 Sgl Ref-B-M Tint 6mm High VT 0.27 0.61 0.53 Dbl Low-e Triple Silver Clr, Th Bk
3C Minimally compliant 0.25 0.62 0.20 Dbl Ref-C Clr 6mm/13mm Air High VT 0.27 0.61 0.53 Dbl Low-e Triple Silver Clr, Th Bk
4A, 5A, 5C
Minimally compliant 0.40 0.48 0.31 Dbl Ref-D Clr 6mm/13mm Air High VT 0.37 0.43 0.61 Dbl Low-e Double Silver Clr, Th Bk
Building Orientation. The building is rectangular in shape and to remove the effect of orientation, the building was rotated 90° and the result was averaged with the 0° orientation.
Daylight Areas. Standard 90.1-2010 requires automatic daylight controls only in the PSA. The study included the SSA to determine whether controlling additional area could offset the increase in energy caused by higher WWR.
Table 3.2 summarizes the variables in the analysis and lists the number of cases per variable.
Table 3.2. List of Variables for the WWR Analysis
Variable Description Number of Radiance
cases
Number of EnergyPlus
cases WWR Main variable. Five cases: 0%, 20%, 33%, 40%, 50% 5 5 Climate Zones ASHRAE climate zones (Table 2.2) 6 6 Template Spaces Two runs for Radiance; combined to one for
EnergyPlus 2 1
Blinds Optimum blinds and worst-case blinds 2 2 Exterior Obstructions
With trees and without trees 2 2
Facades Four for Radiance; combined to one for EnergyPlus 4 1 Window Type Two cases: minimally compliant and high VT 2 2 Building Orientation
One for Radiance; two for EnergyPlus; building rotated 90° to remove effect of orientation
1 2
Daylight Areas One for Radiance; two for EnergyPlus; primary only and primary plus secondary
1 2
3.2 Results
Results of the WWR analysis are presented by plotting the change in EUI with increasing WWR. The impact of other parameters including window VT, blinds, trees, and the fraction of the sidelighted area controlled are included. Each case represents an average of two building orientations.

13
3.2.1 Window VT
Figure 3.1 shows the percent change in EUI compared to 0% WWR for two levels of VT in six climate zones. The graphed cases have optimum blinds, are without trees, and only the primary daylight zone is controlled. Positive change indicates increase in energy consumption.
Figure 3.1. Percent Change in EUI Compared to 0% WWR at Two Levels of VT
It is clear from the Figure 3.1 that energy consumption of the Medium Office building increased with an increase in WWR. The only exception to this trend was climate zone 3C, San Francisco, where the energy consumption at 20% WWR was slightly lower than at 0% WWR (i.e., no windows) in the high VT case. However, the trend of increasing EUI with increasing WWR still remains. Figure 3.1 also showed that cases with low VT windows consumed more energy than cases with high VT windows at all WWRs when daylighting controls are used.
3.2.2 Blinds
Figure 3.2 shows the impact of blinds on the energy consumption as the WWR is varied at two different levels of VT. Only the primary daylight zone is controlled. Compared to window VT, the two types of blinds used in the simulation resulted in marginal changes in energy consumption. The major difference in energy consumption came from the window VT.

14
Figure 3.2. Percent Change in EUI Compared to 0% WWR with Two Types of Blinds for Two Levels of
VT
3.2.3 Exterior Obstructions
Figure 3.3 shows the impact of trees together with blinds on the energy consumption of the Medium Office building. Only the primary daylight zone is controlled. Again, the lines on the graph group into categories differentiated by VT. The figure demonstrates that the impact of trees is very small.

15
Figure 3.3. Percent Change in EUI Compared to 0% WWR with Two Types of Blinds, With and
Without Trees for Two Levels of VT
3.2.4 Sidelighted Area
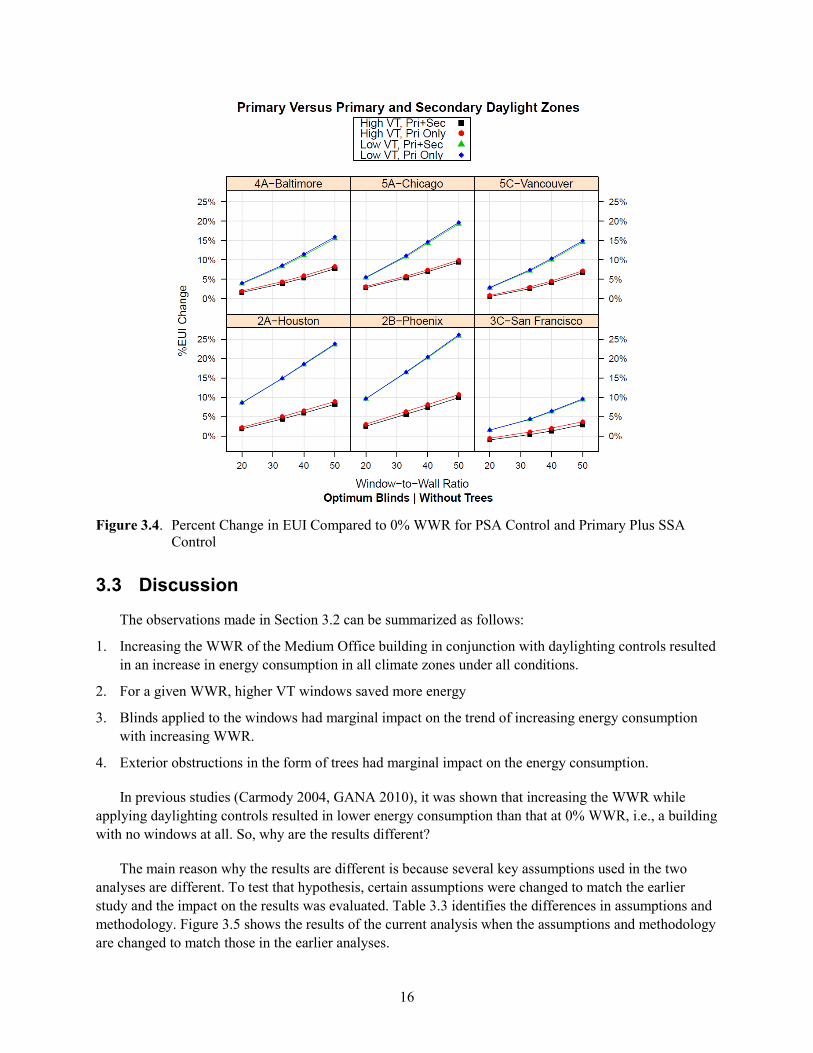
Figure 3.4 shows the impact of controlling both the primary and secondary daylight zones versus controlling only the primary daylight zone. Even when both daylight zones are controlled, the trend of increasing energy consumption with increasing WWR remains the same.
16
Figure 3.4. Percent Change in EUI Compared to 0% WWR for PSA Control and Primary Plus SSA
Control
3.3 Discussion
The observations made in Section 3.2 can be summarized as follows:
1. Increasing the WWR of the Medium Office building in conjunction with daylighting controls resulted in an increase in energy consumption in all climate zones under all conditions.
2. For a given WWR, higher VT windows saved more energy
3. Blinds applied to the windows had marginal impact on the trend of increasing energy consumption with increasing WWR.
4. Exterior obstructions in the form of trees had marginal impact on the energy consumption.
In previous studies (Carmody 2004, GANA 2010), it was shown that increasing the WWR while applying daylighting controls resulted in lower energy consumption than that at 0% WWR, i.e., a building with no windows at all. So, why are the results different?
The main reason why the results are different is because several key assumptions used in the two analyses are different. To test that hypothesis, certain assumptions were changed to match the earlier study and the impact on the results was evaluated. Table 3.3 identifies the differences in assumptions and methodology. Figure 3.5 shows the results of the current analysis when the assumptions and methodology are changed to match those in the earlier analyses.

17
Table 3.3. Comparison of Assumptions in Previous and Present Studies
Current Analysis Assumptions New Assumptions to Match Earlier
Studies Simulation Engine Radiance combined with EnergyPlus EnergyPlus Lighting Power Density 1.0 W/ft2 (based on 90.1-2010 code) 1.3 W/ft2 (based on 90.1-1999 code) Occupancy Sensor Control
Classrooms, lecture and training rooms, locker rooms, storage and supply rooms between 50 ft2 and 1000 ft2, office spaces up to 250 ft2, and restrooms
None
% Perimeter Zone Available for Daylighting Controls
56% [80% daylightable x (60% enclosed spaces x 50% larger than 250 ft2 + 40% open offices)]
100%
Daylight Obstructions Blinds and trees None Control Strategy Two-Step control (90.1-2010 minimum
requirement) Continuous dimming
Figure 3.5. Percent Change in EUI Compared to 0% WWR for Medium Office Building with New
Assumptions
Note the change in the scale of the y-axis of Figure 3.5 compared to the earlier figures. Up to 40% WWR, the building shows no increase in energy consumption for all climate zones compared to the 0% WWR case. Even though the trend of increasing energy consumption with increasing WWR remains the same, cases with 50% WWR still show energy savings in some climate zones compared to the 0% WWR case.

18
The results showed that a building complying with Standard 90.1-2010 had a number of measures that reduced the overall lighting energy use and thus the potential savings from daylighting controls. High WWRs produced increased lighting energy savings, but these savings could no longer offset the heat transfer through the windows.

19
4.0 Impact of Visible Transmittance on Energy Consumption
This section examines the change in energy consumption with a change in window VT. Other window variables, such as SHGC and U-factor remain fixed for each climate zone.
4.1 Variables for the VT Analysis
In this analysis, the window VT for minimally code-compliant windows was varied. The variables in the analysis are described below.
VT. The VT of windows was varied from 0% to 90% in increments of 10%. The 0% VT window is a hypothetical window that performs like a regular window with the given U and SHGC, but does not pass any visible light. Changes in VT impact the illuminance outputs from Radiance, which are converted to lighting schedules in EnergyPlus, as described in Section 2.7. Window VT is controlled in Radiance; in EnergyPlus, for a given climate zone, the U-factor and SHGC of the window remained constant for all WWRs and all VTs.
WWR. The WWR was varied between 20% and 50% WWR, as discussed in the WWR analysis. This resulted in four cases: 20%, 33%, 40%, and 50%. The default WWR for the Medium Office prototype is 33% and this WWR was used in lieu of 30%.
Climate Zones. The six selected climate zones are described in Section 2.2.
Template Spaces. The two template spaces – open office and enclosed office – were used in Radiance to simulate daylighting, as described in Section 2.4. For each EnergyPlus simulation, there were two Radiance simulations per perimeter zone.
Blinds. Two types of blinds were used; they are described in Section 2.5.
Exterior Obstructions. Urban obstructions, as described in Section 2.6, formed the exterior obstructions.
Facades. There were four facades to the Medium Office prototype, each facing a cardinal direction. In Radiance, this amounts to four different simulations, the outputs of which were mapped to the four perimeter zones in a single EnergyPlus simulation.
Window Type. Only windows minimally compliant with Standard 90.1-2010 were used for this analysis. Table 3.1 shows the properties of the minimally compliant windows.
Building Orientation. The building was rectangular in shape and to remove the effect of orientation, the building was rotated 90° and the result was averaged with the 0° orientation.
Daylight Areas. Two cases were simulated to capture the impact of controlling only the primary daylight zone and controlling both the primary and secondary daylight zone.
Photocontrol Strategy. Four control strategies were simulated:

20
a. Two-step control to 33% (minimum requirement in Standard 90.1-2010)
b. Two-step plus off-step control
c. Continuous dimming control up to 10% of full power
d. Continuous dimming plus off-step control.
In strategy (a), lights were dimmed to two-thirds of full power and then to one-third of full power depending upon the amount of daylight available. If more daylight was available, the lights remained at one-third of full of power. In strategy (b), the lights were allowed to turn all the way off, when there was enough daylight to meet the illuminance target using daylight alone.
For continuous dimming control strategy (c), lights were dimmed continuously down to 10% of full power, and stopped at 10% of full power even if more daylight was available. In strategy (d), lights were dimmed continuously down to 10% of full power and then, if there was enough daylight to meet the illuminance target using daylight alone, the lights were turned off completely.
Table 4.1 summarizes the variables in the analysis and lists the number of cases per variable.
Table 4.1. List of Variables for the VT Analysis
Variable Description Number of Radiance
cases
Number of EnergyPlus
cases VT Main variable. 0% to 90% in 10% increments 10 10 WWR Four cases: 20%, 33%, 40%, 50% 4 4 Climate Zones Six ASHRAE climate zones (Table 2.2) 6 6 Template Spaces Two runs for Radiance; combined to one for
EnergyPlus 2 1
Blinds Optimum blinds and worst-case blinds 2 2 Exterior Obstructions
With and without urban obstructions 2 2
Facades Four for Radiance; combined to one for EnergyPlus 4 1 Window Type Minimally compliant windows only 1 1 Building Orientation
One for Radiance; two for EnergyPlus: building rotated 90° to remove effect of orientation
1 2
Daylight Areas One for Radiance; two for EnergyPlus: primary only and primary plus secondary
1 2
Photocontrols Four control strategies: two-step, two-step plus off, dimming, dimming plus off
1 4
4.2 Results
To determine the impact of VT on various parameters, the change in whole-building EUI with VT compared to 0% VT was plotted against VT. Each case represents an average of two building orientations. As seen in Section 3.2.2, the type of blinds had little impact on the building EUI. Therefore, in the results presented below, the cases with worst-case blinds were omitted.
21
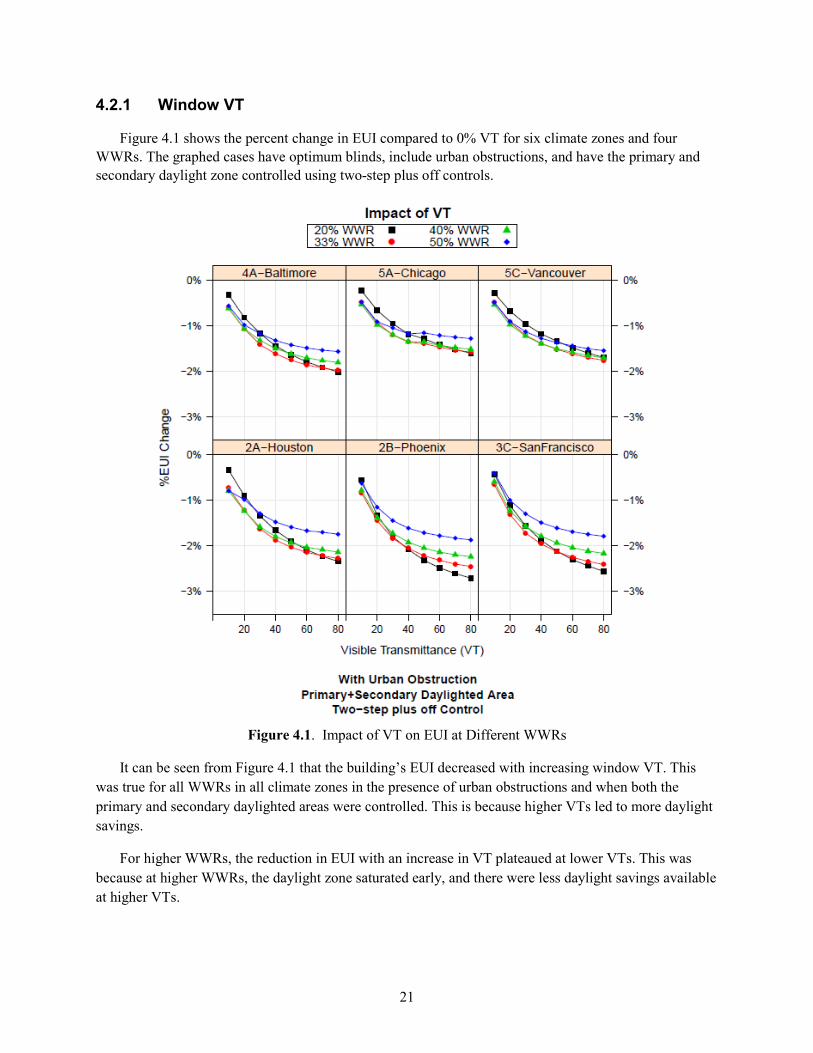
4.2.1 Window VT
Figure 4.1 shows the percent change in EUI compared to 0% VT for six climate zones and four WWRs. The graphed cases have optimum blinds, include urban obstructions, and have the primary and secondary daylight zone controlled using two-step plus off controls.
Figure 4.1. Impact of VT on EUI at Different WWRs
It can be seen from Figure 4.1 that the building’s EUI decreased with increasing window VT. This was true for all WWRs in all climate zones in the presence of urban obstructions and when both the primary and secondary daylighted areas were controlled. This is because higher VTs led to more daylight savings.
For higher WWRs, the reduction in EUI with an increase in VT plateaued at lower VTs. This was because at higher WWRs, the daylight zone saturated early, and there were less daylight savings available at higher VTs.

22
Figure 4.2 is similar to Figure 4.1 except it does not have urban obstructions. The flattening of the curves occurred sooner without obstructions than with obstructions. In all the climate zones, a combination of low WWR and high VT produced the lowest energy consumption. With obstructions (Figure 4.1), the daylight zone saturated slowly, and energy consumption continued to decrease even at very high VTs.
Figure 4.2. Impact of WWR and Urban Obstructions on VT
4.2.2 Exterior Obstructions
Figure 4.3 shows the percent change in EUI compared to 0% VT with and without urban obstructions at 20% and 33% WWR. The graphed cases have optimum blinds with the primary and secondary daylight zone controlled using two-step plus off controls.
The cases without urban obstructions saved more energy compared to cases with urban obstructions. This was expected because urban obstructions cause a reduction in available daylight, lowering the lighting energy savings.

23
At higher WWRs, the daylight zone was saturated at lower VTs. High WWRs coupled with no obstructions resulted in a flattening of curve at lower VTs, as can be seen in Figure 4.3 for the 33% WWR and no obstructions case.
Figure 4.3. Impact of Urban Obstructions at Different VTs
4.2.3 Lighting Control Strategy
Figure 4.4 shows the percent change in EUI compared to 0% VT for different lighting control strategies. The graphed cases have optimum blinds, 33% WWR, urban obstructions, and have the primary and secondary daylight zone controlled.

24
Figure 4.4. Impact of Daylight Control Strategy at Different VTs
In all climate zones, the dimming plus off strategy had the lowest energy consumption. However, the two-step plus off strategy saved nearly the same amount of energy as the dimming plus off strategy. This is because the daylight zones were saturated or close to saturated for most of the daylight hours. The finer control offered by continuous dimming has little value when the daylight zone is saturated for a large percentage of the time the space is occupied. It can be seen that the off-step resulted in much higher savings for both the stepped and continuous dimming strategies.
4.2.4 Sidelighted Area
Figure 4.5 shows the percent change in EUI compared to 0% VT when the primary daylighted area is controlled compared to when both the primary and secondary daylighted areas are controlled. The graphed cases have optimum blinds, 33% WWR, no urban obstructions, and have the daylight zones controlled using two-step plus off controls.

25
Figure 4.5. Impact of Daylighted Area on VT
With only the PSA controlled, the curve plateaued at fairly low VTs. The cases shown in Figure 4.5 have no urban obstructions, which resulted in saturating the PSA at low VT. When the SSA was controlled simultaneously with, but independently of, the PSA, the energy reduction was higher. At the same time, more savings could be achieved at higher VTs because the secondary daylight zone did not saturate at low VTs. The reduction in energy savings seen in some cases where only the PSA is controlled can be attributed to the operation of blinds. In cases without blinds (not shown), there is a monotonic decrease in energy consumption with increasing VT.
4.3 Discussion
The observations made in Section 4.2 can be summarized as follows:
1. Increasing the VT of the fenestration in the Medium Office building in conjunction with daylighting controls resulted in a decrease in energy consumption in all climate zones under all but a very few conditions.
2. Lower WWRs had lower consumption at all VTs.

26
3. Urban obstructions had significant impact on energy consumption. Energy consumption was increased in the presence of urban obstructions. Higher VT helped reduce energy consumption in the presence of urban obstructions.
4. A two-step plus off daylighting control strategy saved nearly the same amount of energy as a continuous dimming plus off strategy. The off-step was crucial in maximizing energy savings.
5. Controlling the SSA increased energy savings.
6. In all the climate zones, a combination of low WWR and high VT produced the lowest energy consumption.

27
5.0 Comparison of EnergyPlus and Radiance When Predicting Whole-Building Energy Consumption
As discussed previously, the EnergyPlus daylighting algorithm has been shown to overestimate the internally reflected component of daylight (Winkelmann and Selkowitz 1985). Radiance was chosen to perform the daylighting calculations because of its ability to accurately predict interior illuminance levels (Mardaljevic 1995). However, the work flow when using Radiance as the daylighting engine is tedious and time consuming. This study investigated whether EnergyPlus can accurately capture the energy consumption of the Medium Office prototype model in comparison to Radiance (when Radiance is used as the daylighting engine).
5.1 Changes to Methodology
To create comparable cases with EnergyPlus as the daylighting engine and Radiance as the daylighting engine, the following changes were made to the methodology explained in Section 2.0:
1. EnergyPlus daylighting engine: In EnergyPlus, the split-flux method, not the radiosity (Delight) method was used because the radiosity method does not run on the Linux version of EnergyPlus (needed for PNNL simulation setup).
2. Radiance output: The illuminance output from Radiance was not used because EnergyPlus’ internal daylighting engine was used. However, in cases where blinds were present, the blind schedule from Radiance was used as the schedule for blinds in EnergyPlus. In other words, EnergyPlus’ native schemes for controlling blinds were not used.
3. Trees and furniture: Trees and furniture were only simulated in Radiance. The corresponding EnergyPlus cases would show the impact of not including trees or furniture.
4. Sensor location: To allow comparison, output from only two sensors that corresponded to the split-flux locations was taken from Radiance. The sensors were located at the edge of the primary and secondary daylight zone (away from the perimeter), and at the midpoint of the zone.
Based on the changes listed above, Table 5.1 lists the unique cases in Radiance and EnergyPlus that were used for the comparison.
Table 5.1. Radiance and EnergyPlus Cases for Comparison Radiance
Unique Case EnergyPlus
Unique Case Furniture Blinds Exterior
Obstructions 1 1 No No No 2 1 Yes No No 3 2 No Yes No 4 1 No No Yes 5 3 Yes Yes Yes
28
Table 5.2 shows the list of variables for the comparison between Radiance and EnergyPlus. For this comparison, the WWR was fixed at 33%, only high VT windows were used, only the primary daylight zone was controlled, and it was controlled using the two-step plus off strategy.
Table 5.2. List of Variables for Radiance and EnergyPlus Comparison
Variable Description Number of Radiance
cases
Number of EnergyPlus
cases Climate Zones Six ASHRAE climate cones (Table 2.2) 6 6 Blinds Optimum blinds and no blinds 2 2 Exterior Obstructions
With and without trees 2 2
Furniture With and without furniture 2 2 Window Type High VT windows only 1 1 Daylight Areas Primary only 1 1 WWR 33% 1 1 Photocontrols Two-step plus off only 1 1
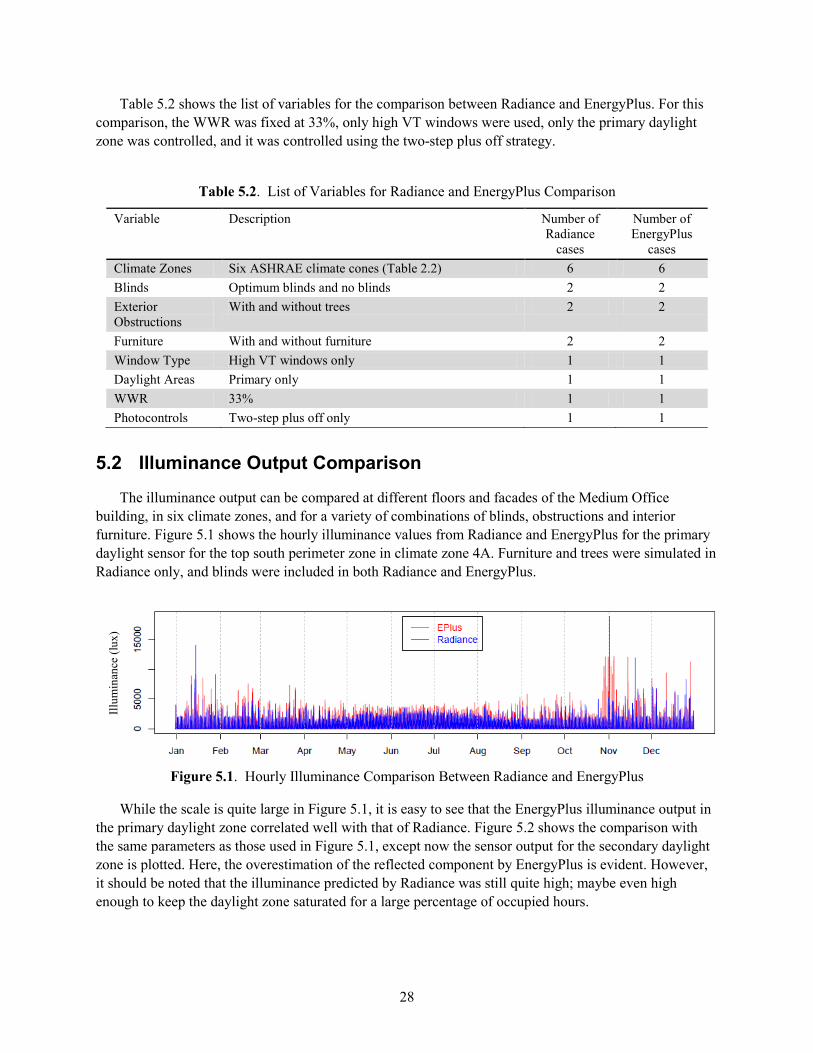
5.2 Illuminance Output Comparison
The illuminance output can be compared at different floors and facades of the Medium Office building, in six climate zones, and for a variety of combinations of blinds, obstructions and interior furniture. Figure 5.1 shows the hourly illuminance values from Radiance and EnergyPlus for the primary daylight sensor for the top south perimeter zone in climate zone 4A. Furniture and trees were simulated in Radiance only, and blinds were included in both Radiance and EnergyPlus.
Figure 5.1. Hourly Illuminance Comparison Between Radiance and EnergyPlus
While the scale is quite large in Figure 5.1, it is easy to see that the EnergyPlus illuminance output in the primary daylight zone correlated well with that of Radiance. Figure 5.2 shows the comparison with the same parameters as those used in Figure 5.1, except now the sensor output for the secondary daylight zone is plotted. Here, the overestimation of the reflected component by EnergyPlus is evident. However, it should be noted that the illuminance predicted by Radiance was still quite high; maybe even high enough to keep the daylight zone saturated for a large percentage of occupied hours.
Illum
inan
ce (l
ux)

29
Figure 5.2. Hourly Illuminance Comparison Between Radiance and EnergyPlus
While it is interesting to compare the illuminance output, the purpose of this analysis was to compare how well the energy impact is captured.
5.3 Energy Consumption Comparison
Table 5.3 shows the % EUI difference between EnergyPlus and Radiance for the five cases listed in Table 5.1. Only the primary daylight zone was controlled in all the cases. The maximum absolute % EUI difference was 0.23%. Positive percent difference indicated lower EUI for EnergyPlus.
Table 5.3. Percent EUI Difference Between EnergyPlus and Radiance
% EUI Difference
Furniture Blinds Trees 2A-
Houston 2B-
Phoenix 3C-San
Francisco 4A-
Baltimore 5A-
Chicago 5C-
Vancouver No No No 0.23% 0.09% 0.09% -0.03% -0.10% 0.00% No No Yes -0.23% -0.09% -0.09% 0.02% 0.10% -0.01% No Yes No -0.23% -0.10% -0.16% 0.03% 0.15% -0.11% Yes No No -0.22% -0.08% -0.06% 0.04% 0.12% 0.03% Yes Yes Yes -0.23% -0.09% -0.14% 0.04% 0.16% -0.08% Max % EUI Difference 0.23% 0.10% 0.16% 0.04% 0.16% 0.11%
In each of the five cases, the maximum difference occurred in climate zone 2A, Houston. In other climate zones, the difference was much smaller.
Table 5.4 shows the same comparison as Table 5.3 except only for the interior lighting end use, which is directly affected by daylighting. Positive percent difference indicates lower lighting EUI for EnergyPlus. The maximum percent EUI difference was 0.57% of the lighting end use and occurred in Vancouver.
Illum
inan
ce (l
ux)

30
Table 5.4. Percent Lighting EUI Difference Between EnergyPlus and Radiance
% EUI Difference
Furniture Blinds Trees 2A-
Houston 2B-
Phoenix 3C-San
Francisco 4A-
Baltimore 5A-
Chicago 5C-
Vancouver No No No 0.25% 0.27% 0.22% 0.31% 0.36% 0.49% No No Yes 0.27% 0.28% 0.24% 0.34% 0.39% 0.57% No Yes No 0.19% 0.19% 0.14% 0.27% 0.34% 0.48% Yes No No 0.18% 0.20% 0.11% 0.18% 0.23% 0.18% Yes Yes Yes 0.13% 0.13% 0.05% 0.17% 0.23% 0.21% Max % EUI Difference 0.27% 0.28% 0.24% 0.34% 0.39% 0.57%
5.4 Discussion
The change in whole-building EUI and lighting end use EUI was less than 0.25% and 0.60% respectively. The main reason for such a small impact was that the primary daylight zone was almost always saturated with daylight during occupied hours. Table 5.5 shows the average annual illuminance in the top south perimeter zone during occupied hours for both Radiance and EnergyPlus.
Table 5.5. Average Annual Illuminance in Primary Daylight Zone of Top South Perimeter Zone During Occupied Hours
Illuminance (lux)
4A-Baltimore
5A-Chicago
2A- Houston
2B-Phoenix
3C-San_Francisco
5C-Vancouver
Radiance 575 549 639 612 539 465 EnergyPlus 753 770 720 625 565 626
It can be seen that the primary daylight zone in the Medium Office prototype, which is the only one required to be controlled according to Standard 90.1-2010, had enough daylight to turn the lights off for a large percentage of the occupied hours. As a result, the overestimation of daylight by the split-flux model did not have a significant impact on the reduction in lighting; except for shoulder hours, lights in the primary daylight zones were turned off for a majority of occupied hours.
This result was based on the assumptions of the study and relate to the Medium Office building. The simple geometry and the requirements of Standard 90.1 have a significant impact on the result. However, for buildings with simple geometry and multiple zones with daylighting, where the daylight zones are mostly saturated during occupied hours, and where the goal is to capture energy savings from daylighting, this study showed that the effort to go to Radiance may only offer a modest increase in the accuracy.

31
6.0 Summary of Conclusions
The main goal of this study was to explore the relationship of major variables related to daylighting and fenestration in the context of Standard 90.1. The major conclusions from the study can be summarized as follows:
1. Increasing the WWR of the Medium Office building in conjunction with daylighting controls resulted in an increase in energy consumption in all climate zones under all conditions.
2. Blinds applied to the windows had marginal impact on the trend of increasing energy consumption with an increase in WWR.
3. Exterior obstructions in the form of trees had marginal impact on the energy consumption. In contrast, urban obstructions had significant impact on the energy consumption.
4. Increasing the VT of the fenestration in the Medium Office building resulted in a decrease in energy consumption in all climate zones under almost all conditions.
5. Increasing the VT does not change the trend of increasing energy consumption with increasing WWR.
6. Higher VT helped reduce energy consumption in the presence of urban obstructions.
7. A two-step plus off control strategy saved nearly the same amount of energy as a continuous dimming plus off strategy. The off-step was crucial in maximizing energy savings from daylighting.
8. Controlling the SSA increased energy savings at all WWRs.
9. For buildings with simple geometry and multiple zones with daylighting, where the daylighted area is likely to be saturated for a majority of the occupied hours and where the goal is to capture energy savings from daylighting, modeling with Radiance may only offer a modest increase in the accuracy of captured energy savings compared to the split-flux method in EnergyPlus.
With the proliferation of high performance windows that can deliver high visible light to solar heat gain ratios, it is easy to envision a scenario where the fenestration is optimized for occupant comfort and energy performance:
1. WWR is optimized for view.
2. VT is chosen such that the daylight zone is near saturation for a large portion of the occupied hours.
3. Glare is controlled by blinds.
32
7.0 References
ANSI/ASHRAE/IES. 2010. ANSI/ASHRAE/IES 90.1-2010, Energy Standard for Buildings Except Low-Rise Residential Buildings. American Society of Heating, Refrigerating and Air-Conditioning Engineers, Atlanta, Georgia.
Briggs, R.L., R.G. Lucas, and Z.T. Taylor. 2003. “Climate Classification for Building Energy Codes and Standards: Part 1—Development Process.” ASHRAE Transactions, (1):4610-4611.
Carmody, J. 2004. Windows Systems for High Performance Buildings. W. W. Norton & Company Incorporated. New York, NY.
DiLaura, D. L., K. W., Houser, R. G., Mistrick, and G. R. Steffy. 2011. The Lighting Handbook. Illuminating Engineering Society.
DOE. 2012. Energy Plus Energy Simulation Software. U.S. Department of Energy, Washington, D.C. Last accessed in July 2012 at http://apps1.eere.energy.gov/buildings/EnergyPlus/
F.W. DODGE. 2002. Dodge Plans Via The Internet. Last Accessed in December 2011 at http://dodge.construction.com/Plans/Electronic/ViaInternet.asp
Glass Association of North America (GANA). 2010. Window-to-Wall Ratio and Energy Performance. Presentation to ASHRAE Standard 90.1 Envelope Subcommittee. ASHRAE Winter Meeting. ASHRAE, Orlando, FL.
Google. 2012. SketchUp Software. Last accessed in July 2012 at http://www.sketchup.com/
Jarnagin, R.E., and G.K. Bandyopadhyay. 2010. Weighting Factors for the Commercial Building Prototypes Used in the Development of ANSI/ASHRAE/IESNA 90.1-2010. PNNL-19116, Pacific Northwest National Laboratory, Richland, Washington.
Mardaljevic, J. 1995. “Validation of a lighting simulation program under real sky conditions.” Lighting research and Technology, 27(4), 181-188.
NOAA. 2013. Lower 48 States –Mean Sunshine Percentage (Annual). U.S. Department of Commerce, Washington, D.C. Last accessed in August 2013 at http://cdo.ncdc.noaa.gov/climaps/sun5213.pdf
R Development Core Team. 2005. “R: A language and environment for statistical computing.” R Foundation for Statistical Computing, Vienna, Austria. ISBN 3-900051-07-0, URL http://www.R-project.org.
Saxena, M. 2011. “Office Daylighting Potential.” Public Interest Energy Research, California Energy Commission, Folsum, CA.
Thornton, B.A., M.I. Rosenberg, E.E. Richman, W. Wang, Y. Xie, J. Zhang, H. Cho, V.V. Mendon, and R.A. Athalye (2011). Achieving the 30% Goal: Energy and Cost Savings Analysis of ASHRAE Standard 90.1-2010. PNNL-20405. Pacific Northwest National Laboratory, Richland, Washington.

33
Ward, G. 2011. Simulating the Daylight Performance of Complex Fenestration Systems Using Bidirectional Scattering Distribution Functions within Radiance. LBNL-4414E. Lawrence Berkeley National Laboratory, Berkely, California.
Ward, G. J. 1994. “The RADIANCE lighting simulation and rendering system.” In Proceedings of the 21st annual conference on Computer graphics and interactive techniques (pp. 459-472). ACM, Orlando, FL.
Winkelmann, F. C., and S. Selkowitz. 1985. “Daylighting simulation in the DOE-2 building energy analysis program.” Energy and Buildings, 8(4), 271-286.
Related Documents