an overview of prepared for A D V I S O R Y G R O World Services Group, Inc. May, 2004 U.S. Economy & Commercial Real Estate Investment Market

An overview of prepared for A D V I S O R Y G R O U P World Services Group, Inc. May, 2004 U.S. Economy & Commercial Real Estate Investment Market.
Dec 26, 2015
Welcome message from author
This document is posted to help you gain knowledge. Please leave a comment to let me know what you think about it! Share it to your friends and learn new things together.
Transcript

an overview of
prepared for
A D V I S O R Y G R O U P
World Services Group, Inc.May, 2004
U.S. Economy & Commercial Real Estate Investment Market

A D V I S O R Y G R O U P2
Economic Overview
A D V I S O R Y G R O U P3
Annual U.S. Inflation Rate1980–2005
0%
2%
4%
6%
8%
10%
12%
14%19
80
1981
1982
1983
1984
1985
1986
1987
1988
1989
1990
1991
1992
1993
1994
1995
1996
1997
1998
1999
2000
2001
2002
2003
2004
2005
Rol
ling
4-Q
uarte
r Cha
nge
For
ecas
t
Source: Economy.com, Cushman & Wakefield Analytics
A D V I S O R Y G R O U P4
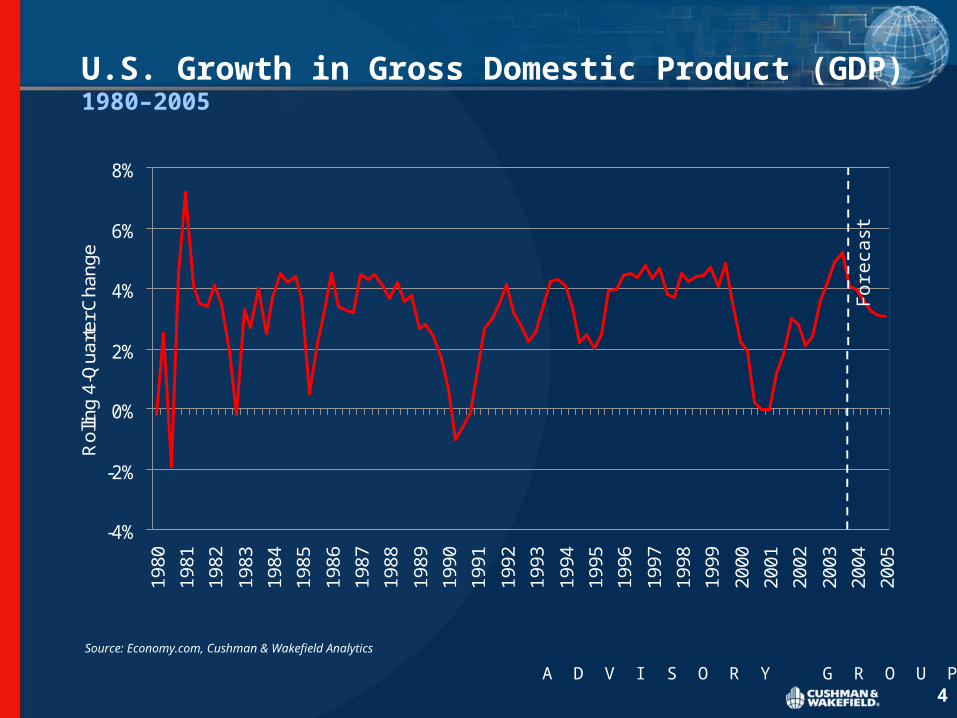
U.S. Growth in Gross Domestic Product (GDP)1980–2005
-4%
-2%
0%
2%
4%
6%
8%19
80
1981
1982
1983
1984
1985
1986
1987
1988
1989
1990
1991
1992
1993
1994
1995
1996
1997
1998
1999
2000
2001
2002
2003
2004
2005
Rol
ling
4-Q
uarte
r Cha
nge
For
ecas
t
Source: Economy.com, Cushman & Wakefield Analytics
A D V I S O R Y G R O U P5
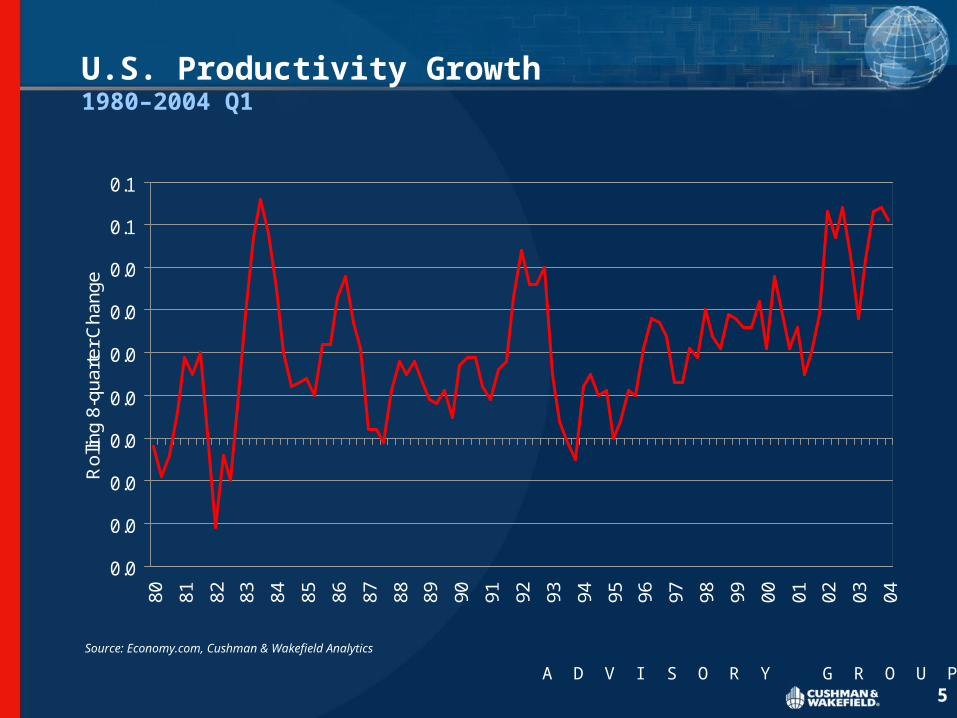
U.S. Productivity Growth1980–2004 Q1
Source: Economy.com, Cushman & Wakefield Analytics
0.0
0.0
0.0
0.0
0.0
0.0
0.0
0.0
0.1
0.1
80 81 82 83 84 85 86 87 88 89 90 91 92 93 94 95 96 97 98 99 00 01 02 03 04
Rol
ling
8-qu
arte
r Cha
nge
A D V I S O R Y G R O U P6
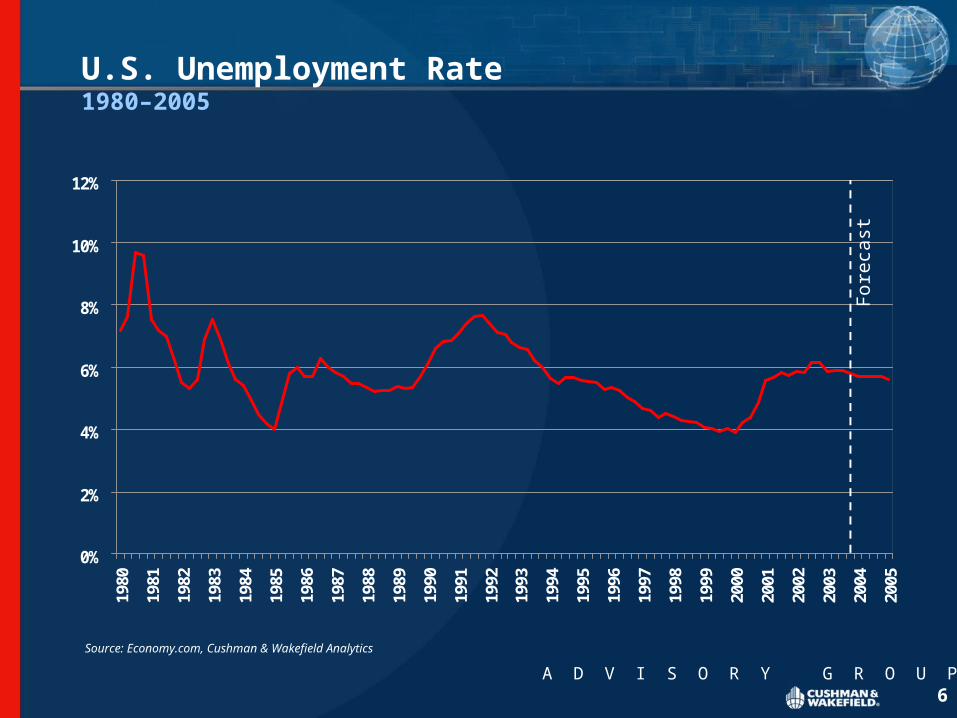
U.S. Unemployment Rate1980–2005
0%
2%
4%
6%
8%
10%
12%
1980
1981
1982
1983
1984
1985
1986
1987
1988
1989
1990
1991
1992
1993
1994
1995
1996
1997
1998
1999
2000
2001
2002
2003
2004
2005
For
ecas
t
Source: Economy.com, Cushman & Wakefield Analytics
A D V I S O R Y G R O U P7
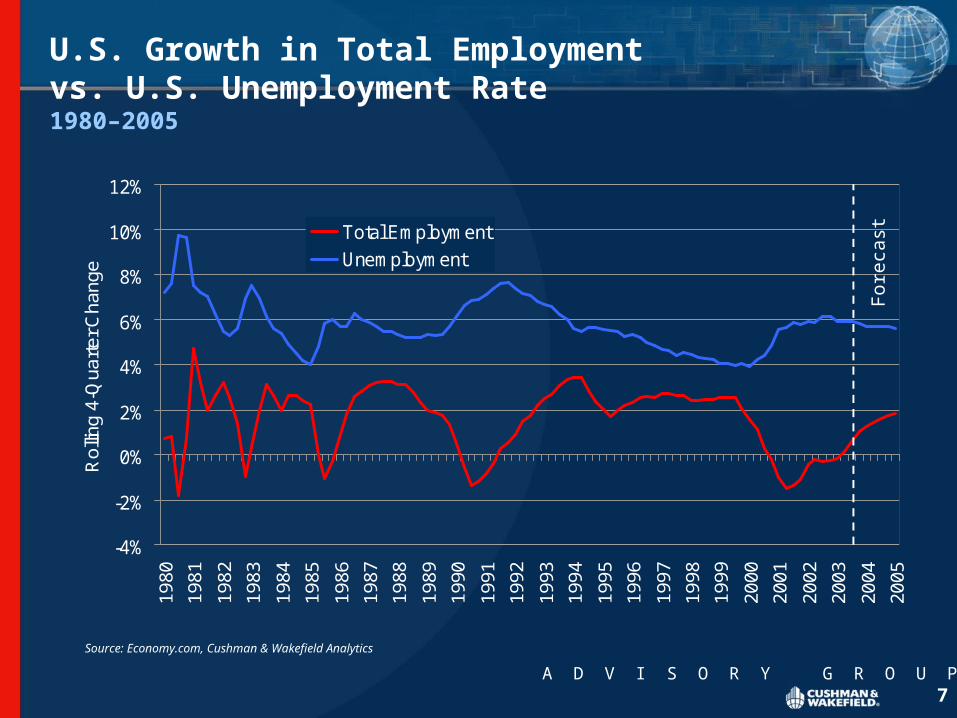
U.S. Growth in Total Employmentvs. U.S. Unemployment Rate 1980–2005
-4%
-2%
0%
2%
4%
6%
8%
10%
12%19
80
1981
1982
1983
1984
1985
1986
1987
1988
1989
1990
1991
1992
1993
1994
1995
1996
1997
1998
1999
2000
2001
2002
2003
2004
2005
Rol
ling
4-Q
uarte
r Cha
nge
Total Employment
Unemployment
For
ecas
t
Source: Economy.com, Cushman & Wakefield Analytics
A D V I S O R Y G R O U P8
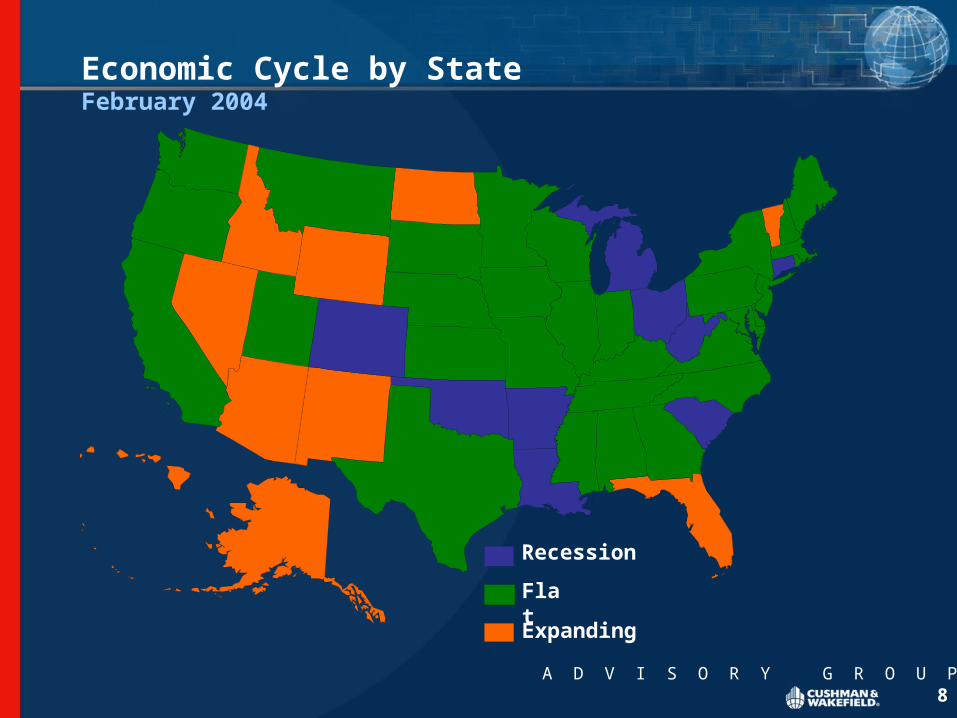
Economic Cycle by StateFebruary 2004
Recession
Flat
Expanding

A D V I S O R Y G R O U P9
U.S. Investment Market Overview
A D V I S O R Y G R O U P10
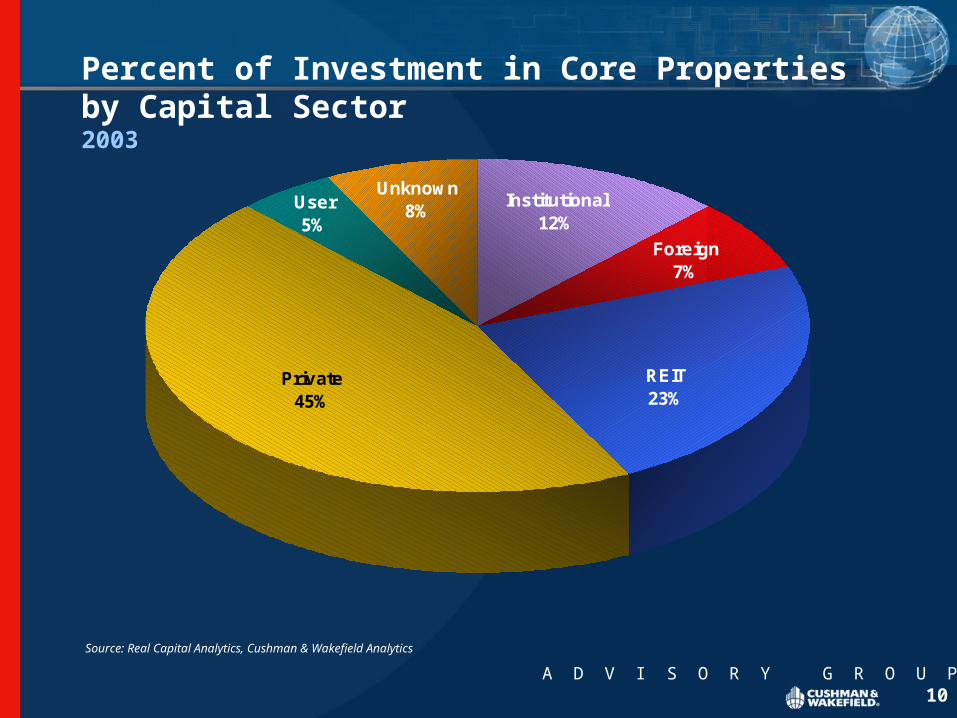
Percent of Investment in Core Propertiesby Capital Sector2003
REIT23%
Foreign7%
Institutional12%
Private45%
User5%
Unknown8%
Source: Real Capital Analytics, Cushman & Wakefield Analytics
A D V I S O R Y G R O U P11
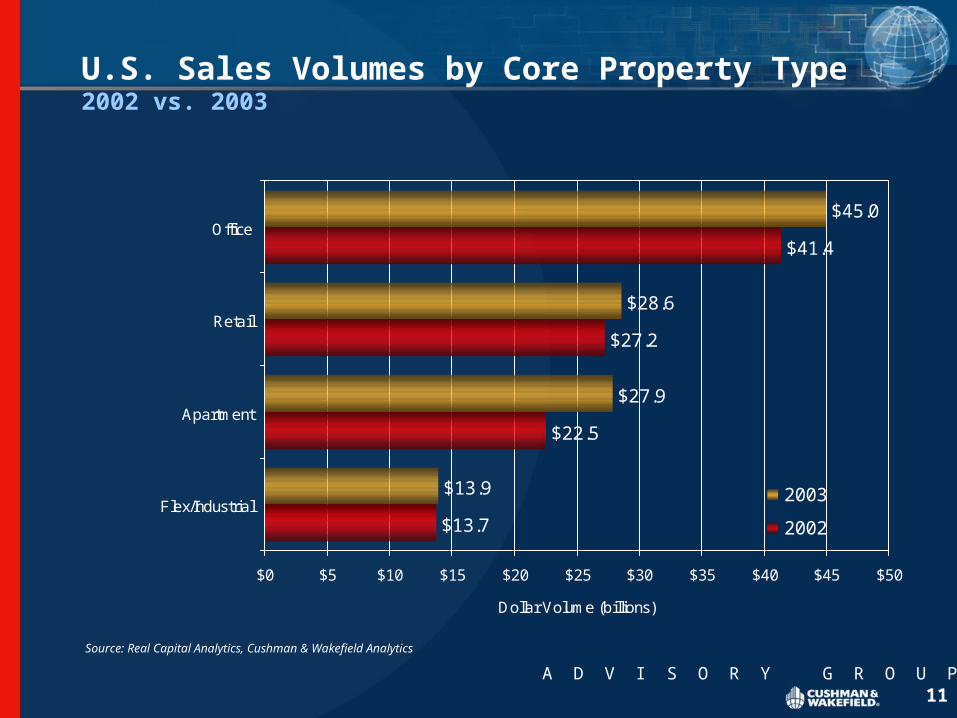
$13.7
$22.5
$27.2
$41.4
$13.9
$27.9
$28.6
$45.0
$0 $5 $10 $15 $20 $25 $30 $35 $40 $45 $50
Flex/Industrial
Apartment
Retail
Office
Dollar Volume (billions)
2003
2002
U.S. Sales Volumes by Core Property Type2002 vs. 2003
Source: Real Capital Analytics, Cushman & Wakefield Analytics
A D V I S O R Y G R O U P12
-6%
-4%
-2%
0%
2%
4%
6%
19
83
19
84
19
85
19
86
19
87
19
88
19
89
19
90
19
91
19
92
19
93
19
94
19
95
19
96
19
97
19
98
19
99
20
00
20
01
20
02
20
03
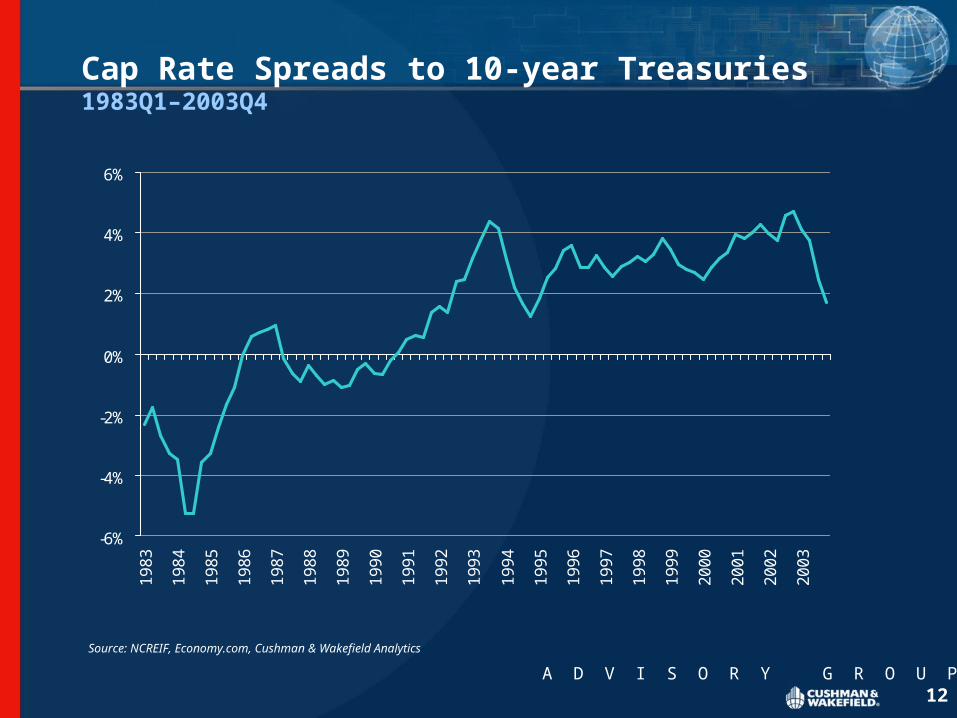
Source: NCREIF, Economy.com, Cushman & Wakefield Analytics
Cap Rate Spreads to 10-year Treasuries 1983Q1–2003Q4
A D V I S O R Y G R O U P13
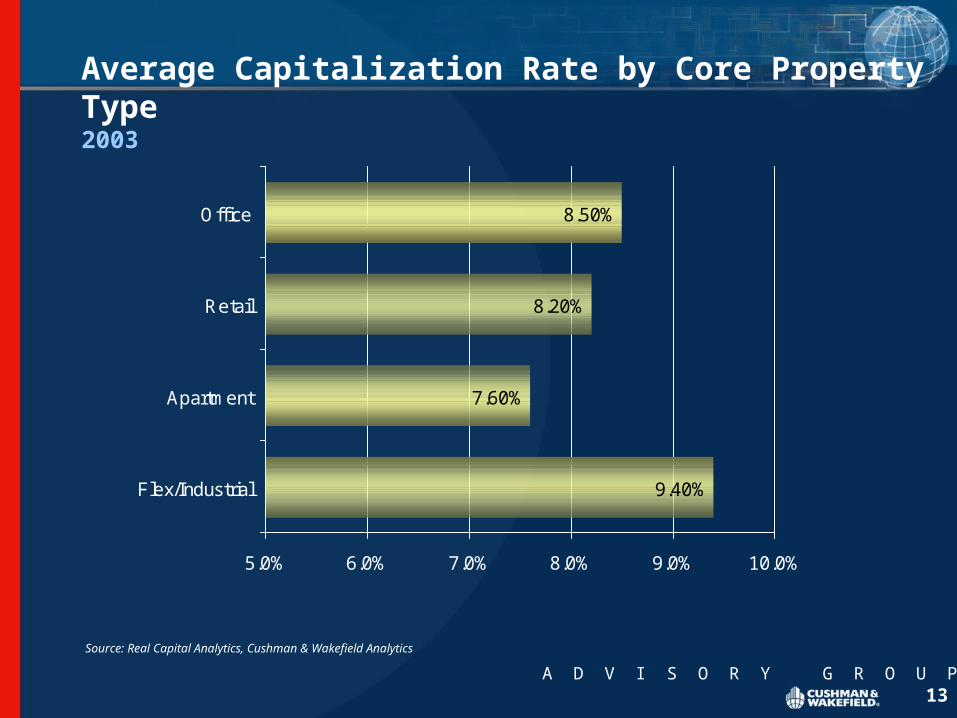
9.40%
7.60%
8.20%
8.50%
5.0% 6.0% 7.0% 8.0% 9.0% 10.0%
Flex/Industrial
Apartment
Retail
Office
Average Capitalization Rate by Core Property Type2003
Source: Real Capital Analytics, Cushman & Wakefield Analytics
A D V I S O R Y G R O U P14
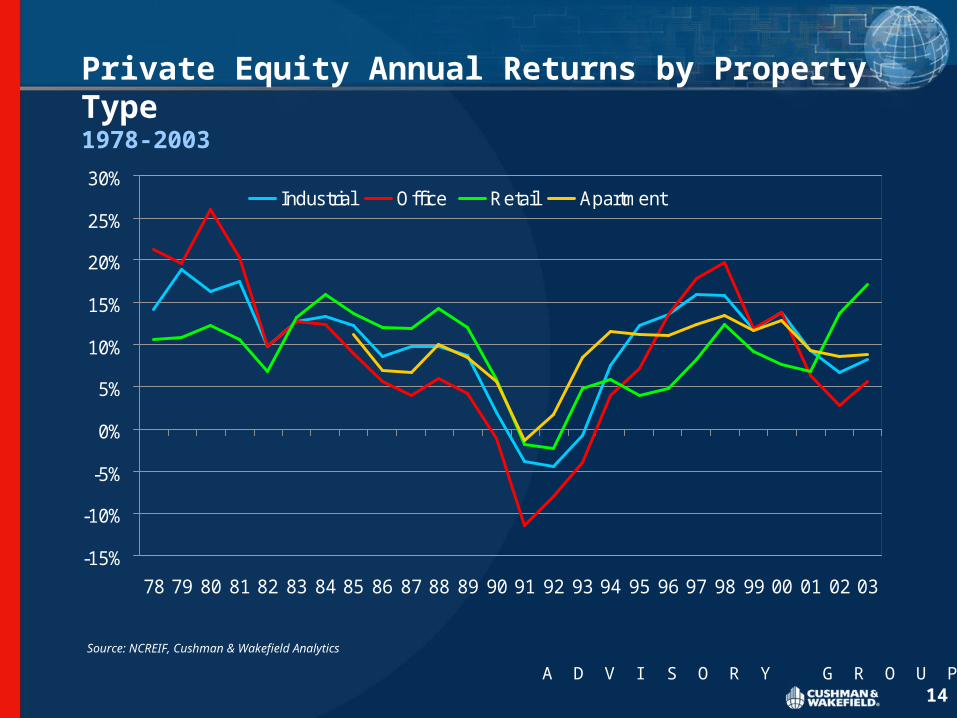
Source: NCREIF, Cushman & Wakefield Analytics
Private Equity Annual Returns by Property Type1978-2003
-15%
-10%
-5%
0%
5%
10%
15%
20%
25%
30%
78 79 80 81 82 83 84 85 86 87 88 89 90 91 92 93 94 95 96 97 98 99 00 01 02 03
Industrial Office Retail Apartment

A D V I S O R Y G R O U P15
U.S. Office Markets
A D V I S O R Y G R O U P16
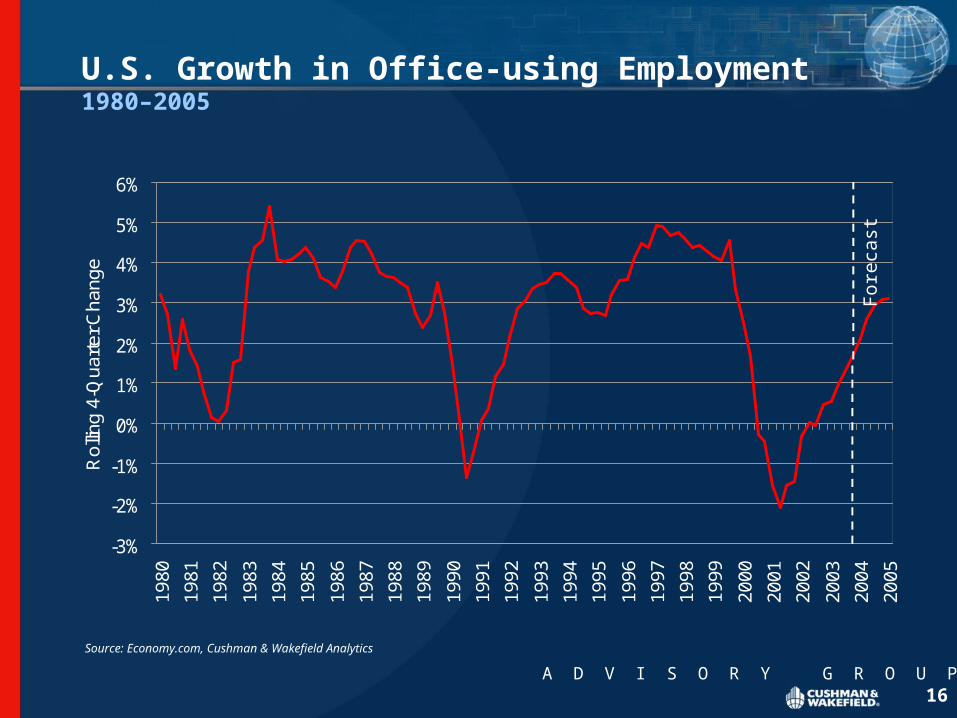
U.S. Growth in Office-using Employment1980–2005
-3%
-2%
-1%
0%
1%
2%
3%
4%
5%
6%19
80
1981
1982
1983
1984
1985
1986
1987
1988
1989
1990
1991
1992
1993
1994
1995
1996
1997
1998
1999
2000
2001
2002
2003
2004
2005
Rol
ling
4-Q
uarte
r Cha
nge
For
ecas
t
Source: Economy.com, Cushman & Wakefield Analytics
A D V I S O R Y G R O U P17
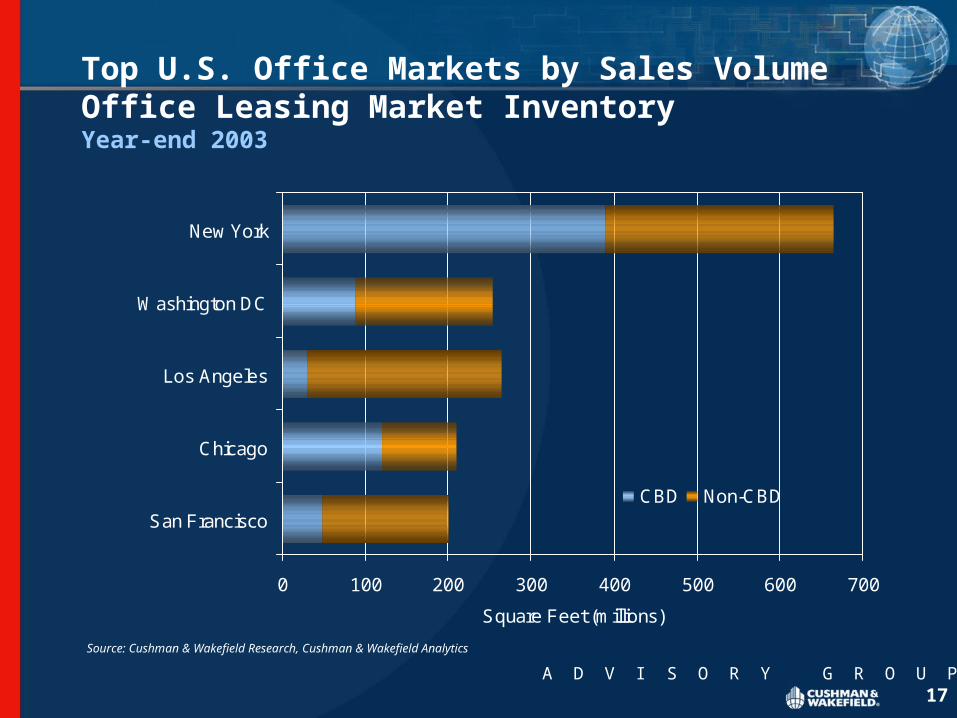
0 100 200 300 400 500 600 700
San Francisco
Chicago
Los Angeles
Washington DC
New York
Square Feet (millions)
CBD Non-CBD
Top U.S. Office Markets by Sales Volume Office Leasing Market InventoryYear-end 2003
Source: Cushman & Wakefield Research, Cushman & Wakefield Analytics
A D V I S O R Y G R O U P18
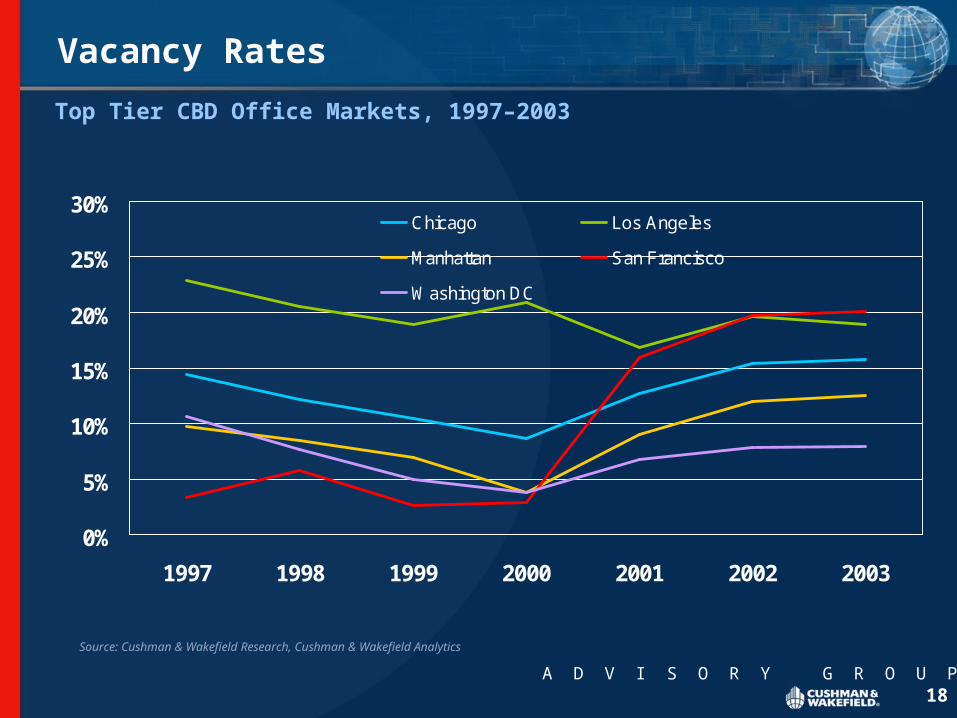
Vacancy Rates
0%
5%
10%
15%
20%
25%
30%
1997 1998 1999 2000 2001 2002 2003
Chicago Los Angeles
Manhattan San Francisco
Washington DC
Top Tier CBD Office Markets, 1997–2003
Source: Cushman & Wakefield Research, Cushman & Wakefield Analytics
A D V I S O R Y G R O U P19
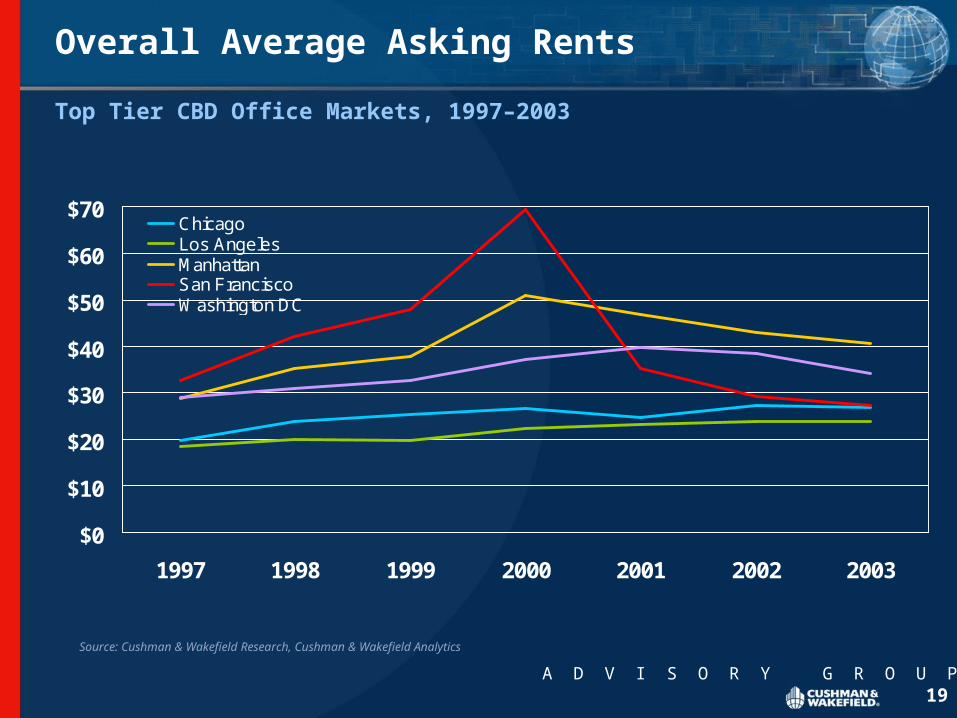
Overall Average Asking Rents
$0
$10
$20
$30
$40
$50
$60
$70
1997 1998 1999 2000 2001 2002 2003
ChicagoLos AngelesManhattanSan FranciscoWashington DC
Top Tier CBD Office Markets, 1997–2003
Source: Cushman & Wakefield Research, Cushman & Wakefield Analytics
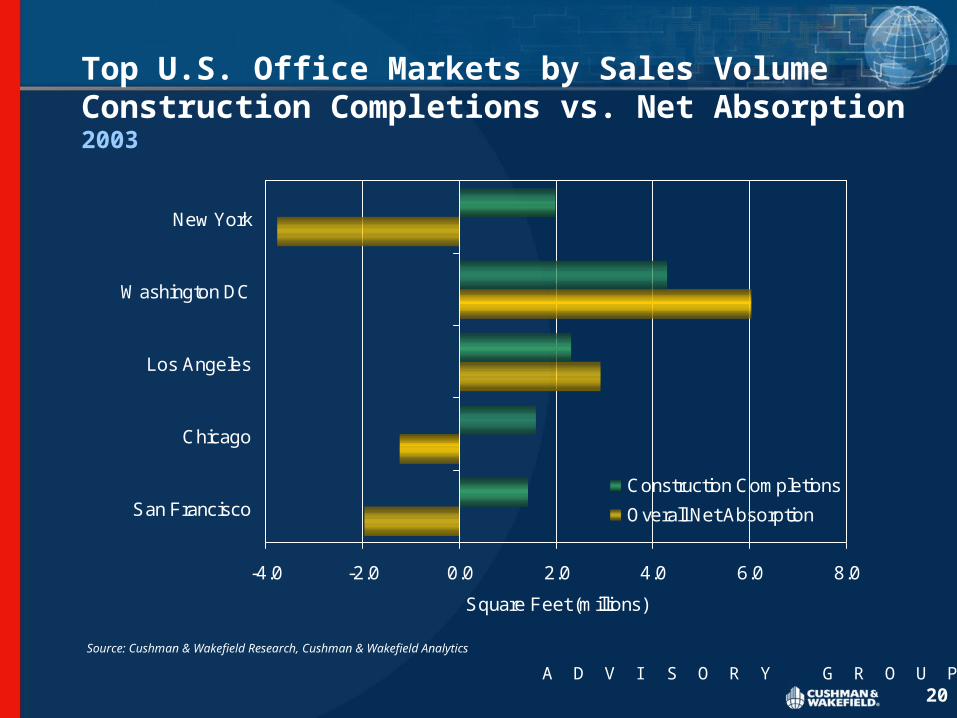
A D V I S O R Y G R O U P20
-4.0 -2.0 0.0 2.0 4.0 6.0 8.0
San Francisco
Chicago
Los Angeles
Washington DC
New York
Square Feet (millions)
Construction Completions
Overall Net Absorption
Top U.S. Office Markets by Sales Volume Construction Completions vs. Net Absorption2003
Source: Cushman & Wakefield Research, Cushman & Wakefield Analytics
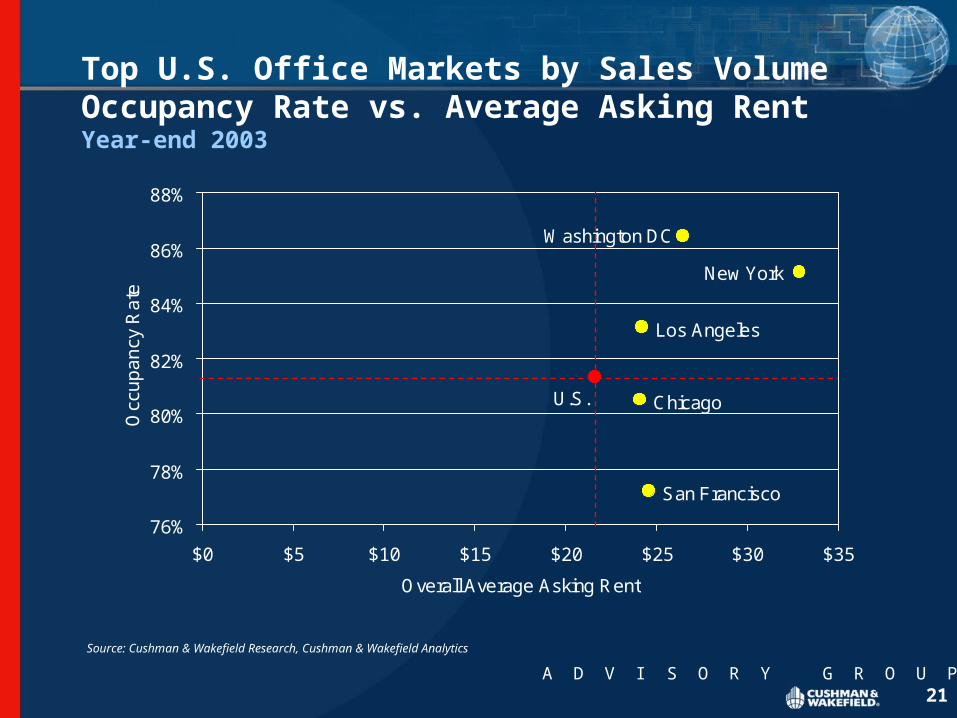
A D V I S O R Y G R O U P21
U.S.
New York
Washington DC
Los Angeles
Chicago
San Francisco
76%
78%
80%
82%
84%
86%
88%
$0 $5 $10 $15 $20 $25 $30 $35
Overall Average Asking Rent
Occ
up
an
cy R
ate
Top U.S. Office Markets by Sales Volume Occupancy Rate vs. Average Asking RentYear-end 2003
Source: Cushman & Wakefield Research, Cushman & Wakefield Analytics
A D V I S O R Y G R O U P22
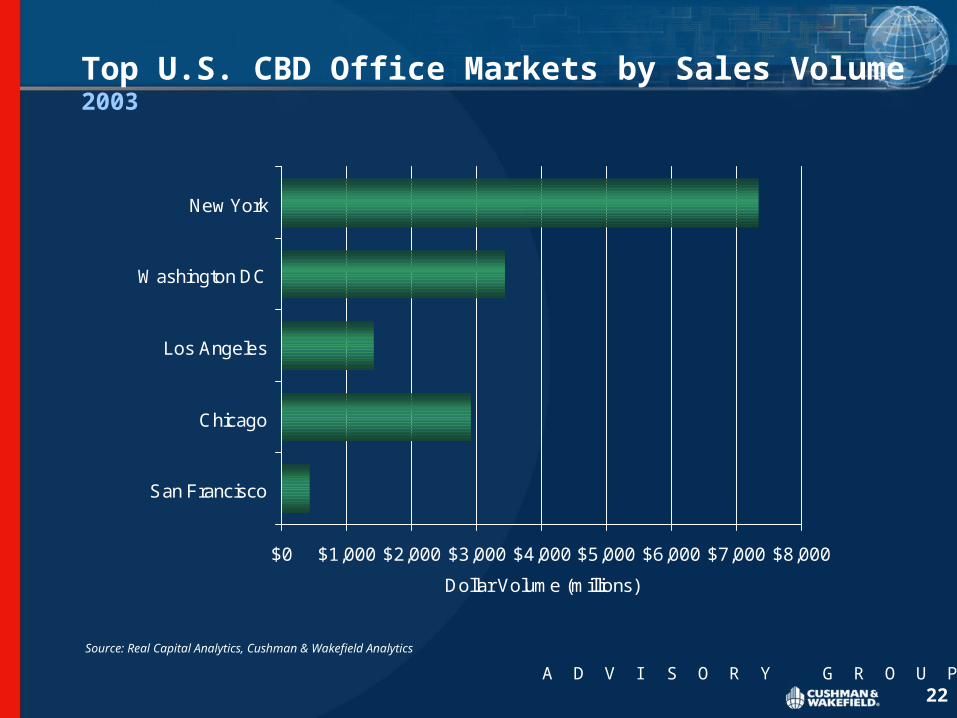
$0 $1,000 $2,000 $3,000 $4,000 $5,000 $6,000 $7,000 $8,000
San Francisco
Chicago
Los Angeles
Washington DC
New York
Dollar Volume (millions)
Top U.S. CBD Office Markets by Sales Volume2003
Source: Real Capital Analytics, Cushman & Wakefield Analytics
A D V I S O R Y G R O U P23
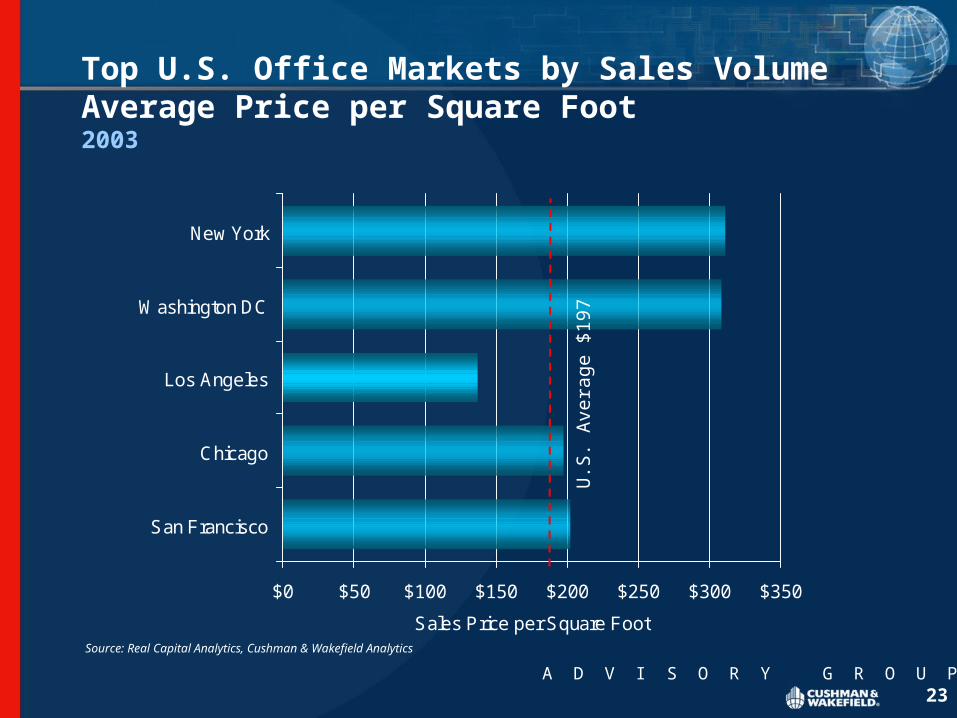
$0 $50 $100 $150 $200 $250 $300 $350
San Francisco
Chicago
Los Angeles
Washington DC
New York
Sales Price per Square Foot
Top U.S. Office Markets by Sales VolumeAverage Price per Square Foot2003
Source: Real Capital Analytics, Cushman & Wakefield Analytics
U.S
. A
vera
ge $
197
A D V I S O R Y G R O U P24
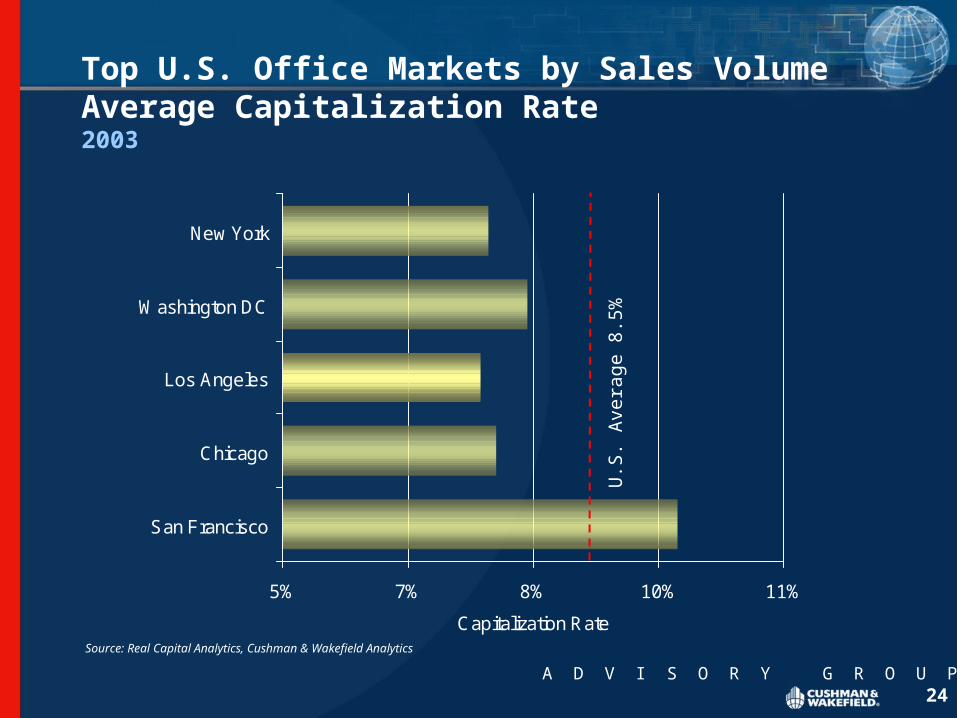
5% 7% 8% 10% 11%
San Francisco
Chicago
Los Angeles
Washington DC
New York
Capitalization Rate
Top U.S. Office Markets by Sales VolumeAverage Capitalization Rate2003
Source: Real Capital Analytics, Cushman & Wakefield Analytics
U.S
. A
vera
ge 8
.5%
Related Documents