Computers, Materials & Continua CMC, vol.64, no.1, pp.325-344, 2020 CMC. doi:10.32604/cmc.2020.09784 www.techscience.com/journal/cmc An Effective Steganalysis Algorithm for Histogram-Shifting Based Reversible Data Hiding Junxiang Wang 1, * , Lin Huang 1 , Ying Zhang 1 , Yonghong Zhu 1 , Jiangqun Ni 2 and Yunqing Shi 3 Abstract: To measure the security for hot searched reversible data hiding (RDH) technique, especially for the common-used histogram-shifting based RDH (denoted as HS-RDH), several steganalysis schemes are designed to detect whether some secret data has been hidden in a normal-looking image. However, conventional steganalysis schemes focused on the previous RDH algorithms, i.e., some early spatial/pixel domain-based histogram-shifting (HS) schemes, which might cause great changes in statistical characteristics and thus be easy to be detected. For recent improved methods, such as some adaptive prediction error (PE) based embedding schemes, those conventional schemes might be invalid, since those adaptive embedding mechanism would effectively reduce the embedding trace and thus increase the difficulty of steganalysis. Therefore, a novel steganalysis method is proposed in this paper to detect recent adaptive RDH schemes and provide a more effective detection tool for RDH. The contributions of this paper could be summarized as follows. (1) By analyzing the characteristics for those adaptive HS-RDH, an effective “flat ground” based detection method is designed to fast identify whether the given image is used to hide secret data; (2) According to the empirical statistical model, double check mechanism is provided to improve the detection accuracy; (3) In addition, to further improve detection ability, some detailed information for secret data, i.e., its content and embedding location are further estimated. Compared with conventional steganalysis methods, experimental results indicate that our proposed algorithm could achieve a better detection accuracy and meanwhile acquire more detailed information on secret data. Keywords: Reversible data hiding, steganalysis, detection, histogram shifting. 1 Introduction During the past decade, data hiding techniques have found wide applications in copyright protection and content authentication of digital multimedia [Barni, Bartolini, Cox et al. 1 School of Mechanical and Electronic Engineering, Jingdezhen Ceramic Institute, Jingdezhen, 333403, China. 2 School of Data and Computer Science, Sun Yat-sen University, Guangzhou, 510006, China. 3 Department of Electronics and Computer Engineering, New Jersey Institute of Technology, Newark, 07102, USA. * Corresponding Author: Junxiang Wang. Email: [email protected]. Received: 18 January 2020; Accepted: 10 April 2020.

Welcome message from author
This document is posted to help you gain knowledge. Please leave a comment to let me know what you think about it! Share it to your friends and learn new things together.
Transcript
Computers, Materials & Continua CMC, vol.64, no.1, pp.325-344, 2020
CMC. doi:10.32604/cmc.2020.09784 www.techscience.com/journal/cmc
An Effective Steganalysis Algorithm for Histogram-Shifting Based Reversible Data Hiding
Junxiang Wang1, *, Lin Huang1, Ying Zhang1, Yonghong Zhu1, Jiangqun Ni2 and
Yunqing Shi3 Abstract: To measure the security for hot searched reversible data hiding (RDH) technique, especially for the common-used histogram-shifting based RDH (denoted as HS-RDH), several steganalysis schemes are designed to detect whether some secret data has been hidden in a normal-looking image. However, conventional steganalysis schemes focused on the previous RDH algorithms, i.e., some early spatial/pixel domain-based histogram-shifting (HS) schemes, which might cause great changes in statistical characteristics and thus be easy to be detected. For recent improved methods, such as some adaptive prediction error (PE) based embedding schemes, those conventional schemes might be invalid, since those adaptive embedding mechanism would effectively reduce the embedding trace and thus increase the difficulty of steganalysis. Therefore, a novel steganalysis method is proposed in this paper to detect recent adaptive RDH schemes and provide a more effective detection tool for RDH. The contributions of this paper could be summarized as follows. (1) By analyzing the characteristics for those adaptive HS-RDH, an effective “flat ground” based detection method is designed to fast identify whether the given image is used to hide secret data; (2) According to the empirical statistical model, double check mechanism is provided to improve the detection accuracy; (3) In addition, to further improve detection ability, some detailed information for secret data, i.e., its content and embedding location are further estimated. Compared with conventional steganalysis methods, experimental results indicate that our proposed algorithm could achieve a better detection accuracy and meanwhile acquire more detailed information on secret data.
Keywords: Reversible data hiding, steganalysis, detection, histogram shifting.
1 Introduction During the past decade, data hiding techniques have found wide applications in copyright protection and content authentication of digital multimedia [Barni, Bartolini, Cox et al.
1 School of Mechanical and Electronic Engineering, Jingdezhen Ceramic Institute, Jingdezhen, 333403, China. 2 School of Data and Computer Science, Sun Yat-sen University, Guangzhou, 510006, China. 3 Department of Electronics and Computer Engineering, New Jersey Institute of Technology, Newark, 07102, USA. * Corresponding Author: Junxiang Wang. Email: [email protected]. Received: 18 January 2020; Accepted: 10 April 2020.
326 CMC, vol.64, no.1, pp.325-344, 2020
(2001); Tian, Zhao, Ni et al. (2013); Wang, Kong, Li et al. (2019)], which could hide some secret data in the cover image in an imperceptible manner to declare their ownership. Generally, secret data is required to be extracted by receiver. Among them, reversible data hiding (RDH) technique is considered as important branch, which could recover not only secret data as conventional scheme but the cover image without any distortion. Based on the desired characteristics, RDH techniques is hot researched and widely used in some fields, i.e., military, medical, legal field and so on. In general, most RDH schemes could be mainly classified into three categories, lossless compression (LC) [Fridrich, Goljan and Du (2001); Celik, Sharma, Tekalp et al. (2005)], difference expansion (DE) [Tian (2003); Thodi and Rodriguez (2007); Sachnev, Kim, Nam et al. (2009); Hwang, Kim, Sachnev et al. (2010); Wu and Huang (2012); Luo, Chen, Chen et al. (2010); Xuan, Shi, Chai et al. (2009)] and histogram shifting (HS) [Ni, Shi, Ansari et al. (2006)]. Actually, those schemes tend to exploit the redundancy of cover image to acquire a larger space for secret message embedding. LC algorithms usually employed the low to medium bit planes of the spatial pixels or transform coefficients to seek redundancy. Due to weak and instable correlation in one bit-plane, LC based scheme usually cannot achieve desired performance. DE was first proposed by Tian [Tian (2003)], where the difference between two adjacent pixels in cover image is obtained and then doubled to vacate its LSB to embed 1-bit secret message. Later, to further exploit the correlation in cover image, some prediction/interpolation methods are incorporated in DE, which are called as prediction-error expansion methods (PEE) [Fallahpour (2008); Li, Yang, Zeng et al. (2011); Ou, Li, Zhao et al. (2013); Coatrieux, Pan, Cuppens-Boulahia et al. (2013); Dragoi and Coltuc (2015); Hong, Chen and Chen (2015); Xiao, Liang, Ma et al. (2019)]. Another histogram shifting based RDH was pioneered by Ni et al. [Ni, Shi, Ansari et al. (2006)], which chose a pair of peak (highest frequency) and zero (zero frequency) bins in histogram as side information and then shifted the content between peak and zero bins towards zero bin by 1 to create vacant space for data hiding. Generally speaking, the performance of HS based RDH is heavily dependent on the sharpness of generated histogram [Tai, Yeh and Chang (2009); Gao, An, Yuan et al. (2011); Li, Li, Yang et al. (2013)] and the method to determine those peak and zero bin pairs [Xuan, Tong, Teng et al. (2012); Ma, Pan, Hu et al. (2015); Wang, Ni, Zhang et al. (2017)]. More recently, Li et al. [Li, Li, Yang et al. (2013)] proposed a general framework for HS based RDH, in which the DE/PEE could be regarded as a special case of HS. This is also followed in a recent survey article on RDH [Shi, Li and Zhang (2016)]. Thus, in this paper, we would concentrate solely on HS based RDH. In addition, to avoid the abuse of data hiding technique, some specialized detection tools were designed and called as ‘steganalysis’, which could identify the original carrier and its stego-version by judging whether some secret data are hidden in it. Essentially, steganalysis is considered as a classification algorithm with some specially designed features. It is known that more features are utilized, the steganalysis is more powerful. Recently, some typical steganalysis techniques [Westfeld and Pfitzmann (1999); Fridrich, Goljan, Hogea et al. (2003); Fridrich and Goljan (2004); Fridrich and Kodovsk (2012); Pevny, Bas and Fridrich (2010); Kamstra and Heijmans (2005)] are proposed for secret data detection, i.e., content-selective residuals (CSR), subtractive pixel adjacency matrix (SPAM) [Pevny, Bas and Fridrich (2010)], spatial rich model (SRM) [Fridrich and
An Effective Steganalysis Algorithm for Histogram-Shifting 327
Kodovsk (2012)] and so on. Among them, CSR features are calculated by computing noise residuals from disjoint classes of pixels. SPAM models those the differences between adjacent pixels as Markov chains, and utilizes the transition probability matrices to derive the statistical features. SRM is based on a large number of diverse sub-models to build huge feature set. Considering low computational complexity, CSR and SPAM are adopted for comparison in this paper. In the aspect of reversible data hiding, those steganalysis scheme are also significant. However, based on our best knowledge, those steganalysis scheme for RDH is rare. It results in the fact that most recent RDHs just pursue the high performance but ignore another anti-steganalysis factor, which will greatly reduce its practicability. According to our search results, most special designed steganalysis methods for RDH [Lou, Hu, Chou et al. (2011); Lou, Chou, Wei et al. (2013)] were proposed many years ago. It just detected the abnormal trace caused by the early RDH schemes, which generally modified those significant bins and thus led to serious deviation of histogram distribution. For example, one scheme [Sachnev, Kim, Nam et al. (2009)] employed bins 0, -1 with high frequency in the prediction error histogram for data hiding and thus broke the original Laplace distribution. In fact, recent adaptive embedding schemes usually adaptively choose appropriate peak bin (not the highest frequency bin) according to the given embedding payload to embedding secret information. In the case, the embedding process has less influence on the histogram distribution and meanwhile reduce the embedding trace, which might make those conventional schemes [Lou, Hu, Chou et al. (2011); Lou, Chou, Wei et al. (2013)] invalid and lead to the failure detection by previous steganalysis schemes. Consequently, this paper proposes a novel staganalysis method to detect recent adaptive HS-RDH [Wang, Ni and Zhang (2016, 2017)]. The contribution of this paper could be summarized as follows. (1) Analyzing the characteristics of recent adaptive HS-RDH scheme; (2) Providing a new staganalysis framework to detect HS-RDH; (3) Offering double check mechanism to improve detection accuracy based on the
empirical statistical model; (4) Design a supplementary algorithm to further estimate more detailed information on
secret data, i.e., its content and embedding location. The rest of the paper is organized as follows. A general adaptive HS-RDH embedding scheme and its characteristic analysis are described in Section 2; A novel steganalysis scheme for recent adaptive HS-RDH embedding algorithm is proposed in Section 3, which includes general framework, double check mechanism, and detailed information estimation and so on. Experimental results and discussions are provided in Section 4. Finally, the conclusions are summarized in Section 5.
2 HS based RDH and its characteristics In this section, a typical HS-RDH scheme [Wang, Ni and Zhang (2016, 2017)] with adaptive embedding strategy is briefly mentioned and then its characteristics are analyzed for following steganalysis scheme design.
328 CMC, vol.64, no.1, pp.325-344, 2020
In general, one typical adaptive HS-RDH scheme includes three phases as follows.
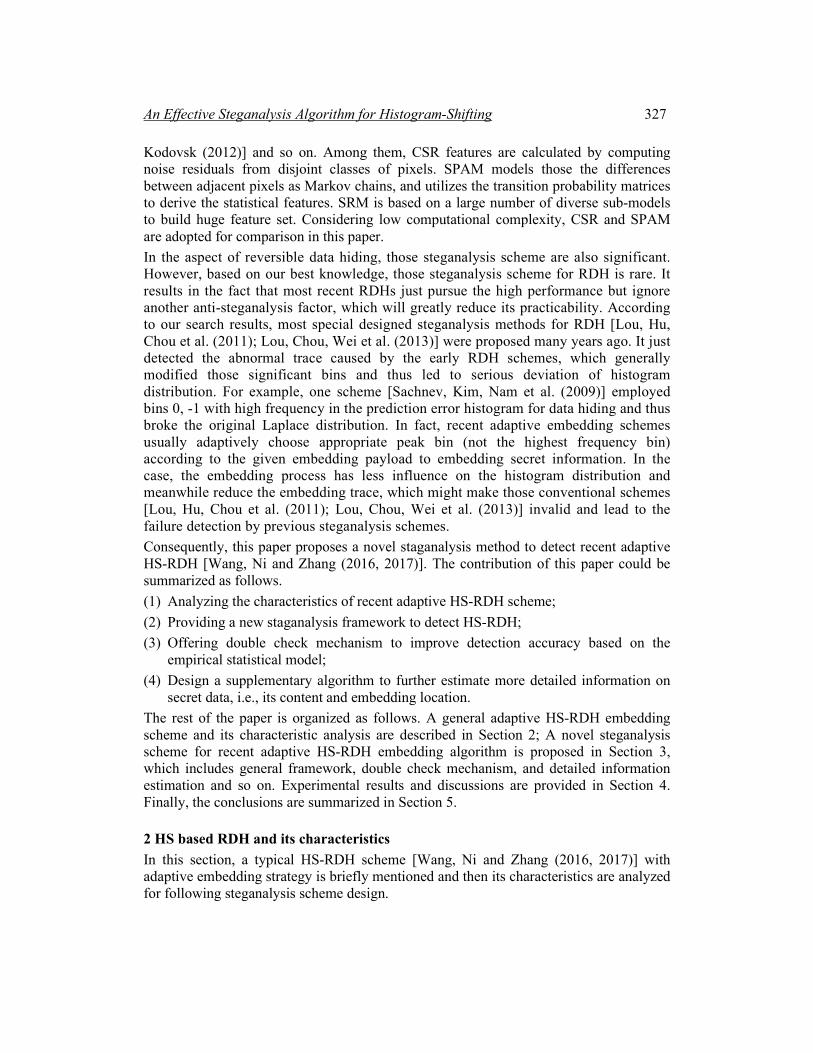
2.1 Prediction To sufficiently employ the spatial correlation between the cover image, a prediction technique is generally utilized to generate prediction errors (PEs). Then data hiding process is performed on those PEs. As mentioned in Wang et al. [Wang, Ni and Zhang (2017)], precise rhombus prediction is employed, in which the cover image is divided into two sets denoted as ‘Cross’ and ‘Round’ (see Fig. 1 for an illustration). And then each kx in one set, i.e., Cross set, is predicted using its four neighbors in the other set, i.e., Round set, to obtain ˆkx by
1 2 3 4ˆ4k
v v v vx + + + = (1)
Then the prediction error is computed by ˆk k ke x x= − (2)
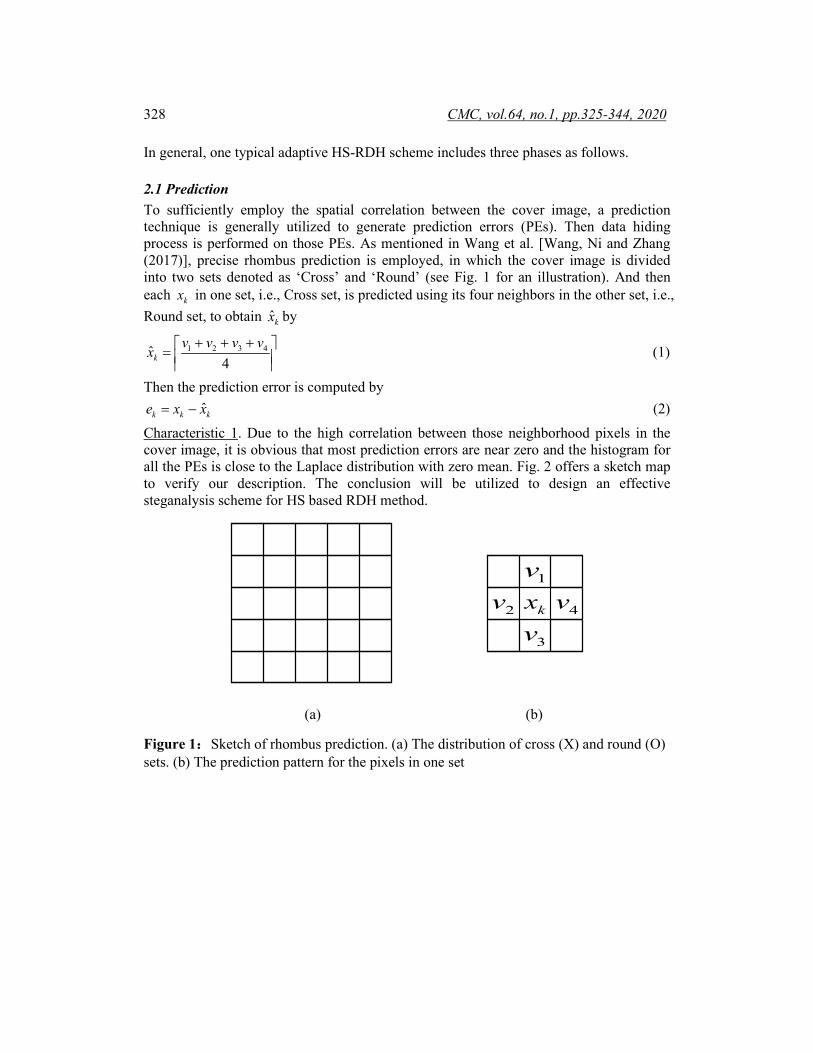
Characteristic 1. Due to the high correlation between those neighborhood pixels in the cover image, it is obvious that most prediction errors are near zero and the histogram for all the PEs is close to the Laplace distribution with zero mean. Fig. 2 offers a sketch map to verify our description. The conclusion will be utilized to design an effective steganalysis scheme for HS based RDH method.
1v
2v 4v
3vkx
(a) (b)
Figure 1:Sketch of rhombus prediction. (a) The distribution of cross (X) and round (O) sets. (b) The prediction pattern for the pixels in one set
An Effective Steganalysis Algorithm for Histogram-Shifting 329
H(k)
0 1 2 3 4 5 6-1-2-3-4-5-6 k. . . . . . . . . . . .
Tail areaTail area
Middle area
Figure 2:The sketch map of PEs histogram
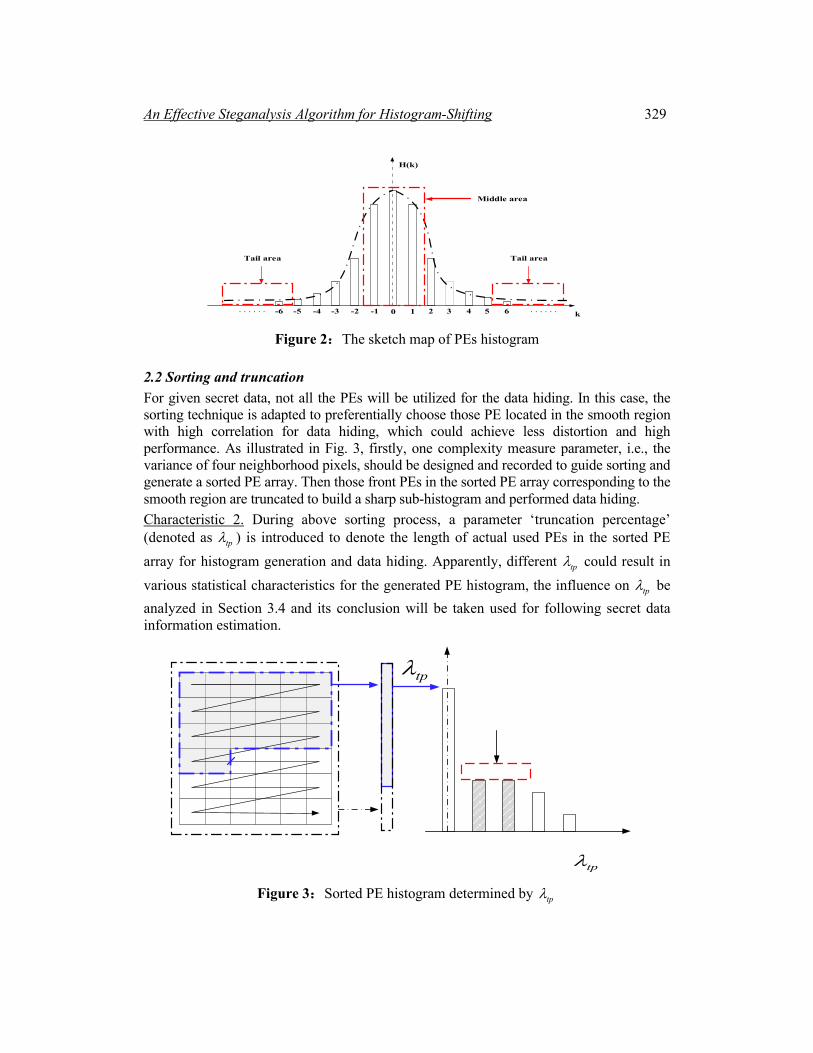
2.2 Sorting and truncation For given secret data, not all the PEs will be utilized for the data hiding. In this case, the sorting technique is adapted to preferentially choose those PE located in the smooth region with high correlation for data hiding, which could achieve less distortion and high performance. As illustrated in Fig. 3, firstly, one complexity measure parameter, i.e., the variance of four neighborhood pixels, should be designed and recorded to guide sorting and generate a sorted PE array. Then those front PEs in the sorted PE array corresponding to the smooth region are truncated to build a sharp sub-histogram and performed data hiding. Characteristic 2. During above sorting process, a parameter ‘truncation percentage’ (denoted as tpλ ) is introduced to denote the length of actual used PEs in the sorted PE array for histogram generation and data hiding. Apparently, different tpλ could result in various statistical characteristics for the generated PE histogram, the influence on tpλ be analyzed in Section 3.4 and its conclusion will be taken used for following secret data information estimation.
tpλ
tpλ Figure 3:Sorted PE histogram determined by tpλ
330 CMC, vol.64, no.1, pp.325-344, 2020
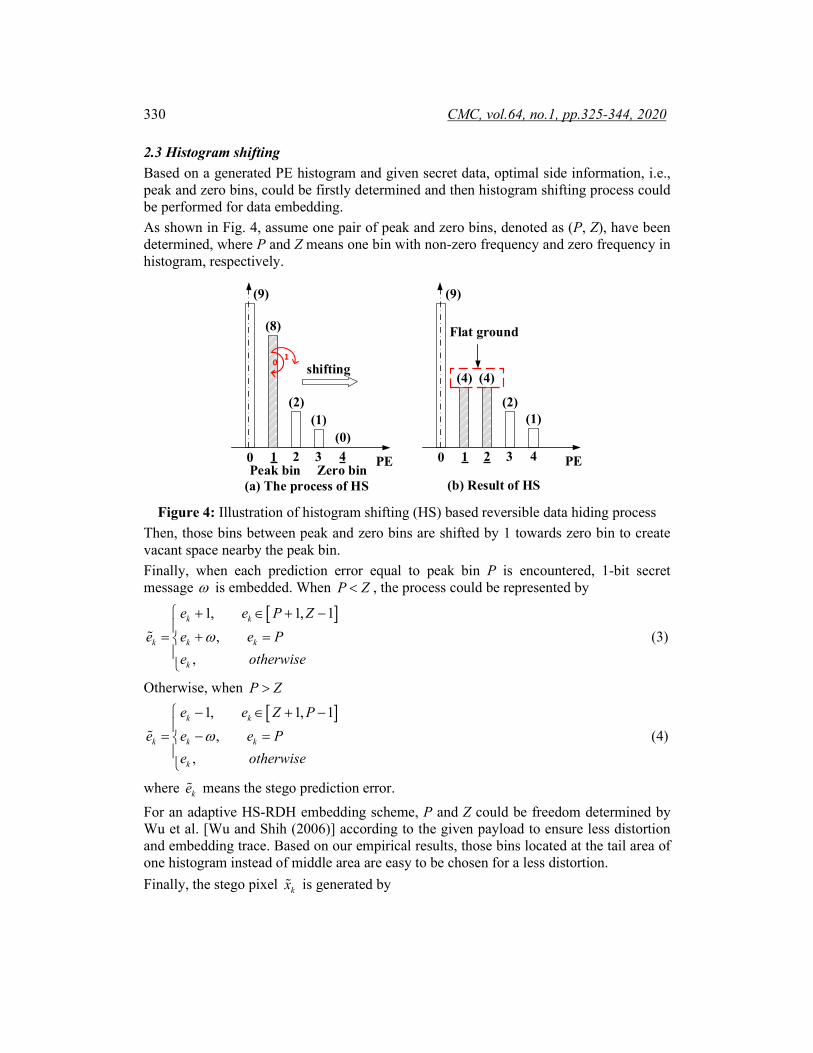
2.3 Histogram shifting Based on a generated PE histogram and given secret data, optimal side information, i.e., peak and zero bins, could be firstly determined and then histogram shifting process could be performed for data embedding. As shown in Fig. 4, assume one pair of peak and zero bins, denoted as (P, Z), have been determined, where P and Z means one bin with non-zero frequency and zero frequency in histogram, respectively.
0 1 2 3 4 PE
Flat ground
0 1 2 3 4 PEPeak bin Zero bin
0 1
(9)
(8)
(2)(1)
(0)
(9)
(4) (4)
(2)(1)
shifting
(a) The process of HS (b) Result of HS Figure 4: Illustration of histogram shifting (HS) based reversible data hiding process
Then, those bins between peak and zero bins are shifted by 1 towards zero bin to create vacant space nearby the peak bin. Finally, when each prediction error equal to peak bin P is encountered, 1-bit secret message ω is embedded. When P Z< , the process could be represented by
[ ]1, 1, 1,
,
k k
k k k
k
e e P Ze e e P
e otherwiseω
+ ∈ + −
= + =
(3)
Otherwise, when P Z>
[ ]1, 1, 1,
,
k k
k k k
k
e e Z Pe e e P
e otherwiseω
− ∈ + −
= − =
(4)
where ke means the stego prediction error. For an adaptive HS-RDH embedding scheme, P and Z could be freedom determined by Wu et al. [Wu and Shih (2006)] according to the given payload to ensure less distortion and embedding trace. Based on our empirical results, those bins located at the tail area of one histogram instead of middle area are easy to be chosen for a less distortion. Finally, the stego pixel kx is generated by
An Effective Steganalysis Algorithm for Histogram-Shifting 331
ˆk k kx x e= + (5)
to generate the stego-image. In addition, to improve the security for the HS-RDH, those binary secret messages are generally performed pseudo-random processing to ensure the value 0 and 1 in it are nearly equally distributed before data hiding process. Characteristic 3. As above mentioned, the peak bin in the histogram (namely the embedding location) will be split into two parts and appear a ‘flat ground’ phenomena, as shown in Fig. 4(b), which is considered as an obvious embedding trace and different from the normal Laplace distribution as mentioned in Characteristic 1. The conclusion will be employed to capture initial embedding trace.
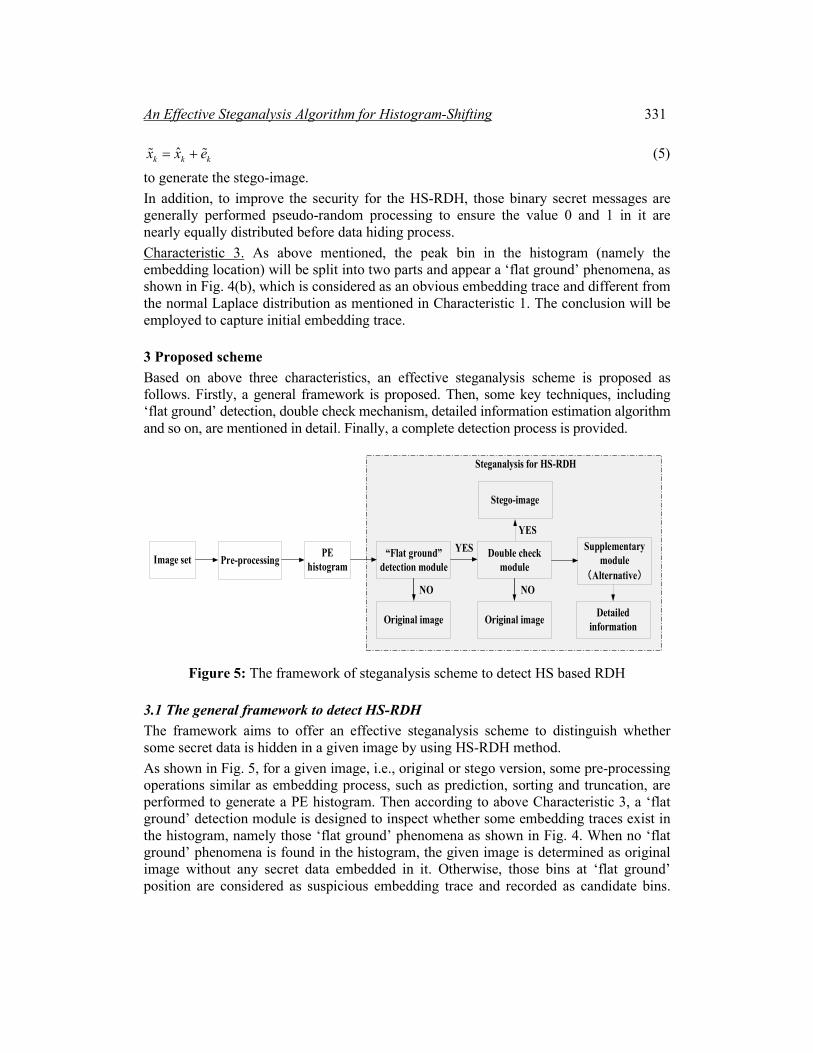
3 Proposed scheme Based on above three characteristics, an effective steganalysis scheme is proposed as follows. Firstly, a general framework is proposed. Then, some key techniques, including ‘flat ground’ detection, double check mechanism, detailed information estimation algorithm and so on, are mentioned in detail. Finally, a complete detection process is provided.
Image set Pre-processing PE histogram
“Flat ground” detection module
Double check module
Supplementary module
(Alternative)
Original image Original image Detailed information
Steganalysis for HS-RDH
NO NO
YES
Stego-image
YES
Figure 5: The framework of steganalysis scheme to detect HS based RDH
3.1 The general framework to detect HS-RDH The framework aims to offer an effective steganalysis scheme to distinguish whether some secret data is hidden in a given image by using HS-RDH method. As shown in Fig. 5, for a given image, i.e., original or stego version, some pre-processing operations similar as embedding process, such as prediction, sorting and truncation, are performed to generate a PE histogram. Then according to above Characteristic 3, a ‘flat ground’ detection module is designed to inspect whether some embedding traces exist in the histogram, namely those ‘flat ground’ phenomena as shown in Fig. 4. When no ‘flat ground’ phenomena is found in the histogram, the given image is determined as original image without any secret data embedded in it. Otherwise, those bins at ‘flat ground’ position are considered as suspicious embedding trace and recorded as candidate bins.
332 CMC, vol.64, no.1, pp.325-344, 2020
Later, double check module is provided to further inspect whether those candidate bins at ‘flat ground’ position are genuine ones based on Characteristic 1. If the result is positive, the given image is judged to be stego-image. Otherwise, it is considered as original one. When the conclusion is positive, we design a supplementary module to further estimate the detailed information for the secret data, i.e., its content and embedding location, according to Characteristic 2. The following section will describe those modules in detail.
3.2 Flat ground detection module As shown in Fig. 4, for a histogram, histogram shifting operation will lead to ‘flat ground’ phenomena, which means the frequency of adjacent bins is equal or nearly equal. Thus, the relative difference is provided to indicate whether a ‘flat ground’ phenomena exist at the k-th bin by
( ) ( 1) ( ) ( 1), [ 255,255]
( ) ( )H k H k H k H k
or FG kH k H k− − − +
≤ ∈ − (6)
where k+1 and k-1 denotes the adjacent bin for the k-th bin. ( )H k means the frequency of the k-th bin. X represent the absolute value of X .
Consider that those ‘0’ and ‘1’ in the secret data are not extremely uniform distributed, we pre-define a hyper-parameter to inspect the ‘flat ground’ phenomena and denote it as FG. According to our experimental results, set optimal 0.1FG = , which will be discussed in the Section 4 (Experimental results). When one bin meets Eq. (6), it is recorded as candidate bin located at ‘flat ground’ phenomena. When all the bins in the histogram are orderly inspected, a candidate array with all candidate bins in it will be acquired. When the array is null, the given image is determined as original image. Otherwise, go to the next double check module. In addition, it is noted that two special cases should be comprehensively considered to improve the ‘flat ground’ phenomena detection accuracy. Case 1: For some original nature images, those bins located at the middle area of PE histogram, such as 0, 1, -1 as shown in Fig. 2, might be more easily to recognize as above candidate bin located at ‘flat ground’ phenomena and cause error detection due to those bins with the high frequency in the denominator of Eq. (6). To deal with this case, the absolute difference is defined as auxiliary parameter (denoted as AD) and calculated by Eq. (7) to perform secondary judge to determine whether bins 0, 1, -1 are normal ones from original image or candidate bins located at ‘flat ground’ phenomena from stego-image.
( ) ( 1) , k [-1,1]H k H k AD− + ≤ ∈ (7)
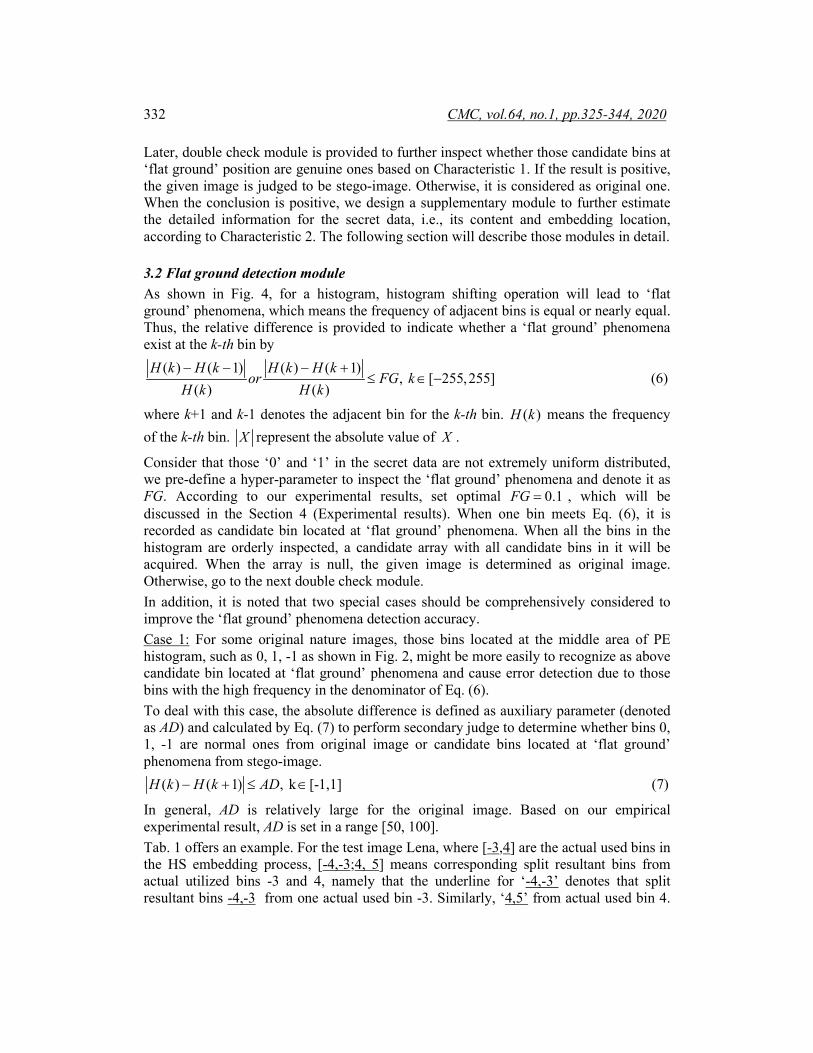
In general, AD is relatively large for the original image. Based on our empirical experimental result, AD is set in a range [50, 100]. Tab. 1 offers an example. For the test image Lena, where [-3,4] are the actual used bins in the HS embedding process, [-4,-3;4, 5] means corresponding split resultant bins from actual utilized bins -3 and 4, namely that the underline for ‘-4,-3’ denotes that split resultant bins -4,-3 from one actual used bin -3. Similarly, ‘4,5’ from actual used bin 4.
An Effective Steganalysis Algorithm for Histogram-Shifting 333
For the test images Lena and Airplane, different ADs could achieve correct result, since Case 1 is not encountered. However, for the test image Baboon with peak bins -2 and 3 for HS-RDH embedding, no matter auxiliary parameter AD is not employed or too large (>100), some bins 0,1 will be misjudged as a candidate bin. On the contrary, when AD is set to be an appropriate value in the interval [50,100], correct results could be obtained. Case 2: For an original image, those bins with tiny frequencies located at the tail area of PE histogram as shown in Fig. 2, might have similar frequencies and thus led to error detection. In fact, those bins could be directly ignored since those bins are hardly taken used in RDH process due to the poor data hiding capacity caused by their low frequencies. Therefore, to deal with Case 2, another parameter is defined to remove those tiny frequency bins at the tail area of PE histogram and denoted as RT. Based on the empirical result, RT is set to be 100, which means those bins with frequency less than RT is ignored to perform ‘flat ground’ detection. In the section experimental result, the value of RT is discussed.
Table 1: The impact of parameter “AD” Payload (bpp) Image Actual bins Parameter
(AD) Candidate
bins Result
0.05
Lena
[-3,4]
50 [-4,-3;4,5] Correct 75 [-4,-3;4,5] Correct
100 [-4,-3;4,5] Correct 200 [-4,-3;4,5] Correct
None [-4,-3;4,5] Correct
Airplane
[-3,1,5]
50 [-4,-3;1,2] Correct 75 [-4,-3;1,2] Correct
100 [-4,-3;1,2] Correct 200 [-4,-3;1,2] Correct
None [-4,-3;1,2] Correct
Baboon
[-2,3]
50 [-3,-2;3,4] Correct 75 [-3,-2;3,4] Correct
100 [-3,-2;3,4] Correct 200 [-3,-2;0,1;3,4] Error
None [0,1] Error
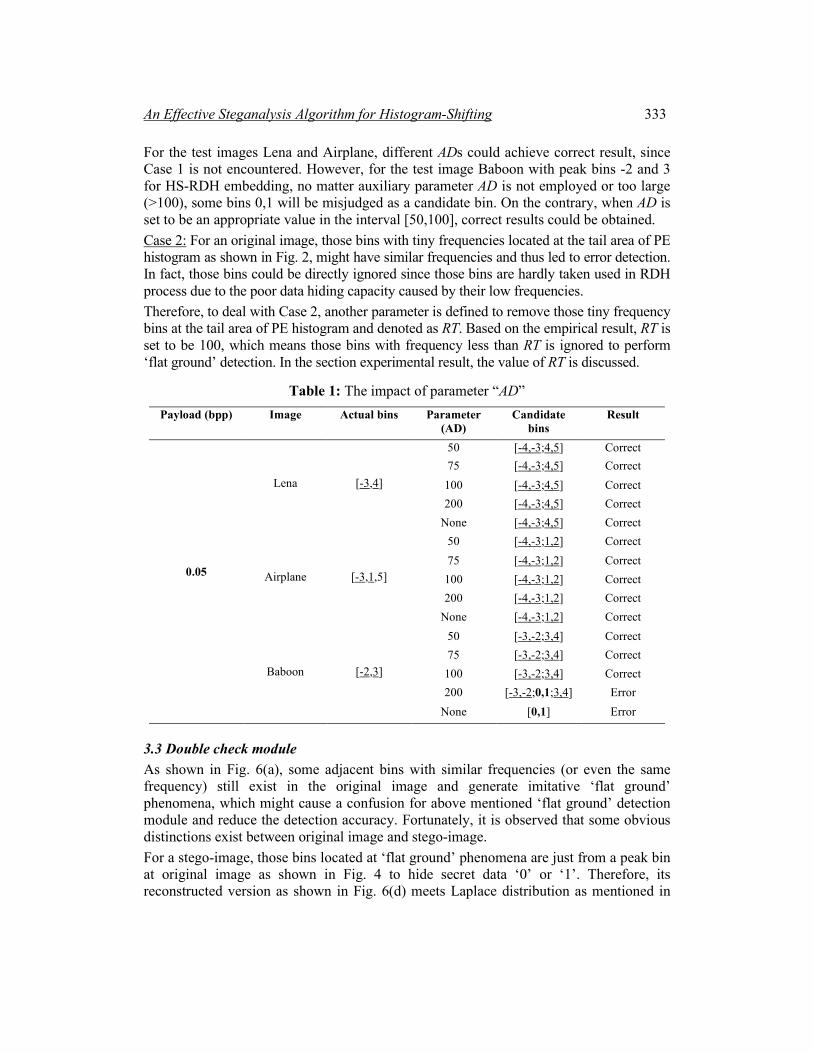
3.3 Double check module As shown in Fig. 6(a), some adjacent bins with similar frequencies (or even the same frequency) still exist in the original image and generate imitative ‘flat ground’ phenomena, which might cause a confusion for above mentioned ‘flat ground’ detection module and reduce the detection accuracy. Fortunately, it is observed that some obvious distinctions exist between original image and stego-image. For a stego-image, those bins located at ‘flat ground’ phenomena are just from a peak bin at original image as shown in Fig. 4 to hide secret data ‘0’ or ‘1’. Therefore, its reconstructed version as shown in Fig. 6(d) meets Laplace distribution as mentioned in
334 CMC, vol.64, no.1, pp.325-344, 2020
Characteristic 1. Assuming both k-th and (k-1)-th bins are located at ‘flat ground’ phenomena position from stego-image, it should meet following formula.
( 2) ( ) ( 1) ( 1), 0( 2) ( ) ( 1) ( 1), 0
H k H k H k H k kH k H k H k H k k
− > + − > + > − < + − < + <
(8)
On the contrary, for those imitative ‘flat ground’ phenomena in the original image, the reconstructed version as shown in Fig. 6(b) does commonly not meet Eq. (8) since those bins are not from the same source.
0 1 2 3 4 PE
Flat ground (imitative)
(9)
(5) (5)
(2) (1)
0 1 2 3 4 PE
flat ground
(9)
(4) (4)
(2) (1)
0 1 2 3 4 PE
(9)
(2) (1)
(10)
0 1 2 3 4 PE
(9)
(2) (1)
(8)
(a) PE histogram of original image
(b) Reconstructed PE histogram of original image
(c) PE histogram of stego image
(d) Reconstructed PE histogram of stego image
Reconstructed
Reconstructed
Figure 6: Sketch map for double check module
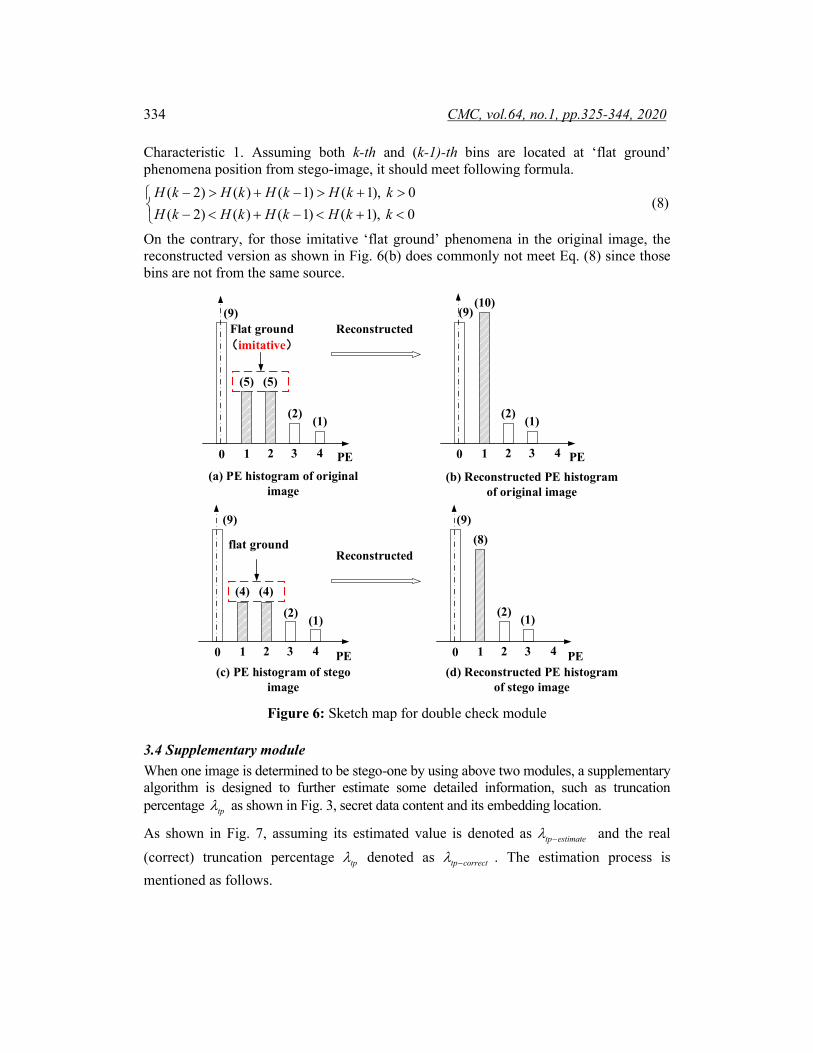
3.4 Supplementary module When one image is determined to be stego-one by using above two modules, a supplementary algorithm is designed to further estimate some detailed information, such as truncation percentage tpλ as shown in Fig. 3, secret data content and its embedding location.
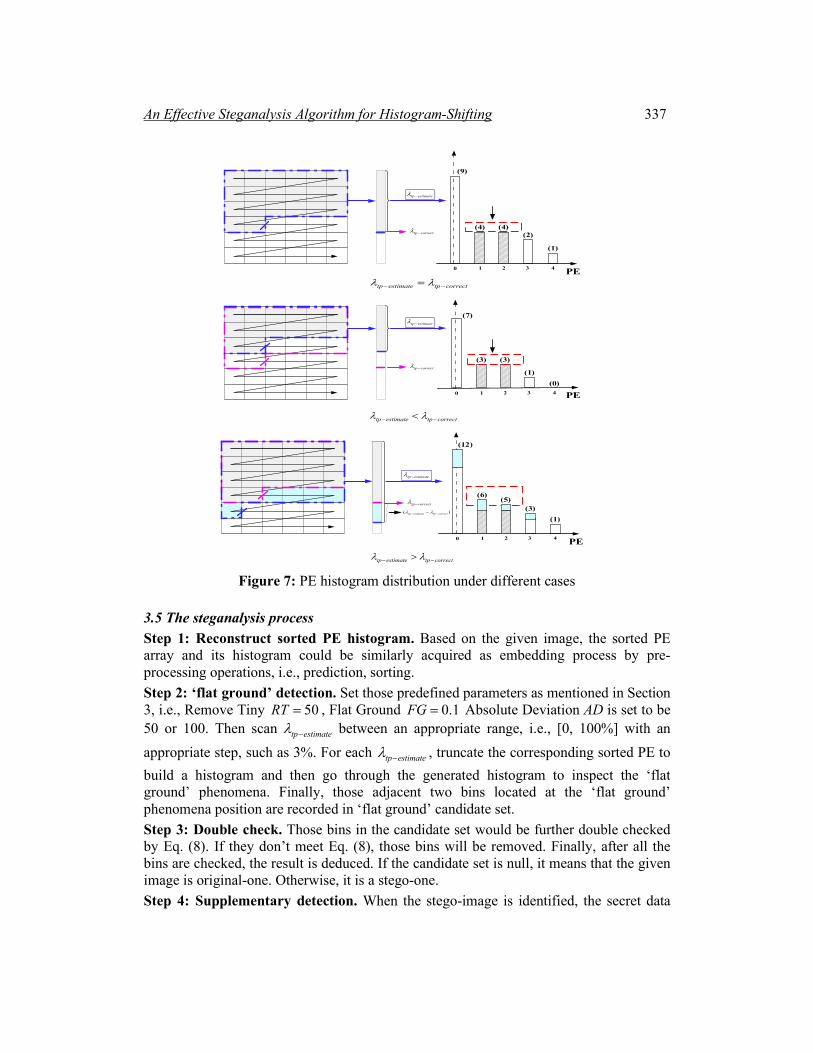
As shown in Fig. 7, assuming its estimated value is denoted as tp estimateλ − and the real (correct) truncation percentage tpλ denoted as tp correctλ − . The estimation process is mentioned as follows.
An Effective Steganalysis Algorithm for Histogram-Shifting 335
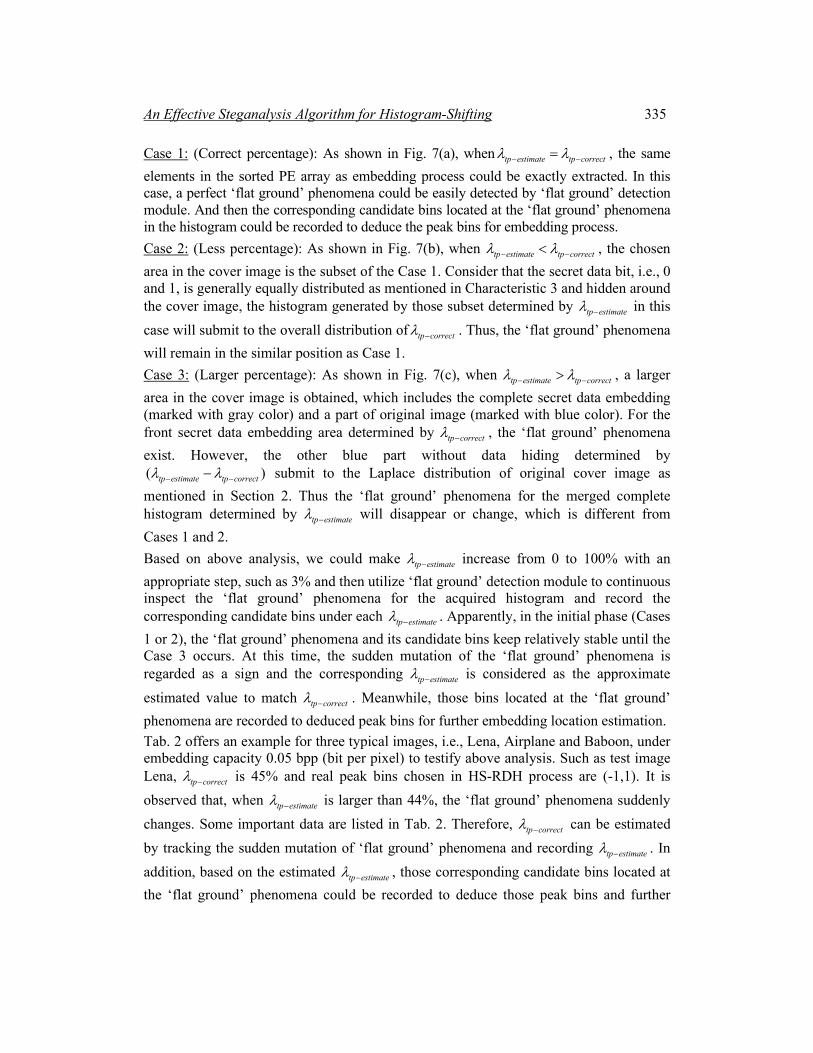
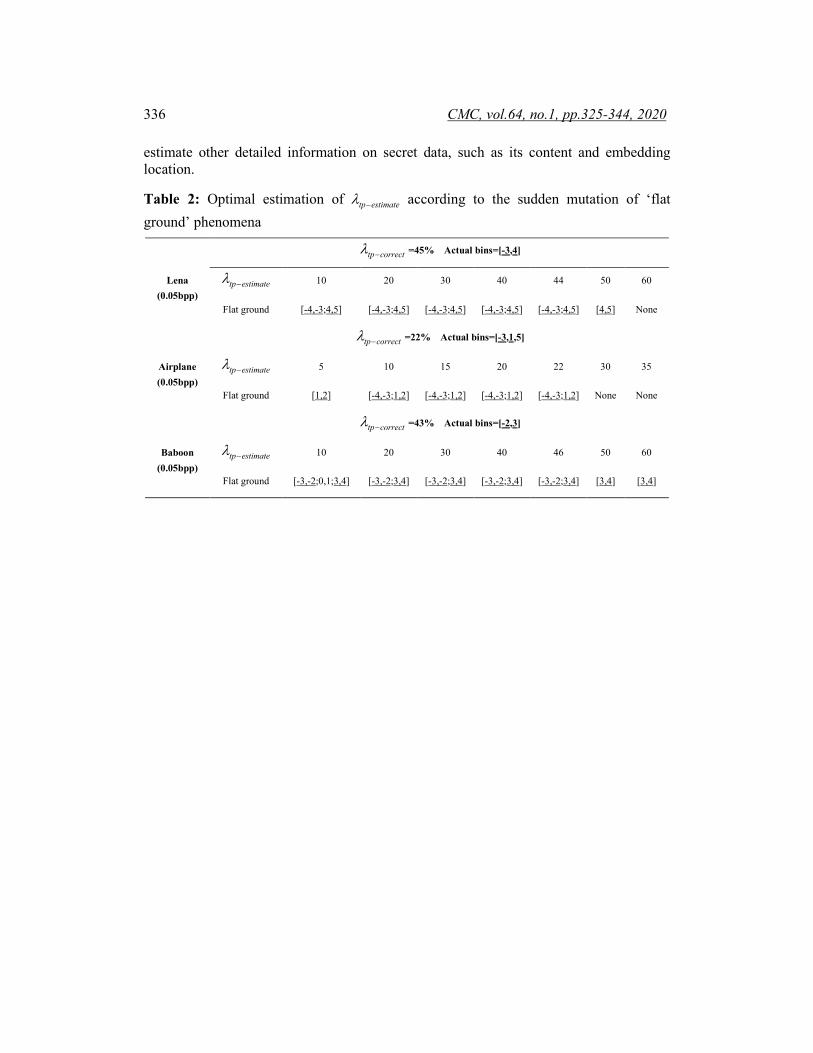
Case 1: (Correct percentage): As shown in Fig. 7(a), when tp estimate tp correctλ λ− −= , the same elements in the sorted PE array as embedding process could be exactly extracted. In this case, a perfect ‘flat ground’ phenomena could be easily detected by ‘flat ground’ detection module. And then the corresponding candidate bins located at the ‘flat ground’ phenomena in the histogram could be recorded to deduce the peak bins for embedding process. Case 2: (Less percentage): As shown in Fig. 7(b), when tp estimate tp correctλ λ− −< , the chosen area in the cover image is the subset of the Case 1. Consider that the secret data bit, i.e., 0 and 1, is generally equally distributed as mentioned in Characteristic 3 and hidden around the cover image, the histogram generated by those subset determined by tp estimateλ − in this case will submit to the overall distribution of tp correctλ − . Thus, the ‘flat ground’ phenomena will remain in the similar position as Case 1. Case 3: (Larger percentage): As shown in Fig. 7(c), when tp estimate tp correctλ λ− −> , a larger area in the cover image is obtained, which includes the complete secret data embedding (marked with gray color) and a part of original image (marked with blue color). For the front secret data embedding area determined by tp correctλ − , the ‘flat ground’ phenomena exist. However, the other blue part without data hiding determined by ( )tp estimate tp correctλ λ− −− submit to the Laplace distribution of original cover image as mentioned in Section 2. Thus the ‘flat ground’ phenomena for the merged complete histogram determined by tp estimateλ − will disappear or change, which is different from Cases 1 and 2. Based on above analysis, we could make tp estimateλ − increase from 0 to 100% with an appropriate step, such as 3% and then utilize ‘flat ground’ detection module to continuous inspect the ‘flat ground’ phenomena for the acquired histogram and record the corresponding candidate bins under each tp estimateλ − . Apparently, in the initial phase (Cases 1 or 2), the ‘flat ground’ phenomena and its candidate bins keep relatively stable until the Case 3 occurs. At this time, the sudden mutation of the ‘flat ground’ phenomena is regarded as a sign and the corresponding tp estimateλ − is considered as the approximate estimated value to match tp correctλ − . Meanwhile, those bins located at the ‘flat ground’ phenomena are recorded to deduced peak bins for further embedding location estimation. Tab. 2 offers an example for three typical images, i.e., Lena, Airplane and Baboon, under embedding capacity 0.05 bpp (bit per pixel) to testify above analysis. Such as test image Lena, tp correctλ − is 45% and real peak bins chosen in HS-RDH process are (-1,1). It is observed that, when tp estimateλ − is larger than 44%, the ‘flat ground’ phenomena suddenly changes. Some important data are listed in Tab. 2. Therefore, tp correctλ − can be estimated by tracking the sudden mutation of ‘flat ground’ phenomena and recording tp estimateλ − . In addition, based on the estimated tp estimateλ − , those corresponding candidate bins located at the ‘flat ground’ phenomena could be recorded to deduce those peak bins and further
336 CMC, vol.64, no.1, pp.325-344, 2020
estimate other detailed information on secret data, such as its content and embedding location.
Table 2: Optimal estimation of tp estimateλ − according to the sudden mutation of ‘flat ground’ phenomena
Lena
(0.05bpp)
tp correctλ − =45% Actual bins=[-3,4]
tp estimateλ − 10 20 30 40 44 50 60
Flat ground [-4,-3;4,5] [-4,-3;4,5] [-4,-3;4,5] [-4,-3;4,5] [-4,-3;4,5] [4,5] None
Airplane (0.05bpp)
tp correctλ − =22% Actual bins=[-3,1,5]
tp estimateλ − 5 10 15 20 22 30 35
Flat ground [1,2] [-4,-3;1,2] [-4,-3;1,2] [-4,-3;1,2] [-4,-3;1,2] None None
Baboon
(0.05bpp)
tp correctλ − =43% Actual bins=[-2,3]
tp estimateλ − 10 20 30 40 46 50 60
Flat ground [-3,-2;0,1;3,4] [-3,-2;3,4] [-3,-2;3,4] [-3,-2;3,4] [-3,-2;3,4] [3,4] [3,4]
An Effective Steganalysis Algorithm for Histogram-Shifting 337
0 1 2 3 4 PE
(7)
(3) (3)
(1)(0)
0 1 2 3 4 PE
(9)
(4) (4)(2)
(1)
0 1 2 3 4 PE
(12)
(6)(5)
(3)(1)
tp estimateλ −
tp estimate tp correctλ λ− −=
tp estimate tp correctλ λ− −<
tp estimate tp correctλ λ− −>
tp correctλ −
tp correctλ −
tp correctλ −
( )tp estimate tp correctλ λ− −−
tp estimateλ −
tp estimateλ −
Figure 7: PE histogram distribution under different cases
3.5 The steganalysis process Step 1: Reconstruct sorted PE histogram. Based on the given image, the sorted PE array and its histogram could be similarly acquired as embedding process by pre-processing operations, i.e., prediction, sorting. Step 2: ‘flat ground’ detection. Set those predefined parameters as mentioned in Section 3, i.e., Remove Tiny 50RT = , Flat Ground 0.1FG = Absolute Deviation AD is set to be 50 or 100. Then scan tp estimateλ − between an appropriate range, i.e., [0, 100%] with an appropriate step, such as 3%. For each tp estimateλ − , truncate the corresponding sorted PE to build a histogram and then go through the generated histogram to inspect the ‘flat ground’ phenomena. Finally, those adjacent two bins located at the ‘flat ground’ phenomena position are recorded in ‘flat ground’ candidate set. Step 3: Double check. Those bins in the candidate set would be further double checked by Eq. (8). If they don’t meet Eq. (8), those bins will be removed. Finally, after all the bins are checked, the result is deduced. If the candidate set is null, it means that the given image is original-one. Otherwise, it is a stego-one. Step 4: Supplementary detection. When the stego-image is identified, the secret data
338 CMC, vol.64, no.1, pp.325-344, 2020
content and its embedding location could be further estimated according to detail information estimation module as mentioned in Section 3.4.
4 Experimental results In this section, the impact of three parameters, namely, Remove Tiny (RT), Flat Ground (FG), Absolute Deviation (AD) are firstly discussed. Then, the performance of our proposed detail information estimation module is tested. Finally, the comprehensive comparison is performed among our scheme and other two classical steganalysis features, i.e., CSR and SPAM. In the experiment, a general Bossbase1.01 database [Filler, Pevny and Bas (2013)] is employed, and the implementation platform is the Intel(R) Core (TM) i7-8750H CPU @ 2.20 GHZ with MATLAB2016b software. The detailed are mentioned as follows.
4.1 The impact of different parameters To measure the impact of different parameters and meanwhile evaluate the performance of our proposed scheme, the detection accuracy (denotes as accR ) is introduced as follows.
accTP TNR
TP TN FP FN+
=+ + +
(9)
where TP is the number of true positives (a stego-image is correctly identified as a stego-image), TN is the number of true negatives (an original-image is correctly recognized as an original-image), FP is the number of false positives (an original-image is incorrectly denoted as a stego-image), and FN is the number of false negatives (a stego-image is incorrectly considered as an original -image).
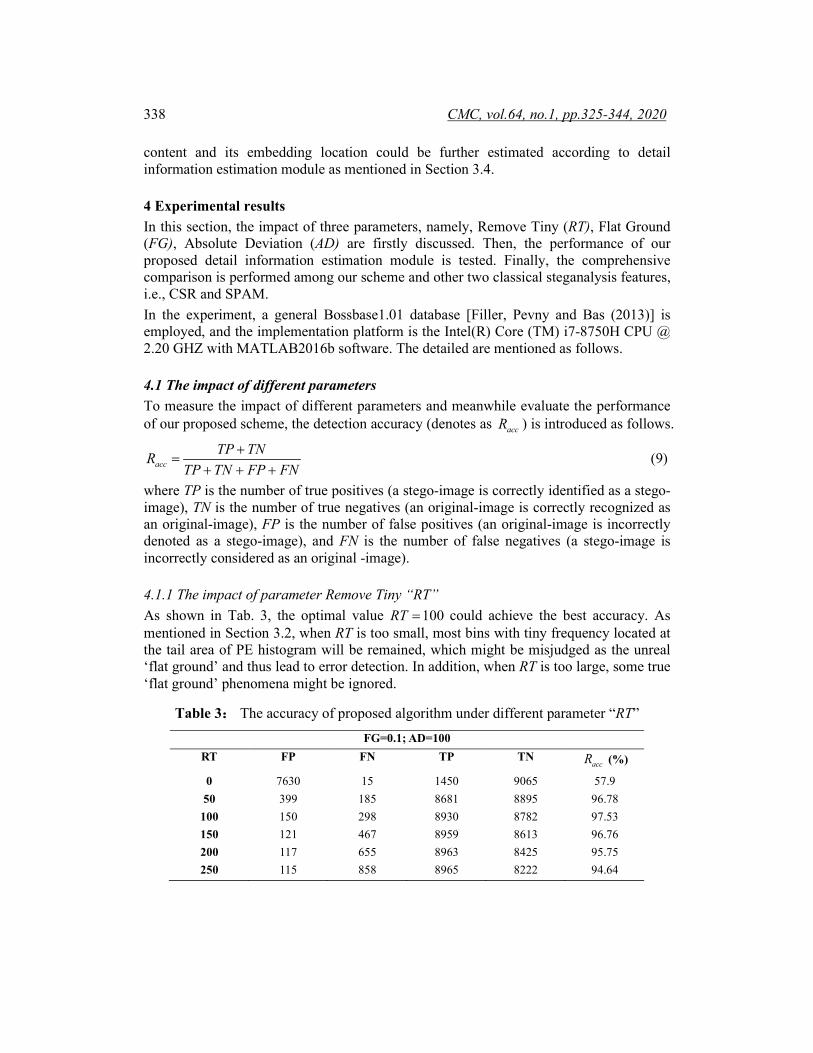
4.1.1 The impact of parameter Remove Tiny “RT” As shown in Tab. 3, the optimal value 100RT = could achieve the best accuracy. As mentioned in Section 3.2, when RT is too small, most bins with tiny frequency located at the tail area of PE histogram will be remained, which might be misjudged as the unreal ‘flat ground’ and thus lead to error detection. In addition, when RT is too large, some true ‘flat ground’ phenomena might be ignored.
Table 3: The accuracy of proposed algorithm under different parameter “RT” FG=0.1; AD=100
RT FP FN TP TN accR (%)
0 7630 15 1450 9065 57.9 50 399 185 8681 8895 96.78
100 150 298 8930 8782 97.53 150 121 467 8959 8613 96.76 200 117 655 8963 8425 95.75 250 115 858 8965 8222 94.64
An Effective Steganalysis Algorithm for Histogram-Shifting 339
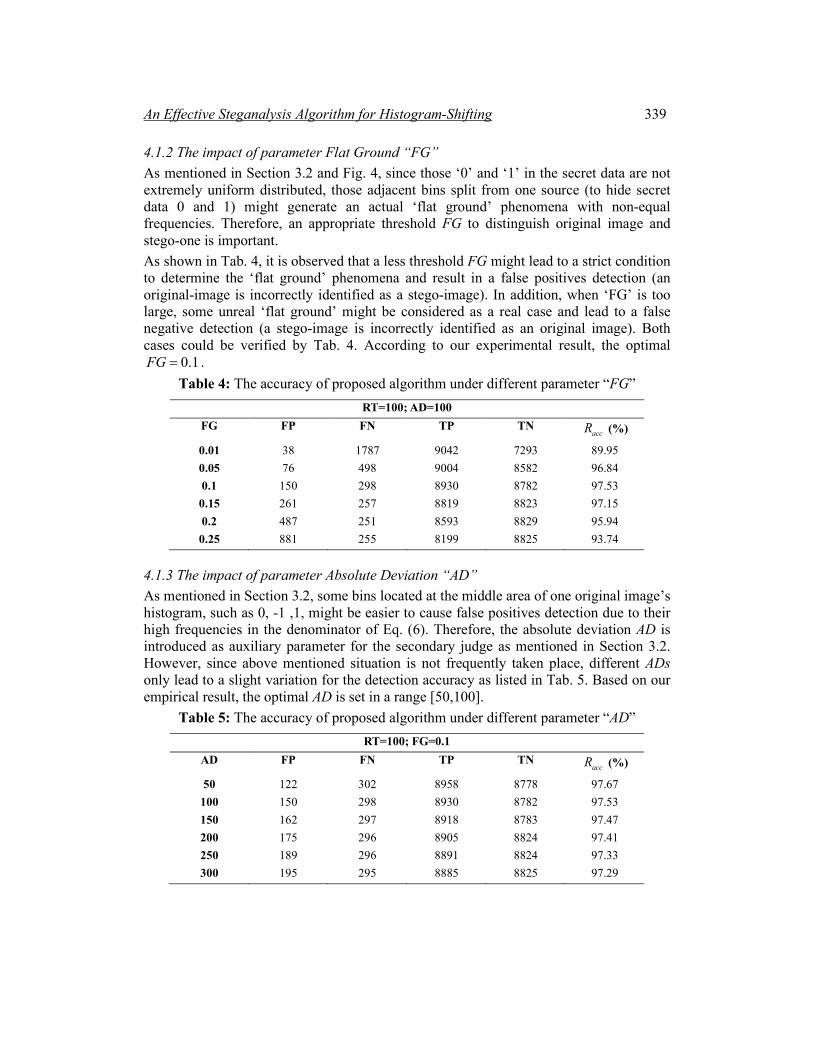
4.1.2 The impact of parameter Flat Ground “FG” As mentioned in Section 3.2 and Fig. 4, since those ‘0’ and ‘1’ in the secret data are not extremely uniform distributed, those adjacent bins split from one source (to hide secret data 0 and 1) might generate an actual ‘flat ground’ phenomena with non-equal frequencies. Therefore, an appropriate threshold FG to distinguish original image and stego-one is important. As shown in Tab. 4, it is observed that a less threshold FG might lead to a strict condition to determine the ‘flat ground’ phenomena and result in a false positives detection (an original-image is incorrectly identified as a stego-image). In addition, when ‘FG’ is too large, some unreal ‘flat ground’ might be considered as a real case and lead to a false negative detection (a stego-image is incorrectly identified as an original image). Both cases could be verified by Tab. 4. According to our experimental result, the optimal
0.1FG = . Table 4: The accuracy of proposed algorithm under different parameter “FG”
RT=100; AD=100 FG FP FN TP TN
accR (%)
0.01 38 1787 9042 7293 89.95 0.05 76 498 9004 8582 96.84 0.1 150 298 8930 8782 97.53 0.15 261 257 8819 8823 97.15 0.2 487 251 8593 8829 95.94 0.25 881 255 8199 8825 93.74
4.1.3 The impact of parameter Absolute Deviation “AD” As mentioned in Section 3.2, some bins located at the middle area of one original image’s histogram, such as 0, -1 ,1, might be easier to cause false positives detection due to their high frequencies in the denominator of Eq. (6). Therefore, the absolute deviation AD is introduced as auxiliary parameter for the secondary judge as mentioned in Section 3.2. However, since above mentioned situation is not frequently taken place, different ADs only lead to a slight variation for the detection accuracy as listed in Tab. 5. Based on our empirical result, the optimal AD is set in a range [50,100].
Table 5: The accuracy of proposed algorithm under different parameter “AD” RT=100; FG=0.1
AD FP FN TP TN accR (%)
50 122 302 8958 8778 97.67 100 150 298 8930 8782 97.53 150 162 297 8918 8783 97.47 200 175 296 8905 8824 97.41 250 189 296 8891 8824 97.33 300 195 295 8885 8825 97.29
340 CMC, vol.64, no.1, pp.325-344, 2020
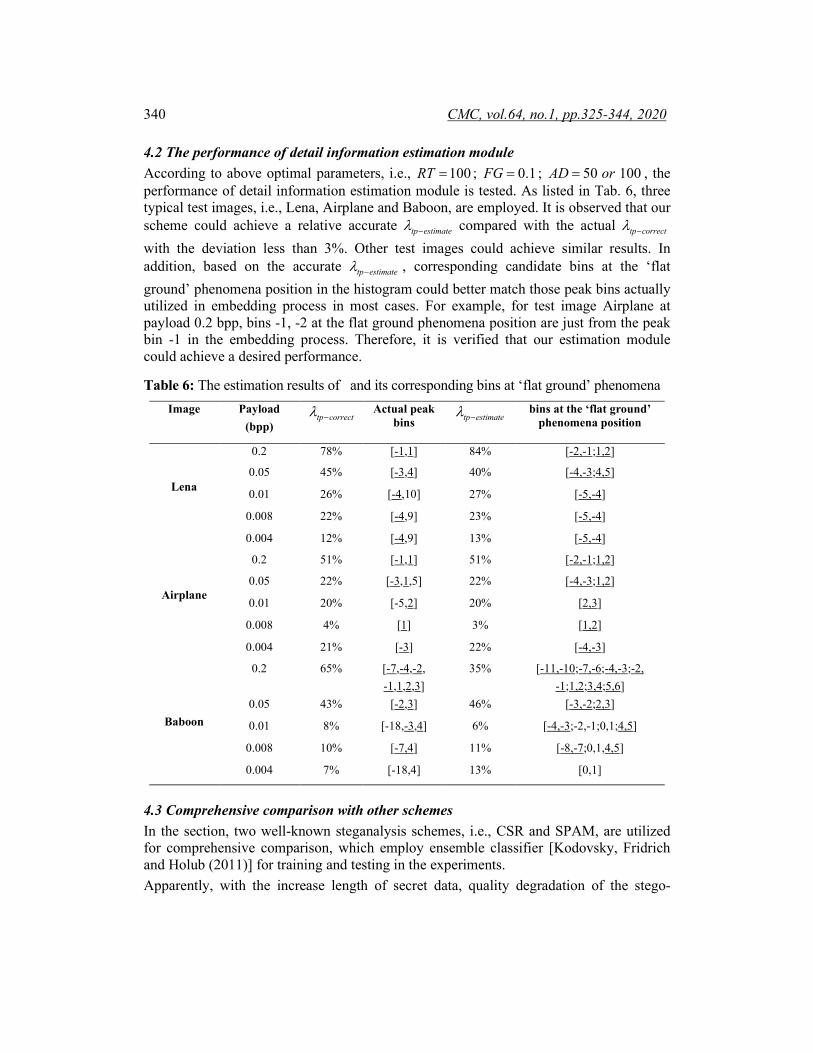
4.2 The performance of detail information estimation module According to above optimal parameters, i.e., 100RT = ; 0.1FG = ; 50 100AD or= , the performance of detail information estimation module is tested. As listed in Tab. 6, three typical test images, i.e., Lena, Airplane and Baboon, are employed. It is observed that our scheme could achieve a relative accurate tp estimateλ − compared with the actual tp correctλ − with the deviation less than 3%. Other test images could achieve similar results. In addition, based on the accurate tp estimateλ − , corresponding candidate bins at the ‘flat ground’ phenomena position in the histogram could better match those peak bins actually utilized in embedding process in most cases. For example, for test image Airplane at payload 0.2 bpp, bins -1, -2 at the flat ground phenomena position are just from the peak bin -1 in the embedding process. Therefore, it is verified that our estimation module could achieve a desired performance.
Table 6: The estimation results of and its corresponding bins at ‘flat ground’ phenomena Image Payload
(bpp) tp correctλ −
Actual peak bins tp estimateλ − bins at the ‘flat ground’
phenomena position
Lena
0.2 78% [-1,1] 84% [-2,-1;1,2]
0.05 45% [-3,4] 40% [-4,-3;4,5]
0.01 26% [-4,10] 27% [-5,-4]
0.008 22% [-4,9] 23% [-5,-4]
0.004 12% [-4,9] 13% [-5,-4]
Airplane
0.2 51% [-1,1] 51% [-2,-1;1,2]
0.05 22% [-3,1,5] 22% [-4,-3;1,2]
0.01 20% [-5,2] 20% [2,3]
0.008 4% [1] 3% [1,2]
0.004 21% [-3] 22% [-4,-3]
Baboon
0.2 65% [-7,-4,-2, -1,1,2,3]
35% [-11,-10;-7,-6;-4,-3;-2, -1;1,2;3,4;5,6]
0.05 43% [-2,3] 46% [-3,-2;2,3]
0.01 8% [-18,-3,4] 6% [-4,-3;-2,-1;0,1;4,5]
0.008 10% [-7,4] 11% [-8,-7;0,1,4,5]
0.004 7% [-18,4] 13% [0,1]
4.3 Comprehensive comparison with other schemes In the section, two well-known steganalysis schemes, i.e., CSR and SPAM, are utilized for comprehensive comparison, which employ ensemble classifier [Kodovsky, Fridrich and Holub (2011)] for training and testing in the experiments. Apparently, with the increase length of secret data, quality degradation of the stego-
An Effective Steganalysis Algorithm for Histogram-Shifting 341
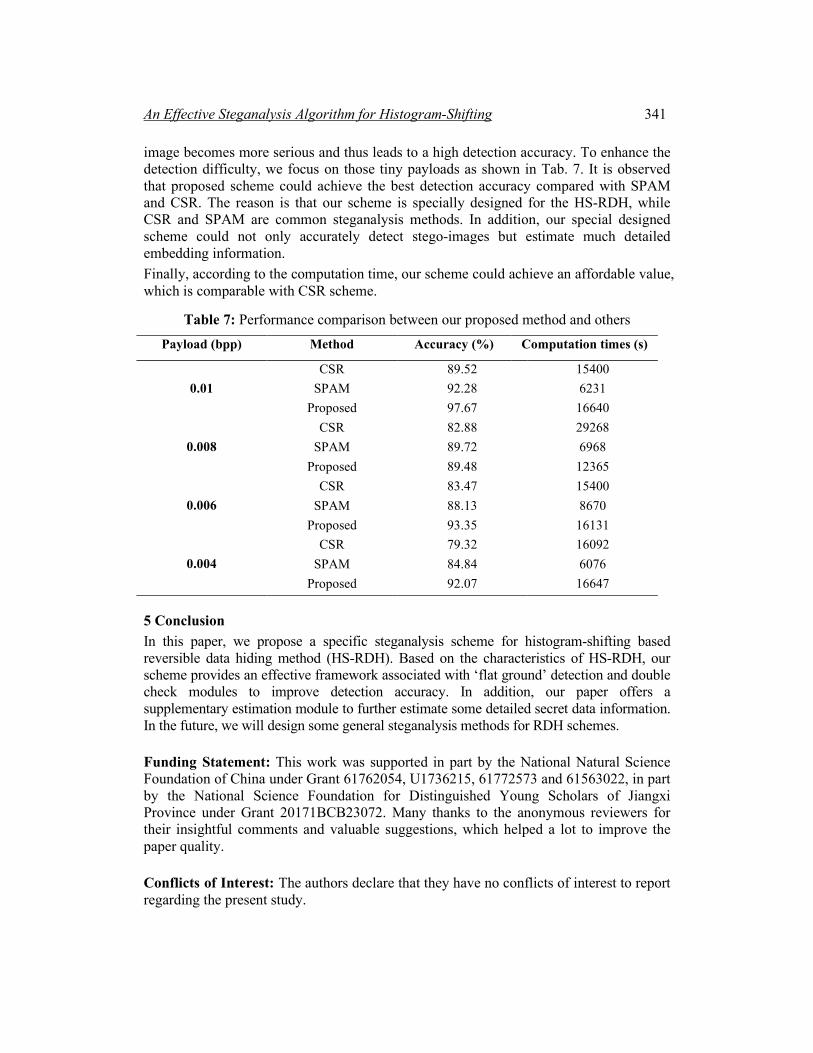
image becomes more serious and thus leads to a high detection accuracy. To enhance the detection difficulty, we focus on those tiny payloads as shown in Tab. 7. It is observed that proposed scheme could achieve the best detection accuracy compared with SPAM and CSR. The reason is that our scheme is specially designed for the HS-RDH, while CSR and SPAM are common steganalysis methods. In addition, our special designed scheme could not only accurately detect stego-images but estimate much detailed embedding information. Finally, according to the computation time, our scheme could achieve an affordable value, which is comparable with CSR scheme.
Table 7: Performance comparison between our proposed method and others Payload (bpp) Method Accuracy (%) Computation times (s)
0.01
CSR 89.52 15400 SPAM 92.28 6231
Proposed 97.67 16640
0.008
CSR 82.88 29268 SPAM 89.72 6968
Proposed 89.48 12365
0.006
CSR 83.47 15400 SPAM 88.13 8670
Proposed 93.35 16131
0.004 CSR 79.32 16092
SPAM 84.84 6076 Proposed 92.07 16647
5 Conclusion In this paper, we propose a specific steganalysis scheme for histogram-shifting based reversible data hiding method (HS-RDH). Based on the characteristics of HS-RDH, our scheme provides an effective framework associated with ‘flat ground’ detection and double check modules to improve detection accuracy. In addition, our paper offers a supplementary estimation module to further estimate some detailed secret data information. In the future, we will design some general steganalysis methods for RDH schemes.
Funding Statement: This work was supported in part by the National Natural Science Foundation of China under Grant 61762054, U1736215, 61772573 and 61563022, in part by the National Science Foundation for Distinguished Young Scholars of Jiangxi Province under Grant 20171BCB23072. Many thanks to the anonymous reviewers for their insightful comments and valuable suggestions, which helped a lot to improve the paper quality.
Conflicts of Interest: The authors declare that they have no conflicts of interest to report regarding the present study.
342 CMC, vol.64, no.1, pp.325-344, 2020
References Barni, M.; Bartolini, F.; Cox, I. J.; Hernandez, J.; Perez-Gonzalez, F. (2001): Digital watermarking for copyright protection: a communications perspective. IEEE Communications Magazine, vol. 39, no. 8, pp. 90-91. Celik, M. U.; Sharma, G.; Tekalp, A. M.; Saber, E. (2005): Lossless generalized-LSB data embedding. IEEE Transactions on Image Processing, vol. 14, no. 2, pp. 253-266. Coatrieux, G.; Pan, W.; Cuppens-Boulahia, N.; Cuppens, F.; Roux, C. (2013): Reversible watermarking based on invariant image classification and dynamic histogram shifting. IEEE Transactions on Information Forensics and Security, vol. 8, no. 1, pp. 111-120. Coltuc, D. (2011): Improved embedding for prediction-based reversible watermarking. IEEE Transactions on Information Forensics and Security, vol. 6, no. 3, pp. 873-882. Dragoi, C.; Coltuc, D. (2015): On local prediction based reversible watermarking. IEEE Transactions on Image Processing, vol. 24, no. 4, pp. 1244-1246. Dumitrescu, S.; Wu, X. L.; Wang, Z. (2002): Detection of LSB steganography via sample pair analysis. The 5th International Workshop on Information Hiding, vol. 2578, pp. 355-372. Fridrich, J.; Goljan, M.; Du, R. (2001): Invertible authentication. Proceedings of SPIE 4314, Security and Watermarking of Multimedia Contents III, pp. 197-208. Fridrich, J.; Goljan, M.; Hogea, D.; Soukal, D. (2003): Quantitative steganalysis of digital images: estimating the secret message length. Multimedia System, vol. 9, no. 3, pp. 288-302. Fridrich, J.; Goljan, M. (2004): On estimation of secret message length in LSB steganography in spatial domain in the FGIE security. Steganography and Watermarking of Multimedia Contents VI, vol. 5306, pp. 23-34. Fridrich, J.; Kodovsk, J. (2012): Rich models for steganalysis of digital images. IEEE Transactions on Information Forensics and Security, vol. 7, no. 3, pp. 868-882. Fallahpour, M. (2008): Reversible image data hiding based on gradient adjusted prediction. IEICE Electronics Express, vol. 5, no. 20, pp. 870-876. Filler, T.; Pevny, T.; Bas, P. (2013): BOSS (Break Our Steganography System). http://www.agents.cz/boss. Gao, X.; An, L.; Yuan, Y.; Tao, D.; Li, X. (2011): Lossless data embedding using generalized statistical quantity histogram. IEEE Transactions on Circuits and Systems for Video Technology, vol. 21, no. 8, pp. 1061-1070. Hwang, H. J.; Kim, H. J.; Sachnev, V.; Joo, S. H. (2010): Reversible watermarking method using optimal histogram pair shifting based on prediction and sorting. KSII Transactions on Internet and Information Systems, vol. 4, no. 4, pp. 655-670. Hong, W.; Chen, T. S.; Chen, J. (2015): Reversible data hiding using Delaunay triangulation and selective embedment. Information Science, vol. 308, pp. 140-154. Kodovsky, J.; Fridrich, J.; Holub, V. (2011): Ensemble classifiers for steganalysis of digital media. IEEE Transactions on Information Forensics and Security, vol. 7, no. 2, pp. 432-444.
An Effective Steganalysis Algorithm for Histogram-Shifting 343
Li, X. L.; Yang, B.; Zeng, T. Y. (2011): Efficient reversible watermarking based on adaptive prediction-error expansion and pixel selection. IEEE Transactions on Image Processing, vol. 20, no. 12, pp. 3524-3533. Li, X.; Li, B.; Yang, B.; Zeng, T. (2013): General framework to histogram shifting-based reversible data hiding. IEEE Transactions on Image Processing, vol. 22, no. 6, pp. 2181-2191. Lou, D.; Hu, C.; Chou, C. L.; Chiu, C. C. (2011): Steganalysis of HMPD reversible data hiding scheme. Optics Communications, vol. 284, no. 23, pp. 5406-5414. Lou, D. C.; Chou, C. L.; Wei, H. Y.; Huang, H. F. (2013): Active steganalysis for interpolation-error based reversible data hiding. Pattern Recognition Letters, vol. 34, no. 9, pp. 1032-1036. Luo, L.; Chen, Z.; Chen, M.; Zeng, X.; Xiong, Z. (2009): Reversible image watermarking using interpolation technique. IEEE Transactions on Information Forensics and Security, vol. 5, no. 1, pp. 187-193. Ma, X.; Pan, Z.; Hu, S.; Wang, L. (2015): High-fidelity reversible data hiding scheme based on multi-predictor sorting and selecting mechanism. Journal of Visual Communication and Image Representation, vol. 28, pp. 71-82. Ni, Z.; Shi, Y. Q.; Ansari, N.; Su, W. (2006): Reversible data hiding. IEEE Transactions on Circuits and Systems for Video Technology, vol. 16, no. 3, pp. 354-362. Ou, B.; Li, X. L.; Zhao, Y.; Ni, R. R.; Shi, Y. Q. (2013): Pair-wise prediction error expansion for efficient reversible data hiding. IEEE Transactions on Image Processing, vol. 22, no. 12, pp. 5010-5021. Pevny, T.; Bas, P.; Fridrich, J. (2010): Steganalysis by subtractive pixel adjacency matrix. IEEE Transactions on Information Forensics and Security, vol. 5, no. 2, pp. 215-224. Sachnev, V.; Kim, H. J.; Nam, J.; Suresh, S.; Shi, Y. Q. (2009): Reversible watermarking algorithm using sorting and prediction. IEEE Transactions on Circuits and Systems for Video Technology, vol. 19, no. 7, pp. 989-999. Shi, Y. Q.; Li, X.; Zhang, X.; Wu, H. T.; Ma, B. (2016): Reversible data hiding: advances in the past two decades. IEEE Access, vol. 4, pp. 3210-3237. Thodi, D. M.; Rodriguez, J. J. (2007): Expansion embedding techniques for reversible watermarking. IEEE Transactions on Image Processing, vol. 16, no. 3, pp. 721-730. Tian, H.; Zhao, Y.; Ni, R.; Qin, L.; Li, X. (2013): LDFT-based watermarking resilient to local desynchronization attacks. IEEE Transactions on Cybernetics, vol. 43, no. 6, pp. 2190-2201. Tian, J. (2003): Reversible watermarking using a difference expansion. IEEE Transaction on Circuits and Systems for Video Technology, vol. 13, no. 8, pp. 890-896. Tai, W. L.; Yeh, C. M.; Chang, C. C. (2009): Reversible data hiding based on histogram modification of pixel differences. IEEE Transactions on Circuits and Systems for Video Technology, vol. 19, no. 6, pp. 906-910. Westfeld, A.; Pfitzmann, A. (1999): Attacks on steganographic systems. Pfitzmann, A. (eds.) Information Hiding. IH. Lecture Notes in Computer Science, vol. 1768, pp. 61-76.
344 CMC, vol.64, no.1, pp.325-344, 2020
Wang, B. W.; Kong, W. W.; Li, W.; Xiong, N. N. (2019): A dual-chaining watermark scheme for data integrity protection in internet of things. Computers, Materials & Continua, vol. 58, no. 3, pp. 679-695. Wu, H. T.; Huang, J. (2012): Reversible image watermarking on prediction errors by efficient histogram modification. Signal Process, vol. 92, no. 12, pp. 3000-3009. Wang, J. X.; Ni, J. Q.; Zhang, X. (2016): Efficient HS based reversible data hiding using multi-feature complexity measure and optimized histogram. Proceedings of the 4th ACM Workshop on Information Hiding and Multimedia Security, pp. 29-38. Wang, J.; Ni, J.; Zhang, X.; Shi, Y. (2017): Rate and distortion optimization for reversible data hiding using multiple histogram shifting. IEEE Transactions on Cybernetics, vol. 47, no. 2, pp. 315-326. Wu, Y. T.; Shih, F. Y. (2006): Genetic algorithm based methodology for breaking the steganalytic systems. IEEE Transactions on Systems, Man, and Cybernetics, Part B, vol. 36, no. 1, pp. 24-31. Xuan, G. R.; Shi, Y. Q.; Chai, P.; Cui, X.; Ni, Z. et al. (2009): Optimum histogram pair based image lossless data embedding. Transactions on Data Hiding and Multimedia Security IV. Lecture Notes in Computer Science, vol. 5510, pp. 84-102. Xuan, G.; Tong, X.; Teng, J.; Zhang, X.; Shi, Y. Q. (2012): Optimal histogram pair and prediction-error based image reversible data hiding. The International Workshop on Digital Forensics and Watermarking. IWDW. Lecture Notes in Computer Science, vol. 7809, pp. 368-383. Xiao, D.; Liang, J.; Ma, Q. Q.; Xiang, Y. P.; Zhang, Y. S. (2019): High capacity data hiding in encrypted image based on compressive sensing for nonequivalent resources. Computers, Materials & Continua, vol. 58, no. 1, pp. 1-13.
Related Documents