Ecuity Consulting LLP October 2015 An alternative Solar Feed in Tariff Scenario for the UK Abstract: • Ecuity Consulting LLP (Ecuity) is a firm of energy sector specialists with a track record in analysing and influencing energy policy to deliver successful outcomes. Ecuity’s mission is to make sustainable energy mainstream by using our unique strategic insight to connect the commercial day to day reality of running a business and the political challenges of sustainable energy policy making. • In response to the growing public and political interest in the proposals set out in the 2015 Feed in Tariff consultation, and also due to demand from Ecuity’s client base, Ecuity’s analytical team have sought to replicate the Department for Energy and Climate Change’s Economic Impact Assessment model and prepare an alternative scenario for the UK Feed in Tariff. • This paper sets out the results of our analysis and presents a scenario which we believe many in the solar industry would approve as it provides a costed plan to deliver a workable volume of deployment at a price which might be affordable. Prepared by Ecuity Consulting LLP (“Ecuity”) registered in England and Wales No. OC373224

Welcome message from author
This document is posted to help you gain knowledge. Please leave a comment to let me know what you think about it! Share it to your friends and learn new things together.
Transcript
Ecuity Consulting LLP October 2015
An alternative Solar Feed in Tariff Scenario for the UK
Abstract: • Ecuity Consulting LLP (Ecuity) is a firm of energy sector specialists with a track record in analysing
and influencing energy policy to deliver successful outcomes. Ecuity’s mission is to make sustainable energy mainstream by using our unique strategic insight to connect the commercial day to day reality of running a business and the political challenges of sustainable energy policy making.
• In response to the growing public and political interest in the proposals set out in the 2015 Feed in Tariff consultation, and also due to demand from Ecuity’s client base, Ecuity’s analytical team have sought to replicate the Department for Energy and Climate Change’s Economic Impact Assessment model and prepare an alternative scenario for the UK Feed in Tariff.
• This paper sets out the results of our analysis and presents a scenario which we believe many in the solar industry would approve as it provides a costed plan to deliver a workable volume of deployment at a price which might be affordable.
Prepared by Ecuity Consulting LLP (“Ecuity”) registered in England and Wales No. OC373224
Confidential Solar PV Scenario Paper October 2015
2
Disclaimer Nothing in this document constitutes a valuation or legal advice. Any party that chooses to rely on this Report (or any part of it) does so at its own risk. To the fullest extent permitted by law, Ecuity Consulting LLP does not assume any responsibility and will not accept any liability, including any liability arising from fault or negligence, for any loss arising from the use of this document or its contents or otherwise in connection with it to any party. In preparing the Report, the primary source has been publically available information. Details of principal sources are set out within the document and we have satisfied ourselves, so far as possible, that the information presented in the Report is consistent with other information which was made available to us by Ecuity clients in the course of our work. Our work was completed on 20th October 2015 and we have not undertaken to update the document for events or circumstances arising after that date.
Contents: Introduction………………………………………………….. Pg 1 Summary Analysis………………………………………….. Pg 1 Section 1 – Solar PV System Performance Assumptions Pg 8 Section 2 – Proposed Tariffs and Cost Roadmap……… Pg 13 Section 3 – Feed in Tariff Budget Outcomes……………. Pg 17 Section 4 – Costs and Benefits…………………………… Pg 20 Conclusions…………………………………………………. Pg 23 Contacts……………………………………………………… Pg 24
Confidential Solar PV Scenario Paper October 2015
3
Executive Summary • In August 2015, the Department for Energy and Climate Change published a consultation
on the UK Feed in Tariff. The declared purpose of the consultation is to propose means of controlling costs under the Feed-in Tariff. Measures proposed include significantly revised tariffs based on updated technology cost data, a more stringent degression mechanism and deployment caps. Taken together, these measures would result in phased closure of the scheme in 2018-19.
• The solar industry claims that sustaining support needn’t break the bank and that c£100m is required to fund a sustainable solar industry in 2018/19. In order to test this hypothesis Ecuity Consulting LLP prepared an economic model which replicates DECC’s approach to calculating the costs of the Feed in Tariff scheme. Alongside sharing results directly with industry and policymakers, this paper provides a public summary of our findings.
• According to the Solar Trade Association, British Photovoltaic Association and many others we have spoken to in the past few weeks, the solar market also requires a return to the stability it was benefitting from prior to the current consultation on feed in tariffs. With this stability the solar industry claims it can achieve grid parity within 3-5 years, locking in a permanent cost reduction for the UK energy system.
• To test the validity of some of these claims and to support industry responses to the consultation this paper sets out the results of an alternative budget scenario which includes higher tariffs and a market size that many deem necessary to sustain the solar industry whilst keeping spending to sensible limits.
• The Ecuity Scenario replicates as closely as possible, DECC’s own analysis of scheme
costs and is explained in detail on the following pages. The outputs can however be summarised as follows:
a) Workable generation tariffs can be set based on updated assumptions for system
size bands from residential up to 500kW commercial accompanied by a degression pathway for reducing tariffs as costs fall.
b) Our suggested tariffs, alongside a workable market size of 1GW per annum can be delivered for a budgetary cost which amounts to just £1.20 on the typical consumer bill in 2018/19 yet delivers a market, sufficient to support the industry to grid parity by 2020.
c) The net benefit to the economy from this investment into the achievement of grid parity is estimated at over £3 billion, equivalent to a discounted value of £126 for every household in the UK1.
d) Hinckley Point C is not expected to start generating electricity before 2025 and will cost £199 for every tonne of CO2 saved. In contrast, Solar PV will deliver increasingly cost-effective CO2 abatement with new installations costing just £12 per tonne of CO2 saved by 2020.
1 Net resource cost of -£3.336bn – based on assessment of costs and benefits associated with Solar PV systems installed between 2016 and 2030
Confidential Solar PV Scenario Paper October 2015
4
Summary of Analysis
• Following publication of the Feed in Tariff Consultation proposals the industry reaction was fairly uniform in its assertion that the tariffs proposed by DECC for solar PV will not allow a sufficient return on investment to encourage ongoing consumer appetite. It was therefore clear that our first step should be to evaluate the assumptions affecting the financial return on individual systems included within the consultation proposals.
• The Ecuity team systematically reviewed the assumptions informing the tariff proposals for individual tariff bands and prepared a revised set of performance assumptions. Our key conclusions were as follows: • The consultation assumes a level of irradiation only achievable in the very far south of
the UK in ideal conditions. • It assumes no loss of availability for maintenance or performance degradation over
time. • Most electricity bills include a fixed standing charge, yet DECC’s consultants
included this charge as variable in their estimate of potential savings.
• The industry has also argued strongly that a 4% IRR for reference installations would not deliver sufficient consumer appetite in either the domestic or commercial market. Ecuity chose to model tariffs that deliver a 6% IRR in the reference case as a minimum required investment return.
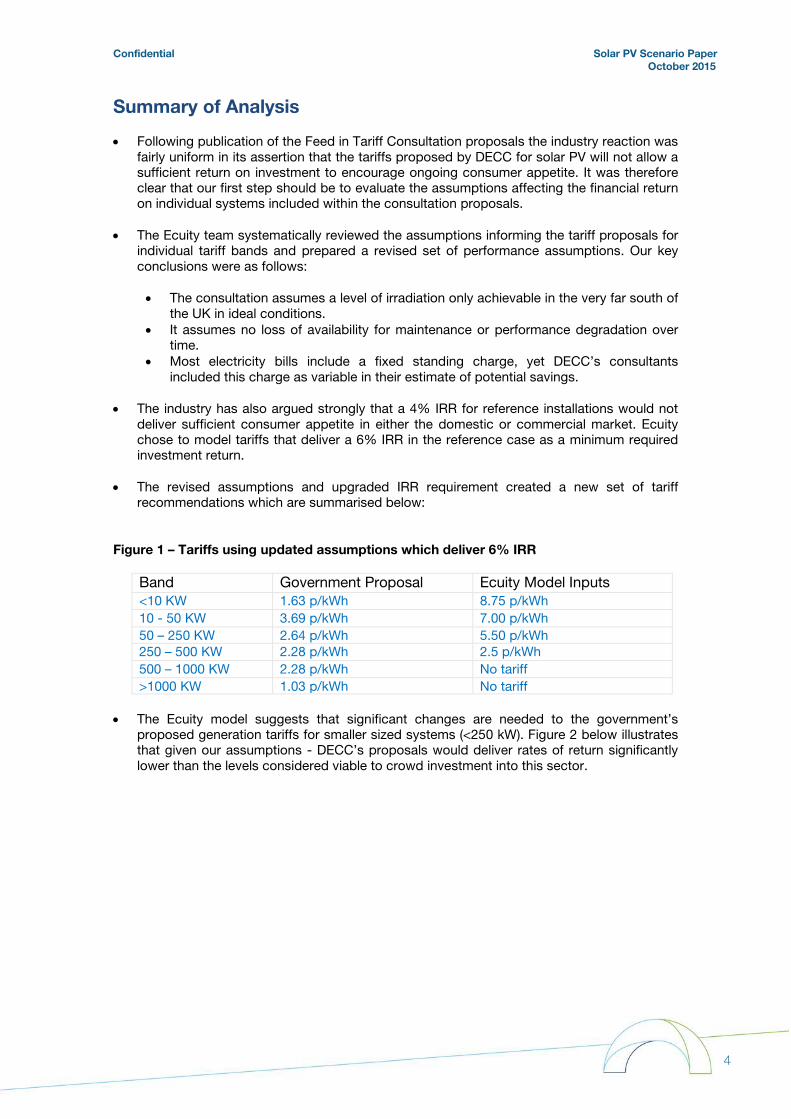
• The revised assumptions and upgraded IRR requirement created a new set of tariff recommendations which are summarised below:
Figure 1 – Tariffs using updated assumptions which deliver 6% IRR Band Government Proposal Ecuity Model Inputs <10 KW 1.63 p/kWh 8.75 p/kWh 10 - 50 KW 3.69 p/kWh 7.00 p/kWh 50 – 250 KW 2.64 p/kWh 5.50 p/kWh 250 – 500 KW 2.28 p/kWh 2.5 p/kWh 500 – 1000 KW 2.28 p/kWh No tariff >1000 KW 1.03 p/kWh No tariff
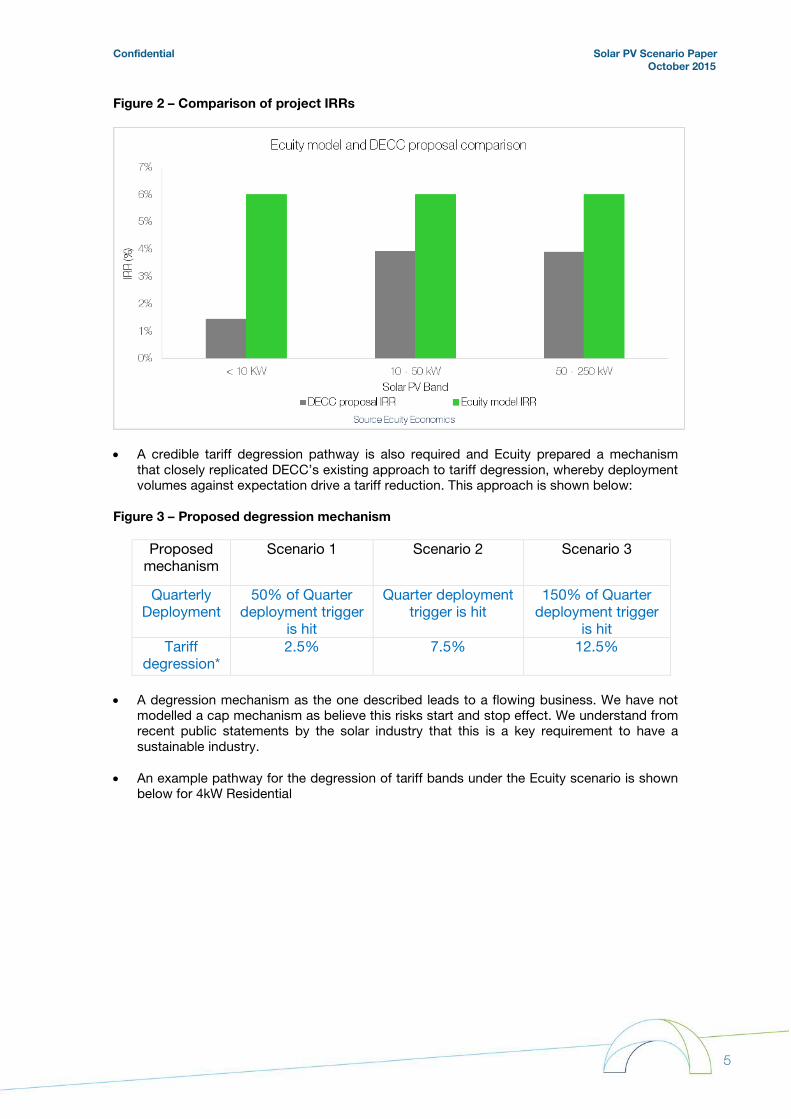
• The Ecuity model suggests that significant changes are needed to the government’s proposed generation tariffs for smaller sized systems (<250 kW). Figure 2 below illustrates that given our assumptions - DECC’s proposals would deliver rates of return significantly lower than the levels considered viable to crowd investment into this sector.
Confidential Solar PV Scenario Paper October 2015
5
Figure 2 – Comparison of project IRRs
• A credible tariff degression pathway is also required and Ecuity prepared a mechanism that closely replicated DECC’s existing approach to tariff degression, whereby deployment volumes against expectation drive a tariff reduction. This approach is shown below:
Figure 3 – Proposed degression mechanism
Proposed mechanism
Scenario 1 Scenario 2 Scenario 3
Quarterly Deployment
50% of Quarter deployment trigger
is hit
Quarter deployment trigger is hit
150% of Quarter deployment trigger
is hit Tariff
degression* 2.5% 7.5% 12.5%
• A degression mechanism as the one described leads to a flowing business. We have not
modelled a cap mechanism as believe this risks start and stop effect. We understand from recent public statements by the solar industry that this is a key requirement to have a sustainable industry.
• An example pathway for the degression of tariff bands under the Ecuity scenario is shown below for 4kW Residential
Confidential Solar PV Scenario Paper October 2015
6
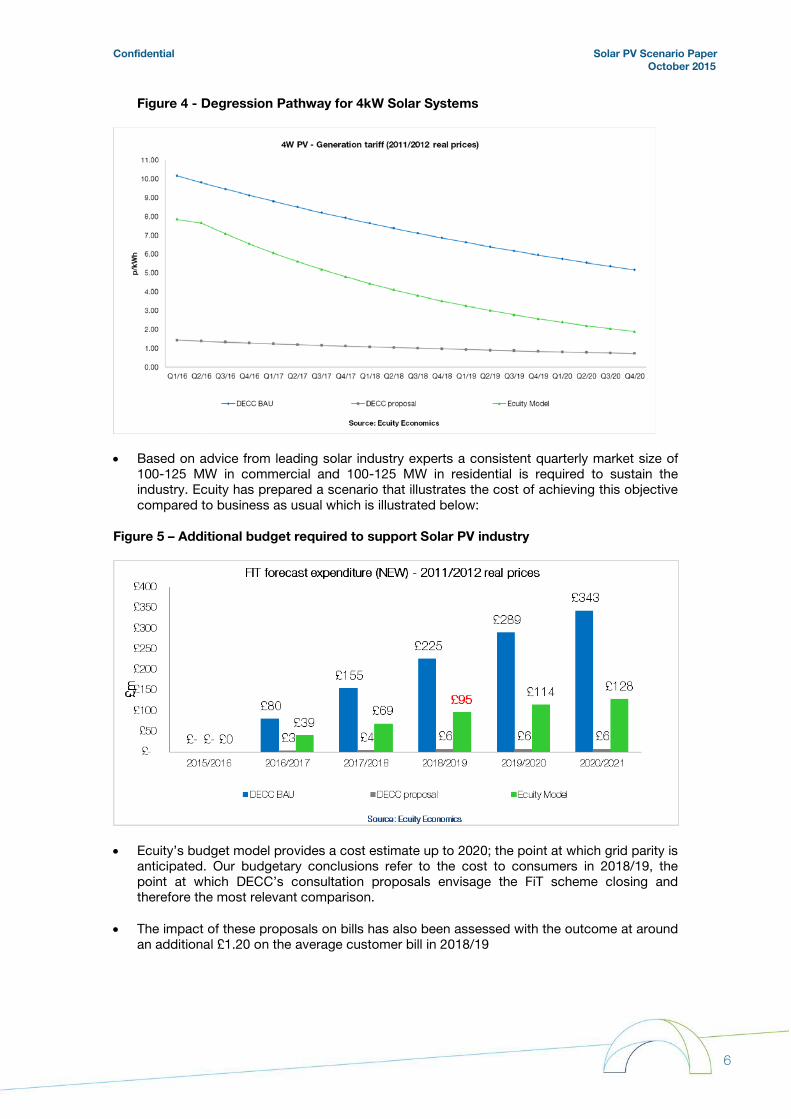
Figure 4 - Degression Pathway for 4kW Solar Systems
• Based on advice from leading solar industry experts a consistent quarterly market size of
100-125 MW in commercial and 100-125 MW in residential is required to sustain the industry. Ecuity has prepared a scenario that illustrates the cost of achieving this objective compared to business as usual which is illustrated below:
Figure 5 – Additional budget required to support Solar PV industry
• Ecuity’s budget model provides a cost estimate up to 2020; the point at which grid parity is
anticipated. Our budgetary conclusions refer to the cost to consumers in 2018/19, the point at which DECC’s consultation proposals envisage the FiT scheme closing and therefore the most relevant comparison.
• The impact of these proposals on bills has also been assessed with the outcome at around an additional £1.20 on the average customer bill in 2018/19
Confidential Solar PV Scenario Paper October 2015
7
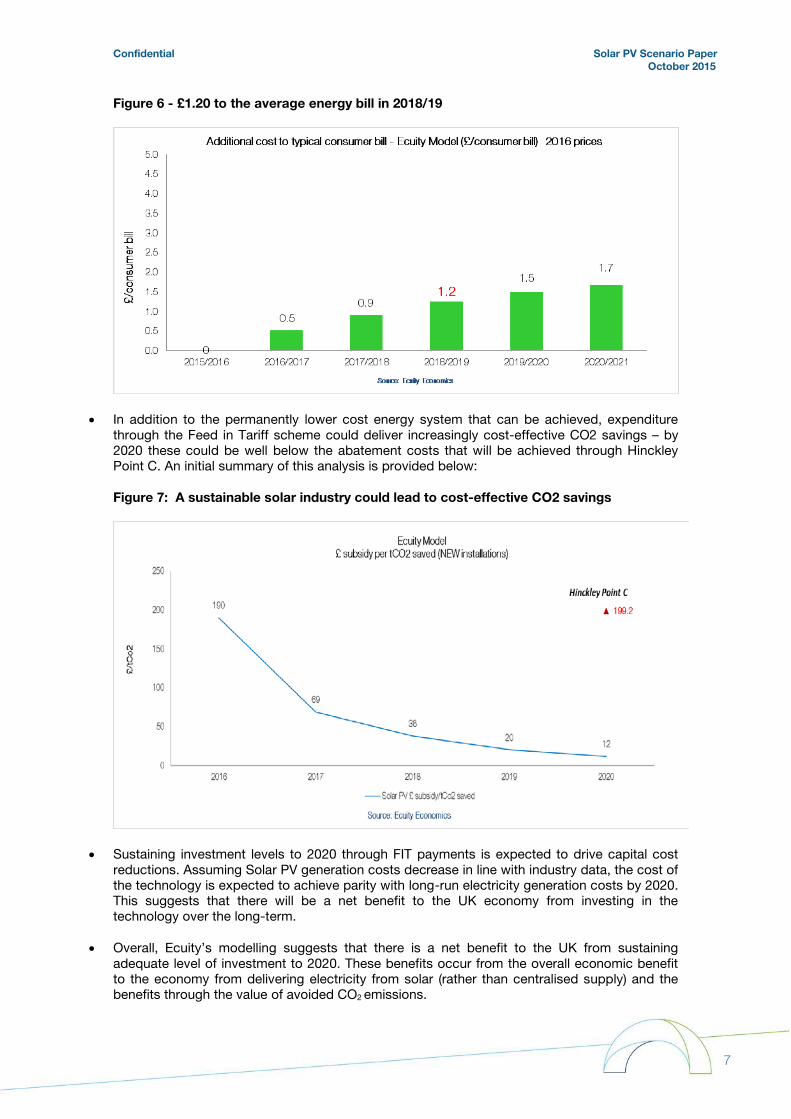
Figure 6 - £1.20 to the average energy bill in 2018/19
• In addition to the permanently lower cost energy system that can be achieved, expenditure through the Feed in Tariff scheme could deliver increasingly cost-effective CO2 savings – by 2020 these could be well below the abatement costs that will be achieved through Hinckley Point C. An initial summary of this analysis is provided below: Figure 7: A sustainable solar industry could lead to cost-effective CO2 savings
• Sustaining investment levels to 2020 through FIT payments is expected to drive capital cost reductions. Assuming Solar PV generation costs decrease in line with industry data, the cost of the technology is expected to achieve parity with long-run electricity generation costs by 2020. This suggests that there will be a net benefit to the UK economy from investing in the technology over the long-term.
• Overall, Ecuity’s modelling suggests that there is a net benefit to the UK from sustaining adequate level of investment to 2020. These benefits occur from the overall economic benefit to the economy from delivering electricity from solar (rather than centralised supply) and the benefits through the value of avoided CO2 emissions.
Confidential Solar PV Scenario Paper October 2015
8
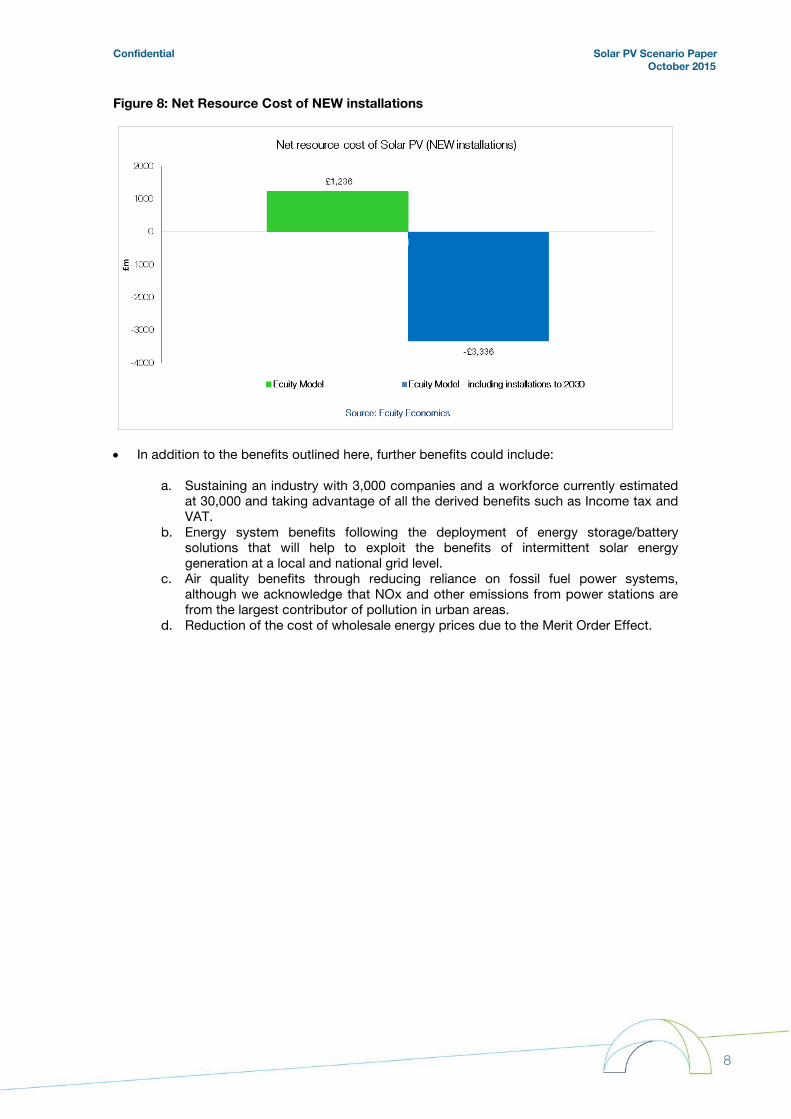
Figure 8: Net Resource Cost of NEW installations
• In addition to the benefits outlined here, further benefits could include:
a. Sustaining an industry with 3,000 companies and a workforce currently estimated at 30,000 and taking advantage of all the derived benefits such as Income tax and VAT.
b. Energy system benefits following the deployment of energy storage/battery solutions that will help to exploit the benefits of intermittent solar energy generation at a local and national grid level.
c. Air quality benefits through reducing reliance on fossil fuel power systems, although we acknowledge that NOx and other emissions from power stations are from the largest contributor of pollution in urban areas.
d. Reduction of the cost of wholesale energy prices due to the Merit Order Effect.
Confidential Solar PV Scenario Paper October 2015
9
Section 1 – Solar PV System Performance Assumptions • DECC’s tariff proposals are based on the desire to achieve a 4% IRR for a typical well
performing system. In order to calculate tariffs accurately, they commissioned consultants Parsons Brinkerhoff (PB) to undertake a review of solar industry costs and benefits to consumers. These assumptions have been shared with industry and subject to some considerable scrutiny.
• Ecuity’s view is that some key assumptions used in the PB report require modification to more accurately reflect the investment case for consumers. Set out below are our thoughts on some of the key assumptions
Load Factor • The load factor is one of the key assumptions informing tariff calibration and having looked
at the data provided by PB we can see that the assumptions have been predominantly based on data from the South of England.
• For consumers to be able to achieve the target IRR proposed it is clear that, amongst other things they have to live on the South Coast of England and have ideal roof conditions (full South and zero shadowing) to ensure that the Irradiance level is sufficient;
• Existing Feed in Tariff registration statistics confirm that the average load factor for the UK (2011/14) stands at 9.8% (equivalent to Sheffield). The proposal assumes a load factor of 11.3% (equivalent to Brighton) in a perfect location (full South 30º with no shading).
• Ecuity has remodelled tariffs using an average load factor based on scheme deployment to date at 9.8%2.
Plant Lifetime • Another key parameter that influences the profitability of a solar PV system is the lifetime
on the technology, and thus the total amount of electricity bill savings that can be made. DECC in the IA document have used a 30 year lifetime – assuming that the owner can expect both bill savings and some export income for that total period.
• Most manufacturers of panels provide product warranties of 10 years and performance warranties of 20 years whilst inverter guarantees rarely go beyond 10 years. As such the predictability of performance is uncertain and with very little evidence available to draw conclusions we conclude that generation will be significantly lower towards the end of a product lifetime than in year 1.
• According to the legislation in place for the Feed in Tariff scheme we understand that the
export tariff is not available after 20 years. According to our analysis, the cost of O&M could exceed the benefit of the additional savings generated from the PV system after year 25. We have therefore modelled a plant life set at 25 years with export and FiT tariffs payable over 20 years. This is a key assumption in our model.
Degradation and availability
• Our understanding is that that the inputs used to model the assumptions have been impacted by issues such as panel degradation or system availability. These can significantly impact the actual system yield which is key to the amount of FiT and export tariff required.
2 Energy Trends: December 2014, special feature article - Feed-in Tariff load factor analysis
Confidential Solar PV Scenario Paper October 2015
10
• Standard degradation figures agreed by 3rd party institutions and used in financing installations are 1% for the first year and 0.5% per year thereafter. Manufacturers provide their own warranted levels of degradation which can be up to 3% in the first year.
• Assumed availability in the IA is 100% over the system lifetime. We understand that the
reality is that for different reasons (maintenance, downtime, grid issues etc) systems are not always functioning;
• The typical value used in industry is 97% availability and we have used this in our modelling of required tariffs.3
Impacts: • We remodelled assumptions concerning:
a. load factor – Ecuity use a UK-based average rather than DECC’s South England
estimate b. system lifetime – 25 years used by Ecuity rather than 30 years by DECC, and c. panel degradation and availability – included by Ecuity, not included by DECC
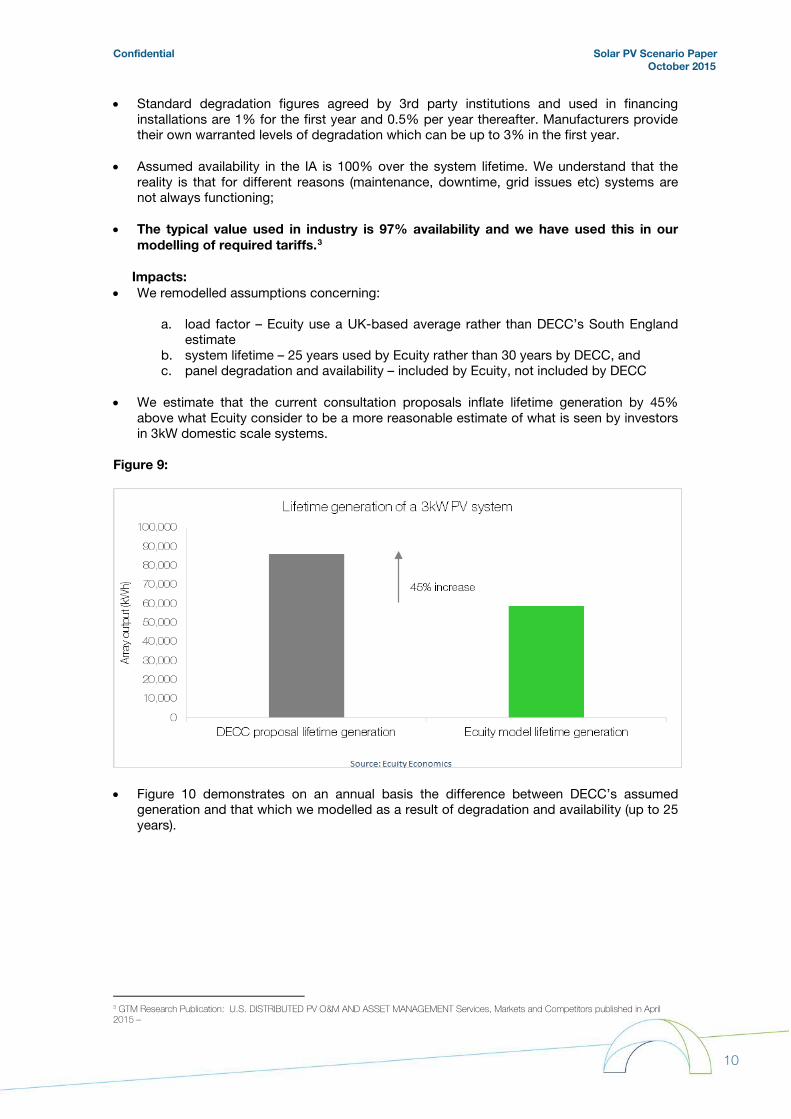
• We estimate that the current consultation proposals inflate lifetime generation by 45%
above what Ecuity consider to be a more reasonable estimate of what is seen by investors in 3kW domestic scale systems.
Figure 9:
• Figure 10 demonstrates on an annual basis the difference between DECC’s assumed
generation and that which we modelled as a result of degradation and availability (up to 25 years).
3 GTM Research Publication: U.S. DISTRIBUTED PV O&M AND ASSET MANAGEMENT Services, Markets and Competitors published in April 2015 –
Confidential Solar PV Scenario Paper October 2015
11
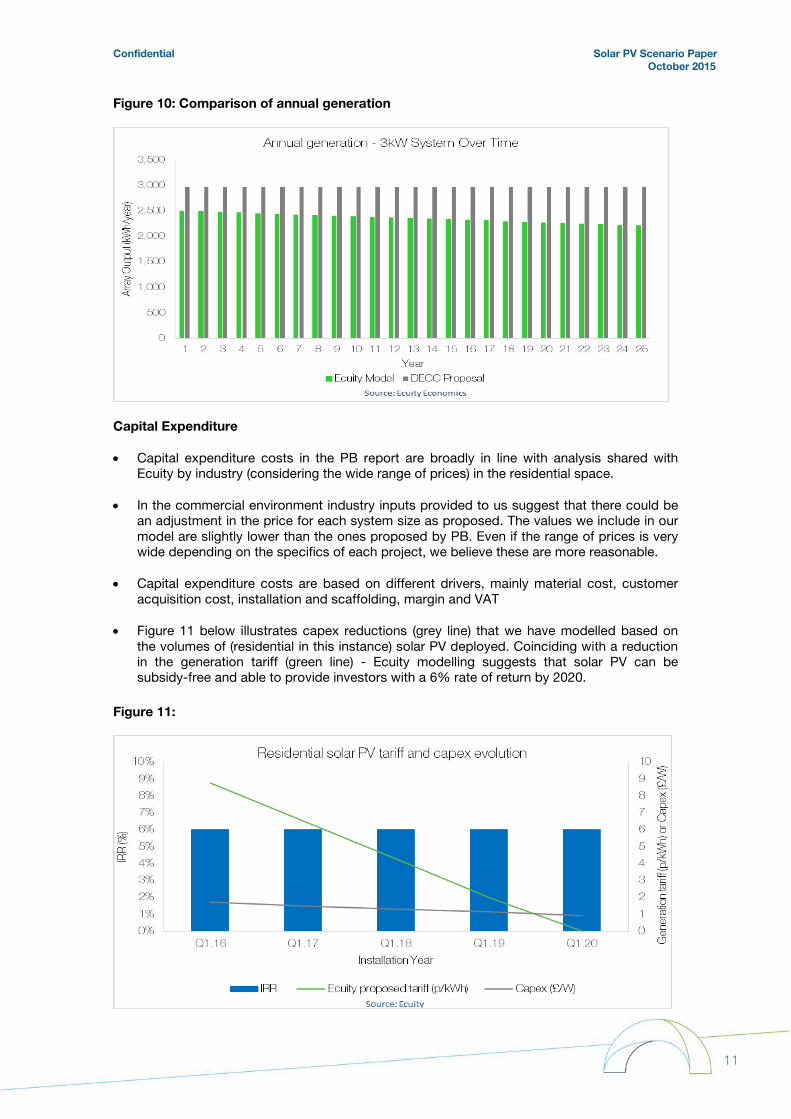
Figure 10: Comparison of annual generation
Capital Expenditure
• Capital expenditure costs in the PB report are broadly in line with analysis shared with Ecuity by industry (considering the wide range of prices) in the residential space.
• In the commercial environment industry inputs provided to us suggest that there could be an adjustment in the price for each system size as proposed. The values we include in our model are slightly lower than the ones proposed by PB. Even if the range of prices is very wide depending on the specifics of each project, we believe these are more reasonable.
• Capital expenditure costs are based on different drivers, mainly material cost, customer acquisition cost, installation and scaffolding, margin and VAT
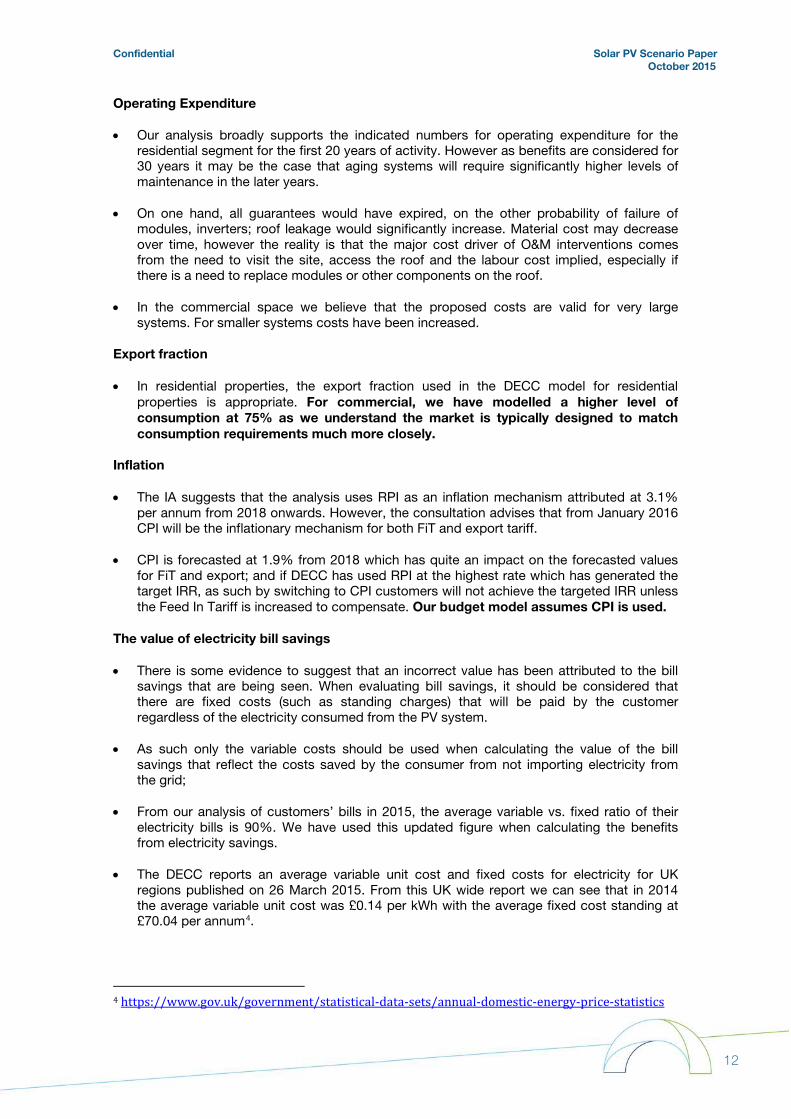
• Figure 11 below illustrates capex reductions (grey line) that we have modelled based on the volumes of (residential in this instance) solar PV deployed. Coinciding with a reduction in the generation tariff (green line) - Ecuity modelling suggests that solar PV can be subsidy-free and able to provide investors with a 6% rate of return by 2020.
Figure 11:
Confidential Solar PV Scenario Paper October 2015
12
Operating Expenditure
• Our analysis broadly supports the indicated numbers for operating expenditure for the residential segment for the first 20 years of activity. However as benefits are considered for 30 years it may be the case that aging systems will require significantly higher levels of maintenance in the later years.
• On one hand, all guarantees would have expired, on the other probability of failure of modules, inverters; roof leakage would significantly increase. Material cost may decrease over time, however the reality is that the major cost driver of O&M interventions comes from the need to visit the site, access the roof and the labour cost implied, especially if there is a need to replace modules or other components on the roof.
• In the commercial space we believe that the proposed costs are valid for very large systems. For smaller systems costs have been increased.
Export fraction • In residential properties, the export fraction used in the DECC model for residential
properties is appropriate. For commercial, we have modelled a higher level of consumption at 75% as we understand the market is typically designed to match consumption requirements much more closely.
Inflation • The IA suggests that the analysis uses RPI as an inflation mechanism attributed at 3.1%
per annum from 2018 onwards. However, the consultation advises that from January 2016 CPI will be the inflationary mechanism for both FiT and export tariff.
• CPI is forecasted at 1.9% from 2018 which has quite an impact on the forecasted values for FiT and export; and if DECC has used RPI at the highest rate which has generated the target IRR, as such by switching to CPI customers will not achieve the targeted IRR unless the Feed In Tariff is increased to compensate. Our budget model assumes CPI is used.
The value of electricity bill savings • There is some evidence to suggest that an incorrect value has been attributed to the bill
savings that are being seen. When evaluating bill savings, it should be considered that there are fixed costs (such as standing charges) that will be paid by the customer regardless of the electricity consumed from the PV system.
• As such only the variable costs should be used when calculating the value of the bill savings that reflect the costs saved by the consumer from not importing electricity from the grid;
• From our analysis of customers’ bills in 2015, the average variable vs. fixed ratio of their electricity bills is 90%. We have used this updated figure when calculating the benefits from electricity savings.
• The DECC reports an average variable unit cost and fixed costs for electricity for UK regions published on 26 March 2015. From this UK wide report we can see that in 2014 the average variable unit cost was £0.14 per kWh with the average fixed cost standing at £70.04 per annum4.
4 https://www.gov.uk/government/statistical-data-sets/annual-domestic-energy-price-statistics
Confidential Solar PV Scenario Paper October 2015
13
• Based on an average house consuming 3,800 kWh per annum this would mean that customers would spend £533 per annum on the variable cost and £70 on the fixed cost. This would result in the fixed element representing 11.6% of the total costs a customer incurs.
• As a result of the above we believe that the value of energy savings per kWh shown in the IA could be over inflated and as have been reduced in our model to reflect more moderate savings that a customer may benefit from.
Hurdle Rates
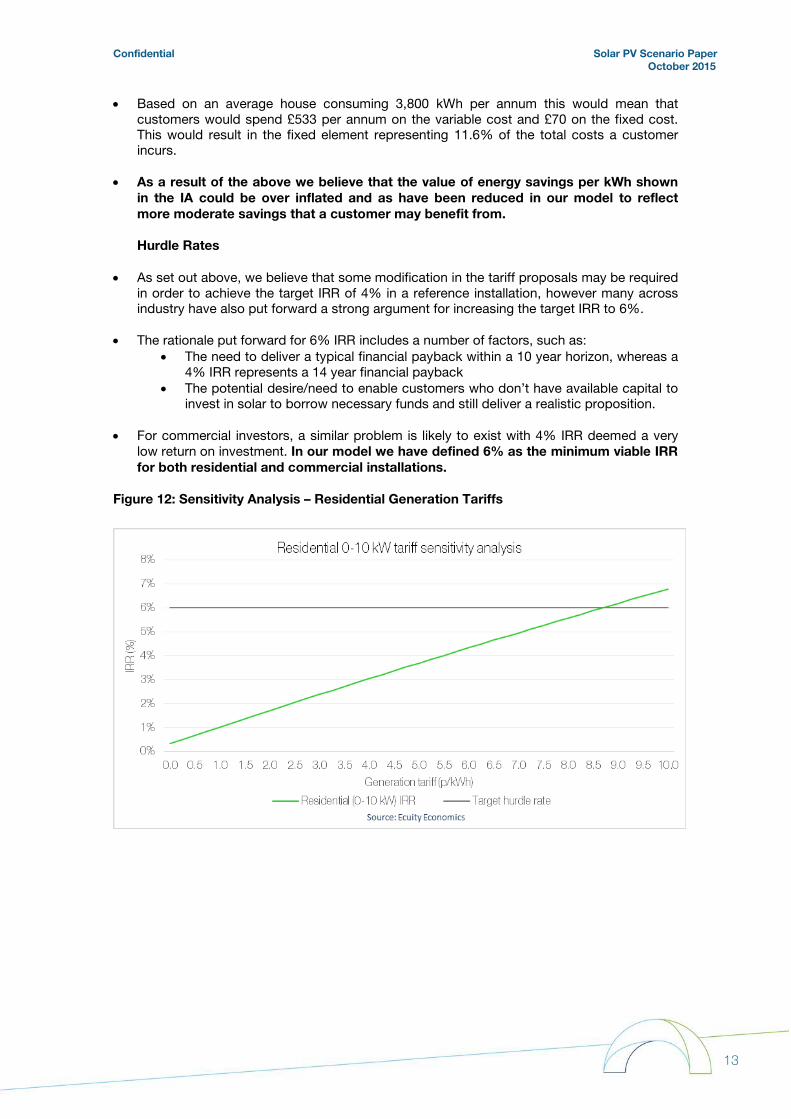
• As set out above, we believe that some modification in the tariff proposals may be required in order to achieve the target IRR of 4% in a reference installation, however many across industry have also put forward a strong argument for increasing the target IRR to 6%.
• The rationale put forward for 6% IRR includes a number of factors, such as: • The need to deliver a typical financial payback within a 10 year horizon, whereas a
4% IRR represents a 14 year financial payback • The potential desire/need to enable customers who don’t have available capital to
invest in solar to borrow necessary funds and still deliver a realistic proposition.
• For commercial investors, a similar problem is likely to exist with 4% IRR deemed a very low return on investment. In our model we have defined 6% as the minimum viable IRR for both residential and commercial installations.
Figure 12: Sensitivity Analysis – Residential Generation Tariffs
Confidential Solar PV Scenario Paper October 2015
14
Section 2 – Proposed Tariffs and Cost Roadmap
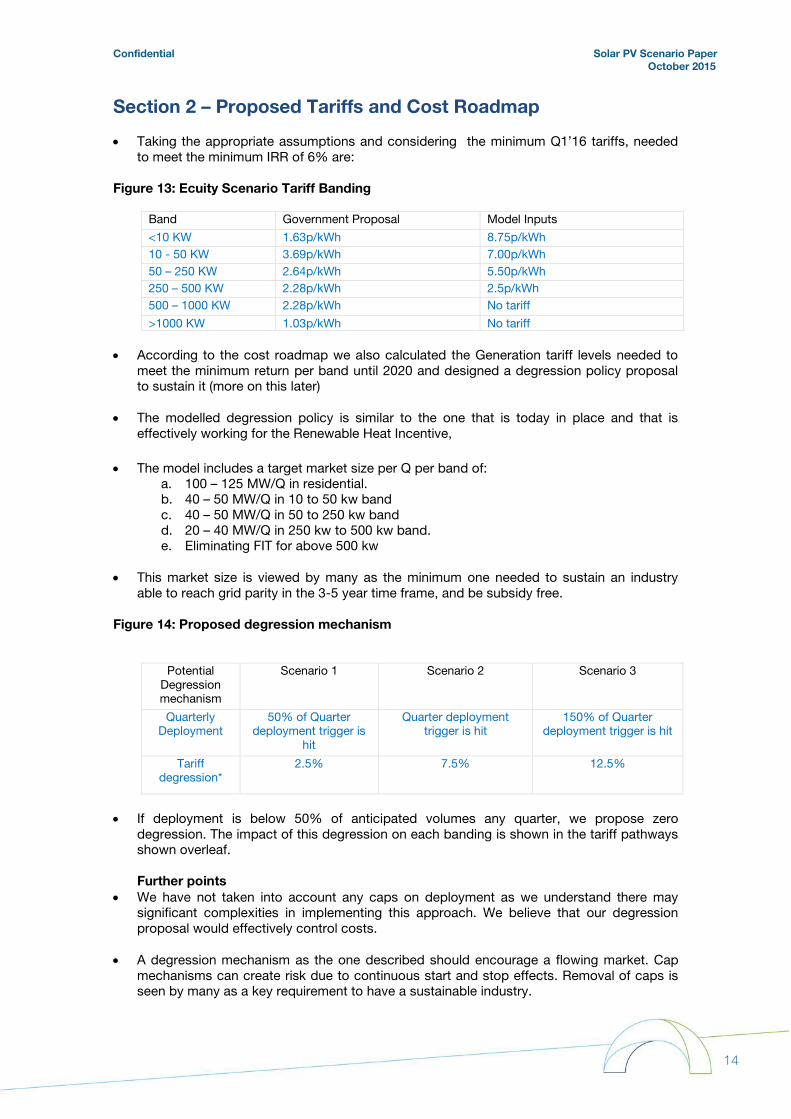
• Taking the appropriate assumptions and considering the minimum Q1’16 tariffs, needed to meet the minimum IRR of 6% are:
Figure 13: Ecuity Scenario Tariff Banding
Band Government Proposal Model Inputs
<10 KW 1.63p/kWh 8.75p/kWh 10 - 50 KW 3.69p/kWh 7.00p/kWh 50 – 250 KW 2.64p/kWh 5.50p/kWh 250 – 500 KW 2.28p/kWh 2.5p/kWh 500 – 1000 KW 2.28p/kWh No tariff
>1000 KW 1.03p/kWh No tariff
• According to the cost roadmap we also calculated the Generation tariff levels needed to meet the minimum return per band until 2020 and designed a degression policy proposal to sustain it (more on this later)
• The modelled degression policy is similar to the one that is today in place and that is effectively working for the Renewable Heat Incentive,
• The model includes a target market size per Q per band of:
a. 100 – 125 MW/Q in residential. b. 40 – 50 MW/Q in 10 to 50 kw band c. 40 – 50 MW/Q in 50 to 250 kw band d. 20 – 40 MW/Q in 250 kw to 500 kw band. e. Eliminating FIT for above 500 kw
• This market size is viewed by many as the minimum one needed to sustain an industry
able to reach grid parity in the 3-5 year time frame, and be subsidy free. Figure 14: Proposed degression mechanism
Potential Degression mechanism
Scenario 1 Scenario 2 Scenario 3
Quarterly Deployment
50% of Quarter deployment trigger is
hit
Quarter deployment trigger is hit
150% of Quarter deployment trigger is hit
Tariff degression*
2.5% 7.5% 12.5%
• If deployment is below 50% of anticipated volumes any quarter, we propose zero
degression. The impact of this degression on each banding is shown in the tariff pathways shown overleaf. Further points
• We have not taken into account any caps on deployment as we understand there may significant complexities in implementing this approach. We believe that our degression proposal would effectively control costs.
• A degression mechanism as the one described should encourage a flowing market. Cap
mechanisms can create risk due to continuous start and stop effects. Removal of caps is seen by many as a key requirement to have a sustainable industry.

Confidential Solar PV Scenario Paper October 2015
15
• For a cap mechanism to be effective there needs to be a live register and mechanism to define the applicable FIT for each installation at the moment of presenting the proposal. This would require significant investment and time to be implemented.
• A pre-accreditation process could be implemented for larger systems above 250kW, although note we are not proposing any tariffs for systems above 500kW. We have also not modelled any mid-level tariff and assume that this is no longer required.
• Finally, all the calculations have been made with a 5% VAT level. If VAT increased to 20%, FIT would need to increase by around 2 pence to provide same level of IRR.
Confidential Solar PV Scenario Paper October 2015
16
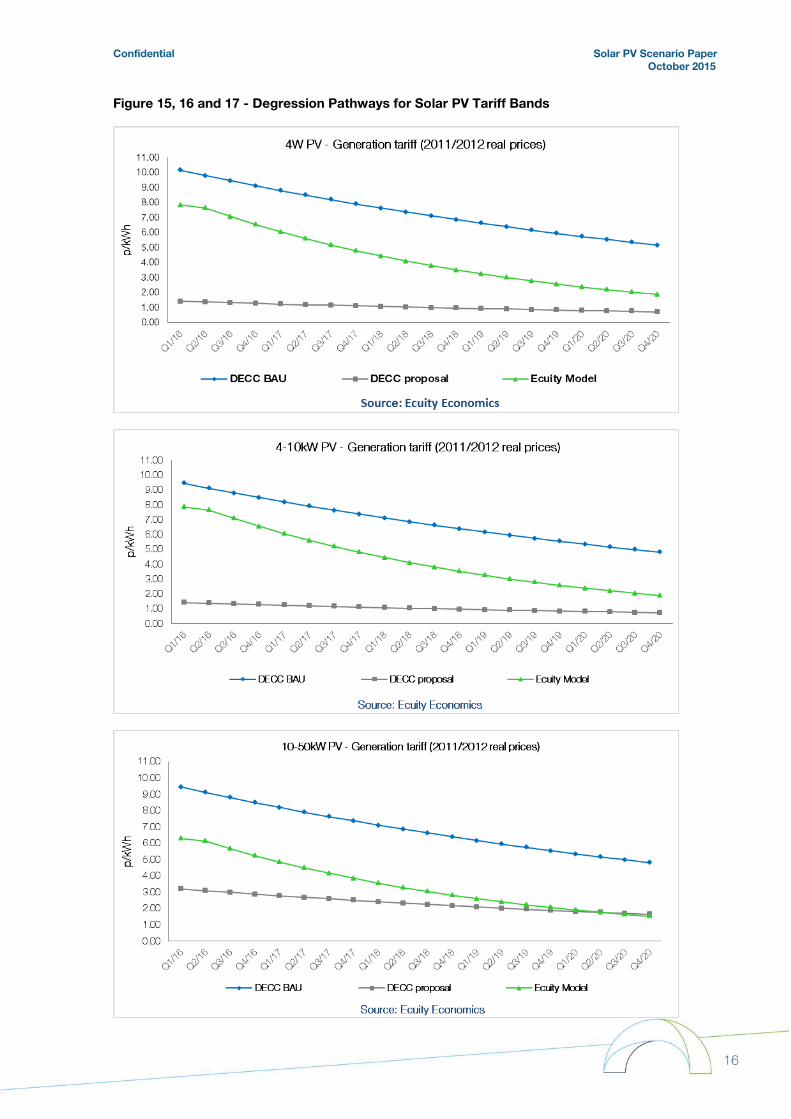
Figure 15, 16 and 17 - Degression Pathways for Solar PV Tariff Bands
Confidential Solar PV Scenario Paper October 2015
17
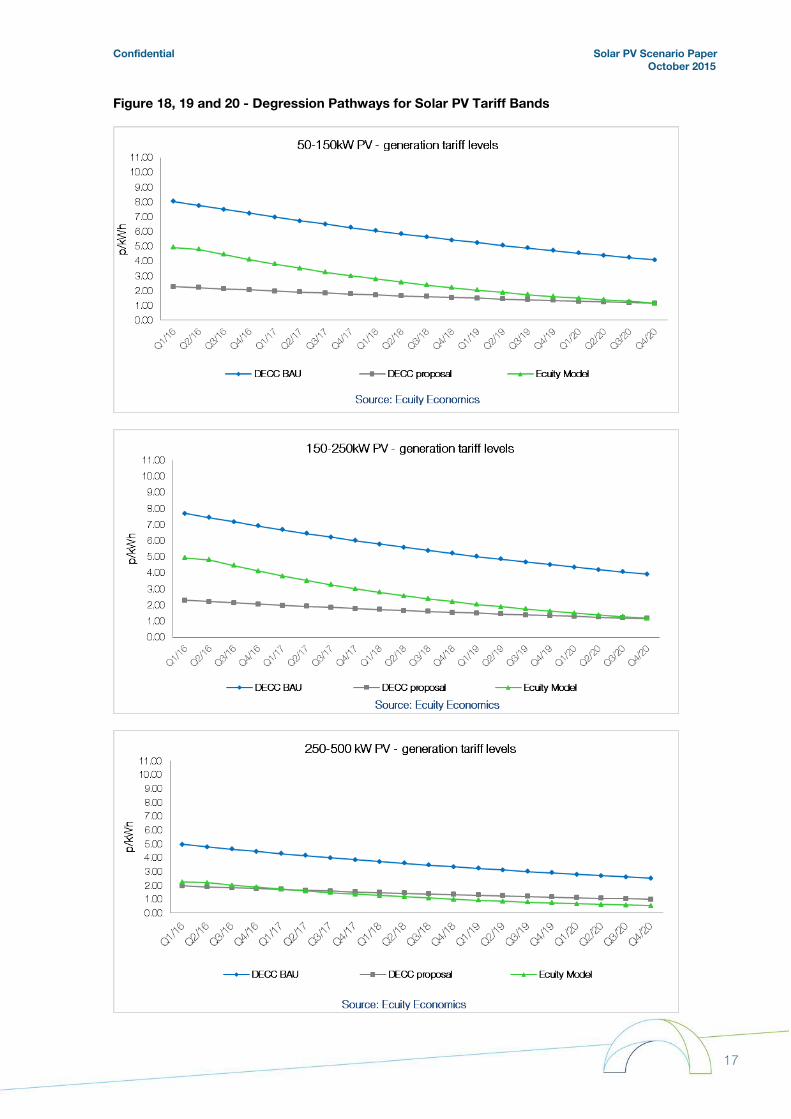
Figure 18, 19 and 20 - Degression Pathways for Solar PV Tariff Bands
Confidential Solar PV Scenario Paper October 2015
18
Section 3 – Budget Outcomes
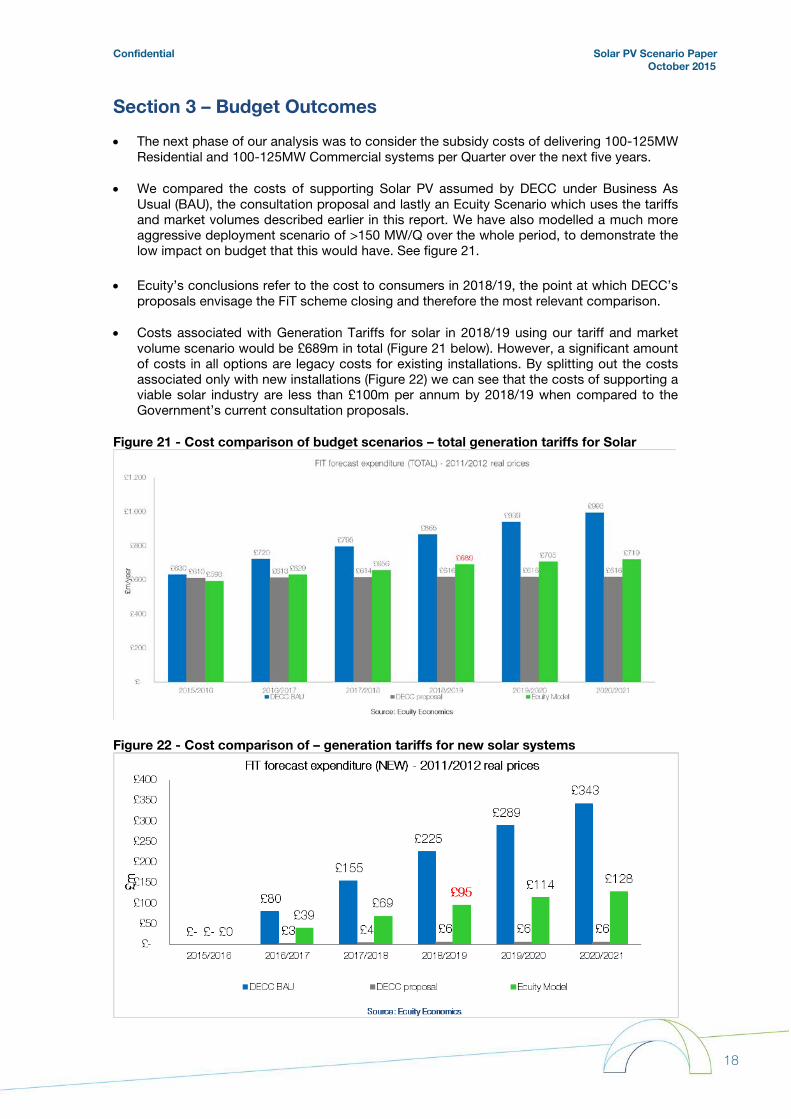
• The next phase of our analysis was to consider the subsidy costs of delivering 100-125MW Residential and 100-125MW Commercial systems per Quarter over the next five years.
• We compared the costs of supporting Solar PV assumed by DECC under Business As Usual (BAU), the consultation proposal and lastly an Ecuity Scenario which uses the tariffs and market volumes described earlier in this report. We have also modelled a much more aggressive deployment scenario of >150 MW/Q over the whole period, to demonstrate the low impact on budget that this would have. See figure 21.
• Ecuity’s conclusions refer to the cost to consumers in 2018/19, the point at which DECC’s
proposals envisage the FiT scheme closing and therefore the most relevant comparison.
• Costs associated with Generation Tariffs for solar in 2018/19 using our tariff and market volume scenario would be £689m in total (Figure 21 below). However, a significant amount of costs in all options are legacy costs for existing installations. By splitting out the costs associated only with new installations (Figure 22) we can see that the costs of supporting a viable solar industry are less than £100m per annum by 2018/19 when compared to the Government’s current consultation proposals.
Figure 21 - Cost comparison of budget scenarios – total generation tariffs for Solar
Figure 22 - Cost comparison of – generation tariffs for new solar systems
Confidential Solar PV Scenario Paper October 2015
19
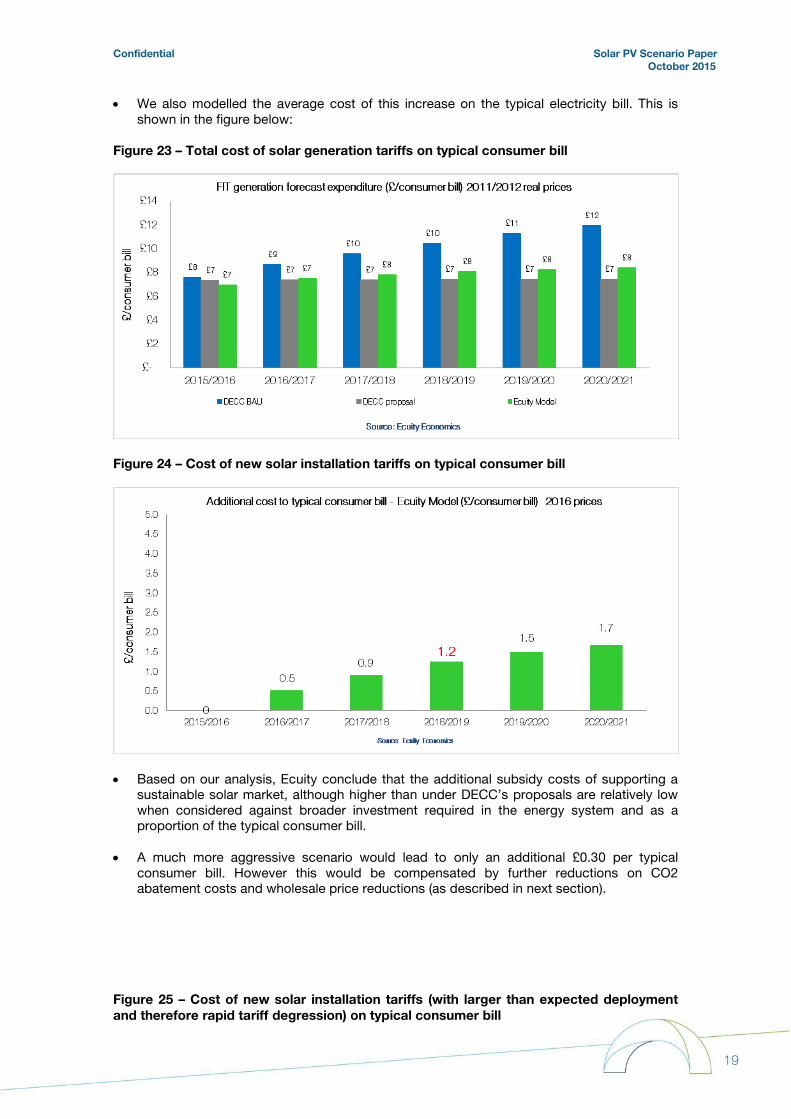
• We also modelled the average cost of this increase on the typical electricity bill. This is shown in the figure below:
Figure 23 – Total cost of solar generation tariffs on typical consumer bill
Figure 24 – Cost of new solar installation tariffs on typical consumer bill
• Based on our analysis, Ecuity conclude that the additional subsidy costs of supporting a sustainable solar market, although higher than under DECC’s proposals are relatively low when considered against broader investment required in the energy system and as a proportion of the typical consumer bill.
• A much more aggressive scenario would lead to only an additional £0.30 per typical consumer bill. However this would be compensated by further reductions on CO2 abatement costs and wholesale price reductions (as described in next section).
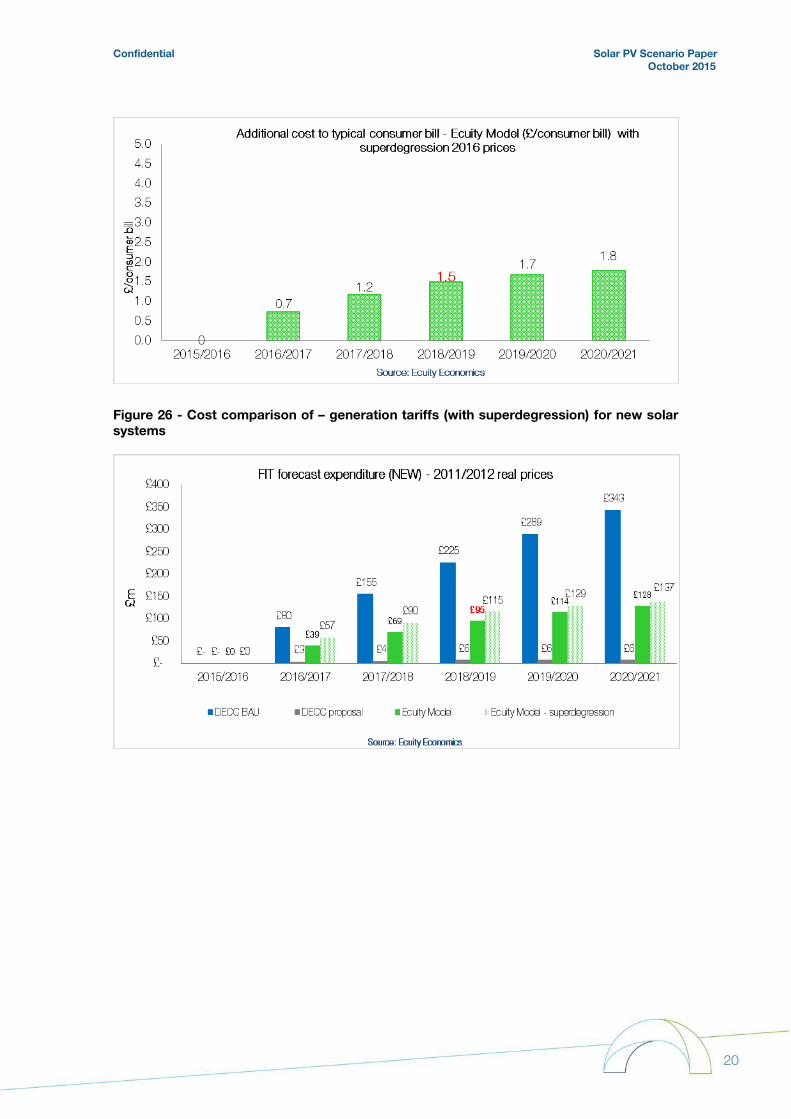
Figure 25 – Cost of new solar installation tariffs (with larger than expected deployment and therefore rapid tariff degression) on typical consumer bill
Confidential Solar PV Scenario Paper October 2015
20
Figure 26 - Cost comparison of – generation tariffs (with superdegression) for new solar systems
Confidential Solar PV Scenario Paper October 2015
21
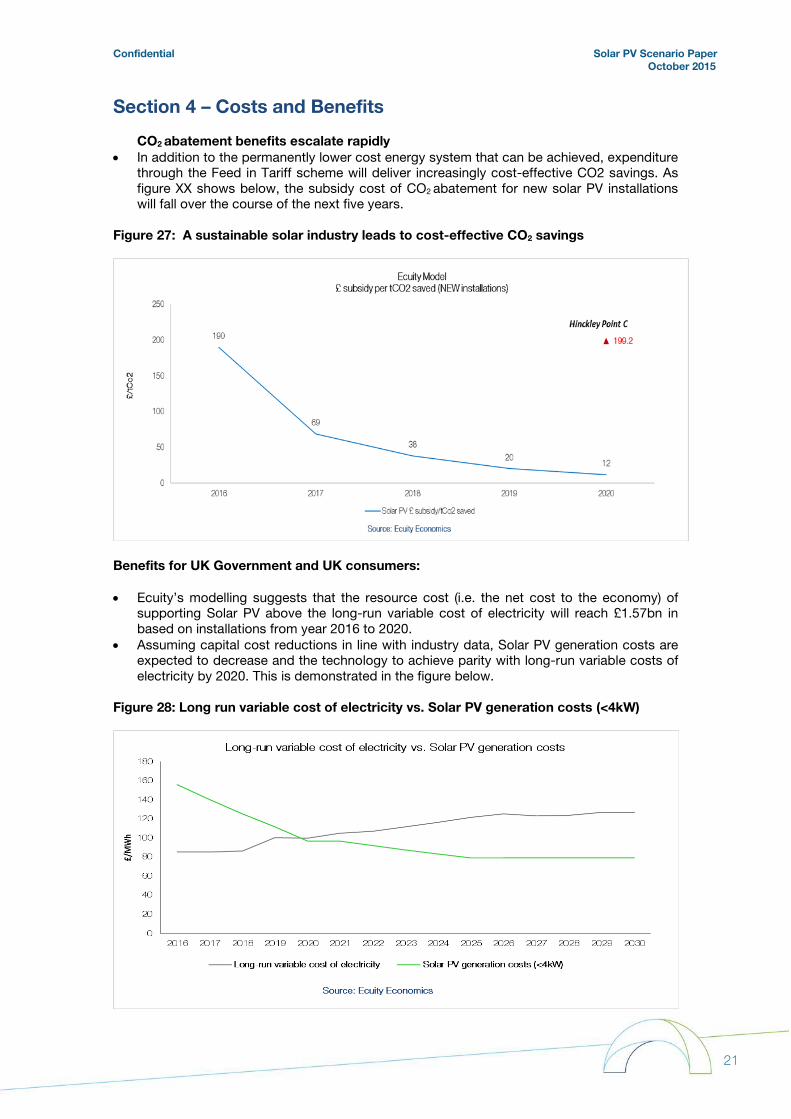
Section 4 – Costs and Benefits CO2 abatement benefits escalate rapidly
• In addition to the permanently lower cost energy system that can be achieved, expenditure through the Feed in Tariff scheme will deliver increasingly cost-effective CO2 savings. As figure XX shows below, the subsidy cost of CO2 abatement for new solar PV installations will fall over the course of the next five years.
Figure 27: A sustainable solar industry leads to cost-effective CO2 savings
Benefits for UK Government and UK consumers: • Ecuity’s modelling suggests that the resource cost (i.e. the net cost to the economy) of
supporting Solar PV above the long-run variable cost of electricity will reach £1.57bn in based on installations from year 2016 to 2020.
• Assuming capital cost reductions in line with industry data, Solar PV generation costs are expected to decrease and the technology to achieve parity with long-run variable costs of electricity by 2020. This is demonstrated in the figure below.
Figure 28: Long run variable cost of electricity vs. Solar PV generation costs (<4kW)
Confidential Solar PV Scenario Paper October 2015
22
• When taking into account market installations beyond 2020 (to 2030), the resource cost of
supporting Solar PV becomes negative. This is because the cost of Solar PV installations beyond 2020 is lower than the long-run variable cost of electricity, thus producing a benefit to the UK economy. To be able to monetize these benefits, the Solar PV sector is requesting support in the next 3-5 years and argues that failure to do so could delay grid parity and thereby reduce the benefits.
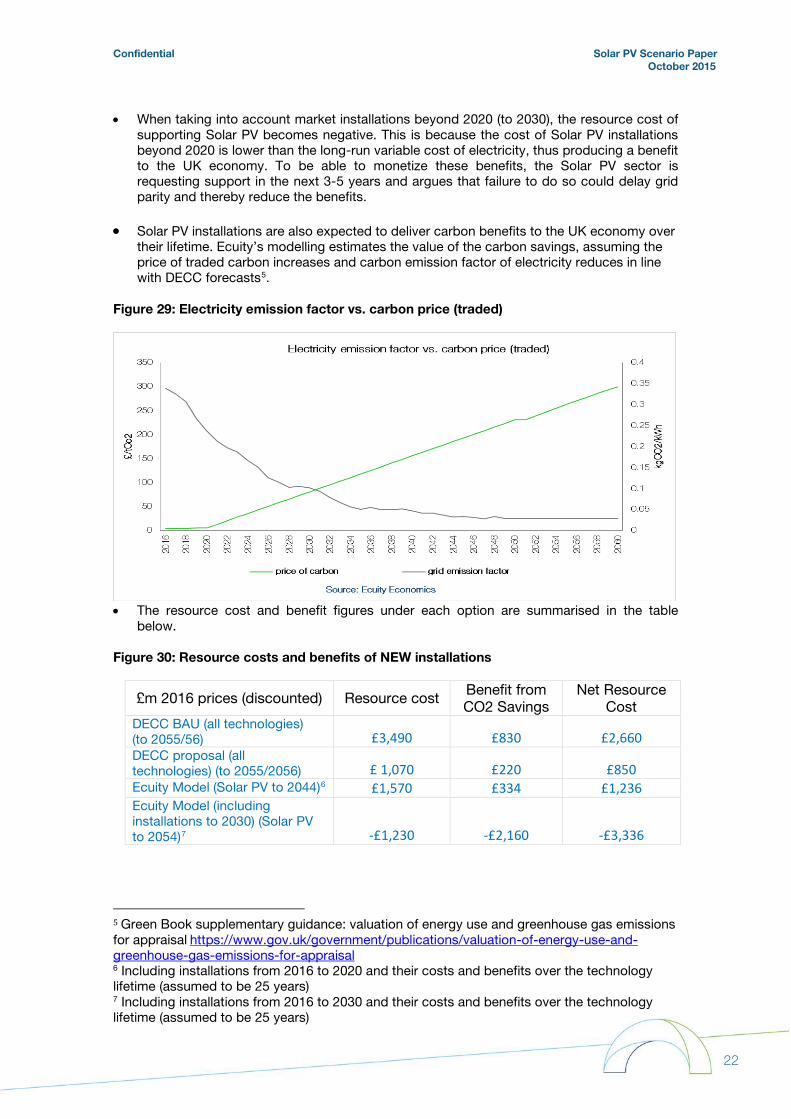
• Solar PV installations are also expected to deliver carbon benefits to the UK economy over their lifetime. Ecuity’s modelling estimates the value of the carbon savings, assuming the price of traded carbon increases and carbon emission factor of electricity reduces in line with DECC forecasts5.
Figure 29: Electricity emission factor vs. carbon price (traded)
• The resource cost and benefit figures under each option are summarised in the table
below.
Figure 30: Resource costs and benefits of NEW installations
£m 2016 prices (discounted) Resource cost Benefit from CO2 Savings
Net Resource Cost
DECC BAU (all technologies) (to 2055/56) £3,490 £830 £2,660 DECC proposal (all technologies) (to 2055/2056) £ 1,070 £220 £850 Ecuity Model (Solar PV to 2044)6 £1,570 £334 £1,236 Ecuity Model (including installations to 2030) (Solar PV to 2054)7 -£1,230 -£2,160 -£3,336
5 Green Book supplementary guidance: valuation of energy use and greenhouse gas emissions for appraisal https://www.gov.uk/government/publications/valuation-of-energy-use-and-greenhouse-gas-emissions-for-appraisal 6 Including installations from 2016 to 2020 and their costs and benefits over the technology lifetime (assumed to be 25 years) 7 Including installations from 2016 to 2030 and their costs and benefits over the technology lifetime (assumed to be 25 years)
Confidential Solar PV Scenario Paper October 2015
23
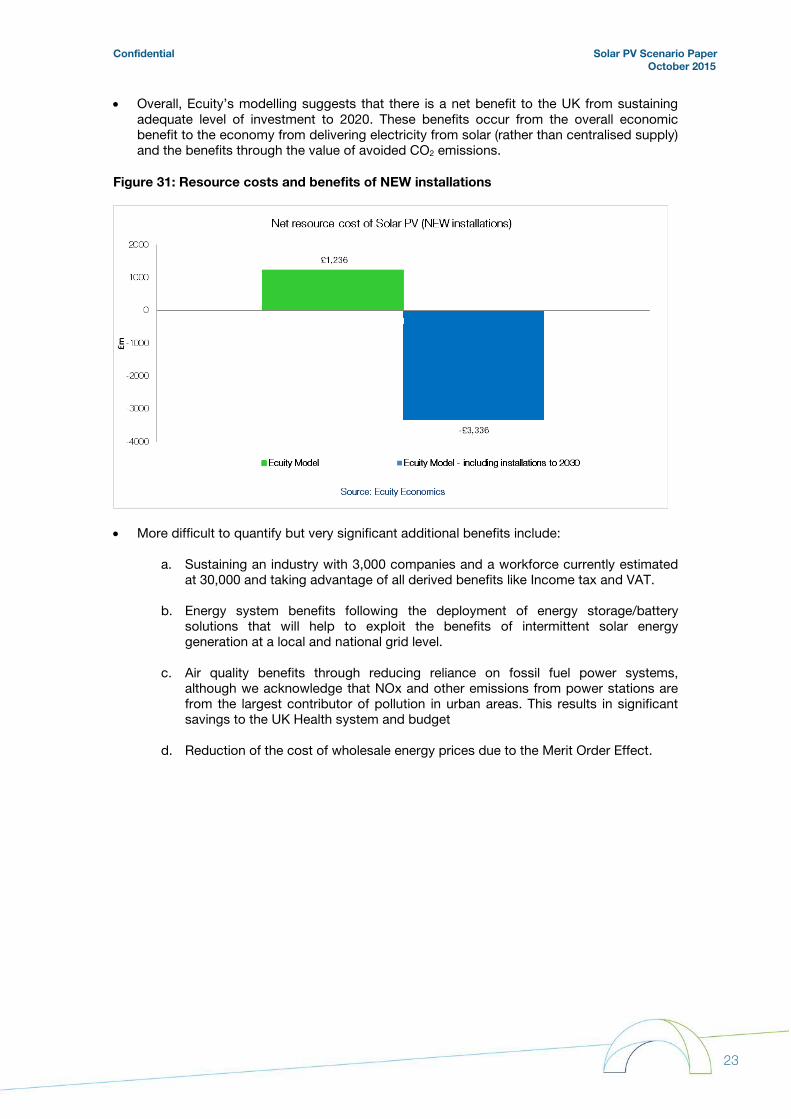
• Overall, Ecuity’s modelling suggests that there is a net benefit to the UK from sustaining adequate level of investment to 2020. These benefits occur from the overall economic benefit to the economy from delivering electricity from solar (rather than centralised supply) and the benefits through the value of avoided CO2 emissions.
Figure 31: Resource costs and benefits of NEW installations
• More difficult to quantify but very significant additional benefits include:
a. Sustaining an industry with 3,000 companies and a workforce currently estimated at 30,000 and taking advantage of all derived benefits like Income tax and VAT.
b. Energy system benefits following the deployment of energy storage/battery solutions that will help to exploit the benefits of intermittent solar energy generation at a local and national grid level.
c. Air quality benefits through reducing reliance on fossil fuel power systems, although we acknowledge that NOx and other emissions from power stations are from the largest contributor of pollution in urban areas. This results in significant savings to the UK Health system and budget
d. Reduction of the cost of wholesale energy prices due to the Merit Order Effect.
Confidential Solar PV Scenario Paper October 2015
24
Conclusion
• Getting energy financial incentives right so that they deliver to objectives whilst keeping to a budget is a significant challenge, especially as the assumptions upon which decisions are based can be a moving target. However the Ecuity project team has identified a number of significant variances between the assumptions and modelling undertaken for the purposes of consultation proposals and the information that we have been able to source publicly or that has been provided to us by the solar industry
• Our analysis suggests that the generation tariffs for solar systems in a number of tariff bandings should be revised upwards if DECC’s target IRR of 4% is to be achieved in a reference case installation.
• In addition to the above, our alternative feed in tariff scenario suggests that a sustainable
solar industry (with tariffs that generate 6% IRR) of around 1GW installed capacity per annum could be delivered at a cost of £100m per annum which equates to £1.20 on the typical energy customer bill.
• The benefits of supporting a sustainable solar industry (if the pathway to grid parity is
achieved) can be quantified. Using an approach that we hope is familiar to Government analysts, we have shown in this paper how supporting the solar industry to deliver grid parity could deliver a significant overall benefit to UK plc
ENDS

Confidential Solar PV Scenario Paper October 2015
25
Contacts Please direct any questions or queries regarding the analysis presented in this paper to Ecuity Consulting LLP at [email protected], or via telephone to +44 121 709 5587 Project Team The following Ecuity personnel have contributed to the development of this work:
James Higgins
Partner
James leads on Ecuity’s Insight and Strategy service which helps the organisations we work with understand and manage risk and opportunity within the energy policy environment. James works hands-on with clients and the Ecuity consulting team to develop persuasive narratives supported by technical and economic analysis across the renewable, heating and energy efficiency sectors.
James has previously worked as a Parliamentary specialist for the UK’s water industry regulator Ofwat. In 2012 graduated from the Global Energy MBA programme at Warwick Business School.
Gaia Stigliani
Senior Economic
Analyst
Gaia delivers techno-economic and policy analysis on behalf of industry that feeds into commercial strategy and government policy design. She has led on a number of projects including economic appraisal of energy policy interventions, government-backed finance schemes and demand reduction programmes. She is also responsible for producing scenario modelling that emulates the way governments assess policy intervention including extensively for the rural heating sector. Gaia holds an MSc in Economics and International Financial Economics from The University of Warwick.
Robert Honeyman
Economic Analyst
Robert provides techno-economic analysis to many of Ecuity’s projects and clients. He is leading on a number of projects including the commercial viability of microgeneration technologies, price forecasts and Life Cycle Assessment (LCA) of renewables. Robert has developed models that have influenced UK Government policy thinking in areas such as domestic heating, domestic efficiency and smart technologies.
Robert holds an MSc in Environmental Economics with Climate Change and a BSc in Environmental Policy with Economics from London School of Economics and Political Science.
Related Documents