VOL.38, NO.3, Summer 2007 VOL.38, No.3, SUMMER 2007 ISSN 0084-5841

Welcome message from author
This document is posted to help you gain knowledge. Please leave a comment to let me know what you think about it! Share it to your friends and learn new things together.
Transcript

VO
L.38, NO
.3, Sum
mer 2007
VOL.38, No.3, SUMMER 2007
ISSN 0084-5841


Yoshisuke Kishida, Publisher & Chief EditorContributing Editors and Cooperators
- AFRICA -Kayombo, Benedict (Botswana)Fonteh, Fru Mathias (Cameroon)
El Behery, A.A.K. (Egypt)El Hossary, A.M. (Egypt)
Pathak, B.S. (Ethiopia)Bani, Richard Jinks (Ghana)Djokoto, Israel Kofi (Ghana)
Some, D. Kimutaiarap (Kenya)Houmy, Karim (Morocco)Igbeka, Joseph C. (Nigeria)
Odigboh, E.U. (Nigeria)Oni, Kayode C. (Nigeria)
Kuyembeh, N.G. (Sierra Leone)Abdoun, Abdien Hassan (Sudan)
Saeed, Amir Bakheit (Sudan)Khatibu, Abdisalam I. (Tanzania)Baryeh, Edward A. (Zimbabwe)Tembo, Solomon (Zimbabwe)
- AMERICAS -Cetrangolo, Hugo Alfredo (Argentina)
Naas, Irenilza de Alencar (Brazil)Ghaly, Abdelkader E. (Canada)
Hetz, Edmundo J. (Chile)Valenzuela, A.A. (Chile)
Aguirre, Robert (Colombia)Ulloa-Torres, Omar (Costa Rica)Magana, S.G. Campos (Mexico)
Ortiz-Laurel, H. (Mexico)Chancellor, William J. (U.S.A.)
Goyal, Megh Raj (U.S.A.)Mahapatra, Ajit K. (U.S.A.)Philips, Allan L. (U.S.A.)
- ASIA and OCEANIA -Quick, G.R. (Australia)
Farouk, Shah M. (Bangladesh)Hussain, Daulat (Bangladesh)
Mazed, M.A. (Bangladesh)Wangchen, Chetem (Bhutan)
Wang, Wanjun (China)Illangantileke, S. (India)
Ilyas, S. M. (India)Michael, A.M. (India)
Ojha, T.P. (India)
Verma, S.R. (India)Soedjatmiko (Indonesia)
Behroozi-Lar, Mansoor (Iran)Minaei, Saeid (Iran)Sakai, Jun (Japan)
Snobar, Bassam A. (Jordan)Chung, Chang Joo (Korea)
Lee, Chul Choo (Korea)Bardaie, Muhamad Zohadie (Malaysia)
Pariyar, Madan (Nepal)Ampratwum, David Boakye (Oman)
Eldin, Eltag Seif (Oman)Chaudhry, Allah Ditta (Pakistan)
Mughal, A.Q. (Pakistan)Rehman, Rafiq ur (Pakistan)
Devrajani, Bherular T. (Pakistan)Abu-Khalaf, Nawaf A. (Palestine)Nath, Surya (Papua New Guinea)Lantin, Reynaldo M. (Philippines)Venturina, Ricardo P. (Philippines)
Al-suhaibani, Saleh Abdulrahman (Saudi Arabia)Al-Amri, Ali Mufarreh Saleh (Saudi Arabia)
Chang, Sen-Fuh (Taiwan)Peng, Tieng-song (Taiwan)
Krishnasreni, Suraweth (Thailand)Phongsupasamit, Surin (Thailand)
Rojanasaroj. C. (Thailand)Salokhe, Vilas M. (Thailand)Singh, Gajendra (Thailand)
Pinar, Yunus (Turkey)Haffar, Imad (United Arab Emirates)
Lang, Pham Van (Viet Nam)Nguyen Hay (Viet Nam)
Hazza’a, Abdulsamad Abdulmalik (Yemen)
- EUROPE -Kaloyanov, Anastas P. (Bulgaria)
Kic, Pavel (Czech)Have, Henrik (Denmark)
Müller, Joachim (Germany)Pellizzi, Giuseppe (Italy)
Hoogmoed, W.B. (Netherlands)Pawlak, Jan (Poland)
Marchenko, Oleg S. (Russia)Kilgour, John (U.K.)
Martinov, Milan (Yugoslavia)
EDITORIAL STAFF(Tel.+81-(0)3-3291-5718)
Yoshisuke Kishida, Chief EditorShinjiro Tetsuka, Managing Editor
Noriyuki Muramatsu, Assistant EditorZachary A. Henry, Editorial Consultant
ADVERTISING(Tel.+81-(0)3-3291-3672)
Yoshito Nakajima, Manager (Head Office)Hiroshi Yamamoto, Manager (Branch Office)Advertising Rate: 300 thousand yen per page
CIRCULATION(Tel.+81-(0)3-3291-5718)(Fax.+81-(0)3-3291-5717)
Editorial, Advertising and Circulation Headquarters7, 2-chome, Kanda Nishikicho, Chiyoda-ku, Tokyo 101-0054, Japan
URL: http://www.shin-norin.co.jpE-Mail: [email protected]
Copylight © 2007 byFARM MACHINERY INDUSTRIAL RESEACH CORP.
SHIN-NORIN Building7, 2-chome, Kanda Nishikicho, Chiyoda-ku, Tokyo 101-0054, Japan
Printed in Japan
This is the 132th issue since its maiden isue in the Spring of 1971

EDITORIAL
Some years ago, the report on “the limit of the growth” was published from Rome Club, which makes mention of expanding global population and limited natural resources. It says that at some point in the future social economy will stop growing with a limited supply of natural resources. That recognition drove us to find the solution toward a sus-tainable society. Also, sustainability has been, more and more, an important concept in the field of agriculture.
Now, in the early 21st century, world population exceeded six billion and is still increasing. The population is predict-ed to grow up to nine billion in 2050. China, the most highly populated country in the world, has controlled population growth as a national policy. Nevertheless, its population is estimated to be 1.4 billion, although the growth rate has decreased. In the second most populated country, India, the youth population growth rate will cause an even greater total population growth. India is expected to pass China in total population by 2030, and have over 1.5 billion people in 2050.
The Chinese economy has grown remarkably and has achieved almost 10 % annual growth. Average personal annual income has exceeded ten thousand dollars in Guangzhou. If the Chinese economy keeps growing at the present rate, 8 % annually, Chinese national income per capita in 2030 is estimated to be equal that of the 2004 per capita income in the United States. What happens if Chinese people possess three cars per four persons and use them as Americans presently use them? More than 98 million barrels of oil per day will be consumed, only in China, far more than the present total oil production in the world, 84 million barrels a day. What happens if the consumption rate of paper in China is the same as that presently consumed in the United States? Over 3.12 billion tons of paper will be needed, only in China, more than double the present total paper production in the world. All forests will disappear throughout the world at that time. Not only China, but India, and many other developing countries are eager to get a wealthy life.
The figures mentioned above, however, indicate that such economic growth will be impossible. The limited natural resources will not only put the brakes on economic growth but increase international tensions in connection with the struggle for natural resources if science and technology remain at the present level. Scientist and engineers are re-quired to develop the technology which contributes to resources that save economic growth. The Japanese car compa-ny, Toyota, developed the hybrid car, “Prius”. Oil consumption will be cut to half if such hybrid cars are used all over the world. Present energy demand in the United States will be supplied only by wind power if wind power plants work sufficiently.
Production of bio-ethanol from corn has raised corn prices in the international market.This has caused a food shortage not only in developing countries but also in developed countries where food has
been over-supplied. The increase of bio-energy production will take the food away in the future, even in developed countries. It is of particular concern in Japan where food self-sufficiency rate is only 39 %, lower than 40 %!
We must develop and spread the technology contributing to sustainable agriculture to produce necessary food on limited farmland without losing the balance of ecological systems. Required mechanization of precision farming is substantial to raise land productivity. Agricultural machines will play an increasingly important role. AMA continues to make an effort to fulfill the task of agricultural engineers.
Yoshisuke KishidaChief Editor
Tokyo, JapanSeptember, 2007

Yoshisuke Kishida
Mohamed Hassan DahabHassan Elhaj Hamed Hassan
Mohamed Hassan Nayel
K. Kathirvel, R. ManianT. Senthilkumar
Mukesh Singh, T. K. BhattacharyaH. C. Joshi, T. N. Mishra
Binisam, K. KathirvelR. Manian, L. P. Gite
K. Rayaguru, Md. K. KhanG. Sahoo, U. S. Pal
S. N. Yadav, M. M. PandeyD. C. Saraswat
Sukhbir SinghDinesh Kumar Vatsa
T. B. Adhikarinayake, J. MüllerJ. Oostdam, W. Huisman, P. Richards
A. Sessiz, T. Koyuncu, Y. Pinar
Lizardo Reina C, Edmundo J. Hetz
Sheikh El Din Abdel Gadir El-AwadAwad El-Karim Sir-Elkhatim Abdu-
Elmagid, Mohamed Ahmed Ali
S. Kaleemullah, R. Kaliappan
Binisam, K. KathirvelR. Manian, C. R. Mehta
T. Senthilkumar, Aravinda ReddyR. Manian, K. Kathirvel
Abstracts
News
Book Review
7
9
15
20
28
33
38
45
48
56
60
67
73
79
84
87
89
89
Editorial
Modification of Power Transmission System to the Stationary Com-bine Thresher
Performance Evaluation of Tractor Drawn Weeding Cum Earthing-up Equipment for Cotton
Studies on Blending of Refined Soybean Oil and Ethanol with Die-sel as Hybrid CI Engine Fuel
Effect of Whole Body Vibration of Riding Type Power Tiller
Post Harvest Practices of Betel Leaves in Orissa, India
Effect of Design and Operating Parameters of Performance of Inter-cultivation Sweep Vertisols
Development and Evaluation of a Light Weight Power Tiller Oper-ated Seed Drill for Hilly Region
An Airtight Paddy Storage System for Small-scale Farmers in Sri Lanka
Soybean Threshing Efficiency and Power Consumption for Differ-ent Concave Materials
Evaluation of the Agricultural Tractor Park of Ecuador
Improvement of the Modified Grain Thresher for Groundnut Thresh-ing
Design, Development and Evaluation of a Rotary Type Chilly Dryer
Influence of Forward Speed and Terrain Condition on Hand Trans-mitted Vibration of Power Tiller
Performance Evaluation of Implements for Incorporation of Cotton Stalk
CONTENTS
AGRICULTURAL MECHANIZATION IN ASIA, AFRICA AND LATIN AMERICAVol.38, No.3, Oct 2007
New Co-operating Editor ....................................27Co-operating Editor ............................................91
Back Issues ..........................................................94Instructions to AMA Contributors .....................96
★ ★ ★
VOL.38 NO.3 2007 AGRICULTURAL MECHANIZATION IN ASIA, AFRICA, AND LATIN AMERICA 9
Modification of Power Transmission System to theStationary Combine Thresher
byMohamed Hassan DahabAssociate ProfessorDept. of Agricultural Engineering,Faculty of Agriculture,University of Khartoum,P.O. Box 321, Shambat 1334SUDAN
Mohamed Hassan NayelAssistant ProfessorFaculty of Agriculture, Dar Mali,University of Nile Valley,P.O. Box 346, AtbraSUDAN
Hassan Elhaj Hamed HassanLectureFaculty of Agriculture, Dar Mali,University of Nile Valley,P.O. Box 346, AtbraSUDAN
AbstractThe experiment was conducted
in Atbra town, River Nile State, Sudan, to modify and evaluate the power transmission system to the stationary combine thresher. The modification was designed from a differential unit, a universal joint, shaft assembly for power transmis-sion and power regulating unit.
The evaluation tests were car-ried out on two crops, sorghum and faba bean and compared with the unmodified thresher. The results indicated that the modification was significantly affected by the time
taken for linking the machine to the tractor and also the average effec-tive field capacity at (p > 0.01). The time taken for linking the machine was 0.3hr and 0.43hr, and the ef-fective field capacity obtained was 1.43 fd/hr, 0.93 fd/hr for the modi-fied and the unmodified machines respectively.
IntroductionPower source in agriculture is of
great importance in determining the level of agricultural mechaniza-tion and development. In the farm
there are three sources of power for carrying out operations, the human power (about 0.07-0.1 kW) for lim-ited amount of work which seldom exceeds subsistence level, and ani-mal power, which is mainly used for draft work or transport of goods and people (Grossly and Kilgour, 1983). Mechanical power through tractors will continue to be an absolute ne-cessity for agricultural production (Hunt, 1983). This power is required for two kinds of work, dynamic as for pulling or draft of implements and static for operating machines like water pumps or threshers.
Transmitting of power from its
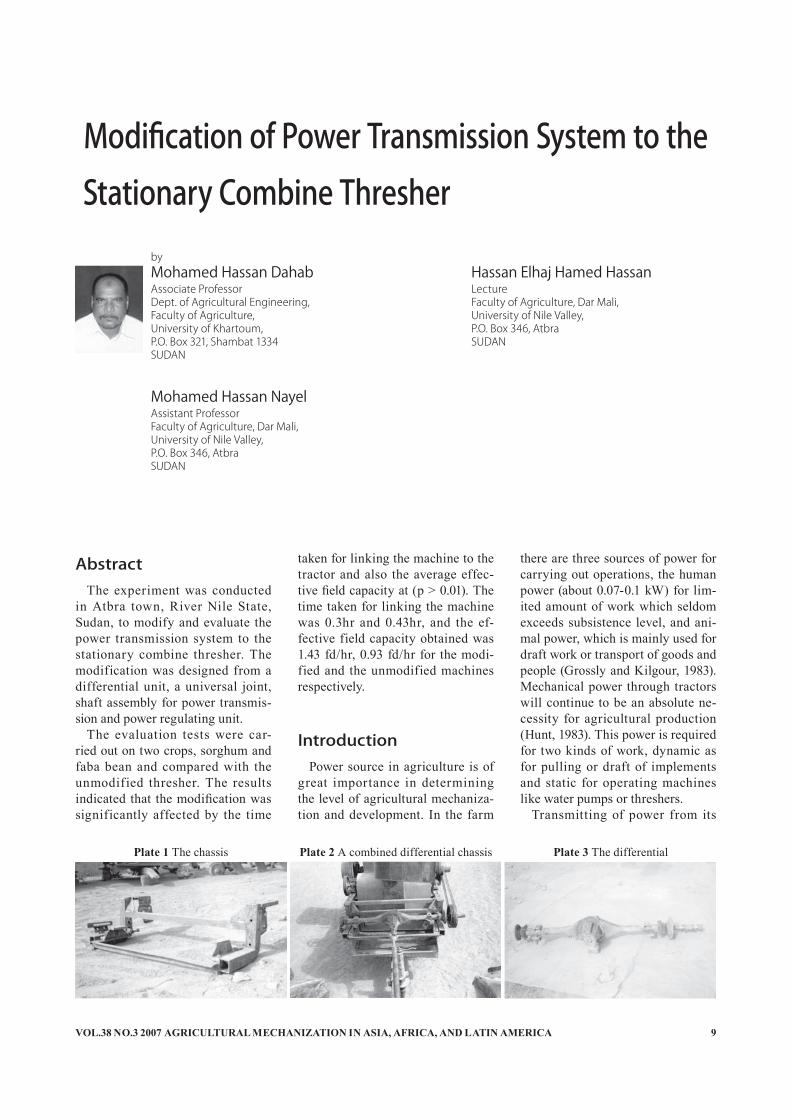
Plate 1 The chassis Plate 2 A combined differential chassis Plate 3 The differential

AGRICULTURAL MECHANIZATION IN ASIA, AFRICA, AND LATIN AMERICA 2007 VOL.38 NO.310
source to the points of use is one of the important variables to the farm equipment designers.
Krutz et al. (1984) cited that the selection of proper power transmis-sion systems on mobile agricultural machinery must take into account the customer requirements, cost constraints, field usage, operator safety and reliability.
The pr imar y funct ion of the transmission member is to affect the change in speed between the two shafts as well as in linking them. It is generally required that the trans-mission system should have ade-quate reliability, service life, simple in construction, little resistance to motion, produce little noise, offers substantial resistance to vibration and easy to control.
There are many power transmis-sion systems used, but the most extensively used in agricultural machinery applications are V-belts (Kepner et al., 1982; Krutz et al., 1984). Shigley and Mitchell (1983) stated that, the efficiency of V-belts ranges from 70-95 %. Gears and chains are also widely used for power transmission as linear or rotary motion (Hunt and Garver, 1973; Spotts, 1978; Crouse, 1980; Liljedahl et al., 1984). Other power transmission systems included bear-ings, shafts and universal joints. Spotts (1978) cited that, bearings are important in almost every kind of machine and device with rotating parts. Rotating shafts are of various lengths, diameters and types and they may be subjected to bending, tension, compression or torsion loads, acting singly or in combina-
tion with one another (Shigley and Mitchell, 1983; Hunt and Garver, 1973). Therefore it is important to locate the PTO shaft of the tractor with respect to the draw bar because of the telescoping action of the drive member when the tractor is moving over rough ground and the vibra-tion of the universal joints when the tractor is turning (Liljedahl et al., 1984).
Stationary threshers which are drawn and operated by tractors PTO are now of great important in the Sudan for threshing many crops, but the system of power transmis-sion from the tractor to the machine causes some losses in power use and efficiency of work. That is because
power transmission to the machine is from one side, which means unlink-ing the machine from the tractor in the field and linking again (Plate 1).
Therefore, the main objectives of the present research work are to modify the power transmission system to the thresher and evalu-ate the modification, to improve the machine performance and minimize the operation costs.
Modification of Power Transmission System of the Machine
The study was carried out in Dar-mally village, 13 km north of Atbara
Plate 4 The modified universal joint Plate 5 Shaft assembly for power transmission Plate 6 Power regulating unit
Fig. 1 Chassis
Fig. 2 Shaft assembly for power transmission
All demention in mm
All demention in mm

VOL.38 NO.3 2007 AGRICULTURAL MECHANIZATION IN ASIA, AFRICA, AND LATIN AMERICA 11
city and 325 km north of Khartoum city. A Massey Fergeson (290) trac-tor of 74.8 hp (maximum PTO) was used as a source of power for oper-ating a stationary thresher with its technical specifications shown in Table 1. Other materials and tools used to carryout the modification in-cluded, iron sheets, iron angles, iron f langes, fixing bolts, nuts, shims, shafts, pulleys, bearings and other workshop equipment.
Design of Modification PartsThe Differential
A metal differential chassis was fixed in the front part of the thresher and used for locating the differen-tial (Plate 2 and Fig. 1). All design criteria were considered when fix-ing the chassis strongly with fix-ing bolts. A simple car differential was used for power transmission between two intersecting shafts at right angle (Plate 3). The original
universal joint was modified to en-able the connection between the differential and the cardan shaft. It consisted of a flange of 120 mm in diameter, a squared section shaft and a universal joint (Plate 4). Four fasteners were used to maintain the linkage between the modified universal joint and the differential through the flange.Shaft Assembly for Power Trans-mission
A shaft with the same specifica-tions of the one used in the origi-nal power transmission unit of the thresher was selected. It consisted of a flange (198 mm in diameter), a shaft (255 mm in length) and a key (65 x 8 x 8 mm). This assembly was used for operating the pulley which was fixed with a fixing nut (23 mm in diameter) at the end of the shaft (Plate 5 and Fig. 2). The assembly was firmly linked to the differential with five fixing bolts.
Power Regulating UnitIt was designed from a shaft,
pulleys and V-belts in order to get an optimum speed (rpm) transmit-ted from the shaft assembly to the threshing mechanism of the ma-chine (Plate 6 and Fig. 3a, b).
A Modified Removable Draw BarA modified removable draw bar
was developed and linked at the two points of the lower two linkage of the hydraulic system of the tractor. This helped in raising and lowering the power transmission shaft and the machine easily.
Speed (rpm) CalculationsThe following calculations were
made to have an optimum speed (rpm) from the tractor PTO shaft to the threshing mechanism of the thresher through the differential and the regulating unit (Plate 7).
Pulley SelectionIn the normal situation, the thresh-
er speed (rpm) ratio may be calcu-lated as follows:
Speed ratio = = ,
(Krutz et at., 1984),where
PD = pitch diameter (inch),SP = shaft speed (rpm),V1 = driver pulley andV2 = driven pulley.The driver pulley diameter of the
thresher = 10 inch.The driven pulley diameter of the
thresher = 5.4 inch. Speed ratio = 10/5.4 = 1.85Therefore, the rpm of the thresh-
ing mechanism was calculated as
PDv1PDv2
SPv2SPv1
Fig. 3a Power regulating unit part 1
Fig. 3b Power regulating unit part 2
Plate 7 Steps of power transmission
All demention in mm
All demention in mm

AGRICULTURAL MECHANIZATION IN ASIA, AFRICA, AND LATIN AMERICA 2007 VOL.38 NO.312
540 x 1.85 = 999 rpmFor the modified thresher with the
added differential, the differential speed ratio DSR =
. ,
(Maitra, 1985),Driven and driver gear teeth were
39 & 8 and, therefore,DSR = 39/8 = 4.88To have the speed 999 rpm at the
driven pulley (4) of the threshing unit (5.4 inch diameter), the follow-ing steps are taken (Fig. 4):
Stopping the right axle of the dif-ferential reduced DSR and double the speed coming from the tractor PTO at the first pulley (10 inch di-ameter) of the thresher (Liljedahl et al., 1984).
Speed (rpm) at pulley (1) =
= 540/2.44 =
221.54 rpmTo give the required speed in the
threshing mechanism another pulley was used and its size calculated as follows (Plate 7 and Fig. 3).
The speed at pulley (3) =
x Speed (rpm) =
5.4/15.7 x 999 = 343.61 rpm
Pulley (2) diameter = x
Pulley (1) = 221.54/343.61 x 10 = 6.45 inch
V-belt SelectionThe center distance between pul-
ley (3) and pulley (4) was 25 inches and this was found to fulfill the equations of Shigley and Mitchell (1983)
C > 3 (d + D),where
C = center distance,D = large pulley diameter andd = small pulley diameter.Therefore, from Table 2, a B-
section V- belt was selected.According to pulleys selected, the
maximum rpm at the threshing unit could be obtained as follows:
15.7/5.4 x 540 = 1570 rpmThe pitch length of the belt was
calculated as follows:
Lp = 2C + 1.57(D + d) + ,
(Shigley and Mitchell, 1983),C = center distance,D = pitch diameter large pulley,d = pitch diameter small pulley andLp = pitch length of belt.Lp = 2 x 25 + 1.57 (15.7 + 5.4) +
= 87.58 inch
The inside circumference is calcu-
Technical specifications ElshamsLength, m/m 4,020Width, m/m 2,200Hight, cm 2,400Drum type: Mobile fingeDrum length, m/m 1,200Drum diameter, m/m 75/120Rows of pegs 4Numbers of pegs 44Output, kg 2,300Tire size 13 x 600Flywheel diameter, m/m 732Flywheel weight, kg 130Main bearing inner diameter, m/m 70Cardan shaft StandardBelt tension StandardBag filling possibility, seed diameter All sizesAir flow adjustment StandardStraw length Adjustable
Belt designation
Power range perbelt hp
Typical standard pulley sizes, inch
Inch seriesA 0.2 to 5 2.6 up by 0.2 incrementsB 0.8 to 10 4.6 up by 0.2 incrementsC 1 to 21 7.0 up by 0.5 increments
Belt designation Size range inch Conversion
quantityA 26 to 128 1.3B 35 to 240 1.8B 240 up 2.1C 51 to 210 2.9C 210 up 3.8D 120 to 210 3.3D 210 up 4.1E 180 to 240 4.5E 240 up 5.5
Table 1 Technical specifications of the stationarycombine thresher (Elshams)
Table 2 Heavy-duty conversion v-belt section
Table 3 Length conversion quantities for heavy-duty conventional inch series belts
Fig. 4 Pulleys 1, 2, 3 and 4
Fig. 5 Correction factor k1
(D - d)2
4C
(15.7 + 5.4)2
4 x 25
Tractor PTO (rpm)Differential SR
Pulley (4)Pulley (3)
Speed (1)Speed (2)
No of teeth of the driven gearNo of teeth of the driver gear

VOL.38 NO.3 2007 AGRICULTURAL MECHANIZATION IN ASIA, AFRICA, AND LATIN AMERICA 13
lated using Table 3. The conversion quantities shown are in inches and are to be added to the inside circum-ference to get the pitch length.
Pitch length = Lp - 1.8 = 87.58 - 1.8 = 85.78 inch.
The nearest standard size of V-belt from (Table 4) is B-90 V-belt.
The angle of contact of the small pulley Øs was found as follows:
Øs = 2 cos-1 ,
whereD = pitch diameter for large pulley,d = pitch diameter for small pulley,c = center distance andØs = contact angle for small pulley.
Øs = 2 cos-1 = 156º
The rated horsepower (hp) was calculated as follows:
hp = (C1 - - C3(rd)2 - C4 log(rd))
(rd) + C2r (1- 1/ka),where
r = rpm of high-speed shaft, di-vided by 1000,
Ka = speed ratio factor (Table 5),d = pitch diameter of small pulley
andC1, C2, C3, C4 = constants (Table 6).The rated horsepower was cor-
rected according to the contact angle by the following equation:
hp1 = k1k2hp,where
hp1 = corrected power rating,k1 = correction factor of angle of
contact (Fig. 5),k2 = correction factor for length of
belt (Table 4) andhp = rated horsepower. Since the designed horsepower
of the thresher is 35 hp and the cal-culated hp is 5.02 hp, therefore the number of belts = 35/5.02 = 6.97 (≈ 7.0 belts).
Using seven belts found not to be practical due to some pulleys design difficulties and therefore, four pul-leys of B-90 V-belt was used be-tween pulley (3) and (4). The similar above calculation steps were used to select four belts of B-120 V-belt to be used to transmit motion between pulley (1) and (2) (Fig. 3).
The Modified Machine Evaluation and Testing
The modified machine was evalu-ated by testing in the field and was compared with an unmodified one. The test area was 1.5 fed and was cultivated by two crops, sorghum and fababean. The area was divided into six plots (35 x 30 m). In each plot the crop was cut and collected alone and then threshed separately using the threshers (Modified and unmodified).
Time taken in linking the machine to the tractor and the effective field capacity were measured in all plots.
It was clear that, the time taken
Ls A B C D60 0.97 0.91 0.8368 1.00 0.94 0.8575 1.02 0.96 0.8780 1.0481 0.98 0.8985 1.05 0.99 0.9090 1.07 1.00 0.9196 1.08 0.9297 1.02105 1.10 1.03 0.94112 1.12 1.05 0.95120 1.13 1.06 0.96 0.88128 1.15 1.08 0.98 0.89
Belt section C1 C2 C3 C4
A 0.8542 1.342 2.436(10)-4 0.1703B 1.5060 3.520 4.193(10)-4 0.2931C 2.7860 9.788 7.460(10)-4 0.5214D 5.9220 34.72 1.522(10)-4 1.064E 8.6420 66.32 2.192(10)-4 1.532
D/d range KA
1.00 to 1.01 1.00001.02 to 1.04 1.01121.05 to 1.07 1.02261.08 to 1.10 1.03441.11 to 1.14 1.04631.15 to 1.20 1.05861.21 to 1.27 1.07111.28 to 1.39 1.08401.40 to 1.64 1.0972
over 1.64 1.1106
Table 5 Speed-ratio factors for usein the power-rating equation
Table 6 Constants for use in the power-rating equation
Table 7 The average time taken in linking the machine to thetractor and effective field capacity (EFC) of the modified and unmodified threshers
Table 4 Standard length Ls and length-correction factors K2for heavy-duty conventional english v-belts
Average time, hr EFC, fed/hrModified thresher 0.3 1.43Unmodified thresher 0.43 0.93
in linking the modified machine to the tractor in all plots was less com-pared to the unmodified thresher. The average time taken was 0.3 hr and 0.43 hr for the modified and unmodified machines respectively. The effective field capacities for the modified and unmodified machine were 1.43 fed/hr and 0.93 fed/hr re-spectively (Table 7). This is mainly due to the time taken and the effi-ciency in linking and preparing the thresher.
Statistically the difference be-tween the two machines was highly significant at 1 % level.
This modification was found very effective and useful in increasing the efficiency of work and reducing the time and cost of carrying out the threshing operation.
Conclusions• The modif ication helped in
(D - d)2c
(15.7 - 5.4)2 x 25
C2d
AGRICULTURAL MECHANIZATION IN ASIA, AFRICA, AND LATIN AMERICA 2007 VOL.38 NO.314
transmitting power from the t ractor hor izontal ly to the thresher without unlinking the machine in the field.
• The Field efficiency and effec-tive field capacity of the modi-fied thresher were increased re-sulting in time and cost saving of the harvesting operation.
REFERENCES
Crouse, W. H. 1980. Automotive Mechanics. Eighth Edition. Mc-Graw Hill Book Company.
Grossley, P. and J. Kilgour. 1983. Small Farm Mechanization for
Developing Countries. Silsoe, England, pp. 59-70.
Hunt, D. R. 1983. Farm Power and Machinery Management, 8th Edi-tion. Iowa State University Press. pp. 3-25, 129-148.
Hunt, D. R. and L. W. Gaiver. 1973. Farm Machinery Mechanisms. The Iowa State University Press Ames, Iowa.
Kepner R. A., Roy Bainer, and E. L. Barger. 1982. Principle of Farm Machinery Third Edition. AVI Publishing Company. Inc. West port Connecticut.
Krutz, G., L. Thompson, and P. Claar. 1984. Design of Agricul-tural Machinery. John Wiley &
Sons, New York. pp. 222-270.Liljedahl, J. B., W. M. Carleton, P.
K. Turnquist, and D. W. Smith. 1979. Tractors and Their Power Units, 3rd Edition. John Willey and Sons New York.
Maitra, G. M. 1985. Handbook of Gear Design. McGraw Hill Book Company Publishing Limited.
Shigley, J. E. and L. D. Mitchell. 1983. Mechanical Engineering Design, 4th Edition. Mc Graw-Hill Book Company.
Spotts, M. F. 1978. Design of Ma-chine Elements. 5th Edition, Pren-tice-Hall, Inc., Englewood Cliffs, New Jersey, pp. 269, 396-425.
■■
VOL.38 NO.3 2007 AGRICULTURAL MECHANIZATION IN ASIA, AFRICA, AND LATIN AMERICA 15
Performance Evaluation of Tractor Drawn WeedingCum Earthing-up Equipment for Cotton
byK. KathirvelProfessor and HeadAgricultural Engineering Collegeand Research Institute,Tamil Nadu Agricultural University, Coimbatore - 641 003INDIA
T. SenthilkumarResearch ScholarAgricultural Engineering Collegeand Research Institute,Tamil Nadu Agricultural University, Coimbatore - 641 003INDIA
R. ManianDeanAgricultural Engineering Collegeand Research Institute,Tamil Nadu Agricultural University, Coimbatore - 641 003INDIA
AbstractThe arduous operation of weeding
is usually performed manually with the use of traditional hand tools in an upright bending posture, induc-ing back pain for a majority of the labour. The situation necessitates the introduction of a suitable ma-chine for weeding operations. The unit developed consists of an inter cultivator cum earthing-up equip-ment fitted to a standard tractor drawn ridger. Three sweep type blades 45 cm wide are affixed to the ridger frame with 120º approach
angle and 15º lift angle for accom-plishing the weeding operation between standing rows of crops. Three ridger bottoms fitted behind the sweep blade work on the loos-ened soil mass and aid in earthing-up by forming ridges and furrows. The unit was evaluated for its per-formance with the available weed-ers and the conventional method. Manual weeding with a hand hoe registered the maximum efficiency of 82.56 % (wet basis) and 82.4 % (dry basis). The weeding efficiency of t ractor drawn weeding cum earthing-up implement was 60.24
(wet basis) and 61.62 (dry basis). The savings in cost of the weeding operation with bullock drawn junior hoe, self propelled power weeder and tractor drawn weeding cum earthing-up implement when com-pared to manual weeding was 78.7, 79.8 and 68.7 percent respectively. The savings in time of the weeding operation with bullock drawn junior hoe, self propelled power weeder and tractor drawn weeding cum earthing-up implement when com-pared to manual weeding was 96.5, 96.6 and 98.9 percent respectively.
IntroductionCrop intensification, timeliness
in farm operations and efficient use of production resources are critical inputs in increasing the productiv-ity of the agricultural sector. A de-crease in the availability of agricul-tural labour is a direct consequence of migration of agricultural labours
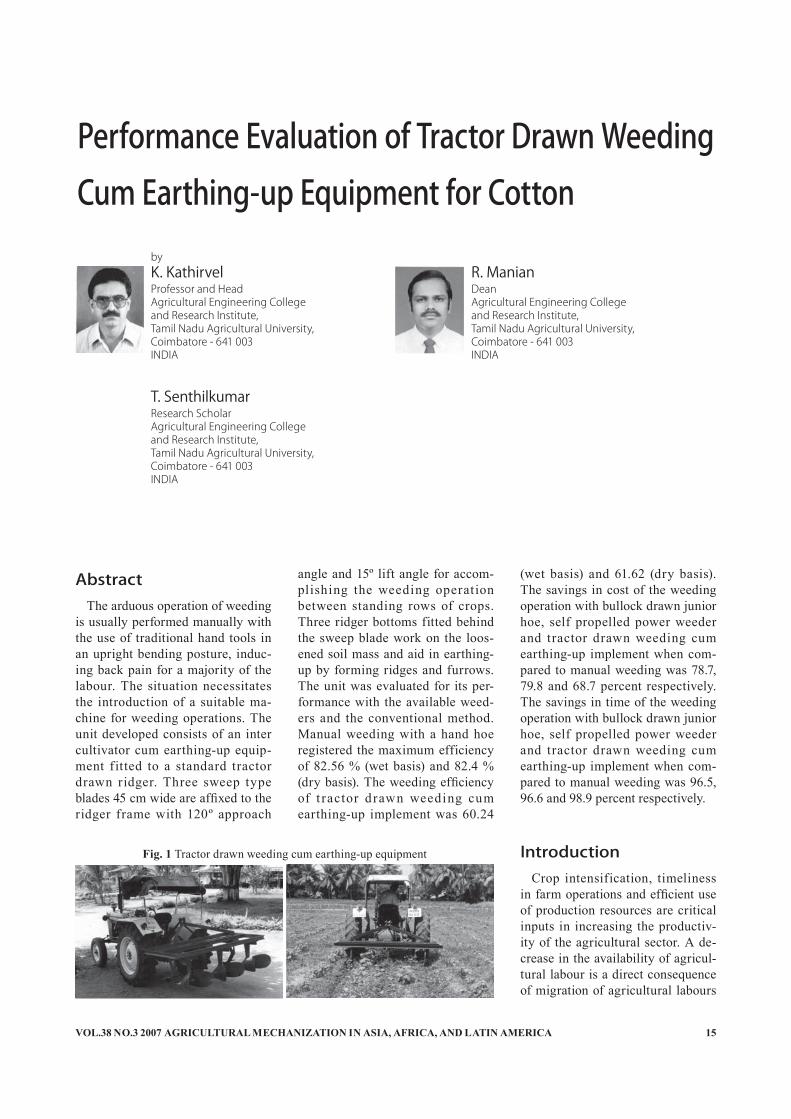
Fig. 1 Tractor drawn weeding cum earthing-up equipment

AGRICULTURAL MECHANIZATION IN ASIA, AFRICA, AND LATIN AMERICA 2007 VOL.38 NO.316
to the industrial sector due to the development of market economy and rural industries. One third of the cost of cultivation is spent on weeding alone when carried out with manual labour. The arduous operation of weeding is usually performed manually with the use of traditional hand tools in upright bending posture, inducing back pain for a majority of the labours. This situation necessitates the introduc-tion of a suitable machine for weed-ing operations in cotton cultivation.
Review of LiteratureThe yield of cotton was reduced
by 41.46 % when the weeds were allowed to grow unchecked. The treatment of weeding alone and interculture and weeding together, however, did not differ significantly. In the row crops of cotton after the 50th day of sowing with or without application of herbicide, the bullock drawn junior hoe was used for inter cultivation. After 2 or 3 times of inter cultivation with the junior hoe, urea or nitrogen was applied to the crop with the help of a ridger. The bullock drawn blade harrow gave better performance when compared to a bullock drawn three tyne cul-tivator as seen from Table 1. The tractor drawn high clearance culti-vator with full and half sweeps gave good results. A bullock drawn lister
plough may be used at the later stages of plant growth (Bahl et al., 1988).
A ridger should be used between the rows for inter-row cultivation and for collecting soil around the crop rows. Tractor drawn, high-clearance cultivators using full and one-half sweeps has given good results. The bullock-drawn lister plough may be used at later stages of plant growth. A ridger may be used between the rows for inter-row cultivation and for collecting the soil around the crop rows.
Materials and Methodsi. Development of Tractor Drawn Weeding Cum Earthing-up Equip-ment for Cotton
The unit developed consists of an inter cultivator cum earthing-up equipment fitted to a standard trac-tor drawn ridger. Three sweep type blades 45 cm wide are affixed to the ridger frame with 120º approach angle and 15º lift angle for accom-plishing the weeding operation between standing rows of the cotton crop. The operational view of the unit between the rows of cotton crop
is shown in Fig. 1. Three ridger bot-toms fitted behind the sweep blade work on the loosened soil mass and aid in earthing-up by forming ridges and furrows. The specifications of the unit are shown in Table 2.
The salient features of the unit are: weeding and earthing-up opera-tions are simultaneously performed in a single pass; row to row distance between the sweep blades and the ridger bottoms are adjustable (60, 75 and 90 cm); cost of the unit is Rs.12,000; and the capacity is 1.6 ha per day.
ii. Existing Models of Weeders for Cotton
The available models of weeders which can be used for weeding in the cotton crop are:
a. Self propelled power weeder (TNAU model)
b. Bullock drawn junior hoeThe description of the above men-
tioned implements and their specifi-cation are furnished below.a. Self Propelled Power Weeder (TNAU model)
The weeder was operated by a 3 hp petrol start kerosene run engine. The engine power was transmit-ted to ground wheels through a
Name of the weeder Weeding efficiency, %
Plant damage, % Man-hrs/ha Cost of weed-
ing Rs./haBlade harrow 76.8 12.16 6.63 15.15Three tyne cultivator 67.4 9.7 6.94 17.35
Table 1 Comparative performance of weeders
Details ValueOver all dimensions (L x B x W), mm 2100 x 630 x 1500Weight, kg 242Number of rows 3Number of weeding blades 3Number of ridger bottoms 3Shape of the weeding blade V shaped sweep bottomWidth of sweep blade, mm 450Approach angle, deg 120Lift angle 15Row spacing, cm Adjustable (60,75,90 cm)Source of power 35-45 hp tractorDepth of operation, cm 15
Table 2 Specification of weeding cum earthing-up implementWeeding efficiency, %
0
10
20
30
40
50
60
70
80
90
T4T3T2T1
Treatments
64.15
44.87
61.62
82.40
63.49
43.13
60.24
82.56 Wet basis
Dry basis
Fig. 2 Efficiency of weeders evaluated in cotton crop

VOL.38 NO.3 2007 AGRICULTURAL MECHANIZATION IN ASIA, AFRICA, AND LATIN AMERICA 17
V belt-pulley and sprocket-chain mechanism. A replaceable sweep blade was fixed at the back of the machine. Sweep blades of different width can be fitted to the machine depending on the row to row spac-ing of the crop. A tail wheel was provided at the rear to maintain the operating depth. The sweep blade could be raised or lowered so as to have the desired operating depth. A rotary weeding attachment to the power weeder was developed. The rotary tiller consisted of three rows of discs mounted with six curved blades in opposite directions alter-natively in each disc. These blades, when rotating, enabled cutting and mulching the soil. The width of coverage of the rotary tiller was 350 mm and the depth of opera-tion could be adjusted to weed and mulch the soil in the cropped field. In addition to the rotary tiller and sweep type blades, the ridger or cultivator could be easily fitted to the unit, in place of the rotary tiller by the operator for field operations. The cost of the machine was Rs.
(Wr)w(Wr)w + (Wr)w
53,000/- (Rs. 35,000/- excluding the prime mover). The capacity was 0.75 ha per day. Additional features of the unit make it useful for weeding between rows of crops like tapioca, cotton, sugarcane, maize, tomato and pulses whose row spacing was more than 45 cm. The specification of the power weeder are furnished in Table 3.b. Drawn Junior Hoe
The bullock junior hoe was an in-tercultural implement used primar-ily for weeding between the rows of standing crops. It consisted of reversible shovels with curved tynes attached to the framework with a hinge arrangement. A handle and beam were fixed to the framework for guiding and attaching the unit to the yoke. The spacing between the shovel could be adjusted according to the row spacing of the crop. The cost of the unit was Rs.1500.
iii. Conventional Method of Weed-ing
In the conventional method of weeding the cotton crop, weeding
is performed by women with a hand hoe. The hand hoe consists of a tri-angular shaped mild steel-weeding blade of 75 mm width attached to a short wooden handle of 450 mm length. The weeding operation is carried out in an upright bending posture.
iv. Treatments Selected for the In-vestigation
The treatments selected for the investigation included:
T1: Operation with junior hoe T2: Operation with self propelled
power weeder (TNAU model)T3: Operation with tractor drawn
inter cultivator T4: Control (Manual with hand
hoe)The developed t ractor drawn
weeding cum earthing-up imple-ment was evaluated for its perfor-mance in terms of weeding efficien-cy (wet basis and dry basis), depth of operation and percent breakage of cotton plant. The moisture content of the soil during evaluation was 14.48 percent on dry basis.
v. Weeding Efficiency and Percent Breakage
The weeding efficiency (wet ba-sis) was computed by using the fol-lowing expression.
ηww % = x 100
Where,
Details ValueOver all dimensions (L x B x H), mm 2400 x 1750 x 1100Weight, kg 300Source of power 3.5 hp petrol start kerosene engineNumber pf blades Sweep blade: 1, Shovel: 5Nominal working width, mm 2,250 (Adjustable depending on row spacing)Depth of operation, mm 30 (Adjustable)
Table 3 Specification of power weeder (TNAU model)
Depth of weeding operation, cm
0
2
4
6
8
10
12
14
16
0
2
4
6
8
10
12
14
16
T4T3T2T1T4T3T2T1
Treatments
4.874.2
9.51
0.22
6.1
14.7
0.8
2.4
Percent of plant damage, % Saving in cost, %
0
20
40
60
80
100
120
0
20
40
60
80
100
120
T3T2T1T3T2T1
Treatments
79.83
68.68
96.6
78.71
96.5 98.9
Saving in time, %
Fig. 3 Depth of operation of weeders and percentageof plant damage in cotton field
Fig. 4 Saving in cost and time when comparedto conventional method
AGRICULTURAL MECHANIZATION IN ASIA, AFRICA, AND LATIN AMERICA 2007 VOL.38 NO.318
ηww: Weeding efficiency (wet ba-sis), per cent
(Wr)w: Wet weight of weeds re-moved by the implement/m2
(Wu) w: Weight of weeds lef t in the field after the weeding operation/m2
The weeding efficiency (dry ba-sis) was computed by using the fol-lowing expression.
ηwd % = x 100
Where,ηwd: Weeding efficiency (dry ba-
sis), percent(Wr)d: Weight of oven dried weeds
removed by the implement/m2
(Wu) d: Weight of oven d r ied weeds left in the field after the weeding/m2
The percent breakage of cotton stalks was computed by using the following expression.
ηb, % = x 100
Where,Pb: Number of plants broken in
the rowPt: Total number of plants in the
row The cost of weeding with trac-
tor drawn weeding cum earthing-up implement was compared with weeding by power weeder, junior hoe and manual method of weeding. The cost and time saved by the trac-tor drawn weeding cum earthing-up implement against other methods was compared.
Particulars T1 T2 T3 T4
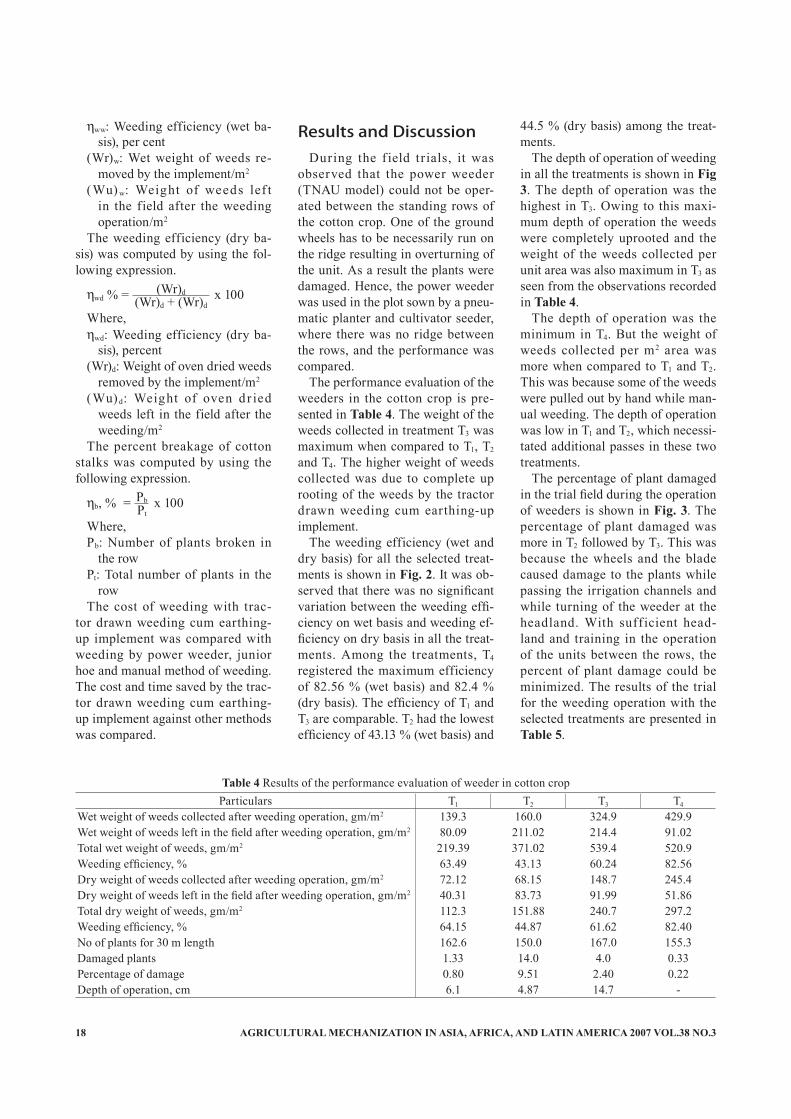
Wet weight of weeds collected after weeding operation, gm/m2 139.3 160.0 324.9 429.9Wet weight of weeds left in the field after weeding operation, gm/m2 80.09 211.02 214.4 91.02Total wet weight of weeds, gm/m2 219.39 371.02 539.4 520.9Weeding efficiency, % 63.49 43.13 60.24 82.56Dry weight of weeds collected after weeding operation, gm/m2 72.12 68.15 148.7 245.4Dry weight of weeds left in the field after weeding operation, gm/m2 40.31 83.73 91.99 51.86Total dry weight of weeds, gm/m2 112.3 151.88 240.7 297.2Weeding efficiency, % 64.15 44.87 61.62 82.40No of plants for 30 m length 162.6 150.0 167.0 155.3Damaged plants 1.33 14.0 4.0 0.33Percentage of damage 0.80 9.51 2.40 0.22Depth of operation, cm 6.1 4.87 14.7 -
Table 4 Results of the performance evaluation of weeder in cotton crop
Results and DiscussionDuring the f ield trials, it was
observed that the power weeder (TNAU model) could not be oper-ated between the standing rows of the cotton crop. One of the ground wheels has to be necessarily run on the ridge resulting in overturning of the unit. As a result the plants were damaged. Hence, the power weeder was used in the plot sown by a pneu-matic planter and cultivator seeder, where there was no ridge between the rows, and the performance was compared.
The performance evaluation of the weeders in the cotton crop is pre-sented in Table 4. The weight of the weeds collected in treatment T3 was maximum when compared to T1, T2 and T4. The higher weight of weeds collected was due to complete up rooting of the weeds by the tractor drawn weeding cum earthing-up implement.
The weeding efficiency (wet and dry basis) for all the selected treat-ments is shown in Fig. 2. It was ob-served that there was no significant variation between the weeding effi-ciency on wet basis and weeding ef-ficiency on dry basis in all the treat-ments. Among the treatments, T4 registered the maximum efficiency of 82.56 % (wet basis) and 82.4 % (dry basis). The efficiency of T1 and T3 are comparable. T2 had the lowest efficiency of 43.13 % (wet basis) and
44.5 % (dry basis) among the treat-ments.
The depth of operation of weeding in all the treatments is shown in Fig 3. The depth of operation was the highest in T3. Owing to this maxi-mum depth of operation the weeds were completely uprooted and the weight of the weeds collected per unit area was also maximum in T3 as seen from the observations recorded in Table 4.
The depth of operation was the minimum in T4. But the weight of weeds collected per m2 area was more when compared to T1 and T2. This was because some of the weeds were pulled out by hand while man-ual weeding. The depth of operation was low in T1 and T2, which necessi-tated additional passes in these two treatments.
The percentage of plant damaged in the trial field during the operation of weeders is shown in Fig. 3. The percentage of plant damaged was more in T2 followed by T3. This was because the wheels and the blade caused damage to the plants while passing the irrigation channels and while turning of the weeder at the headland. With suff icient head-land and training in the operation of the units between the rows, the percent of plant damage could be minimized. The results of the trial for the weeding operation with the selected treatments are presented in Table 5.
(Wr)d(Wr)d + (Wr)d
PbPt

VOL.38 NO.3 2007 AGRICULTURAL MECHANIZATION IN ASIA, AFRICA, AND LATIN AMERICA 19
The savings in cost and time of weeding operation with the bullock drawn junior hoe, self propelled power weeder and tractor drawn weeding cum earthing-up imple-ment are shown in Fig. 4. It is clear-ly shown from the figure that all the treatments T1, T2 and T3 resulted in savings of cost and time when com-pared to T4. T3, T2 recorded the high-est percent cost saving, followed by T1 and T3. High initial cost of the tractor and weeding unit increased the cost of weeding operation in T3 and hence it was the lowest. There was little difference in time saving among treatments T1, T2 and T3.
ConclusionsBased on the analysis of the re-
sults the following conclusions were drawn.
• An inter cultivator cum earth-ing-up implement f itted to a standard tractor drawn ridger was developed.
• The developed unit was evalu-ated for its performance in com-parison with the existing mod-els of weeders and conventional method of weeding.
• Manual weeding with hand hoe registered the maximum ef-ficiency of 82.56 % (wet basis)
and 82.4 % (dry basis). The weeding efficiency of tractor drawn weeding cum earthing-up implement was 60.24 % (wet basis) and 61.62 % (dry basis).
• The cost saving of the weed-ing operation with a bullock drawn junior hoe, self propelled power weeder and tractor drawn weed i ng cu m ea r t h i ng-up implement, when compared to manual weeding, was 78.7, 79.8 and 68.7 percent, respectively.
• The saving in time of weeding operation with bullock drawn junior hoe, self propelled power weeder and t r ac tor d raw n weed i ng cu m ea r t h i ng-up implement, when compared to manual weeding, was 96.5, 96.6 and 98.9 percent, respectively.
REFERENCES
Bahl, V. P., M. K. Garg, and M. L. Jain. Role of improved farm ma-chinery in increasing cotton produc-tivity. J Agric., Engg. ISAE, 20(4): 9-10.
Bahl, V. P., D. N. Sharma, and M. L. Jain. 1988. Cotton Cultivation in Haryana State, India. Agricultural Mechanization in Asia, Africa and Latin America, Japan, 19(4): 63-67.
■■
Particulars T1 T2 T3 T4
Width of operation, m 0.45 0.75 2.25 -Length of the field, m 46.0 46.0 46.0 -Time taken to travel, sec 65.6 60.54 100.3 -Forward speed of operation, kph 2.53 2.75 1.66 -Theoretical field capacity, ha/hr 0.114 0.207 0.373 -Size of the field, m2 ——————————— 46 x 11.5 = 1,890 m2. ———————————
Time taken, in 1st pass, min 27.9 29.7 16.0 -Time taken, in 2nd pass, min 27.0 24.6 - -Total time taken, min 54.9 51.4 16.0 450 woman hrs/haActural field capacity, ha/hr 0.058 0.06 0.198 -Field efficiency, % 50.9 50.0 52.6 -Cost of operation, Rs/hr 50 55 250 9.0Cost of weeding, Rs/hr 862.07 887.1 1,268.63 4,050.0Saving in cost when compared to conventional method, % 78.71 79.3 68.68 -Saving in time when compared to conventional method, % 96.5 96.6 98.9 -
Table 5 Result of the evaluation trail for weeding operation in cotton crop

AGRICULTURAL MECHANIZATION IN ASIA, AFRICA, AND LATIN AMERICA 2007 VOL.38 NO.320
Studies on Blending of Refined Soybean Oil andEthanol with Diesel as Hybrid CI Engine Fuel
byMukesh SinghSenior ScientistFarm Machinery and Power Engineering,L.P.M. Section, Indian Veterinary Research Institute,Izatnagar - 243 122INDIA
H. C. JoshiPrincipal ScientistFarm Machinery and Power Engineering,L.P.M. Section, Indian Veterinary Research Institute,Izatnagar - 243 122INDIA
T. K. BhattacharyaProfessor and Joint Director Extension (Engg.)Dept. of Farm Machinery and Power Engineering,Govind Ballbh Pant University of Agricultureand Technology, Pantnagar - 263 145INDIA
T. N. MishraProfessorDept. of Farm Machinery and Power Engineering,Govind Ballbh Pant University of Agricultureand Technology, Pantnagar - 263 145INDIA
AbstractBlend i ng of e t ha nol- d iesel ,
ethanol-refined soybean oil, diesel-ref ined soybean oil and diesel-refined soybean oil- ethanol in dif-ferent proportions were studied to explore possibility of a hybrid fuel suitable for CI engines. Different proportions were tried and physi-cal observations were studied for a period of three months on the basis of phase separation. It was found that there was a limiting percent-age of 20 % for anhydrous ethanol in ethanol-diesel blend. A 15 % of refined soybean oil was limiting in ethanol-refined soybean oil blend. Diesel-refined soybean oil could be mixed in any proportion without phase separation. In case of diesel-refined soybean oil-ethanol blend the results indicated that stable, ho-mogeneous and soluble fuel blends with no sign of phase separation were obtained when the blends had
40-70 percent diesel, 10-40 percent refined soybean oil and 5 to 20 per-cent anhydrous ethanol.
IntroductionThe petroleum sector plays an
important role in the economic de-velopment of any country. Energy consumption can be considered as a measure of the vibrancy of any economy. India is the eighth largest consumer of the petroleum oil in the world. Ever since the discovery of this black gold, there has been a consistent increase in its demand. The world oil demand in the year 2001 was around 77.6 mbd (mil-lion barrels a day). The demand is further expected to increase to 86 mbd by 2005 and 96 mbd by 2010 at a growth rate of 2 percent. It is interesting to note that 50 percent of future growth will be from India and China (Ram Mohan, 2003).
Thus, the search for alternative fu-els for internal combustion engines, automobiles and stationary/motive power, has become important. Inter-nal combustion engines continue to be the most important prime mov-ers and they consume more than one third of our crude oil import. Researchers all over the world focus attention on development of various alternative fuels, which may include renewable resources, or blending of renewable with non-renewable fuels.
In the recent past, biogas Ortiz-Canavate et al. (1981), Bhattacharya et al. (1988), compressed natural gas Das and Ghosh (1995), vegetable oils Peterson (1986) and alcohols Gupta (1983) have been found to be promising fuels for compression ig-nition engines. However, problems of transportability to distant use points of biogas and high viscos-ity as well as gumming tendency of crude vegetable oils have limited their capabilities to supplement die-

VOL.38 NO.3 2007 AGRICULTURAL MECHANIZATION IN ASIA, AFRICA, AND LATIN AMERICA 21
sel fuel in a large way. On the other hand the physical and thermody-namic characteristics of alcohols do not make them particularly suitable fuels for compression ignition en-gines, but they offer a means of re-ducing exhaust emissions of sulphur compounds, smoke, particulates and NOx. The main disadvantage of alcohols is that they have much lower energy content than gasoline or diesel thus requiring more fuel for the unit power produced. How-ever, this effect can be minimized to some extent by modification of engine design such as using higher compression ratio engines (Janius, 1988). The use of alcohols in CI engines also leads to reduced power output and can be compensated by injecting increased amounts of fuel. Other factors requiring consider-ation are the lower viscosity and lu-bricity of alcohols which may cause excessive wear in conventional fuel injection equipment. Apart from it, higher volatility of alchols may increase the risk of vapour lock and cavitation.
There are two possible approaches for using ethanol in a diesel engine. The diesel could be injected in the conventional way, along with a car-buretor added into the engine's air stream to atomize the ethanol placed in a separate tank. Alternately, the ethanol could be blended with
diesel. In order to reduce the incon-venience of engine modification necessary for atomization, ethanol-diesel blends have also been tried. It is convenient, as blended fuel is injected in the normal way without regulating the ethanol input rate separately. The diesel replacement is regulated automatically by the percentage of ethanol in the blend.
Vegetable oils, straight or modi-f ied, are known to offer several advantages as engine fuel. These in-clude better self-ignition character-istics, compatibility with fuel injec-tion system of the CI engine, high energy content and safe processing and handling. Moreover, vegetable oils can be processed on the farm it-self due to relatively simple and low cost technology of expelling and filtering, which may further save the transport cost. Based on simple calculations, researchers have indi-cated that one hectare of an oil seed crop can fetch adequate oil to meet the energy needs of an 8 to 10 hect-are of agricultural farm Burwer et al. (1980). These fuels can be read-ily incorporated in to energy pool, should the need arise due to sudden shortage or disruption in the exist-ing petroleum supply system. Also, vegetable oil fuels produce greater thermal efficiency than diesel fuel Goering et al. (1982). However, the use of vegetable oils in direct injec-
tion type diesel fuel engines is lim-ited due to higher viscosity. Viscosi-ties of vegetable oils are reported to be 10 to 20 times more than that of diesel fuel and are considered to be lower in total energy and higher in density, carbon residue, and particu-late matter (Ali, 1995).
It has been reported that in diesel engines, crude vegetable oils can be used as fuel, straight as well as in blend with the diesel (Shyam, 1984). However, the idea dates back to early part of last century in 1900 when Rudolph Diesel, the inventor of the diesel engine used Peanut oil to fuel the engine (Clevenger et al., 1988). Preliminary studies indicate that over short periods of time total replacement of diesel by vegetable oil fuels perform satisfactorily in unmodified diesel engines. How-ever, the problems associated with their use are difficulty in making a cold start, plugging and gumming of filters, fuel lines and injectors and engine knocking. In long-term uses, the problems may lead to reduced performance or even com-plete failure of the engine. These include choking of injector nozzles, carbon deposits on the piston and cylinder head, dilution of the crank-case lubricating oil, excess wear on the rings, pistons and cylinder and failure of the engine lubricating oil due to oxidation and polymeriza-
Fuel type Ethanol proof, º
Fuel constituents, %, v/v ObservationsDiesel Ethanol200º-80-20 200 80 20 Homogeneous blend with no sign of phase separation200º-75-25 200 75 25 Initially homogeneous blend but phase separation observed after 24h200º-74-26 200 74 26 Initially homogeneous blend but phase separation observed after 24h200º-73-27 200 73 27 Initially homogeneous blend but phase separation observed after 24h200º-72-28 200 72 28 Initially homogeneous blend but phase separation observed after 24h200º-71-29 200 71 29 Phase separation observed at initial stage of blending200º-70-30 200 70 30 Phase separation observed at initial stage of blending200º-65-35 200 65 35 Phase separation observed at initial stage of blending200º-60-40 200 60 40 Phase separation observed at initial stage of blending200º-55-45 200 55 45 Phase separation observed at initial stage of blending190º-85-15 190 85 15 Phase separation observed at initial stage of blending190º-80-20 190 80 20 Phase separation observed at initial stage of blending190º-72-28 190 72 28 Phase separation observed at initial stage of blending
Table 1 Observations on phase separation of diesel-ethanol blends
AGRICULTURAL MECHANIZATION IN ASIA, AFRICA, AND LATIN AMERICA 2007 VOL.38 NO.322
tion. These problems have been cor-related with several basic properties of vegetable oils, such as naturally occurring gums, high viscosity, acid composition, free fatty acid content and moderate cetane rating. It is crucial to understand and anticipate these problems before an attempt is made to use vegetable oils. This problem, combined with the viscos-ity of vegetable oils, presents the greatest difficulty in using vegetable oils in diesel engines. Therefore, several techniques are being used to reduce the viscosity. These include heating the vegetable oil to sufficient temperature to lower the viscosity to near specification range, diluting the vegetable oil with other less vis-cous liquid fuels to form blends that have been termed as hybrid fuels, micro emulsifying the vegetable oil and transesterification process, i.e. chemically converting the vegetable oil to simple esters of methyl, ethyl or butyl alcohols. The most popular diesel-vegetable oil fuel combina-tions have resulted from the blend-ing of the vegetable oils with con-ventional diesel fuels because they improve fuel properties, give better engine performance than with veg-etable oils alone as fuel and reduce the problems encountered because of smaller proportion blends.
The use of ethanol in diesel en-gines has been investigated (Wrage and Goering, 1980 and Boruff et al.,
1982) by using blending of diesel with ethanol. It was found that the cetane number of ethanol - diesel fuel blends assumed to increase proportionally with the increase in percentage of diesel in the blend and suggested that the blend of 20 percent ethanol and 80 percent die-sel would have a cetane rating equal to the ASTM minimum (Goering et al., 1983). It was further advised to keep alcohol content below 50 percent for minimum adequate ce-tane rating and heating value of the blend. In light of the above facts, the study was undertaken to ascertain the blending proportion of diesel, ethanol and refined soybean oil for preparation of hybrid fuel for a con-stant speed CI engines.
Materials and MethodsThe experiments were carried out
using high speed diesel (HSD) mar-keted by Indian oil Corporation in accordance with IS: 1460 - (1974) as as reference fuel for the preparation of blends with ethanol and refined soybean oil.
Anhydrous ethanol was one of the constituent of hybrid fuels prepared for the experiment. Anhydrous etha-nol made by Merck (CH3CH2 OH) was procured from the local market. Basically ethanol can be considered as a biomass based renewable fuel
which burns cleaner and has high-est octane rating. The application of ethanol as a supplementary engine fuel may reduce environmental pollution such as CO and smoke. The concentration of ethanol is expressed as ethanol proof, which represents twice the ethanol concen-tration. A 200º proof ethanol is an anhydrous absolute ethanol having 100 percent concentration of etha-nol. A 190º proof ethanol having 5 percent water content was prepared from the anhydrous ethanol by add-ing required quantity of distilled water.
Refined soybean oil was used as another constituent of the hybrid fuel. Better self-ignition charac-teristics, compatibility with fuel injection system of existing CI en-gines, high-energy content and high cetane number makes vegetable oils compatible with diesel. However, the viscosity of vegetable oils is 10-12 times more than that of die-sel, which must be reduced before supplementing them as an engine fuel.
Preparation of Hybrid Fuel BlendsThe preparation of fuel blends of
selected constituents was carried out as follows:
Diesel - Anhydrous Ethanol (200º proof) blends
Diesel - Aqueous Ethanol (190º proof) blends
Fuel type Ethanol proof, º
Fuel constituents, %, v/vObservationsRefined
soybean oil Ethanol
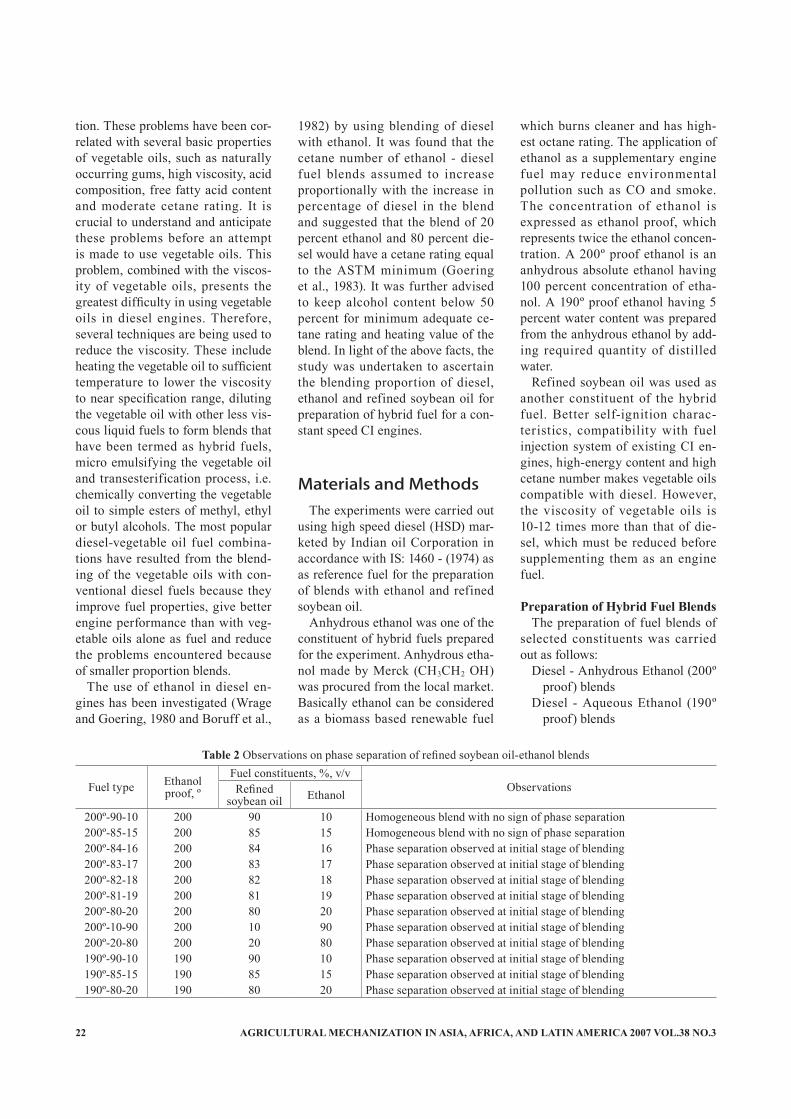
200º-90-10 200 90 10 Homogeneous blend with no sign of phase separation200º-85-15 200 85 15 Homogeneous blend with no sign of phase separation200º-84-16 200 84 16 Phase separation observed at initial stage of blending200º-83-17 200 83 17 Phase separation observed at initial stage of blending200º-82-18 200 82 18 Phase separation observed at initial stage of blending200º-81-19 200 81 19 Phase separation observed at initial stage of blending200º-80-20 200 80 20 Phase separation observed at initial stage of blending200º-10-90 200 10 90 Phase separation observed at initial stage of blending200º-20-80 200 20 80 Phase separation observed at initial stage of blending190º-90-10 190 90 10 Phase separation observed at initial stage of blending190º-85-15 190 85 15 Phase separation observed at initial stage of blending190º-80-20 190 80 20 Phase separation observed at initial stage of blending
Table 2 Observations on phase separation of refined soybean oil-ethanol blends

VOL.38 NO.3 2007 AGRICULTURAL MECHANIZATION IN ASIA, AFRICA, AND LATIN AMERICA 23
Refined Soybean Oil - Anhydrous Ethanol (200º proof) blends
Refined Soybean Oil - Aqueous Ethanol (190º proof) blends
Diesel - Refined Soybean OilDiesel - Refined Soybean Oil -
Anhydrous Ethanol (200º proof) blends
The anhydrous ethanol - diesel blends were prepared by blending 20-45 % ethanol with diesel. The initial level of 20 % was chosen as past researcher Ajav et al. (1999) had indicated that blending of 20 percent anhydrous ethanol with die-sel was found feasible.
The blends of diesel, anhydrous ethanol, aqueous ethanol and refined soybean oil were prepared as per above steps. The level of miscibility of the different fuel constituents with each other was studied by observing phase separation at the initial stage. The details of fuel blends prepared from different fuel constituents are given in Table 1 to 4.
The blends that did not show any sign of phase separation at the ini-tial stage were considered as stable. The stability of such blends was further observed at room tempera-ture (10-35 ºC) for a period of three months at an interval of seven days by visualizing phase separation.
Results and DiscussionThe stability and homogeneity
studies were conducted on different hybrid fuel blends prepared using diesel, refined soybean oil and vari-ous proofs of ethanol.
Stability of Hybrid Fuel BlendsThe suitability of blending dif-
ferent proofs of ethanol, diesel and refined soybean oil with each other was studied by conducting phase separation studies. The phase separation in blended fuels hav-ing different fuel constituents was observed on the basis of homogene-ity, solubility and colour of blends which are presented in Table 1 to 4.
The observations on blending of diesel and ethanol as shown in Table 1 indicate that a homogeneous blend with no sign of phase separation was obtained when 20 percent anhy-drous ethanol and 80 percent diesel was blended. This blend was found stable even after a period of three months. The blending of anhydrous ethanol (200º proof) with diesel in the range of 25 to 30 percent with an increment of 1 percent resulted in a homogeneous soluble fuel blend at the initial stage. However, in these blends the constituents got partially separated after a period of 24 hours. Further, the instant phase separation was observed in a thoroughly mixed anhydrous ethanol - diesel blends containing 35, 40 and 45 percent anhydrous ethanol. The 190º proof ethanol - diesel blends having 15, 20 and 28 percent ethanol were also not
found stable because the phase sep-aration in thoroughly mixed blends was observed at the initial stage of preparation. The observations was in line with the findings of (Ecku-lund et al., 1984) which described that solubility of ethanol with diesel was dependent on diesel fuels hy-drocarbon and its wax composition, ambient temperature, water content in ethanol and for practical purposes recommended blending of 20 per-cent or less anhydrous ethanol with diesel.
The observations on the blends of refined soybean oil and anhydrous ethanol as well as aqueous ethanol (190º proof) are presented Table 2. The table indicates that 10 to 20 per-cent anhydrous ethanol was blended with refined soybean oil. It was ob-served that a homogeneous, soluble and stable fuel blends of refined soy-bean oil and anhydrous ethanol with no sign of phase separation were obtained when 10 and 15 percent of anhydrous ethanol was blended. The blending of 16 percent anhydrous ethanol with refined soybean oil re-sulted in a blend, which initially did not show any sign of phase separa-tion but was found to have partial phase separation after 24 hours. The fuel blends containing refined soybean oil and anhydrous ethanol respectively between 17 to 20 per-cent were found to be unstable at the initial stage itself. The results also indicated distinct phase separa-tion at the initial stage in the blends having refined soybean oil mixed with 10, 15 and 20 percent aqueous ethanol of 190º proof. Therefore, blending of aqueous ethanol (190º proof) with refined soybean oil may not be feasible.
Table 3 shows the observations on the blends prepared using diesel and refined soybean oil. It was observed that in this blends 10 to 90 percent refined soybean oil were stable and did not show any sign of phase sepa-ration even after a period of three months. However, these blends were found to have a yellowish brown
Fueltype
Fuel constituents, %, v/v
ObservationsDiesel
Refined soybean
oil90-10 90 10 Homogeneous blend with no sign of phase separation80-20 80 20 Homogeneous blend with no sign of phase separation70-30 70 30 Homogeneous blend with no sign of phase separation60-40 60 40 Homogeneous blend with no sign of phase separation50-50 50 50 Homogeneous blend with no sign of phase separation40-60 40 60 Homogeneous blend with no sign of phase separation30-70 30 70 Homogeneous blend with no sign of phase separation20-80 20 80 Homogeneous blend with no sign of phase separation10-90 10 90 Homogeneous blend with no sign of phase separation
Table 3 Observations on phase separation of deisel refined soybean blends
AGRICULTURAL MECHANIZATION IN ASIA, AFRICA, AND LATIN AMERICA 2007 VOL.38 NO.324
colour which was different than the colour of diesel and refined soybean oil. It was also observed that the refined soybean oil - diesel blends were thicker than the diesel which was due to high viscosity of refined soybean oil.
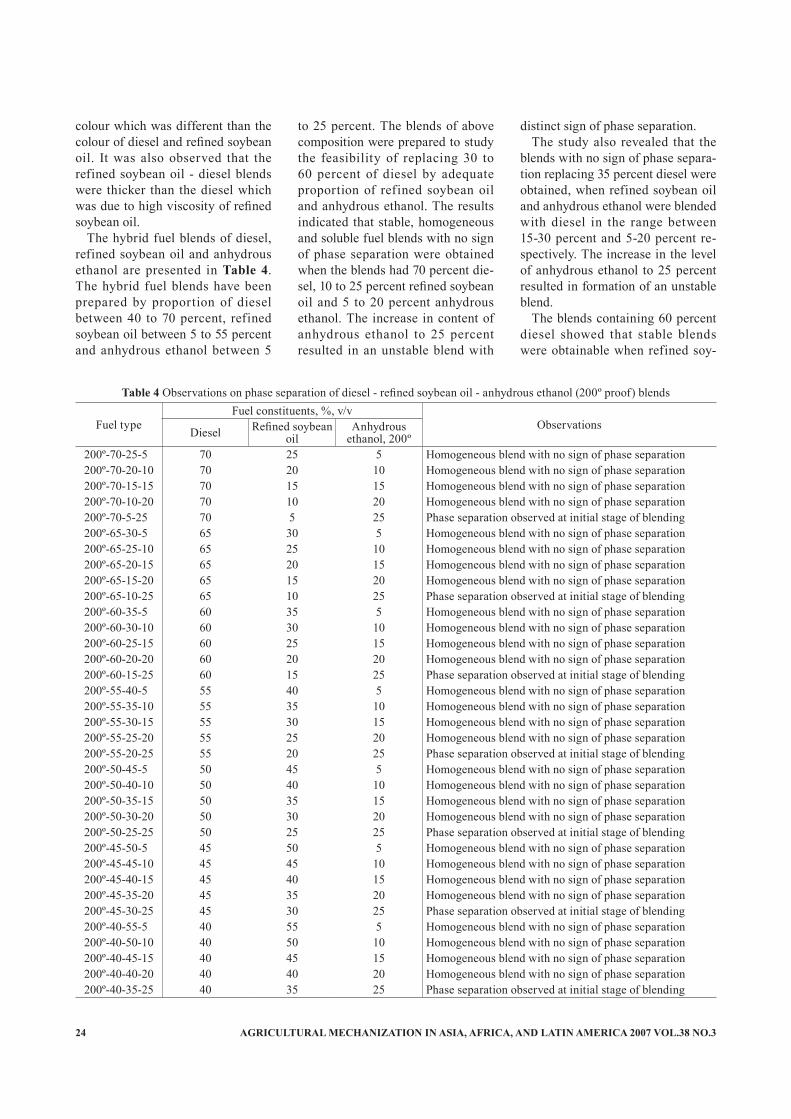
The hybrid fuel blends of diesel, refined soybean oil and anhydrous ethanol are presented in Table 4. The hybrid fuel blends have been prepared by proportion of diesel between 40 to 70 percent, refined soybean oil between 5 to 55 percent and anhydrous ethanol between 5
to 25 percent. The blends of above composition were prepared to study the feasibility of replacing 30 to 60 percent of diesel by adequate proportion of refined soybean oil and anhydrous ethanol. The results indicated that stable, homogeneous and soluble fuel blends with no sign of phase separation were obtained when the blends had 70 percent die-sel, 10 to 25 percent refined soybean oil and 5 to 20 percent anhydrous ethanol. The increase in content of anhydrous ethanol to 25 percent resulted in an unstable blend with
distinct sign of phase separation.The study also revealed that the
blends with no sign of phase separa-tion replacing 35 percent diesel were obtained, when refined soybean oil and anhydrous ethanol were blended with diesel in the range between 15-30 percent and 5-20 percent re-spectively. The increase in the level of anhydrous ethanol to 25 percent resulted in formation of an unstable blend.
The blends containing 60 percent diesel showed that stable blends were obtainable when refined soy-
Fuel typeFuel constituents, %, v/v
ObservationsDiesel Refined soybean
oilAnhydrous
ethanol, 200º200º-70-25-5 70 25 5 Homogeneous blend with no sign of phase separation200º-70-20-10 70 20 10 Homogeneous blend with no sign of phase separation200º-70-15-15 70 15 15 Homogeneous blend with no sign of phase separation200º-70-10-20 70 10 20 Homogeneous blend with no sign of phase separation200º-70-5-25 70 5 25 Phase separation observed at initial stage of blending200º-65-30-5 65 30 5 Homogeneous blend with no sign of phase separation200º-65-25-10 65 25 10 Homogeneous blend with no sign of phase separation200º-65-20-15 65 20 15 Homogeneous blend with no sign of phase separation200º-65-15-20 65 15 20 Homogeneous blend with no sign of phase separation200º-65-10-25 65 10 25 Phase separation observed at initial stage of blending200º-60-35-5 60 35 5 Homogeneous blend with no sign of phase separation200º-60-30-10 60 30 10 Homogeneous blend with no sign of phase separation200º-60-25-15 60 25 15 Homogeneous blend with no sign of phase separation200º-60-20-20 60 20 20 Homogeneous blend with no sign of phase separation200º-60-15-25 60 15 25 Phase separation observed at initial stage of blending200º-55-40-5 55 40 5 Homogeneous blend with no sign of phase separation200º-55-35-10 55 35 10 Homogeneous blend with no sign of phase separation200º-55-30-15 55 30 15 Homogeneous blend with no sign of phase separation200º-55-25-20 55 25 20 Homogeneous blend with no sign of phase separation200º-55-20-25 55 20 25 Phase separation observed at initial stage of blending200º-50-45-5 50 45 5 Homogeneous blend with no sign of phase separation200º-50-40-10 50 40 10 Homogeneous blend with no sign of phase separation200º-50-35-15 50 35 15 Homogeneous blend with no sign of phase separation200º-50-30-20 50 30 20 Homogeneous blend with no sign of phase separation200º-50-25-25 50 25 25 Phase separation observed at initial stage of blending200º-45-50-5 45 50 5 Homogeneous blend with no sign of phase separation200º-45-45-10 45 45 10 Homogeneous blend with no sign of phase separation200º-45-40-15 45 40 15 Homogeneous blend with no sign of phase separation200º-45-35-20 45 35 20 Homogeneous blend with no sign of phase separation200º-45-30-25 45 30 25 Phase separation observed at initial stage of blending200º-40-55-5 40 55 5 Homogeneous blend with no sign of phase separation200º-40-50-10 40 50 10 Homogeneous blend with no sign of phase separation200º-40-45-15 40 45 15 Homogeneous blend with no sign of phase separation200º-40-40-20 40 40 20 Homogeneous blend with no sign of phase separation200º-40-35-25 40 35 25 Phase separation observed at initial stage of blending
Table 4 Observations on phase separation of diesel - refined soybean oil - anhydrous ethanol (200º proof) blends

VOL.38 NO.3 2007 AGRICULTURAL MECHANIZATION IN ASIA, AFRICA, AND LATIN AMERICA 25
bean oil and anhydrous ethanol were blended in the range of 20 to 35 percent and 5 to 20 percent re-spectively. An unstable blend was formed when the level of anhydrous ethanol was increased to 25 percent.
The replacement of 45 percent diesel by forming stable and ho-mogeneous fuel blends of diesel, refined soybean oil and anhydrous ethanol were possible by blending 25 to 40 percent refined soybean oil and 5 to 20 percent anhydrous etha-nol and an increase of anhydrous ethanol to 25 percent level resulted in the formation of an unstable blend.
The blends containing 50 per-cent diesel, 30 to 45 percent refined soybean oil and 5 to 20 percent anhydrous ethanol were also found to be stable with no sign of phase separation. It was also seen that stable blends replacing 55 percent diesel were obtained when 35 to 50 percent refined soybean oil and 5 to 20 percent anhydrous ethanol were blended with diesel. The results also indicated that diesel replacement of 60 percent was obtainable from stable blends with no sign of phase separation when 40 to 55 percent refined soybean oil and 5 to 20 per-cent anhydrous ethanol were mixed. It is evident from the observations that in hybrid fuels, anhydrous etha-
nol may be blended up to 20 percent level because an increase to 25 percent level with possible diesel re-placement between 30 to 60 percent resulted in the formation of unstable blends with distinct sign of phase separation.
Engine PerformanceThe Engine performance of a
3.73 kW constant speed CI engine on three types of hybrid fuel blends was compared with diesel while measuring the brake power, fuel consumption and brake thermal ef-ficiency.
Effect of Fuel Types on Brake Power
The brake power developed by the engine operating on diesel, diesel - anhydrous ethanol blend (80:20), diesel - refined soybean oil blends mixed in 80:20 proportions and die-sel - refined soybean oil - anhydrous ethanol blends mixed in 40:40:20 proportions is presented in Table 5 at different loads and engine speeds. It is evident that the engine devel-oped brake power of 3.75 kW at 100 percent load on diesel and at 1,499 rpm. The rated power of the engine as specified by manufacturer was 3.73 kW at 1,500 rpm. At 110 per-
cent load, the engine on diesel de-veloped 4.06 kW while correspond-ing engine speed was 1,486 rpm. The engine was able to develop its rated power at its rated speed (1,500 rpm) as specified by manufacturer at 100 percent load.
Table 5 shows that the engine was able to develop almost similar power on fuel types at every se-lected brake load. The engine also developed its rated power on all selected fuel types at 100 percent load and the corresponding engine speed was found to be close to its rated speed. It is, therefore, evident from the observed results that the performance of the engine in terms of brake power on the selected fuel types was all most identical. This could be due to the reason that the volumetric fuel flow rate on hybrid fuels was higher thus contributing energy supply near to diesel.
Effect of Fuel Types on Fuel Con-sumption
The fuel consumption (l/h) of the engine on diesel and selected blends of diesel, refined soybean oil, anhy-drous ethanol is shown in Table 6. It is evident that the fuel consumption of the engine gradually increased with increase in brake load on all fuel types. The fuel consumption of the engine at rated power on
Fuel type
Brake load, %No load 25 50
engine speed, rpm
Brake power,
kw
engine speed, rpm
Brake power,
kw
engine speed, rpm
Brake power,
kwDiesel 1,604 - 1,532 0.95 1,535 1.91Diesel - anhydrous ethanol blend (80:20) 1,541 - 1,544 0.96 1,540 1.90Diesel - refined soybean oil blend (80:20) 1,593 - 1,563 0.98 1,576 1.96Diesel - refined soybean oil - anhydrous ethanol blend (40:40:20) 152.3 - 1,506 0.95 1,489 1.86
Fuel type
75 100 110engine speed, rpm
Brake power,
kw
engine speed, rpm
Brake power,
kw
engine speed, rpm
Brake power,
kwDiesel 1,502 2.80 1,499 3.73 1,486 4.06Diesel - anhydrous ethanol blend (80:20) 1,536 2.87 1,532 3.82 1,521 4.17Diesel - refined soybean oil blend (80:20) 1,551 2.90 1,533 3.81 1,515 4.14Diesel - refined soybean oil - anhydrous ethanol blend (40:40:20) 1,505 2.81 1,508 3.75 1,490 4.08
Table 5 Brake power developed by the Kirloskar AVI engine on different fuels

AGRICULTURAL MECHANIZATION IN ASIA, AFRICA, AND LATIN AMERICA 2007 VOL.38 NO.326
diesel was 1.336 l/h. The observed fuel consumption at 100 percent load, i.e. when the engine was de-veloping its rated power was higher (1.478 l/h) on the blend containing 80 percent diesel and 20 percent anhydrous ethanol. The observed fuel consumption of the engine also indicates that a decrease in diesel content in the blends resulted in an increase in fuel consumption.
Effect of Fuel Types on Brake Thermal Efficiency
The observed brake thermal ef-ficiency of the engine on selected fuel types is shown in Table 7. The brake thermal eff iciency of the engine was found to be highest on all fuel types at 110 percent load. The brake thermal efficiency of the engine on diesel when developing rated power, i.e. at 100 percent load was 24.7 percent. The comparison of observed brake thermal efficien-cy indicates that when the engine developed its rated power, it was 22.9 percent on diesel - anhydrous ethanol blend mixed in proportion of 80:20 and 24.6 percent on diesel - refined soybean oil blends mixed in 80:20 proportion. The engine under similar conditions had the brake thermal efficiency of 24.5 percent on the diesel - refined soybean oil - anhydrous ethanol blends mixed in
Fuel typeBrake load, %
No load 25 50 75 100 110Fuel consumption, l/h
Diesel 0.493 0.671 0.870 1.069 1.336 1.449Diesel - anhydrous ethanol blend (80:20) 0.620 0.757 0.932 1.172 1.478 1.611Diesel - refined soybean oil blend (80:20) 0.483 0.659 0.868 1.100 1.371 1.461Diesel - refined soybean oil - anhydrous ethanol blend (40:40:20) 0.596 0.760 0.899 1.133 1.354 1.483
Table 6 Fuel consumption of Kirloskar AVI engine on different fuels
40:40:20 proportions. The observa-tions on brake thermal efficiency of the engine when developing rated power was found almost similar to diesel on the diesel-refined soybean oil blends mixed prepared 80:20 proportion and on the blend of die-sel - refined soybean oil - anhydrous ethanol mixed in 40:40:20 propor-tions.
ConclusionsThe blending of anhydrous etha-
nol up to 20 percent level with die-sel was found feasible. The blend-ing to this level forms a stable and homogeneous blend. Distinct phase separation was observed when 190º proof aqueous ethanol was blended with diesel as well as with refined soybean oil. Thus blending of aque-ous ethanol of lower proof does not seem to be practical.
Stable and homogeneous blends of refined soybean oil and diesel were formed when 10 to 90 percent refined soybean oil was blended. The blending of diesel, refined soy-bean oil and anhydrous ethanol was found to produce blends without any sign of phase separation when the level of anhydrous ethanol was kept between 5 to 20 percent and that of refined soybean oil between 10 to
40 percentThe blending of refined soybean
oil and anhydrous ethanol mixed in the proportion of 85:15 also formed a stable and homogeneous blend. However, mixing 20 percent anhy-drous ethanol to this resulted in an unstable blend
The observed results of engine shor t-term test reveled that the selected hybrid fuels had similar power producing capability, slightly more fuel consumption and compa-rable thermal efficiency. The per-formance of the engine on them was also found compatible with diesel.
REFERENCES
Ajav, E. A., B. Singh, and T. K. Bhattacharya. 1999. Experimen-tal study of some performance parameters of a constant in speed stationary diesel engine using ethanol-diesel blends as fuel. Bio-mass and Bioenergy, UK V(17)pp 357-365.
Ali, Y., M. A. Hanna, and S. L. Cuppett. 1995. Fuel properties of tallow and soybean oil esters. Journal of American oil chemist society 72(12): 1557-1564.
Bhattacharyya, T. K., B. Singh, and T. N. Mishra. 1988. A compres-sion ignition engine on biogas-
Fuel typeBrake load, %
No load 25 50 75 100 110Brake thermal efficiency, %
Diesel - 12.6 19.4 23.2 24.7 24.8Diesel - anhydrous ethanol blend (80:20) - 11.2 18.0 21.7 22.9 22.9Diesel - refined soybean oil blend (80:20) - 13.1 20.0 24.3 24.6 25.1Diesel - refined soybean oil - anhydrous ethanol blend (40:40:20) - 11.1 18.3 22.0 24.5 24.4
Table 7 Brake thermal efficiency of Kirloskar AVI engine on different fuels

VOL.38 NO.3 2007 AGRICULTURAL MECHANIZATION IN ASIA, AFRICA, AND LATIN AMERICA 27
diesel fuel. Agricultural Mecha-nization in Asia, Africa and Latin America (AMA) 19(3): 32-36.
Boruff, P. A., A. W. Schwab, C. E. Goering, and E. H. Pryde. 1982. Evaluation of diesel fuel-ethanol microemulsions. Transactions of the ASAE. 25(1): 47-53.
Bruwer, J. J., B. J. Boshoff, R. J. C. Hugo, J. Fuls, C. Hawkins, and A. N. Vander Walt. 1980. Sunflower seed as an extender for diesel fuel. Agricultural Technical services, Pretoria, South Africa.
Clevenger, M. D., M. O. Bagby, C. E. Goering, A. W. Schwab, and L. D. Savage. 1988. Developing an accelerated test of coking tenden-cies of alternative fuels. Transac-tions of the ASAE. 31(4): 1054- 1058.
Das, R. K. and B. B. Ghosh. 1995. Some studies on the use of CNG in research and commercial diesel engines. Institution of Engineers (India). Journal of Mechanical Engineering Section. 76: 16-23.
Ecklund, E. 1984. Alcohols in diesel engine: A review SAE paper no. 840119.Society of Automotive En-gineers. 28(1): 70-74.
Goering, C. E., A. W. Schwab, R. M. Campion, and E. H. Pryde. 1982. Evaluation of soybean oil aqueous ethanol microemulsion for diesel engines. ASAE Proceeding of the International Conference of Plant and Vegetable oils as fuels, Fargo, ND.
Goering, C. E., A. W. Schwab, R. M. Campion, and E. H. Pryde. 1983. Soyoil-ethanol microemul-sion at diesel fuel. Transactions of the ASAE. 26(06): 1602-1604.
Gupta, C. P. 1983. Use of alcohol in diesel engines- A review. Institu-tion of Engineers (India) Journal of Mechanical Engineering. 63: 199-211.
IS: 1460 : (1974) Diesel Fuel Speci-fications. Bureau of Indian Stan-dards, New Delhi.
Janius, R. 1988. Alcohol as a tractor fuel - is there any future? Agri-
cultural Mechanization in Asia, Africa and Latin America: 19 (04): 75-77
Ortiz-Crnavate, J., D. J. Hills, and W. J. Chancellor. 1981. Diesel engine modification to operate on biogas. Transactions of the ASAE. 24(4): 808-811.
Peterson, C. L. 1986. Vegetable oil as diesel fuel: Status and research priorities. Transactions of the ASAE. 29(5): 1413:1422.
Ram Mohan, S. 2003. Refining: More chal lenges ahead. The Hindu Survey of Indian Industry. 2003. Pp: 199-203.
Shyam, M., S. R. Verma, and B. S. Pathak. 1984. Performance of a 5 HP diesel engine with various blends of plant oils and diesel/kerosene oils. J. Agric. Engg. ISAE. 21(3): 1-14.
Wrage, K. E. and C. E. Goering. 1980. Technical feasibility of diesohol. Transactions of the ASAE. 23 (5): 1338-1343.
■■
W. B. Hoogmoed
Present Position: University Lecture,Faculty of Lsg Agrarische Bedrijfstechnologie,
Wageningen University Agrotechnologie en VoedingswetenschappenAddress: Wageningen University, Bornsesteeg 59, 6700 AA, Wageningen / Netherland
Tel.: 0317-484375Email: [email protected]
New Co-operating Editor

AGRICULTURAL MECHANIZATION IN ASIA, AFRICA, AND LATIN AMERICA 2007 VOL.38 NO.328
Effect of Whole Body Vibration of Riding TypePower Tiller
byBinisamAssistant ProfessorKelappaji College of Agricultural Engineering and Technology,Kerala Agricultural University,Tavanur - 679 573INDIA
R. ManianDeanAgricultural Engineering College andResearch Institute, Tamil Nadu Agricultural University,Coimbatore - 641 003INDIA
K. KathirvelProfessor and HeadAgricultural Engineering College andResearch Institute, Tamil Nadu Agricultural University,Coimbatore - 641 003INDIA
L. P. GiteProject CoordinatorCentral Institute of Agricultural Engineering,Nabi Bagh, Berasia Road, Bhopal - 462 038INDIA
AbstractThe whole body vibration of a
riding type power tiller was investi-gated in accordance with ISO 2631 (1985). For measuring whole body vibration, triaxial seat accelerometer type 4322 was used as a transducer. The accelerometer was placed on the operator's seat at a point on the interface between the operator and his seat. Whole body vibration was measured using the portable four channel B & K PULSE multi-analyzer system. Whole body vibra-tion was measured as frequency weighted r.m.s value of acceleration for the one-third octave band, hav-ing centre frequencies from 1 to 80 Hz (ISO 2631). All the transducers were calibrated before the trials. The whole body vibration was mea-sured for the x, y, and z directions. The experiments were conducted during rototilling with rotovator in untilled and tilled field conditions and during transport mode of riding
type power tiller with empty trailer on farm roads and bitumen roads. Measurements were made at differ-ent forward speeds, viz. 1.5 km h-1, 1.8 km h-1, 2.1 km h-1 and 2.4 km h-1 during field trials and 3.5 km h-1, 4.0 km h-1, 4.5 km h-1 and 5.0 km h-1 during transport mode. The whole body vibration varied from 0.823 to 1.21 m s-2 and 0.776 to 1.11 m s-2 during rototilling in untilled and tilled fields, respectively. The over-all ride vibration level increased by 6.05 to 9.09 percent in an untilled field when compared to tilled field. The safe exposure limit varied from 4-8 h to 2.5-4 h with the increase in forward speed from 3.5 to 5.0 km h-1 in an untilled and tilled field. The human reaction was “fairly uncomfortable” to “uncomfortable” during field operation. The whole body vibration varied from 0.686 to 1.06 m s-2 and 0.660 to 0.967 m s-2 during transport on farm and bitu-men roads, respectively. The safe exposure limit was 4 to 8 h dur-
ing transport on farm and bitumen roads. The likely human reaction was “fairly uncomfortable”. In gen-eral the increase in forward speed
Fig. 1 Directions of coordinate system for mechanical vibrations influencing human
LegendX axis: Longitudinal direction (back- to-chest), Y axis: Lateral direction (right side to left side), Z axis: Vertical direction (foot or buttrocks to head)

VOL.38 NO.3 2007 AGRICULTURAL MECHANIZATION IN ASIA, AFRICA, AND LATIN AMERICA 29
resulted in increase of whole body vibration. Vibration dose values (VDV) for whole body vibration were within the maximum recom-mended limit of VDV (BS 6841, 1987) of 15 ms-1.75 for all operations.
IntroductionMechanization in agriculture has
changed the characteristics of labour and it also influences the workload. Need for timeliness of operation and increased capacity, has led to higher speeds and bigger and heavier machines. The operation of these machines increases workload on the operators as well as occupational hazards and diseases that impair the performance of the operator. In farm works, the fatigue and dis-comfort to which human beings are subjected is not only due to physical labour, but to vibration and noise as well (Huang and Suggs, 1968). Exposure to whole body vibration causes a complex distribution of os-cillatory motions and forces within the human body for a power tiller with seating attachment. The low frequency ride vibrations to which the operator is subjected results from both linear displacement of the power tiller and rotational oscil-lations of the pitch and roll modes (Mehta et al., 1997). Exposure to the whole body can either cause perma-nent physical damage, or disturb the nervous system. The four principal effects of ride vibrations are consid-ered to be (i) degraded health, (ii)
impaired activities, (iii) impaired comfort and (iv) motion sickness. Hence, measurement and evaluation of ride vibrations are necessary for assessing operator’s comfort and to suggest limits for the continuous operation of power tillers with seat-ing attachment.
Review of LiteratureHigher vibration in the vertical
and longitudinal directions resulted in an increased ventilation rate (Huang and Suggs, 1967). Lilje-dahl et al. (1979) reported that ride vibration intensities had a positive correlation with ground speed and often become intolerable as speed is increased. Vladimirov et al. (1985) measured vibration of a tractor cab seat of a wheeled tractor with a two-axle trailer in the field. Three passes in two types of terrain (straw stubble and farm road) were made and vibrations were measured in three directions on the cab seat and on the tractor chassis. Spectral den-sities of vertical vibrations and the correlation functions showed that the driving speed and the weight of the trailer played the key role in seat vibrations. They reported that there was an increase in acceleration with forward speed. Mehta et al. (1997) measured ride vibrations on a 7.5 kW rotary power tiller under differ-ent operating conditions. The over-all ride vibration level (SUM) in-creased with forward speed of travel under all operating conditions. Cli-
jmans et al. (1998) reported that the rotating parts within the machine and the soil roughness in combina-tion with driving speed, contribute to the tractor vibrations. Kawakani et al. (1999) evaluated a medium class tractor on a gravel road and on pasture for ride vibrations. Vertical vibration had the highest accelera-tion level in the tractor driven on a gravel road without any implements attached, and during that ride 20-50 percent of the vertical vibrations were transmitted to the seat. Ac-celerations in the one-third octave band of the vertical vibrations re-mained under ISO exposure limit of 8 h. Mehta et al. (2000) quantified the ride vibration of a low horse power tractor-implement system. He reported that the SUM vibration levels increased as forward speed of travel increased under most of the operating conditions.
Materials and MethodsThe whole body vibrat ion of
the power t i l ler was measured and analyzed using the portable PULSE mult i-analyzer system (Brüel & Kjær Type 3560 C). The PULSE multi-analyzer system is a versatile, task oriented analysis sys-tem for vibration and noise analysis. It provided the platform for a range of PC-based measurement solutions. Type 3650 C is a portable system powered by internal batteries or an external DC supply. The base soft-ware for a PULSE system is vibra-
Fig. 2 Triaxial seat accelerometer placed on metallic seat of power tiller B
Fig. 3 Triaxial seat accelerometerplaced on the trailer seat
Fig. 4 Instrumentation set up for measureing WBV of power tiller

AGRICULTURAL MECHANIZATION IN ASIA, AFRICA, AND LATIN AMERICA 2007 VOL.38 NO.330
tion and noise analysis type 7700. On this base, pulse software such as data recorder type 7701 was in-stalled. The entire system consisted of a portable data acquisition unit- front end type 2827, vibration and noise analysis software type 7700, data recorder type 7701 and tri-axial seat accelerometer type 4322.
The power tiller was put in proper test condition before conducting the experiments, that is, in full working order with full fuel tank and radia-tor, without optional front weights, tire ballast and any specialized components. Tires used for the tests were of standard size and depth of treads was not less than 70 percent of the depth of a new thread. Pneu-matic wheels with recommended tyre pressure of 1.5 kg cm-2 and 2.5 kg cm-2 were used during rototill-ing and transporting operations, respectively. There were no known mechanical defects that would result in abnormal vibration in both power tillers.
For measuring whole body vibra-tion, a triaxial seat accelerometer
type 4322 was used as a transducer (Mehta et al., 1997; Sorainen et al., 1998; and Mehta et al., 2000). The accelerometer was placed on the operator’s seat at a point on the interface between the operator and his seat (Lovesey, 1970; Mehta et al.,1997; and Mehta et al., 2000). This point corresponds to the ischial tuberosites of the human body. A triaxial seat accelerometer contained three independent accelerometers which simultaneously measured the vibration level along three mutu-ally perpendicular axes, viz. vertical (az), longitudinal (ax) and lateral (ay) according to the International Stan-dard 2631 (1985) as shown in Fig. 1. The views of Triaxial seat accel-erometer placed on the metallic seat of power tiller and trailer seat are shown in Figs. 2 and 3, respectively.
Whole body vibration was mea-sured as frequency weighted r.m.s value of acceleration for the one-third octave band having centre fre-quencies from 6.3 to 1250 Hz (ISO 2631). All the transducers were calibrated before the trials. The
instrument set up for measuring whole body vibration of power tiller is shown in Fig. 4. The whole body vibration was measured for the x, y, and z directions.
The experiments were conducted during rototilling with rotavator in untilled and tilled field conditions and during transport mode of power tiller with empty trailer on farm road and bitumen road. The depth of operation was maintained at a constant level of about 15 cm during rototilling. The subjects were in-structed to hold the handle grip with a light and constant compression force. The subjects were requested to keep upright posture during the whole body vibration measurement because the upper body spinal axis is aligned with the vertical vibration vector when sitting upright (Wilder et al., 1994). The natural frequency of the upright posture was greater than the equivalent natural frequen-cy of the forward and full back pos-tures. The higher natural frequency of the upright posture indicated that the subject was mechanically stiffer
Forward speed,km h-1
Human criteria for assessment of WBV as per ISO 2631 (1985)Mean value of
vector sum,m s-2, 4-8 Hz
Fatigue decreased proficiency boundary, h
Exposure limit,h
Reduced comfort boundary, h
A. Rototilling in untilled field1.5 0.823 1-2.5 4-8 1-161.8 0.966 1-2.5 4-8 1-162.1 1.10 1-2.5 2.5-4 1-162.4 1.21 0.42-1 2.5-4 1-16
B. Rototilling in tilled field1.5 0.776 1-2.5 4-8 1-161.8 0.859 1-2.5 4-8 1-162.1 1.030 1-2.5 4-8 1-162.4 1.110 1-2.5 2.5-4 1-16
C. Transport in farm road3.5 0.686 2.5-4 4-8 16-254.0 0.759 1-2.5 4-8 1-164.5 0.963 1-2.5 4-8 1-165.0 1.060 1-2.5 4-8 1-16
D. Transport in bitumen road3.5 0.660 2.5-4 4-8 16-254.0 0.726 1-2.5 4-8 1-164.5 0.951 1-2.5 4-8 1-165.0 0.967 1-2.5 4-8 1-16
Table 1 Whole body vibration
Forward speed,km h-1
Vibration dose volue,(VDV) - (m s-1.75)
A. Rototilling in untilled field1.5 10.721.8 12.582.1 14.322.4 15.76
B. Rototilling in tilled field1.5 10.101.8 11.192.1 13.412.4 14.46
C. Transport in farm road3.5 8.944.0 9.894.5 12.545.0 13.81
D. Transport in bitumen road3.5 8.594.0 9.464.5 12.395.0 12.59
Table 2 Vibration dose value for 8 h exposure time for selected operations

VOL.38 NO.3 2007 AGRICULTURAL MECHANIZATION IN ASIA, AFRICA, AND LATIN AMERICA 31
when sitting upright. Measurements were made at dif-
ferent forward speeds, viz. 1.5 km h-1, 1.8 km h-1, 2.1 km h-1 and 2.4 km h-1 during field trials and 3.5 km h-1, 4.0 km h-1, 4.5 km h-1 and 5.0 km h-1 during transport mode of a riding type power tiller provided with a me-tallic seat. The PULSE programme was activated after the power tiller was started for the operation and the measurement was recorded with an acquisition period of 60 seconds (Ying et al., 1998). Each trial was repeated five times for all operating conditions. The same procedure was repeated for all the selected subjects.
The Br it ish Standard (6841) specifies limiting values that spec-ify approximate indications of the likely human reactions to various magnitudes of frequency weighted r.m.s acceleration levels. The over-all weighted acceleration values for different operating conditions are compared with the values and the human reactions for all the power tiller operations were determined. The vibration dose value was given by the fourth root of the integral of the fourth power of the acceleration after it has been frequency weight-ed. Vibration dose values for 8 hour exposure time were calculated for each selected forward speed under different operating conditions and the results were compared with the maximum recommended limit of
VDV (BSI 6841, 1987) of 15 ms-1.75.
Results and discussionThe mean values of accelera-
tion in x, y and z direction of each subject at selected levels of forward speed for power tiller B during ro-totilling in an untilled field are fur-nished in Table 1.
There was an increase in r.m.s. weighted accelerat ion with the increase in forward speed. It is inferred that ride vibration levels in untilled field were within the 1 to 2.5 hour fatigue decreased proficiency boundary limit during rototilling at forward speeds of 1.5, 1.8 and 2.1 km h-1, but limited to 0.42-1.0 h at the forward speed of 2.4 km h-1. The results indicated that the safe exposure limit during rototilling in untilled was 4-8 h at the forward speed of 1.5 km h-1 and 1.8 km h-1, respectively. But further increase in forward speed from 1.8 to 2.4 km h-1, the exposure limit was restricted to 2.5-4 h (Mehta et al., 1997). Exceeding the exposure limit will reduce the health and safety of the subject and may cause severe discomfort, pain and injury (ISO, 2631).
The increase in forward speed had no effect on the fatigue decreased proficiency boundary limit of 1-2.5 h of the subjects. The overall ride
vibration values (SUM) were within the 4-8 h exposure limit when the power tiller was operated at the forward speeds of 1.5, 1.8 and 2.1 km h-1 but limited to 2.5-4 h at the forward speed of 2.4 km h-1, respec-tively. The comfort of the subject was reduced within 16 minutes of operation for all the selected levels of forward speed.
Ride vibrat ion levels dur ing transport on farm roads were up to 4 h fatigue decreased proficiency boundary limit at the forward speed of 3.5 km h-1, but limited to 2.5 h at the forward speeds of 4.0, 4.5 and 5.0 km h-1, respectively and the safe exposure limit was 4-8 hours at all selected levels of forward speeds. With the increase in speed from 3.5 to 5.0 km h-1, the comfort of the subject was reduced from 25 to 16 minutes of operation.
Comparison of r ide vibration values between untilled and tilled showed (Fig. 5) that the peak value was less in tilled field. This might be due to the more cushioning effect of the tilled soil below the wheels. The increase in forward speed from 1.5 to 2.4 km h-1 resulted in an in-creased overall ride vibration level by 6.05 to 9.09 percent in untilled field when compared to tilled field. The result clearly showed the effect of terrain condition in inducing vi-bration (Clijmans et al., 1998).
Comparison of r ide vibration
Overall ride vibration value, m s-2
1.5 1.8 2.1 2.40.6
0.7
0.8
0.9
1.0
1.1
1.2
1.3 Test 2
Test 1
Forward speed, km h-1
Power tiller B (Tilled)Power tiller B (Untilled)
RototillingOverall ride vibration value, m s-2
3.5 4.0 4.5 5.00.6
0.7
0.8
0.9
1.0
1.1 Test 2
Test 1
Forward speed, km h-1
Power tiller B (Bitumen road)Power tiller B (Farm road)
Transporting
Fig. 5 Whole body vibration for different seat
AGRICULTURAL MECHANIZATION IN ASIA, AFRICA, AND LATIN AMERICA 2007 VOL.38 NO.332
values in farm and bitumen road showed (Fig. 5) that the peak value was less on bitumen roads. The in-crease in forward speed from 3.5 to 5.0 km h-1 resulted in an increased overall ride vibration level by 1.3 to 6.5 percent in bitumen roads when compared to farm roads. The ac-celeration values were higher in the field condition when compared to transport mode. The rotating parts within the machine and the soil roughness in combination with for-ward speed contribute to relatively more vibration in field conditions than during transport mode.
The vector sum acceleration was compared with the limiting values prescribed in BS 6841 and the hu-man reaction to overall weighted r.m.s. acceleration were “uncom-fortable” at all levels of forward speed selected during the operation of rototilling in untilled and tilled field. The overall weighted r.m.s. ac-celeration were “fairly uncomfort-able” for all levels of forward speed selected during transport mode with empty trailer on farm and bitumen road.
Vibration dose values for each selected level of forward speed for different operating conditions are presented in Table 2.
The results were compared with the maximum recommended limit of VDV (BS 6841, 1987) of 15 ms-1.75. It is quite clear that almost all the values are within the recommended limit. The results showed that VDV increased with forward speed of travel.
Conclusions• The whole body vibration varied
from 0.823 to 1.21 m s-2 and 0.776 to 1.11 m s-2 during roto-tilling in untilled and tilled field respectively.
• The safe exposure limit varied from 4-8 h to 2.5-4 h with the increase in forward speed from 3.5 to 5.0 km h-1 in untilled and
tilled field. The human reaction was “fairly uncomfortable” to “uncomfortable” during field operation.
• The whole body vibration var-ied from 0.686 to 1.06 m s-2 and 0.660 to 0.967 m s - during transport with (8.95kW) power tiller on farm and bitumen roads respectively.
• The safe exposure limit was 4 to 8 h during transport on farm and bitumen roads. The likely human reaction was “fairly un-comfortable”.
• In general the increase in for-ward speed resulted in increase of whole body vibration at all conditions tested. The increase in forward speed from 1.5 to 2.4 km h-1 resulted in an increased overall ride vibration level by 6.05 to 9.09 percent in an un-tilled field when compared to tilled field.
• The increase in forward speed from 3.5 to 5.0 km h-1 resulted in an increased overall r ide vibration level by 1.3 to 6.5 percent in bitumen road when compared to farm road.
• Vibration dose values (VDV) for whole body vibration were within the maximum recom-mended limit of VDV (BS 6841, 1987) of 15 ms-1.75 for all opera-tions.
REFERENCES
Clijmans, L., Ramon, and De Baer-demaeker. 1998. Structural modi-fication effects on the dynamic behaviour of an agricultural trac-tor. Transactions of ASAE, 41(1): 5-10.
Huang, B. K. and C. W. Suggs. 1968. Tractor noise and operator performance. Transactions of the ASAE: 1-5.
Kawakani, K., T. Itou, M. Komya. 1999. Middle class tractor tested for ride vibrations on gravel road and pasture. Journal of Rakuno
Gakuon University, Natural Sci-ence, 24(1):25-31.
Liljedahl, J. B., W. McCarleton., P. K. Turnquist, and D. W. Smith. 1979. Tractor and their power units, 4th Edn., John Willey and Sons, New York. pp. 206-210.
Mehta, C. R., P. S. Tiwari, and A. C. Varshney. 1997. Ride vibrations on a 7.5 kW power tiller. J. agric. Engng Res., 66: 169-176.
Mehta, C. R. 2000. Measurement of noise, vibration, dust and ambi-ent conditions. Proceedings of the training for the investigators of the NATP on Application of Er-gonomics in Designing Agricul-tural Tools/Equipment, AMD & AICRP on HESA, CIAE, Bhopal, November 19-24, 2001: 107-117.
Vladimirov, V., S. Stancev, and S. Mitev. 1985. Investigation of vi-brations of tractor cab seat. Acta Technologica Agriculturae Nitra, 26: 331-341.
■■

VOL.38 NO.3 2007 AGRICULTURAL MECHANIZATION IN ASIA, AFRICA, AND LATIN AMERICA 33
Post Harvest Practices of Betel Leaves in Orissa, IndiabyK. RayaguruAssistant Research EngineerAICRP on Post Harvest Technology,Orissa University of Agriculture and Technology,Bhubaneswar - 751 003INDIA
G. SahooAssistant Food BiochemistAICRP on Post Harvest Technology,Orissa University of Agriculture and Technology,Bhubaneswar - 751 003INDIA
Md. K. KhanResearch EngineerAICRP on Post Harvest Technology,Orissa University of Agriculture and Technology,Bhubaneswar - 751 003INDIA
U. S. PalAssistant Process EngineerAICRP on Post Harvest Technology,Orissa University of Agriculture and Technology,Bhubaneswar - 751 003INDIA
AbstractA large number of small and mar-
ginal farmers of Orissa, India solely depend on betelvine cultivation for their family maintenance. It is not only a local consumable commod-ity but also is exported to other states of India and abroad. In addition to the medicinal value, the betel leaves also have a good nutritional value. The essential oil of the betel leaves contains around 30 different com-pounds. This essential oil has high market value, which is used in the production of perfume, medicine, talc, beverages, food additives and mouthwash. Moreover, the betel vine cultivation, being labour intensive, provides employment throughout the year for cultivation, harvesting, grading, packing and marketing op-erations. The movement of the betel leaves starts from the growers’ field to the consumer point through differ-ent ways. After plucking, the leaves are washed, graded and then packed. The manner of packing varies with the processing operation to be fol-lowed. The green leaves are directly sold to the local pan vendors in local markets or to retailers with about 2
Acknowledgement: The authors are grateful to the Indian Council of Agricultural Research, New Delhi for providing financial assistance to undertake this research work.
to 5 days to reach to the consumers. But a greater percentage of leaves are sold to the traders who further process it to export outside the state. Processors usually take about 10 to 15 days to condition the leaves to be exported outside the state. These leaves reach the end users after about one month. Conditioning is a pro-cess in which the green colour of the leaves is changed to yellow/white, which is in high demand by a group of consumers. The process not only fetches a high price because of con-sumer preference but also increases the storability of the leaves to a no-ticeable extent. The traditional post harvest practice of betel leaves as followed in the state of Orissa was studied. This paper identifies the points that require R & D interven-tion for better utilization of the crop.
IntroductionBetelvine, commonly known as
Pan (piper betle L.) is a perennial, dioecious, evergreen creeper grown in moist, tropical and sub-tropical regions of India. The betel leaf is cultivated either under forest eco-
system with support or in artificially created shaded condition, locally known as “baraja” (Fig. 1 and Fig. 2). Though betelvine was originated in Malaysia, at present it is an im-portant cash crop in different parts of India. In India, it is cultivated in about 55,000 hectares (Jan. 1996) with an annual return of over of nine billion rupees and provides liveli-hood to about 15 million people. The annual yield of the betel leaf in India varies from 600 to 700 bundles/ha (1 bundle = 10,000 leaves) and the av-erage yield per plant varies from 60 to 80 leaves/year. In Orissa betelvine is cultivated in an area of over 4,000 ha in the coastal districts of Balaso-re, Bhadrak, Cuttack, Puri, Khurda, Jagatsingpur, Kendrapara, Gan-jam, Gajapati, Nayagarh and small pockets in the interior of Phulbani, Bolangir and Sambalpur districts. Godi Bangla, Noua Cuttack, Sanchi, Birkoli are some popular varieties grown in Orissa.

AGRICULTURAL MECHANIZATION IN ASIA, AFRICA, AND LATIN AMERICA 2007 VOL.38 NO.334
Uses of Betel LeavesBetel leaves have been in human
use since the time immemorial. In “Vedas and Ayurbeda Sastra” the use of “Tambula” has been mentioned. Betel leaf with a bit of betel nut has been used in Hindu rituals as a pious offering to God in many auspicious occasions and to elder people as a mark of respect during ceremonies. Chewing of “pan” has also been said to be popular among “aryas” and credited with many medicinal prop-erties as indicated in “Susruta Sam-hita”. Since then, betel leaves have occupied a magnificent place in daily life of Indian people. In addition to the above legendary effects, the betel leaf has also the following qualities.
• The leaf is rich in Vitamin B, C & E.
• It has stimulatory effect on heart, brain and liver.
• It cleans the mouth and throat• It helps in digestion by increas-
ing salivation and neutralizes excess acid with lime.
• It is good for teeth as it contains chlorophyll.
• It is useful in catarrhal, pulmonary infections and night blindness.
• Fresh leaf powder is used as lo-tion for patients suffering from small pox and enlarged glands.
• It is used with honey as a rem-edy for cough.
• Betel leaf extract may be used as an antioxidant for storage of oily products such as fish, fish oil, ghee etc.
• Betel leaf may be used for the manufacture of essential oil, perfume and food additives.
Cultivation of betel vine is labour intensive process with pre-harvest and post-harvest operations like earthing, tying, plucking, washing, sorting, counting, grading, depetoil-ation arranging, bundling, packag-ing and transportation, which pro-vides employment to rural people throughout the year.
MethodologyA survey was conducted in Cut-
tack, Puri, Balasore, Paradeep, Khurda and Ganjam districts of the state of Orissa, India, to study the traditional harvest and post harvest practices of betel leaves followed by the farmers. Large and small-scale processors were also contacted to study the existing practices of pro-cessing. Information regarding meth-ods used for different unit operations and problems encountered were col-lected through questionnaire sheets to identify the area where post-harvest approach is needed. Detailed f low charts for the post-harvest practices of betel leaves followed by the farmers in the state of Orissa are given in Fig. 3 and Fig. 4.
Harvest and Post-Harvest OperationsHarvesting
The leaves that are sufficiently matured are plucked along with a portion of the petiole. Leaves are plucked by hand without any aid. However, the maturity level is de-cided based on the consumer prefer-
ence in the local area. In Orissa the leaves are plucked at an interval of 7 to 15 days yielding, about 50 to 70 leaves per plant per year. About seven to eight million leaves are harvested annually from one hect-are of betel vine garden.
Cleaning and SortingAfter plucking, the leaves are sort-
ed for damaged/diseased leaves and made into bundles of 50 to 100. These are washed thoroughly and packed in bamboo strip baskets or gunny cloth according to the prevailing tradition of the area. During this operation the damaged/rotten leaves are discarded. Freshly plucked leaves packed as mentioned below are sold in the local pan markets either to local pan ven-dors or to middlemen/processors.
PackagingAfter sorting the leaves into dif-
ferent grades (damaged, rotten) the good quality leaves are separated, depetioled and bundled into 50 and 100 and then packed in bamboo bas-
Fig. 1 Outside view "Pan baraj" Fig. 2 Inside view of "Pan baraj" showing plants and supporting structures
Name of the State Area under cultivation, ha
West Bengal 18,209Assam 7,850Karnataka 6,682Tamil Nadu 4,795Orissa 4,007Andhra Pradesh 3,865Bihar 3,116Uttar Pradesh 2,214Maharastra 1,419Kerala 1,280Madhya Pradesh 600Others 600
Table 1 Area under betel leave cultivation in different states of India
Year of export
Quantity, tonnes
Value, Thousand
Rupees1975-80 932 8,0071981-85 1,347 13,2261986-90 402 3,4291991-95 435 4,0021996-2000 574 6,162
Table 2 Export of betel leaves from India during 1975-2000
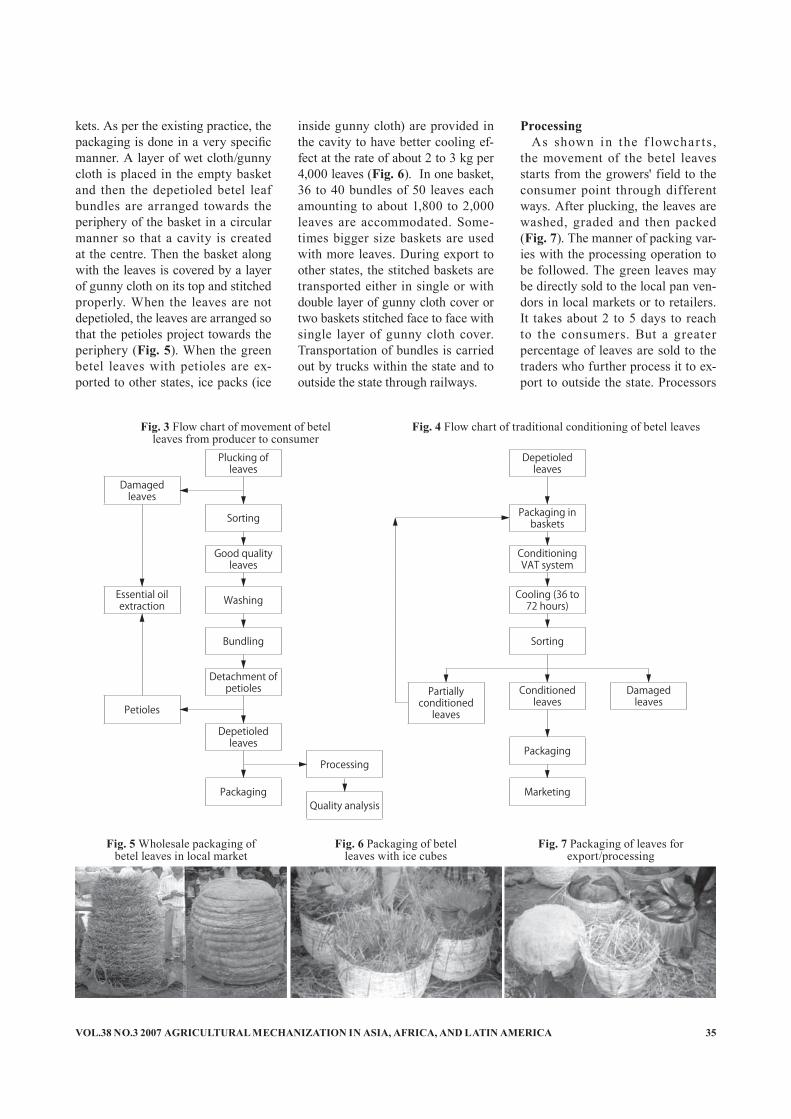
VOL.38 NO.3 2007 AGRICULTURAL MECHANIZATION IN ASIA, AFRICA, AND LATIN AMERICA 35
kets. As per the existing practice, the packaging is done in a very specific manner. A layer of wet cloth/gunny cloth is placed in the empty basket and then the depetioled betel leaf bundles are arranged towards the periphery of the basket in a circular manner so that a cavity is created at the centre. Then the basket along with the leaves is covered by a layer of gunny cloth on its top and stitched properly. When the leaves are not depetioled, the leaves are arranged so that the petioles project towards the periphery (Fig. 5). When the green betel leaves with petioles are ex-ported to other states, ice packs (ice
inside gunny cloth) are provided in the cavity to have better cooling ef-fect at the rate of about 2 to 3 kg per 4,000 leaves (Fig. 6). In one basket, 36 to 40 bundles of 50 leaves each amounting to about 1,800 to 2,000 leaves are accommodated. Some-times bigger size baskets are used with more leaves. During export to other states, the stitched baskets are transported either in single or with double layer of gunny cloth cover or two baskets stitched face to face with single layer of gunny cloth cover. Transportation of bundles is carried out by trucks within the state and to outside the state through railways.
ProcessingAs shown in the f lowchar ts,
the movement of the betel leaves starts from the growers' field to the consumer point through different ways. After plucking, the leaves are washed, graded and then packed (Fig. 7). The manner of packing var-ies with the processing operation to be followed. The green leaves may be directly sold to the local pan ven-dors in local markets or to retailers. It takes about 2 to 5 days to reach to the consumers. But a greater percentage of leaves are sold to the traders who further process it to ex-port to outside the state. Processors
Fig. 3 Flow chart of movement of betelleaves from producer to consumer
Fig. 4 Flow chart of traditional conditioning of betel leaves
Fig. 5 Wholesale packaging ofbetel leaves in local market
Fig. 6 Packaging of betelleaves with ice cubes
Fig. 7 Packaging of leaves for export/processing
▼▼
▼
▼
▼
▼▼
▼
▼
▼
▼
Plucking of leaves
Depetioled leaves
Damaged leaves
Sorting Packaging in baskets
Good quality leaves
Conditioning VAT system
Essential oil extraction Washing Cooling (36 to
72 hours)
Bundling Sorting
Detachment of petioles Partially
conditioned leaves
Conditioned leaves
Damaged leaves
Petioles
Depetioled leaves
PackagingProcessing
Packaging MarketingQuality analysis
▼
▼
▼
▼
▼
▼
▼
▼
▼
▼
▼
▼
▼

AGRICULTURAL MECHANIZATION IN ASIA, AFRICA, AND LATIN AMERICA 2007 VOL.38 NO.336
usually take about 10 to 15 days to condition the leaves to be exported outside the state, which takes about 1 month to reach to the end users.
ConditioningTo preserve the delicacy of the
betel leaves for many days, they are artificially ripened or bleached be-fore transportation or storage. Con-ditioning is a process in which the green colour of the leaves is changed to yellow/white, which is highly de-manded by a group of consumers. The process not only fetches a high price because of consumer prefer-ence but also increases the storability of the leaves to a noticeable extent. In the traditional method of condi-tioning, a small chamber (called as Bhatti) made up of brick and mud is used. The chambers are of vari-ous sizes ranging from 1.2 x 1.2 x 2.4 m to 2.7 x 2.7 x 2.4 m depending on the capacity. The vats are usu-ally constructed inside the house. Walls of the vat are constructed with brickwork of mud plaster some times accompanied by a layer of cow dung. The floor is also either cemented or covered by an even layer of clay and dung to make it air proof. An insu-lated door of 0.75 x 1.8 m is provided at the front that is fabricated with bamboo mat frame covered with straw and gunny cloth. The door is about 15 cm larger on each side by the dimension of the door opening. Enough care is taken to make it air
tight as well as insulated by restrict-ing the opening of the door. Inside the vat at a height of 30 cm from the ground level, bamboo racks are pro-vided at an interval of 45 cm to 60 cm between the racks on all sides of the chamber excluding the entrance side. After plucking from the plant, the betel leaves are sorted for dam-aged and diseased leaves that are dis-carded. After removing the petioles, the leaves are bundled into 50 to 100 and are arranged in the baskets of uniform size. The inner side of the baskets is lined with Sal leaves or a layer of wet gunny cloth. Then leaves are arranged in the specific way as described earlier to have a cavity at the centre for proper ventilation to remove the heat of respiration. The bundles are placed in such a man-ner that the front and backside of the leaves are exposed alternately. Then the baskets are covered with moist gunny cloth and arranged in the racks in order. At a given time, about 10 to 40 baskets each containing about 2,000 leaves can be kept in the chamber. The number varies accord-ing to the size of the chamber.
In one corner of the room a small chullah is kept in which wood char-coal is burnt during conditioning. About 2 to 3 kg of charcoal are required for one charging. After fir-ing the movable chullah is kept at a corner away from the racks to avoid direct heat. The door is also prop-erly covered to avoid any leakage of heat from the chamber. After 10 to 12 hours of charging the baskets are taken out for cooling. The cooling period varies between 36 to 72 hours
depending upon the weather condi-tions. During the cooling period the leaves are sorted (Fig. 9) and re-shuffled (by keeping the top layers at the bottom and the bottom layers on top). Before subjecting the baskets to a second phase of charging, the dam-aged or rotten leaves are discarded. Then the process is repeated until all the leaves are conditioned, i.e. the green colour of the leaves change to yellow colour (Fig. 10). After the second phase the amount of fuel is gradually reduced. The requirement of fuel for obtaining the desired tem-perature range, as well as to achieve the final conditioned stage of betel leaves, is mainly decided through personal experience as no such rule or scientific formula exists. Tempera-ture requirement varies with the vari-ety and quality of leaves. During the summer season, the leaves are fully conditioned with 2 to 3 chargings. But in winter, sometimes, it requires even a 5th charging. The conditioned leaves are finally packed in bamboo baskets as described earlier to be ex-ported to other cities.
In a chamber of 2.7 x 2.7 x 2.4 m, around 30 to 40 baskets can be ac-commodated at any given time for conditioning (each carrying 1,800 to 2,000 leaves). This method of processing of betel leaves not only enhances the taste (for a particular group) but also extends the storage life of the leaves about 7 to 10 days in summer and 15 to 20 days in winter. The cost of such conditioned leaves is much higher than the general un-processed ones. The intensity and quality of conditioning is dependent
Fig. 8 Outside and inside view of tradi-tional conditioning chamber (VAT) along with arrangement of baskets
Fig. 9 Sorting and arrangingthe conditioned leaves
Fig. 10 Stages of betel leavesduring conditioning

VOL.38 NO.3 2007 AGRICULTURAL MECHANIZATION IN ASIA, AFRICA, AND LATIN AMERICA 37
on many influencing parameters like time and intensity of heating, quality of green leaves, size of chamber and external climatic conditions.
Limitations of the Traditional Processing System
• Labour consuming• Time consuming• Tedious• Does not work during rainy sea-
son
MarketingAround 4,000 hectares of land is
in use for betel vine cultivation in Orissa. Each hactare yields an aver-age of seven to eight million leaves per year. Farmers sale their leaves with an average price of Rs.50 to Rs.200 per 1,000 leaves depending upon the season and demand, where as, the conditioned leaves are sold for Rs.200 to Rs.500 per thousand leaves. Middle men/traders primar-ily do the conditioning. They collect leaves from different farmers and export to other parts of the coun-try after conditioning in baskets of about 2,000 leaves. On an average, 2,000 to 3,000 baskets are exported out of the state daily (Fig. 12).
Future Research Needs on Post Harvest Technology of Betel Leaves
During the rainy season, the leaf production is so high that, the leaves remain unsold or sold at a very low price. Therefore, manufacturing of essential oil, pan masala, talc, me-
dicinal compounds, perfume, bever-age and food additives may be use-ful in establishing the market price of the crop year-round. Standardisa-tion of different parameters of each of these processes is essential in or-der to reduce the losses. Following are the thrust areas on which future research may be carried out.
• Development of process technol-ogy and low cost equipment for extraction of essential oil from betel leaves and petioles.
• Development of process technol-ogy for manufacture of mouth fresheners, perfume, talc, food additives and beverages etc.
• Study on the antioxidant and anti-inflammatory properties of betel leaf extract.
• Scientific packaging and storage of betel leaves for shelf life en-hancement.
ConclusionCultivation of this potential crop is
handicapped by various constraints. No official data is available on acre-age, yield and processing methods. No systematic efforts have been made so far to improve the process-ing, packaging and marketing of this potential cash crop though a large number of villagers exclusively engage themselves traditionally in this cultivation. The business is mostly carried out based on per-sonal experience. Scientific study on the optimisation of all the above said parameters will no doubt lead to the minimisation of losses. If the
processing and packaging methods can be scientifically standardised, then the leaves can be processed and packed at the garden level, which will earn more profits to the growers. It will also increase export by improv-ing the quality as well as storability.
REFERENCE
Chattopadhyay, N. C., A. K. Dey, S. Das Mukherjee, and A. K. Mishra. 1984. Phytochemistry of betel leaves and some aspects of storage, importance of betelvine cultiva-tion, Lucknow, India, 130-145.
Jana, B. L. 1996. Improved technol-ogy for betel leave cultivation. A note presented in the workshop on betel leave marketing, June 5-6, 1996.
Maiti, Satyabrata. 1989. “The betel vine”, Bulletin published in AICRP on Betel vine, IIHR, Bangalore.
Mohanty, B. K. and J. M. Panda. 1990. Study on rapid multiplication of betel vine cutting and prolonging storage life of betel leaf. M.Sc. (Ag), Thesis, submitted to OUAT, pp 71.
Rayaguru K, U. S. Pal, M. K. Khan, G. R. Sahoo, M. K. Panda, and N. R. Sahoo. 1999. Post Harvest Profile of Betel Leaves. Techni-cal Bulletin. OUAT/CAET/PHT5/ 99/2 (18 pages). ICAR.
Sankar, C. R., D. Sridevi, and M. K. Babu. 1996 Studies on es-sential oil and oil constituents of betel vine cultivars. The Andhra Agrilic.J., 43(1): 24-26.
■■
Fig. 11 Betel leaves in local pan market Fig. 12 Baskets of betel leaves at railway station for transportation

AGRICULTURAL MECHANIZATION IN ASIA, AFRICA, AND LATIN AMERICA 2007 VOL.38 NO.338
Effect of Design and Operating Parameters ofPerformance of Inter-cultivation Sweep in Vertisols
byS. N. YadavTechnical OfficerCentral Institute of Agricultural Engineering,Nabigagh, Beresia Road,Bhopal - 462 038INDIA
D. C. SaraswatAssociate ProfessorAllahabad Agricultural Institute,Deemed University,AllahabadINDIA
M. M. PandeyProject Coordinator (FIM)Central Institute of Agricultural Engineering,Nabigagh, Beresia Road,Bhopal - 462 [email protected]
AbstractEffect of approach angle, gang
width, moisture content and speed on specific draft and weeding ef-ficiency were studied in the labora-tory and field. Specific draft was lower and weeding efficiency was higher for 70 º approach angle sweep. The relationship between approach angle and specific draft was a polynomial and that of speed and specific draft was linear. As the moisture content increased the spe-cific draft increased. The effect of approach angle and gang width on weeding efficiency was also signifi-cant. Weeding efficiency was high-est for 300 mm gang width at 15 % moisture content. Trend of specific draft and weeding efficiency in the laboratory and field was similar. From the field test, it was observed that 250 mm gang width may be used in 350 mm row spaced crop as it gave reasonable weeding and field efficiency with comparatively less plant damage (1.32 %) and high (0.20 ha/h) field capacity.
IntroductionSoybean (Glycin - max) crop is
the major monsoon crop of Madhya Pradesh state of India. Higher weed infestation is a serious problem for growing soybean. High temperature accompanied by high humidity pre-vailing during the early monsoon facilitates weeds growth in the state. It is estimated that during monsoon about 5 million-hectare are left fal-low in the state due to the weed problem. A lot of work has been done to evaluate the performance of vari-ous designs of inter-cultivation tools (Tewari, 1993; Biswas, 1993; Sial, 1978; Dransfield, 1964). Girma (1992) reported that in the ploughing pro-cess, most of the energy dissipation is a function of speed. Speed also plays an important role for dynamic stabil-ity and draft control. Some scientific approaches for design of soil working components are available (Bernacki, 1972; Goryachkin, 1968). Power operated inter-cultivation machines are available but their expediency in narrow row spaced crop is limited
and most of them are region specific. Therefore, geometry of soil working tools suitable for narrow row spac-ing crop is required. Various types of weeders and weeding mechanism are being used according to cultural practices and climatic conditions. Different design parameters such as rake angle, approach angle, tilt angle, lift angle, blade width, blade thick-ness, sharpness angle, speed, depth of operation and geometry were consid-ered as design parameters by various researchers.
It was found from the review of literature that shape, size, geometry and operating parameters affect the performance of the inter-cultivation tools. It has also been observed that the sweep is the most suitable (Sial, 1978; Tewari, 1993; Biswas, 1999) soil working tool under black soil conditions. Bernacki (1972) recom-mended that apex angle should be in the range of 60 to 90º. Previous studies on approach angle are limit-ed. It was decided to test the weeder with a different geometry of sweep that had a small width but in gang
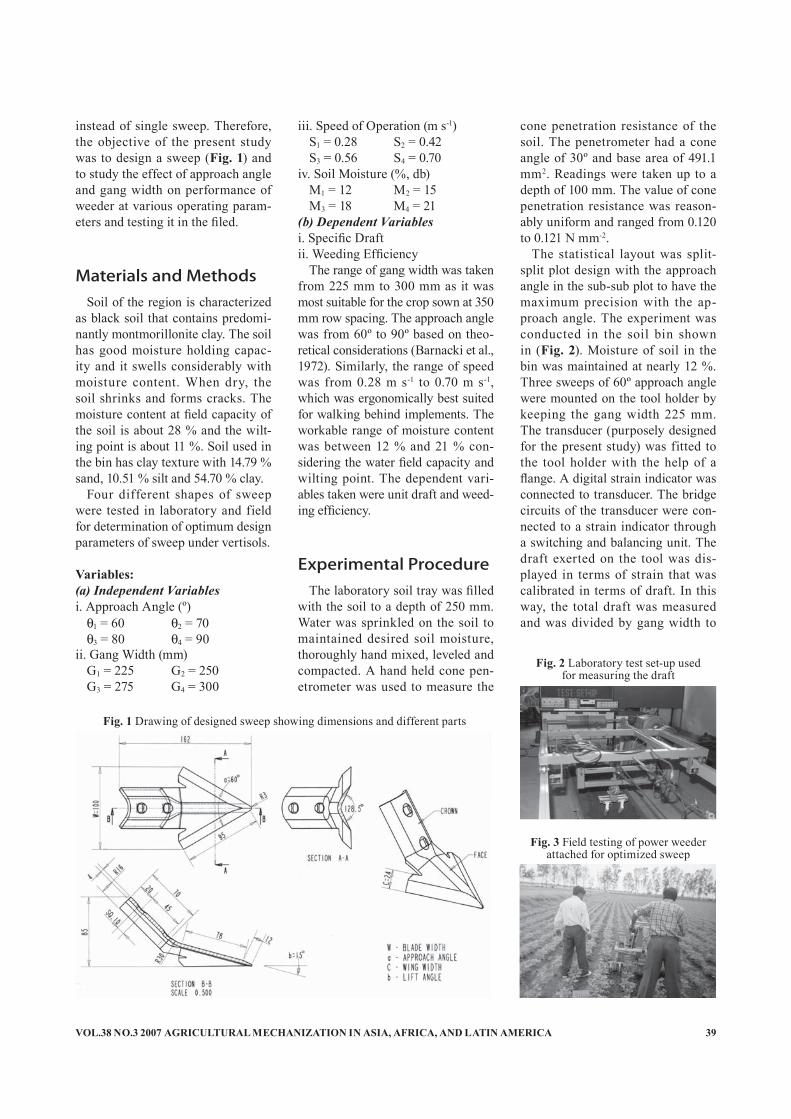
VOL.38 NO.3 2007 AGRICULTURAL MECHANIZATION IN ASIA, AFRICA, AND LATIN AMERICA 39
instead of single sweep. Therefore, the objective of the present study was to design a sweep (Fig. 1) and to study the effect of approach angle and gang width on performance of weeder at various operating param-eters and testing it in the filed.
Materials and MethodsSoil of the region is characterized
as black soil that contains predomi-nantly montmorillonite clay. The soil has good moisture holding capac-ity and it swells considerably with moisture content. When dry, the soil shrinks and forms cracks. The moisture content at field capacity of the soil is about 28 % and the wilt-ing point is about 11 %. Soil used in the bin has clay texture with 14.79 % sand, 10.51 % silt and 54.70 % clay.
Four different shapes of sweep were tested in laboratory and field for determination of optimum design parameters of sweep under vertisols.
Variables: (a) Independent Variablesi. Approach Angle (º)θ1 = 60 θ2 = 70θ3 = 80 θ4 = 90
ii. Gang Width (mm)G1 = 225 G2 = 250G3 = 275 G4 = 300
iii. Speed of Operation (m s-1)S1 = 0.28 S2 = 0.42S3 = 0.56 S4 = 0.70
iv. Soil Moisture (%, db)M1 = 12 M2 = 15M3 = 18 M4 = 21
(b) Dependent Variables i. Specific Draft ii. Weeding Efficiency
The range of gang width was taken from 225 mm to 300 mm as it was most suitable for the crop sown at 350 mm row spacing. The approach angle was from 60º to 90º based on theo-retical considerations (Barnacki et al., 1972). Similarly, the range of speed was from 0.28 m s-1 to 0.70 m s-1, which was ergonomically best suited for walking behind implements. The workable range of moisture content was between 12 % and 21 % con-sidering the water field capacity and wilting point. The dependent vari-ables taken were unit draft and weed-ing efficiency.
Experimental ProcedureThe laboratory soil tray was filled
with the soil to a depth of 250 mm. Water was sprinkled on the soil to maintained desired soil moisture, thoroughly hand mixed, leveled and compacted. A hand held cone pen-etrometer was used to measure the
cone penetration resistance of the soil. The penetrometer had a cone angle of 30º and base area of 491.1 mm2. Readings were taken up to a depth of 100 mm. The value of cone penetration resistance was reason-ably uniform and ranged from 0.120 to 0.121 N mm-2.
The statistical layout was split-split plot design with the approach angle in the sub-sub plot to have the maximum precision with the ap-proach angle. The experiment was conducted in the soil bin shown in (Fig. 2). Moisture of soil in the bin was maintained at nearly 12 %. Three sweeps of 60º approach angle were mounted on the tool holder by keeping the gang width 225 mm. The transducer (purposely designed for the present study) was fitted to the tool holder with the help of a flange. A digital strain indicator was connected to transducer. The bridge circuits of the transducer were con-nected to a strain indicator through a switching and balancing unit. The draft exerted on the tool was dis-played in terms of strain that was calibrated in terms of draft. In this way, the total draft was measured and was divided by gang width to
Fig. 1 Drawing of designed sweep showing dimensions and different parts
Fig. 3 Field testing of power weeder attached for optimized sweep
Fig. 2 Laboratory test set-up usedfor measuring the draft

AGRICULTURAL MECHANIZATION IN ASIA, AFRICA, AND LATIN AMERICA 2007 VOL.38 NO.340
obtain the draft per unit working width (termed as specific draft in this study). One hundred pearled head pins were randomly inserted in to the soil on the path of the tool in the 350 mm band to represent the weeds in the row. Depth of operation was maintained at 50 mm. The trol-ley was pulled at 0.28 m s-1 speed. The horizontal force was recorded with the help of the strain indicator. The undisturbed pins were counted. Soil was brought to its original condition and speed was changed to 0.42 m s-1. The horizontal force and undisturbed pins were recorded. The procedure was repeated for speeds of 0.56 m s-1 and 0.70 m s-1. After completion of tests, at all four speeds, the gang width was changed to 250, 275 and 300 mm, respective-ly and the same procedures adopted as for 225 mm. The identical test was conducted with approach angles 70º, 80º, and 90º tools at 15 %, 18 % and 21 % moisture content. The data were subjected to statistical analysis on window based WINDOWSTAT and SPSS statistical software.
Field TestingThe field test was conducted on a
soybean crop sown at 350 mm row spacing (Fig. 3). The operating speed of the weeder was maintained at a rate to prevent fatigue and crop dam-age. Three gangs at a time were used to cover three inter row spacing so as
that the field capacity of the weeder would be high. The weeder was test-ed at four gang widths to obtain the optimum gang width for maximum weeding efficiency and least crop damage.
The test was conducted to cover 400 m2 area and was replicated three times. RNAM test code and test procedure (1983) was followed for field testing.
Results and DiscussionOptimization of Approach Angle (θ) and Gang Width (G)
The effects of approach angle on specific draft and weeding efficien-
cy at various operating parameters such as soil moisture and operating speed at various gang widths have been studied. The details of the ef-fect are as follows:
Effect of Approach Angle (θ) and Gang Width (G) on Specific Draft (Ud)
The effect of approach angles and gang widths on specific draft (Ud) at 0.28 m s-1 operating speed have been presented in Fig. 4 and 5 at different moisture content.
It is evident from the Fig. 4 and 5 that the specific draft (Ud) is lower for the 70º approach angle sweep for all the gang widths and moisture content. Similar trends were also observed for
Source of variation df
For specific draft For weeding efficiencySum of squares
Mean squares F ratio Sum of
squaresMean
squares F ratio
Replicates 2 0.00048 0.0002 0.75 3.292 1.646 1.47θ 3 0.10427 0.0347 137.13*** 101.229 33.74 30.18***
Linear 1 0.07176 0.0718 283.11*** 2.60417 2.604 2.33Quadratic 1 0.02950 0.0295 116.39*** 93.5208 93.52 83.65***
Cubic 1 0.00301 0.0030 11.88*** 5.10417 5.104 4.57Error A 6 0.00152 0.0003 6.70833 1.118G 3 0.00361 0.0012 4.44* 396.229 132.1 101.2***
Linear 1 0.00001 0.00001 0.04 387.604 387.604 296.9***
Quadratic 1 0.0035 0.0035 12.93** 0.1875 0.1875 0.14Cubic 1 0.000094 0.000094 0.35 8.4375 8.4375 6.46*
θ*G 9 0.00457 0.0005 1.87 9.1875 1.02083 0.78Error B 24 0.0065 0.0003 31.333 1.30556
Total 47 0.12085 0.00257 547.98 11.6591
Table 1 Analysis of variance to test the effect of approach angleand gang width on specific draft and weeding efficiency
Ud, N/mm
0.3
0.4
0.5
0.6
90807060Approach angle, º
225250275300
(A) 12 % soil moistureUd, N/mm
0.5
0.6
0.7
0.8
0.9
90807060Approach angle, º
225250275300
(B) 15 % soil moisture
Fig. 4 Effect of approach angle and gang width on specific draft at (A) 12 % soil moisture (B) 15 % soil moisture

VOL.38 NO.3 2007 AGRICULTURAL MECHANIZATION IN ASIA, AFRICA, AND LATIN AMERICA 41
other operating speeds. There is little effect of gang width on specific draft but it is lower for 225 mm gang at lower moisture content however, at 21 % moisture content it was lower for 300 mm gang width. As the moisture content increased the unit draft in-creased. A second degree polynomial relationship exists between approach angle and specific draft.
From Table 1, the calculated F
ratio for θ and G are higher than the tabulated F ratio. It is therefore, con-cluded that the effect of approach angle and gang width on specific draft is highly significant.
The lowest draft at 70º approach angle could be explained by physico mechanical properties of soils, trihe-dral wedge theory, theory of rupture and cutting theory given by Gory-achkin (1968) and Sineokov (1977).
Change in approach angle causes change in f low pattern of the soil along the tool surface. The change in f low pattern causes significant variations in draft (Girma, 1992). To prevent sticking, the direction of cut can be made normal to the working face of the wedge, and for that it is necessary that ϕ = 90º - α, where ϕ is angle of internal friction and α is cutting angle. The forces acting on the implements are (a) force causing forward travel, P, acting at an angle to the horizontal (b) the weight, G, of the implement (c) the resistance of the working surface (d) the reactions of the supporting surface, R, which includes normal and tangential fric-tional forces. The frictional forces can be eliminated by changing the inclination of the working and sup-porting planes by the angle of fric-tion. The resultant of all above forces must lie in the same line. For mini-mum draft, the force causing forward travel 'P' must make an angle with horizontal equal to the angle of fric-tion. The draft in the present study was lowest for 70º approach angle, which might be due to fulfilling of this condition. Other researchers (Biswas, 1990; Tewari, 1993) have also reported similar findings.
Effect of Approach Angle (θ) and Gang Width (G) on Weeding Ef-ficiency (We)
The effect of approach angle and
Ud, N/mm
0.5
0.6
0.7
0.8
0.9
90807060Approach angle, º
225250275300
(C) 18 % soil moistureUd, N/mm
0.7
0.8
0.9
1.0
1.1
1.2
90807060Approach angle, º
225250275300
(D) 21 % soil moisture
Fig. 5 Effect of approach angle and gang width on specific draft at (C) 18 % soil moisture (D) 21 % soil moisture
Source of variation df
For specific draft For weeding efficiencySum of squares
Mean squares F ratio Sum of
squaresMean
squares F ratio
Replicates 2 0.00060 0.0003 1.13 0.875 0.4375 0.80M 3 8.16031 2.7201 10207*** 3389.96 1130.0 2060***
Linear 1 7.581 7.581 28447*** 2306.4 2306.4 4204***
Quadratic 1 0.12556 0.12556 471..2*** 638.02 638.02 1163***
Cubic 1 0.45371 0.45371 1703*** 445.34 445.54 812***
Error A 6 0.0016 0.00026 3.292 0.5486G 3 0.14121 0.04707 172.04*** 980.291 326.76 359.2***
Linear 1 0.05415 0.05415 197.91*** 980.104 980.104 1077***
Quadratic 1 0.04532 0.04532 165.66*** 0.0833 0.0833 0.09Cubic 1 0.04173 0.04173 152.55*** 0.10416 0.10416 0.11
M*G 9 0.81891 0.0099 332.25*** 80.75 8.97222 9.86***
Error B 24 0.00656 0.00027 21.8333 0.9097S 3 0.59953 0.19984 736.96*** 223.416 74.472 60.59***
Linear 1 0.5995 0.5995 2210*** 160.066 160.066 130.2***
Quadratic 1 0.000005 0.000005 0.02 44.0833 44.0833 35.86***
Cubic 1 0.00003 0.0003 0.11 19.2666 19.2666 15.67***
M*S 9 0.2094 0.02326 85.79*** 264.458 29.384 23.91***
G*S 9 0.02812 0.00312 11.52*** 13.4583 1.4954 1.22M*G*S 27 0.04506 0.00167 6.15*** 43.6667 1.6172 1.32Error C 96 0.02603 0.0003 118 1.22917
Total 101 10.0373 0.05255 5140 26.911
Table 2 Analysis of variance to test the effect of soil moistureand operating spped on specific draft and weeding efficiency
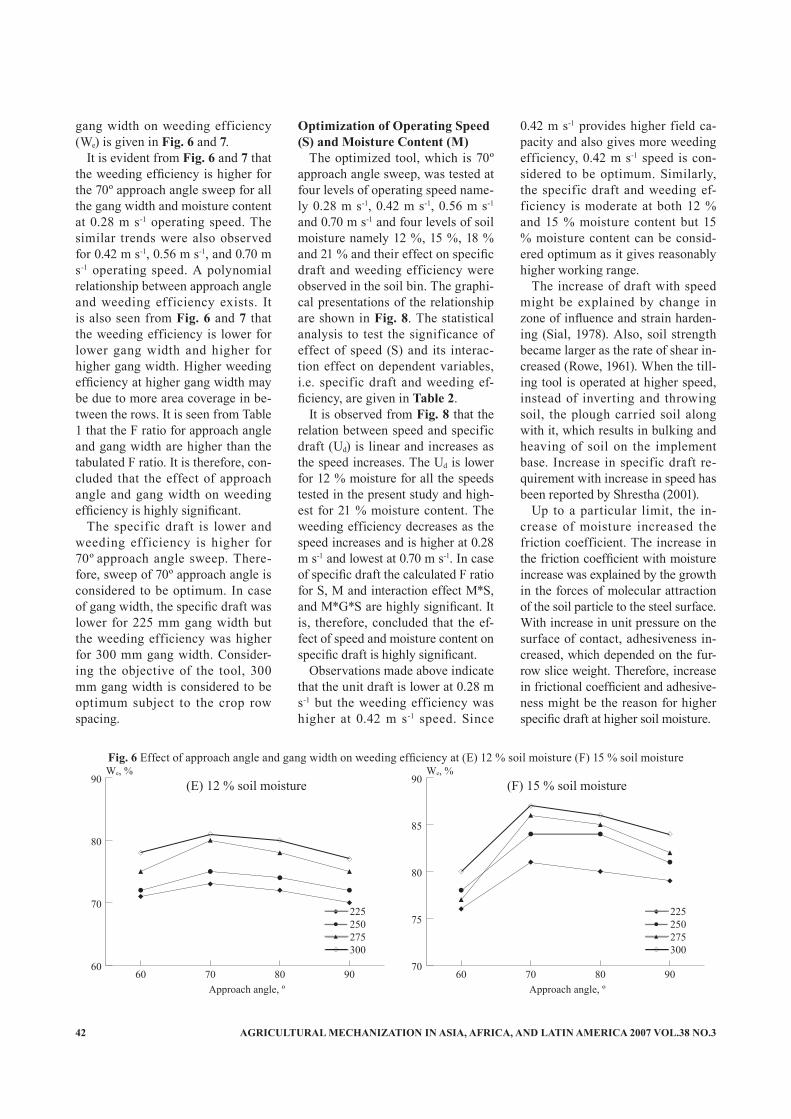
AGRICULTURAL MECHANIZATION IN ASIA, AFRICA, AND LATIN AMERICA 2007 VOL.38 NO.342
gang width on weeding efficiency (We) is given in Fig. 6 and 7.
It is evident from Fig. 6 and 7 that the weeding efficiency is higher for the 70º approach angle sweep for all the gang width and moisture content at 0.28 m s-1 operating speed. The similar trends were also observed for 0.42 m s-1, 0.56 m s-1, and 0.70 m s-1 operating speed. A polynomial relationship between approach angle and weeding efficiency exists. It is also seen from Fig. 6 and 7 that the weeding efficiency is lower for lower gang width and higher for higher gang width. Higher weeding efficiency at higher gang width may be due to more area coverage in be-tween the rows. It is seen from Table 1 that the F ratio for approach angle and gang width are higher than the tabulated F ratio. It is therefore, con-cluded that the effect of approach angle and gang width on weeding efficiency is highly significant.
The specific draft is lower and weeding efficiency is higher for 70º approach angle sweep. There-fore, sweep of 70º approach angle is considered to be optimum. In case of gang width, the specific draft was lower for 225 mm gang width but the weeding efficiency was higher for 300 mm gang width. Consider-ing the objective of the tool, 300 mm gang width is considered to be optimum subject to the crop row spacing.
Optimization of Operating Speed (S) and Moisture Content (M)
The optimized tool, which is 70º approach angle sweep, was tested at four levels of operating speed name-ly 0.28 m s-1, 0.42 m s-1, 0.56 m s-1 and 0.70 m s-1 and four levels of soil moisture namely 12 %, 15 %, 18 % and 21 % and their effect on specific draft and weeding efficiency were observed in the soil bin. The graphi-cal presentations of the relationship are shown in Fig. 8. The statistical analysis to test the significance of effect of speed (S) and its interac-tion effect on dependent variables, i.e. specific draft and weeding ef-ficiency, are given in Table 2.
It is observed from Fig. 8 that the relation between speed and specific draft (Ud) is linear and increases as the speed increases. The Ud is lower for 12 % moisture for all the speeds tested in the present study and high-est for 21 % moisture content. The weeding efficiency decreases as the speed increases and is higher at 0.28 m s-1 and lowest at 0.70 m s-1. In case of specific draft the calculated F ratio for S, M and interaction effect M*S, and M*G*S are highly significant. It is, therefore, concluded that the ef-fect of speed and moisture content on specific draft is highly significant.
Observations made above indicate that the unit draft is lower at 0.28 m s-1 but the weeding efficiency was higher at 0.42 m s-1 speed. Since
We, %
60
70
80
90
90807060Approach angle, º
225250275300
(E) 12 % soil moistureWe, %
70
75
80
85
90
90807060Approach angle, º
225250275300
(F) 15 % soil moisture
Fig. 6 Effect of approach angle and gang width on weeding efficiency at (E) 12 % soil moisture (F) 15 % soil moisture
0.42 m s-1 provides higher field ca-pacity and also gives more weeding efficiency, 0.42 m s-1 speed is con-sidered to be optimum. Similarly, the specific draft and weeding ef-ficiency is moderate at both 12 % and 15 % moisture content but 15 % moisture content can be consid-ered optimum as it gives reasonably higher working range.
The increase of draft with speed might be explained by change in zone of influence and strain harden-ing (Sial, 1978). Also, soil strength became larger as the rate of shear in-creased (Rowe, 1961). When the till-ing tool is operated at higher speed, instead of inverting and throwing soil, the plough carried soil along with it, which results in bulking and heaving of soil on the implement base. Increase in specific draft re-quirement with increase in speed has been reported by Shrestha (2001).
Up to a particular limit, the in-crease of moisture increased the friction coefficient. The increase in the friction coefficient with moisture increase was explained by the growth in the forces of molecular attraction of the soil particle to the steel surface. With increase in unit pressure on the surface of contact, adhesiveness in-creased, which depended on the fur-row slice weight. Therefore, increase in frictional coefficient and adhesive-ness might be the reason for higher specific draft at higher soil moisture.

VOL.38 NO.3 2007 AGRICULTURAL MECHANIZATION IN ASIA, AFRICA, AND LATIN AMERICA 43
We, %
65
70
75
80
90807060Approach angle, º
225250275300
(G) 18 % soil moistureWe, %
65
70
75
80
90807060Approach angle, º
225250275300
(H) 21 % soil moisture
Fig. 7 Effect of approach angle and gang width on weeding efficiency at (G) 18 % soil moisture (H) 21 % soil moisture
Field Testing The average specific draft required
for the weeder was 0.57, 0.56, 0.53 and 0.49 N mm-1 at average depth of operation of 58, 67, 61 and 64 mm and the average speed of operation was 0.53, 0.56, 0.49 and 0.47 m s-1 for 225 mm, 250 mm, 275 mm and 300 mm gang width, respectively. The weeder worked in the field sat-isfactorily with occasional clogging and scouring. The percentage crop damage was 0.67, 1.32, 2.08 and 3.03 % for 225, 250, 275 and 300 mm gang width respectively. The crop damage was lower for 225 mm gang width because of more space avail-able within the row. Similarly the field capacity was 0.19, 0.20, 0.17 and 0.17 ha/h. The weeding efficiency was 74.04, 77.60, 78.92 and 80.25 % and field efficiency was 71.38, 69.94, 73.51 and 74.27 % for the above gang widths. From the field performance study, it was concluded that the 250 mm gang width may be used in 350 mm row spaced crop as it gives rea-sonably high weeding and field effi-ciency with comparatively less plant damage (1.32 %) but with high (0.20 ha/h) field capacity. The magnitudes of specific draft and weeding effi-ciency at the identical conditions of the laboratory study were 0.67, 0.64, 0.73 and 0.78 N mm-1 and 72, 72, 74 and 78 %, respectively. The trend of variation of specific draft in the field was similar to the trend obtained in
the laboratory. The trend for weed-ing efficiency in both laboratory and field was similar and as the speed increased, the weeding efficiency de-creased. The specific draft obtained in the laboratory test was higher than field testing because of difference in bulk density of soil. The soil in the laboratory was compacted where as the soil in the field was in natural condition. Although, in the laborato-ry test, the 300 mm gang width was optimum. However, it was a little inconvenient for the operator to steer the weeder at this gang width with only one meter working width. This gave only a small margin of error to avoid plant damage.
Multiple Nonlinear Regression Equation for Specific Draft and Weeding Efficiency
To see the combined effect of all the four independent variables namely, approach angles, gang widths, soil moisture and operation-al speed on the dependent variable, namely, specific draft, the data was subjected to regression analysis by using SPSS computer program. The equation obtained is given below.
Ud = -0.527 - 5.741 x 10⁻² x θ + 1.143 x 10⁻² x m + 1.947 x 10⁻² x g + 0.337 x s + 4.059 x 10⁻⁴ x θ2 + 1.523 x 10⁻³ x m2 - 3.781 x 10⁻⁵ x g2 + 4.556 x 10⁻² x s2
Where,Ud = Specific draft (Nmm-1)
θ = Approach angle (0º)m = Soil moisture (db), (%)g = Gang width (mm)s = Operating speed (m s-1)The calculated ‘F’ value of the
estimated multiple nonlinear regres-sion equation was 190.21 which is significant at 1 % level. Thus, the combined nonlinear effects of all the four independent variables con-tributed significantly to the variation in specific draft. The coefficient of determination (R2) of the regression equation obtained above was 0.86, which indicated that about 86 % of the total variation in the specific draft was explained by the nonlinear func-tion of the independent variables.
The multiple nonlinear regression equation obtained for the weeding efficiency is given below:
We = -58.737 + 2.24 x θ + 5.5 x m + 3.725 x 10⁻² x g + 13.68 x s - 1.48 x 10⁻² x θ2 - 0.2 x m2 + 7.5 x 10⁻⁵ x g2 - 19.534 x s2
Where,We = Weeding efficiency (%)θ = Approach angle (0º)m = Soil moisture (db), (%)g = Gang width (mm)s = Operating speed (m s-1)The calculated ‘F’ value of the es-
timated multiple nonlinear regression was 139.321, which was significant at the 1 % level. Thus, the combined nonlinear effects of all the four independent variables contributed significantly to the variation in weed-

AGRICULTURAL MECHANIZATION IN ASIA, AFRICA, AND LATIN AMERICA 2007 VOL.38 NO.344
Ud, N/mm
0.2 0.4 0.6 0.80.0
0.3
0.6
0.9
1.2
Speed, m/s
12 %15 %18 %21 %
(J) Specific draftWe, %
0.2 0.4 0.6 0.850
60
70
80
90
Speed, m/s
12 %15 %18 %21 %
(K) Weeding efficiency
Fig. 8 Effect of operating speed and soil moisture at 225 mm gang width on (J) specific draft (K) weeding efficiency
ing efficiency. The coefficient of determination (R2) of the regression equation obtained above was 0.819, which indicate that about 82 % of the total variation in the specific draft is explained by the nonlinear function of the independent variables.
ConclusionThe conclusions drawn from the
study are given below.1. The effect of approach angle on
specific draft and weeding ef-ficiency was significant and the relationship was quadratic. The specific draft was lower and weeding efficiency was higher for 70º approach angle sweep.
2. The effect of gang width on specific draft was significant. Specific draft was lower for 225 mm gang width at lower mois-ture content and 300 mm for 21 % soil moisture.
3. Effect of gang width on weed-ing efficiency was significant. It increased linearly with gang width.
4. The specific draft increased as moisture content increased and the relationship was quadratic.
5. The weeding efficiency initially increased and then decreased with increase in moisture con-tent and was higher at 15 % moisture content.
6. The relationship between speed and specific draft was linear for all speeds, moisture contents and gang widths.
7. In the field, the weeder with 70º approach angle tool spaced at 250 mm operated at around 0.56 m s-1 speed gave the best performance.
REFERENCES
Anon. 1983. Test codes & proce-dures for farm machinery, Techni-cal Series No. 12, Manila, Philip-pines.
Bernacki, H., J. Haman, and Cz. Kanafojski. 1972. Agricultural machines theory and construc-tion, Vol I. Reproduced by Na-tional Technical Information Ser-vice, United States Department of Commerce Springfield, VA.
Biswas, H. S., G. S. Ingle, and T. P. Ojha. 1993. Performance evalua-tion and optimization of straight blades for shallow tillage and weeding in black soils. AMA, 24(4): 19-22.
Biswas, H. S., T. P. Ojha, and G. S. Ingle. 1999. Development of animal drawn weeders in India. AMA, 30(4): 57-61.
Dransfield, P., S. T. Willat, and A. H. Willis. 1964. Soil to implement reaction experienced with simple tines at various angle of attack.
Journal of Agricultural Engineer-ing Research. 9 (3): 220-224.
Gebresenbet, G. 1992. Dynamic effect of speed, depth and soil strength upon forces on plough components. J. Agric. Engng. Res. 51: 47-66.
Goryachkin, V. P. 1968. Collected works in three volumes, Volume I. The U.S. Department of Ag-riculture and National Science Foundation, Washington, D.C.
Shrestha, D. S., G. Singh, and G. Gebresenbet. 2001. Optimizing design parameters of a mould board plough. J. Agric. Engng. Res. 78(4): 377-389.
Sial, J. K. and H. P. Harrison. 1978. Soil reacting forces from field measurements with sweeps. Trans of the ASAE. 21: 825-829.
Sineokov, G. N. 1977. Design of Soil Tilling Machines. Indian National Scientific Documentation Centre, Hillside Road, New Delhi. Pub-lished for the U.S. Department of Agriculture, Agricultural Re-search Service and the National Science Foundation, Washington, D.C.
Tewari, V. K., R. R. Datta, and A. S. R Murthy. 1993. Field per-formance of weeding blades of a manually operated push-pull weeder. J. Agric. Engng. Res. 55: 129-141.
■■

VOL.38 NO.3 2007 AGRICULTURAL MECHANIZATION IN ASIA, AFRICA, AND LATIN AMERICA 45
Development and Evaluation of a Light WeightPower Tiller Operated Seed Drill for Hilly Region
bySukhbir SinghAssistant Agricultural EngineerDept. of Agricultural Engineering,Ch. Sarwan Kumar H.P. Krishi Vishvavidyalaya,Palampur - 176 [email protected]
Dinesh Kumar VatsaResearch EngineerDept. of Agricultural Engineering,Ch. Sarwan Kumar H.P. Krishi Vishvavidyalaya,Palampur - 176 [email protected]
AbstractA light weight power tiller op-
erated seed drill was developed for sowing wheat in hilly terraces where vertical interval between ter-races is high. Field trials were con-ducted at the university farm and at the farmers’ field to determine the performance of the seed drill in comparison to the traditional meth-od of sowing. The effective capacity of the machine was 0.09 ha/h with field efficiency about 74 %. The ma-chine was efficient and economical as indicated by net saving of 78 % labor and 62 % cost of sowing over the traditional method.
IntroductionMost of the farmlands in the hill
region are in small and undulating terraces. Manual and bullock power is predominantly used on farms. Farm equipment for the hill region must suit the terrain. Machines de-signed for plains are not suitable in the hills due to topography and size of land holdings. The average size of land holdings in Himachal Pradesh
is about 0.6 ha only, indicating that small and marginal farmers are pre-dominant in the state (Kingra and Singh, 1986). Topography and undu-lating terrain limits the introduction of large tractors. Thus, equipment is restricted to a lightweight power source. The power source needed for this purpose must be in the range of 100-110 kilogram, which can be lifted by one or two men from one terrace to another where vertical interval ranges from 0.5-1.0 meter. Sowing is the single field operation
that makes the prospects of a crop. The farmers in Himachal Pradesh still use traditional methods of sow-ing, i.e. broadcasting or hand drop-ping behind a plough. These methods result in lower yield due to uneven distribution of seed and fertilizer, low germination and excessive weed growth. Although a number of ani-mal-drawn seed-cum-fertilizer drills (3-5 rows) have been developed in the country (Singh and Bhardwaj, 1985) these could not be adopted by the farmers of the hill areas due to
Fig. 1 Side and front view of the seed-cum-fertilizer drill

AGRICULTURAL MECHANIZATION IN ASIA, AFRICA, AND LATIN AMERICA 2007 VOL.38 NO.346
their heavy weight. Manual/power tiller operated multicrop planters have been developed by Gupta, et al. (1999) and Vatsa et al. (2000) for the hilly region. However, there is need for a lightweight power operated seed drill/planter for terraced land where there is a large vertical inter-val. Maize and wheat are the major crops grown in Himachal Pradesh. Wheat is grown in an area of 377.3 thousand hectare with average yield 1,700 kg/ha (Anon. 1999). Presently, there is no suitable lightweight power operated drill/planter available in the country that can sow these crops in hilly areas. Thus, a lightweight power operated seed-cum-fertilizer drill was developed and evaluated for sowing wheat in the hills.
Material and MethodsDesign Considerations
The basic design considerations in the development of the seed-cum-fertilizer drill were:
i. It should be suitable for opera-tion with a lightweight power tiller (100-110 kg).
ii. It should be light in weight so that it can be transported easily from one terrace to another.
iii. It should be easily fabricated by local manufacturers.
iv. The cost of the machine with power source should be within the purchasing power of small and marginal farmers.
v. It should be able to sow the wheat crop.
Constructional DetailsThe machine consisted of a main
frame, ground wheels, seed and fer-tilizer hoppers, furrow opener, pow-er transmission system and hitch (Fig. 1). The metering of seeds and fertilizer was accomplished with f luted rollers. The metering shaft was driven by a sproket and chain from the ground wheels. The depth of sowing was adjusted by lowering and raising the furrow opener. The
machine was easily attached to the lightweight power tiller by a bolt. The estimated cost of the machine was about Rs 2,000/-. The major specifications of the machine are as given in Table 1.
Field EvaluationField trials were conducted at the
university farm and at the farmers' field to evaluate the two row seed-cum-fertilizer drill attached to a 5.5 hp Amar power tiller for sow-ing wheat. Machine performance parameters l ike effect ive f ield capacity, field efficiency, speed of operation, fuel consumption, depth of sowing and labor requirements were determined. For comparing the performance of the drill with the traditional method of sowing at the farmers’ field, a minimum plot size of 10 x 8 m2 was taken with three replications for both the methods.
Field data were also collected to determine the capacity, efficiency, labor requirement and cost of the sowing operation by the traditional method.
Cost AnalysisA cost analysis was made based
on the procedure given in the IS Code (Anon, 1979). The useful life of seed drill was assumed to be 8 years and the annual use was as-sumed to be 50 hours.
Results and DiscussionThe field performance data of the
seed drill and bullock system are given in Table 2. The values are an average of three replications. The machine was operated at a speed of 2.1 km/h. The soil moisture and bulk density were 17.4 % and 1.14
Parameters ValueOverall dimensions
Length, mm 550Width, mm 610Height, mm 770
Total weight, kg 27Power source Amar power tiller (110 kg wt., 5.5 hp petrol
start kerosene run engine)Number of rows 2Hopper capacity
Seed, kg 3.0Fertilizer, kg 3.5
Row spacing, mm 220Operational width, mm 450Depth of sowing Adjustable up to 100 mmSeed and fertilizer metering device Fluted roller made of AluminiumPower transmission to metering device From ground wheel through sprocket and
chain arrangement
Table 1 Major specifications of the machine
Fig. 2 Seed drill attached with power tiller in stationary and in operation

VOL.38 NO.3 2007 AGRICULTURAL MECHANIZATION IN ASIA, AFRICA, AND LATIN AMERICA 47
Parameters Seed drill Traditional method*
Soil moisture, % (db) 17.4 17.8Bulk density of the soil, g/cc 1.19 1.20Speed of operation, km/h 2.1 2.0Row spacing, mm 225 -Depth of seeding, mm 56 -Actual seed rate, kg/ha 126 141Actual fertilizer rate, kg/ha 276 280Effective field capacity, ha/h 0.09 0.02Field efficiency, % 73.77 56.20Labour requirement, man-h/ha 22 100Fuel consumption, l/h 1.32 -Cost of seeding, Rs/ha 922 2,438
Table 2 Comparative performance of seed drill for sowing of wheat crop
g/cc, respectively. The actual seed and fertilizer rates with the machine were 126 and 276 kg/ha, which was lower than the broadcasting method. The effective field capacity was 0.09 ha/h and 0.02 ha/h with the seed drill and traditional method, respec-tively. The labour requirement was only 22 man-h/ha with the seed drill as compared to 100 man-h/ha with the traditional method, which was a labour saving of 78 %. The cost of sowing with the seed drill was Rs 922/ha as compared to Rs 2,438/ha with traditional method, resulting in net savings of Rs 1,516/ha (62.18 %).
ConclusionA seed-cum-fertilizer drill at-
tached to a lightweight power tiller (100-110 kg) has tremendous pos-sibilities for the small and medium sized farmers of the hilly region due to its higher capacity and low cost of operation as compared to the tra-ditional method of sowing. The fact that it can be used for tasks other than ploughing/weeding will help to popularize the lightweight power til-ler among farmers of the hilly state
REFERENCES
Anonymous. 1999. State statistical abstract of Himachal Pradesh. De-
partment of Economics and Statis-tics. Govt. of Himachal Pradesh, Shimla.
Anonymous. 1979. Guide for esti-mating cost of farm machinery operation. IS: 9164-1979, Bureau of Indian Standards, New Delhi.
Kingra, I. S. and C. Singh. 1986. Ag-ricultural Research and Develop-ment in Himachal Pradesh. Govt. of Himachal Pradesh, Shimla, pp 11-24.
Gupta, M. L., D. K. Vatsa, and M. K. Verma. 1999. Development and Evaluation of Multicrop Planter for Hill Regions. Agril. Mechani-sation in Asia, South Africa and Latin America. 30(1): 17-19.
Vatsa, D. K. and M. K. Verma. 2000. Development and Evalu-ation of Power Tiller Operated Multicrop Planter for Hills. IE(I) Journal, Agril. Engineering Divi-sion. Vol. 80: 58-60.
Singh, G. and K. C. Bhardwaj. 1985. Directory of agricultural machin-ery and manufacturers. Central Institute of Agricultural Engi-neering, Bhopal.
■■
*Traditional method (Broadcasting of seeds then ploughing and planking with bullocks)

AGRICULTURAL MECHANIZATION IN ASIA, AFRICA, AND LATIN AMERICA 2007 VOL.38 NO.348
An Airtight Paddy Storage System for Small-scaleFarmers in Sri Lanka
byT. B. AdhikarinayakeHead/Agriculture and Post HarvestTechnology DepartmentNational Engineering Research andDevelopment Centre,Ekala, Ja-ElaSRI LANKA
W. HuismanAssociate ProfessorFarm Technology Group,Wageningen University,6708 PD WangeningenTHE NETHERLANDS
J. MüllerProfessor and HeadFarm Technology Group,Wageningen University,6708 PD WangeningenTHE NETHERLANDS
P. RichardsProfessor and HeadTechnology and AgrarianDevelopmentGroup,Wageningen University,6708 PD WangeningenTHE NETHERLANDS
J. OostdamSenior Research EngineerFarm Technology Group,Wageningen University,6708 PD WangeningenTHE NETHERLANDS
AbstractThe farmers in Sri Lanka’s dry
zone are the main contributors to the paddy production in the country. However, due to various reasons, they face difficulties in obtaining a reasonable income for their produce at harvesting time. According to the survey carried out in the paddy producing regions, it was found that one possible solution to reduce this problem is to enable the farmers to sell their produce at a time when prices are higher than at harvest time. To enable the farmers to keep their paddy on-farm for some time with a minimum loss of quality and quantity, some reliable and afford-able storage facility has to be devel-oped.
To achieve this, an airtight stor-age system of 2.5 tons was devel-oped by a four-step approach, which consists of: preliminary study to investigate the actual need, defini-tion of the core problem, definition of the main function to be fulfilled by the designed system and finally,
assessment of applicable working principles, to achieve a viable solu-tion of the problem.
This paper describes in detail the steps in the approach to achieve an efficient and inexpensive system ac-ceptable to the farmers.
IntroductionIn Sri Lanka, there are two rice
harvests per year: the Maha season in February and March and the Yala season in September and October. Typical paddy production of small holders is 5 t/season from an area of about 1 ha. Half the harvest is stored in simple open wooden boxes or bags for home consumption and the other half is sold as cash crop (Fernando et al., 1985). A few de-cades back, farmers were able to sell their paddy at a guaranteed price to the Paddy Marketing Board (PMB) or at free prices to private traders. With the liquidation of the PMB in 1999, the paddy marketing system was privatised, leading to a price decrease especially during
the harvest period. For example, the price of paddy of the long white variety, during the harvest season in September 2003, was US$ 0.108/kg (Rs 10.50/kg) and increased to US$ 0.165/kg (Rs 16.00/kg) in Decem-ber 2003, shortly before the next harvest. The price of the short va-riety increased from US$ 0.123/kg (Rs 12.00/kg) to US$ 0.206/kg (Rs 20.00/kg) during the same period. Prices are fixed by the traders and farmers have a weak position in negotiations as they have to dispose their produce anyhow. There are two main reasons, preventing farmers from benefiting from the seasonal difference in price:
(a) many farmers have to pay back the loans they took from agri-cultural suppliers and
(b) storage losses are high due to the high air relative humid-ity right after the harvest and the absence of reliable on-farm storage facilities.
To tackle the first problem, the Government has started a program to furnish the smallholders a loan

VOL.38 NO.3 2007 AGRICULTURAL MECHANIZATION IN ASIA, AFRICA, AND LATIN AMERICA 49
of US$ 0.10 (Rs 10.00/kg) per kg of stored rice. So farmers are able to pay back the expensive private loans without selling paddy. The second problem only can be solved by pro-viding the small holders a reliable means of keeping their produce on their farm for some months. Since insects cause most of the storage losses, special focus has to be put on insect protection in an attempt to provide a solution.
Since the 70s, airtight storage - also called hermetic storage - proved to be an alternative to fumigation of storage systems under tropical conditions. De Lima (1990) stated that airtight storage is considered as the most effective method of storage
at the high temperature and humid-ity in tropical regions. If the store is sealed to prevent air exchange of inside ecosystem with ambient, re-spiratory metabolism of insects, mi-cro-organisms and the paddy itself will lower the oxygen content and raise the carbon dioxide content of the inter-granular atmosphere. As a result, insects are die and growth of moulds is hampered as well as the respiration of paddy, thus reducing the corresponding dry matter losses. Although low O2-concentration is more important than high CO2 in causing mortality of insects, there is a synergetic effect of concomitant O2-depletion and CO2- accumula-tion (Calderon and Navarro, 1980).
Early application of hermetic storage for small-scale farmers has been the storage of grain in sealed gourds, empty oil drums and other metal drums (Pat tinson, 1970). Hyde et al. (1973) developed con-crete lined conical pits, surmounted by domed concrete-shell roofs. Im-proved versions of these structures were later constructed in Kenya for hermetic storage of the national grain reserve (De Lima, 1990). The Indian Grain Storage Institute (IGSI) has developed various air-tight containers for farm level stor-age (Birewar et al., 1983). Amongst them were partly underground bins made of reinforced concrete and brick, which showed that under-ground structures are only suitable for low rainfall and deep water table areas. In Thailand airtight above ground silos have been developed using a ferrocement technique by the Siam Cement Groups (Anon., 1973). The Asian Institute of Tech-nology has developed a farm level storage bin using ferrocement tech-nology, which can be converted into an airtight container for storage at farm level (Athapol et al., 1990). Also conventional galvanized iron silos have been used successfully by sealing them with a polyvinyl resin formula from inside (Williams et al., 1990).
In the 70s, flexible airtight struc-tures were developed in England as emergency storage systems, wrap-ping bulks or stacks in butyl liners (Kenneford & O’Dowd, 1981). Such systems were also tested in the trop-ics, however the liners were found to deteriorate due to high UV radia-tion and showed increased gas per-meability to a level where the liners could no longer be used for hermetic storage (Beeny et al., 1972; Navarro & Donahaye, 1976). More recently, the method of covering and sealing stacks inside warehouses with PVC liners for storage under carbon diox-ide enriched atmospheres has been developed by the CSIRO (Annis et al., 1984). Large-scale outdoor
Fig. 1 Flow chart of Kroonenberg-method of systematic design process
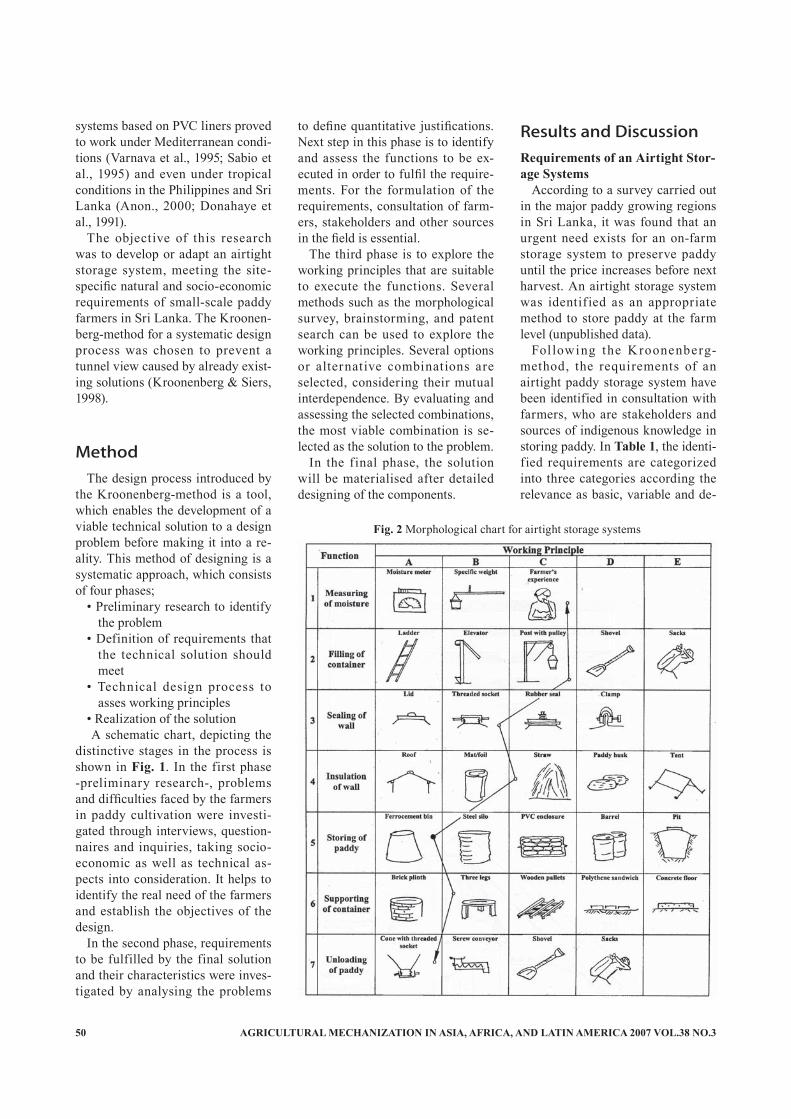
AGRICULTURAL MECHANIZATION IN ASIA, AFRICA, AND LATIN AMERICA 2007 VOL.38 NO.350
systems based on PVC liners proved to work under Mediterranean condi-tions (Varnava et al., 1995; Sabio et al., 1995) and even under tropical conditions in the Philippines and Sri Lanka (Anon., 2000; Donahaye et al., 1991).
The objective of this research was to develop or adapt an airtight storage system, meeting the site-specific natural and socio-economic requirements of small-scale paddy farmers in Sri Lanka. The Kroonen-berg-method for a systematic design process was chosen to prevent a tunnel view caused by already exist-ing solutions (Kroonenberg & Siers, 1998).
MethodThe design process introduced by
the Kroonenberg-method is a tool, which enables the development of a viable technical solution to a design problem before making it into a re-ality. This method of designing is a systematic approach, which consists of four phases;
• Preliminary research to identify the problem
• Definition of requirements that the technical solution should meet
• Technical design process to asses working principles
• Realization of the solution A schematic chart, depicting the
distinctive stages in the process is shown in Fig. 1. In the first phase -preliminary research-, problems and difficulties faced by the farmers in paddy cultivation were investi-gated through interviews, question-naires and inquiries, taking socio-economic as well as technical as-pects into consideration. It helps to identify the real need of the farmers and establish the objectives of the design.
In the second phase, requirements to be fulfilled by the final solution and their characteristics were inves-tigated by analysing the problems
to define quantitative justifications. Next step in this phase is to identify and assess the functions to be ex-ecuted in order to fulfil the require-ments. For the formulation of the requirements, consultation of farm-ers, stakeholders and other sources in the field is essential.
The third phase is to explore the working principles that are suitable to execute the functions. Several methods such as the morphological survey, brainstorming, and patent search can be used to explore the working principles. Several options or alternative combinations are selected, considering their mutual interdependence. By evaluating and assessing the selected combinations, the most viable combination is se-lected as the solution to the problem.
In the final phase, the solution will be materialised after detailed designing of the components.
Results and DiscussionRequirements of an Airtight Stor-age Systems
According to a survey carried out in the major paddy growing regions in Sri Lanka, it was found that an urgent need exists for an on-farm storage system to preserve paddy until the price increases before next harvest. An airtight storage system was identif ied as an appropriate method to store paddy at the farm level (unpublished data).
Fol lowing the K roonenberg-method, the requirements of an airtight paddy storage system have been identified in consultation with farmers, who are stakeholders and sources of indigenous knowledge in storing paddy. In Table 1, the identi-fied requirements are categorized into three categories according the relevance as basic, variable and de-
Fig. 2 Morphological chart for airtight storage systems
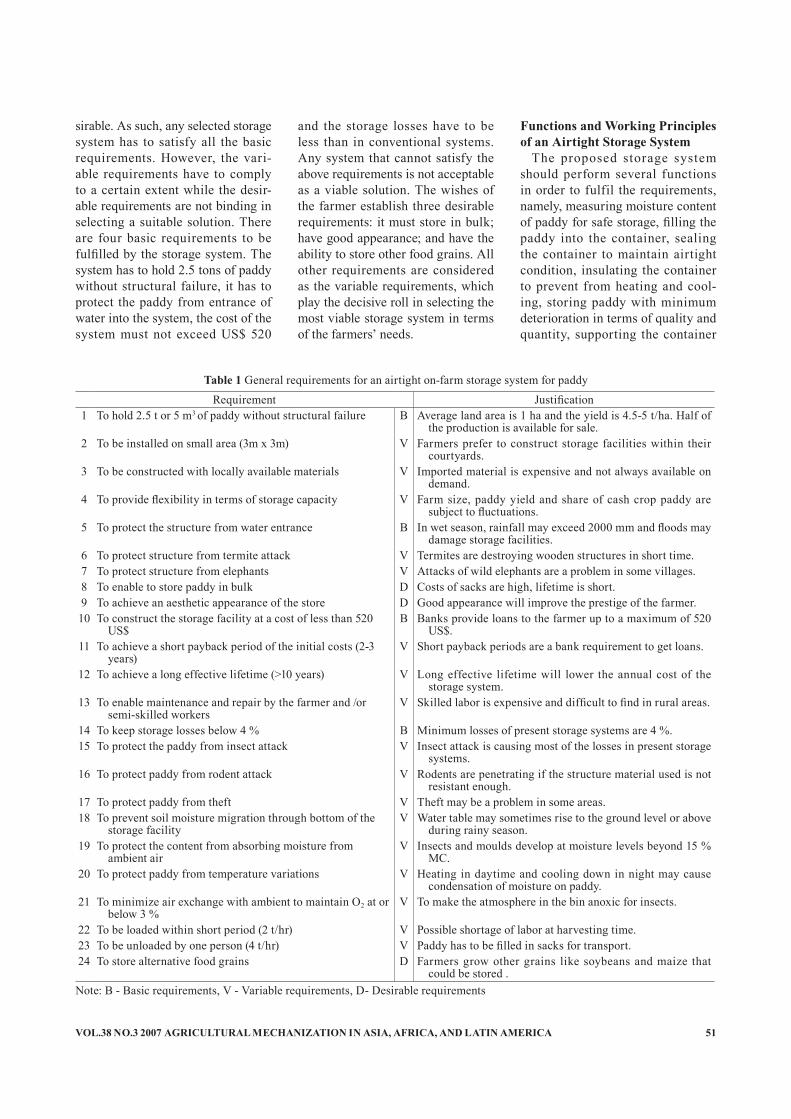
VOL.38 NO.3 2007 AGRICULTURAL MECHANIZATION IN ASIA, AFRICA, AND LATIN AMERICA 51
sirable. As such, any selected storage system has to satisfy all the basic requirements. However, the vari-able requirements have to comply to a certain extent while the desir-able requirements are not binding in selecting a suitable solution. There are four basic requirements to be fulfilled by the storage system. The system has to hold 2.5 tons of paddy without structural failure, it has to protect the paddy from entrance of water into the system, the cost of the system must not exceed US$ 520
and the storage losses have to be less than in conventional systems. Any system that cannot satisfy the above requirements is not acceptable as a viable solution. The wishes of the farmer establish three desirable requirements: it must store in bulk; have good appearance; and have the ability to store other food grains. All other requirements are considered as the variable requirements, which play the decisive roll in selecting the most viable storage system in terms of the farmers’ needs.
Functions and Working Principles of an Airtight Storage System
The proposed storage system should perform several functions in order to fulfil the requirements, namely, measuring moisture content of paddy for safe storage, filling the paddy into the container, sealing the container to maintain airtight condition, insulating the container to prevent from heating and cool-ing, storing paddy with minimum deterioration in terms of quality and quantity, supporting the container
Requirement Justification1 To hold 2.5 t or 5 m3 of paddy without structural failure B Average land area is 1 ha and the yield is 4.5-5 t/ha. Half of
the production is available for sale. 2 To be installed on small area (3m x 3m) V Farmers prefer to construct storage facilities within their
courtyards.3 To be constructed with locally available materials V Imported material is expensive and not always available on
demand.4 To provide flexibility in terms of storage capacity V Farm size, paddy yield and share of cash crop paddy are
subject to fluctuations. 5 To protect the structure from water entrance B In wet season, rainfall may exceed 2000 mm and floods may
damage storage facilities.6 To protect structure from termite attack V Termites are destroying wooden structures in short time.7 To protect structure from elephants V Attacks of wild elephants are a problem in some villages.8 To enable to store paddy in bulk D Costs of sacks are high, lifetime is short.9 To achieve an aesthetic appearance of the store D Good appearance will improve the prestige of the farmer.10 To construct the storage facility at a cost of less than 520
US$B Banks provide loans to the farmer up to a maximum of 520
US$.11 To achieve a short payback period of the initial costs (2-3
years)V Short payback periods are a bank requirement to get loans.
12 To achieve a long effective lifetime (>10 years) V Long effective lifetime will lower the annual cost of the storage system.
13 To enable maintenance and repair by the farmer and /or semi-skilled workers
V Skilled labor is expensive and difficult to find in rural areas.
14 To keep storage losses below 4 % B Minimum losses of present storage systems are 4 %.15 To protect the paddy from insect attack V Insect attack is causing most of the losses in present storage
systems. 16 To protect paddy from rodent attack V Rodents are penetrating if the structure material used is not
resistant enough.17 To protect paddy from theft V Theft may be a problem in some areas.18 To prevent soil moisture migration through bottom of the
storage facility V Water table may sometimes rise to the ground level or above
during rainy season.19 To protect the content from absorbing moisture from
ambient airV Insects and moulds develop at moisture levels beyond 15 %
MC.20 To protect paddy from temperature variations V Heating in daytime and cooling down in night may cause
condensation of moisture on paddy.21 To minimize air exchange with ambient to maintain O2 at or
below 3 %V To make the atmosphere in the bin anoxic for insects.
22 To be loaded within short period (2 t/hr) V Possible shortage of labor at harvesting time.23 To be unloaded by one person (4 t/hr) V Paddy has to be filled in sacks for transport.24 To store alternative food grains D Farmers grow other grains like soybeans and maize that
could be stored .
Table 1 General requirements for an airtight on-farm storage system for paddy
Note: B - Basic requirements, V - Variable requirements, D- Desirable requirements

AGRICULTURAL MECHANIZATION IN ASIA, AFRICA, AND LATIN AMERICA 2007 VOL.38 NO.352
to protect it from soil moisture, and finally, unloading the paddy for dis-posal.
Fig. 2 shows the morphological chart for airtight storage systems. The various functions of the system are arranged in the vertical axis of the chart, while in the horizontal axis, certain working principles are shown that are suitable to fulfil the concerned function. Alternative working principles for each of the functions are discussed below.
Measuring moisture content: If the moisture content of the paddy is above the equilibrium level, meta-bolic activity of the grain increases the production of heat and creates hot spots within the grain bulk. A high moisture and temperature en-vironment is favourable for mould growth on paddy grains. For safe storage, the paddy has to be dried to a moisture content of 14 % w.b. or below. To identify the moisture con-tent, three methods are suggested; use of a moisture meter, measuring the specific weight and using farm-ers' experience by checking brittle-ness by biting a few grains.
Filling the container: Paddy brought from the field, has to be transferred into the container for storage. Five methods are proposed to fill the storage container; namely, use of a ladder by climbing up with a bag, elevator, post with a pulley, shovelling and finally manual stack-ing of sacks.
Sealing the inlet: The function of the inlet is to feed the bin as well as to close it in order to make the container airtight. Four methods of sealing are suggested; namely, lid with a sealant in the groove, inlet with a threaded socket, lid with a rubber seal and connecting cover sheets using a clamp.
Insulation of the wall: Insulation of the bin wall is required to protect the content from heating up due to solar radiation and also, to prevent moisture condensation inside the wall during the night due to cool-ing. Five methods of insulation are suggested; namely, the construction of a shelter, the application of a foil or mat on the wall, to cover the bin surface with straw, to place a pile of paddy husk bags on the bin surface, and to make a tent over the store.
Storing the paddy: The main function of the bin is to preserve the quality of the paddy by controlling insect activity and moisture migra-tion. Since insects are controlled by creating an unfavourable condition inside the bin, air exchange through the wall should be minimal to final-ly create an anoxic atmosphere by decreasing the oxygen level below 3 %. Five storage methods are pro-posed which are suitable to maintain air tightness. A ferrocement bin, a steel silo, a PVC enclosure, PVC or steel empty oil drums, and under-ground lined pit are considered.
Supporting the container: Sup-
porting the storage structure is required to protect the paddy from soil moisture. A brick wall plinth, concrete pillars, wooden pallets, a base with a polythene sandwich in it and a concrete floor are considered as alternatives to support the store.
Unloading the paddy: Paddy, stored in the container has to be transferred into sacks/bags for sale. Therefore, the container should also have an outlet, provided with a facility to close the container air-tight. Four methods were suggested: a conical hopper with a threaded socket, a screw conveyor, a shovel, and finally, manual discharge with sacks are suggested.
Selection of Alternative SystemsCombining the working principles
for each function will result in alter-native storage systems. To facilitate the selection, the working principles are presented by pictograms. Exem-plarily, one suitable combination of working principles is connected by a line. As the most crucial function among the others is the actual stor-ing function, the selection process is initiated from the storage method. Other appropriate functions suitable for the particular storage method are selected by moving upward and downward. To prevent overload-ing Fig. 2, most suitable alternative combinations are presented sepa-rately in Table 2.
Ferrocement bin system: For the
Points
0
100
200
300
400
500
PVC linersPitBarrelSteel siloFC bin
Fig. 3 Comparison of storage systems Fig. 4 Final design concept of the on-farmairtight storage system

VOL.38 NO.3 2007 AGRICULTURAL MECHANIZATION IN ASIA, AFRICA, AND LATIN AMERICA 53
ferrocement bin, the suitable insulat-ing method would be covering with a straw layer. A lid with a threaded socket can be used to feed the bin as well as to close it airtight as the socket can be embedded in the fer-rocement lid. A post with a pulley can be used to lift the paddy about 3 meters high. For moisture deter-mination, farmer’s experience of checking brittleness of grain would be suff icient. The most suitable method to discharge the paddy from the ferrocement store would be the cone with a threaded socket, hence, the three pillars would be the most suitable support for the system as the paddy can be taken out easily.
Steel silo system: The steel silo is the most expensive storage sys-tem among the others. This system would be suitable for a rich farmer. For insulation of the bin, a shelter can be built up. Also, the bin surface can be covered with an aluminium
Measurig moisture Filling Sealing Insulation Storing Support Unloading
Ferrocement bin 1C 2C 3B 4C 5A 6B 7ASteel silo 1A 2B 3B 4A 5B 6B 7APVC enclosure 1C 2E 3D 4E 5C 6C 7DBarrel 1C 2D 3B 4A 5D 6E 7CPit 1C 2E 3A 4D 5E 6D 7C
Table 2 Alternative systems for airtight storage
Criterion
Inve
stm
ent
Use
ful l
ife
Flex
ibili
ty
Thie
ves
Rod
ents
Inse
cts
Rai
n
Soil
moi
stur
e
Air
moi
stur
e
Tem
pera
ture
va
riatio
n
Air
tight
ness
Han
dlin
g
Spac
e re
quire
men
t
Aes
thet
ics
Poin
ts
Wei
ght
Investment 1 1 0 0 0 0 0 1 1 1 1 1 1 8 9Useful life 0 1 0 0 0 0 0 1 1 1 1 1 1 7 8Flexibility 0 0 0 0 0 0 0 0 0 0 1 1 1 3 4Thieves 1 1 1 1 1 0 1 1 1 1 1 1 1 12 13Rodents 1 1 1 0 1 0 1 1 1 1 1 1 1 11 12Insects 1 1 1 0 0 0 1 1 1 1 1 1 1 10 11Rain 1 1 1 1 1 1 1 1 1 1 1 1 1 13 14Soil moisture 1 1 1 0 0 0 0 1 1 1 1 1 1 9 10Air moisture 0 0 1 0 0 0 0 0 1 1 1 1 1 6 7Temperature variation 0 0 1 0 0 0 0 0 0 1 1 1 1 5 6Air tightness 0 0 1 0 0 0 0 0 0 0 1 1 1 4 5Handling 0 0 0 0 0 0 0 0 0 0 0 1 1 2 3Space requirement 0 0 0 0 0 0 0 0 0 0 0 0 1 1 2Aesthetics 0 0 0 0 0 0 0 0 0 0 0 0 0 0 1
Table 3 Matrix to determine the weight factor of assessment criteria
foil. Threaded socket for closing, an elevator for feeding the bin and a moisture meter for moisture determi-nation would be suitable and afford-able to the farmer. Three pillars to support the bin and a hopper bottom cone with a threaded socket to close the outlet would be other appropriate components for the steel silo system.
PVC enclosure system: For PVC enclosure, paddy is stored in sacks and covered by PVC plastic liners. The suitable method of protecting from sun would be a tent. Sealing of the enclosure can be done by clos-ing two liners using a clamp with nuts and bolts. Manual stacking the paddy sacks would be the most con-venient method of filling the store. Moisture content can be checked ac-cording to the farmer’s experience. Wooden pallets would be the most suitable base for stacking of paddy sacks and manual labour can be used to unload the store.
Barrel system: Empty drums or PVC containers can be used to store paddy. These containers can be kept under a roof to protect them from the sun. The threaded cap of the con-tainer would be sufficient to close and seal it. A shovel with a bucket or a funnel can be used to fill the barrel and the farmer’s experience would be sufficient to check the moisture content of paddy. These barrels can be kept on a raised concrete plinth. Paddy can be removed by unloading into sacks using a shovel.
Underground lined pit system: The store can be constructed below the ground level and placing husk bags over it would be sufficient to prevent from heating up. A lid can be kept over the dome with a sealant material in the groove. Manual feed-ing with sacks would be the suitable method of feeding. Farmer’s experi-ence would be sufficient to check the moisture content of paddy. A polythene sheet can be sandwiched to the wall to prevent soil moisture penetration. For unloading of the paddy, a bucket and a shovel can be used to fill sacks when unloading.
Selection of the Most Promising Storage Concept
To select the most promising stor-

AGRICULTURAL MECHANIZATION IN ASIA, AFRICA, AND LATIN AMERICA 2007 VOL.38 NO.354
System
Rai
n
Thie
ves
Rod
ents
Inse
cts
Soil
moi
stur
e
Inve
stm
ent
Use
ful l
ife
Air
moi
stur
e
Tem
pera
ture
va
riatio
n
Air
tight
ness
Flex
ibili
ty
Han
dlin
g
Spac
e re
quire
men
t
Aes
thet
ics
Tota
l poi
nts
Ran
k
Weight 14 13 12 11 10 9 8 7 6 5 4 3 2 1Barrel 5 1 5 5 5 1 2 4 1 4 4 1 3 3 355 3Pit 1 3 1 3 1 5 3 3 5 2 2 1 2 3 256 4Steel silo 5 5 5 5 5 1 4 3 1 1 1 5 5 5 407 2FC bin 5 5 5 5 5 4 5 4 3 4 1 5 5 5 476 1PVC liners 2 1 1 3 2 2 1 3 1 2 5 2 2 2 201 5
Table 4 Evaluation of five storage concepts against crieria
age system out of the five alterna-tives shown in Table 2, the systems have to be assessed considering the requirements listed in Table 1. As the requirements are not of equal importance, a matrix was used to determine the relative importance of various criteria that are repre-senting the requirements. Table 3 shows the matrix that compares the criteria with each other. The value ‘1’ is given, if the importance of the criterion in the row is higher than that of the criterion in the column, otherwise, ‘0’ is given. The sum of the values in a row plus one is taken as weighting factor. According to the above evaluation procedure, pro-tection from rain received the high-est weighting factor of 14, while the aesthetics received the lowest factor of 1. Similarly, other criteria are given weighting factors according to their points received.
In evaluation of the five concepts against the criteria, 1 to 5 points are given depending on the fulfilment of the requirements (Table 4). Fi-nally, the given points are multiplied by the relevant weighting factor and summed up for ranking.
Among the storage systems, the ferrocement bin system is placed at the highest rank as it received the highest points for most of the high weighted factors of evaluating crite-ria. When considering the flexibil-ity, the system has a fixed holding capacity and therefore, it received the lowest point for that criterion.
The steel silo system is placed at the second rank. It received
high points for the criteria of high weighted factors and it received the lowest point for poor air tightness, high investment, less flexibility and high temperature variation inside the bin.
The barrel system is placed at the third rank and it received lowest point for easy access for theft, high investment for barrels, high temper-ature variation and poor handling of grains such as filling and discharg-ing of paddy.
Although the pit system received the highest points for low invest-ment and low temperature variation inside the bin, other high weighted criteria such as poor protection from rain, soil moisture, rodent and heat-ing received the lowest point. Also due to difficulties in taking out the grains from the pit, it received the lowest point.
Points received by each storage concept are depicted in Fig. 3 and it shows that the ferrocement bin system is the most viable concept of storing paddy as it meets best the requirements identified by the farm-ers.
Final Design Concept of the On-farm Airtight Storage System
The working principles consid-ered in the morphological survey are incorporated into a final design by refining modifications as shown in Fig. 4. The ferrocement bin consists of a frustum of a cone with a coni-cal bottom to minimize the joints in construction in order to obtain maximum air tightness. The bin is
constructed on a three V-cross sec-tioned pillars for convenient unload-ing into sacks. A lid with a threaded socket is provided for filling the bin and closes it airtight. Conical bot-tom with an outlet having a thread-ed socket is provided for easy and complete discharge of the bin. Cov-ering of the upper cone with a straw layer provides sufficient insulation from excessive heating and cooling of the paddy inside the bin. A metal cone is placed on the top to protect from rain. An inclined ladder with a plastic container, which can be pulled by a rope, is provided to feed the bin.
ConclusionsA design for a viable and cost ef-
fective storage system for on-farm storage of paddy was achieved by following a methodical design pro-cess according to Kroonenberg. The method adapted for the study con-sists of three major phases; namely, investigation of problems of paddy farmers, definition of requirements and finally, assessment of working principles for a solution.
An urgent need for an on-farm storage system was identified by investigating the problems of the farmers during the first phase. By analysing the need, an airtight stor-age system was identified as the most viable system for the paddy farmers. In the second phase, re-quirements and characteristics of an air tight storage system were

VOL.38 NO.3 2007 AGRICULTURAL MECHANIZATION IN ASIA, AFRICA, AND LATIN AMERICA 55
established with five functions to be performed by the system. In the final phase, working principles were identified for each function to be ex-ecuted and the most viable concept was selected by assessing them.
This systematic approach pro-vided insight in the problems the farmers encounter in the cultivation of paddy and enabled to identify the farmers needs. After establishing the socio-economic background and the available technologies, it showed to be possible to achieve an appro-priate solution.
REFERENCES
Annis, P. C., H. J. Banks, and Sukar-di. 1984. Insect control in sacks of bagged rice using carbon dioxide treatment and experimental PVC membrane enclosure. Division of Entomology, Technical Paper No 22, CISRO, Australia, 38.
Anon. 2000. BPRE Outdoor storage. Bureau of Postharvest Research and Extension, Department of Agriculture, The Philippines.
Anon. 1973. Ferrocement: Applica-tion in developing countries. Na-tional Academy of Science, Wash-ington, 29-30, 55-59.
Athapol, N., S. G. Ilangantilake, and T. B. Adhikarinayake. 1990. Comparison of rural farm storage structures based on the milling quality of paddy. 12th ASEAN Grain Post Harvest Programme, Indonesia.
Beeny, J. M., L. A. Jensen, G. Var-ghese, and M. Sanusi Bin Jungi. 1972. Use of butyl rubber silos for paddy storage in tropics, Techni-cal Agriculture, (Trinidad), 49(2), 151-160.
Birewar, B. R., K. Krishnamurthy, G. K. Girish, B. K. Varma, and S. C. Kanjilal. 1983. Farm level modern storage structures. Indian Grain Storage Institute, Harpur.
Calderon, M. and S. Navaro. 1980. Synergistic effor t of CO2 and O2 mixtures on two stored grain
insect pests. J. ed., Controlled Atmosphere Storage of Grains, Amsterdam Elsevier, 79-84.
De Lima, C. P. F. 1990. Airtight storage: Principle and Practice. Rivka Ed., Food preservation by modified atmospheres, Chapter 2, CRC Press Inc., Boca Raton, Florida. 9-19.
Donahaye, E., S. Navarro, A. Ziv, Y. Blauschild, and D. Weerasinghe. 1991. Storage of paddy in hermeti-cally sealed plastic liners in Sri Lanka. Tropical Science, Vol.31, 109-121.
Fernando, M. D., K. B. Palipane, and T. B. Adhikarinayake 1985. Improvement of farm level grain storage methods. RPRDC J. Post Harvest Technologist Vol.1, 47-67.
Hodges, R. J. and Surendro. 1996. Detection of controlled atmo-sphere changes in CO2-f lushed sealed enclosures for pest and quality management of bagged milled rice. J.Stored Prod. Res. Vol. 32. No.1. pp. 97-104.
Hyde, M. B., A. A. Baker, A. C. Ross, and C. O. Lopez. 1973. Air-tight grain storage, FAO Agricul-tural Services Bulletin, 17, 71p.
Kenneford, S. and T. O'Dowd. 1981. Guidelines for the use of flexible silos for grain storage in tropical countries. Tropical Stored Prod-ucts Information, 42, 11-20.
Kroonenberg, v.d. H. H. and F. J. Siers. 1998. Methodisch ontwer-pen, EPN, Houten, The Nether-lands.
Navarro, S. and E. Donahaye. 1976. Conservation of wheat grain in Butyl rubber/EPDM container during three storage seasons. Trop. Stored Prod. Inf. 32. 13-23.
Oostdam, J. W. M. 2000. Methodi-cal Engineering Design. Wagenin-gen University. The Netherlands.
Pattinson, I. 1970. Grain storage at village level. FFHC Action Pro-gramme Report TAN/11., FFHC/FAO, Rome. www.agri.gov.il /envir/abstracts.
Sabio, G. S., S. Navarro, E. Do-nahaye, F. M. Caliboso, M. Rind-
ner, and R. Dias. 1995. Control of storage pests in the tropics using sealed storage. www.agri.gov.il/envir/abstracts
Varnava, A., S. Navarro, and E. Do-nahaye. 1995. Long-term hermetic storage of barley in PVC covered concrete platforms under Medi-terranean conditions Postharvest Biol. & Technol. 6: 177-186.
Williams, P., W. Minett, S. Navarro, and T. G. Amos. 1990. Sealing a farm silo for insect control by nitrogen swamping or fumigation. www.agri.gov.il/envir/abstracts.
Wright, I. C. 1998. Design methods in engineering and product de-sign. McGraw Hill, London.
■■
AGRICULTURAL MECHANIZATION IN ASIA, AFRICA, AND LATIN AMERICA 2007 VOL.38 NO.356
Soybean Threshing Efficiency and PowerConsumption for Different Concave Materials
byA. SessizUniversity of Dicle,Faculty of Agriculture,Dept. of Agricultural Machinery,21280, [email protected]
Y. PinarUniversity of Ondokuz,Faculty of Agriculture,Dept. of Agricultural Machinery,55130, [email protected]
T. KoyuncuUniversity of Ondokuz,Faculty of Agriculture,Dept. of Agricultural Machinery,55130, [email protected]
AbstractSoybean is one of the most slowly
established crops in many develop-ing countries. During recent years, greater interest has been given to the cultivation and mechanization of soybean. Particularly, soybean threshing is an important problem because of the product loss. Most of the trials for soybean threshing have been on the structure of beat-ers, although the type and structure of contrbeaters are as important as structure of beaters. This work de-signed and tested concaves made of different materials with respect to threshing efficiency, power require-ment and specific power consump-tion at various feed rates and drum peripheral speeds. Regression equa-tions have been established. The multiple regression technique was used to study the relationship among different variables, namely, concave type, feed rate and drum peripheral speed in relation to three dependent variables, namely, threshing effi-ciency, power requirement and spe-cific power consumption. An experi-
mental model of a soybean thresher without a cleaning and separating unit was developed. The threshing machine had a peg-tooth drum and was powered by a 4 kW electricity motor. Also, four concaves made of different materials were used for the trials. SA-88 soybean variety was used for the trials.
The four concave types were PVC, rubber, chromium, and steel plate with three feed rates (360 kg/h, 720 kg/h, and 1,080 kg/h) and five beater peripheral speeds (7.95 m/s, 9.10 m/s, 10.54 m/s, 12.16 m/s, 14.66 m/s).
Speed and feed rate were found to a have a significant effect (p < 0.01) on power requirement. The power re-quirement increased with increasing feed rate and drum peripheral speed. The specific power consumption decreased with increasing feed rate. Threshing efficiency decreased with increasing feed rate and increased drum peripheral velocity significant-ly improved the threshing efficiency. The highest threshing efficiency was achieved with the chromium type of contrbeater, followed by PVC, the sheet iron, and the rubber.
IntroductionSoybean, one of the oldest culti-
vated crops in the world, has a vital role in supplying protein needs of an expanding population, and this is be-coming one of the leading cash crops in world (Mesquita et al., 1997). Its protein content ranges from 30 to 45 % (Sharma and Devnani, 1980; Tandon and Panwar, 1989). It also contents calcium, phosphorus, and vitamin B. It can also be used for animal feed (Sharma and Devnani, 1980; Chinsuwan and Vejasit, 1991). However, soybean is one of the most slowly established crops in Turkey. During recent years greater inter-est has been given to the cultivation of soybean on account of its dietic, industrial, agricultural and medi-cal importance. In Turkey, after the 1980’s the areas of soybean sowing and production rate have been in-creased in parallel with the increas-ing soybean production in the world.
In soybean production, during the harvesting and threshing, there oc-curs an important product loss aris-ing from physical structure of soy-

VOL.38 NO.3 2007 AGRICULTURAL MECHANIZATION IN ASIA, AFRICA, AND LATIN AMERICA 57
bean. Mechanization becomes more important during the harvesting and threshing which are the most criti-cal steps and expensive operations in soybean production (Yadav and Yadav, 1985; Tandon et al., 1988; Mesquita and Hanna, 1993). Various harvesting and threshing methods are used even though the classic type combine harvesters are commonly used in Turkey as well as USA and the other western countries. Howev-er, this type of combine harvester is not suitable for harvesting beans due to pod distribution along the plants.
Product losses are around 10 %, and sometimes reach to 30 %. However, combines are successfully used for soybean harvesting, even though they are not designed for this purpose (Nave et al., 1972; Tandon and Panwar, 1988; Mesquita et al., 1997). The designed threshing unit for a small enterprise may be more practical and economical than com-bines since the the cost is high and they involve high-energy consump-tion and high seed losses.
Material and MethodsThe soybean-threshing unit seen
in Fig. 1 was made for the purpose of threshing trials and consisted of a spike-tooth drum. The length of the contrbeater was 0.885 m. The diameter and length of threshing drum were 0.885 m and 0.365 m, respectively. The concave clearance
was fixed at about 30 mm for all combinations of speed and feeding rate.
Five threshing beater speeds of 415 min-1, 475 min-1, 550 min-1, 635 min-1 and 765 min-1, equivalent to peripheral velocities of 7.95 m/s, 9.10 m/s, 10.54 m/s, 12.16 m/s, and 14.66 m/s, respectively.
The threshing drum was oper-ated from a 4 kW electricity mo-tor, which was placed on a special frame. A belt-pulley system pro-vided the movement transfer be-tween the threshing beater and the motor (Fig. 1). The three feed rates, 360, 720 and 1,080 kg/h, were used for testing. The independent vari-ables studied were contrbeater type, beater speed and feed rate. Material was loaded on the belt conveyor and feed into the hopper. The drive to the belt conveyor was provided and controlled by an electric motor.
The commonly grown secondary crop soybean variety, SA-88, was used for this experiment. It was har-vested by the conventional method. The moisture content of the grain, head and straw was determined by oven-drying method (ASAE, 1984). The average moisture content of seeds and stalk were 11.66 and 13.47 % w.b., respectively.
Mome nt Me a s u r i ng D ev ice (Torqumeter) and Multi-Measuring Device (Multimeter) were used to measure the rotating moment (Fig. 1). The power requirement was cal-culated by using the formula given
by Yavuzcan et al. (1987) and Tezer et al. (1993).
Consumed specific power values for threshing 1 ton of stalk product were mean power values. Unthreshed seeds were separated from pods and the collected seeds were weighed af-ter threshing and cleaned by hand to determine the threshing efficiency as a percentage of total seeds collected (Sharma and Devnani, 1980; Bhutta et al., 1997; Sessiz, 1998).
The performance of the developed threshing unit was analysed against different concave, threshing speed and feed rates by using a random-ized complete block design of a 4 by 5 by 3 factorial experiment with three replications in each treatment. All measured variables were consid-ered in the statistical development of the multiple linear regression models. The linear model of maxi-mum correlation was determined. Using Excel tested data, the normal form of multiple linear regression model was represented by an equa-tion of the following type:
Y = a + bX1 + cX2
Where: Y was the estimated power requirement, specific power con-sumption and threshing efficiency value, a was the constant, b and c was the coefficient of power require-ment, specific power consumption and threshing efficiency, X1 was the drum speed and X2 was the feed rate.
Results and DiscussionInfluence of Concave Type on Power Requirement and Specific Energy Consumption
The type of contrbeater, beater, peripheral speed and feed rate sig-nificantly affected the power con-sumption and specific energy con-sumption at the 1 % level of signifi-cance. The linear multiple regression equations derived for each concave are given in Table 1. The peripheral speed (V) and the feed rate (C) had a significant effect on the power consumption (Sharma ve Devnani,
Fig. 1 A view of the threshing unit

AGRICULTURAL MECHANIZATION IN ASIA, AFRICA, AND LATIN AMERICA 2007 VOL.38 NO.358
1980). Increasing the V and the C raised the power consumption because of the positive coefficient value. The power requirement of the drum increased with drum speed because of the increased feed rate, which accounted for the extra energy required for threshing material. The increasing feed rate required greater compression of the material as it passed between the threshing drum and concave and caused an increase in power requirement (Sudajan at al., 2002).
Minimum power requirement was obtained with chromium and PVC, whereas a maximum consumption was achieved with rubber conrabe-ater type.
The multiple regression equations of the specific power consumption (SPC) are seen in Table 2, indicating a inversed relationship between the feed rate and all contrbeaters types.
The power consumed by the drum for threshing the product decreases with increasing feed rate. All equa-tions indicate that all parameters have a significant effect on thresh-ing efficiency. A maximum SPC was obtained with the rubber cov-ered contribeater whereas a mini-mum consumption was gained with the PVC type.
According to the regression equa-tions, the V has positive values, hence, increasing the V raises the
SPC and increasing the C reduces the SPC due to the negative coeffi-cient value.
For each contrabeater type, power requirement values and specif ic power requirement were obtained using a drum speed of 14.66 m/s and feed rate of 1,080 kg/h. The results are presented in Fig. 2. The maximum power requirement and specific power consumption was obtained with the rubber type con-trbeater, while the values gained for PVC and chromium were lowest and similar. This indicates that the fric-tion coefficient of PVC and chro-mium material were low, and hence they consumed less power.
Influence of Concave Type on Threshing Efficiency
The regression equations are given in Table 3 for each concave type, depending on peripheral speed and feed rate. Threshing efficiency (TE) was signif iciantly affected by the peripheral speed and feed-ing rate, the speed had a possitive effect, whereas the feeding had a negative effect (Tandon et al., 1988). The effect of V was higher than C (Chinsuwan and Vejasit, 1991). Because the partial regression coef-ficient of V is positive it increased the TE, whereas the effect of C was decreased due to negative coef-ficient. The partial regression coef-
ficient in the equations showed that the unit variation for V was greater than C. The regression coefficient of speed and feeding rate on threshing efficiency were highly significant at the 1 % level in all concave types.
The TE values were obtained us-ing the drum peripheral speed of 14.66 m/s and feed rate 1,080 kg/h for each contrbeater type are given in Fig. 3. It shows that the highest TE (92.8 %) was gained with the chromium contrbeater type, fol-lowed by PVC (90.92 %), steel plate (87.51), and rubber (81.54 %).
PVC and chromium type con-trbeaters had the lowest power con-sumption with the highest TE values. Hence, the use of PVC and chromium type contrbeaters reduced product loses as well as power cost. Equations derived for each contrbeater may used to estimate the power consump-tion and TE. This study showed that to increase the threshing efficiency the speed must be kept between 10.54 m/s and 14.66 m/s. Thus, the best period is between 550 d/d and 765 d/d. The trials proved that the lowest threshing efficiency was gained with the rubber-covered concave, whereas the highest value was obtained with the chromium contrbeater.
ConclusionsIt was concluded that the concave
Power Cunsumption, kw
0.0
0.5
1.0
1.5
2.0
Sheet ironCromiumRubberPVCType of concave
SPC, kWh/t
0.0
0.5
1.0
1.5
2.0
2.5
Sheet ironCromiumRubberPVCType of concave
Threshing efficiency, %
75
80
85
90
95
Sheet ironCromiumRubberPVCType of concave
Fig. 2 Changes in power requirement and the SPC dependingconcave type (FR: 1,080 kg/h, V: 14.66 m/s)
Fig. 3 Changes in the TEdepending concave type

VOL.38 NO.3 2007 AGRICULTURAL MECHANIZATION IN ASIA, AFRICA, AND LATIN AMERICA 59
type has a significant effect on pow-er requirement, specific power con-sumption and threshing efficiency.
The power requirement and spe-cial power consumption of chro-mium type concave were lower than the others. The power consumption increased with all concave types de-pending on the increase in the speed and the feeding rate. The highest power consumption was obtained with the rubber-covered concave. The lowest consumption was ob-tained with the cromium type. The lowest specific energy consumption was with chromium type at all drum speeds and feed rates.
Threshing efficiency increased with increasing BPS with all con-trbeater types. The highest increase was achieved with the chromium type and the lowest with the rubber-covered type.
Type of countabeater Fitted regression equations
Multiple correlation
coefficient (R)Standard error
of estimate
PVC P = -1.356 + 0.149V** + 0.000682C** 0.959 0.122Rubber P = -1.102 + 0.151V** + 0.000684C** 0.971 0.103Cromium P = -0.802 + 0.126V** + 0.000394C** 0.983 0.06Sheet iron P = -0.792 + 1.085V** + 0.000632C** 0.969 0.127
Type of countabeater Fitted regression equations
Multiple correlation
coefficient (R)Standard error
of estimate
PVC P = -0.850 + 0.225V** - 0.000630C** 0.963 0.161Rubber P = -0.0593 + 0.239V** - 0.00132C** 0.950 0.232Cromium P = 0.193 + 0.204V** - 0.00146C** 0.944 0.233Sheet iron P = 0.169 + 0.166V** - 0.000948C** 0.968 0.127
Type of countabeater Fitted regression equations
Multiple correlation
coefficient (R)Standard error
of estimate
PVC TE = 82.27 + 0.946V** - 0.0039C** 0.57 3.73Rubber TE = 64.66 + 1.999V** - 0.0115C** 0.68 6.30Cromium TE = 84.67 + 1.233V** - 0.0092C** 0.63 4.94Sheet iron TE = 77.29 + 1.287V** - 0.0080C** 0.61 5.12
Table 3 The multiple regression equations of the threshing efficiency
Table 2 The multiple regression results for the specifice power cunsumption
Table 1 The multiple regression results for the power requirement
**Significant at 1 % level. P: Specifice power cunsumption, kWh/t. V: Drum peripheral speed, m/s. C: Feeding rate, kg/h
**Significant at 1 % level. P: Predicted value of power cunsumption, kW. V: Beater peripheral speed, m/s. C: Feeding rate, kg/h
**Significant at 5 % level. TE: Threshing efficiency, %. V: Drum peripheral speed, m/s. C: Feeding rate, kg/h
REFERENCES
ASAE. 1984. Moisture measurement. ASAE Standards. ASAE S352.1.
Bhutta, M. S, M. S. Sabir and Z. Jaxaid. 1997. Comparative Per-formance of Different Methods of Sunflower Threshing. AMA Vol. 28(3): 65-67.
Chinsuwan, W and A. Vejasit. 1991. Comparison of Axial-Flow Peg Tooth and Rasp Bar Cylinders for Threshing Soybean. Proceedings of the Fourteenth ASEAN Semi-nar on Grain Post Harvest Tech-nology. Manila, Philippines, 5-8 November, 1991.
Mesquita, C. M. and M. A. Hana. 1993. Soybean Threshing Mechan-ics: I. Frictional Rubbering by Flat Belts. Vol: 36(2): March-April.
Mesquita, C. M., M. A. Hana, and R. W. Weber. 1997. Blast Wheel
Device for Threshing Soybeans. Transaction of ASAE. Vol: 40(3): 541-546.
Nave, W. R., D. E. Tate, and B. T. Butter. 1972. Combine Header for Soybean. Transactions of The ASAE, 15(4): 632-635
Sessiz, A. 1998. Studies on Design of Spike-Tooth and Rasp-Bar Type Axial-Flow Type Threshing Units and on Development of Their Ap-propriate Prototypes. Ph.D. Thesis. Trakya University, Graduta School of National and Applied Sciences. Agricultural Machinery Main-science Section. Edirne-Turkey
Sharma, K. D. and R. S. Devnani. 1980. Threshing Studies on Soy-bean and Cowpea. AMA Vol. 11 (1).
Sharma, V. K., N. S. Sandhar, P. K. Gupta, S. S.Ahuja, I. K. Garg, and J. S. Sandha. 1984. Design, Development and Evaluation of a Tractor-Operated Multicrop Thresher. AMA Vol. 15(4).
Sudajan, S., V. M. Salokhe, and K. Triratanasirichai. 2002. Effect of Type of Drum, Drum speed and Feed Rate on Sunflower Thresh-ing. Biosystem Enginerring. Vol. 83(4): 413-421.
Tandon, S. K., B. S. Sirohi, and P. B. S. Sarma. 1988. Threshing Effi-ciency of Pulses Using Step-Wise Regression Technique. AMA Vol. 19(3): 55-57.
Tandon, S. K. and J. S. Panwar. 1989. Status of Mechanization of Harvesting and Threshing of Soy-bean in India. AMA Vol. 20(1): 55-60.
Tezer, E., A. Sabanci, and Tarimsal Mekanizsayon. 1993. Ç.Ü. Ziraat Fakültesi Genel Yayin No:44 Ders Kitaplari Yayin No. 7, Adana.
Yadav, R. N. S and B. G. Yadav. 1985. Design and Development of A Tractor Drawn Soybean Reaper. Proc. ISEA, SJC. Vol. 1. Bhopal, India.
Yavuzcan, G., B. Erdiler, and A. Saral. Ölçme Teknigi. Ankara Ünivrtsitesi Fen bilimleri Enstitüsü Yayin No. 3. Ankara. ■■

AGRICULTURAL MECHANIZATION IN ASIA, AFRICA, AND LATIN AMERICA 2007 VOL.38 NO.360
Evaluation of the Agricultural Tractor Park of EcuadorbyLizardo Reina CAssociate ProfessorFaculty of Agricultural Engineering,Technical University of Manabi,[email protected]
Edmundo J. HetzProfessorFaculty of Agricultural Engineering,University of Concepción,P.O. Box 537, [email protected]
AbstractThe principal objectives of this
work were to establish the tractor hours demanded by the agricultural production systems of Ecuador; to compare this demand with the ac-tual tractor park and the total power available for agriculture; and to ana-lyze the mechanization indicators of Ecuadorian agriculture.
The main sources of information were the 2000 Agricultural Census, the Ministry of Agriculture, the Institute of Agricultural Research, the Central Bank of Ecuador, the Technical University of Manabi, the University of Loja, several agricul-tural engineers working in mecha-nization programs, and 18 produc-ers in the provinces of Pichincha, Cotopaxi and Loja (Sierra Region) and Guayas, Los Rios and Manabi (Coastal Region).
The production systems, culti-vated area with 24 main annual and perennial (tree) crops, tractor hours demanded by these systems, human, animal and tractor power were es-tablished. The mechanization level indicators obtained were compared with levels recommended for devel-oping countries and with the levels existing in other Latin American countries.
The results show that the produc-tive systems of annual and perennial crops have similar areas with about
1.2 million hectares each. To this, 3.3 million hectares of cultivated pastures were added. Annual crops have a much larger demand (2.56 times) of yearly tractor hours than perennial crops; cultivated pastures use very little tractor hours.
The actual tractor park is 14,652 units that provide 716,880 kW of power. When the human and animal power are added, a grand total of 1,217,945 kW is reached. This power does not satisfy the yearly demand of annual and perennial crops, giv-ing origin to a deficit of 2,600 trac-tors; larger deficits appear when pastures are considered and when recommended power levels for de-veloping countries are considered.
The actual mechanization level of Ecuador is 0.30 kW per hect-are of annual and perennial crops. This indicator would go up to 0.36 kW/ha if the tractor deficit of 2,600 units were added. These levels are far from the ones existing in the majority of the other Latin Ameri-can countries and farther from the levels recommended for developing countries. Other indicators, such as hectares and rural workers per trac-tor, also show an agriculture with low levels of mechanization.
IntroductionThe Republic of Ecuador is locat-
ed in northeastern South America, It has four well defined regions: Coast, Sierra, Amazonia and Gala-pagos. Its area is 271.667 km2 and its population 12,156,608 inhabit-ants (INEC, 2002).
The Agricultural sector is one of the most important of the Ecuador-ian economy, employing 38 % of the working population and produc-ing 17 % of the GNP, The principal crops are caccao, maize, rice, cof-fee, banana, plantain, African palm and sugarcane.
The agricultural area of Ecuador is 12,355,831 hectares, distributed in natural and artificial pastures (36 %), forests (31 %), crops and fruit trees (24 %), very high dry moors and other uses (9 %) (INEC, 2002).
Land tenure is highly skewed, with a high number (366,058) of very small farmers (< 2 ha) own-ing only 2 % of the area and a small number (19,557) of large farmers (> 100 ha) owning 42 % of the agricul-
Soil use Area, haAnnual crops 1 1,153,802Perennial crops 2 1,243,644Cultivated pastures 3,357,167Land in recess 381,304
Total 6,135,917
Table 1 Agricultural area of Ecuador considered in this study
1 Area seeded alone +50 % of associated area, 2 Area planted alone +25 % of associated area

VOL.38 NO.3 2007 AGRICULTURAL MECHANIZATION IN ASIA, AFRICA, AND LATIN AMERICA 61
tural area (INEC, 2002).Agricultural mechanization in Ec-
uador is in its early stages of devel-opment, with much work carried out manually and with animal traction. Zambrano (1994) points out that there are 2,428,625 ha with tractor mechanization potential. Aldean (1991) and Jarre (2000) have estab-lished in some valleys of Ecuador, tractor mechanization levels of 0.1 to 0.3 HP per cultivated hectare.
Several authors (Giles, 1975;
Campbell, 1992: Ortiz-Cañavate, 1993; Witney, 1995; Clarke, 1997; Clarke and Bishop, 2002) have in-dicated that the productivity of land and labor could be greatly increased and insure food security if the developing countries could reach mechanization levels in the range 0.50-0.75 kW per hectare of culti-vated land.
The hipothesis put forward in this work is that the level of mechaniza-tion of Ecuadorian agriculture is
below the recommended levels for developing countries and this is af-fecting negatively the productivity of land and labor in this country.
The main objectives of this work were to establish the tractor hours demanded by the agricultural pro-duction systems of Ecuador; to compare this demand with the ac-tual tractor park and to analyze the mechanization indicators of agricul-ture in Ecuador.
MethodologyInformation Sources
The main sources of information were the National Agricultural Cen-sus (INEC, 2002), the Ministry of Agriculture, the National Institute of Agricultural Research, the Cen-tral Bank of Ecuador (BCE, 2003), The Technical University of Mana-bi, The National University of Loja, six expert agricultural engineers working at Universities and mecha-nization programs, and 18 producers in the provinces of Pichincha, Coto-paxi and Loja (Sierra) and Guayas, Los Rios and Manabi (Coast).
Production Systems and Culti-vated Area
The 12 most important annual and the 12 perennial crops were se-lected to establish their production systems and area utilized. The total area considered in the study included annual crops, fruit and industrial trees, cultivated pastures and land in recess.
To estimate the tractor hours per hectare two seasons were consid-ered (winter and summer). For the summer season 28 % of the area was considered, since this is the ir-rigated area of the country.
Tractor Hours DemandedTo establish this demand the op-
erative time (h/ha) of each one of the agricultural operations was de-termined according with the infor-mation gathered in the field and the
Main annual crops
Annual cropsSeeded area, ha
Alone Associated Total Study area 1
Maize (Zea mays) 349,346 122,199 471,545 410,446Rice (Oryza sativa) 343,936 5,790 349,726 346,831Beans (Phaseolus vulgaris L.) 24,379 97,212 121,591 72,985Soybean (Glycine max L.) 54,350 1,630 55,980 55,165Barley (Hordeum vulgare) 48,874 2,117 50,991 49,933Potato (Solanum tuberosum) 47,494 2,225 49,719 48,607Broad bean (Vicia faba L.) 18,338 24,836 43,174 30,756Wheat (Triticum sativum) 21,945 747 22,692 22,319Yucca (Manihot sculenta) 17,846 8,408 26,254 22,050Peas (Pisum sativum L.) 13,571 4,506 18,077 15,824Onions (Allium cepa) 11,471 763 12,234 11,853Peanuts (Arachis hypogea) 7,624 4,444 12,068 9,846Others 46,033 22,307 68,340 57,187
National total 1,005,207 297,184 1,302,391 1,153,802Souce: INEC-III CNA 20001 Area seeded alone +50 % associated area
Table 2 Main annual crops in Ecuador
Main perennial crops
Perennial crops Planted area, haAlone Associated Total Study area 1
Cacao (Theobroma cacao L.) 243,146 191,272 434,418 290,964Banana (Musa paradisiaca) 180,331 85,793 266,124 201,779Coffee (Coffea sp.) 151,941 168,970 320,911 194,184African palm (Elaeis guinee) 146,314 15,888 162,202 150,286Sugarcane (Saccharum officinarm L.) 125,355 6,497 131,852 126,979Plantain (Musa sp.) 82,341 101,258 183,599 107,656Maracuya (Passiflora edulis S.) 28,747 2,892 31,639 29,470Mango (Mangifera indica) 16,754 2,641 19,395 17,414Palmetto (Trachycarpus fortunci) 14,752 606 15,358 14,904Abaca (Musa textilis) 14,713 118 14,831 14,743Orange (Citrus sinensis) 3,737 40,759 44,496 13,927Mandarin (Citrus reticula) 2,077 12,873 14,950 5,295Others 62,833 52,846 115,679 76,045
National total 1,073,041 682,413 1,755,454 1,243,644Souce: INEC-III CNA 20001 Area planted alone +25 % associated area
Table 3 Main perennial (tree) crops in Ecuador

AGRICULTURAL MECHANIZATION IN ASIA, AFRICA, AND LATIN AMERICA 2007 VOL.38 NO.362
standards proposed by Ibanez and Abarzua (1995).
To estimate the h/ha for perennial crops, the useful (commercial) life of the orchard was used to distrib-ute the h/ha needed for the orchard establishment in the years of useful life. To cultivated pastures and land in recess 1.5 and 1.0 h/ha were as-signed, respectively.
Estimation of Human PowerOf all the persons living in the
Agricultural Productions Units (INEC, 2001), those with ages be-tween 15 and 60 years were consid-ered. The power equivalences used were 0.075 kW for men and 0.05 kW for women (Fluck, 1992; Stout, 1990). Of these values 100 % was used for ages 20 to 60 years and 90 % for ages 15 to 20 years.
Estimation of Animal PowerOf the animals counted in the cen-
sus (INEC, 2002), 80 % of oxen, 60 % of horses, 50 % of donkeys and mules were considered, according to the field work in the 6 provinces.
The power equivalences used were 0.75 kW for horses, 0.56 kW for oxen, 0.52 kW for mules and 0.26 kW for donkeys (Fluck, 1992; Stout, 1990).
Estimation of Tractor PowerTractors appearing in the Census
(INEC, 2002) were classified in 3 age groups: < 5 years; 6-15 years, and > 15 years. An average power of 60 kW and 100 kW for tire and crawler tractors was used (Zam-brano, 1994; Jarre, 2000; Aldeán, 1991); His power was decreased according to age: 60 kW for < 5 years, 50 kW for 6-15 years, and 25 kW for > 15 years, in tire tractors. For crawler tractors, 100 kW for < 5 years; 75 kW for 6-15 years, and 50 kW for > 15 years. An average an-nual use of 836 hours for these trac-tors was utilized (Reina and Hetz, 2003)
Evaluation of the Demand and Availability of Power for Agricul-ture.
(a) Tractor hours demand of the Ecuadorian agr iculture and the capacity to satisfy it with the actual tractor park and the human and animal power avail-able;
(b) Power available for cultivated area (kW/ha) including the hu-man and animal power and its comparison to mechanization indicators recommended for de-veloping countries of 0.50 - 0.75 kW/ha (Giles, 1975; Campbell,
1992; Ortiz-Cañavate, 1993; Witney, 1995; Clarke, 1997; Clarke and Bishop, 2002);
(c) General mechanization indica-tors, like rural population per tractor and hectares per tractor compared with those published by FAO and those of other Latin American countries.
Results and DiscussionsAreas and Species Considered in This Study
Table 1 shows the agricultural area considered in this study. Annu-al and perennial crops cover about 1.2 million hectares each, with cul-tivated pastures covering 3.36 mil-lion hectares, for a total considered of 6.14 million hectares.
Tables 2 and 3 show the differ-ent species and area covered by the 24 principal annual and perennial crops. The main annual crops are maize, rice, bean, soybean, barley and potatoes. Caccao, banana, cof-fee, African palm, sugarcane and plantain are among the tree crops.
Power Demand of the Production Systems
Table 4 shows that the production systems of the 12 principal annual crops demand 17.29 million tractor hours per year. On the other hand, the 12 principal tree crops demand
Population, thousand
0
400
800
1200
1600
2000
TractorAnimalHuman
1,763.886
Population
Available power675.832
14.6520
200
400
600
800
Power sources
Available power, thousand kW
392.243
716.88
108.822
Fig. 1 Ecuador in South America
Fig. 2 power study to agricultural in Ecuador
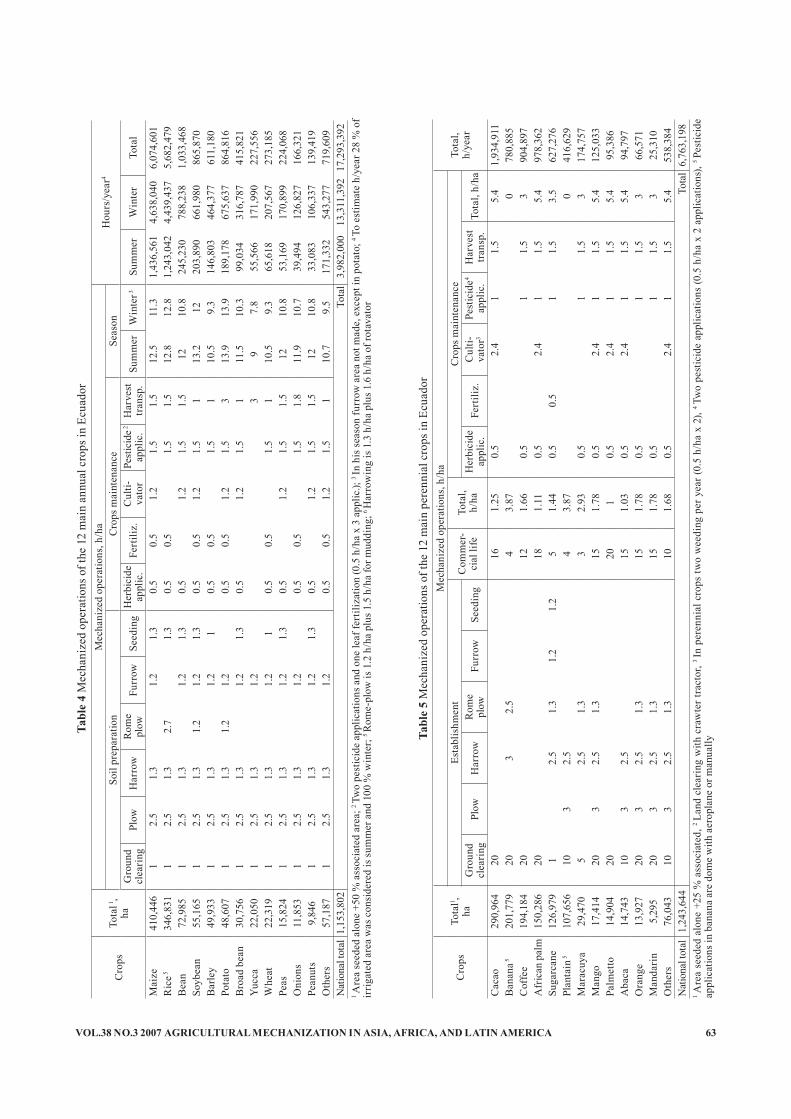
VOL.38 NO.3 2007 AGRICULTURAL MECHANIZATION IN ASIA, AFRICA, AND LATIN AMERICA 63
Cro
psTo
tal 1
,ha
Mec
hani
zed
oper
atio
ns, h
/ha
Hou
rs/y
ear4
Soil
prep
arat
ion
Cro
ps m
aint
enan
ceSe
ason
Gro
und
clea
ring
Plow
Har
row
Rom
e pl
owFu
rrow
Seed
ing
Her
bici
de
appl
ic.
Fert
iliz.
Cul
ti-va
tor
Pest
icid
e 2
appl
ic.
Har
vest
tr
ansp
.Su
mm
erW
inte
r 3Su
mm
erW
inte
rTo
tal
Mai
ze41
0,44
61
2.5
1.3
1.2
1.3
0.5
0.5
1.2
1.5
1.5
12.5
11.3
1,43
6,56
14,
638,
040
6,07
4,60
1R
ice 5
346,
831
12.
51.
32.
71.
30.
50.
51.
51.
512
.812
.81,
243,
042
4,43
9,43
75,
682,
479
Bea
n72
,985
12.
51.
31.
21.
30.
51.
21.
51.
512
10.8
245,
230
788,
238
1,03
3,46
8So
ybea
n55
,165
12.
51.
31.
21.
21.
30.
50.
51.
21.
51
13.2
1220
3,89
066
1,98
086
5,87
0B
arle
y49
,933
12.
51.
31.
21
0.5
0.5
1.5
110
.59.
314
6,80
346
4,37
761
1,18
0Po
tato
48,6
071
2.5
1.3
1.2
1.2
0.5
0.5
1.2
1.5
313
.913
.918
9,17
867
5,63
786
4,81
6B
road
bea
n30
,756
12.
51.
31.
21.
30.
51.
21.
51
11.5
10.3
99,0
3431
6,78
741
5,82
1Y
ucca
22,0
501
2.5
1.3
1.2
39
7.8
55,5
6617
1,99
022
7,55
6W
heat
22,3
191
2.5
1.3
1.2
10.
50.
51.
51
10.5
9.3
65,6
1820
7,56
727
3,18
5Pe
as15
,824
12.
51.
31.
21.
30.
51.
21.
51.
512
10.8
53,1
6917
0,89
922
4,06
8O
nion
s11
,853
12.
51.
31.
20.
50.
51.
51.
811
.910
.739
,494
126,
827
166,
321
Pean
uts
9,84
61
2.5
1.3
1.2
1.3
0.5
1.2
1.5
1.5
1210
.833
,083
106,
337
139,
419
Oth
ers
57,1
871
2.5
1.3
1.2
0.5
0.5
1.2
1.5
110
.79.
517
1,33
254
3,27
771
9,60
9N
atio
nal t
otal
1,15
3,80
2To
tal
3,98
2,00
013
,311
,392
17,2
93,3
92
Cro
psTo
tal1 ,
ha
Mec
hani
zed
oper
atio
ns, h
/ha
Tota
l, h/
year
Esta
blis
hmen
tC
omm
er-
cial
life
Tota
l,h/
ha
Cro
ps m
aint
enan
ceG
roun
d cl
eari
ngPl
owH
arro
wR
ome
plow
Furr
owSe
edin
gH
erbi
cide
ap
plic
.Fe
rtili
z.C
ulti-
vato
r3Pe
stic
ide4
appl
ic.
Har
vest
tr
ansp
.To
tal,
h/ha
Cac
ao29
0,96
420
161.
250.
52.
41
1.5
5.4
1,93
4,91
1B
anan
a 520
1,77
920
32.
54
3.87
078
0,88
5C
offe
e19
4,18
420
121.
660.
51
1.5
390
4,89
7A
fric
an p
alm
150,
286
2018
1.11
0.5
2.4
11.
55.
497
8,36
2Su
garc
ane
126,
979
12.
51.
31.
21.
25
1.44
0.5
0.5
11.
53.
562
7,27
6Pl
anta
in 5
107,
656
103
2.5
43.
870
416,
629
Mar
acuy
a29
,470
52.
51.
33
2.93
0.5
11.
53
174,
757
Man
go17
,414
203
2.5
1.3
151.
780.
52.
41
1.5
5.4
125,
033
Palm
etto
14,9
0420
201
0.5
2.4
11.
55.
495
,386
Aba
ca14
,743
103
2.5
151.
030.
52.
41
1.5
5.4
94,7
97O
rang
e13
,927
203
2.5
1.3
151.
780.
51
1.5
366
,571
Man
dari
n5,
295
203
2.5
1.3
151.
780.
51
1.5
325
,310
Oth
ers
76,0
4310
32.
51.
310
1.68
0.5
2.4
11.
55.
453
8,38
4N
atio
nal t
otal
1,24
3,64
4To
tal
6,76
3,19
8
Tabl
e 4
Mec
hani
zed
oper
atio
ns o
f the
12
mai
n an
nual
cro
ps in
Ecu
ador
1 A
rea
seed
ed a
lone
+50
% a
ssoc
iate
d ar
ea; 2
Two
pest
icid
e ap
plic
atio
ns a
nd o
ne le
af fe
rtili
zatio
n (0
.5 h
/ha
x 3
appl
ic.);
3 In
his
seas
on fu
rrow
are
a no
t mad
e, e
xcep
t in
pota
to; 4
To e
stim
ate
h/ye
ar 2
8 %
of
irrig
ated
are
a w
as c
onsi
dere
d is
sum
mer
and
100
% w
inte
r; 5 R
ome-
plow
is 1
.2 h
/ha
plus
1.5
h/h
a fo
r mud
ding
; 6 H
arro
win
g is
1.3
h/h
a pl
us 1
.6 h
/ha
of ro
tava
tor
Tabl
e 5
Mec
hani
zed
oper
atio
ns o
f the
12
mai
n pe
renn
ial c
rops
in E
cuad
or
1 A
rea
seed
ed a
lone
+25
% a
ssoc
iate
d, 2
Land
cle
arin
g w
ith c
raw
ter t
ract
or, 3
In p
eren
nial
cro
ps tw
o w
eedi
ng p
er y
ear (
0.5
h/ha
x 2
), 4 Tw
o pe
stic
ide
appl
icat
ions
(0.5
h/h
a x
2 ap
plic
atio
ns),
5 Pe
stic
ide
appl
icat
ions
in b
anan
a ar
e do
me
with
aer
opla
ne o
r man
ually

AGRICULTURAL MECHANIZATION IN ASIA, AFRICA, AND LATIN AMERICA 2007 VOL.38 NO.364
Soil use Area, ha Number hours/year
Human 3 and animal operations,
40%
Total hours with tractor/year
Crops 1 2,397,446 24,056,590 9,622,636 14,433,954Cultivated pastures 2 3,357,167 5,035,571 2,014,229 3,021,342Land in recess 381,304 381,304 152,522 228,782
Total 6,135,917 29,473,465 11,789,386 17,684,079
Table 6 Total yearly demand of tractor hours in Ecuador
1 Annual and perennial crops; 2 To estimate the no. of h/year, 1.5 h/ha for pastures and 1 h/ha for recess; 3 Human and animal share
Age, yearTire tractors Crawler tractors Total power,
kWNo. tractor Mean power, kW
Power available, kW No. tractor Mean power,
kWPower
available, kW< 5 2,548 60 152,880 259 100 25,900 178,780
6 - 15 7,266 50 363,300 948 75 71,100 434,400> 15 3,114 25 77,850 517 50 25,850 103,700Total 12,928 594,030 1,724 122,850 716,880
Table 7 Agricultural tractor park of Ecuador
Source: Elaborated by the Author upon data INEC (2002)
Area considered,
haDemand of hours/year
Human and animal operations,
40%
Tractor hours
demand, hours/year
Tractor 1 annual use, hours/year
Tractors required
Exisiting tractor
Tractor deficit
Annual and perennial crops 2,397,446 24,056,950 9,622,636 14,433,954 836 17,265 14,652 2,613Pastures and recess 6,135,917 29,473,465 11,789,386 17,684,079 836 21,153 14,652 6,501
Table 8 Demand and supply of tracor hours for agriculture in Ecuador
1 Reina and Hetz (2003)
6.76 million tractor hours per year, as it is shown in Table 5. It can be seen that the largest demand (77 %) occurs in the winter season when all the area is utilized taking advantage of the rain; in the summer season only the irrigated area is seeded and the demand of tractor hours is much smaller.
Perennial tree crops demand a low number of tractor hours given that their maintenance, especially pesticide applicactions, is carried out with airplanes and the tractor hours needed for their establishment are distributed in the years of com-mercial life.
Total Yearly Demand of Tractor Hours in Ecuador
Table 6 shows that the total yearly demand of tractor hours for the an-nual and perennial crops is 24 mil-lion, to which the demand of culti-vated pastures and land in recess is to be added to reach a grand total of 29.5 million h/yr. Taking away the work carried out manually and with animal traction leaves the 17.7 mil-lion h/yr that are to be carried out with tractors.
Agricultural Tractor Park of Ec-uador
Table 7 shows there are 12,928 tractors with pneumatic tires and
1,724 crawler tractors, which to-gether provide a total of 716,880 kW of power.
Total Power Supply to Agricul-ture in Ecuador
Figure 2 shows the total provision of power to agriculture, consist-ing of 108,822 kW (9 %) of human power, 392,243 kW (32 %) provided by animals and 716,880 kW (59 %) by tractors, for a grand total of 1,217,945 kW.
Demand and Supply of Tractor Hours for Agriculture in Ecuador
Table 8 shows that the yearly de-mand of tractor hours for the area with annual and perennial crops (2,397,446 ha) corresponds to a bit more than 24 million hours. For the area that includes cultivated pastures (6,135,917 ha) the power demand reaches 29.5 million h/yr.
When the human and animal work
is substracted, the hours to be car-ried out with tractors comes down to 14.4 million h/yr and 17.7 million h/yr without and with the pastures, respectively. With tractors working an average of 836 h/yr (Reina and Hetz, 2003) a demand of 17,265 and 21,153 tractors appear for the two areas considered. Substracting the actual tractor park of 14,652 units, deficits of 2,613 and 6,501 tractors appear, for the two areas considered.
Taking into consideration the average annual historic rate of trac-tor importation into Ecuador of 423 tractors/yr (FAOSTAT, 2004), the covering of the first deficit of 2,613 units would take many years, going from 7 to 12 years according to a new importation rate of 100 % or 50 % above the actual rate. These are decisions not to be taken lightly and should consider the long range plans and policies of agricultural develop-ment of the country.

VOL.38 NO.3 2007 AGRICULTURAL MECHANIZATION IN ASIA, AFRICA, AND LATIN AMERICA 65
Area considered,
ha
Sugested indicator,
kW/haTotal power needed, kW
Actual 1 power, kW Deficit, kW
Required tractors 2
Tire tractors Crawlers
Annual and perennial crops 2,397,446 0.75 1,798,085 1,217,945 580,140 8,509 696
Table 9 Tractor power deficit in Ecuador to reach 0.75 kW/ha
1 It includes human, animal and tractor power; 2 88 % tire tracotrs and 12 % crawlers
Area considered,
haRural
populationActual
number of tractors
Required tractors
General indicatorsha/tractor Rural pop./ tractor
Actual Projected ActuralAnnual and perennial crops 2,397,446 3,061,917 14,652 16,907 164 142 209Pastures and recess 6,135,917 3,061,917 14,652 21,153 419 290 209
Table 10 Other mechanization indicators for Ecuador
Power Indicators in Ecuadorian Agriculture
Figure 3 shows the actual power indicators for the area with annual and perennial crops and for the area that includes the cultivated pastures. There are also projected indicators that include the tractor deficit estab-lished, excluding and including the human and animal power.
These indicators go from as low as 0.12 kW/ha for the area with pas-tures to a high of 0.57 kW/ha when only the area with annual and peren-nial crops is considered and the hu-man and animal power is included. The most representative of these six indicators would be 0.30 kW/ha that considers only the tractor power for the annual and perennial crops area.
These power levels are far from
the level of 0.75 kW/ha recommend-ed for developing countries (Giles, 1975; Stout, 1990; Fluck, 1992; Campbell, 1992; Ortiz-Cañavate, 1993; Witney, 1995; Clarke, 1997; Clarke and Bishop, 2002). They are also below the levels of Chile (0.56 kW/ha), Argentina (0.60 kW/ha), Mexico (0.77 kW/ha), and Venezue-la (0.79 kW/ha), being close to those of Colombia and Peru (0.23 and 0.14 kW/ha).
Tractor Power Deficit to Reach 0.75 kW/ha
Table 9 shows that to go from the actual power available in Ecuador to the recommended level of 0.75 kW/ha, only in the area with annual and perennial crops and maintain-ing the use of human and animal
power, the actual tractor park would have to increase by 9,205 units. This increment would easily take 20 to 25 years.
This power level, of 0.75 kW per hectare of cultivated land, has been recommended by the authors pre-viously mentioned, and has been validated by the authors of this study for several countries of Latin American, as it is shown in Figure 4, where it is clear that to a larger power level corresponds a larger per capita income.
Other Agricultural Mechaniza-tion Indicators
Table 10 shows general mechani-zation indicators. It shows there are from 164 to 419 hectares per tractor, according to the area considered;
Power indicator, kW/ha
0.0
0.1
0.2
0.3
0.4
0.5
0.6
Annual, perennial and pasturesAnnual and perennial crops
0.30
Actual
Projected
0.36
0.57
0.12
0.19
0.26
Human and animal power included
Indicator, kW/ha
0.0
0.1
0.2
0.3
0.4
0.5
0.6
0.7
0.8
VenezuelaMexico
ArgentinaChille
UruguayEcuador
ParaguayColombia
PeruBolivia
Mechanization indicator
Per capita income
0
1000
2000
3000
4000
5000
6000
7000
Countries
Per capita income, USD/year
r = 0.90
Sources: Elaborated by the Author on data of FAOSTAT (2004), National Agricultural Census and the International Monetary Fund
Fig. 3 Power indicators in Euadorian agriculture Fig. 4 Agricultural power indicators and per capita incomeof several Latin American countries

AGRICULTURAL MECHANIZATION IN ASIA, AFRICA, AND LATIN AMERICA 2007 VOL.38 NO.366
these values go down to 142 and 290 hectares per tractor, when no deficits are considered. They are far from the ones existing in Chile (90) and Venezuela (69), closer to Peru (319) and Colombia (216), but better than Bolivia (522).
On the other hand, Table 10 also shows the number of rural persons per tractor, with 209 for Ecuador, smaller than those in Bolivia (596), Peru (593) and Colombia (417), but quite larger than those of Chile (48), Venezuela (47), and Argentina with only 13 persons per tractor.
In summary, it can be said that the hypothesis put forward in this work is true, that is to say the Ecuadorian agriculture could achieve an impor-tant growth in its production and productivity of land and labor by in-creasing its level of mechanization.
ConclusionsThe productive systems of the
Ecuadorian agriculture have similar areas, about 1.2 million hectares, of annual and perennial (tree) crops. Annual crops produce a second harvest in the irrigated area. A large area of cultivated pastures exists alongside the annual and perennial crops.
The average yearly demand of tractor hours per hectare of the an-nual crops is much larger than that of the perennial crops; as a result, the total yearly demand of tractor hours of the annual crops is more than twice (2.56) the demand of the perennial crops. Very little tractor hours are used in the cultivated pas-tures.
The actual tractor park is 14,652 units that provide 716,880 kW of power. When the human and ani-mal power is added a grand total of 1,217,945 kW is reached. This power does not satisfy the yearly demand of the annual and perennial crops, giving origin to a deficit of 2,600 tractors. When the area with culti-vated pastures is added, the deficit
reaches 6,500 units. If the power level recommended for developing countries is to be reached the deficit goes up to more than 9,000 tractors.
The actual agricultural mechani-zation indicator of Ecuador is 0.30 kW per hectare of annual and pe-rennial crops. This indicator would go up to 0.36 kW per hectare if the established tractor deficit is added; however when the cultivated pas-tures are included the indicator is very much reduced. All these values are far from the ones existing in the majority of the other Latin Ameri-can countries and from the power levels recommended for developing countries.
Other indicators, such as hectares per tractor and rural workers per tractor, also show an agriculture with levels of mechanization far be-low the levels of the majority of the other Latin American countries.
REFERENCES
Aldeán, E. 1991. Estructura Orgánica y Políticas del Programa Nacional de Mecanización Agrícola “PRO-NAMEC”. Panel sobre Educación Superior y Desarrollo. CONUEP, Universidad Técnica de Manabí. Portoviejo, Manabí, Ecuador.
B.C.E. 2003. Información estadística mensual del Banco Central del Ecuador, Dirección General de Es-tudios Económicos, Departamento de Publicaciones. Quito.
Campbell, J. 1990. Dibble sticks, donkeys and diesels. IIRI, Manila, Phillipines.
Clarke, L. 1997. Strategies for agri-cultural mechanization develop-ment. FAO, Rome, Italy
Clarke, L. and C. Bishop. 2002. Farm power - present and future avail-ability in developing countries. FAO, Rome, Italy.
FAOSTAT, FAO, 2004. Statiscal Database for Agriculture. http:// apps.fao.org/page/collections? subset=agriculture [Consult: 10 February 2004].
Fluck, R. (Ed.) 1992. Energy for world agriculture Elsevier, Am-sterdam. The Netherlands.
Giles, G. 1975. The reorientation of agricultural mechanization for the developing countries. Part 1. Policies and Attitudes for Action Programs. AMA. 6(2): 15-25.
Ibánez, M. and C. Abarzúa. 1998. Capacidad de trabajo y eficiencia de campo de las máquinas agrí-colas. Universidad de Concepción, Facultad de Ingeniería Agrícola. Chillán, Chile. 35 p. (Boletín de Extensión No. 35).
INEC. 2002. Resultados del III Cen-so Nacional Agropecuario del Ec-uador. INEC-MAG-SICA. Quito.
INEC. 2001. IV Censo Nacional de Población y Vivienda del Ecua-dor. Quito.
Jarre. 2000. Fomento de la me-canización agrícola en los valles de la provincia de Manabí. Uni-versidad Técnica de Manabí. Por-toviejo, Manabí, Ecuador (Docu-mento Interno).
Ortiz-Cañavate, J. 1993. Las máquinas agrícolas y su aplicación. Mundi-Prensa, Madrid, España.
Reina, L. and E. Hetz. 2003. Gestión integral de un sistema mecanizado para una finca del valle del río Por-toviejo, Manabí, Ecuador. Revista de la Sociedad de Ingenieros del Ecuador (SIDE), Quito.
Stout, B. 1990. Handbook of energy utilization for world agriculture. Elsevier, Amsterdam. The Neth-erlands.
Witney, B. 1995. Choosing and us-ing farm machines. Land Technol-ogy. Edinburgh, Scotland. 412 p.
Zambrano, J. 1994. Perfil de la me-canización agrícola de Ecuador. Trabajo presentado en el Curso Internacional de Selección, Uso y Mantenimiento de Maquinaria Agrícola para la Producción Agrí-cola. Universidad de Concepción, Facultad de Ingeniería Agrícola. Chillán, Chile.
■■

VOL.38 NO.3 2007 AGRICULTURAL MECHANIZATION IN ASIA, AFRICA, AND LATIN AMERICA 67
Improvement of the Modified Grain Thresher forGroundnut Threshing
bySheikh El Din Abdel Gadir El-AwadProfessorNational Coordinator,Agricultural Engineering Research Programme,Agricultural Research Corporation,P.O. Box 126, Wad MedaniSUDAN
Mohamed Ahmed AliProfessorFaculty of Agricultural Science,University of Gezira,Wad MedaniSUDAN
Awad El-Karim Sir-Elkhatim Abdu-ElmagidAgricultural EngineerGeneral Administration of Technology Transferand Extension,Ministry of Agriculture and Forestry,KhartoumSUDAN
AbstractAfter successful modif ication
of the Oztarim grain thresher for groundnut threshing, other parts were designed to improve its thresh-ing operation efficiency, to facilitate automatic collection of crop residue for animal feeding and to solve the problem of soil particles accumula-tion underneath the thresher shaker. This was achieved through the de-sign of a conveyor feeding belt, a cyclone vines collector and soil par-ticle handcarts. Their specifications were identified. The improved and modified thresher with conveyor feeding belt was compared with the modified grain thresher with direct feeding, commercial thresher as a stationary thresher and manual threshing as the traditional thresh-ing method in the Gezira scheme.
Results indicated significant differ-ences (P = 0.05) between the thresh-ing methods for the required man-hrs/ha and between threshing ma-chines for fuel consumption/ha. The
improved modified thresher resulted in savings of about 2 man-hrs/ha and about 3 liter/ha of fuel consump-tion compared to the modified grain thresher with direct feeding. The use of a conveyor feeding belt increased the material capacity of the modi-fied grain thresher with direct feed-ing from 41 % to 64 % as compared to the commercial thresher with no significant difference in cleaning ef-ficiency. Manual threshing resulted in significantly lower cleaning ef-ficiency. The cyclone vine collector resulted in savings of about 2 min/sack, which was the time for manual bagging of vines, and in a significant (P = 0.05) reduction in the required number of sacks/ha in comparison with manual filling operation. The use of handcarts for soil particle re-moval allowed continuous working of the improved thresher without chang-ing its position near the groundnut heap. Therefore, the designed parts could be recommended for the modi-fied grain thresher to improve its groundnut threshing performance.
IntroductionSudan ranks four th in world
groundnut production. The crop is grown to meet the local demands for oil and cakes and provides a sur-plus for export (Ahmed, 1994). The crop residue is an excellent protein source for ruminant livestock feed.
Elmahdi (1996) stated that the groundnut harvesting in the New Halfa scheme (25,000 ha) is com-prised of three operations, which are digging, collection and threshing. The harvesting operation utilizes about 39 % of the total labour force used in groundnut production and constitutes about 44 % of the total production cost. The pulled crop is collected into five heaps per tenancy (2.1 ha) and fed manually to the sta-tionary thresher. Ahmed (1996) re-ported that harvesting of groundnut in the Rahad scheme (27,000 ha) is comprised of four operations, which are digging, collection, thresh-ing and manual residue collection. Harvesting utilizes 50 % of the la-

AGRICULTURAL MECHANIZATION IN ASIA, AFRICA, AND LATIN AMERICA 2007 VOL.38 NO.368
bour for groundnut production and constitutes 20 % of the production cost. Manual digging and collection utilizes 20 % of the labour force and constitutes 13 % of the total produc-tion cost. The machine does 85 % of the groundnut threshing operation. Threshing operation utilizes 14 % of the labour force and constitutes about 10 % of the total production cost. Stationary threshers do about 70 % of the threshing operation due to their low crop losses and easy collection of the hay crop. Mobile threshers contribute about 30 % and crop residue collection is done manually where residue is divided equally between the farmer and the labourer. Due to the lack of ground-nut harvesters in the Gezira scheme (90,000 ha), manual harvesting is the traditional method for ground-nut threshing, which is a t ime-consuming with high crop losses. Delay in threshing the stacked heaps of groundnut results in delay of the following cotton land preparation and they may act as source of rats to attack groundnut pods as well as wheat crop before combine harvest-ing (El-Awad, 2000). These situ-ations necessitate the introduction of new methods and machinery for crop harvesting.
The calculations based on trac-tor requirements per area of the principal crops showed that with the present number of tractors (for operating stationary threshers and combine harvesters) it is not pos-sible to achieve timely harvesting of all crops (FAO, 1995). This called for local manufacturing of agricul-tural equipment, and advised that local assembly of tractors is hardly feasible due to the relatively small market size. It also indicated that the promotion of imported threshers to satisfy local needs is highly ap-preciated.
Different models of stationary grain threshers have been imported to the Sudan (G.A.S., 1996). They are simple in design, easily main-tained, consume little power (35 to
40 hp) and have been designed with simple threshing, cleaning and bag-ging units. El-Awad (2000) success-fully modified the Oztarim grain thresher for groundnut threshing. The modified parts were made to be replaceable, which were the concave, the soil particle and the seed sieves, aspirator fan pulley, the delivery gate and bagging system (optional). The field capacity of the modified grain thresher was found to be 41 % as compared to the commercial ground-nut thresher (Lilliston). Therefore, attempts were made to design some parts for further improvement of the modified grain thresher in order to:
1. Increase the capacity of the thresher by introducing a me-chanical feeding device for the crop.
2. Improve the crop residue col-lection by modifying the chaffer unit of the thresher.
3. Solve the problem of the accu-mulation of soil particles under-neath the stationary thresher.
By studying the technical speci-fications of eight different models of grain threshers, it can be inferred that the modifications on the Oztarim grain thresher for groundnut thresh-ing (El-Awad, 2000) could be ad-opted successfully for all models that have been imported to the Sudan.
Modified Parts for the Thresher Performance Improvement
The modified parts of the grain thresher developed by El-Awad (20 0 0) we re employed i n t he Oztar im grain thresher, Model 1200-SPX, which was intended to be improved in the areas of material feeding, crop residue collection and removal of soil particles underneath the shaker. The design of the parts for the improvement was carried out at Masaad Training Center Work-shop in the year 2002 and com-prised the following:
The Belt ConveyorThe designed conveyor-feeding
belt consisted of a frame and rollers, a special selected conveyor belt and a belt drive. The assembled belt con-veyor in operation is shown in Fig. 1a. The designed conveyor frame consisted of an inclined table and ground wheels with the following specifications:The Inclined Table
The inclined table was constructed as a rectangular table (320 x 118 cm) from a 75-mm steel angle. It was designed with these dimensions to help in handling the groundnut from the heap at an inclined sur-face of 35º to the feeding platform, which is at a height of 160 cm above the ground surface. This angle of elevation was determined through a micro-test by putting some dry groundnuts on a f lat and smooth metal sheet, which was raised slowly from the horizontal position. The groundnut started to slide at an angle of 37º. Therefore, a smaller angle of 35º was chosen for calculation of the total length of the conveyor belt table by dividing the vertical height of the feeding platform (160 cm) by sine 35º. Then an extra 40 cm was added to extend the length towards the threshing unit for a total length of 320 cm. The width of the thresher feeding plat for m was 120 cm. Therefore, the width of conveyor belt table was taken as 118 cm with 1 cm clearance at each side in order to have as great as possible conveyor belt area. Two side fenders, made from sheet metal (20 x 315 cm), were attached to each side of the conveyor table to prevent the conveyed crop from falling to the sides.
Three rollers 100 cm long and 10.8 cm diameter were installed to sup-port the conveyor belt. The rollers were made of galvanized steel tubes welded to a steel shaft 35 mm diam-eter and 115 cm long. Each roller was supported by two pillow-block ball bearings. The front drive roller shaft was 162 x 3.5 cm, which was extend-ed 17 cm to one side and 45 cm to the

VOL.38 NO.3 2007 AGRICULTURAL MECHANIZATION IN ASIA, AFRICA, AND LATIN AMERICA 69
other side (the driven pulley side). A keyway of 20 x 0.5 x 0.5 cm was milled on the shaft for connecting its motion to the driven pulleys.Ground Wheels
The ground wheels carried the whole conveyor belt assembly and were used for changing the con-veyor belt ground clearance and the angle of elevation (Fig. 1a). The wheel assembly consisted of two rubber wheels (6.00 x 16), a 220-cm wheel axle, supporting pipes and a drawing (pulling) shaft. The rubber wheels were mounted on a 50 mm galvanized tube axle, which had the same length as the rubber wheel axle. Each wheel was supported on two ball bearings at the wheel spin-dle. The ground wheels supported the conveyor belt assembly through the two supporting pipes. The con-veyor belt assembly was drawn behind the thresher by two pull-ing shafts. Since the thresher was used on rough agricultural land, the shafts were supplied with springs that serve as shock absorbers. Each supporting pipe consisted of two telescoping pipes. The inner pipe di-ameter was 35 mm, while the outer pipe diameter was 42 mm. The pipes were connected to the conveyor belt table and wheels axle through pin joints. The length supporting pipes have ranged between 70-120 cm to provide a ground clearance from 6 to 60 cm and an angle of elevation from 35º to 19º respectively.The Conveyor Belt
A light, endless rubber belt 100 x 635 cm was used for the convey-ing operation. Eight metal slats (90 x 5 cm) were riveted to the belt
after four to six tines (fingers) were attached. The tines held the crop while being conveyed to the thresh-ing unit. The tines were made from a 0.5 cm metal rod 5 cm long.The Belt Drive
ASAE (1979) reported that, for drives with two sheaves (pulleys) the relationship between the center distance and the belt length was:
L = 2C + 1.57 (D + d) + (D - d) / 4C ............................(1)Where:L = Effective length of the belt.C = Distance between centers of
pulleys.D = Effective outside diameter of
the large pulley (sheave).d = Effective outside diameter of
the small pulley (sheave). The cylinder (Bator) shaft of the
Oztarim thresher had a five-groove pulley attached to it at its right side. One of the grooves was used for driving the aspirator fan pulley and another for driving the shaker and the soil particle sieve. One of the three remaining grooves, which had an effective diameter of 12.5 cm was used as a driving pulley. This pulley ran at the same speed as the cylinder (400-450 rpm). The distance between the centers of the driving shaft (Bator shaft) and the driven shaft (roller shaft) was 73.5 cm. Three different pulleys with di-ameters of 13.5, 21.5 and 35 cm were chosen to give conveyor feeding belt speeds that ranged from 370 to 416, 232 to 261 and 143 to 151 rpm, re-spectively. The driven pulleys were attached to the roller shaft. The driv-en pulley speed can be calculated by the following equation:
V = (d/D) x N ..............................(2)Where:V = Driven pulley speed (rpm).d = Driving pulley diameter (cm).D = Driven pulley diameter (cm).N = Driving pulley speed (rpm).The conveyor feeding belt speed
was calculated using equation (2). The V-belts with measurement of B-75, B-80 and 17 x 2350 were used for power transmission to the roller shaft when using each of the three pulleys (13.5, 21.5 and 35 cm diameter) that were made available from the local market. A tension pulley with a diameter of 22 cm was provided with a rotating arm and a spring with an adjusting arm to keep the belt at the proper tension.
The Cyclone Vines CollectorIn the Oztarim thresher, the pneu-
matic conveying system introduced the trash directly by gravity and then discharged directly out by the fan. The vines were separated from the air by a cyclone collector, which was developed and attached to the chaffer outlet (Fig. 1b). The ground-nut vines were collected in the bag-ging sacks. The cyclone collector consisted of an inner cylinder with a diameter of 39 cm and a length of 41.5 cm, an outer cylinder of 49-cm diameter and a length of 47 cm and a cone with a bottom circle diam-eter of 23 cm and a vertical height of 66 cm. The vines were delivered inside the cyclone through a side opening (60 x 25 cm) around the outer cylinder diameter, and driven by the air pressure. When the vines entered the cyclone they start rotat-ing around the inner cylinder and
Fig. 2 Two soil particles handcartsFig. 1a The belt conveyor at operation Fig. 1b The cyclone vines collector

AGRICULTURAL MECHANIZATION IN ASIA, AFRICA, AND LATIN AMERICA 2007 VOL.38 NO.370
passed down through the discharge cone bottom opening, while the air moved up through the inner cylin-der to the outer space. The height of the discharge cone bottom opening from the ground was 93 cm, which facilitated the upright standing of the bagging sack. However, with the use of the conveyor feeding belt, the aspirator fan pulley 15 cm diam-eter (El-Awad, 2000) was changed by a 10-cm pulley to increase the cleaning efficiency through the high speed of fan.
The Soil Particles HandcartsUsually, in clay soils, clay par-
ticles adhere to the lifted groundnut pods. During the threshing opera-tion, the soil particles drop from the soil particle sieve and start to ac-cumulate underneath the shaker. Unless they are removed or the position of the thresher is changed, a low cleaning efficiency will result. Therefore, for the thresher to operate in one position nearby the stacked heap, two simple handcarts with similar dimensions to the effective dimensions of the soil particles sieve (Fig. 2) were developed to be posi-tioned under the soil particles sieve, one on either side of the thresher. When they were full, they could be easily drawn out, emptied and then replaced under the thresher.
Comparative Evaluation of the Improved Modified Thresher
The experimental work of ground-nut threshing was conducted in the Gezira scheme at Musallamia Group in 2002 to compare the performance of the following threshers and man-ual threshing method:
1. Improved modified thresher: Oztarim grain thresher that included El-Awad (2000) modi-fied parts for groundnut thresh-ing and the newly modif ied parts for threshing performance i mprovement , wh ich were
conveyor feeding belt, cyclone vines collector and soil particles removal handcarts.
2. The modified grain thresher: A modified Oztarim grain thresh-er that contained only the modi-f ied par ts from by El-Awad (2000) for groundnut threshing.
3. Commercial thresher: A trail type Lilliston groundnut har-vester, Model 1580, which was used as stationary thresher.
4. Manual threshing: The tradi-tional threshing method in the Gezira scheme, in which the groundnut is threshed using wooden threshing paddles.
Groundnuts were pulled manually four weeks before threshing opera-tion. It was left for four days in the field to dry before being gathered in heaps. The experiment was a ran-domized complete block design with five replications. The experimental work was done over a period of five days.
The three thresher machines, one at a time, were made ready beside a heap of groundnuts that were col-lected from a plot area of 0.42 ha. Five labourers were used in the threshing operation with the com-mercial thresher, while four labour-ers were used with the improved modified thresher and the modified grain thresher. The machine was first operated to determine the most suitable tractor engine and P.T.O. speed for the best threshing perfor-mance. The fuel tank of the tractor was topped with fuel. Man-hrs/ha, fuel consumption and the time to fill a sack with collected yield and to replace it with another were measured. Also, the time required for filling a sack with vines by the cyclone method and the time needed for removing the handcarts from un-derneath the shaker, emptying them and replacing them were recorded. At the same time two farmers were doing the manual threshing, wind cleaning, bagging of clean crop and bagging of vines. The time for each operation was determined. Samples
of collected yields were taken from each threshing method to determine the cleaning efficiency.
Methods for determining the op-erational performance were as fol-lows:
1. Man-hours per hectare was determined with the use of the following formula;Man-hours/ha = (L x t) / A ...(3)Where:L = Number of labourers.t = Spent time (hours).A = The area of collected crop
(in this study was 0.42 ha).2. Fuel consumption: After ad-
justing the engine rpm for the best threshing performance, the fuel tank was topped with fuel and the operation started. Using the graduated cylinder, the fuel tank of the tractor was retopped and the fuel used for retopping was recorded (F). Then the fuel consumption per unit area (A), which was 0.42 ha was calcu-lated as follows:
Fuel consumption per unit area (l/ha) = F/A ..............................(4)
3. Time required to fill a sack with collected clean crop yield dur-ing the threshing operation was recorded using the stopwatch.
4. Time consumed for a man-filled sack of vines and a cy-clone-filled sack of vines were recorded using the stopwatch.
5. Time required for removing and emptying the two handcarts that were positioned underneath the shaker when filled with soil particles, and then repositioned underneath the shaker was re-corded.
6. The number of cyclone-filled and man-filled sacks of vines per plot were counted.
7. Sor t ing of the clean crop samples: Random samples were taken from collected yield and weighed. After manual separation, the clean pods were weighed to find the percentage of the clean pods to the total sample weight.
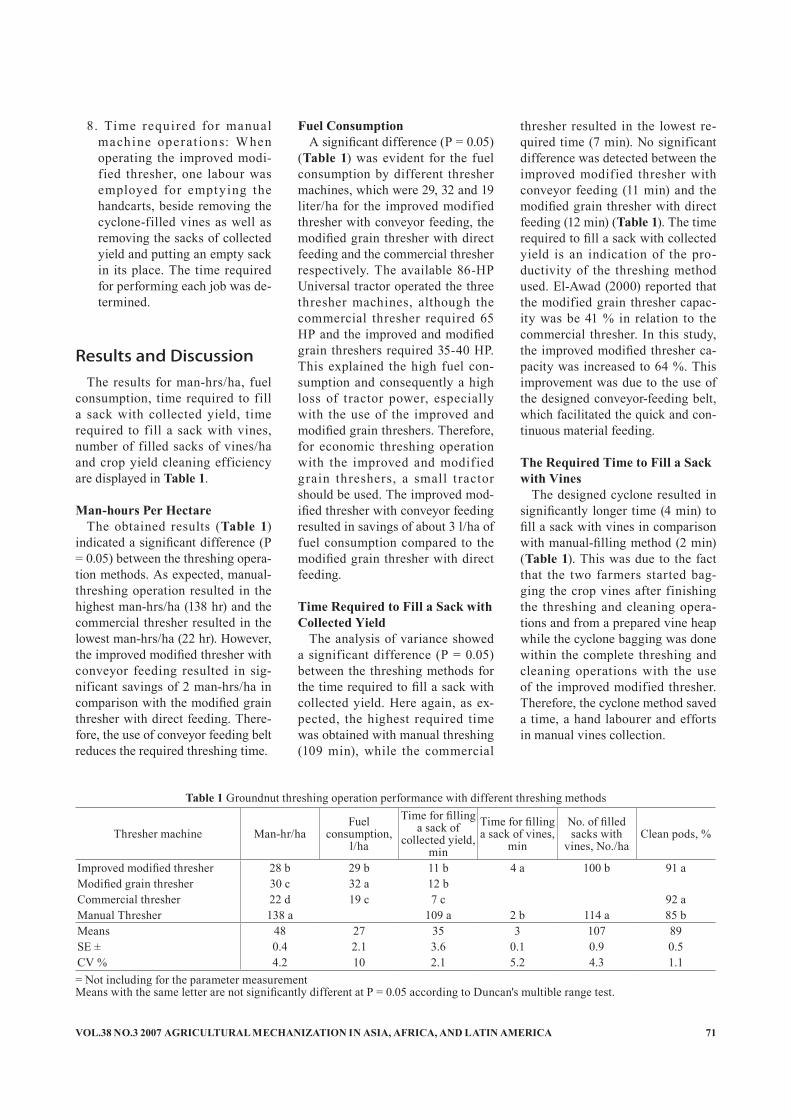
VOL.38 NO.3 2007 AGRICULTURAL MECHANIZATION IN ASIA, AFRICA, AND LATIN AMERICA 71
8. Time required for manual machine operat ions: When operating the improved modi-fied thresher, one labour was employed for emptying the handcarts, beside removing the cyclone-filled vines as well as removing the sacks of collected yield and putting an empty sack in its place. The time required for performing each job was de-termined.
Results and DiscussionThe results for man-hrs/ha, fuel
consumption, time required to fill a sack with collected yield, time required to fill a sack with vines, number of filled sacks of vines/ha and crop yield cleaning efficiency are displayed in Table 1.
Man-hours Per HectareThe obtained results (Table 1)
indicated a significant difference (P = 0.05) between the threshing opera-tion methods. As expected, manual-threshing operation resulted in the highest man-hrs/ha (138 hr) and the commercial thresher resulted in the lowest man-hrs/ha (22 hr). However, the improved modified thresher with conveyor feeding resulted in sig-nificant savings of 2 man-hrs/ha in comparison with the modified grain thresher with direct feeding. There-fore, the use of conveyor feeding belt reduces the required threshing time.
Fuel ConsumptionA significant difference (P = 0.05)
(Table 1) was evident for the fuel consumption by different thresher machines, which were 29, 32 and 19 liter/ha for the improved modified thresher with conveyor feeding, the modified grain thresher with direct feeding and the commercial thresher respectively. The available 86-HP Universal tractor operated the three thresher machines, although the commercial thresher required 65 HP and the improved and modified grain threshers required 35-40 HP. This explained the high fuel con-sumption and consequently a high loss of tractor power, especially with the use of the improved and modified grain threshers. Therefore, for economic threshing operation with the improved and modified grain threshers, a small t ractor should be used. The improved mod-ified thresher with conveyor feeding resulted in savings of about 3 l/ha of fuel consumption compared to the modified grain thresher with direct feeding.
Time Required to Fill a Sack with Collected Yield
The analysis of variance showed a significant difference (P = 0.05) between the threshing methods for the time required to fill a sack with collected yield. Here again, as ex-pected, the highest required time was obtained with manual threshing (109 min), while the commercial
thresher resulted in the lowest re-quired time (7 min). No significant difference was detected between the improved modified thresher with conveyor feeding (11 min) and the modified grain thresher with direct feeding (12 min) (Table 1). The time required to fill a sack with collected yield is an indication of the pro-ductivity of the threshing method used. El-Awad (2000) reported that the modified grain thresher capac-ity was be 41 % in relation to the commercial thresher. In this study, the improved modified thresher ca-pacity was increased to 64 %. This improvement was due to the use of the designed conveyor-feeding belt, which facilitated the quick and con-tinuous material feeding.
The Required Time to Fill a Sack with Vines
The designed cyclone resulted in significantly longer time (4 min) to fill a sack with vines in comparison with manual-filling method (2 min) (Table 1). This was due to the fact that the two farmers started bag-ging the crop vines after finishing the threshing and cleaning opera-tions and from a prepared vine heap while the cyclone bagging was done within the complete threshing and cleaning operations with the use of the improved modified thresher. Therefore, the cyclone method saved a time, a hand labourer and efforts in manual vines collection.
Thresher machine Man-hr/haFuel
consumption, l/ha
Time for filling a sack of
collected yield, min
Time for filling a sack of vines,
min
No. of filled sacks with
vines, No./haClean pods, %
Improved modified thresher 28 b 29 b 11 b 4 a 100 b 91 aModified grain thresher 30 c 32 a 12 bCommercial thresher 22 d 19 c 7 c 92 aManual Thresher 138 a 109 a 2 b 114 a 85 bMeans 48 27 35 3 107 89SE ± 0.4 2.1 3.6 0.1 0.9 0.5CV % 4.2 10 2.1 5.2 4.3 1.1
Table 1 Groundnut threshing operation performance with different threshing methods
= Not including for the parameter measurementMeans with the same letter are not significantly different at P = 0.05 according to Duncan's multible range test.

AGRICULTURAL MECHANIZATION IN ASIA, AFRICA, AND LATIN AMERICA 2007 VOL.38 NO.372
Number of Filled Sacks of Vines/ha
The cyclone filling resulted in significantly (P = 0.05) lower num-ber of filled sacks with vines per ha (100 sacks) compared to the manual-filling method (114 sacks). This was due to the proper filling of sack with vines with the use of cyclone method rather than the manual filling opera-tion. Therefore, the cyclone-filling operation reduced the required num-ber of sacks/ha and, hence, reduced the cost of production.
Cleaning EfficiencyThe cleaning efficiency was mea-
sured by separation of clean pods from the other constituent parts of the collected yield. Despite the preciseness of doing all kinds of adjustment stated in the operator manual for improving the cleaning efficiency of the threshers, some impurities appeared with collected yield. The threshers with conveyor and direct feeding showed no dif-ferences in the cleaning efficiency due to the use of the same cleaning system. Thus, the comparison was made for the improved modified thresher, commercial thresher and manual threshing.
The results showed no significant difference between the improved thresher (91 %) and the commercial thresher (92 %), but a significant dif-ference (P = 0.05) in cleaning effi-ciency for manual threshing (85 %).
General ObservationsDuring the complete cycle of
threshing with the improved modi-fied thresher, replicated five times, one labourer was used for changing the filled sack of collected yield, emptying the two handcarts from the soil par ticles and replacing them and changing the filled sack of vines. The respective required time to accomplishing these different operations were determined to be 18, 36 and 21 seconds, with a total time of 75 seconds. It could be seen that 4 and 11 minutes passed before
another sack was filled with vines and another sack was filled with collected yield, respectively. Thus, the labourer could find enough time to perform all these jobs, which might infer that the designed parts of vines collector and the soil par-ticles handcarts do not add another burden to the labourer, but he could find a time for some rest during the threshing cycle.
The designed conveyor-feeding belt could also be used in the thresh-er feeding of other grain types, so as to improve the threshing operation performance.
Conclusion and Recom-mendation
The additional designed units of conveyor feeding belt, cyclone vines collector and soil particle handcarts were made from the locally avail-able materials. The use of a convey-or feeding belt improved the modi-fied thresher capacity from 41 to 64 % in comparison to the commercial groundnut thresher. In addition to that, the improved modified thresher significantly reduced the required man-hrs/ha compared to both the modified grain thresher and manual threshing. Also, it resulted in sig-nificantly lower fuel consumption in comparison with the modified grain thresher with direct feeding. However, manual threshing resulted in significantly lower cleaning effi-ciency of collected yield, but no sig-nificant difference was evident with the use of the improved modified thresher and the commercial one.
The cyclone method of crop vines bagging resulted in significant re-duction of the required number of sacks/ha in comparison with manual bagging method, in addition to the savings of manual filling time.
The use of handcarts for soil par-ticle removal resulted in continuous working of the thresher without changing its position nearby the groundnut heap. The time required
to perform the job was about 36 sec-onds. However, the designed parts of vines collector and soil particles handcarts did not add a burden to the labourer that was responsible for the jobs related to them.
Therefore, the designed parts of conveyor feeding belt, cyclone vines collector and handcarts for soil par-ticles removal could be recommend-ed for the modified grain thresher to improve its groundnut threshing performance.
REFERENCES
Ahmed, H. H. 1996. Economics of groundnut production and mar-keting in Rahad scheme. Unpub-lished M.Sc. thesis, University of Gezira, Wad Medani, Sudan. pp. 1-3, 47-48.
ASAE. 1979. Agricultural Engineer-ing Year Book. 26th Edition. The American Society of Agricultural Engineers, St. Joseph. Michigan, U.S.A. pp. 173.
El-Awad, Sh. A. 2000. Modification of grain thresher to work with groundnut. AMA, 31(4): 67-71, 74.
Elmahdi, G. H. 1996. Economics of groundnut production and mar-keting in New Halfa Agricultural Production Corporation. Unpub-lished M.Sc. thesis, University of Gezira, Wad Medani, Sudan. pp. 1-2, 24.
G.A.S. 1996. Annual report. Gen-eral Administration of Statistics, Ministry of Agriculture and For-estry, Khartoum, Sudan.
■■

VOL.38 NO.3 2007 AGRICULTURAL MECHANIZATION IN ASIA, AFRICA, AND LATIN AMERICA 73
Design, Development and Evaluation of a Rotary Type Chilly Dryer
byS. KaleemullahAssitant ProfessorDept. of Agricultural Engineering,SV Agricultural College,Acharya NG Ranga Agricultural University,Tirupati - 517 502INDIA
R. KaliappanProfessorDept. of Agricultural Processing,College of Agricultural Engineering,Tamil Nadu Agricultural University,Coimbatore - 641 003INDIA
AbstractA proto-type rotary dryer of 10.5
kg capacity (to hold chillies of 330 % d.b. moisture content) was designed, fabricated and evaluated. The cost of the dryer was US $ 475. The heat utilization factor was 0.62, 0.56 and 0.48 at the beginning and was almost same for nearly 3 hours of drying and finally reduced to 0.09, 0.08 and 0.08 for the capacities of 75, 50 and 25 % of dryer volume, respectively. The total heat efficiency was 0.55, 0.49 and 0.43 at the beginning and was almost same for nearly one hour of drying and finally reduced to 0.07, 0.07 and 0.08 for the capacities of 75, 50 and 25 % of dryer volume, respec-tively. On the basis of chillies output per hour, percentage of chillies with stalk, percentage of chillies without stalk and without a hole, percentage of chillies without stalk and with a hole, heat utilization factor and total heat efficiency, it was concluded that the chillies dried at a capacity of 75 % dryer volume was the best.
IntroductionChillies are the dried ripe fruits
of the species of genus Capsicum. They are also called as red peppers of capsicums and they constitute an important commercial crop used as
condiment, culinary supplement or as a vegetable. Chillies are cultivat-ed mainly in tropical and subtropi-cal countries namely Africa, India, Japan, Mexico, Turkey and USA. In India, among the spices consumed (per capita consumption), dried chillies contribute a major share (Pruthi, 1998).
Chillies, which contain high mois-ture content (300-400 % d.b.) after harvest, are highly perishable and, hence, its processing and storage are of considerable importance both to the farmers as well as to the proces-sor and consumer. It is essential to reduce the moisture content and provide aeration to the chillies after harvesting to avoid development of microflora and subsequent loss of quality or total spoilage (Singh and Alam, 1982). Traditionally, fresh chillies are dried under the sun. The sun drying takes 14-21 days depend-ing on weather. As sun drying meth-od is weather dependent, it generally does not yield a good quality product due to breakage and loss of seeds. Some research work was done to re-duce the drying time or improve the quality of chillies in mechanical dry-ers (Dhanegopal et al., 1988; Phirke et al., 1992; Mangaraj et al., 2001). As most of the drying will be done with a bed thickness of 10 cm or even less, it require more area to dry in thin-layer dryers. It was also no-
ticed that non uniform drying results from in deep-bed drying (Kaleemul-lah, 2002). New paragraph in view of this an attempt was made to develop a rotary dryer for uniform drying of chillies. The major objectives of this study were: 1) to design and fabricate a proto type rotary dryer and 2) to test the performance of the dryer at different loading capacities.
Materials and MethodsDesign of a Rotary Dryer
The design of a batch type rotary dryer and the materials used to fab-ricate it are given below. Drying Chamber
Drying of chillies takes place in cascading and mixing condition in the drying chamber of a rotary dryer. The maximum capacity of the dryer was assumed to be 10.5 kg per batch. A volume of 25 % of drying cham-ber was left free so as to have a free fall of chillies during rotation. Bulk density (ρb) of chillies at a moisture content of 329.44 % d.b. was 370.56 kg/m3 (Kaleemullah, 2002). By as-suming the radius (r) of the drying chamber as 20 cm, the length (L) of the cylindrical drying chamber for 10.5 kg capacity (m) was determined by using the following formula.
L = ..............................(1)4 x 10⁶ m3ρb�r2

AGRICULTURAL MECHANIZATION IN ASIA, AFRICA, AND LATIN AMERICA 2007 VOL.38 NO.374
whereL = length of the dying chamber, cmm = weight of chillies fed, kgρb = bulk density of chillies, kg/m3 r = radius of the drying chamber, cm
∴ L =
= 30 cmThe length of the drying chamber
was fixed as 30 cm.Flights
Uniform drying of chillies can be achieved by mixing them frequently in a rotary dryer. If mixing is vigor-ous, damage to fruits is more. To have optimum mixing, it was decid-ed to lift chillies equivalent to 3 % of the volume of the drying cham-ber. The depth (D) and width (W) of flights were calculated as follows.
3 % volume of during chamber =
�r2L x cm3 .......................(2)
wherer = radius of the drying chamber, cmL = length of the dying chamber, cm Volume of each flight = L x W x
D cm3 ........................................(3)where
W = width of the flight, cmD = depth of the flight, cmL = length of the flight, cm Let W = 0.75 D But Equation 2 = Equation 3
∴ �r2L x = L x W x D = L x
0.75D x D∴ D = 0.3545r cm = 0.3545 x 20 =
7.09 cm ≅ 7 cm∴ W = 0.75D = 0.75 x 7 = 5.25 cm ≅ 5.5 cm
Based on the preliminary studies conducted with the rotary dryer, it was observed that 3 flights having a lip angle of 75º, thrown the chil-lies uniformly over the chillies bed. Hence, 3 flights with a lip angle of 75º and having dimensions of 30 x 7 x 5.5 cm were used in the rotary dryer.Heating Chamber
The main function of the heating chamber was to accommodate the heating coils to heat the air com-ing from the blower. The size of the heating chamber was designed based
4 x 106 x 10.53 x 370.56 x � x (20)2
3100
3100
on the size and capacity of the heat-ing coil. The capacity of the heating coil was calculated based on the heat required to dry chillies. The heating chamber was insulated well to pre-vent the heat loss through its outer surface. The heat required for drying chillies was calculated as follows.
This was the sum of the sensible heat required to raise the tempera-ture of chillies along with the mois-ture plus the heat of evaporation of moisture from chillies. These heat requirements were calculated by us-ing the following formulae.
qc = mcp(tc2 - tc1) ..........................(4)where
qc = sensible heat of chillies along with its moisture, kJ
m = weight of fresh chillies along with its moisture, kg
cp = specific heat of chillies at M1 moisture content, kJ/kg.ºC
tc1 = initial temperature of chil-lies, ºC
tc2 = final temperature of chillies, ºCThe equation to determine the
latent heat of vapour izat ion of moisture in chillies (Kaleemullah, 2002) was used to calculate the heat required for evaporation of moisture from M1 to M2 % d.b.
Lc(M1 to M2) = [1.00934M -
7.40013e(-0.05948M) ]M2 x [2502.535 - 2.386tc2] ..................................(5)
whereL c(M1 to M2) = latent heat of va-
pourization of moisture in chil-lies within a moisture of M1 and M2, kJ
Wb = weight of bone dry material of chillies, kg
M1 = moisture content of fresh chillies, % d.b.
M2 = moisture content of dried chillies, % d.b.
∴ Qr = 0.239[qc + Lc(M1 to M2)]( ∴
1 kJ = 0.239 kcal) ................. (6)where
Qr = total heat required to remove the moisture in ‘θ’ hours of dry-ing, kcal
The total heat required to remove the moisture in ‘θ’ hours of drying
-Wb100
and the number of heating coils (NH) required was calculated for the fol-lowing conditions.
Ambient air temperature, ta1 = 25 ºC
R.H. of ambient air = 80 %Initial moisture content of chil-
lies, M1 = 330 % d.b.Final moisture content of chillies,
M2 = 11 % d.b.Initial temperature of chillies, tc1 =
25 ºCFinal temperature of chillies, tc2 =
65 ºCHeated air temperature, ta3 = 70 ºCExhaust air temperature, ta2 = 55 ºCWeight of fresh chillies, m = 10.5 kgSpecific heat of chillies at 329.44
% d.b., Cp = 4.172 kJ/kg.K (Kal-eemullah, 2002)
Drying time, θ = 20 hHeater efficiency, ηH = 20 %Qr = 0.239[qc + Lc(M1 to M2)] = 0.239
[mCp(tc2 - tc1) - [1.00934M -
7.40013e-0.05948M ]M2 - 2502.54 - 2.39tc2)] = 0.239 x [[10.5 x 4.172 x
(65 - 25)] - ( ) x [1.00934M
- 7.40013e-0.05948M ]11 x (2502.54 -
2.39 x 65) ] = 4,839.77 kcal ......(7)The number of heating coils (NH)
of capacity 1 kW required was calcu-lated by using the following equation.
NH =
= = 1.42 ≅ 2
Two heating coils having a capac-ity of 1 kW each are required for the above said dryer. A temperature con-troller cum indicator was connected to heating elements to provide and maintain the constant hot air tem-perature with an accuracy of ±1 ºC. Blower Capacity
The airflow rate required for dry-ing chillies was calculated based on the following formulae (Chakra-verty, 1988).
Qs = 60G_
(0.24 + 0.45H)(ta3 - ta2)θ ............................(8)
whereQs = total heat supplied by air in ‘θ’
Qr859.85θηH
4839.77 x 100859.85 x 20 x 20
Wb100
2.441100
330
M1
M1

VOL.38 NO.3 2007 AGRICULTURAL MECHANIZATION IN ASIA, AFRICA, AND LATIN AMERICA 75
hours of drying, kcalG_
= gravimetric air f low rate, kg/min
H = absolute humidity of ambient air at ambient air temperature (ta1) and ambient R.H., kg/kg
ta3 = heated air temperature, ºCta2 = exhaust air temperature, ºC But Qs ≥ Qr
60G_
(0.24 + 0.45H)(ta3 - ta2)θ = Qr
............................(9)
∴ G = =
= 1.088 kg/min ......................(10)The rate of air supply can be ex-
pressed in volumetric flow rate asG = G
_v ........................................(11)
whereG = volumetric f low rate of air,
m3/minG_
= gravimetric air f low rate, kg/min
v = humid volume of dry air, m3/kg
But v = (0.00283 + 0.00456 H)(ta1 + 273) ......................................(12)
where
H = absolute humidity of ambient air, kg/kg
ta1 = ambient air temperature, ºC∴ G = (0.00283 + 0.00456H)(ta1
+ 273) ......................................(13)= 1.088 (0.00283 + 0.00456 x 0.016)(25+273) = 0.941 m3/min
The quantity of air required from the blower is 0.941 m3/min. Hence, a standard blower of 1.25 m3/min ca-pacity was fixed to the rotary dryer.Blower hp
The blower horsepower can be ob-tained by calculating the air require-ment per unit area per unit time. The air requirement was calculated by using the following formula.
V = ................................(14)
whereV = volume of air passed per unit
time and per unit surface area of plenum chamber, m3/s.m2
G = volumetric f low rate of air, m3/min
As = surface area of plenum cham-
G60AsPp
0.94160 x 0.1257 x (60/100)
ber (perpendicular to air flow) through which air passes, m2
Pp = perforations on the surface area of plenum chamber, %
Let Pp = 60 %But As = �r2 = �(20)2 cm2 = 0.1257
m2
∴ V = =
0.2 m3/s/m2
Shedd’s curve (Shedd, 1953) was used to determine the static pres-sure drop (Ps) per unit length for the value of ‘V’.
From Shedd’s curve, Static pressure Drop for 0.2 m3/
s/m2 for soybean* = 300 Pa/m length = 300 x 0.0010209 m of water/m length = 0.03063 m of water/m length
(*As there was no study report for chillies in Shedd's curve and as the porosity of soybean is on par with the chillies, the static pressure drop of soybean was considered for cal-culation purpose)
22.2 kgF
AB
C
95 cm10 cm
▼ ▼
▼ ▼▼
▼▼
Fig. 2 Schematic diagram of a rotary dryer
Fig. 1 Loads acting on the shaft of a rotary dryer
Fig. 3 Rotary dryer developed to dry chillies
1. Reduction gear box, 2. Motor, 3. Hollow shaft, 4. Heating coil, 5. Insulator, 6. Exhaust pipe, 7. Bearing, 8. Exhaust chamber, 9. Drying chamber, 10. Rotary drum, 11. Plenum chamber, 12. Thermocouple, 13. Heating chamber, 14. Main frame, 15. Blower
Qr60(0.24 + 0.45H)(ta3 - ta2)θ
4.839.7760 x (0.24 + 0.45 x 0.016) x (70 - 55) x 20
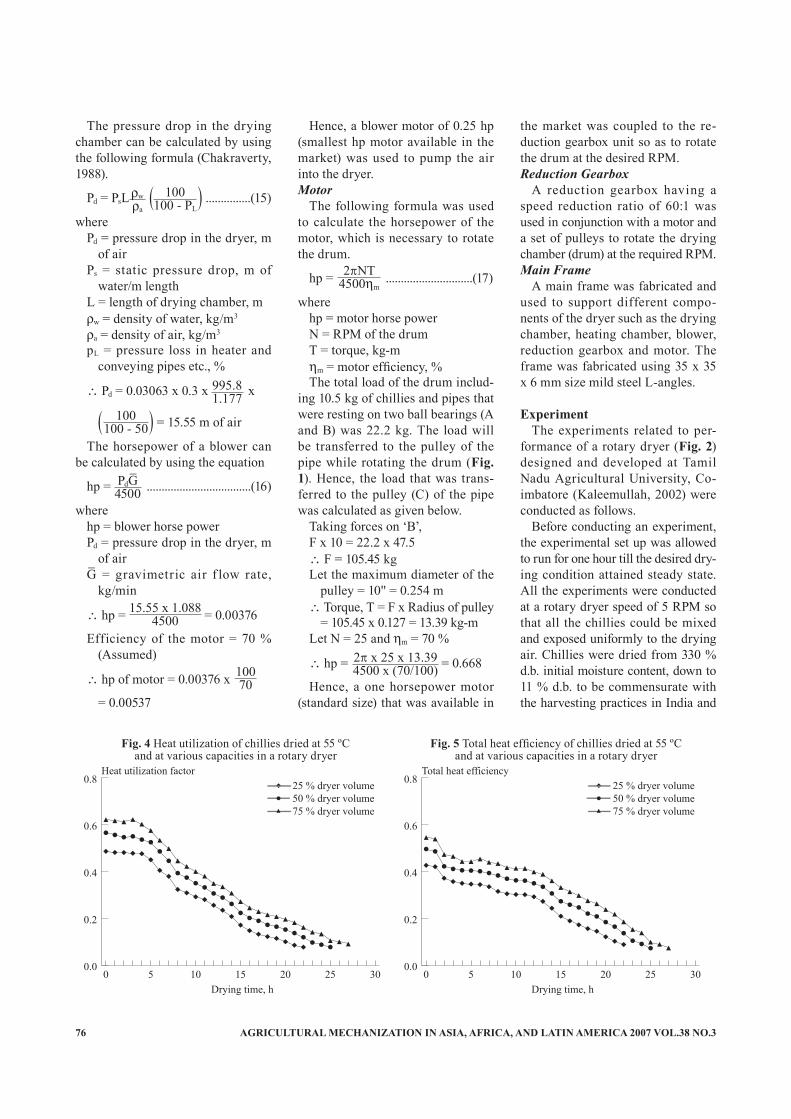
AGRICULTURAL MECHANIZATION IN ASIA, AFRICA, AND LATIN AMERICA 2007 VOL.38 NO.376
The pressure drop in the drying chamber can be calculated by using the following formula (Chakraverty, 1988).
Pd = PsL ( ) ...............(15)
wherePd = pressure drop in the dryer, m
of airPs = static pressure drop, m of
water/m length L = length of drying chamber, mρw = density of water, kg/m3
ρa = density of air, kg/m3
pL = pressure loss in heater and conveying pipes etc., %
∴ Pd = 0.03063 x 0.3 x x
( ) = 15.55 m of air
The horsepower of a blower can be calculated by using the equation
hp = ...................................(16)
wherehp = blower horse powerPd = pressure drop in the dryer, m
of airG_
= gravimetric air f low rate, kg/min
∴ hp = = 0.00376
Efficiency of the motor = 70 % (Assumed)
∴ hp of motor = 0.00376 x
= 0.00537
2� x 25 x 13.394500 x (70/100)
Hence, a blower motor of 0.25 hp (smallest hp motor available in the market) was used to pump the air into the dryer.Motor
The following formula was used to calculate the horsepower of the motor, which is necessary to rotate the drum.
hp = .............................(17)
wherehp = motor horse powerN = RPM of the drumT = torque, kg-mηm = motor efficiency, %The total load of the drum includ-
ing 10.5 kg of chillies and pipes that were resting on two ball bearings (A and B) was 22.2 kg. The load will be transferred to the pulley of the pipe while rotating the drum (Fig. 1). Hence, the load that was trans-ferred to the pulley (C) of the pipe was calculated as given below.
Taking forces on ‘B’,F x 10 = 22.2 x 47.5∴ F = 105.45 kgLet the maximum diameter of the
pulley = 10'' = 0.254 m∴ Torque, T = F x Radius of pulley
= 105.45 x 0.127 = 13.39 kg-mLet N = 25 and ηm = 70 %
∴ hp = = 0.668
Hence, a one horsepower motor (standard size) that was available in
the market was coupled to the re-duction gearbox unit so as to rotate the drum at the desired RPM.Reduction Gearbox
A reduction gearbox having a speed reduction ratio of 60:1 was used in conjunction with a motor and a set of pulleys to rotate the drying chamber (drum) at the required RPM.Main Frame
A main frame was fabricated and used to support different compo-nents of the dryer such as the drying chamber, heating chamber, blower, reduction gearbox and motor. The frame was fabricated using 35 x 35 x 6 mm size mild steel L-angles.
ExperimentThe experiments related to per-
formance of a rotary dryer (Fig. 2) designed and developed at Tamil Nadu Agricultural University, Co-imbatore (Kaleemullah, 2002) were conducted as follows.
Before conducting an experiment, the experimental set up was allowed to run for one hour till the desired dry-ing condition attained steady state. All the experiments were conducted at a rotary dryer speed of 5 RPM so that all the chillies could be mixed and exposed uniformly to the drying air. Chillies were dried from 330 % d.b. initial moisture content, down to 11 % d.b. to be commensurate with the harvesting practices in India and
Heat utilization factor
0.0
0.2
0.4
0.6
0.8
302520151050Drying time, h
25 % dryer volume50 % dryer volume75 % dryer volume
Total heat efficiency
0.0
0.2
0.4
0.6
0.8
302520151050Drying time, h
25 % dryer volume50 % dryer volume75 % dryer volume
Fig. 5 Total heat efficiency of chillies dried at 55 ºCand at various capacities in a rotary dryer
Fig. 4 Heat utilization of chillies dried at 55 ºCand at various capacities in a rotary dryer
ρwρa
100100 - PL
995.81.177
100100 - 50
PdG_
4500
15.55 x 1.0884500
10070
2�NT4500ηm

VOL.38 NO.3 2007 AGRICULTURAL MECHANIZATION IN ASIA, AFRICA, AND LATIN AMERICA 77
td - tetd - ta
td - tetd - taw
safe storage. The ambient air, inlet and exhaust hot air temperatures and relative humidities were recorded each hour by using a digital relative humidity cum temperature meter. After finishing the experiment, 15 g of the dried sample was dried once again in the experimental environ-mental condition until it gave a con-stant weight. This sample was used to determine the equilibrium moisture content of the sample in the experi-mental environmental condition.
A preliminary study was carried out to test the performance of the rotary dryer at different loading ca-pacities. The loading capacity was optimised based on chillies output per hour, percentage of chillies with stalk, percentage of chillies without stalk and without a hole, percentage of chillies without stalk and with a hole, heat utilization factor and total heat efficiency. A score of 3 to 1 was given based on the best to the worst performance. As the hot air temperature of 55 ºC gave the overall best result in drying chil-lies in a thin-layer dryer, the same temperature, i.e. 55 ºC, was selected to conduct the drying experiment (Kaleemullah, 2002). Rotary drying experiments were conducted at three different loads, i.e. 25, 50 and 75 % dryer volume. Each experiment was
replicated three times and the aver-age values were used for analysis.
The chillies weights used for ex-periments at 25, 50 and 75 % of dry-er volume were 3.5, 7 and 10.5 kg, respectively at a moisture content of 330 % d.b.. The initial moisture con-tent of fresh red chillies was deter-mined as per AOAC (1995) method. The required quantity of the sample was loaded and spread in the dry-ing chamber so that 25, 50 and 75 % of the dryer volume was occupied. Drying was carried out at an air ve-locity of 0.15 m/s. The chillies were unloaded and weighed each hour on a balance having an accuracy of 0.1 g. Unloading, weighing and loading of the sample took about 3 minutes.
The heat utilization factor may be defined as the ratio of temperature decrease due to cooling of the air during drying and the temperature increase due to heating of air. The to-tal heat efficiency considers the sen-sible heat in drying air as being the effective heat for drying and the total heat efficiency (Chakraverty, 1988). The heat utilization factor and the total heat efficiency were calculated by using the following formulae.
Heat utilization factor =
.........................................(18)
Total heat efficiency =
.......................................(19)
whereta = dry bulb temperature of the
ambient air, ºCtd = dry bulb temperature of the
heated air, ºCte = dry bulb temperature of the
exhaust air, ºCtaw = wet bulb temperature of the
heated air, ºC
Results and DiscussionDevelopment of a Rotary Dryer
The details of the main components of a rotary dryer (Fig. 3) designed and fabricated are given below.
The dimensions of the cylindrical drying chamber were calculated as 40 cm diameter and 30 cm length to hold 10.5 kg of fresh chillies (at 75 % of dryer’s volume) at a moisture con-tent of 330 % d.b. It was made with a 20-gauge galvanized iron sheet and was provided with a 28 x 18 cm door so as to load fresh chillies and unload dried chillies. The two ends of the cylinder were covered with a perforated sheet having 6 mm diameter holes. A plenum chamber and an exhaust chamber were pro-vided on either sides of the drying chamber. A copper-constantan ther-mocouple connected to a thermostat was provided in the plenum chamber to sense the temperature of drying air with an accuracy of ±1 ºC and act accordingly to supply/cut off the power to the heating coil. Three flights of size 7 cm depth and 5.5 cm width throughout the length of the drying chamber (30 cm) were fixed inside the drying chamber. The lip angle of the flight was fixed as 75º so that the chillies can fall uniformly over the chillies bed.
Two heating coils, each having 1 kW capacity, was fixed in the heat-ing chamber. The heating chamber was a cylindrical container made of 20-gauge thick galvanized iron sheet. The length of heating cham-
ContentsDryer capacity
25 % dryer volume
50 % dryer volume
75 % dryer volume
Initial wt. of chillies, kg 3.5 7.0 10.5Initial m.c., % d.b. 331.24 328.45 330.02Final wt. of chillies, kg 0.903 1.803 2.673Final m.c.,% d.b 10.48 10.31 10.22Drying time, h 22 25 27Chillies output, kg/h 0.041 1* 0.072 2 0.099 3
Chillies with stalk, % 47.50 1 50.00 2 52.00 3
Chillies without stalk and without a hole, % 50.00 3 48.00 2 46.50 1
Chillies without stalk and with a hole, % 2.50 1 2.00 2 1.50 3
Heat utilization factor Low 1 Medium 2 High 3
Total heat efficiency Low 1 Medium 2 High 3
Total score 8 12 16Rank 3 2 1
Table 1 Performance of rotary type chilly dryer dried at 55 ºCtemperature and operated at different capacities of the dryer
* Score based on performance
AGRICULTURAL MECHANIZATION IN ASIA, AFRICA, AND LATIN AMERICA 2007 VOL.38 NO.378
ber was 90 cm with 15 cm diameter so as to accommodate two heating coils and facilitate air movement. Heating coils of finned type were used to increase the heat transfer from the coils to the air. A blower with a capacity of 1.25 m3/min pow-ered by 0.25 hp electric motor was provided, to supply sufficient quan-tity of air to dry chillies. A 3-phase, one horsepower electric motor was fixed to reduction gear box so as to rotate the drying chamber drum.
The main frame was fabricated with an angle iron (35 x 35 x 6 mm size) to support the heating cham-ber and drying chamber. A blower coupled with motor and the electric heating chamber were kept on a separate angle iron frame so that the outlet of blower and inlet of heating chamber were at the same level to facilitate air movement from blower to the heating chamber. The drying chamber and its outlet were fixed on a main frame with the help of ball bearings so that the drying chamber could rotate freely. The length, width and height of the main frame were 100, 50 and 90 cm, respectively.
Performance of a Rotary DryerThe heat utilization factor of chil-
lies was more at all the times in the case of chillies dried at a capacity of 75 % of dryer volume when com-pared to the chillies dried at lower capacities (Fig. 4). This permitted more chillies to be contacted at higher capacities, which in turn uti-lized the more drying air tempera-ture. The heat utilization factor was 0.62, 0.56 and 0.48 at the beginning and was almost same for nearly 3 hours of drying and finally reduced to 0.09, 0.08 and 0.08 for the ca-pacities of 75, 50 and 25 % of dryer volume, respectively. The amount of heat supplied to the drying air was constant for the whole drying experiment, but the amount of heat utilized decreased as exhaust air temperature was increased with the progress of drying time. Initially, some heat was used for heating the
chillies and a considerable amount of heat was lost with the exhaust air. This may be the reason for falling of heat utilization factor of chillies with the progress of drying time. Similar results are repor ted by Chakraverty and More (1983) in the case of drying of raw and parboiled paddy in a baffle type grain dryer.
The total heat efficiency of chillies was more at all the times in the case of chillies dried at a capacity of 75 % of dryer volume when compared to the chillies dried at lower capacities (Fig. 5). The reason is that at higher capacities, more quantity of chil-lies contacted the drying air, which in turn required more heat present in the drying air. The total heat ef-ficiency was 0.55, 0.49 and 0.43 at the beginning and was almost same for nearly one hour of drying and finally reduced to 0.07, 0.07 and 0.08 for the capacities of 75, 50 and 25 % of dryer volume, respectively. By definition, the total heat efficiency is always smaller than the heat uti-lization factor at any point of time and the same type of results was obtained in rotary drying of chillies also. Chakraverty and More (1983) obtained similar type of results in the case of drying of raw and parboiled paddy in a baffle type grain dryer.
The dried chillies output was 0.041, 0.072 and 0.099 kg/h (Table 1) for an input capacity of 25, 50 and 75 % dryer volume, respectively, which showed that the drying of chillies at a capacity of 75 % dryer volume was the best. The percentage of damaged chillies (chillies without stalk and with a hole) was less in the case of chillies dried at a capacity of 75 % dryer volume. The reason may be due to less height of fall of chillies at a capacity of 75 % dryer volume compared to the one at 25 and 50 % dryer volume. On the basis of chillies output per hour, percent-age of chillies with stalk, percentage of chillies without stalk and without a hole, percentage of chillies without stalk and with a hole, heat utiliza-tion factor and total heat efficiency,
it may be concluded that the chillies dried at a capacity of 75 % dryer volume is the best (Table 1).
REFERENCES
AOAC. 1995. Official Methods of Analysis, 16th edn. Association of Official Analytical Chemists, Arlington, Virginia, USA.
Chakrraverty, A. and H. G. More. 1983. Development and testing of a simple baffle type grain dryer. Agricultural Mechanization in Asia, Africa and Latin America, 14(4): 41-44.
Chakrraverty, A. 1988. Post Harvest Technology of Cereals, Pulses and Oilseeds. Oxford and IBH Pub-lishing Co. Pvt. Ltd., New Delhi.
Dhanegopal, M. S., S. D. Shashid-hara, and G. N. Kulakarni. 1988. Studies on drying characteristics of chillies. J. Agril. Engng., 25(3): 72-75.
Kaleemullah, S. 2002. Studies on engineering properties and drying kinetics of chillies. PhD Thesis, Tamil Nadu Agricultural Univer-sity, Coimbatore, India.
Mangaraj, S., A. Singh, D. V. K. Samuel, and O. P. Singhal. 2001. Comparative performance evalu-ation of different drying methods for chillies. J. Food Sci. Technol., 38(3): 296-299.
Phirkae, P. S., S. P. Umbarkar, A. B. Tapre. 1992. Development and evaluation of a waste fired dryer for red chilli. Indian J. Agril. Engng., 2(3): 176-180.
Pruthi, J. S. 1998. Chillies or Cap-sicums. In: Major spices of India - Crop management and post har-vest technology. Indian Council of Agricultural Research, New Delhi. pp 180-243.
Shedd, C. K. 1953. Resistance of grains and seeds to airflow. Agril. Engng., 34: 616-619.
Singh, H. and A. Alam. 1982. Tech-no-economic study on chilli dry-ing. J. Agril. Engng., 19(1): 27-32.
■■

VOL.38 NO.3 2007 AGRICULTURAL MECHANIZATION IN ASIA, AFRICA, AND LATIN AMERICA 79
Influence of Forward Speed and Terrain Conditionon Hand Transmitted Vibration of Power Tiller
byBinisamAssistant ProfessorKelappaji College of Agricultural Engineering and Technology,Kerala Agricultural University,Tavanur - 679 573INDIA
R. ManianDeanAgricultural Engineering College andResearch Institute, Tamil Nadu Agricultural University,Coimbatore - 641 003INDIA
K. KathirvelProfessor and HeadAgricultural Engineering College andResearch Institute, Tamil Nadu Agricultural University,Coimbatore - 641 003INDIA
C. R. MehtaScientistCentral Institute of Agricultural Engineering,Nabi Bagh, Berasia Road,Bhopal - 462 038INDIA
AbstractThe operator of a power tiller
must endure various environments and stress. Vibration significantly accelerates fat igue and affects sensitivity and reaction rates of the operator. The hand transmitted vibration (HTV) of walking type (7.46 kW) and riding type (8.95 kW) power tiller was measured and analyzed with respect to exposure time as per the guidelines of Inter-national standards ISO 5349 (1986). The operations included rototilling in untilled and tilled field condi-tions at 1.5, 1.8, 2.1 and 2.4 km h-1 forward speeds and transporting at 3.5, 4.0, 4.5 and 5.0 km h-1 forward speeds on farm roads and bitumen roads. The HTV during rototilling with the 7.46 kW power tiller in an untilled field varied from 3.43 to 5.26 m s-2 restricting the exposure time from 1/2-1 h to < 1/2 h. In the tilled field, the values were 2.66 to 4.55 m s-2 and 1 to 2 h to < 1/2 h, respectively. The terrain condition
of the untilled field resulted in 15.60 to 28.94 percent increased HTV. For the 8.95 kW power tiller, HTV varied from 3.31 to 5.09 m s-2 with an exposure time of 1 to 2 h to < 1/2 h. In the tilled field the values were 2.66 to 4.55 m s-2 and 1 to 2 h to < 1/2 h. The terrain condition of the untilled field was more pronounced with 16.47 to 30.31 percent increase in HTV. Among the power tillers, walking type power tiller registered 3.62 to 4.11 percent higher values of vibration. The HTV and expo-sure time during transport with the 7.46 kW power tiller on farm roads varied from 2.21 to 3.61 m s-2 and 2 to 4 h to 1/2 to1 h. In the bitumen road the values were 1.67 to 2.77 m s-2 and 2 to 4 h to 1 to 2 h. During transport with the 8.95 kW power tiller on farm roads the HTV and exposure time varied from 2.72 to 3.66 m s-2 and 1 to 2 h to 1/2 to1 h with the increase in forward speed. In bitumen roads the values were 2.02 to 2.95 m s-2 and 2 to 4 h to 1 to 2 h. The terrain induced vibration
of the 8.95 kW power tiller was 1.38 to 23.07 percent more on farm roads and 20.96 to 6.49 percent more on bitumen roads as compared to the 7.46 kW power tiller.
IntroductionThe operator of a power tiller
must endure various environments and st resses. The environment includes all the factors in the sur-roundings which have an effect on man-machine system. Among these factors, mechanical vibra-tion is more important because it significantly accelerates fatigue and affects sensitivity and reaction rates of the operator. Excessive noise level, vibrations and uncomfortable posture are the important shortcom-ings in power tiller design (Pawar, 1978). Hand transmitted vibration of a walking tractor is very strong be-cause the handle grip of a walking tractor is a cantilever beam and the power is obtained from a single cyl-

AGRICULTURAL MECHANIZATION IN ASIA, AFRICA, AND LATIN AMERICA 2007 VOL.38 NO.380
inder diesel engine. Daily exposure to hand arm vibrations over a num-ber of years can cause permanent physical damage known as “white finger syndrome”, or it can damage the joints and muscles of the wrist and elbow. The hand transmitted vibration has seriously affected the health of drivers and resulted in many traffic accidents necessitating the study on the vibratory charac-teristics and anti-vibration solutions of the walking tractor (Lewis and Griffin, 1978). This is of great theo-retical significance and high practi-cal value. In this paper the influence of forward speed and terrain condi-tion on HTV of riding and walking type power tillers are presented.
Review of LiteratureAraya (1986) reported that handle
vibration in hand-operated tilling machines and tractors was mainly due to the reciprocating motion of the main moving parts. Jiao Quny-ing et al. (1989) concluded that the major excitations of the hand trans-mitted vibration of a walking trac-tor are the unbalanced inertia force of the engine and the unevenness of road surface. He also reported that the hand transmitted vibration caused by the unevenness of road makes up about 20 percent of the to-tal hand transmitted vibration of the walking tractor (Jiao Qunying et al., 1993). Dong (1996) studied the main causes and characteristics of the vibration transmitted by handles of GN-5 walking tractor theoretically
and experimentally. The vibrations of handles were evaluated in refer-ence to ISO 5349. It was concluded that the main cause of vibration was the engine, and the vibration on the handles of the GN-5 walking trac-tor was very strong and seriously affects operator health. Mamansari (1998) reported that the vibration level increased with an increase of engine speed in the stationary and transport mode. Vertical vibration was significantly higher at the tip of handle of a power tiller, which had direct contact with the operator hand arm system. Ying et al. (1998) reported that the major excitation of the hand transmitted vibration of the walking tractor was the engine. The hand transmitted vibration was mainly composed of the harmonic waves of integer times and 1/2 times of the engine working frequencies. Major peaks in acceleration spectra varied from 2.683 m s-2 to 20 m s-2 while testing the walking tractor in stationary with engine rotating speed of 3000 rpm. The most seri-ous vibration among the three direc-tions was in the x-direction.
Materials and MethodsThe hand transmitted vibration of
the power tiller was measured and analyzed using the portable PULSE multi-analyzer system (Brüel & Kjær Type 3560 C). The PULSE multi-analyzer system is a versatile, task oriented analysis system for vibration and noise analysis. It pro-vides the platform for a range of PC-
based measurement solutions. Type 3650 C is a portable system powered by internal batteries or an external DC supply. The base software for a PULSE system is vibration and noise analysis type 7700. On this base, pulse software such as data re-corder type 7701 was installed. The entire system consisted of portable data acquisition unit- front end type 2827, vibration and noise analysis software type 7700, data recorder type 7701 and hand arm transducer type 4392. The power tiller was put in proper test condition before conducting the experiments, that is, in full working order with full fuel tank and radiator, without optional front weights, tire ballast and any specialized components. Tires used for the tests were of standard size and depth of treads was not less than 70 percent of the depth of a new thread. Pneumatic wheels with recommended tire pressure of 1.5 kg cm-2 and 2.5 kg cm-2 were used during rototilling and transporting operations respectively. There were no known mechanical defects that would result in abnormal vibration in both power tillers.
The vibration from the handle of the power tiller was transmitted to the hand and arm of the operator through the palm of his hand. The hand transmitted vibration was measured at handle-grip level as per the guide lines issued in ISO 5349 (1986). The transducer employed was a piezoelectric accelerometer (B&K, Type 4392) mounted on a hand adapter to insert between the fingers and the grip (Ying et al.,
Fig. 3 Instrumentation set up for measuring HTV of power tiller B
Fig. 2 Instrumentation set up for measuring HTV of power tiller A
Fig. 1 Hand arm transducer inserted between the fingers and handle grip

VOL.38 NO.3 2007 AGRICULTURAL MECHANIZATION IN ASIA, AFRICA, AND LATIN AMERICA 81
1998 and Ragni, et al., 1999) and fixed on the grip by tape (Fig. 1). The transducer was inserted be-tween the middle and index fingers of left hand of each subject since the force output from index and middle finger is larger than that from ring and little finger (Fransson and Win-kel, 1991). The right hand was used for operating the controls.
The orientation of the measure-ment axes of the accelerometers was according to ISO 5349. The Z- axis was directed along the second meta-carpus bone of the hand, X- axis perpendicular to the Z-axis (both these axes are normal to the longi-tudinal axis of the grip) and Y-axis parallel to the longitudinal axis of the grip.
Hand transmitted vibration was measured as frequency weighted r.m.s value of acceleration for the one-third octave band, having cen-tre frequencies from 1 to 80 Hz (ISO 5349). All the transducers were calibrated before the trials. The instrument set up for measur-ing hand transmitted vibration of power tiller A is shown in Fig. 2. The instrument set up for measuring hand transmitted and whole body vibration of power tiller B is shown in Fig. 3.
The experiments were conducted during rototilling with rotavator in untilled and tilled field conditions and during transport mode of a
walking type power tiller (7.46 kW) and riding type power tiller (8.95 kW) with empty trailer on farm roads and bitumen roads. The depth of operation was maintained at a constant level of about 15 cm during rototilling. The subjects were in-structed to hold the handle grip with a light and constant compression force. Measurements were made at different forward speeds, viz. 1.5 km h-1, 1.8 km h-1, 2.1 km h-1 and 2.4 km h-1 during field trials and 3.5 km h-1, 4.0 km h-1, 4.5 km h-1 and 5.0 km h-1 during transport mode. The PULSE programme was activated after the power tiller was started for the operation and the measurement was recorded with an acquisition period of 60 seconds (Ying et al., 1998). Each trial was repeated five times for all operating conditions. The same procedure was repeated for all the selected subjects.
Assessment of Human Exposure to HandTransmitted Vibration
The values of HTV of 5 runs were averaged at corresponding frequen-cy for one subject. The procedure was repeated for all the subjects and the mean value for three subjects for each selected levels of forward speed was computed. The exposure time limit was then predicted by
superimposing the mean measured values of three subjects at each fre-quency on the exposure guide line. The same procedure was followed for all operating conditions. The ISO standard 5349 for hand arm vibrations does not define the limits for safe exposure. It only provides guidelines for the measurement and assessment of hand-transmitted vibration. Annexure A of the ISO 5349 provides information that allows one to predict the probabil-ity of white-finger syndrome as a function of the frequency weighted energy equivalent r.m.s acceleration value for a daily period of 4 h and exposure time in years for selected percentiles of an exposed population (Ragni, 1993).
Results and DiscussionThe predicted exposure limit of
the subjects for the measured values of HTV under selected levels of variables is furnished in Table 1.
The safe exposure time limit for hand transmitted vibration of the two power tillers was of serious con-cern restricting the safe exposure to < 1/2 - 1-2 h in rototilling and 1-2 to 2-4 h in transporting respectively. On an average, the power tillers were used for more than 5 h in the study region. If the subjects were exposed to 5 h at this level of HTV,
Acceleration (r.m.s), m s-2
2.0
2.5
3.0
3.5
4.0
4.5
5.0
5.5
2.42.11.81.5Forward speed, km h-1
Power tiller A (Untilled)Power tiller B (Untilled)Power tiller A (Tilled)
RototillingAcceleration (r.m.s), m s-2
1.0
1.5
2.0
2.5
3.0
3.5
4.0
5.04.54.03.5Forward speed, km h-1
Power tiller A (Farm road)Power tiller B (Farm road)Power tiller A (Bitumen road)Power tiller B (Bitumen road)
Transporting
Fig. 4 Hand transmitted vibration of power tillers
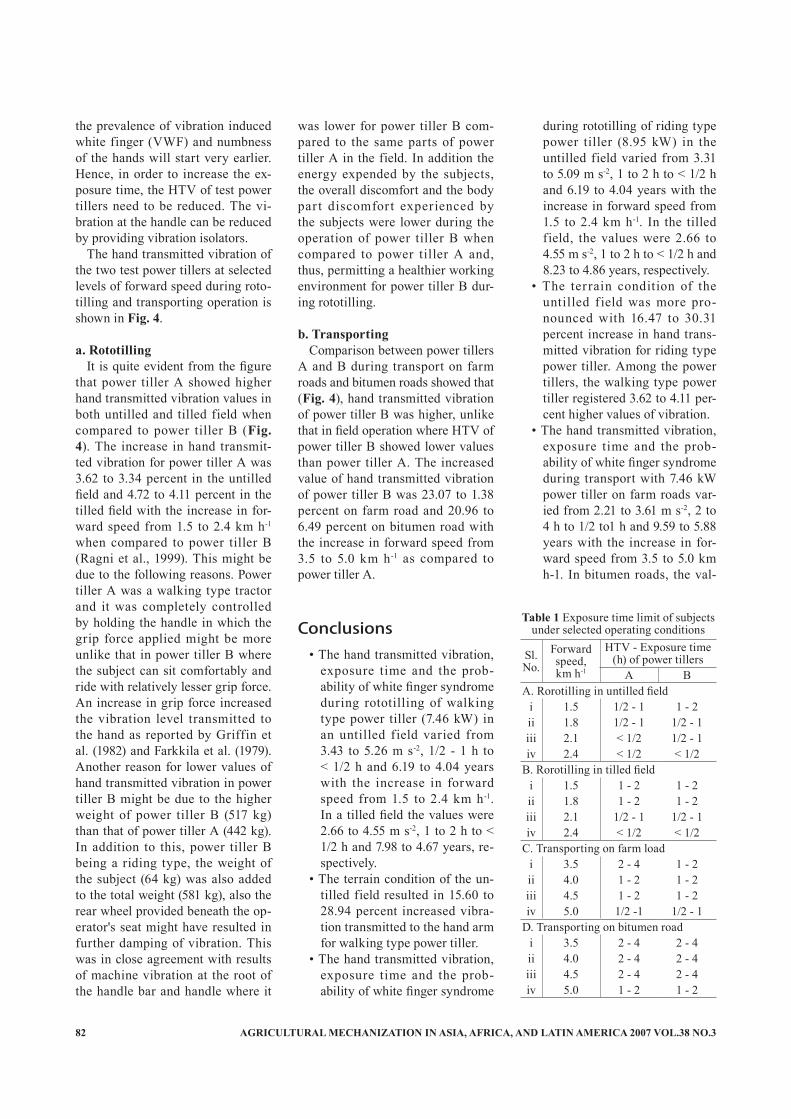
AGRICULTURAL MECHANIZATION IN ASIA, AFRICA, AND LATIN AMERICA 2007 VOL.38 NO.382
the prevalence of vibration induced white finger (VWF) and numbness of the hands will start very earlier. Hence, in order to increase the ex-posure time, the HTV of test power tillers need to be reduced. The vi-bration at the handle can be reduced by providing vibration isolators.
The hand transmitted vibration of the two test power tillers at selected levels of forward speed during roto-tilling and transporting operation is shown in Fig. 4.
a. RototillingIt is quite evident from the figure
that power tiller A showed higher hand transmitted vibration values in both untilled and tilled field when compared to power tiller B (Fig. 4). The increase in hand transmit-ted vibration for power tiller A was 3.62 to 3.34 percent in the untilled field and 4.72 to 4.11 percent in the tilled field with the increase in for-ward speed from 1.5 to 2.4 km h-1 when compared to power tiller B (Ragni et al., 1999). This might be due to the following reasons. Power tiller A was a walking type tractor and it was completely controlled by holding the handle in which the grip force applied might be more unlike that in power tiller B where the subject can sit comfortably and ride with relatively lesser grip force. An increase in grip force increased the vibration level transmitted to the hand as reported by Griffin et al. (1982) and Farkkila et al. (1979). Another reason for lower values of hand transmitted vibration in power tiller B might be due to the higher weight of power tiller B (517 kg) than that of power tiller A (442 kg). In addition to this, power tiller B being a riding type, the weight of the subject (64 kg) was also added to the total weight (581 kg), also the rear wheel provided beneath the op-erator's seat might have resulted in further damping of vibration. This was in close agreement with results of machine vibration at the root of the handle bar and handle where it
was lower for power tiller B com-pared to the same parts of power tiller A in the field. In addition the energy expended by the subjects, the overall discomfort and the body par t discomfort experienced by the subjects were lower during the operation of power tiller B when compared to power tiller A and, thus, permitting a healthier working environment for power tiller B dur-ing rototilling.
b. TransportingComparison between power tillers
A and B during transport on farm roads and bitumen roads showed that (Fig. 4), hand transmitted vibration of power tiller B was higher, unlike that in field operation where HTV of power tiller B showed lower values than power tiller A. The increased value of hand transmitted vibration of power tiller B was 23.07 to 1.38 percent on farm road and 20.96 to 6.49 percent on bitumen road with the increase in forward speed from 3.5 to 5.0 km h-1 as compared to power tiller A.
Conclusions• The hand transmitted vibration,
exposure time and the prob-ability of white finger syndrome during rototilling of walking type power tiller (7.46 kW) in an untilled field varied from 3.43 to 5.26 m s-2, 1/2 - 1 h to < 1/2 h and 6.19 to 4.04 years with the increase in forward speed from 1.5 to 2.4 km h-1. In a tilled field the values were 2.66 to 4.55 m s-2, 1 to 2 h to < 1/2 h and 7.98 to 4.67 years, re-spectively.
• The terrain condition of the un-tilled field resulted in 15.60 to 28.94 percent increased vibra-tion transmitted to the hand arm for walking type power tiller.
• The hand transmitted vibration, exposure time and the prob-ability of white finger syndrome
during rototilling of riding type power tiller (8.95 kW) in the untilled field varied from 3.31 to 5.09 m s-2, 1 to 2 h to < 1/2 h and 6.19 to 4.04 years with the increase in forward speed from 1.5 to 2.4 km h-1. In the tilled field, the values were 2.66 to 4.55 m s-2, 1 to 2 h to < 1/2 h and 8.23 to 4.86 years, respectively.
• The terrain condition of the untilled f ield was more pro-nounced with 16.47 to 30.31 percent increase in hand trans-mitted vibration for riding type power tiller. Among the power tillers, the walking type power tiller registered 3.62 to 4.11 per-cent higher values of vibration.
• The hand transmitted vibration, exposure time and the prob-ability of white finger syndrome during transport with 7.46 kW power tiller on farm roads var-ied from 2.21 to 3.61 m s-2, 2 to 4 h to 1/2 to1 h and 9.59 to 5.88 years with the increase in for-ward speed from 3.5 to 5.0 km h-1. In bitumen roads, the val-
Sl.No.
Forward speed,km h-1
HTV - Exposure time (h) of power tillers
A BA. Rorotilling in untilled field
i 1.5 1/2 - 1 1 - 2ii 1.8 1/2 - 1 1/2 - 1iii 2.1 < 1/2 1/2 - 1iv 2.4 < 1/2 < 1/2
B. Rorotilling in tilled fieldi 1.5 1 - 2 1 - 2ii 1.8 1 - 2 1 - 2iii 2.1 1/2 - 1 1/2 - 1iv 2.4 < 1/2 < 1/2
C. Transporting on farm loadi 3.5 2 - 4 1 - 2ii 4.0 1 - 2 1 - 2iii 4.5 1 - 2 1 - 2iv 5.0 1/2 -1 1/2 - 1
D. Transporting on bitumen roadi 3.5 2 - 4 2 - 4ii 4.0 2 - 4 2 - 4iii 4.5 2 - 4 2 - 4iv 5.0 1 - 2 1 - 2
Table 1 Exposure time limit of subjects under selected operating conditions

VOL.38 NO.3 2007 AGRICULTURAL MECHANIZATION IN ASIA, AFRICA, AND LATIN AMERICA 83
ues are 1.67 to 2.77 m s-2, 2 to 4 h to 1 to 2 h and 12.73 to 7.66 years, respectively.
• The hand transmitted vibration, exposure time and the prob-ability of white finger syndrome during transport with 8.95 kW power tiller on farm roads var-ied from 2.72 to 3.66 m s-2, 1 to 2 h to 1/2 to1 h and 7.8 to 5.79 years with the increase in for-ward speed from 3.5 to 5.0 km h-1. In bitumen roads the values are 2.02 to 2.95 ms-2, 2 to 4 h to 1 to 2 h and 10.50 to 7.20 years, respectively.
• The terrain induced vibration of 8.95 kW power tiller was 1.38 to 23.07 percent more on farm roads and 20.96 to 6.49 percent more on bitumen roads as com-pared to 7. 46 kW power tiller.
REFERENCES
Araya, K. 1986. Handle vibration in hand operated tilling machines and tractors. Journal of the Japa-nese Society of Agricultural Ma-chinery, 48(1): 99-102.
Dong, M. D. 1996. Testing analysis and evaluation of vibration trans-mitted by handles of GN-5 walk-ing tractor. Journal of Zhejiang Agricultural University, 22(1): 68- 72.
Farkkila, M., I. Pyyko., O. Bottoms, and R. M. Stayner. 1979. Hand grip force during chain saw op-eration and vibration white finger in lumberjacks. British J of Ind Med.,36: 336-341.
Griffin, M. J., E. M. Whitham, and K. C. Parsons. 1982. Vibration and comfort.I. Translational seat vibration. Ergonomics, 25: 603- 630.
ISO 5349. 1984. Mechanical vibra-tion-Guidelines for the measure-ment and the assessment of hu-man exposure to hand transmitted vibration. Geneva.
Jiao Qunying, Dai Shiliang, and Ji Chunliang. 1989. The dynamic
characteristics of a walking trac-tor. Transactions of the Chinese Society of Agricultural-Machin-ery, 20(4): 3-8.
Jiao Qunying, Wang Qianhua, Chen Kuifu, and Zhao Daxing. 1993. The excitations and characteris-tics of the vibration of walking tractors handle using isolators. Transactions of the Chinese So-ciety of Agricultural-Machinery, 24(4): 74-79.
Lewis, C. H. and M. J. Griffin. 1978. A review of the effects of vibra-tion on visual acuity and con-tinuous manual control (Part 2). J. Sound & Vibra, 56(3): 415-457.
Mamansari, D. U. 1998. Ergonomic evaluation of a commonly used power tiller in Thailand. Unpub-lished Ph.D. Thesis. Asian Insti-tute of Technology, Bangkok.
Pawar, J. G. 1978. Investigation of human energy requirements for power tiller operation. Unpub-lished M.Tech Thesis, Punjab Ag-ricultural University, Ludhiana.
Ragni, L. 1993. Vibration transmit-ted to the hand-arm system by walking tractors. Third part: a solution for vibration reduction. Rivista di Ingegneria Agraria, 24(4): 193-198.
Ying, Y., L. Zhang, F. Xu, and M. Dong. 1998. Vibratory character-istics and hand- transmitted vibra-tion reduction of walking tractor. Transactions of the ASAE, 41(4): 917-922.
■■

AGRICULTURAL MECHANIZATION IN ASIA, AFRICA, AND LATIN AMERICA 2007 VOL.38 NO.384
Performance Evaluation of Implements forIncorporation of Cotton Stalks
byT. SenthilkumarResearch ScholarAgricultural Engineering College andResearch Institute, Tamil Nadu Agricultural University,Coimbatore - 641 003INDIA
R. ManianDeanAgricultural Engineering College andResearch Institute, Tamil Nadu Agricultural University,Coimbatore - 641 003INDIA
Aravinda ReddyResearch ScholarAgricultural Engineering College andResearch Institute, Tamil Nadu Agricultural University,Coimbatore - 641 003INDIA
K. KathirvelProfessor and HeadAgricultural Engineering College andResearch Institute, Tamil Nadu Agricultural University,Coimbatore - 641 003INDIA
AbstractThe soil fertility changes due to in-
situ incorporation of cotton stalks and residual effect of crop residue man-agement was investigated through a field experimental with post harvest stalks as standing crop. The treat-ments included operation with roto slasher followed by disc plough, operation of roto slasher followed by rotovator, operation of disc plough followed by rotovator and hand pull-ing of cotton stalks followed by disc ploughing and cultivator once. Till-age treatments were imposed as non-replicated and succeeding cowpea crop (Co.4) was raised in RBD with two replications. Pre- and post-exper-imental soil sampling was done using core sampler and were analyzed for physical properties such as saturated hydraulic conductivity, bulk den-sity and total porosity at different soil depths, viz. 0-15, 15-30 and 30-45 cm. The chemical properties such as pH, EC, macro and micro nutrients were also analyzed at periodical in-tervals, viz. 10, 20 and 30 days after
incorporation. Subsequently, the re-sidual crop was sown and maintained till maturity. Treatments with a disc plough played a predominant role in lowering the bulk density and increas-ing the hydraulic conductivity and porosity. The residual effect observed showed that the pod and haulm yields of cowpea were maximum (10.38 and 55.2 q ha-1, respectively) under roto slasher followed by disc plough (T1). There was 21.6 percent increase in pod yield compared to farmers’ practice. This was followed by disc plough followed by rotovator tilling (T3). Farmers’ practice (T4) recorded the lowest pod and haulm yield (8.53 and 45.4 q ha-1 respectively) due to non-incorporation of cotton stalks. Roto slashing of post-harvest cotton stubbles followed by incorporation through disc ploughing once was the best as it recorded the favourable soil physical and chemical properties and recorded the maximum pod and haulm yield of the succeeding cow-pea crop, suggesting its suitability for crop residue management for sustain-able crop production.
IntroductionThe area under cotton cultivation
in Tamil Nadu is 250,000 ha with a production of 550,000 bales. In India, Tamil Nadu ranks ninth in position in respect of area as well as production. For the collection of information on the implements/machinery used by the farmers for performing the different operations in cotton cultivation, a survey was conducted with cotton growers. The requirement for the 770 mills in Tamil Nadu is around 5.0 to 5.5 mil-lion bales. Agricultural labour input is becoming increasingly costlier. Labour efficiency, turnover of work and duration of working hours are deplorably deteriorating, resulting in poor crop management, increas-ing cost of cultivation and poor in-come to the cotton farmers. Hence, farm mechanization is the need of the hour. The arduous operation of removal of cotton stalks from the soil and transporting the same to the yard manually is labour intensive.

VOL.38 NO.3 2007 AGRICULTURAL MECHANIZATION IN ASIA, AFRICA, AND LATIN AMERICA 85
Review of LiteratureRochester et al. (1997) conducted
a study on effects of cotton stubble removal on and incorporation on lint yield and N fertilizer recovery of three consecutive cotton crops. Soil mineral N content prior to planting was slightly higher where stubble was removed, but N fertilizer recov-ery was reduced by 10 %, averaged over the three seasons. Lint yield tended to decline with successive crops with stubble removal compared with stubble retention and in the third crop yield was reduced by 10 %. It was concluded that stubble re-tention promotes a more biologically active soil system that is conducive to more efficient use of N fertilizer and maintains higher cotton yields. Tiwari et al. (1998) reported that in-corporation of ground nut haulm at 7.5 Mg ha-1 significantly increased the grain and straw yields of wheat both at 50 and 100 kg levels of N application. There was considerable improvement in physical properties, viz. water holding capacity and bulk density of the soil. Ravendar Reddy et al. (2002) reported that the incor-poration of crop residue like wheat straw at 5 t ha-1 in combination with fertilizer application and tillage op-erations resulted in improvement of soil physical properties along with available nutrient status (available ni-trogen, phosphorous and potassium).
Methods and MaterialsA field experiment was conducted
in TNAU, Coimbatore between De-cember, 2001 and April 2002 with post harvest stalks as standing crop.
The treatments selected were: T1: Operation with roto slasher followed by disc plough, T2: Operation of roto slasher followed by rotovator, T3: Operation of disc plough followed by rotovator, T4: Hand pulling of cot-ton stalks followed by disc plough-ing and once (farmers’ practice).
Tillage treatments were imposed as non-replicated and succeeding cowpea crop (Co.4) was raised in RBD with two replications. Pre- and post-experimental soil sampling was done using core sampler and were analyzed for physical properties such as saturated hydraulic conduc-tivity, bulk density and total poros-ity at different soil depths, viz. 0-15, 15-30 and 30-45 cm. The chemical properties such as pH, EC, macro and micro nutrients were also ana-lyzed at periodical intervals, viz. 10, 20 and 30 days after incorporation. Subsequently, the residual crop was sown and maintained until maturity.
Results and Discussioni. Soil Physical Properties
Analysis of soil physical properties showed a decrease in bulk density,
an increase in hydraulic conductivity and variation in total porosity due to tillage. Bulk density, the most impor-tant physical property of the soil due to its control over root proliferation, air, water and nutrient movement decreased invariably in all treat-ments up to 30 cm depth and was unchanged under the treatment with roto slasher followed by disc plough after 30 cm. Though tillage practices lower bulk density, the reduction was marked under roto slashing followed by disc ploughing (Table 1).
The soil strength was positively correlated with bulk density and the uptake of N, P and K decreased when the bulk density of the soil increased from 1.5 Mg m-3 for cowpea (Baskar et al., 1995). The saturated hydraulic conductivity increased in all tillage treatments and was more pronounced under roto slasher followed by disc plough -T1 (from 0.76 to 1.83, 0.69 to 1.73 and 0.52 to 1.62 in 0-15, 15-30 and 30-45 cm depths, respectively, as furnished in Table 2. Variation in total porosity was observed at differ-ent depths. Reduction in bulk density and increase in hydraulic conductiv-ity was observed under crop-residue management through tillage prac-tices in alfisols (Vijayalakshmi and Saravanan, 2000).
Treatments with a disc plough played a predominant role in lower-ing the bulk density and increasing hydraulic conductivity and porosity.
ii. Soil Fertility Changes Due to In-situ Incorporation of Cotton Stalks
Changes in soil reaction, EC and available N, P and K and micronu-trients Zn, Fe, Cu and Mn status are presented in Table 3. Incorporation of cotton stalks recorded a decrease
TreatmentsBulk density, mg m-3 Total porosity, %
0-15 cm 15-30 cm 30-45 cm 0-15 cm 15-30 cm 30-45 cmI F I F I F I F I F I F
Roto slasher + disc plough (T1) 1.210 0.920 1.303 0.980 1.033 1.051 16.12 26.64 23.07 63.75 14.80 17.12Roto slasher + rotovator (T2) 1.208 1.035 1.302 1.370 1.033 1.395 12.55 9.31 23.38 45.32 15.53 45.24Disc plogh + rotovator (T3) 1.207 1.026 1.304 1.022 1.005 1.430 15.52 26.70 23.09 62.80 13.75 31.70Farmers' practice (T4) 1.314 1.110 1.378 1.240 1.173 1.372 19.65 9.85 16.01 40.40 18.06 44.50
Table 1 Influence of tillage on bulk density and total porosity of soil at different depths
Treatments 0-15 cm 15-30 cm 30-45 cmInitial 30 DAI Initial 30 DAI Initial 30 DAI
Roto slasher + disc plough (T1) 0.76 1.83 0.69 1.73 0.52 1.62Roto slasher + rotovator (T2) 0.75 1.10 0.69 0.95 0.51 0.80Disc plogh + rotovator (T3) 0.74 1.40 0.67 1.33 0.53 1.27Farmers' practice (T4) 0.82 1.48 0.72 1.26 0.46 1.05
Table 2 Influence of tillage on the saturated hydraulic conductivity, mm ha-1

AGRICULTURAL MECHANIZATION IN ASIA, AFRICA, AND LATIN AMERICA 2007 VOL.38 NO.386
in soil pH and slight increase in EC from its initial levels. An increase in soil pH and EC values were record-ed in farmers’ practice, which might be due to the complete removal of crop residue.
Progressive increase in macro and micro nutrient levels were ob-served in all cotton stalk incorpo-rated treatments. Among the cotton stalk incorporated treatments, the increase in macro and micro nutri-ents were the highest for treatment T1 (Rotoslasher + Disc plough). The percentage increase in macro and micro nutrients levels in this treat-ment when compared with farmers practice was 23.0, 21.0, 64.7, 15.35, 50.0, 19.5 and 9.4 for N, P, K, Fe, Zn, Mn and Cu, respectively.a. Residual Effect of Crop Residue Management
The pod and haulm yields of cow-pea were recorded at maturity and presented in Table 4.
Residual effect observed showed that the pod and haulm yields of cowpea were maximum (10.38 and 55.2 q ha-1, respectively) under roto slasher followed by disc plough (T1). There was 21.6 percent increase in pod yield compared to farmers’ practice. This was followed by disc plough followed by rotovator tilling
(T3). Farmers’ practice (T4) recorded the lowest pod and haulm yield (8.53 and 45.4 q ha-1, respectively) due to non-incorporation of cotton stalks.
ConclusionThe chemical properties such as
pH, EC, macro and micronutrients were also analyzed at periodical in-tervals viz. 10, 20 and 30 days after incorporation. Subsequently, the re-sidual crop was sown and maintained until maturity. Treatments with a disc plough played a predominant role in lowering the bulk density, increasing the hydraulic conductiv-ity and porosity. The residual effect observed showed that the pod and haulm yields of cowpea were maxi-mum (10.38 and 55.2 q ha-1, respec-tively) under roto slasher followed by disc plough (T1). There was 21.6 percent increase in pod yield com-pared to farmers’ practice. This was followed by disc plough followed by rotovator tilling (T3). Farmers’ prac-tice (T4) recorded the lowest pod and haulm yield (8.53 and 45.4 q ha-1, re-spectively) due to non-incorporation of cotton stalks. Rotoslashing of post-harvest cotton stubbles fol-lowed by incorporation through disc
Treat. Roto slasher + disc plough Roto slasher + rotovator Disc plough + rotovator Farmers' practiceDA1 Initial 10 20 30 Initial 10 20 30 Initial 10 20 30 Initial 10 20 30
PH 8.8 8.8 8.7 8.6 8.8 8.8 8.7 8.7 8.8 8.7 8.7 8.6 8.8 8.9 8.9 8.9EC, dsm-1 0.32 0.36 0.42 0.45 0.36 0.36 0.36 0.37 0.32 0.36 0.4 0.49 0.32 0.36 0.49 0.49N, kg/ha 170 165 210 227.5 177.5 177.5 190.0 220.0 177.5 177.5 190.0 190.0 185.0 180.0 185.0 185.0P, kg/ha 11.0 11.0 13.0 14.0 11.0 11.0 12.0 12.5 10.5 10.5 12.0 12.5 10.5 10.0 11.5 11.5K, kg/ha 687.5 780.0 975.0 1,050 675.0 690.0 735.0 832.0 682.5 715.0 800.0 800.0 670.0 625.0 605.0 637.5Fc, ppm 6.26 6.26 6.76 6.76 6.26 6.26 6.78 6.48 6.48 6.48 6.32 6.52 6.48 6.26 5.92 5.86Zn, ppm 1.32 1.42 1.80 1.80 1.30 1.30 1.72 1.72 1.32 1.46 1.78 1.78 1.28 1.30 1.20 1.20Mn, ppm 5.86 5.86 6.12 6.36 5.82 5.82 6.10 6.10 5.76 5.82 6.26 6.24 5.52 5.40 5.32 5.32Cu, ppm 2.14 2.14 2.22 2.32 2.14 2.14 2.22 2.32 2.20 2.22 2.32 2.28 2.20 2.20 2.14 2.12
Table 3 Influence of tillage on bulk density and total porosity of soil at different depths
Treatments Pod yield Haulm yieldRoto slasher + disc plough (T1) 10.38 55.20Roto slasher + rotovator (T2) 9.14 50.50Disc plogh + rotovator (T3) 9.96 52.20Farmers' practice (T4) 8.53 45.40
Table 4 Residual effect of tillage implements on pod and haulm yield (q ha-1) of cowpea
ploughing once was the best as it re-corded decrease in bulk density and increase in hydraulic conductivity, porosity, and micro, macro nutrient levels and recorded the maximum pod and haulm yield of the succeed-ing cowpea crop, which suggested its suitability for crop residue manage-ment for sustainable crop production.
REFERENCES
Baskar, A., C. Paulraj, B. Rajkan-nan, S. Avudainayagam, S. Poon-gothai, S. Natesan, K. Appavu, and Rani Perumal. 1995. Twenty-five years of soil physics research in Tam-il Nadu (1967-1992). Department of Soil Science and Agricultural Chem-istry, TNAU, Coimbatore, pp 80.
Rajender Reddy G., G. U. Male-war, and B. G. Karle. 2002. Effect of crop residue incorporation and tillage operations on soil properties of vertisol under rainfed agriculture. Indian J. Dryland Agric. Res. & Dev. 17(1), 55-58.
Rochester. I. J., G. A. Constable, and P. G. Saffingna. 1997. Reten-tion of cotton stubble enhances N fertilizer recovery and lint yield of irrigated cotton. Soil & Tillage Re-searach, 41: 75-86.
Tiwari V. N., L. K. Lehri, K. N. Tiwari, and Hari Singh. 1998. Effect of the incorporation of groundnut plant residues on wheat yield, nutri-ent uptake and soil productivity. Journal of the Indian soc. of soil sci-ence, 46, 43-47.
■■
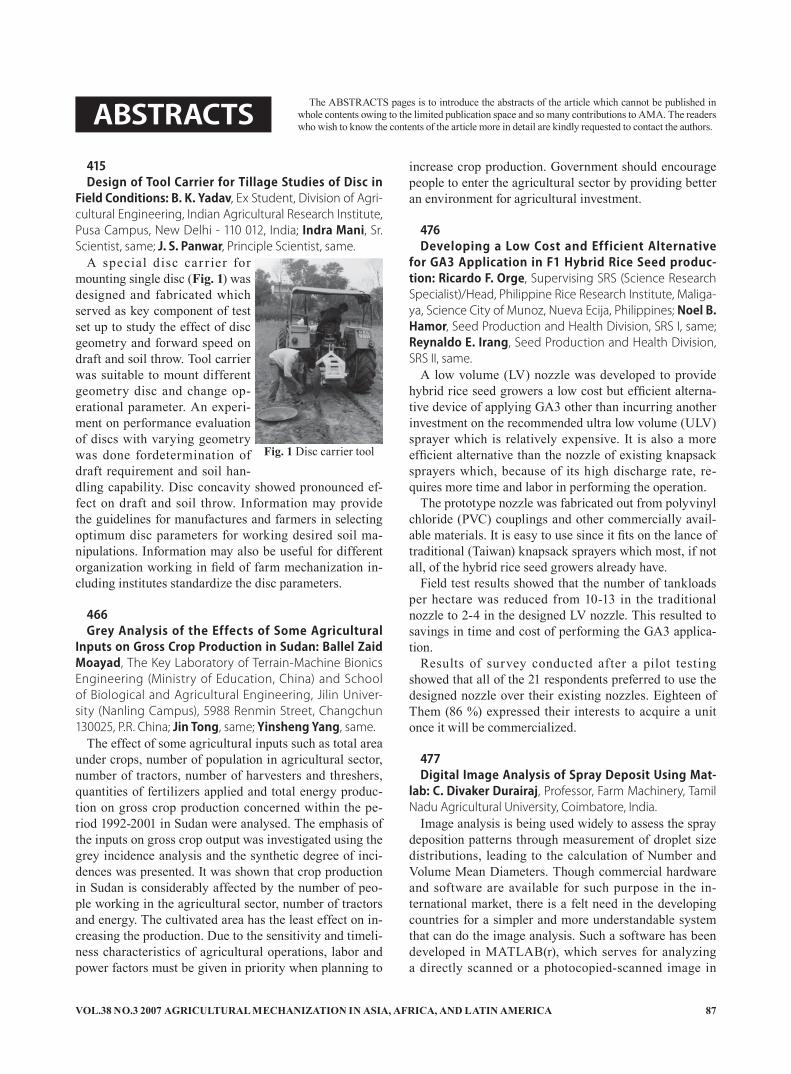
VOL.38 NO.3 2007 AGRICULTURAL MECHANIZATION IN ASIA, AFRICA, AND LATIN AMERICA 87
ABSTRACTS The ABSTRACTS pages is to introduce the abstracts of the article which cannot be published in whole contents owing to the limited publication space and so many contributions to AMA. The readers who wish to know the contents of the article more in detail are kindly requested to contact the authors.
415Design of Tool Carrier for Tillage Studies of Disc in
Field Conditions: B. K. Yadav, Ex Student, Division of Agri-cultural Engineering, Indian Agricultural Research Institute, Pusa Campus, New Delhi - 110 012, India; Indra Mani, Sr. Scientist, same; J. S. Panwar, Principle Scientist, same.
A special disc car r ier for mounting single disc (Fig. 1) was designed and fabricated which served as key component of test set up to study the effect of disc geometry and forward speed on draft and soil throw. Tool carrier was suitable to mount different geometry disc and change op-erational parameter. An experi-ment on performance evaluation of discs with varying geometry was done fordetermination of draft requirement and soil han-dling capability. Disc concavity showed pronounced ef-fect on draft and soil throw. Information may provide the guidelines for manufactures and farmers in selecting optimum disc parameters for working desired soil ma-nipulations. Information may also be useful for different organization working in field of farm mechanization in-cluding institutes standardize the disc parameters.
466Grey Analysis of the Effects of Some Agricultural
Inputs on Gross Crop Production in Sudan: Ballel Zaid Moayad, The Key Laboratory of Terrain-Machine Bionics Engineering (Ministry of Education, China) and School of Biological and Agricultural Engineering, Jilin Univer-sity (Nanling Campus), 5988 Renmin Street, Changchun 130025, P.R. China; Jin Tong, same; Yinsheng Yang, same.
The effect of some agricultural inputs such as total area under crops, number of population in agricultural sector, number of tractors, number of harvesters and threshers, quantities of fertilizers applied and total energy produc-tion on gross crop production concerned within the pe-riod 1992-2001 in Sudan were analysed. The emphasis of the inputs on gross crop output was investigated using the grey incidence analysis and the synthetic degree of inci-dences was presented. It was shown that crop production in Sudan is considerably affected by the number of peo-ple working in the agricultural sector, number of tractors and energy. The cultivated area has the least effect on in-creasing the production. Due to the sensitivity and timeli-ness characteristics of agricultural operations, labor and power factors must be given in priority when planning to
increase crop production. Government should encourage people to enter the agricultural sector by providing better an environment for agricultural investment.
476Developing a Low Cost and Efficient Alternative
for GA3 Application in F1 Hybrid Rice Seed produc-tion: Ricardo F. Orge, Supervising SRS (Science Research Specialist)/Head, Philippine Rice Research Institute, Maliga-ya, Science City of Munoz, Nueva Ecija, Philippines; Noel B. Hamor, Seed Production and Health Division, SRS I, same; Reynaldo E. Irang, Seed Production and Health Division, SRS II, same.
A low volume (LV) nozzle was developed to provide hybrid rice seed growers a low cost but efficient alterna-tive device of applying GA3 other than incurring another investment on the recommended ultra low volume (ULV) sprayer which is relatively expensive. It is also a more efficient alternative than the nozzle of existing knapsack sprayers which, because of its high discharge rate, re-quires more time and labor in performing the operation.
The prototype nozzle was fabricated out from polyvinyl chloride (PVC) couplings and other commercially avail-able materials. It is easy to use since it fits on the lance of traditional (Taiwan) knapsack sprayers which most, if not all, of the hybrid rice seed growers already have.
Field test results showed that the number of tankloads per hectare was reduced from 10-13 in the traditional nozzle to 2-4 in the designed LV nozzle. This resulted to savings in time and cost of performing the GA3 applica-tion.
Results of survey conducted after a pilot testing showed that all of the 21 respondents preferred to use the designed nozzle over their existing nozzles. Eighteen of Them (86 %) expressed their interests to acquire a unit once it will be commercialized.
477Digital Image Analysis of Spray Deposit Using Mat-
lab: C. Divaker Durairaj, Professor, Farm Machinery, Tamil Nadu Agricultural University, Coimbatore, India.
Image analysis is being used widely to assess the spray deposition patterns through measurement of droplet size distributions, leading to the calculation of Number and Volume Mean Diameters. Though commercial hardware and software are available for such purpose in the in-ternational market, there is a felt need in the developing countries for a simpler and more understandable system that can do the image analysis. Such a software has been developed in MATLAB(r), which serves for analyzing a directly scanned or a photocopied-scanned image in
Fig. 1 Disc carrier tool

AGRICULTURAL MECHANIZATION IN ASIA, AFRICA, AND LATIN AMERICA 2007 VOL.38 NO.388
the personal computer. The algorithm uses the extensive MATLAB(r) image processing toolbox and is able to segment and separate overlapping deposits to accurately measure their sizes, finally yielding the NMD and VMD value too. The routines were tested on computer generat-ed images as well as real spray deposit images and found to assess the size distribution within an error margin of 3.0 percent.
488Ergonomic Studies on the Operation of Clutch Pedal
of the Tractor: Vinay Madan, Research Fellow, Dept. of Farm Power and Machinery, Punjab Agricultural University, Ludhiana, India; H. S. Dhingra, Assistant Professor (Sl. Sc.) of Agricultural Engineering, same; Santokh Singh, Profes-sor of Agricultural Engineering, same.
The present study deals with the force applied by the operator on clutch pedal while performing different field operations. Force measurement was made with a designed and developed instrumentation package, which included the load cell, signal conditioner and readout de-vice. Load cell was calibrated by applying step loading of 5 kg from 0 to 30 kg and data was recorded for both loading and unloading. The performance of load cell was upto the mark and worked well during study. The amount of force varied by changing the implements through the subject was same. Average force value in operating various implements in the field ranged between 202.37 to 212.00 N. the similar trend was observed in the heart rate which varied from 86.30 to 98.60 beats per minute for the corresponding implements.
498Studies on Gravitational Settling of Cassava Starch
on an Inclined Plane: Shama Rao P., Tamil Nadu Agricul-tural University, Coimbatore, India; R. Kailappan, same; M. Kannnan, same.
Cassava or tapioca (Manihot esculanta Crantz) is an important tuber crop cultivated in many tropical coun-tries of the world. Cassava is considered as an industrial crop for its high starch content (78.1-90.15 % on dry ba-sis). Tamil Nadu stands top in processing of cassava in to starch and sago. Out of 1,000 sago industries in Tamil Nadu, 800 are located in and around Salem district, Tamil Nadu, India.
Extraction of starch from raw tubers involves washing, peeling, rasping, screening, gravitational settling, pulver-ization and drying. On an average, it requires 6.5 m3 of water per tonne of tubers and about 90-95 % of the water used goes as effluent. Settling of starch particles through settling tank takes about 10-12 h in the secondary settling tank and this longer detention time causes fermentation; producing alcohol and organic acids, which gave foul smell polluting the entire area and atmosphere in and around the sago industry. An easy and quick separation of starch, which consumes minimum water and elimi-nates effluent disposal problem theoretically becomes an immediate requirement for the starch industry to operate the same in a pollution free environment.
A study was undertaken to fabricate a model gravita-tional settling plane to study the settling of starch par-ticles under gravitational force in order to understand the process of separation of starch from the starch milk and recycle the fruit water collected for rasping operation. Studies were conducted with model starch settling unit with the process parameters namely length, slope, feed rate and starch concentration in the fruit water. The pro-cess parameters were varied and experiments were con-ducted to optimize the parameters for the best operating condition. A starch settling plane 36 m length and 0.25 % slope was found to be best for draining fruit water with a starch concentration of 0.05 % for a maximum feed rate of 8 lit/min studied.
As the BOD value of the fruit water with 0.05 % starch concentration was only 90 mg/lit after 24 h which is less than the safe limit. Hence, it can be recycled for rasping operation and finally for washing of tubers and then used for irrigation purpose.
The design calculations for a 50 tonnes capacity starch industry revealed that the size of the starch settling floor required is 36 x 12 m, size of the water tank and second-ary settling tank are 10 and 40 m3, respectively. It was also found that 97 % of the water could be saved through this method of starch separation from starch milk as compared to the conventional method. By following this method of starch separation from the starch milk not only reduces the water consumption but also eliminates the ef-fluent treatment plant theoretically. Computer programme to assist the design for various capacities of the sago in-dustry was also written in C++ language.
■■

VOL.38 NO.3 2007 AGRICULTURAL MECHANIZATION IN ASIA, AFRICA, AND LATIN AMERICA 89
NEWSAgro Reinforces Its Harvesting Pole
Joint venture between AGCO and Laverda to improve positioning in the markets of Europe, Africa and Middle East
Breganze June 25th, 2007. AGCO, the Italian Industrial Group owner of long tradition and great value brands such as Laverda, Landini, Fella, Gallignani, McCormick, Valpadana, Pegoraro, spe-cialized in the production of agricultural machines and equipment has announced officially today the establishment of a 50 % joint venture between Laverda S.p.A., leader of its harvesting pole and owner of Fella and Gallignani shared at 50 %, and AGCO Corporation.
Laverda has been operating since 2004 in close partnership with AGCO sup-plying the Corporation based in Duluth (Georgia) with its top and medium range combines declined in the Massey Fargu-son, Fendt and Challenger brands des-tined to the distribution in the markets of Europe, Africa and Middle East, where they have met a great success thanks to their features of reliability, productivity and profitability.
The very good relationships estab-lished and the good results obtained during these years of cooperation have persuaded the two groups to pursue the
maximum stability in the partnership with the common aim of taking a lead-ing position in the EAME harvesting business.
The partnership agreement ratified today will allow Laverda, the Breganze Company settled in 1873 and since that date fully dedicated to the manufac-turing of agricultural machines and equipments, to associate the expertise acquired in over 50 years of activity in the production of self-propelled com-bine-harvesters with the knowledge of AGCO, enlarging its offer also in those market segments where it is not present today.
The synergy between Laverda and AGCO in terms of research and devel-opment will further increase the rapid-ity in the response to the demand of the market of the Breganze Company, which has always taken the customers’ needs into the maximum cosideration.
Besides Laverda, the joint venture involves also Fella-Werke, Feucht (Ger-many) dedicated to the production of hay and grass machinery, and Gallignani, Russi (RA), dedicated to the production of balers.
This will allow AGCO, as well as the increase of its volumes in the combine market thanks to the machines manu-factured in Breganze, to have a direct access to the remaining products strate-gic for the completion of the offer in the
segment of harvesting machines.Valerio Morra will be in charge as
President of the joint venture. Head-quarters of the joint venture will be in Laverda, at the Breganze plant, where the management is confirmed with all its functions.
All strategies and actions in support of the brand will be carried on in the sign of Laverda.
The Company policy related to the marketing, distribution and sales of the combine-harvesters with Laverda brand will remain unchanged.
“This agreement is the best way to grant the development of the manufac-turing volumes which can actually be effected by Laverda and Fella, since they have the structure, the organization, the men and the means to sustain an important growth” has declared Valerio Morra, President of ARGO.
For further information:Simonetta LambroccoResponsabile Comunicazione e Pub-
bliche RelazioniLaverda S.p.A. - Via F. Laverda, 15/17
- 36042 Breganze (VI)Tel.: + 39(0)445/385305Fax.: + 39(0)445/385593e-mail: simonetta.lambrocco@laverda-
world.com■■
Book ReviewAgroecosystems in a Changing Climate
Authors: Paul C.D. Newton (AgResearch, Palmerston North, New Zealand), R. Andrew Carran (same), Grant R. Ed-wards (Lincoln University, Canterbury, New Zealand), Pascal A. Niklaus (ETH Zurich, Switzerland)
Detailed Description:Agroecosystems in a Changing Cli-
mate considers the consequences of
changes in the atmosphere and climate on the integrity, stability, and productiv-ity of agroecosystems. The book adopts a novel approach by bringing together theoretical contributions from ecolo-gists and the applied interpretations of agriculturalists. Drawing these two ap-proaches together, the book provides the theoretical underpinning that guides sci-entists on what phenomena to look for, looking beyond first-order responses in the creation of sustainable agroecosys-
tems. This unique approach provides an interpretation of ecological insights and general theory, and then relates them to agroecosystem performance.
Each section of the book combines general principles of response with an examination of the applied consequenc-es. The authors cover the supply of re-sources necessary to sustain agriculture in the future and discuss the incidence of pests, weeds, diseases, and their control. They provide an understanding

AGRICULTURAL MECHANIZATION IN ASIA, AFRICA, AND LATIN AMERICA 2007 VOL.38 NO.390
of how the population biology of organ-isms will change and the adaptations that might be possible. The book also explores plant breeding solutions and the capacity for adaptation that exists in plant populations. In addition to the full chapters, the book includes Special Ex-ample chapters that deal in more detail with specific issues.
Presenting a global perspective of cli-mate change effects on agricultural pro-duction, Agroecosystems in a Changing Climate establishes connections be-tween the immediate effects of change and the longer-term processes that will ultimately determine the consequences for agroecosystems and therefore the potential for adaptation.376 pp., Price: $129.95 / £74.99Published: CRC Press / Taylor & Fran-
cis Group, LLC, 6000 Broken Sound Parkway NW, Suite 3000, Boca Raton, FL33487, USA
GIS Applications in Agriculture
Authors: F.J. Pierce (Washington State University, Professor, USA), David Clay (South Dakota State University, Brookings, USA)
Detailed Description:The increased efficiency and profit-
ability that the proper application of technology can provide has made preci-sion agriculture the hottest developing area within traditional agriculture. The first single-source volume to cover GIS applications in agronomy, GIS Appli-cations in Agriculture examines ways that this powerful technology can help farmers produce a greater abundance of crops with more efficiency and at lower costs.
Each chapter describes the nature of a problem, examines the purpose and scope of a GIS application, presents the methods used to develop the application, and then goes on to provide results and offer a conclusion as well as support-ing information. When appropriate, the chapters present the underlying statisti-cal approach for the GIS software that is used. The text also includes a CD-ROM featuring data sets and color maps pro-duced by the use of GIS.
Concentrating more on the approach and less on the specific software, the authors describe the methods used to de-velop an application and discuss limita-
tions to the algorithms and the program-ming code used. They then summarize the application in terms of what it does, how it works, its limitations, and its po-tential uses. The book provides a toolkit for the acquisition, management, and analysis of spatial data throughout the agriculture value chain.224 pp., Price: $119.95 / £68.99Published: CRC Press / Taylor & Fran-
cis Group, LLC, 6000 Broken Sound Parkway NW, Suite 3000, Boca Raton, FL33487, USA
Biological Approaches to Sus-tainable Soil Systems
Authors: Norman Uphoff, Andrew S. Ball, Erick Fernandes, Hans Herren, Olivier Husson, Mark Laing, Cheryl Palm, Jules Pretty and Pedro Sanchez
Detailed Description:Global agriculture is now at the cross-
roads. The Green Revolution of the last century, which helped developing countries meet their food needs for sev-eral decades, is now losing momentum. Rates of growth in food production are now declining, with land and water re-sources becoming scarcer, while world population continues to grow. We need to continue to identify and share the knowledge that will support successful and sustainable agriculture systems in this new century. These depend cru-cially on soil.
Biological Approaches to Sustainable Soil Systems brings together 102 ex-perts from multiple disciplines and 28 countries to report on the science and the innovation going on for sustainable soil-system management. While accept-ing some continuing role for chemical and other external inputs in 21st-century agriculture, this book presents a variety of ways in which crops can be produced more abundantly and more cheaply with lessened dependence on the exogenous resources that have driven the expansion of agriculture in the past.
Including the work of both researchers and practitioners around the world, Bio-logical Approaches to Sustainable Soil Systems.784 pp., Price: $149.95 / £85.00Published: CRC Press / Taylor & Fran-
cis Group, LLC, 6000 Broken Sound Parkway NW, Suite 3000, Boca Raton, FL33487, USA
Machine Elements: Life and De-sign
Authors: Boris M. Klebanov (Beer-Sheva, Israel), David M. Barlam (Ben Gurion University, Beer-Sheva, Israel), Frederic E. Nystrom (Racine, Wiscon-sin, USA)
Detailed Description:Focusing on how a machine “feels”
and behaves while operating, Machine Elements: Life and Design seeks to impart both intellectual and emotional comprehension regarding the “life” of a machine. It presents a detailed descrip-tion of how machines elements function, seeking to form a sympathetic attitude toward the machine and to ensure its well-being through more careful and proper design.
The book is divided into three parts for accessibility and ease of comprehension. The first section is devoted to micro-scopic deformations and displacements both in permanent connections and within the bodies of stressed parts. Top-ics include relative movements in inter-ference fit connections and bolted joints, visual demonstrations and clarifications of the phenomenon of stress concentra-tion, and increasing the load capacity of parts using prior elasto-plastic deforma-tion and surface plastic deformation.
The second part examines machine elements and units. Topics include load capacity calculations of interference f it connections under bending, new considerations about the role of the interference fit in key joints, a detailed examination of bolts loaded by eccentri-cally applied tension forces, resistance of cylindrical roller bearings to axial displacement under load, and a new ap-proach to the choice of fits for rolling contact bearings.
The third section addresses strength calculations and life prediction of ma-chine parts. It includes information on the phenomena of static strength and fatigue’, correlation between calculated and real strength and safety factors; and error migration.440 pp., Price: $129.95 / £74.99Published: CRC Press / Taylor & Fran-
cis Group, LLC, 6000 Broken Sound Parkway NW, Suite 3000, Boca Raton, FL33487, USA
■■

VOL.38 NO.3 2007 AGRICULTURAL MECHANIZATION IN ASIA, AFRICA, AND LATIN AMERICA 91
-AFRICA-Benedict KayomboAssociate Professor of Soil and Water Engineering, Dept. of Agric. Engineering and Land Planning, Botswana College of Agriculture, University of Bo-tswana, Private Bag 0027, Gaborone, BOTSWANA.TEL(+267)-3650125, FAX(+267)-328753E-mail: [email protected]
Mathias Fru FontehAsst. Professor and Head, Dept. of Agric. Engineer-ing, Faculty of Agriculture, University of Dschang, P.O. Box 447, Dschang, West Province, CAMEROONTEL+237-45-1701/1994, FAX+237-45-2173/1932E-mail: [email protected]
Ahmed Abdel Khalek El BeheryAgric Engineering Research Institute, Agricultural Reserch Center, Nadi El-Said St. P.O. Box 256, Dokki 12311, Giza, EGYPT
Ali Mahmoud El HossarySenior Advisor to the Ministry of Agriculture and Chairman of (AGES)-Agengineering Consulting Group, Ministry of Agriculture - P.O.Box 195 Zama-lek 11211 Cairo, EGYPTTEL00-202-335-9304, FAX00-202-3494-132
B. S. PathakProject Manager, Agric. Implements Research and Improvement Centre, Melkassa, ETHIOPIA
Richard Jinks BaniLecturer & Co-ordinator, Agric. Engineering Div., Faculty of Agriculture, University of Ghana, Legon, GHANA
Israel Kofi DjokotoSenior Lecturer, University of Science and Technol-ogy, Kumasi, GHANA
David Kimutaiarap SomeProfessor, Deputy Vice-chancellor. Moi University, P.O. Box: 2405, Eldoret, KENYA
Karim HoumyProfessor and head of the Farm Mechanization Dept., Institute of Agronomy and Velerinary Medi-cine II, Secteur 13 Immeuble 2 Hay Riad, Rabat, MOROCCO, Tel+212-7-68-05-12, Fax+212-7-775801E-mail: [email protected]
Joseph Chukwugotium IgbekaProfessor, Dept. of Agricultural Engineering, Univ. of Ibadan,, Ibadan, NIGERIATEL+234-2-8101100-4, FAX+234-281030118E-mail: [email protected]
E. U. OdigbohProfessor, Agricultural Engg Dept., Faculty of En-gineering, University of Nigeria, Nsukka, Enugu state, NIGERIA, TEL+234-042-771676, FAX042- 770644/771550, E-mail: [email protected]
Kayode C. OniDirector/Chief Executive, National Centre for Agric. Mechanization (NCAM), P.M.B.1525, Ilorin, Kwara State, NIGERIATEL+234-031-224831, FAX+234-031-226257E-mail: [email protected]
N. G. KuyembehAssociate Professor, Njala University Colle, Univer-sity of Sierra Leone, Private Mail Bag, Free Town, SIERRA LEONETEL+249-778620-780045, FAX+249-11-771779
Abdien Hassan AbdounMember of Board, Amin Enterprises Ltd., P.O. Box 1333, Khartoum, SUDAN
Amir Bakheit SaeedAssoc. Professor, Dept. of Agric. Engineering, Fac-ulty of Agriculture, University of Khartoum, 310131 Shambat, SUDAN, TEL+249-11-310131
Abdisalam I. KhatibuNational Prolect Coordinafor and Direcror, FAO Ir-rigated Rice Production, Zanzibar, TANZANIA
Edward A. BaryehProfessor, Africa University, P.O.Box 1320, Mutare, ZIMBABWE
Solomon Tembo52 Goodrington Drive, PO Mabelreign,Sunridge, Harare, ZIMBABWE
-AMERICAS-Hugo Alfredo CetrangoloFull Professor and Director of Food and Agribusi-ness Program Agronomy College Buenos Aires University, Av. San Martin4453, (1417) Capital Fed-
eral, ARGENTINATEL+54-11-4524-8041/93, FAX+54-11-4514-8737/39E-mail: [email protected]
Irenilza de Alencar NääsProfessor, Agricultural Engineering College, UNI-CAMP, Agricultural Construction Dept.,P.O. Box 6011, 13081 -Campinas- S.P.,BRAZILTEL+55-19-7881039, FAX+55-19-7881010E-mail: [email protected]
A. E. GhalyProfessor, Biological Engineering Deparment Dalhousie University, P.O. Box 1000, Halifax, Nova Scotia, B3J2X4, CANADATEL+1-902-494-6014, FAX+1-902-423-2423E-mail: [email protected]
Edmundo J. HetzProfessor, Dept. of Agric. Eng. Univ. of Concepcion, Av. V.Mendez 595, P.O. Box 537, Chillan, CHILETEL+56-42-216333, FAX+56-42-275303E-mail: [email protected]
A. A. ValenzuelaEmeritus Professor, Ag. Eng. Fac., University of Concepcion,Casilla537Chillan, CHILETEL+56-42-223613, FAX+56-42-221167
Roberto AguirreAssociate Professor, National University of Colom-bia, A.A. 237, Palmira, COLOMBIATEL+57-572-2717000, FAX+57-572-2714235E-mail: [email protected]
Omar Ulloa-TorresProfessor, Escuela de Agricultura de la Region, Tropical Humeda(EARTH), Apdo. 4442- 1000, San Jose, COSTA RICA, TEL+506-255-2000, FAX +506-255-2726, E-mail: [email protected]
S. G. Campos MaganaLeader of Agric. Engineering Dept. of the Gulf of Mexico Region of the National Institute of Forestry and Agricultural Research, Apdo. Postal 429. Vera-cruz, Ver. MEXICO
Hipolito Ortiz-LaurelHead of Agric. Engineering and Mechanization Dept./ Postgraduate College, Iturbide 73, Salinas de Hgo, S.L.P., C.P. 78600, MEXICOTEL+52-496-30448, FAX+52-496-30240
B Kayombo M F Fonteh A A KEl Behery
A MEl Hossary
B S Pathak R J Bani I K Djokoto D K Some K Houmy J C Igbeka
E U-Odigboh K C Oni N GKuyembeh
A HAbdoun
A B Saeed A I Khatibu E A Baryeh S Tembo H ACetrangolo
I de A Nääs
A E Ghaly E J Hetz A AValenzuela
R Aguirre O Ulloa-Torres S G CMagana
H Ortiz-Laurel W JChancellor
M R Goyal A KMahapatra
Co-operating Editors

AGRICULTURAL MECHANIZATION IN ASIA, AFRICA, AND LATIN AMERICA 2007 VOL.38 NO.392
William J. ChancellorProfessor Emeritus, Bio. and Agr. Eng. Dept., Univ. of California, Davis, CA, 95616, U.S.A.TEL+1-530-753-4292, FAX+1-530-752-2640E-mail: [email protected]
Megh R. GoyalProf./Agric & Biomedical Engineering, Univer-sity of Puerto Rico, P.O.Box 5984, Mayaguez PR, 006815984, U.S.A., TEL+1-787-265-4702E-mail: [email protected]
Ajit K. MahapatraPresent add: Agric. & Biosystems Eng. Dept., South Dakota State Univ., P.O. Box2120 Brook-ings, SD 57007-1496, U.S.A., TEL605-6885291, FAX 605-6886764, E-mail: [email protected]
-ASIA and OCEANIA-Graeme R. QuickConsulting Enginner, 83 Morrisons Road, Peaches-ter, Queensland, 4519, AUSTRALIA
Shah M. FaroukProfessor (Retd.),Farm Power & Machinery Dept., Bangladesh Agricultural University, Mymensingh 2200, BANGLADESH, TEL+880-91-5695ext.2596, FAX91-55810, E-mail: [email protected]
Daulat HussainDean, Faculty of Agric. Engineering and Tech-nology, Bangladesh Agricultural University, My-mensingh-2202, BANGLADESH, TEL+880-91-52245, FAX91-55810, E-mail: [email protected]
Mohammed A. MazedMember-Director, Bangladesh Agri. Res. Council, Farmgate, Dhaka, BANGLADESHE-mail: [email protected]
Chetem WangchenProgramme Director Agricultural Machinery Centre Ministry of Agriculture Royal Government of Bhutan, Bondey Paro Bhutan 1228, BHUTAN, E-mail: [email protected]
Wang WanjunPast Vice Director and Chief Engineer/Chinese Academy of Agricultural Mechanization Sciences, 1 Beishatan, Beijing, 100083, CHINATEL+86-(0)83-001-6488-2710, FAX001-6488-2710E-mail: [email protected]
Sarath IllangantilekeRegional Representative for South and West
Asia, International Potato Center (CIP), Regional Office for CIP-South & West Asia, IARI (Indian Ag-ric. Res. Institute) Campus, Pusa, New Delhe-12, 110002, INDIA, TEL+91-11-5719601/5731481, FAX./5731481, E-mail: [email protected]
S. M. IlyasDirector, National Academy of Agricultural Re-search Management (NAARM), Rajendranagar, Hyderabad-500030, INDIA, Tel+91-40-24015070, Fax:+91-41-24015912, E-mail: [email protected]
A. M. Michael1/64, Vattekunnam, Methanam Road, Edappally North P.O., Cochin, 682024, Kerala State, S. INDIA
Gajendra SinghProfessor, Vice Chancellor, Doon University 388/2, India Nagar, Dehradun - 248006, INDIATEL+91-989-738-4111, FAX+91-135-320-1920Email: [email protected]
T. P. OjhaDirector General(Engg.) Retd., ICAR, 110, Vineet Kung Akbarpur, Kolar Road, Bhopal, 462 023, INDIATEL+91-755-290045
S. R. VermaProf. of Agr. Eng, & Dean Eng.(Retd), 14, Good Friends Colony, Barewal Road , Via Ayoli Kalan, Lud-hiana 142027 Punjab, INDIA, TEL+91-(0)161-463096E-mail: [email protected]
SoedjatmikoPresident, MMAI(Indonesian Soc. of Agric. Eng. & Agroindustry), Menara Kadin Indonesia Lt.29 Jl. HR. Rasuna Said X-5/2-3 Jakarta, 12940, INDONESIATEL+62-(0)21-9168137/7560544, FAX(0)21-5274485/5274486/7561109
Mansoor Behroozi-LarProfessor, Agr. Machinery, Ph.D, Tehran University Faculty of Agriculture, Karaj, IRANTEL+98-21-8259240, E-mail: [email protected]
Saeid MinaeiAssistant Professor, Dept. of Agr. Machinery Eng., Tarbiat Modarres Univ., P.O.Box 14115-111, Tehran, IRANTEL+9821-6026522-3(office ext.2060, lab ext.2168)FAX+9821-6026524, E-mail: [email protected]
Jun SakaiProfessor Emeritus, Kyushu University, 2-31-1 Chi-haya, Higashi-ku, Fukuoka city, 813, JAPANTEL+81-92-672-2929, FAX+81-92-672-2929E-mail: [email protected]
Bassam A. SnobarProfessor and Vice President, Jordan University of Science and Technology, P.O.Box 3030 Irbid, 22110, JORDAN, TEL+962-2-295111, FAX+962-2-295123E-mail: [email protected]
Chang Joo ChungEmeritus Professor, Seoul National University, Ag-ricutural Engineering Department, College of Agri-culture and Life Sciences, Suwon, 441-744, KOREATEL+82-(0)331-291-8131, FAX+82-(0)331-297-7478E-mail: [email protected]
Chul Choo LeeMailing Address: Rm. 514 Hyundate Goldentel Bld. 76-3 Kwang Jin Ku,Seoul, KOREATEL+82-(0)2-446-3473, FAX+82-(0)2-446-3473E-mail: [email protected]
Muhamad Zohadie BardaieProfessor, Department of Agricultural and Biosys-tems Engineering, University Putra Malaysia, 43400 upm, Serdang, Serdangor, MALAYSIATEL+60-3-89466410Email: [email protected]
Madan P. PariyarConsultant, Rural Development through Selfhelp Promotion Lamjung Project, German Technical Cooperation. P.O. Box 1457, Kathmandu, NEPAL
David Boakye AmpratwumAssociate Professor, Dept.of Bioresource and Agri-cultural Engineering, College of Agriculture, Sultan Qaboos University, P.O. Box 34, Post Code 123, Muscat, Sultanate of Oman, OMANTEL+968-513866, FAX513866E-mail: [email protected]
EITag Seif Eldin Mailling Address: Dept. of Agric. Mechanization, College of Agriculture, P.O. Box 32484, Al-Khod, Sultan Qaboos University, Muscat, Sultanate of Oman, OMAN
Linus U. OperaAssociate Professor, Agricultural Engineering & Postharvest technology, Director, Agricultural Experiment Station, Sultan Qaboos University, Muscat, Sultanate of Oman, OMAN
Allah Ditta ChaudhryProfessor and Dean Faculty of Agric. Engineering and Technology, University of Agriculture, Faisala-bad, PAKISTAN
G R Quick S M Farouk DaoulatHussain
M A Mazed Chetem Wangchen
Wang Wanjun
S Illangantileke S M Ilyas A M Michael
T P Ojha S R Verma Soedjatmiko M Behroozi-Lar
Saeid Minaei
J Sakai B A Snorbar C J Chung C C Lee M ZBardaie
M P Pariyar D BAmpratwum
E S Eldin A DChaudhry
A Q Mughal R ur Rehmen B TDevrajani
N AAbu-Khalaf
Surya NathL U Opera
G Singh
VOL.38 NO.3 2007 AGRICULTURAL MECHANIZATION IN ASIA, AFRICA, AND LATIN AMERICA 93
R PVenturina
A. Q. A. MughalVice Chancellor, Sindh Agriculture University, Tan-dojam, PAKISTAN
Rafiq ur RehmanDirector, Agricultural Mechanization Reserch Insti-tute, P.O. Box No. 416 Multan, PAKISTAN
Bherulal T. DevrajaniProfessor and Chairman, Faculty of Agricultural En-gineering, Sindh Agriculture University, Tandojam, Sindh, PAKISTANTEL+92-2233-5594
Nawaf A. Abu-KhalafEngineer, the Project Directorate in Palestinian Ag-ricultural Ministry, P.O.Box 405, Hebron, PALESTINETelfax: 972-2-2227846/7E-mail: [email protected]
Surya NathAssoci. Prof., Dept. of Agriculture, Papua New Guinea University of Technology, Private Mail Basg, Lae, PAPUA NEW GUINEA, TEL+675-475-5162, FAX473-4477, E-mail: [email protected]
Reynaldo M. LantinProfessor, College of Engineering and Agro-Indus-trial Technology University of the Philippines Los Banos, Laguna 4031, PHILIPPINESTEL+63-(0)49-536-2792, FAX+63-(0)49-536-2873E-mail: [email protected]
Ricardo P. VenturinaPresident & General Manager, Rivelisa publishing House, 215 F, Angeles St. cor Taft Ave. Ext., 1300 Pasay City, Metro Manila,PHILIPPINES
Saleh Abdulrahman Al-suhaibaniProfessor, Agricultural Engineering Dept.,College of Agriculture, King Saud University,P.O. Box 2460 Riyadh 11451, SAUDI ARABIA
Ali Mufarreh Saleh Al-AmriProfessor, Dept. of Agric. Engineering, Colleg of Agricultural and Food Sciences, King Faisal Univer-sity, Al-Ahsa,SAUDI ARABIAE-Mail: [email protected],[email protected]
Sen-Fuh ChangProfessor, Agric.-Machinery Dept. National Taiwan University, Taipei, TAIWAN
Tieng-song PengDeputy Director, Taiwan Agricultural Mechaniza-tion Research and Development Center. FL. 9-6, No. 391 Sinyi Road, Sec. 4, TAIWAN
Suraweth KrishnasreniSenior Expert in Agricultural En-gineering, Depart-ment of Agricul-ture, Chatuchak, Bangkok 10900, Thailand, Tel5792153,5794497,5798520,Ext.124, Fax9405791, E-mail: [email protected]
Surin PhongsupasamitProfessor of Agricultural Engineering, Dept. of Me-chanical Engineering, Faculty of Engineering, Chu-lalongkom University, Phyathai Road, Patumwan, Bangkok 10330, THAILAND
Chanchai RojanasarojResearch and Development Engineer, Dept. of Ag-riculture, Ministry of Agriculture and Cooperatives, Gang-Khen, Bangkok 10900, THAILAND
Vilas M. SalokheProfessor, AFE Program, Asian Institute of Technol-ogy, P.O. Box 4, Klang Luang. Pathumthani 12120, THAILAND, TEL+66-2-5245479, FAX+66-2-5246200E-mail: [email protected]
Yunus PinarProfessor, and Head, Agric. Machinery Dept, Fac-ulty of Agriculture, University of Ondokuz Mayis, Kurupelit, Samsun, TURKEY
Imad HaffarAssociate Professor of Agric. Engineering, Faculty of Agricultural Sciences, United Arab Emirates Univer-sity, Al Ain, P.O. Box 17555, UAE, Tel+971-506436385, E-mail: [email protected]
Nguyen HayAssociate Professor, Dean of Faculty of Engineering, Nonglam University, Linh Trung Ward, Thu Duc Dis-trict, Ho Chi Minh City, VIET NAME-mail: [email protected]
Pham Van LangDirector, Vietnam Institute of Agricultural Engineer-ing, A2-Phuong Mai, Dong Da Hanoi, VIET NAM
Abdulsamad Abdulmalik Hazza,aProfessor and Head of Agricultural Engineering De-partment, Faculty of Agriculture, Sana,a University, P.O.Box 12355, Sana,a YEMEN, Tel+9671-407300, Fax:9671-217711, E-mail: [email protected]
-EUROPE-Anastas Petrov KaloyanovProfessor & Head, Research Laboratory of Farm Mechanization, Higher Institute of Economics, So-fia, BULGARIA
Pavel KicVice-Dean/Technical Faculty, Czech University of Agriculture Prague, 16521 Prague 6-Suchdol, CZECH, Tel+420-2-24383141, Email: [email protected]
Henrik HaveProf. of Agric. Machinery and Mechanization at In-stitute of Agric. Engineering, Royal Veterinan/- and Agricultural University, Agrovej 10DK2630 Tastrup, DENMARK
Joachim MüllerFull Professor at the University Hohenheim, Insti-tute of Agricultural Engineering, Head of Agricul-tural Engineering in the Tropics and Subtropics, University of Hohenheim, 70593 Stuttgart, GERMA-NY, Tel+0711-459-22490, E-mail: joachim.muller@ uni-hohenheim.de
Giuseppe PellizziDirector of the Institute of Agric. Engineering of the University of Milano and Professor of Agric. Machinery and Mechanization, Via G. Celoria, 2-20133 Milano, ITALY, Tel+39-02-503-16871, E-mail: [email protected]
W. B. HoogmoedUniversity Lecturer, Faculty of Lsg Agrarische Bedrii-jfstechnologie, Wangeningen University, Agrotech-nologie en Voedingswetenshappen, Bornsesteeg 59, 6700 AA, Wageningen, P.O.Box 17, NETHERLAND, E-mail: [email protected]
Jan PawlakProfessor, head of the Dept. of Economics and Utilization of Farm Machines at IBMER, Professor at the Univ. of Warmia and Mazury in Olsztyn, Fac. of Tech. Sci., POLAND
Oleg S. MarchenkoProfessor and agricultural engineer, Department Head in All-Russia Research Institute for Mechani-zation in Agriculture (VIM), 1st Institutsky proezd, 5, Moscow 109428, RUSSIA, Tel+7(095)174-8700, Fax+7(095)171-4349, E-mail: [email protected]
John KilgourSenior Lecturer in Farm Machinery Design at Silsoe College, Silsoe Campus, Silsoe, Bedford, MK45 4DT, UK
Milan MartinovFull Professor on Agricultural Machinery, Univer-sity of Novi Sad, Faculty of Engineering, Institute of mechanization and machine design, TRG D. Obra-dovica 6, 21 121 Novi Sad, PF55, YUGOSLAVIA, TEL+ 381-21-350-122(298), E-mail: [email protected]
O SMarchenko
J Kilgour M Martinov
S AAl-Suhaibani
A M SAl-Amri
S F Chang T S Peng S Krishnasreni S Phong-supasamit
C Rojanasaroj V M Salokhe
Y Pinar I Haffar P V Lang A A Hazza,a A P
KaloyanovP Kic H Have J Müller G Pellizzi
Jan Pawlak
N Hay
R M Lantin
W BHoogmoed

AGRICULTURAL MECHANIZATION IN ASIA, AFRICA, AND LATIN AMERICA 2007 VOL.38 NO.394
Back Issues
AGRICULTURAL MECHANIZATION IN ASIA, AFRICA AND LATIN AMERICA
(Vol.36, No.2, Autumn, 2005)A Mathematical Model for Predicting Output
Capacity of Selected Stationary Grain Threshers (V. I. O. Ndirika) .........................
Study on the Development of Agricultural Machines for Small-Scale Farmers Pt. 2, “Applied Technology to the Improvement of an Animal-Drawn Plow for Morocco and Africa” (Toshiyuki Tsujimoto, Hai Saku-rai, Koichi Hashiguchi, Eiji Inoue) ..............
Development an Indsutrial Yam Peeler (A. C. Ukatu) ..........................................................
Design and Development of a Low-Cost Po-tato Grader (K. C. Roy, M. A. Wohab, A. D. M. Gulam Mustafa) .................................
Extensive Review of Crop Drying and Dri-ers Developed in India (A. Alam, Harpal Singh, Ranjan Mohnot, H. L. Kushwaha) ...
Insect Inhibitive Properties of Some Consum-able Local Plant Materials on Grains in Storage (D. S. Zibokere) ...............................
Evaluation and Performance of Raw Mango Grader (Syed Zameer Hussain, S. C. Man-dhar, S. Javare Gowda) .................................
Engineering the Crop Establishment System for Paddy Wet Seeding (Eden C. Gage-lonia, B. D. Tadeo, E. G. Bautista, J. C. Cordero, J. A. Damian, W. B. Collado, H. Monobe, S. Ishihara, N. Sawamura, M. Daikoku, R. Otani) .......................................
Performance of Cage Wheel with Opposing Circumferential Lugs amd Normal Cage Wheel in Wet Clay Soil (S. Soekarno, V. M. Salokhe) ...................................................
Fabrication and Testing of Tomato Seed Ex-tractor (R. Kailappan, Parveen Kasur Baig, N. Varadharaju, K. Appavu, V. Krishna-samy) ............................................................
Computer-Aided Analysis of Forces Acting on a Trailed Plough (Ying Yibin, Zhao Yun, Jin Juanqin) ..........................................
The Effects of Some Operational Parameters on Potato Planter’s Performance (Ebubekir Altuntas) .......................................................
The Use of Hot Air from Room Type Coolers for Drying Agricultural Products (Turhan Koyuncu, Yunas Pinar) ................................
Effect of Mechanization level and Crop Rota-tion on Yield Energy Requirements (S.K. Dash, D.K. Das) ............................................
Simple Quality Evaluation of Chili Pepper Based on Continuous Weight Measure-ment During Dehydration Process (T.W. Widodo, H. Ishida, J. Tatsuno, K, Tajima, E. Sakaguchi, K. Tamaki) ............................
◇ ◇ ◇
AGRICULTURAL MECHANIZATION IN ASIA, AFRICA AND LATIN AMERICA
(Vol.37, No.1, Winter, 2006)Evaluation of Solar Drying for Post Harvest
Curing of Turmeric: Curcuma longa L. (J. John Gunasekar, S. Kaleemullah, P. Do-
raisamy, S. Kamaraj) ....................................Front Wheel Drive Effect on the Performance
of the Agricultural Tractor (H. Ortiz-Laurel, D. Rössel, J.G. Hermosilo-Nieto) ...
Development and Performance Evaluation of a Test Rig for Mechanical Metering of Sunf lower Seeds (Sukhbir Singh, D. N. Sharama, Jagvir Dixit, Dinesh Kumar Vasta) ............................................................
Design Development and Performance Evalu-ation of a Saw Cylinder Cleaner for Me-chanically Picked Cotton (S. K. Shukla, P. G. Patil, V. G. Arude) ...................................
Design Development and Performance Evalu-ation of Portable Cotton Ginning Machines (P. G. Patil, V. G. Arude, S. K. Shukla) .......
Design and Development of Power Operated Roller Type Lac Scraper (Niranjan Prased, K. K. Kumar, S. K. Panday, M. L. Bhagat) .
The Impact of Power Tillers on Small Farm Productivity and Employment in Bangla-desh (R. I. Sarker, D. Barton) ......................
Field Performance Evaluation od Power Tiller Operated Air Assisted Spraying System (A. G. Powar, V. V. Aware, S. K. Jain, A. P. Jaiswal) .........................................................
Effect of Cone Angle on Droplet Spectrum of Hollow Cone Hydraulic Nozzles (S. K. Jain, K. G. Dhande, V. V. Aware, A. P. Jaiswal) .........................................................
Feasibility of Using Yield Monitors for the Development of Soil Management Maps (Jay Radhakrishnan, V. Anbumozhi, Rob-ert H. Hill, Raymond J. Miller) ...................
Improving Whole Kernel Recoverly in Ca-shew Nut Processing Specific to Nigeria Nuts (D. Balasubramanian) .........................
Processing Factor Affecting the Yield and Physicochemical Properties of Starches from Cassava Chips and Flour (O. V. Olo-mo, O. O. Ajibola) .........................................
Influence of Seeding Depth and Compaction on Germination (P. R. Jayan, V. J. F. Ku-mar, C. Divaker Durairaj) ............................
Testing, Evaluation and Modification of Man-ual Coiler for Drip Lateral (S. S. Taley, S. M. Bhende, V. P. Tale) ..................................
Single Hydrocyclone for Cassava Starch Milk (A. Manickavasagan, K. Thangavel) ...........
Utilization Pattern of Power Tillers in Tamil Nadu (B. Shridar, P. K. Padmanathan, R. Manian) ........................................................
◇ ◇ ◇
AGRICULTURAL MECHANIZATION IN ASIA, AFRICA AND LATIN AMERICA
(Vol.37, No.2, Spring, 2006)Perfomance Evaluation of Bullock Drawn
Puddlers (S. K. Dash, D. K. Das).................Design of a Knapsack Sprayer for Local Fa-
blication (R. F. Orge, R. B. Benito) .............Current and Future Trends and Constraints in
Iranian Agricultural Mechanization (Ah-mad Tabatabaeefar, Ali Hajeiahmad) .........
Comparative Evaluation of the Performance
of Intermadiate Agricultural Processing Technologies with Traditional Processing Techniques for Cereal Crops in South Af-rica (V. I. O. Ndirika, A. J. Buys) ................
Computer-Aided Design of Extended Oc-tagonal Ring Transducer for Agricultural Implements (H. Raheman, R. K. Sahu).......
Optimization of Seed Rate of Direct Rice Seeder as Influenced by Machine and Op-erational Parameters (S. S. Sivakumar, R. Manian, K. Kathirvel) ..................................
Reliability Analysis of Different Makes of Power Tillers (B. Shridar, P. K. Padmana-than, R. Manian) ...........................................
Design and Development of a Two-Raw Saf-fron Bulb Planter (Mohammad-H. Saiedi Rad) ..............................................................
Determination of the Optimum Moisture Contents for Shelling Maize Using Local Shellers (I. K. Tastra, Erliana Ginting, Richard Merx) ..............................................
The Influence of Various Factors on Tractor Selection (Ali Aybek, Ismet Boz) ................
Effect of Impeller Materials on Centrifugal Pump Characteristics (Bahattin Akdemir, Birol kayisoglu, Senel Kocoglu) ..................
Performance Evaluation of a Safflower Har-vester (Devanand Maski, T. Guruswamy) ..
Semi-Automatic VRT-Based Fertilization System Utilizing GPS (Moustafa A. Fadel, Ahmad El-Mowafy, Abdul Elghaffar Jo-maa) ..............................................................
The Effect of Dilution Volume, Water Tem-perature and Pressing Time on Oil Yield from Thevetia Kernel during Extraction (A. F. Alonge, A. M. Olaniyan) ...................
Postharvest Losses of Tomatoes in Transit (R. J. Bani, M. N. Josiah, E. Y. Kra) ..................
The Present State of Farm Machinery Indus-try (Shin-Norinsha Co., Ltd) ........................
◇ ◇ ◇
AGRICULTURAL MECHANIZATION IN ASIA, AFRICA AND LATIN AMERICA
(Vol.37, No.3, Summer, 2006)Optimisation of Machine Parameters of Pnue-
matic Knapsack Cotton Pikker (K. Ran-gasamy, M. Muthamilselvan, C. Divaker Durairaj) .......................................................
Tractor and Implement Ownership and Uti-lization of Haryana (Sandeep Yadav, S. Kumar Lohan) ..............................................
Study on Different Tillage Treatments for Rice-Residue Incorporation and its Effect on Wheat Yield in Tarai Region of Ut-taranchal (T. P. Singh, Jayant Singh, Raj Kumar) .........................................................
A Comparative Study on the Crop Establish-ment Technologies for Lowland Rice (T. Pandiarajan, U. Solaiappan, K. Rubapathi)
Design of Tractor Operated Rotary Cultivator - a Computer Simulation (H. Raheman, R. K. Sahu) ........................................................
Machine-Crop Parameters Affecting Per-formance of an Axial-Flow Soya Been
(Vol.36, No.2, Autumn, 2005-)
9
14
21
28
32
43
46
49
55
62
67
71
75
80
84
9
14
18
25
30
35
38
46
51
54
58
65
70
75
80
85
9
12
17
24
29
34
42
48
51
58
62
68
72
79
84
87
9
15
18
25
27
VOL.38 NO.3 2007 AGRICULTURAL MECHANIZATION IN ASIA, AFRICA, AND LATIN AMERICA 95
Thresher (Anusorn Vejasit, Vilas M. Sa-lokhe) ............................................................
Prospects and Problems of Power Tillers in Selected Districts of North Eastern Hilly Region in India - a Case Study (E. V. Thomas, C. S. Sahay, K. K. Satapathy) .......
Design and Development of Cylinder Type Cotton Pre-Cleaner (P. G. Patil, V. G. Arude, G. R. Anap) ......................................
The Effect of a Fogging System on Sensible and Latent Heat Transfer in a Rose Green-house (H. H. Öztürk) ....................................
Evaluation of Wheat Bed Planting System in Irrigated Vertisols of Sudan (A. W. Ad-belhadi, S. E. A. El Awad, M. A. Bashir, Takeshi Hata) ...............................................
Subsoiling - a Strategy to Combat Water Scarcity and Enhanced Productivity of Groundnut Crop (K. K. Jain, V. R. Vaga-dia, L. P. Singh, A. H. Memon) ...................
Evaluation of Practical Training in Uganda’s Agricultural Engineering Carriculum (W. S. Kisaalita, J. B. Kawongolo, J. S. Kibalama) .....................................................
Performance Evaluation of a Tractor-Operat-ed Sugarcane Harvester (H. M. Al Sharief, M. A. Haque, N. A. Aviara) .........................
Role of Computers in Eco-Friendly and Sus-tainable Agriculture of the 21th Century (Madan K. Jha, V. M. Salokhe, Satish K. Jain) ..............................................................
◇ ◇ ◇
AGRICULTURAL MECHANIZATION IN ASIA, AFRICA AND LATIN AMERICA
(Vol.37, No.4, Autumn, 2006)Potential of Farm Mechanization in Jammu
and Kashmir State of India- a Review (Jag-vir Dixit, A. S. Jeena, N. C. Shahi, Tahir Wahid) ..........................................................
Case Study in the Conversion of Fired-Wood Fuel to other Suitable ones in the Rural Areas of Vietnam (Nguyen Hay, Le Quang Giang) ...........................................................
Establishment and Performance of an Indege-neous Small Scale Rice Processing Plant in Nigeria (Gbabo Agidi)..................................
Evaluation of Soil-Water Conservation Till-age Systems for Communal Farmers in the Eastern Cape, South Africe (O. T. Mandir-ingana, M. Mabi, T. E. Simalenga) ..............
Recent Developments in Sugarcane Mechani-sation in India (M. P. Sharma, S. R. Misra, Ashutosh Mishra) .........................................
Performance Efficiency of an Active Evapo-rative Cooling System for the Storage of Fruits and Vegetables in a Semi Arid Envi-ronment (Adam U. Dzivama, J. C. Igbeka, I. Audu) .........................................................
Inspection of Watermelon Maturity by Test-ing Transmitting Velocity of Acoustic Wave (Rao Xiuqin, Ying Yibin) ..................
Development and Testing of a Chilli Seed Ex-tractor (M. Balakrishnan, V. Thirupathi, V. V. Sree Narayanan) .......................................
Design and Fabrication of a Small-Scale Fruit Picker of Adjustable Height (Mohamad I. Al-Widyan, Hind M. Al-Qutob, Ahmad H. Hajeer) ..........................................................
Non Polluting Pestcide Application Window for Fruit Orchards in South Central Chile
32
39
46
52
62
68
71
79
85
9
15
21
27
33
36
42
46
49
(Edmundo J. Hetz, Fernando A. Venegas, Marco A. Lopez)...........................................
Performance Evaluation of an Evaporative Cooling System for Fruits and Vegitable Storage in the Tropics (F. A. Babarinsa) .....
Development and Testing of a Tomato Pulper Cum Straner (V. Thirupathi, R. Viswana-than, K. Thangavel) ......................................
Comparative Feasibility Analysis of Alterna-tive Renewable Energy Sources for Small Milk Cooling Plants of Southwestern Uganda) ........................................................
Development of Simple Pulper for Leaves of Green Plant (Julius K. Tangka) ....................
Constrains and Prospects of Agricultural Mechanisation in Samoa (Md. Wali Ullah)
Design and Development of an Off-Set Ro-tary Cultivator for Use with a Two-Wheel Tractor for Fruit Tree Cultivation (A. Sena-narong, K. Wannaronk) ................................
◇ ◇ ◇
AGRICULTURAL MECHANIZATION IN ASIA, AFRICA AND LATIN AMERICA
(Vol.38, No.1, Winter, 2007)The Evaluation of Performance and Energy
Usage in Submersible Deep Well irrigation Pumping Plants (Sedat Çalisir) ...................
Status of Farm Mechanization in Nalanda District of Bihar (V. B. Shambhu, R. B. Ram) .............................................................
Effect of Puddling on Physical Prosperities of Soil and Rice Yield (B. K. Hehera, B. P. Varshney, S. Swain)......................................
Ground Contact Pressure and Soil Sedimen-tation Period Affecting Transplanter Sink-age and its Performance (B. K. Hehera, B. P. Varshney, S. Swain) ..................................
Development of a Reinforced Mud Silo (A. F. Alonge, A. A. Opeloyeru) ............................
Current Status, Constraints and Potentiality of Agricultural Mechanization in Fiji (M. W. Ullah, S. Anad) .......................................
Performance of some Pneumatic Tires Used in Camel Carts on Sandy Terrain (Ghan-shyam Tiwari, Ajay Kumar Sharma, K. P. Pandey) .........................................................
Feasibility of Collecting Ambient Air Mois-ture by Forced Condensation (Hamid Al-Jalil, Jumah Amayreh, Mohamad Al- Widyan) ........................................................
Energy Cost of Riding and Walking Type Power Tillers (Binisam, K. Kathirvel, R. Manian, T. Senthikumar) .............................
Vibration Mapping of Walking and Riding Type Power Tillers (K. Kathirvel, Binisam, R. Manian, T. Senthikumar) ........................
Oman Traditional Farms: Changes and Im-provement of Farms in Oman (Ahmed Al-Marshudi) .....................................................
Prospects of Maize Cultivation Mechaniza-tion in Hills of Himachal Pradesh (Sukhbir Singh, Dinesh Kumar Vatsa) .......................
Farm Mechanization in Andaman and Nico-bar Island (M. Din, P. S. Deshmukh, N. Ravisankar, S. G. Choudhuri) .....................
Current Status of Animal traction in Mexico (H. Ortiz-Laurel, D. Rössel) ........................
◇ ◇ ◇
52
60
66
69
76
81
87
9
18
23
29
34
39
46
51
55
61
68
74
78
83
AGRICULTURAL MECHANIZATION IN ASIA, AFRICA AND LATIN AMERICA
(Vol.38, No.2, Spring, 2007)Noise Levels in Indian Cotton Gins (V. G.
Arude) ..........................................................Evaluation of Hydraulic Energy Nozzels Suit-
able for Orchard Spraying (T. Senthilku-mar, V. J. F. Kumar) ......................................
An Innovative Vertical Axial-flow Threshing Machine Developed in China (Ji Ma) .........
Storage Stability of Selected Agricultural Grains (E. S. A. Ajisegiri, P. A. Idah) .........
Design of Tool Carrier for Tillage Studies of Disc in Field Conditions (B. K. Yadav, In-dra Mani, J. S. Panwar) ................................
Design, Development and Evaluation of Seed Cum Fertilizer Drill (Ajay Kumar Verma, M. L. Dewangan) ..........................................
Tillage Effect on Yield, Quality, Management and Cost of Sugarbeet (Koc Mehmet Tu-grul, Ilknur Dursun) .....................................
Potential for No-Tillage Agricultural in the Pandamatenga Vertisols of Botswana (M. Tepela, B. Kayombo, F. Pule-Meulenberg) .
Development and Performance Test of a La-ser Controlled Land Levelling Machine (Lin Jianhan, Liu Gang, Wang Maohua, Si Yongsheng, Lv Qingfei, Yang Yunuo) ........
Chikpea Threshing Efficiency and Energy Cunsumption for Different Beater-Con-trbeater Combinations (Turhan Koyuncu, Erkut Peksen, Abdullah Sessiz, Yunus Pinar) ............................................................
Rotally Tiller Blade Surface Development (Varinder Singh, D. S. Wadhwa) .................
Present Status and Future Scope of Mechani-zation of Horticultural Crops in Mountais (Sukhbir Singh, Dinesh Kumar Vasta, S. K. Upadhaya) ................................................
Development of Solar Cabinet Dryer for Dates (D. B. Ampratwum, A. S. S. Dorvo, I. Haffer) ........................................................
Mechanical Consideration for Design and Development of Furrow Openers for Seed Cum Fertilizer Drill (Ajay Kumar Verma, M. L. Dewangan, V. V. Singh, Vineet Das)
Performance Evaluation of a Yum (Dioscorea spp.) Harvester (Issac N. Itodo, Joakim O. Daudu) ..........................................................
■■
9
13
18
23
29
33
38
42
48
53
58
63
69
74
79
AGRICULTURAL MECHANIZATION IN ASIA, AFRICA, AND LATIN AMERICA 2007 VOL.38 NO.396
are written in the English language;are relevant: to the promotion of agricultural mecha-nization, particularly for the developing countries;have not been previously published elsewhere, or, if previously published are supported by a copyright permission;deal with practical and adoptable innovations by, small farmers with a minimum of complicated for-mulas, theories and schematic diagrams;have a 50 to 100-word abstract, preferably preceding the main body of the article;are printed, double-spaced, under 3,000 words (ap-proximately equivalent to 6 pages of AMA-size pa-per) ; and those thatart: supported by authentic sources, reference or bib-liography.written on floppy disc or CD-R
As a rule, articles that are not chosen for AMA pub-lication are not returned unless the writer(s) asks for their return and are covered with adequate postage stamps. At the earliest time possible, the writer(s) is advised whether the article is rejected or accepted.When an article is accepted but requires revision/modification, the details will be indicated in the re-turn reply from the AMA Chief Editor in which case such revision/modification must be completed and returned to AMA within three months from the date of receipt from the Editorial Staff."The AMA does not pay for articles published. How-ever, the writers are given collectively 5 free copies (one copy air-mailed and 4 copies sent by surface/sea mail) of the AMA issue wherein their articles are published. In addition, a single writer is given 25 off-prints of the article and plural writers are given 35 off-prints (also sent by surface/sea mail)"Complimentary copies: Following the publishing, three successive issue are sent to the author(s).
Articles for publication (original and one-copy) must be sent to AMA through the Co-operating Editor in the country where the article originates. (Please refer to the names and addresses of Co-operating Editors in any issue of the AMA). However, in the absence of any Co-operating Editor, the article may be sent directly to the AMA Chief Editor in Tokyo.Contributors of articles for the AMA for the first time are required to attach a passport size ID photograph (black and white print preferred) to the article. The same applies to those who have contributed articles three years earlier. In either case, ID photographs
Criteria for Article SelectionPriority in the selection of article for publication is given
to those that –a.b.
c.
d.
e.
f.
g.
h.
Rejected/Accepted Articlesa.
b.
c.
d.
Procedurea.
b.
INSTRUCTIONS TO AMA CONTRIBUTORSThe Editorial Staff of the AMA requests of articles for publication to observe the following editorial
policy and guidelines in order to improve communication and to facilitate the editorial process:
taken within the last 6 months are preferred.The article must bear the writer(s) name, title/designation, office/organization, nationality and com-plete mailing address.
Article must be sent on 3.5 inch floppy disk or CD-R with MS DOS format (e.g. Word Perfect, Word for DOS, Word for Windows... Absolutely necessary TEXT FORMAT) along with two printed copy (A4).The data for graphs and the black & white photo-graphs must be enclosed with the article.Whether the article is a technical or popular contribu-tion, lecture, research result, thesis or special report, the format must contain the following features:(i) brief and appropriate title;(ii) the writer(s) name, designation/title, office/organization; and mailing address;(iii) an abstract following ii) above;(iv) body proper (text/discussion);(v) conclusion/recommendation; and a(vi) bibliographyThe printed copy must be numbered (Arabic nu-meral) successively at the top center whereas the disc copy pages should not be number. Tables, graphs and diagrams must likewise be numbered. Table numbers must precede table titles, e.g., "Table 1. Rate of Seed-ing per Hectare". Such table number and title must be typed at the top center of the table. On the other hand, graphs, diagrams, maps and photographs are considered figures in which case the captions must be indicated below the figure and preceded by num-ber, e.g., "Figure 1. View of the Farm Buildings".The data for the graph must also be included. (e.g. EXCEL for Windows)Tables and figures must be preceded by texts or discussions. Inclusion of such tables and figures not otherwise referred to in the text/discussion must be avoided.Tables must be typed clearly without vertical lines or partitions. Horizontal lines must be drawn only to contain the sub-title heads of columns and at the bot-tom of the table.Express measurements in the metric system and crop yields in metric tons per hectare (t/ha) and smaller units in kilogram or gram (kg/plot or g/row).Indicate by footnotes or legends any abbreviations or symbols used in tables or figures.Convert national currencies in US dollars and use the later consistently.Round off numbers, if possible, to one or two deci-mal units, e.g., 45.5 kg/ha instead of 45.4762 kg/ha.When numbers must start a sentence, such numbers must be written in words, e.g., Forty-five workers..., or Five tractors..."instead of 45 workers..., or, 5 trac-tors.
c.
Format/Style Guidancea.
b.
c.
d.
e.
f.
g.
h.
i.
j.
k.
l.