1 Soil Moisture Active Passive (SMAP) Project Algorithm Theoretical Basis Document SMAP L1B Radiometer Brightness Temperature Data Product: L1B_TB (Includes L1A and L1B) Rev. B Signatures on file: PREPARED BY: Jeffrey Piepmeier, NASA GSFC Date SMAP Instrument Scientist Algorithm Development Team Lead for L1B Radiometer Data Product Priscilla Mohammed, NASA GSFC Date SMAP Algorithm Development Team for L1B Radiometer Data Product Giovanni De Amici, NASA GSFC Date SMAP Algorithm Development Team for L1B Radiometer Data Product Edward Kim, NASA GSFC Date SMAP Algorithm Development Team for L1B Radiometer Data Product Jinzheng Peng, NASA GSFC Date SMAP Algorithm Development Team for L1B Radiometer Data Product Christopher Ruf, University of Michigan Date SMAP Algorithm Development Team for L1B Radiometer Data Product https://ntrs.nasa.gov/search.jsp?R=20160003317 2018-07-30T05:54:26+00:00Z

Welcome message from author
This document is posted to help you gain knowledge. Please leave a comment to let me know what you think about it! Share it to your friends and learn new things together.
Transcript
1
Soil Moisture Active Passive (SMAP) Project
Algorithm Theoretical Basis Document
SMAP L1B Radiometer Brightness Temperature Data Product:
L1B_TB (Includes L1A and L1B)
Rev. B
Signatures on file: PREPARED BY: Jeffrey Piepmeier, NASA GSFC Date SMAP Instrument Scientist Algorithm Development Team Lead for L1B Radiometer Data Product Priscilla Mohammed, NASA GSFC Date SMAP Algorithm Development Team for L1B Radiometer Data Product Giovanni De Amici, NASA GSFC Date SMAP Algorithm Development Team for L1B Radiometer Data Product Edward Kim, NASA GSFC Date SMAP Algorithm Development Team for L1B Radiometer Data Product Jinzheng Peng, NASA GSFC Date SMAP Algorithm Development Team for L1B Radiometer Data Product Christopher Ruf, University of Michigan Date SMAP Algorithm Development Team for L1B Radiometer Data Product
https://ntrs.nasa.gov/search.jsp?R=20160003317 2018-07-30T05:54:26+00:00Z
2
APPROVED BY: Maher Hanna, JPL Date SMAP Science Data System Manager Simon Yueh, JPL Date SMAP Project Scientist Dara Entekhabi, MIT Date SMAP Science Team Leader Paper copies of this document may not be current and should not be relied on for official purposes. The current version is in the Product Data Management System (PDMS): https://pdms.jpl.nasa.gov/ February 2016 GSFC SMAP-ALGMS-RPT-0026 Rev-B

3
Page intentionally left blank for pasting in the electronic approval/signature screen from PDMS
4
Contents1 Introduction ............................................................................................................................. 10
2 Overview and Background ..................................................................................................... 10
2.1 Product/Algorithm Objectives ......................................................................................... 10
2.2 Historical Perspective ...................................................................................................... 11
2.3 Background and Science Objectives ................................................................................ 12
2.4 Measurement Approach ................................................................................................... 12
3 Instrument Description ............................................................................................................ 16
4 Forward Model (TB à TA) ..................................................................................................... 23
4.1 Brightness Temperature Forward Model ......................................................................... 23
4.2 Radiometer System Forward Model ................................................................................ 26
4.2.1 Signal Through a Lossy Component ......................................................................... 26
4.2.2 Impedance Mismatch ................................................................................................ 27
4.2.3 Feed Network Lumped Loss Model ......................................................................... 28
4.2.4 Forward Model to 𝐓𝐀′ ........................................................................................... 29
4.2.5 Forward Model to 𝐓𝐀′′ ....................................................................................... 30
4.2.6 Forward Model to 𝐓𝐑𝐅𝐄 .......................................................................................... 30
4.2.7 Radiometer Electronics Model ................................................................................. 30
5 Calibration Algorithm ............................................................................................................. 32
5.1 L1B_TB Algorithm Flow ................................................................................................ 32
5.2 Level 1A Product ............................................................................................................. 32
5.3 Geolocation and Pointing ................................................................................................. 34
5.3.1 Radiometer geolocation and radar geolocation compatibility .................................. 36
5.4 Nonlinearity Correction ................................................................................................... 36
5.5 Calibration Coefficients Computation ............................................................................. 37
5.6 Radiometric Calibration ................................................................................................... 37
5.6.1 Horizontal and Vertical Channels ............................................................................. 38
5.6.2 Third and Fourth Stokes Parameters ......................................................................... 40
5.7 Radio Frequency Interference (RFI) ................................................................................ 42
5.7.1 RFI Sources ............................................................................................................... 42
5.8 RFI Detection Algorithm Theory ..................................................................................... 43
5
5.8.1 Pulse or Time Domain Detection .............................................................................. 43
5.8.2 Cross Frequency Detection ....................................................................................... 43
5.8.3 Kurtosis Detection .................................................................................................... 44
5.8.4 Polarimetric detection ............................................................................................... 45
5.8.5 RFI Model ................................................................................................................. 45
5.8.6 FAR and PD of Detection Algorithms ...................................................................... 49
5.8.7 Area Under Curve (AUC) Parameterization ............................................................. 50
5.9 Detection Algorithms ....................................................................................................... 52
5.9.1 Time domain RFI detection ...................................................................................... 52
5.9.2 Cross-frequency RFI detection ................................................................................. 53
5.9.3 Kurtosis Detection .................................................................................................... 54
5.9.4 T3 and T4 RFI detection ............................................................................................ 56
5.10 RFI Removal and Footprint Averaging ......................................................................... 57
5.10.1 Algorithm Implementation Details ......................................................................... 57
5.10.2 Detection Algorithm ............................................................................................... 57
5.10.3 Mitigation Algorithm .............................................................................................. 58
5.10.4 RFI Flags ................................................................................................................. 59
5.11 RFI Detection and Removal from Calibration Data ...................................................... 59
5.12 Antenna Pattern Correction ............................................................................................ 60
5.12.1 Solar flux processing ............................................................................................... 62
5.12.2 Direct Sun Contribution .......................................................................................... 64
5.12.3 Reflected Sun Contribution ..................................................................................... 65
5.12.4 Direct Moon Contribution ....................................................................................... 68
5.12.5 Reflected Moon Contribution ................................................................................. 70
5.12.6 Direct Galaxy Contribution ..................................................................................... 72
5.12.7 Reflected Galaxy Contribution ............................................................................... 73
5.12.8 Reflector Mesh Self Emission Correction .............................................................. 74
5.12.9 Earth Sidelobe Correction ....................................................................................... 75
5.13 Faraday Rotation Correction .......................................................................................... 76
5.14 Atmospheric Correction ................................................................................................. 77
6 Orbital Simulator .................................................................................................................... 79

6
6.1 Number of antenna beams ............................................................................................... 79
6.2 Conical scan ..................................................................................................................... 79
6.3 Antenna pattern ................................................................................................................ 79
6.4 Land focus ........................................................................................................................ 79
6.5 Atmosphere model ........................................................................................................... 79
6.6 Ancillary data ................................................................................................................... 80
7 References ............................................................................................................................... 81

7
Acronyms
µs – microseconds AMR – Advanced Microwave Radiometer APC – Antenna Pattern Correction ATBD – Algorithm Theoretical Basis Document AUC – Area Under Curve CMB – Cosmic Microwave Background CNS – Correlated Noise Source CW – Continuous Wave CSC – Cold Sky Calibration DL – Dicke Load DOY – Day of Year EESS – Earth Exploration Satellite Service EFOV – Effective Field of View EIA – Earth Incidence Angle EOS – Earth Observing System ESSP – Earth System Science Pathfinder FAR – False Alarm Rate FPGA – Field-Programmable Gate Array GDS – Ground Data System GSFC – Goddard Space Flight Center IFOV – Instantaneous Field of View IGRF – International Geomagnetic Reference Field INSF – Instrument-Fixed Coordinates System IRI – International Reference Ionosphere JPL – Jet Propulsion Laboratory MEM – Microwave Emission Model MPD – Maximum Probability of Detection ms – Milliseconds NAIF - Navigation and Ancillary Information Facility NASA – National Aeronautics and Space Administration NCEP – National Centers for Environmental Prediction NCCS – NASA Center for Climate Simulation NCDC – National Climatic Data Center NEDT, NEΔT – Noise Equivalent Delta Temperature NEΔk – Noise Equivalent Delta kurtosis NOAA – National Oceanic and Atmospheric Administration NRC – National Research Council OFDM – Orthogonal frequency-division multiplexing OMT – Ortho Mode Transducer
8
OOB – Out Of Band PD – Probability of Detection pdf – probability density function PI – Principal Investigator PRF – Pulse Repetition Frequency PRI – Pulse Repetition Interval RA – Right Ascension RBE – RF Back End RDE – Radiometer Digital Electronics RFE – Radiometer Front End RFI – Radio Frequency Interference RMS – Root Mean Square ROC – Receiver Operating Curve QPSK – Quadrature Phase Shift Keying SC – Spacecraft Coordinates System SMAP – Soil Moisture Active Passive SMAPVEX08 – Soil Moisture Active Passive Validation Experiment 2008 SMOS – Soil Moisture and Ocean Salinity S-NPP – Suomi National Polar-orbiting Partnership SPICE – Spacecraft ephemeris, Planet, satellite, comet, or asteroid ephemerides, Instrument description kernel, Pointing kernel, Events kernel SSS – Sea Surface Salinity SST – Sea Surface Temperature TBC – To Be Confirmed TBD – To Be Determined TBV – To Be Verified TEC – Total Electron Content TOA – Top of the Atmosphere TOI – Top of Ionosphere TSFE – Temperature Sensitive Front-End USGS – United States Geological Survey WGS84 – World Geodetic System 84

9
Internal Reference Documents
SMAP Level 1A Radiometer Product Specification Document, GSFC-SMAP-ALGMS-SPEC-0034 and JPL D-92340 SMAP Level 1B_TB Product Specification Document, GSFC-SMAP-ALGMS-SPEC-0035 and JPL D-92339 SMAP Radiometer Error Budget Document, JPL D-61632 SMAP Radiometer GSFC Pre-Launch Calibration Plan, GSFC-SMAP-I&T-PLAN-0013
SMAP Level 1 Data Products Calibration and Validation Plan, JPL D-79462
10
1 Introduction The purpose of the Soil Moisture Active Passive (SMAP) radiometer calibration algorithm is to convert Level 0 (L0) radiometer digital counts data into calibrated estimates of brightness temperatures referenced to the Earth's surface within the main beam. The algorithm theory in most respects is similar to what has been developed and implemented for decades for other satellite radiometers; however, SMAP includes two key features heretofore absent from most satellite borne radiometers: radio frequency interference (RFI) detection and mitigation, and measurement of the third and fourth Stokes parameters using digital correlation.
The purpose of this document is to describe the SMAP radiometer and forward model, explain the SMAP calibration algorithm, including approximations, errors, and biases, provide all necessary equations for implementing the calibration algorithm and detail the RFI detection and mitigation process.
Section 2 provides a summary of algorithm objectives and driving requirements. Section 3 is a description of the instrument and Section 4 covers the forward models, upon which the algorithm is based. Section 5 gives the retrieval algorithm and theory. Section 6 describes the orbit simulator, which implements the forward model and is the key for deriving antenna pattern correction coefficients and testing the overall algorithm.
2 Overview and Background
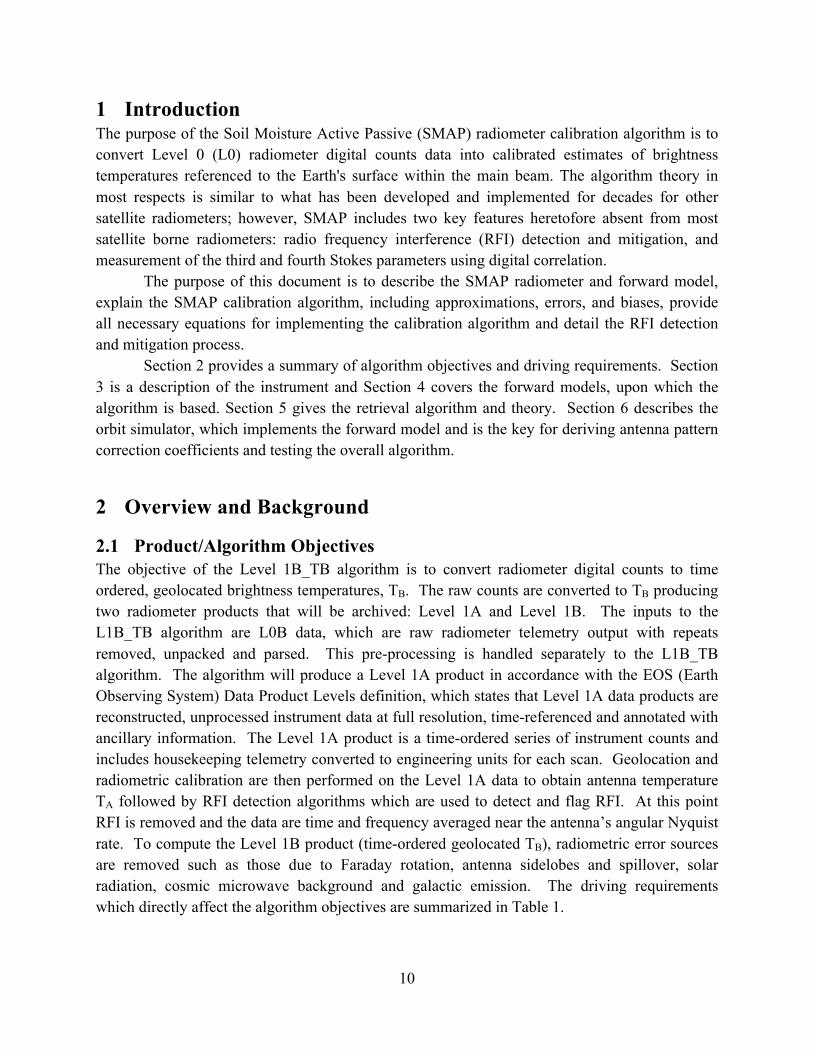
2.1 Product/Algorithm Objectives The objective of the Level 1B_TB algorithm is to convert radiometer digital counts to time ordered, geolocated brightness temperatures, TB. The raw counts are converted to TB producing two radiometer products that will be archived: Level 1A and Level 1B. The inputs to the L1B_TB algorithm are L0B data, which are raw radiometer telemetry output with repeats removed, unpacked and parsed. This pre-processing is handled separately to the L1B_TB algorithm. The algorithm will produce a Level 1A product in accordance with the EOS (Earth Observing System) Data Product Levels definition, which states that Level 1A data products are reconstructed, unprocessed instrument data at full resolution, time-referenced and annotated with ancillary information. The Level 1A product is a time-ordered series of instrument counts and includes housekeeping telemetry converted to engineering units for each scan. Geolocation and radiometric calibration are then performed on the Level 1A data to obtain antenna temperature TA followed by RFI detection algorithms which are used to detect and flag RFI. At this point RFI is removed and the data are time and frequency averaged near the antenna’s angular Nyquist rate. To compute the Level 1B product (time-ordered geolocated TB), radiometric error sources are removed such as those due to Faraday rotation, antenna sidelobes and spillover, solar radiation, cosmic microwave background and galactic emission. The driving requirements which directly affect the algorithm objectives are summarized in Table 1.
11
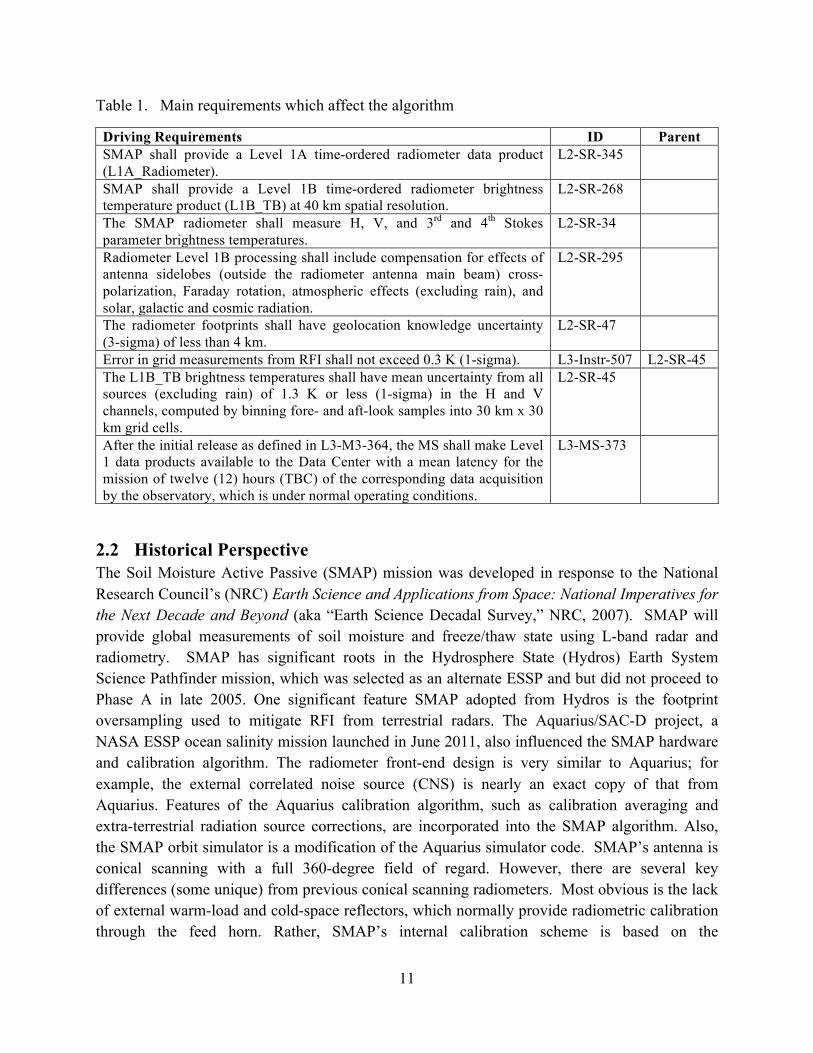
Table 1. Main requirements which affect the algorithm
Driving Requirements ID Parent SMAP shall provide a Level 1A time-ordered radiometer data product (L1A_Radiometer).
L2-SR-345
SMAP shall provide a Level 1B time-ordered radiometer brightness temperature product (L1B_TB) at 40 km spatial resolution.
L2-SR-268
The SMAP radiometer shall measure H, V, and 3rd and 4th Stokes parameter brightness temperatures.
L2-SR-34
Radiometer Level 1B processing shall include compensation for effects of antenna sidelobes (outside the radiometer antenna main beam) cross-polarization, Faraday rotation, atmospheric effects (excluding rain), and solar, galactic and cosmic radiation.
L2-SR-295
The radiometer footprints shall have geolocation knowledge uncertainty (3-sigma) of less than 4 km.
L2-SR-47
Error in grid measurements from RFI shall not exceed 0.3 K (1-sigma). L3-Instr-507 L2-SR-45 The L1B_TB brightness temperatures shall have mean uncertainty from all sources (excluding rain) of 1.3 K or less (1-sigma) in the H and V channels, computed by binning fore- and aft-look samples into 30 km x 30 km grid cells.
L2-SR-45
After the initial release as defined in L3-M3-364, the MS shall make Level 1 data products available to the Data Center with a mean latency for the mission of twelve (12) hours (TBC) of the corresponding data acquisition by the observatory, which is under normal operating conditions.
L3-MS-373
2.2 Historical Perspective The Soil Moisture Active Passive (SMAP) mission was developed in response to the National Research Council’s (NRC) Earth Science and Applications from Space: National Imperatives for the Next Decade and Beyond (aka “Earth Science Decadal Survey,” NRC, 2007). SMAP will provide global measurements of soil moisture and freeze/thaw state using L-band radar and radiometry. SMAP has significant roots in the Hydrosphere State (Hydros) Earth System Science Pathfinder mission, which was selected as an alternate ESSP and but did not proceed to Phase A in late 2005. One significant feature SMAP adopted from Hydros is the footprint oversampling used to mitigate RFI from terrestrial radars. The Aquarius/SAC-D project, a NASA ESSP ocean salinity mission launched in June 2011, also influenced the SMAP hardware and calibration algorithm. The radiometer front-end design is very similar to Aquarius; for example, the external correlated noise source (CNS) is nearly an exact copy of that from Aquarius. Features of the Aquarius calibration algorithm, such as calibration averaging and extra-terrestrial radiation source corrections, are incorporated into the SMAP algorithm. Also, the SMAP orbit simulator is a modification of the Aquarius simulator code. SMAP’s antenna is conical scanning with a full 360-degree field of regard. However, there are several key differences (some unique) from previous conical scanning radiometers. Most obvious is the lack of external warm-load and cold-space reflectors, which normally provide radiometric calibration through the feed horn. Rather, SMAP’s internal calibration scheme is based on the
12
Aquarius/SAC-D and Jason Advanced Microwave Radiometer (AMR) push broom radiometers and uses a reference load switch and a coupled noise diode. The antenna system is shared with the SMAP radar, which requires the use of a frequency diplexer in the feed network. Like WindSat, SMAP measures all four Stokes parameters; unlike WindSat, SMAP uses coherent detection in a digital radiometer backend. The first two modified Stokes parameters, TV and TH, are the primary science channels; the T3 and T4 channels are used to help detect RFI, which has recently proven quite valuable for the SMOS mission [Skou et. al 2010]. The T3 channel measurement also provides correction of Faraday rotation caused by the ionosphere. The most significant difference SMAP has from all past space borne radiometer programs is its aggressive hardware and algorithm approach to RFI mitigation, which is discussed in Section 3.
2.3 Background and Science Objectives The NRC’s Decadal Survey, Earth Science and Applications from Space: National Imperatives for the Next Decade and Beyond, was released in 2007 after a two year study commissioned by NASA, NOAA, and USGS to provide them with prioritization recommendations for space-based Earth observation programs [National Research Council, 2007]. Factors including scientific value, societal benefit and technical maturity of mission concepts were considered as criteria. SMAP data products have high science value and provide data towards improving many natural hazards applications. Furthermore SMAP draws on the significant design and risk-reduction heritage of the Hydrosphere State (Hydros) mission [Entekhabi et. al 2004]. For these reasons, the NRC report placed SMAP in the first tier of missions in its survey. In 2008 NASA announced the formation of the SMAP project as a joint effort of NASA’s Jet Propulsion Laboratory (JPL) and Goddard Space Flight Center (GSFC), with project management responsibilities at JPL. The target launch date is October 2014 [Entekhabi et. al 2010]. The SMAP science and applications objectives are to:
• Understand processes that link the terrestrial water, energy and carbon cycles • Estimate global water and energy fluxes at the land surface • Quantify net carbon flux in boreal landscapes • Enhance weather and climate forecast skill • Develop improved flood prediction and drought monitoring capability
2.4 Measurement Approach Table 2 is a summary of the SMAP instrument functional requirements derived from its science measurement needs. The goal is to combine the attributes of the radar and radiometer observations (in terms of their spatial resolution and sensitivity to soil moisture, surface roughness, and vegetation) to estimate soil moisture at a resolution of 10 km and freeze-thaw state at a resolution of 1-3 km.
13
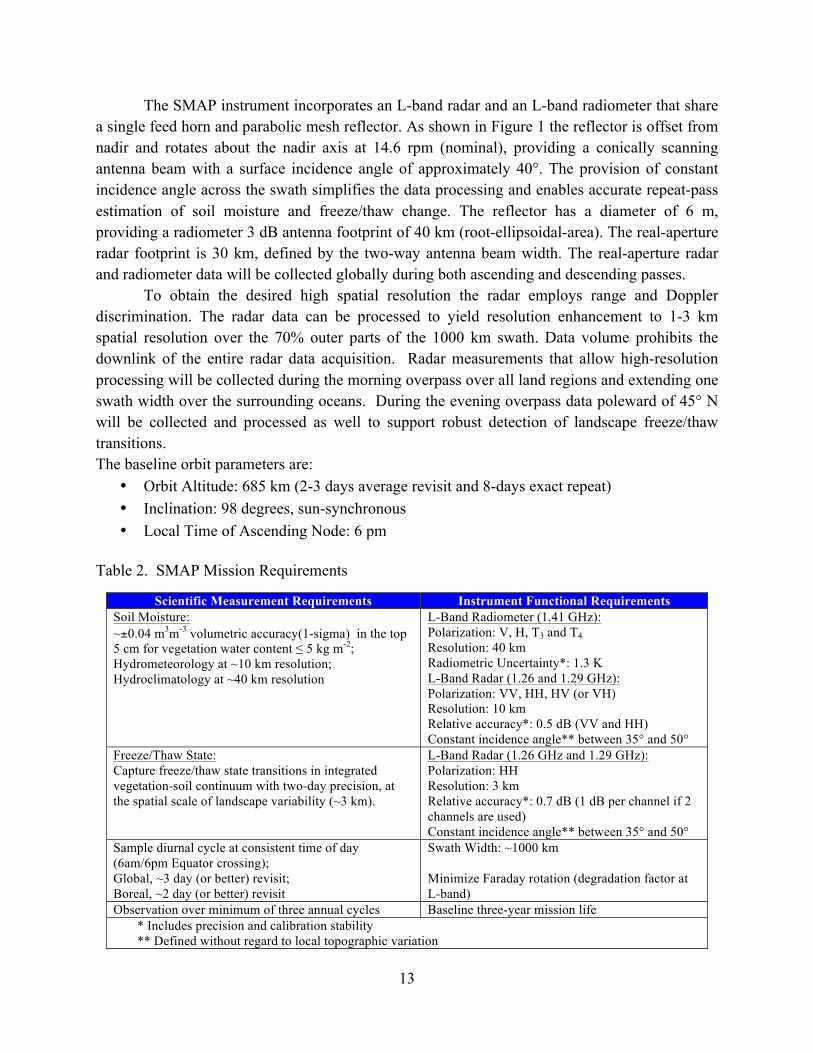
The SMAP instrument incorporates an L-band radar and an L-band radiometer that share a single feed horn and parabolic mesh reflector. As shown in Figure 1 the reflector is offset from nadir and rotates about the nadir axis at 14.6 rpm (nominal), providing a conically scanning antenna beam with a surface incidence angle of approximately 40°. The provision of constant incidence angle across the swath simplifies the data processing and enables accurate repeat-pass estimation of soil moisture and freeze/thaw change. The reflector has a diameter of 6 m, providing a radiometer 3 dB antenna footprint of 40 km (root-ellipsoidal-area). The real-aperture radar footprint is 30 km, defined by the two-way antenna beam width. The real-aperture radar and radiometer data will be collected globally during both ascending and descending passes.
To obtain the desired high spatial resolution the radar employs range and Doppler discrimination. The radar data can be processed to yield resolution enhancement to 1-3 km spatial resolution over the 70% outer parts of the 1000 km swath. Data volume prohibits the downlink of the entire radar data acquisition. Radar measurements that allow high-resolution processing will be collected during the morning overpass over all land regions and extending one swath width over the surrounding oceans. During the evening overpass data poleward of 45° N will be collected and processed as well to support robust detection of landscape freeze/thaw transitions. The baseline orbit parameters are:
• Orbit Altitude: 685 km (2-3 days average revisit and 8-days exact repeat) • Inclination: 98 degrees, sun-synchronous • Local Time of Ascending Node: 6 pm
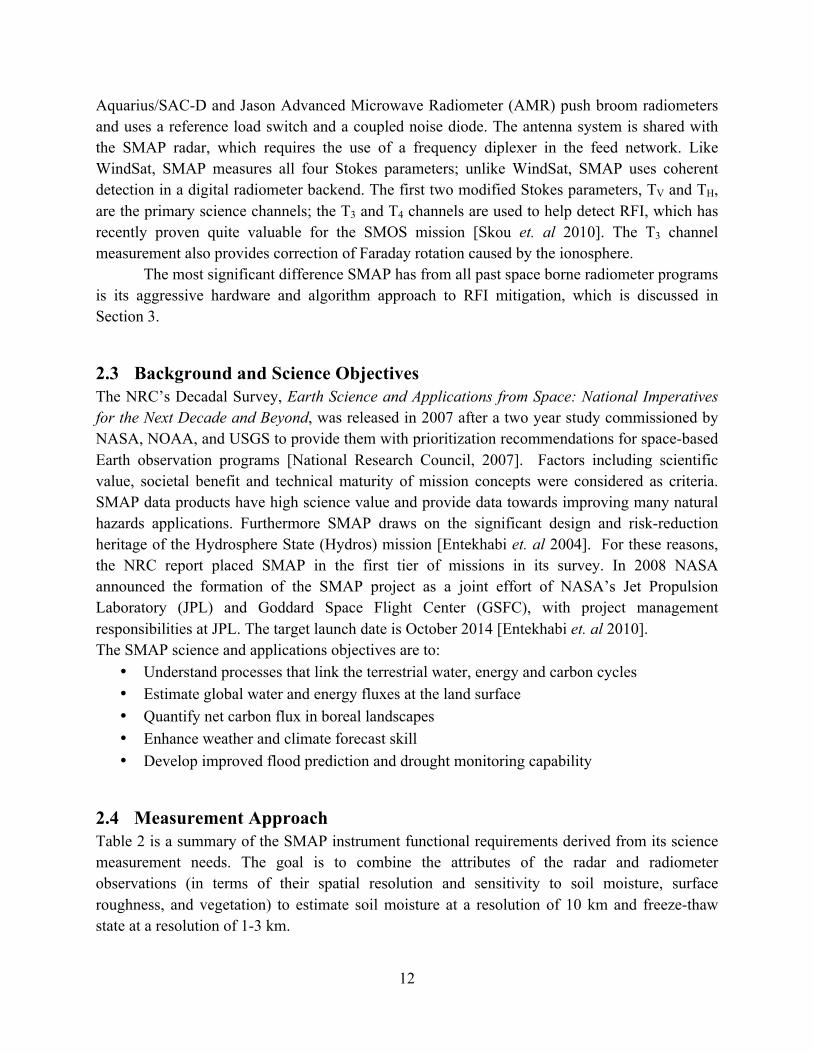
Table 2. SMAP Mission Requirements
Scientific Measurement Requirements Instrument Functional Requirements Soil Moisture: ~±0.04 m3m-3 volumetric accuracy(1-sigma) in the top 5 cm for vegetation water content ≤ 5 kg m-2; Hydrometeorology at ~10 km resolution; Hydroclimatology at ~40 km resolution
L-Band Radiometer (1.41 GHz): Polarization: V, H, T3 and T4 Resolution: 40 km Radiometric Uncertainty*: 1.3 K L-Band Radar (1.26 and 1.29 GHz): Polarization: VV, HH, HV (or VH) Resolution: 10 km Relative accuracy*: 0.5 dB (VV and HH) Constant incidence angle** between 35° and 50°
Freeze/Thaw State: Capture freeze/thaw state transitions in integrated vegetation-soil continuum with two-day precision, at the spatial scale of landscape variability (~3 km).
L-Band Radar (1.26 GHz and 1.29 GHz): Polarization: HH Resolution: 3 km Relative accuracy*: 0.7 dB (1 dB per channel if 2 channels are used) Constant incidence angle** between 35° and 50°
Sample diurnal cycle at consistent time of day (6am/6pm Equator crossing); Global, ~3 day (or better) revisit; Boreal, ~2 day (or better) revisit
Swath Width: ~1000 km Minimize Faraday rotation (degradation factor at L-band)
Observation over minimum of three annual cycles Baseline three-year mission life * Includes precision and calibration stability ** Defined without regard to local topographic variation
14
The SMAP radiometer measures the four Stokes parameters, TV, TH, T3, and T4 at 1.41 GHz. The T3 channel measurement can be used to correct for possible Faraday rotation caused by the ionosphere, although such Faraday rotation is minimized by the selection of the 6 am/6 pm sun-synchronous SMAP orbit.
At L-band, anthropogenic Radio Frequency Interference (RFI), principally from ground-based surveillance radars, can contaminate both radar and radiometer measurements. Early measurements and results from the SMOS mission indicate that in some regions RFI is present and detectable. The SMAP radar and radiometer electronics and algorithms have been designed to include features to mitigate the effects of RFI. To combat this, the SMAP radar utilizes selective filters and an adjustable carrier frequency in order to tune to pre-determined RFI-free portions of the spectrum while on orbit. The SMAP radiometer will implement a combination of time and frequency diversity, kurtosis detection, and use of T3 and T4 thresholds to detect and where possible mitigate RFI.
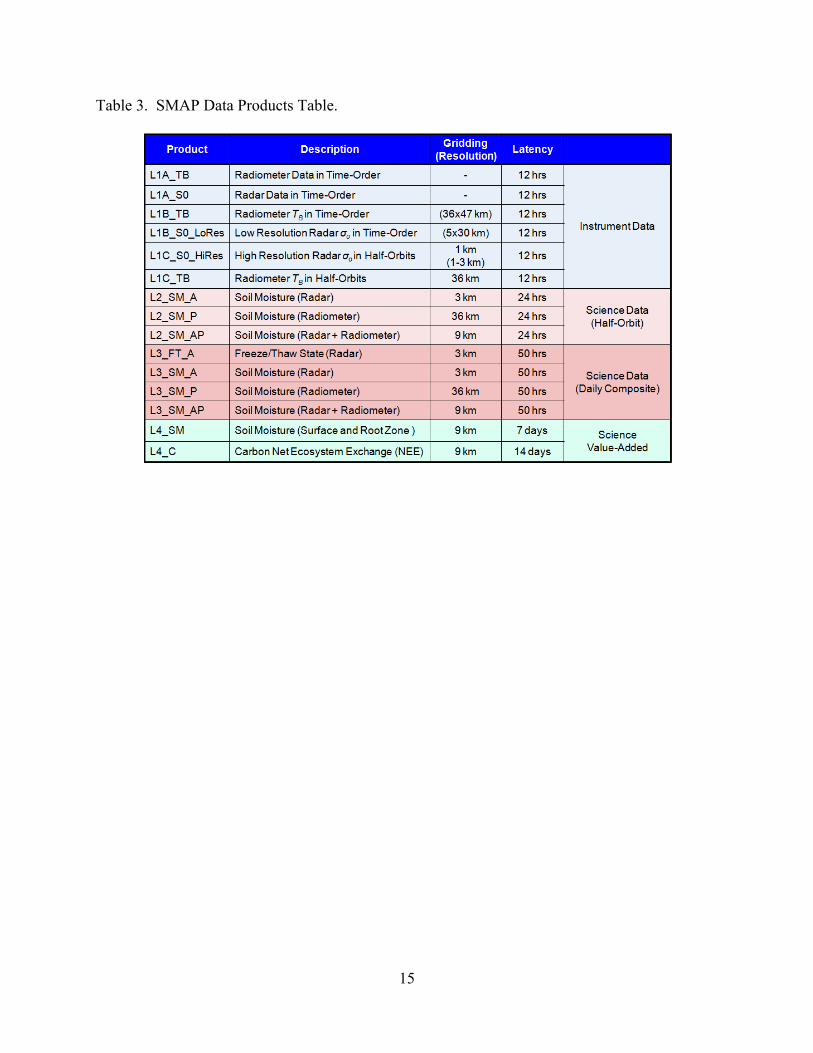
The SMAP planned data products are listed in Table 3. Level 1B and 1C data products are calibrated and geolocated instrument measurements of surface radar backscatter cross-section and brightness temperatures derived from antenna temperatures. Level 2 products are geophysical retrievals of soil moisture on a fixed Earth grid based on Level 1 products and ancillary information; the Level 2 products are output on half-orbit basis. Level 3 products are daily composites of Level 2 surface soil moisture and freeze/thaw state data. Level 4 products are model-derived value-added data products that support key SMAP applications and more directly address the driving science questions.
Figure 1. The SMAP observatory is a dedicated spacecraft with a rotating 6 m light weight deployable mesh reflector. The radar and radiometer share a common feed.
15
Table 3. SMAP Data Products Table.
16
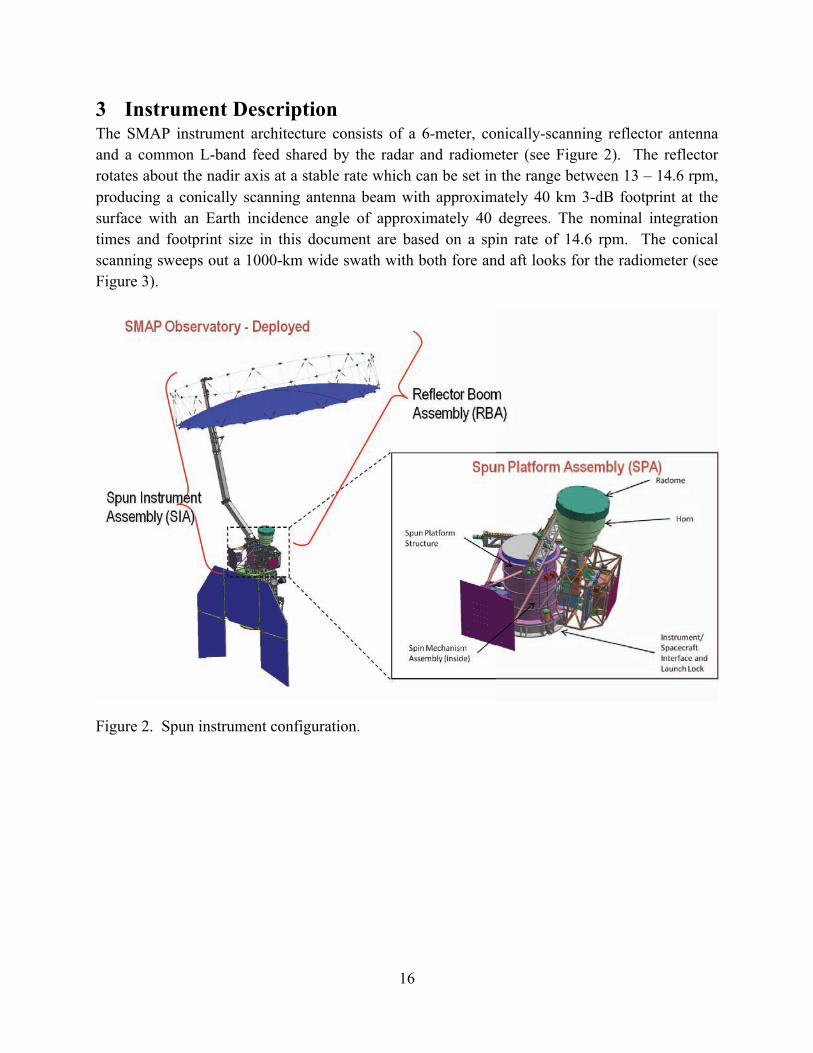
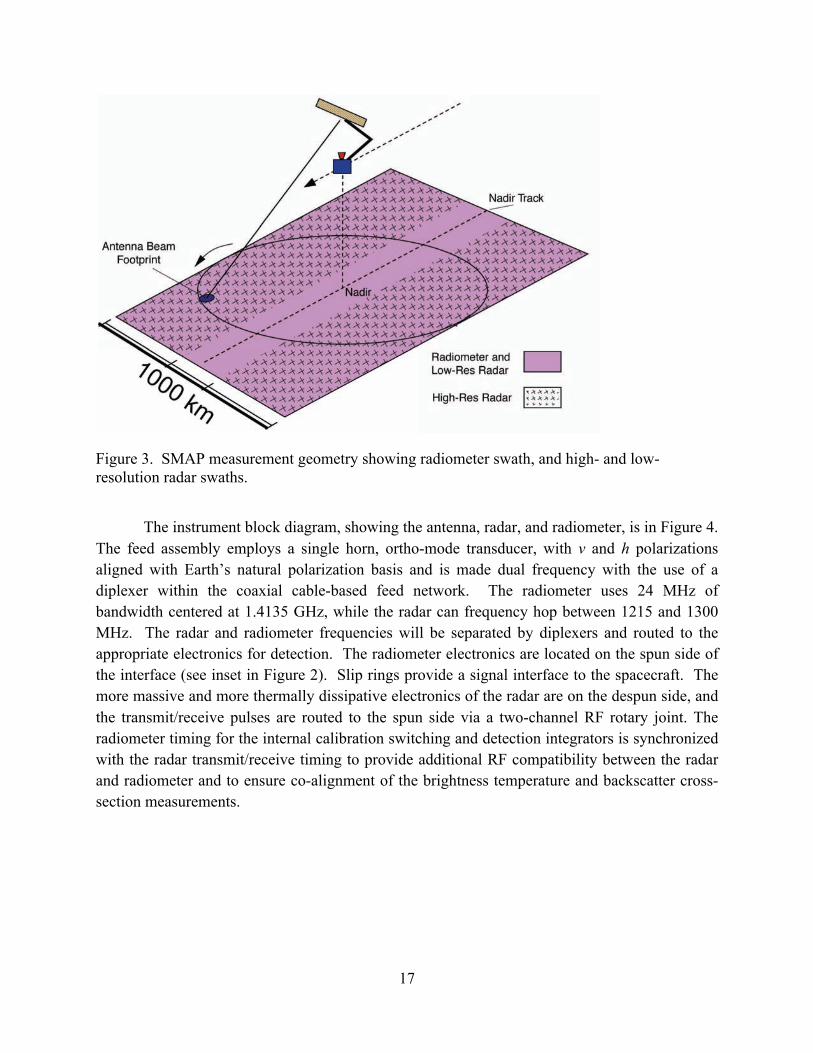
3 Instrument Description The SMAP instrument architecture consists of a 6-meter, conically-scanning reflector antenna and a common L-band feed shared by the radar and radiometer (see Figure 2). The reflector rotates about the nadir axis at a stable rate which can be set in the range between 13 – 14.6 rpm, producing a conically scanning antenna beam with approximately 40 km 3-dB footprint at the surface with an Earth incidence angle of approximately 40 degrees. The nominal integration times and footprint size in this document are based on a spin rate of 14.6 rpm. The conical scanning sweeps out a 1000-km wide swath with both fore and aft looks for the radiometer (see Figure 3).
Figure 2. Spun instrument configuration.
17
Figure 3. SMAP measurement geometry showing radiometer swath, and high- and low-resolution radar swaths.
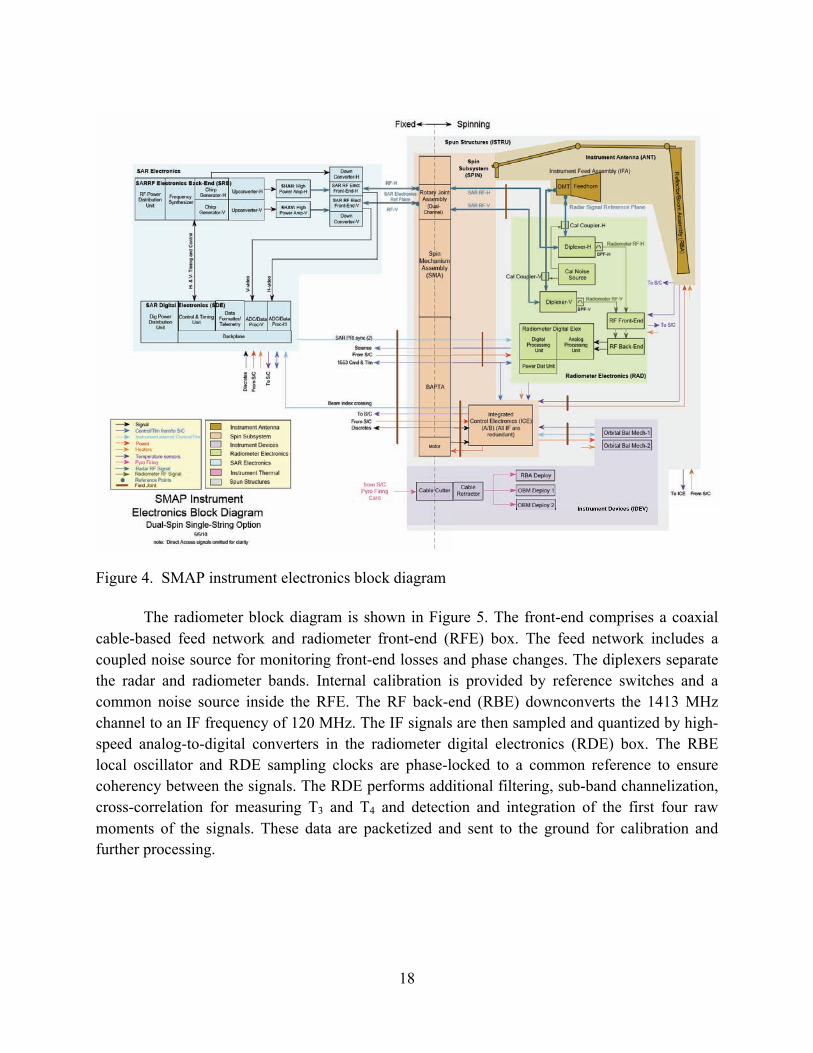
The instrument block diagram, showing the antenna, radar, and radiometer, is in Figure 4. The feed assembly employs a single horn, ortho-mode transducer, with v and h polarizations aligned with Earth’s natural polarization basis and is made dual frequency with the use of a diplexer within the coaxial cable-based feed network. The radiometer uses 24 MHz of bandwidth centered at 1.4135 GHz, while the radar can frequency hop between 1215 and 1300 MHz. The radar and radiometer frequencies will be separated by diplexers and routed to the appropriate electronics for detection. The radiometer electronics are located on the spun side of the interface (see inset in Figure 2). Slip rings provide a signal interface to the spacecraft. The more massive and more thermally dissipative electronics of the radar are on the despun side, and the transmit/receive pulses are routed to the spun side via a two-channel RF rotary joint. The radiometer timing for the internal calibration switching and detection integrators is synchronized with the radar transmit/receive timing to provide additional RF compatibility between the radar and radiometer and to ensure co-alignment of the brightness temperature and backscatter cross-section measurements.
18
Figure 4. SMAP instrument electronics block diagram
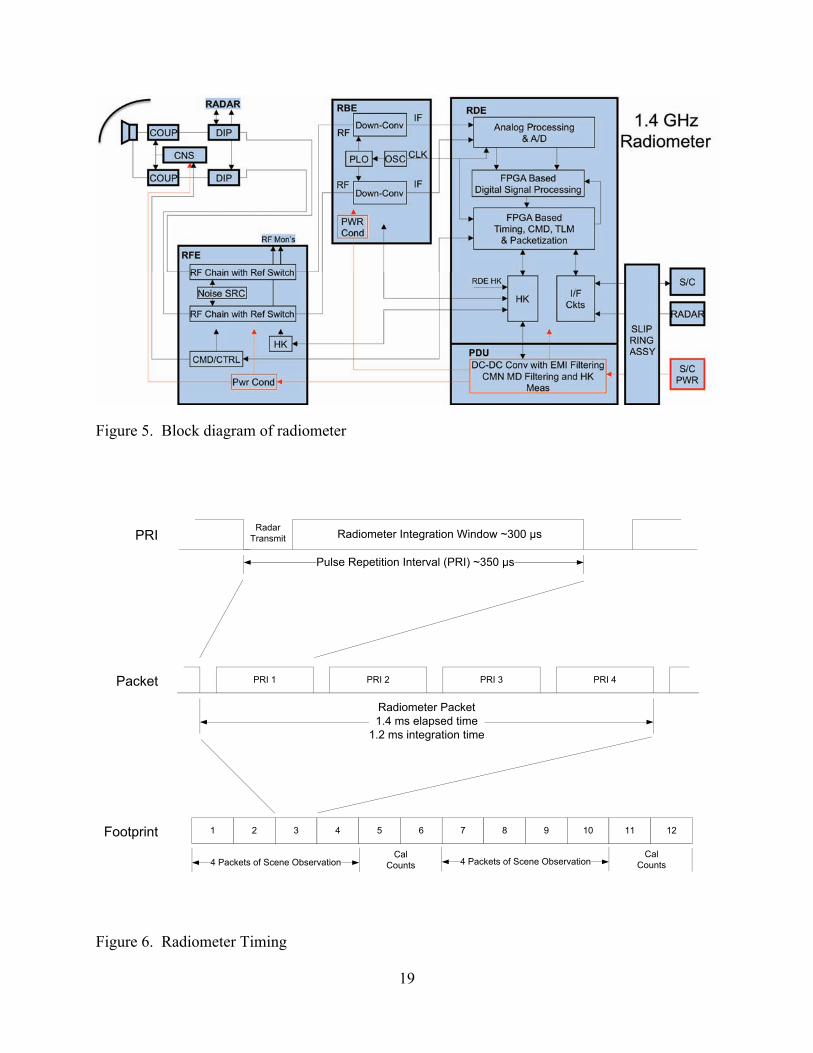
The radiometer block diagram is shown in Figure 5. The front-end comprises a coaxial cable-based feed network and radiometer front-end (RFE) box. The feed network includes a coupled noise source for monitoring front-end losses and phase changes. The diplexers separate the radar and radiometer bands. Internal calibration is provided by reference switches and a common noise source inside the RFE. The RF back-end (RBE) downconverts the 1413 MHz channel to an IF frequency of 120 MHz. The IF signals are then sampled and quantized by high-speed analog-to-digital converters in the radiometer digital electronics (RDE) box. The RBE local oscillator and RDE sampling clocks are phase-locked to a common reference to ensure coherency between the signals. The RDE performs additional filtering, sub-band channelization, cross-correlation for measuring T3 and T4 and detection and integration of the first four raw moments of the signals. These data are packetized and sent to the ground for calibration and further processing.
19
Figure 5. Block diagram of radiometer
Radiometer Integration Window ~300 µs
Pulse Repetition Interval (PRI) ~350 µs
Radar Transmit
PRI 1 PRI 2 PRI 3 PRI 4
Radiometer Packet1.4 ms elapsed time
1.2 ms integration time
PRI
Packet
Footprint 1 2 3 4 5 6 7 8 9 10 11 12
4 Packets of Scene ObservationCal
Counts4 Packets of Scene ObservationCal
Counts
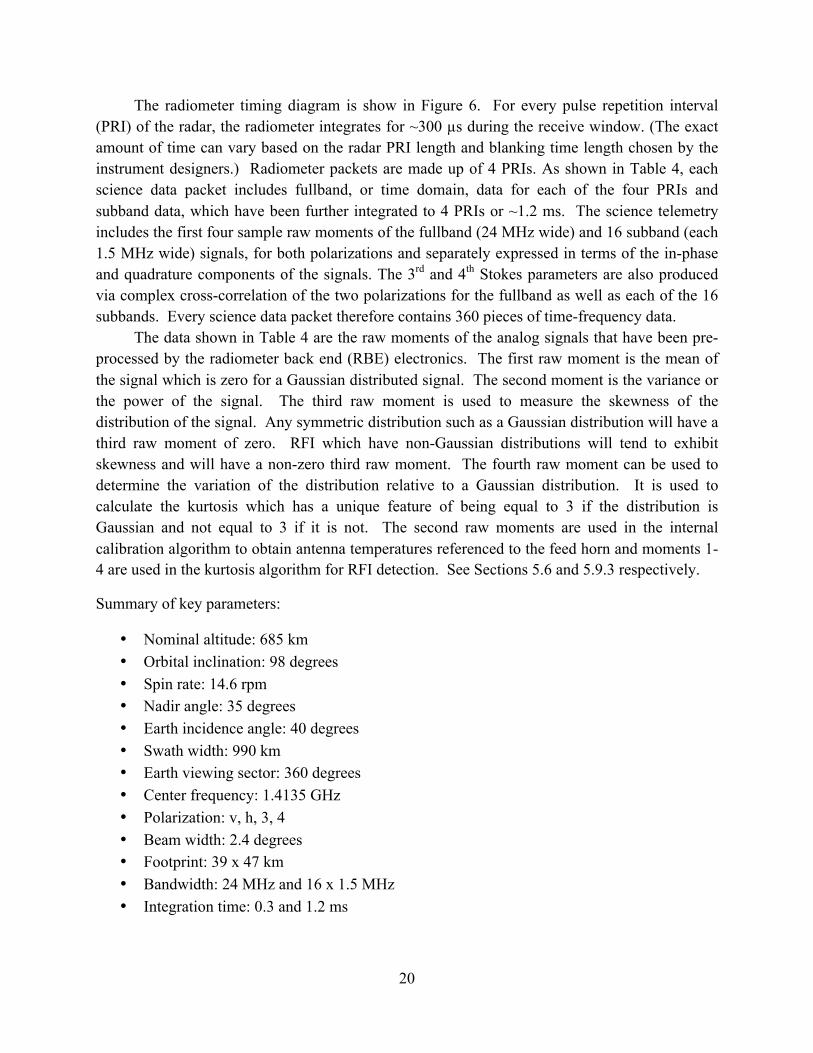
Figure 6. Radiometer Timing
20
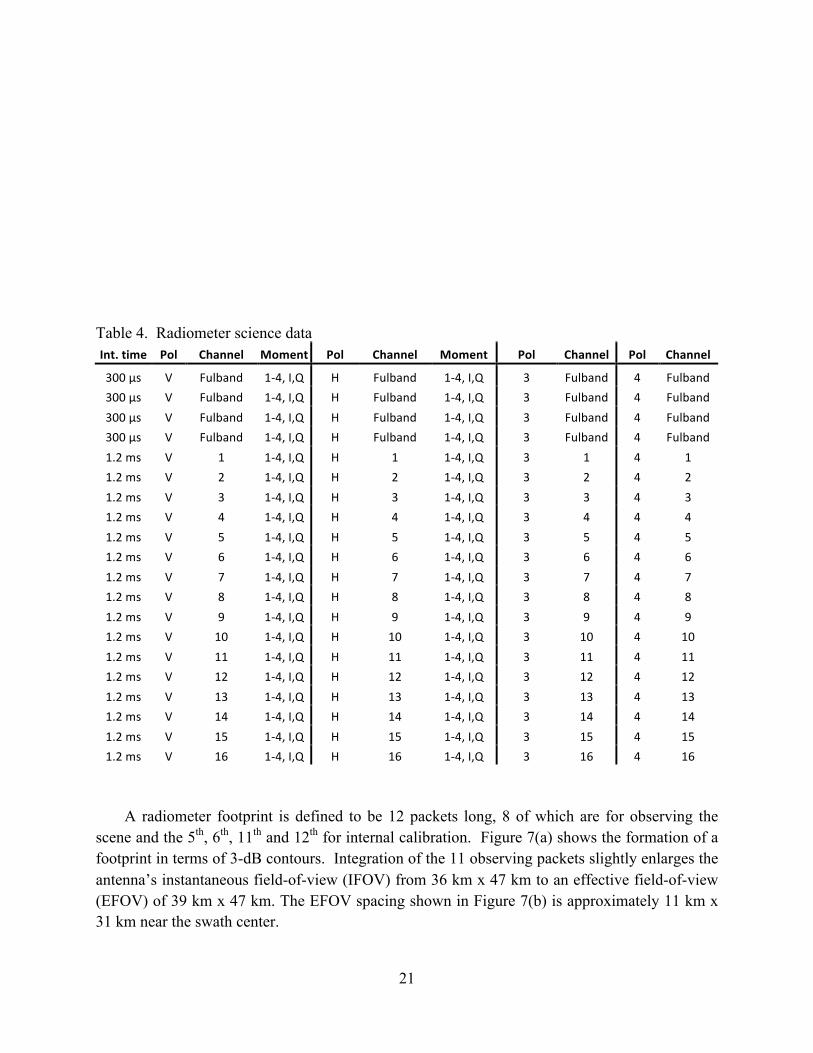
The radiometer timing diagram is show in Figure 6. For every pulse repetition interval (PRI) of the radar, the radiometer integrates for ~300 µs during the receive window. (The exact amount of time can vary based on the radar PRI length and blanking time length chosen by the instrument designers.) Radiometer packets are made up of 4 PRIs. As shown in Table 4, each science data packet includes fullband, or time domain, data for each of the four PRIs and subband data, which have been further integrated to 4 PRIs or ~1.2 ms. The science telemetry includes the first four sample raw moments of the fullband (24 MHz wide) and 16 subband (each 1.5 MHz wide) signals, for both polarizations and separately expressed in terms of the in-phase and quadrature components of the signals. The 3rd and 4th Stokes parameters are also produced via complex cross-correlation of the two polarizations for the fullband as well as each of the 16 subbands. Every science data packet therefore contains 360 pieces of time-frequency data.
The data shown in Table 4 are the raw moments of the analog signals that have been pre-processed by the radiometer back end (RBE) electronics. The first raw moment is the mean of the signal which is zero for a Gaussian distributed signal. The second moment is the variance or the power of the signal. The third raw moment is used to measure the skewness of the distribution of the signal. Any symmetric distribution such as a Gaussian distribution will have a third raw moment of zero. RFI which have non-Gaussian distributions will tend to exhibit skewness and will have a non-zero third raw moment. The fourth raw moment can be used to determine the variation of the distribution relative to a Gaussian distribution. It is used to calculate the kurtosis which has a unique feature of being equal to 3 if the distribution is Gaussian and not equal to 3 if it is not. The second raw moments are used in the internal calibration algorithm to obtain antenna temperatures referenced to the feed horn and moments 1-4 are used in the kurtosis algorithm for RFI detection. See Sections 5.6 and 5.9.3 respectively.
Summary of key parameters:
• Nominal altitude: 685 km • Orbital inclination: 98 degrees • Spin rate: 14.6 rpm • Nadir angle: 35 degrees • Earth incidence angle: 40 degrees • Swath width: 990 km • Earth viewing sector: 360 degrees • Center frequency: 1.4135 GHz • Polarization: v, h, 3, 4 • Beam width: 2.4 degrees • Footprint: 39 x 47 km • Bandwidth: 24 MHz and 16 x 1.5 MHz • Integration time: 0.3 and 1.2 ms
21
Table 4. Radiometer science data Int.time Pol Channel Moment Pol Channel Moment Pol Channel Pol Channel 300µs V Fulband 1-4,I,Q H Fulband 1-4,I,Q 3 Fulband 4 Fulband 300µs V Fulband 1-4,I,Q H Fulband 1-4,I,Q 3 Fulband 4 Fulband 300µs V Fulband 1-4,I,Q H Fulband 1-4,I,Q 3 Fulband 4 Fulband 300µs V Fulband 1-4,I,Q H Fulband 1-4,I,Q 3 Fulband 4 Fulband 1.2ms V 1 1-4,I,Q H 1 1-4,I,Q 3 1 4 1 1.2ms V 2 1-4,I,Q H 2 1-4,I,Q 3 2 4 2 1.2ms V 3 1-4,I,Q H 3 1-4,I,Q 3 3 4 3 1.2ms V 4 1-4,I,Q H 4 1-4,I,Q 3 4 4 4 1.2ms V 5 1-4,I,Q H 5 1-4,I,Q 3 5 4 5 1.2ms V 6 1-4,I,Q H 6 1-4,I,Q 3 6 4 6 1.2ms V 7 1-4,I,Q H 7 1-4,I,Q 3 7 4 7 1.2ms V 8 1-4,I,Q H 8 1-4,I,Q 3 8 4 8 1.2ms V 9 1-4,I,Q H 9 1-4,I,Q 3 9 4 9 1.2ms V 10 1-4,I,Q H 10 1-4,I,Q 3 10 4 10 1.2ms V 11 1-4,I,Q H 11 1-4,I,Q 3 11 4 11 1.2ms V 12 1-4,I,Q H 12 1-4,I,Q 3 12 4 12 1.2ms V 13 1-4,I,Q H 13 1-4,I,Q 3 13 4 13 1.2ms V 14 1-4,I,Q H 14 1-4,I,Q 3 14 4 14 1.2ms V 15 1-4,I,Q H 15 1-4,I,Q 3 15 4 15 1.2ms V 16 1-4,I,Q H 16 1-4,I,Q 3 16 4 16
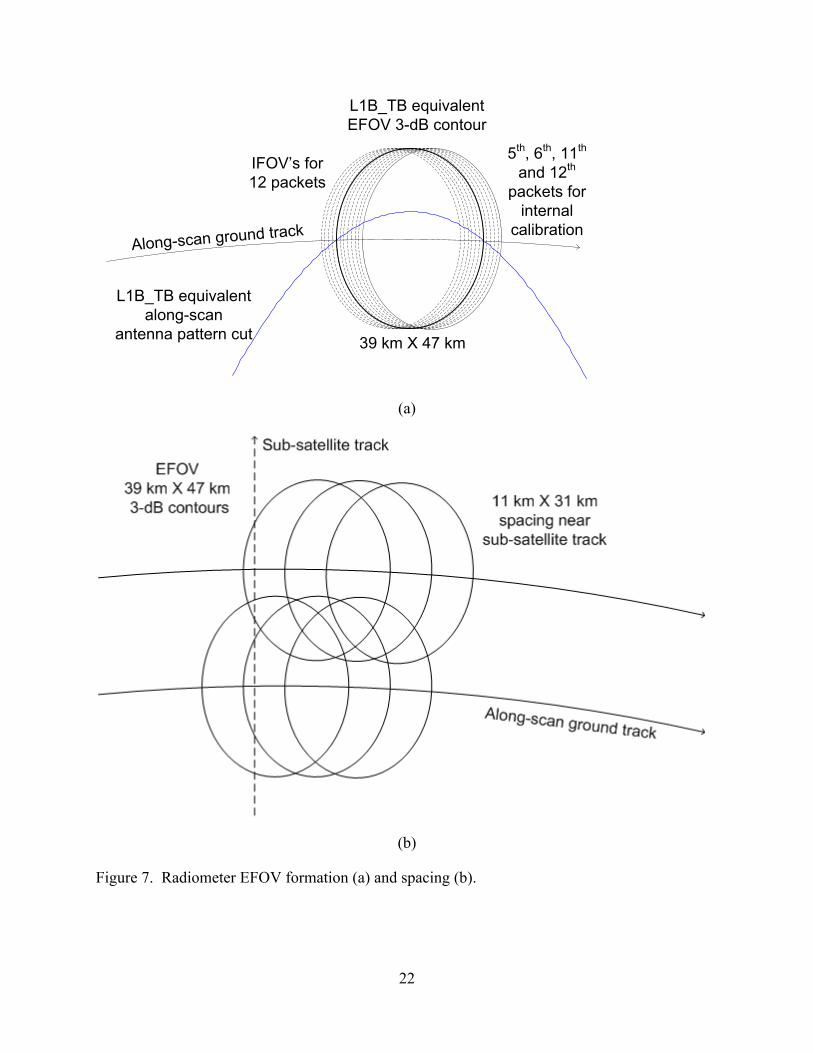
A radiometer footprint is defined to be 12 packets long, 8 of which are for observing the scene and the 5th, 6th, 11th and 12th for internal calibration. Figure 7(a) shows the formation of a footprint in terms of 3-dB contours. Integration of the 11 observing packets slightly enlarges the antenna’s instantaneous field-of-view (IFOV) from 36 km x 47 km to an effective field-of-view (EFOV) of 39 km x 47 km. The EFOV spacing shown in Figure 7(b) is approximately 11 km x 31 km near the swath center.
22
Along-scan ground track
IFOV’s for 12 packets
L1B_TB equivalent along-scan
antenna pattern cut
L1B_TB equivalentEFOV 3-dB contour
39 km X 47 km
5th, 6th, 11th and 12th
packets for internal
calibration
(a)
(b)
Figure 7. Radiometer EFOV formation (a) and spacing (b).
23
4 Forward Model (TB à TA)
4.1 Brightness Temperature Forward Model This section contains a description of the sources contributing to the total apparent temperature seen at the input to the SMAP main reflector.
The brightness temperature of a source (measured in kelvins) can be described in terms of the product of the physical temperature and the emissivity of the source. Emissivity is, in general, polarization-dependent, thus differentiating brightness temperature into 𝑇!,! and 𝑇!,! for the vertical and horizontal polarizations, respectively. These are the first two modified Stokes parameters. The real part of the complex correlation between these two components is measured by the third modified Stokes parameter, represented in brightness temperatures as T3. The fourth Stokes parameter, T4 measures the imaginary part of the correlation. For this document, a vector of modified Stokes parameters is shown by
𝑇! 𝜃,𝜙 =
𝑇!𝑇!𝑇!𝑇!
(4.1)
where 𝜃 and 𝜙 are the elevation and azimuth of a spherical coordinate system centered on the radiometer antenna boresight vector.
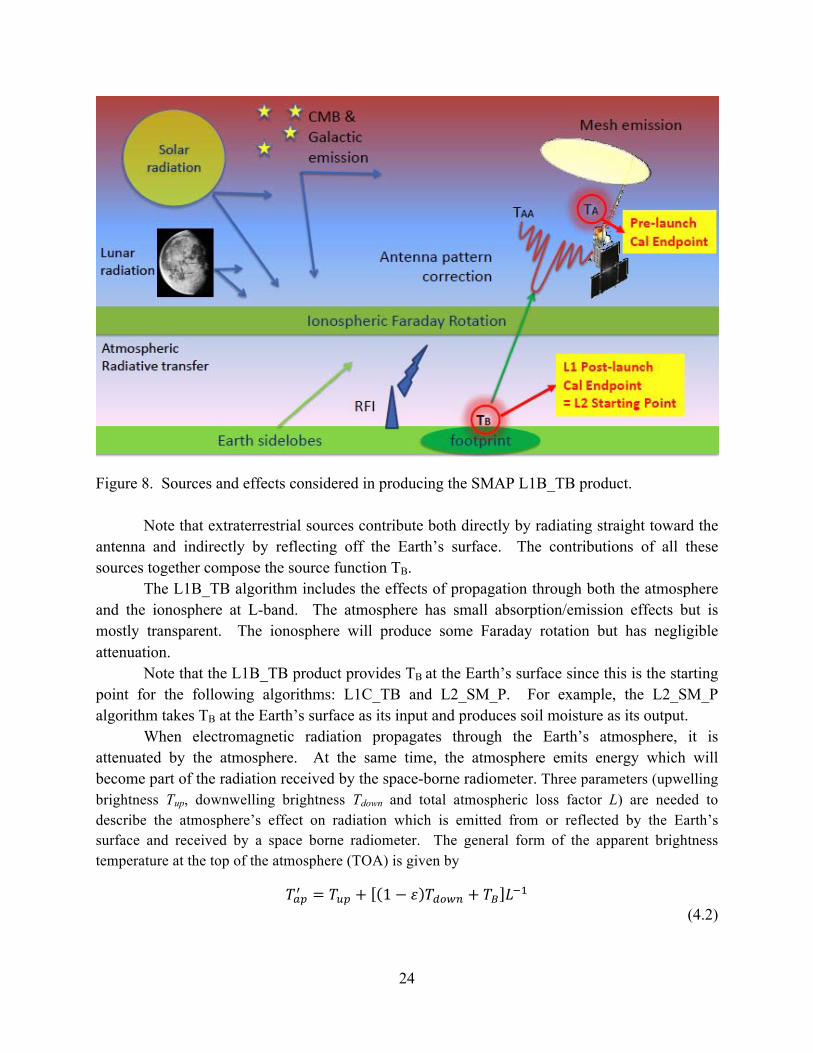
Important sources of radiation at L-band are the Earth’s land and sea, the cosmic background radiation, the sun, radiation sources outside our solar system, and the moon. Figure 8 depicts the various sources and effects considered in producing the SMAP L1B_TB product. More details are given in Section 5.12.
24
Figure 8. Sources and effects considered in producing the SMAP L1B_TB product.
Note that extraterrestrial sources contribute both directly by radiating straight toward the antenna and indirectly by reflecting off the Earth’s surface. The contributions of all these sources together compose the source function TB.
The L1B_TB algorithm includes the effects of propagation through both the atmosphere and the ionosphere at L-band. The atmosphere has small absorption/emission effects but is mostly transparent. The ionosphere will produce some Faraday rotation but has negligible attenuation.
Note that the L1B_TB product provides TB at the Earth’s surface since this is the starting point for the following algorithms: L1C_TB and L2_SM_P. For example, the L2_SM_P algorithm takes TB at the Earth’s surface as its input and produces soil moisture as its output.
When electromagnetic radiation propagates through the Earth’s atmosphere, it is attenuated by the atmosphere. At the same time, the atmosphere emits energy which will become part of the radiation received by the space-borne radiometer. Three parameters (upwelling brightness Tup, downwelling brightness Tdown and total atmospheric loss factor L) are needed to describe the atmosphere’s effect on radiation which is emitted from or reflected by the Earth’s surface and received by a space borne radiometer. The general form of the apparent brightness temperature at the top of the atmosphere (TOA) is given by
𝑇!"! = 𝑇!" + 1− 𝜀 𝑇!"#$ + 𝑇! 𝐿!! (4.2)
25
where ε is the emissivity of the Earth’s surface and TB is the brightness temperature of the Earth’s surface. The radiometer sees the sum of the surface brightness TB attenuated by L, added to upwelling atmospheric brightness Tup plus the downwelling atmospheric brightness Tdown
reflected off the surface and attenuated by L. The ionosphere acts as an anisotropic medium, which can alter the polarization state of the wave [Stratton, 1941; Kraus 1966]. For SMAP, for example, linearly-polarized signals transiting through the Earth’s ionosphere will experience some degree of polarization change. The amount of polarization rotation Ωf, in this case can be expressed as
∫−×=Ω dsBnef ||2131062.2 λ (in radians)
(4.3)
where λ is in meters, ne is electrons/m-3, B|| is the magnetic field component parallel to the propagation direction in teslas; integration is along the viewing path. The SMAP radiometer wavelength is λ = c/f = 0.21m. The resulting apparent temperature incident on the SMAP main reflector becomes
𝑇!",!𝑇!",!𝑇!",!𝑇!",!
=
𝑇!",!! − ∆𝑇!"𝑇!",!! + ∆𝑇!"
− 𝑇!",!! − 𝑇!",!! 𝑠𝑖𝑛2Ω! + 𝑇!",!! 𝑐𝑜𝑠2Ω!𝑇!",!!
(4.4)
where 𝑇!",!! (x = v, h, 3, 4) is the apparent brightness at TOA of polarization x; and
∆𝑇!" = 𝑇!",!! − 𝑇!",!! 𝑠𝑖𝑛!Ω! −𝑇!",!!
2 𝑠𝑖𝑛2Ω! (4.5)
Considering all of the radiation sources and all the incidence direction on the SMAP main reflector, the total Tap incident on the main reflector is
𝑇!" = 𝑇!",!" + 𝑇!",!"# + 𝑇!",!!" (4.6)
where 𝑇!",!" is the brightness incident through the main beam, 𝑇!",!"# is the brightness incident through sidelobes that view the Earth (more precisely, the solid angle subtended by the Earth but not including the main beam, or the “Earth solid angle”), and 𝑇!",!!" is the brightness incident through sidelobes that view off-Earth directions, including back lobe directions (i.e., all other directions, or the “space solid angle”). Together, the three terms on the right hand side of Equation (4.6) subtend the full 4π steradian solid angle around the main reflector.
The terms 𝑇!",!"#and 𝑇!",!!" can be further separated into the following components:

26
𝑇!",!"# = 𝑇!",!"# + 𝑇!",!"#$%& + 𝑇!",!"#$%%& + 𝑇!",!"#$%& (4.7)
𝑇!",!!" = 𝑇!",!"#$%& + 𝑇!",!"#$%%& + 𝑇!",!"#$%& (4.8)
where 𝑇!",!"#$%&,𝑇!",!"#$%%& and 𝑇!",!"#$%& are brightness after reflection off the Earth into the Earth solid angle from, respectively, the sun, the moon and the galaxy including cosmic microwave background. 𝑇!",!"# accounts for Earth emission into sidelobes that view the Earth. The terms on the right hand side of Equation (4.8), 𝑇!",!"#$%&,𝑇!",!"#$%%& and 𝑇!",!"#$%&, are brightness temperatures entering the space solid angle directly from, respectively, the sun, the moon and the galaxy including cosmic microwave background. All Tap quantities in Equations (4.7) and (4.8) are, in general, 4-vectors corresponding to the 4 modified Stokes parameters (although 𝑇!",!"#$%&,𝑇!",!"#$%%& and 𝑇!",!"#$%& can be treated as unpolarized). All right hand terms in Equations (4.6) to (4.8) are integrals of the respective source TB over the indicated solid angle weighted by the SMAP antenna pattern in each direction 𝜃,𝜙 relative to the antenna coordinate frame. As the antenna is constantly rotating, the terms in Equations (4.6) to (4.8) are all implicitly functions of the time of observation. Each also includes polarization basis rotations for Faraday rotation correction and alignment of the v-h (vertical-horizontal) basis with the main beam basis.
4.2 Radiometer System Forward Model The forward model traces the path of signal from feed horn to the power digitally recorded in the radiometer.
4.2.1 Signal Through a Lossy Component The antenna temperature of the signal in a radiometer is defined as
𝑇 =
𝑇!𝑇!𝑇!𝑇!
.
(4.9)
Assuming perfect isolation between the vertical and horizontal channels, a loss in the system will behave by attenuating the signals while inserting additional antenna power into the vertical and horizontal channels based on the physical temperature of the ohmic loss. Thus, the antenna temperature vector 𝑇′ after loss 𝐿 is
𝑇′ = 𝐿!!𝑇 + 𝐼 − 𝐿!! 𝑇!!! (4.10)
27
where 𝐿!! is the Mueller matrix [Piepmeier et. al 2008] of the loss shown as
𝐿!!! 0 0 00 𝐿!!! 0 0
0 0 𝐿!𝐿!!!! 0
0 0 0 𝐿!𝐿!!!!
(4.11)
and 𝑇!!! is a physical temperature vector
𝑇!!! =
𝑇!!!",!𝑇!!!",!00
(4.12)
where 𝑇!!!",! and 𝑇!!!",! are the physical temperatures of the loss in the vertical and horizontal channels.
4.2.2 Impedance Mismatch An impedance mismatch will attenuate a passing signal while reflecting outgoing noise back into the receiver. Ignoring the OMT cross-coupling which has been subsumed into the antenna pattern correction algorithm, channels v and h can be treated as total power channels and the effective signal into the receiver can be modeled as [Corbella et al. 2005]
Minout TTMT += (4.13)
where inT is input Stokes parameter vector
⎥⎥⎥⎥
⎦
⎤
⎢⎢⎢⎢
⎣
⎡
=
4
3
TTTT
T h
v
in
(4.14)
28
⎥⎥⎥⎥⎥
⎦
⎤
⎢⎢⎢⎢⎢
⎣
⎡
ΛΛΛΛ
ΛΛ−ΛΛ
Λ
Λ
=
**
**
2
2
ReIm00ImRe00000000
hvhv
hvhv
h
v
M
(4.15)
[ ][ ]
⎥⎥⎥⎥⎥
⎦
⎤
⎢⎢⎢⎢⎢
⎣
⎡
ΓΛ+ΓΛ
ΓΛ+ΓΛ
=
00
Re2
Re2
,,,,2
,2
,,,,2
,2
hcorhahvisophyhah
vcorvavvisophyvav
MTT
TT
T
(4.16)
where kisophyT ,, (k = v, h) is the physical temperature of the isolator in receiving channel k; ka ,Γ is
the feed horn assembly (including OMT) reflection coefficient of channel k and
kakk S ,,111
1Γ−
=Λ
(4.17)
⎟⎟⎠
⎞⎜⎜⎝
⎛+−= *
,,21
*,,22,,12
,,11,,,kTSFE
kTSFEkTSFEkTSFEkisophykcor S
SSSTT
(4.18)
where kS ,11 (k = v, h) is the input reflection coefficient of the receiver (channel k, started from
CNS coupler). The S-parameters with subscript ‘TSFE’ are defined for the temperature sensitive front-end (TSFE) components (CNS coupler through RFE isolator). Physical temperatures of these TSFE components are assumed to be the same.
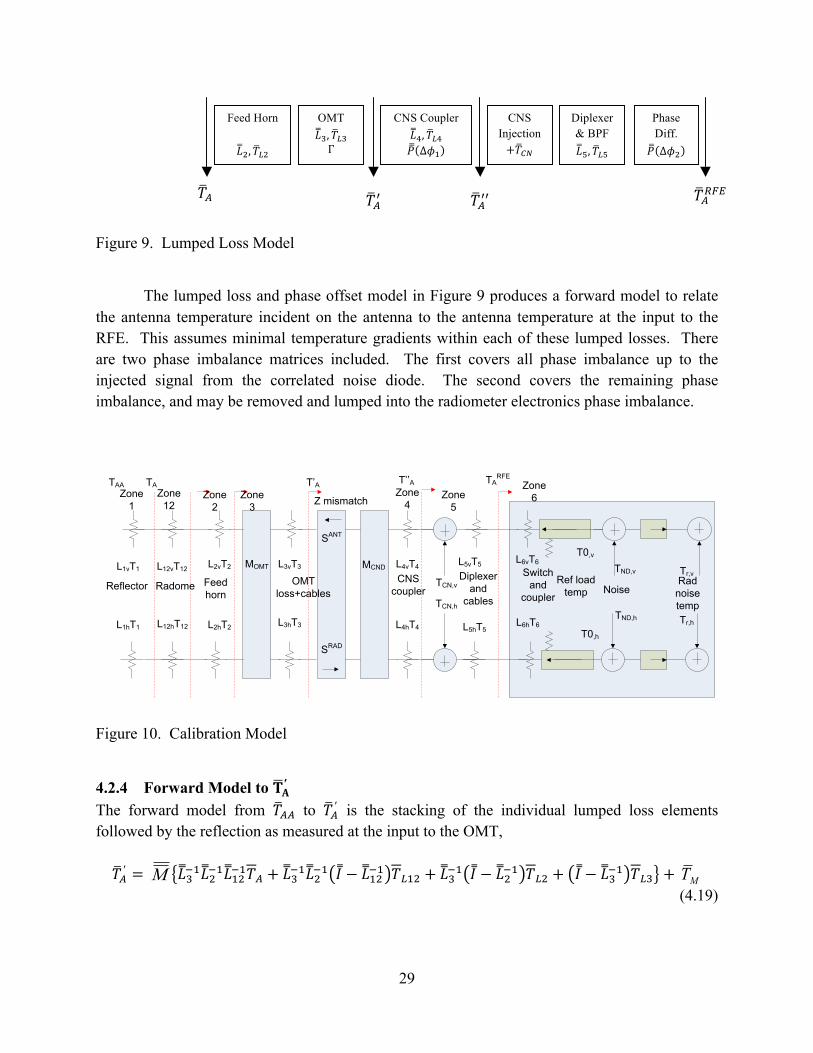
4.2.3 Feed Network Lumped Loss Model A lumped loss model is used to derive the antenna temperature as measured at the input of the radiometer front end (RFE). The block diagram of the vertical and horizontal channels of the SMAP radiometer leads directly to lumped loss model shown in Figure 9 and its corresponding calibration model shown in Figure 10.
29
Figure 9. Lumped Loss Model
The lumped loss and phase offset model in Figure 9 produces a forward model to relate the antenna temperature incident on the antenna to the antenna temperature at the input to the RFE. This assumes minimal temperature gradients within each of these lumped losses. There are two phase imbalance matrices included. The first covers all phase imbalance up to the injected signal from the correlated noise diode. The second covers the remaining phase imbalance, and may be removed and lumped into the radiometer electronics phase imbalance.
Zone 1
Zone 2
Zone 3
Zone 4
Zone 5
Zone 6Z mismatch
TCN,v
L1vT1
L1hT1
L2vT2
L2hT2
TCN,h
L3vT3 L4vT4
L3hT3 L4hT4
TAA
Reflector Feedhorn
OMT loss+cables
CNS coupler
Diplexer and
cables
Switch and
coupler
Ref load temp
T0,v
T0,h
Noise
TND,v
TND,h
Tr,v
Tr,h
Rad noise temp
L5vT5
L5hT5
L6vT6
L6hT6
T’ATA T’’A TARFE
MCNDMOMT
SANT
SRAD
Zone 12
Radome
L12vT12
L12hT12
Figure 10. Calibration Model
4.2.4 Forward Model to 𝐓𝐀′ The forward model from 𝑇!! to 𝑇!′ is the stacking of the individual lumped loss elements followed by the reflection as measured at the input to the OMT,
𝑇!′ = M 𝐿!!!𝐿!!!𝐿!"!!𝑇! + 𝐿!!!𝐿!!! 𝐼 − 𝐿!"!! 𝑇!!" + 𝐿!!! 𝐼 − 𝐿!!! 𝑇!! + 𝐼 − 𝐿!!! 𝑇!! + MT (4.19)
𝑇!!!
Feed Horn
𝐿!,𝑇!!
OMT 𝐿!,𝑇!! Γ
CNS Coupler 𝐿!,𝑇!! 𝑃 Δ𝜙!
Diplexer & BPF 𝐿!,𝑇!!
Phase Diff.
𝑃 Δ𝜙!
𝑇!
CNS Injection +𝑇!"
𝑇!!
𝑇!!"#
30
where 𝐿!" is the Mueller matrix of the radome loss. 𝑇!" is the physical temperature vector of the radome.
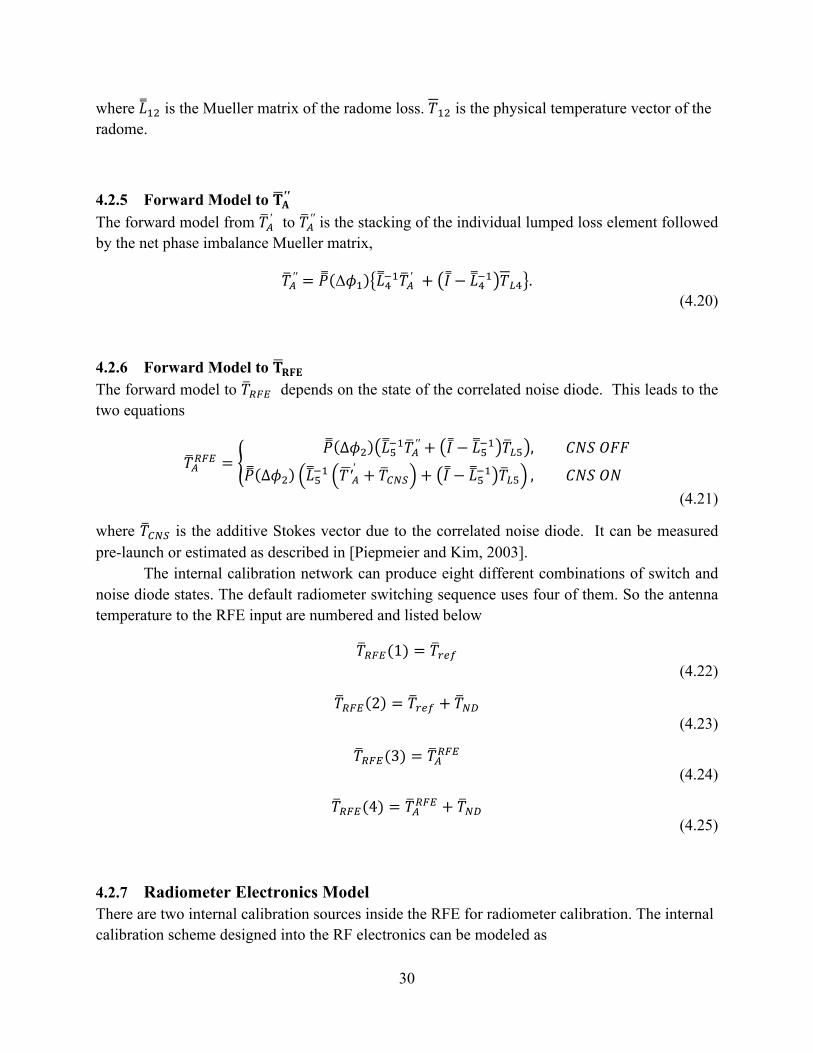
4.2.5 Forward Model to 𝐓𝐀′′ The forward model from 𝑇!′ to 𝑇!′′ is the stacking of the individual lumped loss element followed by the net phase imbalance Mueller matrix,
𝑇!′′ = 𝑃 Δ𝜙! 𝐿!!!𝑇!′ + 𝐼 − 𝐿!!! 𝑇!! . (4.20)
4.2.6 Forward Model to 𝐓𝐑𝐅𝐄 The forward model to 𝑇!"# depends on the state of the correlated noise diode. This leads to the two equations
𝑇!!"# =𝑃 ∆𝜙! 𝐿!!!𝑇!′′ + 𝐼 − 𝐿!!! 𝑇!! , 𝐶𝑁𝑆 𝑂𝐹𝐹
𝑃 ∆𝜙! 𝐿!!! 𝑇′!′ + 𝑇!"# + 𝐼 − 𝐿!!! 𝑇!! , 𝐶𝑁𝑆 𝑂𝑁
(4.21)
where 𝑇!"# is the additive Stokes vector due to the correlated noise diode. It can be measured pre-launch or estimated as described in [Piepmeier and Kim, 2003].
The internal calibration network can produce eight different combinations of switch and noise diode states. The default radiometer switching sequence uses four of them. So the antenna temperature to the RFE input are numbered and listed below
𝑇!"#(1) = 𝑇!"# (4.22)
𝑇!"# 2 = 𝑇!"# + 𝑇!" (4.23)
𝑇!"#(3) = 𝑇!!"# (4.24)
𝑇!"#(4) = 𝑇!!"# + 𝑇!" (4.25)
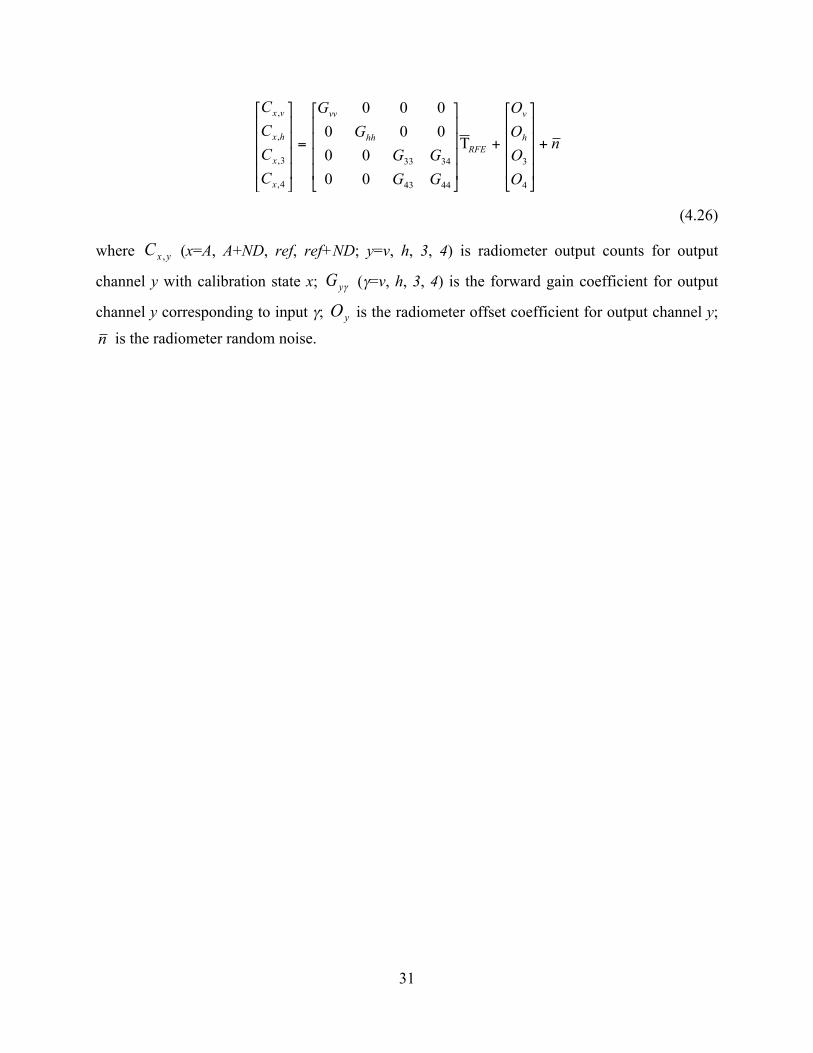
4.2.7 Radiometer Electronics Model There are two internal calibration sources inside the RFE for radiometer calibration. The internal calibration scheme designed into the RF electronics can be modeled as
31
n
OOOO
GGGG
GG
CCCC
h
v
RFEhh
vv
x
x
hx
vx
+
⎥⎥⎥⎥
⎦
⎤
⎢⎢⎢⎢
⎣
⎡
+
⎥⎥⎥⎥
⎦
⎤
⎢⎢⎢⎢
⎣
⎡
=
⎥⎥⎥⎥
⎦
⎤
⎢⎢⎢⎢
⎣
⎡
4
3
4443
3433
4,
3,
,
,
T
0000
000000
(4.26)
where yxC , (x=A, A+ND, ref, ref+ND; y=v, h, 3, 4) is radiometer output counts for output
channel y with calibration state x; γyG (γ=v, h, 3, 4) is the forward gain coefficient for output
channel y corresponding to input γ; yO is the radiometer offset coefficient for output channel y;
n is the radiometer random noise.
32
5 Calibration Algorithm
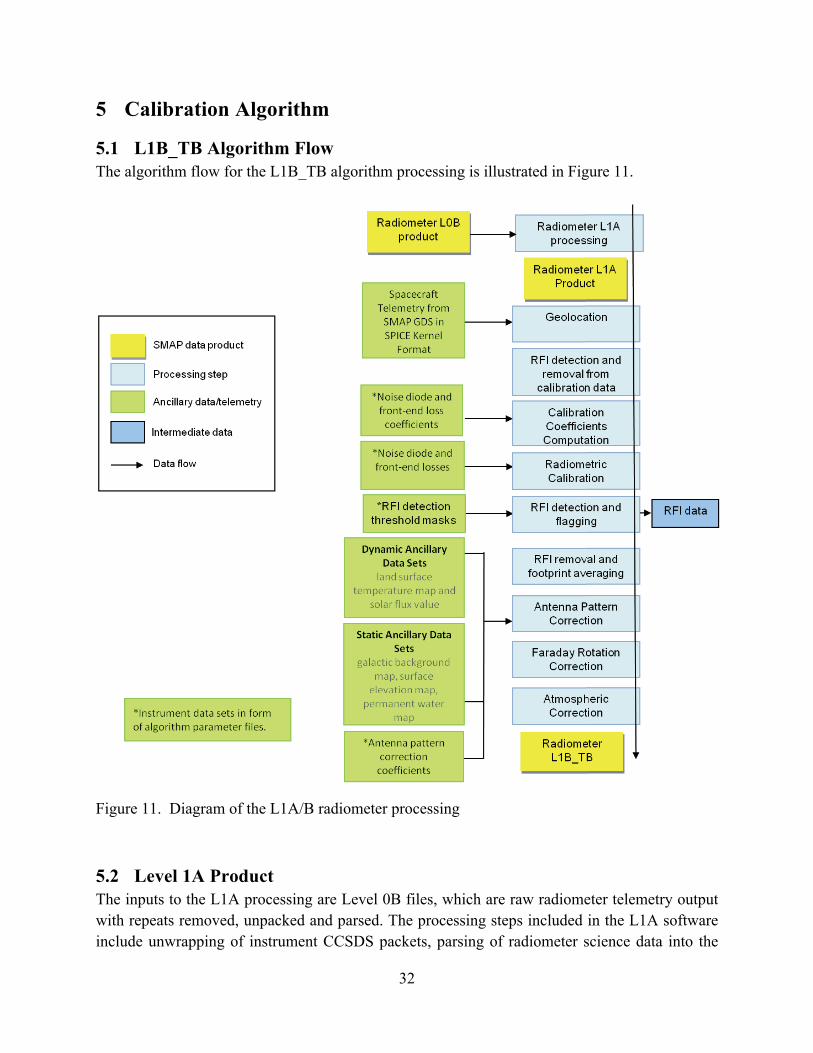
5.1 L1B_TB Algorithm Flow The algorithm flow for the L1B_TB algorithm processing is illustrated in Figure 11.
Figure 11. Diagram of the L1A/B radiometer processing
5.2 Level 1A Product The inputs to the L1A processing are Level 0B files, which are raw radiometer telemetry output with repeats removed, unpacked and parsed. The processing steps included in the L1A software include unwrapping of instrument CCSDS packets, parsing of radiometer science data into the
33
various radiometric states, storing of time stamps for science data as well as housekeeping telemetry such as temperature, voltage and current monitor points converted to engineering units for each antenna scan. L0 data will be archived but not be made available to the public. It is important to note that the raw science data is preserved in the L1A product allowing re-processing of data. The parameters that are part of the L1A product are defined in the Radiometer Level 1A Product Specification Document.
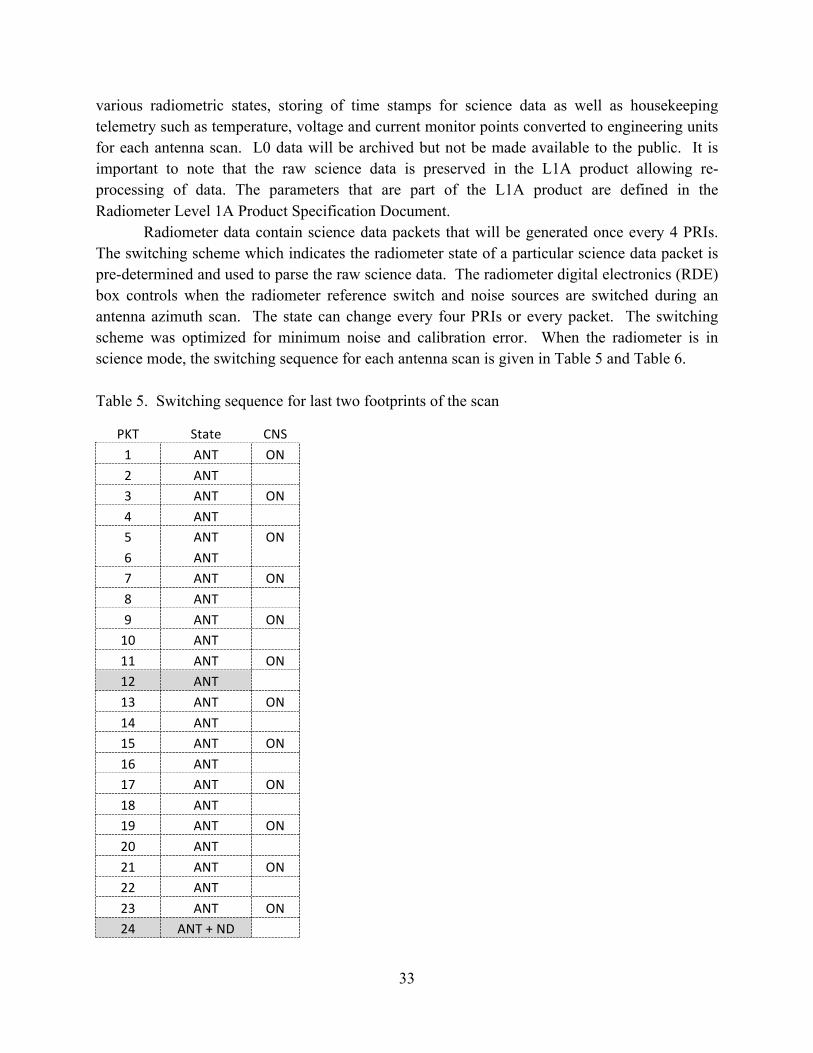
Radiometer data contain science data packets that will be generated once every 4 PRIs. The switching scheme which indicates the radiometer state of a particular science data packet is pre-determined and used to parse the raw science data. The radiometer digital electronics (RDE) box controls when the radiometer reference switch and noise sources are switched during an antenna azimuth scan. The state can change every four PRIs or every packet. The switching scheme was optimized for minimum noise and calibration error. When the radiometer is in science mode, the switching sequence for each antenna scan is given in Table 5 and Table 6. Table 5. Switching sequence for last two footprints of the scan
PKT State CNS1 ANT ON2 ANT
3 ANT ON4 ANT
5 ANT ON6 ANT
7 ANT ON8 ANT
9 ANT ON10 ANT
11 ANT ON12 ANT
13 ANT ON14 ANT
15 ANT ON16 ANT
17 ANT ON18 ANT
19 ANT ON20 ANT
21 ANT ON22 ANT
23 ANT ON24 ANT+ND
34
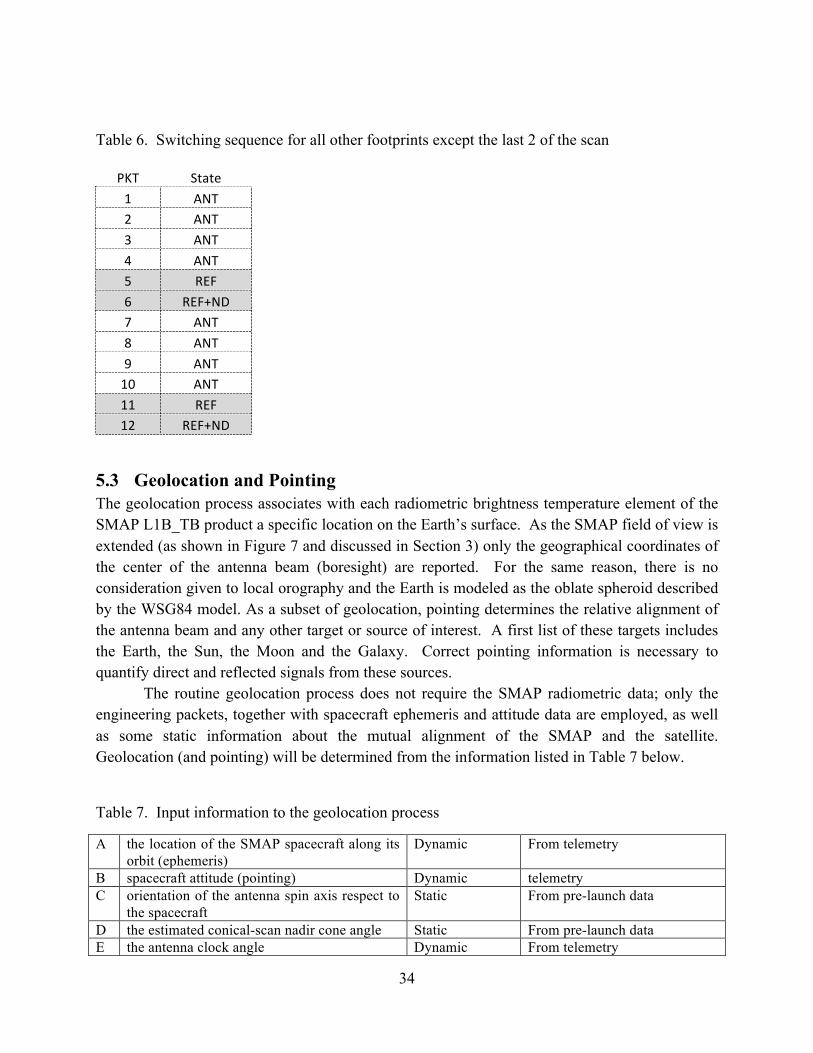
Table 6. Switching sequence for all other footprints except the last 2 of the scan
PKT State1 ANT2 ANT3 ANT4 ANT5 REF6 REF+ND7 ANT8 ANT9 ANT10 ANT11 REF12 REF+ND
5.3 Geolocation and Pointing The geolocation process associates with each radiometric brightness temperature element of the SMAP L1B_TB product a specific location on the Earth’s surface. As the SMAP field of view is extended (as shown in Figure 7 and discussed in Section 3) only the geographical coordinates of the center of the antenna beam (boresight) are reported. For the same reason, there is no consideration given to local orography and the Earth is modeled as the oblate spheroid described by the WSG84 model. As a subset of geolocation, pointing determines the relative alignment of the antenna beam and any other target or source of interest. A first list of these targets includes the Earth, the Sun, the Moon and the Galaxy. Correct pointing information is necessary to quantify direct and reflected signals from these sources.
The routine geolocation process does not require the SMAP radiometric data; only the engineering packets, together with spacecraft ephemeris and attitude data are employed, as well as some static information about the mutual alignment of the SMAP and the satellite. Geolocation (and pointing) will be determined from the information listed in Table 7 below.
Table 7. Input information to the geolocation process
A the location of the SMAP spacecraft along its orbit (ephemeris)
Dynamic From telemetry
B spacecraft attitude (pointing) Dynamic telemetry C orientation of the antenna spin axis respect to
the spacecraft Static From pre-launch data
D the estimated conical-scan nadir cone angle Static From pre-launch data E the antenna clock angle Dynamic From telemetry
35
From these five elements the geolocation process determines the point of intersection of the radiometer boresight vector with the WGS84 surface. This intersection is calculated for each IFOV.
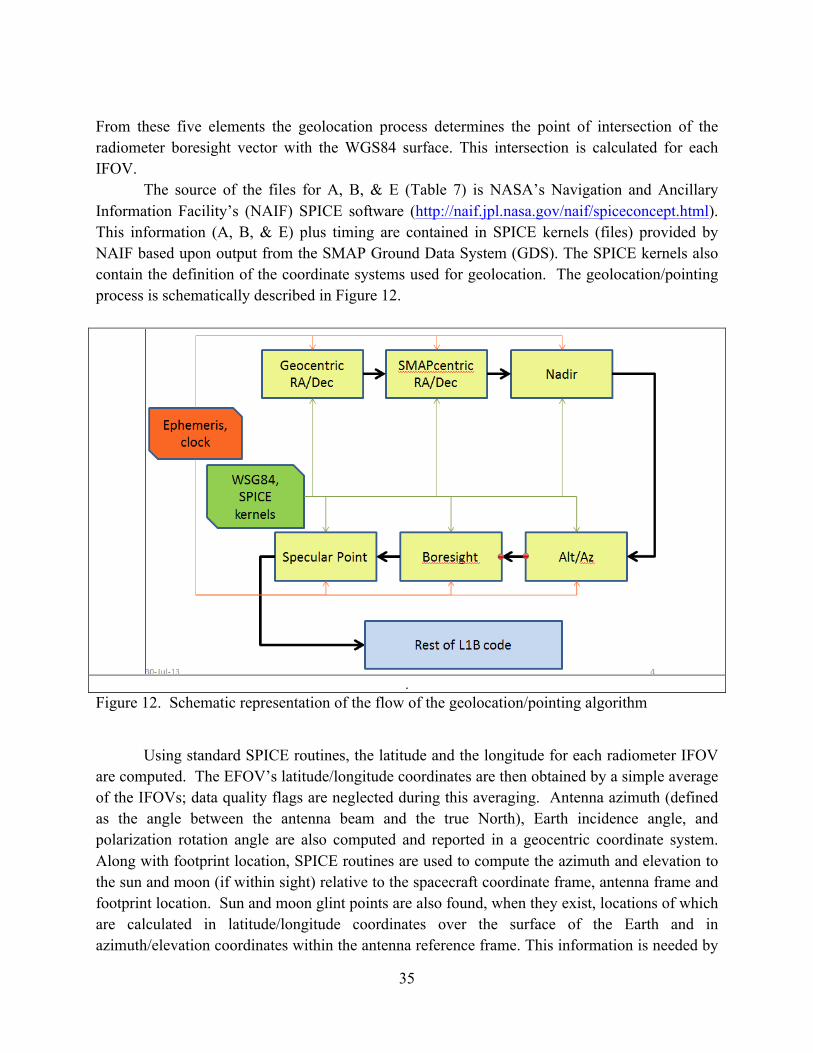
The source of the files for A, B, & E (Table 7) is NASA’s Navigation and Ancillary Information Facility’s (NAIF) SPICE software (http://naif.jpl.nasa.gov/naif/spiceconcept.html). This information (A, B, & E) plus timing are contained in SPICE kernels (files) provided by NAIF based upon output from the SMAP Ground Data System (GDS). The SPICE kernels also contain the definition of the coordinate systems used for geolocation. The geolocation/pointing process is schematically described in Figure 12.
.
Figure 12. Schematic representation of the flow of the geolocation/pointing algorithm
Using standard SPICE routines, the latitude and the longitude for each radiometer IFOV
are computed. The EFOV’s latitude/longitude coordinates are then obtained by a simple average of the IFOVs; data quality flags are neglected during this averaging. Antenna azimuth (defined as the angle between the antenna beam and the true North), Earth incidence angle, and polarization rotation angle are also computed and reported in a geocentric coordinate system. Along with footprint location, SPICE routines are used to compute the azimuth and elevation to the sun and moon (if within sight) relative to the spacecraft coordinate frame, antenna frame and footprint location. Sun and moon glint points are also found, when they exist, locations of which are calculated in latitude/longitude coordinates over the surface of the Earth and in azimuth/elevation coordinates within the antenna reference frame. This information is needed by
36
the antenna pattern correction (APC) segment to properly account for stray radiation into the Earth-viewing sidelobes of antenna beam. During maneuvers, when the antenna main beam does not intersect the Earth’s surface (e.g., during cold sky calibration), the boresight direction will be reported in galactic coordinates right ascension and declination.
Referring to the L1 processing flow in Figure 11, the geolocation input data are combined with the raw radiometer output (counts) data to form the L1A radiometer data product. The geolocation process is performed during the generation of the L1B product because the geolocation product is connected with later processing steps in the L1B flow. As will be discussed later, the Faraday correction and the APC (for example) depend upon the knowledge of the antenna pointing and geolocation
5.3.1 Radiometer geolocation and radar geolocation compatibility The boresight vectors of the radiometer and radar are not necessarily the same, although the difference is expected to be insignificant when compared to the radiometer geolocation accuracy requirement (4 km accuracy per Table 1).
Although the SMAP radar is expected to achieve higher precision geolocation/pointing knowledge than the radiometer, radar geolocation information will not be used to generate the L1B_TB product. The 12-hour latency requirement on the L1B_TB product and the long computation time for the radar geolocation solution leave only a very short window in which to perform all the L1B_TB processing steps. Nonetheless, the L1B_TB geolocation described in this section is compatible with higher level SMAP data products such as L2_SM_AP that involve combined passive and active retrievals.
5.4 Nonlinearity Correction For each of the v and h channels, nonlinearity correction is performed on the sum of the second moment of the in-phase and second moment of the quadrature signal components. See Figure 13. Correction coefficients and their temperature dependencies will be measured during pre-launch calibration testing at GSFC. The correction algorithm operates directly on the uncalibrated detector count values C from the radiometer. The linearized count value Clin is expanded into a polynomial of raw counts C,
𝐶!"# = 𝐶 + 𝑐!𝐶! + 𝑐!𝐶!
(5.1)
The expansion coefficients c2 and c3 are expanded as functions of physical temperature: 𝑐!!𝑐!,! + 𝑐!,!𝛥𝑇 + 𝑐!,!𝛥𝑇!
37
(5.2)
𝑐!!𝑐!,! + 𝑐!,!𝛥𝑇 + 𝑐!,!𝛥𝑇! (5.3)
where ∆𝑇 = 𝑇!,! − 𝑇!"#!
(5.4)
is the deviation of the detector temperature Tp,0 from a reference temperature Tref0.
5.5 Calibration Coefficients Computation Prior to radiometric calibration, calibration coefficients are computed and these values are stored in the L1B_TB product. Instrument parameter files containing noise diode and front end loss coefficients are used to compute noise diode and front end losses. These losses are used in subsequent equations in the TA calibration algorithm. These instrument parameter files will be made time dependent which takes into account component drifts.
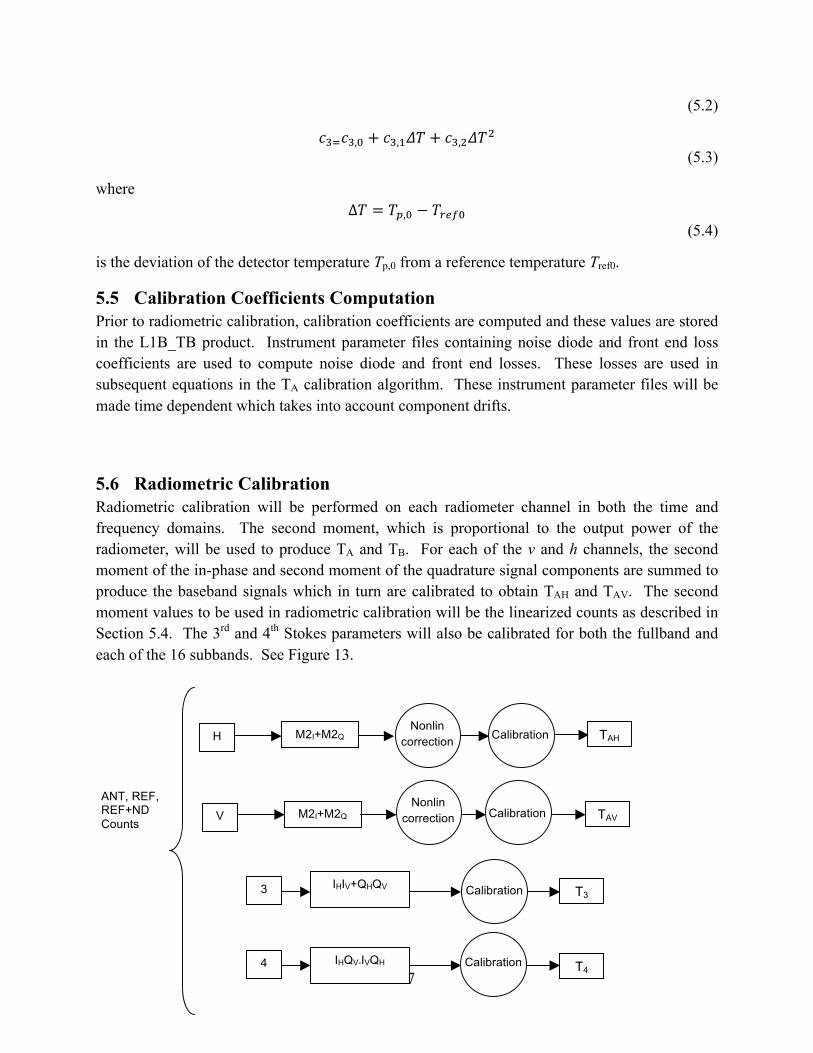
5.6 Radiometric Calibration Radiometric calibration will be performed on each radiometer channel in both the time and frequency domains. The second moment, which is proportional to the output power of the radiometer, will be used to produce TA and TB. For each of the v and h channels, the second moment of the in-phase and second moment of the quadrature signal components are summed to produce the baseband signals which in turn are calibrated to obtain TAH and TAV. The second moment values to be used in radiometric calibration will be the linearized counts as described in Section 5.4. The 3rd and 4th Stokes parameters will also be calibrated for both the fullband and each of the 16 subbands. See Figure 13.
ANT, REF, REF+ND Counts
Calibration IHIV+QHQV T3 3
Calibration IHQV-IVQH
T4 4
H Calibration TAH M2I+M2Q Nonlin
correction
V
Calibration TAV M2I+M2Q Nonlin
correction
38
Figure 13. Calibration of radiometer counts
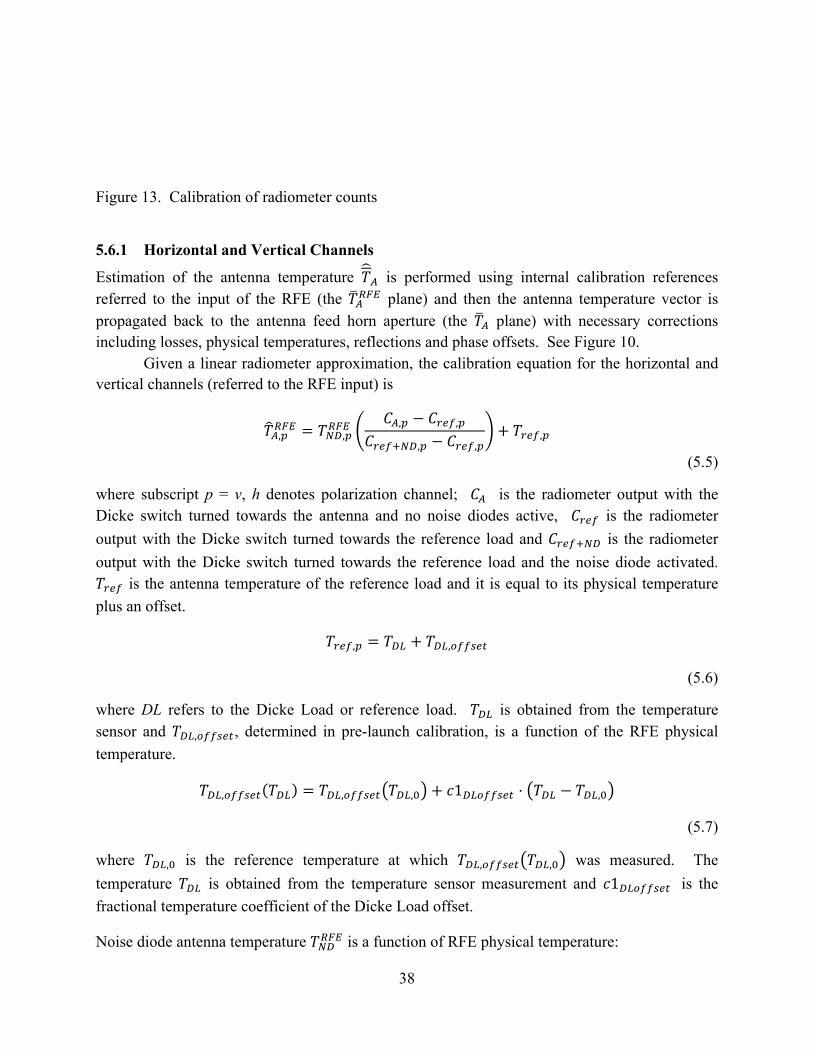
5.6.1 Horizontal and Vertical Channels
Estimation of the antenna temperature 𝑇! is performed using internal calibration references referred to the input of the RFE (the 𝑇!!"# plane) and then the antenna temperature vector is propagated back to the antenna feed horn aperture (the 𝑇! plane) with necessary corrections including losses, physical temperatures, reflections and phase offsets. See Figure 10.
Given a linear radiometer approximation, the calibration equation for the horizontal and vertical channels (referred to the RFE input) is
𝑇!,!!"# = 𝑇!",!!"# 𝐶!,! − 𝐶!"#,!𝐶!"#!!",! − 𝐶!"#,!
+ 𝑇!"#,!
(5.5)
where subscript p = v, h denotes polarization channel; 𝐶! is the radiometer output with the Dicke switch turned towards the antenna and no noise diodes active, 𝐶!"# is the radiometer output with the Dicke switch turned towards the reference load and 𝐶!"#!!" is the radiometer output with the Dicke switch turned towards the reference load and the noise diode activated. 𝑇!"# is the antenna temperature of the reference load and it is equal to its physical temperature plus an offset.
𝑇!"#,! = 𝑇!" + 𝑇!",!""#$%
(5.6)
where DL refers to the Dicke Load or reference load. 𝑇!" is obtained from the temperature sensor and 𝑇!",!""#$%, determined in pre-launch calibration, is a function of the RFE physical temperature.
𝑇!",!""#$% 𝑇!" = 𝑇!",!""#$% 𝑇!",! + 𝑐1!"#$$%&' · 𝑇!" − 𝑇!",!
(5.7)
where 𝑇!",! is the reference temperature at which 𝑇!",!""#$% 𝑇!",! was measured. The temperature 𝑇!" is obtained from the temperature sensor measurement and 𝑐1!"#$$%&' is the fractional temperature coefficient of the Dicke Load offset.
Noise diode antenna temperature 𝑇!"!"# is a function of RFE physical temperature:
39
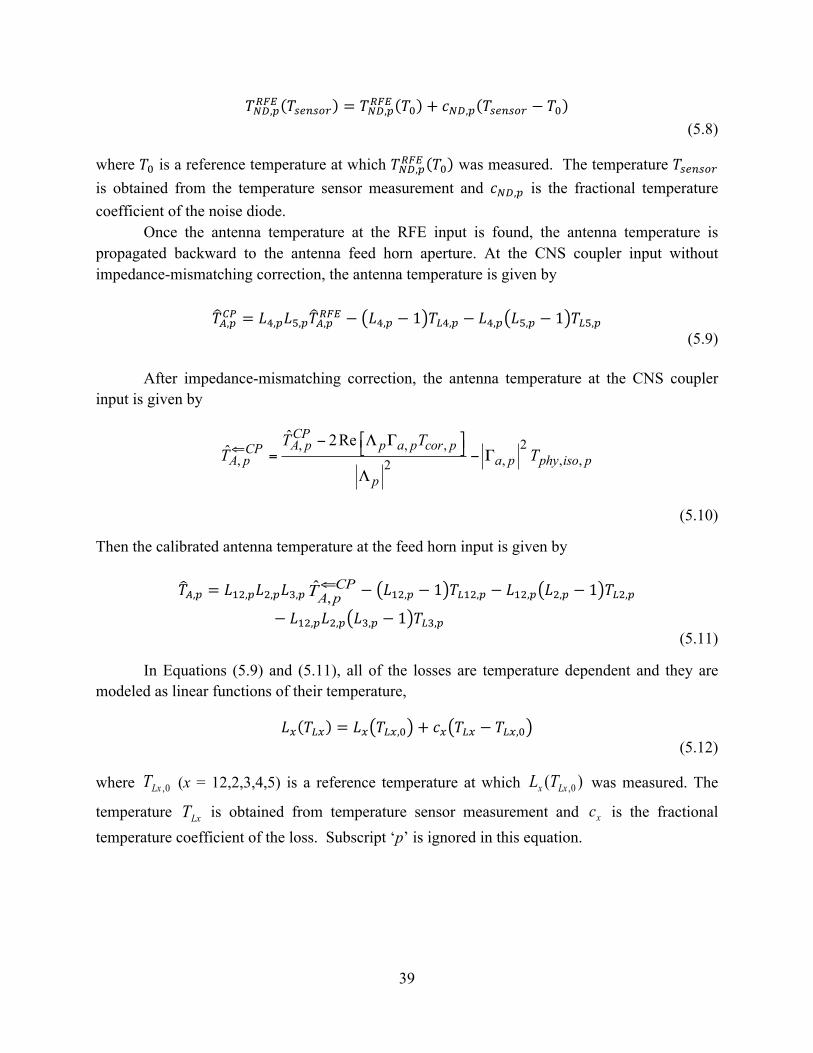
𝑇!",!!"# 𝑇!"#!$% = 𝑇!",!!"# 𝑇! + 𝑐!",! 𝑇!"#!$% − 𝑇! (5.8)
where 𝑇! is a reference temperature at which 𝑇!",!!"# 𝑇! was measured. The temperature 𝑇!"#!$% is obtained from the temperature sensor measurement and 𝑐!",! is the fractional temperature coefficient of the noise diode.
Once the antenna temperature at the RFE input is found, the antenna temperature is propagated backward to the antenna feed horn aperture. At the CNS coupler input without impedance-mismatching correction, the antenna temperature is given by
𝑇!,!!" = 𝐿!,!𝐿!,!𝑇!,!!"# − 𝐿!,! − 1 𝑇!!,! − 𝐿!,! 𝐿!,! − 1 𝑇!!,!
(5.9)
After impedance-mismatching correction, the antenna temperature at the CNS coupler input is given by
2, , ,, , , ,2
ˆ 2Reˆ
CPA p p a p cor pCP
A p a p phy iso pp
T TT T⇐
⎡ ⎤− Λ Γ⎣ ⎦= − ΓΛ
(5.10)
Then the calibrated antenna temperature at the feed horn input is given by
𝑇!,! = 𝐿!",!𝐿!,!𝐿!,! ,ˆ CPA pT⇐ − 𝐿!",! − 1 𝑇!!!,! − 𝐿!",! 𝐿!,! − 1 𝑇!!,!
− 𝐿!",!𝐿!,! 𝐿!,! − 1 𝑇!!,! (5.11)
In Equations (5.9) and (5.11), all of the losses are temperature dependent and they are modeled as linear functions of their temperature,
𝐿! 𝑇!" = 𝐿! 𝑇!",! + 𝑐! 𝑇!" − 𝑇!",! (5.12)
where 0,LxT (x = 12,2,3,4,5) is a reference temperature at which )( 0,Lxx TL was measured. The
temperature LxT is obtained from temperature sensor measurement and xc is the fractional temperature coefficient of the loss. Subscript ‘p’ is ignored in this equation.
40
5.6.2 Third and Fourth Stokes Parameters The 3rd and 4th Stokes channel characteristics can be calibrated using the noise diode and the reference load as well. With and without the noise diode coupled into the receiver when the Dicke switch is switched to the reference load, the radiometer responses are given by
34
344,
3,
4443
3433
4,
3,
O
OTT
GGGG
CC
RFEref
RFEref
ref
ref
=
+⎥⎥⎦
⎤
⎢⎢⎣
⎡⎥⎦
⎤⎢⎣
⎡=⎥
⎦
⎤⎢⎣
⎡
(5.13)
344,
3,
4443
3433
344,4,
3,3,
4443
3433
4,
3,
OTT
GGGG
OTTTT
GGGG
CC
RFEND
RFEND
RFEND
RFEref
RFEND
RFEref
NDref
NDref
+⎥⎥⎦
⎤
⎢⎢⎣
⎡⎥⎦
⎤⎢⎣
⎡=
+⎥⎥⎦
⎤
⎢⎢⎣
⎡
+
+⎥⎦
⎤⎢⎣
⎡=⎥
⎦
⎤⎢⎣
⎡
+
+
(5.14)
where RFExNDT , (x = 3,4) is the 3rd/4th Stokes antenna temperature of the noise diode referenced to
the RFE input. RFExrefT , (x = 3,4) is the 3rd/4th Stokes antenna temperature of the reference loads
and they are equal to zero. 34O is offset vector corresponding zero input response. The difference between Equations (5.14) and (5.13) gives
⎥⎥⎦
⎤
⎢⎢⎣
⎡⎥⎦
⎤⎢⎣
⎡=⎥
⎦
⎤⎢⎣
⎡
−
−
+
+RFEND
RFEND
refNDref
refNDref
TT
GGGG
CCCC
4,
3,
4443
3433
4,4,
3,3,
(5.15)
If the radiometer channel phase imbalance is stable or if it can be measured during pre-launch calibration, then for a radiometer with digital back end, the gain matrix in Equation (5.13) for the 3rd and 4th Stokes channel can be represented by
( ) ( )( ) ( )⎥⎦
⎤⎢⎣
⎡
ΔΔ−
ΔΔ=⎥
⎦
⎤⎢⎣
⎡
θθ
θθ
cossinsincos
4&34443
3433 GGGGG
(5.16)
where 4&3G is the gain magnitude of 3rd/4th Stokes channel; θΔ is the channel phase imbalance counted from calibration reference plane to radiometer output.
Let
41
( )( )⎥⎦
⎤⎢⎣
⎡
Δ
Δ=
⎥⎥⎦
⎤
⎢⎢⎣
⎡
ND
NDRFENDRFE
ND
RFEND TTT
ϑ
ϑ
sincos
4&3,4,
3,
(5.17)
where NDϑΔ is the noise diode channel phase imbalance referenced to the RFE input. RFENDT 4&3, is
the antenna temperature of the noise diode 3rd/4th Stokes parameters referenced to the RFE input. Then the gain magnitude of 3rd/4th Stokes channel is estimated by
( ) ( ) ( ) ( )RFEND
NDrefNDrefNDrefNDref
T
CCCCG
4&3,
4,4,3,3,4&3
sincosˆ ϑθϑθ Δ−Δ−−Δ−Δ−= ++ .
(5.18)
Assume that impedance-mismatching status is unchanged when the Dicke switch works between the antenna and the reference load. When the Dicke switch turns toward the antenna, the radiometer output response is given by
344,
3,
4443
3433
4,
3, OTT
GGGG
CC
RFEA
RFEA
A
A +⎥⎥⎦
⎤
⎢⎢⎣
⎡⎥⎦
⎤⎢⎣
⎡=⎥
⎦
⎤⎢⎣
⎡ .
(5.19)
Then the estimated 3rd and 4th Stokes parameters are given by
( ) ( )( ) ( )
( ) ( )( ) ( )
4&3
4,3,
4,3,
4,3,
4,3,
4,
3,ˆ
cossinsincos
cossinsincos
ˆˆ
G
CcCcCC
CCCC
TT refref
refref
AA
AA
RFEA
RFEA
⎥⎦
⎤⎢⎣
⎡
Δ+Δ
Δ−Δ−⎥⎦
⎤⎢⎣
⎡
Δ+Δ
Δ−Δ
=⎥⎥⎦
⎤
⎢⎢⎣
⎡ θθ
θθ
θθ
θθ
.
(5.20)
The 3rd and 4th Stokes parameters at the feed horn input can be derived by
⎥⎥⎦
⎤
⎢⎢⎣
⎡Δ=
⎥⎥⎦
⎤
⎢⎢⎣
⎡−−
= =∏ ∏ RFE
A
RFEA
m nhnvmhv
A
A
TT
MPLLLLTT
4,
3,14&3
15
2
5
2,,,12,12
4,
3,
ˆˆ
)(ˆˆ
ψ
(5.21)
where ( ) ( )( ) ( )⎥⎦
⎤⎢⎣
⎡
ΔΔ−
ΔΔ=Δ
ψψ
ψψψ
cossinsincos
)(P
(5.22)
⎥⎦
⎤⎢⎣
⎡
ΛΛΛΛ
ΛΛ−ΛΛ= **
**
4&3 ReImImRe
hvhv
hvhvM
(5.23)
42
where ψΔ is the phase imbalance between v and h channels counted from feed horn to the RFE input.
5.7 Radio Frequency Interference (RFI) SMAP’s radiometer passband lies within the 1400-1427 MHz Earth Exploration Satellite Service (EESS) passive frequency allocation. Both unauthorized in-band transmitters as well as out-of-band emissions from transmitters operating at frequencies adjacent to this allocated spectrum have been documented as sources of radio frequency interference to the L-band radiometers on SMOS and on Aquarius. This is a serious issue that is expected to be present during the SMAP mission lifetime and SMAP will be the first space borne radiometer to fly a dedicated subsystem to enable detection and mitigation of RFI [Piepmeier et.al 2014].
The radiometer instrument architecture provides science data with time-frequency diversity enabling the use of multiple RFI detection methods. The RFI detection and mitigation algorithms are part of the L1B processing which will be performed in ground processing. See Figure 11. Previous airborne and ground based experiments were assessed to predict the RFI environment SMAP will be facing. SMAPVEX08 was one such campaign which provided a comprehensive database of RFI present in the United States [Park et. al 2011]. Since a number of RFI detection methods were demonstrated during these campaigns, a combination of these methods is incorporated into the RFI detection algorithm for SMAP. A pulse detection method as well as cross frequency and kurtosis detection methods are employed. The third and fourth Stokes parameters are also included with the primary purpose of RFI detection. A maximum probability of detection algorithm is used to combine the outputs of each detection method. Data indicated as RFI within a footprint are removed and the rest averaged to produce the antenna temperature, TA, for that footprint. RFI detection algorithms (except the kurtosis algorithm which operates on raw moments) are performed on calibrated data or TA referenced to the feed horn.
5.7.1 RFI Sources Satellite data sets such as that from SMOS and Aquarius are of limited utility in classifying source types i.e. pulsed, narrowband, wideband etc. Airborne data sets can provide more details on this type of information. The sources of L-band RFI are critical to SMAP. The RFI model described below takes into consideration two main types of RFI: pulsed and CW. They represent the main sources of RFI at L-band known from literature, the spectrum engineering community and airborne field campaigns. The airborne campaign, SMAPVEX08 showed most US RFI to be either pulsed or narrowband (CW) type with a wideband example occurring only once in the campaign which comprised over 100 flight hours. Wideband continuous sources at low levels which occupy ~4 MHz or more are a concern since they are difficult to detect using either frequency or time based algorithms. These broadband sources can potentially be detected by polarimetric and kurtosis detection. Polarimetric and kurtosis detection of wideband sources will
43
be evaluated using test data since these examples are lacking from airborne data and indeterminate from existing satellite data.
RFI simulations have been performed for pulsed (e.g., radar) and CW-type (e.g., spurious emission) RFI sources to determine algorithm performance of various detection methods. It is shown that the detection strategies described below can effectively mitigate these main sources of L-band RFI. Since the RFI environment is uncertain, other RFI types will be studied to evaluate algorithm performance. The algorithm response to signals such as QPSK, OFDM, etc. will be studied via test rather than simulations which were previously done for pulsed and CW sources.
5.8 RFI Detection Algorithm Theory
5.8.1 Pulse or Time Domain Detection The pulse or time domain detection algorithm searches in the time domain for increased levels of observed antenna temperatures above that produced by geophysical properties. The algorithm is also referred to as asynchronous pulse blanking since no periodic properties of the RFI are assumed. This detection method is best suited to detect RFI with large amplitudes and short duration times or duty cycles, properties inherent to air surveillance radar signals which are classified as pulsed RFI. These radar pulses or pulsed RFI below the 1400 MHz passive frequency allocation, range from 2 to 400 µs in length and occur 1-75 ms apart [Ellingson, 2003]. In order to detect these pulses, the standard asynchronous pulse blanking algorithm calculates a running mean and standard deviation used to threshold data. The robust mean and standard deviation can be estimated from each time window without the largest N% of samples. If a time domain sample is a certain number of standard deviations above the mean, the algorithm flags it as RFI. The number of standard deviations used to threshold data determines the false alarm rate or FAR. The robust estimator, however, removes outliers in the noise distribution which tends to artificially reduce the standard deviation and increases the FAR. This can be overcome by determining the standard deviation of the system temperature a priori since it does not vary significantly with time. The adaptive mean calculation is still necessary to account for variability in the scene. Previous pulse blanking algorithms also flag and blank a preset number of samples before and after each detection to include any multipath components that may be associated with the detected pulses [Niamsuwan et. al, 2005].
5.8.2 Cross Frequency Detection The cross frequency detection algorithm is similar to the pulse detection algorithm except that it searches for increased levels of antenna temperatures which are recorded in multiple frequency channels. This detection algorithm performs best on narrow band sources whose frequency resolution is matched to that of the measurement; however, no RFI properties are assumed in the algorithm. The algorithm consists of thresholding in the frequency domain. A robust mean and
44
standard deviation can be estimated for each time subsample without the largest N channels and like the pulse detector, antenna temperatures a certain number of standard deviations above the mean are flagged as corrupted with the threshold level determining the FAR. Like the time domain algorithm, the standard deviation can also be estimated using the system temperature but the adaptive mean calculation is still required. This detection method has been shown to be more sensitive to CW RFI while the pulse and kurtosis detectors are more insensitive to this kind of RFI [Güner et. al, 2010].
5.8.3 Kurtosis Detection Natural thermal emission incident on a space-borne radiometer and the thermal noise generated by the receiver hardware itself are both random in nature. The kurtosis algorithm makes use of the randomness of the incoming signal to detect RFI. Thermally generated radiometric sources have an amplitude probability distribution function that is Gaussian in nature, whereas man-made RFI sources tend to have a non-Gaussian distribution [Ruf et al., 2006]. The kurtosis algorithm measures the deviation from normality of the incoming radiometric source to detect the presence of interfering sources.
The kurtosis detection algorithm uses higher order central moments of the incoming signal than the 2nd central moment measured by a square-law detector in a total power radiometer. The nth central moment of a signal is given by
( ) ( )( )nn txtxm −=
(5.24)
where x(t) is the pre-detection voltage and <·> represents the expectation of the measured signal. The kurtosis is the ratio of the 4th central moment to the square of the 2nd central moment,
or
22
4
mm
=κ
(5.25)
The kurtosis equals three when the incoming signal is purely Gaussian distributed and in most cases deviates from three if there is a non-normal (typically man-made) interfering source present. The kurtosis statistic is independent of the 2nd central moment of the signal, i.e., the kurtosis value is not affected by natural variations in the antenna temperature of the scene being observed.
The kurtosis estimate itself behaves like a random variable since it is generally calculated from a finite sample set [Kenney and Keeping, 1962]. Estimates of the kurtosis have a standard deviation associated with them, and there is a corresponding kurtosis threshold for detecting RFI.
45
If the sample size is sufficiently large (> N = 50,000 [DeRoo et al., 2007]), the kurtosis estimate exhibits a normal distribution.
5.8.4 Polarimetric detection Natural scenes have highly variable horizontal and vertical brightness temperatures but the 3rd and 4th Stokes parameters are nearly always zero unless RFI is present [Pardé et. al, 2011]. SMAP has included the 3rd and 4th Stokes parameters for both the fullband and each of the 16 subbands. RFI can be detected by looking for unusually large variations in the 3rd and 4th Stokes parameters.
5.8.5 RFI Model Air-traffic control radars and early warning radars are expected to be sources of RFI at L-Band [Piepmeier et al., 2006]. A general expression is considered as the model for RFI which provides for the possibility of multiple pulsed-sinusoidal sources. It is given by
(5.26)
where n(t)~N(0,σ2) is normally distributed with zero mean and standard deviation σ. A is the amplitude of the RFI source, f is the frequency, φ is the phase shift, t0 represents the center of the ON pulse of the duty-cycle, w is the width of the pulse and T is the integration period. The ratio (d=w/T) represents the duty-cycle of the RFI source. The frequency, f, is assumed to be uniformly distributed between [0, B] where B is the bandwidth of the radiometer. The terms φ and t0 are assumed to be uniformly distributed over [0, 2π] and [0,T] respectively. N is the total number of RFI sources.
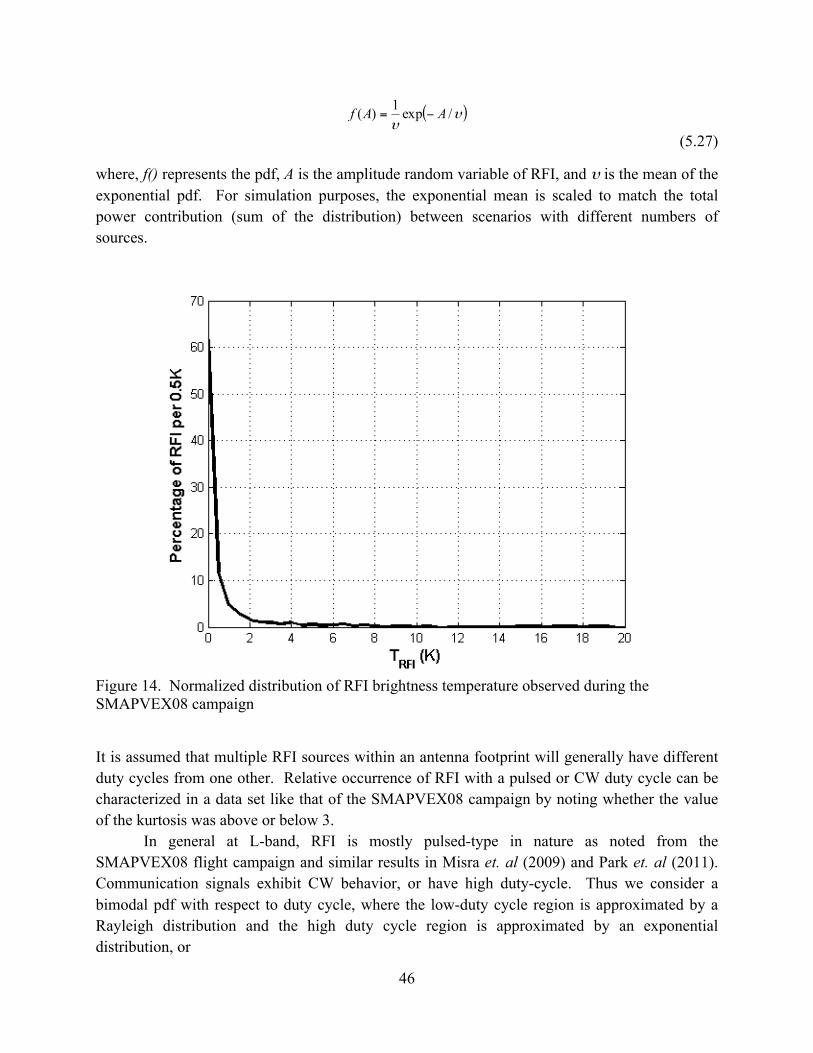
The model described in Equation (5.26) has two undetermined random variables associated with it: the amplitude A and the duty cycle d. Within an antenna footprint it is expected that the various RFI sources would have a variety of power levels. In addition, the side lobes will see an RFI source differently than the main lobe of an antenna does. As a result, A is modeled as a random variable. In order to obtain characteristic data of a typical RFI amplitude distribution, the SMAPVEX08 campaign was used. Figure 14 shows the distribution of RFI power observed during the campaign, specifically the percent of total RFI present within 0.5 K bins from 0 to 20 K. The distribution of RFI power is seen to be exponential in nature, consisting primarily of low-power RFI with a much lower probability of high-power sources. Assuming the SMAPVEX08 data are representative of RFI in general, the amplitude probability density function (pdf) can be expressed as
( ) ( ) ( )∑=
⎟⎟⎠
⎞⎜⎜⎝
⎛ −++=
N
i iiii w
ttrecttfAtntx1
02cos φπ
[ ]Tt ,0∈
46
( )υυ
/exp1)( AAf −=
(5.27)
where, f() represents the pdf, A is the amplitude random variable of RFI, and υ is the mean of the exponential pdf. For simulation purposes, the exponential mean is scaled to match the total power contribution (sum of the distribution) between scenarios with different numbers of sources.
Figure 14. Normalized distribution of RFI brightness temperature observed during the SMAPVEX08 campaign
It is assumed that multiple RFI sources within an antenna footprint will generally have different duty cycles from one other. Relative occurrence of RFI with a pulsed or CW duty cycle can be characterized in a data set like that of the SMAPVEX08 campaign by noting whether the value of the kurtosis was above or below 3.
In general at L-band, RFI is mostly pulsed-type in nature as noted from the SMAPVEX08 flight campaign and similar results in Misra et. al (2009) and Park et. al (2011). Communication signals exhibit CW behavior, or have high duty-cycle. Thus we consider a bimodal pdf with respect to duty cycle, where the low-duty cycle region is approximated by a Rayleigh distribution and the high duty cycle region is approximated by an exponential distribution, or
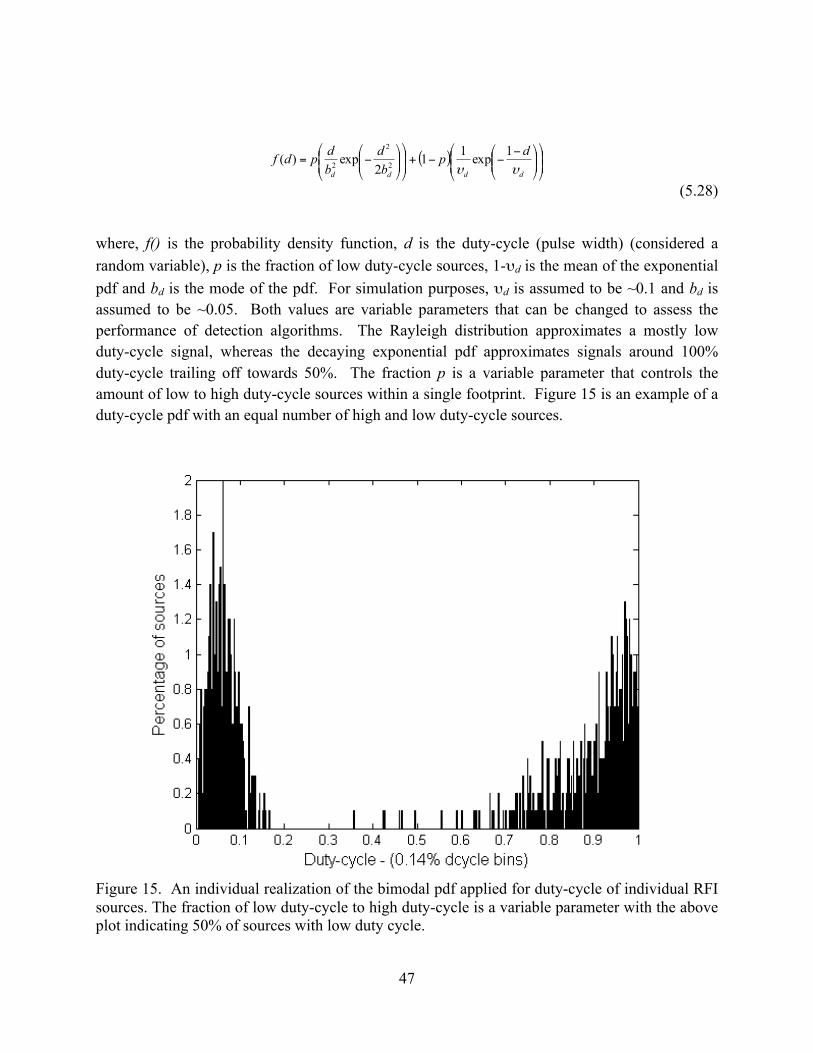
47
( ) ⎟⎟⎠
⎞⎜⎜⎝
⎛⎟⎟⎠
⎞⎜⎜⎝
⎛ −−−+⎟
⎟⎠
⎞⎜⎜⎝
⎛⎟⎟⎠
⎞⎜⎜⎝
⎛−=
dddd
dpbd
bdpdf
υυ1exp11
2exp)( 2
2
2
(5.28)
where, f() is the probability density function, d is the duty-cycle (pulse width) (considered a random variable), p is the fraction of low duty-cycle sources, 1-υd is the mean of the exponential pdf and bd is the mode of the pdf. For simulation purposes, υd is assumed to be ~0.1 and bd is assumed to be ~0.05. Both values are variable parameters that can be changed to assess the performance of detection algorithms. The Rayleigh distribution approximates a mostly low duty-cycle signal, whereas the decaying exponential pdf approximates signals around 100% duty-cycle trailing off towards 50%. The fraction p is a variable parameter that controls the amount of low to high duty-cycle sources within a single footprint. Figure 15 is an example of a duty-cycle pdf with an equal number of high and low duty-cycle sources.
Figure 15. An individual realization of the bimodal pdf applied for duty-cycle of individual RFI sources. The fraction of low duty-cycle to high duty-cycle is a variable parameter with the above plot indicating 50% of sources with low duty cycle.
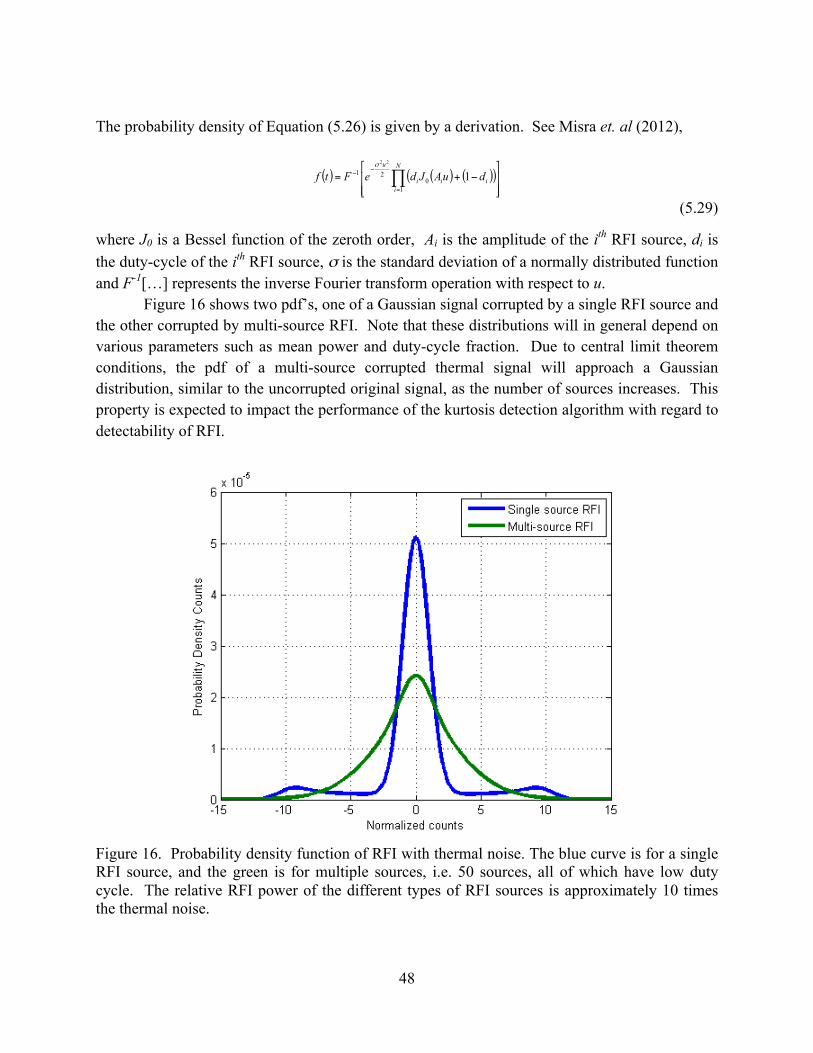
48
The probability density of Equation (5.26) is given by a derivation. See Misra et. al (2012),
(5.29)
where J0 is a Bessel function of the zeroth order, Ai is the amplitude of the ith RFI source, di is the duty-cycle of the ith RFI source, σ is the standard deviation of a normally distributed function and F-1[…] represents the inverse Fourier transform operation with respect to u.
Figure 16 shows two pdf’s, one of a Gaussian signal corrupted by a single RFI source and the other corrupted by multi-source RFI. Note that these distributions will in general depend on various parameters such as mean power and duty-cycle fraction. Due to central limit theorem conditions, the pdf of a multi-source corrupted thermal signal will approach a Gaussian distribution, similar to the uncorrupted original signal, as the number of sources increases. This property is expected to impact the performance of the kurtosis detection algorithm with regard to detectability of RFI.
Figure 16. Probability density function of RFI with thermal noise. The blue curve is for a single RFI source, and the green is for multiple sources, i.e. 50 sources, all of which have low duty cycle. The relative RFI power of the different types of RFI sources is approximately 10 times the thermal noise.
( ) ( ) ( )( )⎥⎥⎦
⎤
⎢⎢⎣
⎡−+= ∏
=
−−N
iiii
u
duAJdeFtf1
021 122σ
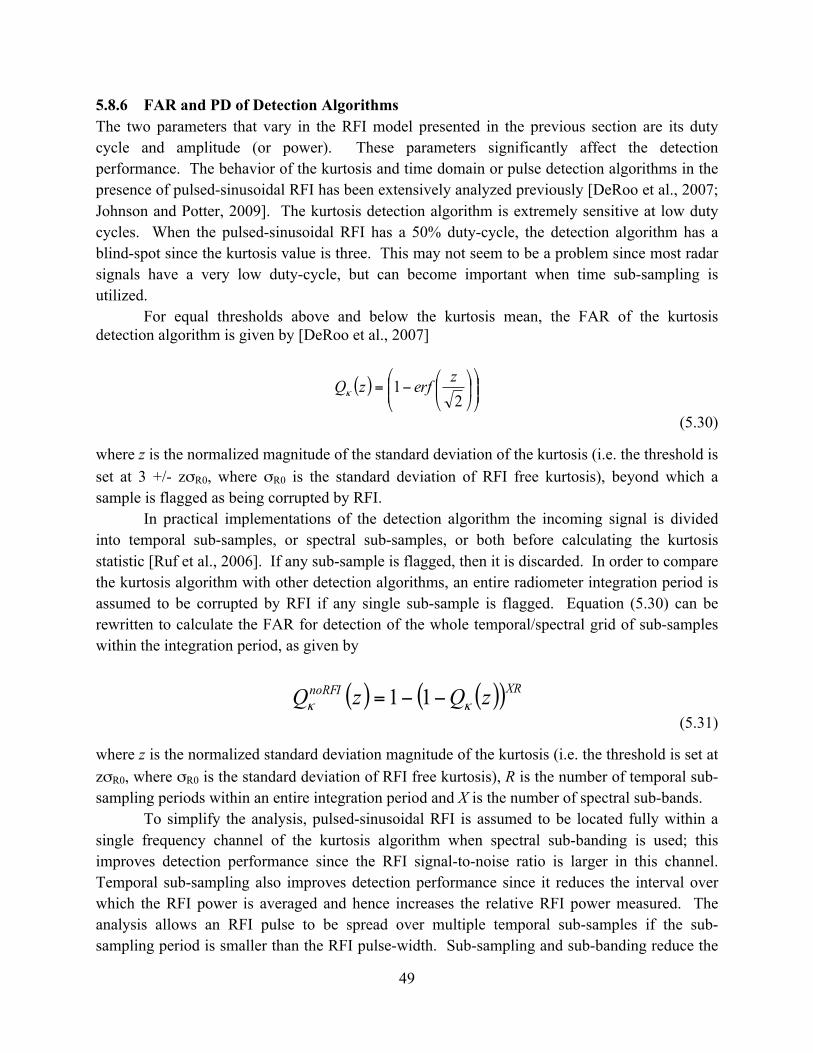
49
5.8.6 FAR and PD of Detection Algorithms The two parameters that vary in the RFI model presented in the previous section are its duty cycle and amplitude (or power). These parameters significantly affect the detection performance. The behavior of the kurtosis and time domain or pulse detection algorithms in the presence of pulsed-sinusoidal RFI has been extensively analyzed previously [DeRoo et al., 2007; Johnson and Potter, 2009]. The kurtosis detection algorithm is extremely sensitive at low duty cycles. When the pulsed-sinusoidal RFI has a 50% duty-cycle, the detection algorithm has a blind-spot since the kurtosis value is three. This may not seem to be a problem since most radar signals have a very low duty-cycle, but can become important when time sub-sampling is utilized.
For equal thresholds above and below the kurtosis mean, the FAR of the kurtosis detection algorithm is given by [DeRoo et al., 2007]
( ) ⎟⎟⎠
⎞⎜⎜⎝
⎛⎟⎠
⎞⎜⎝
⎛−=
21 zerfzQκ
(5.30)
where z is the normalized magnitude of the standard deviation of the kurtosis (i.e. the threshold is set at 3 +/- zσR0, where σR0 is the standard deviation of RFI free kurtosis), beyond which a sample is flagged as being corrupted by RFI.
In practical implementations of the detection algorithm the incoming signal is divided into temporal sub-samples, or spectral sub-samples, or both before calculating the kurtosis statistic [Ruf et al., 2006]. If any sub-sample is flagged, then it is discarded. In order to compare the kurtosis algorithm with other detection algorithms, an entire radiometer integration period is assumed to be corrupted by RFI if any single sub-sample is flagged. Equation (5.30) can be rewritten to calculate the FAR for detection of the whole temporal/spectral grid of sub-samples within the integration period, as given by
( ) ( )( )XRnoRFI zQzQ κκ −−= 11 (5.31)
where z is the normalized standard deviation magnitude of the kurtosis (i.e. the threshold is set at zσR0, where σR0 is the standard deviation of RFI free kurtosis), R is the number of temporal sub-sampling periods within an entire integration period and X is the number of spectral sub-bands.
To simplify the analysis, pulsed-sinusoidal RFI is assumed to be located fully within a single frequency channel of the kurtosis algorithm when spectral sub-banding is used; this improves detection performance since the RFI signal-to-noise ratio is larger in this channel. Temporal sub-sampling also improves detection performance since it reduces the interval over which the RFI power is averaged and hence increases the relative RFI power measured. The analysis allows an RFI pulse to be spread over multiple temporal sub-samples if the sub-sampling period is smaller than the RFI pulse-width. Sub-sampling and sub-banding reduce the
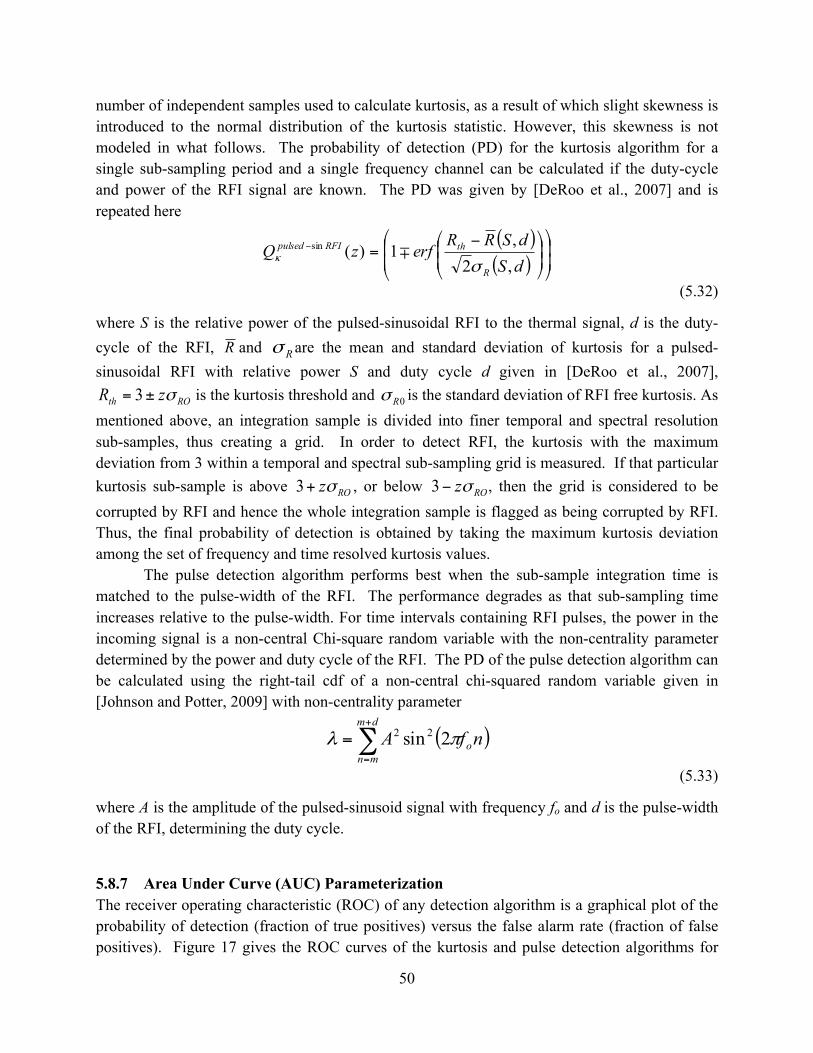
50
number of independent samples used to calculate kurtosis, as a result of which slight skewness is introduced to the normal distribution of the kurtosis statistic. However, this skewness is not modeled in what follows. The probability of detection (PD) for the kurtosis algorithm for a single sub-sampling period and a single frequency channel can be calculated if the duty-cycle and power of the RFI signal are known. The PD was given by [DeRoo et al., 2007] and is repeated here
( )( ) ⎟
⎟
⎠
⎞
⎜⎜
⎝
⎛⎟⎟⎠
⎞⎜⎜⎝
⎛ −=−
dSdSRR
erfzQR
thRFIpulsed
,2,
1)(sin
σκ ∓
(5.32)
where S is the relative power of the pulsed-sinusoidal RFI to the thermal signal, d is the duty-cycle of the RFI, R and Rσ are the mean and standard deviation of kurtosis for a pulsed-sinusoidal RFI with relative power S and duty cycle d given in [DeRoo et al., 2007],
ROth zR σ±= 3 is the kurtosis threshold and 0Rσ is the standard deviation of RFI free kurtosis. As mentioned above, an integration sample is divided into finer temporal and spectral resolution sub-samples, thus creating a grid. In order to detect RFI, the kurtosis with the maximum deviation from 3 within a temporal and spectral sub-sampling grid is measured. If that particular kurtosis sub-sample is above ROzσ+3 , or below ROzσ−3 , then the grid is considered to be corrupted by RFI and hence the whole integration sample is flagged as being corrupted by RFI. Thus, the final probability of detection is obtained by taking the maximum kurtosis deviation among the set of frequency and time resolved kurtosis values.
The pulse detection algorithm performs best when the sub-sample integration time is matched to the pulse-width of the RFI. The performance degrades as that sub-sampling time increases relative to the pulse-width. For time intervals containing RFI pulses, the power in the incoming signal is a non-central Chi-square random variable with the non-centrality parameter determined by the power and duty cycle of the RFI. The PD of the pulse detection algorithm can be calculated using the right-tail cdf of a non-central chi-squared random variable given in [Johnson and Potter, 2009] with non-centrality parameter
( )∑+
=
=dm
mnonfA πλ 2sin22
(5.33)
where A is the amplitude of the pulsed-sinusoid signal with frequency fo and d is the pulse-width of the RFI, determining the duty cycle.
5.8.7 Area Under Curve (AUC) Parameterization The receiver operating characteristic (ROC) of any detection algorithm is a graphical plot of the probability of detection (fraction of true positives) versus the false alarm rate (fraction of false positives). Figure 17 gives the ROC curves of the kurtosis and pulse detection algorithms for
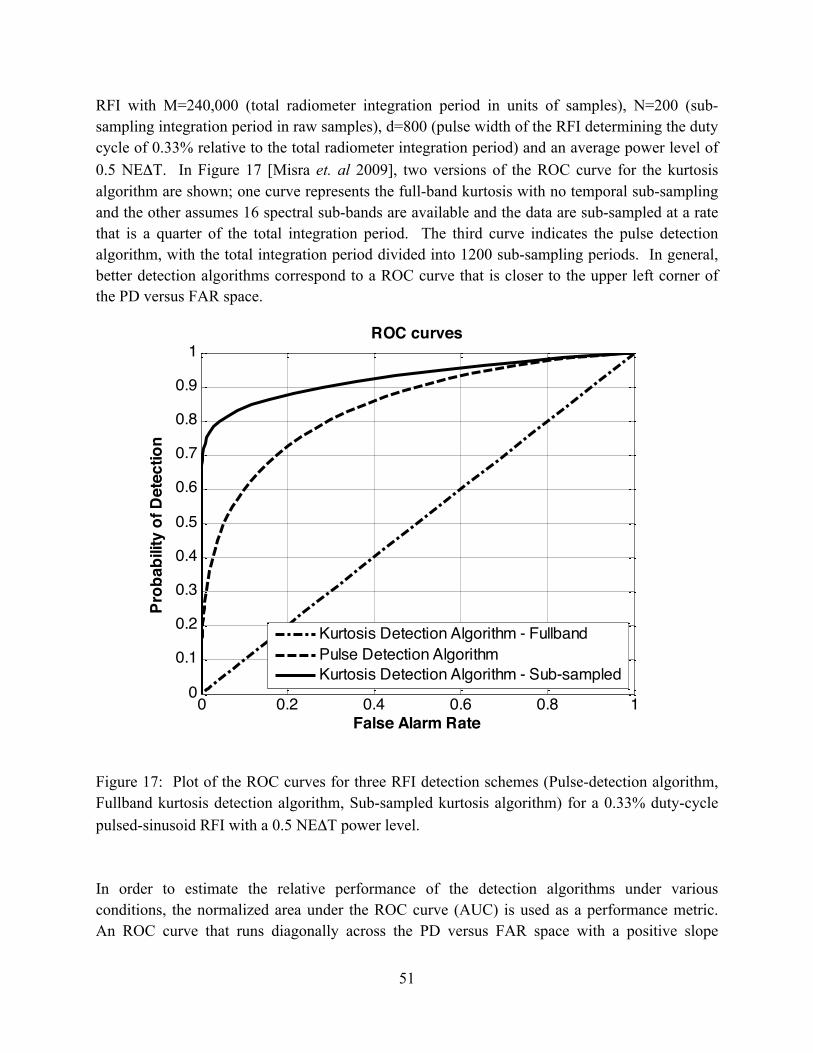
51
RFI with M=240,000 (total radiometer integration period in units of samples), N=200 (sub-sampling integration period in raw samples), d=800 (pulse width of the RFI determining the duty cycle of 0.33% relative to the total radiometer integration period) and an average power level of 0.5 NEΔT. In Figure 17 [Misra et. al 2009], two versions of the ROC curve for the kurtosis algorithm are shown; one curve represents the full-band kurtosis with no temporal sub-sampling and the other assumes 16 spectral sub-bands are available and the data are sub-sampled at a rate that is a quarter of the total integration period. The third curve indicates the pulse detection algorithm, with the total integration period divided into 1200 sub-sampling periods. In general, better detection algorithms correspond to a ROC curve that is closer to the upper left corner of the PD versus FAR space.
Figure 17: Plot of the ROC curves for three RFI detection schemes (Pulse-detection algorithm, Fullband kurtosis detection algorithm, Sub-sampled kurtosis algorithm) for a 0.33% duty-cycle pulsed-sinusoid RFI with a 0.5 NEΔT power level. In order to estimate the relative performance of the detection algorithms under various conditions, the normalized area under the ROC curve (AUC) is used as a performance metric. An ROC curve that runs diagonally across the PD versus FAR space with a positive slope
0 0.2 0.4 0.6 0.8 10
0.1
0.2
0.3
0.4
0.5
0.6
0.7
0.8
0.9
1ROC curves
False Alarm Rate
Prob
abili
ty o
f Det
ectio
n
Kurtosis Detection Algorithm - FullbandPulse Detection AlgorithmKurtosis Detection Algorithm - Sub-sampled
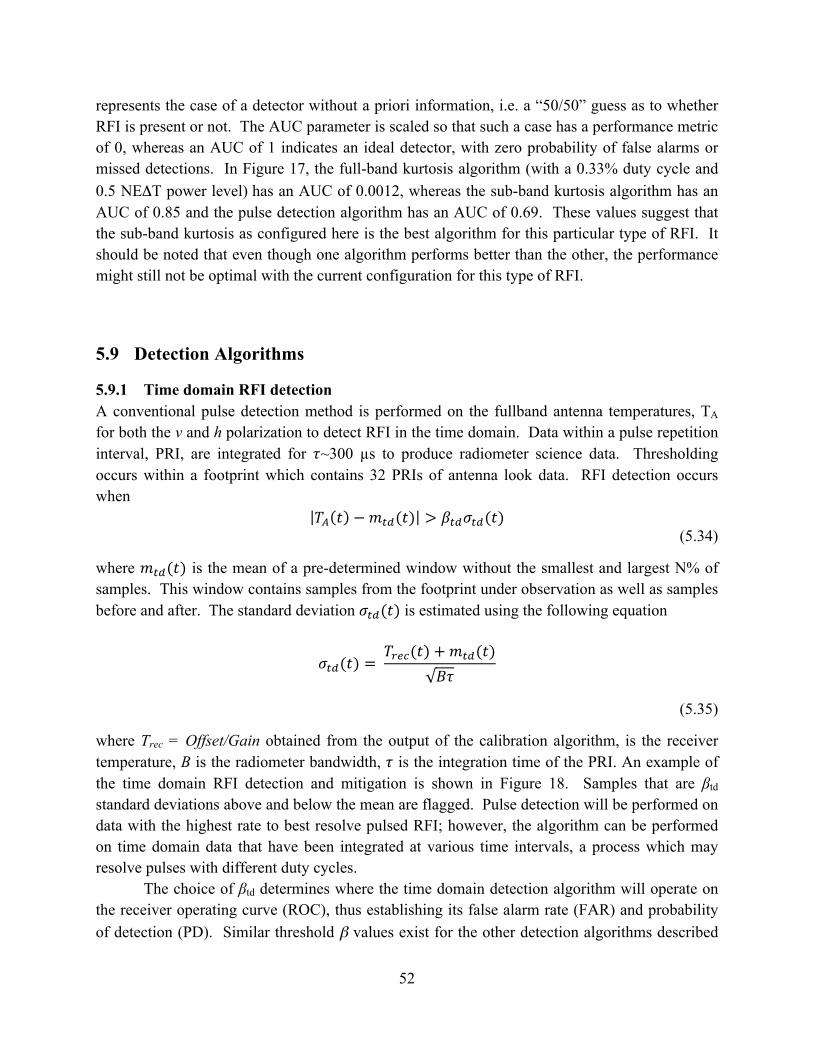
52
represents the case of a detector without a priori information, i.e. a “50/50” guess as to whether RFI is present or not. The AUC parameter is scaled so that such a case has a performance metric of 0, whereas an AUC of 1 indicates an ideal detector, with zero probability of false alarms or missed detections. In Figure 17, the full-band kurtosis algorithm (with a 0.33% duty cycle and 0.5 NEΔT power level) has an AUC of 0.0012, whereas the sub-band kurtosis algorithm has an AUC of 0.85 and the pulse detection algorithm has an AUC of 0.69. These values suggest that the sub-band kurtosis as configured here is the best algorithm for this particular type of RFI. It should be noted that even though one algorithm performs better than the other, the performance might still not be optimal with the current configuration for this type of RFI.
5.9 Detection Algorithms
5.9.1 Time domain RFI detection A conventional pulse detection method is performed on the fullband antenna temperatures, TA for both the v and h polarization to detect RFI in the time domain. Data within a pulse repetition interval, PRI, are integrated for 𝜏~300 µs to produce radiometer science data. Thresholding occurs within a footprint which contains 32 PRIs of antenna look data. RFI detection occurs when
𝑇! 𝑡 −𝑚!"(𝑡) > 𝛽!"𝜎!"(𝑡) (5.34)
where 𝑚!"(𝑡) is the mean of a pre-determined window without the smallest and largest N% of samples. This window contains samples from the footprint under observation as well as samples before and after. The standard deviation 𝜎!"(𝑡) is estimated using the following equation
𝜎!"(𝑡) = 𝑇!"#(𝑡)+𝑚!"(𝑡)
𝐵𝜏
(5.35)
where Trec = Offset/Gain obtained from the output of the calibration algorithm, is the receiver temperature, B is the radiometer bandwidth, 𝜏 is the integration time of the PRI. An example of the time domain RFI detection and mitigation is shown in Figure 18. Samples that are βtd standard deviations above and below the mean are flagged. Pulse detection will be performed on data with the highest rate to best resolve pulsed RFI; however, the algorithm can be performed on time domain data that have been integrated at various time intervals, a process which may resolve pulses with different duty cycles.
The choice of βtd determines where the time domain detection algorithm will operate on the receiver operating curve (ROC), thus establishing its false alarm rate (FAR) and probability of detection (PD). Similar threshold β values exist for the other detection algorithms described
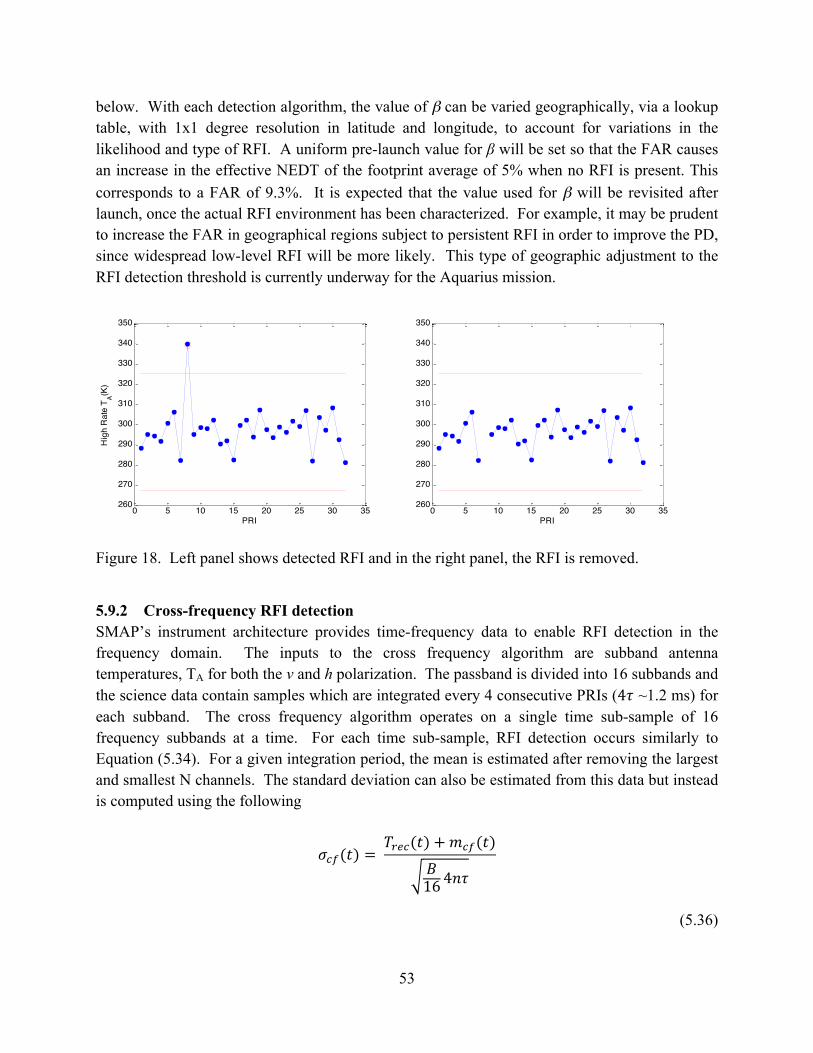
53
below. With each detection algorithm, the value of β can be varied geographically, via a lookup table, with 1x1 degree resolution in latitude and longitude, to account for variations in the likelihood and type of RFI. A uniform pre-launch value for β will be set so that the FAR causes an increase in the effective NEDT of the footprint average of 5% when no RFI is present. This corresponds to a FAR of 9.3%. It is expected that the value used for β will be revisited after launch, once the actual RFI environment has been characterized. For example, it may be prudent to increase the FAR in geographical regions subject to persistent RFI in order to improve the PD, since widespread low-level RFI will be more likely. This type of geographic adjustment to the RFI detection threshold is currently underway for the Aquarius mission.
Figure 18. Left panel shows detected RFI and in the right panel, the RFI is removed.
5.9.2 Cross-frequency RFI detection SMAP’s instrument architecture provides time-frequency data to enable RFI detection in the frequency domain. The inputs to the cross frequency algorithm are subband antenna temperatures, TA for both the v and h polarization. The passband is divided into 16 subbands and the science data contain samples which are integrated every 4 consecutive PRIs (4𝜏 ~1.2 ms) for each subband. The cross frequency algorithm operates on a single time sub-sample of 16 frequency subbands at a time. For each time sub-sample, RFI detection occurs similarly to Equation (5.34). For a given integration period, the mean is estimated after removing the largest and smallest N channels. The standard deviation can also be estimated from this data but instead is computed using the following
𝜎!"(𝑡) = 𝑇!"#(𝑡)+𝑚!"(𝑡)
𝐵16 4𝑛𝜏
(5.36)
0 5 10 15 20 25 30 35260
270
280
290
300
310
320
330
340
350
Hig
h R
ate
T A(K)
PRI0 5 10 15 20 25 30 35
260
270
280
290
300
310
320
330
340
350
PRI
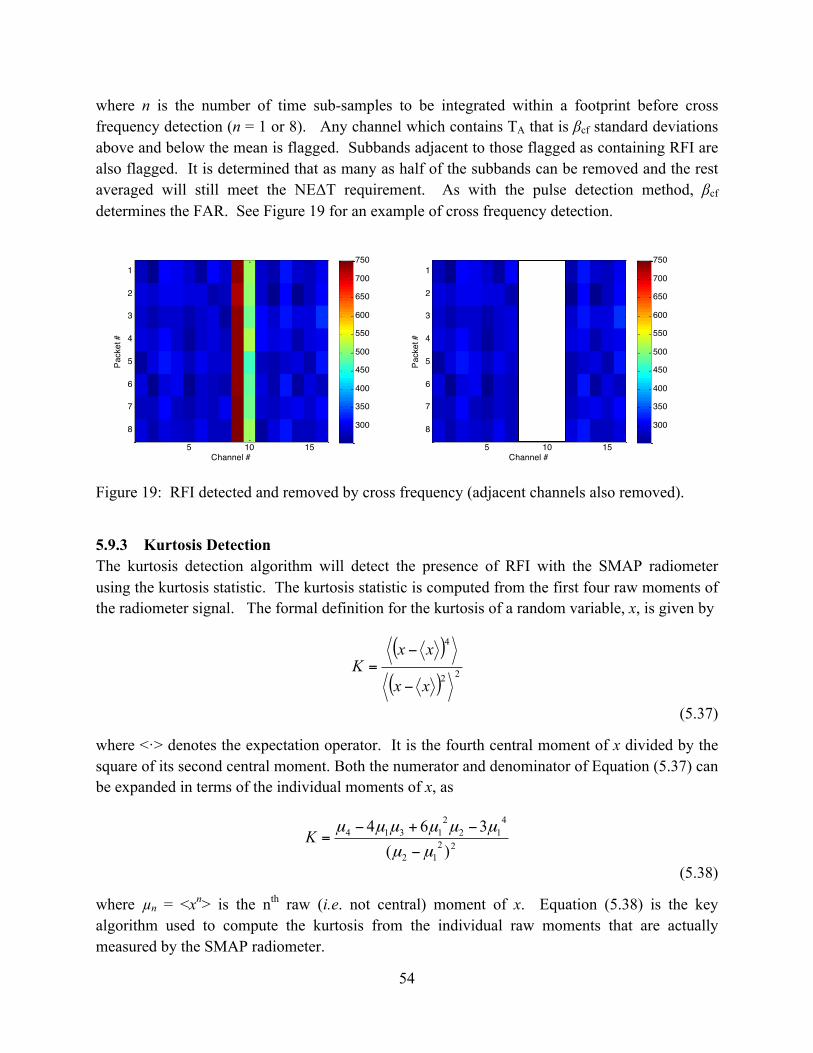
54
where n is the number of time sub-samples to be integrated within a footprint before cross frequency detection (n = 1 or 8). Any channel which contains TA that is βcf standard deviations above and below the mean is flagged. Subbands adjacent to those flagged as containing RFI are also flagged. It is determined that as many as half of the subbands can be removed and the rest averaged will still meet the NEΔT requirement. As with the pulse detection method, βcf determines the FAR. See Figure 19 for an example of cross frequency detection.
Figure 19: RFI detected and removed by cross frequency (adjacent channels also removed).
5.9.3 Kurtosis Detection The kurtosis detection algorithm will detect the presence of RFI with the SMAP radiometer using the kurtosis statistic. The kurtosis statistic is computed from the first four raw moments of the radiometer signal. The formal definition for the kurtosis of a random variable, x, is given by
( )
( )22
4
xx
xxK
−
−=
(5.37)
where <·> denotes the expectation operator. It is the fourth central moment of x divided by the square of its second central moment. Both the numerator and denominator of Equation (5.37) can be expanded in terms of the individual moments of x, as
2212
412
21314
)(364
µµ
µµµµµµ
−
−+−=K
(5.38)
where µn = <xn> is the nth raw (i.e. not central) moment of x. Equation (5.38) is the key algorithm used to compute the kurtosis from the individual raw moments that are actually measured by the SMAP radiometer.
Channel #
Pack
et #
5 10 15
1
2
3
4
5
6
7
8 300
350
400
450
500
550
600
650
700
750
Channel #
Pack
et #
5 10 15
1
2
3
4
5
6
7
8 300
350
400
450
500
550
600
650
700
750
55
The detection algorithm identifies statistically significant departures of the kurtosis from its expected value when only Gaussian distributed signals (i.e. signals of purely thermal emission origin) are present. The threshold for statistical significance is a parameter of the algorithm that can be adjusted to establish a desired probability of false alarm, probability of detection and RFI detection threshold. The detection algorithm operates on finely spaced subsamples of the data in both time and frequency in order to enable mitigation of the RFI. Subsamples in either/both time and frequency which have RFI detected in them are excluded from the averages of subsamples that are used in subsequent processing steps.
The kurtosis algorithm does not make use of cross-spectral or cross temporal information to aid in the detection of RFI. In addition, it does not vary the integration time over which the relevant statistics (the moments) are calculated, which will affect the duty cycle and hence, the detectability of the RFI.
The inputs to the kurtosis algorithm are samples of the first four raw moments which are used prior to any time or frequency averaging, i.e. with the shortest integration time and from each individual frequency subband (includes fullband). Equation (5.38) is applied separately to both I and Q components of the baseband signal for each frequency subband (includes fullband) and each radiometer channel (v and h).
The nominal Gaussian distributed kurtosis value for each radiometer subband (includes fullband) and the kurtosis threshold will be determined in pre-launch calibration. This is the value from which deviations are computed in order to identify RFI. The value is ideally equal to 3 for a system with infinitely many bits, but quantization effects will lower the actual value. The nominal kurtosis condition is a table of values for each frequency subband (includes fullband) and for each radiometer channel (v and h). For the SMAP radiometer, the nominal kurtosis deviates less than 0.1 % from 3. The kurtosis threshold is the deviation from the nominal kurtosis value beyond which a sample is considered to be corrupted by RFI. The value of this threshold determines the false alarm rate and probability of detection of RFI. For each time and frequency subsample, the value of the kurtosis is compared to the nominal Gaussian value and detection occurs if the deviation from the nominal value exceeds the threshold. Detection using kurtosis occurs if
𝐾 − 𝐾!"# > 𝛽!𝜎! (5.39)
where K is the measured kurtosis, Knom is the nominal kurtosis value, βK is the threshold value which determines FAR, and σK is the standard deviation of the measured kurtosis. As mentioned above, the threshold, 𝛽!, will in general depend on latitude and longitude as defined by a look up table with a 1x1 degree resolution and will be set prior to launch based on a set FAR. Initial values for σK will be determined by laboratory measurements prior to launch but may change on orbit due to instrument aging. For the case of the frequency subband channels, RFI is additionally flagged as being present in every subband adjacent to one in which RFI is actually detected according to Equation (5.39).
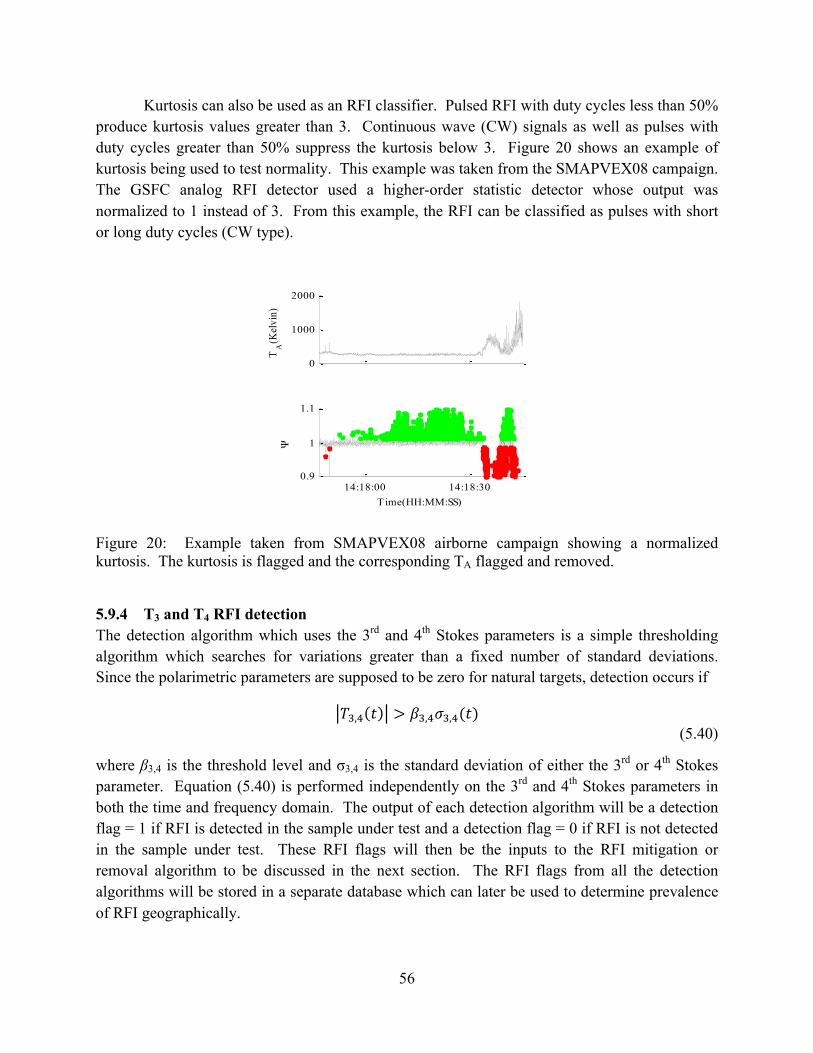
56
Kurtosis can also be used as an RFI classifier. Pulsed RFI with duty cycles less than 50% produce kurtosis values greater than 3. Continuous wave (CW) signals as well as pulses with duty cycles greater than 50% suppress the kurtosis below 3. Figure 20 shows an example of kurtosis being used to test normality. This example was taken from the SMAPVEX08 campaign. The GSFC analog RFI detector used a higher-order statistic detector whose output was normalized to 1 instead of 3. From this example, the RFI can be classified as pulses with short or long duty cycles (CW type).
Figure 20: Example taken from SMAPVEX08 airborne campaign showing a normalized kurtosis. The kurtosis is flagged and the corresponding TA flagged and removed.
5.9.4 T3 and T4 RFI detection The detection algorithm which uses the 3rd and 4th Stokes parameters is a simple thresholding algorithm which searches for variations greater than a fixed number of standard deviations. Since the polarimetric parameters are supposed to be zero for natural targets, detection occurs if
𝑇!,! 𝑡 > 𝛽!,!𝜎!,!(𝑡) (5.40)
where β3,4 is the threshold level and σ3,4 is the standard deviation of either the 3rd or 4th Stokes parameter. Equation (5.40) is performed independently on the 3rd and 4th Stokes parameters in both the time and frequency domain. The output of each detection algorithm will be a detection flag = 1 if RFI is detected in the sample under test and a detection flag = 0 if RFI is not detected in the sample under test. These RFI flags will then be the inputs to the RFI mitigation or removal algorithm to be discussed in the next section. The RFI flags from all the detection algorithms will be stored in a separate database which can later be used to determine prevalence of RFI geographically.
0
1000
2000
TA(Kelvin)
14:18:00 14:18:300.9
1
1.1
Time(HH:MM:SS)
Ψ
57
5.10 RFI Removal and Footprint Averaging Ground processing for the SMAP radiometer produces four different types of RFI detection flags as described above. Each of the detection algorithms has associated with it statistical properties of its performance – namely a probability density function (pdf) for the variable on which the detection decision is based and given a detection threshold to which that variable is compared, a probability of deciding RFI is present when it is not (the false alarm rate, or FAR) and a probability of deciding RFI is present when it is (the probability of detection, or PD). The probability of a missed detection is given by (1 – PD). The output of each individual RFI detection algorithm is an RFI flag that is set whenever its detection variable exceeds its detection threshold.
The composite maximum probability of detection (MPD) RFI detection algorithm is a logical OR of each of the individual RFI detection flags. Since the probability of missed detection is only partially correlated between individual flags, this can result in the detection of RFI by the MPD algorithm that was missed by one or more of the individual algorithms. Due to the logical OR operation, no RFI that is detected by any individual algorithm can ever be missed by the MPD algorithm thereby minimizing the probability of missed detection given the available individual flags.
5.10.1 Algorithm Implementation Details The individual RFI detection algorithms operate on data samples with different time and frequency resolution. Fullband measurements (covering the full 24 MHz passband) are available every 300 µs. From these measurements, fullband versions of each RFI flag are produced. Subband measurements (covering each of 16 subbands, of bandwidth 1.5 MHz each, across the 24 MHz passband) are available every 1.2 ms. From these measurements, 16 separate subband versions of each RFI flag are produced. Two versions of the MPD algorithm will be implemented: a fullband version every 300 µs and 16 subband versions every 1.2 ms. The philosophy of using a logical OR operation to combine individual flags is extended to these different MPD versions as well, in the following manner. If a fullband MPD flag is set high (indicating the presence of RFI), then all 16 subbands which include that time interval will be considered contaminated with RFI. RFI mitigation is accomplished by including in the final average only those second moment subband counts for which the composite MPD flag is not set.
5.10.2 Detection Algorithm Let the individual subband RFI detection flags be defined and indexed as ds(i,j,k) where: 1) i=1-11 refers to time steps in units of 1.2 ms for samples used in a single antenna temperature data product or footprint; 2) j=1-16 refers to subband number; and k=1-4 refers to RFI flag type (k=1 for “glitch” detection, k=2 for cross-spectrum detection, k=3 for kurtosis detection, and k=4 for polarimetric detection).
58
The MPD subband detection flag is defined and indexed as Ds(i,j) with the same time and frequency indices as those of the individual subband flags. The logical OR operation is given by
Ds (i,j) = OR (ds(i,j,1), ds(i,j,2), ds(i,j,3), ds(i,j,4)) (5.41)
Let the individual fullband RFI detection flags be defined and indexed as df(i,j,k) where: 1) i=1-11 refers to the (coarse) subband time step within which the fullband sample was taken; 2) j=1-4 refers to the subsample number of a fullband sample (taken every 300 µs within the 1.2 ms second time interval); and k=1-4 refers to RFI flag type (k=1 for “glitch” detection, k=2 for cross-spectrum detection, k=3 for kurtosis detection, and k=4 for polarimetric detection).
The MPD fullband detection flag is defined and indexed as Df(i,j) with the same coarse time and subsample number indices as those of the individual fullband flags. The logical OR operation for Df is given by
Df (i,j) = OR (df(i,j,1), df(i,j,2), df(i,j,3), df(i,j,4)) (5.42)
The composite MPD detection flag combines the Ds and Df flags and is defined as D(i,j), with the same time and frequency indices as those of the subband flags. Its logical OR operation is given by
D(i,j) = OR (Ds(i,j), Df(i,1), Df(i,2), Df(i,3), Df(i,4)) (5.43)
5.10.3 Mitigation Algorithm The mitigation algorithm will operate on the calibrated antenna temperatures TA, referenced to the feed horn. There are at most 11 consecutive time samples and 16 parallel subband samples of the TA that are averaged together to produce antenna temperature for a footprint. Let the TA that may be averaged together be defined and indexed similarly as the composite MPD flag, or TA(i,j) for i=1..11 and j = 1..16. The mitigated version of the calibrated antenna temperatures TA, is given by
11 16
1 1, 11 16
1 1
( , ) ( , )
( , )
Ai j
A fp
i j
T i j D i jT
D i j
= =
= =
∑ ∑
=
∑ ∑
(5.44)
where D(i,j) equals one if the RFI flag is set and zero if it is not set. TA,fp is the RFI-mitigated antenna temperature of a footprint.
59
5.10.4 RFI Flags The L1B_TB product reports TA before RFI mitigation, TA after RFI mitigation as well as the NEΔT for the TA of each footprint after RFI mitigation. The RFI mitigation algorithm therefore does not limit the amount of data that can be discarded before combining to form an RFI free TA for a footprint. Instead the L1B_TB product contains a 2 bit flag which indicates the quality of the TA for each footprint as well as a flag indicating the quality of the associated NEΔT. The RFI flag specifies if the individual TA is RFI free and no correction was necessary (i.e. none of the detectors indicated that RFI was present), RFI was detected and removed or RFI was detected but not removed, for example all the pixels for a given footprint were flagged for RFI. The quality flag for the associated NEΔT is a one bit flag indicating whether the NEΔT is good or bad based on a threshold to be determined by the Level 2 science algorithm team. See the Radiometer L1B Product Specification Document, TBD.
5.11 RFI Detection and Removal from Calibration Data The RFI detection and mitigation techniques described in previous sections are applied to calibrated antenna temperatures TA, referenced to the feed horn. The detection algorithms are performed on calibrated data to avoid detections due to power variations with frequency caused by the system passband response. Since the RFI detection algorithm is applied after conversion to TA, an RFI detection and mitigation algorithm must also be applied to the calibration data, i.e. the reference and reference plus noise diode counts. This reduces the risk of RFI corrupting the TA calibration. The RFI detection and mitigation performed on the reference and reference plus noise diode counts, is similarly done to that described above. The RFI detection algorithms (time domain, cross frequency and kurtosis) are used to check the reference and reference plus noise diode counts for RFI. The time domain and fullband kurtosis detection algorithms are applied to the fullband counts and the cross frequency and subband kurtosis detection algorithms are applied to the subband counts. Passband shapes for both the reference and reference plus noise diode states are used to “flatten” or normalize the subband counts before the cross frequency algorithm can be implemented on the calibration data counts without biasing the detection. The logical OR operation is subsequently performed on the resulting fullband RFI flags from the time domain and fullband kurtosis detection algorithms to produce a composite flag for fullband data. A similar logical OR operation is performed on the resulting RFI flags from the cross frequency and subband kurtosis detection algorithms to produce the composite flag for subband data. The respective composite flags indicate data points with RFI to be removed. The RFI free reference and reference plus noise diode data are used in the TA calibration to the feed horn routine. Polarimetric detection is not used since this detection algorithm requires calibrated data and RFI detection needs to be performed on count values in this portion of the algorithm. The time domain and cross frequency algorithms used here are single sided algorithms which threshold data by using a robust mean and standard deviation computed without the top N% of data.
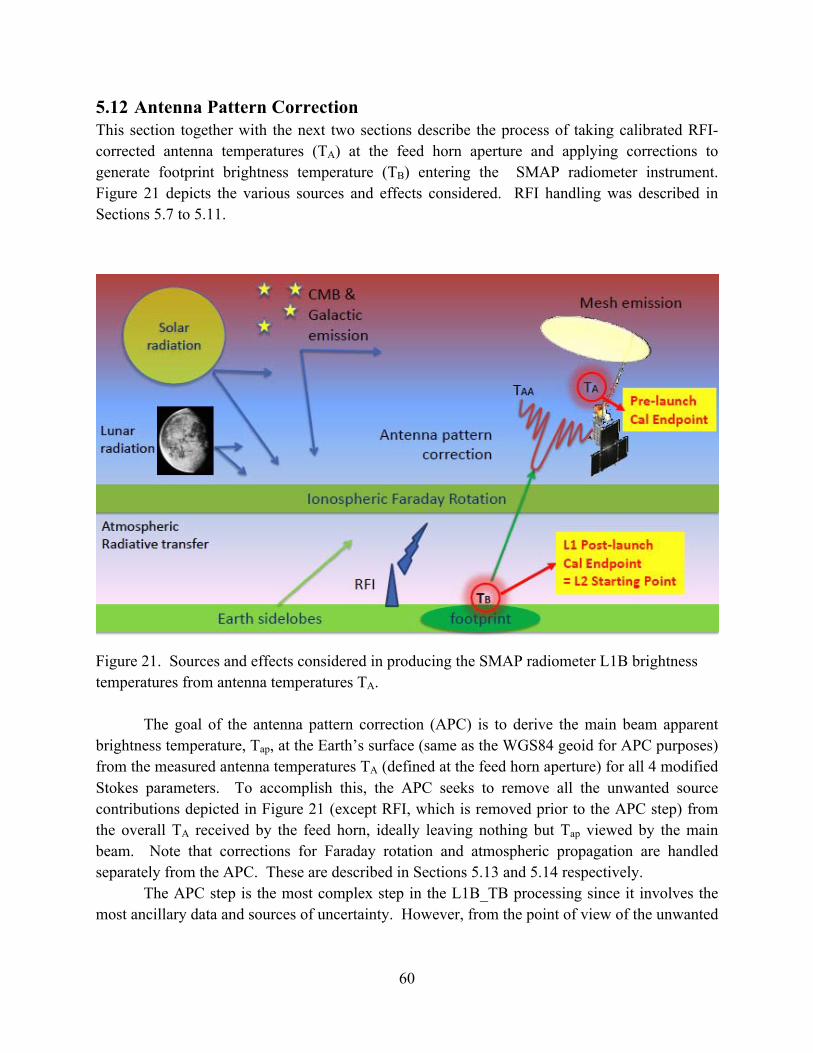
60
5.12 Antenna Pattern Correction This section together with the next two sections describe the process of taking calibrated RFI-corrected antenna temperatures (TA) at the feed horn aperture and applying corrections to generate footprint brightness temperature (TB) entering the SMAP radiometer instrument. Figure 21 depicts the various sources and effects considered. RFI handling was described in Sections 5.7 to 5.11.
Figure 21. Sources and effects considered in producing the SMAP radiometer L1B brightness temperatures from antenna temperatures TA.
The goal of the antenna pattern correction (APC) is to derive the main beam apparent brightness temperature, Tap, at the Earth’s surface (same as the WGS84 geoid for APC purposes) from the measured antenna temperatures TA (defined at the feed horn aperture) for all 4 modified Stokes parameters. To accomplish this, the APC seeks to remove all the unwanted source contributions depicted in Figure 21 (except RFI, which is removed prior to the APC step) from the overall TA received by the feed horn, ideally leaving nothing but Tap viewed by the main beam. Note that corrections for Faraday rotation and atmospheric propagation are handled separately from the APC. These are described in Sections 5.13 and 5.14 respectively.
The APC step is the most complex step in the L1B_TB processing since it involves the most ancillary data and sources of uncertainty. However, from the point of view of the unwanted
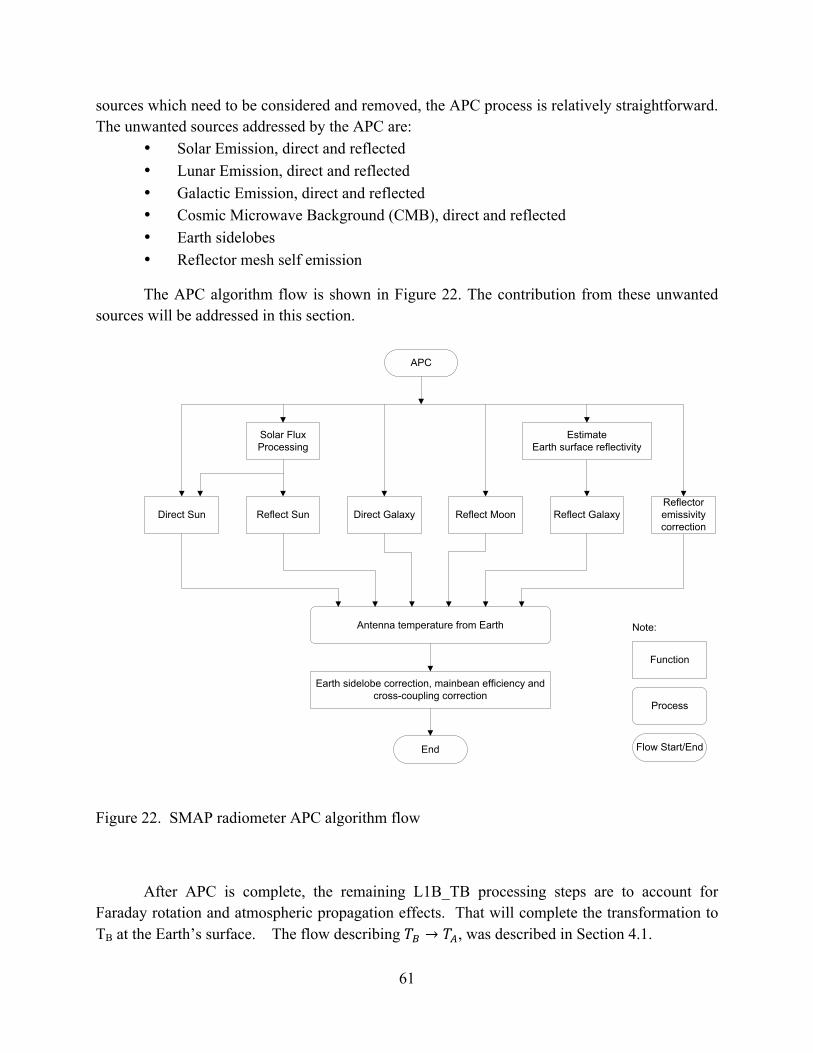
61
sources which need to be considered and removed, the APC process is relatively straightforward. The unwanted sources addressed by the APC are:
• Solar Emission, direct and reflected • Lunar Emission, direct and reflected • Galactic Emission, direct and reflected • Cosmic Microwave Background (CMB), direct and reflected • Earth sidelobes • Reflector mesh self emission
The APC algorithm flow is shown in Figure 22. The contribution from these unwanted sources will be addressed in this section.
APC
Direct Sun Reflect Sun
Solar FluxProcessing
Reflect MoonDirect Galaxy Reflect Galaxy
Antenna temperature from Earth
Earth sidelobe correction, mainbean efficiency andcross-coupling correction
End
EstimateEarth surface reflectivity
Reflectoremissivitycorrection
Flow Start/End
Note:
Function
Process
Figure 22. SMAP radiometer APC algorithm flow
After APC is complete, the remaining L1B_TB processing steps are to account for
Faraday rotation and atmospheric propagation effects. That will complete the transformation to TB at the Earth’s surface. The flow describing 𝑇! → 𝑇!, was described in Section 4.1.
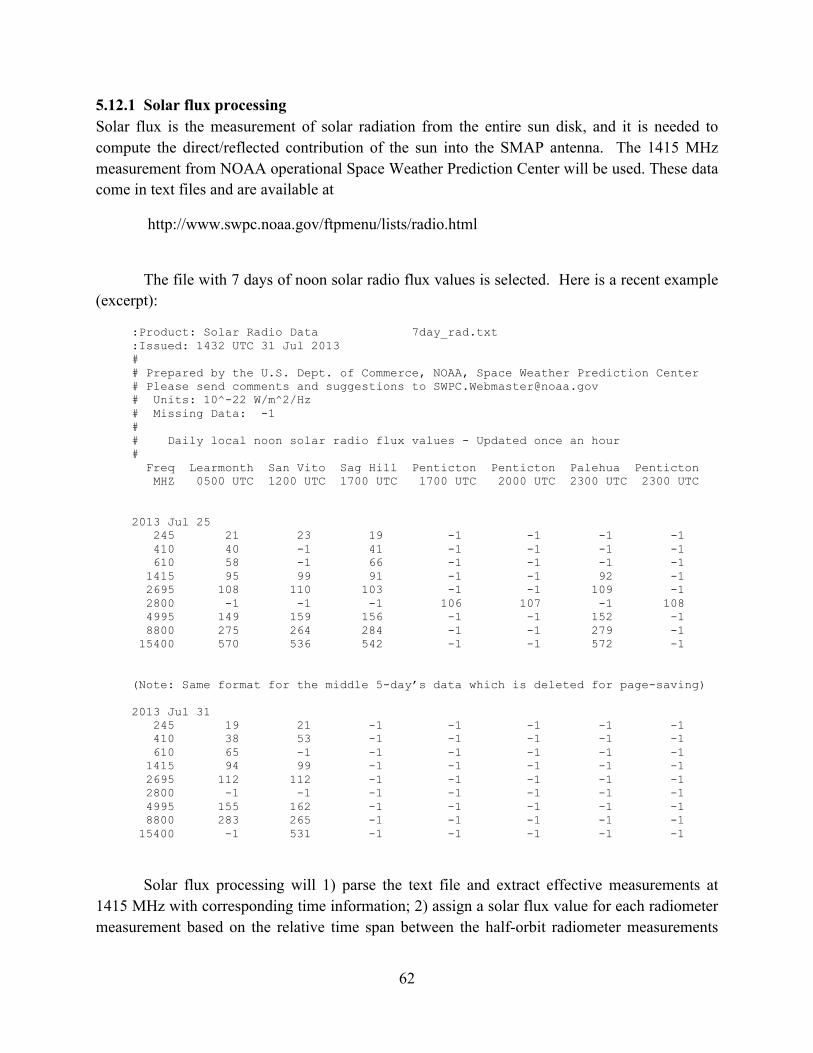
62
5.12.1 Solar flux processing Solar flux is the measurement of solar radiation from the entire sun disk, and it is needed to compute the direct/reflected contribution of the sun into the SMAP antenna. The 1415 MHz measurement from NOAA operational Space Weather Prediction Center will be used. These data come in text files and are available at
http://www.swpc.noaa.gov/ftpmenu/lists/radio.html
The file with 7 days of noon solar radio flux values is selected. Here is a recent example (excerpt):
:Product: Solar Radio Data 7day_rad.txt :Issued: 1432 UTC 31 Jul 2013 # # Prepared by the U.S. Dept. of Commerce, NOAA, Space Weather Prediction Center # Please send comments and suggestions to [email protected] # Units: 10^-22 W/m^2/Hz # Missing Data: -1 # # Daily local noon solar radio flux values - Updated once an hour # Freq Learmonth San Vito Sag Hill Penticton Penticton Palehua Penticton MHZ 0500 UTC 1200 UTC 1700 UTC 1700 UTC 2000 UTC 2300 UTC 2300 UTC 2013 Jul 25 245 21 23 19 -1 -1 -1 -1 410 40 -1 41 -1 -1 -1 -1 610 58 -1 66 -1 -1 -1 -1 1415 95 99 91 -1 -1 92 -1 2695 108 110 103 -1 -1 109 -1 2800 -1 -1 -1 106 107 -1 108 4995 149 159 156 -1 -1 152 -1 8800 275 264 284 -1 -1 279 -1 15400 570 536 542 -1 -1 572 -1 (Note: Same format for the middle 5-day’s data which is deleted for page-saving) 2013 Jul 31 245 19 21 -1 -1 -1 -1 -1 410 38 53 -1 -1 -1 -1 -1 610 65 -1 -1 -1 -1 -1 -1 1415 94 99 -1 -1 -1 -1 -1 2695 112 112 -1 -1 -1 -1 -1 2800 -1 -1 -1 -1 -1 -1 -1 4995 155 162 -1 -1 -1 -1 -1 8800 283 265 -1 -1 -1 -1 -1 15400 -1 531 -1 -1 -1 -1 -1
Solar flux processing will 1) parse the text file and extract effective measurements at 1415 MHz with corresponding time information; 2) assign a solar flux value for each radiometer measurement based on the relative time span between the half-orbit radiometer measurements
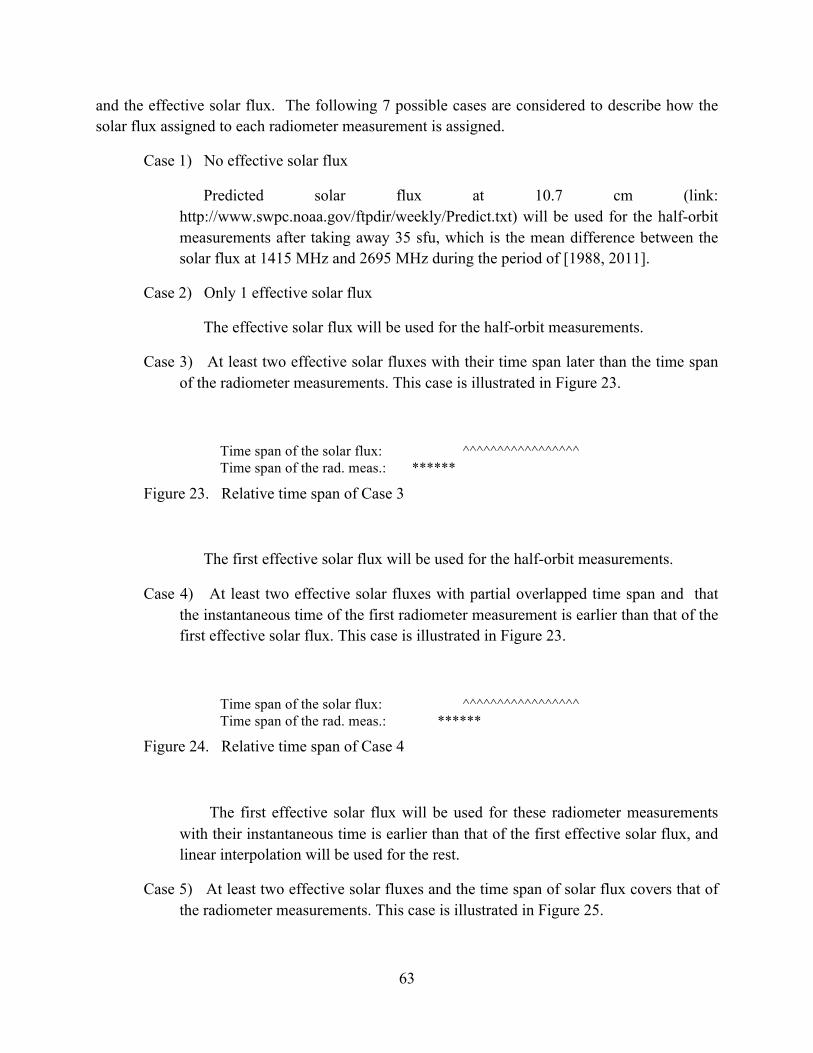
63
and the effective solar flux. The following 7 possible cases are considered to describe how the solar flux assigned to each radiometer measurement is assigned.
Case 1) No effective solar flux
Predicted solar flux at 10.7 cm (link: http://www.swpc.noaa.gov/ftpdir/weekly/Predict.txt) will be used for the half-orbit measurements after taking away 35 sfu, which is the mean difference between the solar flux at 1415 MHz and 2695 MHz during the period of [1988, 2011].
Case 2) Only 1 effective solar flux
The effective solar flux will be used for the half-orbit measurements.
Case 3) At least two effective solar fluxes with their time span later than the time span of the radiometer measurements. This case is illustrated in Figure 23.
Time span of the solar flux: ^^^^^^^^^^^^^^^^^ Time span of the rad. meas.: ******
Figure 23. Relative time span of Case 3
The first effective solar flux will be used for the half-orbit measurements.
Case 4) At least two effective solar fluxes with partial overlapped time span and that the instantaneous time of the first radiometer measurement is earlier than that of the first effective solar flux. This case is illustrated in Figure 23.
Time span of the solar flux: ^^^^^^^^^^^^^^^^^ Time span of the rad. meas.: ******
Figure 24. Relative time span of Case 4
The first effective solar flux will be used for these radiometer measurements with their instantaneous time is earlier than that of the first effective solar flux, and linear interpolation will be used for the rest.
Case 5) At least two effective solar fluxes and the time span of solar flux covers that of the radiometer measurements. This case is illustrated in Figure 25.
64
Time span of the solar flux: ^^^^^^^^^^^^^^^^^ Time span of the rad. meas.: ******
Figure 25. Relative time span of Case 5
The first effective solar flux will be used for these radiometer measurements with their instantaneous time is earlier than that of the first effective solar flux, and linear interpolation will be used for the rest.
Case 6) At least two effective solar fluxes with partial overlapped time span and that the instantaneous time of the last radiometer measurement is later than that of the last effective solar flux. This case is illustrated in Figure 26.
Time span of the solar flux: ^^^^^^^^^^^^^^^^^ Time span of the rad. meas.: ******
Figure 26. Relative time span of Case 6
The last effective solar flux will be used for these radiometer measurements with their instantaneous time is later than that of the last effective solar flux, and linear interpolation will be used for the rest.
Case 7) At least two effective solar fluxes with their time span earlier than the time span of the radiometer measurements. This case is illustrated in Figure 27.
Time span of the solar flux: ^^^^^^^^^^^^^^^^^ Time span of the rad. meas.: ******
Figure 27. Relative time span of Case 7
The last effective solar flux will be used for the half-orbit measurements.
The processed solar flux will be used by calculating direct/reflected sun contributions.
5.12.2 Direct Sun Contribution The contribution of the sun to the SMAP antenna temperature directly is given by
65
𝑇!,!"#$%& = 𝐺𝑇!,!"#𝑑Ω!!"#$%&
(5.45)
where Ω!"#$%& ≈ 8.6×10!! [Dinnat et. al 2007] (0.6° apex angle as viewed from the Earth) is the solid angle of the sun observed on the Earth directly. G is the SMAP antenna gain matrix. 𝑇!,!"# is the brightness temperature of the sun and it is a function of the solar flux,
𝑇!,!"# =�!!�
!!!!"#$%&
(5.46)
where λ is the wavelength, 𝑆� is the solar radio flux and k = 1.3810×10⁻²³ J⋅K-1 is the Boltzmann’s constant.
At L-band, Equation (5.46) can be represented by
𝑇!,!"# = 1988.9𝐹�
(5.47)
where 𝐹� is radio flux in solar flux units (sfu) (1 sfu = 10-22 W⋅m-2⋅Hz-1). The direct sun contribution to the SMAP antenna temperature can be modeled as
𝑇!,!"#$%& = 0.013𝐺!"#$%&�𝐹�
(5.48)
The daily local noon solar flux measurements at 1415 MHz from 4 stations (Learmonth, San_Vito, Sagamore_Hill and Palehua) will be used in SMAP Level 1B_TB algorithm.
5.12.3 Reflected Sun Contribution Solar radiation can enter the SMAP antenna after reflection from the Earth’s surface as shown in Figure 28.
66
Figure 28. Geometry of reflected sun/moon measurements. X, Y, Z are the 3 axes of the Spun Antenna System.
The reflected sun contribution to the SMAP radiometer antenna temperature can be obtained from
𝑇!,!"#$%& = GΨ𝑅𝐿!!𝑇!,!"#𝑑Ω!!"#$%&
(5.49)
where Ω!"#$%& is the solid angle of the solar reflection from the spherical Earth (it is less than Ω!"#$%&). Ψ is a rotation matrix. R is the reflectivity vector at the point of reflection. L is the atmospheric loss factor (>1), described further in Section 5.14.
Treating the sun as point source and considering the effects of curvature of the Earth’s surface, Equation (5.49) can be simplified as
𝑇!,!"#$%& = 0.013D𝐺Ψ𝑅𝐿!!𝐹�
(5.50)
where the factor D is due to the curvature of the Earth surface and it is given by
𝐷 = 1+ !!!!!𝑐𝑜𝑠 𝜃!
!!1+ !!!
!!
!!
(5.51)
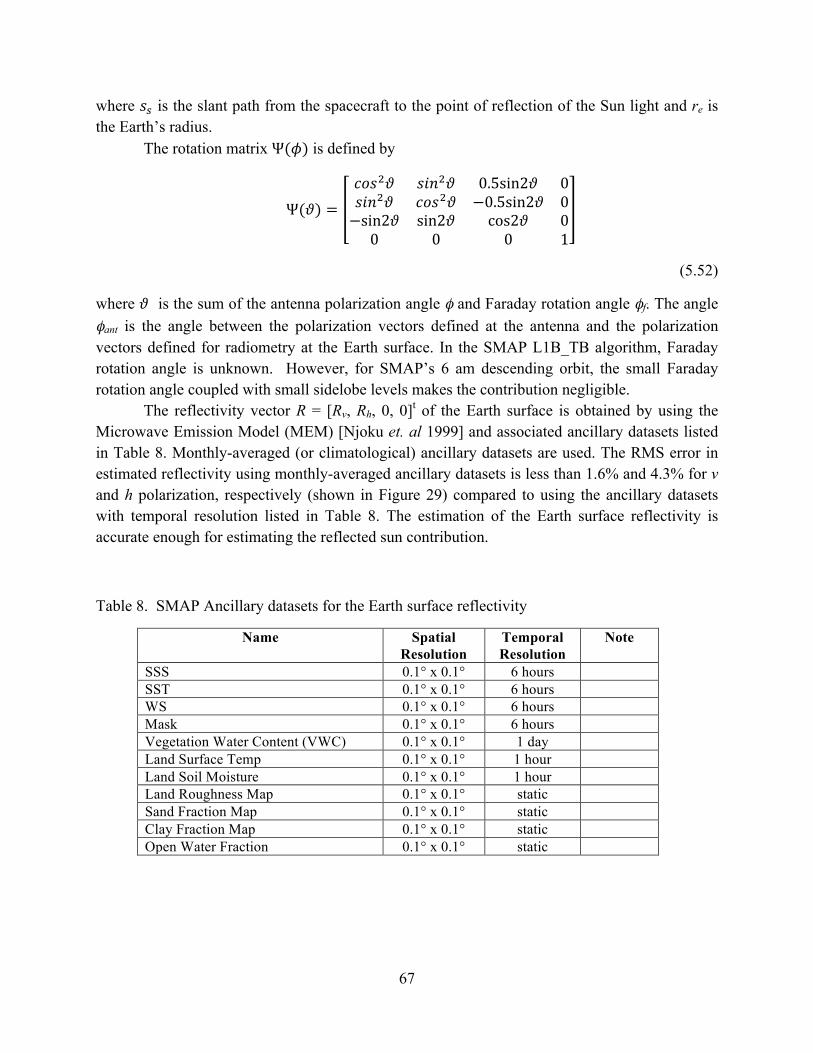
67
where 𝑠! is the slant path from the spacecraft to the point of reflection of the Sun light and re is the Earth’s radius.
The rotation matrix Ψ(𝜙) is defined by
Ψ(𝜗) =𝑐𝑜𝑠!𝜗 𝑠𝑖𝑛!𝜗 0.5sin2𝜗 0𝑠𝑖𝑛!𝜗 𝑐𝑜𝑠!𝜗 −0.5sin2𝜗 0−sin2𝜗 sin2𝜗 cos2𝜗 00 0 0 1
(5.52)
where 𝜗 is the sum of the antenna polarization angle φ and Faraday rotation angle φf. The angle φant is the angle between the polarization vectors defined at the antenna and the polarization vectors defined for radiometry at the Earth surface. In the SMAP L1B_TB algorithm, Faraday rotation angle is unknown. However, for SMAP’s 6 am descending orbit, the small Faraday rotation angle coupled with small sidelobe levels makes the contribution negligible.
The reflectivity vector R = [Rv, Rh, 0, 0]t of the Earth surface is obtained by using the Microwave Emission Model (MEM) [Njoku et. al 1999] and associated ancillary datasets listed in Table 8. Monthly-averaged (or climatological) ancillary datasets are used. The RMS error in estimated reflectivity using monthly-averaged ancillary datasets is less than 1.6% and 4.3% for v and h polarization, respectively (shown in Figure 29) compared to using the ancillary datasets with temporal resolution listed in Table 8. The estimation of the Earth surface reflectivity is accurate enough for estimating the reflected sun contribution.
Table 8. SMAP Ancillary datasets for the Earth surface reflectivity
Name Spatial Resolution
Temporal Resolution
Note
SSS 0.1° x 0.1° 6 hours SST 0.1° x 0.1° 6 hours WS 0.1° x 0.1° 6 hours Mask 0.1° x 0.1° 6 hours Vegetation Water Content (VWC) 0.1° x 0.1° 1 day
Land Surface Temp 0.1° x 0.1° 1 hour Land Soil Moisture 0.1° x 0.1° 1 hour Land Roughness Map 0.1° x 0.1° static Sand Fraction Map 0.1° x 0.1° static
Clay Fraction Map 0.1° x 0.1° static
Open Water Fraction 0.1° x 0.1° static
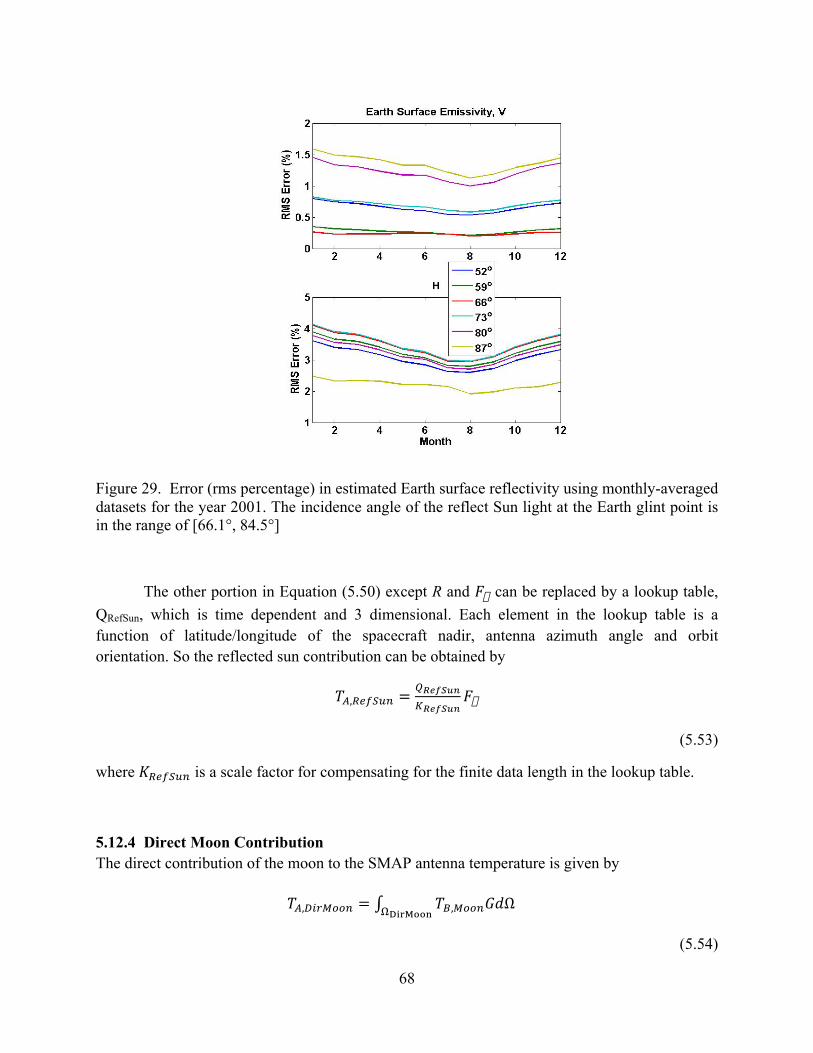
68
Figure 29. Error (rms percentage) in estimated Earth surface reflectivity using monthly-averaged datasets for the year 2001. The incidence angle of the reflect Sun light at the Earth glint point is in the range of [66.1°, 84.5°]
The other portion in Equation (5.50) except R and 𝐹� can be replaced by a lookup table, QRefSun, which is time dependent and 3 dimensional. Each element in the lookup table is a function of latitude/longitude of the spacecraft nadir, antenna azimuth angle and orbit orientation. So the reflected sun contribution can be obtained by
𝑇!,!"#$%& =!!"#$%&!!"#$%&
𝐹�
(5.53)
where 𝐾!"#$%& is a scale factor for compensating for the finite data length in the lookup table.
5.12.4 Direct Moon Contribution The direct contribution of the moon to the SMAP antenna temperature is given by
𝑇!,!"#$%%& = 𝑇!,!""#𝐺𝑑Ω!!"#$%%&
(5.54)
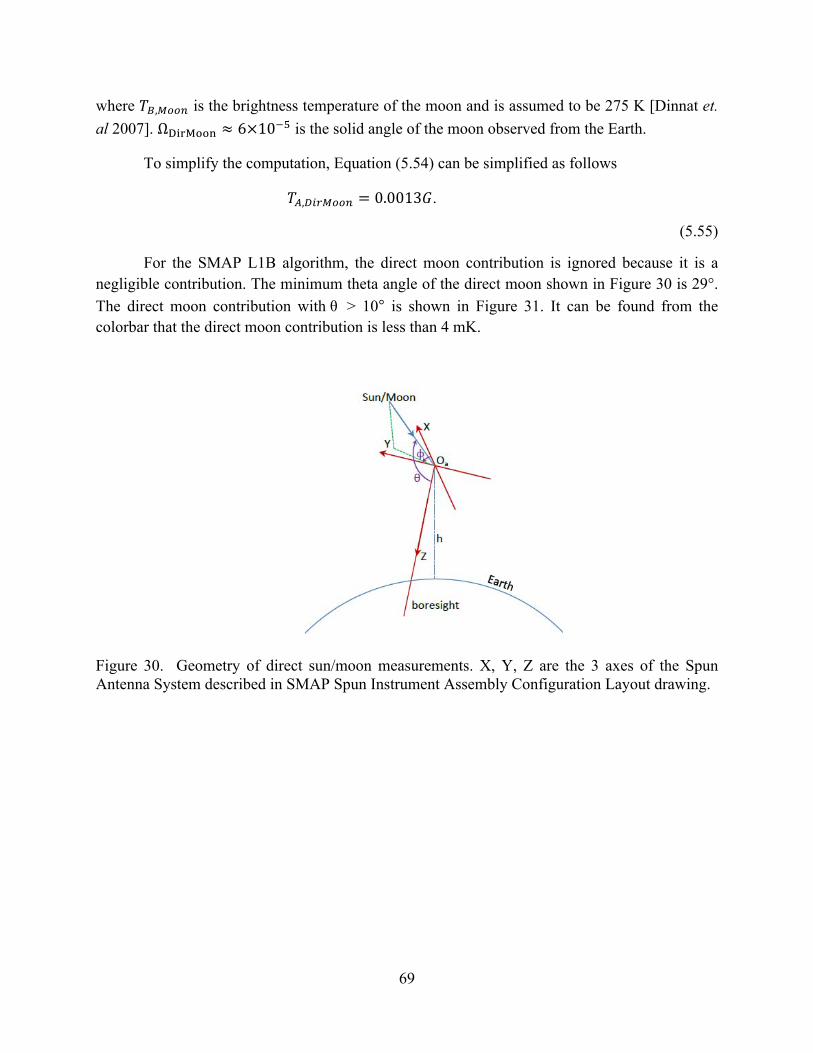
69
where 𝑇!,!""# is the brightness temperature of the moon and is assumed to be 275 K [Dinnat et. al 2007]. Ω!"#$%%& ≈ 6×10!! is the solid angle of the moon observed from the Earth.
To simplify the computation, Equation (5.54) can be simplified as follows
𝑇!,!"#$%%& = 0.0013𝐺.
(5.55)
For the SMAP L1B algorithm, the direct moon contribution is ignored because it is a negligible contribution. The minimum theta angle of the direct moon shown in Figure 30 is 29°. The direct moon contribution with θ > 10° is shown in Figure 31. It can be found from the colorbar that the direct moon contribution is less than 4 mK.
Figure 30. Geometry of direct sun/moon measurements. X, Y, Z are the 3 axes of the Spun Antenna System described in SMAP Spun Instrument Assembly Configuration Layout drawing.
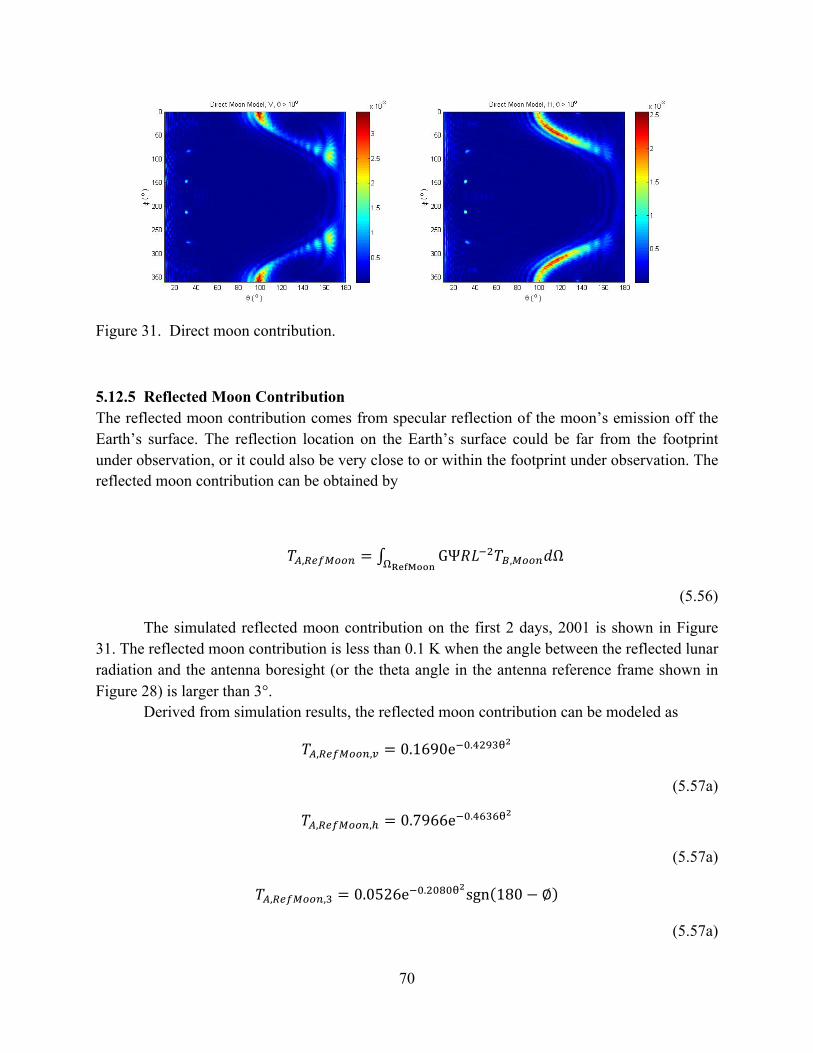
70
Figure 31. Direct moon contribution.
5.12.5 Reflected Moon Contribution The reflected moon contribution comes from specular reflection of the moon’s emission off the Earth’s surface. The reflection location on the Earth’s surface could be far from the footprint under observation, or it could also be very close to or within the footprint under observation. The reflected moon contribution can be obtained by
𝑇!,!"#$%%& = GΨ𝑅𝐿!!𝑇!,!""#𝑑Ω!!"#$%%&
(5.56)
The simulated reflected moon contribution on the first 2 days, 2001 is shown in Figure 31. The reflected moon contribution is less than 0.1 K when the angle between the reflected lunar radiation and the antenna boresight (or the theta angle in the antenna reference frame shown in Figure 28) is larger than 3°.
Derived from simulation results, the reflected moon contribution can be modeled as
𝑇!,!"#$%%&,! = 0.1690e!!.!"#$!!
(5.57a)
𝑇!,!"#$%%&,! = 0.7966e!!.!"#"!!
(5.57a)
𝑇!,!"#$%%&,! = 0.0526e!!.!"#"!!sgn 180− ∅
(5.57a)
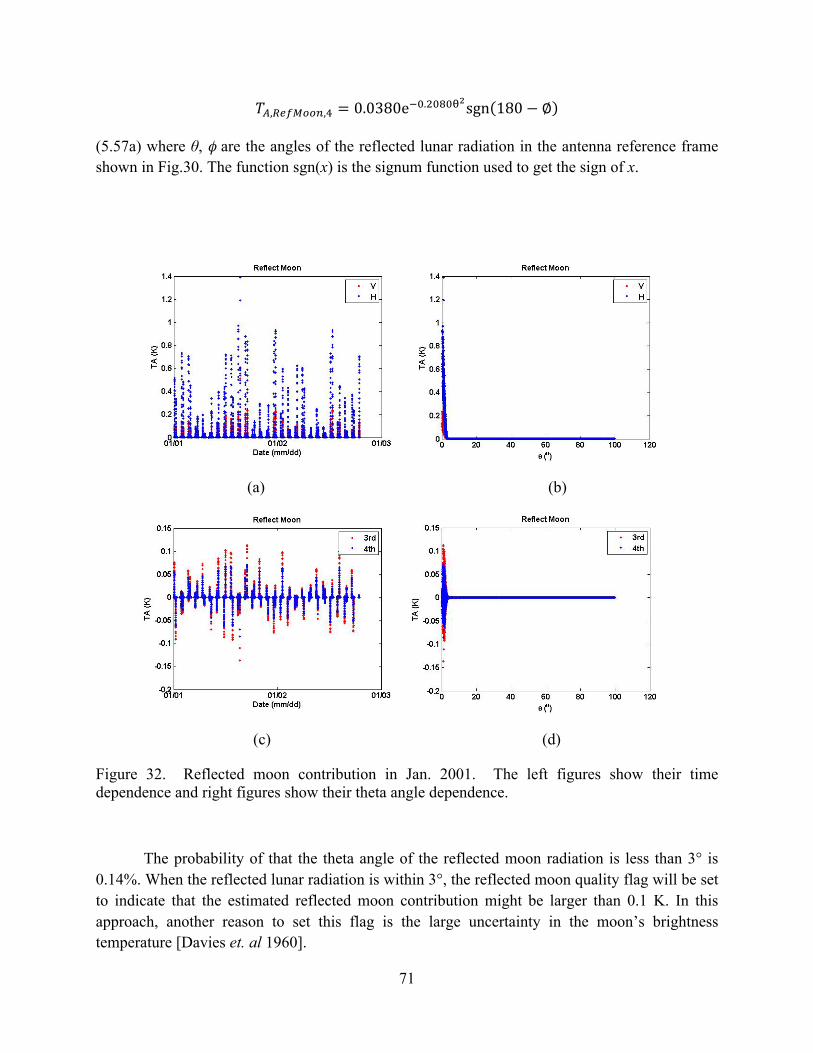
71
𝑇!,!"#$%%&,! = 0.0380e!!.!"#"!!sgn 180− ∅
(5.57a) where θ, φ are the angles of the reflected lunar radiation in the antenna reference frame shown in Fig.30. The function sgn(x) is the signum function used to get the sign of x.
(a) (b)
(c) (d)
Figure 32. Reflected moon contribution in Jan. 2001. The left figures show their time dependence and right figures show their theta angle dependence.
The probability of that the theta angle of the reflected moon radiation is less than 3° is 0.14%. When the reflected lunar radiation is within 3°, the reflected moon quality flag will be set to indicate that the estimated reflected moon contribution might be larger than 0.1 K. In this approach, another reason to set this flag is the large uncertainty in the moon’s brightness temperature [Davies et. al 1960].
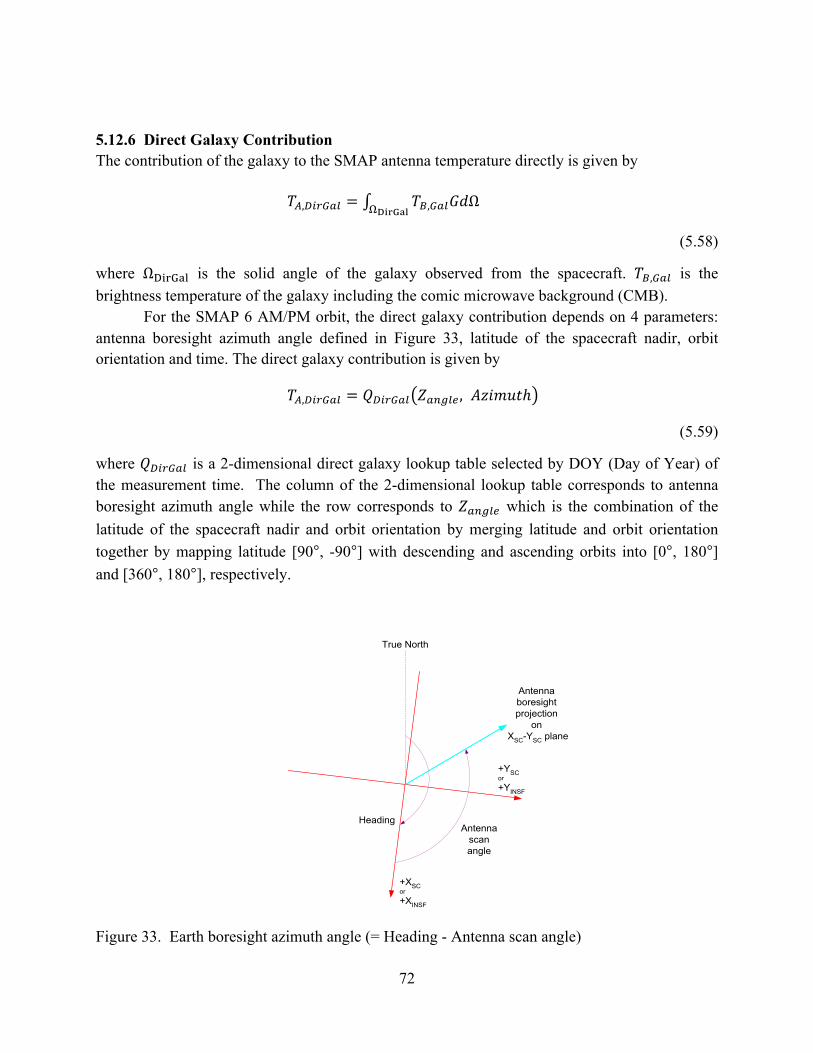
72
5.12.6 Direct Galaxy Contribution The contribution of the galaxy to the SMAP antenna temperature directly is given by
𝑇!,!"#$%& = 𝑇!,!"#𝐺𝑑Ω!!"#$%&
(5.58)
where Ω!"#$%& is the solid angle of the galaxy observed from the spacecraft. 𝑇!,!"# is the brightness temperature of the galaxy including the comic microwave background (CMB).
For the SMAP 6 AM/PM orbit, the direct galaxy contribution depends on 4 parameters: antenna boresight azimuth angle defined in Figure 33, latitude of the spacecraft nadir, orbit orientation and time. The direct galaxy contribution is given by
𝑇!,!"#$%& = 𝑄!"#$%& 𝑍!"#$% , 𝐴𝑧𝑖𝑚𝑢𝑡ℎ
(5.59)
where 𝑄!"#$%& is a 2-dimensional direct galaxy lookup table selected by DOY (Day of Year) of the measurement time. The column of the 2-dimensional lookup table corresponds to antenna boresight azimuth angle while the row corresponds to 𝑍!"#$% which is the combination of the latitude of the spacecraft nadir and orbit orientation by merging latitude and orbit orientation together by mapping latitude [90°, -90°] with descending and ascending orbits into [0°, 180°] and [360°, 180°], respectively.
Antennascanangle
Heading
True North
+YSCor+YINSF
+XSCor+XINSF
Antennaboresightprojection
on XSC-YSC plane
Figure 33. Earth boresight azimuth angle (= Heading - Antenna scan angle)
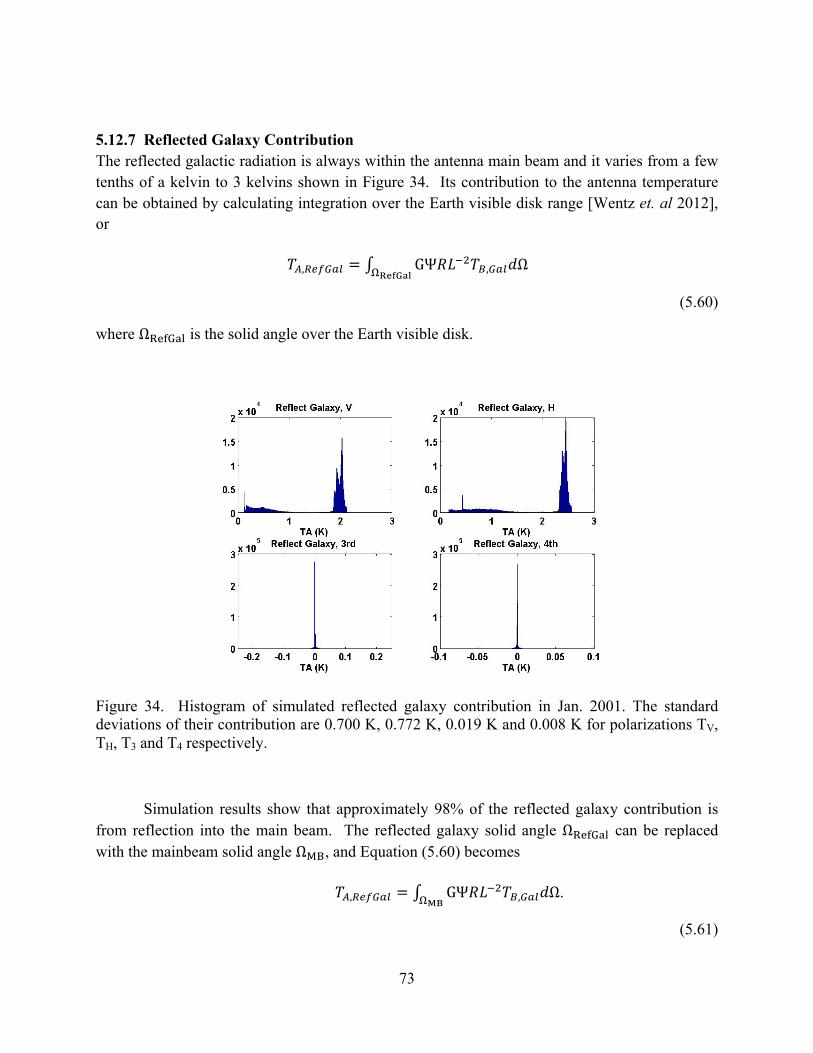
73
5.12.7 Reflected Galaxy Contribution The reflected galactic radiation is always within the antenna main beam and it varies from a few tenths of a kelvin to 3 kelvins shown in Figure 34. Its contribution to the antenna temperature can be obtained by calculating integration over the Earth visible disk range [Wentz et. al 2012], or
𝑇!,!"#$%& = GΨ𝑅𝐿!!𝑇!,!"#𝑑Ω!!"#$%&
(5.60)
where Ω!"#$%& is the solid angle over the Earth visible disk.
Figure 34. Histogram of simulated reflected galaxy contribution in Jan. 2001. The standard deviations of their contribution are 0.700 K, 0.772 K, 0.019 K and 0.008 K for polarizations TV, TH, T3 and T4 respectively.
Simulation results show that approximately 98% of the reflected galaxy contribution is from reflection into the main beam. The reflected galaxy solid angle Ω!"#$%& can be replaced with the mainbeam solid angle Ω!", and Equation (5.60) becomes
𝑇!,!"#$%& = GΨ𝑅𝐿!!𝑇!,!"#𝑑Ω!!".
(5.61)
74
The Earth surface reflectivity, R, within the antenna main beam can be estimated by using antenna brightness temperature measurement, while the other terms in Equation (5.61) can be replaced by a lookup table, QRefGal, which is time dependent and 3 dimensional. The element in the lookup table is a function of latitude/longitude of the footprint under measurement and antenna boresight azimuth angle. The reflected galaxy contribution can be obtained from
𝑇!,!"#$%& =!!"#$%&!!"#$%&
𝑅!"
(5.62)
where 𝐾!"#$%& is a scale factor to compensate for the finite data length in the lookup table, and 𝑅!" is the Earth surface reflectivity estimated by
𝑅!",! = 1− !!,!!!∙!!!!,!"#$!
(5.63a)
𝑅!",! = 1− !!,!!!∙!!!!,!"#$!
(5.63b)
𝑅!",! = 𝑅!",! ∙ 𝑅!",! (5.63c)
𝑅!",! = 𝑅!",! ∙ 𝑅!",! (5.63d)
where 𝑇!,! (p=v, h) is the p-pol antenna brightness temperature after RFI removal. 𝜂! is p-pol antenna main beam efficiency. 𝑇!!!,!"#$! is the Earth surface temperature.
5.12.8 Reflector Mesh Self Emission Correction Among the APC error sources, reflector mesh self-emission is slightly different from the other sources since the main reflector has a small non-zero emissivity. It both contributes unwanted signal as well as absorbs some of the desired incident signal. Pre-launch measurements will provide an initial value of its emissivity. On-orbit, transitions of the reflector in and out of eclipse will cause ~100K changes in the mesh physical temperature and this can be used to confirm and monitor this important variable.
The antenna temperature after reflector emissivity correction, 𝑇!,!! (p = v, h, 3, 4), is given by
𝑇!,!! = 𝐿!,!𝑇!,! − 𝑇!!!,!"#$"%&'! 𝐿!,! − 1
(5.64a)
75
𝑇!,!! = 𝐿!,!𝑇!,! − 𝑇!!!,!"#$"%&'! 𝐿!,! − 1
(5.64b)
𝑇!,!! = 𝐿!,!𝐿!,!𝑇!,!
(5.64c)
𝑇!,!! = 𝐿!,!𝐿!,!𝑇!,!
(5.64d)
where 𝑇!,! is the antenna temperature before reflector emissivity correction. 𝐿!,! (≥ 1, x = v, h) is loss factor of the reflector derived from emissivity and 𝑇!!!,!"#$"%&'! is the physical temperature of the reflector.
5.12.9 Earth Sidelobe Correction The purpose of the Earth sidelobe correction is to derive the main beam apparent temperature, 𝑇!",!", in front of the antenna (or at the top of the ionosphere) from the antenna brightness temperature after removing sun/moon/galaxy contributions from the antenna temperature and reflector emissivity correction. In addition, the antenna main beam efficiency and polarization cross-coupling are corrected.
The antenna temperature from the Earth’s surface is given by
𝑇!,!"#$! = 𝑇!! − 𝑇!,!"#$%& − 𝑇!,!"#$%& − 𝑇!,!"#$%& − 𝑇!,!"#$%%& − 𝑇!,!"#$%&
(5.65)
The 𝑇!,!"#$! → 𝑇!",!" transformation cannot be performed exactly since the forward 𝑇!",!" → 𝑇! transformation does not have a simple inverse. However, experience with previous radiometers has shown that this transformation can be approximated quite well using the following two simple transformations.
𝑇!,!"#$!,!𝑇!,!"#$!,!𝑇!,!"#$!,!𝑇!,!"#$!,!
= 𝐴 ∙
𝑇!",!",!𝑇!",!",!𝑇!",!",!𝑇!",!",!
=
𝑎!! 𝑎!! 𝑎!! 𝑎!!𝑎!! 𝑎!! 𝑎!! 𝑎!!𝑎!! 𝑎!! 𝑎!! 𝑎!"𝑎!! 𝑎!! 𝑎!" 𝑎!!
∙
𝑇!",!",!𝑇!",!",!𝑇!",!",!𝑇!",!",!
(5.66)
where 𝑎!" ,𝑝, 𝑞 = 𝑣, ℎ, 3,4 are the cross polarization coefficients. They are initially known from the design of the optical chain. We also expect 𝑎!" = 𝑎!" from symmetry considerations and 𝑎!" ≪ 1 (i.e., low cross-pol).
Now we can invert Equations (5.66) and to get
76
𝑇!",!",!𝑇!",!",!𝑇!",!",!𝑇!",!",!
= M ∙
𝑇!,!"#$!,!𝑇!,!"#$!,!𝑇!,!"#$!,!𝑇!,!"#$!,!
= A!! ∙
𝑇!,!"#$!,!𝑇!,!"#$!,!𝑇!,!"#$!,!𝑇!,!"#$!,!
(5.67)
The degree of Earth sidelobe correction to the antenna temperature including the antenna main beam efficiency and polarization cross-coupling correction is given by
∆𝑇!",!",! = 𝑇!,!"#$!,! − 𝑇!",!",! (5.68a)
∆𝑇!",!",! = 𝑇!,!"#$!,! − 𝑇!",!",! (5.68b)
∆𝑇!",!",! = 𝑇!,!"#$!,! − 𝑇!",!",! (5.68c)
∆𝑇!",!",! = 𝑇!,!"#$!,! − 𝑇!",!",! (5.68d)
The final transformation from Tap,MB to TB requires corrections for Faraday rotation and atmospheric propagation. These are detailed in Sections 5.13 and 5.14, respectively.
5.13 Faraday Rotation Correction The basis for correction is described in Yueh (2000) and is briefly summarized here.
The apparent brightness temperatures reaching the SMAP main reflector (top of ionosphere) are
𝑇!",!",!𝑇!",!",!𝑇!",!",!𝑇!",!",!
=
𝑇!",!"#,!! − ∆𝑇!"𝑇!",!!",!! + ∆𝑇!"
− 𝑇!",!"#,!! − 𝑇!",!"#,!! 𝑠𝑖𝑛2Ω! + 𝑇!",!"#,!! 𝑐𝑜𝑠2Ω!𝑇!",!!
(5.69)
where 𝑇!",!"#,!! (x = v, h, 3, 4) is the apparent brightness at TOA of polarization x; and
∆𝑇!" = 𝑇!",!"#,!! − 𝑇!",!"#,!! 𝑠𝑖𝑛!Ω! −𝑇!",!"#,!!
2 𝑠𝑖𝑛2Ω! (5.70)
Under an assumption of weak 𝑇!",!"#,!! , we can find Ω! from 𝑇!",!",! ,𝑇!",!",! ,𝑇!",!",!. Note these are apparent brightness temperatures including Faraday rotation.
tan2Ω! =!!",!",!
!!",!",!!!!",!",!.
77
(5.71)
Also, 𝑄!",!" = (𝑇!",!",! − 𝑇!",!",!)! + 𝑇!",!",!!,
(5.72)
with these, the Faraday rotation can be corrected by computing the 𝑇!",!"#,!! from the 𝑇!",!",!.
𝑇!",!"#,!!
𝑇!",!"#,!!
𝑇!",!"#,!!
𝑇!",!"#,!!
=
(𝑇!",!",! + 𝑇!",!",! + 𝑄!",!")/2(𝑇!",!",! + 𝑇!",!",! − 𝑄!",!")/2
0𝑇!",!",!
(5.73)
Equation (5.73) is the inverse of Equation (5.69) under the assumptions of Option 1. On the left hand side of Equation (5.73) are the modified Stokes brightness temperatures at the TOA. On the right hand side, 𝑇!",!"#,!! = 0 means this is not derivable by this approach because we assumed this T3 to be weak.
The atmospheric correction described in Section 5.14 transforms these TOA brightness temperatures to TB at the Earth’s surface.
5.14 Atmospheric Correction Three parameters (upwelling brightness Tup, downwelling brightness Tdown, and total
atmospheric loss factor L) are needed to describe the atmosphere’s effect on a signal which is emitted from the Earth’s surface and received by a space borne radiometer. The general form of the apparent brightness temperature at the top of the atmosphere (TOA) is given by
𝑇!"! = 𝑇!" + 1− 𝜀 𝑇!"#$ + 𝑇! 𝐿!! (5.74)
where ε is the emissivity of the Earth’s surface and TB is the brightness temperature of the Earth’s surface. This equation simply says that the radiometer sees the sum of the surface brightness TB attenuated by L, added to upwelling atmospheric brightness Tup plus the downwelling atmospheric brightness Tdown reflected off the surface and attenuated by L. At L-band at 40 degrees EIA, downwelling brightness is the same as upwelling brightness to within about 2 mK, so Tup = Tdown for our purposes. With this simplification, we can invert Equation (5.74) to obtain:
𝑇! =𝑇!"#$
𝑇!"#$ − 𝑇!"∙ 𝐿 ∙ 𝑇!",!"#! − 1+ 𝐿 ∙ 𝑇!"
(5.75)
78
where Tsurf really refers to the temperature at the bottom of the atmosphere near the Earth’s surface (as opposed to the emission from the Earth’s surface itself). 𝑇!",!"#! is the uncorrected brightness observed at TOA, and TB is the desired Earth surface brightness corrected for atmospheric effects. So only upwelling brightness, Tup, and total attenuation, L, need to be calculated. These two parameters can also be estimated by using a global simplified atmospheric radiative transfer model [Peng et. al, 2013]. . In the simplified model, upwelling brightness 𝑇!" and total attenuation 𝐿, both for EIA 40°, are modeled as polynomial functions of near surface atmospheric pressure P in millibars, temperature Tsurf in degrees Celsius, and water vapor density V in grams per cubic meter:
𝑇!" = 2.3058− 3.2735×10!!𝑇!"#$ + 4.2330×10!!(𝑃 − 900)+ 1.4472×10!!𝑉 (5.76)
𝐿 = 1.0094− 2.9626×10!!𝑇!"#$ + 1.6521×10!!(𝑃 − 900)+ 1.0712×10!!𝑉 (5.77)
These expressions were developed by matching against conventional atmospheric
radiative transfer from Ulaby et al, (1981) applied to the Integrated Global Radiosonde Archive dataset from the NOAA/National Climatic Data Center (~1000000 global soundings from 662 stations including all 7 continents after filtering to those soundings that go up to at least 30 km altitude). At EIA = 40°, the difference between the simplified model versus conventional radiative transfer for Tup, and Tdown is zero mean with a 1σ standard deviation of 0.028 K and for the total atmospheric loss factor L, it is zero mean with a 1σ standard deviation of 2.1×10⁻⁴.
The source of the ancillary data P, Tsurf, and V are a near real-time global weather forecast product from GMAO (surface level). The degree of the atmospheric correction is given by
∆𝑇!",!" = 𝑇!",!"#! − 𝑇!
(5.78)
79
6 Orbital Simulator To assist with radiometer L1B algorithm development, an orbital simulator capable of simulating the SMAP observing geometry, and the effects of the unwanted sources and propagation effects depicted in Figure 21, is a major risk-reduction asset. The SMAP simulator is a modified version of the Aquarius TB simulator [Le Vine, et. al, 2011. Although this simulator addresses all the sources and effects depicted in Figure 21, there are important differences between Aquarius and SMAP. This section provides a summary of the modifications necessary for deploying the Aquarius simulator as a SMAP simulator.
6.1 Number of antenna beams Aquarius’ 3 beams were replaced with a single beam for SMAP.
6.2 Conical scan SMAP employs a conical scan at 40 degrees EIA while Aquarius has fixed beams.
6.3 Antenna pattern SMAP’s 6-m antenna has a considerably narrower beam than Aquarius’ 2-m antenna. The actual pattern from the SMAP antenna design is used instead of the Aquarius patterns. To balance the spatial resolution over a footprint and simulation speed, hybrid-resolution antenna pattern is used in the orbital simulator. Within the first null-to-null beam width which is defined as 2.5 times 3-dB beam width in the simulator, the resolution of the antenna pattern is 0.1°, while beyond the region, it is 0.5°.
6.4 Land focus Whereas Aquarius’ focus is naturally the ocean, SMAP’s focus is land areas (plus selected ocean and ice sheet targets for calibration). The land TB model in the Aquarius simulator is replaced by using the microwave emission model [Njoku, et. al, 1999] which is significantly more realistic detailed regarding land cover types, and other factors to yield more realistic land TB at a spatial resolution sufficient to use the simulator to analyze effects requiring sub-pixel resolution such as geolocation.
6.5 Atmosphere model The Aquarius simulator employed an atmosphere model that was simplified for L-band. It was found that adding the conical scan also multiplied the number of iterations needed for the atmosphere routine. Since the atmosphere routine could dominate the computation time, a simplified atmospheric model was developed and validated against almost 106 soundings in the NCDC radiosondes database [Peng et. al, 2013]. This simplified model requires only surface
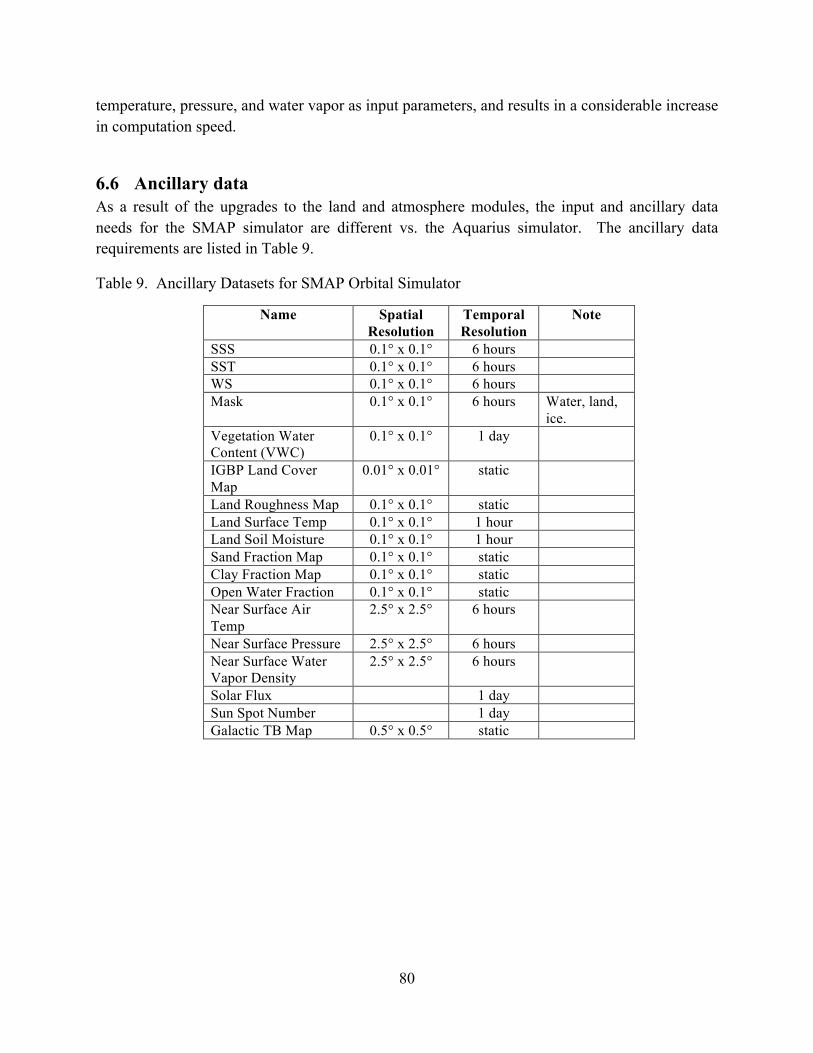
80
temperature, pressure, and water vapor as input parameters, and results in a considerable increase in computation speed.
6.6 Ancillary data As a result of the upgrades to the land and atmosphere modules, the input and ancillary data needs for the SMAP simulator are different vs. the Aquarius simulator. The ancillary data requirements are listed in Table 9.
Table 9. Ancillary Datasets for SMAP Orbital Simulator
Name Spatial Resolution
Temporal Resolution
Note
SSS 0.1° x 0.1° 6 hours SST 0.1° x 0.1° 6 hours WS 0.1° x 0.1° 6 hours Mask 0.1° x 0.1° 6 hours Water, land,
ice. Vegetation Water Content (VWC)
0.1° x 0.1° 1 day
IGBP Land Cover Map
0.01° x 0.01° static
Land Roughness Map 0.1° x 0.1° static Land Surface Temp 0.1° x 0.1° 1 hour Land Soil Moisture 0.1° x 0.1° 1 hour Sand Fraction Map 0.1° x 0.1° static
Clay Fraction Map 0.1° x 0.1° static
Open Water Fraction 0.1° x 0.1° static
Near Surface Air Temp
2.5° x 2.5° 6 hours
Near Surface Pressure 2.5° x 2.5° 6 hours Near Surface Water Vapor Density
2.5° x 2.5° 6 hours
Solar Flux 1 day Sun Spot Number 1 day Galactic TB Map 0.5° x 0.5° static
81
7 References Corbella, I., F. Torres, A. Camps, N. Duffo, M. Vall-llossera, K. Rautiainen, M. Martin-Neira, A. Colliander, “Analysis of correlation and total power radiometer front-ends using noise waves,” IEEE Trans. Geosci. Remote Sens., vol. 43, no. 11, pp 2452-2459, Nov. 2005. Davies, R.D. and Jennison, R.C., “High resolution studies with the 250-ft. radio telescope at Jodrell Bank,” Observatory, vol. 80, no. 915, pp.74-77, Apr. 1960. De Roo, R., S. Misra and C. S. Ruf, “Sensitivity of the Kurtosis Statistic as a Detector of Pulsed Sinusoidal RFI,” IEEE Trans. Geosci. Remote Sens., vol. 45, no. 7, pp 1938-1946, July 2007. Dinnat, E.P.; Abraham, S.; Le Vine, D.M.; De Matthaeis, P.; Jacob, D., "Effect of Emission From the Moon on Remote Sensing of Sea Surface Salinity: An Example With the Aquarius Radiometer," Geoscience and Remote Sensing Letters, IEEE , vol.6, no.2, pp.239,243, April 2009. Güner, B., N, Niamsuwan and J. T. Johnson, “Performance study of a cross-frequency detection algorithm for pulsed sinusoidal RFI in microwave radiometry,” IEEE Trans. Geosci. Remote Sens., vol. 48, no. 7, pp 2899-2908, July 2010. Ellingson, S. W., and J. T. Johnson, Airborne RFI measurements over the mid-Atlantic coast using LISA, technical report, ElectroSci. Lab., Ohio State Univ., Columbus, Jan. 2003. Entekhabi, D. E., Njoku, P. Houser, M. Spencer, T. Doiron, J. Smith, R. Girard, S. Belair, W. Crow, T. Jackson, Y. Kerr, J. Kimball, R. Koster, K. McDonald, P. O'Neill, T. Pultz, S. Running, J. C. Shi, E. Wood, and J. van Zyl, “The Hydrosphere State (HYDROS) mission concept: An Earth system pathfinder for global mapping of soil moisture and land freeze/thaw,” IEEE Trans. Geosci. Remote Sens., vol. 42, no. 10, pp. 2184-2195, 2004. Entekhabi, D., E. Njoku, P. O’Neill, K. Kellogg, W. Crow, W. Edelstein, J. Entin, S. Goodman, T. Jackson, J. Johnson, J. Kimball, J. Piepmeier, R. Koster, K. McDonald, M. Moghaddam, S. Moran, R. Reichle, J. C. Shi, M. Spencer, S. Thurman, L. Tsang, J. Van Zyl, “The Soil Moisture Active and Passive (SMAP) Mission”, Proceedings of the IEEE, 98(5), 2010. Johnson, J.T., and L. C. Potter, “Performance study of algorithms for detecting pulsed sinusoidal interference in microwave radiometry,” IEEE Trans. Geosci. Remote Sens., vol. 47, no. 2, pp 628-636, Feb. 2009. Kenney, J. F. and E.S. Keeping, "Kurtosis," Mathematics of Statistics, 3rd ed. Princeton, NJ: Van Nostrand, 1962, ch.1, Sec. 7.12, pp. 102-103.
82
Le Vine, D.M. Dinnat, E.P. Abraham, S. de Matthaeis, P. Wentz, F.J. “The Aquarius Simulator and Cold-Sky Calibration”, IEEE Trans. Geosci. Remote Sens., vol. 49, no. 9, pp 3198-3210, September 2011. Meissner, T. and F.Wentz, “GMI calibration algorithm and analysis theoretical basis document” version F, Remote Sensing Systems, Aug 29, 2011. Misra, S., P. N. Mohammed, B. Güner, C. S. Ruf, J. R. Piepmeier, J. T. Johnson, “Microwave Radiometer Radio-Frequency Interference Detection Algorithms: A Comparative Study,” IEEE Trans. Geosci. Remote Sens., vol. 47, no. 11, pp 3742-3754, November 2009. Misra, S., R. De Roo and C. S. Ruf, “An Improved Radio Frequency Interference Model: Reevaluation of the Kurtosis Detection Algorithm Performance under Central-Limit Conditions,” IEEE Trans. Geosci. Remote Sens., vol. 50, no. 11, pp 4565-4574, November 2012. National Research Council, “Earth Science and Applications from Space: National Imperatives for the Next Decade and Beyond,” pp. 400, 2007. Njoku, E.G., Li Li, “Retrieval of land surface parameters using passive microwave measurements at 6-18 GHz”, IEEE Trans. Geosci. Remote Sens., vol. 37, no. 1, pp 79-93, January 1999. Niamsuwan, N., J. T. Johnson, S. W. Ellingson, “Examination of a simple pulse-blanking technique for radio frequency interference mitigation,” Radio Science, vol. 40, June 2005. Pardé, M., M. Zribi, P. Fanise, and M. Dechambre, “Analysis of RFI issue using the CAROLS L-band experiment,” IEEE Trans. Geosci. Remote Sens., vol. 49, no. 3, pp 1063-1070, March 2011. Park, J., J. T. Johnson, N. Niamsuwan, J. R. Piepmeier, P. N. Mohammed, C. S. Ruf, S. Misra, S. H. Yueh, and S. J. Dinardo, “Airborne L-Band Radio Frequency Inteference Observations From the SMAPVEX08 Campaign and Associated Flights,” IEEE Trans. Geosci. Remote Sens., vol. 49, no. 9, 3359-3370, September 2011. Peng, J., Piepmeier, J., Kim, E., “Global Simplified Atmospheric Radiative Transfer Model at L-band,” IEEE Geoscience and Remote Sensing Letter, vol.10, no.3, pp.437-440, May 2013.
Piepmeier, J.R., E. J. Kim, “Calibration of passive microwave hybrid coupler-based polarimeters,” Proc. 2003 IEEE International Geoscience and Remote Sensing Symposium, Toulouse, France, vol. 2, pp 1244-1246, 21-25 July 2003.

83
Piepmeier, J., F. Pellerano, A. Freedman, “Mitigation of terrestrial radar interference in L-band space borne microwave radiometers,” Proc. 2006 IEEE International Geoscience and Remote Sensing Symposium, Denver, CO, 31 Jul - 4 Aug 2006. Piepmeier, J.R., Long, D.G., Njoku, E.G., “Stokes Antenna Temperatures,” IEEE Trans. Geosci. Remote Sens., vol. 46, no. 2, February 2008. Piepmeier, J.R., JT Johnson, PN Mohammed, D Bradley, C Ruf, M Aksoy, R Garcia, D Hudson, L Miles, and M Wong, “Radio-Frequency Interference Mitigation for the Soil Moisture Active Passive Microwave Radiometer,” IEEE Trans. Geosci. Remote Sens., vol. 52, no. 1, Jan. 2014. Ruf, C.S., S. M. Gross and S. Misra, “RFI Detection and Mitigation for Microwave Radiometry with an Agile Digital Detector,” IEEE Trans. Geosci. Remote Sens., vol. 44, no. 3, 694-706, March 2006. Skou, N., J. E. Balling, S. S. Sobjarg, S. S. Kristensen, “Surveys and analysis of RFI in the SMOS context,” Proc. 2010 IEEE International Geoscience and Remote Sensing Symposium, Honolulu, HI, 25 Jul - 30 July 2010.
Ulaby, F. T., R. K. Moore, and A. K. Fung, Microwave remote sensing: active and passive. Volume 1, Microwave Remote Sensing Fundamentals and Radiometry. Reading, Mass.: Addison-Wesley Pub. Co., Advanced Book Program/World Science Division, 1981.
Wentz, F.J. , Le Vine, D.M., “Version 2: Algorithm Theoretical Basis Document_Aquarius Salinity Retrieval Algorithm, ” RSS Technical Report. June 11, 2012.
Yueh, S. H., “Estimates of Faraday rotation with passive microwave polarimetry for microwave remote sensing of Earth surfaces,” IEEE Trans.Geosci. Remote Sensing, vol. 38, no. 5, pp. 2434–2438, September 2000.
Related Documents


![ALGORITHM THEORETICAL BASIS DOCUMENT Offline Tropospheric … · 2017-03-02 · ALGORITHM THEORETICAL BASIS DOCUMENT Offline Tropospheric Ozone, Cloud slicing Version 1 ... 2014].](https://static.cupdf.com/doc/110x72/5ec8b973e75795012711ba65/algorithm-theoretical-basis-document-offline-tropospheric-2017-03-02-algorithm.jpg)