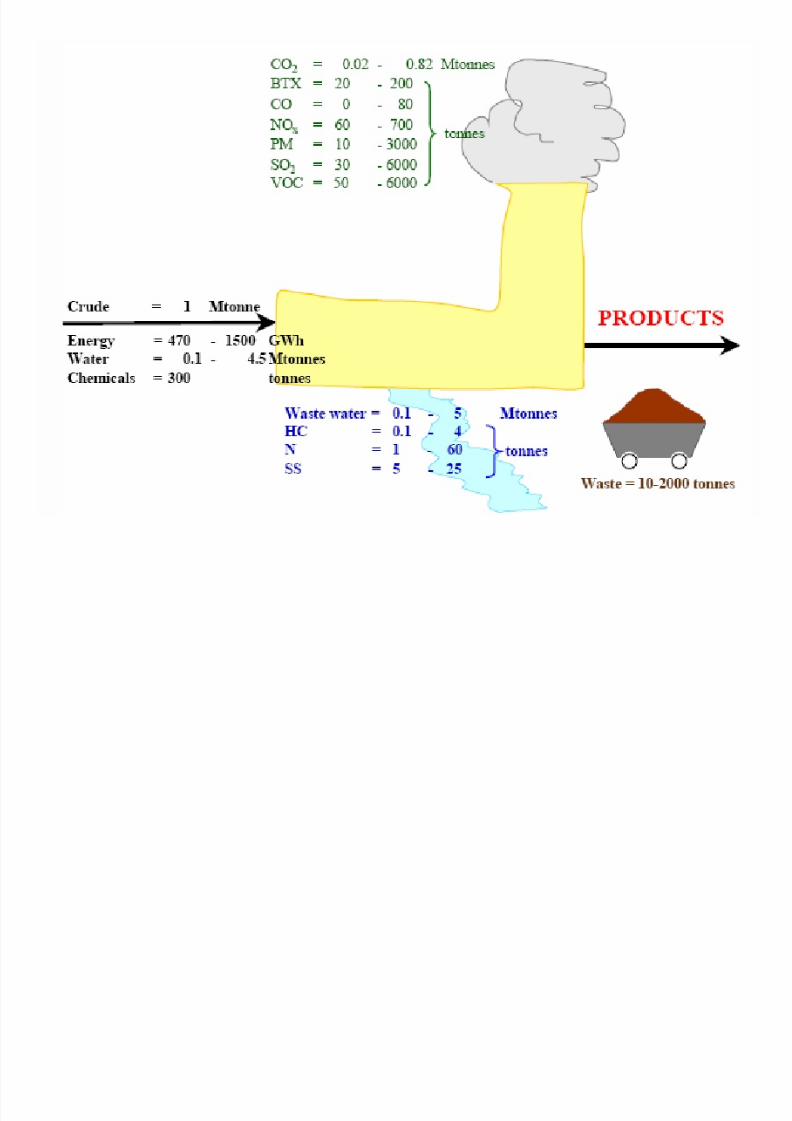
Air Pollution From Refineries • Basis: 1 Million Tonnes of Crude processed, refineries emit – 20000 - 820000 T of Carbon dioxides – 60 - 700 T of nitrogen oxides – 10 - 3000 T of particulate matter – 30 - 6000 T of sulphur oxides – 50 - 6000 T of volatile organic chemicals

Welcome message from author
This document is posted to help you gain knowledge. Please leave a comment to let me know what you think about it! Share it to your friends and learn new things together.
Transcript
8/3/2019 Air Pollution From Refineries
http://slidepdf.com/reader/full/air-pollution-from-refineries 1/23
Air Pollution From Refineries
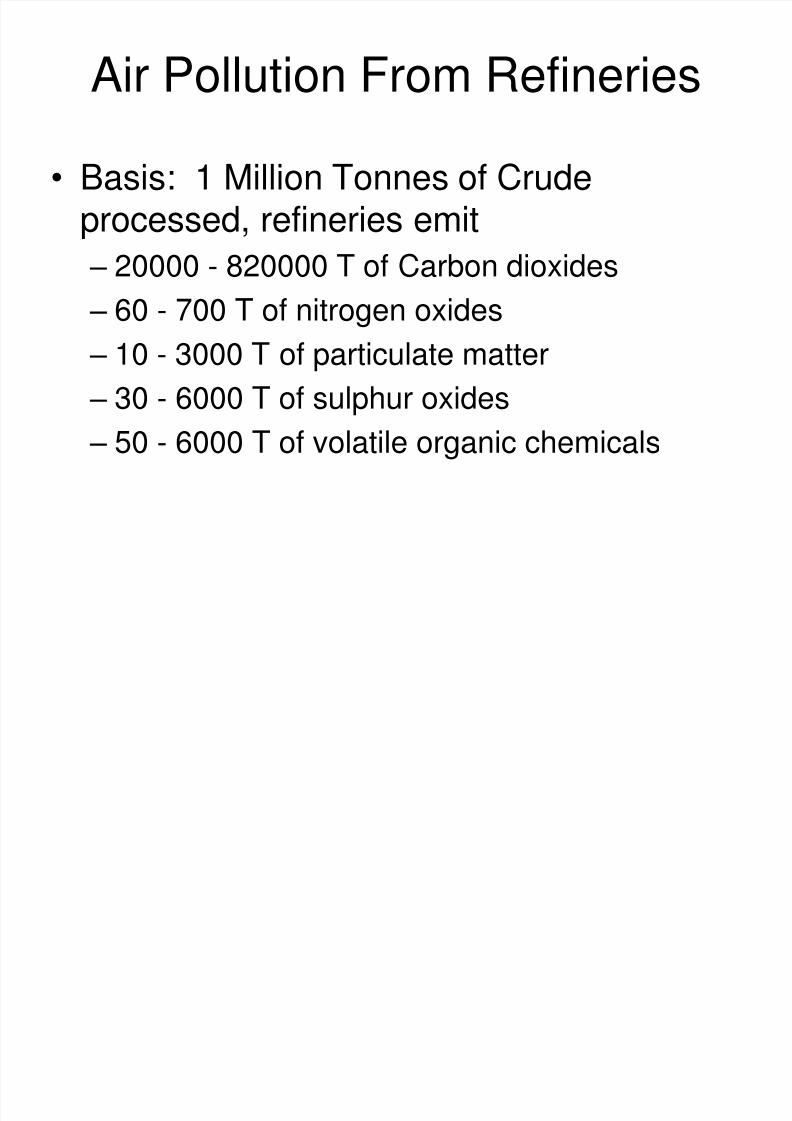
• Basis: 1 Million Tonnes of Crudeprocessed, refineries emit
– 20000 - 820000 T of Carbon dioxides
– 60 - 700 T of nitrogen oxides
– 10 - 3000 T of particulate matter
– 30 - 6000 T of sulphur oxides – 50 - 6000 T of volatile organic chemicals
8/3/2019 Air Pollution From Refineries
http://slidepdf.com/reader/full/air-pollution-from-refineries 2/23
CO2 / CO Emissions
• Power plants
• Process furnaces
• Boilers
• Gas turbines
• Heaters
• Fluidized Catalytic cracking regenerators
• Flare system
• Incinerators

8/3/2019 Air Pollution From Refineries
http://slidepdf.com/reader/full/air-pollution-from-refineries 3/23
Impact of CO2 / CO Emissions
• Almost all carbon present in crude oil once producedfrom the oil well will be converted into CO2 sooner orlater
• A small portion (< 3 - 10 %) of the CO2 will be converted
in the refinery during the processing of crude oil intomarketable products.
• Global climate change
• Link with energy efficiency
• CO2 is increasing as refineries are shifting to moreenergy intensive transportation fuels from heavy fuel oil
• CO is more intermediate product of combustion processwhen combustion is improper – Regeneration of catalyst
8/3/2019 Air Pollution From Refineries
http://slidepdf.com/reader/full/air-pollution-from-refineries 4/23
NOx Emissions
• N2O, NO and NO2
• Emissions from refineries as a whole
• Emission from specific processes /energy systems – Power plant
– Furnaces
– Boilers
– Gas turbines
– Catalytic cracker regenerators
– Flares
– Incinerators
• Fuel oil can generate about three times more NOx thangas fuels
8/3/2019 Air Pollution From Refineries
http://slidepdf.com/reader/full/air-pollution-from-refineries 5/23
Impact of NOx
• Nitrogen in Fuel and from Nitrogen in Combustionair
• Mix of NO2 and NO
• Contributes to both greenhouse effect (global
warming) and ozone depletion• Oxides of nitrogen (NOx), emissions into air can
combine with water and form a component of ‘acidrain’
• NOx in combination with volatile organiccompounds and sunlight, can lead to the formationof ground-level ozone
• Lower emissions when deNOx treatment is applied
8/3/2019 Air Pollution From Refineries
http://slidepdf.com/reader/full/air-pollution-from-refineries 6/23
Nitrogen oxides abatement techniques
Selective catalytic reduction (SCR) • Inlet NOx concentration to the SCR may vary from 200 -
2000 mg/Nm3@ 3 % O2.• Inlet NOx concentrations to the SCR vary with the type
of FCC used (total or partial combustion in combinationwith a CO boiler) and the type of feed used (heavier feedtends to produce higher NOx emissions)
• Reduction by 85 - 90 % of NOx emissions with the outletconcentration of NOx reduced to 30 - 250 mg/Nm3@ 3% O2, depending on the inlet concentration
• Those reduction efficiencies provide a reduction of 300tonnes of NOx per year from catcrackers of capacity of1.65 Mt/yr. Other advantage is that some CO oxidationalso occurs in the SCR process (aprox. 40%).
8/3/2019 Air Pollution From Refineries
http://slidepdf.com/reader/full/air-pollution-from-refineries 7/23
Nitrogen oxides abatement techniques
Selective non-catalytic reduction (SNCR) • These systems reduce the NOx emissions by 40 - 80 %.• The outlet concentrations can be down to <200 - 400 mg/Nm3@ 3 % O2
depending on the nitrogen content of the feedstock.• Instead of ammonia, urea can be also used.• The use of urea has the advantage to be more soluble in water and
consequently reduce the risk handling/storage of NH3.
• Use of NH3 (storage/handling), risk of NH3 emissions when operatingoutside stoichiometric proportion.
• Ammonia needed for this technique may be supplied by two-stage sourwater strippers.
• The use of urea generates more ammonia (from urea) slip and someN2O formation.
• High temperatures (800 - 900 ºC) of the flue gases are needed.• It is applicable in partial combustion FCCs with CO boiler; retrofitting in
existing CO boilers is relatively simple.• It is also applicable to full combustion units. Space requirements are
mainly related to NH3 storage.
8/3/2019 Air Pollution From Refineries
http://slidepdf.com/reader/full/air-pollution-from-refineries 8/23
SOx Emissions
• Energy systems such as – Fuels containing sulphur compounds – Catalytic cracker regenerators – Bitumen production
– Coking processes – Amine treating – Sulphur recovery units – Flares
• Sulphur in products from refinery• Sulphur balance as part of Environmental
Management System
8/3/2019 Air Pollution From Refineries
http://slidepdf.com/reader/full/air-pollution-from-refineries 9/23
Impact of SOx Emissions
• Fuel with 1% sulphur generates a flue gaswith 1700 mg/Nm3
• Sox emissions into air can combine withwater and form a component of ‘acid rain’
• Sulphur in the fuel is transformed to a mixof SO
2
and SO3
• Emission limit governed by regulations
8/3/2019 Air Pollution From Refineries
http://slidepdf.com/reader/full/air-pollution-from-refineries 10/23
VOC Emissions
• Generic term for all compounds containing organiccarbon which evaporate at ambient temperature
• Mostly fugitive emissions –mainly from evaporation ofleakage of hydrocarbon fractions during storage ,product loading, handling and distribution
• Vents, flares, seals from pumps, compressors, flanges,valves, seals and drains, wastewater, storage tanks(tank breathing)
• Wastewater systems (oil/water separation systems, airstripping in floatation units and bioreactor)
• Non-optimal combustion conditions – minor• VOC emissions from storage tanks account for more
than 40% of total emissions
8/3/2019 Air Pollution From Refineries
http://slidepdf.com/reader/full/air-pollution-from-refineries 11/23
Factors Driving VOC Emissions
• Valves that are operated frequently, such as controlvalves, may wear more quickly and will allow emissionpaths to develop
• Newer, low-leak control valves provide good fugitiveemissions control performance.
• Valves with rising stems (gate valves, globe valves) arelikely to leak more frequently than quarter-turn typevalves such as ball and plug valves.
• Equipment design, quality of the sealing system,maintenance programme and properties of the linecontents also impact VOC emissions
• Poorer designs (with wider tolerances), poor sealingsystems (e.g. leak-prone valve packings) and limitedmaintenance will lead to higher emissions.
8/3/2019 Air Pollution From Refineries
http://slidepdf.com/reader/full/air-pollution-from-refineries 12/23
HC Emission from wastewaterSystems
• Exposed surface area of the oil-contaminated untreated water tank (APIseparator)
• Oil evaporation factor (empirical)
– 20 g/m2 per hour for open oil separator
– 2 g/m2 per hour for covered oil separator
– 2 g/m2 per hour for flotation
– 0.2 g/m2 per hour for biological treatments
8/3/2019 Air Pollution From Refineries
http://slidepdf.com/reader/full/air-pollution-from-refineries 13/23
Impact of VOC emissions
• Volatile organic carbons (VOC), can reactwith NOx in the presence of sunlight toform low-level atmospheric ozone.
• Emissions of VOC can give rise to odourproblems, which may result in complaintsfrom nearby residents.
8/3/2019 Air Pollution From Refineries
http://slidepdf.com/reader/full/air-pollution-from-refineries 14/23
Particulate emissions
• Particulates (Catalyst changeovers and cokers)
• Metals as constituents of the particulates (Vanadium,Nickel, Arsenic, Mercury)
• Main emission sources are
– Process furnaces/ boilers (fired with liquid heavy fuel oil ~500 to1000 mg/Nm3 and for new optimal burner with steam atomization~200 mg/Nm3)
– Catalytic cracker regenerators (fines10 μm max)
– Coke plants
– Incinerators – Decoking
– Soot blowing of furnaces (2000 mg/Nm3)
– Flare
8/3/2019 Air Pollution From Refineries
http://slidepdf.com/reader/full/air-pollution-from-refineries 15/23
Particulate Matter Forms
• Soot: particle size is below 1 μm- visible smoke from astack is caused by all particles but mainly those with aparticle size between 0.5 and 5 μm
• Cenospheres: they originate from the liquid phase
wastes of combustion of heavy oil droplets at relativelylow temperature (< 700 °C). The size is equal to or largerthan that of the original oil droplets
• Coke particles, formed through liquid phase cracking incombustion at high temperatures (>700 °C) -particle size
is generally from 1 to 10 μm • Fine particles (< 0.01 μm): their contribution to the total
mass emission is negligible.
8/3/2019 Air Pollution From Refineries
http://slidepdf.com/reader/full/air-pollution-from-refineries 16/23
Impact of Particulate emissions
• The concern with particulate emissions (including ofheavy metals) stems from health effects.
• Range of emissions found in refineries is from 100 to20000 tonnes of particulates emitted per year
• Specific emission range found is from 10 to• 3000 tonnes of particulates per million tonnes of crude
oil processed.
• Lower emission value can be achieved in simple
refineries burning substantial amounts of gas or wheneffective dedusting devices (ESP, bag filters) areinstalled.
P ti l t b t t
8/3/2019 Air Pollution From Refineries
http://slidepdf.com/reader/full/air-pollution-from-refineries 17/23
Particulate abatementtechniques
• The selection of the catalyst can be seen as a particulate abatement technique.• Additional cyclones • Highly specialised cyclones are used (third-stage and multicyclones), which are
designed to suit the arrangement, dimensions, contours, velocities, pressures anddensities of the particles to be removed. This is the natural first choice of clean-updevice for particulates: these are conventional cyclones, fitted externally to theregenerator but operating on the same principle as the internal first and secondcyclones. They are high-velocity devices and recovered catalyst is returned to adust hopper. By reducing the particulate content in the air, the metal emissions arereduced. Depending on the above factors, cyclones are generally efficient atremoving particles in the range of 10 to 40 microns and above. Efficiencies canrange from 30 to 90 %. An average performance figure for cyclone separationalone is in the region of 100 - 400 mg/Nm3. (Inlet concentration from 400 - 1000mg/Nm3). Lower concentrations are not achievable because inlet velocities to the
cyclones are in the region that causes additional attrition, which producesadditional fines that pass the cyclone. The fine catalyst disposal is 300 - 400tonnes/yr per unit. Cyclones are more effective for coarser particles and they havebeen designed essentially to prevent any particles greater than 10 microns fromentering downstream facilities.
8/3/2019 Air Pollution From Refineries
http://slidepdf.com/reader/full/air-pollution-from-refineries 18/23
Electrostatic precipitators
• Description• A short description of an electrostatic precipitator can be found in Section 4.23.4.• Achieved environmental benefits• Typical particulate emission levels achieved with electrostatic precipitators range from• 10 - <50 mg/Nm3 of particulate matter in the flue gas of the FCC regenerator. This level is• based on averaged continuous monitoring, excluding soot blowing. The range depends on the• type of catalysts, the mode of FCC operation and whether other pretreatment techniques are
• implemented before the ESP. Particulate abatement measures in FCC with electrostatic• precipitators with efficiency greater than 99.8 %. Efficiency is not dependent on particulate size• or on flue gas velocity and the pressure drop is very marginal. As a consequence of the• particulate reduction, the metals (Ni, Sb, V and their components) can be reduced to less than 1• mg/Nm3 (given as Ni, Sb and V total) and, within that, Ni and its components can be reduced to• less than 0.3 mg/Nm3 (given as Ni). (Half-hourly mean values attainable in continuous• operation and with soot blowing in the CO boiler). Particulate emissions from the FCC can thus• be reduced to 1.1 - 2.3 kg/h.
8/3/2019 Air Pollution From Refineries
http://slidepdf.com/reader/full/air-pollution-from-refineries 19/23
Other Emissions
• H2S
• NH3
• BTX• CS2
• COS
• HF
8/3/2019 Air Pollution From Refineries
http://slidepdf.com/reader/full/air-pollution-from-refineries 20/23
Abatement of H2S Emissions
• Amine scrubbing system
• Sulphur recovery unit to convert H2S intosulphur, a byproduct produced withinrefineries
• Flaring
8/3/2019 Air Pollution From Refineries
http://slidepdf.com/reader/full/air-pollution-from-refineries 21/23
8/3/2019 Air Pollution From Refineries
http://slidepdf.com/reader/full/air-pollution-from-refineries 22/23
STORAGE AND HANDLING
• Pressure vessels are normally used to store gases at high pressures(>91 kPa, e.g. LPG).• Fixed roof tanks can be open to atmosphere, or designed as a
pressure tank, with several classes of allowed pressure build-up,from 20 mbarg (low pressure) to 60 mbarg (high pressure).
• The pressure tanks are provided with Pressure/Vacuum ReliefValves to prevent explosions and implosions, the vacuum settingbeing -6 mbarg.
• Floating roof tanks are constructed in such way that the roof floatson the liquid, and moves with the liquid level (>14kPa to < 91 kPa).
• Above-ground storage tanks (ASTs) are used at refineries forholding either the raw feedstock (crude oil) or end-productsgenerated by the refinery processes (gasoline, diesel, fuel oils etc.).
• Underground storage tanks are used much less frequently (if at all)at refineries - primarily for storing fuel for onsite boilers and vehicles,or for capturing liquids at low level drain points.
8/3/2019 Air Pollution From Refineries
http://slidepdf.com/reader/full/air-pollution-from-refineries 23/23
FlaringSource gas reduction measures to the maximum extent possible;
Use of efficient flare tips, and optimization of the size and number of burningnozzlesMaximizing flare combustion efficiency by controlling and optimizing flare fuel / air/ steam flow rates to ensure the correct ratio of assist stream to flare streamMinimizing flaring from purges and pilots, without compromising safety throughmeasures induding installation of purge gas reduction devices, flare gasrecovery units, inert purge gas, soft seat valve technology where appropriate,
and installation of conservation pilotsMinimizing risk of pilot blow-out by ensuring sufficient exit velocity andproviding wind guards;Use of a reliable pilot ignition system.Installation of high integray instrument pressure protection systems, whereappropriate to reduce over pressure events and avoid or reduce flaringsituations,Installation of knock-out drums to prevent condensate emissions, whereappropriate.Minimizing liquid carry.over and entrainment in the gas flare stream with asuitable liquid separation system:Minimizing flame lift off and for flame lick;Operating flare to control odor and visible smoke emissions
Related Documents